| | |
OMB APPROVAL |
OMB Number: | | 3235-0570 |
Expires: | | August 31, 2010 |
Estimated average burden |
hours per response: | | 18.9 |
UNITED STATES
SECURITIES AND EXCHANGE COMMISSION
Washington, D.C. 20549
FORM N-CSR
CERTIFIED SHAREHOLDER REPORT OF REGISTERED MANAGEMENT
INVESTMENT COMPANIES
Investment Company Act file number: 811-05371
Russell Investment Funds
|
| (Exact name of registrant as specified in charter) |
909 A Street, Tacoma Washington 98402
(Address of principal executive offices) (Zip code)
Gregory J. Lyons, Assistant Secretary
Russell Investment Funds
909 A Street
Tacoma, Washington 98402
253-439-2406
|
| (Name and address of agent for service) |
Registrant’s telephone number, including area code: 253-572-9500
Date of fiscal year end: December 31
Date of reporting period: January 1, 2008 to December 31, 2008
| Item 1. | Reports to Stockholders |

2008 ANNUAL REPORT
Russell Investment Funds
LifePoints® Funds Variable Target Portfolio Series
DECEMBER 31, 2008
FUND
Moderate Strategy Fund
Balanced Strategy Fund
Growth Strategy Fund
Equity Growth Strategy Fund

Russell Investment Funds
Russell Investment Funds is a series investment company with nine different investment portfolios referred to as Funds. These financial statements report on four of these Funds.
Russell Investment Funds
LifePoints® Funds
Variable Target Portfolio Series
Annual Report
December 31, 2008
Table of Contents
Russell Investment Funds - LifePoints® Funds Variable Target Portfolio Series
Copyright© Russell Investments 2009. All rights reserved.
Russell Investments is a Washington, USA corporation, which operates through subsidiaries worldwide and is a subsidiary of The Northwestern Mutual Life Insurance Company.
Fund objectives, risks, charges and expenses should be carefully considered before investing. A prospectus containing this and other important information must precede or accompany this material. Please read the prospectus carefully before investing.
Securities products and services offered through Russell Financial Services, Inc. (effective June 2, 2008, the name changed from Russell Fund Distributors, Inc.), member FINRA, part of Russell Investments.
Indices and benchmarks are unmanaged and cannot be invested in directly. Returns represent past performance, are not a guarantee of future performance, and are not indicative of any specific investment. Index return information is provided by vendors and although deemed reliable, is not guaranteed by Russell Investments or its affiliates.
Russell Investments is the owner of the trademarks, service marks, and copyrights related to its respective indexes.
Performance quoted represents past performance and does not guarantee future results. The investment return and principal value of an investment will fluctuate so that shares, when redeemed, may be worth more or less than their original cost. Current performance may be lower or higher than the performance data quoted.
To Our Shareholders
We are pleased to provide you with the Russell Investment Funds 2008 Annual Report. It includes portfolio management discussions and fund-specific details that will give you an in-depth understanding of fund performance for the fiscal year ended December 31, 2008.
It would be an understatement to say that 2008 has been a difficult year and the market crisis of the past couple of months has defied all predictions. Virtually no sector of the financial industry or the economy has been spared.
All of us at Russell want you to know that we are sensitive to investor concerns. While market events have impacted the performance of the funds, we believe that investors are well-served by remaining focused on long-term disciplined investing in well-diversified, asset allocated portfolios.
The Russell Investments team has years of experience in managing people’s money through various market cycles, trends and turnarounds. As always, we are monitoring our investment managers closely to ensure their adherence to their long-term strategies despite the recent disruptions.
As we all collectively weather this storm, we believe now is the perfect time for you to talk with your financial advisor to ensure that your portfolio remains aligned with your long term goals.
Each and every day we strive to improve financial security for people. We will not waiver in that commitment and sincerely appreciate your continued support.
Best regards,

Greg Stark
Chief Executive Officer, Chairman and President
Russell Investment Management Company
Russell Investment Funds
Market Summary as of December 31, 2008 (Unaudited)
U.S. Equity Markets
For the fiscal year ending December 31, 2008, U.S. equity markets were remarkably weak, with the broad market Russell 3000® Index posting a 37.3% drop amid the worst financial crisis in almost a century. Major bankruptcies, the freezing of credit markets, and the widespread global recession fears which ensued — particularly during the third quarter and first half of the fourth quarter — drove investors to sell riskier assets as fear and panic pervaded the market.
The economic crisis stemmed from issues in the financial sector. The U.S. housing market stood at the center of the financial sector’s problems. The housing slowdown that began in the summer of 2006 and continued in 2007 intensified throughout this fiscal year and led to rising loan default rates and home foreclosures which, in turn, led to further housing weakness. As home prices dropped and default rates increased, the value of derivative instruments, such as mortgage-backed securities, whose values were based on these mortgages, plummeted. This forced banks to take massive write-downs of book values as required by mark-to-market accounting. With the lack of certainty about the real book value of assets on the balance sheets of banks, banks have been unable and/or hesitant to lend funds to other banks. Despite aggressive interest rate cuts by the Federal Reserve Board (the “Federal Reserve”), which took the Federal Funds rate from 5.25% (in third quarter 2007) to a range between 0% and 0.25% (at fiscal year end), mortgage and other lending rates did not come down as quickly as banks used the wider lending spread to offset their substantial write-downs on book values. Over the last month and a half of the year, however, these rates did start to drop sharply. In addition to higher interest rates, banks having stricter lending standards had a profound impact on the availability of affordable credit for potential homebuyers, small businesses, and other borrowers.
Due to write-downs, dwindling capital bases and a crisis of confidence in their businesses, several large banks, brokers, mortgage companies and insurance companies filed for bankruptcy, were seized by the federal government and resold, or were bailed out by the government during the fiscal year, with the most notable ones being Countrywide Financial, Bear Stearns, IndyMac Bancorp, Lehman Brothers, Federal National Mortgage Association (Fannie Mae), Federal Home Loan Mortgage Corporation (Freddie Mac), American International Group (AIG), Washington Mutual and Wachovia. Amid concerns of additional bankruptcies and uncertainty surrounding which institutions may be bailed out by the government, the fear-driven environment has persisted. In addition, there have been a number of problems at hedge funds, leading to massive deleveraging, or forced selling of assets, in order to meet client redemptions. This forced selling of assets has put severe downward pressure on many securities, particularly the highly-liquid larger cap U.S. stocks, regardless of those securities’ fundamentals.
After more than four years of strong growth, corporate profits had dipped fairly sharply by the end of 2008, especially in the financial services sector. The growth rate of gross domestic product also fell, although it stayed marginally positive until the third quarter report which showed a contraction of 0.5%, the worst since the 2001 recession. There was significant deterioration since then, as fourth quarter GDP estimates are -4.2% on average. A significant reduction in consumer spending had the most substantial negative impact on the GDP number, as consumers became fearful due to rising unemployment levels, declining home values and increased difficulty in getting loans. The Consumer Confidence Index released by the Conference Board decreased to 38 in October — the lowest value in the history of the Index (started in February 1967). It increased slightly in November, before dropping back to the all-time low of 38 in December. The first half of the year also featured the negative impact of higher energy prices on consumer spending. Oil prices reached $147/barrel in mid-July before dropping sharply to below $40/barrel in December.
Although the domestic economy slowed during the fiscal year, some segments of the U.S. equity market were helped in the first half of the year by strong exports to faster-growing, developing, non-U.S. economies. With approximately 40% of U.S. corporations’ revenues derived from international customers, the declining U.S. dollar in the first half of 2008 provided increased demand for U.S. products abroad. During the second half of the year, however, the U.S. dollar rallied and the global economy slowed considerably. After being rewarded in the first half of 2008, exposure to companies tied to the global economy underwent a strong reversal that began in July 2008 and has been swift and dramatic. Higher valuation cyclical (more linked to the economic cycle) companies and those with more debt on their balance sheets were among the most negatively impacted over the course of the year. Companies that have high forecasted growth rates have also been hit hard as investors have become less confident that these growth rates can be sustained going forward.
Russell Investment Funds
In the wake of these powerful macroeconomic forces, the fiscal year presented a very difficult active management environment which was marked by three distinct themes: 1) largely indiscriminate selling of U.S. stocks by panic-driven, risk-averse investors concerned first about a U.S. recession and then about a global recession, 2) intense selling of financial stocks for a majority of the period, and 3) the strength of global companies for roughly the first half of the fiscal year as multinational companies with exposure to developing markets outpaced domestically-driven companies and commodity-related companies (especially energy) outperformed the general market by a wide margin.
The weakening of the global economy over the last half of the year caused oil prices to fall from their record highs and led the other energy sector to sell off sharply. Over the course of the year, the worst performing sectors in the Russell 3000® Index were other energy -53.6%, financial services -51.1%, the other sector (which is dominated by GE and contains other large conglomerates, (-50.9%), and materials & processing -47.3%. Meanwhile, the best performing sectors in the Russell 3000® Index were those that are considered to be more defensive. The slower-growing, less economically-sensitive consumer staples sector was the best relative performer -17.7%, followed by integrated oils -21.7%, health care -22.4%, and utilities -29%.
Weakness was experienced across investment styles as well as the capitalization spectrum. While both the growth and value investment styles were down substantially, value outperformed growth in the small cap segment (Russell 2000® Value -28.9%, Russell 2000® Growth -38.5%) and to a lesser degree in the large cap segment (Russell 1000® Value -36.9%, Russell 1000® Growth -38.4%). In general, small cap stocks outperformed large caps (-33.8% and -37.6% for the Russell 2000® Index and Russell 1000® Index, respectively). Midcap and microcap stocks underperformed by the widest margins with the Russell Midcap® Index down 41.5%, and the Russell Microcap® Index down 39.8%.
During 2008, the market environment was largely hostile for active management as investors sold stocks regardless of fundamentals, the basic determinants of a stock’s value. Small cap fund managers had the most difficult time relative to their benchmark. Growth managers across the capitalization spectrum also struggled as the shift away from higher growth stocks came quickly and sharply. Core, or market-oriented, managers struggled less than style-focused managers in fiscal year 2008. The Lipper® Small Cap Core Funds Average trailed the Russell 2000® Index by 2.7%, the Lipper® Small Cap Growth Funds Average underperformed the Russell 2000® Growth Index by 3.6% and the Lipper® Small Cap Value Funds Average underperformed the Russell 2000® Value Index by 4.9%. The Lipper® Large Cap Core Funds Average outperformed the Russell 1000® Index by 0.1%, the Lipper® Large Cap Growth Funds Average underperformed the Russell 1000® Growth Index by 1.8% and the Lipper® Large Cap Value Funds Average underperformed the Russell 1000® Value Index by 0.6%.
Real Estate Securities Market
For the fiscal year ending December 31, 2008, U.S. real estate investment trusts (REITs) generated a 37.7% loss, as measured by the FTSE NAREIT Equity Index (Index). During this period, REITs performed slightly better than the broader equity market, which finished down 37.3% as measured by the Russell 3000 Index. The negative REIT performance was accompanied by an unprecedented amount of volatility during the period. Not only were monthly returns erratic, demonstrated by the worst and best monthly returns in the history of the Index occurring in October -31.7% and December 16.4%, respectively, but the largest percentage gain and loss achieved in a single day also both occurred during the year.
Following the sharp decline in the commercial mortgage-backed securities market and escalating problems in the credit market, investors began 2008 more risk averse. As recessionary fears began to emerge, the Federal Reserve became active in an attempt to stave off concerns of a recession by cutting rates aggressively, twice in January alone, and injecting liquidity into the financial markets through a variety of initiatives. First and second quarter REIT earnings held up well, although many companies took the opportunity to revise 2009 estimates downwards.
By September 2008, consumer spending had slowed, the unemployment rate was climbing and both corporate and consumer credit markets remained tight. The collapse of Lehman Brothers Holdings Inc. on September 15 sparked panic within the financial markets and REITs were heavily sold off over the ensuing weeks. Mirroring the broader equity market, REITs traded down sharply through October and most of November. A marked change in investor sentiment occurred in December as investors became less defensive and REITs staged a modest recovery as the year closed.
An overriding theme during the year was the elevated correlation between REITs and the financial services sector of the broader equity market. This is due to the fact that most broad equity indexes include REITs in the financial services sector. This weighed heavily on REIT performance during the period, as many general equity investors avoided financial services stocks and other investors took short positions in individual stocks and exchange traded funds in the financial
Russell Investment Funds
services sector. This was also a contributing factor to the exceptionally high volatility observed in the REIT market during the fiscal year.
Another key trend during the year was a flight towards quality REIT names, with the market especially rewarding companies that have made a concerted effort to mitigate risk. Companies with the lowest leverage levels, limited near term refinancing needs and limited development pipelines held up the best. Neither dividend yield nor market capitalization appeared to be contributing factors to differences in individual company performance.
During the year, returns were disappointing across all property sectors. The poorest performing sectors were industrial and regional malls. Leverage ratios for the industrial and regional malls companies tend to be higher than the overall REIT universe, which has negatively impacted those stocks. In addition, meaningful development pipelines in the leading industrial companies have put added pressure on earnings forecasts due to weaker leasing market conditions. Two of the better performing property sectors were self storage and health care. Due to the stable nature of the cash flows embedded in many health care leases, investors sought out this defensive sector given the slowing economy. The self storage sector is generally driven by the performance of one company that dominates the sector, Public Storage, which was one of the few stocks to post a positive return for the year. Public Storage held up well due to its strong balance sheet, including minimal leverage and high levels of cash.
The U.S. REIT market outperformed relative to the international real estate securities market by a wide margin during the fiscal year. The largest price correction occurred in the Asia Pacific region, with smaller corrections taking place in Continental Europe and the United Kingdom. While the effects of the global economic slowdown and credit crisis have spread to the other regions, the U.S. REIT market has fared relatively better, mirroring trends in the broader global equity markets.
Non-U.S. Developed Equity Markets
Non-U.S. developed stocks fell 43.38% as measured by the MSCI EAFE® Index for the fiscal year ended December 31, 2008. Appreciation of the U.S. dollar relative to foreign currencies, mainly as a result of the flight to safety in the second half of the fiscal year ended, exacerbated already weak non-U.S. equity returns. In local currencies, the MSCI EAFE® Index fell 40.27% over the 12-month period.
The market struggled under increasing concern over the health of the global financial system. While these concerns affected markets for nearly the full 12 months, most of the decline in equity values came in September and October 2008, as several prominent financial companies in the U.S. and Europe encountered financial distress. In nearly all cases, government “bailouts” were necessary for these companies to avoid bankruptcy.
The additional impact of already declining global economic growth increasingly weighed on markets during the period. Expectations for global economic growth were revised downwards throughout the year. The latter part of the fiscal year experienced contraction in economic output in Europe and Asia. Output growth of 5% in 2007 slowed sharply for 2008 with abbreviated expectations for growth in developed economies in 2009.
The change in market conditions was evident in a marked increase in market volatility as investors’ complacency towards risk was quickly replaced by acute risk aversion. Stocks with prices most directly tied to high, long-term growth prospects suffered some of the steepest declines, as investors doubted the ability of these companies to post strong growth in a decelerating economic environment. However, due to the sharp declines of financials, the largest sector of the value index, value lagged growth by 1.39% in the period (the MCSI EAFE Growth Index lost 42.70% and the MSCI EAFE Value Index lost 44.09%).
Market sectors most leveraged to global economic growth or in the nexus of the financial sector meltdown were the most severely impacted, though no areas of the market were immune. Financials ended the 12-month period down 55.21% (as measured by the MSCI EAFE Index financials sector grouping). The strong gains of materials early in the period were quickly reversed. The sector ended the period down nearly 53.02% as measured by the MSCI EAFE materials sector grouping. Energy stocks also fell sharply as the price of a barrel of oil fell from a high of more than $145 to below $36. However, the sector’s one-year stock price decline of 38.18% (as measured by the MSCI EAFE energy sector) was better than all but the traditionally defensive sectors. Among the defensive sectors of the market, health care, led by pharmaceutical stocks, held up best with a decline of 18.95% as measured by the MSCI EAFE health care sector. Utilities and consumer staples, down 28.16% and 31.33% as measured by the MSCI EAFE utilities and MSCI EAFE consumer staples sector groupings, respectively, were the next best performers. Sector groupings are based on the Global Industry Classification Standard definitions.
Russell Investment Funds
Regional results were generally tied to sensitivity to global economic conditions. The MSCI Pacific ex-Japan® Index declined the most, down 50.50%. MSCI Europe ex-United Kingdom® Index fell 45.54%, while the MSCI United Kingdom® Index fell 48.34%. In all three regions, currency impact had a pronounced impact on returns with the regions down 42.17%, 43.24%, and 28.48%, respectively, in local currencies. MSCI Japan® Index fell 42.56% in yen, but had one of the few currencies that managed to appreciate versus the U.S. dollar and fell only 29.21% in U.S. Dollars.
Emerging Markets
During 2008, the MSCI Emerging Markets Index (“Index”) declined 53.18%, the biggest calendar year decline in the history of the asset class with large return dispersions across sectors and countries. The turmoil in the world’s financial system meant increasing risk aversion, growing macro risks and heightened levels of volatility and dispersion across countries, sectors and currencies. Emerging Markets in general may be better positioned and more resilient to a downturn than developed economies, however, as the crisis changed from financial to economic, emerging markets faced massive asset de-leveraging and indiscriminate selling as investors adopted a zero tolerance to risk. Price momentum (i.e. stocks exhibiting trending relative price appreciation) benefited from the continued rally of commodity-related sectors through the latter part of 2007 and well into 2008 but this reversed as global equity markets began falling sharply. The faltering global economy and the steep pull-back in commodity prices affected cyclical areas of the market including industrials, materials and energy sectors while defensive sectors such as healthcare, consumer staples and utilities were relative safe havens during the period. From a country perspective, smaller markets in general held up relatively better than the larger markets. In addition to the weak equity returns, most emerging markets currencies depreciated against the U.S. Dollar with some, such as the South African Rand, Korean Won, Turkish Lira and Brazilian Real, losing in excess of 30% over the course of the year as investors fled to quality and more liquid currencies.
In terms of regions, Latin America was the top performer, down 51.28% (as measured by the MSCI EM Latin America Index), supported by the relative outperformance from Mexico and the smaller Latin countries. The Asia region (-52.77% as measured by the MSCI EM Asia Index) finished behind Latin America but ahead of the broader market. The Europe, Middle East and Africa region (-55.60% as measured by the MSCI EM Europe, Middle East and Africa Index) underperformed the broader market due in large part to the significant underperformance from Russia. The BRIC (Brazil, Russia, India and China) economies, with the exception of China, underperformed the broader Index. China held up reasonably well over the period due to favorable monetary and fiscal policies during the latter half of the year in an effort to shore up its slowing economy. Other notable relative underperformers included Pakistan (-74.05% as measured by the MSCI Pakistan Index) and Turkey (-62.10% as measured by the MSCI Turkey Index).
U.S. Fixed Income Markets
The Barclays Capital U.S. Aggregate Bond Index, a broad measure of U.S. investment grade fixed income securities, returned 5.24% for the year ended December 31, 2008. Similar to the prior year, the index and its major sectors trailed equivalent-duration U.S. Treasuries, as the subprime mortgage crisis that started in the summer of 2007 deepened and developed into a severe liquidity crisis, the size and scope of which had not been seen since the U.S. Great Depression of the 1930s. During 2008, investors moved their capital away from riskier investments to the safest possible investments (i.e., U.S. Treasuries), continuing the “flight to quality” trend started in the prior period.
Throughout 2008, in an effort to deal with credit market illiquidity and a slowing economy, the Federal Reserve lowered the target Federal Funds rate eight times, including two non-scheduled “surprise” cuts of 0.75% in January and 0.50% in October. The target rate started the year at 4.25% and ended at a 0.00% to 0.25% range after the eighth rate cut on December 16, 2008.
The downward shift in the yield curve started in 2007 and continued in earnest in 2008, with the curve “steepening” significantly below the 10-year mark; i.e., yields on shorter-maturity Treasuries declined by a greater degree than longer-maturity Treasuries, resulting in a steeper, upward sloping curve. The change was driven by the Federal Reserve’s lowering of rates (affecting the short end) and investors’ increasing demand for safe haven U.S. Treasuries (driving down longer-maturity yields). In 2008, yields on 2-year Treasuries declined by 2.28% to 0.76% while 10-year Treasuries declined by 1.81% to 2.21%.
The subprime mortgage crisis and deflating housing market were still major issues throughout the year. Home price depreciation continued to accelerate. By the end of October, the average U.S. national home price as tracked by the S&P/Case-Shiller Composite 20 Index, had declined 18% from the end of 2007, reaching a level that was down 23% from its July 2006 peak. Subprime mortgage foreclosures increased from 8.65% at the end of December 2007 to 12.55% at the end of September 2008, the most recent available data from the Mortgage Bankers Association. Total foreclosures increased from 2.04% to 2.97% during the same period. Writedowns on the values of mortgages had a large negative
Russell Investment Funds
impact on bank balance sheets. During the year, writedowns at financial institutions world-wide amounted to approximately $930.3 billion, bringing total writedowns since the start of the subprime crisis to approximately $997.4 billion.
During the early months of 2008 the market continued its downward trend, which was capped in mid-March by Bear Stearns receiving emergency funding from the Federal Reserve and JPMorgan Chase as a three-day run on the bank depleted its cash reserves. Two days later JPMorgan Chase acquired Bear Stearns for seven percent of its market value in a sale brokered by the Federal Reserve and the U.S. Department of the Treasury (U.S. Treasury). Investors took this as a sign that the U.S. government would stand behind financial institutions and credit markets rallied for the next few months.
During the first part of the year, the U.S. government had become increasingly concerned that the credit crisis would significantly slow the U.S. economy — particularly the spending of consumers, who account for approximately two-thirds of GDP. In April, the U.S. Internal Revenue Service started distributing tax rebates as part of a $168 billion economic stimulus plan.
However, markets continued to weaken as illiquidity reached extreme levels and the financial crisis became global in scope. In July, IndyMac Bancorp, the then-second-biggest independent U.S. mortgage lender, was seized by federal regulators after a run by depositors depleted its cash. In August, Commerzbank AG agreed to buy Allianz SE’s Dresdner Bank for 9.8 billion euros in Germany’s biggest banking takeover in three years.
September started with the U.S. government seizing control of Fannie Mae and Freddie Mac, the largest U.S. mortgage-finance companies. In the middle of the month, the U.S. government did not arrange a deal or otherwise bail out Lehman Brothers, and the 158-year old firm filed the largest bankruptcy in U.S. history. This was followed by the bankruptcy of 119-year old Washington Mutual. AIG accepted an $85 billion loan from the Federal Reserve to avert what would have been the worst financial collapse in history, with the U.S. government taking a substantial ownership stake in AIG.
In the same month, the investment banking business model fundamentally changed, with Goldman Sachs and Morgan Stanley receiving approval to become deposit-taking commercial banks regulated by the Federal Reserve, as tight credit markets forced Wall Street’s two remaining independent investment banks to widen their sources of funding. Similar events occurred in Europe and throughout the world, with large financial institutions either merging or with governments providing support in return for equity stakes.
September finally ended with the U.S. Treasury proposing the Financial Market Rescue Bill, including the Troubled Asset Relief Program (TARP), which authorized the U.S. Treasury to spend up to $700 billion to buy mortgages and other distressed assets. The House initially rejected the bill, but subsequently passed it. The bill was signed into law in early October.
The events of September contributed to the extreme market illiquidity in October, evidenced by spikes in overnight and three-month LIBOR (the rates at which banks lend to one another). The Federal Reserve took significant steps to improve liquidity in the short duration markets, which included the creation of the Commercial Paper Funding Facility (CPFF) and the Money Market Investor Funding Facility (MMIFF).
In November, the U.S. Treasury gave additional support to AIG by announcing the purchase of $40 billion in new preferred stock. The U.S. Treasury then guaranteed $306 billion in residential and commercial mortgage-backed securities of Citi® in exchange for $7 billion in preferred stock. In addition, the U.S. Treasury purchased another $20 billion in preferred stocks from Citi. Shortly thereafter, the Government Sponsored Enterprise (GSE) Debt and Mortgage-Backed Security Purchase Program was announced stating that the Federal Reserve will buy $100 billion in Fannie Mae, Freddie Mac and the Federal Home Loan Bank debentures and $500 billion in agency mortgage-backed securities. Simultaneously, the Term Asset-Backed Securities Loan Facility (TALF) was announced by the U.S. Treasury offering to provide $200 billion in three-year loans to U.S. companies who can provide high quality AAA-rated auto loans, student loans, credit card loans or small business loans as collateral.
This trend continued in December as Congress agreed to provide $13.4 billion in short term loans to General Motors and $4 billion to Chrysler in an effort to aid the suffering auto industry.
December ended on an up note with a majority of fixed income sectors outperforming equivalent-duration Treasuries. Most notably, the commercial mortgage-backed securities sector (CMBS) returned 16.98% (15.14% above equivalent-duration Treasuries) during the month. The year ended with the Barclays Capital U.S. Aggregate Bond Index returning 5.24%, underperforming by 7.10% U.S. Treasuries.
(This page intentionally left blank)
Russell Investment Funds
Moderate Strategy Fund
Portfolio Management Discussion and Analysis — December 31, 2008 (Unaudited)
| | | | | |
| |
| Moderate Strategy Fund | | | |
| | | Total
Return | |
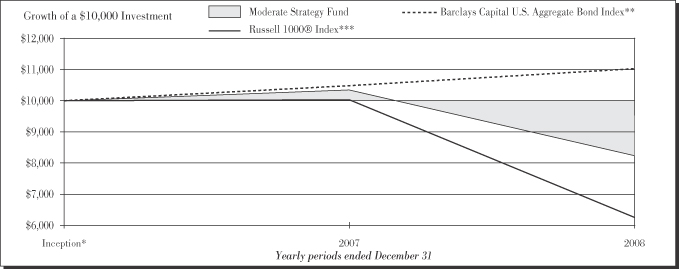
1 Year | | | | (20.39 | )% |
Inception* | | | | (10.92 | )%§ |
| | | | | |
|
| Barclays Capital U.S. Aggregate Bond Index ** | |
| | | Total
Return | |
1 Year | | | | 5.24 | % |
Inception * | | | | 6.05 | %§ |
| | | | | |
|
| Russell 1000® Index*** | |
| | | Total
Return | |
1 Year | | | | (37.60 | )% |
Inception * | | | | (24.45 | )%§ |
| * | | The Fund commenced operation on April 30, 2007. |
| ** | | On October 31, 2008, Barclays Capital, which acquired the Lehman family of indexes in September 2008, announced that it would be re-branding Lehman indexes under the Barclays Capital name; the underlying index structures are to remain unchanged. As a result, the Lehman Brothers Aggregate Bond Index has been renamed the Barclays Capital U.S. Aggregate Bond Index. |
Barclays Capital U.S. Aggregate Bond Index is composed of securities from Barclays Capital U.S. Government/Corporate Bond Index, Mortgage-Backed Securities Index, and the Asset-Backed Securities Index. Total return comprises price appreciation/depreciation and income as a percentage of the original investment. Indexes are rebalanced monthly by market capitalization.
*** | | Russell 1000® Index includes the 1,000 largest companies in the Russell 3000® Index. The Russell 1000® Index represents the universe of stocks from which most active money managers typically select. The Russell 1000® Index return reflects adjustments from income dividends and capital gain distributions reinvested as of the ex-dividend dates. |
The performance shown in this section does not reflect any Insurance Company Separate Account or Policy Charges. Performance is historical and assumes reinvestment of all dividends and capital gains. Investment return and principal value will fluctuate so that an investor’s shares, when redeemed, may be worth more or less than when purchased. Past performance is not indicative of future results.
| | |
| 10 | | Moderate Strategy Fund |
Russell Investment Funds
Moderate Strategy Fund
Portfolio Management Discussion and Analysis — December 31, 2008 (Unaudited)
The Fund is a fund of funds that invests in other Russell Investment Funds and Russell Investment Company mutual funds (the “Underlying Funds”). The Underlying Funds allocate most of their assets among multiple money managers. Russell Investment Management Company (“RIMCo”), as the Underlying Funds' advisor, may change the allocation of the Underlying Funds' assets among money managers at any time. An exemptive order from the Securities and Exchange Commission (SEC) permits RIMCo to engage or terminate a money manager in an Underlying Fund at any time, subject to the approval by the Underlying Fund’s Board without a shareholder vote.
What is the Fund’s investment objective?
The Moderate Strategy Fund (“Fund”) seeks to provide high current income and moderate long term capital appreciation.
How did the Fund perform relative to its benchmark for the fiscal year ended December 31, 2008?
For the fiscal year ended December 31, 2008, the Moderate Strategy Fund lost 20.39%. This compared to the Barclays Capital U.S. Aggregate Bond Index, which gained 5.24% during the same period. The Fund’s performance includes operating expenses, whereas the Index returns are unmanaged and do not include expenses of any kind. The Fund was negatively impacted by its allocation to all equity Underlying Funds and the fixed income Underlying Fund’s overweight to non-Treasury sectors.
For the year ended December 31, 2008, the Moderate Strategy Lipper Composite – lost 20.53%. This result serves as a peer comparison and is expressed net of operating expenses.
Each Underlying Fund has a benchmark reflective of its respective asset class. These benchmarks may be different than the Fund’s benchmark. The Fund’s benchmark represents the largest asset class of the Underlying Funds in which it invests.
How did the market conditions described in the Market Summary report affect the Fund’s performance?
The Fund is a fund of funds and its performance is based on the performance of the Underlying Funds in which it invests. The Fund’s performance was negatively impacted by the financial crisis that affected virtually all asset classes during the fiscal year. The Fund’s benchmark relative performance was negatively impacted by the fixed income Underlying Fund’s overweight to non-treasury sectors.
The largest impact on the Fund’s underperformance relative to its benchmark was from its exposure to large cap U.S. equities and non-U.S. developed market equities. The performance of the equity Underlying Funds (approximately 40% of the Fund) detracted from returns relative to the Fund’s all-fixed income benchmark, the Barclays Capital U.S. Aggregate Bond Index.
The extreme volatility of the financial markets during the fiscal period created a headwind for most active managers. In this challenging environment, all underlying equity asset class funds lagged their respective benchmarks but one; yet, four of
eight Underlying Funds outperformed their peers within their asset classes as measured by their respective Lipper® Averages. The Barclays Capital U.S. Aggregate Bond Index, the benchmark for the RIF Core Bond Underlying Fund, was the only Underlying Fund benchmark with a positive absolute return. The returns of this index benefited from the inclusion of Treasuries. The RIF Core Bond Underlying Fund held a significant underweight to Treasuries relative to the benchmark. In absolute terms, bonds as measured by the Barclays Capital U.S. Aggregate Bond Index performed better than equities.
How did the investment strategies and techniques employed by the Fund and its money managers of the Underlying Funds affect the Fund’s performance?
At the Fund level, all Underlying Funds contributed negatively to the Fund’s returns relative to the Barclays Capital U.S. Aggregate Bond Index. The RIF Core Bond Underlying Fund, however, detracted less from the Fund’s benchmark-relative performance than the equity Underlying Funds.
By far, the largest affect on the fixed income Underlying Fund’s underperformance relative to its benchmark was from the re-pricing of risk (i.e., the market demanding increased compensation for assuming a given level of risk), the fundamental concern regarding the consumer’s ability to make mortgage payments, and the negative impact that market and credit issues had on virtually all non-Treasury segments of the fixed income markets. This Underlying Fund had a material overweight to mortgage-backed securities. This contributed significantly to this Underlying Fund’s benchmark-relative underperformance. The decrease in interest rates across the yield curve had little impact on that Underlying Fund’s performance as its money managers implemented offsetting duration strategies. Yet, as the Federal Reserve decreased the federal funds target rate, short-term yields declined relative to intermediate- and long-term yields resulting in a yield curve “steepening.” Several of the Underlying Fund’s money managers anticipated the change and varied the maturities of their securities accordingly, positioning their portfolios to benefit from these changes.
The U.S. equity Underlying Funds maintained an overall preference for companies with above-average growth rates and attractive valuations. This positioning was not rewarded in 2008 where investors were driven by fear, looking for relative safety and selling stocks regardless of fundamentals. U.S. large cap managers in the Underlying Fund using quantitative investment strategies added to returns by shorting several of the financial stocks that underperformed in the fiscal period. Yet, this was offset by managers employing growth and momentum strategies, which underperformed in this environment.
Managers in the small cap U.S. equity Underlying Fund negatively impacted the Fund by underweighting the financials sector and overweighting the other energy sector. Small cap financials rebounded from their lows as the Federal Reserve and Treasury offered wide ranging forms of financial support. The prices of other energy stocks fell as the price of oil fell.
| | |
| Moderate Strategy Fund | | 11 |
Russell Investment Funds
Moderate Strategy Fund
Portfolio Management Discussion and Analysis — December 31, 2008 (Unaudited)
Managers in non-U.S. developed markets Underlying Fund performed better than managers in global equity and emerging markets Underlying Funds. Yet the Fund’s higher allocation to the Non-U.S. developed markets Underlying Fund resulted in larger negative impact on the Fund’s benchmark relative performance. This Underlying Fund’s multi-style discipline provided some risk control during the fiscal period given the extreme variability in investment style and market leadership. More defensive strategies helped moderate the negative impact of strategies more focused on deteriorating economic conditions.
In emerging markets, the returns of emerging markets Underlying Fund declined along with the returns of the asset class, which experienced its biggest calendar year decline in the history of the asset class. The asset class endured massive asset deleveraging and extreme levels of market volatility. Commodity-related sectors suffered most as the global economic slowdown cut demand.
The real estate Underlying Fund focused primarily on the larger and more liquid REITs during the fiscal year. With the exceptional volatility experienced during the period due to the global economic crisis and cash outflows, this positioning hurt Fund performance. The Underlying Fund’s exposure to non-U.S. REITs, though beneficial in the last quarter of the fiscal period, negatively impacted returns for the year.
The Funds’ performance shown throughout this report was based on the Underlying Funds’ valuations calculated in accordance with Generally Accepted Accounting Principles (GAAP) and in accordance with a newly effective accounting statement (SFAS 157), reflects the December 31, 2008 market value of the pooled investment vehicle in which the Underlying Funds invested their cash collateral received in securities lending transactions. The market value was lower than the vehicle’s amortized cost per unit. This had a negative impact on the Fund’s benchmark relative performance.
Describe any changes to the Fund’s structure or allocation to the Underlying Funds.
In September, 2008, certain of the Underlying Funds in which the Fund invested (the “Former Underlying Funds”) changed as set forth below as the result of the reorganization (the “Reorganizations”) of the Former Underlying Funds into other Russell Investment Company Funds (the “New Underlying Funds”).
| | |
| |
| Former Underlying Fund | | New Underlying Fund |
Quantitative Equity Fund | | Russell U.S. Quantitative Equity Fund |
The New Underlying Fund has the same investment objective, principal investment strategies, investment policies and principal risks as the Former Underlying Fund which it replaced and the allocation of the Fund’s assets to the New Underlying Fund is the same as it was to the Former Underlying Fund.
The views expressed in this report reflect those of the portfolio managers only through the end of the period covered by the report. These views do not necessarily represent the views of RIMCo, or any other person in RIMCo or any other affiliated organization. These views are subject to change at any time based upon market conditions or other events, and RIMCo disclaims any responsibility to update the views contained herein. These views should not be relied on as investment advice and, because investment decisions for a Russell Investment Fund (RIF) or Russell Investment Company (RIC) Fund are based on numerous factors, should not be relied on as an indication of investment decisions of any RIF or RIC Fund.
| | |
| 12 | | Moderate Strategy Fund |
Russell Investment Funds
Moderate Strategy Fund
Shareholder Expense Example — December 31, 2008 (Unaudited)
Fund Expenses
The following disclosure provides important information regarding each Fund’s Expense Example, which appears on each Fund’s individual page in this Annual Report. Please refer to this information when reviewing the Expense Example for a Fund.
Example
As a shareholder of the Fund, you incur two types of costs: (1) transaction costs, and (2) ongoing costs, including management fees and other Fund expenses. The Example is intended to help you understand your ongoing costs (in dollars) of investing in the Fund and to compare these costs with the ongoing costs of investing in other mutual funds. The Example is based on an investment of $1,000 invested at the beginning of the period and held for the entire period indicated, which for this Fund is from July 1, 2008 to December 31, 2008.
Actual Expenses
The information in the table under the heading “Actual Performance” provides information about actual account values and actual expenses. You may use the information in this column, together with the amount you invested, to estimate the expenses that you paid over the period. Simply divide your account value by $1,000 (for example, an $8,600 account value divided by $1,000 = 8.6), then multiply the result by the number in the first column in the row entitled “Expenses Paid During Period” to estimate the expenses you paid on your account during this period.
Hypothetical Example for Comparison Purposes
The information in the table under the heading “Hypothetical Performance (5% return before expenses)” provides information about hypothetical account values and hypothetical expenses based on the Fund’s actual expense ratio and an assumed rate of return of 5% per year before expenses, which is not the Fund’s actual return. The hypothetical account values and expenses may not be used to estimate the actual ending account balance or expenses you paid for the period. You may use this information to compare the ongoing costs of investing in the Fund and other funds. To do so, compare this 5% hypothetical example with the 5% hypothetical examples that appear in the shareholder reports of other funds.
Please note that the expenses shown in the table are meant to highlight your ongoing costs only and do not reflect any transactional costs. Therefore, the information under the heading “Hypothetical Performance (5% return before expenses)” is useful in comparing ongoing costs only, and will not help you determine the relative total costs of owning different funds. In addition, if these transactional costs were included, your costs would have been higher. The fee and expenses shown in this section do not reflect any Insurance Company Separate Account or Policy Charges.
| | | | | | |
| | | Actual
Performance | | Hypothetical
Performance
(5% return
before expenses) |
| | | | | | |
Beginning Account Value | | | | | | |
July 1, 2008 | | $ | 1,000.00 | | $ | 1,000.00 |
Ending Account Value | | | | | | |
December 31, 2008 | | $ | 834.70 | | $ | 1,024.58 |
Expenses Paid During | | | | | | |
Period* | | $ | 0.51 | | $ | 0.56 |
| * | Expenses are equal to the Fund’s annualized expense ratio of 0.11% (representing the one-half year period annualized), multiplied by the average account value over the period, multiplied by 184/366 (to reflect the one-half year period). Reflects amounts waived and/or reimbursed. Without the waiver and/or reimbursement, expenses would have been higher. |
| | |
| Moderate Strategy Fund | | 13 |
Russell Investment Funds
Moderate Strategy Fund
Schedule of Investments — December 31, 2008
Amounts in thousands (except share amounts)
| | | | | |
| | | Shares | | Market
Value
$ | |
| | | | | |
| Investments -100.1% | | | | | |
Other Russell Investment Funds
(“RIF”) and Russell Investment
Company (“RIC”) Series Mutual
Funds | | | |
| | |
| Bonds - 60.2% | | | | | |
RIF Core Bond Fund | | 1,244,532 | | 11,616 | |
| | | | | |
| | |
| Domestic Equities - 26.0% | | | | | |
RIF Aggressive Equity Fund | | 79,710 | | 572 | |
RIF Multi-Style Equity Fund | | 213,609 | | 1,923 | |
RIF Real Estate Securities Fund | | 62,369 | | 580 | |
RIC Russell U.S. Quantitative Equity Fund | | 91,374 | | 1,942 | |
| | | | | |
| | | | 5,017 | |
| | | | | |
| | |
| International Equities - 13.9% | | | | | |
RIF Non-U.S. Fund | | 230,326 | | 1,724 | |
RIC Russell Emerging Markets Fund | | 38,863 | | 383 | |
RIC Russell Global Equity Fund | | 100,888 | | 579 | |
| | | | | |
| | | | 2,686 | |
| | | | | |
| | |
Total Investments - 100.1%
(identified cost $23,496) | | | | 19,319 | |
| | |
Other Assets and Liabilities,
Net - (0.1%) | | | | (11 | ) |
| | | | | |
| | |
| Net Assets - 100.0% | | | | 19,308 | |
| | | | | |
See accompanying notes which are an integral part of the financial statements.
| | |
| 14 | | Moderate Strategy Fund |
(This page intentionally left blank)
Russell Investment Funds
Balanced Strategy Fund
Portfolio Management Discussion and Analysis — December 31, 2008 (Unaudited)
| | | | | |
|
| Balanced Strategy Fund | |
| | | Total
Return | |
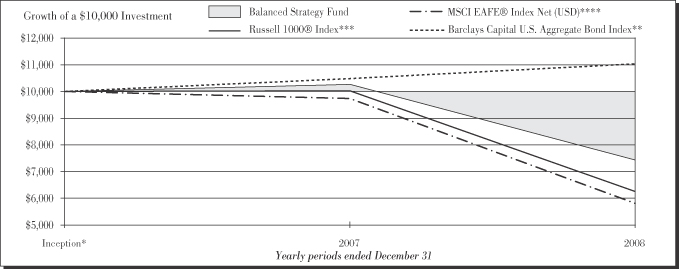
1 Year | | | | (27.70 | )% |
Inception* | | | | (16.30 | )%§ |
| | | | | |
|
| Barclays Capital U.S. Aggregate Bond Index** | |
| | | Total
Return | |
1 Year | | | | 5.24 | % |
Inception* | | | | 6.05 | %§ |
| | | | | |
|
| Russell 1000® Index*** | |
| | | Total
Return | |
1 Year | | | | (37.60 | )% |
Inception* | | | | (24.45 | )%§ |
| | | | | |
|
| MSCI EAFE® Index Net (USD)**** | |
| | | Total
Return | |
1 Year | | | | (43.38 | )% |
Inception* | | | | (27.88 | )%§ |
| * | | The Fund commenced operation on April 30, 2007. |
| ** | | On October 31, 2008, Barclays Capital, which acquired the Lehman family of indexes in September 2008, announced that it would be re-branding Lehman indexes under the Barclays Capital name; the underlying index structures are to remain unchanged. As a result, the Lehman Brothers Aggregate Bond Index has been renamed the Barclays Capital U.S. Aggregate Bond Index. |
| | | Barclays Capital U.S. Aggregate Bond Index is composed of securities from Barclays Capital U.S. Government/Corporate Bond Index, Mortgage-Backed Securities Index, and the Asset-Backed Securities Index. Total return comprises price appreciation/depreciation and income as a percentage of the original investment. Indexes are rebalanced monthly by market capitalization. |
*** | | Russell 1000® Index includes the 1,000 largest companies in the Russell 3000® Index. The Russell 1000® Index represents the universe of stocks from which most active money managers typically select. The Russell 1000® Index return reflects adjustments from income dividends and capital gain distributions reinvested as of the ex-dividend dates. |
| **** | | Morgan Stanley Capital International Europe, Australia, Far East (MSCI EAFE) Index is an index composed of an arithmetic, market value-weighted average of the performance of approximately 1,600 securities listed on the stock exchange of the countries of Europe, Australia, and the Far East. The index is calculated on a total-return basis, which included reinvestment of gross dividends before deduction of withholding taxes. |
The performance shown in this section does not reflect any Insurance Company Separate Account or Policy Charges. Performance is historical and assumes reinvestment of all dividends and capital gains. Investment return and principal value will fluctuate so that an investor’s shares, when redeemed, may be worth more or less than when purchased. Past performance is not indicative of future results.
| | |
| 16 | | Balanced Strategy Fund |
Russell Investment Funds
Balanced Strategy Fund
Portfolio Management Discussion and Analysis — December 31, 2008 (Unaudited)
The Fund is a fund of funds that invests in other Russell Investment Funds and Russell Investment Company mutual funds (the “Underlying Funds”). The Underlying Funds allocate most of their assets among multiple money managers. Russell Investment Management Company (“RIMCo”), as the Underlying Funds' advisor, may change the allocation of the Underlying Funds' assets among money managers at any time. An exemptive order from the Securities and Exchange Commission (SEC) permits RIMCo to engage or terminate a money manager in an Underlying Fund at any time, subject to the approval by the Underlying Fund’s Board without a shareholder vote.
What is the Fund’s investment objective?
The Balanced Strategy Fund (“Fund”) seeks to provide above average capital appreciation and a moderate level of current income.
How did the Fund perform relative to its benchmark for the fiscal year ended December 31, 2008?
For the fiscal year ended December 31, 2008, the Balanced Strategy Fund lost 27.70%. This compared to the Barclays Capital U.S. Aggregate Bond Index, which gained 5.24% during the same period. The Fund’s performance includes operating expenses, whereas the Index returns are unmanaged and do not include expenses of any kind. The Fund was negatively impacted by its allocation to all equity Underlying Funds and the fixed income Underlying Fund’s overweight to non-Treasury sectors.
For the year ended December 31, 2008, the Balanced Strategy Lipper Composite lost 27.65%. This result serves as a peer comparison and is expressed net of operating expenses.
Each Underlying Fund has a benchmark reflective of its respective asset class. These benchmarks may be different than the Fund’s benchmark. The Fund’s benchmark represents the largest asset class of the Underlying Funds in which it invests.
How did the market conditions described in the Market Summary report affect the Fund’s performance?
The Fund is a fund of funds and its performance is based on the performance of the Underlying Funds in which it invests. The Fund’s performance was negatively impacted by the financial crisis that affected virtually all asset classes during the fiscal year. The largest impact on the Fund’s underperformance relative to its benchmark was from its exposure to large cap U.S. equities and non-U.S. developed market equities. The performance of the equity Underlying Funds (approximately 60% of the Fund) detracted from returns relative to the Fund’s all-fixed income benchmark the Barclays Capital U.S. Aggregate Bond Index.
The extreme volatility of the financial markets during the fiscal period created a headwind for most active managers. In this challenging environment, all but one underlying equity asset class funds lagged their respective benchmarks; yet, four of eight Underlying Funds outperformed their peers within their asset classes as measured by their respective Lipper®
Averages. The Barclays Capital U.S. Aggregate Bond Index, the benchmark for the RIF Core Bond Underlying Fund, was the only Underlying Fund benchmark with a positive return. The returns of this index benefited from the inclusion of Treasuries. The RIF Core Bond Underlying Fund held a significant underweight to Treasuries relative to the benchmark. In absolute terms, bonds as measured by the Barclays Capital U.S. Aggregate Bond Index performed better than equities.
How did the investment strategies and techniques employed by the Fund and its money managers of the Underlying Funds affect the Fund’s performance?
At the Fund level, all Underlying Funds contributed negatively to the Fund’s returns relative to the Barclays Capital U.S. Aggregate Bond Index. The RIF Core Bond, however, detracted less from the Fund’s benchmark-relative performance than the equity Underlying Funds.
The U.S. equity Underlying Funds maintained an overall preference for companies with above-average growth rates and attractive valuations. This positioning was not rewarded in 2008 where investors were driven by fear, looking for relative safety and selling stocks regardless of fundamentals. U.S. large cap managers in the Underlying Fund using quantitative investment strategies added to returns by shorting several of the financial stocks that underperformed in the fiscal period. Yet, this was offset by managers employing growth and momentum strategies, which underperformed in this environment.
Managers in the small cap U.S. equity Underlying Fund negatively impacted the Fund by underweighting the financials sector and overweighting the other energy sector. Small cap financials rebounded from their lows as the Federal Reserve and Treasury offered wide ranging forms of financial support. The prices of other energy stocks fell as the price of oil fell.
Managers in the non-U.S. developed market Underlying Fund performed better than managers in global equity and emerging markets Underlying Funds. Yet the Fund’s higher allocation to the Non-U.S. developed markets Underlying Fund resulted in a larger negative impact on the Fund’s benchmark relative performance. This Underlying Fund’s multi-style discipline provided some risk control during the fiscal period given the extreme variability in investment style and market leadership. More defensive strategies helped moderate the negative impact of strategies more focused on deteriorating economic conditions.
In emerging markets, the returns of emerging markets Underlying Fund declined along with the returns of the asset class, which experienced its biggest calendar year decline in the history of the asset class. The asset class endured massive asset deleveraging and extreme levels of market volatility. Commodity-related sectors suffered most as the global economic slowdown cut demand.
The real estate Underlying Fund focused primarily on the larger and more liquid REITs during the fiscal year. With the exceptional volatility experienced during the period due to the
| | |
| Balanced Strategy Fund | | 17 |
Russell Investment Funds
Balanced Strategy Fund
Portfolio Management Discussion and Analysis — December 31, 2008 (Unaudited)
global economic crisis and cash outflows, this positioning hurt Fund performance. The Underlying Fund’s exposure to non-U.S. REITs, though beneficial in the last quarter of the fiscal period, negatively impacted returns for the year.
By far, the largest affect on the fixed income Underlying Fund’s underperformance relative to its benchmark was from the re-pricing of risk (i.e., the market demanding increased compensation for assuming a given level of risk), the fundamental concern regarding the consumer’s ability to make mortgage payments, and the negative impact that market and credit issues had on virtually all non-Treasury segments of the fixed income markets. This Underlying Fund had a material overweight to mortgage-backed securities. This contributed significantly to this Underlying Fund’s benchmark-relative underperformance. The decrease in interest rates across the yield curve had little impact on that Underlying Fund’s performance as its money managers implemented offsetting duration strategies. Yet, as the Federal Reserve decreased the federal funds target rate, short-term yields declined relative to intermediate- and long-term yields resulting in a yield curve “steepening.” Several of the Underlying Fund’s money managers anticipated the change and varied the maturities of their securities accordingly, positioning their portfolios to benefit from these changes
The Funds’ performance shown throughout this report was based on the Underlying Funds’ valuations calculated in accordance with Generally Accepted Accounting Principles (GAAP) and in accordance with a newly effective accounting statement (SFAS 157), reflects the December 31, 2008 market value of the pooled investment vehicle in which the Underlying Funds invested their cash collateral received in securities lending transactions. The market value was lower than the vehicle’s amortized cost per unit. This had a negative impact on the Fund’s benchmark relative performance.
Describe any changes to the Fund’s structure or allocation to the Underlying Funds.
In September, 2008, certain of the Underlying Funds in which the Fund invested (the “Former Underlying Funds”) changed as set forth below as the result of the reorganization (the “Reorganizations”) of the Former Underlying Funds into other Russell Investment Company Funds (the “New Underlying Funds”).
| | |
| |
| Former Underlying Fund | | New Underlying Fund |
Quantitative Equity Fund | | Russell U.S. Quantitative Equity Fund |
The New Underlying Fund has the same investment objective, principal investment strategies, investment policies and principal risks as the Former Underlying Fund which it replaced and the allocation of the Fund’s assets to the New Underlying Fund is the same as it was to the Former Underlying Fund.
The views expressed in this report reflect those of the portfolio managers only through the end of the period covered by the report. These views do not necessarily represent the views of RIMCo, or any other person in RIMCo or any other affiliated organization. These views are subject to change at any time based upon market conditions or other events, and RIMCo disclaims any responsibility to update the views contained herein. These views should not be relied on as investment advice and, because investment decisions for a Russell Investment Fund (RIF) or Russell Investment Company (RIC) Fund are based on numerous factors, should not be relied on as an indication of investment decisions of any RIF or RIC Fund.
| | |
| 18 | | Balanced Strategy Fund |
Russell Investment Funds
Balanced Strategy Fund
Shareholder Expense Example — December 31, 2008 (Unaudited)
Fund Expenses
The following disclosure provides important information regarding each Fund’s Expense Example, which appears on each Fund’s individual page in this Annual Report. Please refer to this information when reviewing the Expense Example for a Fund.
Example
As a shareholder of the Fund, you incur two types of costs: (1) transaction costs, and (2) ongoing costs, including management fees and other Fund expenses. The Example is intended to help you understand your ongoing costs (in dollars) of investing in the Fund and to compare these costs with the ongoing costs of investing in other mutual funds. The Example is based on an investment of $1,000 invested at the beginning of the period and held for the entire period indicated, which for this Fund is from July 1, 2008 to December 31, 2008.
Actual Expenses
The information in the table under the heading “Actual Performance” provides information about actual account values and actual expenses. You may use the information in this column, together with the amount you invested, to estimate the expenses that you paid over the period. Simply divide your account value by $1,000 (for example, an $8,600 account value divided by $1,000 = 8.6), then multiply the result by the number in the first column in the row entitled “Expenses Paid During Period” to estimate the expenses you paid on your account during this period.
Hypothetical Example for Comparison Purposes
The information in the table under the heading “Hypothetical Performance (5% return before expenses)” provides information about hypothetical account values and hypothetical expenses based on the Fund’s actual expense ratio and an assumed rate
of return of 5% per year before expenses, which is not the Fund’s actual return. The hypothetical account values and expenses may not be used to estimate the actual ending account balance or expenses you paid for the period. You may use this information to compare the ongoing costs of investing in the Fund and other funds. To do so, compare this 5% hypothetical example with the 5% hypothetical examples that appear in the shareholder reports of other funds.
Please note that the expenses shown in the table are meant to highlight your ongoing costs only and do not reflect any transactional costs. Therefore, the information under the heading “Hypothetical Performance (5% return before expenses)” is useful in comparing ongoing costs only, and will not help you determine the relative total costs of owning different funds. In addition, if these transactional costs were included, your costs would have been higher. The fee and expenses shown in this section do not reflect any Insurance Company Separate Account or Policy Charges.
| | | | | | |
| | | Actual
Performance | | Hypothetical
Performance
(5% return
before expenses) |
Beginning Account Value | | | | | | |
July 1, 2008 | | $ | 1,000.00 | | $ | 1,000.00 |
Ending Account Value | | | | | | |
December 31, 2008 | | $ | 773.77 | | $ | 1,024.73 |
Expenses Paid During | | | | | | |
Period* | | $ | 0.36 | | $ | 0.41 |
| * | Expenses are equal to the Fund’s annualized expense ratio of 0.08% (representing the one-half year period annualized), multiplied by the average account value over the period, multiplied by 184/366 (to reflect the one-half year period). Reflects amounts waived and/or reimbursed. Without the waiver and/or reimbursement, expenses would have been higher. |
| | |
| Balanced Strategy Fund | | 19 |
Russell Investment Funds
Balanced Strategy Fund
Schedule of Investments — December 31, 2008
Amounts in thousands (except share amounts)
| | | | | |
| | | Shares | | Market
Value
$ | |
| | | | | |
| Investments - 100.0% | | | | | |
Other Russell Investment Funds
(“RIF”) and Russell Investment
Company (“RIC”) Series Mutual
Funds | | | |
| | |
| Bonds - 39.3% | | | | | |
RIF Core Bond Fund | | 2,535,119 | | 23,663 | |
| | | | | |
| | |
| Domestic Equities - 39.6% | | | | | |
RIF Aggressive Equity Fund | | 337,912 | | 2,427 | |
RIF Multi-Style Equity Fund | | 1,007,644 | | 9,069 | |
RIF Real Estate Securities Fund | | 337,627 | | 3,138 | |
RIC Russell U.S. Quantitative Equity Fund | | 431,619 | | 9,172 | |
| | | | | |
| | | | 23,806 | |
| | | | | |
| | |
| International Equities - 21.1% | | | | | |
RIF Non-U.S. Fund | | 1,131,869 | | 8,472 | |
RIC Russell Emerging Markets Fund | | 183,498 | | 1,808 | |
RIC Russell Global Equity Fund | | 422,530 | | 2,425 | |
| | | | | |
| | | | 12,705 | |
| | | | | |
| | |
Total Investments - 100.0%
(identified cost $81,252) | | | | 60,174 | |
| | |
Other Assets and Liabilities,
Net - (0.0%) | | | | (16 | ) |
| | | | | |
| | |
| Net Assets - 100.0% | | | | 60,158 | |
| | | | | |
See accompanying notes which are an integral part of the financial statements.
| | |
| 20 | | Balanced Strategy Fund |
(This page intentionally left blank)
Russell Investment Funds
Growth Strategy Fund
Portfolio Management Discussion and Analysis — December 31, 2008 (Unaudited)
| | | | | |
| |
| Growth Strategy Fund | | | |
| | | Total
Return | |
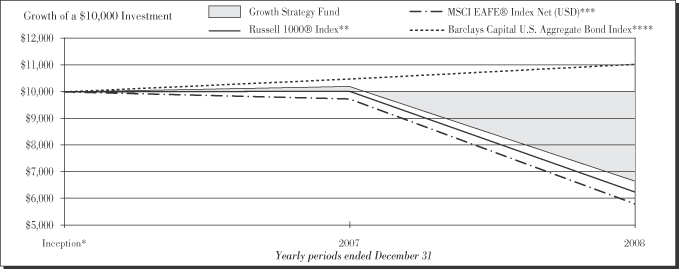
1 Year | | | | (34.73 | )% |
Inception* | | | | (21.55 | )%§ |
| | | | | |
| |
| Russell 1000® Index** | | | |
| | | Total
Return | |
1 Year | | | | (37.60 | )% |
Inception* | | | | (24.45 | )%§ |
| | | | | |
| |
| MSCI EAFE® Index Net (USD)*** | | | |
| | | Total
Return | |
1 Year | | | | (43.38 | )% |
Inception* | | | | (27.88 | )%§ |
| | | | | |
|
| Barclays Capital U.S. Aggregate Bond Index**** | |
| | | Total
Return | |
1 Year | | | | 5.24 | % |
Inception* | | | | 6.05 | %§ |
| * | | The Fund commenced operation on April 30, 2007. |
** | | Russell 1000® Index includes the 1,000 largest companies in the Russell 3000® Index. The Russell 1000® Index represents the universe of stocks from which most active money managers typically select. The Russell 1000® Index return reflects adjustments from income dividends and capital gain distributions reinvested as of the ex-dividend dates. |
| *** | | Morgan Stanley Capital International Europe, Australia, Far East (MSCI EAFE) Index is an index composed of an arithmetic, market value-weighted average of the performance of approximately 1,600 securities listed on the stock exchange of the countries of Europe, Australia, and the Far East. The index is calculated on a total-return basis, which included reinvestment of gross dividends before deduction of withholding taxes. |
| **** | | On October 31, 2008, Barclays Capital, which acquired the Lehman family of indexes in September 2008, announced that it would be re-branding Lehman indexes under the Barclays Capital name; the underlying index structures are to remain unchanged. As a result, the Lehman Brothers Aggregate Bond Index has been renamed the Barclays Capital U.S. Aggregate Bond Index. |
| | | Barclays Capital U.S. Aggregate Bond Index is composed of securities from Barclays Capital U.S. Government/Corporate Bond Index, Mortgage-Backed Securities Index, and the Asset-Backed Securities Index. Total return comprises price appreciation/depreciation and income as a percentage of the original investment. Indexes are rebalanced monthly by market capitalization. |
The performance shown in this section does not reflect any Insurance Company Separate Account or Policy Charges. Performance is historical and assumes reinvestment of all dividends and capital gains. Investment return and principal value will fluctuate so that an investor’s shares, when redeemed, may be worth more or less than when purchased. Past performance is not indicative of future results.
Russell Investment Funds
Growth Strategy Fund
Portfolio Management Discussion and Analysis — December 31, 2008 (Unaudited)
The Fund is a fund of funds that invests in other Russell Investment Funds and Russell Investment Company mutual funds (the “Underlying Funds”). The Underlying Funds allocate most of their assets among multiple money managers. Russell Investment Management Company (“RIMCo”), as the Underlying Funds' advisor, may change the allocation of the Underlying Funds' assets among money managers at any time. An exemptive order from the Securities and Exchange Commission (SEC) permits RIMCo to engage or terminate a money manager in an Underlying Fund at any time, subject to the approval by the Underlying Fund’s Board without a shareholder vote.
What is the Fund’s investment objective?
The Growth Strategy Fund (“Fund”) seeks to provide high long term capital appreciation with low current income.
How did the Fund perform relative to its benchmark for the fiscal year ended December 31, 2008?
For the fiscal year ended December 31, 2008, the Growth Strategy Fund lost 34.73%. This compared to the Russell 1000® Index, which lost 37.60% during the same period. The Fund’s performance includes operating expenses, whereas the Index returns are unmanaged and do not include expenses of any kind. The Fund’s performance was negatively impacted mostly by its allocation to all equities. This was partly offset by the Fund’s allocation to fixed income.
For the year ended December 31, 2008, the Growth Strategy Lipper Composite lost 34.19%. This result serves as a peer comparison and is expressed net of operating expenses.
Each Underlying Fund has a benchmark reflective of its respective asset class. These benchmarks may be different than the Fund’s benchmark. The Fund’s benchmark represents the largest asset class of the Underlying Funds in which it invests.
How did the market conditions described in the Market Summary report affect the Fund’s performance?
The Fund is a fund of funds and its performance is based on the performance of the Underlying Funds in which it invests. The Fund’s performance was negatively impacted by the financial crisis that affected virtually all asset classes during the fiscal year. The largest positive contribution to the Fund’s performance relative to its all-equity benchmark was from its exposure to fixed income through its investment in the RIF Core Bond Underlying Fund. The performance of the equity Underlying Funds (approximately 80% of the Fund) detracted from returns relative to the Fund’s benchmark, the Russell 1000® Index.
The extreme volatility of the financial markets during the fiscal period created a headwind for most active managers. In this challenging environment, all but one underlying equity asset class funds lagged their respective benchmarks; yet, four of eight Underlying Funds outperformed their peers within their asset classes as measured by their respective Lipper® Averages. The Barclays Capital U.S. Aggregate Bond Index, the
benchmark for the RIF Core Bond Underlying Fund, was the only Underlying Fund benchmark with a positive absolute return. The returns of this index benefited from the inclusion of Treasuries. The RIF Core Bond Underlying Fund held a significant underweight to Treasuries relative to the benchmark. In absolute terms, bonds as measured by the Barclays Capital U.S. Aggregate Bond Index performed better than equities.
How did the investment strategies and techniques employed by the Fund and its money managers of the Underlying Funds affect the Fund’s performance?
At the Fund level, exposure to the RIF Multi-Style Equity, RIF Non-U.S. and Russell U.S. Quantitative Equity Underlying Funds dampened returns relative to the Russell 1000® Index. The RIF Core Bond Underlying Fund contributed positively to the Fund’s benchmark-relative performance.
The U.S. equity Underlying Funds maintained an overall preference for companies with above-average growth rates and attractive valuations. This positioning was not rewarded in 2008 where investors were driven by fear, looking for relative safety and selling stocks regardless of fundamentals. U.S. large cap managers in the Underlying Fund using quantitative investment strategies added to returns by shorting several of the financial stocks that underperformed in the fiscal period. Yet, this was offset by managers employing growth and momentum strategies, which underperformed in this environment.
Managers in the small cap U.S. equity Underlying Fund negatively impacted the Fund by underweighting the financials sector and overweighting the other energy sector. Small cap financials rebounded from their lows as the Federal Reserve and Treasury offered wide ranging forms of financial support. The prices of other energy stocks fell as the price of oil fell.
Managers in the non-U.S. developed markets Underlying Fund performed better than managers in global equity and emerging markets Underlying Funds. Yet the Fund’s higher allocation to the Non-U.S. developed markets Underlying Fund resulted in a larger negative impact on the Fund’s benchmark relative performance. This Underlying Fund’s multi-style discipline provided some risk control during the fiscal period given the extreme variability in investment style and market leadership. More defensive strategies helped moderate the negative impact of strategies more focused on deteriorating economic conditions.
In emerging markets, the returns of emerging markets Underlying Fund declined along with the returns of the asset class, which experienced its biggest calendar year decline in the history of the asset class. The asset class endured massive asset deleveraging and extreme levels of market volatility. Commodity-related sectors suffered most as the global economic slowdown cut demand.
The real estate Underlying Fund focused primarily on the larger and more liquid REITs during the fiscal year. With the exceptional volatility experienced during the period due to the
Russell Investment Funds
Growth Strategy Fund
Portfolio Management Discussion and Analysis — December 31, 2008 (Unaudited)
global economic crisis and cash outflows, this positioning hurt Fund performance. The Underlying Fund’s exposure to non-U.S. REITs added to the Fund excess weighted performance relative to the benchmark for the year.
While the fixed income Underlying Fund contributed positively to the Fund’s benchmark relative performance, this Underlying Fund underperformed its benchmark. By far, the largest affect on the Underlying Fund’s underperformance relative to its benchmark was from the re-pricing of risk (i.e., the market demanding increased compensation for assuming a given level of risk), the fundamental concern regarding the consumer’s ability to make mortgage payments, and the negative impact that market and credit issues had on virtually all non-Treasury segments of the fixed income markets. This Underlying Fund had a material overweight to mortgage-backed securities. This contributed significantly to this Underlying Fund’s benchmark-relative underperformance. The decrease in interest rates across the yield curve had little impact on that Underlying Fund’s performance as its money managers implemented offsetting duration strategies. Yet, as the Federal Reserve decreased the federal funds target rate, short-term yields declined relative to intermediate- and long-term yields resulting in a yield curve “steepening.” Several of the Underlying Fund’s money managers anticipated the change and varied the maturities of their securities accordingly, positioning their portfolios to benefit from these changes.
The Funds’ performance shown throughout this report was based on the Underlying Funds’ valuations calculated in accordance with Generally Accepted Accounting Principles (GAAP) and in accordance with a newly effective accounting statement (SFAS 157), reflects the December 31, 2008 market value of the pooled investment vehicle in which the Underlying Funds invested their cash collateral received in securities lending transactions. The market value was lower than the vehicle’s amortized cost per unit. This had a negative impact on the Fund’s benchmark relative performance.
Describe any changes to the Fund’s structure or allocation to the Underlying Funds.
In September, 2008, certain of the Underlying Funds in which the Fund invested (the “Former Underlying Funds”) changed as set forth below as the result of the reorganization (the “Reorganizations”) of the Former Underlying Funds into other Russell Investment Company Funds (the “New Underlying Funds”).
| | |
| |
| Former Underlying Fund | | New Underlying Fund |
Quantitative Equity Fund | | Russell U.S. Quantitative Equity Fund |
The New Underlying Fund has the same investment objective, principal investment strategies, investment policies and principal risks as the Former Underlying Fund which it replaced and the allocation of the Fund’s assets to the New Underlying Fund is the same as it was to the Former Underlying Fund.
The views expressed in this report reflect those of the portfolio managers only through the end of the period covered by the report. These views do not necessarily represent the views of RIMCo, or any other person in RIMCo or any other affiliated organization. These views are subject to change at any time based upon market conditions or other events, and RIMCo disclaims any responsibility to update the views contained herein. These views should not be relied on as investment advice and, because investment decisions for a Russell Investment Fund (RIF) or Russell Investment Company (RIC) Fund are based on numerous factors, should not be relied on as an indication of investment decisions of any RIF or RIC Fund.
Russell Investment Funds
Growth Strategy Fund
Shareholder Expense Example — December 31, 2008 (Unaudited)
Fund Expenses
The following disclosure provides important information regarding each Fund’s Expense Example, which appears on each Fund’s individual page in this Annual Report. Please refer to this information when reviewing the Expense Example for a Fund.
Example
As a shareholder of the Fund, you incur two types of costs: (1) transaction costs, and (2) ongoing costs, including management fees and other Fund expenses. The Example is intended to help you understand your ongoing costs (in dollars) of investing in the Fund and to compare these costs with the ongoing costs of investing in other mutual funds. The Example is based on an investment of $1,000 invested at the beginning of the period and held for the entire period indicated, which for this Fund is from July 1, 2008 to December 31, 2008.
Actual Expenses
The information in the table under the heading “Actual Performance” provides information about actual account values and actual expenses. You may use the information in this column, together with the amount you invested, to estimate the expenses that you paid over the period. Simply divide your account value by $1,000 (for example, an $8,600 account value divided by $1,000 = 8.6), then multiply the result by the number in the first column in the row entitled “Expenses Paid During Period” to estimate the expenses you paid on your account during this period.
Hypothetical Example for Comparison Purposes
The information in the table under the heading “Hypothetical Performance (5% return before expenses)” provides information about hypothetical account values and hypothetical expenses based on the Fund’s actual expense ratio and an assumed rate of return of 5% per year before expenses, which is not the Fund’s actual return. The hypothetical account values and expenses may not be used to estimate the actual ending account balance or expenses you paid for the period. You may use this information to compare the ongoing costs of investing in the Fund and other funds. To do so, compare this 5% hypothetical example with the 5% hypothetical examples that appear in the shareholder reports of other funds.
Please note that the expenses shown in the table are meant to highlight your ongoing costs only and do not reflect any transactional costs. Therefore, the information under the heading “Hypothetical Performance (5% return before expenses)” is useful in comparing ongoing costs only, and will not help you determine the relative total costs of owning different funds. In addition, if these transactional costs were included, your costs would have been higher. The fee and expenses shown in this section do not reflect any Insurance Company Separate Account or Policy Charges.
| | | | | | |
| | | Actual
Performance | | Hypothetical
Performance
(5% return
before expenses) |
| | | | | | |
| | | | | | |
Beginning Account Value | | | | | | |
July 1, 2008 | | $ | 1,000.00 | | $ | 1,000.00 |
Ending Account Value | | | | | | |
December 31, 2008 | | $ | 714.01 | | $ | 1,024.94 |
Expenses Paid During Period* | | $ | 0.17 | | $ | 0.20 |
| * | Expenses are equal to the Fund’s annualized expense ratio of 0.04% (representing the one-half year period annualized), multiplied by the average account value over the period, multiplied by 184/366 (to reflect the one-half year period). Reflects amounts waived and/or reimbursed. Without the waiver and/or reimbursement, expenses would have been higher. |
Russell Investment Funds
Growth Strategy Fund
Schedule of Investments — December 31, 2008
Amounts in thousands (except share amounts)
| | | | | |
| | | Shares | | Market
Value
$ | |
| | | | | |
| Investments - 100.0% | | | | | |
Other Russell Investment Funds
(“RIF”) and Russell Investment
Company (“RIC”) Series Mutual
Funds | | | |
| | |
| Bonds - 20.3% | | | | | |
RIF Core Bond Fund | | 755,265 | | 7,050 | |
| | | | | |
| | |
| Domestic Equities - 52.9% | | | | | |
RIF Aggressive Equity Fund | | 288,062 | | 2,069 | |
RIF Multi-Style Equity Fund | | 796,729 | | 7,171 | |
RIF Real Estate Securities Fund | | 237,447 | | 2,207 | |
RIC Russell U.S. Quantitative Equity Fund | | 325,489 | | 6,917 | |
| | | | | |
| | | | 18,364 | |
| | | | | |
| | |
| International Equities - 26.8% | | | | | |
RIF Non-U.S. Fund | | 785,740 | | 5,881 | |
RIC Russell Emerging Markets Fund | | 140,727 | | 1,386 | |
RIC Russell Global Equity Fund | | 360,983 | | 2,072 | |
| | | | | |
| | | | 9,339 | |
| | | | | |
| | |
Total Investments - 100.0%
(identified cost $52,231) | | | | 34,753 | |
| | |
Other Assets and Liabilities,
Net - (0.0%) | | | | (11 | ) |
| | | | | |
| | |
| Net Assets - 100.0% | | | | 34,742 | |
| | | | | |
See accompanying notes which are an integral part of the financial statements.
(This page intentionally left blank)
Russell Investment Funds
Equity Growth Strategy Fund
Portfolio Management Discussion — December 31, 2008 (Unaudited)
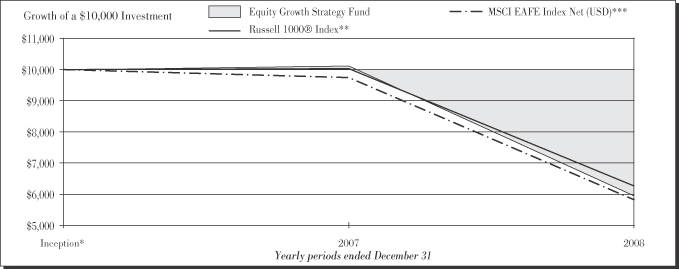
| | | | |
| | |
| Equity Growth Strategy Fund | | | | |
| | | Total
Return |
1 Year | | | | (41.18)% |
Inception * | | | | (26.66)%§ |
| | | | |
| | |
| Russell 1000® Index ** | | | | |
| | | Total
Return |
1 Year | | | | (37.60)% |
Inception * | | | | (24.45)%§ |
| | | | | |
|
| MSCI EAFE® Index Net (USD) *** | |
| | | Total
Return | |
1 Year | | | | (43.38 | )% |
Inception * | | | | (27.88 | )%§ |
| * | | The Fund commenced operation on April 30, 2007. |
** | | Russell 1000® Index includes the 1,000 largest companies in the Russell 3000® Index. The Russell 1000® Index represents the universe of stocks from which most active money managers typically select. The Russell 1000® Index return reflects adjustments from income dividends and capital gain distributions reinvested as of the ex-dividend dates. |
| *** | | Morgan Stanley Capital International Europe, Australia, Far East (MSCI EAFE) Index is an index composed of an arithmetic, market value-weighted average of the performance of approximately 1,600 securities listed on the stock exchange of the countries of Europe, Australia, and the Far East. The index is calculated on a total-return basis, which included reinvestment of gross dividends before deduction of withholding taxes. |
The performance shown in this section does not reflect any Insurance Company Separate Account or Policy Charges. Performance is historical and assumes reinvestment of all dividends and capital gains. Investment return and principal value will fluctuate so that an investor’s shares, when redeemed, may be worth more or less than when purchased. Past performance is not indicative of future results.
| | |
| 28 | | Equity Growth Strategy Fund |
Russell Investment Funds
Equity Growth Strategy Fund
Portfolio Management Discussion and Analysis — December 31, 2008 (Unaudited)
The Fund is a fund of funds that invests in other Russell Investment Funds and Russell Investment Company mutual funds (the “Underlying Funds”). The Underlying Funds allocate most of their assets among multiple money managers. Russell Investment Management Company (“RIMCo”), as the Underlying Funds' advisor, may change the allocation of the Underlying Funds' assets among money managers at any time. An exemptive order from the Securities and Exchange Commission (SEC) permits RIMCo to engage or terminate a money manager in an Underlying Fund at any time, subject to the approval by the Underlying Fund’s Board without a shareholder vote.
What is the Fund’s investment objective?
The Equity Growth Strategy Fund (“Fund”) seeks to provide high long term capital appreciation.
How did the Fund perform relative to its benchmark for the fiscal year ended December 31, 2008?
For the fiscal year ended December 31, 2008, the Equity Growth Strategy Fund lost 41.18%. This compared to the Russell 1000® Index, which lost 37.60% during the same period. The Fund’s performance includes operating expenses, whereas the Index returns are unmanaged and do not include expenses of any kind. The Fund’s performance was negatively impacted mostly by its allocation to the large cap and non-U.S equity asset classes, which are not included in the Fund’s benchmark.
For the year ended December 31, 2008, the Equity Growth Strategy Lipper Composite – lost 39.68%. This result serves as a peer comparison and is expressed net of operating expenses.
Each Underlying Fund has a benchmark reflective of its respective asset class. These benchmarks may be different than the Fund’s benchmark. The Fund’s benchmark represents the largest asset class of the Underlying Funds in which it invests.
How did the market conditions described in the Market Summary report affect the Fund’s performance?
The Fund is a fund of funds and its performance is based on the performance of the Underlying Funds in which it invests. The Fund’s performance was negatively impacted by the financial crisis that affected virtually all asset classes during the fiscal year. The largest impact on the Fund’s weighted excess return relative to the Russell 1000® Index was negative from its exposure to the RIF Multi-Style Equity, RIF Non-U.S., RIF Emerging Markets, Russell Global Equity and the RIF Aggressive Equity Underlying Funds.
The extreme volatility of the financial markets during the fiscal period created a headwind for most active managers. In this challenging environment, all but one underlying equity asset class funds lagged their respective benchmarks; yet three of seven Underlying Funds outperformed their peers within their asset classes as measured by their respective Lipper® Averages.
How did the investment strategies and techniques employed by the Fund and its money managers of the Underlying Funds affect the Fund’s performance?
The U.S. equity Underlying Funds maintained an overall preference for companies with above-average growth rates and attractive valuations. This positioning was not rewarded in 2008 where investors were driven by fear, looking for relative safety and selling stocks regardless of fundamentals. U.S. large cap managers in the Underlying Fund using quantitative investment strategies added to returns by shorting several of the financial stocks that underperformed in the fiscal period. Yet, this was offset by managers employing growth and momentum strategies, which underperformed in this environment.
Managers in the small cap U.S. equity Underlying Fund negatively impacted the Fund by underweighting the financials sector and overweighting the other energy sector. Small cap financials rebounded from their lows as the Federal Reserve and Treasury offered wide ranging forms of financial support. The prices of other energy stocks fell as the price of oil fell.
Managers in the non-U.S. developed markets Underlying Fund performed better than managers in global equity and emerging markets Underlying Funds. Yet the Fund’s higher allocation to the Non-U.S. developed markets Underlying Fund resulted in a larger negative impact on the Fund’s benchmark relative performance. This Underlying Fund’s multi-style discipline provided some risk control during the fiscal period given the extreme variability in investment style and market leadership. More defensive strategies helped moderate the negative impact of strategies more focused on deteriorating economic conditions.
In emerging markets, the returns of the emerging markets Underlying Fund declined along with the returns of the asset class, which experienced its biggest calendar year decline in the history of the asset class. The asset class endured massive asset deleveraging and extreme levels of market volatility. Commodity-related sectors suffered most as the global economic slowdown cut demand.
The real estate Underlying Fund focused primarily on the larger and more liquid REITs during the fiscal year. With the exceptional volatility experienced during the period due to the global economic crisis and cash outflows, this positioning hurt Fund performance. The Underlying Fund’s exposure to non-U.S. REITs added to the Fund excess weighted performance relative to the benchmark for the year.
The Funds’ performance shown throughout this report was based on the Underlying Funds’ valuations calculated in accordance with Generally Accepted Accounting Principles (GAAP) and in accordance with a newly effective accounting statement (SFAS 157), reflects the December 31, 2008 market value of the pooled investment vehicle in which the Underlying Funds invested their cash collateral received in securities lending transactions. The market value was lower than the
| | |
| Equity Growth Strategy Fund | | 29 |
Russell Investment Funds
Equity Growth Strategy Fund
Portfolio Management Discussion and Analysis — December 31, 2008 (Unaudited)
vehicle’s amortized cost per unit. This had a negative impact on the Fund’s benchmark relative performance.
Describe any changes to the Fund’s structure or allocation to the Underlying Funds.
In September, 2008, certain of the Underlying Funds in which the Fund invested (the “Former Underlying Funds”) changed as set forth below as the result of the reorganization (the “Reorganizations”) of the Former Underlying Funds into other Russell Investment Company Funds (the “New Underlying Funds”).
| | |
| |
| Former Underlying Fund | | New Underlying Fund |
Quantitative Equity Fund | | Russell U.S. Quantitative Equity Fund |
The New Underlying Fund has the same investment objective, principal investment strategies, investment policies and principal risks as the Former Underlying Fund which it replaced and the allocation of the Fund’s assets to the New Underlying Fund is the same as it was to the Former Underlying Fund.
The views expressed in this report reflect those of the portfolio managers only through the end of the period covered by the report. These views do not necessarily represent the views of RIMCo, or any other person in RIMCo or any other affiliated organization. These views are subject to change at any time based upon market conditions or other events, and RIMCo disclaims any responsibility to update the views contained herein. These views should not be relied on as investment advice and, because investment decisions for a Russell Investment Fund (RIF) or Russell Investment Company (RIC) Fund are based on numerous factors, should not be relied on as an indication of investment decisions of any RIF or RIC Fund.
| | |
| 30 | | Equity Growth Strategy Fund |
Russell Investment Funds
Equity Growth Strategy Fund
Shareholder Expense Example — December 31, 2008 (Unaudited)
Fund Expenses
The following disclosure provides important information regarding each Fund’s Expense Example, which appears on each Fund’s individual page in this Annual Report. Please refer to this information when reviewing the Expense Example for a Fund.
Example
As a shareholder of the Fund, you incur two types of costs: (1) transaction costs, and (2) ongoing costs, including management fees and other Fund expenses. The Example is intended to help you understand your ongoing costs (in dollars) of investing in the Fund and to compare these costs with the ongoing costs of investing in other mutual funds. The Example is based on an investment of $1,000 invested at the beginning of the period and held for the entire period indicated, which for this Fund is from July 1, 2008 to December 31, 2008.
Actual Expenses
The information in the table under the heading “Actual Performance” provides information about actual account values and actual expenses. You may use the information in this column, together with the amount you invested, to estimate the expenses that you paid over the period. Simply divide your account value by $1,000 (for example, an $8,600 account value divided by $1,000 = 8.6), then multiply the result by the number in the first column in the row entitled “Expenses Paid During Period” to estimate the expenses you paid on your account during this period.
Hypothetical Example for Comparison Purposes
The information in the table under the heading “Hypothetical Performance (5% return before expenses)” provides information
about hypothetical account values and hypothetical expenses based on the Fund’s actual expense ratio and an assumed rate of return of 5% per year before expenses, which is not the Fund’s actual return. The hypothetical account values and expenses may not be used to estimate the actual ending account balance or expenses you paid for the period. You may use this information to compare the ongoing costs of investing in the Fund and other funds. To do so, compare this 5% hypothetical example with the 5% hypothetical examples that appear in the shareholder reports of other funds.
Please note that the expenses shown in the table are meant to highlight your ongoing costs only and do not reflect any transactional costs. Therefore, the information under the heading “Hypothetical Performance (5% return before expenses)” is useful in comparing ongoing costs only, and will not help you determine the relative total costs of owning different funds. In addition, if these transactional costs were included, your costs would have been higher. The fee and expenses shown in this section do not reflect any Insurance Company Separate Account or Policy Charges.
| | | | | |
| | | Actual Performance | | Hypothetical
Performance
(5% return
before expenses) |
Beginning Account Value | | | | | |
July 1, 2008 | | $ 1,000.00 | | $ | 1,000.00 |
Ending Account Value | | | | | |
December 31, 2008 | | $ 657.02 | | $ | 1,024.94 |
Expenses Paid During | | | | | |
Period* | | $ 0.17 | | $ | 0.20 |
| * | Expenses are equal to the Fund’s annualized expense ratio of 0.04% (representing the one-half year period annualized), multiplied by the average account value over the period, multiplied by 184/366 (to reflect the one-half year period). Reflects amounts waived and/or reimbursed. Without the waiver and/or reimbursement, expenses would have been higher. |
| | |
| Equity Growth Strategy Fund | | 31 |
Russell Investment Funds
Equity Growth Strategy Fund
Schedule of Investments — December 31, 2008
Amounts in thousands (except share amounts)
| | | | | |
| | | Shares | | Market
Value
$ | |
| | | | | |
| Investments - 100.1% | | | | | |
Other Russell Investment Funds
(“RIF”) and Russell Investment
Company (“RIC”) Series Mutual
Funds | | | |
| | |
| Domestic Equities - 65.3% | | | | | |
RIF Aggressive Equity Fund | | 122,594 | | 881 | |
RIF Multi-Style Equity Fund | | 363,495 | | 3,272 | |
RIF Real Estate Securities Fund | | 97,129 | | 903 | |
RIC Russell U.S. Quantitative Equity Fund | | 149,420 | | 3,175 | |
| | | | | |
| | | | 8,231 | |
| | | | | |
| | |
| International Equities - 34.8% | | | | | |
RIF Non-U.S. Fund | | 385,493 | | 2,885 | |
RIC Russell Emerging Markets Fund | | 63,499 | | 625 | |
RIC Russell Global Equity Fund | | 153,703 | | 882 | |
| | | | | |
| | | | 4,392 | |
| | | | | |
| | |
Total Investments - 100.1%
(identified cost $20,009) | | | | 12,623 | |
| | |
Other Assets and Liabilities,
Net - (0.1%) | | | | (10 | ) |
| | | | | |
| | |
| Net Assets - 100.0% | | | | 12,613 | |
| | | | | |
See accompanying notes which are an integral part of the financial statements.
| | |
| 32 | | Equity Growth Strategy Fund |
Russell Investment Funds
LifePoints® Funds Variable Target Portfolio Series
Statements of Assets and Liabilities — December 31, 2008
| | | | | | | | | | | | | | | | |
| Amounts in thousands | | Moderate Strategy
Fund | | | Balanced Strategy
Fund | | | Growth Strategy
Fund | | | Equity Growth
Strategy Fund | |
| | | | | | | | | | | | | | | | |
Assets | | | | | | | | | | | | | | | | |
Investments, at identified cost | | $ | 23,496 | | | $ | 81,252 | | | $ | 52,231 | | | $ | 20,009 | |
Investments, at market | | | 19,319 | | | | 60,174 | | | | 34,753 | | | | 12,623 | |
Receivables: | | | | | | | | | | | | | | | | |
Investments sold | | | 65 | | | | — | | | | — | | | | — | |
Fund shares sold | | | 6 | | | | 42 | | | | 8 | | | | 6 | |
From Transfer Agent | | | — | | | | — | | | | 2 | | | | 1 | |
Prepaid expenses | | | — | | | | 1 | | | | — | | | | — | |
| | | | | | | | | | | | | | | | |
Total assets | | | 19,390 | | | | 60,217 | | | | 34,763 | | | | 12,630 | |
| | | | | | | | | | | | | | | | |
| | | | | | | | | | | | | | | | |
Liabilities | | | | | | | | | | | | | | | | |
Payables: | | | | | | | | | | | | | | | | |
Investments purchased | | | — | | | | 42 | | | | 9 | | | | 5 | |
Fund shares redeemed | | | 71 | | | | — | | | | — | | | | — | |
Accrued fees to affiliates | | | 1 | | | | 5 | | | | 2 | | | | 1 | |
Other accrued expenses | | | 10 | | | | 12 | | | | 10 | | | | 11 | |
| | | | | | | | | | | | | | | | |
Total liabilities | | | 82 | | | | 59 | | | | 21 | | | | 17 | |
| | | | | | | | | | | | | | | | |
| | | | | | | | | | | | | | | | |
Net Assets | | $ | 19,308 | | | $ | 60,158 | | | $ | 34,742 | | | $ | 12,613 | |
| | | | | | | | | | | | | | | | |
| Net Assets Consist of: | | | | | | | | | | | | | | | | |
Undistributed (overdistributed) net investment income | | $ | 172 | | | $ | 80 | | | $ | 8 | | | $ | 32 | |
Accumulated net realized gain (loss) | | | (901 | ) | | | (1,155 | ) | | | (481 | ) | | | (1,063 | ) |
Unrealized appreciation (depreciation) on investments | | | (4,177 | ) | | | (21,078 | ) | | | (17,478 | ) | | | (7,386 | ) |
Shares of beneficial interest | | | 25 | | | | 88 | | | | 57 | | | | 23 | |
Additional paid-in capital | | | 24,189 | | | | 82,223 | | | | 52,636 | | | | 21,007 | |
| | | | | | | | | | | | | | | | |
Net Assets | | $ | 19,308 | | | $ | 60,158 | | | $ | 34,742 | | | $ | 12,613 | |
| | | | | | | | | | | | | | | | |
Net Asset Value, offering and redemption price per share: | | | | | | | | | | | | | | | | |
Net asset value per share* | | $ | 7.67 | | | $ | 6.80 | | | $ | 6.11 | | | $ | 5.42 | |
Net assets | | $ | 19,308,456 | | | $ | 60,158,172 | | | $ | 34,742,243 | | | $ | 12,612,657 | |
Shares outstanding ($.01 par value) | | | 2,515,767 | | | | 8,846,816 | | | | 5,685,013 | | | | 2,328,684 | |
* Net asset value per share equals net assets divided by shares of beneficial interest outstanding. | | | | | | | | | |
See accompanying notes which are an integral part of the financial statements.
| | |
| Statements of Assets and Liabilities | | 33 |
Russell Investment Funds
LifePoints® Funds Variable Target Portfolio Series
Statements of Operations — For the Fiscal Year Ended December 31, 2008
| | | | | | | | | | | | | | | | |
| Amounts in thousands | | Moderate Strategy
Fund | | | Balanced Strategy
Fund | | | Growth Strategy
Fund | | | Equity Growth
Strategy Fund | |
| | | | | | | | | | | | | | | | |
Investment Income | | | | | | | | | | | | | | | | |
Income distributions from Underlying Funds | | $ | 674 | | | $ | 1,568 | | | $ | 669 | | | $ | 128 | |
| | | | | | | | | | | | | | | | |
| | | | | | | | | | | | | | | | |
Expenses | | | | | | | | | | | | | | | | |
Advisory fees | | | 35 | | | | 111 | | | | 71 | | | | 28 | |
Administrative fees | | | 9 | | | | 28 | | | | 18 | | | | 7 | |
Custodian fees | | | 15 | | | | 19 | | | | 17 | | | | 14 | |
Transfer agent fees | | | 1 | | | | 2 | | | | 2 | | | | 1 | |
Professional fees | | | 21 | | | | 23 | | | | 22 | | | | 21 | |
Trustees’ fees | | | — | | | | 1 | | | | 1 | | | | — | |
Offering fees | | | 5 | | | | 5 | | | | 5 | | | | 5 | |
Miscellaneous | | | 5 | | | | 5 | | | | 4 | | | | 6 | |
| | | | | | | | | | | | | | | | |
Expenses before reductions | | | 91 | | | | 194 | | | | 140 | | | | 82 | |
Expense reductions | | | (72 | ) | | | (150 | ) | | | (126 | ) | | | (76 | ) |
| | | | | | | | | | | | | | | | |
Net expenses | | | 19 | | | | 44 | | | | 14 | | | | 6 | |
| | | | | | | | | | | | | | | | |
Net investment income (loss) | | | 655 | | | | 1,524 | | | | 655 | | | | 122 | |
| | | | | | | | | | | | | | | | |
| | | | | | | | | | | | | | | | |
Net Realized and Unrealized Gain (Loss) | | | | | | | | | | | | | | | | |
Net realized gain (loss) on: | | | | | | | | | | | | | | | | |
Investments | | | (990 | ) | | | (1,448 | ) | | | (675 | ) | | | (1,102 | ) |
Capital gain distributions from Underlying Funds | | | 121 | | | | 330 | | | | 214 | | | | 87 | |
| | | | | | | | | | | | | | | | |
Net realized gain (loss) | | | (869 | ) | | | (1,118 | ) | | | (461 | ) | | | (1,015 | ) |
Net change in unrealized appreciation (depreciation) on investments | | | (4,012 | ) | | | (19,597 | ) | | | (15,965 | ) | | | (6,201 | ) |
| | | | | | | | | | | | | | | | |
Net realized and unrealized gain (loss) | | | (4,881 | ) | | | (20,715 | ) | | | (16,426 | ) | | | (7,216 | ) |
| | | | | | | | | | | | | | | | |
Net Increase (Decrease) in Net Assets from Operations | | $ | (4,226 | ) | | $ | (19,191 | ) | | $ | (15,771 | ) | | $ | (7,094 | ) |
| | | | | | | | | | | | | | | | |
| | | | |
| | | | | | | | | | | | | | | | | |
See accompanying notes which are an integral part of the financial statements.
| | |
| 34 | | Statements of Operations |
(This page intentionally left blank)
Russell Investment Funds
LifePoints® Funds Variable Target Portfolio Series
Statements of Changes in Net Assets — For the Fiscal Years Ended December 31,
| | | | | | | | |
| | | Moderate Strategy
Fund | |
| Amounts in thousands | | 2008 | | | 2007* | |
| | | | | | | | |
Increase (Decrease) in Net Assets | | | | | | | | |
| | |
Operations | | | | | | | | |
Net investment income (loss) | | $ | 655 | | | $ | 194 | |
Net realized gain (loss) | | | (869 | ) | | | 142 | |
Net change in unrealized appreciation (depreciation) | | | (4,012 | ) | | | (165 | ) |
| | | | | | | | |
Net increase (decrease) in net assets from operations | | | (4,226 | ) | | | 171 | |
| | | | | | | | |
| | |
Distributions | | | | | | | | |
From net investment income | | | (482 | ) | | | (207 | ) |
From net realized gain | | | (160 | ) | | | (2 | ) |
| | | | | | | | |
Net decrease in net assets from distributions | | | (642 | ) | | | (209 | ) |
| | | | | | | | |
| | |
Share Transactions | | | | | | | | |
Net increase (decrease) in net assets from share transactions | | | 15,522 | | | | 8,692 | |
| | | | | | | | |
| | |
Total Net Increase (Decrease) in Net Assets | | | 10,654 | | | | 8,654 | |
| | |
Net Assets | | | | | | | | |
Beginning of period | | | 8,654 | | | | — | |
| | | | | | | | |
End of period | | $ | 19,308 | | | $ | 8,654 | |
| | | | | | | | |
Undistributed (overdistributed) net investment income included in net assets | | $ | 172 | | | $ | — | |
| * | For the period April 30, 2007 (commencement of operations) to December 31, 2007. |
See accompanying notes which are an integral part of the financial statements.
| | |
| 36 | | Statements of Changes in Net Assets |
| | | | | | | | | | | | | | | | | | | | | | |
Balanced Strategy
Fund | | | Growth Strategy
Fund | | | Equity Growth Strategy
Fund | |
| 2008 | | | 2007* | | | 2008 | | | 2007* | | | 2008 | | | 2007* | |
| | | | | | | | | | | | | | | | | | | | | | |
| | | | | | | | | | | | | | | | | | | | | | |
| | | | | |
| | | | | | | | | | | | | | | | | | | | | | |
| $ | 1,524 | | | $ | 889 | | | $ | 655 | | | $ | 638 | | | $ | 122 | | | $ | 347 | |
| | (1,118 | ) | | | 1,114 | | | | (461 | ) | | | 1,101 | | | | (1,015 | ) | | | 709 | |
| | (19,597 | ) | | | (1,481 | ) | | | (15,965 | ) | | | (1,513 | ) | | | (6,201 | ) | | | (1,185 | ) |
| | | | | | | | | | | | | | | | | | | | | | | |
| | (19,191 | ) | | | 522 | | | | (15,771 | ) | | | 226 | | | | (7,094 | ) | | | (129 | ) |
| | | | | | | | | | | | | | | | | | | | | | | |
| | | | | |
| | | | | | | | | | | | | | | | | | | | | | |
| | (1,462 | ) | | | (901 | ) | | | (647 | ) | | | (651 | ) | | | (89 | ) | | | (358 | ) |
| | (1,120 | ) | | | (2 | ) | | | (1,109 | ) | | | — | | | | (748 | ) | | | — | |
| | | | | | | | | | | | | | | | | | | | | | | |
| | (2,582 | ) | | | (903 | ) | | | (1,756 | ) | | | (651 | ) | | | (837 | ) | | | (358 | ) |
| | | | | | | | | | | | | | | | | | | | | | | |
| | | | | |
| | | | | | | | | | | | | | | | | | | | | | |
| | 46,234 | | | | 36,078 | | | | 24,879 | | | | 27,815 | | | | 7,538 | | | | 13,493 | |
| | | | | | | | | | | | | | | | | | | | | | | |
| | | | | |
| | 24,461 | | | | 35,697 | | | | 7,352 | | | | 27,390 | | | | (393 | ) | | | 13,006 | |
| | | | | |
| | | | | | | | | | | | | | | | | | | | | | |
| | 35,697 | | | | — | | | | 27,390 | | | | — | | | | 13,006 | | | | — | |
| | | | | | | | | | | | | | | | | | | | | | | |
| $ | 60,158 | | | $ | 35,697 | | | $ | 34,742 | | | $ | 27,390 | | | $ | 12,613 | | | $ | 13,006 | |
| | | | | | | | | | | | | | | | | | | | | | | |
| $ | 80 | | | $ | — | | | $ | 8 | | | $ | — | | | $ | 32 | | | $ | — | |
See accompanying notes which are an integral part of the financial statements.
| | |
| Statements of Changes in Net Assets | | 37 |
Russell Investment Funds
LifePoints® Funds Variable Target Portfolio Series
Financial Highlights
For a Share Outstanding Throughout the Period.
| | | | | | | | | | | | | | | | |
| | |
$
Net Asset Value,
Beginning of
Period | | $
Net
Investment
Income (Loss)(a)(b) | | $
Net Realized
and Unrealized
Gain (Loss) | | | $
Total Income
(Loss) from
Operations | | | $
Distributions
from Net
Investment Income | | | $
Distributions
from Net
Realized Gain | |
Moderate Strategy Fund | | | | | | | | | | | | | | | | |
December 31, 2008 | | 9.99 | | .33 | | (2.32 | ) | | (1.99 | ) | | (.23 | ) | | (.10 | ) |
December 31, 2007* | | 10.00 | | .46 | | (.11 | ) | | .35 | | | (.36 | ) | | — | (g) |
Balanced Strategy Fund | | | | | | | | | | | | | | | | |
December 31, 2008 | | 9.93 | | .23 | | (2.88 | ) | | (2.65 | ) | | (.21 | ) | | (.27 | ) |
December 31, 2007* | | 10.00 | | .47 | | (.20 | ) | | .27 | | | (.34 | ) | | — | (g) |
Growth Strategy Fund | | | | | | | | | | | | | | | | |
December 31, 2008 | | 9.90 | | .15 | | (3.46 | ) | | (3.31 | ) | | (.14 | ) | | (.34 | ) |
December 31, 2007* | | 10.00 | | .45 | | (.24 | ) | | .21 | | | (.31 | ) | | — | |
Equity Growth Strategy Fund | | | | | | | | | | | | | | | | |
December 31, 2008 | | 9.83 | | .07 | | (3.92 | ) | | (3.85 | ) | | (.05 | ) | | (.51 | ) |
December 31, 2007* | | 10.00 | | .50 | | (.38 | ) | | .12 | | | (.29 | ) | | — | |
See accompanying notes which are an integral part of the financial statements.
| | | | | | | | | | | | | | | | |
$
Total
Distributions | | | $
Net Asset Value,
End of
Period | | %
Total
Return(c) | | | $
Net Assets,
End of Period
(000) | | %
Ratio of Expenses
to Average
Net Assets,
Net(d)(e)(f) | | %
Ratio of Expenses
to Average
Net Assets,
Gross(d)(e) | | %
Ratio of Net
Investment Income
to Average
Net Assets(c)(f) | | %
Portfolio
Turnover Rate(c) |
| | | | | | | | | | | | | | | | |
| (.33 | ) | | 7.67 | | (20.39 | ) | | 19,308 | | .11 | | .53 | | 3.77 | | 39 |
| (.36 | ) | | 9.99 | | 3.54 | | | 8,654 | | .11 | | 2.01 | | 5.37 | | 24 |
| | | | | | | | | | | | | | | | |
| (.48 | ) | | 6.80 | | (27.70 | ) | | 60,158 | | .08 | | .35 | | 2.75 | | 16 |
| (.34 | ) | | 9.93 | | 2.73 | | | 35,697 | | .08 | | .74 | | 5.37 | | 11 |
| | | | | | | | | | | | | | | | |
| (.48 | ) | | 6.11 | | (34.73 | ) | | 34,742 | | .04 | | .40 | | 1.85 | | 10 |
| (.31 | ) | | 9.90 | | 2.13 | | | 27,390 | | .04 | | .84 | | 5.05 | | 3 |
| | | | | | | | | | | | | | | | |
| (.56 | ) | | 5.42 | | (41.18 | ) | | 12,613 | | .04 | | .58 | | 0.87 | | 24 |
| (.29 | ) | | 9.83 | | 1.25 | | | 13,006 | | .04 | | 1.36 | | 5.59 | | 6 |
See accompanying notes which are an integral part of the financial statements.
Russell Investment Funds
LifePoints® Funds Variable Target Portfolio Series
Notes to Financial Highlights — December 31, 2008
| * | For the period April 30, 2007 (commencement of operations) to December 31, 2007. |
| (a) | Average month-end shares outstanding were used for this calculation. |
| (b) | Recognition of net investment income by the Fund is affected by the timing of the declaration of dividends by the Underlying Funds in which the Fund invests. |
| (c) | Periods less than one year are not annualized. |
| (d) | The ratios for periods less than one year are annualized. |
| (e) | The calculation includes only those expenses charged directly to the Fund and does not include expenses charged to the Underlying Funds in which the Fund invests. |
| (f) | May reflect amounts waived and reimbursed by RIMCo and RFSC. |
| (g) | Less than $.01 per share. |
See accompanying notes which are an integral part of the financial statements.
| | |
| 40 | | Notes to Financial Highlights |
Russell Investment Funds
LifePoints® Funds Variable Target Portfolio Series
Notes to Financial Statements — December 31, 2008
Russell Investment Funds (the “Investment Company” or “RIF”) is a series investment company with nine different investment portfolios referred to as Funds. These financial statements report on four of these Funds (each a “Fund” and collectively the “Funds”). The Investment Company provides the investment base for one or more variable insurance products issued by one or more insurance companies. These Funds are offered at net asset value to qualified insurance company separate accounts offering variable insurance products. The Investment Company is registered under the Investment Company Act of 1940, as amended, as an open-end management investment company. It is organized and operates as a Massachusetts business trust under an amended and restated master trust agreement dated October 1, 2008. The Investment Company’s master trust agreement permits the Board of Trustees (the “Board”) to issue an unlimited number of shares of beneficial interest.
Russell Investment Management Company (“RIMCo”) is the Funds’ adviser and Russell Fund Services Company (“RFSC”), a wholly-owned subsidiary of RIMCo, is the Funds’ administrator and transfer agent.
The Funds seek to achieve their objective by investing in a combination of Russell Investment Company (“RIC”) funds and other of the Investment Company’s funds (the “Underlying Funds”) as set forth in the table below. RIMCo may modify the target asset allocation for any Fund and/or the Underlying Funds in which the Funds invest. From time to time, each Fund may adjust its investments within the ranges below based on RIMCo’s outlook for the economy, financial markets generally and relative market valuation of the asset classes represented by each Underlying Fund. Additionally, each Fund may deviate from the ranges when, in RIMCo’s opinion, it is necessary to do so to pursue the Fund’s investment objective. In the future, the Funds may also invest in other funds which are not currently Underlying Funds.
| | | | | | | | | | | | |
| | | Asset Allocation Targets as of April 30, 2008 | |
| Asset Class/Underlying Funds | | Moderate
Strategy Fund | | | Balanced
Strategy Fund | | | Growth
Strategy Fund | | | Equity Growth
Strategy Fund | |
| | | | | | | | | | | | |
Bonds | | | | | | | | | | | | |
RIF Core Bond Fund | | 55-65 | % | | 35-45 | % | | 15-25 | % | | 0 | % |
Domestic Equities | | | | | | | | | | | | |
RIF Aggressive Equity Fund | | 0-8 | | | 0-9 | | | 1-11 | | | 2-12 | |
RIF Multi-Style Equity Fund | | 5-15 | | | 10-20 | | | 16-26 | | | 21-31 | |
RIF Real Estate Securities Fund | | 0-8 | | | 0-10 | | | 1-11 | | | 2-12 | |
RIC Russell U.S. Quantitative Equity Fund | | 5-15 | | | 10-20 | | | 15-25 | | | 20-30 | |
International Equities | | | | | | | | | | | | |
RIF Non-U.S. Fund | | 14-24 | | | 9-19 | | | 12-22 | | | 18-28 | |
RIC Russell Emerging Markets Fund | | 0-7 | | | 0-8 | | | 0-9 | | | 0-10 | |
RIC Russell Global Equity Fund | | 0-8 | | | 0-9 | | | 1-11 | | | 2-12 | |
| 2. | | Significant Accounting Policies |
The Funds’ financial statements are prepared in accordance with accounting principles generally accepted in the United States of America (“GAAP”) which require the use of management estimates and assumptions at the date of the financial statements. Actual results could differ from those estimates. The following is a summary of the significant accounting policies consistently followed by each Fund in the preparation of its financial statements.
Security Valuation
The Funds value their portfolio securities, the shares of the Underlying Funds, at the current net asset value per share of each Underlying Fund.
The Underlying Funds value portfolio securities according to Board-approved securities valuation procedures and pricing services which include market value procedures, fair value procedures and a description of the pricing services used by the Underlying Funds. Money market fund securities are priced using the amortized cost method of valuation, as are debt obligation securities maturing within 60 days at the time of purchase, unless the Board determines that amortized cost does not represent market value of short-term debt obligations. The Board has delegated the responsibility for administration of the securities valuation procedures to RFSC.
Ordinarily, the Underlying Funds value each portfolio security based on market quotations provided by pricing services or alternative pricing services or dealers (when permitted by the market value procedures). Generally, Underlying Fund securities are valued at the close of the market on which they are traded as follows:
| | • | | U.S. listed equities, equity and fixed income options and Rights/Warrants: Last sale price; last bid price if no last sale price. |
| | |
| Notes to Financial Statements | | 41 |
Russell Investment Funds
LifePoints® Funds Variable Target Portfolio Series
Notes to Financial Statements, continued — December 31, 2008
| | • | | U.S. over-the-counter equities: Official closing price; last bid price if no closing price. |
| | • | | Listed ADRs/GDRs: Last sale price; last bid price if no last sale price. |
| | • | | Municipal bonds, U.S. bonds, Eurobonds/foreign bonds: Evaluated bid price; broker quote if no evaluated bid price;. |
| | • | | Futures: Settlement price; |
| | • | | Bank loans and Forwards: mean between bid and asking price. |
| | • | | Investments in other mutual funds are valued at their net asset value per share, calculated at 4 p.m. Eastern time or as of the close of the New York Stock Exchange, whichever is earlier; |
| | • | | The value of swap agreements is equal to the Funds’ obligation (or rights) under swap contracts which will generally be equal to the net amounts to be paid or received under the contracts based upon the relative values of the positions held by each party to the contracts. |
| | • | | Equity securities traded on a national foreign securities exchange or a foreign over the counter market are valued on the basis of the official closing price, or lacking the official closing price, at the last sale price of the primary exchange on which the security is traded. |
If market quotations are not readily available for a security or if subsequent events suggest that a market quotation is not reliable, the Underlying Funds will use the security’s fair value, as determined in accordance with the fair value procedures. The effect of fair value pricing is that securities may not be priced on the basis of quotations from the primary market on which they are traded, but rather may be priced by another method that the Board believes reflects fair value. The fair value procedures may involve subjective judgments as to the fair value of securities. The use of fair value pricing by an Underlying Fund may cause the net asset value of its shares to differ significantly from the net asset value that would be calculated using normal pricing methods. Fair value pricing could also cause discrepancies between the daily movement of the value of Underlying Fund shares and daily movement of the benchmark index if the index is valued using another pricing method.
This policy is intended to assure that the Underlying Funds’ net asset values fairly reflect security values as of the time of pricing. Events or circumstances affecting the values of Underlying Fund securities that occur between the closing of the principal markets on which they trade and the time the net asset value of Underlying Fund shares is determined may be reflected in the calculation of net asset values for each applicable Underlying Fund (and each Fund which invests in such Underlying Fund) when the Underlying Funds deem that the particular event or circumstance would materially affect such Underlying Fund’s net asset value. Underlying Funds that invest primarily in frequently traded exchange-listed securities will use fair value pricing in limited circumstances since reliable market quotations will often be readily available. Underlying Funds that invest in foreign securities are likely to use fair value pricing more often since significant events may occur between the close of foreign markets and the time of pricing which would trigger fair value pricing of the foreign securities. Underlying Funds that invest in low-rated debt securities are also likely to use fair value pricing more often since the markets in which such securities are traded are generally thinner, more limited and less active than those for higher rated securities. Examples of events that could trigger fair value pricing of one or more securities are: a material market movement of the US securities market (defined in the fair value procedures as the movement by a single major US Index greater than a certain percentage) or other significant event; foreign market holidays if on a daily basis, Fund exposure exceeds 20% in aggregate (all closed markets combined); a company development; a natural disaster; or an armed conflict.
Because foreign securities can trade on non-business days, the net asset value of a Fund’s portfolio that includes an Underlying Fund which invests in foreign securities may change on days when shareholders will not be able to purchase or redeem fund shares.
The Funds adopted Financial Accounting Standards Board (“FASB”) Statement of Financial Accounting Standards No. 157, Fair Value Measurements (“SFAS 157”), effective January 1, 2008. In accordance with SFAS 157, fair value is defined as the price that the Funds would receive upon selling an investment in a timely transaction to an independent buyer in the principal or most advantageous market of the investment. SFAS 157 established a three-tier hierarchy to maximize the use of observable market data and minimize the use of unobservable inputs and to establish classification of fair value measurements for disclosure purposes. Inputs refer broadly to the assumptions that market participants would use in pricing the asset, including assumptions about risk, for example, the risk inherent in a particular valuation technique used to measure fair value including a pricing model and/or risk inherent in the inputs to the valuation technique. Inputs may be observable or unobservable. Observable inputs are inputs that reflect the assumptions market participants would use in pricing the asset or liability developed based on market data obtained from sources independent of the reporting entity. Unobservable inputs are inputs that reflect the reporting entity’s own assumptions about the assumptions market participants would use in pricing the asset or liability developed based on the best information available in the circumstances.
| | |
| 42 | | Notes to Financial Statements |
Russell Investment Funds
LifePoints® Funds Variable Target Portfolio Series
Notes to Financial Statements, continued — December 31, 2008
The three-tier hierarchy of inputs is summarized in the three broad levels listed below.
| | • | Level 1 — quoted prices in active markets for identical investments |
| | • | Level 2 — other significant observable inputs (including quoted prices for similar investments, interest rates, prepayment speeds, credit risk, etc.) |
| | • | Level 3 — significant unobservable inputs (including the Fund’s own assumptions in determining the fair value of investments) |
Inputs used in valuing the Funds’ investments for the period ended December 31, 2008, were as follows:
| | | | | | | | | | | | |
| | | Moderate
Strategy Fund | | Balanced
Strategy Fund | | Growth
Strategy Fund | | Equity Growth
Strategy Fund |
| | | Investments in
Securities | | Investments in
Securities | | Investments in
Securities | | Investments in
Securities |
| | | | | | | | | | | | |
Level 1 | | $ | — | | $ | — | | $ | — | | $ | — |
Level 2 | | | 19,319,025 | | | 60,174,298 | | | 34,752,751 | | | 12,623,205 |
Level 3 | | | — | | | — | | | — | | | — |
| | | | | | | | | | | | |
| | $ | 19,319,025 | | $ | 60,174,298 | | $ | 34,752,751 | | $ | 12,623,205 |
| | | | | | | | | | | | |
As of December 31, 2008, there were no Level 3 securities held by the Funds.
Investment Transactions
Investment transactions are recorded on a trade date basis. Realized gains and losses from securities transactions, if any, are recorded on the basis of specific identified cost.
Investment Income
Distributions of income and capital gains from the Underlying Funds are recorded on the ex-dividend date.
Federal Income Taxes
Since the Investment Company is a Massachusetts business trust, each Fund is a separate corporate taxpayer and determines its net investment income and capital gains (or losses) and the amounts to be distributed to each Fund’s shareholders without regard to the income and capital gains (or losses) of the other Funds.
It is each Fund’s intention to qualify as a regulated investment company and distribute all of its taxable income and capital gains. Therefore, no federal income tax provision is required for the Funds.
In accordance with provisions set forth in the FASB issued Interpretation No. 48, “Accounting for Uncertainty in Income Taxes, an Interpretation of FASB Statement No. 109” (“FIN 48”), adopted by the Funds on January 1, 2007, management has reviewed the Funds’ tax positions for all open tax years, and concluded that adoption had no effect on the Funds’ financial position or results of operations. At December 31, 2008, the Funds have recorded no liabilities for net unrecognized tax benefits relating to uncertain income tax positions they have taken or expect to take in future tax returns.
Each Fund files a U. S. tax return. While the statute of limitations remains open to examine the Funds’ U.S. tax returns filed for the fiscal years ending December 31, 2005, through December 31, 2007, no examinations are in progress or anticipated at this time. The Funds are not aware of any tax positions for which it is reasonably possible that the total amounts of unrecognized tax benefits will significantly change in the next twelve months.
Dividends and Distributions to Shareholders
Income dividends and capital gain distributions, if any, are recorded on the ex-dividend date. Income dividends are generally declared and paid quarterly. Capital gain distributions are generally declared and paid annually. An additional distribution may be paid by the Funds to avoid imposition of federal income and excise tax on any remaining undistributed capital gains and net investment income.
The timing and characterization of certain income and capital gain distributions are determined in accordance with federal tax regulations which may differ from GAAP. As a result, net investment income and net realized gain (or loss) from investment transactions for a reporting period may differ significantly from distributions during such period. The differences between tax regulations and GAAP relate primarily to investments in the Underlying Funds sold at a loss, wash sale deferrals and capital loss
| | |
| Notes to Financial Statements | | 43 |
Russell Investment Funds
LifePoints® Funds Variable Target Portfolio Series
Notes to Financial Statements, continued — December 31, 2008
carryforwards. Accordingly, the Funds may periodically make reclassifications among certain of their capital accounts without impacting their net asset value.
Expenses
Expenses included in the accompanying financial statements reflect the expenses of each Fund and do not include those expenses incurred by the Underlying Funds. Because the Underlying Funds have varied expense and fee levels and the Funds may own different proportions of the Underlying Funds at different times, the amount of the fees and expenses incurred indirectly by the Funds will vary. Most expenses can be directly attributed to the individual Funds. Expenses which cannot be directly attributed to a specific Fund are allocated among all Funds principally based on their relative net assets.
Guarantees
In the normal course of business the Funds enter into contracts that contain a variety of representations which provide general indemnifications. The Funds’ maximum exposure under these arrangements is unknown as this would involve future claims that may be made against the Funds that have not yet occurred. However, the Funds expect the risk of loss to be remote.
| 3. | | Investment Transactions |
Securities
During the period ended December 31, 2008, purchases and sales of the Underlying Funds (excluding short-term investments) were as follows:
| | | | | | |
| Funds | | Purchases | | Sales |
| | | | | | |
Moderate Strategy | | $ | 22,507,185 | | $ | 6,839,969 |
Balanced Strategy | | | 54,479,438 | | | 8,963,036 |
Growth Strategy | | | 27,506,639 | | | 3,505,289 |
Equity Growth Strategy | | | 10,289,401 | | | 3,369,110 |
| 4. | | Related Party Transactions, Fees and Expenses |
Adviser and Administrator
RIMCo is the Funds’ investment adviser and RFSC is the Funds’ administrator. RFSC is a wholly-owned subsidiary of RIMCo. RIMCo is a wholly-owned subsidiary of Frank Russell Company (a subsidiary of The Northwestern Mutual Life Insurance Company). Frank Russell Company provides ongoing money manager research and trade placement services to RIC and RIMCo.
RIMCo has contractually agreed to waive, at least through April 29, 2009, its 0.20% advisory fee for each Fund. RIMCo and RFSC have contractually agreed to waive and/or reimburse, at least through April 29, 2009, each Fund for other direct Fund-level expenses to the extent that direct Fund-level expenses exceed 0.11%, 0.08%, 0.04% and 0.04% of the average daily net assets of the Moderate Strategy, Balanced Strategy, Growth Strategy and Equity Growth Strategy Funds, respectively, on an annual basis. Direct Fund-level expenses for the Funds do not include the expenses of other investment companies in which the Fund invests which are borne indirectly by the Fund. These arrangements may not be terminated during the relevant period except at the Board’s discretion.
The Administrative fee of 0.05% is based upon the average daily net assets of each Fund.
For the period ended December 31, 2008, the fees waived and reimbursed by RIMCo and RFSC amounted to:
| | | | | | | | | |
| Funds | | RIMCo | | RFSC | | Total |
| | | | | | | | | |
Moderate Strategy | | $ | 34,738 | | $ | 37,363 | | $ | 72,101 |
Balanced Strategy | | | 110,766 | | | 39,259 | | | 150,025 |
Growth Strategy | | | 70,744 | | | 55,262 | | | 126,006 |
Equity Growth Strategy | | | 28,041 | | | 47,590 | | | 75,631 |
RIMCo and RFSC do not have the ability to recover amounts waived or reimbursed from previous periods.
Transfer and Dividend Disbursing Agent
RFSC is the Transfer and Dividend Disbursing Agent for the Investment Company. For this service, RFSC is paid a fee for transfer agency and dividend disbursing services provided to the Funds. RFSC retains a portion of this fee for its services provided to the Funds and pays the balance to unaffiliated agents who assisted in providing these services.
| | |
| 44 | | Notes to Financial Statements |
Russell Investment Funds
LifePoints® Funds Variable Target Portfolio Series
Notes to Financial Statements, continued — December 31, 2008
Accrued Fees Payable to Affiliates
Accrued fees payable to affiliates for the period ended December 31, 2008, were as follows:
| | | | | | | | | | | | |
| | | Moderate Strategy
Fund | | Balanced
Strategy Fund | | Growth Strategy
Fund | | Equity Growth
Strategy Fund |
| | | | | | | | | | | | |
Administration Fees | | $ | 785 | | $ | 4,705 | | $ | 1,399 | | $ | 494 |
Transfer Agent Fees | | | 69 | | | 214 | | | 124 | | | 44 |
Trustee Fees | | | 20 | | | 113 | | | 134 | | | 59 |
| | | | | | | | | | | | |
| | $ | 874 | | $ | 5,032 | | $ | 1,657 | | $ | 597 |
| | | | | | | | | | | | |
Distributor
On June 2, 2008, Russell Fund Distributors, Inc., a wholly-owned subsidiary of RIMCo, changed its name to Russell Financial Services, Inc. (“Distributor”). The Distributor serves as distributor for RIF, pursuant to the Distribution Agreement with the Investment Company. The Distributor receives no compensation from the Investment Company for its services.
Board of Trustees
The Russell Fund Complex consists of RIC, which has 38 Funds, and RIF, which has nine Funds. Each of the Trustees is a Trustee of both RIC and RIF. During the period, the Russell Fund Complex paid each of its independent Trustees a retainer of $60,000 per year, $6,500 for each regular quarterly meeting attended in person, $2,500 for each special meeting attended in person, and $2,500 for each Audit Committee meeting, Nominating and Governance Committee meeting, Investment Committee meeting or any other committee meeting established and approved by the Board that is attended in person. Each Trustee receives a $1,000 fee for attending the quarterly and special meetings and a $500 fee for attending the committee meeting by phone instead of receiving the full fee had the member attended in person. Trustees’ out of pocket expenses are also paid by the Russell Fund Complex. The Audit Committee Chair and Investment Committee Chair are each paid a fee of $12,000 per year and the Nominating and Governance Committee Chair is paid a fee of $6,000 per year. The chairman of the Board receives additional annual compensation of $52,000.
Transactions With Affiliated Companies
An affiliated company is a company in which a Fund has ownership of at least 5% of the voting securities or under common control. Transactions during the period ended December 31, 2008, with Underlying Funds which are an affiliated company or under common control are as follows:
| | | | | | | | | | | | | | | | | | | |
| Affiliate | | Market
Value | | Purchases
Cost | | Sales
Cost | | Realized Gain
(Loss) | | | Income
Distributions | | Capital Gains
Distributions |
| | | | | | | | | | | | | | | | | | | |
Moderate Strategy Fund | | | | | | | | | | | | | | | | | | | |
RIF Core Bond Fund | | $ | 11,616,680 | | $ | 12,045,579 | | $ | 4,650,835 | | $ | (283,992 | ) | | $ | 605,092 | | $ | 75,808 |
RIF Aggressive Equity Fund | | | 572,565 | | | 794,728 | | | 250,889 | | | (65,586 | ) | | | 5,503 | | | 102 |
RIF Multi-Style Equity Fund | | | 1,922,578 | | | 2,597,647 | | | 724,308 | | | (127,238 | ) | | | 24,657 | | | 14,651 |
RIC Russell U.S. Quantitative Equity Fund | | | 1,941,688 | | | 449,330 | | | 162,091 | | | (61,456 | ) | | | 11,977 | | | — |
RIF Real Estate Securities Fund | | | 579,739 | | | 869,806 | | | 404,619 | | | (92,663 | ) | | | 10,253 | | | — |
RIC Russell Emerging Markets Fund | | | 382,802 | | | 605,880 | | | 171,290 | | | (47,356 | ) | | | — | | | 18,228 |
RIC Russell Global Equity Fund | | | 579,098 | | | 798,632 | | | 207,118 | | | (36,795 | ) | | | 9,201 | | | — |
RIF Non-U.S. Fund | | | 1,723,875 | | | 2,276,651 | | | 630,329 | | | (158,774 | ) | | | — | | | 12,557 |
RIC Quantitative Equity Fund (1) | | | — | | | 2,068,932 | | | 628,900 | | | (116,550 | ) | | | 7,312 | | | |
| | | | | | | | | | | | | | | | | | | |
| | $ | 19,319,025 | | $ | 22,507,185 | | $ | 7,830,379 | | $ | (990,410 | ) | | $ | 673,995 | | $ | 121,346 |
| | | | | | | | | | | | | | | | | | | |
| | | | | | | | | | | | | | | | | | | |
Balanced Strategy Fund | | | | | | | | | | | | | | | | | | | |
RIF Core Bond Fund | | $ | 23,663,254 | | $ | 17,824,158 | | $ | 6,424,844 | | $ | (480,454 | ) | | $ | 1,252,067 | | $ | 141,698 |
RIF Aggressive Equity Fund | | | 2,427,255 | | | 2,453,632 | | | 225,239 | | | (51,919 | ) | | | 22,766 | | | 333 |
RIF Multi-Style Equity Fund | | | 9,069,268 | | | 8,898,053 | | | 714,019 | | | (113,565 | ) | | | 110,869 | | | 53,562 |
RIC Russell U.S. Quantitative Equity Fund | | | 9,171,902 | | | 1,716,415 | | | 129,494 | | | (61,804 | ) | | | 54,900 | | | — |
RIF Real Estate Securities Fund | | | 3,138,362 | | | 3,447,419 | | | 1,128,447 | | | (318,787 | ) | | | 54,603 | | | — |
RIC Russell Emerging Markets Fund | | | 1,807,454 | | | 2,286,358 | | | 156,160 | | | (52,488 | ) | | | — | | | 86,370 |
RIC Russell Global Equity Fund | | | 2,425,322 | | | 2,494,605 | | | 155,153 | | | (21,707 | ) | | | 37,741 | | | — |
RIF Non-U.S. Fund | | | 8,471,481 | | | 8,563,152 | | | 731,474 | | | (197,105 | ) | | | — | | | 47,603 |
RIC Quantitative Equity Fund (1) | | | — | | | 6,795,646 | | | 745,714 | | | (149,679 | ) | | | 34,877 | | | |
| | | | | | | | | | | | | | | | | | | |
| | $ | 60,174,298 | | $ | 54,479,438 | | $ | 10,410,544 | | $ | (1,447,508 | ) | | $ | 1,567,823 | | $ | 329,566 |
| | | | | | | | | | | | | | | | | | | |
| | |
| Notes to Financial Statements | | 45 |
Russell Investment Funds
LifePoints® Funds Variable Target Portfolio Series
Notes to Financial Statements, continued — December 31, 2008
| | | | | | | | | | | | | | | | | | | |
| Affiliate | | Market
Value | | Purchases
Cost | | Sales
Cost | | Realized Gain
(Loss) | | | Income
Distributions | | Capital Gains
Distributions |
| | | | | | | | | | | | | | | | | | | |
Growth Strategy Fund | | | | | | | | | | | | | | | | | | | |
RIF Core Bond Fund | | $ | 7,049,778 | | $ | 4,288,231 | | $ | 2,087,711 | | $ | (166,477 | ) | | $ | 397,423 | | $ | 46,107 |
RIF Aggressive Equity Fund | | | 2,069,177 | | | 1,742,315 | | | 101,844 | | | (22,719 | ) | | | 21,059 | | | 377 |
RIF Multi-Style Equity Fund | | | 7,170,930 | | | 5,916,805 | | | 456,660 | | | (74,873 | ) | | | 102,571 | | | 56,648 |
RIC Russell U.S. Quantitative Equity Fund | | | 6,916,638 | | | 887,839 | | | 95,505 | | | (47,164 | ) | | | 42,950 | | | — |
RIF Real Estate Securities Fund | | | 2,207,150 | | | 1,812,228 | | | 419,571 | | | (121,596 | ) | | | 41,786 | | | — |
RIC Russell Emerging Markets Fund | | | 1,386,160 | | | 1,586,734 | | | 119,980 | | | (36,724 | ) | | | — | | | 66,347 |
RIC Russell Global Equity Fund | | | 2,072,044 | | | 1,828,431 | | | 105,741 | | | (11,290 | ) | | | 32,870 | | | — |
RIF Non-U.S. Fund | | | 5,880,874 | | | 5,080,230 | | | 406,274 | | | (113,410 | ) | | | — | | | 44,109 |
RIC Quantitative Equity Fund (1) | | | — | | | 4,363,826 | | | 386,473 | | | (80,217 | ) | | | 30,180 | | | |
| | | | | | | | | | | | | | | | | | | |
| | $ | 34,752,751 | | $ | 27,506,639 | | $ | 4,179,759 | | $ | (674,470 | ) | | $ | 668,839 | | $ | 213,588 |
| | | | | | | | | | | | | | | | | | | |
| | | | | | | | | | | | | | | | | | | |
Equity Growth Strategy Fund | | | | | | | | | | | | | | | | | | | |
RIF Aggressive Equity Fund | | $ | 880,602 | | $ | 713,306 | | $ | 281,798 | | $ | (66,220 | ) | | $ | 9,247 | | $ | 194 |
RIF Multi-Style Equity Fund | | | 3,271,627 | | | 2,624,719 | | | 1,043,658 | | | (198,054 | ) | | | 51,215 | | | 30,967 |
RIC Russell U.S. Quantitative Equity Fund | | | 3,175,181 | | | 568,631 | | | 184,893 | | | (77,051 | ) | | | 19,265 | | | — |
RIF Real Estate Securities Fund | | | 902,850 | | | 928,295 | | | 743,554 | | | (204,398 | ) | | | 18,909 | | | — |
RIC Russell Emerging Markets Fund | | | 625,469 | | | 666,124 | | | 211,439 | | | (67,862 | ) | | | — | | | 29,500 |
RIC Russell Global Equity Fund | | | 882,254 | | | 714,480 | | | 224,435 | | | (40,902 | ) | | | 13,700 | | | — |
RIF Non-U.S. Fund | | | 2,885,222 | | | 2,302,751 | | | 901,903 | | | (264,119 | ) | | | — | | | 26,476 |
RIC Quantitative Equity Fund (1) | | | — | | | 1,771,095 | | | 879,244 | | | (183,208 | ) | | | 15,351 | | | |
| | | | | | | | | | | | | | | | | | | |
| | $ | 12,623,205 | | $ | 10,289,401 | | $ | 4,470,924 | | $ | (1,101,814 | ) | | $ | 127,687 | | $ | 87,137 |
| | | | | | | | | | | | | | | | | | | |
| (1) | Quantitative Equity Fund merged into Russell U.S. Quantitative Equity Fund as of September 22, 2008. |
At December 31, 2008, the following Fund had net tax basis capital loss carryforwards which may be applied against any net realized taxable gains in each succeeding year or until their respective expiration dates, whichever occurs first. Available capital loss carryforwards and expiration dates are as follows:
| | | | | | |
| Funds | | 12/31/2016 | | Totals |
| | | | | | |
Equity Growth Strategy | | $ | 134,219 | | $ | 134,219 |
At December 31, 2008, the cost of investments, net unrealized appreciation (depreciation), undistributed ordinary income and undistributed long-term capital gains for income tax purposes were as follows:
| | | | | | | | | | | | | | | | |
| | | Moderate
Strategy Fund | | | Balanced
Strategy Fund | | | Growth
Strategy Fund | | | Equity Growth
Strategy Fund | |
| | | | | | | | | | | | | | | | |
Cost of Investments for Tax Purposes | | $ | 24,524,329 | | | $ | 82,502,736 | | | $ | 52,768,220 | | | $ | 20,937,830 | |
| | | | | | | | | | | | | | | | |
Unrealized Appreciation | | $ | — | | | $ | — | | | $ | — | | | $ | — | |
Unrealized Depreciation | | | (5,205,304 | ) | | | (22,328,438 | ) | | | (18,015,469 | ) | | | (8,314,625 | ) |
| | | | | | | | | | | | | | | | |
Net Tax Unrealized Appreciation (Depreciation) | | $ | (5,205,304 | ) | | $ | (22,328,438 | ) | | $ | (18,015,469 | ) | | $ | (8,314,625 | ) |
| | | | | | | | | | | | | | | | |
Undistributed Ordinary Income | | $ | 237,035 | | | $ | 79,930 | | | $ | 7,955 | | | $ | 31,779 | |
Undistributed Long-Term Gains (Capital Loss Carryforward) | | $ | 62,862 | | | $ | 96,500 | | | $ | 56,058 | | | $ | (134,219 | ) |
Tax Composition of Distributions: | | | | | | | | | | | | | | | | |
Ordinary Income | | $ | 482,474 | | | $ | 1,443,808 | | | $ | 646,736 | | | $ | 95,429 | |
Long-Term Capital Gains | | $ | 159,653 | | | $ | 1,138,562 | | | $ | 1,108,503 | | | $ | 741,432 | |
| 6. | | Fund Share Transactions (amounts in thousands) |
Share transactions for the periods ended December 31, 2008 and December 31, 2007 were as follows:
| | | | | | | | | | | | | | |
| | | Shares | | | Dollars | |
| | | 2008 | | | 2007* | | | 2008 | | | 2007* | |
| | | | | | | | | | | | | | |
Moderate Strategy Fund | | | | | | | | | | | | | | |
Proceeds from shares sold | | 2,261 | | | 950 | | | $ | 21,043 | | | $ | 9,530 | |
Proceeds from reinvestment of distributions | | 71 | | | 22 | | | | 642 | | | | 209 | |
Payments for shares redeemed | | (682 | ) | | (106 | ) | | | (6,163 | ) | | | (1,047 | ) |
| | | | | | | | | | | | | | |
Total net increase (decrease) | | 1,650 | | | 866 | | | $ | 15,522 | | | $ | 8,692 | |
| | | | | | | | | | | | | | |
| | |
| 46 | | Notes to Financial Statements |
Russell Investment Funds
LifePoints® Funds Variable Target Portfolio Series
Notes to Financial Statements, continued — December 31, 2008
| 6. | | Fund Share Transactions (amounts in thousands) (continued) |
| | | | | | | | | | | | | | |
| | | Shares | | | Dollars | |
| | | | | | | |
| | | 2008 | | | 2007* | | | 2008 | | | 2007* | |
| | | | | | | | | | | | | | |
Balanced Strategy Fund | | | | | | | | | | | | | | |
Proceeds from shares sold | | 5,802 | | | 3,701 | | | $ | 50,702 | | | $ | 37,178 | |
Proceeds from reinvestment of distributions | | 306 | | | 91 | | | | 2,582 | | | | 903 | |
Payments for shares redeemed | | (856 | ) | | (197 | ) | | | (7,050 | ) | | | (2,003 | ) |
| | | | | | | | | | | | | | |
Total net increase (decrease) | | 5,252 | | | 3,595 | | | $ | 46,234 | | | $ | 36,078 | |
| | | | | | | | | | | | | | |
| | | | | | | | | | | | | | |
| | |
| | | Shares | | | Dollars | |
| | | 2008 | | | 2007* | | | 2008 | | | 2007* | |
| | | | | | | | | | | | | | |
Growth Strategy Fund | | | | | | | | | | | | | | |
Proceeds from shares sold | | 3,050 | | | 2,762 | | | $ | 25,915 | | | $ | 27,787 | |
Proceeds from reinvestment of distributions | | 212 | | | 66 | | | | 1,755 | | | | 651 | |
Payments for shares redeemed | | (344 | ) | | (61 | ) | | | (2,791 | ) | | | (623 | ) |
| | | | | | | | | | | | | | |
Total net increase (decrease) | | 2,918 | | | 2,767 | | | $ | 24,879 | | | $ | 27,815 | |
| | | | | | | | | | | | | | |
| | |
| | | Shares | | | Dollars | |
| | | 2008 | | | 2007* | | | 2008 | | | 2007* | |
Equity Growth Strategy Fund | | | | | | | | | | | | | | |
Proceeds from shares sold | | 1,334 | | | 1,332 | | | $ | 10,149 | | | $ | 13,593 | |
Proceeds from reinvestment of distributions | | 100 | | | 37 | | | | 837 | | | | 358 | |
Payments for shares redeemed | | (428 | ) | | (46 | ) | | | (3,448 | ) | | | (458 | ) |
| | | | | | | | | | | | | | |
Total net increase (decrease) | | 1,006 | | | 1,323 | | | $ | 7,538 | | | $ | 13,493 | |
| | | | | | | | | | | | | | |
| * | For the period April 30, 2007 (commencement of operations) to December 31, 2007. |
| 7. | | Interfund Lending Program |
The Investment Company Funds have received permission from the Securities and Exchange Commission to participate in a joint lending and borrowing facility (the “Credit Facility”). Portfolios of the Funds may borrow money from each other for temporary purposes. All such borrowing and lending will be subject to a participating Fund’s fundamental investment limitations. Typically, Funds will borrow from the RIC Russell Money Market Fund. The RIC Russell Money Market Fund will lend through the program only when the returns are higher than those available from an investment in repurchase agreements or short-term reserves and the portfolio manager determines it is in the best interest of the RIC Russell Money Market Fund. The Investment Company Funds will borrow through the program only when the costs are equal to or lower than the cost of bank loans. Interfund loans and borrowings normally extend overnight, but can have a maximum duration of seven days. Loans may be called on one business day’s notice. A participating fund may have to borrow from a bank at a higher interest rate if an interfund loan is called or not renewed. Any delay in repayment to the RIC Russell Money Market Fund could result in a lost investment opportunity or additional borrowing costs. For the period ended December 31, 2008, the Funds presented herein did not borrow through the interfund lending program.
As of December 31, 2008, the following table includes shareholders of record with greater than 10% of the total outstanding shares of each respective Fund. The Northwestern Mutual Life Insurance Company accounts were the largest shareholders in each Fund.
| | | | |
| Funds | | # of Shareholders | | % |
| | | | |
Moderate Strategy | | 1 | | 97.7 |
Balanced Strategy | | 1 | | 97.2 |
Growth Strategy | | 1 | | 98.3 |
Equity Growth Strategy | | 1 | | 97.9 |
| | |
| Notes to Financial Statements | | 47 |
Report of Independent Registered Public Accounting Firm
To the Board of Trustees and Shareholders
of Russell Investment Funds:
In our opinion, the accompanying statements of assets and liabilities, including the schedules of investments, and the related statements of operations and of changes in net assets and the financial highlights present fairly, in all material respects, the financial position of Moderate Strategy Fund, Balanced Strategy Fund, Growth Strategy Fund, and Equity Growth Strategy Fund (four of the portfolios constituting the Russell Investment Funds, hereafter referred to as the “Funds”) at December 31, 2008, the results of each of their operations for the year then ended, and the changes in each of their net assets and the financial highlights for the periods indicated, in conformity with accounting principles generally accepted in the United States of America. These financial statements and financial highlights (hereafter referred to as “financial statements”) are the responsibility of the Funds’ management; our responsibility is to express an opinion on these financial statements based on our audits. We conducted our audits of these financial statements in accordance with the standards of the Public Company Accounting Oversight Board (United States). Those standards require that we plan and perform the audits to obtain reasonable assurance about whether the financial statements are free of material misstatement. An audit includes examining, on a test basis, evidence supporting the amounts and disclosures in the financial statements, assessing the accounting principles used and significant estimates made by management, and evaluating the overall financial statement presentation. We believe that our audits, which included confirmation of securities at December 31, 2008 by correspondence with the transfer agent, provide a reasonable basis for our opinion.

Seattle, Washington
February 12, 2009
| | |
| 48 | | Report of Independent Registered Public Accounting Firm |
Russell Investment Funds
Tax Information — December 31, 2008 (Unaudited)
For the tax year ended December 31, 2008, the Funds hereby designate 100% or the maximum amount allowable, of its net taxable income as qualified dividends taxed at individual net capital gain rates.
The Form 1099 you receive in January 2009 will show the tax status of all distributions paid to your account in calendar year 2008.
The Funds designate dividends distributed during the fiscal year as qualifying for the dividends received deduction for corporate shareholders as follows:
| | | |
Moderate Strategy | | 12.0 | % |
Balanced Strategy | | 17.6 | % |
Growth Strategy | | 35.0 | % |
Equity Growth Strategy | | 100.0 | % |
Pursuant to Section 852 of the Internal Revenue Code, the Funds designate the following amounts as long-term capital gain dividends for their taxable year ended December 31, 2008:
| | |
| | | Long-Term
Capital Gains |
| | |
Moderate Strategy | | 159,653 |
Balanced Strategy | | 1,138,562 |
Growth Strategy | | 1,108,503 |
Equity Growth Strategy | | 741,432 |
Please consult a tax adviser for any questions about federal or state income tax laws.
Russell Investment Funds
LifePoints® Funds Variable Target Portfolio Series
Basis for Approval of Investment Advisory Contracts (Unaudited)
Approval of Investment Advisory Agreement
The Board of Trustees, including all of the Independent Trustees, last considered and approved the continuation of the advisory agreement with RIMCo (the “RIMCo Agreement”) and the portfolio management contract (collectively, the “portfolio management contracts”) with each Money Manager of the funds in which the Funds invest (the “Underlying Funds”) at a meeting held on April 22, 2008. During the course of a year, the Trustees receive a wide variety of materials regarding the investment performance of the Funds, sales and redemptions of the Funds’ and Underlying Funds’ shares, and the management of the Funds and the Underlying Funds by RIMCo. In preparation for the annual review, the Independent Trustees, with the advice and assistance of their independent counsel, also requested and the Board considered (1) information and reports prepared by RIMCo relating to the services provided by RIMCo (and its affiliates) to the Funds and the Underlying Funds; and (2) information (the “Third-Party Information”) received from an independent, nationally recognized provider of investment company information comparing the performance of each of the Funds and the Underlying Funds and their respective operating expenses over various periods of time with other peer funds (“Comparable Funds”) not managed by RIMCo believed by the provider to be generally comparable in investment objectives and size to the Funds and the Underlying Funds. The foregoing information requested by the Trustees or provided by RIMCo is collectively called the “Agreement Renewal Information.” The Trustees’ evaluations also reflected the knowledge and familiarity gained as Board members of the Funds and other funds in the same complex with respect to services provided by RIMCo, RIMCo’s affiliates and each Money Manager. The Trustees received a memorandum from counsel to the Funds discussing the legal standards for their consideration of the continuations of the RIMCo Agreement and the portfolio management contracts and the Independent Trustees separately received a memorandum regarding their responsibilities from their independent counsel.
On April 21, 2008, the Independent Trustees met to review the Agreement Renewal Information in a private session with their independent counsel at which no representatives of RIMCo or management were present. At the April 22 meeting of the Board of Trustees, the Board, including the Independent Trustees, reviewed the proposed continuance of the RIMCo Agreement and the portfolio management contracts with management and independent counsel to the Independent Trustees. Presentations made by RIMCo to the Board as part of this review encompassed the Funds and all other RIMCo-managed funds for which the Board has supervisory responsibility. Following this review, but prior to voting, the Independent Trustees again met in a private session with their independent counsel to evaluate additional information and analyses received from RIMCo and management at the Board meeting. The discussion below reflects all of these reviews.
In evaluating the portfolio management contracts, the Board considered that the Underlying Funds, in employing a manager-of-managers method of investment, operate in a manner that is distinctly different from most other investment companies. In the case of most other investment companies, an advisory fee is paid by the investment company to its adviser which in turn employs and compensates individual portfolio managers to make specific securities selections consistent with the adviser’s style and investment philosophy. RIMCo has engaged multiple unaffiliated Money Managers for all Underlying Funds.
The Board considered that RIMCo (rather than any Money Manager) is responsible under the RIMCo Agreement for allocating assets of each Fund among its Underlying Funds and for determining, implementing and maintaining the investment program for each Underlying Fund. The assets of each Fund are invested in different combinations of the Underlying Funds pursuant to target asset allocations set by RIMCo. RIMCo may modify the target asset allocation for any Fund and/or the Underlying Funds in which the Funds invest. Assets of each Underlying Fund generally have been allocated among the multiple Money Managers selected by RIMCo, subject to Board approval, for that Underlying Fund. RIMCo manages directly a portion of certain Underlying Funds’ assets employing a “select holdings strategy,” as described below, and directly manages the investment of each Underlying Fund’s cash reserves. RIMCo also may manage directly any portion of each Underlying Fund’s assets that RIMCo determines not to allocate to the Money Managers and portions of an Underlying Fund during transitions between Money Managers. In all cases, assets are managed directly by RIMCo pursuant to authority granted by the RIMCo Agreement.
RIMCo is responsible for selecting, subject to Board approval, Money Managers for each Underlying Fund and for actively managing allocations and reallocations of its assets among the Money Managers. RIMCo’s goal is to construct and manage diversified portfolios in a risk aware manner. Each Money Manager for an Underlying Fund in effect performs the function of an individual portfolio manager who is responsible for selecting portfolio securities for the portion of the Underlying Fund assigned to it by RIMCo (each, a “segment”) in accordance with the Fund’s applicable investment objective, policies and restrictions, any constraints placed by RIMCo upon their selection of portfolio securities and the Money Manager’s specified role in an Underlying Fund. RIMCo is responsible for communicating performance expectations to each Money Manager; supervising compliance by each Money Manager with each Underlying Fund’s investment objective and policies; authorizing Money Managers to engage in certain investment strategies for an Underlying Fund; and recommending annually to the Board whether portfolio management contracts should be renewed, modified or terminated. In addition to its annual recommendation as to the renewal, modification or termination of portfolio management contracts, RIMCo is responsible for recommending to the Board additions of new Money Managers or replacements of existing Money Managers at any time when, based on RIMCo’s research and ongoing review and analysis, such actions are
| | |
| 50 | | Basis for Approval of Investment Advisory Contracts |
Russell Investment Funds
LifePoints® Funds Variable Target Portfolio Series
Basis for Approval of Investment Advisory Contracts, continued (Unaudited)
appropriate. RIMCo may impose specific investment constraints from time to time for each Money Manager intended to capitalize on the strengths of that Money Manager or to coordinate the investment activities of Money Managers for an Underlying Fund in a complementary manner. Therefore, the performance of individual Money Managers for an Underlying Fund may reflect the roles assigned to them by RIMCo in the Underlying Funds’ investment activities and any constraints placed by RIMCo upon their selection of portfolio securities. In light of the foregoing, the overall performance of each Underlying Fund over appropriate periods reflects, in great part, the performance of RIMCo in designing the Underlying Fund’s investment program, structuring an Underlying Fund, selecting an effective Money Manager with a particular investment style or sub-style for a segment that is complementary to the styles of the Money Managers of other Underlying Fund segments, and allocating assets among the Money Managers in a manner designed to achieve the objectives of the Underlying Fund.
The Board considered that the prospectuses for the Funds and the Underlying Funds and other public disclosures emphasize to investors RIMCo’s role as the principal investment manager for each Underlying Fund, rather than the investment selection role of the Underlying Funds’ Money Managers, and describe the manner in which the Funds or Underlying Funds operate so that investors may take that information into account when deciding to purchase shares of any Fund.
The Board also considered the demands and complexity of managing the Underlying Funds pursuant to the manager-or-managers structure, the special expertise of RIMCo with respect to the manager-of-managers structure of the Underlying Funds and the likelihood that, at the current expense ratio of each Underlying Fund, there would be no acceptable alternative investment managers to replace RIMCo on comparable terms given the need to continue the manager-of-managers strategy of each Underlying Fund selected by shareholders in purchasing their shares of a Fund or Underlying Fund.
In addition to these general factors relating to the manager-of-managers structure of the Underlying Funds, the Trustees considered, with respect to each Fund and Underlying Fund, various specific factors in evaluating renewal of the RIMCo Agreement, including the following:
| 1. | The nature, scope and quality of the services provided to the Fund and the Underlying Fund by RIMCo; |
| 2. | The advisory fee paid by the Fund or the Underlying Fund to RIMCo and the fact that it encompasses all investment advisory fees paid by the Fund or Underlying Fund, including the fees for any Money Managers of such Underlying Fund; |
| 3. | Information provided by RIMCo as to other fees and benefits received by RIMCo or its affiliates from the Fund or Underlying Fund, including any administrative, transfer agent, cash management and securities lending fees, soft dollar arrangements and commissions in connection with portfolio securities transactions; |
| 4. | Information provided by RIMCo as to expenses incurred by the Fund or the Underlying Fund; and |
| 5. | Information provided by RIMCo as to the profits that RIMCo derives from its mutual fund operations generally and from the Fund or Underlying Fund. |
As noted above, RIMCo pursuant to the terms of the RIMCo Agreement directly managed a portion—up to 10%—of the assets of the RIF Multi-Style Equity Fund and the Russell Investment Company (“RIC”) Quantitative Equity Fund (each a “Participating Underlying Fund”) during the past year utilizing a select holdings strategy, the actual allocation being determined by each Participating Underlying Fund’s RIMCo portfolio manager. The select holdings strategy utilized by RIMCo in managing such assets for a Participating Underlying Fund is designed to increase the Participating Underlying Fund’s exposure to stocks that are viewed as attractive by multiple Money Managers of that Participating Underlying Fund. The Board reviewed the results of the select holdings strategy in respect of each Participating Underlying Fund since implementation taking into account that the strategy has been utilized for a limited period of time. With respect to each Participating Underlying Fund, the Trustees considered that RIMCo is not required to pay investment advisory fees to a Money Manager with respect to assets for which the select holdings strategy is utilized and that the profits derived by RIMCo generally and from the Participating Underlying Fund consequently may increase incrementally. The Board, however, also considered RIMCo’s advice that it pays certain Money Managers additional fees for providing information and other services in connection with the select holdings strategy and incurs additional costs in carrying out the select holdings strategy, the limited amount of assets that are managed directly by RIMCo pursuant to the select holdings strategy, and the fact that the aggregate investment advisory fees paid by the Participating Underlying Fund are not increased as a result of the select holdings strategy.
In evaluating the reasonableness of the Funds’ and Underlying Funds’ investment advisory fees in light of Fund and Underlying Fund performance, the Board considered that RIMCo, in the Agreement Renewal Information and at past meetings, noted differences between the investment strategies of certain Underlying Funds and their respective Comparable Funds in pursuing their investment objectives, including Fund strategies which seek to achieve a lower tracking error (i.e., the difference, whether positive or negative,
| | |
| Basis for Approval of Investment Advisory Contracts | | 51 |
Russell Investment Funds
LifePoints® Funds Variable Target Portfolio Series
Basis for Approval of Investment Advisory Contracts, continued (Unaudited)
between the return of a fund and its benchmark) and resulting lower return volatility than Comparable Funds. According to RIMCo, these strategies may be expected to result, and for certain Underlying Funds during the periods covered by the Third-Party Information did result, in lower performance of the Funds than that of some of their respective Comparable Funds. According to RIMCo, the strategies pursued by the Underlying Funds, among other things, are intended to result in less volatile, more moderate returns relative to each Fund’s performance benchmark rather than more volatile, more extreme returns that its Comparable Funds may experience over time.
The Board considered for each Fund and Underlying Fund whether economies of scale have been realized and whether the fees for such Fund or Underlying Fund appropriately reflect or should be revised to reflect any such economies. The Board determined that, after giving effect to any applicable fee or expense caps, waivers or reimbursements, the investment advisory fees for each Fund or Underlying Fund appropriately reflect any economies of scale realized by such Fund, based upon such factors as the variability of Money Manager investment advisory fees and other factors associated with the manager-of-managers structure employed by the Underlying Funds. The Trustees considered that fees payable to RIMCo by institutional clients with investment objectives similar to those of the Funds and other funds under the Board’s supervision, including the Underlying Funds are lower, and may, in some cases, be substantially lower, than the rates paid by funds supervised by the Board, including the Funds. The Trustees considered the differences in the scope of services it provides to institutional clients and the funds under its supervision, including the Underlying Funds. In response to the Trustees’ inquiries, RIMCo has previously noted, among other things, that institutional clients have fewer administrative needs than the Funds. RIMCo has in the past noted that since the Funds must constantly issue and redeem their shares, they are more difficult to manage than institutional accounts, where assets are relatively stable. Accordingly, the Trustees did not regard these fee differences as relevant to their deliberations.
On the basis of the Agreement Renewal Information, and other information previously received by the Board from RIMCo during the course of the current year or prior years or presented at the April 22 Board meeting by RIMCo, the Board, in respect of each Fund and Underlying Fund, found, after giving effect to waivers and/or reimbursements and considering differences in the composition and investment strategies of their respective Comparable Funds (1) the advisory fee charged by RIMCo to be reasonable in light of the nature, scope and quality of the services provided to the Funds or Underlying Funds; (2) the relative expense ratio of each Fund and Underlying Fund was comparable to those of its Comparable Funds; (3) RIMCo’s methodology of allocating expenses of operating funds in the complex was reasonable; and (4) RIMCo’s profitability with respect to the Fund and each Underlying Fund was not excessive in light of the nature, scope and quality of the services provided by RIMCo.
The Board further concluded that, under the circumstances, the performance of each of the Funds supported continuation of the RIMCo Agreement. In evaluating performance, the Board considered each Fund’s and Underlying Fund’s absolute performance and its performance relative to appropriate benchmarks and indices and its Comparable Funds. In assessing performance, the Board also considered RIMCo’s investment strategy of managing the Underlying Funds in a risk aware manner.
After considering the foregoing and other relevant factors, the Board concluded that continuation of the RIMCo Agreement on its current terms and conditions would be in the best interests of the Funds and their respective shareholders and voted to approve the continuation of the Agreement.
At the April 22 Board meeting, with respect to the evaluation of the terms of portfolio management contracts with Money Managers for the Underlying Funds, the Board received and considered information from RIMCo reporting, among other things, for each Money Manager, the Money Manager’s performance over various periods; RIMCo’s assessment of the performance of the Money Manager; any significant business relationships between the Money Manager and RIMCo or Russell Financial Services, Inc., the Funds’ and Underlying Funds’ underwriter; and RIMCo’s recommendation to retain the Money Manager at the current fee rate, to retain the Money Manager at a reduced fee rate or to terminate the Money Manager. RIMCo recommended that each Money Manager be retained at its current fee rate. RIMCo has advised the Board that it does not regard Money Manager profitability as relevant to its evaluation of the portfolio management contracts with Money Managers because the willingness of Money Managers to serve in such capacity depends upon arm’s-length negotiations with RIMCo; RIMCo is aware of the fees charged by Money Managers to other clients; and RIMCo believes that the fees agreed upon with Money Managers are reasonable in light of the anticipated quality of investment advisory services to be rendered. The Board accepted RIMCo’s explanation in light of the Board’s findings as to the reasonableness of the aggregate investment advisory fees paid by each Fund and Underlying Fund and the fact that each Money Manager’s fee is paid by RIMCo.
Based substantially upon RIMCo’s recommendations together with the information received from RIMCo in support of its recommendations at the April 22 meeting, the Board concluded that the fees paid to the Money Managers of each Underlying Fund are reasonable in light of the quality of the investment advisory services provided and that continuation of the portfolio management contract with each Money Manager of each Underlying Fund would be in the best interests of the Fund and its shareholders.
| | |
| 52 | | Basis for Approval of Investment Advisory Contracts |
Russell Investment Funds
LifePoints® Funds Variable Target Portfolio Series
Basis for Approval of Investment Advisory Contracts, continued (Unaudited)
In their deliberations, the Trustees did not identify any particular information as to the RIMCo Agreement or, other than RIMCo’s recommendation, the portfolio management contract with any Money Manager for an Underlying Fund that was all-important or controlling and each Trustee attributed different weights to the various factors considered. The Trustees evaluated all information available to them on a Fund-by-Fund basis and their determinations were made in respect of each Fund and Underlying Fund.
Subsequently, the Board of Trustees received the following proposals from RIMCo: (1) at a meeting held on May 20, 2008, to effect a money manager change for the Russell Global Equity Fund; (2) at a meeting held on August 26, 2008, to effect a money manager change for the Russell U.S. Quantitative Equity Fund; and (3) at a meeting held on October 10, 2008, to effect a money manager change for the Multi-Style Equity Fund resulting from a change of control of one of the Fund’s Money Managers. In the case of each such proposed change, the Trustees approved the terms of the proposed portfolio management contract based substantially upon RIMCo’s recommendation to hire the Money Manager at the proposed fee rate; any significant business relationships between the Money Manager and RIMCo or Russell Financial Services, Inc. the Fund’s underwriter; RIMCo’s explanation as to the lack of relevance of profitability to the evaluation of portfolio management contracts with money managers because the willingness of Money Managers to serve in such capacity depends upon arm’s-length negotiations with RIMCo; RIMCo’s awareness of the fees charged by the Money Manager to other clients; and RIMCo’s belief that the proposed investment advisory fees would be reasonable in light of the anticipated quality of investment advisory services to be rendered. The Trustees also considered their findings at their April 22, 2008 meeting as to the reasonableness of the aggregate investment advisory fees paid by the Fund, and the fact that the aggregate investment advisory fees paid by the Fund would not increase as a result of the implementation of the proposed money manager change because the money managers’ investment advisory fee is paid by RIMCo.
| | |
| Basis for Approval of Investment Advisory Contracts | | 53 |
Russell Investment Funds
LifePoints® Funds Variable Target Portfolio Series
Shareholder Requests for Additional Information — December 31, 2008 (Unaudited)
A complete unaudited schedule of investments is made available generally no later than 60 days after the end of the first and third quarters of each year. These reports are available (i) free of charge, upon request, by calling the Funds at (800) 787-7354, (ii) on the Securities and Exchange Commission’s website at www.sec.gov, and (iii) at the Securities and Exchange Commission’s public reference room.
The Board has delegated to RIMCo, as RIF’s investment adviser, the primary responsibility for monitoring, evaluating and voting proxies solicited by or with respect to issuers of securities in which assets of the Funds may be invested. RIMCo has established a proxy voting committee (“Committee”) and has adopted written proxy voting policies and procedures (“P&P”) and proxy voting guidelines (“Guidelines”). The Funds maintain a Portfolio Holdings Disclosure Policy that governs the timing and circumstances of disclosure to shareholders and third parties of information regarding the portfolio investments held by the Funds. A description of the P&P, Guidelines, Portfolio Holdings Disclosure Policy and additional information about Fund Trustees are contained in the Funds’ Statement of Additional Information (“SAI”). The SAI is available (i) free of charge, upon request, by calling the Funds at (800) 787-7354, and (ii) on the Securities and Exchange Commission’s website at www.sec.gov.
Financial Statements of the Underlying Funds can be obtained at no charge by calling the Funds at (800) 787-7354.
If possible, depending on contract owner registration and address information, and unless you have otherwise opted out, only one copy of the RIF prospectus and each annual and semi-annual report will be sent to contract owners at the same address. If you would like to receive a separate copy of these documents, please contact your Insurance Company. If you currently receive multiple copies of the prospectus, annual report and semi-annual report and would like to request to receive a single copy of these documents in the future, please call your Insurance Company.
Some Insurance Companies may offer electronic delivery of the Funds’ prospectus and annual and semiannual reports. Please contact your Insurance Company for further details.
| | |
| 54 | | Shareholder Requests for Additional Information |
Russell Investment Funds
LifePoints® Funds Variable Target Portfolio Series
Disclosure of Information about Fund Trustees and Officers — December 31, 2008 (Unaudited)
The following tables provide information for each officer and trustee of the Russell Fund Complex. The Russell Fund Complex consists of Russell Investment Company (“RIC”), which has 38 funds, and Russell Investment Funds (“RIF”), which has 9 funds. Each of the trustees is a trustee of both RIC and RIF. The first table provides information for the interested trustee. The second table provides information for the independent trustees. The third table provides information for the trustees emeritus. The fourth table provides information for the officers.
| | | | | | | | | | |
Name,
Age,
Address | | Position(s) Held
with Fund and
Length of
Time Served | | Term
of
Office* | | Principal Occupation(s)
During the
Past 5 Years | | No. of
Portfolios
in Russell
Fund
Complex
Overseen
by Trustee | | Other
Directorships Held
by Trustee |
INTERESTED TRUSTEES | | | | | | | | | | |
#Greg J. Stark Born May 3, 1968 909 A Street Tacoma, Washington 98402-1616 | | President and Chief Executive Officer since 2004 Trustee since 2007 | | Appointed until successor is duly elected and qualified Until successor is chosen and qualified by Trustees | | • President and CEO RIC and RIF • Chairman of the Board, President and CEO, RIMCo • Chairman of the Board, President and CEO, Russell Fund Services Company (“RFSC”) • Chairman of the Board, President and CEO, Russell Financial Services, Inc. • Chairman of the Board and President, Russell Insurance Agency, Inc. (insurance agency (“RIA”)) • Until 2004, Managing Director, of Individual Investor Services, FRC • 2000 to 2004 Managing Director, Sales and Client Service, RIMCo | | 47 | | None |
INDEPENDENT TRUSTEES | | | | | | | | |
Thaddas L. Alston Born April 7, 1945 909 A Street Tacoma, Washington 98402-1616 | | Trustee since 2006 | | Appointed until successor is duly elected and qualified | | • Senior Vice President, Larco Investments, Ltd. (real estate firm) | | 47 | | None |
| | | | | | | | | | | |
Kristianne Blake, Born January 22, 1954 909 A Street Tacoma, Washington 98402-1616 | | Trustee since 2000 Chairman since 2005 | | Appointed until successor is duly elected and qualified Annual | | • Director and Chairman of the Audit Committee, Avista Corp. • Trustee and Chairman of the Operations Committee, Principal Investors Funds and Principal Variable Contracts Funds • Regent, University of Washington • President, Kristianne Gates Blake, P.S. (accounting services) • February 2002 to June 2005, Chairman of the Audit Committee, RIC and RIF Trustee and Chairman of the Operations and Distribution Committee, WM Group of Funds, 1999–2006 | | 47 | | • Director, Avista Corp; (electric utilities) • Trustee, Principal Investors Funds (investment company); • Trustee, Principal Variable Contracts Funds (investment company) |
| # | Mr. Stark is also an officer and/or director of one or more affiliates of RIC and RIF and is therefore an Interested Trustee. |
| | |
| Disclosure of Information about Fund Trustees and Officers | | 55 |
Russell Investment Funds
LifePoints® Funds Variable Target Portfolio Series
Disclosure of Information about Fund Trustees and Officers, continued —
December 31, 2008 (Unaudited)
| | | | | | | | | | |
Name,
Age,
Address | | Position(s) Held
With Fund and
Length of
Time Served | | Term
of
Office* | | Principal Occupation(s)
During the
Past 5 Years | | No. of
Portfolios
in Russell
Fund
Complex
Overseen
by Trustee | | Other
Directorships Held
by Trustee |
INDEPENDENT TRUSTEES (continued) | | | | | | | | |
Daniel P. Connealy Born June 6, 1946 909 A Street Tacoma, Washington 98402-1616 | | Trustee since 2003 Chairman of Audit Committee since 2005 | | Appointed until successor is duly elected and qualified Appointed until successor is duly elected and qualified | | • June 2004 to present, Senior Vice President and Chief Financial Officer, Waddell & Reed Financial, Inc. • 2001–2003, Vice President and Chief Financial Officer, Janus Capital Group Inc. | | 47 | | None |
| | | | | | | | | | | |
Jonathan Fine Born July 8, 1954 909 A Street Tacoma, Washington 98402-1616 | | Trustee since 2004 | | Appointed until successor is duly elected and qualified | | • President and Chief Executive Officer, United Way of King County, WA | | 47 | | None |
| | | | | | | | | | | |
Raymond P. Tennison, Jr. Born December 21, 1955 909 A Street Tacoma, Washington 98402-1616 | | Trustee since 2000 Chairman of the Nominating and Governance Committee since 2007 | | Appointed until successor is duly elected and qualified. Appointed until successor is duly elected and qualified | | • President, Simpson Investment Company and several additional subsidiary companies, including Simpson Timber Company, Simpson Paper Company and Simpson Tacoma Kraft Company | | 47 | | None |
| | | | | | | | | | | |
Jack R. Thompson, Born March 21, 1949 909 A Street Tacoma, Washington 98402-1616 | | Trustee since 2005 | | Appointed until successor is duly elected and qualified | | • September 2003 to present, Independent Board Chair and Chairman of the Audit Committee, Sparx Asia Funds • September 2007 to present, Director, Board Chairman, and Audit Committee Chairman, LifeVantage Corporation (health products company) • May 1999 to May 2003, President, Chief Executive Officer and Director, Berger Financial Group, LLC • May 1999 to May 2003, President and Trustee, Berger Funds | | 47 | | • Director, Sparx Asia Funds (investment company) • Director, Board Chairman, and Audit Committee Chairman, LifeVantage Corporation (health products company) |
| | | | | | | | | | | |
Julie W. Weston, Born October 2, 1943 909 A Street Tacoma, Washington 98402-1616 | | Trustee since 2002 Chairperson of the Investment Committee since 2006 | | Appointed until successor is duly elected and qualified Appointed until successor is duly elected and qualified | | • Retired | | 47 | | None |
| * | Each Trustee is subject to mandatory retirement at age 72. |
| | |
| 56 | | Disclosure of Information about Fund Trustees and Officers |
Russell Investment Funds
LifePoints® Funds Variable Target Portfolio Series
Disclosure of Information about Fund Trustees and Officers, continued — December 31, 2008 (Unaudited)
| | | | | | | | | | |
Name,
Age,
Address | | Position(s) Held
with Fund and
Length of
Time Served | | Term
of
Office | | Principal Occupation(s)
During the
Past 5 Years | | No. of
Portfolios
in Russell
Fund
Complex
Overseen
by Trustee | | Other
Directorships Held
by Trustee |
TRUSTEES EMERITUS | | | | | | | | | | |
*George F. Russell, Jr., Born July 3, 1932 909 A Street Tacoma, Washington 98402-1616 | | Trustee Emeritus and Chairman Emeritus since 1999 | | Until resignation or removal | | • Director Emeritus, Frank Russell Company (investment consultant to institutional investors (“FRC”)); and RIMCo • Chairman Emeritus, RIC and RIF; Russell Implementation Services Inc. (broker-dealer and investment adviser (“RIS”)); Russell 20-20 Association (non-profit corporation); and Russell Trust Company (non-depository trust company (“RTC”)) • Chairman, Sunshine Management Services, LLC (investment adviser) | | 47 | | None |
| | | | | | | | | | | |
Paul E. Anderson, Born October 15, 1931 909 A Street Tacoma, Washington 98402-1616 | | Trustee Emeritus since 2007 | | Five year term | | • President, Anderson Management Group LLC (private investments consulting) • February 2002 to June 2005, Lead Trustee, RIC and RIF • Trustee of RIC and RIF until 2006 • Chairman of the Nominating and Governance Committee 2006 | | 47 | | None |
| | | | | | | | | | | |
William E. Baxter, Born June 8, 1925 909 A Street Tacoma, Washington 98402-1616 | | Trustee Emeritus since 2004 | | Five year term | | • Retired since 1986 • Trustee of RIC and RIF until 2004 | | 47 | | None |
| | | | | | | | | | | |
Lee C. Gingrich, Born October 6, 1930 909 A Street Tacoma, Washington 98402-1616 | | Trustee Emeritus since 2006 | | Five year term | | • Retired since 1995 • Trustee of RIC and RIF until 2005 • Chairman of the Nominating and Governance Committee 2001–2005 | | 47 | | None |
| | | | | | | | | | | |
Eleanor W. Palmer, Born May 5, 1926 909 A Street Tacoma, Washington 98402-1616 | | Trustee Emeritus since 2004 | | Five year term | | • Retired since 1981 • Trustee of RIC and RIF until 2004 | | 47 | | None |
| * | Mr. Russell is also a director emeritus of one or more affiliates of RIC and RIF. |
| | |
| Disclosure of Information about Fund Trustees and Officers | | 57 |
Russell Investment Funds
LifePoints® Funds Variable Target Portfolio Series
Disclosure of Information about Fund Trustees and Officers, continued — December 31, 2008 (Unaudited)
| | | | | | |
Name,
Age,
Address | | Position(s) Held
with Fund and
Length of
Time Served | | Term
of
Office | | Principal Occupation(s)
During the
Past 5 Years |
OFFICERS | | | | | | |
Cheryl Wichers Born December 16, 1966 909 A Street Tacoma, Washington 98402-1616 | | Chief Compliance Officer since 2005 | | Until removed by Independent Trustees | | • Chief Compliance Officer, RIC • Chief Compliance Officer, RIF • Chief Compliance Officer, RIMCo • Chief Compliance Officer, RFSC • April 2002–May 2005, Manager, Global Regulatory Policy |
| | | | | | | |
Greg J. Stark, Born May 3, 1968 909 A Street Tacoma, Washington 98402-1616 | | President and Chief Executive Officer since 2004 | | Until successor is chosen and qualified by Trustees | | • President and CEO, RIC and RIF • Chairman of the Board, President and CEO, RIMCo • Chairman of the Board, President and CEO, Russell Financial Services, Inc. • Chairman of the Board, President and CEO, RFSC • Chairman of the Board and President, Russell Insurance Agency, Inc. (insurance agency (“RIA”)) • Until 2004, Managing Director of Individual Investor Services, FRC • 2000 to 2004, Managing Director, Sales and Client Service, RIMCo |
| | | | | | | |
Mark E. Swanson, Born November 26, 1963 909 A Street Tacoma, Washington 98402-1616 | | Treasurer and Chief Accounting Officer since 1998 | | Until successor is chosen and qualified by Trustees | | • Treasurer, Chief Accounting Officer and CFO, RIC and RIF • Director, Funds Administration, RIMCo, RFSC, RTC and Russell Financial Services, Inc. • Treasurer and Principal Accounting Officer, SSgA Funds |
| | | | | | | |
Peter Gunning, Born February 22, 1967 909 A Street Tacoma, Washington 98402-1616 | | Chief Investment Officer since 2008 | | Until removed by Trustees | | • Chief Investment Officer, RIC, RIF • 1996 to 2008 Chief Investment Officer, Russell, Asia Pacific |
| | | | | | | |
Gregory J. Lyons, Born August 24, 1960 909 A Street Tacoma, Washington 98402-1616 | | Secretary since 2007 | | Until successor is chosen and qualified by Trustees | | • Associate General Counsel and Assistant Secretary FRC and RIA • Director and Secretary, RIMCo, RFSC and Russell Financial Services, Inc. • Secretary and Chief Legal Counsel, RIC and RIF |
| | |
| 58 | | Disclosure of Information about Fund Trustees and Officers |
LifePoints® Funds Variable Target Portfolio Series
Russell Investment Funds
909 A Street, Tacoma, Washington 98402
(800) 787-7354
Interested Trustees
Greg J. Stark
Independent Trustees
Thaddas L. Alston
Kristianne Blake
Daniel P. Connealy
Jonathan Fine
Raymond P. Tennison, Jr.
Jack R. Thompson
Julie W. Weston
Trustees Emeritus
George F. Russell, Jr.
Paul E. Anderson
William E. Baxter
Lee C. Gingrich
Eleanor W. Palmer
Officers
Greg J. Stark, President and Chief Executive Officer
Cheryl Wichers, Chief Compliance Officer
Peter Gunning, Chief Investment Officer
Mark E. Swanson, Treasurer and Chief Accounting Officer
Gregory J. Lyons, Secretary
Adviser
Russell Investment Management Company
909 A Street
Tacoma, WA 98402
Administrator and Transfer and Dividend Disbursing Agent
Russell Fund Services Company
909 A Street
Tacoma, WA 98402
Custodian
State Street Bank and Trust Company
Josiah Quincy Building
200 Newport Avenue
North Quincy, MA 02171
Office of Shareholder Inquiries
909 A Street
Tacoma, WA 98402
(800) 787-7354
Legal Counsel
Dechert LLP
200 Clarendon Street, 27th Floor
Boston, MA 02116-5021
Distributor
Russell Financial Services, Inc.
909 A Street
Tacoma, WA 98402
Independent Registered Public Accounting Firm
PricewaterhouseCoopers LLP
1420 5th Avenue
Suite 1900
Seattle, WA 98101
Money Managers of Underlying Funds as of December 31, 2008
RIF Core Bond Fund
Goldman Sachs Asset Management, L.P., New York, NY
Metropolitan West Asset Management, LLC, Los Angeles, CA
Pacific Investment Management Company LLC, Newport Beach, CA
RIF Aggressive Equity Fund
ClariVest Asset Management LLC, San Diego, CA
DePrince, Race & Zollo, Inc., Winter Park, FL
Gould Investment Partners LLC, Berwyn, PA
Jacobs Levy Equity Management, Inc., Florham Park, NJ
PanAgora Asset Management, Inc., Boston, MA
Ranger Investment Management, L.P., Dallas, TX
Signia Capital Management, LLC, Spokane, WA
Tygh Capital Management, Inc., Portland, OR
RIF Multi-Style Equity Fund
Arnhold and S. Bleichroeder Advisers, LLC, New York, NY
Columbus Circle Investors, Stamford, CT
DePrince, Race & Zollo, Inc., Winter Park, FL
Institutional Capital LLC, Chicago, IL
Jacobs Levy Equity Management, Inc., Florham Park, NJ
Montag & Caldwell, Inc., Atlanta, GA
Suffolk Capital Management, LLC, New York, NY
Turner Investment Partners, Inc., Berwyn, PA
RIC Russell U.S. Quantitative Equity Fund
Aronson+Johnson+Ortiz, LP, Philadelphia, PA
Franklin Portfolio Associates, LLC, Boston, MA
Goldman Sachs Asset Management, L.P., New York, NY
INTECH Investment Management, LLC, West Palm Beach, FL
Jacobs Levy Equity Management, Inc., Florham Park, NJ
RIF Real Estate Securities Fund
AEW Management and Advisors, L.P., Boston, MA
Cohen & Steers Capital Management, Inc., New York, NY
Heitman Real Estate Securities LLC, Chicago, IL
INVESCO Institutional (N.A.), Inc. which acts as a money manager to the Fund through its INVESCO Real Estate division, Dallas, TX
RREEF America L.L.C., Chicago, IL
RIC Russell Emerging Markets Fund
AllianceBernstein L.P., New York, NY
Arrowstreet Capital, Limited Partnership, Boston, MA
Genesis Asset Managers, LLP, London, United Kingdom
Harding, Loevner LLC, Somerville, NJ
T. Rowe Price International, Inc., Baltimore, MD
UBS Global Asset Management (Americas) Inc., Chicago, IL
RIC Russell Global Equity Fund
ClariVest Asset Management LLC, San Diego, CA
Gartmore Global Partners, London, United Kingdom
Harris Associates, L.P., Chicago, IL
Tradewinds Global Investors, LLC, Los Angeles, CA
T. Rowe Price International, Inc., Baltimore, MD
RIF Non-U.S. Fund
Altrinsic Global Advisors, LLC, Stamford, CT
AQR Capital Management, LLC, Greenwich, CT
MFS Institutional Advisors, Inc., Boston, MA
Wellington Management Company, LLP, Boston, MA
This report is prepared from the books and records of the Funds and is submitted for the general information of shareholders and is not authorized for distribution to prospective investors unless accompanied or preceded by an effective Prospectus. Nothing herein contained is to be considered an offer of sale or a solicitation of an offer to buy shares of Russell Investment Funds. Such offering is made only by Prospectus, which includes details as to offering price and other material information.
| | |
| Adviser, Money Managers and Service Providers | | 59 |
| | | | |
| Russell Investment Funds | | 909 A Street | | 800-787-7354 |
| | Tacoma, Washington 98402 | | Fax: 253-591-3495 |
| | | | www.russell.com |


36-08-195

2008 ANNUAL REPORT
Russell Investment Funds
DECEMBER 31, 2008
FUND
Multi-Style Equity Fund
Aggressive Equity Fund
Non-U.S. Fund
Core Bond Fund
Real Estate Securities Fund

Russell Investment Funds
Russell Investment Funds is a series investment company with nine different investment portfolios referred to as Funds. These financial statements report on five of these Funds.
Russell Investment Funds
Annual Report
December 31, 2008
Table of Contents
Russell Investment Funds
Copyright © Russell Investments 2009. All rights reserved.
Russell Investments is a Washington, USA corporation, which operates through subsidiaries worldwide and is a subsidiary of The Northwestern Mutual Life Insurance Company.
Fund objectives, risks, charges and expenses should be carefully considered before investing. A prospectus containing this and other important information must precede or accompany this material. Please read the prospectus carefully before investing.
Securities products and services offered through Russell Financial Services, Inc. (effective June 2, 2008, the name changed from Russell Fund Distributors, Inc.), member FINRA, part of Russell Investments.
Indices and benchmarks are unmanaged and cannot be invested in directly. Returns represent past performance, are not a guarantee of future performance, and are not indicative of any specific investment. Index return information is provided by vendors and although deemed reliable, is not guaranteed by Russell Investments or its affiliates.
Russell Investments is the owner of the trademarks, service marks, and copyrights related to its respective indexes.
Performance quoted represents past performance and does not guarantee future results. The investment return and principal value of an investment will fluctuate so that shares, when redeemed, may be worth more or less than their original cost. Current performance may be lower or higher than the performance data quoted.
To Our Shareholders
We are pleased to provide you with the Russell Investment Funds 2008 Annual Report. It includes portfolio management discussions and fund-specific details that will give you an in-depth understanding of fund performance for the fiscal year ended December 31, 2008.
It would be an understatement to say that 2008 has been a difficult year and the market crisis of the past couple of months has defied all predictions. Virtually no sector of the financial industry or the economy has been spared.
All of us at Russell want you to know that we are sensitive to investor concerns. While market events have impacted the performance of the funds, we believe that investors are well-served by remaining focused on long-term disciplined investing in well-diversified, asset allocated portfolios.
The Russell Investments team has years of experience in managing people’s money through various market cycles, trends and turnarounds. As always, we are monitoring our investment managers closely to ensure their adherence to their long-term strategies despite the recent disruptions.
As we all collectively weather this storm, we believe now is the perfect time for you to talk with your financial advisor to ensure that your portfolio remains aligned with your long term goals.
Each and every day we strive to improve financial security for people. We will not waiver in that commitment and sincerely appreciate your continued support.
Best regards,

Greg Stark
Chief Executive Officer, Chairman and President
Russell Investment Management Company
Russell Investment Funds
Market Summary as of December 31, 2008 (Unaudited)
U.S. Equity Markets
For the fiscal year ending December 31, 2008, U.S. equity markets were remarkably weak, with the broad market Russell 3000® Index posting a 37.3% drop amid the worst financial crisis in almost a century. Major bankruptcies, the freezing of credit markets, and the widespread global recession fears which ensued — particularly during the third quarter and first half of the fourth quarter — drove investors to sell riskier assets as fear and panic pervaded the market.
The economic crisis stemmed from issues in the financial sector. The U.S. housing market stood at the center of the financial sector’s problems. The housing slowdown that began in the summer of 2006 and continued in 2007 intensified throughout this fiscal year and led to rising loan default rates and home foreclosures which, in turn, led to further housing weakness. As home prices dropped and default rates increased, the value of derivative instruments, such as mortgage-backed securities, whose values were based on these mortgages, plummeted. This forced banks to take massive write-downs of book values as required by mark-to-market accounting. With the lack of certainty about the real book value of assets on the balance sheets of banks, banks have been unable and/or hesitant to lend funds to other banks. Despite aggressive interest rate cuts by the Federal Reserve Board (the “Federal Reserve”), which took the Federal Funds rate from 5.25% (in third quarter 2007) to a range between 0% and 0.25% (at fiscal year end), mortgage and other lending rates did not come down as quickly as banks used the wider lending spread to offset their substantial write-downs on book values. Over the last month and a half of the year, however, these rates did start to drop sharply. In addition to higher interest rates, banks having stricter lending standards had a profound impact on the availability of affordable credit for potential homebuyers, small businesses, and other borrowers.
Due to write-downs, dwindling capital bases and a crisis of confidence in their businesses, several large banks, brokers, mortgage companies and insurance companies filed for bankruptcy, were seized by the federal government and resold, or were bailed out by the government during the fiscal year, with the most notable ones being Countrywide Financial, Bear Stearns, IndyMac Bancorp, Lehman Brothers, Federal National Mortgage Association (Fannie Mae), Federal Home Loan Mortgage Corporation (Freddie Mac), American International Group (AIG), Washington Mutual and Wachovia. Amid concerns of additional bankruptcies and uncertainty surrounding which institutions may be bailed out by the government, the fear-driven environment has persisted. In addition, there have been a number of problems at hedge funds, leading to massive deleveraging, or forced selling of assets, in order to meet client redemptions. This forced selling of assets has put severe downward pressure on many securities, particularly the highly-liquid larger cap U.S. stocks, regardless of those securities’ fundamentals.
After more than four years of strong growth, corporate profits had dipped fairly sharply by the end of 2008, especially in the financial services sector. The growth rate of gross domestic product also fell, although it stayed marginally positive until the third quarter report which showed a contraction of 0.5%, the worst since the 2001 recession. There was significant deterioration since then, as fourth quarter GDP estimates are -4.2% on average. A significant reduction in consumer spending had the most substantial negative impact on the GDP number, as consumers became fearful due to rising unemployment levels, declining home values and increased difficulty in getting loans. The Consumer Confidence Index released by the Conference Board decreased to 38 in October — the lowest value in the history of the Index (started in February 1967). It increased slightly in November, before dropping back to the all-time low of 38 in December. The first half of the year also featured the negative impact of higher energy prices on consumer spending. Oil prices reached $147/barrel in mid-July before dropping sharply to below $40/barrel in December.
Although the domestic economy slowed during the fiscal year, some segments of the U.S. equity market were helped in the first half of the year by strong exports to faster-growing, developing, non-U.S. economies. With approximately 40% of U.S. corporations’ revenues derived from international customers, the declining U.S. dollar in the first half of 2008 provided increased demand for U.S. products abroad. During the second half of the year, however, the U.S. dollar rallied and the global economy slowed considerably. After being rewarded in the first half of 2008, exposure to companies tied to the global economy underwent a strong reversal that began in July 2008 and has been swift and dramatic. Higher valuation cyclical (more linked to the economic cycle) companies and those with more debt on their balance sheets were among the most negatively impacted over the course of the year. Companies that have high forecasted growth rates have also been hit hard as investors have become less confident that these growth rates can be sustained going forward.
Russell Investment Funds
In the wake of these powerful macroeconomic forces, the fiscal year presented a very difficult active management environment which was marked by three distinct themes: 1) largely indiscriminate selling of U.S. stocks by panic-driven, risk-averse investors concerned first about a U.S. recession and then about a global recession, 2) intense selling of financial stocks for a majority of the period, and 3) the strength of global companies for roughly the first half of the fiscal year as multinational companies with exposure to developing markets outpaced domestically-driven companies and commodity-related companies (especially energy) outperformed the general market by a wide margin.
The weakening of the global economy over the last half of the year caused oil prices to fall from their record highs and led the other energy sector to sell off sharply. Over the course of the year, the worst performing sectors in the Russell 3000® Index were other energy -53.6%, financial services -51.1%, the other sector (which is dominated by GE and contains other large conglomerates, (-50.9%), and materials & processing -47.3%. Meanwhile, the best performing sectors in the Russell 3000® Index were those that are considered to be more defensive. The slower-growing, less economically-sensitive consumer staples sector was the best relative performer -17.7%, followed by integrated oils -21.7%, health care -22.4%, and utilities -29%.
Weakness was experienced across investment styles as well as the capitalization spectrum. While both the growth and value investment styles were down substantially, value outperformed growth in the small cap segment (Russell 2000® Value -28.9%, Russell 2000® Growth -38.5%) and to a lesser degree in the large cap segment (Russell 1000® Value -36.9%, Russell 1000® Growth -38.4%). In general, small cap stocks outperformed large caps (-33.8% and -37.6% for the Russell 2000® Index and Russell 1000® Index, respectively). Midcap and microcap stocks underperformed by the widest margins with the Russell Midcap® Index down 41.5%, and the Russell Microcap® Index down 39.8%.
During 2008, the market environment was largely hostile for active management as investors sold stocks regardless of fundamentals, the basic determinants of a stock’s value. Small cap fund managers had the most difficult time relative to their benchmark. Growth managers across the capitalization spectrum also struggled as the shift away from higher growth stocks came quickly and sharply. Core, or market-oriented, managers struggled less than style-focused managers in fiscal year 2008. The Lipper® Small Cap Core Funds Average trailed the Russell 2000® Index by 2.7%, the Lipper® Small Cap Growth Funds Average underperformed the Russell 2000® Growth Index by 3.6% and the Lipper® Small Cap Value Funds Average underperformed the Russell 2000® Value Index by 4.9%. The Lipper® Large Cap Core Funds Average outperformed the Russell 1000® Index by 0.1%, the Lipper® Large Cap Growth Funds Average underperformed the Russell 1000® Growth Index by 1.8% and the Lipper® Large Cap Value Funds Average underperformed the Russell 1000® Value Index by 0.6%.
Real Estate Securities Market
For the fiscal year ending December 31, 2008, U.S. real estate investment trusts (REITs) generated a 37.7% loss, as measured by the FTSE NAREIT Equity Index (Index). During this period, REITs performed slightly better than the broader equity market, which finished down 37.3% as measured by the Russell 3000 Index. The negative REIT performance was accompanied by an unprecedented amount of volatility during the period. Not only were monthly returns erratic, demonstrated by the worst and best monthly returns in the history of the Index occurring in October -31.7% and December 16.4%, respectively, but the largest percentage gain and loss achieved in a single day also both occurred during the year.
Following the sharp decline in the commercial mortgage-backed securities market and escalating problems in the credit market, investors began 2008 more risk averse. As recessionary fears began to emerge, the Federal Reserve became active in an attempt to stave off concerns of a recession by cutting rates aggressively, twice in January alone, and injecting liquidity into the financial markets through a variety of initiatives. First and second quarter REIT earnings held up well, although many companies took the opportunity to revise 2009 estimates downwards.
By September 2008, consumer spending had slowed, the unemployment rate was climbing and both corporate and consumer credit markets remained tight. The collapse of Lehman Brothers Holdings Inc. on September 15 sparked panic within the financial markets and REITs were heavily sold off over the ensuing weeks. Mirroring the broader equity market, REITs traded down sharply through October and most of November. A marked change in investor sentiment occurred in December as investors became less defensive and REITs staged a modest recovery as the year closed.
An overriding theme during the year was the elevated correlation between REITs and the financial services sector of the broader equity market. This is due to the fact that most broad equity indexes include REITs in the financial services sector. This weighed heavily on REIT performance during the period, as many general equity investors avoided financial services stocks and other investors took short positions in individual stocks and exchange traded funds in the financial
Russell Investment Funds
services sector. This was also a contributing factor to the exceptionally high volatility observed in the REIT market during the fiscal year.
Another key trend during the year was a flight towards quality REIT names, with the market especially rewarding companies that have made a concerted effort to mitigate risk. Companies with the lowest leverage levels, limited near term refinancing needs and limited development pipelines held up the best. Neither dividend yield nor market capitalization appeared to be contributing factors to differences in individual company performance.
During the year, returns were disappointing across all property sectors. The poorest performing sectors were industrial and regional malls. Leverage ratios for the industrial and regional malls companies tend to be higher than the overall REIT universe, which has negatively impacted those stocks. In addition, meaningful development pipelines in the leading industrial companies have put added pressure on earnings forecasts due to weaker leasing market conditions. Two of the better performing property sectors were self storage and health care. Due to the stable nature of the cash flows embedded in many health care leases, investors sought out this defensive sector given the slowing economy. The self storage sector is generally driven by the performance of one company that dominates the sector, Public Storage, which was one of the few stocks to post a positive return for the year. Public Storage held up well due to its strong balance sheet, including minimal leverage and high levels of cash.
The U.S. REIT market outperformed relative to the international real estate securities market by a wide margin during the fiscal year. The largest price correction occurred in the Asia Pacific region, with smaller corrections taking place in Continental Europe and the United Kingdom. While the effects of the global economic slowdown and credit crisis have spread to the other regions, the U.S. REIT market has fared relatively better, mirroring trends in the broader global equity markets.
Non-U.S. Developed Equity Markets
Non-U.S. developed stocks fell 43.38% as measured by the MSCI EAFE® Index for the fiscal year ended December 31, 2008. Appreciation of the U.S. dollar relative to foreign currencies, mainly as a result of the flight to safety in the second half of the fiscal year ended, exacerbated already weak non-U.S. equity returns. In local currencies, the MSCI EAFE® Index fell 40.27% over the 12-month period.
The market struggled under increasing concern over the health of the global financial system. While these concerns affected markets for nearly the full 12 months, most of the decline in equity values came in September and October 2008, as several prominent financial companies in the U.S. and Europe encountered financial distress. In nearly all cases, government “bailouts” were necessary for these companies to avoid bankruptcy.
The additional impact of already declining global economic growth increasingly weighed on markets during the period. Expectations for global economic growth were revised downwards throughout the year. The latter part of the fiscal year experienced contraction in economic output in Europe and Asia. Output growth of 5% in 2007 slowed sharply for 2008 with abbreviated expectations for growth in developed economies in 2009.
The change in market conditions was evident in a marked increase in market volatility as investors’ complacency towards risk was quickly replaced by acute risk aversion. Stocks with prices most directly tied to high, long-term growth prospects suffered some of the steepest declines, as investors doubted the ability of these companies to post strong growth in a decelerating economic environment. However, due to the sharp declines of financials, the largest sector of the value index, value lagged growth by 1.39% in the period (the MCSI EAFE Growth Index lost 42.70% and the MSCI EAFE Value Index lost 44.09%).
Market sectors most leveraged to global economic growth or in the nexus of the financial sector meltdown were the most severely impacted, though no areas of the market were immune. Financials ended the 12-month period down 55.21% (as measured by the MSCI EAFE Index financials sector grouping). The strong gains of materials early in the period were quickly reversed. The sector ended the period down nearly 53.02% as measured by the MSCI EAFE materials sector grouping. Energy stocks also fell sharply as the price of a barrel of oil fell from a high of more than $145 to below $36. However, the sector’s one-year stock price decline of 38.18% (as measured by the MSCI EAFE energy sector) was better than all but the traditionally defensive sectors. Among the defensive sectors of the market, health care, led by pharmaceutical stocks, held up best with a decline of 18.95% as measured by the MSCI EAFE health care sector. Utilities and consumer staples, down 28.16% and 31.33% as measured by the MSCI EAFE utilities and MSCI EAFE consumer staples sector groupings, respectively, were the next best performers. Sector groupings are based on the Global Industry Classification Standard definitions.
Russell Investment Funds
Regional results were generally tied to sensitivity to global economic conditions. The MSCI Pacific ex-Japan® Index declined the most, down 50.50%. MSCI Europe ex-United Kingdom® Index fell 45.54%, while the MSCI United Kingdom® Index fell 48.34%. In all three regions, currency impact had a pronounced impact on returns with the regions down 42.17%, 43.24%, and 28.48%, respectively, in local currencies. MSCI Japan® Index fell 42.56% in yen, but had one of the few currencies that managed to appreciate versus the U.S. dollar and fell only 29.21% in U.S. Dollars.
Emerging Markets
During 2008, the MSCI Emerging Markets Index (“Index”) declined 53.18%, the biggest calendar year decline in the history of the asset class with large return dispersions across sectors and countries. The turmoil in the world’s financial system meant increasing risk aversion, growing macro risks and heightened levels of volatility and dispersion across countries, sectors and currencies. Emerging Markets in general may be better positioned and more resilient to a downturn than developed economies, however, as the crisis changed from financial to economic, emerging markets faced massive asset de-leveraging and indiscriminate selling as investors adopted a zero tolerance to risk. Price momentum (i.e. stocks exhibiting trending relative price appreciation) benefited from the continued rally of commodity-related sectors through the latter part of 2007 and well into 2008 but this reversed as global equity markets began falling sharply. The faltering global economy and the steep pull-back in commodity prices affected cyclical areas of the market including industrials, materials and energy sectors while defensive sectors such as healthcare, consumer staples and utilities were relative safe havens during the period. From a country perspective, smaller markets in general held up relatively better than the larger markets. In addition to the weak equity returns, most emerging markets currencies depreciated against the U.S. Dollar with some, such as the South African Rand, Korean Won, Turkish Lira and Brazilian Real, losing in excess of 30% over the course of the year as investors fled to quality and more liquid currencies.
In terms of regions, Latin America was the top performer, down 51.28% (as measured by the MSCI EM Latin America Index), supported by the relative outperformance from Mexico and the smaller Latin countries. The Asia region (-52.77% as measured by the MSCI EM Asia Index) finished behind Latin America but ahead of the broader market. The Europe, Middle East and Africa region (-55.60% as measured by the MSCI EM Europe, Middle East and Africa Index) underperformed the broader market due in large part to the significant underperformance from Russia. The BRIC (Brazil, Russia, India and China) economies, with the exception of China, underperformed the broader Index. China held up reasonably well over the period due to favorable monetary and fiscal policies during the latter half of the year in an effort to shore up its slowing economy. Other notable relative underperformers included Pakistan (-74.05% as measured by the MSCI Pakistan Index) and Turkey (-62.10% as measured by the MSCI Turkey Index).
U.S. Fixed Income Markets
The Barclays Capital U.S. Aggregate Bond Index, a broad measure of U.S. investment grade fixed income securities, returned 5.24% for the year ended December 31, 2008. Similar to the prior year, the index and its major sectors trailed equivalent-duration U.S. Treasuries, as the subprime mortgage crisis that started in the summer of 2007 deepened and developed into a severe liquidity crisis, the size and scope of which had not been seen since the U.S. Great Depression of the 1930s. During 2008, investors moved their capital away from riskier investments to the safest possible investments (i.e., U.S. Treasuries), continuing the “flight to quality” trend started in the prior period.
Throughout 2008, in an effort to deal with credit market illiquidity and a slowing economy, the Federal Reserve lowered the target Federal Funds rate eight times, including two non-scheduled “surprise” cuts of 0.75% in January and 0.50% in October. The target rate started the year at 4.25% and ended at a 0.00% to 0.25% range after the eighth rate cut on December 16, 2008.
The downward shift in the yield curve started in 2007 and continued in earnest in 2008, with the curve “steepening” significantly below the 10-year mark; i.e., yields on shorter-maturity Treasuries declined by a greater degree than longer-maturity Treasuries, resulting in a steeper, upward sloping curve. The change was driven by the Federal Reserve’s lowering of rates (affecting the short end) and investors’ increasing demand for safe haven U.S. Treasuries (driving down longer-maturity yields). In 2008, yields on 2-year Treasuries declined by 2.28% to 0.76% while 10-year Treasuries declined by 1.81% to 2.21%.
The subprime mortgage crisis and deflating housing market were still major issues throughout the year. Home price depreciation continued to accelerate. By the end of October, the average U.S. national home price as tracked by the S&P/Case-Shiller Composite 20 Index, had declined 18% from the end of 2007, reaching a level that was down 23% from its July 2006 peak. Subprime mortgage foreclosures increased from 8.65% at the end of December 2007 to 12.55% at the end of September 2008, the most recent available data from the Mortgage Bankers Association. Total foreclosures increased from 2.04% to 2.97% during the same period. Writedowns on the values of mortgages had a large negative
Russell Investment Funds
impact on bank balance sheets. During the year, writedowns at financial institutions world-wide amounted to approximately $930.3 billion, bringing total writedowns since the start of the subprime crisis to approximately $997.4 billion.
During the early months of 2008 the market continued its downward trend, which was capped in mid-March by Bear Stearns receiving emergency funding from the Federal Reserve and JPMorgan Chase as a three-day run on the bank depleted its cash reserves. Two days later JPMorgan Chase acquired Bear Stearns for seven percent of its market value in a sale brokered by the Federal Reserve and the U.S. Department of the Treasury (U.S. Treasury). Investors took this as a sign that the U.S. government would stand behind financial institutions and credit markets rallied for the next few months.
During the first part of the year, the U.S. government had become increasingly concerned that the credit crisis would significantly slow the U.S. economy — particularly the spending of consumers, who account for approximately two-thirds of GDP. In April, the U.S. Internal Revenue Service started distributing tax rebates as part of a $168 billion economic stimulus plan.
However, markets continued to weaken as illiquidity reached extreme levels and the financial crisis became global in scope. In July, IndyMac Bancorp, the then-second-biggest independent U.S. mortgage lender, was seized by federal regulators after a run by depositors depleted its cash. In August, Commerzbank AG agreed to buy Allianz SE’s Dresdner Bank for 9.8 billion euros in Germany’s biggest banking takeover in three years.
September started with the U.S. government seizing control of Fannie Mae and Freddie Mac, the largest U.S. mortgage-finance companies. In the middle of the month, the U.S. government did not arrange a deal or otherwise bail out Lehman Brothers, and the 158-year old firm filed the largest bankruptcy in U.S. history. This was followed by the bankruptcy of 119-year old Washington Mutual. AIG accepted an $85 billion loan from the Federal Reserve to avert what would have been the worst financial collapse in history, with the U.S. government taking a substantial ownership stake in AIG.
In the same month, the investment banking business model fundamentally changed, with Goldman Sachs and Morgan Stanley receiving approval to become deposit-taking commercial banks regulated by the Federal Reserve, as tight credit markets forced Wall Street’s two remaining independent investment banks to widen their sources of funding. Similar events occurred in Europe and throughout the world, with large financial institutions either merging or with governments providing support in return for equity stakes.
September finally ended with the U.S. Treasury proposing the Financial Market Rescue Bill, including the Troubled Asset Relief Program (TARP), which authorized the U.S. Treasury to spend up to $700 billion to buy mortgages and other distressed assets. The House initially rejected the bill, but subsequently passed it. The bill was signed into law in early October.
The events of September contributed to the extreme market illiquidity in October, evidenced by spikes in overnight and three-month LIBOR (the rates at which banks lend to one another). The Federal Reserve took significant steps to improve liquidity in the short duration markets, which included the creation of the Commercial Paper Funding Facility (CPFF) and the Money Market Investor Funding Facility (MMIFF).
In November, the U.S. Treasury gave additional support to AIG by announcing the purchase of $40 billion in new preferred stock. The U.S. Treasury then guaranteed $306 billion in residential and commercial mortgage-backed securities of Citi® in exchange for $7 billion in preferred stock. In addition, the U.S. Treasury purchased another $20 billion in preferred stocks from Citi. Shortly thereafter, the Government Sponsored Enterprise (GSE) Debt and Mortgage-Backed Security Purchase Program was announced stating that the Federal Reserve will buy $100 billion in Fannie Mae, Freddie Mac and the Federal Home Loan Bank debentures and $500 billion in agency mortgage-backed securities. Simultaneously, the Term Asset-Backed Securities Loan Facility (TALF) was announced by the U.S. Treasury offering to provide $200 billion in three-year loans to U.S. companies who can provide high quality AAA-rated auto loans, student loans, credit card loans or small business loans as collateral.
This trend continued in December as Congress agreed to provide $13.4 billion in short term loans to General Motors and $4 billion to Chrysler in an effort to aid the suffering auto industry.
December ended on an up note with a majority of fixed income sectors outperforming equivalent-duration Treasuries. Most notably, the commercial mortgage-backed securities sector (CMBS) returned 16.98% (15.14% above equivalent-duration Treasuries) during the month. The year ended with the Barclays Capital U.S. Aggregate Bond Index returning 5.24%, underperforming by 7.10% U.S. Treasuries.
(This page intentionally left blank)
Russell Investment Funds
Multi-Style Equity Fund
Portfolio Management Discussion and Analysis — December 31, 2008 (Unaudited)
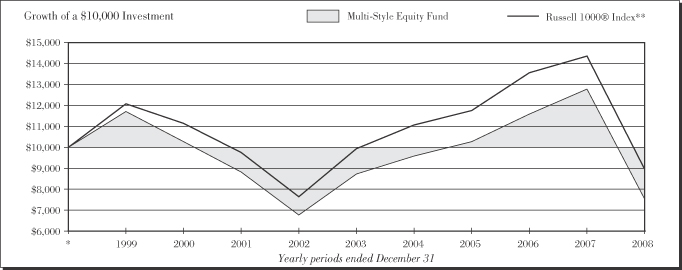
| | | |
|
| Multi-Style Equity Fund | |
| | | Total
Return | |
1 Year | | (41.15 | )% |
5 Years | | (2.92 | )%§ |
10 Years | | (2.80 | )%§ |
| | | |
|
| Russell 1000® Index ** | |
| | | Total
Return | |
1 Year | | (37.60 | )% |
5 Years | | (2.04 | )%§ |
10 Years | | (1.09 | )%§ |
| * | | Assumes initial investment on January 1, 1999. |
** | | Russell 1000® Index includes the 1,000 largest companies in the Russell 3000® Index. The Russell 1000® Index represents the universe of stocks from which most active money managers typically select. The Russell 1000® Index return reflects adjustments from income dividends and capital gain distributions reinvested as of the ex-dividend dates. |
The performance shown in this section does not reflect any Insurance Company Separate Account or Policy Charges. Performance is historical and assumes reinvestment of all dividends and capital gains. Investment return and principal value will fluctuate so that an investor’s shares, when redeemed, may be worth more or less than when purchased. Past performance is not indicative of future results.
| | |
| 10 | | Multi-Style Equity Fund |
Russell Investment Funds
Multi-Style Equity Fund
Portfolio Management Discussion — December 31, 2008 (Unaudited)
The Multi-Style Equity Fund (the “Fund”) allocates most of its assets among multiple money managers. Russell Investment Management Company (“RIMCo”), as the Fund’s advisor, may change the allocation of the Fund’s assets among money managers at any time. An exemptive order from the Securities and Exchange Commission (SEC) permits RIMCo to engage or terminate a money manager at any time, subject to the approval by the Fund’s Board without a shareholder vote. Pursuant to the terms of the exemptive order, the Fund is required to notify its shareholders within 60 days of when a money manager begins providing services. The Fund currently has eight money managers.
What is the Fund’s investment objective?
The Fund seeks to provide long term capital growth.
How did the Fund perform relative to its benchmark for the fiscal year ended December 31, 2008?
For the fiscal year ended December 31, 2008, the Multi-Style Equity Fund lost 41.15%. This compared to the Russell 1000® Index, which lost 37.60% during the same period. The Fund’s performance includes operating expenses, whereas Index returns are unmanaged and do not include expenses of any kind.
For the year ended December 31, 2008, the Lipper® Large-Cap Core Funds (VIP) Average lost 38.29%. This result serves as a peer comparison and is expressed net of operating expenses.
RIMCo may assign a money manager a specific style or capitalization benchmark other than the Fund’s index. However, the Fund’s primary index remains the benchmark for the Fund and is representative of the aggregate of each money manager’s benchmark index.
How did the market conditions described in the Market Summary report affect the Fund’s performance?
During the year, investors sought relative stability and safety found in more liquid stocks and avoided any stocks perceived as risky. Investors sold riskier assets as fear and panic took over the markets, which put severe downward pressure on many stocks, particularly the highly liquid larger cap U.S. stocks, regardless of those stocks’ fundamentals.
The consumer staples sector was the strongest performing sector in the Russell 1000 Index for the period, losing 17.57%, where solid, well-known household names, such as Proctor & Gamble, Colgate and Clorox were seen as safe havens. Integrated oils and health care stocks also performed well compared to other sectors, losing 21.67% and 22.40%, respectively. Other energy, which had been a strong performer for the first half of 2008, fell off sharply in the second half of the year and ended the year down -53.64%, as energy equipment and coal producers were hit hard by the drop in oil prices. Financial services stocks bore the brunt of investor apprehension as write-downs, dwindling capital and a crisis of investor confidence led to the bankruptcy, government seizure and rescue packages for many financial institutions. This sector ended the year down 51.09%.
These unprecedented events created market conditions which were very difficult for active managers in general and for the Fund. The Fund was positioned toward attractively valued companies with higher growth rates, higher beta (beta is the volatility of a given security compared to the volatility of the market as a whole) and lower yielding stocks. This positioning was not rewarded by the market.
The Fund’s strategy of being fully invested and exposing cash reserves to the performance of appropriate markets by purchasing equity securities and/or derivatives was a drag on performance relative to peers that held larger cash positions as the Russell 1000® Index was down over 37%.
How did the investment strategies and techniques employed by the Fund and its money managers affect its performance?
Over the past year, the Fund maintained its positioning towards companies with above-average growth rates and lower yields that are selling at attractive valuations. This positioning was not rewarded in this period where investors were driven by fear and sold stocks regardless of attractive fundamentals.
The Fund’s underperformance resulted from a combination of sector weighting decisions and stock selection. Underweights to both the integrated oils and utilities sectors detracted from returns as those sectors performed better. Weak stock selection in the consumer discretionary, technology, integrated oils and health care sectors was also detrimental to returns.
The Fund’s managers had a difficult time in the risk adverse market environment. Six of the eight managers underperformed their respective style benchmarks, with one manager essentially even with its index. Higher-growth and momentum manager, Turner Investment Partners, Inc.’s more aggressive positioning was not rewarded in this environment, which was to be expected in this market environment. Weak selection in the consumer discretionary and technology sectors led Turner to significantly trail its benchmark, the Russell 1000® Growth Index. Growth manager, Columbus Circle Investors, also struggled in this market environment. Given the economic environment, Columbus’ move to reduce the cyclicality and high level of forecast growth within its portfolio moderated the level of its underperformance in the period. Columbus’ holdings in technology, health care and financial services were the main drivers of its underperformance. Montag & Caldwell, Inc. is a larger-cap growth manager with a high quality consistent growth focus. As expected, Montag performed better in this difficult environment and provided some downside protection. Market-oriented manager, Suffolk Capital Management, LLC also detracted from results as its focus on companies with positive earnings estimate revisions became less effective due to the dramatic decline in companies experiencing such revisions. Suffolk’s performance lagged primarily from an overweight to the financial services sector and an underweight to integrated oils, as well as from stock selection within those sectors.
RIMCo currently employs a “select holdings” strategy for a portion of the Fund’s assets that RIMCo determines not to
| | |
Multi-Style Equity Fund | | 11 |
Russell Investment Funds
Multi-Style Equity Fund
Portfolio Management Discussion — December 31, 2008 (Unaudited)
allocate to the money managers. Pursuant to this strategy, RIMCo analyzes the holdings of the Fund’s money managers in their Fund segments to identify particular stocks that have been selected by multiple money managers. RIMCo uses a proprietary model to rank these stocks. Based on this ranking, RIMCo purchases additional shares of certain stocks for the Fund. The strategy is designed to increase the Fund’s exposure to stocks that are viewed as attractive by multiple money managers. Over the period, the strategy outperformed as it had exposure to many of the stocks that were perceived by investors to be less risky.
At the stock selection level, the Fund benefited from overweights to Gilead, McDonald’s and Qualcomm. However, a significant underweight to Exxon Mobil was the largest single stock detractor from performance over the one year period. Additionally, overweights to Morgan Stanley, Halliburton and Google were detrimental to returns.
The Fund’s performance shown throughout this report was based on valuations calculated in accordance with Generally Accepted Accounting Principles (GAAP) and in accordance with a newly effective accounting statement (SFAS 157), reflects the December 31, 2008 market value of the pooled investment vehicle in which the Fund invested its cash collateral received in securities lending transactions. This market value is lower than the vehicle’s amortized cost per unit. This had a negative impact on the Fund’s benchmark relative performance.
Describe any changes to the Fund’s structure or the money manager line-up.
There were no changes to the Fund’s structure or money manager line-up during the year.
| | |
| |
Money Managers as of
December 31, 2008 | | Styles |
| Arnhold and S. Bleichroeder Advisers, LLC | | Market-Oriented |
| Columbus Circle Investors | | Growth |
| DePrince, Race & Zollo, Inc. | | Value |
| Institutional Capital LLC | | Value |
| Jacobs Levy Equity Management, Inc. | | Value |
| Montag & Caldwell, Inc. | | Growth |
| Suffolk Capital Management, LLC | | Market-Oriented |
| Turner Investment Partners, Inc. | | Growth |
The views expressed in this report reflect those of the portfolio managers only through the end of the period covered by the report. These views do not necessarily represent the views of RIMCo, or any other person in RIMCo or any other affiliated organization. These views are subject to change at any time based upon market conditions or other events, and RIMCo disclaims any responsibility to update the views contained herein. These views should not be relied on as investment advice and, because investment decisions for Russell Investment Funds (RIF) are based on numerous factors, should not be relied on as an indication of investment decisions of any RIF Fund.
| | |
| 12 | | Multi-Style Equity Fund |
Russell Investment Funds
Multi-Style Equity Fund
Shareholder Expense Example — December 31, 2008 (Unaudited)
Fund Expenses
The following disclosure provides important information regarding each Fund’s Expense Example, which appears on each Fund’s individual page in this Annual Report. Please refer to this information when reviewing the Expense Example for a Fund.
Example
As a shareholder of the Fund, you incur two types of costs: (1) transaction costs, and (2) ongoing costs, including management fees and other Fund expenses. The Example is intended to help you understand your ongoing costs (in dollars) of investing in the Fund and to compare these costs with the ongoing costs of investing in other mutual funds. The Example is based on an investment of $1,000 invested at the beginning of the period and held for the entire period indicated, which for this Fund is from July 1, 2008 to December 31, 2008.
Actual Expenses
The information in the table under the heading “Actual Performance” provides information about actual account values and actual expenses. You may use the information in this column, together with the amount you invested, to estimate the expenses that you paid over the period. Simply divide your account value by $1,000 (for example, an $8,600 account value divided by $1,000 = 8.6), then multiply the result by the number in the first column in the row entitled “Expenses Paid During Period” to estimate the expenses you paid on your account during this period.
Hypothetical Example for Comparison Purposes
The information in the table under the heading “Hypothetical Performance (5% return before expenses)” provides information about hypothetical account values and hypothetical expenses
based on the Fund’s actual expense ratio and an assumed rate of return of 5% per year before expenses, which is not the Fund’s actual return. The hypothetical account values and expenses may not be used to estimate the actual ending account balance or expenses you paid for the period. You may use this information to compare the ongoing costs of investing in the Fund and other funds. To do so, compare this 5% hypothetical example with the 5% hypothetical examples that appear in the shareholder reports of other funds.
Please note that the expenses shown in the table are meant to highlight your ongoing costs only and do not reflect any transactional costs. Therefore, the information under the heading “Hypothetical Performance (5% return before expenses)” is useful in comparing ongoing costs only, and will not help you determine the relative total costs of owning different funds. In addition, if these transactional costs were included, your costs would have been higher. The fee and expenses shown in this section do not reflect any Insurance Company Separate Account or Policy Charges.
| | | | | | |
| | | Actual
Performance | | Hypothetical
Performance
(5% return
before expenses) |
| | | | | | |
Beginning Account Value | | | | | | |
July 1, 2008 | | $ | 1,000.00 | | $ | 1,000.00 |
Ending Account Value | | | | | | |
December 31, 2008 | | $ | 664.53 | | $ | 1,020.76 |
Expenses Paid During Period* | | $ | 3.64 | | $ | 4.42 |
| * | Expenses are equal to the Fund’s annualized expense ratio of 0.87% (representing the one-half year period annualized), multiplied by the average account value over the period, multiplied by 184/366 (to reflect the one-half year period). Reflects amounts waived and/or reimbursed. Without the waiver and/or reimbursement, expenses would have been higher. |
| | |
| Multi-Style Equity Fund | | 13 |
Russell Investment Funds
Multi-Style Equity Fund
Schedule of Investments — December 31, 2008
Amounts in thousands (except share amounts)
| | | | |
| | | Principal Amount ($)
or Shares | | Market
Value
$ |
| | | | |
| Common Stocks - 90.0% | | | | |
| Auto and Transportation - 1.6% | | |
Arkansas Best Corp. (Ñ) | | 2,600 | | 78 |
Autoliv, Inc. | | 6,700 | | 144 |
Con-way, Inc. (Ñ) | | 3,500 | | 93 |
CSX Corp. | | 31,950 | | 1,038 |
Delta Air Lines, Inc. (Æ) | | 70,714 | | 810 |
Old Dominion Freight Line, Inc. (Æ)(Ñ) | | 1,900 | | 54 |
Skywest, Inc. | | 5,300 | | 99 |
Toyota Motor Corp. - ADR (Ñ) | | 7,500 | | 491 |
TRW Automotive Holdings Corp. (Æ)(Ñ) | | 12,300 | | 44 |
Union Pacific Corp. (Ñ) | | 30,054 | | 1,437 |
United Parcel Service, Inc. Class B | | 7,150 | | 394 |
| | | | |
| | | | 4,682 |
| | | | |
| |
| Consumer Discretionary - 11.4% | | |
Activision Blizzard, Inc. (Æ) | | 59,060 | | 510 |
Amazon.com, Inc. (Æ)(Ñ) | | 10,000 | | 513 |
American Eagle Outfitters, Inc. (Ñ) | | 72,200 | | 676 |
AnnTaylor Stores Corp. (Æ)(Ñ) | | 8,400 | | 48 |
Apollo Group, Inc. Class A (Æ) | | 2,210 | | 169 |
AutoNation, Inc. (Æ)(Ñ) | | 13,100 | | 129 |
Avis Budget Group, Inc. (Æ) | | 13,500 | | 9 |
Black & Decker Corp. (Ñ) | | 8,900 | | 372 |
Boyd Gaming Corp. (Ñ) | | 7,300 | | 35 |
Brinker International, Inc. | | 53,200 | | 561 |
Callaway Golf Co. | | 4,900 | | 46 |
CBS Corp. Class B (Ñ) | | 88,700 | | 726 |
Clear Channel Outdoor Holdings, Inc. Class A (Æ) | | 84,978 | | 523 |
Comcast Corp. Class A | | 19,660 | | 332 |
Costco Wholesale Corp. (Ñ) | | 25,580 | | 1,343 |
DIRECTV Group, Inc. (The) (Æ) | | 40,559 | | 929 |
Eastman Kodak Co. (Ñ) | | 16,800 | | 111 |
Electronic Arts, Inc. (Æ) | | 37,700 | | 605 |
Foot Locker, Inc. | | 13,700 | | 101 |
FTI Consulting, Inc. (Æ)(Ñ) | | 4,670 | | 209 |
Gannett Co., Inc. (Ñ) | | 31,200 | | 250 |
Guess ?, Inc. | | 14,580 | | 224 |
Home Depot, Inc. | | 13,400 | | 308 |
Intercontinental Hotels Group PLC - ADR | | 30,759 | | 257 |
International Speedway Corp. Class A | | 2,300 | | 66 |
Jack in the Box, Inc. (Æ)(Ñ) | | 1,400 | | 31 |
Jarden Corp. (Æ)(Ñ) | | 4,700 | | 54 |
JC Penney Co., Inc. (Ñ) | | 29,600 | | 583 |
Kimberly-Clark Corp. | | 6,240 | | 329 |
Kohl’s Corp. (Æ)(Ñ) | | 7,270 | | 263 |
Limited Brands, Inc. | | 64,200 | | 645 |
Lowe’s Cos., Inc. | | 76,300 | | 1,642 |
Macy’s, Inc. (Ñ) | | 69,300 | | 717 |
Manpower, Inc. | | 3,600 | | 122 |
McDonald’s Corp. | | 55,100 | | 3,427 |
McGraw-Hill Cos., Inc. (The) | | 9,800 | | 227 |
Men’s Wearhouse, Inc. (The) (Ñ) | | 3,600 | | 49 |
MPS Group, Inc. (Æ) | | 7,400 | | 56 |
New York Times Co. (The) Class C (Ñ) | | 12,400 | | 91 |
Newell Rubbermaid, Inc. | | 38,200 | | 374 |
| | | | |
| | | Principal Amount ($)
or Shares | | Market
Value
$ |
News Corp. Class A | | 165,662 | | 1,506 |
Nike, Inc. Class B | | 39,401 | | 2,009 |
Office Depot, Inc. (Æ) | | 22,800 | | 68 |
OfficeMax, Inc. (Ñ) | | 67,600 | | 516 |
Regis Corp. | | 1,200 | | 17 |
Robert Half International, Inc. (Ñ) | | 12,500 | | 260 |
RR Donnelley & Sons Co. | | 33,300 | | 452 |
Staples, Inc. (Ñ) | | 20,480 | | 367 |
Starwood Hotels & Resorts Worldwide, Inc. (Ñ) | | 26,400 | | 473 |
Target Corp. (Ñ) | | 26,900 | | 929 |
United Stationers, Inc. (Æ)(Ñ) | | 2,200 | | 74 |
Urban Outfitters, Inc. (Æ)(Ñ) | | 10,330 | | 155 |
Vail Resorts, Inc. (Æ)(Ñ) | | 2,900 | | 77 |
Viacom, Inc. Class B (Æ) | | 66,800 | | 1,273 |
Wal-Mart Stores, Inc. (Ñ) | | 122,244 | | 6,853 |
Walt Disney Co. (The) (Ñ) | | 32,400 | | 735 |
Williams-Sonoma, Inc. (Ñ) | | 50,600 | | 398 |
Wyndham Worldwide Corp. | | 13,200 | | 86 |
Yum! Brands, Inc. | | 5,930 | | 187 |
| | | | |
| | | | 34,097 |
| | | | |
| | |
| Consumer Staples - 7.4% | | | | |
Chiquita Brands International, Inc. (Æ)(Ñ) | | 5,600 | | 83 |
Clorox Co. | | 16,280 | | 904 |
Coca-Cola Co. (The) (Ñ) | | 126,650 | | 5,733 |
Coca-Cola Enterprises, Inc. | | 15,200 | | 183 |
Colgate-Palmolive Co. | | 16,760 | | 1,149 |
ConAgra Foods, Inc. | | 38,400 | | 634 |
General Mills, Inc. | | 29,000 | | 1,762 |
Hershey Co. (The) (Ñ) | | 13,700 | | 476 |
Hormel Foods Corp. (Ñ) | | 4,600 | | 143 |
JM Smucker Co. (The) | | 14,524 | | 630 |
Kroger Co. (The) | | 9,300 | | 246 |
Lorillard, Inc. | | 9,500 | | 535 |
Molson Coors Brewing Co. Class B | | 21,150 | | 1,035 |
NBTY, Inc. (Æ) | | 1,500 | | 23 |
Pepsi Bottling Group, Inc. (Ñ) | | 11,000 | | 248 |
PepsiCo, Inc. | | 97,850 | | 5,359 |
Procter & Gamble Co. | | 32,940 | | 2,036 |
Sara Lee Corp. | | 29,000 | | 284 |
Spartan Stores, Inc. (Ñ) | | 2,200 | | 51 |
SUPERVALU, Inc. | | 16,000 | | 234 |
Sysco Corp. | | 7,300 | | 167 |
Tyson Foods, Inc. Class A (Ñ) | | 16,800 | | 147 |
Walgreen Co. | | 6,300 | | 155 |
| | | | |
| | | | 22,217 |
| | | | |
| | |
| Financial Services - 14.3% | | | | |
ACE, Ltd. | | 28,800 | | 1,524 |
Allied Capital Corp. (Ñ) | | 11,200 | | 30 |
Allied World Assurance Co. Holdings, Ltd. | | 2,400 | | 97 |
Allstate Corp. (The) | | 11,700 | | 383 |
American Capital, Ltd. (Ñ) | | 31,200 | | 101 |
Annaly Capital Management, Inc. (ö)(Ñ) | | 47,100 | | 748 |
Arch Capital Group, Ltd. (Æ) | | 2,200 | | 154 |
Arthur J Gallagher & Co. | | 7,100 | | 184 |
| | |
| 14 | | Multi-Style Equity Fund |
Russell Investment Funds
Multi-Style Equity Fund
Schedule of Investments, continued — December 31, 2008
Amounts in thousands (except share amounts)
| | | | |
| | | Principal Amount ($)
or Shares | | Market
Value
$ |
| | | | |
Bank of America Corp. | | 114,150 | | 1,607 |
Bank of Hawaii Corp. (Ñ) | | 5,200 | | 235 |
Bank of New York Mellon Corp. (The) | | 88,976 | | 2,521 |
BlackRock, Inc. Class A (Ñ) | | 1,630 | | 219 |
Brandywine Realty Trust (ö) | | 11,300 | | 87 |
Camden Property Trust (ö)(Ñ) | | 4,300 | | 135 |
Capital One Financial Corp. (Ñ) | | 30,700 | | 979 |
CBL & Associates Properties, Inc. (ö)(Ñ) | | 9,200 | | 60 |
Charles Schwab Corp. (The) | | 75,600 | | 1,222 |
Chubb Corp. | | 6,200 | | 316 |
Citigroup, Inc. | | 52,400 | | 352 |
CME Group, Inc. Class A (Ñ) | | 1,900 | | 395 |
CNA Financial Corp. | | 3,100 | | 51 |
Comerica, Inc. (Ñ) | | 27,300 | | 542 |
Commerce Bancshares, Inc. (Ñ) | | 3,360 | | 148 |
Conseco, Inc. (Æ)(Ñ) | | 13,800 | | 72 |
Cullen/Frost Bankers, Inc. | | 4,300 | | 218 |
Deluxe Corp. | | 5,300 | | 79 |
Developers Diversified Realty Corp. (ö)(Ñ) | | 4,500 | | 22 |
Discover Financial Services (Ñ) | | 28,900 | | 275 |
East West Bancorp, Inc. (Ñ) | | 3,100 | | 50 |
Endurance Specialty Holdings, Ltd. (Ñ) | | 5,400 | | 165 |
Federal National Mortgage Association | | 409,746 | | 311 |
Fifth Third Bancorp (Ñ) | | 77,400 | | 639 |
First American Corp. (Ñ) | | 2,700 | | 78 |
First Horizon National Corp. (Ñ) | | 14,461 | | 153 |
General Growth Properties, Inc. (ö)(Ñ) | | 36,300 | | 47 |
Goldman Sachs Group, Inc. (The) | | 4,615 | | 390 |
Hartford Financial Services Group, Inc. (Ñ) | | 38,200 | | 627 |
Hospitality Properties Trust (ö)(Ñ) | | 14,400 | | 214 |
HRPT Properties Trust (ö) | | 23,400 | | 79 |
Huntington Bancshares, Inc. (Ñ) | | 29,000 | | 222 |
Jefferies Group, Inc. (Ñ) | | 27,800 | | 391 |
Jones Lang LaSalle, Inc. (Ñ) | | 2,900 | | 80 |
JPMorgan Chase & Co. | | 157,515 | | 4,966 |
Keycorp | | 79,900 | | 681 |
Lincoln National Corp. | | 24,100 | | 454 |
M&T Bank Corp. (Ñ) | | 3,900 | | 224 |
Mack-Cali Realty Corp. (ö) | | 7,600 | | 186 |
Marsh & McLennan Cos., Inc. | | 14,400 | | 350 |
Marshall & Ilsley Corp. (Ñ) | | 37,600 | | 513 |
Mastercard, Inc. Class A (Ñ) | | 7,500 | | 1,072 |
Mercury General Corp. (Ñ) | | 16,500 | | 759 |
Merrill Lynch & Co., Inc. | | 52,000 | | 605 |
MetLife, Inc. | | 38,083 | | 1,328 |
MF Global, Ltd. (Æ)(Ñ) | | 13,000 | | 27 |
Morgan Stanley | | 72,500 | | 1,163 |
National Penn Bancshares, Inc. (Ñ) | | 8,000 | | 116 |
PartnerRe, Ltd. - ADR (Ñ) | | 5,000 | | 356 |
Piper Jaffray Cos. (Æ)(Ñ) | | 1,300 | | 52 |
PNC Financial Services Group, Inc. | | 12,900 | | 632 |
Prologis (ö)(Ñ) | | 12,700 | | 176 |
Prosperity Bancshares, Inc. (Ñ) | | 4,000 | | 118 |
Protective Life Corp. | | 27,900 | | 400 |
Prudential Financial, Inc. | | 14,600 | | 442 |
Regions Financial Corp. (Ñ) | | 66,400 | | 529 |
State Street Corp. | | 16,332 | | 642 |
| | | | |
| | | Principal Amount ($)
or Shares | | Market
Value
$ |
SunTrust Banks, Inc. (Ñ) | | 28,500 | | 842 |
T Rowe Price Group, Inc. (Ñ) | | 11,740 | | 416 |
Travelers Cos., Inc. (The) | | 25,200 | | 1,139 |
UDR, Inc. (ö)(Ñ) | | 10,800 | | 149 |
United Rentals, Inc. (Æ)(Ñ) | | 6,114 | | 56 |
Visa, Inc. (Ñ) | | 19,694 | | 1,033 |
Washington Real Estate Investment Trust (ö)(Ñ) | | 5,100 | | 144 |
Wells Fargo & Co. (Ñ) | | 164,735 | | 4,856 |
Western Union Co. (The) | | 33,500 | | 480 |
Wilmington Trust Corp. (Ñ) | | 27,100 | | 603 |
WR Berkley Corp. | | 10,200 | | 316 |
Zions Bancorporation (Ñ) | | 33,600 | | 824 |
| | | | |
| | | | 42,851 |
| | | | |
| | |
| Health Care - 14.7% | | | | |
Abbott Laboratories | | 49,967 | | 2,667 |
Aetna, Inc. | | 17,300 | | 493 |
Alexion Pharmaceuticals, Inc. (Æ)(Ñ) | | 11,440 | | 414 |
Allergan, Inc. | | 20,500 | | 827 |
AMERIGROUP Corp. Class A (Æ)(Ñ) | | 7,200 | | 213 |
AmerisourceBergen Corp. Class A | | 5,700 | | 203 |
Amgen, Inc. (Æ) | | 14,500 | | 837 |
Baxter International, Inc. | | 51,810 | | 2,776 |
Bristol-Myers Squibb Co. | | 36,500 | | 849 |
Cardinal Health, Inc. | | 3,800 | | 131 |
Centene Corp. (Æ) | | 1,900 | | 37 |
Covidien, Ltd. | | 26,770 | | 970 |
CVS Caremark Corp. | | 144,740 | | 4,160 |
Eli Lilly & Co. | | 4,000 | | 161 |
Express Scripts, Inc. Class A (Æ) | | 21,170 | | 1,164 |
Forest Laboratories, Inc. (Æ) | | 13,400 | | 341 |
Genzyme Corp. (Æ) | | 6,630 | | 440 |
Gilead Sciences, Inc. (Æ)(Ñ) | | 84,740 | | 4,334 |
Health Net, Inc. (Æ)(Ñ) | | 9,100 | | 99 |
Intuitive Surgical, Inc. (Æ)(Ñ) | | 4,800 | | 610 |
Johnson & Johnson | | 42,050 | | 2,516 |
King Pharmaceuticals, Inc. (Æ)(Ñ) | | 17,100 | | 182 |
Life Technologies Corp. (Æ)(Ñ) | | 25,200 | | 587 |
Magellan Health Services, Inc. (Æ)(Ñ) | | 3,900 | | 153 |
McKesson Corp. | | 20,100 | | 778 |
Merck & Co., Inc. | | 20,900 | | 635 |
Mylan, Inc. (Æ)(Ñ) | | 94,600 | | 936 |
Novartis AG - ADR | | 37,200 | | 1,851 |
Owens & Minor, Inc. (Ñ) | | 1,600 | | 60 |
Pfizer, Inc. | | 103,200 | | 1,828 |
Schering-Plough Corp. | | 181,057 | | 3,083 |
Sequenom, Inc. (Æ)(Ñ) | | 24,000 | | 476 |
St. Jude Medical, Inc. (Æ) | | 11,970 | | 395 |
Stericycle, Inc. (Æ)(Ñ) | | 7,880 | | 410 |
Stryker Corp. | | 24,600 | | 983 |
Thermo Fisher Scientific, Inc. (Æ) | | 46,900 | | 1,598 |
UnitedHealth Group, Inc. | | 9,000 | | 239 |
Vertex Pharmaceuticals, Inc. (Æ)(Ñ) | | 27,300 | | 829 |
WellPoint, Inc. (Æ) | | 8,100 | | 341 |
Wyeth | | 111,000 | | 4,164 |
| | | | |
| | | | 43,770 |
| | | | |
| | |
| Multi-Style Equity Fund | | 15 |
Russell Investment Funds
Multi-Style Equity Fund
Schedule of Investments, continued — December 31, 2008
Amounts in thousands (except share amounts)
| | | | |
| | | Principal Amount ($)
or Shares | | Market
Value
$ |
| | | | |
| Integrated Oils - 5.0% | | | | |
BP PLC - ADR | | 8,700 | | 407 |
Chevron Corp. | | 12,000 | | 888 |
ConocoPhillips | | 24,600 | | 1,274 |
Exxon Mobil Corp. | | 48,900 | | 3,904 |
Marathon Oil Corp. | | 110,000 | | 3,009 |
Occidental Petroleum Corp. | | 72,950 | | 4,376 |
Total SA - ADR | | 18,100 | | 1,001 |
| | | | |
| | | | 14,859 |
| | | | |
| |
| Materials and Processing - 5.8% | | |
Air Products & Chemicals, Inc. | | 25,600 | | 1,287 |
Alcoa, Inc. (Ñ) | | 50,800 | | 572 |
Archer-Daniels-Midland Co. | | 62,550 | | 1,803 |
Ashland, Inc. (Ñ) | | 35,917 | | 378 |
Avery Dennison Corp. (Ñ) | | 15,100 | | 494 |
BHP Billiton, Ltd. - ADR (Ñ) | | 4,380 | | 188 |
Bunge, Ltd. (Ñ) | | 5,300 | | 274 |
Cabot Corp. | | 24,800 | | 379 |
Celanese Corp. Class A | | 39,100 | | 486 |
Century Aluminum Co. (Æ)(Ñ) | | 7,400 | | 74 |
Ceradyne, Inc. (Æ)(Ñ) | | 800 | | 16 |
Chemtura Corp. | | 12,900 | | 18 |
Cytec Industries, Inc. | | 5,300 | | 112 |
Domtar Corp. (Æ)(Ñ) | | 39,000 | | 65 |
Dow Chemical Co. (The) | | 23,800 | | 359 |
Ecolab, Inc. | | 4,580 | | 161 |
EI Du Pont de Nemours & Co. | | 53,550 | | 1,355 |
Fluor Corp. (Ñ) | | 32,000 | | 1,436 |
HB Fuller Co. (Ñ) | | 5,000 | | 81 |
International Paper Co. (Ñ) | | 16,400 | | 194 |
Lubrizol Corp. | | 14,700 | | 535 |
Masco Corp. (Ñ) | | 69,800 | | 777 |
Monsanto Co. | | 12,054 | | 848 |
Mosaic Co. (The) | | 15,600 | | 540 |
Newmont Mining Corp. | | 16,200 | | 659 |
Nucor Corp. | | 3,300 | | 152 |
OM Group, Inc. (Æ)(Ñ) | | 4,000 | | 84 |
Potash Corp. of Saskatchewan | | 2,300 | | 168 |
PPG Industries, Inc. | | 7,200 | | 306 |
Praxair, Inc. | | 6,400 | | 380 |
Precision Castparts Corp. | | 14,000 | | 833 |
Quanta Services, Inc. (Æ)(Ñ) | | 31,800 | | 630 |
RPM International, Inc. | | 35,850 | | 476 |
Sherwin-Williams Co. (The) (Ñ) | | 4,630 | | 277 |
Smurfit-Stone Container Corp. (Æ) | | 11,100 | | 3 |
Steel Dynamics, Inc. | | 11,100 | | 124 |
United States Steel Corp. (Ñ) | | 900 | | 34 |
Valspar Corp. (Ñ) | | 17,700 | | 320 |
Weyerhaeuser Co. (Ñ) | | 11,000 | | 337 |
| | | | |
| | | | 17,215 |
| | | | |
| | |
| Miscellaneous - 2.2% | | | | |
Berkshire Hathaway, Inc. Class B (Æ) | | 523 | | 1,681 |
Fortune Brands, Inc. | | 7,200 | | 297 |
General Electric Co. | | 98,000 | | 1,588 |
Honeywell International, Inc. | | 54,900 | | 1,802 |
| | | | |
| | | Principal Amount ($)
or Shares | | Market
Value
$ |
Johnson Controls, Inc. (Ñ) | | 34,300 | | 623 |
Tyco International, Ltd. | | 31,500 | | 680 |
| | | | |
| | | | 6,671 |
| | | | |
| | |
| Other Energy - 5.1% | | | | |
Anadarko Petroleum Corp. | | 19,900 | | 767 |
Apache Corp. | | 10,600 | | 790 |
Baker Hughes, Inc. | | 42,100 | | 1,350 |
Berry Petroleum Co. Class A (Ñ) | | 6,100 | | 46 |
BJ Services Co. (Ñ) | | 10,900 | | 127 |
Cabot Oil & Gas Corp. | | 4,000 | | 104 |
Cameron International Corp. (Æ) | | 46,540 | | 954 |
Chesapeake Energy Corp. | | 20,600 | | 333 |
Cimarex Energy Co. (Ñ) | | 8,600 | | 230 |
Devon Energy Corp. | | 48,800 | | 3,207 |
Dynegy, Inc. Class A (Æ)(Ñ) | | 36,500 | | 73 |
Halliburton Co. | | 39,600 | | 720 |
Helix Energy Solutions Group, Inc. (Æ)(Ñ) | | 13,800 | | 100 |
Mariner Energy, Inc. (Æ) | | 12,000 | | 123 |
NRG Energy, Inc. (Æ) | | 7,336 | | 171 |
PetroHawk Energy Corp. (Æ)(Ñ) | | 11,340 | | 177 |
Schlumberger, Ltd. | | 40,890 | | 1,731 |
Southwestern Energy Co. (Æ) | | 15,110 | | 438 |
Stone Energy Corp. (Æ)(Ñ) | | 5,400 | | 60 |
Sunoco, Inc. | | 16,200 | | 704 |
Swift Energy Co. (Æ)(Ñ) | | 4,600 | | 77 |
Transocean, Ltd. (Æ) | | 17,600 | | 832 |
Unit Corp. (Æ)(Ñ) | | 1,200 | | 32 |
Valero Energy Corp. | | 12,640 | | 274 |
Williams Cos., Inc. | | 45,605 | | 660 |
XTO Energy, Inc. | | 32,100 | | 1,132 |
| | | | |
| | | | 15,212 |
| | | | |
| | |
| Producer Durables - 4.9% | | | | |
American Tower Corp. Class A (Æ) | | 12,100 | | 355 |
Applied Materials, Inc. | | 215,950 | | 2,188 |
Centex Corp. | | 10,300 | | 110 |
Deere & Co. | | 3,400 | | 130 |
DR Horton, Inc. (Ñ) | | 9,200 | | 65 |
Emerson Electric Co. | | 62,400 | | 2,284 |
Gardner Denver, Inc. (Æ) | | 3,400 | | 79 |
Herman Miller, Inc. | | 5,300 | | 69 |
Illinois Tool Works, Inc. (Ñ) | | 3,800 | | 133 |
Ingersoll-Rand Co., Ltd. Class A | | 25,600 | | 444 |
Lam Research Corp. (Æ) | | 16,780 | | 357 |
Lexmark International, Inc. Class A (Æ) | | 6,600 | | 178 |
Lockheed Martin Corp. | | 29,840 | | 2,509 |
Northrop Grumman Corp. | | 16,300 | | 734 |
NVR, Inc. (Æ)(Ñ) | | 920 | | 420 |
Parker Hannifin Corp. | | 10,099 | | 430 |
Pentair, Inc. | | 9,060 | | 214 |
Pitney Bowes, Inc. | | 20,400 | | 520 |
Plantronics, Inc. | | 2,300 | | 30 |
Pulte Homes, Inc. (Ñ) | | 27,140 | | 297 |
Raytheon Co. | | 14,600 | | 745 |
Sunpower Corp. (Æ)(Ñ) | | 18,261 | | 556 |
| | |
| 16 | | Multi-Style Equity Fund |
Russell Investment Funds
Multi-Style Equity Fund
Schedule of Investments, continued — December 31, 2008
Amounts in thousands (except share amounts)
| | | | |
| | | Principal Amount ($)
or Shares | | Market
Value
$ |
| | | | |
Terex Corp. (Æ)(Ñ) | | 5,700 | | 99 |
United Technologies Corp. | | 30,100 | | 1,613 |
| | | | |
| | | | 14,559 |
| | | | |
| | |
| Technology - 15.5% | | | | |
ADC Telecommunications, Inc. (Æ)(Ñ) | | 13,200 | | 72 |
Adobe Systems, Inc. (Æ) | | 8,850 | | 188 |
Amphenol Corp. Class A | | 73,288 | | 1,758 |
Analog Devices, Inc. | | 33,000 | | 628 |
Apple, Inc. (Æ)(Ñ) | | 49,660 | | 4,239 |
Avnet, Inc. (Æ) | | 3,000 | | 55 |
Broadcom Corp. Class A (Æ) | | 32,590 | | 553 |
Cisco Systems, Inc. (Æ) | | 237,024 | | 3,864 |
Citrix Systems, Inc. (Æ) | | 7,000 | | 165 |
Computer Sciences Corp. (Æ)(Ñ) | | 3,000 | | 105 |
Corning, Inc. 2008 (Ñ) | | 59,800 | | 570 |
Emulex Corp. (Æ) | | 3,000 | | 21 |
F5 Networks, Inc. (Æ)(Ñ) | | 12,520 | | 286 |
First Solar, Inc. (Æ)(Ñ) | | 6,370 | | 879 |
Garmin, Ltd. (Ñ) | | 27,200 | | 521 |
General Dynamics Corp. | | 25,604 | | 1,475 |
Google, Inc. Class A (Æ)(Ñ) | | 14,400 | | 4,430 |
Hewlett-Packard Co. | | 187,278 | | 6,796 |
Ingram Micro, Inc. Class A (Æ) | | 8,900 | | 119 |
Intel Corp. | | 52,500 | | 770 |
International Business Machines Corp. | | 20,710 | | 1,743 |
Jabil Circuit, Inc. | | 97,700 | | 660 |
JDS Uniphase Corp. (Æ) | | 6,200 | | 23 |
Juniper Networks, Inc. (Æ)(Ñ) | | 81,200 | | 1,422 |
Maxim Integrated Products, Inc. | | 80,300 | | 917 |
McAfee, Inc. (Æ)(Ñ) | | 5,470 | | 189 |
Microsoft Corp. | | 36,800 | | 715 |
Motorola, Inc. | | 93,100 | | 412 |
Qualcomm, Inc. | | 208,986 | | 7,488 |
Research In Motion, Ltd. (Æ) | | 16,900 | | 686 |
Rockwell Automation, Inc. | | 22,900 | | 738 |
SanDisk Corp. (Æ)(Ñ) | | 15,450 | | 148 |
Seagate Technology | | 90,200 | | 400 |
Seagate Technology (Æ) | | 2,300 | | — |
Siemens AG - ADR | | 6,210 | | 470 |
Sun Microsystems, Inc. (Æ) | | 33,300 | | 127 |
Symantec Corp. (Æ) | | 35,900 | | 485 |
Tellabs, Inc. (Æ)(Ñ) | | 34,800 | | 143 |
Texas Instruments, Inc. | | 81,500 | | 1,265 |
Tyco Electronics, Ltd. Class W | | 19,433 | | 315 |
Vishay Intertechnology, Inc. (Æ)(Ñ) | | 14,300 | | 49 |
Xilinx, Inc. (Ñ) | | 16,850 | | 300 |
| | | | |
| | | | 46,189 |
| | | | |
| | |
| Utilities - 2.1% | | | | |
American Electric Power Co., Inc. | | 11,600 | | 386 |
AT&T, Inc. | | 20,300 | | 579 |
Atmos Energy Corp. | | 1,800 | | 43 |
Avista Corp. (Ñ) | | 2,500 | | 48 |
| | | | | |
| | | Principal Amount ($)
or Shares | | Market
Value
$ | |
Consolidated Edison, Inc. | | 10,200 | | 397 | |
DTE Energy Co. | | 9,600 | | 342 | |
Duke Energy Corp. | | 20,500 | | 308 | |
Embarq Corp. | | 8,500 | | 306 | |
Frontier Communications Corp. | | 41,900 | | 366 | |
MetroPCS Communications, Inc. (Æ)(Ñ) | | 20,630 | | 306 | |
New Jersey Resources Corp. (Ñ) | | 3,600 | | 142 | |
NiSource, Inc. | | 20,300 | | 223 | |
Northwest Natural Gas Co. (Ñ) | | 1,500 | | 66 | |
Pepco Holdings, Inc. | | 14,000 | | 249 | |
Pinnacle West Capital Corp. | | 9,600 | | 308 | |
Progress Energy, Inc. - CVO | | 1,300 | | — | |
Qwest Communications International, Inc. (Ñ) | | 43,800 | | 159 | |
Southwest Gas Corp. (Ñ) | | 2,900 | | 73 | |
US Cellular Corp. (Æ) | | 900 | | 39 | |
Verizon Communications, Inc. | | 1,800 | | 61 | |
Vodafone Group PLC - ADR | | 88,350 | | 1,806 | |
| | | | | |
| | | | 6,207 | |
| | | | | |
| | |
Total Common Stocks
(cost $344,298) | | | | 268,529 | |
| | | | | |
| |
| Short-Term Investments - 9.4% | | | |
Russell Investment Company
Money Market Fund | | 27,918,000 | | 27,918 | |
| | | | | |
| | |
Total Short-Term Investments
(cost $27,918) | | | | 27,918 | |
| | | | | |
| | |
| Other Securities - 16.9% | | | | | |
State Street Securities Lending Quality Trust (×) | | 53,419,861 | | 50,487 | |
| | | | | |
| | |
Total Other Securities
(cost $53,420) | | | | 50,487 | |
| | | | | |
| | |
Total Investments - 116.3%
(identified cost $425,636) | | | | 346,934 | |
| | |
Other Assets and Liabilities,
Net - (16.3%) | | | | (48,723 | ) |
| | | | | |
| | |
| Net Assets - 100.0% | | | | 298,211 | |
| | | | | |
See accompanying notes which are an integral part of the financial statements.
| | |
| Multi-Style Equity Fund | | 17 |
Russell Investment Funds
Multi-Style Equity Fund
Schedule of Investments, continued — December 31, 2008
Amounts in thousands (except contracts)
| | | | | | | | | | |
| Futures Contracts | | Number of
Contracts | | Notional
Amount | | Expiration
Date | | Unrealized
Appreciation (Depreciation)
$ |
| | | | | | | | | | |
| Long Positions | | | | | | | | | | |
Russell 1000 Mini Index | | 43 | | USD | | 2,089 | | 03/09 | | 18 |
S&P 500 E-Mini Index (CME) | | 265 | | USD | | 11,926 | | 03/09 | | 32 |
S&P 500 Index (CME) | | 53 | | USD | | 11,926 | | 03/09 | | 63 |
S&P Midcap 400 E-Mini Index (CME) | | 118 | | USD | | 6,339 | | 03/09 | | 341 |
| | | | | | | | | | |
| | | | | |
Total Unrealized Appreciation (Depreciation) on Open Futures Contracts | | | | | | | | | | 454 |
| | | | | | | | | | |
Presentation of Portfolio Holdings — December 31, 2008
| | | |
| Portfolio Summary | | % of Net
Assets | |
| | | |
Auto and Transportation | | 1.6 | |
Consumer Discretionary | | 11.4 | |
Consumer Staples | | 7.4 | |
Financial Services | | 14.3 | |
Health Care | | 14.7 | |
Integrated Oils | | 5.0 | |
Materials and Processing | | 5.8 | |
Miscellaneous | | 2.2 | |
Other Energy | | 5.1 | |
Producer Durables | | 4.9 | |
Technology | | 15.5 | |
Utilities | | 2.1 | |
Short-Term Investments | | 9.4 | |
Other Securities | | 16.9 | |
| | | |
Total Investments | | 116.3 | |
Other Assets and Liabilities, Net | | (16.3 | ) |
| | | |
| |
| | 100.0 | |
| | | |
| |
Futures Contracts | | 0.2 | |
See accompanying notes which are an integral part of the financial statements.
| | |
| 18 | | Multi-Style Equity Fund |
(This page intentionally left blank)
Russell Investment Funds
Aggressive Equity Fund
Portfolio Management Discussion and Analysis — December 31, 2008 (Unaudited)
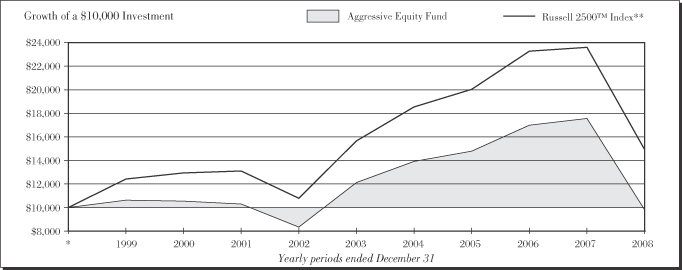
| | | |
|
| Aggressive Equity Fund | |
| | | Total
Return | |
1 Year | | (44.16 | )% |
5 Years | | (4.15 | )%§ |
10 Years | | (0.19 | )%§ |
| | | |
|
| Russell 2500™ Index ** | |
| | | Total
Return | |
1 Year | | (36.79 | )% |
5 Years | | (0.99 | )%§ |
10 Years | | 4.08 | %§ |
| * | | Assumes initial investment on January 1, 1999. |
** | | Russell 2500™ Index is composed of the bottom 500 stocks the Russell 1000® Index and all the stocks in the Russell 2000® Index. The Russell 2500™ Index return reflects adjustments for income dividends and capital gains distributions reinvested as of the ex-dividend dates. |
The performance shown in this section does not reflect any Insurance Company Separate Account or Policy Charges. Performance is historical and assumes reinvestment of all dividends and capital gains. Investment return and principal value will fluctuate so that an investor’s shares, when redeemed, may be worth more or less than when purchased. Past performance is not indicative of future results.
| | |
| 20 | | Aggressive Equity Fund |
Russell Investment Funds
Aggressive Equity Fund
Portfolio Management Discussion — December 31, 2008 (Unaudited)
The Aggressive Equity Fund (the “Fund”) allocates most of its assets among multiple money managers. Russell Investment Management Company (“RIMCo”), as the Fund’s advisor, may change the allocation of the Fund’s assets among money managers at any time. An exemptive order from the Securities and Exchange Commission (SEC) permits RIMCo to engage or terminate a money manager at any time, subject to the approval by the Fund’s Board without a shareholder vote. Pursuant to the terms of the exemptive order, the Fund is required to notify its shareholders within 60 days of when a money manager begins providing services. The Fund currently has eight money managers.
What is the Fund’s investment objective?
The Fund seeks to provide long term capital growth.
How did the Fund perform relative to its benchmark for the fiscal year ended December 31, 2008?
For the fiscal year ended December 31, 2008, the Aggressive Equity Fund lost 44.16%. This compared to the Russell 2500™ Index, which lost 36.79% during the same period. The Fund’s performance includes operating expenses, whereas Index returns are unmanaged and do not include expenses of any kind.
For the year ended December 31, 2008, the Lipper® Small-Cap Core Funds (VIP) Average lost 36.02%. This result serves as a peer comparison and is expressed net of operating expenses.
How did the market conditions described in the Market Summary report affect the Fund’s performance?
The financial crisis that unfolded in 2008 directly impacted Fund performance. Throughout the year, the Fund was underweight regional banks, because of concerns about credit and the value of their loan portfolios. Despite investor concerns, the regional banks industry outperformed the broader index by over 20% as the Federal Reserve and U.S. Treasury offered wide ranging means of support (cutting interest rates, instituting the Troubled Assets Relief Program (TARP) funds and acquiring of troubled securities). An overweight to other energy hurt the Fund as the prices of energy stocks fell as the price of oil fell. Additionally, stock selection within producer durables and technology sectors hurt the Fund as consumer demand for related products in these sectors slowed. Stocks that started the year with higher estimated growth (a typical overweight within the Fund) underperformed as many securities with these characteristics saw forward earnings estimates decreased significantly.
The Fund’s strategy of being fully invested and exposing cash reserves to the performance of appropriate markets by purchasing equity securities and/or derivatives was a drag on performance relative to peers that held larger cash positions as the Russell 2500™ Index was down over 35%.
How did the investment strategies and techniques employed by the Fund and its money managers affect its performance?
The Fund employs eight managers: three growth, two market-oriented, and three value managers. PanAgora Asset Management Company LLC was the only manager to outperform its benchmark. The remaining managers underperformed by varying degrees. Those managers on the style extremes, with larger sector deviation, detracted the most from performance. Signia Capital Management, LLC, which was added to the Fund in March, has underperformed since being added to the Fund.
Gould Investment Partners LLC, Ranger Investment Management, L.P., and Signia were the worst performing managers. Gould, a high-growth manager, underperformed as a result of an overweight to other energy in addition to negative stock selection within producer durables and consumer discretionary. Gould’s high-growth process was not rewarded during the year.
Ranger’s underperformance was driven by stock selection within the technology, materials and processing and health care sectors. Like Gould, Ranger’s exposure to the highest growth stocks detracted from its performance.
Signia, a deep value manager, benefited from stock selection in the materials and processing sector. However, this was offset by weak stock selection in the health care and technology sectors, and an underweight to the financial service sector.
PanAgora modestly outperformed. PanAgora’s lower-beta (beta is the volatility of a given security compared to the volatility of the market as a whole) investment strategy was rewarded during the volatile year. The portfolio benefited from being equally distributed along the capital spectrum and investing in moderately valued stocks.
The Fund’s performance shown throughout this report was based on valuations calculated in accordance with Generally Accepted Accounting Principles (GAAP) and, in accordance with a newly effective accounting statement (SFAS 157), reflects the December 31, 2008 market value of the pooled investment vehicle in which the Fund invested its cash collateral received in securities lending transactions. This market value is lower than the vehicle’s amortized cost. This had a negative impact on the Fund’s benchmark relative performance.
Describe any changes to the Fund’s structure or the money manager line-up.
In March of 2008, Signia Capital Management, LLC was hired to replace David J. Greene and Company, LLC.
| | |
| Aggressive Equity Fund | | 21 |
Russell Investment Funds
Aggressive Equity Fund
Portfolio Management Discussion — December 31, 2008 (Unaudited)
| | |
| |
Money Managers as of
December 31, 2008 | | Styles |
| ClariVest Asset Management LLC | | Market Oriented |
| DePrince, Race, & Zollo, Inc. | | Value |
| Gould Investment Partners LLC | | Growth |
| Jacobs Levy Equity Management, LLC | | Value |
| PanAgora Asset Management Company LLC | | Market Oriented |
| Ranger Investment Management, L.P. | | Growth |
| Signia Capital Management, LLC | | Value |
| Tygh Capital Management, Inc. | | Growth |
The views expressed in this report reflect those of the portfolio managers only through the end of the period covered by the report. These views do not necessarily represent the views of RIMCo, or any other person in RIMCo or any other affiliated organization. These views are subject to change at any time based upon market conditions or other events, and RIMCo disclaims any responsibility to update the views contained herein. These views should not be relied on as investment advice and, because investment decisions for Russell Investment Funds (RIF) are based on numerous factors, should not be relied on as an indication of investment decisions of any RIF Fund.
| | |
| 22 | | Aggressive Equity Fund |
Russell Investment Funds
Aggressive Equity Fund
Shareholder Expense Example — December 31, 2008 (Unaudited)
Fund Expenses
The following disclosure provides important information regarding each Fund’s Expense Example, which appears on each Fund’s individual page in this Annual Report. Please refer to this information when reviewing the Expense Example for a Fund.
Example
As a shareholder of the Fund, you incur two types of costs: (1) transaction costs, and (2) ongoing costs, including management fees and other Fund expenses. The Example is intended to help you understand your ongoing costs (in dollars) of investing in the Fund and to compare these costs with the ongoing costs of investing in other mutual funds. The Example is based on an investment of $1,000 invested at the beginning of the period and held for the entire period indicated, which for this Fund is from July 1, 2008 to December 31, 2008.
Actual Expenses
The information in the table under the heading “Actual Performance” provides information about actual account values and actual expenses. You may use the information in this column, together with the amount you invested, to estimate the expenses that you paid over the period. Simply divide your account value by $1,000 (for example, an $8,600 account value divided by $1,000 = 8.6), then multiply the result by the number in the first column in the row entitled “Expenses Paid During Period” to estimate the expenses you paid on your account during this period.
Hypothetical Example for Comparison Purposes
The information in the table under the heading “Hypothetical Performance (5% return before expenses)” provides information about hypothetical account values and hypothetical expenses based on the Fund’s actual expense ratio and an assumed rate of return of 5% per year before expenses, which is not the Fund’s actual return. The hypothetical account values and expenses may not be used to estimate the actual ending account balance or expenses you paid for the period. You may use this information to compare the ongoing costs of investing in the Fund and other funds. To do so, compare this 5% hypothetical example with the 5% hypothetical examples that appear in the shareholder reports of other funds.
Please note that the expenses shown in the table are meant to highlight your ongoing costs only and do not reflect any transactional costs. Therefore, the information under the heading “Hypothetical Performance (5% return before expenses)” is useful in comparing ongoing costs only, and will not help you determine the relative total costs of owning different funds. In addition, if these transactional costs were included, your costs would have been higher. The fee and expenses shown in this section do not reflect any Insurance Company Separate Account or Policy Charges.
| | | | | | |
| | | Actual
Performance | | Hypothetical
Performance
(5% return
before expenses) |
| | | | | | |
Beginning Account Value | | | | | | |
July 1, 2008 | | $ | 1,000.00 | | $ | 1,000.00 |
Ending Account Value | | | | | | |
December 31, 2008 | | $ | 622.46 | | $ | 1,019.86 |
Expenses Paid During Period* | | $ | 4.28 | | $ | 5.33 |
| * | Expenses are equal to the Fund’s annualized expense ratio of 1.05% (representing the one-half year period annualized), multiplied by the average account value over the period, multiplied by 184/366 (to reflect the one-half year period). Reflects amounts waived and/or reimbursed. Without the waiver and/or reimbursement, expenses would have been higher. |
| | |
| Aggressive Equity Fund | | 23 |
Russell Investment Funds
Aggressive Equity Fund
Schedule of Investments — December 31, 2008
Amounts in thousands (except share amounts)
| | | | |
| | | Principal
Amount ($)
or Shares | | Market
Value
$ |
| | | | |
| Common Stocks - 91.3% | | | | |
| Auto and Transportation - 3.9% | | |
Allegiant Travel Co. (Æ)(Ñ) | | 6,400 | | 311 |
American Railcar Industries, Inc. (Ñ) | | 500 | | 5 |
AMR Corp. (Æ)(Ñ) | | 20,500 | | 219 |
Arctic Cat, Inc. (Ñ) | | 1,800 | | 9 |
Arkansas Best Corp. (Ñ) | | 8,341 | | 251 |
ArvinMeritor, Inc. (Ñ) | | 9,700 | | 28 |
Autoliv, Inc. | | 3,268 | | 70 |
BorgWarner, Inc. (Ñ) | | 1,458 | | 32 |
Con-way, Inc. (Ñ) | | 7,800 | | 208 |
Cooper Tire & Rubber Co. (Ñ) | | 51,400 | | 317 |
Expeditors International of Washington, Inc. (Ñ) | | 5,307 | | 177 |
Force Protection, Inc. (Æ) | | 3,700 | | 22 |
Forward Air Corp. (Ñ) | | 2,400 | | 58 |
FreightCar America, Inc. | | 2,000 | | 37 |
Genesee & Wyoming, Inc. Class A (Æ) | | 13,040 | | 398 |
Global Ship Lease, Inc. (Ñ) | | 16,200 | | 46 |
Goodyear Tire & Rubber Co. (The) (Æ) | | 8,400 | | 50 |
Greenbrier Cos., Inc. (Ñ) | | 2,200 | | 15 |
Hawaiian Holdings, Inc. (Æ)(Ñ) | | 4,188 | | 27 |
Kirby Corp. (Æ)(Ñ) | | 3,323 | | 91 |
Lear Corp. (Æ)(Ñ) | | 10,200 | | 14 |
Navistar International Corp. (Æ) | | 6,493 | | 139 |
Old Dominion Freight Line, Inc. (Æ) | | 40 | | 1 |
Oshkosh Corp. (Ñ) | | 165 | | 1 |
Pacer International, Inc. | | 10,188 | | 106 |
PHI, Inc. (Æ)(Ñ) | | 8,136 | | 114 |
Polaris Industries, Inc. (Ñ) | | 2,975 | | 85 |
Republic Airways Holdings, Inc. (Æ) | | 1,819 | | 19 |
Saia, Inc. (Æ) | | 2,300 | | 25 |
Skywest, Inc. (Ñ) | | 20,840 | | 388 |
Stoneridge, Inc. (Æ)(Ñ) | | 1,600 | | 7 |
Strattec Security Corp. | | 7,607 | | 125 |
Superior Industries International,
Inc. (Ñ) | | 17,140 | | 180 |
Tenneco, Inc. (Æ)(Ñ) | | 6,800 | | 20 |
Tidewater, Inc. (Ñ) | | 3,850 | | 155 |
TRW Automotive Holdings
Corp. (Æ)(Ñ) | | 11,200 | | 40 |
US Airways Group, Inc. (Æ)(Ñ) | | 14,900 | | 115 |
UTI Worldwide, Inc. | | 13,676 | | 196 |
Visteon Corp. (Æ)(Ñ) | | 5,500 | | 2 |
Wabash National Corp. | | 2,800 | | 13 |
Wabtec Corp. (Ñ) | | 13,542 | | 538 |
Werner Enterprises, Inc. (Ñ) | | 9,398 | | 163 |
YRC Worldwide, Inc. (Æ)(Ñ) | | 7,800 | | 22 |
| | | | |
| | | | 4,839 |
| | | | |
| |
| Consumer Discretionary - 15.1% | | |
4Kids Entertainment, Inc. (Æ) | | 55,840 | | 109 |
99 Cents Only Stores (Æ)(Ñ) | | 23,120 | | 253 |
Aaron Rents, Inc. (Ñ) | | 6,600 | | 176 |
Abercrombie & Fitch Co. Class A (Ñ) | | 1,925 | | 44 |
Administaff, Inc. | | 872 | | 19 |
Advance Auto Parts, Inc. (Ñ) | | 5,422 | | 182 |
AFC Enterprises, Inc. (Æ) | | 2,800 | | 13 |
American Eagle Outfitters, Inc. (Ñ) | | 24,900 | | 233 |
| | | | |
| | | Principal
Amount ($)
or Shares | | Market
Value
$ |
American Greetings Corp. Class A | | 5,700 | | 42 |
American Public Education, Inc. (Æ) | | 4,500 | | 167 |
American Woodmark Corp. | | 800 | | 15 |
AnnTaylor Stores Corp. (Æ)(Ñ) | | 9,215 | | 53 |
Apollo Group, Inc. Class A (Æ) | | 4,836 | | 371 |
Asbury Automotive Group, Inc. | | 7,300 | | 33 |
AutoNation, Inc. (Æ)(Ñ) | | 8,600 | | 85 |
Avis Budget Group, Inc. (Æ)(Ñ) | | 13,500 | | 9 |
Bally Technologies, Inc. (Æ)(Ñ) | | 7,682 | | 185 |
Barnes & Noble, Inc. | | 2,300 | | 35 |
Bebe Stores, Inc. (Ñ) | | 47,700 | | 356 |
BJ’s Wholesale Club, Inc. (Æ)(Ñ) | | 4,789 | | 164 |
Blockbuster, Inc. Class A (Æ)(Ñ) | | 34,500 | | 43 |
Blyth, Inc. (Ñ) | | 2,400 | | 19 |
Brightpoint, Inc. (Æ)(Ñ) | | 19,585 | | 85 |
Brink’s Co. (The) | | 1,152 | | 31 |
Brink’s Home Security Holdings, Inc. (Æ) | | 1,318 | | 29 |
Brinker International, Inc. | | 14,300 | | 151 |
Brown Shoe Co., Inc. (Ñ) | | 3,400 | | 29 |
Buckle, Inc. (The) (Ñ) | | 3,900 | | 85 |
Build-A-Bear Workshop, Inc. Class A (Æ)(Ñ) | | 3,900 | | 19 |
Cabela’s, Inc. (Æ)(Ñ) | | 4,000 | | 23 |
Capella Education Co. (Æ)(Ñ) | | 5,641 | | 331 |
Career Education Corp. (Æ)(Ñ) | | 5,989 | | 107 |
Carter’s, Inc. (Æ)(Ñ) | | 15,450 | | 298 |
CDI Corp. | | 1,100 | | 14 |
Central European Distribution Corp. (Æ)(Ñ) | | 1,700 | | 34 |
Charlotte Russe Holding, Inc. (Æ) | | 3,300 | | 21 |
Charming Shoppes, Inc. (Æ)(Ñ) | | 3,867 | | 9 |
Chemed Corp. (Ñ) | | 174 | | 7 |
Childrens Place Retail Stores, Inc. (The) (Æ) | | 2,100 | | 46 |
Chipotle Mexican Grill, Inc. Class A (Æ)(Ñ) | | 950 | | 59 |
Chipotle Mexican Grill, Inc. Class B (Æ)(Ñ) | | 1,310 | | 75 |
Christopher & Banks Corp. | | 1,739 | | 10 |
Churchill Downs, Inc. (Ñ) | | 4,195 | | 170 |
Cintas Corp. | | 3,327 | | 77 |
CKE Restaurants, Inc. (Ñ) | | 20,800 | | 181 |
Conn’s, Inc. (Æ)(Ñ) | | 500 | | 4 |
Copart, Inc. (Æ)(Ñ) | | 15,686 | | 427 |
Corrections Corp. of America (Æ) | | 27,622 | | 452 |
CRA International, Inc. (Æ)(Ñ) | | 411 | | 11 |
Cracker Barrel Old Country Store,
Inc. (Ñ) | | 8,000 | | 165 |
CSS Industries, Inc. | | 710 | | 13 |
DeVry, Inc. | | 9,537 | | 548 |
Dice Holdings, Inc. (Æ)(Ñ) | | 2,009 | | 8 |
Dick’s Sporting Goods, Inc. (Æ)(Ñ) | | 11,147 | | 157 |
Dillard’s, Inc. Class A | | 2,900 | | 12 |
Dollar Tree, Inc. (Æ)(Ñ) | | 16,230 | | 678 |
Domino’s Pizza, Inc. (Æ)(Ñ) | | 900 | | 4 |
DSW, Inc. Class A (Æ)(Ñ) | | 2,100 | | 26 |
Earthlink, Inc. (Æ)(Ñ) | | 33,600 | | 227 |
Eastman Kodak Co. (Ñ) | | 6,100 | | 40 |
Ethan Allen Interiors, Inc. (Ñ) | | 4,000 | | 57 |
EW Scripps Co. Class A (Ñ) | | 28,759 | | 64 |
Ezcorp, Inc. Class A (Æ) | | 15,800 | | 240 |
| | |
| 24 | | Aggressive Equity Fund |
Russell Investment Funds
Aggressive Equity Fund
Schedule of Investments, continued — December 31, 2008
Amounts in thousands (except share amounts)
| | | | |
| | | Principal
Amount ($)
or Shares | | Market
Value
$ |
| | | | |
Fastenal Co. (Ñ) | | 2,509 | | 87 |
Finish Line (The) Class A | | 9,400 | | 53 |
Foot Locker, Inc. (Ñ) | | 8,658 | | 64 |
Fred’s, Inc. Class A (Ñ) | | 6,900 | | 74 |
FTI Consulting, Inc. (Æ)(Ñ) | | 3,586 | | 160 |
Furniture Brands International, Inc. (Ñ) | | 7,300 | | 16 |
G&K Services, Inc. Class A (Ñ) | | 1,637 | | 33 |
GameStop Corp. Class A (Æ) | | 10,074 | | 218 |
Gannett Co., Inc. (Ñ) | | 12,700 | | 102 |
Gap, Inc. (The) | | 19,190 | | 257 |
Genesco, Inc. (Æ)(Ñ) | | 3,086 | | 52 |
Geo Group, Inc. (The) (Æ)(Ñ) | | 13,523 | | 244 |
Group 1 Automotive, Inc. (Ñ) | | 4,400 | | 47 |
Harman International Industries,
Inc. (Ñ) | | 6,224 | | 104 |
Haverty Furniture Cos., Inc. (Ñ) | | 1,700 | | 16 |
Heidrick & Struggles International,
Inc. (Ñ) | | 5,460 | | 118 |
Helen of Troy, Ltd. (Æ) | | 14,600 | | 253 |
Hewitt Associates, Inc. Class A (Æ) | | 10,300 | | 292 |
Hooker Furniture Corp. (Ñ) | | 1,300 | | 10 |
HOT Topic, Inc. (Æ)(Ñ) | | 8,300 | | 77 |
IAC/InterActiveCorp (Æ)(Ñ) | | 1,375 | | 22 |
infoGROUP, Inc. (Ñ) | | 3,315 | | 16 |
Infospace, Inc. | | 685 | | 5 |
Insight Enterprises, Inc. (Æ)(Ñ) | | 6,800 | | 47 |
Interval Leisure Group, Inc. (Æ)(Ñ) | | 561 | | 3 |
ITT Educational Services, Inc. (Æ)(Ñ) | | 2,852 | | 271 |
Jackson Hewitt Tax Service, Inc. | | 4,050 | | 64 |
Jarden Corp. (Æ)(Ñ) | | 10,400 | | 120 |
Jo-Ann Stores, Inc. (Æ)(Ñ) | | 2,200 | | 34 |
Journal Communications, Inc.
Class A (Ñ) | | 8,000 | | 20 |
K12, Inc. (Æ)(Ñ) | | 1,125 | | 21 |
Kelly Services, Inc. Class A (Ñ) | | 4,400 | | 57 |
Kenneth Cole Productions, Inc.
Class A (Ñ) | | 13,727 | | 97 |
La-Z-Boy, Inc. (Ñ) | | 5,600 | | 12 |
Lakeland Industries, Inc. (Æ) | | 16,885 | | 137 |
Leggett & Platt, Inc. (Ñ) | | 3,482 | | 53 |
LIN TV Corp. Class A (Æ)(Ñ) | | 3,900 | | 4 |
LKQ Corp. (Æ)(Ñ) | | 10,999 | | 128 |
LS Starrett Co. | | 4,234 | | 68 |
Maidenform Brands, Inc. (Æ) | | 1,700 | | 17 |
Manpower, Inc. (Ñ) | | 2,516 | | 86 |
MAXIMUS, Inc. | | 556 | | 20 |
McClatchy Co. Class A (Ñ) | | 6,600 | | 5 |
Media General, Inc. Class A (Ñ) | | 2,681 | | 5 |
Men’s Wearhouse, Inc. (The) (Ñ) | | 11,300 | | 153 |
Meredith Corp. (Ñ) | | 2,790 | | 48 |
MPS Group, Inc. (Æ)(Ñ) | | 2,800 | | 21 |
Navigant Consulting, Inc. (Æ)(Ñ) | | 2,503 | | 40 |
Netease.com - ADR (Æ)(Ñ) | | 9,800 | | 217 |
New York & Co., Inc. (Æ)(Ñ) | | 4,000 | | 9 |
Nu Skin Enterprises, Inc. Class A (Ñ) | | 4,300 | | 45 |
O’Charleys, Inc. (Ñ) | | 13,446 | | 27 |
O’Reilly Automotive, Inc. (Æ)(Ñ) | | 8,903 | | 274 |
Office Depot, Inc. (Æ) | | 43,500 | | 130 |
OfficeMax, Inc. | | 9,900 | | 76 |
On Assignment, Inc. (Æ) | | 15,800 | | 90 |
Oxford Industries, Inc. | | 2,300 | | 20 |
| | | | |
| | | Principal
Amount ($)
or Shares | | Market
Value
$ |
Panera Bread Co. Class A (Æ)(Ñ) | | 1,056 | | 55 |
Pantry, Inc. (The) (Æ)(Ñ) | | 4,400 | | 94 |
Parlux Fragrances, Inc. (Æ) | | 35,017 | | 102 |
PC Connection, Inc. (Æ) | | 2,000 | | 10 |
Perry Ellis International, Inc. (Æ)(Ñ) | | 2,200 | | 14 |
PetMed Express, Inc. (Æ)(Ñ) | | 7,000 | | 123 |
PF Chang’s China Bistro, Inc. (Æ)(Ñ) | | 1,647 | | 35 |
Phillips-Van Heusen Corp. | | 1,435 | | 29 |
Pool Corp. (Ñ) | | 5,150 | | 93 |
Pre-Paid Legal Services, Inc. (Æ)(Ñ) | | 285 | | 11 |
Prestige Brands Holdings, Inc. (Æ) | | 20,939 | | 221 |
PRG-Schultz International, Inc. (Æ) | | 4,989 | | 20 |
Quiksilver, Inc. (Æ) | | 14,500 | | 27 |
RadioShack Corp. (Ñ) | | 5,710 | | 68 |
RC2 Corp. (Æ)(Ñ) | | 3,806 | | 41 |
Red Lion Hotels Corp. (Æ) | | 24,355 | | 58 |
Rent-A-Center, Inc. Class A (Æ) | | 7,200 | | 127 |
Republic Services, Inc. Class A | | 22,048 | | 547 |
Revlon, Inc. Class A (Æ) | | 1,110 | | 7 |
Ross Stores, Inc. (Ñ) | | 8,522 | | 253 |
RR Donnelley & Sons Co. | | 1,899 | | 26 |
Ruby Tuesday, Inc. (Æ)(Ñ) | | 8,300 | | 13 |
Rush Enterprises, Inc. Class A (Æ)(Ñ) | | 3,091 | | 27 |
Rush Enterprises, Inc. Class B (Æ) | | 122 | | 1 |
Scholastic Corp. (Ñ) | | 4,286 | | 58 |
School Specialty, Inc. (Æ)(Ñ) | | 643 | | 12 |
Shanda Interactive Entertainment, Ltd. - ADR (Æ)(Ñ) | | 5,000 | | 162 |
Shoe Carnival, Inc. (Æ) | | 1,400 | | 13 |
Sinclair Broadcast Group, Inc.
Class A (Ñ) | | 9,200 | | 29 |
Skechers U.S.A., Inc. Class A (Æ) | | 4,400 | | 56 |
Sohu.com, Inc. (Æ)(Ñ) | | 1,697 | | 80 |
Sonic Automotive, Inc. Class A (Ñ) | | 7,400 | | 29 |
Spherion Corp. (Æ) | | 2,900 | | 6 |
Stage Stores, Inc. | | 4,000 | | 33 |
Stanley Works (The) | | 2,726 | | 93 |
Starbucks Corp. (Æ)(Ñ) | | 11,220 | | 106 |
Stewart Enterprises, Inc. Class A (Ñ) | | 65,000 | | 196 |
Strayer Education, Inc. (Ñ) | | 2,124 | | 455 |
Take-Two Interactive Software,
Inc. (Æ)(Ñ) | | 11,800 | | 89 |
Talbots, Inc. (Ñ) | | 1,000 | | 2 |
Tech Data Corp. (Æ) | | 7,858 | | 140 |
Tempur-Pedic International, Inc. | | 5,300 | | 38 |
thinkorswim Group, Inc. (Æ)(Ñ) | | 12,800 | | 72 |
Ticketmaster Entertainment, Inc. (Æ)(Ñ) | | 184 | | 1 |
Timberland Co. Class A (Æ)(Ñ) | | 1,601 | | 19 |
Toro Co. (Ñ) | | 613 | | 20 |
Tractor Supply Co. (Æ)(Ñ) | | 2,405 | | 87 |
Tuesday Morning Corp. (Æ)(Ñ) | | 7,200 | | 12 |
Tween Brands, Inc. (Æ)(Ñ) | | 2,500 | | 11 |
United Online, Inc. (Ñ) | | 57,381 | | 348 |
United Stationers, Inc. (Æ) | | 4,384 | | 147 |
Universal Electronics, Inc. (Æ) | | 338 | | 5 |
Universal Technical Institute, Inc. (Æ) | | 8,400 | | 144 |
Urban Outfitters, Inc. (Æ)(Ñ) | | 7,000 | | 105 |
Valassis Communications, Inc. (Æ)(Ñ) | | 6,200 | | 8 |
Waste Connections, Inc. (Æ)(Ñ) | | 18,907 | | 597 |
| | |
| Aggressive Equity Fund | | 25 |
Russell Investment Funds
Aggressive Equity Fund
Schedule of Investments, continued — December 31, 2008
Amounts in thousands (except share amounts)
| | | | |
| | | Principal
Amount ($)
or Shares | | Market
Value
$ |
| | | | |
Watson Wyatt Worldwide, Inc. Class A | | 1,842 | | 88 |
WESCO International, Inc. (Æ) | | 4,431 | | 85 |
Wet Seal, Inc. (The) Class A (Æ)(Ñ) | | 45,100 | | 134 |
Williams-Sonoma, Inc. (Ñ) | | 24,700 | | 194 |
WMS Industries, Inc. (Æ)(Ñ) | | 7,915 | | 213 |
Wolverine World Wide, Inc. | | 8,400 | | 177 |
Wyndham Worldwide Corp. (Ñ) | | 15,600 | | 102 |
| | | | |
| | | | 18,537 |
| | | | |
| | |
| Consumer Staples - 2.7% | | | | |
Casey’s General Stores, Inc. | | 2,387 | | 54 |
Chiquita Brands International, Inc. (Æ)(Ñ) | | 12,946 | | 191 |
Church & Dwight Co., Inc. (Ñ) | | 15,234 | | 855 |
Constellation Brands, Inc. Class A (Æ) | | 4,877 | | 77 |
Dean Foods Co. (Æ)(Ñ) | | 1,462 | | 26 |
Del Monte Foods Co. | | 71,321 | | 509 |
Diamond Foods, Inc. (Ñ) | | 3,268 | | 66 |
Fresh Del Monte Produce, Inc. (Æ) | | 11,100 | | 249 |
Green Mountain Coffee Roasters, Inc. (Æ)(Ñ) | | 6,750 | | 261 |
Imperial Sugar Co. | | 900 | | 13 |
Lance, Inc. (Ñ) | | 1,100 | | 25 |
Molson Coors Brewing Co. Class B | | 3,206 | | 157 |
Monterey Gourmet Foods, Inc. (Æ)(Å) | | 125,695 | | 133 |
Nash Finch Co. (Ñ) | | 1,100 | | 49 |
NBTY, Inc. (Æ)(Ñ) | | 4,704 | | 74 |
Omega Protein Corp. (Æ) | | 2,600 | | 11 |
Ralcorp Holdings, Inc. (Æ) | | 2,280 | | 133 |
Schweitzer-Mauduit International, Inc. | | 2,700 | | 54 |
Spartan Stores, Inc. (Ñ) | | 1,700 | | 40 |
SUPERVALU, Inc. | | 2,100 | | 31 |
Tootsie Roll Industries, Inc. (Ñ) | | 4,434 | | 114 |
TreeHouse Foods, Inc. (Æ)(Ñ) | | 5,080 | | 138 |
Weis Markets, Inc. | | 1,986 | | 67 |
| | | | |
| | | | 3,327 |
| | | | |
| | |
| Financial Services - 18.0% | | | | |
Advance America Cash Advance Centers, Inc. (Ñ) | | 7,833 | | 15 |
Affiliated Managers Group, Inc. (Æ)(Ñ) | | 7,197 | | 302 |
Alexandria Real Estate Equities, Inc. (ö)(Ñ) | | 1,235 | | 75 |
Alliance Data Systems Corp. (Æ)(Ñ) | | 9,360 | | 436 |
Allied Capital Corp. (Ñ) | | 33,097 | | 89 |
Allied World Assurance Co. Holdings, Ltd. | | 5,400 | | 219 |
American Capital Agency Corp. (ö)(Ñ) | | 4,650 | | 99 |
American Equity Investment Life Holding Co. (Ñ) | | 20,500 | | 143 |
American Financial Group, Inc. | | 6,223 | | 142 |
Amerisafe, Inc. (Æ) | | 3,776 | | 78 |
Amtrust Financial Services, Inc. (Ñ) | | 7,185 | | 83 |
Anchor Bancorp Wisconsin, Inc. (Ñ) | | 2,500 | | 7 |
Annaly Capital Management, Inc. (ö)(Ñ) | | 11,200 | | 178 |
Anthracite Capital, Inc. (ö)(Ñ) | | 9,700 | | 22 |
Anworth Mortgage Asset Corp. (ö)(Ñ) | | 51,700 | | 332 |
Apartment Investment & Management Co. Class A (ö)(Ñ) | | 455 | | 5 |
Arbor Realty Trust, Inc. (ö)(Ñ) | | 4,700 | | 14 |
| | | | |
| | | Principal
Amount ($)
or Shares | | Market
Value
$ |
Arch Capital Group, Ltd. (Æ)(Ñ) | | 6,400 | | 449 |
Ares Capital Corp. | | 23,605 | | 149 |
Arthur J Gallagher & Co. (Ñ) | | 8,500 | | 220 |
Ashford Hospitality Trust, Inc. (ö)(Ñ) | | 9,100 | | 10 |
Asset Acceptance Capital Corp. (Æ)(Ñ) | | 2,400 | | 12 |
Astoria Financial Corp. (Ñ) | | 9,659 | | 159 |
Bancfirst Corp. (Ñ) | | 1,000 | | 53 |
Banco Latinoamericano de Exportaciones SA Class E | | 4,800 | | 69 |
Bancorp, Inc. (Æ)(Ñ) | | 400 | | 1 |
Bancorpsouth, Inc. (Ñ) | | 9,079 | | 212 |
Bank of Hawaii Corp. (Ñ) | | 5,866 | | 265 |
Bank of the Ozarks, Inc. (Ñ) | | 2,201 | | 65 |
Berkshire Hills Bancorp, Inc. | | 3,300 | | 102 |
BioMed Realty Trust, Inc. (ö)(Ñ) | | 8 | | — |
BOK Financial Corp. (Ñ) | | 1,271 | | 51 |
Brandywine Realty Trust (ö)(Ñ) | | 15,500 | | 120 |
Calamos Asset Management, Inc. Class A (Ñ) | | 4,300 | | 32 |
Capital City Bank Group, Inc. (Ñ) | | 600 | | 16 |
Capitol Bancorp, Ltd. (Ñ) | | 2,600 | | 20 |
Capitol Federal Financial (Ñ) | | 1,788 | | 82 |
CapLease, Inc. (ö)(Ñ) | | 4,100 | | 7 |
Capstead Mortgage Corp. (ö) | | 18,817 | | 203 |
Cash America International, Inc. | | 3,229 | | 88 |
Cathay General Bancorp (Ñ) | | 8,300 | | 197 |
Cedar Shopping Centers, Inc. (ö) | | 2,000 | | 14 |
Center Financial Corp. (Ñ) | | 11,175 | | 69 |
Central Pacific Financial Corp. (Ñ) | | 6,500 | | 65 |
Cigna Corp. | | 12,100 | | 204 |
Citizens Republic Bancorp, Inc. (Ñ) | | 14,900 | | 44 |
City Holding Co. (Ñ) | | 3,148 | | 109 |
CNA Surety Corp. (Æ) | | 4,038 | | 78 |
Colonial Properties Trust (ö)(Ñ) | | 8,200 | | 68 |
Columbia Banking System, Inc. (Ñ) | | 2,400 | | 29 |
Commerce Bancshares, Inc. (Ñ) | | 7,203 | | 317 |
Community Bank System, Inc. (Ñ) | | 9,773 | | 238 |
Community Trust Bancorp, Inc. (Ñ) | | 1,000 | | 37 |
Conseco, Inc. (Æ)(Ñ) | | 18,600 | | 96 |
Cullen/Frost Bankers, Inc. (Ñ) | | 2,229 | | 113 |
Cybersource Corp. (Æ)(Ñ) | | 11,250 | | 135 |
Delphi Financial Group, Inc. Class A | | 14,829 | | 273 |
Deluxe Corp. (Ñ) | | 19,497 | | 292 |
Digital Realty Trust, Inc. (ö)(Ñ) | | 1,102 | | 36 |
Dime Community Bancshares (Ñ) | | 5,453 | | 73 |
Discover Financial Services | | 7,788 | | 74 |
DuPont Fabros Technology, Inc. (ö) | | 12,139 | | 25 |
East West Bancorp, Inc. (Ñ) | | 560 | | 9 |
Eaton Vance Corp. (Ñ) | | 1,070 | | 22 |
Electro Rent Corp. (Ñ) | | 25,627 | | 286 |
EMC Insurance Group, Inc. (Ñ) | | 900 | | 23 |
Employers Holdings, Inc. | | 3,300 | | 54 |
Encore Capital Group, Inc. (Æ) | | 1,700 | | 12 |
Endurance Specialty Holdings, Ltd. (Ñ) | | 7,600 | | 232 |
Equity Lifestyle Properties, Inc. (ö)(Ñ) | | 1,047 | | 40 |
Evercore Partners, Inc. Class A (Ñ) | | 12,700 | | 159 |
FBL Financial Group, Inc. Class A (Ñ) | | 1,800 | | 28 |
| | |
| 26 | | Aggressive Equity Fund |
Russell Investment Funds
Aggressive Equity Fund
Schedule of Investments, continued — December 31, 2008
Amounts in thousands (except share amounts)
| | | | |
| | | Principal
Amount ($)
or Shares | | Market
Value
$ |
| | | | |
Federal Realty Investment Trust (ö)(Ñ) | | 724 | | 45 |
Federated Investors, Inc. Class B (Ñ) | | 4,230 | | 72 |
FelCor Lodging Trust, Inc. (ö)(Ñ) | | 11,200 | | 21 |
Fidelity National Information Services, Inc. | | 3,126 | | 51 |
First American Corp. | | 9,300 | | 269 |
First Bancorp (Ñ) | | 10,200 | | 114 |
First Cash Financial Services,
Inc. (Æ)(Ñ) | | 4,475 | | 85 |
First Community Bancshares, Inc. (Ñ) | | 400 | | 14 |
First Financial Bancorp (Ñ) | | 3,100 | | 38 |
First Financial Bankshares, Inc. (Ñ) | | 407 | | 22 |
First Horizon National Corp. (Ñ) | | 21,895 | | 231 |
First Industrial Realty Trust, Inc. (ö)(Ñ) | | 5,500 | | 42 |
First Marblehead Corp. (The) (Æ)(Ñ) | | 9,800 | | 13 |
First Midwest Bancorp, Inc. (Ñ) | | 7,800 | | 156 |
First Niagara Financial Group, Inc. (Ñ) | | 6,300 | | 102 |
FirstFed Financial Corp. (Æ)(Ñ) | | 3,200 | | 6 |
Flushing Financial Corp. | | 8,200 | | 98 |
Franklin Street Properties Corp. (ö)(Ñ) | | 17,308 | | 255 |
General Growth Properties, Inc. (ö)(Ñ) | | 21,500 | | 28 |
Genworth Financial, Inc. Class A | | 15,400 | | 44 |
Getty Realty Corp. (ö)(Ñ) | | 1,818 | | 38 |
Glimcher Realty Trust (ö)(Ñ) | | 5,800 | | 16 |
Green Bankshares, Inc. (Ñ) | | 2,019 | | 27 |
H&E Equipment Services, Inc. (Æ)(Ñ) | | 3,200 | | 25 |
H&R Block, Inc. | | 2,779 | | 63 |
Hallmark Financial Services (Æ) | | 835 | | 7 |
Hanmi Financial Corp. (Ñ) | | 3,300 | | 7 |
Hanover Insurance Group, Inc. (The) | | 2,100 | | 90 |
Hatteras Financial Corp. (ö) | | 7,700 | | 205 |
HCC Insurance Holdings, Inc. | | 1,350 | | 36 |
Health Care REIT, Inc. (ö)(Ñ) | | 3,555 | | 150 |
Heartland Payment Systems, Inc. (Ñ) | | 259 | | 5 |
Hercules Technology Growth Capital, Inc. (Ñ) | | 21,900 | | 173 |
Hersha Hospitality Trust (ö) | | 4,400 | | 13 |
Horace Mann Educators Corp. (Ñ) | | 16,300 | | 150 |
Hospitality Properties Trust (ö)(Ñ) | | 15,000 | | 223 |
HRPT Properties Trust (ö)(Ñ) | | 5,667 | | 19 |
Huntington Bancshares, Inc. (Ñ) | | 29,800 | | 228 |
Huron Consulting Group, Inc. (Æ)(Ñ) | | 2,790 | | 160 |
Hypercom Corp. (Æ) | | 91,030 | | 98 |
IBERIABANK Corp. (Ñ) | | 1,000 | | 48 |
Independent Bank Corp. (Ñ) | | 2,300 | | 5 |
Independent Bank Corp. | | 200 | | 5 |
Inland Real Estate Corp. (ö)(Ñ) | | 3,500 | | 45 |
Interactive Data Corp. | | 985 | | 24 |
Intersections, Inc. (Æ) | | 27,069 | | 141 |
Investors Bancorp, Inc. (Æ) | | 4,500 | | 60 |
IPC Holdings, Ltd. | | 8,900 | | 266 |
Janus Capital Group, Inc. (Ñ) | | 4,069 | | 33 |
JER Investment Trust, Inc. (Æ)(Þ) | | 9,200 | | 9 |
Knight Capital Group, Inc.
Class A (Æ)(Ñ) | | 22,902 | | 370 |
LaBranche & Co., Inc. (Æ)(Ñ) | | 16,300 | | 78 |
Lexington Realty Trust (ö)(Ñ) | | 7,200 | | 36 |
Life Partners Holdings, Inc. (Ñ) | | 6,525 | | 285 |
LTC Properties, Inc. (ö) | | 3,429 | | 70 |
MainSource Financial Group, Inc. (Ñ) | | 5,600 | | 87 |
| | | | |
| | | Principal
Amount ($)
or Shares | | Market
Value
$ |
MarketAxess Holdings, Inc. (Æ)(Ñ) | | 25,209 | | 206 |
Marshall & Ilsley Corp. (Ñ) | | 7,900 | | 108 |
Meadowbrook Insurance Group, Inc. | | 5,485 | | 35 |
MF Global, Ltd. (Æ)(Ñ) | | 5,400 | | 11 |
Midwest Banc Holdings, Inc. (Ñ) | | 3,844 | | 5 |
MVC Capital, Inc. (Ñ) | | 1,000 | | 11 |
National Financial Partners Corp. (Ñ) | | 4,600 | | 14 |
National Health Investors, Inc. (ö)(Ñ) | | 106 | | 3 |
National Interstate Corp. (Ñ) | | 326 | | 6 |
National Penn Bancshares, Inc. (Ñ) | | 14,963 | | 217 |
National Retail Properties, Inc. (ö)(Ñ) | | 14,485 | | 249 |
Nationwide Health Properties,
Inc. (ö)(Ñ) | | 3,178 | | 91 |
Navigators Group, Inc. (Æ)(Ñ) | | 1,745 | | 96 |
NBT Bancorp, Inc. (Ñ) | | 2,074 | | 58 |
New York Community Bancorp,
Inc. (Ñ) | | 5,029 | | 60 |
NewAlliance Bancshares, Inc. (Ñ) | | 110 | | 1 |
NGP Capital Resources Co. | | 2,100 | | 18 |
NorthStar Realty Finance Corp. (ö)(Ñ) | | 3,899 | | 15 |
Odyssey Re Holdings Corp. | | 1,060 | | 55 |
Old National Bancorp (Ñ) | | 11,658 | | 212 |
Old Second Bancorp, Inc. (Ñ) | | 800 | | 9 |
Omega Healthcare Investors, Inc. (ö)(Ñ) | | 5,553 | | 89 |
OneBeacon Insurance Group, Ltd. Class A (Ñ) | | 2,300 | | 24 |
optionsXpress Holdings, Inc. (Ñ) | | 5,312 | | 71 |
Oriental Financial Group, Inc. (Ñ) | | 24,796 | | 150 |
Pacific Capital Bancorp NA (Ñ) | | 4,800 | | 81 |
PacWest Bancorp (Ñ) | | 4,300 | | 116 |
Parkway Properties, Inc. (ö)(Ñ) | | 3,400 | | 61 |
PartnerRe, Ltd. - ADR (Ñ) | | 3,500 | | 249 |
PennantPark Investment Corp. (Ñ) | | 40,320 | | 146 |
Pennsylvania Real Estate Investment Trust (ö)(Ñ) | | 3,700 | | 28 |
Penson Worldwide, Inc. (Æ) | | 2,633 | | 20 |
People’s United Financial, Inc. (Ñ) | | 2,275 | | 41 |
Phoenix Cos., Inc. (The) | | 3,200 | | 10 |
Piper Jaffray Cos. (Æ)(Ñ) | | 10,066 | | 400 |
Platinum Underwriters Holdings, Ltd. | | 7,900 | | 285 |
PMA Capital Corp. Class A (Æ)(Ñ) | | 1,700 | | 12 |
PMI Group, Inc. (The) (Ñ) | | 15,700 | | 31 |
Potlatch Corp. (ö)(Ñ) | | 10,200 | | 265 |
Prosperity Bancshares, Inc. (Ñ) | | 269 | | 8 |
Protective Life Corp. | | 18,500 | | 265 |
Provident Financial Services, Inc. (Ñ) | | 15,783 | | 241 |
PS Business Parks, Inc. (ö)(Ñ) | | 609 | | 27 |
Pzena Investment Management, Inc. (Ñ) | | 8,300 | | 35 |
Raymond James Financial, Inc. (Ñ) | | 4,841 | | 83 |
Rayonier, Inc. (ö)(Ñ) | | 1,271 | | 40 |
Reinsurance Group of America, Inc. | | 2,700 | | 116 |
RenaissanceRe Holdings, Ltd. | | 500 | | 26 |
S1 Corp. (Æ) | | 8,700 | | 69 |
Sandy Spring Bancorp, Inc. (Ñ) | | 1,700 | | 37 |
Santander BanCorp (Ñ) | | 1,900 | | 24 |
SCBT Financial Corp. | | 500 | | 17 |
SeaBright Insurance Holdings, Inc. (Æ) | | 1,700 | | 20 |
Senior Housing Properties Trust (ö)(Ñ) | | 5,000 | | 90 |
South Financial Group, Inc. (The) (Ñ) | | 8,900 | | 38 |
| | |
| Aggressive Equity Fund | | 27 |
Russell Investment Funds
Aggressive Equity Fund
Schedule of Investments, continued — December 31, 2008
Amounts in thousands (except share amounts)
| | | | |
| | | Principal
Amount ($)
or Shares | | Market
Value
$ |
| | | | |
Southside Bancshares, Inc. (Ñ) | | 1,200 | | 28 |
Southwest Bancorp, Inc. | | 2,276 | | 29 |
StanCorp Financial Group, Inc. (Ñ) | | 7,388 | | 309 |
Sterling Bancorp (Ñ) | | 6,200 | | 87 |
Stewart Information Services Corp. (Ñ) | | 3,000 | | 70 |
Stifel Financial Corp. (Æ)(Ñ) | | 3,872 | | 178 |
Strategic Hotels & Resorts, Inc. (ö)(Ñ) | | 10,900 | | 18 |
Sun Bancorp, Inc. (Æ)(Ñ) | | 1,575 | | 12 |
Sunstone Hotel Investors, Inc. (ö)(Ñ) | | 10,500 | | 65 |
SVB Financial Group (Æ)(Ñ) | | 6,047 | | 159 |
SY Bancorp, Inc. (Ñ) | | 900 | | 25 |
Synovus Financial Corp. (Ñ) | | 20,100 | | 167 |
Tanger Factory Outlet Centers (ö)(Ñ) | | 752 | | 28 |
Texas Capital Bancshares, Inc. (Æ)(Ñ) | | 11,910 | | 159 |
Tompkins Financial Corp. (Ñ) | | 600 | | 35 |
Tower Group, Inc. (Ñ) | | 5,400 | | 152 |
Transatlantic Holdings, Inc. (Ñ) | | 1,866 | | 75 |
Trico Bancshares (Ñ) | | 3,300 | | 82 |
United America Indemnity, Ltd. Class A (Æ) | | 2,000 | | 26 |
United Financial Bancorp, Inc. (Ñ) | | 7,000 | | 106 |
United Rentals, Inc. (Æ)(Ñ) | | 8,977 | | 82 |
United Western Bancorp, Inc. | | 5,400 | | 51 |
Universal American Corp. (Æ)(Ñ) | | 8,007 | | 71 |
Unum Group | | 14,343 | | 267 |
Validus Holdings, Ltd. | | 12,745 | | 333 |
Ventas, Inc. (ö)(Ñ) | | 3,416 | | 115 |
ViewPoint Financial Group | | 8,400 | | 135 |
Waddell & Reed Financial, Inc. Class A | | 18,658 | | 288 |
Washington Federal, Inc. (Ñ) | | 6,384 | | 96 |
Washington Real Estate Investment Trust (ö)(Ñ) | | 3,600 | | 102 |
Webster Financial Corp. (Ñ) | | 16,300 | | 225 |
WesBanco, Inc. (Ñ) | | 2,200 | | 60 |
Westamerica Bancorporation (Ñ) | | 1,000 | | 51 |
Westfield Financial, Inc. (Ñ) | | 108 | | 1 |
Wilmington Trust Corp. (Ñ) | | 11,117 | | 247 |
Wilshire Bancorp, Inc. (Ñ) | | 13,000 | | 118 |
Wintrust Financial Corp. (Ñ) | | 1,000 | | 21 |
World Acceptance Corp. (Æ)(Ñ) | | 568 | | 11 |
WR Berkley Corp. | | 2,477 | | 77 |
Zenith National Insurance Corp. (Ñ) | | 5,450 | | 172 |
| | | | |
| | | | 22,104 |
| | | | |
| | |
| Health Care - 16.1% | | | | |
Affymetrix, Inc. (Æ)(Ñ) | | 98,931 | | 296 |
Albany Molecular Research, Inc. (Æ) | | 8,200 | | 80 |
Alliance Imaging, Inc. (Æ)(Ñ) | | 10,500 | | 84 |
Amedisys, Inc. (Æ)(Ñ) | | 4,373 | | 181 |
American Medical Systems Holdings,
Inc. (Æ)(Ñ) | | 6,714 | | 60 |
AMERIGROUP Corp. Class A (Æ) | | 7,500 | | 221 |
AmerisourceBergen Corp. Class A (Ñ) | | 887 | | 32 |
Analogic Corp. (Ñ) | | 5,599 | | 153 |
Angiodynamics, Inc. (Æ)(Ñ) | | 1,580 | | 22 |
Assisted Living Concepts, Inc. (Æ)(Ñ) | | 4,897 | | 20 |
athenahealth, Inc. (Æ)(Ñ) | | 5,450 | | 205 |
| | | | |
| | | Principal
Amount ($)
or Shares | | Market
Value
$ |
Bio-Rad Laboratories, Inc. Class A (Æ) | | 2,540 | | 191 |
BioScrip, Inc. (Æ) | | 98,509 | | 219 |
Candela Corp. (Æ) | | 163,824 | | 87 |
Capital Senior Living Corp. (Æ)(Ñ) | | 4,655 | | 14 |
Cardiac Science Corp. (Æ) | | 5,218 | | 39 |
Catalyst Health Solutions, Inc. (Æ) | | 7,876 | | 192 |
Centene Corp. (Æ) | | 14,845 | | 293 |
Cephalon, Inc. (Æ)(Ñ) | | 7,860 | | 606 |
Charles River Laboratories International, Inc. (Æ)(Ñ) | | 4,060 | | 106 |
Computer Programs & Systems, Inc. (Ñ) | | 2,846 | | 76 |
Corvel Corp. (Æ)(Ñ) | | 1,027 | | 23 |
Coventry Health Care, Inc. (Æ) | | 1,900 | | 28 |
Cubist Pharmaceuticals, Inc. (Æ)(Ñ) | | 10,555 | | 255 |
CV Therapeutics, Inc. (Æ)(Ñ) | | 1,722 | | 16 |
Datascope Corp. | | 350 | | 18 |
DaVita, Inc. (Æ) | | 7,858 | | 390 |
Depomed, Inc. (Æ)(Ñ) | | 2,767 | | 5 |
Edwards Lifesciences Corp. (Æ)(Ñ) | | 3,239 | | 178 |
Emergency Medical Services Corp. Class A (Æ) | | 2,300 | | 84 |
Endo Pharmaceuticals Holdings,
Inc. (Æ)(Ñ) | | 11,150 | | 289 |
eResearchTechnology, Inc. (Æ)(Ñ) | | 30,482 | | 202 |
Gen-Probe, Inc. (Æ) | | 5,827 | | 250 |
Genomic Health, Inc. (Æ)(Ñ) | | 2,200 | | 43 |
Genoptix, Inc. (Æ) | | 2,740 | | 93 |
Gentiva Health Services, Inc. (Æ)(Ñ) | | 7,537 | | 221 |
Haemonetics Corp. (Æ)(Ñ) | | 4,360 | | 246 |
Hanger Orthopedic Group, Inc. (Æ)(Ñ) | | 1,400 | | 20 |
Harvard Bioscience, Inc. (Æ)(Ñ) | | 49,156 | | 130 |
Health Net, Inc. (Æ)(Ñ) | | 1,700 | | 19 |
Healthsouth Corp. (Æ)(Ñ) | | 2,623 | | 29 |
Healthspring, Inc. (Æ)(Ñ) | | 18,688 | | 373 |
Henry Schein, Inc. (Æ)(Ñ) | | 365 | | 13 |
Hill-Rom Holdings, Inc. (Ñ) | | 6,214 | | 102 |
HMS Holdings Corp. (Æ)(Ñ) | | 23,184 | | 731 |
Hologic, Inc. (Æ)(Ñ) | | 20,193 | | 264 |
Icon PLC - ADR (Æ) | | 7,577 | | 149 |
Idexx Laboratories, Inc. (Æ)(Ñ) | | 3,517 | | 127 |
Illumina, Inc. (Æ)(Ñ) | | 22,814 | | 594 |
Immucor, Inc. (Æ) | | 22,951 | | 610 |
Immunomedics, Inc. (Æ) | | 647 | | 1 |
Intuitive Surgical, Inc. (Æ)(Ñ) | | 655 | | 83 |
Isis Pharmaceuticals, Inc. (Æ)(Ñ) | | 6,535 | | 93 |
Kendle International, Inc. (Æ)(Ñ) | | 2,964 | | 76 |
Kensey Nash Corp. (Æ)(Ñ) | | 3,731 | | 72 |
Kindred Healthcare, Inc. (Æ) | | 8,033 | | 105 |
Kinetic Concepts, Inc. (Æ)(Ñ) | | 1,017 | | 20 |
King Pharmaceuticals, Inc. (Æ)(Ñ) | | 67,264 | | 714 |
Laboratory Corp. of America
Holdings (Æ) | | 3,312 | | 213 |
LHC Group, Inc. (Æ)(Ñ) | | 8,215 | | 296 |
Life Technologies Corp. (Æ)(Ñ) | | 8,227 | | 192 |
LifePoint Hospitals, Inc. (Æ)(Ñ) | | 1,871 | | 43 |
Lincare Holdings, Inc. (Æ)(Ñ) | | 12,915 | | 348 |
Luminex Corp. (Æ)(Ñ) | | 11,600 | | 248 |
Magellan Health Services, Inc. (Æ) | | 7,466 | | 292 |
| | |
| 28 | | Aggressive Equity Fund |
Russell Investment Funds
Aggressive Equity Fund
Schedule of Investments, continued — December 31, 2008
Amounts in thousands (except share amounts)
| | | | |
| | | Principal
Amount ($)
or Shares | | Market
Value
$ |
| | | | |
Martek Biosciences Corp. (Æ)(Ñ) | | 1,400 | | 42 |
Masimo Corp. (Æ)(Ñ) | | 17,090 | | 510 |
Medical Action Industries, Inc. (Æ) | | 566 | | 6 |
Medicis Pharmaceutical Corp.
Class A (Ñ) | | 4,994 | | 69 |
Mednax, Inc. (Æ) | | 5,337 | | 169 |
Mentor Corp. (Ñ) | | 9,200 | | 285 |
Merit Medical Systems, Inc. (Æ) | | 19,077 | | 342 |
Molina Healthcare, Inc. (Æ)(Ñ) | | 6,325 | | 111 |
Myriad Genetics, Inc. (Æ) | | 4,200 | | 278 |
Nabi Biopharmaceuticals (Æ)(Ñ) | | 15,600 | | 52 |
Natus Medical, Inc. (Æ)(Ñ) | | 17,020 | | 220 |
NPS Pharmaceuticals, Inc. (Æ)(Ñ) | | 12,211 | | 76 |
NuVasive, Inc. (Æ)(Ñ) | | 6,604 | | 229 |
Odyssey HealthCare, Inc. (Æ) | | 3,000 | | 28 |
Omnicare, Inc. (Ñ) | | 11,928 | | 331 |
OSI Pharmaceuticals, Inc. (Æ)(Ñ) | | 2,623 | | 102 |
Par Pharmaceutical Cos., Inc. (Æ)(Ñ) | | 6,400 | | 86 |
Parexel International Corp. (Æ) | | 4,674 | | 45 |
Patterson Cos., Inc. (Æ) | | 5,209 | | 98 |
PDL BioPharma, Inc. (Ñ) | | 7,861 | | 49 |
Perrigo Co. (Ñ) | | 15,852 | | 512 |
Pharmaceutical Product Development, Inc. (Ñ) | | 3,538 | | 103 |
PharMerica Corp. (Æ)(Ñ) | | 5,500 | | 86 |
Phase Forward, Inc. (Æ)(Ñ) | | 9,800 | | 123 |
Psychiatric Solutions, Inc. (Æ)(Ñ) | | 23,285 | | 649 |
Quality Systems, Inc. (Ñ) | | 7,200 | | 314 |
RehabCare Group, Inc. (Æ) | | 4,300 | | 65 |
Res-Care, Inc. (Æ)(Ñ) | | 3,483 | | 52 |
Resmed, Inc. (Æ) | | 6,569 | | 246 |
Retractable Technologies, Inc. (Æ)(Å) | | 72,750 | | 62 |
Sirona Dental Systems, Inc. (Æ)(Ñ) | | 3,801 | | 40 |
Somanetics Corp. (Æ) | | 300 | | 5 |
SonoSite, Inc. (Æ)(Ñ) | | 1,591 | | 30 |
Stericycle, Inc. (Æ)(Ñ) | | 15,607 | | 813 |
STERIS Corp. | | 9,627 | | 230 |
SurModics, Inc. (Æ)(Ñ) | | 92 | | 2 |
Techne Corp. | | 8,046 | | 519 |
Thoratec Corp. (Æ)(Ñ) | | 6,875 | | 223 |
Triple-S Management Corp. (Æ)(Ñ) | | 900 | | 10 |
United Therapeutics Corp. (Æ)(Ñ) | | 1,418 | | 89 |
Universal Health Services, Inc. Class B | | 1,900 | | 71 |
VCA Antech, Inc. (Æ)(Ñ) | | 9,099 | | 181 |
Viropharma, Inc. (Æ)(Ñ) | | 20,436 | | 266 |
Watson Pharmaceuticals, Inc.
Class B (Æ)(Ñ) | | 21,311 | | 566 |
| | | | |
| | | | 19,860 |
| | | | |
| |
| Integrated Oils - 0.1% | | |
Vaalco Energy, Inc. (Æ) | | 23,900 | | 178 |
| | | | |
| |
| Materials and Processing - 7.7% | | |
Aceto Corp. | | 11,311 | | 113 |
Acuity Brands, Inc. (Ñ) | | 1,759 | | 61 |
Aecom Technology Corp. (Æ) | | 4,100 | | 126 |
Airgas, Inc. | | 7,907 | | 308 |
Andersons, Inc. (The) (Ñ) | | 2,700 | | 45 |
| | | | |
| | | Principal
Amount ($)
or Shares | | Market
Value
$ |
Armstrong World Industries, Inc. (Ñ) | | 2,167 | | 47 |
Ashland, Inc. | | 8,107 | | 85 |
Beacon Roofing Supply, Inc. (Æ)(Ñ) | | 795 | | 11 |
Brady Corp. Class A (Ñ) | | 1,746 | | 42 |
Buckeye Technologies, Inc. (Æ)(Ñ) | | 8,200 | | 30 |
Cabot Corp. (Ñ) | | 13,600 | | 208 |
Carpenter Technology Corp. (Ñ) | | 2,862 | | 59 |
Celanese Corp. Class A (Ñ) | | 3,237 | | 40 |
Century Aluminum Co. (Æ)(Ñ) | | 9,401 | | 94 |
Ceradyne, Inc. (Æ)(Ñ) | | 5,470 | | 111 |
CF Industries Holdings, Inc. | | 269 | | 13 |
Chemtura Corp. (Ñ) | | 7,027 | | 10 |
Clean Harbors, Inc. (Æ)(Ñ) | | 800 | | 51 |
Clearwater Paper Corp. (Æ)(Ñ) | | 585 | | 5 |
Comfort Systems USA, Inc. (Ñ) | | 9,800 | | 105 |
Commercial Metals Co. (Ñ) | | 14,200 | | 169 |
Compass Minerals International, Inc. | | 2,800 | | 164 |
Cytec Industries, Inc. | | 10,700 | | 227 |
Domtar Corp. (Æ)(Ñ) | | 52,691 | | 88 |
Dycom Industries, Inc. (Æ) | | 11,394 | | 94 |
Eagle Materials, Inc. (Ñ) | | 11,700 | | 215 |
Ecolab, Inc. | | 6,806 | | 239 |
EMCOR Group, Inc. (Æ) | | 15,152 | | 340 |
Encore Wire Corp. (Ñ) | | 4,600 | | 87 |
Energizer Holdings, Inc. (Æ)(Ñ) | | 3,951 | | 214 |
Energy Conversion Devices,
Inc. (Æ)(Ñ) | | 2,700 | | 68 |
EnerSys (Æ) | | 2,480 | | 27 |
Exide Technologies (Æ)(Ñ) | | 24,200 | | 128 |
Facet Biotech Corp. (Æ)(Ñ) | | 1,572 | | 15 |
FMC Corp. (Ñ) | | 8,635 | | 386 |
Glatfelter (Ñ) | | 21,100 | | 196 |
Haynes International, Inc. (Æ)(Ñ) | | 4,040 | | 100 |
HB Fuller Co. (Ñ) | | 8,800 | | 142 |
Hecla Mining Co. (Æ)(Ñ) | | 18,600 | | 52 |
IAMGOLD Corp. | | 51,257 | | 313 |
Innophos Holdings, Inc. (Ñ) | | 6,716 | | 133 |
Innospec, Inc. (Ñ) | | 4,791 | | 28 |
Insituform Technologies, Inc.
Class A (Æ)(Ñ) | | 19,951 | | 393 |
Insteel Industries, Inc. | | 2,465 | | 28 |
Jacobs Engineering Group, Inc. (Æ)(Ñ) | | 5,690 | | 274 |
KapStone Paper and Packaging
Corp. (Æ) | | 1,000 | | 2 |
Koppers Holdings, Inc. | | 2,360 | | 51 |
Layne Christensen Co. (Æ) | | 6,456 | | 155 |
Lennox International, Inc. (Ñ) | | 3,457 | | 112 |
Lydall, Inc. (Æ)(Ñ) | | 4,521 | | 26 |
McDermott International, Inc. (Æ) | | 6,006 | | 59 |
MeadWestvaco Corp. | | 4,060 | | 45 |
Mercer International, Inc. (Æ)(Ñ) | | 1,500 | | 3 |
Myers Industries, Inc. (Ñ) | | 16,300 | | 130 |
Neenah Paper, Inc. (Ñ) | | 10,800 | | 96 |
Olympic Steel, Inc. (Ñ) | | 3,300 | | 67 |
OM Group, Inc. (Æ)(Ñ) | | 14,705 | | 310 |
Owens-Illinois, Inc. (Æ) | | 3,050 | | 83 |
PAN American Silver Corp. (Æ)(Ñ) | | 12,746 | | 218 |
Perini Corp. (Æ)(Ñ) | | 4,900 | | 115 |
PolyOne Corp. (Æ) | | 3,100 | | 10 |
| | |
| Aggressive Equity Fund | | 29 |
Russell Investment Funds
Aggressive Equity Fund
Schedule of Investments, continued — December 31, 2008
Amounts in thousands (except share amounts)
| | | | |
| | | Principal
Amount ($)
or Shares | | Market
Value
$ |
| | | | |
Quaker Chemical Corp. | | 1,000 | | 16 |
Quanta Services, Inc. (Æ)(Ñ) | | 8,188 | | 162 |
Reliance Steel & Aluminum Co. | | 11,519 | | 230 |
Richmont Mines, Inc. (Æ)(Ñ) | | 3,994 | | 7 |
Rockwood Holdings, Inc. (Æ)(Ñ) | | 3,541 | | 38 |
Schulman A, Inc. | | 4,222 | | 72 |
Shaw Group, Inc. (The) (Æ)(Ñ) | | 2,875 | | 59 |
Silgan Holdings, Inc. | | 4,100 | | 196 |
Sims Metal Management, Ltd. - ADR (Ñ) | | 9,034 | | 112 |
Smurfit-Stone Container Corp. (Æ) | | 36,900 | | 9 |
Sonoco Products Co. | | 2,525 | | 59 |
Spartech Corp. | | 2,400 | | 15 |
Standard Register Co. (The) (Ñ) | | 2,100 | | 19 |
Symyx Technologies (Æ)(Ñ) | | 44,248 | | 263 |
Terra Industries, Inc. | | 4,973 | | 83 |
Texas Industries, Inc. (Ñ) | | 800 | | 28 |
Titanium Metals Corp. (Ñ) | | 13,513 | | 119 |
Tredegar Corp. | | 1,393 | | 25 |
Universal Forest Products, Inc. (Ñ) | | 3,100 | | 83 |
URS Corp. (Æ) | | 15,275 | | 623 |
US Concrete, Inc. (Æ)(Ñ) | | 4,200 | | 14 |
Valspar Corp. (Ñ) | | 917 | | 17 |
Xerium Technologies, Inc. (Æ) | | 2,112 | | 1 |
| | | | |
| | | | 9,416 |
| | | | |
| | |
| Miscellaneous - 1.3% | | | | |
Carlisle Cos., Inc. (Ñ) | | 5,800 | | 120 |
Castlepoint Holdings, Ltd. (Þ) | | 30,900 | | 419 |
GenTek, Inc. (Æ)(Ñ) | | 133 | | 2 |
Kaman Corp. Class A (Ñ) | | 10,600 | | 192 |
Lancaster Colony Corp. | | 5,114 | | 176 |
Teleflex, Inc. | | 9,726 | | 487 |
Trinity Industries, Inc. (Ñ) | | 10,100 | | 159 |
Walter Industries, Inc. Class A (Ñ) | | 167 | | 3 |
| | | | |
| | | | 1,558 |
| | | | |
| | |
| Other Energy - 3.8% | | | | |
Allis-Chalmers Energy, Inc. (Æ)(Ñ) | | 3,070 | | 17 |
Alpha Natural Resources, Inc. (Æ) | | 6,700 | | 108 |
Arena Resources, Inc. (Æ)(Ñ) | | 3,830 | | 108 |
Atwood Oceanics, Inc. (Æ)(Ñ) | | 2,105 | | 32 |
Brigham Exploration Co. (Æ)(Ñ) | | 26,724 | | 86 |
Bronco Drilling Co., Inc. (Æ)(Ñ) | | 3,178 | | 21 |
Callon Petroleum Co. (Æ)(Ñ) | | 224 | | 1 |
Cameron International Corp. (Æ) | | 7,650 | | 157 |
CARBO Ceramics, Inc. (Ñ) | | 9,540 | | 339 |
Cimarex Energy Co. (Ñ) | | 13,519 | | 362 |
Clayton Williams Energy, Inc. (Æ) | | 579 | | 26 |
Complete Production Services, Inc. (Æ)(Ñ) | | 7,427 | | 61 |
Comstock Resources, Inc. (Æ) | | 1,088 | | 51 |
Concho Resources, Inc. (Æ)(Ñ) | | 8,635 | | 197 |
Contango Oil & Gas Co. (Æ)(Ñ) | | 400 | | 23 |
Continental Resources, Inc. (Æ)(Ñ) | | 10,419 | | 216 |
Core Laboratories NV | | 2,072 | | 124 |
Dawson Geophysical Co. (Æ)(Ñ) | | 6,568 | | 117 |
Dynegy, Inc. Class A (Æ)(Ñ) | | 4,300 | | 9 |
Encore Acquisition Co. (Æ) | | 2,092 | | 53 |
| | | | |
| | | Principal
Amount ($)
or Shares | | Market
Value
$ |
Energy Partners, Ltd. (Æ)(Ñ) | | 7,267 | | 10 |
Energy XXI Bermuda, Ltd. | | 14,500 | | 11 |
EXCO Resources, Inc. (Æ)(Ñ) | | 18,777 | | 170 |
Exterran Holdings, Inc. (Æ)(Ñ) | | 4,588 | | 98 |
FMC Technologies, Inc. (Æ)(Ñ) | | 2,174 | | 52 |
Foundation Coal Holdings, Inc. | | 2,141 | | 30 |
Frontier Oil Corp. (Ñ) | | 24,000 | | 303 |
Geokinetics, Inc. (Æ) | | 23,010 | | 57 |
Gran Tierra Energy, Inc. (Æ)(Ñ) | | 9,001 | | 25 |
Helmerich & Payne, Inc. (Ñ) | | 7,450 | | 169 |
Hornbeck Offshore Services, Inc. (Æ)(Ñ) | | 8,641 | | 141 |
Key Energy Services, Inc. (Æ) | | 3,458 | | 15 |
Mariner Energy, Inc. (Æ)(Ñ) | | 8,649 | | 88 |
Massey Energy Co. (Ñ) | | 1,185 | | 16 |
Matrix Service Co. (Æ)(Ñ) | | 2,006 | | 15 |
McMoRan Exploration Co. (Æ)(Ñ) | | 2,151 | | 21 |
Meridian Resource Corp. (Æ) | | 4,900 | | 3 |
Newpark Resources (Æ) | | 32,300 | | 119 |
NV Energy, Inc. | | 6,137 | | 61 |
Oceaneering International, Inc. (Æ) | | 4,026 | | 117 |
Oil States International, Inc. (Æ) | | 1,800 | | 34 |
Parker Drilling Co. (Æ) | | 13,800 | | 40 |
Patterson-UTI Energy, Inc. (Ñ) | | 17,744 | | 204 |
Penn Virginia Corp. | | 3,328 | | 86 |
Penn Virginia GP Holdings, LP (Ñ) | | 272 | | 3 |
Precision Drilling Trust (Ñ) | | 2,960 | | 25 |
Reliant Energy, Inc. (Æ) | | 4,000 | | 23 |
Rowan Cos., Inc. (Ñ) | | 5,693 | | 91 |
Stone Energy Corp. (Æ)(Ñ) | | 5,167 | | 57 |
Superior Energy Services, Inc. (Æ) | | 6,924 | | 110 |
Swift Energy Co. (Æ)(Ñ) | | 3,900 | | 66 |
Targa Resources Partners, LP (Ñ) | | 13,242 | | 103 |
TXCO Resources, Inc. (Æ)(Ñ) | | 3,500 | | 5 |
Union Drilling, Inc. (Æ)(Ñ) | | 1,300 | | 7 |
Unit Corp. (Æ)(Ñ) | | 5,675 | | 152 |
W&T Offshore, Inc. (Ñ) | | 3,032 | | 43 |
Western Refining, Inc. (Ñ) | | 6,500 | | 50 |
| | | | |
| | | | 4,728 |
| | | | |
| | |
| Producer Durables - 5.7% | | | | |
Actuant Corp. Class A (Ñ) | | 3,879 | | 74 |
Aerovironment, Inc. (Æ)(Ñ) | | 8,100 | | 298 |
AGCO Corp. (Æ)(Ñ) | | 14,365 | | 339 |
Alliant Techsystems, Inc. (Æ)(Ñ) | | 198 | | 17 |
AM Castle & Co. (Ñ) | | 1,308 | | 14 |
Ametek, Inc. | | 2,800 | | 85 |
AO Smith Corp. (Ñ) | | 4,400 | | 130 |
Argon ST, Inc. (Æ)(Ñ) | | 2,600 | | 49 |
ATMI, Inc. (Æ)(Ñ) | | 164 | | 2 |
Baldor Electric Co. (Ñ) | | 13,000 | | 232 |
Bucyrus International, Inc. Class A (Ñ) | | 2,671 | | 49 |
Cascade Corp. (Ñ) | | 2,100 | | 63 |
Centex Corp. (Ñ) | | 17,700 | | 188 |
Chart Industries, Inc. (Æ) | | 3,295 | | 35 |
Cognex Corp. (Ñ) | | 2,154 | | 32 |
Cohu, Inc. (Ñ) | | 10,650 | | 129 |
Columbus McKinnon Corp. (Æ) | | 800 | | 11 |
| | |
| 30 | | Aggressive Equity Fund |
Russell Investment Funds
Aggressive Equity Fund
Schedule of Investments, continued — December 31, 2008
Amounts in thousands (except share amounts)
| | | | |
| | | Principal
Amount ($)
or Shares | | Market
Value
$ |
| | | | |
Covanta Holding Corp. (Æ)(Ñ) | | 770 | | 17 |
Crane Co. | | 5,332 | | 92 |
CTS Corp. (Ñ) | | 6,282 | | 35 |
Cummins, Inc. | | 1,227 | | 33 |
Donaldson Co., Inc. (Ñ) | | 4,100 | | 138 |
Dover Corp. (Ñ) | | 2,237 | | 74 |
DR Horton, Inc. (Ñ) | | 39,200 | | 277 |
Ducommun, Inc. | | 1,900 | | 32 |
Electro Scientific Industries, Inc. (Æ)(Ñ) | | 39,870 | | 271 |
EnPro Industries, Inc. (Æ) | | 500 | | 11 |
Esterline Technologies Corp. (Æ) | | 2,503 | | 95 |
Federal Signal Corp. (Ñ) | | 10,400 | | 85 |
Flowserve Corp. | | 3,286 | | 169 |
Gardner Denver, Inc. (Æ)(Ñ) | | 5,661 | | 132 |
GrafTech International, Ltd. (Æ) | | 14,767 | | 123 |
Hardinge, Inc. (Ñ) | | 1,400 | | 6 |
Herman Miller, Inc. (Ñ) | | 9,721 | | 127 |
Hovnanian Enterprises, Inc.
Class A (Æ)(Ñ) | | 11,900 | | 20 |
Hubbell, Inc. Class B (Ñ) | | 2,846 | | 93 |
Itron, Inc. (Æ)(Ñ) | | 4,854 | | 309 |
Joy Global, Inc. (Ñ) | | 8,452 | | 193 |
Kimball International, Inc. Class B (Ñ) | | 36,861 | | 317 |
Ladish Co., Inc. (Æ) | | 5,000 | | 69 |
Lam Research Corp. (Æ)(Ñ) | | 4,221 | | 90 |
Lexmark International, Inc.
Class A (Æ)(Ñ) | | 11,636 | | 313 |
Lincoln Electric Holdings, Inc. (Ñ) | | 1,743 | | 89 |
LTX-Credence Corp. (Æ) | | 7,232 | | 2 |
MasTec, Inc. (Æ)(Ñ) | | 12,100 | | 140 |
MDC Holdings, Inc. | | 1,971 | | 60 |
Meritage Homes Corp. (Æ) | | 4,200 | | 51 |
Mettler Toledo International,
Inc. (Æ)(Ñ) | | 1,684 | | 113 |
NVR, Inc. (Æ)(Ñ) | | 529 | | 241 |
Orbital Sciences Corp. (Æ) | | 1,722 | | 34 |
Park-Ohio Holdings Corp. (Æ) | | 1,100 | | 7 |
Perceptron, Inc. (Æ) | | 40,269 | | 136 |
Plantronics, Inc. (Ñ) | | 9,623 | | 127 |
Powerwave Technologies, Inc. (Æ)(Ñ) | | 17,000 | | 8 |
Pulte Homes, Inc. (Ñ) | | 15,247 | | 167 |
Regal-Beloit Corp. (Ñ) | | 255 | | 10 |
Ritchie Bros Auctioneers, Inc. (Ñ) | | 15,305 | | 328 |
Robbins & Myers, Inc. (Ñ) | | 4,085 | | 66 |
SBA Communications Corp.
Class A (Æ)(Ñ) | | 12,126 | | 198 |
Standex International Corp. | | 57 | | 1 |
Steelcase, Inc. Class A (Ñ) | | 317 | | 2 |
Symmetricom, Inc. (Æ)(Ñ) | | 783 | | 3 |
Technitrol, Inc. | | 3,100 | | 11 |
Tecumseh Products Co. Class A (Æ)(Ñ) | | 4,519 | | 43 |
Terex Corp. (Æ) | | 1,700 | | 29 |
Thermadyne Holdings Corp. (Æ)(Ñ) | | 3,575 | | 25 |
Thomas & Betts Corp. (Æ) | | 1,725 | | 41 |
Ultratech, Inc. (Æ) | | 2,739 | | 33 |
Waters Corp. (Æ) | | 4,819 | | 177 |
| | | | |
| | | | 7,010 |
| | | | |
| | |
| Technology - 11.8% | | | | |
3Com Corp. (Æ)(Ñ) | | 52,949 | | 121 |
Acxiom Corp. | | 24,106 | | 195 |
| | | | |
| | | Principal
Amount ($)
or Shares | | Market
Value
$ |
Adaptec, Inc. (Æ)(Ñ) | | 91,165 | | 301 |
ADC Telecommunications, Inc. (Æ)(Ñ) | | 19,000 | | 104 |
Adtran, Inc. (Ñ) | | 5,900 | | 88 |
Affiliated Computer Services, Inc. Class A (Æ) | | 6,800 | | 312 |
American Reprographics Co. (Æ) | | 6,488 | | 45 |
American Science & Engineering,
Inc. (Ñ) | | 2,650 | | 196 |
Amkor Technology, Inc. (Æ)(Ñ) | | 30,300 | | 66 |
Amphenol Corp. Class A | | 12,295 | | 295 |
Ansys, Inc. (Æ)(Ñ) | | 7,976 | | 222 |
Applied Micro Circuits Corp. (Æ)(Ñ) | | 16,900 | | 66 |
Arrow Electronics, Inc. (Æ) | | 10,750 | | 203 |
Autodesk, Inc. (Æ)(Ñ) | | 1,804 | | 35 |
Avnet, Inc. (Æ) | | 5,750 | | 105 |
Avocent Corp. (Æ)(Ñ) | | 3,052 | | 55 |
AVX Corp. (Ñ) | | 30,600 | | 243 |
Benchmark Electronics, Inc. (Æ) | | 16,600 | | 212 |
BMC Software, Inc. (Æ)(Ñ) | | 3,508 | | 94 |
Bookham, Inc. (Æ)(Ñ) | | 5,800 | | 3 |
Broadcom Corp. Class A (Æ)(Ñ) | | 8,303 | | 141 |
Cadence Design Systems, Inc. (Æ)(Ñ) | | 6,911 | | 25 |
Cavium Networks, Inc. (Æ)(Ñ) | | 3,800 | | 40 |
Celestica, Inc. (Æ)(Ñ) | | 18,350 | | 85 |
Ciber, Inc. (Æ)(Ñ) | | 23,200 | | 112 |
Computer Sciences Corp. (Æ) | | 2,159 | | 76 |
Compuware Corp. (Æ)(Ñ) | | 24,708 | | 167 |
COMSYS IT Partners, Inc. (Æ)(Ñ) | | 1,500 | | 3 |
Comtech Telecommunications
Corp. (Æ)(Ñ) | | 4,200 | | 192 |
Concur Technologies, Inc. (Æ)(Ñ) | | 7,800 | | 256 |
Constant Contact, Inc. (Æ)(Ñ) | | 8,950 | | 119 |
CSG Systems International, Inc. (Æ)(Ñ) | | 10,097 | | 176 |
Cubic Corp. (Ñ) | | 4,300 | | 117 |
Digital River, Inc. (Æ) | | 3,440 | | 85 |
Emulex Corp. (Æ) | | 3,000 | | 21 |
Equinix, Inc. (Æ)(Ñ) | | 6,280 | | 334 |
Extreme Networks (Æ)(Ñ) | | 1,508 | | 3 |
F5 Networks, Inc. (Æ)(Ñ) | | 3,776 | | 86 |
Flextronics International, Ltd. (Æ)(Ñ) | | 72,775 | | 186 |
Flir Systems, Inc. (Æ)(Ñ) | | 9,330 | | 286 |
Hittite Microwave Corp. (Æ)(Ñ) | | 5,891 | | 174 |
Hutchinson Technology, Inc. (Æ)(Ñ) | | 3,600 | | 12 |
II-VI, Inc. (Æ)(Ñ) | | 78 | | 1 |
Imation Corp. (Ñ) | | 2,366 | | 32 |
Informatica Corp. (Æ)(Ñ) | | 13,950 | | 192 |
Ingram Micro, Inc. Class A (Æ) | | 25,371 | | 340 |
Integrated Device Technology,
Inc. (Æ)(Ñ) | | 34,200 | | 192 |
InterDigital, Inc. (Æ)(Ñ) | | 2,089 | | 57 |
International Rectifier Corp. (Æ) | | 19,233 | | 260 |
Intersil Corp. Class A | | 16,000 | | 147 |
Interwoven, Inc. (Æ) | | 10,900 | | 137 |
Intuit, Inc. (Æ)(Ñ) | | 7,375 | | 175 |
Jabil Circuit, Inc. | | 43,300 | | 292 |
JDA Software Group, Inc. (Æ) | | 3,700 | | 49 |
JDS Uniphase Corp. (Æ)(Ñ) | | 31,979 | | 117 |
LSI Corp. (Æ)(Ñ) | | 5,066 | | 17 |
Mantech International Corp.
Class A (Æ) | | 3,400 | | 184 |
Mentor Graphics Corp. (Æ)(Ñ) | | 8,702 | | 45 |
| | |
| Aggressive Equity Fund | | 31 |
Russell Investment Funds
Aggressive Equity Fund
Schedule of Investments, continued — December 31, 2008
Amounts in thousands (except share amounts)
| | | | |
| | | Principal
Amount ($)
or Shares | | Market
Value
$ |
| | | | |
Methode Electronics, Inc. | | 2,900 | | 20 |
Micrel, Inc. (Ñ) | | 38,090 | | 278 |
Micros Systems, Inc. (Æ)(Ñ) | | 12,614 | | 206 |
Microsemi Corp. (Æ) | | 1,078 | | 14 |
MicroStrategy, Inc. Class A (Æ)(Ñ) | | 1,621 | | 60 |
Monolithic Power Systems, Inc. (Æ)(Ñ) | | 8,490 | | 107 |
NAM TAI Electronics, Inc. | | 30,100 | | 166 |
National Semiconductor Corp. (Ñ) | | 5,757 | | 58 |
NCR Corp. (Æ) | | 10,787 | | 152 |
Ness Technologies, Inc. (Æ) | | 2,700 | | 12 |
NetApp, Inc. (Æ) | | 5,375 | | 75 |
Netezza Corp. (Æ) | | 4,050 | | 27 |
Netlogic Microsystems, Inc. (Æ)(Ñ) | | 8,117 | | 179 |
Nice Systems, Ltd. - ADR (Æ) | | 21,404 | | 481 |
Novatel Wireless, Inc. (Æ) | | 3,400 | | 16 |
Novell, Inc. (Æ) | | 1,100 | | 4 |
OSI Systems, Inc. (Æ) | | 13,248 | | 183 |
PerkinElmer, Inc. | | 5,997 | | 83 |
Perot Systems Corp. Class A (Æ) | | 1,080 | | 15 |
QLogic Corp. (Æ)(Ñ) | | 9,100 | | 122 |
Quantum Corp. (Æ)(Ñ) | | 17,500 | | 6 |
Rackspace Hosting, Inc. (Æ) | | 10,956 | | 59 |
SAIC, Inc. (Æ) | | 15,778 | | 307 |
Sanmina-SCI Corp. (Æ)(Ñ) | | 119,573 | | 56 |
Sapient Corp. (Æ)(Ñ) | | 1,968 | | 9 |
Silicon Image, Inc. (Æ)(Ñ) | | 9,653 | | 41 |
Solera Holdings, Inc. (Æ) | | 13,402 | | 323 |
Standard Microsystems Corp. (Æ) | | 167 | | 3 |
Stanley, Inc. (Æ)(Ñ) | | 6,600 | | 239 |
Sunpower Corp. Class A (Æ)(Ñ) | | 800 | | 30 |
Sybase, Inc. (Æ)(Ñ) | | 17,078 | | 423 |
Synaptics, Inc. (Æ)(Ñ) | | 1,756 | | 29 |
Syniverse Holdings, Inc. (Æ) | | 36,615 | | 437 |
SYNNEX Corp. (Æ)(Ñ) | | 5,600 | | 63 |
Synopsys, Inc. (Æ) | | 5,870 | | 109 |
TeleCommunication Systems, Inc. (Æ) | | 13,700 | | 118 |
Tellabs, Inc. (Æ) | | 57,700 | | 238 |
Teradata Corp. (Æ) | | 2,282 | | 34 |
TIBCO Software, Inc. (Æ)(Ñ) | | 14,555 | | 76 |
Tier Technologies, Inc. Class B (Æ) | | 54,387 | | 294 |
Trimble Navigation, Ltd. (Æ)(Ñ) | | 6,061 | | 131 |
TTM Technologies, Inc. (Æ)(Ñ) | | 3,400 | | 18 |
Tyler Technologies, Inc. (Æ)(Ñ) | | 7,600 | | 91 |
Utstarcom, Inc. (Æ)(Ñ) | | 10,141 | | 19 |
Varian Semiconductor Equipment Associates, Inc. (Æ)(Ñ) | | 7,745 | | 140 |
Verint Systems, Inc. (Æ)(Ñ) | | 6,327 | | 44 |
Vignette Corp. (Æ)(Ñ) | | 3,820 | | 36 |
Vishay Intertechnology, Inc. (Æ) | | 74,595 | | 255 |
Vocus, Inc. (Æ)(Ñ) | | 10,952 | | 199 |
Western Digital Corp. (Æ) | �� | 15,258 | | 175 |
White Electronic Designs Corp. (Æ) | | 96,057 | | 352 |
| | | | |
| | | | 14,506 |
| | | | |
| | | | |
| | | Principal
Amount ($)
or Shares | | Market
Value
$ |
| Utilities - 5.1% | | | | |
AGL Resources, Inc. (Ñ) | | 9,529 | | 299 |
Allete, Inc. | | 3,300 | | 106 |
Alliant Energy Corp. | | 9,733 | | 284 |
Atlantic Tele-Network, Inc. | | 1,600 | | 42 |
Atmos Energy Corp. | | 18,517 | | 439 |
Avista Corp. | | 11,984 | | 232 |
California Water Service Group | | 3,400 | | 158 |
CenturyTel, Inc. (Ñ) | | 12,256 | | 335 |
Cleco Corp. (Ñ) | | 11,096 | | 253 |
CMS Energy Corp. (Ñ) | | 13,600 | | 137 |
Constellation Energy Group, Inc. (Ñ) | | 1,783 | | 45 |
El Paso Electric Co. (Æ) | | 2,000 | | 36 |
Embarq Corp. | | 1,415 | | 51 |
Energen Corp. | | 2,926 | | 86 |
Frontier Communications Corp. | | 2,179 | | 19 |
Hawaiian Electric Industries, Inc. (Ñ) | | 2,400 | | 53 |
Idacorp, Inc. (Ñ) | | 12,685 | | 374 |
Integrys Energy Group, Inc. (Ñ) | | 600 | | 26 |
Iowa Telecommunications Services, Inc. (Ñ) | | 5,815 | | 83 |
Laclede Group, Inc. (The) | | 2,800 | | 131 |
Leap Wireless International, Inc. (Æ)(Ñ) | | 4,316 | | 116 |
MDU Resources Group, Inc. | | 5,037 | | 109 |
MGE Energy, Inc. (Ñ) | | 300 | | 10 |
New Jersey Resources Corp. (Ñ) | | 9,550 | | 376 |
Nicor, Inc. (Ñ) | | 4,400 | | 153 |
NII Holdings, Inc. (Æ)(Ñ) | | 7,400 | | 134 |
Northwest Natural Gas Co. (Ñ) | | 2,300 | | 102 |
NTELOS Holdings Corp. | | 50 | | 1 |
OGE Energy Corp. (Ñ) | | 4,506 | | 116 |
Oneok, Inc. | | 1,300 | | 38 |
Otter Tail Corp. (Ñ) | | 6,600 | | 154 |
Pepco Holdings, Inc. | | 2,500 | | 44 |
Portland General Electric Co. | | 4,900 | | 95 |
Premiere Global Services, Inc. (Æ) | | 20,015 | | 172 |
SCANA Corp. (Ñ) | | 2,519 | | 90 |
Southwest Gas Corp. (Ñ) | | 13,840 | | 349 |
Southwest Water Co. (Ñ) | | 2,500 | | 8 |
TECO Energy, Inc. (Ñ) | | 7,600 | | 94 |
Telephone & Data Systems, Inc. | | 1,100 | | 35 |
UGI Corp. | | 27,478 | | 671 |
US Cellular Corp. (Æ) | | 1,100 | | 48 |
USA Mobility, Inc. (Æ) | | 3,600 | | 42 |
Westar Energy, Inc. | | 2,318 | | 47 |
Windstream Corp. (Ñ) | | 7,562 | | 70 |
| | | | |
| | | | 6,263 |
| | | | |
| | |
Total Common Stocks
(cost $145,506) | | | | 112,326 |
| | | | |
| |
| Short-Term Investments - 9.5% | | |
Russell Investment Company Russell
Money Market Fund | | 11,729,000 | | 11,729 |
| | | | |
| | |
Total Short-Term Investments
(cost $11,729) | | | | 11,729 |
| | | | |
| | |
| 32 | | Aggressive Equity Fund |
Russell Investment Funds
Aggressive Equity Fund
Schedule of Investments, continued — December 31, 2008
Amounts in thousands (except share amounts)
| | | | | |
| | | Principal
Amount ($)
or Shares | | Market
Value
$ | |
| | | | | |
| Other Securities - 39.2% | | | | | |
State Street Securities Lending Quality
Trust (×) | | 51,074,560 | | 48,271 | |
| | | | | |
| | |
Total Other Investments
(cost $51,075) | | | | 48,271 | |
| | | | | |
| | |
Total Investments - 140.0%
(identified cost $208,310) | | | | 172,326 | |
| | |
Other Assets and Liabilities,
Net - (40.0%) | | | | (49,238 | ) |
| | | | | |
| | |
| Net Assets - 100.0% | | | | 123,088 | |
| | | | | |
A portion of the portfolio has been fair valued as of period end.
See accompanying notes which are an integral part of the financial statements.
| | |
| Aggressive Equity Fund | | 33 |
Russell Investment Funds
Aggressive Equity Fund
Schedule of Investments, continued — December 31, 2008
Amounts in thousands (except contracts)
| | | | | | | | | | |
| Futures Contracts | | Number of
Contracts | | Notional
Amount | | Expiration
Date | | Unrealized
Appreciation
(Depreciation)
$ |
| | | | | | | | | | |
| | | | | | | | | | |
| Long Positions | | | | | | | | | | |
Russell 2000 Mini Index (CME) | | 274 | | USD | | 13,642 | | 03/09 | | 643 |
| | | | | | | | | | |
| | | | | |
Total Unrealized Appreciation (Depreciation) on Open Futures Contracts | | | | | | | | | | 643 |
| | | | | | | | | | |
Presentation of Portfolio Holdings — December 31, 2008
| | | |
| Portfolio Summary | | % of Net
Assets | |
| | | |
Auto and Transportation | | 3.9 | |
Consumer Discretionary | | 15.1 | |
Consumer Staples | | 2.7 | |
Financial Services | | 18.0 | |
Health Care | | 16.1 | |
Integrated Oils | | 0.1 | |
Materials and Processing | | 7.7 | |
Miscellaneous | | 1.3 | |
Other Energy | | 3.8 | |
Producer Durables | | 5.7 | |
Technology | | 11.8 | |
Utilities | | 5.1 | |
Short-Term Investments | | 9.5 | |
Other Securities | | 39.2 | |
| | | |
Total Investments | | 140.0 | |
Other Assets and Liabilities, Net | | (40.0 | ) |
| | | |
| |
| | 100.0 | |
| | | |
| |
Futures Contracts | | 0.5 | |
See accompanying notes which are an integral part of the financial statements.
| | |
| 34 | | Aggressive Equity Fund |
(This page intentionally left blank)
Russell Investment Funds
Non-U.S. Fund
Portfolio Management Discussion and Analysis — December 31, 2008 (Unaudited)
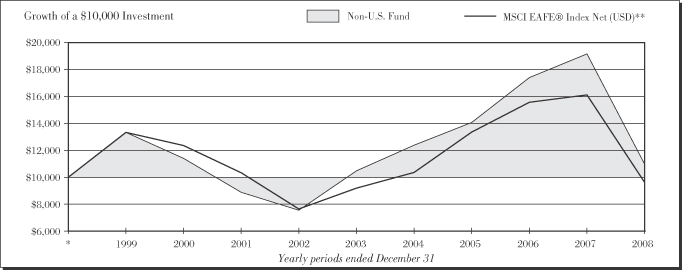
| | | | | |
|
| Non-U.S. Fund | |
| | | | | Total
Return | |
1 Year | | | | (42.79 | )% |
5 Years | | | | 0.93 | %§ |
10 Years | | | | 0.94 | %§ |
| | | | | |
|
| MSCI EAFE® Index Net (USD) ** | |
| | | | | Total
Return | |
1 Year | | | | (43.38 | )% |
5 Years | | | | 1.66 | %§ |
10 Years | | | | 0.80 | %§ |
| * | | Assumes initial investment on January 1, 1999. |
| ** | | Morgan Stanley Capital International Europe, Australia, Far East (MSCI EAFE) Index is an index composed of an arithmetic, market value-weighted average of the performance of approximately 1,600 securities listed on the stock exchange of the countries of Europe, Australia, and the Far East. The index is calculated on a total-return basis, which includes reinvestment of gross dividends before deduction of withholding taxes. |
The performance shown in this section does not reflect any Insurance Company Separate Account or Policy Charges. Performance is historical and assumes reinvestment of all dividends and capital gains. Investment return and principal value will fluctuate so that an investor’s shares, when redeemed, may be worth more or less than when purchased. Past performance is not indicative of future results.
Russell Investment Funds
Non-U.S. Fund
Portfolio Management Discussion — December 31, 2008 (Unaudited)
The Non-US Fund (the “Fund”) allocates most of its assets among multiple money managers. Russell Investment Management Company (“RIMCo”), as the Fund’s advisor, may change the allocation of the Fund’s assets among money managers at any time. An exemptive order from the Securities and Exchange Commission (SEC) permits RIMCo to engage or terminate a money manager at any time, subject to the approval by the Fund’s Board without a shareholder vote. Pursuant to the terms of the exemptive order, the Fund is required to notify its shareholders within 60 days of when a money manager begins providing services. The Fund currently has four money managers.
What is the Fund’s investment objective?
The Fund seeks to provide long term capital growth.
How did the Fund perform relative to its benchmark for the fiscal year ended December 31, 2008?
For the fiscal year ended December 31, 2008, the Non-U.S. Fund lost 42.79%. This compared to its benchmark the MSCI EAFE® Index Net (USD), which lost 43.38%. The Fund’s performance includes operating expenses, whereas Index returns are unmanaged and do not include expenses of any kind.
For the year ended December 31, 2008, the Lipper® International Core Funds (VIP) Average lost 43.13%. This result serves as a peer comparison and is expressed net of operating expenses.
How did the market conditions described in the Market Summary report affect the Fund’s performance?
The market environment proved extremely challenging. Precipitous changes in market leadership and economic trends left few places for managers to find protection from falling prices. Increasingly negative sentiment and rising risk aversion resulted in indiscriminate selling of stocks. Nowhere was this more evident than in the financials sector where managers sought safe havens in companies with less direct exposure to the credit crisis and stronger balance sheets they believed would offer competitive advantages in the midst of deteriorating conditions.
The Fund’s larger exposure to defensive strategies and its rotation earlier in the year into more defensive sectors, which fared better in this market environment, contributed to its performance relative to the MSCI EAFE Index. The Fund’s sector positioning, in the form of an overweight to the consumer staples and health care sectors, two relative outperforming sectors contributed positively to benchmark relative performance. The Fund’s underweight and favorable stock selection in the weak performing financials sector contributed positively to benchmark-relative results.
How did the investment strategies and techniques employed by the Fund and its money managers affect its performance?
The Fund’s multi-style discipline provided some risk control in the period given the extreme variability in investment style and
market leadership during the year. More defensive strategies helped moderate the impact of strategies more focused on stronger economic conditions. Wellington Management Company, LLP, the Fund’s aggressive, high growth manager, underperformed in this market environment. The combination of downward earnings revisions (i.e., lowered growth expectations) and contraction in valuations contributed to Wellington’s underperformance. However, the Fund’s more defensive managers were more effective in moderating downside risk. MFS Institutional Advisors, Inc., the Fund’s quality growth manager, benefited from exposure to the more stable earnings trends of consumer staples and health care, but also managed to avoid much of the volatility in the financials and materials sectors with a combination of underweighted positions and more defensive stock picks. Altrinsic Global Advisors, LLC, the Fund’s value manager, provided the best performance of the Fund’s four managers. Its quality value orientation effectively gained exposure to many of the market’s less negative trends. Altrinsic was particularly effective in its financial stock selection. The firm’s emphasis on Japanese banks, which it believed to be more insulated from the housing market problems affecting U.S., U.K., and other European banks, contributed positively to performance. The firm’s large overweight to consumer staples also contributed positively to its relative performance.
The Fund’s performance shown throughout this report was based on valuations calculated in accordance with Generally Accepted Accounting Principles (GAAP) and in accordance with a newly effective accounting statement (SFAS 157), reflects the December 31, 2008 market value of the pooled investment vehicle in which the Fund invested its cash collateral received in securities lending transactions. This market value is lower than the vehicle’s amortized cost per unit. This had a negative impact on the Fund’s benchmark relative performance.
Describe any changes to the Fund’s structure or the money manager line-up.
There were no changes to the Fund’s structure or money manager line-up during the year.
| | |
| |
Money Managers as of
December 31, 2008 | | Styles |
| Altrinsic Global Advisors, LLC | | Value |
| AQR Capital Management, LLC | | Market Oriented |
| MFS Institutional Advisors, Inc. | | Growth |
| Wellington Management Company, LLP | | Growth |
The views expressed in this report reflect those of the portfolio managers only through the end of the period covered by the report. These views do not necessarily represent the views of RIMCo, or any other person in RIMCo or any other affiliated organization. These views are subject to change at any time based upon market conditions or other events, and RIMCo disclaims any responsibility to update the views contained herein. These views should not be relied on as investment advice and, because investment decisions for Russell
Russell Investment Funds
Non-U.S. Fund
Portfolio Management Discussion — December 31, 2008 (Unaudited)
Investment Funds (RIF) are based on numerous factors, should not be relied on as an indication of investment decisions of any RIF Fund.
Russell Investment Funds
Non-U.S. Fund
Shareholder Expense Example — December 31, 2008 (Unaudited)
Fund Expenses
The following disclosure provides important information regarding each Fund’s Expense Example, which appears on each Fund’s individual page in this Annual Report. Please refer to this information when reviewing the Expense Example for a Fund.
Example
As a shareholder of the Fund, you incur two types of costs: (1) transaction costs, and (2) ongoing costs, including management fees and other Fund expenses. The Example is intended to help you understand your ongoing costs (in dollars) of investing in the Fund and to compare these costs with the ongoing costs of investing in other mutual funds. The Example is based on an investment of $1,000 invested at the beginning of the period and held for the entire period indicated, which for this Fund is from July 1, 2008 to December 31, 2008.
Actual Expenses
The information in the table under the heading “Actual Performance” provides information about actual account values and actual expenses. You may use the information in this column, together with the amount you invested, to estimate the expenses that you paid over the period. Simply divide your account value by $1,000 (for example, an $8,600 account value divided by $1,000 = 8.6), then multiply the result by the number in the first column in the row entitled “Expenses Paid During Period” to estimate the expenses you paid on your account during this period.
Hypothetical Example for Comparison Purposes
The information in the table under the heading “Hypothetical Performance (5% return before expenses)” provides information about hypothetical account values and hypothetical expenses based on the Fund’s actual expense ratio and an assumed rate of return of 5% per year before expenses, which is not the Fund’s actual return. The hypothetical account values and expenses may not be used to estimate the actual ending account balance or expenses you paid for the period. You may use this information to compare the ongoing costs of investing in the Fund and other funds. To do so, compare this 5% hypothetical example with the 5% hypothetical examples that appear in the shareholder reports of other funds.
Please note that the expenses shown in the table are meant to highlight your ongoing costs only and do not reflect any transactional costs. Therefore, the information under the heading “Hypothetical Performance (5% return before expenses)” is useful in comparing ongoing costs only, and will not help you determine the relative total costs of owning different funds. In addition, if these transactional costs were included, your costs would have been higher. The fee and expenses shown in this section do not reflect any Insurance Company Separate Account or Policy Charges.
| | | | | | |
| | | Actual
Performance | | Hypothetical
Performance
(5% return
before expenses) |
| | | | | | |
Beginning Account Value | | | | | | |
July 1, 2008 | | $ | 1,000.00 | | $ | 1,000.00 |
Ending Account Value | | | | | | |
December 31, 2008 | | $ | 645.38 | | $ | 1,019.36 |
Expenses Paid During Period* | | $ | 4.76 | | $ | 5.84 |
| * | Expenses are equal to the Fund’s annualized expense ratio of 1.15% (representing the one-half year period annualized), multiplied by the average account value over the period, multiplied by 184/366 (to reflect the one-half year period). Reflects amounts waived and/or reimbursed. Without the waiver and/or reimbursement, expenses would have been higher. |
Russell Investment Funds
Non-U.S. Fund
Schedule of Investments — December 31, 2008
Amounts in thousands (except share amounts)
| | | | |
| | | Principal Amount ($)
or Shares | | Market Value
$ |
| | | | |
| Common Stocks - 85.7% | | |
| Australia - 1.8% | | | | |
ABC Learning Centres, Ltd. | | 5,058 | | 2 |
AGL Energy, Ltd. | | 2,214 | | 24 |
Allco Finance Group, Ltd. (Æ) | | 99,445 | | 10 |
Amcor, Ltd. | | 9,245 | | 37 |
AMP, Ltd. | | 3,583 | | 14 |
Ansell, Ltd. - GDR | | 9,646 | | 85 |
APN News & Media, Ltd. | | 3,571 | | 6 |
Aristocrat Leisure, Ltd. | | 3,217 | | 9 |
Asciano Group | | 3,522 | | 4 |
Austereo Group, Ltd. | | 1,180 | | 1 |
Australia & New Zealand Banking Group, Ltd. | | 10,048 | | 108 |
AWB, Ltd. | | 8,288 | | 15 |
AXA Asia Pacific Holdings, Ltd. | | 8,105 | | 28 |
BHP Billiton, Ltd. | | 24,544 | | 517 |
BlueScope Steel, Ltd. | | 20,491 | | 50 |
Brambles, Ltd. | | 12,055 | | 63 |
Caltex Australia, Ltd. | | 1,581 | | 8 |
Centennial Coal Co., Ltd. | | 1,311 | | 3 |
CFS Retail Property Trust (ö) | | 11,495 | | 15 |
Coca-Cola Amatil, Ltd. | | 2,513 | | 16 |
Commonwealth Bank of Australia | | 9,685 | | 196 |
CSL, Ltd. | | 17,686 | | 418 |
Dexus Property Group (ö) | | 19,680 | | 11 |
Downer EDI, Ltd. | | 24,211 | | 65 |
Fairfax Media, Ltd. | | 2,156 | | 2 |
Felix Resources, Ltd. | | 10,357 | | 64 |
Flight Centre, Ltd. | | 1,861 | | 10 |
Foster’s Group, Ltd. | | 35,811 | | 138 |
Goodman Group (ö) | | 11,147 | | 6 |
GPT Group (ö) | | 25,815 | | 17 |
Insurance Australia Group, Ltd. | | 5,003 | | 14 |
Macquarie Infrastructure Group | | 8,462 | | 10 |
Macquarie Office Trust (ö) | | 20,228 | | 3 |
Metcash, Ltd. | | 14,233 | | 44 |
Mirvac Group (ö) | | 7,928 | | 7 |
Mount Gibson Iron, Ltd. (Æ) | | 46,934 | | 15 |
National Australia Bank, Ltd. | | 38,026 | | 557 |
Newcrest Mining, Ltd. | | 29,968 | | 711 |
Origin Energy, Ltd. | | 5,224 | | 59 |
PaperlinX, Ltd. | | 21,919 | | 11 |
Qantas Airways, Ltd. | | 24,638 | | 45 |
QBE Insurance Group, Ltd. | | 19,514 | | 355 |
Rio Tinto, Ltd. | | 1,615 | | 43 |
Santos, Ltd. | | 4,216 | | 44 |
Spotless Group, Ltd. | | 2,419 | | 5 |
Stockland (ö) | | 8,441 | | 24 |
Suncorp-Metway, Ltd. | | 13,187 | | 78 |
TABCORP Holdings, Ltd. | | 11,727 | | 57 |
Telstra Corp., Ltd. | | 43,915 | | 118 |
Wesfarmers, Ltd. | | 3,696 | | 47 |
Westfield Group (ö) | | 11,911 | | 110 |
Westpac Banking Corp. | | 19,473 | | 232 |
Woolworths, Ltd. | | 7,174 | | 134 |
| | | | |
| | | | 4,665 |
| | | | |
| | | | |
| | | Principal Amount ($)
or Shares | | Market Value
$ |
| Austria - 0.3% | | | | |
Erste Bank der Oesterreichischer Sparkassen AG (Ñ) | | 29,622 | | 694 |
| | | | |
| | |
| Belgium - 0.2% | | | | |
Delhaize Group | | 176 | | 11 |
Euronav NV | | 2,483 | | 34 |
Hansen Transmissions International NV (Æ) | | 193,827 | | 327 |
Nationale A Portefeuille | | 1,525 | | 74 |
Tessenderlo Chemie NV | | 2,988 | | 91 |
Umicore | | 2,248 | | 44 |
| | | | |
| | | | 581 |
| | | | |
| | |
| Bermuda - 0.3% | | | | |
Catlin Group, Ltd. | | 6,829 | | 43 |
Cheung Kong Infrastructure Holdings, Ltd. | | 2,000 | | 8 |
Chinese Estates Holdings, Ltd. | | 18,000 | | 21 |
Esprit Holdings, Ltd. | | 6,652 | | 38 |
First Pacific Co. | | 4,000 | | 1 |
Giordano International, Ltd. | | 11,474 | | 3 |
Great Eagle Holdings, Ltd. | | 1,000 | | 1 |
Hongkong Land Holdings, Ltd. | | 1,000 | | 2 |
Jardine Matheson Holdings, Ltd. | | 400 | | 7 |
Li & Fung, Ltd. | | 286,000 | | 493 |
Mongolia Energy Co. Ltd (Æ) | | 1,000 | | — |
Noble Group, Ltd. | | 11,000 | | 8 |
Orient Overseas International, Ltd. | | 8,300 | | 19 |
Pacific Basin Shipping, Ltd. | | 6,000 | | 3 |
Seadrill, Ltd. | | 17,850 | | 145 |
Texwinca Holdings, Ltd. | | 16,000 | | 7 |
VTech Holdings, Ltd. | | 1,133 | | 5 |
| | | | |
| | | | 804 |
| | | | |
| | |
| Brazil - 0.4% | | | | |
Cia Vale do Rio Doce - ADR (Ñ) | | 29,700 | | 360 |
Petroleo Brasileiro SA - ADR | | 19,300 | | 472 |
Unibanco - Uniao de Bancos Brasileiros SA - ADR | | 2,600 | | 168 |
| | | | |
| | | | 1,000 |
| | | | |
| | |
| Canada - 1.5% | | | | |
Barrick Gold Corp. | | 21,100 | | 776 |
Canadian National Railway Co. | | 23,330 | | 857 |
Canadian Natural Resources, Ltd. | | 11,300 | | 446 |
Potash Corp. of Saskatchewan | | 5,900 | | 432 |
Research In Motion, Ltd. (Æ)(Ñ) | | 9,900 | | 402 |
Rogers Communications, Inc. | | 13,600 | | 403 |
Suncor Energy, Inc. | | 23,200 | | 446 |
| | | | |
| | | | 3,762 |
| | | | |
| | |
| Cayman Islands - 0.1% | | | | |
Ctrip.com International, Ltd. (Ñ) | | 8,500 | | 202 |
Hutchison Telecommunications International, Ltd. | | 71,457 | | 19 |
LDK Solar Co., Ltd. - ADR (Æ)(Ñ) | | 5,300 | | 70 |
| | | | |
| | | | 291 |
| | | | |
Russell Investment Funds
Non-U.S. Fund
Schedule of Investments, continued — December 31, 2008
Amounts in thousands (except share amounts)
| | | | |
| | | Principal Amount ($)
or Shares | | Market Value
$ |
| | | | |
| China - 0.2% | | | | |
China Communications Construction Co., Ltd. Class H | | 295,000 | | 369 |
China Merchants Bank Co., Ltd. | | 104,000 | | 195 |
| | | | |
| | | | 564 |
| | | | |
| | |
| Czech Republic - 0.2% | | | | |
Komercni Banka AS (Ñ) | | 2,918 | | 449 |
| | | | |
| | |
| Denmark - 0.3% | | | | |
AP Moller - Maersk A/S | | 49 | | 263 |
H Lundbeck A/S (Ñ) | | 2,289 | | 48 |
Novo Nordisk A/S Series B | | 234 | | 12 |
TDC A/S | | 7 | | — |
Vestas Wind Systems A/S (Æ) | | 8,856 | | 526 |
| | | | |
| | | | 849 |
| | | | |
| | |
| Finland - 0.8% | | | | |
Fortum OYJ | | 15,513 | | 333 |
Konecranes OYJ | | 3,872 | | 66 |
Nokia OYJ | | 90,439 | | 1,402 |
Oriola-KD OYJ | | 3,393 | | 6 |
Outokumpu OYJ | | 5,849 | | 69 |
Rautaruukki OYJ | | 2,789 | | 48 |
Sanoma OYJ | | 1,652 | | 22 |
Stora Enso OYJ Class R | | 3,481 | | 27 |
| | | | |
| | | | 1,973 |
| | | | |
| | |
| France - 12.3% | | | | |
Air Liquide SA | | 13,283 | | 1,215 |
Alcatel-Lucent - ADR (Æ)(Ñ) | | 10,008 | | 22 |
Alstom SA | | 853 | | 50 |
AXA SA | | 87,852 | | 1,959 |
bioMerieux | | 733 | | 61 |
BNP Paribas | | 18,902 | | 798 |
Bouygues | | 229 | | 10 |
Carrefour SA (Ñ) | | 39,160 | | 1,504 |
Christian Dior SA | | 579 | | 33 |
Ciments Francais SA | | 461 | | 39 |
CNP Assurances | | 3,062 | | 222 |
Credit Agricole SA | | 5,796 | | 66 |
Eramet | | 155 | | 30 |
France Telecom SA | | 42,984 | | 1,202 |
GDF Suez (Ñ) | | 55,393 | | 2,743 |
Ipsos | | 466 | | 13 |
L’Oreal SA (Ñ) | | 10,667 | | 927 |
Lagardere SCA | | 2,958 | | 120 |
Legrand SA (Ñ) | | 45,299 | | 870 |
LVMH Moet Hennessy Louis Vuitton SA | | 35,062 | | 2,356 |
M6-Metropole Television | | 1,694 | | 33 |
Neopost SA | | 2,450 | | 222 |
Nexans SA (Ñ) | | 1,333 | | 80 |
Pernod-Ricard SA (Ñ) | | 17,684 | | 1,311 |
PPR (Ñ) | | 2,485 | | 162 |
Sanofi-Aventis SA | | 48,675 | | 3,092 |
Schneider Electric SA (Ñ) | | 25,940 | | 1,938 |
| | | | |
| | | Principal Amount ($)
or Shares | | Market Value
$ |
Sodexo | | 876 | | 48 |
Teleperformance - GDR | | 13,303 | | 371 |
Thales SA | | 29,699 | | 1,239 |
Total SA | | 92,896 | | 5,064 |
UBISOFT Entertainment (Æ) | | 7,641 | | 149 |
Unibail-Rodamco (ö) | | 140 | | 21 |
Valeo SA (Ñ) | | 5,813 | | 86 |
Vallourec (Ñ) | | 385 | | 44 |
Veolia Environnement | | 3,912 | | 123 |
Vivendi | | 99,323 | | 3,234 |
| | | | |
| | | | 31,457 |
| | | | |
| | |
| Germany - 7.3% | | | | |
Allianz SE | | 17,268 | | 1,852 |
BASF SE | | 14,826 | | 586 |
Bayer AG (Ñ) | | 31,705 | | 1,862 |
Commerzbank AG (Ñ) | | 8,596 | | 82 |
Daimler AG | | 3,075 | | 117 |
Deutsche Bank AG (Ñ) | | 5,466 | | 218 |
Deutsche Boerse AG | | 9,300 | | 677 |
Deutsche Lufthansa AG | | 5,694 | | 90 |
Deutsche Postbank AG (Æ)(Ñ) | | 2,274 | | 50 |
Deutsche Telekom AG | | 37,023 | | 563 |
E.ON AG | | 47,189 | | 1,908 |
Fielmann AG | | 357 | | 23 |
Fresenius Medical Care AG & Co. | | 8,643 | | 405 |
Generali Deutschland Holding AG | | 319 | | 33 |
Hannover Rueckversicherung AG (Æ) | | 14,074 | | 448 |
Lanxess AG | | 6,445 | | 125 |
Linde AG | | 24,080 | | 2,038 |
Merck KGAA | | 14,690 | | 1,336 |
Metro AG | | 21,121 | | 856 |
MTU Aero Engines Holding AG | | 4,491 | | 124 |
Muenchener Rueckversicherungs AG | | 5,451 | | 857 |
Norddeutsche Affinerie AG | | 340 | | 14 |
RWE AG | | 3,282 | | 295 |
Salzgitter AG | | 5,485 | | 433 |
SAP AG | | 38,020 | | 1,363 |
Siemens AG | | 13,069 | | 979 |
Symrise AG | | 70,217 | | 992 |
ThyssenKrupp AG | | 228 | | 6 |
Tognum AG | | 6,881 | | 88 |
Volkswagen AG | | 548 | | 192 |
Wacker Chemie AG | | 709 | | 75 |
Wincor Nixdorf AG | | 1,073 | | 51 |
| | | | |
| | | | 18,738 |
| | | | |
| | |
| Hong Kong - 0.7% | | | | |
BOC Hong Kong Holdings, Ltd. | | 37,500 | | 43 |
Cheung Kong Holdings, Ltd. | | 65,340 | | 623 |
China Mobile, Ltd. | | 35,500 | | 360 |
CLP Holdings, Ltd. | | 15,500 | | 105 |
Hang Lung Group, Ltd. | | 8,763 | | 27 |
Hang Lung Properties, Ltd. - ADR | | 9,000 | | 20 |
Hang Seng Bank, Ltd. | | 3,200 | | 42 |
Henderson Land Development Co., Ltd. | | 5,000 | | 19 |
Hong Kong & China Gas Co., Ltd. | | 2,000 | | 3 |
Russell Investment Funds
Non-U.S. Fund
Schedule of Investments, continued — December 31, 2008
Amounts in thousands (except share amounts)
| | | | |
| | | Principal Amount ($)
or Shares | | Market Value
$ |
| | | | |
Hong Kong Exchanges and Clearing, Ltd. | | 6,654 | | 64 |
HongKong & Shanghai Hotels (The) | | 1,500 | | 1 |
HongKong Electric Holdings | | 13,500 | | 76 |
Hopewell Holdings | | 9,000 | | 30 |
Hutchison Whampoa, Ltd. | | 19,000 | | 96 |
Hysan Development Co., Ltd. | | 20,000 | | 33 |
Industrial and Commercial Bank of China Asia, Ltd. | | 28,000 | | 30 |
Link REIT (The) (ö) | | 13,500 | | 22 |
New World Development, Ltd. | | 16,000 | | 16 |
Sun Hung Kai Properties, Ltd. | | 7,667 | | 64 |
Swire Pacific, Ltd. | | 8,000 | | 55 |
Television Broadcasts, Ltd. | | 9,000 | | 30 |
Wharf Holdings, Ltd. | | 7,000 | | 19 |
Wheelock & Co., Ltd. | | 13,205 | | 29 |
| | | | |
| | | | 1,807 |
| | | | |
| | |
| India - 0.2% | | | | |
Infosys Technologies, Ltd. - ADR (Ñ) | | 25,620 | | 629 |
| | | | |
| | |
| Indonesia - 0.0% | | | | |
Telekomunikasi Indonesia Tbk PT - ADR | | 1,750 | | 44 |
| | | | |
| | |
| Israel - 0.5% | | | | |
Teva Pharmaceutical Industries, Ltd. - ADR (Ñ) | | 29,000 | | 1,235 |
| | | | |
| | |
| Italy - 1.7% | | | | |
Alleanza Assicurazioni SpA (Ñ) | | 93,388 | | 761 |
Ansaldo STS SpA | | 38,948 | | 549 |
Banco Popolare SC | | 10,472 | | 73 |
Buzzi Unicem SpA | | 3,159 | | 52 |
Credito Emiliano SpA | | 3,435 | | 18 |
Davide Campari-Milano SpA | | 11,086 | | 75 |
Enel SpA | | 23,244 | | 149 |
ENI SpA | | 62,559 | | 1,482 |
Fondiaria-Sai SpA | | 50 | | 1 |
Indesit Co. SpA | | 7,935 | | 48 |
Intesa Sanpaolo SpA (Æ) | | 195,484 | | 704 |
Maire Tecnimont SpA | | 6,342 | | 13 |
Mediaset SpA (Ñ) | | 16,214 | | 93 |
Milano Assicurazioni SPA | | 6,076 | | 19 |
Pirelli & C SpA | | 146,470 | | 54 |
Saras SpA | | 4,025 | | 14 |
Terna Rete Elettrica Nazionale SpA | | 49,456 | | 162 |
UniCredit SpA (Æ) | | 11,873 | | 29 |
Unione di Banche Italiane SCPA | | 657 | | 9 |
Unipol Gruppo Finanziario SpA | | 9,537 | | 15 |
| | | | |
| | | | 4,320 |
| | | | |
| | |
| Japan - 19.1% | | | | |
77 Bank, Ltd. (The) | | 5,000 | | 27 |
Aeon Credit Service Co., Ltd. (Ñ) | | 41,000 | | 434 |
Aiful Corp. (Ñ) | | 4,400 | | 13 |
Aioi Insurance Co., Ltd. | | 8,000 | | 42 |
Aisin Seiki Co., Ltd. | | 3,100 | | 44 |
Alps Electric Co., Ltd. | | 7,300 | | 36 |
| | | | |
| | | Principal Amount ($)
or Shares | | Market Value
$ |
Amada Co., Ltd. | | 5,000 | | 24 |
Aruze Corp. | | 700 | | 7 |
Asahi Glass Co., Ltd. | | 6,000 | | 34 |
Astellas Pharma, Inc. | | 13,400 | | 545 |
Bank of Yokohama, Ltd. (The) | | 165,366 | | 978 |
Bridgestone Corp. | | 3,400 | | 51 |
Brother Industries, Ltd. (Ñ) | | 9,700 | | 58 |
Calsonic Kansei Corp. | | 18,000 | | 26 |
Canon Marketing Japan, Inc. (Ñ) | | 7,600 | | 123 |
Canon, Inc. | | 98,400 | | 3,089 |
Casio Computer Co., Ltd. | | 5,900 | | 37 |
Central Glass Co., Ltd. | | 20,000 | | 81 |
Central Japan Railway Co. | | 4 | | 35 |
Chubu Electric Power Co., Inc. | | 5,300 | | 161 |
Circle K Sunkus Co., Ltd. (Ñ) | | 6,600 | | 119 |
Coca-Cola West Co., Ltd. (Ñ) | | 2,200 | | 48 |
COMSYS Holdings Corp. | | 5,000 | | 46 |
Credit Saison Co., Ltd. (Ñ) | | 1,000 | | 14 |
Dai Nippon Printing Co., Ltd. | | 11,000 | | 121 |
Daiei, Inc. (The) (Æ)(Ñ) | | 6,500 | | 42 |
Daiichi Chuo Kisen Kaisha | | 9,000 | | 25 |
Daiichi Sankyo Co., Ltd. | | 3,200 | | 76 |
Daishi Bank, Ltd. (The) | | 10,000 | | 44 |
Daito Trust Construction Co., Ltd. | | 500 | | 26 |
Daiwa Securities Group, Inc. (Ñ) | | 87,450 | | 521 |
Denso Corp. | | 7,700 | | 128 |
DIC Corp. | | 4,000 | | 8 |
Doutor Nichires Holdings Co., Ltd. | | 700 | | 15 |
East Japan Railway Co. (Å) | | 52 | | 415 |
Ebara Corp. (Ñ) | | 13,000 | | 30 |
Eisai Co., Ltd. (Ñ) | | 6,800 | | 282 |
Exedy Corp. | | 2,600 | | 26 |
FamilyMart Co., Ltd. | | 2,100 | | 91 |
Fanuc, Ltd. | | 19,600 | | 1,394 |
Fuji Fire & Marine Insurance Co., Ltd. (The) | | 22,000 | | 33 |
Fuji Media Holdings, Inc. | | 554 | | 793 |
FUJIFILM Holdings Corp. | | 4,800 | | 106 |
Fujitsu, Ltd. | | 3,000 | | 15 |
Funai Electric Co., Ltd. | | 1,900 | | 39 |
Furukawa Electric Co., Ltd. | | 2,000 | | 10 |
FUTABA Corp. | | 1,500 | | 19 |
Glory, Ltd. | | 5,100 | | 100 |
Gunze, Ltd. | | 5,000 | | 16 |
H2O Retailing Corp. (Ñ) | | 6,000 | | 45 |
Hachijuni Bank, Ltd. (The) (Ñ) | | 3,000 | | 17 |
Hakuhodo DY Holdings, Inc. | | 450 | | 25 |
Higo Bank, Ltd. (The) | | 9,000 | | 57 |
Hino Motors, Ltd. | | 8,000 | | 16 |
Hirose Electric Co., Ltd. (Ñ) | | 5,200 | | 525 |
Hitachi Cable, Ltd. | | 13,000 | | 29 |
Hitachi Capital Corp. | | 4,800 | | 60 |
Hitachi High-Technologies Corp. (Ñ) | | 2,100 | | 34 |
Hitachi Software Engineering Co., Ltd. | | 3,300 | | 51 |
Hitachi Transport System, Ltd. | | 5,000 | | 75 |
Hitachi, Ltd. | | 22,000 | | 85 |
Hokkoku Bank, Ltd. (The) (Ñ) | | 12,000 | | 42 |
Russell Investment Funds
Non-U.S. Fund
Schedule of Investments, continued — December 31, 2008
Amounts in thousands (except share amounts)
| | | | |
| | | Principal Amount ($)
or Shares | | Market Value
$ |
| | | | |
Honda Motor Co., Ltd. | | 8,800 | | 191 |
Hoya Corp. | | 63,900 | | 1,110 |
Inpex Holdings, Inc. | | 186 | | 1,470 |
Isuzu Motors, Ltd. | | 47,000 | | 60 |
Itoham Foods, Inc. | | 22,000 | | 80 |
JFE Holdings, Inc. (Ñ) | | 2,300 | | 61 |
JFE Shoji Holdings, Inc. | | 16,000 | | 49 |
JGC Corp. | | 3,000 | | 45 |
Joyo Bank, Ltd. (The) (Ñ) | | 266,940 | | 1,521 |
JSR Corp. (Ñ) | | 8,200 | | 92 |
Kagoshima Bank, Ltd. (The) | | 12,000 | | 100 |
Kaken Pharmaceutical Co., Ltd. | | 6,000 | | 66 |
Kamigumi Co., Ltd. | | 6,000 | | 54 |
Kandenko Co., Ltd. (Ñ) | | 2,000 | | 16 |
Kaneka Corp. | | 10,000 | | 64 |
Kansai Electric Power Co., Inc. (The) | | 700 | | 20 |
Kansai Paint Co., Ltd. | | 21,000 | | 107 |
Kao Corp. | | 64,000 | | 1,938 |
KDDI Corp. | | 14 | | 100 |
Keihin Corp. (Ñ) | | 9,900 | | 72 |
Keiyo Bank, Ltd. (The) | | 2,000 | | 10 |
Keyence Corp. | | 3,556 | | 728 |
Kinden Corp. | | 4,000 | | 36 |
Kintetsu World Express, Inc. (Ñ) | | 1,000 | | 20 |
Kobayashi Pharmaceutical Co., Ltd. (Ñ) | | 500 | | 21 |
Komatsu, Ltd. (Ñ) | | 17,500 | | 222 |
Komori Corp. | | 6,800 | | 75 |
Konica Minolta Holdings, Inc. | | 24,000 | | 186 |
Kose Corp. | | 60,640 | | 1,524 |
Kuraray Co., Ltd. (Ñ) | | 9,000 | | 70 |
Kyocera Corp. | | 1,100 | | 79 |
Kyoei Steel, Ltd. (Ñ) | | 1,400 | | 28 |
Lawson, Inc. | | 1,700 | | 98 |
Leopalace21 Corp. | | 2,300 | | 23 |
Lintec Corp. | | 3,800 | | 53 |
Matsumotokiyoshi Holdings Co., Ltd. | | 1,000 | | 21 |
Mediceo Paltac Holdings Co., Ltd. (Æ) | | 1,300 | | 16 |
MID Reit, Inc. Class A (ö) | | 180 | | 345 |
Miraca Holdings, Inc. | | 1,500 | | 33 |
Mitsubishi Corp. | | 5,400 | | 76 |
Mitsubishi Electric Corp. | | 4,000 | | 25 |
Mitsubishi Estate Co., Ltd. | | 8,000 | | 132 |
Mitsubishi Heavy Industries, Ltd. | | 5,000 | | 22 |
Mitsubishi Materials Corp. | | 17,000 | | 43 |
Mitsubishi UFJ Financial Group, Inc. | | 155,992 | | 968 |
Mitsubishi UFJ Lease & Finance Co., Ltd. (Ñ) | | 2,610 | | 66 |
Mitsui & Co., Ltd. | | 13,000 | | 133 |
Mitsui Fudosan Co., Ltd. | | 27,000 | | 449 |
Mitsui OSK Lines, Ltd. | | 8,000 | | 49 |
Mitsui Sumitomo Insurance Group Holdings, Inc. | | 53,200 | | 1,697 |
Mizuho Financial Group, Inc. (Ñ)(Å) | | 168 | | 501 |
Musashino Bank, Ltd. (The) | | 900 | | 35 |
Nachi-Fujikoshi Corp. | | 3,000 | | 6 |
Namco Bandai Holdings, Inc. | | 5,000 | | 55 |
NEC Corp. (Ñ) | | 21,000 | | 70 |
| | | | |
| | | Principal Amount ($)
or Shares | | Market Value
$ |
NEC Electronics Corp. (Æ) | | 3,600 | | 34 |
NGK Insulators, Ltd. | | 4,000 | | 45 |
Nichirei Corp. | | 24,000 | | 114 |
Nifco, Inc. | | 3,000 | | 31 |
Nintendo Co., Ltd. | | 2,500 | | 961 |
Nippon Building Fund, Inc. Class A (ö) | | 2 | | 22 |
Nippon Commercial Investment Corp. (ö)(Ñ) | | 131 | | 139 |
Nippon Electric Glass Co., Ltd. | | 9,000 | | 47 |
Nippon Express Co., Ltd. | | 27,000 | | 114 |
Nippon Kayaku Co., Ltd. | | 11,000 | | 57 |
Nippon Konpo Unyu Soko Co., Ltd. | | 4,000 | | 44 |
Nippon Oil Corp. | | 17,000 | | 86 |
Nippon Seiki Co., Ltd. | | 1,000 | | 6 |
Nippon Sheet Glass Co., Ltd. | | 6,000 | | 20 |
Nippon Shinyaku Co., Ltd. | | 1,000 | | 12 |
Nippon Steel Corp. | | 26,000 | | 85 |
Nippon Telegraph & Telephone Corp. | | 30 | | 167 |
Nippon Yusen KK (Ñ) | | 10,000 | | 62 |
Nipponkoa Insurance Co., Ltd. | | 239,490 | | 1,862 |
Nishimatsuya Chain Co., Ltd. | | 1,600 | | 15 |
Nissan Motor Co., Ltd. | | 11,100 | | 40 |
Nissan Shatai Co., Ltd. | | 11,000 | | 68 |
Nissay Dowa General Insurance Co., Ltd. | | 4,000 | | 25 |
Nisshin Seifun Group, Inc. | | 5,000 | | 66 |
Nissin Kogyo Co., Ltd. | | 500 | | 4 |
Nitto Denko Corp. | | 2,300 | | 44 |
Nomura Holdings, Inc. (Ñ) | | 95,020 | | 784 |
Nomura Research Institute, Ltd. (Ñ) | | 69,165 | | 1,313 |
NTN Corp. (Ñ) | | 6,000 | | 18 |
NTT DoCoMo, Inc. | | 209 | | 412 |
Okinawa Electric Power Co., Inc. (The) | | 800 | | 60 |
OKUMA Corp. (Æ) | | 4,000 | | 15 |
Omron Corp. | | 21,700 | | 291 |
Ono Pharmaceutical Co., Ltd. | | 400 | | 21 |
ORIX Corp. | | 890 | | 51 |
Osaka Gas Co., Ltd. | | 25,000 | | 115 |
Panasonic Corp. | | 14,000 | | 175 |
Promise Co., Ltd. (Ñ) | | 1,150 | | 29 |
QP Corp. (Ñ) | | 6,800 | | 93 |
Ricoh Co., Ltd. | | 1,000 | | 13 |
Rohm Co., Ltd. | | 3,000 | | 151 |
San-In Godo Bank, Ltd. (The) | | 4,000 | | 32 |
Sankyo Co., Ltd. | | 1,900 | | 96 |
SBI Holdings, Inc. (Æ)(Ñ) | | 87 | | 13 |
Seiko Epson Corp. (Ñ) | | 2,800 | | 45 |
Seino Holdings Corp. | | 10,000 | | 56 |
Sekisui House, Ltd. | | 3,000 | | 26 |
Seven & I Holdings Co., Ltd. | | 43,260 | | 1,482 |
Sharp Corp. (Ñ) | | 7,000 | | 50 |
Shima Seiki Manufacturing, Ltd. - GDR | | 2,100 | | 41 |
Shin-Etsu Chemical Co., Ltd. | | 38,400 | | 1,761 |
Shinsei Bank, Ltd. (Æ) | | 18,000 | | 28 |
Showa Shell Sekiyu KK | | 8,000 | | 79 |
SMC Corp. | | 13,748 | | 1,407 |
Snow Brand Milk Products Co., Ltd. (Ñ) | | 11,000 | | 42 |
Softbank Corp. (Ñ) | | 50,600 | | 916 |
Sony Corp. (Ñ) | | 5,800 | | 126 |
Russell Investment Funds
Non-U.S. Fund
Schedule of Investments, continued — December 31, 2008
Amounts in thousands (except share amounts)
| | | | |
| | | Principal Amount ($)
or Shares | | Market Value
$ |
| | | | |
Stanley Electric Co., Ltd. | | 3,300 | | 35 |
Sugi Holdings Co., Ltd. - GDR (Ñ) | | 43,899 | | 1,171 |
Sumco Corp. (Ñ) | | 3,000 | | 38 |
Sumitomo Bakelite Co., Ltd. (Ñ) | | 8,000 | | 32 |
Sumitomo Corp. | | 6,900 | | 61 |
Sumitomo Forestry Co., Ltd. (Ñ) | | 8,300 | | 67 |
Sumitomo Metal Mining Co., Ltd. | | 2,000 | | 21 |
Sumitomo Mitsui Financial Group, Inc. (Ñ) | | 40 | | 179 |
Sumitomo Realty & Development Co., Ltd. | | 2,000 | | 30 |
Sumitomo Trust & Banking Co., Ltd. (The) | | 202,033 | | 1,196 |
Suzuken Co., Ltd. | | 2,400 | | 72 |
Suzuki Motor Corp. | | 56,919 | | 787 |
Taisho Pharmaceutical Co., Ltd. | | 1,000 | | 21 |
Takara Holdings, Inc. | | 6,000 | | 36 |
Takasago Thermal Engineering Co., Ltd. | | 1,000 | | 8 |
Takata Corp. (Ñ) | | 2,300 | | 16 |
Takeda Pharmaceutical Co., Ltd. | | 7,100 | | 368 |
Takefuji Corp. (Ñ) | | 3,700 | | 30 |
TDK Corp. (Ñ) | | 1,600 | | 59 |
THK Co., Ltd. (Ñ) | | 30,620 | | 322 |
Toagosei Co., Ltd. | | 8,000 | | 24 |
Toho Pharmaceutical Co., Ltd. | | 2,990 | | 41 |
Tohoku Electric Power Co., Inc. | | 800 | | 22 |
Tokai Rika Co., Ltd. | | 7,800 | | 68 |
Tokai Rubber Industries, Inc. | | 8,100 | | 67 |
Tokai Tokyo Securities Co., Ltd. | | 5,000 | | 14 |
Tokio Marine Holdings, Inc. | | 3,800 | | 111 |
Tokyo Electric Power Co., Inc. (The) | | 5,400 | | 180 |
Tokyo Electron, Ltd. | | 8,800 | | 309 |
Tokyo Gas Co., Ltd. | | 27,000 | | 137 |
Tokyo Steel Manufacturing Co., Ltd. (Ñ) | | 8,800 | | 92 |
Tokyu Land Corp. | | 4,000 | | 15 |
Toppan Forms Co., Ltd. | | 800 | | 10 |
Toppan Printing Co., Ltd. (Ñ) | | 7,000 | | 54 |
Toshiba TEC Corp. | | 20,000 | | 60 |
Toyo Ink Manufacturing Co., Ltd. (Ñ) | | 3,000 | | 9 |
Toyo Seikan Kaisha, Ltd. | | 6,400 | | 133 |
Toyoda Gosei Co., Ltd. | | 2,300 | | 27 |
Toyota Auto Body Co., Ltd. | | 6,200 | | 91 |
Toyota Motor Corp. | | 15,800 | | 517 |
Toyota Tsusho Corp. | | 3,300 | | 35 |
TS Tech Co., Ltd. | | 1,135 | | 7 |
TV Asahi Corp. | | 5 | | 7 |
Unicharm Corp. | | 8,000 | | 605 |
United Urban Investment Corp. (ö) | | 80 | | 316 |
USS Co., Ltd. | | 900 | | 48 |
West Japan Railway Co. | | 17 | | 77 |
Yahoo! Japan Corp. (Ñ) | | 1,156 | | 473 |
Yamaha Corp. (Ñ) | | 3,700 | | 34 |
Yamato Holdings Co., Ltd. (Ñ) | | 5,000 | | 65 |
Yamato Kogyo Co., Ltd. - GDR | | 700 | | 19 |
| | | | |
| | | | 48,766 |
| | | | |
| | |
| Luxembourg - 0.0% | | | | |
ArcelorMittal (Ñ) | | 3,501 | | 84 |
Oriflame Cosmetics SA (Ñ) | | 1,104 | | 32 |
Reinet Investments SCA (Æ) | | 593 | | 6 |
| | | | |
| | | | 122 |
| | | | |
| | | | |
| | | Principal Amount ($)
or Shares | | Market Value
$ |
| Malaysia - 0.1% | | | | |
Sime Darby Berhad | | 162,317 | | 246 |
| | | | |
| | |
| Mauritius - 0.0% | | | | |
Golden Agri-Resources, Ltd. | | 134,176 | | 22 |
| | | | |
| | |
| Mexico - 0.3% | | | | |
America Movil SAB de CV Series L (Ñ) | | 14,700 | | 456 |
Grupo Modelo SAB de CV (Ñ) | | 114,500 | | 362 |
| | | | |
| | | | 818 |
| | | | |
| | |
| Netherlands - 3.8% | | | | |
Aegon NV (Æ) | | 6,298 | | 40 |
Akzo Nobel NV | | 9,343 | | 385 |
ASML Holding NV | | 40,841 | | 729 |
CSM | | 7,091 | | 114 |
European Aeronautic Defence and Space Co. NV | | 7,257 | | 122 |
Heineken NV | | 114,438 | | 3,516 |
Imtech NV | | 6,926 | | 117 |
ING Groep NV (Æ) | | 31,975 | | 334 |
James Hardie Industries NV (Æ) | | 10,036 | | 33 |
Koninklijke Ahold NV | | 50,273 | | 618 |
Koninklijke Philips Electronics NV (Ñ) | | 3,785 | | 74 |
Royal KPN NV | | 64,142 | | 930 |
SNS Reaal | | 14,666 | | 81 |
STMicroelectronics NV | | 5,952 | | 40 |
TNT NV | | 57,060 | | 1,096 |
TomTom NV (Æ) | | 2,610 | | 19 |
Unilever NV | | 6,915 | | 168 |
Wolters Kluwer NV | | 67,990 | | 1,284 |
| | | | |
| | | | 9,700 |
| | | | |
| | |
| Netherlands Antilles - 0.0% | | | | |
Hunter Douglas NV | | 1,257 | | 41 |
| | | | |
| | |
| Norway - 0.2% | | | | |
StatoilHydro ASA | | 25,902 | | 427 |
| | | | |
| | |
| Portugal - 0.2% | | | | |
Energias de Portugal SA | | 148,542 | | 560 |
| | | | |
| | |
| Singapore - 0.7% | | | | |
Ascendas Real Estate Investment
Trust (Æ)(ö) | | 4,000 | | 4 |
CapitaLand, Ltd. | | 2,343 | | 5 |
CapitaMall Trust (Æ)(ö) | | 5,643 | | 6 |
China Aviation Oil Singapore Corp., Ltd. | | 1,000 | | 1 |
ComfortDelgro Corp., Ltd. | | 14,000 | | 14 |
Cosco Corp. Singapore, Ltd. | | 12,000 | | 8 |
DBS Group Holdings, Ltd. | | 65,400 | | 388 |
Haw Par Corp., Ltd. | | 3,000 | | 8 |
Indofood Agri Resources, Ltd. (Æ) | | 2,552 | | 1 |
Jardine Cycle & Carriage, Ltd. | | 3,800 | | 25 |
Keppel Corp., Ltd. | | 13,555 | | 41 |
Keppel Land, Ltd. | | 1,000 | | 1 |
Russell Investment Funds
Non-U.S. Fund
Schedule of Investments, continued — December 31, 2008
Amounts in thousands (except share amounts)
| | | | |
| | | Principal Amount ($)
or Shares | | Market Value
$ |
| | | | |
Neptune Orient Lines, Ltd. | | 8,000 | | 6 |
Oversea-Chinese Banking Corp., Ltd. | | 15,000 | | 52 |
Pacific Century Regional Developments, Ltd. | | 53,000 | | 5 |
Singapore Airlines, Ltd. | | 5,970 | | 47 |
Singapore Exchange, Ltd. | | 6,000 | | 22 |
Singapore Petroleum Co., Ltd. | | 6,312 | | 10 |
Singapore Technologies Engineering, Ltd. | | 6,000 | | 10 |
Singapore Telecommunications, Ltd. | | 540,000 | | 962 |
SMRT Corp., Ltd. | | 3,000 | | 3 |
United Overseas Bank, Ltd. | | 6,572 | | 59 |
UOL Group, Ltd. | | 7,000 | | 11 |
Venture Corp., Ltd. | | 3,000 | | 9 |
| | | | |
| | | | 1,698 |
| | | | |
| | |
| South Africa - 0.4% | | | | |
Gold Fields, Ltd. - ADR (Ñ) | | 61,740 | | 613 |
MTN Group, Ltd. | | 35,760 | | 423 |
| | | | |
| | | | 1,036 |
| | | | |
| | |
| South Korea - 0.5% | | | | |
KB Financial Group, Inc. - ADR (Ñ) | | 9,648 | | 253 |
Samsung Electronics Co., Ltd. | | 3,029 | | 1,100 |
STX Pan Ocean Co., Ltd. (Æ) | | 400 | | 2 |
| | | | |
| | | | 1,355 |
| | | | |
| | |
| Spain - 1.2% | | | | |
Banco Bilbao Vizcaya Argentaria SA | | 25,656 | | 315 |
Banco Santander SA | | 71,989 | | 694 |
Criteria Caixacorp SA | | 1,133 | | 5 |
Ebro Puleva SA (Æ) | | 801 | | 11 |
Endesa SA | | 983 | | 40 |
Gas Natural SDG SA | | 3,271 | | 89 |
Iberia Lineas Aereas de Espana | | 42,192 | | 118 |
Inditex SA | | 6,049 | | 267 |
Prosegur Cia de Seguridad SA | | 3,561 | | 118 |
Red Electrica de Espana | | 1,190 | | 60 |
Repsol YPF SA | | 12,286 | | 262 |
Telefonica SA | | 49,466 | | 1,109 |
Union Fenosa SA | | 284 | | 7 |
Vertice Trescientos Sesenta Grados (Æ) | | 3,257 | | 3 |
Viscofan SA | | 1,801 | | 35 |
| | | | |
| | | | 3,133 |
| | | | |
| | |
| Sweden - 1.3% | | | | |
Axfood AB | | 2,051 | | 44 |
Electrolux AB | | 1,279 | | 11 |
Hennes & Mauritz AB Series B
Class B (Ñ) | | 13,765 | | 538 |
Intrum Justitia AB | | 3,441 | | 35 |
Investor AB Class B | | 265 | | 4 |
Loomis AB (Æ)(Ñ) | | 1,388 | | 9 |
Nordea Bank AB | | 18,703 | | 132 |
SAS AB (Æ) | | 7,286 | | 35 |
Scania AB Class B (Æ) | | 14,402 | | 144 |
Securitas AB Class B | | 6,527 | | 54 |
Skanska AB Class B | | 17,600 | | 175 |
| | | | |
| | | Principal Amount ($)
or Shares | | Market Value
$ |
Svenska Cellulosa AB Class B | | 24,676 | | 211 |
Svenska Handelsbanken AB Class A | | 1,051 | | 17 |
Swedish Match AB | | 30,949 | | 443 |
Tele2 AB Class B | | 17,944 | | 159 |
Telefonaktiebolaget LM Ericsson Class B (Ñ) | | 167,893 | | 1,288 |
TeliaSonera AB | | 6,039 | | 30 |
| | | | |
| | | | 3,329 |
| | | | |
| | |
| Switzerland - 8.9% | | | | |
ABB, Ltd. (Æ) | | 29,262 | | 441 |
Actelion, Ltd. (Ñ) | | 18,298 | | 1,031 |
Baloise Holding AG | | 145 | | 11 |
Barry Callebaut AG (Æ) | | 160 | | 104 |
Compagnie Financiere Richemont SA - Class A | | 39,758 | | 772 |
Credit Suisse Group AG | | 17,113 | | 469 |
Givaudan SA (Ñ) | | 2,040 | | 1,607 |
Helvetia Holding AG (Æ) | | 884 | | 192 |
Holcim, Ltd. | | 786 | | 45 |
Jelmoli Holding AG (Æ) | | 30 | | 56 |
Julius Baer Holding AG | | 41,036 | | 1,578 |
Nestle SA | | 176,792 | | 6,968 |
Novartis AG | | 34,970 | | 1,752 |
Roche Holding AG | | 35,536 | | 5,470 |
Sonova Holding AG | | 4,023 | | 243 |
Swiss Reinsurance | | 18,389 | | 893 |
UBS AG (Æ) | | 50,040 | | 726 |
Zurich Financial Services AG | | 1,638 | | 356 |
| | | | |
| | | | 22,714 |
| | | | |
| | |
| Taiwan - 0.6% | | | | |
Taiwan Semiconductor Manufacturing Co., Ltd. | | 588,500 | | 805 |
Taiwan Semiconductor Manufacturing Co., Ltd. - ADR | | 81,390 | | 643 |
| | | | |
| | | | 1,448 |
| | | | |
| | |
| Thailand - 0.1% | | | | |
Bangkok Bank PCL | | 106,800 | | 219 |
| | | | |
| | |
| United Kingdom - 18.3% | | | | |
3i Group PLC | | 70,392 | | 277 |
Aggreko PLC | | 20,368 | | 131 |
AMEC PLC - GDR | | 8,892 | | 64 |
Anglo American PLC | | 33,295 | | 761 |
Antofagasta PLC | | 106,300 | | 657 |
ARM Holdings PLC | | 408,214 | | 511 |
AstraZeneca PLC | | 41,539 | | 1,683 |
Atkins WS PLC | | 20,893 | | 203 |
Autonomy Corp. PLC (Æ) | | 52,100 | | 717 |
BAE Systems PLC | | 98,373 | | 536 |
Barclays PLC | | 73,696 | | 166 |
BBA Aviation PLC | | 68,277 | | 68 |
BG Group PLC | | 28,062 | | 390 |
BHP Billiton PLC | | 70,338 | | 1,325 |
Russell Investment Funds
Non-U.S. Fund
Schedule of Investments, continued — December 31, 2008
Amounts in thousands (except share amounts)
| | | | |
| | | Principal Amount ($)
or Shares | | Market Value
$ |
| | | | |
BP PLC | | 168,222 | | 1,289 |
BP PLC - ADR (Ñ) | | 32,320 | | 1,511 |
British Airways PLC (Æ) | | 15,490 | | 40 |
British American Tobacco PLC | | 24,994 | | 649 |
British Land Co. PLC (ö) | | 3,139 | | 25 |
BT Group PLC | | 90,874 | | 179 |
Burberry Group PLC | | 109,900 | | 353 |
Cadbury PLC | | 189,311 | | 1,657 |
Capita Group PLC (The) | | 87,323 | | 930 |
Centrica PLC | | 66,162 | | 254 |
Close Brothers Group PLC | | 13,297 | | 102 |
Davis Service Group PLC | | 3,306 | | 13 |
Dawnay Day Treveria PLC (Æ) | | 586,180 | | 60 |
De La Rue PLC | | 3,360 | | 44 |
Diageo PLC | | 218,440 | | 3,039 |
Drax Group PLC | | 26,761 | | 217 |
DSG International PLC (Æ) | | 95,452 | | 24 |
easyJet PLC (Æ) | | 231,779 | | 940 |
Experian PLC | | 232,975 | | 1,459 |
GlaxoSmithKline PLC | | 184,948 | | 3,433 |
Hammerson PLC (ö) | | 2,600 | | 20 |
Hays PLC | | 258,897 | | 261 |
HBOS PLC (Æ) | | 26,806 | | — |
HBOS PLC | | 19,371 | | 20 |
HMV Group PLC | | 21,073 | | 33 |
Home Retail Group PLC | | 20,327 | | 62 |
HSBC Holdings PLC | | 125,296 | | 1,199 |
Imperial Tobacco Group PLC | | 5,721 | | 153 |
Intermediate Capital Group PLC | | 5,983 | | 56 |
J Sainsbury PLC | | 183,057 | | 871 |
Kingfisher PLC | | 145,803 | | 285 |
Ladbrokes PLC | | 143,825 | | 385 |
Land Securities Group PLC (ö) | | 1,609 | | 21 |
Legal & General Group PLC | | 133,906 | | 149 |
Lloyds TSB Group PLC | | 63,382 | | 81 |
Michael Page International PLC | | 118,192 | | 368 |
Mondi PLC | | 12,176 | | 36 |
Next PLC | | 9,583 | | 150 |
Old Mutual PLC | | 238,254 | | 190 |
Petrofac, Ltd. | | 15,193 | | 76 |
Reckitt Benckiser Group PLC | | 78,826 | | 2,937 |
Reed Elsevier PLC | | 4,022 | | 29 |
Regus PLC | | 118,259 | | 85 |
Rio Tinto PLC | | 5,678 | | 123 |
Royal Bank of Scotland Group PLC | | 243,487 | | 176 |
Royal Dutch Shell PLC
Class A | | 109 | | 2,850 |
Class B | | 23,321 | | 587 |
Scottish & Southern Energy PLC | | 47,729 | | 840 |
Shire PLC | | 22,503 | | 329 |
Smiths Group PLC | | 62,469 | | 804 |
Standard Chartered PLC | | 133,097 | | 1,701 |
Tate & Lyle PLC | | 23,338 | | 136 |
Tesco PLC | | 97,301 | | 507 |
Tomkins PLC | | 35,588 | | 64 |
Trinity Mirror PLC | | 14,023 | | 11 |
Unilever PLC | | 11,658 | | 265 |
| | | | | |
| | | Principal Amount ($)
or Shares | | Market Value
$ | |
United Utilities Group PLC | | 17,269 | | 156 | |
Vodafone Group PLC | | 793,269 | | 1,597 | |
Vodafone Group PLC - ADR | | 84,300 | | 1,723 | |
William Hill PLC | | 177,897 | | 553 | |
WM Morrison Supermarkets PLC | | 211,255 | | 857 | |
WPP Group PLC | | 395,417 | | 2,305 | |
| | | | | |
| | | | 46,758 | |
| | | | | |
| | |
| United States - 1.2% | | | | | |
Philip Morris International, Inc. | | 23,950 | | 1,042 | |
Synthes, Inc. | | 15,835 | | 2,002 | |
| | | | | |
| | | | 3,044 | |
| | | | | |
| | |
Total Common Stocks
(cost $278,503) | | | | 219,298 | |
| | | | | |
| | |
| Preferred Stocks - 0.5% | | | | | |
| Germany - 0.5% | | | | | |
Fresenius SE | | 2,559 | | 150 | |
Henkel AG & Co. KGaA (Ñ) | | 36,107 | | 1,158 | |
Volkswagen AG | | 1,627 | | 87 | |
| | | | | |
| | |
Total Preferred Stocks
(cost $2,086) | | | | 1,395 | |
| | | | | |
| | |
| Warrants & Rights - 0.0% | | | | | |
| Belgium - 0.0% | | | | | |
Fortis (Æ) | | 10 | | 13 | |
| | | | | |
| | |
| Singapore - 0.0% | | | | | |
DBS Group Holdings, Ltd. (Æ) | | 33 | | 68 | |
| | | | | |
| | |
Total Warrants & Rights
(cost $—) | | | | 81 | |
| | | | | |
| | |
| Short-Term Investments - 9.5% | | | | | |
| United States - 9.5% | | | | | |
Russell Investment Company Money Market Fund | | 24,227,000 | | 24,227 | |
| | | | | |
| | |
Total Short-Term Investments
(cost $24,227) | | | | 24,227 | |
| | | | | |
| | |
| Other Securities - 9.8% | | | | | |
State Street Securities Lending Quality Trust (×) | | 26,399,671 | | 24,950 | |
| | | | | |
| | |
Total Other Securities
(cost $26,400) | | | | 24,950 | |
| | | | | |
| | |
Total Investments - 105.5%
(identified cost $331,216) | | | | 269,951 | |
| | |
Other Assets and Liabilities,
Net - (5.5%) | | | | (14,201 | ) |
| | | | | |
| | |
| Net Assets - 100.0% | | | | 255,750 | |
| | | | | |
See accompanying notes which are an integral part of the financial statements.
Russell Investment Funds
Non-U.S. Fund
Schedule of Investments, continued — December 31, 2008
Amounts in thousands (except contracts)
| | | | | | | | | | | |
| Futures Contracts | | Number of
Contracts | | Notional
Amount | | Expiration
Date | | Unrealized
Appreciation
(Depreciation)
$ | |
| | | | | | | | | | | |
| | | | | | | | | | | |
| Long Positions | | | | | | | | | | | |
AEX Index (Netherlands) | | 48 | | EUR | | 2,365 | | 01/09 | | (10 | ) |
CAC-40 Index (France) | | 167 | | EUR | | 5,379 | | 01/09 | | 13 | |
DAX Index (Germany) | | 16 | | EUR | | 1,934 | | 03/09 | | 49 | |
EUR STOXX 50 Index | | 177 | | EUR | | 4,337 | | 03/09 | | (4 | ) |
FTSE-100 Index (UK) | | 167 | | GBP | | 7,332 | | 03/09 | | 258 | |
MIB-30 (Italy) | | 29 | | EUR | | 2,816 | | 03/09 | | 26 | |
MSCI Singapore Index | | 2 | | SGD | | 88 | | 01/09 | | 2 | |
TOPIX Index (Japan) | | 94 | | JPY | | 810,280 | | 03/09 | | 423 | |
| | | | | |
| Short Positions | | | | | | | | | | | |
DAX Index (Germany) | | 21 | | EUR | | 2,538 | | 03/09 | | (85 | ) |
Hang Seng Index (Hong Kong) | | 10 | | HKD | | 7,203 | | 01/09 | | 30 | |
IBEX Plus Index (Spain) | | 13 | | EUR | | 1,185 | | 01/09 | | (11 | ) |
OMX Stockholm 30 Index (Sweden) | | 21 | | SEK | | 1,384 | | 01/09 | | — | |
SPI 200 Index (Australia) | | 44 | | AUD | | 4,121 | | 03/09 | | (144 | ) |
TOPIX Index (Japan) | | 15 | | JPY | | 129,300 | | 03/09 | | (34 | ) |
| | | | | | | | | | | |
| | | | | |
Total Unrealized Appreciation (Depreciation) on Open Futures Contracts | | | | | | | | | | 513 | |
| | | | | | | | | | | |
See accompanying notes which are an integral part of the financial statements.
Russell Investment Funds
Non-U.S. Fund
Schedule of Investments, continued — December 31, 2008
Amounts in thousands
| | | | | | | | | | | |
| Foreign Currency Exchange Contracts | |
| | | | | | | | | | | |
Amount
Sold | | Amount
Bought | | Settlement
Date | | Unrealized
Appreciation
(Depreciation)
$ | |
| USD | | 118 | | AUD | | 171 | | 01/05/09 | | 1 | |
| USD | | 22 | | AUD | | 31 | | 03/18/09 | | — | |
| USD | | 501 | | AUD | | 732 | | 03/18/09 | | 6 | |
| USD | | 686 | | AUD | | 1,034 | | 03/18/09 | | 30 | |
| USD | | 742 | | AUD | | 1,085 | | 03/18/09 | | 9 | |
| USD | | 1,001 | | AUD | | 1,465 | | 03/18/09 | | 13 | |
| USD | | 6 | | CHF | | 6 | | 01/05/09 | | — | |
| USD | | 7 | | CHF | | 8 | | 01/06/09 | | — | |
| USD | | 283 | | CHF | | 299 | | 01/06/09 | | (2 | ) |
| USD | | 343 | | CHF | | 400 | | 03/18/09 | | 32 | |
| USD | | 344 | | CHF | | 400 | | 03/18/09 | | 32 | |
| USD | | 344 | | CHF | | 400 | | 03/18/09 | | 32 | |
| USD | | 344 | | CHF | | 400 | | 03/18/09 | | 32 | |
| USD | | 630 | | CHF | | 664 | | 03/18/09 | | (6 | ) |
| USD | | 28 | | DKK | | 155 | | 03/18/09 | | 1 | |
| USD | | 28 | | DKK | | 155 | | 03/18/09 | | 1 | |
| USD | | 28 | | DKK | | 155 | | 03/18/09 | | 1 | |
| USD | | 28 | | DKK | | 155 | | 03/18/09 | | 1 | |
| USD | | 70 | | DKK | | 373 | | 03/18/09 | | (1 | ) |
| USD | | 85 | | EUR | | 60 | | 01/02/09 | | (1 | ) |
| USD | | 243 | | EUR | | 172 | | 01/02/09 | | (4 | ) |
| USD | | 31 | | EUR | | 22 | | 01/05/09 | | — | |
| USD | | 57 | | EUR | | 41 | | 01/06/09 | | — | |
| USD | | 280 | | EUR | | 200 | | 03/18/09 | | (3 | ) |
| USD | | 431 | | EUR | | 300 | | 03/18/09 | | (15 | ) |
| USD | | 645 | | EUR | | 500 | | 03/18/09 | | 49 | |
| USD | | 683 | | EUR | | 485 | | 03/18/09 | | (10 | ) |
| USD | | 692 | | EUR | | 516 | | 03/18/09 | | 23 | |
| USD | | 692 | | EUR | | 516 | | 03/18/09 | | 23 | |
| USD | | 1,265 | | EUR | | 1,000 | | 03/18/09 | | 121 | |
| USD | | 1,288 | | EUR | | 1,000 | | 03/18/09 | | 99 | |
| USD | | 2,840 | | EUR | | 2,218 | | 03/18/09 | | 236 | |
| USD | | 2,840 | | EUR | | 2,218 | | 03/18/09 | | 236 | |
| USD | | 2,841 | | EUR | | 2,218 | | 03/18/09 | | 235 | |
| USD | | 2,841 | | EUR | | 2,218 | | 03/18/09 | | 235 | |
| USD | | 2,850 | | EUR | | 2,218 | | 03/18/09 | | 226 | |
| USD | | 17 | | GBP | | 12 | | 01/02/09 | | — | |
| USD | | 87 | | GBP | | 58 | | 03/18/09 | | (4 | ) |
| USD | | 87 | | GBP | | 58 | | 03/18/09 | | (5 | ) |
| USD | | 87 | | GBP | | 58 | | 03/18/09 | | (4 | ) |
| USD | | 88 | | GBP | | 58 | | 03/18/09 | | (5 | ) |
| USD | | 147 | | GBP | | 100 | | 03/18/09 | | (4 | ) |
| USD | | 155 | | GBP | | 100 | | 03/18/09 | | (12 | ) |
| USD | | 206 | | GBP | | 138 | | 03/18/09 | | (9 | ) |
| USD | | 206 | | GBP | | 138 | | 03/18/09 | | (9 | ) |
| USD | | 591 | | GBP | | 400 | | 03/18/09 | | (17 | ) |
| USD | | 1,187 | | GBP | | 809 | | 03/18/09 | | (26 | ) |
| USD | | 1,189 | | GBP | | 809 | | 03/18/09 | | (28 | ) |
| USD | | 1,189 | | GBP | | 809 | | 03/18/09 | | (27 | ) |
| USD | | 1,190 | | GBP | | 809 | | 03/18/09 | | (29 | ) |
| USD | | 1,192 | | GBP | | 809 | | 03/18/09 | | (31 | ) |
| | | | | | | | | | | |
| Foreign Currency Exchange Contracts | |
Amount
Sold | | Amount
Bought | | Settlement
Date | | Unrealized
Appreciation
(Depreciation)
$ | |
| USD | | 1,752 | | GBP | | 1,210 | | 03/18/09 | | (15 | ) |
| USD | | 19 | | HKD | | 147 | | 03/18/09 | | — | |
| USD | | 24 | | HKD | | 190 | | 03/18/09 | | — | |
| USD | | 24 | | HKD | | 190 | | 03/18/09 | | — | |
| USD | | 24 | | HKD | | 190 | | 03/18/09 | | — | |
| USD | | 24 | | HKD | | 190 | | 03/18/09 | | — | |
| USD | | 41 | | HKD | | 318 | | 03/18/09 | | — | |
| USD | | 436 | | JPY | | 40,000 | | 03/18/09 | | 6 | |
| USD | | 545 | | JPY | | 50,000 | | 03/18/09 | | 8 | |
| USD | | 562 | | JPY | | 50,000 | | 03/18/09 | | (9 | ) |
| USD | | 908 | | JPY | | 82,141 | | 03/18/09 | | (1 | ) |
| USD | | 909 | | JPY | | 82,141 | | 03/18/09 | | (1 | ) |
| USD | | 909 | | JPY | | 82,141 | | 03/18/09 | | (1 | ) |
| USD | | 911 | | JPY | | 82,141 | | 03/18/09 | | (3 | ) |
| USD | | 2,172 | | JPY | | 201,000 | | 03/18/09 | | 49 | |
| USD | | 2,179 | | JPY | | 201,000 | | 03/18/09 | | 41 | |
| USD | | 2,179 | | JPY | | 201,000 | | 03/18/09 | | 41 | |
| USD | | 2,179 | | JPY | | 201,000 | | 03/18/09 | | 41 | |
| USD | | 2,182 | | JPY | | 201,000 | | 03/18/09 | | 39 | |
| USD | | 166 | | NOK | | 1,162 | | 01/02/09 | | — | |
| USD | | 72 | | NOK | | 506 | | 03/18/09 | | (1 | ) |
| USD | | 72 | | NOK | | 506 | | 03/18/09 | | (1 | ) |
| USD | | 73 | | NOK | | 506 | | 03/18/09 | | (1 | ) |
| USD | | 73 | | NOK | | 506 | | 03/18/09 | | (1 | ) |
| USD | | 786 | | NZD | | 1,434 | | 03/18/09 | | 45 | |
| USD | | 786 | | NZD | | 1,434 | | 03/18/09 | | 45 | |
| USD | | 787 | | NZD | | 1,434 | | 03/18/09 | | 44 | |
| USD | | 787 | | NZD | | 1,434 | | 03/18/09 | | 44 | |
| USD | | 92 | | SEK | | 713 | | 01/07/09 | | (2 | ) |
| USD | | 2 | | SGD | | 3 | | 01/05/09 | | — | |
| USD | | 22 | | SGD | | 32 | | 03/18/09 | | 1 | |
| USD | | 22 | | SGD | | 32 | | 03/18/09 | | — | |
| USD | | 22 | | SGD | | 32 | | 03/18/09 | | — | |
| USD | | 22 | | SGD | | 32 | | 03/18/09 | | — | |
| AUD | | 31 | | USD | | 22 | | 01/06/09 | | — | |
| AUD | | 7 | | USD | | 5 | | 03/18/09 | | — | |
| AUD | | 7 | | USD | | 5 | | 03/18/09 | | — | |
| AUD | | 7 | | USD | | 5 | | 03/18/09 | | — | |
| AUD | | 7 | | USD | | 5 | | 03/18/09 | | — | |
| AUD | | 171 | | USD | | 117 | | 03/18/09 | | (1 | ) |
| CAD | | — | | USD | | — | | 01/02/09 | | — | |
| CHF | | 299 | | USD | | 283 | | 03/18/09 | | 2 | |
| CHF | | 832 | | USD | | 711 | | 03/18/09 | | (70 | ) |
| CHF | | 832 | | USD | | 711 | | 03/18/09 | | (70 | ) |
| DKK | | 373 | | USD | | 71 | | 01/06/09 | | 1 | |
| DKK | | 78 | | USD | | 15 | | 03/18/09 | | — | |
| DKK | | 171 | | USD | | 31 | | 03/18/09 | | (1 | ) |
| EUR | | 441 | | USD | | 622 | | 01/05/09 | | 9 | |
| EUR | | 216 | | USD | | 305 | | 01/06/09 | | 5 | |
| EUR | | 41 | | USD | | 57 | | 03/18/09 | | — | |
| EUR | | 100 | | USD | | 137 | | 03/18/09 | | (2 | ) |
See accompanying notes which are an integral part of the financial statements.
Russell Investment Funds
Non-U.S. Fund
Schedule of Investments, continued — December 31, 2008
Amounts in thousands
| | | | | | | | | | | |
| Foreign Currency Exchange Contracts | |
| | | | | | | | | | | |
Amount
Sold | | Amount
Bought | | Settlement
Date | | Unrealized
Appreciation
(Depreciation)
$ | |
| | | | | | | | | | | |
| EUR | | 200 | | USD | | 285 | | 03/18/09 | | 8 | |
| EUR | | 203 | | USD | | 285 | | 03/18/09 | | 3 | |
| EUR | | 342 | | USD | | 463 | | 03/18/09 | | (11 | ) |
| EUR | | 342 | | USD | | 464 | | 03/18/09 | | (11 | ) |
| EUR | | 342 | | USD | | 463 | | 03/18/09 | | (12 | ) |
| EUR | | 342 | | USD | | 463 | | 03/18/09 | | (12 | ) |
| EUR | | 350 | | USD | | 445 | | 03/18/09 | | (40 | ) |
| EUR | | 650 | | USD | | 840 | | 03/18/09 | | (61 | ) |
| EUR | | 700 | | USD | | 955 | | 03/18/09 | | (15 | ) |
| EUR | | 1,400 | | USD | | 1,817 | | 03/18/09 | | (123 | ) |
| EUR | | 1,809 | | USD | | 2,542 | | 03/18/09 | | 34 | |
| EUR | | 2,000 | | USD | | 2,889 | | 03/18/09 | | 116 | |
| GBP | | 94 | | USD | | 138 | | 03/18/09 | | 3 | |
| GBP | | 300 | | USD | | 457 | | 03/18/09 | | 27 | |
| GBP | | 300 | | USD | | 460 | | 03/18/09 | | 29 | |
| GBP | | 400 | | USD | | 590 | | 03/18/09 | | 15 | |
| HKD | | 92 | | USD | | 12 | | 01/02/09 | | — | |
| HKD | | 117 | | USD | | 15 | | 01/02/09 | | — | |
| HKD | | 147 | | USD | | 19 | | 01/05/09 | | — | |
| HKD | | 140 | | USD | | 18 | | 03/18/09 | | — | |
| JPY | | 3,846 | | USD | | 42 | | 03/18/09 | | — | |
| JPY | | 20,000 | | USD | | 224 | | 03/18/09 | | 3 | |
| JPY | | 26,273 | | USD | | 290 | | 03/18/09 | | — | |
| JPY | | 60,000 | | USD | | 663 | | 03/18/09 | | — | |
| JPY | | 70,000 | | USD | | 759 | | 03/18/09 | | (15 | ) |
| JPY | | 70,300 | | USD | | 775 | | 03/18/09 | | (2 | ) |
| JPY | | 105,911 | | USD | | 1,169 | | 03/18/09 | | (2 | ) |
| JPY | | 150,000 | | USD | | 1,683 | | 03/18/09 | | 26 | |
| NOK | | 1,012 | | USD | | 146 | | 03/18/09 | | 2 | |
| NOK | | 1,012 | | USD | | 146 | | 03/18/09 | | 2 | |
| NZD | | 56 | | USD | | 32 | | 03/18/09 | | — | |
| SEK | | 708 | | USD | | 89 | | 03/18/09 | | (1 | ) |
| SEK | | 708 | | USD | | 89 | | 03/18/09 | | (1 | ) |
| SEK | | 713 | | USD | | 92 | | 03/18/09 | | 2 | |
| SEK | | 2,547 | | USD | | 316 | | 03/18/09 | | (6 | ) |
| SEK | | 2,547 | | USD | | 316 | | 03/18/09 | | (6 | ) |
| SEK | | 2,547 | | USD | | 316 | | 03/18/09 | | (6 | ) |
| SEK | | 2,547 | | USD | | 317 | | 03/18/09 | | (5 | ) |
| SGD | | 3 | | USD | | 2 | | 03/18/09 | | — | |
| SGD | | 6 | | USD | | 4 | | 03/18/09 | | — | |
| SGD | | 11 | | USD | | 7 | | 03/18/09 | | — | |
| | | | | | | | | | | |
| |
| Total Unrealized Appreciation (Depreciation) on Open Foreign Currency Exchange Contracts | | 1,604 | |
| | | | | | | | | | | |
See accompanying notes which are an integral part of the financial statements.
Russell Investment Funds
Non-U.S. Fund
Schedule of Investments, continued — December 31, 2008
Amounts in thousands (except share amounts)
| | | | | | |
Industry Diversification
(Unaudited) | | % of
Net
Assets | | | Market Value
$ | |
| | | | | | |
| | | | | | |
Auto and Transportation | | 3.2 | | | 8,212 | |
Consumer Discretionary | | 9.1 | | | 23,405 | |
Consumer Staples | | 12.3 | | | 31,514 | |
Financial Services | | 24.4 | | | 62,517 | |
Health Care | | 9.5 | | | 24,280 | |
Integrated Oils | | 5.8 | | | 14,794 | |
Materials and Processing | | 8.8 | | | 22,633 | |
Miscellaneous | | 1.2 | | | 3,018 | |
Other Energy | | 1.0 | | | 2,504 | |
Producer Durables | | 7.1 | | | 18,176 | |
Technology | | 4.9 | | | 12,415 | |
Utilities | | 8.7 | | | 22,176 | |
Warrants & Rights | | — | | | 81 | |
Other Securities | | 9.5 | | | 24,227 | |
| | | | | | |
| | |
Total Investments | | 105.5 | | | 269,952 | |
Other Assets and Liabilities, Net | | (5.5 | ) | | (14,202 | ) |
| | | | | | |
| | |
| Net Assets | | 100.0 | | | 255,750 | |
| | | | | | |
| | | | | | |
Geographic Diversification
(Unaudited) | | % of
Net
Assets | | | Market
Value
$ | |
| | | | | | |
Africa | | 0.4 | | | 1,058 | |
Asia | | 5.0 | | | 12,743 | |
Europe | | 39.5 | | | 101,178 | |
Japan | | 19.1 | | | 48,766 | |
Latin America | | 1.1 | | | 2,913 | |
Middle East | | 0.5 | | | 1,235 | |
Other Regions | | 12.1 | | | 31,074 | |
United Kingdom | | 18.3 | | | 46,758 | |
Other Securities | | 9.5 | | | 24,227 | |
| | | | | | |
| | |
Total Investments | | 105.5 | | | 269,952 | |
Other Assets and Liabilities, Net | | (5.5 | ) | | (14,202 | ) |
| | | | | | |
| | |
| Net Assets | | 100.0 | | | 255,750 | |
| | | | | | |
See accompanying notes which are an integral part of the financial statements.
Russell Investment Funds
Non-U.S. Fund
Presentation of Portfolio Holdings — December 31, 2008
| | | |
| Catagories | | % of Net
Assets | |
| | | |
| | | |
Australia | | 1.8 | |
Austria | | 0.3 | |
Belgium | | 0.2 | |
Bermuda | | 0.3 | |
Brazil | | 0.4 | |
Canada | | 1.5 | |
Cayman Islands | | 0.1 | |
China | | 0.2 | |
Czech Republic | | 0.2 | |
Denmark | | 0.3 | |
Finland | | 0.8 | |
France | | 12.3 | |
Germany | | 7.3 | |
Hong Kong | | 0.7 | |
India | | 0.2 | |
Indonesia | | — | * |
Israel | | 0.5 | |
Italy | | 1.7 | |
Japan | | 19.1 | |
Luxembourg | | — | * |
Malaysia | | 0.1 | |
Mauritius | | — | * |
Mexico | | 0.3 | |
Netherlands | | 3.8 | |
Netherlands Antilles | | — | * |
Norway | | 0.2 | |
Portugal | | 0.2 | |
Singapore | | 0.7 | |
South Africa | | 0.4 | |
South Korea | | 0.5 | |
Spain | | 1.2 | |
Sweden | | 1.3 | |
Switzerland | | 8.9 | |
Taiwan | | 0.6 | |
Thailand | | 0.1 | |
United Kingdom | | 18.3 | |
United States | | 1.2 | |
Preferred Stocks | | 0.5 | |
Warrants & Rights | | — | * |
Short-Term Investments | | 9.5 | |
Other Securities | | 9.8 | |
| | | |
| |
Total Investments | | 105.5 | |
Other Assets and Liabilities, Net | | (5.5 | ) |
| | | |
| |
| | 100.0 | |
| | | |
| |
Futures Contracts | | 0.2 | |
Foreign Currency Exchange Contracts | | 0.6 | |
| * | Less than .05% of net assets. |
See accompanying notes which are an integral part of the financial statements.
Russell Investment Funds
Core Bond Fund
Portfolio Management Discussion and Analysis — December 31, 2008 (Unaudited)

| | | | | |
| | |
| Core Bond Fund | | | | | |
| | | | | Total
Return | |
1 Year | | | | (3.87 | )% |
5 Years | | | | 2.68 | %§ |
10 Years | | | | 4.47 | %§ |
| | | | | |
|
Barclays Capital U.S. Aggregate Bond Index ** | |
| | | | | Total
Return | |
1 Year | | | | 5.24 | % |
5 Years | | | | 4.65 | %§ |
10 Years | | | | 5.63 | %§ |
| * | | Assumes initial investment on January 1, 1999. |
| ** | | On October 31, 2008, Barclays Capital, which acquired the Lehman family of indexes in September 2008, announced that it would be re-branding Lehman indexes under the Barclays Capital name; the underlying index structures are to remain unchanged. As a result, the Lehman Brothers Aggregate Bond Index has been renamed the Barclays Capital U.S. Aggregate Bond Index. |
| | | Barclays Capital U.S. Aggregate Bond Index is composed of securities from Barclays Capital U.S. Government/Corporate Bond Index, Mortgage-Backed Securities Index, and the Asset-Backed Securities Index. Total return comprises price appreciation/depreciation and income as a percentage of the original investment. Indexes are rebalanced monthly by market capitalization. |
The performance shown in this section does not reflect any Insurance Company Separate Account or Policy Charges. Performance is historical and assumes reinvestment of all dividends and capital gains. Investment return and principal value will fluctuate so that an investor’s shares, when redeemed, may be worth more or less than when purchased. Past performance is not indicative of future results.
Russell Investment Funds
Core Bond Fund
Portfolio Management Discussion and Analysis — December 31, 2008 (Unaudited)
The Core Bond Fund (the “Fund”) allocates most of its assets among multiple money managers. Russell Investment Management Company (“RIMCo”), as the Fund’s advisor, may change the allocation of the Fund’s assets among money managers at any time. An exemptive order from the Securities and Exchange Commission (SEC) permits RIMCo to engage or terminate a money manager at any time, subject to the approval by the Fund’s Board without a shareholder vote. Pursuant to the terms of the exemptive order, the Fund is required to notify its shareholders within 60 days of when a money manager begins providing services. The Fund currently has three money managers.
What is the Fund’s investment objective?
The Fund seeks to provide current income, and as a secondary objective, capital appreciation.
How did the Fund perform relative to its benchmark for the fiscal year ended December 31, 2008?
For the fiscal year ended December 31, 2008, the Core Bond Fund lost 3.87%. This compared to its benchmark the Barclays Capital U.S. Aggregate Bond Index, which gained 5.24% during the same period. The Fund’s performance includes operating expenses, whereas Index returns are unmanaged and do not include expenses of any kind.
For the year ended December 31, 2008, the Lipper® BBB Rated Corp Debt Funds (VIP) Average lost 4.86%. This result serves as a peer comparison and is expressed net of operating expenses.
How did the market conditions described in the Market Summary report affect the Fund’s performance?
Investors’ departure from investments with more risk to the relative safety of U.S. Treasuries and the subsequent re-pricing of risk (i.e., the market demanding increased compensation for assuming a given level of risk) impacted nearly all non-Treasury fixed income investments. As a result, non-Treasury investments posted lower returns than the benchmark. The Fund’s money managers typically invest in non-Treasury sectors. As a result, the Fund underperformed its benchmark. However, the managers’ sector allocation and security selection decisions resulted in the Fund outperforming its peers as measured by the Lipper® BBB Rated Corp Debt Funds (VIP) Average.
The decrease in interest rates across the yield curve had little impact on Fund performance as the Fund’s money managers implemented offsetting duration strategies. Several managers anticipated the decline in interest rates and increased sensitivity to interest rates (also called increased duration) which had a positive impact on their returns. Other managers decreased duration exposure expecting that interest rates would rise in response to the fact that inflation had been a concern during part of the year stemming from exceptionally high oil prices. This positioning detracted from their performance. In general, as interest rates decline bond prices increase and vice
versa. The benefits of the long duration positioning by some managers were offset by the negative effects of the short duration positioning by other managers.
Finally, as the Federal Reserve decreased the federal funds target rate, short-term yields declined relative to yields at the intermediate portion and long end of the yield curve, resulting in a relative shift in yields otherwise known as yield curve “steepening.” This yield curve movement benefited the Fund as several of the Fund’s money managers anticipated the change and varied the maturity of their securities accordingly.
How did the investment strategies and techniques employed by the Fund and its money managers affect its performance?
By far, the largest affect on the Fund’s underperformance relative to benchmark was from the re-pricing of risk (i.e., the market demanding increased compensation for assuming a given level of risk), the fundamental concern regarding the consumer’s ability to make mortgage payments, and the negative impact that market and credit issues had on virtually all non-Treasury segments of the fixed income markets. The Fund had a material overweight to mortgage-backed securities. This contributed significantly to the Fund’s benchmark-relative underperformance. An overweight to and security selection in consumer-related asset-backed securities, and exposure to investment grade and high yield corporate securities that were hard hit by the weakening economic environment, also detracted from Fund performance.
Interest rates across maturities on the yield curve decreased and the curve “steepened” over the calendar year. Several of the Fund’s money managers, most notably Pacific Investment Management Company LLC (“PIMCO”), and to a lesser extent Goldman Sachs Asset Management, L.P., anticipated the change in interest rates and positioned their portfolios to benefit from these changes.
All of the Fund’s money managers underperformed in this historically challenging environment. Goldman underperformed by the largest amount. Goldman’s underperformance was driven by mortgage-related exposure, but this was partially mitigated by its long duration positioning. PIMCO had the least amount of underperformance. Though PIMCO’s performance suffered due to security selection within investment grade corporate bonds (notably financials) and mortgage exposure, its yield curve positioning provided a degree of downside protection.
The managers who were in the Fund for only a part of the year also underperformed. Bear Stearns Asset Management Inc. was replaced by Metropolitan West Asset Management, LLC in March 2008. Bear Stearns’ underperformed given their underweight to Treasuries and overweight to mortgage-backed and high yield securities. Metropolitan West underperformed largely due to their overweight to and security selection within mortgage-backed securities.
Russell Investment Funds
Core Bond Fund
Portfolio Management Discussion and Analysis — December 31, 2008 (Unaudited)
The Fund’s performance shown throughout this report was based on valuations calculated in accordance with Generally Accepted Accounting Principles (GAAP) and in accordance with a newly effective accounting statement (SFAS 157), reflects the December 31, 2008 market value of the pooled investment vehicle in which the Fund invested its cash collateral received in securities lending transactions. This market value is lower than the vehicle’s amortized cost per unit. This had a negative impact on the Fund’s benchmark relative performance.
Russell Investment Funds
Core Bond Fund
Portfolio Management Discussion — December 31, 2008 (Unaudited)
Describe any changes to the Fund’s structure or the money manager line-up.
In March 2008, Bear Stearns Asset Management Inc. was replaced by Metropolitan West Asset Management, LLC.
| | |
| |
Money Managers as of
December 31, 2008 | | Styles |
| Goldman Sachs Asset Management, L.P. | | Fully Discretionary |
| Metropolitan West Asset Management, LLC | | Sector Rotation |
| Pacific Investment Management Company LLC | | Fully Discretionary |
The views expressed in this report reflect those of the portfolio managers only through the end of the period covered by the report. These views do not necessarily represent the views of RIMCo, or any other person in RIMCo or any other affiliated organization. These views are subject to change at any time based upon market conditions or other events, and RIMCo disclaims any responsibility to update the views contained herein. These views should not be relied on as investment advice and, because investment decisions for Russell Investment Funds (RIF) are based on numerous factors, should not be relied on as an indication of investment decisions of any RIF Fund.
Russell Investment Funds
Core Bond Fund
Shareholder Expense Example — December 31, 2008 (Unaudited)
Fund Expenses
The following disclosure provides important information regarding each Fund’s Expense Example, which appears on each Fund’s individual page in this Annual Report. Please refer to this information when reviewing the Expense Example for a Fund.
Example
As a shareholder of the Fund, you incur two types of costs: (1) transaction costs, and (2) ongoing costs, including management fees and other Fund expenses. The Example is intended to help you understand your ongoing costs (in dollars) of investing in the Fund and to compare these costs with the ongoing costs of investing in other mutual funds. The Example is based on an investment of $1,000 invested at the beginning of the period and held for the entire period indicated, which for this Fund is from July 1, 2008 to December 31, 2008.
Actual Expenses
The information in the table under the heading “Actual Performance” provides information about actual account values and actual expenses. You may use the information in this column, together with the amount you invested, to estimate the expenses that you paid over the period. Simply divide your account value by $1,000 (for example, an $8,600 account value divided by $1,000 = 8.6), then multiply the result by the number in the first column in the row entitled “Expenses Paid During Period” to estimate the expenses you paid on your account during this period.
Hypothetical Example for Comparison Purposes
The information in the table under the heading “Hypothetical Performance (5% return before expenses)” provides information about hypothetical account values and hypothetical expenses based on the Fund’s actual expense ratio and an assumed rate of return of 5% per year before expenses, which is not the Fund’s actual return. The hypothetical account values and expenses may not be used to estimate the actual ending account balance or expenses you paid for the period. You may use this information to compare the ongoing costs of investing in the Fund and other funds. To do so, compare this 5% hypothetical example with the 5% hypothetical examples that appear in the shareholder reports of other funds.
Please note that the expenses shown in the table are meant to highlight your ongoing costs only and do not reflect any transactional costs. Therefore, the information under the heading “Hypothetical Performance (5% return before expenses)” is useful in comparing ongoing costs only, and will not help you determine the relative total costs of owning different funds. In addition, if these transactional costs were included, your costs would have been higher. The fee and expenses shown in this section do not reflect any Insurance Company Separate Account or Policy Charges.
| | | | | | |
| | | Actual
Performance | | Hypothetical
Performance
(5% return
before expenses) |
| | | | | | |
Beginning Account Value | | | | | | |
July 1, 2008 | | $ | 1,000.00 | | $ | 1,000.00 |
Ending Account Value | | | | | | |
December 31, 2008 | | $ | 970.84 | | $ | 1,021.62 |
Expenses Paid During Period* | | $ | 3.47 | | $ | 3.56 |
| * | Expenses are equal to the Fund’s annualized expense ratio of 0.70% (representing the one-half year period annualized), multiplied by the average account value over the period, multiplied by 184/366 (to reflect the one-half year period). Reflects amounts waived and/or reimbursed. Without the waiver and/or reimbursement, expenses would have been higher. |
Russell Investment Funds
Core Bond Fund
Schedule of Investments — December 31, 2008
Amounts in thousands (except share amounts)
| | | | |
| | | Principal
Amount ($)
or Shares | | Market
Value
$ |
| | | | |
| Long-Term Investments - 111.7% | | |
| Asset-Backed Securities - 4.7% | | |
Access Group, Inc. (Ê)
Series 2008-1 Class A
4.835% due 10/27/25 | | 900 | | 828 |
Accredited Mortgage Loan Trust (Ê)
Series 2004-2 Class A2
0.771% due 07/25/34 | | 37 | | 14 |
ACE Securities Corp. (Ê)
Series 2003-OP1 Class M2
1.971% due 12/25/33 | | 35 | | 26 |
Series 2005-SD3 Class A
0.871% due 08/25/45 | | 175 | | 141 |
Aegis Asset Backed Securities Trust (Ê) Series 2003-3 Class M2
2.946% due 01/25/34 | | 110 | | 51 |
American Express Credit Account
Master Trust (Ê)(Þ)
Series 2004-C Class C
1.695% due 02/15/12 | | 32 | | 28 |
Ameriquest Mortgage Securities,
Inc. (Ê)
Series 2002-D Class M1
4.221% due 02/25/33 | | 90 | | 48 |
Series 2004-R8 Class A5
0.841% due 09/25/34 | | 12 | | 12 |
Series 2004-R10 Class A5
0.861% due 11/25/34 | | — | | 1 |
ARES CLO Funds (Ê)(Þ)
Series 2005-10A Class A3
2.088% due 09/18/17 | | 520 | | 393 |
Bank of America Credit Card
Trust (Ê)
Series 2008-A1 Class A1
1.775% due 04/15/13 | | 200 | | 182 |
Bayview Financial Acquisition Trust
Series 2006-A Class 1A3
5.865% due 02/28/41 | | 190 | | 101 |
Centex Home Equity (Ê)
Series 2006-A Class AV4
0.721% due 06/25/36 | | 700 | | 312 |
CIT Mortgage Loan Trust (Ê)(Å)
Series 2007-1 Class 2A1
1.471% due 10/25/37 | | 328 | | 267 |
Series 2007-1 Class 2A2
1.721% due 10/25/37 | | 130 | | 49 |
Series 2007-1 Class 2A3
1.921% due 10/25/37 | | 180 | | 61 |
Citigroup Mortgage Loan Trust,
Inc. (Ê)
Series 2006-WFH Class A2
0.571% due 10/25/36 | | 827 | | 758 |
Series 2007-AMC Class A2A
0.531% due 05/25/37 | | 459 | | 368 |
Countrywide Asset-Backed Certificates
Series 2004-AB2 Class M3 (Ê)
1.071% due 05/25/36 | | 95 | | 28 |
Series 2004-BC1 Class M1 (Ê)
0.971% due 02/25/34 | | 95 | | 58 |
| | | | |
| | | Principal
Amount ($)
or Shares | | Market
Value
$ |
Series 2006-11 Class 1AF4
6.300% due 09/25/46 | | 170 | | 60 |
Countrywide Home Equity Loan
Trust (Ê)
Series 2006-HW Class 2A1B
1.345% due 11/15/36 | | 528 | | 256 |
First Franklin Mortgage Loan Asset Backed Certificates (Ê)
Series 2006-FF1 Class A3
0.521% due 11/25/36 | | 118 | | 107 |
Series 2007-FF1 Class A2B
0.561% due 01/25/38 | | 1,000 | | 732 |
GMAC Mortgage Corp. Loan Trust
Series 2007-HE3 Class 1A1
7.000% due 09/25/37 | | 76 | | 25 |
Series 2007-HE3 Class 2A1
7.000% due 09/25/37 | | 80 | | 22 |
GSAA Trust (Ê)
Series 2006-2 Class 2A3
0.741% due 12/25/35 | | 320 | | 272 |
Series 2006-4 Class 1A2
5.993% due 03/25/36 | | 215 | | 51 |
Series 2006-4 Class 3A1
6.103% due 03/25/36 | | 1,476 | | 683 |
GSAMP Trust (Ê)
Series 2003-HE2 Class M1
1.121% due 08/25/33 | | 72 | | 51 |
Series 2004-SEA Class A2A
0.761% due 03/25/34 | | 28 | | 27 |
HFC Home Equity Loan Asset Backed Certificates (Ê)
Series 2005-1 Class A
0.798% due 01/20/34 | | 200 | | 137 |
Series 2007-1 Class AS
0.708% due 03/20/36 | | 814 | | 462 |
Series 2007-3 Class APT
1.708% due 11/20/36 | | 358 | | 209 |
HSI Asset Securitization Corp.
Trust (Ê)
Series 2006-HE2 Class 2A1
0.521% due 12/25/36 | | 39 | | 34 |
Indymac Residential Asset Backed Trust (Ê)
Series 2006-H2 Class A
0.621% due 06/28/36 | | 342 | | 174 |
Lehman XS Trust (Ê)(Ø)
Series 2005-1 Class 2A2
1.971% due 07/25/35 | | 81 | | 62 |
Series 2005-5N Class 3A1A
0.771% due 11/25/35 | | 439 | | 204 |
Series 2005-7N Class 1A1A
0.741% due 12/25/35 | | 483 | | 222 |
Series 2006-2N Class 1A2
0.811% due 02/25/46 | | 211 | | 46 |
Series 2006-16N Class A1A
0.551% due 11/25/46 | | 116 | | 107 |
Series 2006-16N Class A4A
0.661% due 11/25/46 | | 751 | | 322 |
Russell Investment Funds
Core Bond Fund
Schedule of Investments, continued — December 31, 2008
Amounts in thousands (except share amounts)
| | | | |
| | | Principal
Amount ($)
or Shares | | Market
Value
$ |
| | | | |
Long Beach Mortgage Loan Trust (Ê)
Series 2004-4 Class 1A1
0.751% due 10/25/34 | | 5 | | 2 |
Series 2006-9 Class 2A1
0.531% due 10/25/36 | | 247 | | 234 |
Mastr Asset Backed Securities
Trust (Ê)
Series 2003-WMC Class M2
2.946% due 08/25/33 | | 57 | | 20 |
Series 2006-WMC Class A4
0.631% due 08/25/36 | | 850 | | 244 |
Morgan Stanley ABS Capital I (Ê)
Series 2003-NC8 Class M3
3.621% due 09/25/33 | | 32 | | 4 |
Series 2006-HE7 Class A2A
0.521% due 09/25/36 | | 215 | | 203 |
New Century Home Equity Loan
Trust (Ê)
Series 2004-4 Class M2
1.001% due 02/25/35 | | 215 | | 144 |
Option One Mortgage Loan Trust (Ê)
Series 2003-2 Class M2
3.021% due 04/25/33 | | 40 | | 16 |
Series 2003-3 Class M3
3.471% due 06/25/33 | | 29 | | 4 |
Series 2003-4 Class M2
2.121% due 07/25/33 | | 27 | | 12 |
Park Place Securities, Inc. (Ê)
Series 2005-WCW Class M1
0.921% due 09/25/35 | | 210 | | 114 |
Popular ABS Mortgage Pass-Through Trust
Series 2005-6 Class A3
5.680% due 01/25/36 | | 227 | | 206 |
Renaissance Home Equity Loan Trust
Series 2005-1 Class M1
5.357% due 05/25/35 | | 67 | | 40 |
Series 2005-2 Class AF4
4.934% due 08/25/35 | | 85 | | 57 |
Series 2006-1 Class AF6
5.746% due 05/25/36 | | 175 | | 134 |
Residential Asset Mortgage Products, Inc.
Series 2003-RS1 Class AI6A
5.980% due 12/25/33 | | 161 | | 89 |
Series 2006-RZ4 Class A1A (Ê)
0.551% due 10/25/36 | | 288 | | 267 |
Residential Asset Securities Corp.
Series 2003-KS2 Class MI1
4.800% due 04/25/33 | | 258 | | 181 |
Series 2003-KS2 Class MI3
6.100% due 04/25/33 | | 64 | | 22 |
Series 2003-KS4 Class AIIB (Ê)
1.051% due 06/25/33 | | 43 | | 25 |
Series 2006-KS9 Class AI1 (Ê)
0.541% due 11/25/36 | | 58 | | 56 |
Series 2007-KS2 Class AI1 (Ê)
0.541% due 02/25/37 | | 233 | | 204 |
SBI Heloc Trust (Ê)(Þ)
Series 2006-1A Class 1A2A
0.641% due 08/25/36 | | 65 | | 61 |
| | | | |
| | | Principal
Amount ($)
or Shares | | Market
Value
$ |
SLM Student Loan Trust (Ê)
Series 2007-3 Class A1
3.525% due 10/27/14 | | 341 | | 330 |
Series 2008-2 Class A1
3.835% due 01/26/15 | | 93 | | 92 |
Series 2008-7 Class A2
4.035% due 10/25/17 | | 2,800 | | 2,629 |
Small Business Administration
Series 2000-P10 Class 1
7.449% due 08/10/10 | | 5 | | 5 |
Series 2005-20G Class 1
4.750% due 07/01/25 | | 794 | | 799 |
Soundview Home Equity Loan Trust
Series 2006-WF1 Class A2
5.645% due 10/25/36 | | 290 | | 281 |
Structured Asset Investment Loan
Trust (Ê)
Series 2005-3 Class M2
0.911% due 04/25/35 | | 120 | | 40 |
Structured Asset Securities Corp. (Ê)
Series 2006-BC3 Class A2
0.521% due 10/25/36 | | 92 | | 85 |
Series 2007-BC3 Class 2A2
0.611% due 08/25/09 | | 920 | | 479 |
| | | | |
| | | | 15,070 |
| | | | |
| |
| Corporate Bonds and Notes - 18.9% | | |
Ace Capital Trust II
9.700% due 04/01/30 | | 175 | | 134 |
Allied Waste North America, Inc.
Series B
7.125% due 05/15/16 | | 90 | | 82 |
Allstate Life Global Funding Trusts
5.375% due 04/30/13 | | 200 | | 197 |
Altria Group, Inc.
9.700% due 11/10/18 | | 275 | | 297 |
American Electric Power Co., Inc. (Ñ)
Series C
5.375% due 03/15/10 | | 35 | | 35 |
American Express Bank FSB
Series BKNT
5.500% due 04/16/13 | | 300 | | 284 |
6.000% due 09/13/17 | | 400 | | 375 |
American Express Centurion Bank
Series BKN1
6.000% due 09/13/17 | | 400 | | 375 |
American Express Co.
7.000% due 03/19/18 | | 200 | | 202 |
American General Finance Corp.
4.875% due 05/15/10 | | 225 | | 134 |
6.900% due 12/15/17 | | 400 | | 173 |
American International Group, Inc.
4.700% due 10/01/10 | | 20 | | 18 |
5.850% due 01/16/18 | | 900 | | 603 |
Americo Life, Inc. (Å)
7.875% due 05/01/13 | | 75 | | 71 |
Amgen, Inc.
6.900% due 06/01/38 | | 1,000 | | 1,142 |
Russell Investment Funds
Core Bond Fund
Schedule of Investments, continued — December 31, 2008
Amounts in thousands (except share amounts)
| | | | |
| | | Principal
Amount ($)
or Shares | | Market
Value
$ |
| | | | |
ANZ Capital Trust (ƒ)(Þ)
4.484% due 12/31/49 | | 225 | | 174 |
Appalachian Power Co.
Series O
5.650% due 08/15/12 | | 65 | | 62 |
ArcelorMittal USA (Ñ)
6.500% due 04/15/14 | | 210 | | 149 |
Arizona Public Service Co.
5.800% due 06/30/14 | | 100 | | 84 |
6.250% due 08/01/16 | | 150 | | 121 |
AT&T, Inc.
4.950% due 01/15/13 | | 200 | | 201 |
5.500% due 02/01/18 | | 200 | | 202 |
6.300% due 01/15/38 | | 975 | | 1,031 |
6.400% due 05/15/38 | | 400 | | 428 |
Bank of America Corp.
5.625% due 10/14/16 | | 115 | | 113 |
6.000% due 09/01/17 | | 335 | | 340 |
5.750% due 12/01/17 | | 490 | | 489 |
5.650% due 05/01/18 | | 175 | | 176 |
8.000% due 12/29/49 (ƒ) | | 2,500 | | 1,798 |
8.125% due 12/29/49 (ƒ) | | 375 | | 280 |
Bank of America NA (Ê)
Series BKNT
2.276% due 06/15/16 | | 200 | | 134 |
BankAmerica Capital III (Ê)
Series*
5.323% due 01/15/27 | | 350 | | 186 |
Bear Stearns Cos. LLC (The)
4.903% due 07/19/10 (Ê) | | 600 | | 581 |
6.950% due 08/10/12 | | 600 | | 623 |
7.250% due 02/01/18 | | 645 | | 707 |
Bellsouth Telecommunications, Inc.
7.000% due 12/01/95 | | 245 | | 192 |
BNP Paribas Capital Trust (ƒ)(Ñ)(Å)
9.003% due 12/29/49 | | 450 | | 276 |
Boardwalk Pipelines, LP
5.875% due 11/15/16 | | 225 | | 188 |
Burlington Northern Santa Fe Corp.
6.875% due 12/01/27 | | 25 | | 25 |
6.750% due 03/15/29 | | 10 | | 10 |
Calpine Construction Finance Co., LP
and CCFC Finance Corp. (Ê)(Þ)
11.603% due 08/26/11 | | 300 | | 274 |
Caterpillar Financial Services Corp.
4.850% due 12/07/12 | | 100 | | 95 |
Catlin Insurance Co., Ltd. (ƒ)(Å)
7.249% due 12/31/49 | | 100 | | 40 |
Cellco Partnership (Þ)
8.500% due 11/15/18 | | 225 | | 264 |
CenterPoint Energy Houston Electric LLC (Ñ)
Series J2
5.700% due 03/15/13 | | 110 | | 105 |
CenterPoint Energy Resources Corp.
6.125% due 11/01/17 | | 50 | | 42 |
Series B
7.875% due 04/01/13 | | 165 | | 153 |
| | | | |
| | | Principal
Amount ($)
or Shares | | Market
Value
$ |
Chubb Corp.
6.375% due 03/29/67 | | 175 | | 109 |
Series 1
6.500% due 05/15/38 | | 50 | | 48 |
Citigroup Capital XXI
8.300% due 12/21/57 | | 250 | | 193 |
Citigroup, Inc.
5.500% due 08/27/12 | | 200 | | 194 |
5.500% due 04/11/13 | | 700 | | 682 |
5.850% due 07/02/13 | | 425 | | 410 |
6.500% due 08/19/13 | | 565 | | 570 |
4.700% due 05/29/15 | | 50 | | 43 |
5.850% due 08/02/16 (Ñ) | | 55 | | 53 |
6.000% due 08/15/17 | | 400 | | 398 |
6.125% due 11/21/17 | | 405 | | 409 |
6.125% due 08/25/36 | | 300 | | 269 |
6.875% due 03/05/38 | | 325 | | 370 |
8.400% due 04/29/49 (ƒ) | | 750 | | 495 |
CNA Financial Corp.
6.500% due 08/15/16 | | 125 | | 89 |
Columbus Southern Power Co.
Series C
5.500% due 03/01/13 | | 10 | | 10 |
Comcast Cable Communications
Holdings, Inc. (Ñ)
9.455% due 11/15/22 | | 125 | | 140 |
Comcast Cable Holdings LLC
9.800% due 02/01/12 | | 180 | | 190 |
7.875% due 08/01/13 | | 245 | | 252 |
Comcast Corp. (Ñ)
5.500% due 03/15/11 | | 100 | | 98 |
Comcast Holdings Corp.
10.625% due 07/15/12 | | 125 | | 133 |
Commonwealth Edison Co.
6.950% due 07/15/18 | | 50 | | 47 |
5.900% due 03/15/36 | | 75 | | 62 |
Series 105
5.400% due 12/15/11 | | 125 | | 122 |
Community Health Systems, Inc. (Ñ)
Series WI
8.875% due 07/15/15 | | 235 | | 216 |
Continental Airlines, Inc.
Series 071A
5.983% due 04/19/22 | | 150 | | 101 |
Series 991A
6.545% due 08/02/20 | | 298 | | 238 |
Countrywide Financial Corp.
Series MTN
5.800% due 06/07/12 | | 100 | | 97 |
Countrywide Home Loans, Inc.
Series MTNL
4.000% due 03/22/11 | | 290 | | 276 |
COX Communications, Inc.
4.625% due 01/15/10 | | 350 | | 339 |
5.875% due 12/01/16 (Þ) | | 75 | | 67 |
Credit Suisse USA, Inc.
5.500% due 08/15/13 | | 45 | | 44 |
4.875% due 01/15/15 (Ñ) | | 55 | | 50 |
Russell Investment Funds
Core Bond Fund
Schedule of Investments, continued — December 31, 2008
Amounts in thousands (except share amounts)
| | | | |
| | | Principal
Amount ($)
or Shares | | Market
Value
$ |
| | | | |
CSC Holdings, Inc. (Ñ)
Series WI
6.750% due 04/15/12 | | 90 | | 82 |
CSX Corp.
6.250% due 03/15/18 | | 75 | | 69 |
DCP Midstream LLC
6.875% due 02/01/11 | | 20 | | 19 |
Dell, Inc. (Ñ)
4.700% due 04/15/13 | | 400 | | 376 |
Delta Air Lines, Inc.
Series 00A2
7.570% due 11/18/10 | | 205 | | 172 |
Series 01A2
7.111% due 09/18/11 | | 400 | | 320 |
Detroit Edison Co. (The)
6.350% due 10/15/32 | | 50 | | 47 |
DPL, Inc.
6.875% due 09/01/11 | | 193 | | 190 |
Echostar DBS Corp. (Ñ)
7.125% due 02/01/16 | | 125 | | 104 |
El Paso Corp. (Ñ)
8.050% due 10/15/30 | | 200 | | 130 |
El Paso Natural Gas Co.
7.500% due 11/15/26 | | 100 | | 83 |
Energy Transfer Partners, LP
5.950% due 02/01/15 | | 325 | | 279 |
6.700% due 07/01/18 | | 200 | | 169 |
Enterprise Products Operating LLC
4.950% due 06/01/10 | | 125 | | 120 |
6.500% due 01/31/19 | | 100 | | 84 |
8.375% due 08/01/66 | | 100 | | 55 |
Federal Express Corp.
7.600% due 07/01/97 | | 75 | | 68 |
Fifth Third Bancorp
8.250% due 03/01/38 | | 1,100 | | 909 |
FirstEnergy Corp.
Series B
6.450% due 11/15/11 | | 280 | | 265 |
Series C
7.375% due 11/15/31 | | 125 | | 118 |
Ford Motor Credit Co. LLC
7.875% due 06/15/10 | | 200 | | 160 |
Frontier Communications Corp. (Ñ)
9.250% due 05/15/11 | | 125 | | 119 |
General Electric Capital Corp.
4.573% due 01/20/10 (Ê) | | 200 | | 191 |
5.875% due 01/14/38 | | 300 | | 294 |
6.375% due 11/15/67 (Ñ) | | 1,900 | | 1,194 |
Series GMTN (Ñ)
5.500% due 04/28/11 | | 220 | | 225 |
Series MTNA (Ê)(Ñ)
2.256% due 09/15/14 | | 300 | | 231 |
General Electric Co.
5.250% due 12/06/17 | | 150 | | 150 |
Goldman Sachs Group, Inc. (The)
4.500% due 06/15/10 (Ñ) | | 125 | | 123 |
4.750% due 07/15/13 (Ñ) | | 350 | | 315 |
| | | | |
| | | Principal
Amount ($)
or Shares | | Market
Value
$ |
6.250% due 09/01/17 | | 600 | | 582 |
6.150% due 04/01/18 | | 150 | | 144 |
6.750% due 10/01/37 | | 800 | | 649 |
Series MTNB (Ê)(Ñ)
4.459% due 07/22/15 | | 100 | | 70 |
GrafTech Finance, Inc.
10.250% due 02/15/12 | | 12 | | 11 |
HCA, Inc.
9.125% due 11/15/14 (Ñ) | | 125 | | 116 |
9.250% due 11/15/16 | | 235 | | 216 |
HCP, Inc.
5.950% due 09/15/11 | | 300 | | 249 |
Historic TW, Inc.
8.050% due 01/15/16 | | 195 | | 193 |
HSBC Finance Corp. (Ê)
2.179% due 03/12/10 | | 300 | | 273 |
2.638% due 05/10/10 | | 100 | | 90 |
Idearc, Inc. (Ñ)
8.000% due 11/15/16 | | 125 | | 9 |
ING Capital Funding Trust III (ƒ)
8.439% due 12/29/49 | | 275 | | 138 |
Inmarsat Finance PLC
10.375% due 11/15/12 | | 125 | | 111 |
International Lease Finance Corp. (Ñ)
4.950% due 02/01/11 | | 100 | | 72 |
International Paper Co.
5.850% due 10/30/12 | | 510 | | 440 |
Jackson National Life Fund LLC (Ê) 2.981% due 08/06/11 | | 2,800 | | 2,668 |
Jersey Central Power & Light Co. (Ñ)
5.625% due 05/01/16 | | 90 | | 84 |
JPMorgan Chase Capital XIII (Ê)
Series M
2.418% due 09/30/34 | | 480 | | 343 |
JPMorgan Chase & Co.
5.375% due 01/15/14 (Ñ) | | 170 | | 172 |
6.000% due 01/15/18 (Ñ) | | 200 | | 211 |
6.400% due 05/15/38 | | 323 | | 382 |
Series 1 (ƒ)
7.900% due 04/29/49 | | 840 | | 699 |
JPMorgan Chase Bank NA
Series BKNT
5.875% due 06/13/16 | | 70 | | 70 |
6.000% due 10/01/17 | | 400 | | 403 |
Kerr-McGee Corp.
6.950% due 07/01/24 | | 125 | | 110 |
KeyBank NA (Ê)
Series BKNT
4.467% due 06/02/10 | | 300 | | 289 |
Kinder Morgan Energy Partners, LP
5.950% due 02/15/18 | | 700 | | 597 |
Kraft Foods, Inc.
6.500% due 08/11/17 | | 100 | | 101 |
6.125% due 02/01/18 | | 200 | | 196 |
L-3 Communications Corp.
Series B
6.375% due 10/15/15 | | 125 | | 117 |
Russell Investment Funds
Core Bond Fund
Schedule of Investments, continued — December 31, 2008
Amounts in thousands (except share amounts)
| | | | |
| | | Principal
Amount ($)
or Shares | | Market
Value
$ |
| | | | |
Lehman Brothers Holdings, Inc. (Ø)
2.951% due 05/25/10 (Ê) | | 200 | | 18 |
5.625% due 01/24/13 | | 200 | | 19 |
6.200% due 09/26/14 | | 200 | | 19 |
Manufacturers & Traders Trust Co.
5.585% due 12/28/20 | | 84 | | 60 |
Merrill Lynch & Co., Inc.
6.050% due 08/15/12 | | 100 | | 99 |
5.450% due 02/05/13 | | 200 | | 192 |
6.400% due 08/28/17 | | 325 | | 326 |
6.875% due 04/25/18 | | 500 | | 523 |
MetLife, Inc.
6.125% due 12/01/11 | | 205 | | 202 |
6.400% due 12/15/36 | | 100 | | 60 |
Series A
6.817% due 08/15/18 | | 200 | | 190 |
Metropolitan Life Global
Funding I (Ê)(Þ)
2.189% due 05/17/10 | | 400 | | 359 |
Midamerican Energy Holdings Co.
5.750% due 04/01/18 | | 125 | | 122 |
6.125% due 04/01/36 | | 150 | | 139 |
Mirant Mid Atlantic Trust
Series A
8.625% due 06/30/12 | | 295 | | 268 |
Mohegan Tribal Gaming Authority (Ñ)
8.000% due 04/01/12 | | 125 | | 76 |
Morgan Stanley
4.233% due 05/14/10 (Ê) | | 400 | | 372 |
4.209% due 03/01/13 (Ê) | | 600 | | 612 |
4.953% due 10/18/16 (Ê) | | 435 | | 299 |
6.250% due 08/28/17 | | 100 | | 85 |
5.950% due 12/28/17 | | 125 | | 104 |
6.625% due 04/01/18 | | 450 | | 395 |
Series GMTN
5.750% due 08/31/12 | | 125 | | 117 |
Series MTN (Ê)(Ñ)
4.843% due 01/15/10 | | 300 | | 276 |
Nationwide Life Global Funding I (Ê)(Þ)
2.439% due 05/19/10 | | 1,900 | | 1,856 |
Nelnet, Inc.
7.400% due 09/29/36 | | 125 | | 37 |
Nevada Power Co.
Series L
5.875% due 01/15/15 | | 100 | | 96 |
New Cingular Wireless Services, Inc.
7.875% due 03/01/11 | | 150 | | 155 |
News America Holdings, Inc.
7.900% due 12/01/95 | | 90 | | 81 |
8.250% due 10/17/96 | | 20 | | 19 |
News America, Inc.
6.650% due 11/15/37 | | 225 | | 223 |
NGPL Pipeco LLC (Þ)
6.514% due 12/15/12 | | 200 | | 190 |
Nisource Finance Corp.
7.875% due 11/15/10 | | 125 | | 114 |
6.400% due 03/15/18 | | 145 | | 90 |
| | | | |
| | | Principal
Amount ($)
or Shares | | Market
Value
$ |
Norfolk Southern Corp.
7.900% due 05/15/97 | | 415 | | 455 |
Ohio Power Co. (Ñ)
Series F
5.500% due 02/15/13 | | 20 | | 19 |
Oncor Electric Delivery Co. (Þ)
6.800% due 09/01/18 | | 550 | | 527 |
ONEOK Partners, LP
6.650% due 10/01/36 | | 100 | | 77 |
6.850% due 10/15/37 | | 100 | | 79 |
Philip Morris International, Inc.
5.650% due 05/16/18 | | 350 | | 347 |
6.375% due 05/16/38 | | 100 | | 104 |
Phoenix Life Insurance Co. (Þ)
7.150% due 12/15/34 | | 150 | | 92 |
PNC Bank NA
Series BKNT
6.875% due 04/01/18 | | 250 | | 266 |
Progress Energy, Inc.
7.100% due 03/01/11 | | 77 | | 76 |
5.625% due 01/15/16 | | 40 | | 37 |
Public Service Co. of New Mexico
7.950% due 05/15/18 | | 260 | | 212 |
Pulte Homes, Inc.
5.250% due 01/15/14 | | 1,000 | | 715 |
Qwest Corp.
7.625% due 06/15/15 | | 100 | | 82 |
RBS Capital Trust III (ƒ)(Ñ)
5.512% due 09/29/49 | | 200 | | 80 |
Reckson Operating Partnership, LP
5.150% due 01/15/11 | | 92 | | 68 |
Reinsurance Group of America, Inc.
6.750% due 12/15/65 | | 75 | | 28 |
Rohm & Haas Co.
6.000% due 09/15/17 | | 100 | | 91 |
Sabine Pass LNG, LP (Ñ)
7.250% due 11/30/13 | | 275 | | 201 |
Simon Property Group, LP
5.600% due 09/01/11 | | 200 | | 167 |
5.300% due 05/30/13 | | 765 | | 572 |
6.100% due 05/01/16 | | 130 | | 83 |
6.125% due 05/30/18 (Ñ) | | 175 | | 118 |
SLM Corp.
Series MTN
5.400% due 10/25/11 | | 100 | | 76 |
5.125% due 08/27/12 | | 75 | | 56 |
8.450% due 06/15/18 | | 100 | | 79 |
State Street Capital Trust III (ƒ)
8.250% due 12/29/49 | | 200 | | 155 |
Sun Life Financial Global
Funding, LP (Ê)(Þ)
1.718% due 07/06/10 | | 1,500 | | 1,481 |
Swiss Re Capital I, LP (ƒ)(Þ)
6.854% due 05/29/49 | | 225 | | 72 |
Symetra Financial Corp. (Å)
6.125% due 04/01/16 | | 150 | | 123 |
Russell Investment Funds
Core Bond Fund
Schedule of Investments, continued — December 31, 2008
Amounts in thousands (except share amounts)
| | | | |
| | | Principal
Amount ($)
or Shares | | Market
Value
$ |
| | | | |
Target Corp. (Ñ)
5.125% due 01/15/13 | | 400 | | 395 |
Tennessee Gas Pipeline Co. (Ñ)
7.000% due 10/15/28 | | 50 | | 38 |
TEPPCO Partners, LP
6.650% due 04/15/18 | | 250 | | 202 |
Time Warner Cable, Inc.
Series WI
5.400% due 07/02/12 | | 300 | | 280 |
6.550% due 05/01/37 | | 75 | | 72 |
Time Warner, Inc.
5.875% due 11/15/16 | | 400 | | 359 |
Travelers Cos., Inc. (The)
6.250% due 06/15/37 | | 100 | | 96 |
Union Electric Co.
6.400% due 06/15/17 | | 205 | | 187 |
Union Pacific Corp.
5.700% due 08/15/18 | | 400 | | 385 |
United States Steel Corp.
5.650% due 06/01/13 | | 35 | | 26 |
6.050% due 06/01/17 | | 95 | | 62 |
6.650% due 06/01/37 | | 40 | | 20 |
UnitedHealth Group, Inc.
5.250% due 03/15/11 (Ñ) | | 95 | | 89 |
4.875% due 02/15/13 (Ñ) | | 200 | | 187 |
6.000% due 06/15/17 | | 35 | | 32 |
Series WI
6.500% due 06/15/37 | | 45 | | 38 |
Valero Energy Corp.
6.625% due 06/15/37 | | 225 | | 165 |
Verizon Communications, Inc.
6.400% due 02/15/38 | | 175 | | 186 |
Wachovia Capital Trust III (ƒ)
5.800% due 03/15/42 | | 125 | | 74 |
Wachovia Corp.
5.500% due 05/01/13 | | 450 | | 445 |
5.625% due 10/15/16 | | 100 | | 91 |
5.750% due 06/15/17 (Ñ) | | 155 | | 154 |
5.750% due 02/01/18 (Ñ) | | 500 | | 501 |
Wells Fargo & Co.
5.625% due 12/11/17 | | 800 | | 835 |
Series K (ƒ)(Ñ)
7.980% due 02/28/49 | | 3,585 | | 3,056 |
Wells Fargo Capital XIII (ƒ)
Series GMTN
7.700% due 12/29/49 | | 150 | | 124 |
Wells Fargo Capital XV (ƒ)(Ñ)
9.750% due 12/29/49 | | 150 | | 152 |
Windstream Corp.
Series WI
8.625% due 08/01/16 | | 125 | | 111 |
XTO Energy, Inc.
6.500% due 12/15/18 | | 325 | | 315 |
ZFS Finance USA Trust I (Þ)
6.150% due 12/15/65 | | 500 | | 280 |
| | | | |
| | | | 60,233 |
| | | | |
| | | | |
| | | Principal
Amount ($)
or Shares | | Market
Value
$ |
| International Debt - 5.3% | | |
America Movil SAB de CV
5.500% due 03/01/14 | | 100 | | 92 |
ANZ National International, Ltd. (Þ)
6.200% due 07/19/13 | | 600 | | 581 |
ArcelorMittal
6.125% due 06/01/18 | | 300 | | 205 |
AstraZeneca PLC
5.900% due 09/15/17 | | 100 | | 106 |
AXA SA (ƒ)(Þ)
6.463% due 12/14/18 | | 100 | | 44 |
Ballyrock CDO, Ltd. (Ê)(Å)
Series 2005-3A Class A2
3.765% due 07/25/17 | | 1,000 | | 764 |
Barclays Bank PLC
5.450% due 09/12/12 | | 1,300 | | 1,316 |
6.050% due 12/04/17 (Þ) | | 200 | | 176 |
Barrick Gold Financeco LLC (Ñ)
6.125% due 09/15/13 | | 270 | | 256 |
BAT International Finance PLC (Þ)
9.500% due 11/15/18 | | 200 | | 222 |
Black Diamond CLO, Ltd. (Ê)(Å)
Series 2007-1A Class AD
3.758% due 04/29/19 | | 1,000 | | 700 |
BNP Paribas (ƒ)
5.186% due 06/29/49 | | 300 | | 170 |
Callidus Debt Partners Fund, Ltd. (Ê)(Å)
Series 2003-2A Class A
2.649% due 05/15/15 | | 973 | | 779 |
Canadian Natural Resources, Ltd.
5.150% due 02/01/13 | | 100 | | 93 |
5.700% due 05/15/17 | | 75 | | 65 |
6.500% due 02/15/37 | | 100 | | 82 |
Credit Suisse NY
5.000% due 05/15/13 | | 330 | | 318 |
6.000% due 02/15/18 | | 450 | | 413 |
Deutsche Bank AG/London
6.000% due 09/01/17 | | 600 | | 637 |
Deutsche Telekom International Finance BV
5.375% due 03/23/11 (Ñ) | | 75 | | 74 |
8.750% due 06/15/30 | | 100 | | 123 |
Egypt Government AID Bonds
4.450% due 09/15/15 | | 295 | | 319 |
EnCana Corp.
6.500% due 02/01/38 | | 225 | | 181 |
Endurance Specialty Holdings, Ltd.
6.150% due 10/15/15 | | 100 | | 87 |
Enel Finance International SA (Þ)
6.250% due 09/15/17 | | 600 | | 507 |
HBOS PLC (Þ)
6.750% due 05/21/18 | | 825 | | 726 |
HSBC Holdings PLC
6.500% due 05/02/36 | | 100 | | 102 |
6.500% due 09/15/37 | | 100 | | 102 |
Inco, Ltd.
5.700% due 10/15/15 | | 175 | | 144 |
Russell Investment Funds
Core Bond Fund
Schedule of Investments, continued — December 31, 2008
Amounts in thousands (except share amounts)
| | | | |
| | | Principal
Amount ($)
or Shares | | Market
Value
$ |
| | | | |
Ispat Inland ULC
9.750% due 04/01/14 | | 689 | | 590 |
Korea Development Bank (Ê)
1.565% due 04/03/10 | | 900 | | 869 |
Korea Electric Power Corp. (Þ)
5.125% due 04/23/34 | | 60 | | 53 |
Loomis Sayles, Ltd. (Ê)(Þ)
Series 2006-1A Class A
3.765% due 10/26/20 | | 1,500 | | 999 |
MUFG Capital Finance 1, Ltd. (ƒ)
6.346% due 07/29/49 | | 200 | | 139 |
National Australia Bank, Ltd. (Þ)
5.350% due 06/12/13 | | 800 | | 771 |
Ras Laffan Liquefied Natural Gas Co.,
Ltd. III (Þ)
5.838% due 09/30/27 | | 250 | | 151 |
Resona Bank, Ltd. (ƒ)(Þ)
5.850% due 09/29/49 | | 100 | | 57 |
Resona Preferred Global Securities
Cayman, Ltd. (ƒ)(Þ)
7.191% due 12/29/49 | | 325 | | 155 |
Rogers Communications, Inc.
6.800% due 08/15/18 | | 200 | | 202 |
Royal Bank of Scotland Group PLC
6.990% due 10/29/49 (ƒ)(Þ) | | 450 | | 210 |
Series 1 (ƒ)
9.118% due 03/31/49 | | 700 | | 598 |
Santander Perpetual SA Unipersonal (ƒ)(Þ)
6.671% due 10/29/49 | | 300 | | 191 |
SMFG Preferred Capital USD 1, Ltd. (ƒ)(Þ)
6.078% due 01/29/49 | | 100 | | 67 |
Sumitomo Mitsui Banking Corp. (ƒ)(Þ)
5.625% due 07/29/49 | | 300 | | 222 |
Systems 2001 AT LLC (Þ)
7.156% due 12/15/11 | | 73 | | 64 |
Telecom Italia Capital SA
6.200% due 07/18/11 | | 255 | | 226 |
7.721% due 06/04/38 | | 200 | | 164 |
Thomson Reuters Corp.
6.500% due 07/15/18 | | 225 | | 205 |
TransCapitalInvest, Ltd. for
OJSC AK Transneft (Þ)
8.700% due 08/07/18 | | 100 | | 64 |
Transocean, Ltd.
6.800% due 03/15/38 | | 150 | | 134 |
UBS AG
3.779% due 05/05/10 (Ê) | | 700 | | 699 |
Series DPNT
5.875% due 12/20/17 | | 400 | | 367 |
5.750% due 04/25/18 | | 100 | | 91 |
UBS Luxembourg SA for OJSC
Vimpel Communications
Series REGS
8.250% due 05/23/16 | | 100 | | 54 |
WEA Finance LLC / WCI Finance LLC (Þ)
5.400% due 10/01/12 | | 125 | | 96 |
| | | | |
| | | Principal
Amount ($)
or Shares | | Market
Value
$ |
Westfield Capital Corp., Ltd. /
WT Finance Aust Pty Ltd /
WEA Finance LLC (Þ)
5.125% due 11/15/14 | | 125 | | 87 |
Xstrata Canada Corp.
7.250% due 07/15/12 | | 50 | | 39 |
6.000% due 10/15/15 | | 45 | | 30 |
| | | | |
| | | | 16,978 |
| | | | |
| | |
| Loan Agreements - 0.4% | | | | |
Adam Aircraft Industries, Term Loan (Å)
14.890% due 05/23/12 | | 56 | | 5 |
NRG Energy, Inc. Term Loan B (Ê)
2.959% due 02/01/13 | | 1,579 | | 1,326 |
| | | | |
| | | | 1,331 |
| | | | |
| |
| Mortgage-Backed Securities - 78.1% | | |
ABN Amro Mortgage Corp.
Series 2003-13 Class A3
5.500% due 01/25/34 | | 1,710 | | 1,293 |
Adjustable Rate Mortgage Trust (Ê)
Series 2004-5 Class 2A1
4.996% due 04/25/35 | | 76 | | 46 |
Series 2005-3 Class 8A2
0.711% due 07/25/35 | | 126 | | 60 |
American Home Mortgage Assets (Ê)
Series 2007-4 Class A2
0.661% due 08/25/37 | | 1,060 | | 339 |
American Home Mortgage Investment Trust (Ê)
Series 2004-4 Class 4A
4.390% due 02/25/45 | | 105 | | 53 |
Banc of America Alternative Loan Trust
Series 2003-2 Class CB2 (Ê)
0.971% due 04/25/33 | | 72 | | 62 |
Series 2003-10 Class 2A2 (Ê)
0.921% due 12/25/33 | | 177 | | 138 |
Series 2006-5 Class CB17
6.000% due 06/25/46 | | 198 | | 117 |
Banc of America Commercial Mortgage, Inc.
Series 2004-3 Class A3
4.875% due 06/10/39 | | 217 | | 215 |
Series 2005-2 Class A4
4.783% due 07/10/43 | | 333 | | 301 |
Series 2005-3 Class A2
4.501% due 07/10/43 | | 150 | | 138 |
Series 2005-5 Class A4
5.115% due 10/10/45 | | 500 | | 408 |
Series 2006-1 Class A4
5.372% due 09/10/45 | | 280 | | 224 |
Series 2006-2 Class A4
5.739% due 05/10/45 | | 200 | | 163 |
Banc of America Funding Corp.
Series 2005-D Class A1 (Ê)
4.155% due 05/25/35 | | 124 | | 88 |
Russell Investment Funds
Core Bond Fund
Schedule of Investments, continued — December 31, 2008
Amounts in thousands (except share amounts)
| | | | |
| | | Principal
Amount ($)
or Shares | | Market
Value
$ |
| | | | |
Series 2006-3 Class 5A8
5.500% due 03/25/36 | | 475 | | 382 |
Series 2006-A Class 3A2
5.850% due 02/20/36 | | 161 | | 86 |
Series 2006-A Class 4A1 (Ê)
5.562% due 02/20/36 | | 419 | | 266 |
Banc of America Mortgage Securities, Inc.
Series 2003-9 Class 1A12 (Ê)
0.921% due 12/25/33 | | 344 | | 312 |
Series 2004-1 Class 5A1
6.500% due 09/25/33 | | 13 | | 12 |
Series 2004-2 Class 1A9 (Ê)
0.921% due 03/25/34 | | 177 | | 164 |
Series 2004-11 Class 2A1
5.750% due 01/25/35 | | 376 | | 316 |
Series 2005-H Class 2A5 (Ê)
4.805% due 09/25/35 | | 220 | | 123 |
Series 2005-L Class 3A1 (Ê)
5.460% due 01/25/36 | | 218 | | 169 |
Series 2006-2 Class A15
6.000% due 07/25/36 | | 212 | | 173 |
Series 2006-B Class 1A1 (Ê)
6.153% due 11/20/36 | | 121 | | 60 |
Series 2007-3 Class 1A1
6.000% due 09/25/37 | | 831 | | 523 |
Bear Stearns Adjustable Rate Mortgage Trust (Ê)
Series 2003-1 Class 6A1
5.037% due 04/25/33 | | 54 | | 43 |
Series 2003-8 Class 4A1
5.176% due 01/25/34 | | 92 | | 58 |
Series 2004-1 Class 21A1
4.707% due 04/25/34 | | 82 | | 57 |
Series 2004-9 Class 22A1
4.786% due 11/25/34 | | 84 | | 63 |
Series 2005-2 Class A1
4.125% due 03/25/35 | | 1,282 | | 1,085 |
Series 2005-3 Class 2A1
5.076% due 06/25/35 | | 284 | | 140 |
Bear Stearns Alt-A Trust
Series 2005-4 Class 23A1
5.364% due 05/25/35 | | 209 | | 141 |
Series 2005-7 Class 22A1
5.495% due 09/25/35 | | 99 | | 46 |
Series 2006-4 Class 13A1 (Ê)
0.631% due 08/25/36 | | 788 | | 312 |
Bear Stearns Alt-A Trust II
Series 2007-1 Class 1A1
6.196% due 09/25/47 | | 865 | | 392 |
Bear Stearns Commercial Mortgage Securities
Series 2005-T20 Class A4A
5.151% due 10/12/42 | | 600 | | 518 |
Series 2006-PW1 Class A4
5.540% due 09/11/41 | | 1,000 | | 784 |
Bear Stearns Mortgage Funding Trust (Ê)
Series 2006-AR2 Class 1A1
0.671% due 09/25/46 | | 827 | | 337 |
| | | | |
| | | Principal
Amount ($)
or Shares | | Market
Value
$ |
Series 2006-AR2 Class 2A1
0.701% due 10/25/36 | | 734 | | 286 |
Chase Mortgage Finance Corp.
Series 2003-S8 Class A1
4.500% due 09/25/18 | | 134 | | 124 |
Series 2006-S4 Class A3
6.000% due 12/25/36 | | 216 | | 198 |
Series 2006-S4 Class A4
6.000% due 12/25/36 | | 139 | | 136 |
Series 2007-A1 Class 1A3 (Ê)
4.884% due 02/25/37 | | 571 | | 486 |
Citigroup Commercial Mortgage Trust
Series 2006-C4 Class A3
5.724% due 03/15/49 | | 330 | | 259 |
Citigroup Mortgage Loan Trust, Inc.
Series 2005-11 Class A2A (Ê)
4.700% due 12/25/35 | | 72 | | 52 |
Series 2007-AR8 Class 2A1A
5.912% due 07/25/37 | | 209 | | 123 |
Citigroup/Deutsche Bank Commercial Mortgage Trust
Series 2005-CD1 Class A4 (Ê)
5.225% due 07/15/44 | | 1,340 | | 1,112 |
Series 2006-CD3 Class A5
5.617% due 10/15/48 | | 190 | | 151 |
Citimortgage Alternative Loan Trust
Series 2006-A3 Class 1A5
6.000% due 07/25/36 | | 132 | | 80 |
Commercial Mortgage Pass Through Certificates
Series 2006-C8 Class A4
5.306% due 12/10/46 | | 200 | | 146 |
Series 2007-C9 Class A4 (Ê)
5.816% due 12/10/49 | | 360 | | 273 |
Countrywide Alternative Loan Trust
Series 2005-1CB Class 2A1
6.000% due 03/25/35 | | 591 | | 390 |
Series 2005-32T Class A7 (Ê)
0.721% due 08/25/35 | | 129 | | 85 |
Series 2005-J8 Class 1A3
5.500% due 07/25/35 | | 192 | | 164 |
Series 2005-J13 Class 2A3
5.500% due 11/25/35 | | 128 | | 77 |
Series 2006-9T1 Class A7
6.000% due 05/25/36 | | 96 | | 60 |
Series 2006-43C Class 1A7
6.000% due 02/25/37 | | 254 | | 134 |
Series 2006-J2 Class A3
6.000% due 04/25/36 | | 149 | | 136 |
Series 2006-OA1 Class 2A1 (Ê)
0.718% due 03/20/46 | | 570 | | 234 |
Series 2006-OA1 Class 4A1 (Ê)
0.661% due 08/25/46 | | 621 | | 242 |
Series 2006-OA1 Class A1 (Ê)
0.688% due 02/20/47 | | 754 | | 310 |
Series 2007-15C Class A5
5.750% due 07/25/37 | | 872 | | 418 |
Russell Investment Funds
Core Bond Fund
Schedule of Investments, continued — December 31, 2008
Amounts in thousands (except share amounts)
| | | | |
| | | Principal
Amount ($)
or Shares | | Market
Value
$ |
| | | | |
Series 2007-J2 Class 2A1
6.000% due 07/25/37 | | 250 | | 112 |
Series 2007-OA1 Class A1A (Ê)
3.636% due 04/25/43 | | 956 | | 362 |
Countrywide Home Loan Mortgage Pass Through Trust
Series 2003-8 Class A2 (Ê)
0.971% due 05/25/18 | | 145 | | 122 |
Series 2003-52 Class A1 (Ê)
5.292% due 02/19/34 | | 184 | | 116 |
Series 2004-16 Class 1A1 (Ê)
0.871% due 09/25/34 | | 153 | | 60 |
Series 2004-22 Class A3 (Ê)
4.789% due 11/25/34 | | 204 | | 127 |
Series 2004-HYB Class 1A1 (Ê)
4.730% due 02/20/35 | | 357 | | 222 |
Series 2004-HYB Class A2 (Ê)
4.540% due 11/20/34 | | 89 | | 47 |
Series 2005-1 Class 2A1 (Ê)
0.761% due 03/25/35 | | 1,799 | | 838 |
Series 2005-3 Class 1A2 (Ê)
0.761% due 04/25/35 | | 27 | | 13 |
Series 2005-HYB Class 2A1 (Ê)
4.897% due 08/20/35 | | 370 | | 184 |
Series 2005-HYB Class 3A2A (Ê)
5.250% due 02/20/36 | | 66 | | 36 |
Series 2006-OA5 Class 2A1 (Ê)
0.671% due 04/25/46 | | 737 | | 289 |
Series 2007-14 Class A19
6.000% due 09/25/37 | | 928 | | 556 |
Series 2007-18 Class 2A1
6.500% due 11/25/37 | | 234 | | 150 |
Series 2007-HY1 Class 1A2 (Ê)
5.680% due 04/25/37 | | 87 | | 25 |
Credit Suisse Mortgage Capital Certificates
Series 2006-8 Class 4A1
6.500% due 10/25/21 | | 756 | | 444 |
Series 2006-C2 Class A3
5.658% due 03/15/39 | | 100 | | 81 |
Credit Suisse First Boston Mortgage Securities Corp.
Series 2005-9 Class 2A1
5.500% due 10/25/35 | | 436 | | 294 |
Deutsche ALT-A Securities, Inc. Alternate Loan Trust (Ê)
Series 2005-AR1 Class 2A3
4.964% due 08/25/35 | | 465 | | 286 |
Series 2007-OA1 Class A1
0.621% due 02/25/47 | | 2,804 | | 1,088 |
Series 2007-OA2 Class A1
3.249% due 04/25/47 | | 1,557 | | 664 |
DLJ Commercial Mortgage Corp.
Series 1999-CG1 Class S (Ê)
Interest Only STRIP
0.900% due 03/10/32 | | 2,034 | | 12 |
Fannie Mae
5.190% due 2012 | | 206 | | 212 |
6.000% due 2016 | | 11 | | 11 |
3.848% due 2017 (Ê) | | 41 | | 41 |
| | | | |
| | | Principal
Amount ($)
or Shares | | Market
Value
$ |
5.000% due 2017 | | 433 | | 449 |
6.000% due 2017 | | 65 | | 68 |
4.000% due 2018 | | 694 | | 712 |
4.500% due 2018 | | 3,763 | | 3,871 |
5.000% due 2018 | | 188 | | 194 |
4.500% due 2019 | | 757 | | 775 |
5.000% due 2019 | | 924 | | 953 |
6.000% due 2019 | | 388 | | 404 |
4.500% due 2020 | | 323 | | 333 |
5.000% due 2020 | | 758 | | 780 |
5.500% due 2020 | | 193 | | 199 |
6.000% due 2020 | | 487 | | 508 |
4.500% due 2021 | | 493 | | 505 |
5.000% due 2021 | | 1,168 | | 1,201 |
5.500% due 2021 | | 354 | | 365 |
4.500% due 2022 | | 55 | | 57 |
5.500% due 2022 | | 346 | | 357 |
4.500% due 2023 | | 5,377 | | 5,513 |
5.000% due 2023 | | 6,598 | | 6,793 |
6.500% due 2024 | | 430 | | 447 |
6.000% due 2026 | | 932 | | 962 |
6.000% due 2027 | | 463 | | 477 |
6.000% due 2028 | | 30 | | 31 |
5.500% due 2029 | | 91 | | 95 |
6.000% due 2032 | | 466 | | 482 |
7.000% due 2032 | | 143 | | 151 |
3.823% due 2033 (Ê) | | 170 | | 164 |
4.588% due 2033 (Ê) | | 75 | | 75 |
5.000% due 2033 | | 537 | | 550 |
5.500% due 2033 | | 2,373 | | 2,438 |
6.000% due 2033 | | 177 | | 183 |
5.000% due 2034 | | 1,409 | | 1,441 |
5.500% due 2034 | | 1,517 | | 1,557 |
5.000% due 2035 | | 3,313 | | 3,388 |
5.500% due 2035 | | 2,133 | | 2,191 |
6.000% due 2035 | | 218 | | 224 |
4.343% due 2036 (Ê) | | 376 | | 375 |
5.000% due 2036 | | 2,448 | | 2,503 |
6.000% due 2036 | | 2,592 | | 2,666 |
6.500% due 2036 | | 125 | | 131 |
7.000% due 2036 | | 23 | | 24 |
5.000% due 2037 | | 5,044 | | 5,156 |
5.500% due 2037 | | 4,658 | | 4,786 |
5.560% due 2037 (Ê) | | 263 | | 269 |
6.000% due 2037 | | 3,782 | | 3,893 |
6.500% due 2037 | | 2,871 | | 2,967 |
7.000% due 2037 | | 660 | | 692 |
7.500% due 2037 | | 1,610 | | 1,690 |
5.000% due 2038 | | 1,981 | | 2,025 |
5.500% due 2038 | | 11,584 | | 11,897 |
6.000% due 2038 | | 3,947 | | 4,067 |
6.500% due 2038 | | 159 | | 166 |
7.000% due 2038 | | 166 | | 174 |
7.500% due 2038 | | 844 | | 886 |
Series 2003-343 Class 6
Interest Only STRIP
5.000% due 10/01/33 | | 247 | | 25 |
Russell Investment Funds
Core Bond Fund
Schedule of Investments, continued — December 31, 2008
Amounts in thousands (except share amounts)
| | | | |
| | | Principal
Amount ($)
or Shares | | Market
Value
$ |
| | | | |
Series 2003-345 Class 18
Interest Only STRIP
4.500% due 12/01/18 | | 645 | | 57 |
Series 2003-345 Class 19
Interest Only STRIP
4.500% due 01/01/19 | | 720 | | 63 |
Series 2005-365 Class 12
Interest Only STRIP
5.500% due 12/01/35 | | 967 | | 104 |
Series 2006-369 Class 8
Interest Only STRIP
5.500% due 04/01/36 | | 199 | | 28 |
15 Year TBA (Ï)
5.000% | | 2,080 | | 2,121 |
30 Year TBA (Ï)
4.500% | | 684 | | 693 |
5.500% | | 43,185 | | 42,222 |
6.000% | | 21,000 | | 21,617 |
6.500% | | 4,000 | | 4,154 |
Fannie Mae REMICS
Series 1999-56 Class Z
7.000% due 12/18/29 | | 90 | | 97 |
Series 2003-32 Class FH (Ê)
0.871% due 11/25/22 | | 270 | | 265 |
Series 2003-35 Class FY (Ê)
0.871% due 05/25/18 | | 343 | | 338 |
Series 2003-78 Class FI (Ê)
0.871% due 01/25/33 | | 280 | | 273 |
Series 2004-21 Class FL (Ê)
0.821% due 11/25/32 | | 133 | | 130 |
Series 2005-79 Class FC (Ê)
0.771% due 02/25/22 | | 125 | | 122 |
Series 2006-48 Class LG
Principal Only STRIP
Zero coupon due 06/25/36 | | 66 | | 58 |
Series 2008-56 Class FD (Ê)
1.411% due 07/25/48 | | 961 | | 892 |
Fannie Mae Whole Loan
Series 2003-W1 Class 1A1
6.500% due 12/25/42 | | 35 | | 36 |
Federal Home Loan Mortgage Corp. Structured Pass Through
Securities (Ê)
Series 2005-63 Class 1A1
3.679% due 02/25/45 | | 28 | | 26 |
First Horizon Alternative Mortgage Securities
Series 2004-AA3 Class A1 (Ê)
5.309% due 09/25/34 | | 45 | | 27 |
Series 2006-AA5 Class A2 (Ê)
6.510% due 09/25/36 | | 133 | | 33 |
Series 2006-FA3 Class A6
6.000% due 07/25/36 | | 187 | | 116 |
First Horizon Asset Securities, Inc. (Ê)
Series 2004-AR6 Class 2A1
4.750% due 12/25/34 | | 38 | | 28 |
Series 2005-AR5 Class 3A1
5.538% due 10/25/35 | | 105 | | 84 |
| | | | |
| | | Principal
Amount ($)
or Shares | | Market
Value
$ |
Freddie Mac
6.000% due 2016 | | 20 | | 21 |
5.000% due 2018 | | 534 | | 552 |
5.000% due 2019 | | 607 | | 627 |
5.000% due 2020 | | 1,135 | | 1,169 |
5.500% due 2020 | | 637 | | 659 |
5.376% due 2030 (Ê) | | 1 | | 1 |
5.000% due 2033 | | 186 | | 190 |
4.884% due 2034 (Ê) | | 66 | | 66 |
5.000% due 2035 | | 1,916 | | 1,961 |
5.871% due 2036 (Ê) | | 94 | | 96 |
5.923% due 2036 (Ê) | | 174 | | 177 |
5.968% due 2036 (Ê) | | 133 | | 136 |
5.470% due 2037 (Ê) | | 133 | | 136 |
5.500% due 2037 | | 1,869 | | 1,875 |
5.526% due 2037 (Ê) | | 405 | | 412 |
5.687% due 2037 (Ê) | | 536 | | 548 |
5.702% due 2037 (Ê) | | 83 | | 85 |
5.723% due 2037 (Ê) | | 211 | | 215 |
5.752% due 2037 (Ê) | | 171 | | 175 |
5.805% due 2037 (Ê) | | 172 | | 176 |
5.844% due 2037 (Ê) | | 60 | | 62 |
5.873% due 2037 (Ê) | | 85 | | 87 |
6.000% due 2037 | | 1,136 | | 1,172 |
5.500% due 2038 | | 7,178 | | 7,355 |
6.000% due 2038 | | 8,405 | | 8,667 |
30 Year TBA (Ï)
5.500% | | 5,000 | | 5,117 |
6.000% | | 1,900 | | 1,957 |
Freddie Mac REMICS
Series 2000-226 Class F (Ê)
1.645% due 11/15/30 | | 15 | | 14 |
Series 2003-256 Class FJ (Ê)
1.595% due 02/15/33 | | 120 | | 117 |
Series 2003-262 Class AB
2.900% due 11/15/14 | | 142 | | 141 |
Series 2004-281 Class DF (Ê)
1.645% due 06/15/23 | | 102 | | 100 |
Series 2005-294 Class FA (Ê)
1.365% due 03/15/20 | | 186 | | 181 |
Series 2005-299 Class KF (Ê)
1.595% due 06/15/35 | | 62 | | 61 |
Series 2005-301 Class IM
Interest Only STRIP
5.500% due 01/15/31 | | 127 | | 10 |
Series 2006-313 Class FP (Ê)(Å)
Principal Only STRIP
Zero coupon due 04/15/36 | | 125 | | 113 |
Series 2006-317 Class XI (Ê)(Å)
Principal Only STRIP
Zero coupon due 10/15/35 | | 126 | | — |
Series 2006-323 Class PA
6.000% due 03/15/26 | | 210 | | 213 |
Series 2007-330 Class GL (Ê)(Å)
12.343% due 04/15/37 | | 60 | | 69 |
Series 2007-333 Class AF (Ê)
1.345% due 10/15/20 | | 1,621 | | 1,569 |
Russell Investment Funds
Core Bond Fund
Schedule of Investments, continued — December 31, 2008
Amounts in thousands (except share amounts)
| | | | |
| | | Principal
Amount ($)
or Shares | | Market
Value
$ |
| | | | |
Series 2007-333 Class BF (Ê)
1.345% due 07/15/19 | | 291 | | 283 |
Series 2007-333 Class FT (Ê)
1.345% due 08/15/19 | | 1,157 | | 1,122 |
Series 2007-334 Class FA (Ê)
1.425% due 02/15/19 | | 1,151 | | 1,106 |
Series 2008-345 Class MB
4.500% due 06/15/23 | | 1,635 | | 1,598 |
Ginnie Mae I
6.000% due 2029 | | 11 | | 12 |
30 Year TBA (Ï)
5.500% | | 410 | | 422 |
Ginnie Mae II (Ê)
5.375% due 2026 | | 165 | | 165 |
4.625% due 2027 | | 10 | | 10 |
4.750% due 2032 | | 66 | | 65 |
GMAC Commercial Mortgage Securities, Inc.
Series 1999-C2 Class A2
6.945% due 09/15/33 | | 115 | | 115 |
GMAC Mortgage Corp. Loan Trust (Ê)
Series 2004-JR1 Class A6
0.921% due 12/25/33 | | 85 | | 58 |
Government National Mortgage Association (Ê)
Series 1999-40 Class FE
1.590% due 11/16/29 | | 94 | | 93 |
Series 2000-29 Class F
1.008% due 09/20/30 | | 18 | | 17 |
Greenwich Capital Commercial Funding Corp.
Series 2003-C2 Class A2
4.022% due 01/05/36 | | 78 | | 76 |
Series 2004-GG1 Class A7
5.317% due 06/10/36 | | 465 | | 387 |
Series 2006-GG7 Class A4
5.914% due 07/10/38 | | 290 | | 226 |
Series 2007-GG9 Class A4
5.444% due 03/10/39 | | 315 | | 240 |
GS Mortgage Securities Corp. II
Series 2006-GG6 Class A4
5.553% due 04/10/38 | | 320 | | 259 |
Series 2006-GG8 Class AAB
5.535% due 11/10/39 | | 200 | | 151 |
GSR Mortgage Loan Trust
Series 2005-AR7 Class 6A1 (Ê)
5.244% due 11/25/35 | | 242 | | 180 |
Harborview Mortgage Loan Trust (Ê)
Series 2005-3 Class 2A1A
0.821% due 06/19/35 | | 1,615 | | 743 |
Series 2005-4 Class 3A1
5.142% due 07/19/35 | | 161 | | 88 |
Series 2005-14 Class 3A1A
5.303% due 12/19/35 | | 88 | | 74 |
Series 2005-16 Class 3A1A
0.831% due 01/19/36 | | 392 | | 181 |
| | | | |
| | | Principal
Amount ($)
or Shares | | Market
Value
$ |
Indymac Index Mortgage Loan Trust
Series 2005-AR1 Class A1 (Ê)
5.404% due 09/25/35 | | 633 | | 338 |
Series 2006-AR2 Class A2 (Ê)
0.551% due 11/25/36 | | 83 | | 76 |
Series 2006-AR3 Class 2A1A (Ê)
0.641% due 01/25/37 | | 729 | | 227 |
Series 2006-AR9 Class 1A1 (Ê)
5.970% due 06/25/36 | | 769 | | 484 |
Series 2007-AR5 Class 1A1
6.201% due 05/25/37 | | 809 | | 398 |
JPMorgan Alternative Loan Trust (Ê)
Series 2007-A2 Class 12A2
0.571% due 06/25/37 | | 457 | | 348 |
JPMorgan Chase Commercial Mortgage Securities Corp.
Series 2001-CIB Class A2
6.244% due 04/15/35 | | 75 | | 74 |
Series 2004-LN2 Class A1
4.475% due 07/15/41 | | 317 | | 294 |
Series 2005-LDP Class A3A1
4.871% due 10/15/42 | | 210 | | 180 |
Series 2005-LDP Class A4
4.918% due 10/15/42 | | 325 | | 256 |
5.179% due 12/15/44 | | 390 | | 313 |
Series 2006-CB1 Class A4
5.552% due 05/12/45 | | 220 | | 170 |
Series 2006-LDP Class A3
5.336% due 05/15/47 | | 305 | | 229 |
Series 2006-LDP Class A3B
5.447% due 05/15/45 | | 250 | | 174 |
Series 2006-LDP Class A4
5.875% due 04/15/45 | | 650 | | 519 |
5.399% due 05/15/45 | | 290 | | 221 |
Series 2007-CB1 Class A4
5.440% due 06/12/47 | | 1,200 | | 866 |
5.747% due 02/12/49 | | 340 | | 250 |
Series 2007-LD1 Class A4
5.882% due 02/15/51 | | 380 | | 270 |
Series 2007-LDP Class A3
5.420% due 01/15/49 | | 975 | | 689 |
JPMorgan Mortgage Trust
Series 2005-A1 Class 6T1 (Ê)
5.024% due 02/25/35 | | 122 | | 92 |
Series 2005-A5 Class TA1
5.432% due 08/25/35 | | 1,043 | | 768 |
Series 2007-A1 Class 2A2 (Ê)
4.740% due 07/25/35 | | 720 | | 587 |
Series 2007-S3 Class 1A35
6.000% due 07/25/37 | | 1,188 | | 629 |
LB-UBS Commercial Mortgage Trust
Series 2006-C1 Class A4
5.156% due 02/15/31 | | 1,000 | | 794 |
Series 2006-C3 Class A4
5.661% due 03/15/39 | | 210 | | 171 |
Series 2006-C4 Class A4 (Ê)
5.883% due 06/15/38 | | 105 | | 86 |
Russell Investment Funds
Core Bond Fund
Schedule of Investments, continued — December 31, 2008
Amounts in thousands (except share amounts)
| | | | |
| | | Principal
Amount ($)
or Shares | | Market
Value
$ |
| | | | |
Series 2007-C6 Class A4
5.858% due 07/15/40 | | 270 | | 192 |
Lehman Mortgage Trust
Series 2005-3 Class 1A3
5.500% due 01/25/36 | | 556 | | 384 |
Series 2006-8 Class 2A1 (Ê)
0.891% due 12/25/36 | | 814 | | 337 |
Lehman XS Trust (Ê)
Series 2007-7N Class 1A2
0.711% due 06/25/47 | | 929 | | 314 |
Mastr Adjustable Rate Mortgages Trust (Ê)
Series 2004-13 Class 3A4
3.788% due 11/21/34 | | 65 | | 63 |
Mastr Alternative Loans Trust
Series 2003-4 Class B1 (Ê)
5.688% due 06/25/33 | | 181 | | 149 |
Series 2004-10 Class 5A6
5.750% due 09/25/34 | | 170 | | 138 |
Mastr Asset Securitization Trust (Ê)
Series 2003-7 Class 4A35
0.871% due 09/25/33 | | 205 | | 184 |
Series 2004-4 Class 2A2
0.921% due 04/25/34 | | 79 | | 77 |
Mellon Residential Funding Corp. (Ê)
Series 2000-TBC Class A1
1.675% due 06/15/30 | | 164 | | 135 |
Merrill Lynch Floating Trust (Ê)(Þ)
Series 2006-1 Class A1
1.265% due 06/15/22 | | 720 | | 546 |
Merrill Lynch Mortgage Investors, Inc. (Ê)
Series 2005-A10 Class A
0.681% due 02/25/36 | | 92 | | 49 |
Merrill Lynch/Countrywide Commercial Mortgage Trust
Series 2007-6 Class A4
5.485% due 03/12/51 | | 100 | | 69 |
MLCC Mortgage Investors, Inc. (Ê)
Series 2004-HB1 Class A2
3.551% due 04/25/29 | | 31 | | 20 |
Series 2005-3 Class 5A
0.721% due 11/25/35 | | 55 | | 38 |
Morgan Stanley Capital I
Series 2005-HQ6 Class A4A
4.989% due 08/13/42 | | 740 | | 605 |
Series 2005-IQ1 Class AAB
5.178% due 09/15/42 | | 415 | | 339 |
Series 2006-HQ1 Class A4
5.328% due 11/12/41 | | 130 | | 101 |
Series 2006-HQ8 Class A4 (Ê)
5.387% due 03/12/44 | | 310 | | 251 |
Series 2006-HQ9 Class A4
5.731% due 07/12/44 | | 295 | | 228 |
Series 2007-IQ1 Class A4
5.809% due 12/12/49 | | 320 | | 240 |
MortgageIT Trust (Ê)
Series 2005-AR1 Class 1A1
0.721% due 11/25/35 | | 444 | | 206 |
| | | | |
| | | Principal
Amount ($)
or Shares | | Market
Value
$ |
Prime Mortgage Trust (Ê)
Series 2004-CL1 Class 1A2
0.871% due 02/25/34 | | 34 | | 30 |
Residential Accredit Loans, Inc.
Series 2004-QS5 Class A6 (Ê)
1.071% due 04/25/34 | | 53 | | 43 |
Series 2004-QS8 Class A4 (Ê)
0.871% due 06/25/34 | | 258 | | 213 |
Series 2005-QA8 Class NB3 (Ê)
5.486% due 07/25/35 | | 232 | | 141 |
Series 2005-QO5 Class A1 (Ê)
3.256% due 01/25/46 | | 2,177 | | 937 |
Series 2005-QS1 Class 2A3
5.750% due 09/25/35 | | 656 | | 571 |
Series 2006-QS6 Class 1A13
6.000% due 06/25/36 | | 298 | | 181 |
Series 2007-QH9 Class A1 (Ê)
5.487% due 11/25/37 | | 960 | | 300 |
Residential Asset Securitization Trust
Series 2003-A15 Class 1A2 (Ê)
0.921% due 02/25/34 | | 294 | | 238 |
Series 2007-A5 Class 2A3
6.000% due 05/25/37 | | 120 | | 72 |
Residential Funding Mortgage Securities I (Ê) | | |
Series 2003-S5 Class 1A2
0.921% due 11/25/18 | | 156 | | 156 |
Series 2003-S14 Class A5
0.871% due 07/25/18 | | 169 | | 106 |
Series 2003-S20 Class 1A7
0.971% due 12/25/33 | | 55 | | 55 |
Series 2005-SA4 Class 2A1
5.204% due 09/25/35 | | 642 | | 395 |
Series 2006-SA4 Class 2A1 (Ê)
6.128% due 11/25/36 | | 427 | | 221 |
Sequoia Mortgage Trust
Series 2001-5 Class A
0.931% due 10/19/26 | | 55 | | 44 |
Structured Adjustable Rate Mortgage Loan Trust
Series 2004-5 Class 3A1
4.380% due 05/25/34 | | 131 | | 84 |
Series 2004-12 Class 3A2
5.250% due 09/25/34 | | 61 | | 29 |
Series 2004-16 Class 3A1
5.450% due 11/25/34 | | 226 | | 128 |
Series 2005-21 Class 7A1 (Ê)
6.007% due 11/25/35 | | 1,168 | | 594 |
Series 2006-12 Class 2A1 (Ê)
5.929% due 01/25/37 | | 791 | | 415 |
Structured Asset Mortgage Investments, Inc. (Ê)
Series 2005-AR5 Class A3
0.831% due 07/19/35 | | 159 | | 107 |
Series 2006-AR2 Class A1
0.701% due 02/25/36 | | 546 | | 227 |
Series 2006-AR8 Class A1A
0.671% due 10/25/36 | | 768 | | 303 |
Russell Investment Funds
Core Bond Fund
Schedule of Investments, continued — December 31, 2008
Amounts in thousands (except share amounts)
| | | | |
| | | Principal
Amount ($)
or Shares | | Market
Value
$ |
| | | | |
Series 2007-AR6 Class A1
3.979% due 08/25/47 | | 954 | | 420 |
Structured Asset Securities Corp.
Series 2004-21X Class 1A3
4.440% due 12/25/34 | | 262 | | 257 |
Thornburg Mortgage Securities Trust (Ê)
Series 2003-2 Class A1
1.151% due 04/25/43 | | 72 | | 62 |
Series 2006-5 Class A1
0.591% due 09/25/46 | | 673 | | 558 |
Series 2006-6 Class A1
0.581% due 11/25/46 | | 121 | | 100 |
Wachovia Bank Commercial Mortgage Trust (Ê) | | |
Series 2005-C21 Class A4
5.209% due 10/15/44 | | 1,000 | | 817 |
Washington Mutual Alternative Mortgage Pass-Through Certificates
Series 2005-4 Class CB11
5.500% due 06/25/35 | | 90 | | 63 |
Series 2007-OA1 Class 2A (Ê)
2.976% due 12/25/46 | | 722 | | 220 |
Washington Mutual Mortgage Pass Through Certificates
Series 2003-S9 Class A2 (Ê)
1.021% due 10/25/33 | | 313 | | 293 |
Series 2004-AR3 Class A2
4.243% due 06/25/34 | | 143 | | 101 |
Series 2005-AR1 Class 1A1 (Ê)
4.834% due 10/25/35 | | 246 | | 194 |
Series 2005-AR1 Class A1A1 (Ê)
0.761% due 10/25/45 | | 34 | | 19 |
0.731% due 11/25/45 | | 852 | | 418 |
0.741% due 12/25/45 | | 420 | | 197 |
Series 2005-AR6 Class B3 (Ê)(Å)
1.131% due 04/25/45 | | 197 | | 24 |
Series 2006-AR1 Class 3A1A (Ê)
3.176% due 09/25/46 | | 722 | | 273 |
Series 2006-AR2 Class 1A1 (Ê)
5.297% due 03/25/37 | | 728 | | 520 |
Series 2007-HY3 Class 4B1 (Ê)
5.347% due 03/25/37 | | 124 | | 41 |
Series 2007-HY4 Class 1A1 (Ê)
5.526% due 04/25/37 | | 146 | | 77 |
Wells Fargo Alternative Loan Trust
Series 2007-PA6 Class A1 (Ê)
6.600% due 12/26/37 | | 834 | | 379 |
Wells Fargo Mortgage Backed Securities Trust
Series 2005-AR6 Class A1 (Ê)
5.034% due 04/25/35 | | 688 | | 505 |
Series 2006-2 Class 2A3
5.500% due 03/25/36 | | 388 | | 344 |
Series 2006-AR2 Class 2A1
4.950% due 03/25/36 | | 287 | | 187 |
Series 2007-8 Class 1A16
6.000% due 07/25/37 | | 336 | | 218 |
Series 2007-10 Class 2A5
6.250% due 07/25/37 | | 159 | | 145 |
| | | | |
| | | | 249,287 |
| | | | |
| | | | |
| | | Principal
Amount ($)
or Shares | | Market
Value
$ |
| Municipal Bonds - 0.6% | | | | |
Chicago Transit Authority
Revenue Bonds
6.899% due 12/01/40 | | 400 | | 410 |
Los Angeles Unified School District
General Obligation Unlimited (µ)
4.500% due 07/01/22 | | 400 | | 375 |
New York City Municipal Water Finance Authority Revenue Bonds
4.750% due 06/15/37 | | 1,300 | | 1,131 |
| | | | |
| | | | 1,916 |
| | | | |
| | |
| Non-US Bonds - 0.4% | | | | |
Bombardier, Inc. (Å)
7.250% due 11/15/16 | | EUR 125 | | 104 |
Brazilian Government International Bond
12.500% due 01/05/22 | | BRL 300 | | 133 |
Federative Republic of Brazil
10.250% due 01/10/28 | | BRL 1,400 | | 540 |
Hellas Telecommunications Luxembourg V (Ê)
Series REGS
8.818% due 10/15/12 | | EUR 125 | | 103 |
Impress Holdings B.V.
8.443% due 09/15/13 | | EUR 125 | | 130 |
Ineos Group Holdings PLC
Series REGS
7.875% due 02/15/16 | | EUR 125 | | 21 |
UBS AG
5.849% due 12/31/17 | | EUR 270 | | 48 |
| | | | |
| | | | 1,079 |
| | | | |
| |
| United States Government Agencies - 0.3% | | |
Federal Home Loan Mortgage Corp.
5.000% due 12/14/18 | | 100 | | 104 |
Freddie Mac
5.125% due 11/17/17 (Ñ) | | 700 | | 811 |
4.875% due 06/13/18 | | 100 | | 115 |
| | | | |
| | | | 1,030 |
| | | | |
| |
| United States Government Treasuries - 3.0% | | |
United States Treasury Principal (Ñ)
Principal Only STRIP
Zero coupon due 11/15/21 | | 1,938 | | 1,256 |
United States Treasury Inflation Indexed Bonds
2.000% due 07/15/14 (Ñ) | | 1,149 | | 1,087 |
2.000% due 01/15/16 (Ñ) | | 1,924 | | 1,843 |
2.500% due 07/15/16 (Ñ) | | 322 | | 319 |
2.625% due 07/15/17 | | 314 | | 321 |
2.000% due 01/15/26 (Ñ) | | 1,201 | | 1,131 |
2.375% due 01/15/27 | | 215 | | 216 |
1.750% due 01/15/28 (Ñ) | | 3,498 | | 3,232 |
3.625% due 04/15/28 (Ñ) | | 134 | | 160 |
| | | | |
| | | | 9,565 |
| | | | |
| | |
Total Long-Term Investments
(cost $391,388) | | | | 356,489 |
| | | | |
Russell Investment Funds
Core Bond Fund
Schedule of Investments, continued — December 31, 2008
Amounts in thousands (except share amounts)
| | | | |
| | | Principal
Amount ($)
or Shares | | Market
Value
$ |
| | | | |
| Preferred Stocks - 0.4% | | | | |
| Financial Services - 0.4% | | | | |
Bank of America Corp. | | 1,000 | | 650 |
DG Funding Trust (Å)(Æ) | | 49 | | 491 |
| | | | |
| | |
Total Preferred Stocks
(cost $1,409) | | | | 1,141 |
| | | | |
| | |
| | | Notional
Amount | | |
| Options Purchased - 0.7% | | | | |
| (Number of Contracts) | | | | |
| Mortgage-Backed Securities | | | | |
Fannie Mae TBA
Feb 2009 94.14 Call (1) | | USD 1,000 | | 82 |
| | |
| Swaptions | | | | |
| (Fund Pays/Fund Receives) | | | | |
USD Three Month LIBOR/USD
3.000%
Feb 2009 0.00 Call (1) | | 24,400 | | 720 |
USD Three Month LIBOR/USD
3.150%
Feb 2009 0.00 Call (1) | | 8,700 | | 282 |
USD Three Month LIBOR/USD
3.500%
Feb 2009 0.00 Call (1) | | 13,200 | | 519 |
USD Three Month LIBOR/USD
3.600%
July 2009 0.00 Call (1) | | 2,300 | | 85 |
USD Three Month LIBOR/USD
3.450%
Aug 2009 0.00 Call (5) | | 17,900 | | 601 |
| | | | |
| | |
Total Options Purchased
(cost $710) | | | | 2,289 |
| | | | |
| | |
| | | Principal
Amount ($)
or Shares | | |
| Short-Term Investments - 11.4% | | |
AES Corp. (The) (Ñ)
9.500% due 06/01/09 | | 125 | | 124 |
Bank of America Corp. (Ê)
2.826% due 11/06/09 | | 100 | | 98 |
Bank of America NA (Ê)
Series BKNT
2.099% due 06/12/09 | | 700 | | 698 |
Bank of Scotland PLC (Ê)(Ñ)(Þ)
Series MTN
4.590% due 07/17/09 | | 300 | | 299 |
Bear Stearns Cos. LLC (The) (Ê)
4.905% due 07/16/09 | | 1,200 | | 1,184 |
| | | | |
| | | Principal
Amount ($)
or Shares | | Market
Value
$ |
Caterpillar Financial Services Corp. (Ê)
2.296% due 05/18/09 | | 1,100 | | 1,090 |
Citigroup Funding, Inc. (Ê)
0.474% due 04/23/09 | | 100 | | 99 |
1.466% due 06/26/09 | | 200 | | 196 |
Citigroup Global Markets Deutschland AG for OAO Gazprom
10.500% due 10/21/09 | | 200 | | 201 |
Citigroup Global Markets
Holdings, Inc. (Ê)
Series MTNA
1.971% due 03/17/09 | | 200 | | 199 |
Citigroup, Inc. (Ê)(Ñ)
3.505% due 01/30/09 | | 100 | | 100 |
1.496% due 12/28/09 | | 400 | | 377 |
Continental Airlines, Inc.
Series 99A2
7.056% due 09/15/09 | | 300 | | 288 |
Countrywide Financial Corp. (Ê)
4.348% due 01/05/09 | | 150 | | 150 |
Countrywide Home Loans, Inc.
Series MTNK
5.625% due 07/15/09 | | 175 | | 174 |
4.125% due 09/15/09 | | 335 | | 331 |
CSC Holdings, Inc.
Series B
8.125% due 07/15/09 | | 210 | | 209 |
8.125% due 08/15/09 | | 175 | | 174 |
Daimler Finance North America LLC (Ê)
2.346% due 03/13/09 | | 400 | | 400 |
2.426% due 03/13/09 | | 300 | | 289 |
Deutsche Telekom International
Finance BV (Ê)
1.678% due 03/23/09 | | 300 | | 297 |
DnB NOR Bank ASA (Ê)(Þ)
4.889% due 10/13/09 | | 1,000 | | 1,000 |
Federal National Mortgage Association Discount Notes (ç)(ž)(§)
0.850% due 01/27/09 | | 26 | | 26 |
0.150% due 02/23/09 | | 111 | | 111 |
Ford Motor Credit Co. LLC
5.800% due 01/12/09 | | 300 | | 299 |
General Electric Capital Corp. (Ê)
Series MTN
3.565% due 10/26/09 | | 100 | | 97 |
GMAC LLC (Ñ)
5.850% due 01/14/09 | | 200 | | 199 |
Goldman Sachs Group, Inc. (The) (Ê)
1.518% due 03/30/09 | | 400 | | 395 |
HSBC Finance Corp. (Ê)
4.479% due 10/21/09 | | 100 | | 94 |
Lehman Brothers Holdings, Inc. (Ø)
2.889% due 01/23/09 | | 600 | | 54 |
2.878% due 04/03/09 | | 400 | | 36 |
Mandalay Resort Group
6.500% due 07/31/09 | | 90 | | 87 |
Merrill Lynch & Co., Inc. (Ê)
Series MTN
2.438% due 05/08/09 | | 900 | | 884 |
2.290% due 12/04/09 (Ê) | | 200 | | 192 |
Russell Investment Funds
Core Bond Fund
Schedule of Investments, continued — December 31, 2008
Amounts in thousands (except share amounts)
| | | | | |
| | | Principal
Amount ($)
or Shares | | Market
Value
$ | |
| | | | | |
Morgan Stanley
2.556% due 05/07/09 (Ê) | | 300 | | 295 | |
Series GMTN
2.498% due 02/09/09 | | 500 | | 498 | |
Nordea Bank Finland PLC (ž)
3.028% due 04/09/09 | | 400 | | 400 | |
Reckson Operating Partnership, LP
7.750% due 03/15/09 | | 25 | | 24 | |
Russell Investment Company
Russell Money Market Fund | | 17,437,000 | | 17,437 | |
Telefonica Emisiones SAU (Ê)
1.825% due 06/19/09 | | 300 | | 290 | |
United States Treasury Bills (ž)
0.010% due 01/22/09 (ç)(§) | | 1,250 | | 1,250 | |
0.030% due 02/26/09 (ç)(§) | | 270 | | 270 | |
0.101% due 02/26/09 (ç)(§) | | 350 | | 350 | |
0.020% due 03/26/09 (§) | | 250 | | 250 | |
0.041% due 03/26/09 (§) | | 2,530 | | 2,530 | |
0.046% due 03/26/09 (§) | | 260 | | 260 | |
0.011% due 04/23/09 | | 310 | | 310 | |
0.228% due 06/11/09(§) | | 250 | | 250 | |
Verizon Communications, Inc. (Ê)(Ñ) 1.475% due 04/03/09 | | 500 | | 496 | |
Wachovia Mortgage FSB (Ê)
Series BKNT
2.428% due 05/08/09 | | 1,000 | | 987 | |
| | | | | |
| | |
Total Short-Term Investments
(cost $37,413) | | | | 36,348 | |
| | | | | |
| | |
| Repurchase Agreement - 1.3% | | | | | |
Agreement with JPMorgan Chase Securities and JPMorgan Chase Bank (Tri-Party) of $4,300 dated December 31, 2008 at 0.020% to be repurchased at $4,300 on January 2, 2009, collateralized by: $3,844 par United States Treasury Notes, valued at $3,844. | | 4,300 | | 4,300 | |
| | | | | |
| | |
Total Repurchase Agreement
(cost $4,300) | | | | 4,300 | |
| | | | | |
| | |
| Other Securities - 5.1% | | | | | |
State Street Securities Lending Quality Trust (×) | | 17,154,636 | | 16,214 | |
| | | | | |
| | |
Total Other Securities
(cost $17,155) | | | | 16,214 | |
| | | | | |
| | |
Total Investments - 130.6%
(identified cost $452,375) | | | | 416,781 | |
| | |
Other Assets and Liabilities,
Net - (30.6%) | | | | (97,672 | ) |
| | | | | |
| | |
| Net Assets - 100.0% | | | | 319,109 | |
| | | | | |
See accompanying notes which are an integral part of the financial statements.
Russell Investment Funds
Core Bond Fund
Schedule of Investments, continued — December 31, 2008
Amounts in thousands (except contracts)
| | | | | | | | | | | |
| Futures Contracts | | Number of
Contracts | | Notional
Amount | | Expiration
Date | | Unrealized
Appreciation
(Depreciation)
$ | |
| | | | | | | | | | | |
| | | | | | | | | | | |
| Long Positions | | | | | | | | | | | |
Euribor Futures (Germany) | | 5 | | EUR | | 1,222 | | 03/09 | | 53 | |
Euribor Futures (Germany) | | 5 | | EUR | | 1,225 | | 06/09 | | 56 | |
Euro-Bobl Futures (Germany) | | 61 | | EUR | | 7,089 | | 03/09 | | 64 | |
Eurodollar Futures (CME) | | 96 | | USD | | 23,746 | | 03/09 | | 535 | |
Eurodollar Futures (CME) | | 90 | | USD | | 22,246 | | 06/09 | | 482 | |
Eurodollar Futures (CME) | | 43 | | USD | | 10,615 | | 09/09 | | 223 | |
Eurodollar Futures (CME) | | 31 | | USD | | 7,640 | | 12/09 | | 160 | |
Eurodollar Futures (CME) | | 18 | | USD | | 4,431 | | 03/10 | | 103 | |
Eurodollar Futures (CME) | | 1 | | USD | | 246 | | 06/10 | | 6 | |
Eurodollar Futures (CME) | | 1 | | USD | | 245 | | 09/10 | | 6 | |
Long Gilt Bond (UK) | | 5 | | GBP | | 617 | | 03/09 | | 56 | |
Three Month Short Sterling Interest Rate Futures (UK) | | 21 | | GBP | | 2,579 | | 03/09 | | 184 | |
Three Month Short Sterling Interest Rate Futures (UK) | | 16 | | GBP | | 1,967 | | 06/09 | | 139 | |
Three Month Short Sterling Interest Rate Futures (UK) | | 1 | | GBP | | 122 | | 12/09 | | 6 | |
United States Treasury 2 Year Notes | | 33 | | USD | | 7,196 | | 03/09 | | 47 | |
United States Treasury 5 Year Notes | | 91 | | USD | | 10,834 | | 03/09 | | 350 | |
United States Treasury 10 Year Notes | | 39 | | USD | | 4,904 | | 03/09 | | 165 | |
United States Treasury 30 Year Bonds | | 38 | | USD | | 5,246 | | 03/09 | | 96 | |
| | | | | |
| Short Positions | | | | | | | | | | | |
Eurodollar Futures (CME) | | 3 | | USD | | 739 | | 12/09 | | (15 | ) |
United States Treasury 5 Year Notes | | 26 | | USD | | 3,095 | | 03/09 | | (94 | ) |
United States Treasury 10 Year Notes | | 9 | | USD | | 1,132 | | 03/09 | | (74 | ) |
United States Treasury 30 Year Bonds | | 18 | | USD | | 2,485 | | 03/09 | | (200 | ) |
| | | | | | | | | | | |
| | | | | |
Total Unrealized Appreciation (Depreciation) on Open Futures Contracts | | | | | | | | | | 2,348 | |
| | | | | | | | | | | |
See accompanying notes which are an integral part of the financial statements.
Russell Investment Funds
Core Bond Fund
Schedule of Investments, continued — December 31, 2008
| | | | | | | |
Options Written
(Number of Contracts) | | Notional
Amount | | Market
Value
$ | |
| | | | | | | |
| Eurodollar Futures | | | | | | | |
Mar 2009 98.00 Put (7) | | USD | | 18 | | — | |
Mar 2009 98.25 Put (6) | | USD | | 15 | | (1 | ) |
Mar 2009 98.50 Put (14) | | USD | | 35 | | (2 | ) |
| | | |
| Swaptions | | | | | | | |
| (Fund Receives/Fund Pays) | | | | | | | |
USD Three Month LIBOR/USD
3.950%
Feb 2009 0.00 Call (1) | | | | 7,200 | | (613 | ) |
USD Three Month LIBOR/USD
4.250%
Feb 2009 0.00 Call (1) | | | | 2,900 | | (352 | ) |
USD Three Month LIBOR/USD
4.600%
Feb 2009 0.00 Call (1) | | | | 1,300 | | (187 | ) |
USD 2.750%/USD Three Month
LIBOR
May 2009 0.00 Put (2) | | | | 2,000 | | (21 | ) |
USD Three Month LIBOR/USD
4.200%
July 2009 0.00 Call (1) | | | | 1,000 | | (91 | ) |
USD Three Month LIBOR/USD
4.150%
Aug 2009 0.00 Call (1) | | | | 600 | | (52 | ) |
USD Three Month LIBOR/USD
4.400%
Aug 2009 0.00 Call (5) | | | | 5,500 | | (681 | ) |
United States Treasury Notes
5 Year Futures | | | | | | | |
| Feb 2009 118.00 Put (14) | | USD | | 14 | | (12 | ) |
United States Treasury Notes
10 Year Futures | | | | | | | |
| Feb 2009 124.00 Put (6) | | USD | | 6 | | (10 | ) |
| | | | | | | |
| | | |
Total Liability for Options Written
(premiums received $580) | | | | | | (2,022 | ) |
| | | | | | | |
See accompanying notes which are an integral part of the financial statements.
Russell Investment Funds
Core Bond Fund
Schedule of Investments, continued — December 31, 2008
| | | | | | | | | | | |
| Foreign Currency Exchange Contracts | | | |
| | | | | | | | | | | |
Amount
Sold | | Amount
Bought | | Settlement
Date | | Unrealized
Appreciation
(Depreciation)
$ | |
| USD | | 1,092 | | CNY | | 7,516 | | 03/02/09 | | (1 | ) |
| USD | | 15 | | EUR | | 10 | | 01/13/09 | | — | |
| USD | | 18 | | EUR | | 13 | | 01/13/09 | | 1 | |
| USD | | 19 | | EUR | | 13 | | 01/13/09 | | (1 | ) |
| USD | | 19 | | EUR | | 13 | | 01/13/09 | | (1 | ) |
| USD | | 21 | | EUR | | 16 | | 01/13/09 | | 1 | |
| USD | | 21 | | EUR | | 16 | | 01/13/09 | | 1 | |
| USD | | 21 | | EUR | | 16 | | 01/13/09 | | 1 | |
| USD | | 30 | | EUR | | 20 | | 01/13/09 | | (1 | ) |
| USD | | 30 | | EUR | | 21 | | 01/13/09 | | (1 | ) |
| USD | | 32 | | EUR | | 24 | | 01/13/09 | | 2 | |
| USD | | 113 | | EUR | | 80 | | 01/13/09 | | (1 | ) |
| USD | | 587 | | EUR | | 430 | | 01/13/09 | | 11 | |
| USD | | 29 | | HUF | | 6,496 | | 01/16/09 | | 5 | |
| USD | | 32 | | HUF | | 6,882 | | 01/16/09 | | 4 | |
| USD | | 45 | | HUF | | 8,942 | | 01/16/09 | | 2 | |
| USD | | 71 | | HUF | | 14,346 | | 01/16/09 | | 4 | |
| USD | | 76 | | HUF | | 16,107 | | 01/16/09 | | 8 | |
| USD | | 2 | | INR | | 86 | | 01/16/09 | | — | |
| USD | | 18 | | JPY | | 1,698 | | 01/08/09 | | 1 | |
| USD | | 22 | | JPY | | 2,051 | | 01/08/09 | | 1 | |
| USD | | 22 | | JPY | | 2,113 | | 01/08/09 | | 1 | |
| USD | | 44 | | JPY | | 4,150 | | 01/08/09 | | 2 | |
| USD | | 40 | | MYR | | 141 | | 02/12/09 | | 1 | |
| USD | | 70 | | MYR | | 251 | | 02/12/09 | | 2 | |
| USD | | 130 | | MYR | | 467 | | 02/12/09 | | 5 | |
| USD | | 427 | | PHP | | 20,565 | | 02/06/09 | | 4 | |
| USD | | 369 | | SGD | | 565 | | 01/06/09 | | 23 | |
| USD | | 200 | | SGD | | 296 | | 01/16/09 | | 5 | |
| USD | | 226 | | SGD | | 335 | | 01/16/09 | | 6 | |
| USD | | 250 | | SGD | | 368 | | 01/16/09 | | 5 | |
| USD | | 360 | | SGD | | 528 | | 01/16/09 | | 7 | |
| USD | | 369 | | SGD | | 565 | | 01/16/09 | | 23 | |
| AUD | | 199 | | USD | | 129 | | 01/22/09 | | (10 | ) |
| BRL | | 8 | | USD | | 3 | | 02/03/09 | | — | |
| BRL | | 75 | | USD | | 31 | | 02/03/09 | | (1 | ) |
| BRL | | 82 | | USD | | 34 | | 02/03/09 | | (1 | ) |
| BRL | | 88 | | USD | | 36 | | 02/03/09 | | (1 | ) |
| BRL | | 127 | | USD | | 57 | | 02/03/09 | | 3 | |
| BRL | | 1,370 | | USD | | 624 | | 02/03/09 | | 43 | |
| CNY | | 2,674 | | USD | | 385 | | 03/02/09 | | (3 | ) |
| EUR | | 399 | | USD | | 516 | | 01/13/09 | | (39 | ) |
| EUR | | 630 | | USD | | 815 | | 01/13/09 | | (61 | ) |
| EUR | | 715 | | USD | | 903 | | 01/13/09 | | (89 | ) |
| GBP | | 165 | | USD | | 250 | | 01/15/09 | | 12 | |
| HUF | | 52,773 | | USD | | 289 | | 01/16/09 | | 14 | |
| INR | | 86 | | USD | | 2 | | 01/16/09 | | — | |
| JPY | | 10,134 | | USD | | 105 | | 01/08/09 | | (7 | ) |
| JPY | | 20,227 | | USD | | 219 | | 01/22/09 | | (4 | ) |
| MYR | | 14 | | USD | | 4 | | 02/12/09 | | — | |
| MYR | | 18 | | USD | | 5 | | 02/12/09 | | — | |
| MYR | | 24 | | USD | | 7 | | 02/12/09 | | — | |
| MYR | | 36 | | USD | | 10 | | 02/12/09 | | — | |
| | | | | | | | | | | |
| Foreign Currency Exchange Contracts | | | |
Amount
Sold | | Amount
Bought | | Settlement
Date | | Unrealized
Appreciation
(Depreciation)
$ | |
| MYR | | 40 | | USD | | 11 | | 02/12/09 | | — | |
| MYR | | 45 | | USD | | 13 | | 02/12/09 | | (1 | ) |
| MYR | | 45 | | USD | | 13 | | 02/12/09 | | (1 | ) |
| MYR | | 47 | | USD | | 13 | | 02/12/09 | | (1 | ) |
| MYR | | 47 | | USD | | 13 | | 02/12/09 | | (1 | ) |
| MYR | | 47 | | USD | | 13 | | 02/12/09 | | (1 | ) |
| MYR | | 109 | | USD | | 30 | | 02/12/09 | | (1 | ) |
| MYR | | 193 | | USD | | 53 | | 02/12/09 | | (3 | ) |
| MYR | | 193 | | USD | | 53 | | 02/12/09 | | (3 | ) |
| PHP | | 20,565 | | USD | | 396 | | 02/06/09 | | (34 | ) |
| SEK | | 25 | | USD | | 3 | | 01/20/09 | | — | |
| SEK | | 983 | | USD | | 124 | | 01/20/09 | | — | |
| SGD | | 565 | | USD | | 369 | | 01/06/09 | | (23 | ) |
| SGD | | 291 | | USD | | 194 | | 01/16/09 | | (8 | ) |
| SGD | | 562 | | USD | | 370 | | 01/16/09 | | (20 | ) |
| SGD | | 565 | | USD | | 370 | | 01/16/09 | | (22 | ) |
| SGD | | 674 | | USD | | 442 | | 01/16/09 | | (26 | ) |
| | | | | | | | | | | |
| |
| Total Unrealized Appreciation (Depreciation) on Open Foreign Currency Exchange Contracts | | (169 | ) |
| | | | | | | | | | | |
See accompanying notes which are an integral part of the financial statements.
Russell Investment Funds
Core Bond Fund
Schedule of Investments, continued — December 31, 2008
Amounts in thousands
| | | | | | | | | | | | |
| Credit Default Swap Contracts |
| | | | | | | | | | | | | | | |
| Corporate Issues | | | | | | | | | | | | | | | |
Reference
Entity | | Counter
Party | | Implied
Credit
Spread | | Notional Amount | | Fund (Pays)/Receives
Fixed Rate | | Termination
Date | | Market
Value
$ |
|
| | | | | | | | | | | | | | | |
Arrow Electronics, Inc. | | Citigroupglobal Markets, Inc. | | 2.040% | | USD | | 135 | | (0.820)% | | 03/20/14 | | 8 | |
Centex Corp. | | JP Morgan | | 4.250% | | USD | | 325 | | (4.400)% | | 12/20/13 | | 1 | |
Citigroup, Inc. | | Barclays Bank PLC | | 7.300% | | USD | | 600 | | 5.650% | | 03/20/13 | | (31 | ) |
Citigroup, Inc. | | JP Morgan | | 7.300% | | USD | | 200 | | 5.170% | | 03/20/13 | | (13 | ) |
Darden Restaurants, Inc. | | Deutsche Bank | | 2.670% | | USD | | 400 | | (2.250)% | | 03/20/14 | | 7 | |
Ford Motor Credit Co. | | Barclays Bank PLC | | 10.510% | | USD | | 1,000 | | 6.150% | | 09/20/12 | | (120 | ) |
Ford Motor Credit Co. | | Goldman Sachs | | 10.510% | | USD | | 600 | | 5.850% | | 09/20/12 | | (77 | ) |
Ford Motor Credit Co. | | Merrill Lynch | | 98.500% | | USD | | 200 | | 5.000% | | 12/20/09 | | (115 | ) |
Gaz Capital for Gazprom | | Barclays Bank PLC | | 9.970% | | USD | | 300 | | 1.600% | | 12/20/12 | | (74 | ) |
Gaz Capital for Gazprom | | Morgan Stanley | | 9.870% | | USD | | 1,000 | | 2.480% | | 02/20/13 | | (215 | ) |
Gaz Capital for Gazprom | | Morgan Stanley | | 9.870% | | USD | | 100 | | 2.180% | | 02/20/13 | | (23 | ) |
GE Capital Corp. | | Banque National De Paris | | 4.550% | | USD | | 400 | | 1.100% | | 12/20/09 | | (13 | ) |
GE Capital Corp. | | Citibank | | 3.710% | | USD | | 200 | | 4.000% | | 12/20/13 | | 3 | |
GE Capital Corp. | | Deutsche Bank | | 3.710% | | USD | | 100 | | 4.900% | | 12/20/13 | | 5 | |
General Motors Acceptance Corp. | | Merrill Lynch | | 9.740% | | USD | | 1,000 | | 1.850% | | 09/20/09 | | (54 | ) |
General Motors Corp. | | Citibank | | 81.100% | | USD | | 2,000 | | 4.630% | | 12/20/12 | | (1,547 | ) |
General Motors Corp. | | Deutsche Bank | | 140.510% | | USD | | 400 | | 5.000% | | 12/20/09 | | (280 | ) |
Hewelett-Packard Co. | | Citigroupglobal Markets, Inc. | | 0.900% | | USD | | 135 | | (0.720)% | | 03/20/14 | | 1 | |
Home Depot, Inc. | | Citigroupglobal Markets, Inc. | | 2.570% | | USD | | 340 | | (3.250)% | | 03/20/14 | | (11 | ) |
Lowe's Cos., Inc. | | Citigroupglobal Markets, Inc. | | 1.300% | | USD | | 340 | | (1.450)% | | 03/20/14 | | (3 | ) |
Nordstrom, Inc. | | Deutsche Bank | | 5.560% | | USD | | 425 | | (2.100)% | | 03/20/14 | | 56 | |
Pulte Homes, Inc. | | JP Morgan | | 3.200% | | USD | | 725 | | (2.550)% | | 12/20/13 | | 19 | |
Pulte Homes, Inc. | | JP Morgan | | 3.160% | | USD | | 1,000 | | (3.870)% | | 03/20/14 | | 29 | |
Republic of Panama | | Morgan Stanley | | 2.810% | | USD | | 100 | | 0.750% | | 01/20/12 | | (6 | ) |
SLM Corp. | | Bank of America | | 11.540% | | USD | | 200 | | 4.550% | | 03/20/09 | | (3 | ) |
SLM Corp. | | Citibank | | 8.610% | | USD | | 200 | | 4.850% | | 03/20/13 | | (22 | ) |
| | | | | | | | | | | | | | | |
| | | |
Total Market Value of Open Corporate Issue Credit Default Swap Contracts Premiums Paid (Received) - ($298) | | | | | | (2,478 | ) |
| | | | | | | | | | | | | | | |
| | | | | | | | | | | | | |
| Credit Indices | | | | | | | | | | | | | |
Reference
Entity | | Counter
Party | | Notional
Amount | | Fund (Pays)/
Receives
Fixed Rate | | Termination
Date | | Market
Value
$ | |
| | | | | | | | | | | | | |
ABX - HE Index for Sub-Prime Home Equity Sector | | Citibank | | USD | | 650 | | 0.170% | | 05/25/46 | | (569 | ) |
ABX - HE Index for Sub-Prime Home Equity Sector | | Credit Suisse First Boston | | USD | | 350 | | 0.090% | | 08/25/37 | | (211 | ) |
ABX - HE Index for Sub-Prime Home Equity Sector | | Credit Suisse First Boston | | USD | | 350 | | 0.090% | | 08/25/37 | | (211 | ) |
ABX - HE Index for Sub-Prime Home Equity Sector | | Credit Suisse First Boston | | USD | | 200 | | 0.760% | | 01/25/38 | | (122 | ) |
ABX - HE Index for Sub-Prime Home Equity Sector | | Credit Suisse First Boston | | USD | | 300 | | 0.760% | | 01/25/38 | | (182 | ) |
ABX - HE Index for Sub-Prime Home Equity Sector | | JP Morgan | | USD | | 1,300 | | 0.090% | | 08/25/37 | | (785 | ) |
ABX - HE Index for Sub-Prime Home Equity Sector | | JP Morgan | | USD | | 1,300 | | 0.760% | | 01/25/38 | | (792 | ) |
CMBS AAA Index | | Citibank | | USD | | 250 | | (0.350)% | | 02/15/51 | | 79 | |
CMBS AAA Index | | Citigroupglobal Markets, Inc. | | USD | | 255 | | (0.350)% | | 10/03/51 | | 77 | |
CMBS AAA Index | | Credit Suisse First Boston | | USD | | 540 | | (0.070)% | | 03/15/49 | | 109 | |
CMBS AAA Index | | Credit Suisse First Boston | | USD | | 350 | | (0.350)% | | 02/17/51 | | 105 | |
CMBS AAA Index | | Deutsche Bank | | USD | | 300 | | (0.080)% | | 12/13/49 | | 90 | |
CMBS AAA Index | | JP Morgan | | USD | | 720 | | (0.080)% | | 12/13/49 | | 215 | |
CMBS AAA Index | | JP Morgan | | USD | | 280 | | (0.080)% | | 12/13/49 | | 84 | |
CMBS AAA Index | | JP Morgan | | USD | | 590 | | (0.350)% | | 02/17/51 | | 177 | |
CMBS AAA Index | | JP Morgan | | USD | | 280 | | (0.350)% | | 02/17/51 | | 84 | |
CMBS AAA Index | | JP Morgan | | USD | | 540 | | (0.100)% | | 10/12/52 | | 76 | |
CMBX AJ Index | | Barclays Bank PLC | | USD | | 360 | | (0.840)% | | 10/12/52 | | 124 | |
CMBX AJ Index | | Barclays Bank PLC | | USD | | 360 | | (0.840)% | | 10/12/52 | | 124 | |
Dow Jones CDX Index | | Citibank | | USD | | 500 | | 2.144% | | 06/20/12 | | (85 | ) |
Dow Jones CDX Index | | Deutsche Bank | | USD | | 778 | | 0.708% | | 12/20/12 | | 4 | |
Dow Jones CDX Index | | Deutsche Bank | | USD | | 4,880 | | (1.550)% | | 06/20/13 | | 110 | |
Dow Jones CDX Index | | Deutsche Bank | | USD | | 600 | | 1.500% | | 12/20/13 | | (12 | ) |
Dow Jones CDX Index | | Goldman Sachs | | USD | | 194 | | 0.548% | | 12/20/17 | | — | |
Dow Jones CDX Index | | JP Morgan | | USD | | 2,928 | | (1.550)% | | 06/20/13 | | 64 | |
Dow Jones CDX Index | | JP Morgan | | USD | | 1,984 | | (1.550)% | | 06/20/13 | | 45 | |
Dow Jones CDX Index | | JP Morgan | | USD | | 389 | | 0.553% | | 12/20/17 | | 1 | |
Dow Jones CDX Index | | Morgan Stanley | | USD | | 400 | | 5.000% | | 12/20/13 | | (80 | ) |
Dow Jones CDX Index | | Morgan Stanley | | USD | | 293 | | (0.800)% | | 12/20/17 | | 15 | |
Dow Jones CDX Index | | Morgan Stanley | | USD | | 500 | | (5.000)% | | 06/20/13 | | 63 | |
| | | | | | | | | | | | | |
| | | |
Total Market Value of Open Credit Index Credit Default Swap Contracts Premiums Paid (Received) - ($1,862) | | | | | | (1,403 | ) |
| | | | | | | | | | | | | |
| | | |
Total Market Value of Open Credit Default Swap Contracts Premiums Paid (Received) - ($2,160) | | | | | | (3,881 | ) |
| | | | | | | | | | | | | |
See accompanying notes which are an integral part of the financial statements.
Russell Investment Funds
Core Bond Fund
Schedule of Investments, continued — December 31, 2008
Amounts in thousands
| | | | | | | | | | | | | |
| Interest Rate Swaps Contracts | |
Counter Party | | Notional
Amount | | Fund Receives | | Fund Pays | | Termination
Date | | Market
Value
$ | |
| | | | | | | | | | | | | |
Bank of America | | USD | | 6,500 | | 5.473% | | Three Month LIBOR | | 06/14/11 | | 612 | |
Bank of America | | USD | | 3,600 | | 4.444% | | Three Month LIBOR | | 11/18/15 | | 282 | |
Bank of America | | USD | | 2,700 | | 3.815% | | Three Month LIBOR | | 11/25/15 | | 133 | |
Bank of America | | USD | | 1,800 | | 5.548% | | Three Month LIBOR | | 06/14/16 | | 391 | |
Bank of America | | USD | | 2,200 | | Three Month LIBOR | | 4.569% | | 11/18/20 | | (300 | ) |
Bank of America | | USD | | 1,600 | | Three Month LIBOR | | 3.807% | | 11/25/20 | | (115 | ) |
Bank of America | | USD | | 2,200 | | Three Month LIBOR | | 3.500% | | 06/17/24 | | (171 | ) |
Bank of America | | USD | | 600 | | Three Month LIBOR | | 5.000% | | 12/17/28 | | (202 | ) |
Bank of America | | USD | | 1,500 | | 5.628% | | Three Month LIBOR | | 06/16/36 | | 825 | |
Bank of America | | USD | | 700 | | Three Month LIBOR | | 5.000% | | 12/17/38 | | (319 | ) |
Barclays Bank PLC | | BRL | | 100 | | 11.360% | | Brazil Interbank Deposit Rate | | 01/04/10 | | (1 | ) |
Barclays Bank PLC | | USD | | 600 | | 4.000% | | Three Month LIBOR | | 12/16/10 | | 14 | |
Barclays Bank PLC | | EUR | | 3,170 | | Six Month EURIBOR | | 4.500% | | 12/17/13 | | (247 | ) |
Barclays Bank PLC | | USD | | 7,800 | | 3.855% | | Three Month LIBOR | | 10/27/14 | | 525 | |
Barclays Bank PLC | | USD | | 3,960 | | 3.340% | | Three Month LIBOR | | 11/25/14 | | 166 | |
Barclays Bank PLC | | GBP | | 140 | | 5.250% | | Six Month LIBOR | | 12/17/18 | | 31 | |
Barclays Bank PLC | | USD | | 100 | | Three Month LIBOR | | 4.000% | | 06/17/19 | | (12 | ) |
Barclays Bank PLC | | USD | | 144 | | Three Month LIBOR | | 4.524% | | 11/15/21 | | (35 | ) |
Barclays Bank PLC | | USD | | 146 | | Three Month LIBOR | | 4.420% | | 11/15/21 | | (32 | ) |
Barclays Bank PLC | | USD | | 266 | | Three Month LIBOR | | 4.540% | | 11/15/21 | | (64 | ) |
Barclays Bank PLC | | USD | | 530 | | Three Month LIBOR | | 4.633% | | 11/15/21 | | (138 | ) |
Barclays Bank PLC | | USD | | 2,050 | | Three Month LIBOR | | 4.015% | | 10/27/39 | | (486 | ) |
Barclays Bank PLC | | USD | | 950 | | Three Month LIBOR | | 3.130% | | 11/25/39 | | (56 | ) |
BNP Paribas | | EUR | | 500 | | Consumer Price Index (France) | | 2.090% | | 10/15/10 | | 23 | |
BNP Paribas | | EUR | | 300 | | 4.500% | | Six Month EURIBOR | | 03/18/14 | | 24 | |
Citibank | | MXN | | 10,000 | | 8.850% | | Mexico Interbank 28 Day Deposit Rate | | 11/23/10 | | 13 | |
Citibank | | MXN | | 20,000 | | 8.210% | | Mexico Interbank 28 Day Deposit Rate | | 12/08/10 | | 9 | |
Citibank | | MXN | | 17,000 | | 8.210% | | Mexico Interbank 28 Day Deposit Rate | | 12/09/10 | | 7 | |
Citibank | | EUR | | 660 | | Six Month EURIBOR | | 4.500% | | 12/17/10 | | (29 | ) |
Citibank | | BRL | | 2,500 | | 13.226% | | Brazil Interbank Deposit Rate | | 01/03/11 | | — | |
Citibank | | USD | | 1,300 | | 2.750% | | Three Month LIBOR | | 06/18/12 | | 30 | |
Citibank | | USD | | 1,600 | | Three Month LIBOR | | 5.000% | | 12/17/38 | | (727 | ) |
Citigroupglobal Markets, Inc. | | USD | | 7,240 | | 4.288% | | Three Month LIBOR | | 10/30/14 | | 633 | |
Citigroupglobal Markets, Inc. | | USD | | 1,960 | | Three Month LIBOR | | 4.313% | | 10/30/39 | | (581 | ) |
Credit Suisse First Boston | | GBP | | 100 | | 5.000% | | Six Month LIBOR | | 06/15/09 | | 1 | |
Credit Suisse First Boston | | USD | | 4,200 | | 2.750% | | Three Month LIBOR | | 06/18/12 | | 98 | |
Credit Suisse First Boston | | JPY | | 258,000 | | Six Month LIBOR | | 1.500% | | 12/17/13 | | (71 | ) |
Credit Suisse First Boston | | USD | | 1,000 | | Three Month LIBOR | | 3.500% | | 06/17/24 | | (78 | ) |
Credit Suisse First Boston | | USD | | 500 | | Three Month LIBOR | | 3.500% | | 06/18/29 | | (49 | ) |
Deutsche Bank | | MXN | | 8,300 | | 8.910% | | Mexico Interbank 28 Day Deposit Rate | | 11/18/10 | | 11 | |
Deutsche Bank | | EUR | | 300 | | 4.500% | | Six Month EURIBOR | | 12/17/10 | | 13 | |
Deutsche Bank | | EUR | | 1,740 | | 4.500% | | Six Month EURIBOR | | 12/17/10 | | 77 | |
Deutsche Bank | | BRL | | 1,000 | | 13.220% | | Brazil Interbank Deposit Rate | | 01/03/11 | | — | |
Deutsche Bank | | GBP | | 100 | | 5.000% | | Six Month LIBOR | | 03/18/14 | | 12 | |
Deutsche Bank | | USD | | 4,400 | | 3.500% | | Three Month LIBOR | | 06/17/16 | | 289 | |
Deutsche Bank | | USD | | 300 | | Three Month LIBOR | | 3.500% | | 06/17/19 | | (22 | ) |
Deutsche Bank | | USD | | 900 | | Three Month LIBOR | | 3.500% | | 06/17/24 | | (70 | ) |
Deutsche Bank | | USD | | 1,000 | | Three Month LIBOR | | 3.500% | | 06/17/24 | | (78 | ) |
Deutsche Bank | | USD | | 3,400 | | Three Month LIBOR | | 3.500% | | 06/17/24 | | (264 | ) |
Deutsche Bank | | USD | | 200 | | Three Month LIBOR | | 3.500% | | 06/18/29 | | (19 | ) |
Deutsche Bank | | USD | | 1,200 | | 3.500% | | Three Month LIBOR | | 06/17/39 | | 170 | |
Goldman Sachs | | GBP | | 900 | | 5.000% | | Six Month LIBOR | | 06/15/09 | | 12 | |
Goldman Sachs | | GBP | | 500 | | 6.000% | | Six Month LIBOR | | 06/19/09 | | 10 | |
Goldman Sachs | | GBP | | 100 | | 5.250% | | Six Month LIBOR | | 03/18/14 | | 14 | |
See accompanying notes which are an integral part of the financial statements.
Russell Investment Funds
Core Bond Fund
Schedule of Investments, continued — December 31, 2008
Amounts in thousands
| | | | | | | | | | | | | |
| Interest Rate Swaps Contracts | |
Counter Party | | Notional
Amount | | Fund Receives | | Fund Pays | | Termination
Date | | Market
Value
$ | |
| | | | | | | | | | | | | |
HSBC | | GBP | | 300 | | 5.000% | | Six Month LIBOR | | 09/17/13 | | 32 | |
JP Morgan | | MXN | | 4,500 | | 8.950% | | Mexico Interbank 28 Day Deposit Rate | | 11/19/10 | | 6 | |
JP Morgan | | MXN | | 9,000 | | 8.420% | | Mexico Interbank 28 Day Deposit Rate | | 12/01/10 | | 6 | |
JP Morgan | | MXN | | 7,000 | | 8.380% | | Mexico Interbank 28 Day Deposit Rate | | 12/03/10 | | 5 | |
JP Morgan | | EUR | | 1,570 | | Six Month EURIBOR | | 4.500% | | 12/17/10 | | (70 | ) |
JP Morgan | | EUR | | 1,730 | | 4.500% | | Six Month EURIBOR | | 12/17/10 | | 77 | |
JP Morgan | | USD | | 400 | | Three Month LIBOR | | 3.250% | | 06/17/14 | | (18 | ) |
JP Morgan | | USD | | 4,900 | | 3.500% | | Three Month LIBOR | | 06/17/16 | | 322 | |
JP Morgan | | AUD | | 90 | | Six Month LIBOR | | 7.250% | | 12/17/18 | | (15 | ) |
JP Morgan | | USD | | 1,100 | | Three Month LIBOR | | 3.500% | | 06/17/19 | | (81 | ) |
JP Morgan | | USD | | 200 | | Three Month LIBOR | | 3.500% | | 06/17/24 | | (16 | ) |
Merrill Lynch | | BRL | | 200 | | 12.948% | | Brazil Interbank Deposit Rate | | 01/04/10 | | 2 | |
Merrill Lynch | | USD | | 1,500 | | 4.000% | | Three Month LIBOR | | 06/17/11 | | 68 | |
Merrill Lynch | | BRL | | 100 | | 14.765% | | Brazil Interbank Deposit Rate | | 01/02/12 | | 2 | |
Merrill Lynch | | BRL | | 700 | | 11.980% | | Brazil Interbank Deposit Rate | | 01/02/12 | | (2 | ) |
Merrill Lynch | | BRL | | 800 | | 12.540% | | Brazil Interbank Deposit Rate | | 01/02/12 | | 2 | |
Merrill Lynch | | GBP | | 100 | | Six Month LIBOR | | 4.000% | | 12/15/35 | | (9 | ) |
Merrill Lynch | | USD | | 400 | | Three Month LIBOR | | 5.000% | | 12/17/38 | | (182 | ) |
Morgan Stanley | | BRL | | 400 | | 12.670% | | Brazil Interbank Deposit Rate | | 01/04/10 | | 1 | |
Morgan Stanley | | USD | | 9,500 | | 4.000% | | Three Month LIBOR | | 06/17/10 | | 248 | |
Morgan Stanley | | USD | | 200 | | Three Month LIBOR | | 5.000% | | 12/17/28 | | (67 | ) |
Morgan Stanley | | USD | | 300 | | Three Month LIBOR | | 5.000% | | 12/17/38 | | (137 | ) |
Royal Bank of Scotland | | USD | | 2,100 | | 4.000% | | Three Month LIBOR | | 06/17/10 | | 55 | |
Royal Bank of Scotland | | USD | | 18,500 | | 4.000% | | Three Month LIBOR | | 06/17/11 | | 839 | |
Royal Bank of Scotland | | EUR | | 100 | | 1.955% | | Consumer Price Index (France) | | 03/28/12 | | 2 | |
Royal Bank of Scotland | | GBP | | 200 | | 5.250% | | Six Month LIBOR | | 03/18/14 | | 28 | |
Royal Bank of Scotland | | USD | | 100 | | Three Month LIBOR | | 4.000% | | 06/17/16 | | (9 | ) |
Royal Bank of Scotland | | USD | | 200 | | Three Month LIBOR | | 5.000% | | 12/17/28 | | (67 | ) |
Royal Bank of Scotland | | GBP | | 100 | | Six Month LIBOR | | 4.000% | | 12/15/36 | | (16 | ) |
Royal Bank of Scotland | | USD | | 1,900 | | Three Month LIBOR | | 5.000% | | 12/17/38 | | (866 | ) |
SBC Warburg | | BRL | | 400 | | 12.410% | | Brazil Interbank Deposit Rate | | 01/04/10 | | 1 | |
UBS | | AUD | | 300 | | 7.500% | | Three Month BBSW | | 03/15/10 | | 9 | |
UBS | | AUD | | 2,800 | | 7.000% | | Three Month BBSW | | 06/15/10 | | 72 | |
UBS | | AUD | | 1,600 | | 7.500% | | Six Month LIBOR | | 03/15/11 | | 84 | |
UBS | | BRL | | 800 | | 10.575% | | Brazil Interbank Deposit Rate | | 01/02/12 | | (16 | ) |
UBS | | JPY | | 64,000 | | Six Month LIBOR | | 1.500% | | 12/17/13 | | (20 | ) |
UBS | | GBP | | 140 | | Six Month LIBOR | | 5.250% | | 12/17/18 | | (30 | ) |
UBS | | AUD | | 90 | | 7.250% | | Six Month BBSW | | 12/17/18 | | 15 | |
| | | | | | | | | | | | | |
| | |
Total Market Value of Open Interest Rate Swap Contracts Premiums Paid (Received) - $461 | | | | 514 | |
| | | | | |
See accompanying notes which are an integral part of the financial statements.
Russell Investment Funds
Core Bond Fund
Presentation of Portfolio Holdings — December 31, 2008
| | | |
| Categories | | % of Net
Assets | |
| | | |
| | | |
Asset-Backed Securities | | 4.7 | |
Corporate Bonds and Notes | | 18.9 | |
International Debt | | 5.3 | |
Loan Agreements | | 0.4 | |
Mortgage-Backed Securities | | 78.1 | |
Municipal Bonds | | 0.6 | |
Non-US Bonds | | 0.4 | |
United States Government Agencies | | 0.3 | |
United States Government Treasuries | | 3.0 | |
Preferred Stocks | | 0.4 | |
Options Purchased | | 0.7 | |
Short-Term Investments | | 11.4 | |
Repurchase Agreement | | 1.3 | |
Other Securities | | 5.1 | |
| | | |
| |
Total Investments | | 130.6 | |
Other Assets and Liabilities, Net | | (30.6 | ) |
| | | |
| |
| | 100.0 | |
| | | |
| |
Futures Contracts | | 0.7 | |
Options Written | | (0.6 | ) |
Foreign Currency Exchange Contracts | | (0.1 | ) |
Credit Default Swap Contracts | | (1.2 | ) |
Interest Rate Swap Contracts | | 0.2 | |
See accompanying notes which are an integral part of the financial statements.
(This page intentionally left blank)
Russell Investment Funds
Real Estate Securities Fund
Portfolio Management Discussion and Analysis — December 31, 2008 (Unaudited)
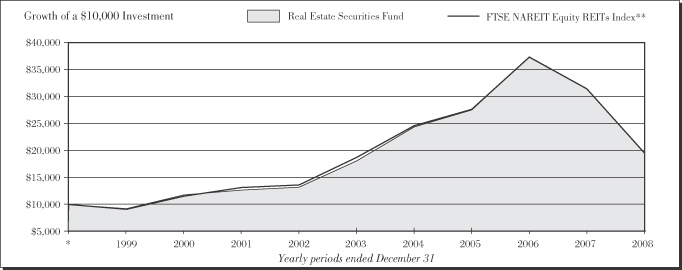
| | | | | |
|
| Real Estate Securities Fund | |
| | | | | Total
Return | |
1 Year | | | | (37.76 | )% |
5 Years | | | | 1.62 | %§ |
Inception* | | | | 7.23 | %§ |
| | | | | |
|
| FTSE NAREIT Equity REITs Index ** | |
| | | | | Total
Return | |
1 Year | | | | (37.73 | )% |
5 Years | | | | 0.91 | %§ |
Inception* | | | | 7.22 | %§ |
| * | | The Fund commenced operations on April 30, 1999. |
| ** | | FTSE National Association of Real Estate Investment Trusts (NAREIT) Equity REITs Index is an index composed of all the data based on the last closing price of the month for all tax-qualified REITs listed on the New York Stock Exchange, American Stock Exchange, and the NASDAQ National Market System. The data is market value-weighted. The total-return calculation is based upon whether it is 1-month, 3-months or 12-months. Only those REITs listed for the entire period are used in the total return calculation. |
The performance shown in this section does not reflect any Insurance Company Separate Account or Policy Charges. Performance is historical and assumes reinvestment of all dividends and capital gains. Investment return and principal value will fluctuate so that an investor’s shares, when redeemed, may be worth more or less than when purchased. Past performance is not indicative of future results.
| | |
| 80 | | Real Estate Securities Fund |
Russell Investment Funds
Real Estate Securities Fund
Portfolio Management Discussion — December 31, 2008 (Unaudited)
The Real Estate Securities Fund (the “Fund”) allocates most of its assets among multiple money managers. Russell Investment Management Company (“RIMCo”), as the Fund’s advisor, may change the allocation of the Fund’s assets among money managers at any time. An exemptive order from the Securities and Exchange Commission (SEC) permits RIMCo to engage or terminate a money manager at any time, subject to the approval by the Fund’s Board without a shareholder vote. Pursuant to the terms of the exemptive order, the Fund is required to notify its shareholders within 60 days of when a money manager begins providing services. The Fund currently has five money managers.
What is the Fund’s investment objective?
The Fund seeks to provide current income and long term capital growth.
How did the Fund perform relative to its benchmark for the fiscal year ended December 31, 2008?
For the fiscal year ended December 31, 2008, the Real Estate Securities Fund lost 37.76%. This compared to the FTSE NAREIT Equity REITs Index, which lost 37.73% during the same period. The Fund’s performance includes operating expenses, whereas Index returns are unmanaged and do not include expenses of any kind.
For the year ending December 31, 2008, the Lipper® Real Estate Funds (VIP) Average lost 40.21%. This result serves as a peer comparison and is expressed net of operating expenses.
How did the market conditions described in the Market Summary report affect the Fund’s performance?
The money managers positioned the Fund with a more defensive posture during the fiscal year. Over the course of the fiscal year, the managers moved to underweight positions in the industrial and lodging/resorts sectors. The industrial underweight reflected concerns about the large development pipelines maintained by the leading companies in the sector. The lodging/resorts underweight reflected concerns about a slowing economy, which is expected to curtail business and leisure travel, leading to lower occupancies and room rate growth. The Fund maintained an overweight position in the regional malls sector, as the managers were drawn to the long term lease structures and limited new supply of high quality malls. The Fund maintained underweight positions in the health care and specialty sectors based on relative valuations. While the underweight positions in the industrial and lodging/resorts sectors benefited Fund performance, the overweight to regional malls and underweight to the health care and specialty sectors detracted from performance. Overall, property sector positioning was a positive contributor to the Fund’s performance during the fiscal year.
Due to the negative market returns, the Fund’s cash position of approximately 4% had a positive contribution to Fund performance during the fiscal year. The Fund’s international real estate securities holdings detracted from performance. Property stocks in Asia Pacific and Europe lagged behind U.S. REITs during this period.
How did the investment strategies and techniques employed by the Fund and its money managers affect its performance?
AEW Management and Advisors, L.P. pursues a value-oriented style that focuses on identifying companies that it believes are mis-priced relative to underlying real estate net asset value. AEW performed slightly ahead of the benchmark during the fiscal year. Stock selection was a positive contributor to performance, particularly in the regional malls and industrial sectors. Property sector allocation negatively contributed to performance. The primary detractors to performance were an overweight to the underperforming regional malls sector and an underweight to the outperforming health care sector.
INVESCO Institutional (N.A.), Inc. maintains a broadly diversified portfolio with exposure to all major property sectors. Their investment style incorporates fundamental property market research and bottom-up quantitative securities analysis. INVESCO outperformed the benchmark during the fiscal year due to contributions from both property sector allocation and stock selection. An overweight to the outperforming health care sector and underweight to the underperforming industrial sector both had a positive contribution to performance. Stock selection was strongest in the apartments, diversified, shopping centers and regional malls sectors. This was partially offset by weak stock selection in the office sector.
RREEF America L.L.C.’s style emphasizes a top-down approach to property sector weights based on an assessment of property market fundamentals. RREEF performed in line with the benchmark during the fiscal year. Sector allocation detracted from performance due primarily to an overweight to the underperforming regional malls sector. Overall stock selection had a positive contribution to performance, driven by stock selection in the regional malls, shopping centers and lodging/resorts sectors.
Heitman Real Estate Securities LLC manages a concentrated portfolio with a bottom-up approach to stock selection focusing on companies that it believes have attractive valuations relative to growth prospects. Heitman outperformed the benchmark during the fiscal year, primarily as a result of effective stock selection. Stock selection was strongest in the regional malls, industrial and health care sectors. Sector allocation detracted from performance, driven primarily by an overweight to the underperforming regional malls sector.
Cohen & Steers Capital Management Inc. manages a broadly diversified portfolio of global property securities. Cohen & Steers uses a bottom-up approach to portfolio construction, emphasizing the relationship between price and net asset value as the principal valuation metric. Cohen & Steers also evaluates multiple-to-growth ratios as indicators of value. While Cohen & Steers outperformed relative to their peer group of global managers, the global portfolio had a negative impact on Fund performance, due to the underperformance of international
| | |
| Real Estate Securities Fund | | 81 |
Russell Investment Funds
Real Estate Securities Fund
Portfolio Management Discussion — December 31, 2008 (Unaudited)
property securities markets. Investments in Asia, particularly in Hong Kong, detracted the most from performance. However, all regions outside the U.S., including Australia, Continental Europe and the United Kingdom, underperformed relative to the U.S. Cohen & Steers’ strong stock selection was insufficient to overcome the lower returns in the international markets.
The Fund’s performance shown throughout this report was based on valuations calculated in accordance with Generally Accepted Accounting Principles (GAAP) and in accordance with a newly effective accounting statement (SFAS 157), reflects the December 31, 2008 market value of the pooled investment vehicle in which the Fund invested its cash collateral received in securities lending transactions. This market value is lower than the vehicle’s amortized cost per unit. This had a negative impact on the Fund’s benchmark relative performance.
Describe any changes to the Fund’s structure or the money manager line-up.
There were no money manager changes during the fiscal year. During the course of the fiscal year, Heitman’s target weight was increased from 10% to 15% and the target weights for AEW and INVESCO decreased to 25% each.
| | |
| |
Money Managers as of
December 31, 2008 | | Styles |
| AEW Management and Advisors, L.P. | | Value |
| Cohen & Steers Capital Management, Inc. | | Global Market-Oriented |
| Heitman Real Estate Securities LLC | | Growth |
| INVESCO Institutional (N.A.), Inc. which acts as a money manager to the Fund through its INVESCO Real Estate division | | Market-Oriented |
| RREEF America L.L.C. | | Market-Oriented |
The views expressed in this report reflect those of the portfolio managers only through the end of the period covered by the report. These views do not necessarily represent the views of RIMCo or any other person in RIMCo or any other affiliated organization. These views are subject to change at any time based upon market conditions or other events, and RIMCo disclaims any responsibility to update the views contained herein. These views should not be relied on as investment advice and, because investment decisions for Russell Investment Funds are based on numerous factors, should not be relied on as an indication of investment decisions of any RIF Fund.
| | |
| 82 | | Real Estate Securities Fund |
Russell Investment Funds
Real Estate Securities Fund
Shareholder Expense Example — December 31, 2008 (Unaudited)
Fund Expenses
The following disclosure provides important information regarding each Fund’s Expense Example, which appears on each Fund’s individual page in this Annual Report. Please refer to this information when reviewing the Expense Example for a Fund.
Example
As a shareholder of the Fund, you incur two types of costs: (1) transaction costs, and (2) ongoing costs, including management fees and other Fund expenses. The Example is intended to help you understand your ongoing costs (in dollars) of investing in the Fund and to compare these costs with the ongoing costs of investing in other mutual funds. The Example is based on an investment of $1,000 invested at the beginning of the period and held for the entire period indicated, which for this Fund is from July 1, 2008 to December 31, 2008.
Actual Expenses
The information in the table under the heading “Actual Performance” provides information about actual account values and actual expenses. You may use the information in this column, together with the amount you invested, to estimate the expenses that you paid over the period. Simply divide your account value by $1,000 (for example, an $8,600 account value divided by $1,000 = 8.6), then multiply the result by the number in the first column in the row entitled “Expenses Paid During Period” to estimate the expenses you paid on your account during this period.
Hypothetical Example for Comparison Purposes
The information in the table under the heading “Hypothetical Performance (5% return before expenses)” provides information about hypothetical account values and hypothetical expenses based on the Fund’s actual expense ratio and an assumed rate of return of 5% per year before expenses, which is not the Fund’s actual return. The hypothetical account values and expenses may not be used to estimate the actual ending account balance or expenses you paid for the period. You may use this information to compare the ongoing costs of investing in the Fund and other funds. To do so, compare this 5% hypothetical example with the 5% hypothetical examples that appear in the shareholder reports of other funds.
Please note that the expenses shown in the table are meant to highlight your ongoing costs only and do not reflect any transactional costs. Therefore, the information under the heading “Hypothetical Performance (5% return before expenses)” is useful in comparing ongoing costs only, and will not help you determine the relative total costs of owning different funds. In addition, if these transactional costs were included, your costs would have been higher. The fee and expenses shown in this section do not reflect any Insurance Company Separate Account or Policy Charges.
| | | | | | |
| | | Actual
Performance | | Hypothetical
Performance
(5% return
before expenses) |
| | | | | | |
Beginning Account Value | | | | | | |
July 1, 2008 | | $ | 1,000.00 | | $ | 1,000.00 |
Ending Account Value | | | | | | |
December 31, 2008 | | $ | 643.40 | | $ | 1,020.11 |
Expenses Paid During Period* | | $ | 4.13 | | $ | 5.08 |
| * | Expenses are equal to the Fund’s annualized expense ratio of 1.00% (representing the one-half year period annualized), multiplied by the average account value over the period, multiplied by 184/366 (to reflect the one-half year period). |
| | |
| Real Estate Securities Fund | | 83 |
Russell Investment Funds
Real Estate Securities Fund
Schedule of Investments — December 31, 2008
Amounts in thousands (except share amounts)
| | | | |
| | | Principal
Amount ($)
or Shares | | Market
Value
$ |
| | | | |
| Common Stocks - 97.9% | | | | |
| Apartments—15.6% | | | | |
American Campus Communities, Inc. (ö)(Ñ) | | 136,809 | | 2,802 |
Apartment Investment & Management Co. Class A (ö)(Ñ) | | 111,249 | | 1,285 |
AvalonBay Communities, Inc. (ö)(Ñ) | | 223,326 | | 13,529 |
Boardwalk Real Estate Investment Trust (ö) | | 9,285 | | 192 |
BRE Properties, Inc. Class A (ö)(Ñ) | | 90,454 | | 2,531 |
Camden Property Trust (ö)(Ñ) | | 197,090 | | 6,177 |
China Overseas Land & Investment, Ltd. (Ñ) | | 156,000 | | 213 |
China Resources Land, Ltd. (Ñ) | | 58,000 | | 72 |
Equity Residential (ö)(Ñ) | | 479,334 | | 14,294 |
Essex Property Trust, Inc. (ö)(Ñ) | | 43,207 | | 3,316 |
Home Properties, Inc. (ö)(Ñ) | | 15,300 | | 621 |
Mid-America Apartment Communities, Inc. (ö) | | 27,719 | | 1,030 |
Post Properties, Inc. (ö)(Ñ) | | 53,750 | | 887 |
UDR, Inc. (ö)(Ñ) | | 20,071 | | 277 |
| | | | |
| | | | 47,226 |
| | | | |
| | |
| Diversified—9.7% | | | | |
Agile Property Holdings, Ltd. (Ñ) | | 44,000 | | 23 |
Atrium European Real Estate, Ltd. (Æ) | | 9,248 | | 34 |
British Land Co. PLC (ö) | | 51,693 | | 414 |
Canadian Real Estate Investment Trust(ö) | | 18,317 | | 335 |
CapitaLand, Ltd. | | 107,000 | | 235 |
Castellum AB (Ñ) | | 37,595 | | 292 |
Dexus Property Group (ö)(Ñ) | | 618,174 | | 359 |
Gecina SA (ö) | | 421 | | 29 |
GPT Group (ö) | | 188,740 | | 122 |
Hang Lung Properties, Ltd.—ADR (Ñ) | | 154,000 | | 338 |
Henderson Land Development Co., Ltd. (Ñ) | | 102,336 | | 382 |
Hysan Development Co., Ltd. | | 211,470 | | 343 |
Kerry Properties, Ltd. | | 19,500 | | 53 |
Land Securities Group PLC (ö) | | 61,331 | | 817 |
Mirvac Group (ö) | | 329,079 | | 297 |
Mitsubishi Estate Co., Ltd. | | 127,000 | | 2,094 |
Mitsui Fudosan Co., Ltd. | | 65,100 | | 1,082 |
New World China Land, Ltd. (Æ) | | 86,100 | | 26 |
Sino Land Co. | | 153,000 | | 160 |
Sino-Ocean Land Holdings, Ltd. (Æ) | | 70,000 | | 32 |
Sponda OYJ | | 4,701 | | 21 |
Stockland (ö)(Ñ) | | 57,477 | | 166 |
Sumitomo Realty & Development Co., Ltd. | | 5,000 | | 75 |
Sun Hung Kai Properties, Ltd. | | 164,362 | | 1,382 |
Suntec Real Estate Investment Trust (Æ)(ö) | | 15,000 | | 7 |
Tokyu Land Corp. | | 18,000 | | 69 |
Unibail-Rodamco (ö) | | 5,947 | | 886 |
Vornado Realty Trust (ö)(Ñ) | | 287,683 | | 17,362 |
Washington Real Estate Investment Trust (ö)(Ñ) | | 74,902 | | 2,120 |
| | | | |
| | | | 29,555 |
| | | | |
| | | | |
| | | Principal
Amount ($)
or Shares | | Market
Value
$ |
| Free Standing Retail—0.6% | | | | |
National Retail Properties, Inc. (ö)(Ñ) | | 65,800 | | 1,131 |
Realty Income Corp. (ö)(Ñ) | | 30,800 | | 713 |
| | | | |
| | | | 1,844 |
| | | | |
| | |
| Health Care—14.0% | | | | |
Cogdell Spencer, Inc. (ö)(Ñ) | | 41,300 | | 387 |
HCP, Inc. (ö)(Ñ) | | 188,671 | | 5,239 |
Health Care REIT, Inc. (ö)(Ñ) | | 147,602 | | 6,229 |
LTC Properties, Inc. (ö) | | 51,650 | | 1,047 |
Medical Properties Trust, Inc. (ö)(Ñ) | | 144,604 | | 912 |
Nationwide Health Properties, Inc. (ö) | | 297,335 | | 8,539 |
Omega Healthcare Investors, Inc. (ö)(Ñ) | | 217,275 | | 3,470 |
Senior Housing Properties Trust (ö) | | 268,779 | | 4,817 |
Ventas, Inc. (ö)(Ñ) | | 352,838 | | 11,845 |
| | | | |
| | | | 42,485 |
| | | | |
| | |
| Industrial—4.9% | | | | |
AMB Property Corp. (ö) | | 212,310 | | 4,972 |
DCT Industrial Trust, Inc. (ö)(Ñ) | | 678,599 | | 3,434 |
EastGroup Properties, Inc. (ö)(Ñ) | | 16,038 | | 571 |
First Potomac Realty Trust (ö) | | 73,500 | | 683 |
Goodman Group (ö) | | 137,561 | | 73 |
Prologis (ö)(Ñ) | | 343,711 | | 4,774 |
ProLogis European Properties | | 14,670 | | 66 |
Segro PLC (ö)(Ñ) | | 38,967 | | 139 |
| | | | |
| | | | 14,712 |
| | | | |
| | |
| Lodging/Resorts—2.6% | | | | |
Hospitality Properties Trust (ö)(Ñ) | | 15,450 | | 230 |
Host Hotels & Resorts, Inc. (ö)(Ñ) | | 825,112 | | 6,246 |
LaSalle Hotel Properties (ö)(Ñ) | | 24,700 | | 273 |
Starwood Hotels & Resorts Worldwide, Inc. (Ñ)(ö) | | 71,691 | | 1,283 |
| | | | |
| | | | 8,032 |
| | | | |
| | |
| Manufactured Homes—0.9% | | | | |
Equity Lifestyle Properties, Inc. (ö)(Ñ) | | 74,200 | | 2,846 |
| | | | |
| | |
| Mixed Industrial/Office—2.4% | | | | |
Duke Realty Corp. (ö)(Ñ) | | 12,466 | | 137 |
Liberty Property Trust (ö)(Ñ) | | 266,524 | | 6,085 |
PS Business Parks, Inc. (ö) | | 21,454 | | 958 |
| | | | |
| | | | 7,180 |
| | | | |
| | |
| Office—11.3% | | | | |
Alexandria Real Estate Equities, Inc. (ö)(Ñ) | | 51,282 | | 3,094 |
Alstria Office REIT-AG (Æ)(ö) | | 2,664 | | 14 |
BioMed Realty Trust, Inc. (ö)(Ñ) | | 193,948 | | 2,273 |
Boston Properties, Inc. (ö)(Ñ) | | 231,460 | | 12,730 |
Brandywine Realty Trust (ö) | | 100,412 | | 774 |
Brookfield Properties Corp. | | 223,228 | | 1,726 |
Corporate Office Properties Trust SBI MD (ö)(Ñ) | | 59,375 | | 1,823 |
Douglas Emmett, Inc. (ö)(Ñ) | | 138,221 | | 1,805 |
Great Portland Estates PLC (ö)(Ñ) | | 38,944 | | 146 |
| | |
| 84 | | Real Estate Securities Fund |
Russell Investment Funds
Real Estate Securities Fund
Schedule of Investments, continued — December 31, 2008
Amounts in thousands (except share amounts)
| | | | |
| | | Principal
Amount ($)
or Shares | | Market
Value
$ |
| | | | |
Highwoods Properties, Inc. (ö) | | 18,700 | | 512 |
Hongkong Land Holdings, Ltd. | | 253,000 | | 634 |
HRPT Properties Trust (ö) | | 159,400 | | 537 |
ICADE (ö) | | 3,347 | | 279 |
Japan Prime Realty Investment Corp. Class A (ö) | | 24 | | 57 |
Japan Real Estate Investment Corp. Class A (ö) | | 18 | | 162 |
Kilroy Realty Corp. (ö)(Ñ) | | 78,300 | | 2,620 |
Mack-Cali Realty Corp. (ö)(Ñ) | | 71,781 | | 1,759 |
Nippon Building Fund, Inc. Class A (ö) | | 21 | | 231 |
Nomura Real Estate Office Fund, Inc. Class A (ö) | | 12 | | 78 |
NTT Urban Development Corp. (Ñ) | | 211 | | 228 |
SL Green Realty Corp. (ö)(Ñ) | | 100,901 | | 2,613 |
Societe Immobiliere de Location pour l’Industrie et le Commerce (ö) | | 797 | | 74 |
Tokyo Tatemono Co., Ltd. (Ñ) | | 36,000 | | 165 |
| | | | |
| | | | 34,334 |
| | | | |
| | |
| Regional Malls—10.5% | | | | |
Aeon Mall Co., Ltd. (Ñ) | | 18,300 | | 353 |
CBL & Associates Properties, Inc. (ö)(Ñ) | | 8,630 | | 56 |
Macerich Co. (The) (ö)(Ñ) | | 167,654 | | 3,045 |
Simon Property Group, Inc. (ö)(Ñ) | | 449,687 | | 23,892 |
Taubman Centers, Inc. (ö)(Ñ) | | 120,926 | | 3,079 |
Westfield Group (ö)(Ñ) | | 164,437 | | 1,515 |
| | | | |
| | | | 31,940 |
| | | | |
| | |
| Self Storage—8.0% | | | | |
Extra Space Storage, Inc. (ö)(Ñ) | | 296,376 | | 3,059 |
Public Storage (ö)(Ñ) | | 260,148 | | 20,682 |
Safestore Holdings PLC | | 11,321 | | 9 |
Sovran Self Storage, Inc. (ö) | | 10,900 | | 392 |
U-Store-It Trust (ö) | | 4,044 | | 18 |
| | | | |
| | | | 24,160 |
| | | | |
| | |
| Shopping Centers—11.2% | | | | |
Acadia Realty Trust (ö)(Ñ) | | 55,841 | | 797 |
Citycon Oyj | | 12,560 | | 30 |
Corio NV (ö)(Ñ) | | 9,018 | | 414 |
Developers Diversified Realty Corp. (ö)(Ñ) | | 135,108 | | 659 |
Eurocommercial Properties NV (ö)(Ñ) | | 3,413 | | 115 |
Federal Realty Investment Trust (ö)(Ñ) | | 198,010 | | 12,293 |
Hammerson PLC (ö)(Ñ) | | 46,259 | | 358 |
Japan Retail Fund Investment Corp. Class A (ö) | | 49 | | 212 |
Kimco Realty Corp. (ö)(Ñ) | | 231,280 | | 4,228 |
Kite Realty Group Trust (ö) | | 112,000 | | 623 |
Klepierre—GDR (ö) | | 2,870 | | 70 |
Link REIT (The) (ö)(Ñ) | | 139,028 | | 231 |
Mercialys SA (ö) | | 3,854 | | 121 |
Primaris Retail Real Estate Investment Trust (ö) | | 6,720 | | 58 |
| | | | | |
| | | Principal
Amount ($)
or Shares | | Market
Value
$ | |
Regency Centers Corp. (ö)(Ñ) | | 255,319 | | 11,923 | |
RioCan Real Estate Investment Trust (ö) | | 200 | | 2 | |
Saul Centers, Inc. (ö) | | 8,600 | | 340 | |
Tanger Factory Outlet Centers (ö)(Ñ) | | 36,400 | | 1,369 | |
Weingarten Realty Investors (ö)(Ñ) | | 6,710 | | 139 | |
| | | | | |
| | | | 33,982 | |
| | | | | |
| | |
| Specialty—6.2% | | | | | |
Corrections Corp. of America (Æ)(Ñ) | | 5,900 | | 97 | |
Digital Realty Trust, Inc. (ö)(Ñ) | | 274,516 | | 9,018 | |
DuPont Fabros Technology, Inc. (ö) | | 129,050 | | 267 | |
Entertainment Properties Trust (ö)(Ñ) | | 23,362 | | 696 | |
Plum Creek Timber Co., Inc. (ö)(Ñ) | | 187,540 | | 6,515 | |
Rayonier, Inc. (ö)(Ñ) | | 69,800 | | 2,188 | |
| | | | | |
| | | | 18,781 | |
| | | | | |
| | |
Total Common Stocks
(cost $338,763) | | | | 297,077 | |
| | | | | |
| |
| Short-Term Investments - 3.5% | | | |
Russell Investment Company Money Market Fund | | 10,609,000 | | 10,609 | |
| | | | | |
| | |
Total Short-Term Investments
(cost $10,609) | | | | 10,609 | |
| | | | | |
| | |
| Other Securities - 31.2% | | | | | |
State Street Securities Lending Quality Trust (×) | | 100,064,879 | | 94,571 | |
| | | | | |
| | |
Total Other Securities
(cost $100,065) | | | | 94,571 | |
| | | | | |
| | |
Total Investments - 132.6%
(identified cost $449,437) | | | | 402,257 | |
| | |
Other Assets and Liabilities,
Net - (32.6%) | | | | (98,841 | ) |
| | | | | |
| | |
| Net Assets - 100.0% | | | | 303,416 | |
| | | | | |
See accompanying notes which are an integral part of the financial statements.
| | |
| Real Estate Securities Fund | | 85 |
Russell Investment Funds
Real Estate Securities Fund
Schedule of Investments — December 31, 2008
| | | | | | | | | | |
| Foreign Currency Exchange Contracts |
| | | | | | | | | | |
Amount
Sold | | Amount
Bought | | Settlement
Date | | Unrealized
Appreciation
(Depreciation)
$ |
| USD | | — | | AUD | | — | | 01/02/09 | | — |
| USD | | 4 | | AUD | | 5 | | 01/02/09 | | — |
| USD | | — | | AUD | | — | | 01/05/09 | | — |
| USD | | — | | AUD | | — | | 01/06/09 | | — |
| USD | | — | | AUD | | — | | 01/06/09 | | — |
| USD | | 7 | | AUD | | 10 | | 01/06/09 | | — |
| USD | | 2 | | EUR | | 2 | | 01/02/09 | | — |
| USD | | 3 | | EUR | | 2 | | 01/02/09 | | — |
| USD | | 5 | | EUR | | 3 | | 01/02/09 | | — |
| USD | | 2 | | EUR | | 2 | | 01/05/09 | | — |
| USD | | 6 | | EUR | | 4 | | 01/05/09 | | — |
| USD | | 2 | | EUR | | 1 | | 01/06/09 | | — |
| USD | | 1 | | HKD | | 4 | | 01/02/09 | | — |
| USD | | 1 | | HKD | | 7 | | 01/02/09 | | — |
| USD | | 5 | | HKD | | 40 | | 01/02/09 | | — |
| USD | | — | | HKD | | 4 | | 01/05/09 | | — |
| USD | | 1 | | HKD | | 11 | | 01/05/09 | | — |
| USD | | 2 | | HKD | | 16 | | 01/05/09 | | — |
| USD | | 3 | | HKD | | 24 | | 01/05/09 | | — |
| USD | | 7 | | HKD | | 57 | | 01/05/09 | | — |
| USD | | 11 | | HKD | | 84 | | 01/05/09 | | — |
| USD | | 5 | | JPY | | 429 | | 01/07/09 | | — |
| USD | | 13 | | JPY | | 1,162 | | 01/07/09 | | — |
| USD | | 13 | | JPY | | 1,169 | | 01/07/09 | | — |
| USD | | 6 | | SGD | | 8 | | 01/05/09 | | — |
| USD | | 2 | | SGD | | 3 | | 01/06/09 | | — |
| AUD | | 5 | | USD | | 3 | | 01/02/09 | | — |
| AUD | | 5 | | USD | | 3 | | 01/05/09 | | — |
| AUD | | 17 | | USD | | 12 | | 01/06/09 | | — |
| AUD | | 36 | | USD | | 25 | | 01/06/09 | | 1 |
| CAD | | 2 | | USD | | 2 | | 01/02/09 | | — |
| CAD | | 3 | | USD | | 2 | | 01/02/09 | | — |
| CAD | | 2 | | USD | | 2 | | 01/05/09 | | — |
| CAD | | 5 | | USD | | 4 | | 01/05/09 | | — |
| EUR | | 2 | | USD | | 2 | | 01/02/09 | | — |
| EUR | | 2 | | USD | | 2 | | 01/05/09 | | — |
| EUR | | 3 | | USD | | 3 | | 01/05/09 | | — |
| EUR | | 7 | | USD | | 10 | | 01/06/09 | | — |
| EUR | | 40 | | USD | | 56 | | 01/06/09 | | — |
| GBP | | 3 | | USD | | 4 | | 01/02/09 | | — |
| GBP | | 1 | | USD | | 1 | | 01/06/09 | | — |
| GBP | | 14 | | USD | | 21 | | 01/06/09 | | — |
| HKD | | 26 | | USD | | 3 | | 01/02/09 | | — |
| HKD | | 51 | | USD | | 7 | | 01/05/09 | | — |
| HKD | | 63 | | USD | | 8 | | 01/05/09 | | — |
| HKD | | 553 | | USD | | 71 | | 01/05/09 | | — |
| JPY | | 5,780 | | USD | | 64 | | 01/07/09 | | — |
| SEK | | 85 | | USD | | 11 | | 01/05/09 | | — |
| SEK | | 100 | | USD | | 13 | | 01/07/09 | | — |
| | | | | | | | | | |
| |
| Total Unrealized Appreciation (Depreciation) on Open Foreign Currency Exchange Contracts | | 1 |
| | | | | | | | | | |
See accompanying notes which are an integral part of the financial statements.
| | |
| 86 | | Real Estate Securities Fund |
Russell Investment Funds
Real Estate Securities Fund
Presentation of Portfolio Holdings — December 31, 2008
| | | |
| Categories | | % of Net
Assets | |
| | | |
| | | |
Apartments | | 15.6 | |
Diversified | | 9.7 | |
Free Standing Retail | | 0.6 | |
Health Care | | 14.0 | |
Industrial | | 4.9 | |
Lodging/Resorts | | 2.6 | |
Manufactured Homes | | 0.9 | |
Mixed Industrial/Office | | 2.4 | |
Office | | 11.3 | |
Regional Malls | | 10.5 | |
Self Storage | | 8.0 | |
Shopping Centers | | 11.2 | |
Specialty | | 6.2 | |
Short-Term Investments | | 3.5 | |
Other Securities | | 31.2 | |
| | | |
| |
Total Investments | | 132.6 | |
Other Assets and Liabilities, Net | | (32.6 | ) |
| | | |
| |
| | 100.0 | |
| | | |
| |
Foreign Currency Exchange Contracts | | — | * |
| —* | Less than .05% of net assets. |
See accompanying notes which are an integral part of the financial statements.
| | |
| Real Estate Securities Fund | | 87 |
Russell Investment Funds
Notes to Schedules of Investments — December 31, 2008
Footnotes:
| (Æ) | Nonincome-producing security. |
| (ö) | Real Estate Investment Trust (REIT). |
| (§) | All or a portion of the shares of this security are held as collateral in connection with futures contracts purchased (sold), options written, or swaps entered into by the Fund. |
| (ž) | Rate noted is yield-to-maturity from date of acquisition. |
| (ç) | At amortized cost, which approximates market. |
| (Ê) | Adjustable or floating rate security. Rate shown reflects rate in effect at period end. |
| (ƒ) | Perpetual floating rate security. Rate shown reflects rate in effect at period end. |
| (µ) | Bond is insured by a guarantor. |
| (æ) | Pre-refunded: These bonds are collateralized by US Treasury securities, which are held in escrow by a trustee and used to pay principal and interest in the tax-exempt issue and to retire the bonds in full at the earliest refunding date. The rate noted is for descriptive purposes; effective yield may vary. |
| (×) | The security is purchased with the cash collateral from the securities loaned. |
| (Ñ) | All or a portion of the shares of this security are on loan. |
| (Þ) | Restricted security. Security may have contractual restrictions on resale, may have been offered in a private placement transaction, and may not be registered under the Securities Act of 1933. |
| (Å) | Illiquid and restricted security. |
| (å) | Currency balances were held in connection with futures contracts purchased (sold), options written, or swaps entered into by the Fund. See Note 2. |
Abbreviations:
144A - Represents private placement security for qualified buyers according to rule 144A of the Securities Act of 1933.
ADR - American Depositary Receipt
ADS - American Depositary Share
BBSW - Australian Bank Bill Short Term Rate
CIBOR - Copenhagen Interbank Offered Rate
CME - Chicago Mercantile Exchange
CMO - Collateralized Mortgage Obligation
CVO - Contingent Value Obligation
EURIBOR - Euro Interbank Offered Rate
FDIC - Federal Deposit Insurance Company
GDR - Global Depositary Receipt
GDS - Global Depositary Share
LIBOR - London Interbank Offered Rate
NIBOR - Norwegian Interbank Offered Rate
PIK - Payment in Kind
REMIC - Real Estate Mortgage Investment Conduit
STRIP - Separate Trading of Registered Interest and Principal of Securities
TBA - To Be Announced Security
Foreign Currency Abbreviations:
| | | | |
| ARS - Argentine peso | | HKD - Hong Kong dollar | | PLN - Polish zloty |
| AUD - Australian dollar | | HUF - Hungarian forint | | RUB - Russian ruble |
| BRL - Brazilian real | | IDR - Indonesian rupiah | | SEK - Swedish krona |
| CAD - Canadian dollar | | ILS - Israeli shekel | | SGD - Singapore dollar |
| CHF - Swiss franc | | INR - Indian rupee | | SKK - Slovakian koruna |
| CLP - Chilean peso | | JPY - Japanese yen | | THB - Thai baht |
| CNY - Chinese renminbi yuan | | KES - Kenyan schilling | | TRY - Turkish lira |
| COP - Colombian peso | | KRW - South Korean won | | TWD - Taiwanese dollar |
| CRC - Costa Rica colon | | MXN - Mexican peso | | USD - United States dollar |
| CZK - Czech koruna | | MYR - Malaysian ringgit | | VEB - Venezuelan bolivar |
| DKK - Danish krone | | NOK - Norweigian Krone | | VND - Vietnamese dong |
| EGP - Egyptian pound | | NZD - New Zealand dollar | | ZAR - South African rand |
| EUR - Euro | | PEN - Peruvian nouveau sol | | |
| GBP - British pound sterling | | PHP - Philippine peso | | |
| | |
| 88 | | Notes to Schedules of Investments |
Russell Investment Funds
Statements of Assets and Liabilities — December 31, 2008
| | | | | | | | | | | | | | | |
| Amounts in thousands | | Multi-Style Equity
Fund | | Aggressive Equity
Fund | | Non-U.S.
Fund | | Core Bond
Fund | | Real Estate
Securities Fund |
| | | | | | | | | | | | | | | |
Assets | | | | | | | | | | | | | | | |
Investments, at identified cost | | $ | 425,636 | | $ | 208,310 | | $ | 331,216 | | $ | 452,375 | | $ | 449,437 |
Investments, at market*** | | | 346,934 | | | 172,326 | | | 269,951 | | | 416,781 | | | 402,257 |
Cash | | | — | | | 106 | | | 104 | | | — | | | — |
Cash (restricted) | | | 3,700 | | | 1,600 | | | 7,642 | | | 2,019 | | | — |
Foreign currency holdings* | | | — | | | — | | | 3,124 | | | 606 | | | 136 |
Unrealized appreciation on foreign currency exchange contracts | | | — | | | — | | | 2,365 | | | 198 | | | 1 |
Receivables: | | | | | | | | | | | | | | | |
Dividends and interest | | | 549 | | | 195 | | | 336 | | | 2,532 | | | 2,521 |
Dividends from affiliated money market funds | | | 17 | | | 6 | | | 18 | | | 12 | | | 11 |
Investments sold | | | 2,064 | | | 1,048 | | | 4,239 | | | 22,465 | | | 1,972 |
Fund shares sold | | | 25 | | | 7 | | | 10 | | | 103 | | | 77 |
Foreign taxes recoverable | | | — | | | — | | | 36 | | | — | | | — |
Fund Adviser | | | — | | | — | | | — | | | — | | | — |
Daily variation margin on futures contracts | | | 478 | | | 387 | | | 44 | | | 498 | | | — |
Prepaid expenses | | | 5 | | | 2 | | | 4 | | | 6 | | | 4 |
Interest rate swap contracts, at market value**** | | | — | | | — | | | — | | | 6,301 | | | — |
Credit default swap contracts, at market value***** | | | — | | | — | | | — | | | 1,775 | | | — |
| | | | | | | | | | | | | | | |
Total assets | | | 353,772 | | | 175,677 | | | 287,873 | | | 453,296 | | | 406,979 |
| | | | | | | | | | | | | | | |
| | | | | | | | | | | | | | | |
Liabilities | | | | | | | | | | | | | | | |
Payables: | | | | | | | | | | | | | | | |
Due to Custodian or Broker | | | — | | | — | | | — | | | 1,000 | | | — |
Investments purchased | | | 1,822 | | | 1,256 | | | 4,386 | | | 99,942 | | | 3,150 |
Fund shares redeemed | | | 73 | | | 143 | | | 184 | | | 42 | | | 54 |
Accrued fees to affiliates | | | 188 | | | 65 | | | 177 | | | 146 | | | 204 |
Other accrued expenses | | | 58 | | | 50 | | | 114 | | | 68 | | | 90 |
Daily variation margin on futures contracts | | | — | | | — | | | 101 | | | 288 | | | — |
Other payable | | | — | | | — | | | — | | | 1,714 | | | — |
Unrealized depreciation on foreign currency exchange contracts | | | — | | | — | | | 761 | | | 367 | | | — |
Options written, at market value** | | | — | | | — | | | — | | | 2,022 | | | — |
Payable upon return of securities loaned | | | 53,420 | | | 51,075 | | | 26,400 | | | 17,155 | | | 100,065 |
Interest rate swap contracts, at market value**** | | | — | | | — | | | — | | | 5,787 | | | — |
Credit default swap contracts, at market value***** | | | — | | | — | | | — | | | 5,656 | | | — |
| | | | | | | | | | | | | | | |
Total liabilities | | | 55,561 | | | 52,589 | | | 32,123 | | | 134,187 | | | 103,563 |
| | | | | | | | | | | | | | | |
| | | | | | | | | | | | | | | |
Net Assets | | $ | 298,211 | | $ | 123,088 | | $ | 255,750 | | $ | 319,109 | | $ | 303,416 |
| | | | | | | | | | | | | | | |
See accompanying notes which are an integral part of the financial statements.
| | |
| Statements of Assets and Liabilities | | 89 |
Russell Investment Funds
Statements of Assets and Liabilities, continued — December 31, 2008
| | | | | | | | | | | | | | | | | | | | |
| | | Multi-Style Equity
Fund | | | Aggressive Equity
Fund | | | Non-U.S.
Fund | | | Core Bond
Fund | | | Real Estate
Securities Fund | |
| | | | | | | | | | | | | | | | | | | | |
| Net Assets Consist of: | | | | | | | | | | | | | | | | | | | | |
Undistributed (overdistributed) net investment income | | $ | 1,690 | | | $ | — | | | $ | 1,726 | | | $ | 2,838 | | | $ | 4,013 | |
Accumulated net realized gain (loss) | | | (85,181 | ) | | | (57,214 | ) | | | (84,838 | ) | | | 521 | | | | (81,468 | ) |
Unrealized appreciation (depreciation) on: | | | | | | | | | | | | | | | | | | | | |
Investments | | | (78,702 | ) | | | (35,984 | ) | | | (61,265 | ) | | | (35,594 | ) | | | (47,180 | ) |
Futures contracts | | | 454 | | | | 643 | | | | 513 | | | | 2,348 | | | | — | |
Options written | | | — | | | | — | | | | — | | | | (1,442 | ) | | | — | |
Credit default swap contracts | | | — | | | | — | | | | — | | | | (1,721 | ) | | | — | |
Interest rate swap contracts | | | — | | | | — | | | | — | | | | 53 | | | | — | |
Foreign currency-related transactions | | | — | | | | — | | | | 1,511 | | | | (186 | ) | | | (4 | ) |
Shares of beneficial interest | | | 331 | | | | 171 | | | | 342 | | | | 342 | | | | 326 | |
Additional paid-in capital | | | 459,619 | | | | 215,472 | | | | 397,761 | | | | 351,950 | | | | 427,729 | |
| | | | | | | | | | | | | | | | | | | | |
Net Assets | | $ | 298,211 | | | $ | 123,088 | | | $ | 255,750 | | | $ | 319,109 | | | $ | 303,416 | |
| | | | | | | | | | | | | | | | | | | | |
Net Asset Value, offering and redemption price per share: | | | | | | | | | | | | | | | | | | | | |
Net asset value per share****** | | $ | 9.00 | | | $ | 7.18 | | | $ | 7.48 | | | $ | 9.33 | | | $ | 9.30 | |
Net assets | | $ | 298,210,893 | | | $ | 123,087,924 | | | $ | 255,749,546 | | | $ | 319,108,827 | | | $ | 303,416,057 | |
Shares outstanding ($.01 par value) | | | 33,132,830 | | | | 17,135,790 | | | | 34,170,535 | | | | 34,187,141 | | | | 32,641,688 | |
Amounts in thousands | | | | | | | | | | | | | | | | | | | | |
* Foreign currency holdings - cost | | $ | — | | | $ | — | | | $ | 3,199 | | | $ | 618 | | | $ | 138 | |
** Premiums received on options written | | $ | — | | | $ | — | | | $ | — | | | $ | 580 | | | $ | — | |
*** Securities on loan included in investments | | $ | 53,455 | | | $ | 51,291 | | | $ | 25,168 | | | $ | 16,586 | | | $ | 101,844 | |
**** Interest rate swap contracts - premiums paid (received) | | $ | — | | | $ | — | | | $ | — | | | $ | 461 | | | $ | — | |
***** Credit default swap contracts - premiums paid (received) | | $ | — | | | $ | — | | | $ | — | | | $ | (2,160 | ) | | $ | — | |
****** Net asset value per share equals net assets divided by shares of beneficial interest outstanding. | | | | | | | | | | | | | | | | | | | | |
See accompanying notes which are an integral part of the financial statements.
| | |
| 90 | | Statements of Assets and Liabilities |
Russell Investment Funds
Statements of Operations — For the Fiscal Year Ended December 31, 2008
| | | | | | | | | | | | | | | | | | | | |
| Amounts in thousands | | Multi-Style Equity
Fund | | | Aggressive Equity
Fund | | | Non-U.S.
Fund | | | Core Bond
Fund | | | Real Estate
Securities Fund | |
| | | | | | | | | | | | | | | | | | | | |
Investment Income | | | | | | | | | | | | | | | | | | | | |
Dividends | | $ | 8,002 | | | $ | 2,495 | | | $ | 10,612 | | | $ | 111 | | | $ | 14,749 | |
Dividends from affiliated money market funds | | | 632 | | | | 210 | | | | 802 | | | | 529 | | | | 435 | |
Interest | | | 19 | | | | 13 | | | | 27 | | | | 18,249 | | | | — | |
Securities lending income | | | 940 | | | | 761 | | | | 703 | | | | 222 | | | | 994 | |
Less foreign taxes withheld | | | — | | | | — | | | | (1,003 | ) | | | — | | | | — | |
| | | | | | | | | | | | | | | | | | | | |
Total investment income | | | 9,593 | | | | 3,479 | | | | 11,141 | | | | 19,111 | | | | 16,178 | |
| | | | | | | | | | | | | | | | | | | | |
| | | | | | | | | | | | | | | | | | | | |
Expenses | | | | | | | | | | | | | | | | | | | | |
Advisory fees | | | 2,954 | | | | 1,653 | | | | 3,166 | | | | 1,946 | | | | 3,515 | |
Administrative fees | | | 202 | | | | 92 | | | | 176 | | | | 177 | | | | 220 | |
Custodian fees | | | 292 | | | | 338 | | | | 784 | | | | 490 | | | | 327 | |
Transfer agent fees | | | 18 | | | | 8 | | | | 15 | | | | 16 | | | | 19 | |
Professional fees | | | 72 | | | | 45 | | | | 68 | | | | 72 | | | | 71 | |
Trustees’ fees | | | 8 | | | | 4 | | | | 7 | | | | 7 | | | | 9 | |
Printing fees | | | 10 | | | | 6 | | | | 7 | | | | 4 | | | | 9 | |
Miscellaneous | | | 31 | | | | 17 | | | | 38 | | | | 26 | | | | 38 | |
| | | | | | | | | | | | | | | | | | | | |
Expenses before reductions | | | 3,587 | | | | 2,163 | | | | 4,261 | | | | 2,738 | | | | 4,208 | |
Expense reductions | | | (68 | ) | | | (235 | ) | | | (215 | ) | | | (261 | ) | | | — | |
| | | | | | | | | | | | | | | | | | | | |
Net expenses | | | 3,519 | | | | 1,928 | | | | 4,046 | | | | 2,477 | | | | 4,208 | |
| | | | | | | | | | | | | | | | | | | | |
Net investment income (loss) | | | 6,074 | | | | 1,551 | | | | 7,095 | | | | 16,634 | | | | 11,970 | |
| | | | | | | | | | | | | | | | | | | | |
| | | | | | | | | | | | | | | | | | | | |
Net Realized and Unrealized Gain (Loss) | | | | | | | | | | | | | | | | | |
Net realized gain (loss) on: | | | | | | | | | | | | | | | | | | | | |
Investments | | | (67,847 | ) | | | (50,759 | ) | | | (63,112 | ) | | | 2,785 | | | | (72,517 | ) |
Futures contracts | | | (13,376 | ) | | | (4,414 | ) | | | (19,413 | ) | | | 7,184 | | | | — | |
Options written | | | — | | | | — | | | | (845 | ) | | | (2,146 | ) | | | — | |
Credit default swap contracts | | | — | | | | — | | | | — | | | | 66 | | | | — | |
Index swap contracts | | | — | | | | — | | | | (81 | ) | | | (282 | ) | | | — | |
Interest rate swap contracts | | | — | | | | — | | | | — | | | | 431 | | | | — | |
Foreign currency-related transactions | | | — | | | | — | | | | (4,186 | ) | | | 435 | | | | (54 | ) |
| | | | | | | | | | | | | | | | | | | | |
Net realized gain (loss) | | | (81,223 | ) | | | (55,173 | ) | | | (87,637 | ) | | | 8,473 | | | | (72,571 | ) |
| | | | | | | | | | | | | | | | | | | | |
Net change in unrealized appreciation (depreciation) on: | | | | | | | | | | | | | | | | | | | | |
Investments | | | (125,852 | ) | | | (46,331 | ) | | | (108,497 | ) | | | (37,544 | ) | | | (115,572 | ) |
Futures contracts | | | 752 | | | | 673 | | | | 888 | | | | (245 | ) | | | — | |
Options written | | | — | | | | — | | | | 2 | | | | (710 | ) | | | — | |
Credit default swap contracts | | | — | | | | — | | | | — | | | | (998 | ) | | | — | |
Index swap contracts | | | — | | | | — | | | | 5 | | | | (51 | ) | | | — | |
Interest rate swap contracts | | | — | | | | — | | | | — | | | | (569 | ) | | | — | |
Foreign currency-related transactions | | | — | | | | — | | | | 1,213 | | | | (396 | ) | | | (6 | ) |
| | | | | | | | | | | | | | | | | | | | |
Net change in unrealized appreciation (depreciation) | | | (125,100 | ) | | | (45,658 | ) | | | (106,389 | ) | | | (40,513 | ) | | | (115,578 | ) |
| | | | | | | | | | | | | | | | | | | | |
Net realized and unrealized gain (loss) | | | (206,323 | ) | | | (100,831 | ) | | | (194,026 | ) | | | (32,040 | ) | | | (188,149 | ) |
| | | | | | | | | | | | | | | | | | | | |
Net Increase (Decrease) in Net Assets from Operations | | $ | (200,249 | ) | | $ | (99,280 | ) | | $ | (186,931 | ) | | $ | (15,406 | ) | | $ | (176,179 | ) |
| | | | | | | | | | | | | | | | | | | | |
See accompanying notes which are an integral part of the financial statements.
| | |
| Statements of Operations | | 91 |
Russell Investment Funds
Statements of Changes in Net Assets — For the Fiscal Years Ended December 31,
| | | | | | | | | | | | | | | | |
| | | Multi-Style Equity
Fund | | | Aggressive Equity
Fund | |
| Amounts in thousands | | 2008 | | | 2007 | | | 2008 | | | 2007 | |
| | | | | | | | | | | | | | | | |
Increase (Decrease) in Net Assets | | | | | | | | | | | | | | | | |
| | | | |
Operations | | | | | | | | | | | | | | | | |
Net investment income (loss) | | $ | 6,074 | | | $ | 4,740 | | | $ | 1,551 | | | $ | 925 | |
Net realized gain (loss) | | | (81,223 | ) | | | 42,430 | | | | (55,173 | ) | | | 19,170 | |
Net change in unrealized appreciation (depreciation) | | | (125,100 | ) | | | (3,082 | ) | | | (45,658 | ) | | | (12,030 | ) |
| | | | | | | | | | | | | | | | |
Net increase (decrease) in net assets from operations | | | (200,249 | ) | | | 44,088 | | | | (99,280 | ) | | | 8,065 | |
| | | | | | | | | | | | | | | | |
| | | | |
Distributions | | | | | | | | | | | | | | | | |
From net investment income | | | (5,806 | ) | | | (4,459 | ) | | | (1,578 | ) | | | (866 | ) |
From net realized gain | | | (3,972 | ) | | | (19,120 | ) | | | (44 | ) | | | (29,590 | ) |
| | | | | | | | | | | | | | | | |
Net decrease in net assets from distributions | | | (9,778 | ) | | | (23,579 | ) | | | (1,622 | ) | | | (30,456 | ) |
| | | | | | | | | | | | | | | | |
| | | | |
Share Transactions | | | | | | | | | | | | | | | | |
Net increase (decrease) in net assets from share transactions | | | 28,316 | | | | 41,906 | | | | (4,937 | ) | | | 27,672 | |
| | | | | | | | | | | | | | | | |
| | | | |
Total Net Increase (Decrease) in Net Assets | | | (181,711 | ) | | | 62,415 | | | | (105,839 | ) | | | 5,281 | |
| | | | |
Net Assets | | | | | | | | | | | | | | | | |
Beginning of period | | | 479,922 | | | | 417,507 | | | | 228,927 | | | | 223,646 | |
| | | | | | | | | | | | | | | | |
End of period | | $ | 298,211 | | | $ | 479,922 | | | $ | 123,088 | | | $ | 228,927 | |
| | | | | | | | | | | | | | | | |
Undistributed (overdistributed) net investment income included in net assets | | $ | 1,690 | | | $ | 1,423 | | | $ | — | | | $ | — | |
See accompanying notes which are an integral part of the financial statements.
| | |
| 92 | | Statements of Changes in Net Assets |
| | | | | | | | | | | | | | | | | | | | | | |
Non-U.S.
Fund | | | Core Bond
Fund | | | Real Estate
Securities Fund | |
| 2008 | | | 2007 | | | 2008 | | | 2007 | | | 2008 | | | 2007 | |
| | | | | | | | | | | | | | | | | | | | | | |
| | | | | | | | | | | | | | | | | | | | | | |
| | | | | |
| | | | | | | | | | | | | | | | | | | | | | |
| $ | 7,095 | | | $ | 6,991 | | | $ | 16,634 | | | $ | 15,000 | | | $ | 11,970 | | | $ | 10,443 | |
| | (87,637 | ) | | | 47,882 | | | | 8,473 | | | | 3,830 | | | | (72,571 | ) | | | 51,349 | |
| | (106,389 | ) | | | (16,201 | ) | | | (40,513 | ) | | | 3,043 | | | | (115,578 | ) | | | (159,351 | ) |
| | | | | | | | | | | | | | | | | | | | | | | |
| | (186,931 | ) | | | 38,672 | | | | (15,406 | ) | | | 21,873 | | | | (176,179 | ) | | | (97,559 | ) |
| | | | | | | | | | | | | | | | | | | | | | | |
| | | | | |
| | | | | | | | | | | | | | | | | | | | | | |
| | — | | | | (10,855 | ) | | | (14,176 | ) | | | (16,240 | ) | | | (8,443 | ) | | | (13,544 | ) |
| | (3,345 | ) | | | (75,619 | ) | | | (6,979 | ) | | | — | | | | — | | | | (65,161 | ) |
| | | | | | | | | | | | | | | | | | | | | | | |
| | (3,345 | ) | | | (86,474 | ) | | | (21,155 | ) | | | (16,240 | ) | | | (8,443 | ) | | | (78,705 | ) |
| | | | | | | | | | | | | | | | | | | | | | | |
| | | | | |
| | | | | | | | | | | | | | | | | | | | | | |
| | 14,340 | | | | 109,604 | | | | 9,603 | | | | 74,651 | | | | (771 | ) | | | 39,596 | |
| | | | | | | | | | | | | | | | | | | | | | | |
| | | | | |
| | (175,936 | ) | | | 61,802 | | | | (26,958 | ) | | | 80,284 | | | | (185,393 | ) | | | (136,668 | ) |
| | | | | |
| | | | | | | | | | | | | | | | | | | | | | |
| | 431,686 | | | | 369,884 | | | | 346,067 | | | | 265,783 | | | | 488,809 | | | | 625,477 | |
| | | | | | | | | | | | | | | | | | | | | | | |
| $ | 255,750 | | | $ | 431,686 | | | $ | 319,109 | | | $ | 346,067 | | | $ | 303,416 | | | $ | 488,809 | |
| | | | | | | | | | | | | | | | | | | | | | | |
$ |
1,726 |
| | $ | (1,232 | ) | | $ | 2,838 | | | $ | 14 | | | $ | 4,013 | | | $ | (62 | ) |
See accompanying notes which are an integral part of the financial statements.
| | |
| Statements of Changes in Net Assets | | 93 |
Russell Investment Funds
Financial Highlights — For the Fiscal Years Ended
For a Share Outstanding Throughout Each Period.
| | | | | | | | | | | | | | | | | | | |
| | |
$
Net Asset Value,
Beginning of
Period | | $
Net
Investment
Income (Loss)(a) | | $
Net Realized
and Unrealized
Gain (Loss) | | | $
Total Income
(Loss) from
Operations | | | $
Distributions
from Net
Investment Income | | | $
Distributions
from Net
Realized Gain | | | $
Total
Distributions | |
Multi-Style Equity Fund | | | | | | | | | | | | | | | | | |
December 31, 2008 | | 15.65 | | .19 | | (6.52 | ) | | (6.33 | ) | | (.19 | ) | | (.13 | ) | | (.32 | ) |
December 31, 2007 | | 14.93 | | .16 | | 1.37 | | | 1.53 | | | (.16 | ) | | (.65 | ) | | (.81 | ) |
December 31, 2006 | | 13.37 | | .14 | | 1.55 | | | 1.69 | | | (.13 | ) | | — | | | (.13 | ) |
December 31, 2005 | | 12.60 | | .12 | | .79 | | | .91 | | | (.14 | ) | | — | | | (.14 | ) |
December 31, 2004 | | 11.56 | | .11 | | 1.02 | | | 1.13 | | | (.09 | ) | | — | | | (.09 | ) |
Aggressive Equity Fund | | | | | | | | | | | | | | | | | |
December 31, 2008 | | 12.99 | | .09 | | (5.81 | ) | | (5.72 | ) | | (.09 | ) | | — | (c) | | (.09 | ) |
December 31, 2007 | | 14.45 | | .06 | | .40 | | | .46 | | | (.05 | ) | | (1.87 | ) | | (1.92 | ) |
December 31, 2006 | | 14.40 | | .03 | | 2.10 | | | 2.13 | | | (.03 | ) | | (2.05 | ) | | (2.08 | ) |
December 31, 2005 | | 14.90 | | .03 | | .90 | | | .93 | | | (.03 | ) | | (1.40 | ) | | (1.43 | ) |
December 31, 2004 | | 13.47 | | .02 | | 1.95 | | | 1.97 | | | (.02 | ) | | (.52 | ) | | (.54 | ) |
Non-U.S. Fund | | | | | | | | | | | | | | | | | |
December 31, 2008 | | 13.20 | | .21 | | (5.83 | ) | | (5.62 | ) | | —
|
| | (.10 | ) | | (.10 | ) |
December 31, 2007 | | 15.01 | | .25 | | 1.14 | | | 1.39 | | | (.38 | ) | | (2.82 | ) | | (3.20 | ) |
December 31, 2006 | | 12.68 | | .23 | | 2.75 | | | 2.98 | | | (.35 | ) | | (.30 | ) | | (.65 | ) |
December 31, 2005 | | 11.33 | | .16 | | 1.38 | | | 1.54 | | | (.19 | ) | | — | | | (.19 | ) |
December 31, 2004 | | 9.76 | | .11 | | 1.66 | | | 1.77 | | | (.20 | ) | | — | | | (.20 | ) |
Core Bond Fund | | | | | | | | | | | | | | | | | |
December 31, 2008 | | 10.32 | | .47 | | (.86 | ) | | (.39 | ) | | (.39 | ) | | (.21 | ) | | (.60 | ) |
December 31, 2007 | | 10.14 | | .51 | | .20 | | | .71 | | | (.53 | ) | | — | | | (.53 | ) |
December 31, 2006 | | 10.23 | | .45 | | (.08 | ) | | .37 | | | (.46 | ) | | — | | | (.46 | ) |
December 31, 2005 | | 10.50 | | .38 | | (.17 | ) | | .21 | | | (.37 | ) | | (.11 | ) | | (.48 | ) |
December 31, 2004 | | 10.47 | | .24 | | .24 | | | .48 | | | (.26 | ) | | (.19 | ) | | (.45 | ) |
Real Estate Securities Fund | | | | | | | | | | | | | | | |
December 31, 2008 | | 15.22 | | .38 | | (6.03 | ) | | (5.65 | ) | | (.27 | ) | | — | | | (.27 | ) |
December 31, 2007 | | 21.34 | | .35 | | (3.68 | ) | | (3.33 | ) | | (.47 | ) | | (2.32 | ) | | (2.79 | ) |
December 31, 2006 | | 17.28 | | .37 | | 5.72 | | | 6.09 | | | (.39 | ) | | (1.64 | ) | | (2.03 | ) |
December 31, 2005 | | 17.09 | | .32 | | 1.82 | | | 2.14 | | | (.37 | ) | | (1.58 | ) | | (1.95 | ) |
December 31, 2004 | | 13.71 | | .36 | | 4.33 | | | 4.69 | | | (.36 | ) | | (.95 | ) | | (1.31 | ) |
See accompanying notes which are an integral part of the financial statements.
| | | | | | | | | | | | | |
$
Net Asset Value,
End of
Period | | %
Total
Return | | | $
Net Assets,
End of Period
(000) | | %
Ratio of Expenses
to Average
Net Assets,
Net(b) | | %
Ratio of Expenses
to Average
Net Assets,
Gross | | %
Ratio of Net
Investment Income
to Average
Net Assets(b) | | %
Portfolio
Turnover Rate |
| | | | | | | | | | | | | |
| 9.00 | | (41.15 | ) | | 298,211 | | .87 | | .89 | | 1.50 | | 135 |
| 15.65 | | 10.36 | | | 479,922 | | .87 | | .87 | | 1.04 | | 136 |
| 14.93 | | 12.75 | | | 417,507 | | .87 | | .87 | | 1.03 | | 128 |
| 13.37 | | 7.27 | | | 349,659 | | .83 | | .87 | | .94 | | 130 |
| 12.60 | | 9.81 | | | 332,759 | | .87 | | .88 | | .96 | | 123 |
| | | | | | | | | | | | | |
| 7.18 | | (44.16 | ) | | 123,088 | | 1.05 | | 1.18 | | .84 | | 161 |
| 12.99 | | 3.42 | | | 228,927 | | 1.05 | | 1.13 | | .39 | | 180 |
| 14.45 | | 14.79 | | | 223,646 | | 1.05 | | 1.12 | | .16 | | 184 |
| 14.40 | | 6.36 | | | 204,292 | | .99 | | 1.13 | | .21 | | 130 |
| 14.90 | | 14.73 | | | 195,583 | | 1.05 | | 1.17 | | .17 | | 150 |
| | | | | | | | | | | | | |
| 7.48 | | (42.79 | ) | | 255,750 | | 1.15 | | 1.21 | | 2.01 | | 123 |
| 13.20 | | 10.12 | | | 431,686 | | 1.15 | | 1.18 | | 1.70 | | 106 |
| 15.01 | | 23.64 | | | 369,884 | | 1.15 | | 1.21 | | 1.64 | | 111 |
| 12.68 | | 13.69 | | | 302,261 | | 1.12 | | 1.26 | | 1.41 | | 88 |
| 11.33 | | 18.30 | | | 258,766 | | 1.15 | | 1.28 | | 1.11 | | 73 |
| | | | | | | | | | | | | |
| 9.33 | | (3.87 | ) | | 319,109 | | .70 | | .77 | | 4.70 | | 164 |
| 10.32 | | 7.24 | | | 346,067 | | .70 | | .78 | | 5.04 | | 965 |
| 10.14 | | 3.72 | | | 265,783 | | .70 | | .73 | | 4.40 | | 453 |
| 10.23 | | 2.01 | | | 216,774 | | .70 | | .72 | | 3.70 | | 193 |
| 10.50 | | 4.66 | | | 175,851 | | .70 | | .73 | | 2.41 | | 216 |
| | | | | | | | | | | | | |
| 9.30 | | (37.76 | ) | | 303,416 | | .96 | | .96 | | 2.72 | | 71 |
| 15.22 | | (15.86 | ) | | 488,809 | | .92 | | .92 | | 1.75 | | 77 |
| 21.34 | | 35.84 | | | 625,477 | | .90 | | .91 | | 1.86 | | 53 |
| 17.28 | | 12.96 | | | 443,092 | | .91 | | .91 | | 1.86 | | 64 |
| 17.09 | | 34.88 | | | 379,733 | | .92 | | .92 | | 2.43 | | 47 |
See accompanying notes which are an integral part of the financial statements.
Russell Investment Funds
Notes to Financial Highlights — December 31, 2008
| (a) | Average month-end shares outstanding were used for this calculation. |
| (b) | May reflect amounts waived and/or reimbursed by RIMCo and/or RFSC custody credit arrangements. |
| (c) | Less than $.01 per share. |
See accompanying notes which are an integral part of the financial statements.
| | |
| 96 | | Notes to Financial Highlights |
Russell Investment Funds
Notes to Financial Statements — December 31, 2008
Russell Investment Funds (the “Investment Company” or “RIF”) is a series investment company with nine different investment portfolios referred to as Funds. These financial statements report on five of these Funds (each a “Fund” and collectively the “Funds”). The Investment Company provides the investment base for one or more variable insurance products issued by one or more insurance companies. These Funds are offered at net asset value to qualified insurance company separate accounts offering variable insurance products. The Investment Company is registered under the Investment Company Act of 1940, as amended, as an open-end management investment company. It is organized and operates as a Massachusetts business trust under an amended and restated master trust agreement dated October 1, 2008. The Investment Company’s master trust agreement permits the Board of Trustees (the “Board”) to issue an unlimited number of shares of beneficial interest.
Russell Investment Company (“RIMCo”) is the Funds’ adviser and Russell Fund Services Company (“RFSC”), a wholly-owned subsidiary of RIMCo, is the Funds’ administrator and transfer agent.
| 2. | | Significant Accounting Policies |
The Funds’ financial statements are prepared in accordance with accounting principles generally accepted in the United States of America (“GAAP”) which require the use of management estimates and assumptions at the date of the financial statements. Actual results could differ from those estimates. The following is a summary of the significant accounting policies consistently followed by each Fund in the preparation of its financial statements.
Security Valuation
The Funds value portfolio securities according to Board-approved securities valuation procedures and pricing services which include market value procedures, fair value procedures and a description of the pricing services used by the Funds. Debt obligation securities maturing within 60 days of the time of purchase are priced using the amortized cost method of valuation, unless the Board determines that amortized cost does not represent market value of short-term debt obligations. The Board has delegated the responsibility for administration of the securities valuation procedures to RFSC.
Ordinarily, the Funds value each portfolio security based on market quotations provided by pricing services or alternative pricing services or dealers (when permitted by the market value procedures). Generally, Fund securities are valued at the close of the market on which they are traded as follows:
| | • | | U.S. listed equities, equity and fixed income options and Rights/Warrants: Last sale price; last bid price if no last sale price. |
| | • | | U.S. over-the-counter equities: Official closing price; last bid price if no closing price. |
| | • | | Listed ADRs/GDRs: Last sale price; last bid price if no last sale price. |
| | • | | Municipal bonds, U.S. bonds, Eurobonds/foreign bonds: Evaluated bid price; broker quote if no evaluated bid price. |
| | • | | Futures: Settlement price. |
| | • | | Bank loans and forwards: Mean between bid and asking price. |
| | • | | Investments in other mutual funds are valued at their net asset value per share, calculated at 4 p.m. Eastern time or as of the close of the New York Stock Exchange, whichever is earlier; |
| | • | | The value of swap agreements is equal to the Funds’ obligation (or rights) under swap contracts which will generally be equal to the net amounts to be paid or received under the contracts based upon the relative values of the positions held by each party to the contracts. |
| | • | | Equity securities traded on a national foreign securities exchange or a foreign over the counter market are valued on the basis of the official closing price, or lacking the official closing price, at the last sale price of the primary exchange on which the security is traded. |
If market quotations are not readily available for a security or if subsequent events suggest that a market quotation is not reliable, the Funds will use the security’s fair value, as determined in accordance with the fair value procedures. The effect of fair value pricing is that securities may not be priced on the basis of quotations from the primary market in which they are traded, but rather may be priced by another method that the Board believes reflects fair value. The fair value procedures may involve subjective judgments as to the fair value of securities. The use of fair value pricing by a Fund may cause the net asset value of its shares to differ significantly from the net asset value that would be calculated using normal pricing methods. Fair value pricing could also cause discrepancies between the daily movement of the value of Fund shares and the daily movement of the benchmark index if the index is valued using another pricing method.
This policy is intended to assure that the Funds’ net asset values fairly reflect security values as of the time of pricing. Events or circumstances affecting the values of Fund securities that occur between the closing of the principal markets on which they trade
| | |
| Notes to Financial Statements | | 97 |
Russell Investment Funds
Notes to Financial Statements, continued — December 31, 2008
and the time the net asset value of Fund shares is determined may be reflected in the calculation of net asset values for each applicable Fund when the Funds deem that the particular event or circumstance would materially affect such Fund’s net asset value. Funds that invest primarily in frequently traded exchange-listed securities will use fair value pricing in limited circumstances since reliable market quotations will often be readily available. Funds that invest in foreign securities are likely to use fair value pricing more often since significant events may occur between the close of foreign markets and the time of pricing which would trigger fair value pricing of the foreign securities. Funds that invest in low-rated debt securities are also likely to use fair value pricing more often since the markets in which such securities are traded are generally thinner, more limited and less active than those for higher rated securities. Examples of events that could trigger fair value pricing of one or more securities are: a material market movement of the U.S. securities market (defined in the fair value procedures as the movement by a single major U.S. Index greater than a certain percentage) or other significant event; foreign market holidays if on a daily basis, Fund exposure exceeds 20% in aggregate (all closed markets combined); a company development; a natural disaster; or an armed conflict.
Because foreign securities can trade on non-business days, the net asset value of a Fund’s portfolio that includes foreign securities may change on days when shareholders will not be able to purchase or redeem fund shares.
The Funds adopted Financial Accounting Standards Board (“FASB”) Statement of Financial Accounting Standards No. 157, Fair Value Measurements (“SFAS 157”), effective January 1, 2008. In accordance with SFAS 157, fair value is defined as the price that the Funds would receive upon selling an investment in a timely transaction to an independent buyer in the principal or most advantageous market of the investment. SFAS 157 established a three-tier hierarchy to maximize the use of observable market data and minimize the use of unobservable inputs and to establish classification of fair value measurements for disclosure purposes. Inputs refer broadly to the assumptions that market participants would use in pricing the asset, including assumptions about risk, for example, the risk inherent in a particular valuation technique used to measure fair value including a pricing model and/or risk inherent in the inputs to the valuation technique. Inputs may be observable or unobservable. Observable inputs are inputs that reflect the assumptions market participants would use in pricing the asset or liability developed based on market data obtained from sources independent of the reporting entity. Unobservable inputs are inputs that reflect the reporting entity’s own assumptions about the assumptions market participants would use in pricing the asset or liability developed based on the best information available in the circumstances.
The three-tier hierarchy of inputs is summarized in the three broad levels listed below.
| | • | | Level 1 — quoted prices in active markets for identical investments |
| | • | | Level 2 — other significant observable inputs (including quoted prices for similar investments, interest rates, prepayment speeds, credit risk, etc.) |
| | • | | Level 3 — significant unobservable inputs (including the Fund’s own assumptions in determining the fair value of investments) |
Inputs used in valuing the Funds’ investments for the period ended December 31, 2008 were as follows:
| | | | | | | | | | | | | | | | | | | | | | | | | | | | | | | |
| | | Multi-Style Equity Fund | | Aggressive Equity Fund | | Non-U.S. Fund | | Core Bond Fund | | | Real Estate Securities Fund |
| | | Investments in
Securities | | Other
Financial
Instruments* | | Investments in
Securities | | Other
Financial
Instruments* | | Investments in
Securities | | Other
Financial
Instruments* | | Investments in
Securities | | Other
Financial
Instruments* | | | Investments in
Securities | | Other
Financial
Instruments* |
Level 1 | | $ | 296,447,366 | | $ | 453,685 | | $ | 123,627,485 | | $ | — | | $ | 35,318,532 | | $ | 517,979 | | $ | 18,660,205 | | $ | 2,323,435 | | | $ | 307,683,502 | | $ | 1,186 |
Level 2 | | | 50,487,111 | | | — | | | 48,270,567 | | | — | | | 234,621,187 | | | 1,596,563 | | | 394,433,028 | | | (3,834,515 | ) | | | 94,573,469 | | | — |
Level 3 | | | — | | | — | | | 427,560 | | | 643,365 | | | 11,611 | | | — | | | 3,687,314 | | | — | | | | — | | | — |
| | | | | | | | | | | | | | | | | | | | | | | | | | | | | | | |
| | $ | 346,934,477 | | $ | 453,685 | | $ | 172,325,612 | | $ | 643,365 | | $ | 269,951,330 | | $ | 2,114,542 | | $ | 416,780,547 | | $ | (1,511,080 | ) | | $ | 402,256,971 | | $ | 1,186 |
| | | | | | | | | | | | | | | | | | | | | | | | | | | | | | | |
| | * | Other financial instruments not reflected in the Schedule of Investments, such as futures, forwards and swap contracts, which are valued at the unrealized appreciation/depreciation on the instruments. |
A reconciliation of investments in which significant unobservable inputs (Level 3) were used in determining a value for the period ending December 31, 2008 were as follows:
| | | | | | | | | | | | | | | | |
| | | Multi-Style
Equity Fund | | | Aggressive
Equity Fund | | | Non-U.S.
Fund | | | Core Bond
Fund | |
| | | | | | | | | | | | | | | | |
Balance as of 01/01/08 | | $ | 429 | | | $ | 469,884 | | | $ | — | | | $ | 3,137,866 | |
Accrued discounts/(premiums) | | | — | | | | — | | | | — | | | | 8,834 | |
Realized gain/(loss) | | | — | | | | (14,639 | ) | | | (54,802 | ) | | | 246,309 | |
Net change in unrealized appreciation/(depreciation) from investments still held as of 12/31/08 | | | (429 | ) | | | 601,041 | | | | 26,303 | | | | (1,492,869 | ) |
Net purchases (sales) | | | — | | | | 14,639 | | | | 40,110 | | | | 2,734,716 | |
Net transfers in and/or out of Level 3 | | | — | | | | — | | | | — | | | | (947,542 | ) |
| | | | | | | | | | | | | | | | |
Balance as of 12/31/08 | | $ | — | | | $ | 1,070,925 | | | $ | 11,611 | | | $ | 3,687,314 | |
| | | | | | | | | | | | | | | | |
| | |
| 98 | | Notes to Financial Statements |
Russell Investment Funds
Notes to Financial Statements, continued — December 31, 2008
In March 2008, the Financial Accounting Standards Board (“FASB”) issued Statement of Financial Accounting Standards No. 161, “Disclosures about Derivative Instruments and Hedging Activities” (“SFAS 161”). SFAS 161 is effective for fiscal years or interim periods beginning after November 15, 2008. SFAS 161 requires enhanced disclosures about the Funds’ derivative and hedging activities. Management is currently evaluating the impact the adoption of SFAS 161 will have on the Funds’ financial statements disclosures.
Investment Transactions
Investment transactions are recorded on a trade date basis. Realized gains and losses from securities transactions, if any, are recorded on the basis of specific identified cost incurred by each money manager within a particular Fund.
Investment Income
Dividend income is recorded net of applicable withholding taxes on the ex-dividend date, except that certain dividends from foreign securities are recorded as soon thereafter as the Funds are informed of the ex-dividend date. Interest income is recorded daily on the accrual basis. The Core Bond Fund classifies gains and losses realized on prepayments received on mortgage-backed securities as part of interest income. All premiums and discounts, including original issue discounts, are amortized/accreted using the interest method.
Federal Income Taxes
Since the Investment Company is a Massachusetts business trust, each Fund is a separate corporate taxpayer and determines its net investment income and capital gains (or losses) and the amounts to be distributed to each Fund’s shareholders without regard to the income and capital gains (or losses) of the other Funds.
It is each Fund’s intention to qualify as a regulated investment company and distribute all of its taxable income and capital gains. Therefore, no federal income tax provision is required for the Funds.
In accordance with the provisions set forth in the FASB issued Interpretation No. 48, “Accounting for Uncertainty in Income Taxes, an Interpretation of FASB Statement 109” (“FIN 48”), management has reviewed the Funds’ tax positions for all open tax years, and concluded that adoption had no effect on the Funds’ financial position or results of operations. At December 31, 2008, the Funds have recorded no liabilities for net unrecognized tax benefits relating to uncertain income tax positions they have taken or expect to take in future tax returns.
Each Fund files a U. S. tax return. While the statute of limitations remains open to examine the Funds’ U.S. tax returns filed for the fiscal years ending December 31, 2005 through December 31, 2007, no examinations are in progress or anticipated at this time. The Funds are not aware of any tax positions for which it is reasonably possible that the total amounts of unrecognized tax benefits will significantly change in the next twelve months.
Dividends and Distributions to Shareholders
For all Funds, income and capital gain distributions, if any, are recorded on the ex-dividend date. Income distributions are generally declared and paid quarterly, except for the Non-U.S. Fund, which generally declares and pays income distributions annually. Capital gain distributions are generally declared and paid annually. An additional distribution may be paid by the Funds to avoid imposition of federal income and excise tax on any remaining undistributed capital gains and net investment income.
The timing and characterization of certain income and capital gain distributions are determined in accordance with federal tax regulations which may differ from GAAP. As a result, net investment income and net realized gain (or loss) from investment and foreign currency-related transactions for a reporting period may differ significantly from distributions during such period. The differences between tax regulations and GAAP relate primarily to investments in options, futures, forward contracts, swap contracts, passive foreign investment companies, foreign-denominated investments, mortgage-backed securities, certain securities sold at a loss and capital loss carryforwards.
Expenses
The Funds will pay their own expenses other than those expressly assumed by RIMCo or RFSC. Most expenses can be directly attributed to the individual Funds. Expenses which cannot be directly attributed to a specific Fund are allocated among all Funds principally based on their relative net assets.
| | |
| Notes to Financial Statements | | 99 |
Russell Investment Funds
Notes to Financial Statements, continued — December 31, 2008
Foreign Currency Translations
The books and records of the Funds are maintained in U.S. dollars. Foreign currency amounts and transactions of the Funds are translated into U.S. dollars on the following basis:
| | (a) | Market value of investment securities, other assets and liabilities at the closing rate of exchange on the valuation date. |
| | (b) | Purchases and sales of investment securities and income at the closing rate of exchange prevailing on the respective trade dates of such transactions. |
Net realized gains or losses from foreign currency-related transactions arise from: sales and maturities of short-term securities; sales of foreign currencies; currency gains or losses realized between the trade and settlement dates on securities transactions; the difference between the amounts of dividends, interest, and foreign withholding taxes recorded on the Non-U.S. Fund’s books and the U.S. dollar equivalent of the amounts actually received or paid. Net unrealized gains or losses from foreign currency-related transactions arise from changes in the value of assets and liabilities, other than investments in securities, at year-end, as a result of changes in the exchange rates.
The Funds do not isolate that portion of the results of operations of the Funds that arises as a result of changes in exchange rates from that portion that arises from changes in market prices of investments during the year. Such fluctuations are included with the net realized and unrealized gain or loss from investments. However, for federal income tax purposes the Funds do isolate the effects of changes in foreign exchange rates from the fluctuations arising from changes in market prices for realized gain (or loss) on debt obligations.
Capital Gains Taxes
The Non-U.S. Fund may be subject to capital gains taxes and repatriation taxes imposed by certain countries in which it invests. The Non-U.S. Fund may record a deferred tax liability in respect of unrealized appreciation on foreign securities for potential capital gains and repatriation taxes at December 31, 2008. The accrual for capital gains and repatriation taxes is included in net unrealized appreciation (depreciation) on investments in the Statements of Assets and Liabilities for the Fund. The amounts related to capital gains taxes are included in net realized gain (loss) on investments in the Statements of Operations for the Fund. The Non-U.S. Fund had no deferred tax liability but incurred $3,749 in capital gains taxes for the period ended December 31, 2008.
Derivatives
To the extent permitted by the investment objectives, restrictions and policies set forth in the Funds’ Prospectus and Statement of Additional Information, the Funds may participate in various derivative-based transactions. Derivative securities are instruments or agreements whose value is derived from an underlying security or index. They include options, futures, swaps, forwards, structured notes and stripped securities. These instruments offer unique characteristics and risks that assist the Funds in meeting its investment strategies.
The Funds typically use derivatives in three ways: exposing cash reserves to markets, hedging and return enhancement. The Funds, other than the Real Estate Securities Fund, may pursue their strategy to be fully invested by exposing cash reserves to the performance of appropriate markets by purchasing securities and/or derivatives. This is intended to cause the Funds to perform as though their cash reserves were actually invested in those markets. Hedging is also used by some Funds to limit or control risks, such as adverse movements in exchange rates and interest rates. Return enhancement can be accomplished through the use of derivatives in a Fund. By purchasing certain instruments, Funds may more effectively achieve the desired portfolio characteristics that assist them in meeting their investment objectives. Depending on how the derivatives are structured and utilized, the risks associated with them may vary widely. These risks are generally categorized as market risk, liquidity risk and counterparty or credit risk.
Foreign Currency Exchange Contracts
In connection with investment transactions consistent with the Funds’ investment objective and strategies, certain Funds may enter into foreign currency exchange spot contracts and forward foreign currency exchange contracts (“contracts”). From time to time the Funds may enter into contracts to hedge certain foreign currency-denominated assets. Contracts are recorded at market value. Certain risks may arise upon entering into these contracts from the potential inability of counterparties to meet the terms of their contracts and are generally limited to the amount of unrealized gain on the contracts, if any, that are recognized in the Statements of Assets and Liabilities. Realized gains or losses arising from such transactions are included in net realized gain (or loss) from foreign currency-related transactions.
| | |
| 100 | | Notes to Financial Statements |
Russell Investment Funds
Notes to Financial Statements, continued — December 31, 2008
Forward Commitments
Certain Funds may contract to purchase securities for a fixed price at a future date beyond customary settlement time consistent with a Fund’s ability to manage its investment portfolio and meet redemption requests. The price of the underlying securities and the date when the securities will be delivered and paid for are fixed at the time the transaction is negotiated. The Funds may dispose of a forward commitment transaction prior to settlement if it is appropriate to do so and realize short-term gains (or losses) upon such sale. When effecting such transactions, cash or liquid high-grade debt obligations of the Fund in a dollar amount sufficient to make payment for the portfolio securities to be purchased will be segregated on the Fund’s records at the trade date and maintained until the transaction is settled. A forward commitment transaction involves a risk of loss if the value of the security to be purchased declines prior to the settlement date or the other party to the transaction fails to complete the transaction.
Loan Agreements
The Core Bond Fund may invest in direct debt instruments which are interests in amounts owed by corporate, governmental, or other borrowers to lenders or lending syndicates. A Fund’s investments in loans may be in the form of participations in loans or assignments of all or a portion of loans from third parties. A loan is often administered by a bank or other financial institution (the “lender”) that acts as agent for all holders. The agent administers the terms of the loan, as specified in the loan agreement. When investing in a loan participation, a Fund has the right to receive payments of principal, interest and any fees to which it is entitled only from the lender selling the loan agreement and only upon receipt by the lender of payments from the borrower. A Fund generally has no right to enforce compliance with the terms of the loan agreement with the borrower. As a result, a Fund may be subject to the credit risk of both the borrower and the lender that is selling the loan agreement. When a Fund purchases assignments from lenders it acquires direct rights against the borrower on the loan. For the period ended December 31, 2008, there were no unfunded loan commitments in the Core Bond Fund.
Options
The Funds may purchase and sell (write) call and put options on securities and securities indices, provided such options are traded on a national securities exchange or in an over-the-counter market. The Funds may also purchase and sell call and put options on foreign currencies. The domestic equity Funds may utilize options to equitize liquidity reserve balances.
When a Fund writes a covered call or a put option, an amount equal to the premium received by the Fund is included in the Fund’s Statement of Assets and Liabilities as an asset and as an equivalent liability. The amount of the liability is subsequently marked-to-market to reflect the current market value of the option written. The Fund receives a premium on the sale of a call option but gives up the opportunity to profit from any increase in stock value above the exercise price of the option, and when the Fund writes a put option it is exposed to a decline in the price of the underlying security.
Whether an option which the Fund has written expires on its stipulated expiration date or the Fund enters into a closing purchase transaction, the Fund realizes a gain (or loss, if the cost of a closing purchase transaction exceeds the premium received when the option was sold) without regard to any unrealized gain or loss on the underlying security, and the liability related to such option is extinguished. If a call option which the Fund has written is exercised, the Fund realizes a capital gain or loss from the sale of the underlying security, and the proceeds from such sale are increased by the premium originally received. When a put option which a Fund has written is exercised, the amount of the premium originally received will reduce the cost of the security which a Fund purchases upon exercise of the option. Realized gains (losses) on purchased options are included in net realized gain (loss) from investments on the Statements of Operations.
The Funds’ use of written options involves, to varying degrees, elements of market risk in excess of the amount recognized in the Statement of Assets and Liabilities. The face or contract amounts of these instruments reflect the extent of the Funds’ exposure to market risk. The risks may be caused by an imperfect correlation between movements in the price of the instrument and the price of the underlying securities and interest rates.
A Fund may enter into a swaption (swap option). In a swaption, in exchange for an option, the buyer gains the right but not the obligation to enter into a specified swap agreement with the issuer on a specified future date. The writer of the contract receives the premium and bears the risk of unfavorable changes in the preset rate on the underlying interest rate swap. Unrealized gains/losses on swaptions are reflected in investment assets and investment liabilities in the Fund’s Statement of Assets and Liabilities.
Futures Contracts
The Funds may invest in futures contracts (i.e., interest rate, foreign currency and index futures contracts) to a limited extent. The face or contract amounts of these instruments reflect the extent of the Funds’ exposure to off balance sheet risk. The primary risks associated with the use of futures contracts are an imperfect correlation between the change in market value of the securities held by the Fund and the prices of futures contracts and the possibility of an illiquid market. Upon entering into a futures contract, the
| | |
| Notes to Financial Statements | | 101 |
Russell Investment Funds
Notes to Financial Statements, continued — December 31, 2008
Funds are required to deposit with a broker an amount, termed the initial margin, which typically represents 5% of the purchase price indicated in the futures contract. Payments to and from the broker, known as variation margin, are required to be made on a daily basis as the price of the futures contract fluctuates. Changes in initial settlement value are accounted for as unrealized appreciation (depreciation) until the contracts are terminated, at which time realized gains and losses are recognized. As of December 31, 2008, included in the Statement of Assets and Liabilities, the Funds had a cash collateral balances in connection with futures contracts purchased (sold) as follows:
| | | |
| | | Cash Collateral |
| | | |
| | | |
Multi-Style Equity Fund | | $ | 3,700,000 |
Aggressive Equity Fund | | | 1,600,000 |
Non-U.S. Fund | | | 7,642,092 |
Core Bond Fund | | | 1,088,659 |
Swap Agreements
The Funds may enter into swap agreements, on either an asset-based or liability-based basis, depending on whether they are hedging their assets or their liabilities, and will usually enter into swaps on a net basis, i.e., the two payment streams are netted out, with the Funds receiving or paying, as the case may be, only the net amount of the two payments. When a Fund engages in a swap, it exchanges its obligations to pay or rights to receive payments for the obligations or rights to receive payments of another party (i.e., an exchange of floating rate payments for fixed rate payments).
Certain Funds may enter into several different types of agreements including interest rate, credit default and currency swaps. The Funds may enter into index swap agreements as an additional hedging strategy for cash reserves held by those Funds or to effect investment transactions consistent with those objectives and strategies. Interest rate swaps are a counterparty agreement, can be customized to meet each party’s needs, and involve the exchange of a fixed payment per period for a payment that is not fixed. Currency swaps are an agreement where two parties exchange specified amounts of different currencies which are followed by a series of interest payments that are exchanged based on the principal cash flow. At maturity the principal amounts are exchanged back. Credit default swaps are a counterparty agreement which allows the transfer of third party credit risk (the possibility that an issuer will default on their obligation by failing to pay principal or interest in a timely manner) from one party to another. The lender faces the credit risk from a third party and the counterparty in the swap agrees to insure this risk in exchange for regular periodic payments.
The Funds expect to enter into these transactions primarily to preserve a return or spread on a particular investment or portion of their portfolios or to protect against any increase in the price of securities they anticipate purchasing at a later date. The net amount of the excess, if any, of the Funds’ obligations over their entitlements with respect to each swap will be accrued on a daily basis and an amount of cash or liquid high-grade debt securities having an aggregate net asset value at least equal to the accrued excess will be segregated. To the extent that the Funds enter into swaps on other than a net basis, the amount maintained in a segregated account will be the full amount of the Funds’ obligations, if any, with respect to such interest rate swaps, accrued on a daily basis. The Funds will not enter into any swaps unless the unsecured senior debt or the claims-paying ability of the other party thereto is rated in the highest rating category of at least one nationally recognized rating organization at the time of entering into such transaction. If there is a default by the other party to such a transaction, the Funds will have contractual remedies pursuant to the agreement related to the transaction. The swap market has grown substantially in recent years with a large number of banks and investment banking firms acting both as principals and as agents utilizing standardized swap documentation. As a result, the swap market has become more liquid.
A Fund may not receive the expected amount under a swap agreement if the other party to the agreement defaults or becomes bankrupt. The market for swap agreements is largely unregulated. The Funds will only enter into swap agreements with counterparties that would be eligible for consideration as repurchase agreement counterparties under the Funds’ repurchase agreement guidelines.
As of December 31, 2008, included in the Statement of Assets and Liabilities, the Core Bond Fund had a cash collateral balance of $1,079,064 in connection with swaps contracts purchased (sold).
Credit Default Swaps
FASB issued FASB Staff Position (“FSP”) No. 133-1 and 45-4 “Disclosures about Credit Derivatives and Certain Guarantees” which requires enhanced disclosure about the Funds’ credit derivatives. Management adopted FSP No. 133-1 and 45-4 on 12/31/2008.
The Core Bond Fund may enter into credit default swaps. A credit default swap can refer to corporate issues, asset-backed securities or an index of assets, each known as the reference entity or underlying asset. The Fund may act as either the buyer or the seller of a credit default swap. In an unhedged credit default swap, the Fund enters into a credit default swap without owning
| | |
| 102 | | Notes to Financial Statements |
Russell Investment Funds
Notes to Financial Statements, continued — December 31, 2008
the underlying asset or debt issued by the reference entity. Credit default swaps allow the Fund to acquire or reduce credit exposure to a particular issuer, asset or basket of assets.
As the seller in a credit default swap, the Fund would be required to pay the par or other agreed-upon value (or otherwise perform according to the swap contract) of a reference debt obligation to the counterparty in the event of a default (or other specified credit event); the counterparty would be required to surrender the reference debt obligation In return, the Fund would receive from the counterparty a periodic stream of payments over the term of the contract provided that no credit event has occurred. If no credit event occurs, the Fund would keep the stream of payments and would have no payment obligations.
The Fund may also purchase credit default swap contracts in order to offset the risk of default of debt securities held in its portfolio, in which case the Fund would function as the counterparty referenced in the preceding paragraph.
Credit default swap agreements on corporate issues involve one party making a stream of payments to another party in exchange for the right to receive a specified return in the event of a default or other credit event. If a credit event occurs and cash settlement is not elected, a variety of other deliverable obligations may be delivered in lieu of the specific referenced obligation. The ability to deliver other obligations may result in a cheapest-to-deliver option (the buyer of protection’s right to choose the deliverable obligation with the lowest value following a credit event). A Fund may use credit default swaps on corporate issues to provide a measure of protection against defaults of the issuers (i.e., to reduce risk where a Fund owns or has exposure to the referenced obligation) or to take an active long or short position with respect to the likelihood (as measured by the credit default swap’s spread) of a particular issuer’s default.
Credit default swap agreements on asset-backed securities involve one party making a stream of payments to another party in exchange for the right to receive a specified return in the event of a default or other credit event. Unlike credit default swaps on corporate issues or sovereign issues of an emerging country, deliverable obligations in most instances would be limited to the specific referenced obligation as performance for asset-backed securities can vary across deals. Prepayments, principal paydowns, and other write-down or loss events on the underlying mortgage loans will reduce the outstanding principal balance of the referenced obligation. These reductions may be temporary or permanent as defined under the terms of the swap agreement and the notional amount for the swap agreement generally will be adjusted by corresponding amounts. A Fund may use credit default swaps on asset-backed securities to provide a measure of protection against defaults (or other defined credit events) of the referenced obligation or to take an active long or short position with respect to the likelihood of a particular referenced obligation’s default (or other defined credit events).
Credit default swap agreements on credit indices involve one party making a stream of payments to another party in exchange for the right to receive a specified return in the event of a write-down, principal shortfall, interest shortfall or default of all or part of the referenced entities comprising the credit index. A credit index is of a basket of credit instruments or exposures designed to be representative of some part of the credit market as a whole. These indices are made up of reference credits that are judged by a poll of dealers to be the most liquid entities in the credit default swap market based on the sector of the index. Components of the indices may include, but are not limited to, investment grade securities, high yield securities, asset backed securities, emerging markets, and/or various credit ratings within each sector. Credit indices are traded using credit default swaps with standardized terms including a fixed spread and standard maturity dates. An index credit default swap references all the names in the index, and if there is a default, the credit event is settled based on that name’s weight in the index. The composition of the indices changes periodically, usually every six months, and for most indices, each name has an equal weight in the index. Traders may use credit-default swaps on indices to speculate on changes in credit quality.
Implied credit spreads, represented in absolute terms, utilized in determining the market value of credit default swap agreements on corporate issues as of period end are disclosed in the Schedules of Investments and generally serve as an indicator of the current status of the payment/performance risk and represent the likelihood or risk of default (or other defined credit event) for the credit derivative. The implied credit spread of a particular referenced entity reflects the cost of entering into a credit default swap and may include upfront payments required to be made to enter into the agreement. For credit default swap agreements on asset-backed securities and credit indices, the quoted market prices and resulting values serve as the indicator of the current status of the payment/performance risk. Wider credit spreads and increasing market values, in absolute terms when compared to the notional amount of the swap, generally represent a deterioration of the referenced entity’s credit soundness and a greater likelihood or risk of default or other credit event occurring as defined under the terms of the agreement. The maximum potential amount of future payments (undiscounted) that a Fund as a seller of protection could be required to make under a credit default swap agreement would be an amount equal to the notional amount of the agreement. Notional amounts of all credit default swap agreements outstanding as of December 31, 2008 for which a Fund is the seller of protection are disclosed in the Schedules of Investments. These potential amounts would be partially offset by any recovery values of the respective referenced obligations, upfront payments received upon entering into the agreement, or net amounts received from the settlement of buy protection credit default swap agreements entered into by a Fund for the same referenced entity or entities.
Credit default swaps could result in losses if the Fund does not correctly evaluate the creditworthiness of the company or companies on which the credit default swap is based. The Fund will generally incur a greater degree of risk when it sells a credit
| | |
| Notes to Financial Statements | | 103 |
Russell Investment Funds
Notes to Financial Statements, continued — December 31, 2008
default swap than when its purchases a credit default swap. As a buyer of credit default swap, the Fund may lose its investment and recover nothing should a credit event fail to occur and the swap is held to its termination date. As seller of a credit default swap, if a credit event were to occur, the value of any deliverable obligation received by the Fund, coupled with the upfront or periodic payments previously received, may be less than what it pays to the buyer, resulting in a loss of value to the Fund.
If the creditworthiness of the Fund’s swap counterparty declines, the risk that the counterparty may not perform could increase, potentially resulting in a loss to the Fund. To limit the counterparty risk involved in swap agreements, the Funds will only enter into swap agreements with counterparties that meet certain standards of creditworthiness. Although there can be no assurance that the Fund will be able to do so, the Fund may be able to reduce or eliminate its exposure under a swap agreement either by assignment or other disposition, or by entering into an offsetting swap agreement with the same party or another creditworthy party. The Fund may have limited ability to eliminate its exposure under a credit default swap if the credit of the reference entity or underlying asset has declined.
Swap agreements generally are entered into by “eligible participants” and in compliance with certain other criteria necessary to render them excluded from regulation under the Commodity Exchange Act (“CEA”) and, therefore not subject to regulation as futures or commodity option transactions under the CEA.
Interest Rate Swaps
The use of interest rate swaps is a highly specialized activity which involves investment techniques and risks different from those associated with ordinary portfolio securities transactions. If a money manager using this technique is incorrect in its forecast of market values, interest rates and other applicable factors, the investment performance of a Fund would diminish compared to what it would have been if this investment technique were not used.
Interest rate swaps do not involve the delivery of securities or other underlying assets or principal. Accordingly, the risk of loss with respect to interest rate swaps is limited to the net amount of interest payments that the Funds are contractually obligated to make. If the other party to an interest rate swap defaults, the Funds’ risk of loss consists of the net amount of interest payments that the Funds are contractually entitled to receive. Since interest rate swaps are individually negotiated, the Funds expect to achieve an acceptable degree of correlation between their rights to receive interest on their portfolio securities and their rights and obligations to receive and pay interest pursuant to interest rate swaps.
Index Swaps
Certain Funds may enter into index swap agreements as an additional hedging strategy for cash reserves held by those Funds or to effect investment transactions consistent with these Funds’ investment objectives and strategies. Swap agreements are two party contracts entered into primarily by institutional investors for periods ranging from a few weeks to more than one year. In a standard transaction, the two parties agree to exchange the returns (or differentials in rates of return) earned or realized on particular investments or instruments. The returns to be exchanged between the parties are calculated with respect to a “notional amount” (i.e. a specified dollar amount that is hypothetically invested in a “basket” of securities representing a particular index).
Investments in Emerging Markets
Investing in emerging markets may involve special risks and considerations not typically associated with investing in the United States markets. These risks include revaluation of currencies, high rates of inflation, repatriation, restrictions on income and capital, and future adverse political and economic developments. Moreover, securities issued in these markets may be less liquid, subject to government ownership controls, delayed settlements, and their prices may be more volatile than those of comparable securities in the United States.
Repurchase Agreements
The Core Bond Fund may enter into repurchase agreements. A repurchase agreement is an agreement under which the Fund acquires a fixed income security from a commercial bank, broker or dealer and simultaneously agrees to resell such security to the seller at an agreed upon price and date (normally the next business day). The resale price reflects an agreed upon interest rate effective for the period the security is held by the Fund and is unrelated to the interest rate on the security. The securities acquired by the Fund constitute collateral for the repurchase obligation. In these transactions, the securities acquired by the
| | |
| 104 | | Notes to Financial Statements |
Russell Investment Funds
Notes to Financial Statements, continued — December 31, 2008
Fund (including accrued interest earned thereon) must have a total value in excess of the value of the repurchase agreement and must be held by the custodian bank until repurchased. In addition, RIMCo will monitor the Fund’s repurchase agreement transactions generally and will evaluate the credit worthiness of any bank, broker or dealer party to a repurchase agreement with the Fund. A Fund will not invest more than 15% (10% in the case of the Russell Money Market Fund) of its net assets (taken at current market value) in repurchase agreements maturing in more than seven days.
Mortgage-Related and Other Asset-Backed Securities
The Core Bond Fund may invest in mortgage or other asset-backed securities. These securities may include mortgage pass-through securities, collateralized mortgage obligations (“CMOs”), commercial mortgage-backed securities, mortgage dollar rolls, CMO residuals, stripped mortgage-backed securities (“SMBSs”) and other securities that directly or indirectly represent a participation in, or are secured by a payable from, mortgage loans on real property. The value of a Fund’s mortgage-backed securities (“MBS”) may be affected by, among other things, changes or perceived changes in interest rates, factors concerning the interests in and structure of the issuer or the originator of the mortgage, or the quality of the underlying assets. The quality and value of the underlying assets may decline, or default. This has become an increasing risk for collateral related to sub-prime, Alt-A and non-conforming mortgage loans, especially in a declining residential real estate market. In addition, regulatory or tax changes may adversely affect the mortgage securities markets as a whole.
MBS often have stated maturities of up to thirty years when they are issued, depending upon the length of the mortgages underlying the securities. In practice however, unscheduled or early payments of principal and interest on the underlying mortgages may make the securities’ effective maturity shorter than this, and the prevailing interest rates may be higher or lower than the current yield of a Fund’s portfolio at the time the Fund receives the payments for reinvestment.
Rising or high interest rates may result in slower than expected principal payments which may tend to extend the duration of MBS, making them more volatile and more sensitive to changes in interest rates. This is known as extension risk.
MBS may have less potential for capital appreciation than comparable fixed income securities due to the likelihood of increased prepayments of mortgages resulting from foreclosures or declining interest rates. These foreclosed or refinanced mortgages are paid off at face value (par) or less, causing a loss, particularly for any investor who may have purchased the security at a premium or a price above par. In such an environment, this risk limits the potential price appreciation of these securities.
Through its investments in MBS, including those that are issued by private issuers, the Fund has exposure to subprime loans, Alt-A loans and non-conforming loans as well as to the mortgage and credit markets generally. Private issuers include commercial banks, savings associations, mortgage companies, investment banking firms, finance companies and special purpose finance entities (called special purpose vehicles or SPVs) and other entities that acquire and package mortgage loans for resale as MBS. These privately issued non-governmental MBS may offer higher yields than those issue by government entities, but also may be subject to greater price changes than governmental issues. Subprime loans refer to loans made to borrowers with weakened credit histories or with a lower capacity to make timely payments on their loans. Alt-A loans refers to loans extended to borrowers who have incomplete documentation of income, assets, or other variables that are important to the credit underwriting processes. Non-conforming mortgages are loans that do not meet the standards that allow purchase by government-sponsored enterprises. MBS with exposure to subprime loans, Alt-A loans or non-conforming loans have had in many cases higher default rates than those loans that meet government underwriting requirements. The risk of non-payment is greater for MBS that are backed by mortgage pools that contain subprime, Alt-A and non-conforming loans, but a level of risk exists for all loans.
Unlike MBS issued or guaranteed by the U.S. government or a government sponsored entity (e.g., Fannie Mae (the Federal National Mortgage Association) and Freddie Mac (the Federal Home Loan Mortgage Corporation)), MBS issued by private issuers do not have a government or government-sponsored entity guarantee, but may have credit enhancements provided by external entities such as banks or financial institutions or achieved through the structuring of the transaction itself. Examples of such credit support arising out of the structure of the transaction include the issue of senior and subordinated securities (e.g., the issuance of securities by an SPV in multiple classes or “tranches,” with one or more classes being senior to other subordinated classes as to the payment of principal and interest, with the result that defaults on the underlying mortgage loans are borne first by the holders of the subordinated class); creation of “reserve funds” (in which case cash or investments, sometimes funded from a portion of the payments on the underlying mortgage loans, are held in reserve against future losses); and “overcollateralization” (in which case the scheduled payments on, or the principal amount of, the underlying mortgage loans exceeds that required to make payment on the securities and pay any servicing or other fees). However, there can be no guarantee that credit enhancements, if any, will be sufficient to prevent losses in the event of defaults on the underlying mortgages loans. In addition, MBS that are issued by private issuers are not subject to the underwriting requirements for the underlying mortgage that are applicable to those MBS that have a government or government-sponsored entity guarantee. As a result, the mortgage loans underlying private MBS may, and frequently do, have less favorable collateral, credit risk or other underwriting characteristics than government or government-sponsored MBS and have wider variances in a number of terms including interest rate, term, size, purpose and borrower characteristics. Privately issued pools more frequently include second mortgages, high loan-to-value mortgages and manufactured housing loans. The coupon rates and maturities of the underlying mortgage loans in a private-label MBS pool may vary to a greater extent than those included in a government guaranteed pool, and the pool may include subprime mortgage loans.
| | |
| Notes to Financial Statements | | 105 |
Russell Investment Funds
Notes to Financial Statements, continued — December 31, 2008
Privately issued MBS are not traded on an exchange and there may be a limited market for the securities, especially when there is a perceived weakness in the mortgage and real estate market sectors. Without an active trading market, MBS held in a Fund’s portfolio may be particularly difficult to value because of the complexities involved in assessing the value of the underlying mortgage loans.
Asset-backed securities may include MBS, loans, receivables or other assets. The value of the Fund’s asset-backed securities may be affected by, among other things, actual or perceived changes in interest rates, factors concerning the interests in and structure of the issuer or the originator of the receivables, the market’s assessment of the quality of underlying assets or actual or perceived changes in the credit worthiness of the individual borrowers, the originator, the servicing agent or the financial institution providing the credit support.
Payment of principal and interest may be largely dependent upon the cash flows generated by the assets backing the securities. Rising or high interest rates tend to extend the duration of asset-backed securities, making them more volatile and more sensitive to changes in interest rates. The underlying assets are sometimes subject to prepayments which can shorten the security’s weighted average life and may lower its return. Defaults on loans underlying asset-backed securities have become an increasing risk for asset-backed securities that are secured by home-equity loans related to sub-prime, Alt-A or non-conforming mortgage loans, especially in a declining residential real estate market.
Asset-backed securities (other than MBS) present certain risks that are not presented by MBS. Primarily, these securities may not have the benefit of any security interest in the related assets. Credit card receivables are generally unsecured and the debtors are entitled to the protection of a number of state and federal consumer credit laws, many of which give such debtors the right to set off certain amounts owed on the credit cards, thereby reducing the balance due. There is the possibility that recoveries on repossessed collateral may not, in some cases, be available to support payments on these securities. Asset-backed securities are often backed by a pool of assets representing the obligations of a number of different parties. To lessen the effect of failures by obligors on underlying assets to make payments, the securities may contain elements of credit support which fall into two categories: (i) liquidity protection, and (ii) protection against losses resulting from ultimate default by an obligor on the underlying assets. Liquidity protection refers to the provision of advances, generally by the entity administering the pool of assets, to ensure that the receipt of payments on the underlying pool occurs in a timely fashion. Protection against losses results from payment of the insurance obligations on at least a portion of the assets in the pool. This protection may be provided through guarantees, policies or letters of credit obtained by the issuer or sponsor from third parties, through various means of structuring the transaction or through a combination of such approaches. The Fund will not pay any additional or separate fees for credit support. The degree of credit support provided for each issue is generally based on historical information respecting the level of credit risk associated with the underlying assets. Delinquency or loss in excess of that anticipated or failure of the credit support could adversely affect the return on an investment in such a security. The availability of asset-backed securities may be affected by legislative or regulatory developments. It is possible that such developments may require the Fund to dispose of any then existing holdings of such securities.
Inflation-Indexed Bonds
The Core Bond Fund may invest in inflation-indexed bonds. Inflation-indexed bonds are fixed-income securities whose principal value is periodically adjusted to the rate of inflation. The interest rate on these bonds is generally fixed at issuance at a rate lower than typical bonds. Over the life of an inflation-indexed bond, however, interest will be paid based on a principal value, which is adjusted for inflation. Any increase in the principal amount of an inflation-indexed bond will be included as interest income in the Statement of Operations, even though investors do not receive their principal until maturity.
Guarantees
In the normal course of business the Funds enter into contracts that contain a variety of representations which provide general indemnifications. The Funds’ maximum exposure under these arrangements is unknown as this would involve future claims that may be made against the Funds that have not yet occurred. However, the Funds expect the risk of loss to be remote.
Market and Credit Risk
In the normal course of business the Funds trade financial instruments and enter into financial transactions where risk of potential loss exists due to changes in the market (market risk) or failure of the other party to a transaction to perform (credit risk). Similar to credit risk, the Funds may be exposed to counterparty risk or risk that an institution or other entity with which the Funds have unsettled or open transactions will default. The potential loss could exceed the value of the assets recorded in the financial statements (The “Assets”). Assets which potentially expose the Funds to credit risk consist principally of cash due from counterparties and investments. The extent of the Funds’ exposure to credit and counterparty risks in respect to the Assets approximates their carrying value as recorded in the Funds’ Statements of Assets and Liabilities.
On September 15, 2008, Lehman Brothers Holdings Inc. filed for protection under Chapter 11 of the United States Bankruptcy Code. On September 19, 2008, a proceeding under the Securities Investor Protection Act (SIPA) was commenced with respect to
| | |
| 106 | | Notes to Financial Statements |
Russell Investment Funds
Notes to Financial Statements, continued — December 31, 2008
Lehman Brothers Inc., a broker-dealer. A trustee appointed under SIPA is administering the bankruptcy estate of Lehman Brothers Inc. Lehman Brothers International (Europe) was placed in administration under the UK Insolvency Act on September 15, 2008. Lehman Brothers Special Financing Inc., among other Lehman subsidiaries, filed for protection under Chapter 11 of the United States Bankruptcy Code on October 3, 2008. In connection with these filings, the Lehman Brothers group of companies (collectively “Lehman Brothers”) will be reorganized and/or liquidated in an orderly fashion, subject to court approval. Each Lehman Brothers entity is a separate legal entity that is subject to its own bankruptcy proceeding.
The Core Bond Fund and Non-U.S. Fund had direct holdings swap agreements, and securities and derivatives transactions outstanding with Lehman Brothers entities as issuers or counterparties at the time the relevant Lehman Brothers entities filed for protection or were placed in administration. The direct holdings associated with Lehman Brothers have been written down to their estimated recoverable values. Unrealized gain on foreign exchange swaps or other derivatives transactions have been written down to zero, while anticipated losses for such transactions associated with Lehman Brothers have been incorporated as components of other liabilities on the Statement of Assets and Liabilities and net changes in realized gain (loss) or unrealized appreciation (depreciation) on the Statements of Operations.
RIMCo or the Funds’ Money Managers have delivered notices of default and early termination to the relevant Lehman Brothers entities where required. For transactions with Lehman Brothers counterparties, RIMCo or the Funds’ Money Managers have terminated trades, obtained quotations from brokers for replacement trades and, where deemed appropriate, re-opened positions with new counterparties.
| 3. | | Investment Transactions |
Securities
During the period ended December 31, 2008, purchases and sales of investment securities (excluding U.S. Government and Agency obligations, short-term investments, options, futures and repurchase agreements) were as follows:
| | | | | | |
| Funds | | Purchases | | Sales |
| | | | | | |
Multi-Style Equity | | $ | 519,431,909 | | $ | 518,036,985 |
Aggressive Equity | | | 284,590,920 | | | 298,045,354 |
Non-U.S. | | | 395,527,830 | | | 394,931,403 |
Core Bond | | | 120,967,058 | | | 85,094,531 |
Real Estate Securities | | | 320,166,984 | | | 305,568,466 |
Purchases and sales of U.S. Government and Agency obligations (excluding short-term investments, options, futures and repurchase agreements) were as follows:
| | | | | | |
| Fund | | Purchases | | Sales |
| | | | | | |
Core Bond | | $ | 529,232,775 | | $ | 524,212,269 |
Written Options Contracts
Transactions in written options contracts for the period ended December 31, 2008 were as follows:
| | | | | | | | | | | | | | |
| | | Non-U.S. Fund | | | Core Bond Fund | |
| | | Number of
Contracts | | | Premiums
Received | | | Number of
Contracts | | | Premiums
Received | |
| | | | | | | | | | | | | | |
Outstanding December 31, 2007 | | 22 | | | $ | 95,180 | | | 44 | | | $ | 322,282 | |
Opened | | 720 | | | | 3,404,891 | | | 574 | | | | 1,377,260 | |
Closed | | (742 | ) | | | (3,500,071 | ) | | (524 | ) | | | (869,829 | ) |
Expired | | — | | | | — | | | (35 | ) | | | (249,728 | ) |
| | | | | | | | | | | | | | |
Outstanding December 31, 2008 | | — | | | $ | — | | | 59 | | | $ | 579,985 | |
| | | | | | | | | | | | | | |
Securities Lending
The Investment Company has a securities lending program whereby each Fund can loan securities with a value up to 33 1/3% of each Fund’s total assets. The Fund receives cash (U.S. currency), U.S. Government or U.S. Government agency obligations as collateral against the loaned securities. To the extent that a loan is collateralized by cash, such collateral is invested by the securities lending agent, State Street Corporation (“State Street”), in short-term instruments, money market mutual funds and other short-term investments that meet certain quality and diversification requirements. Cash collateral invested in money market funds is included in the Schedule of Investments. The collateral received is recorded on a lending Fund’s statement of assets and liabilities along with the related obligation to return the collateral.
Income generated from the investment of cash collateral, less negotiated rebate fees paid to participating brokers and transaction costs, is divided between the Fund and State Street and is recorded as income for the Fund. To the extent that a loan is secured by
| | |
| Notes to Financial Statements | | 107 |
Russell Investment Funds
Notes to Financial Statements, continued — December 31, 2008
non-cash collateral, brokers pay the Fund negotiated lenders’ fees, which are divided between the Fund and State Street and are recorded as securities lending income for the Fund. All collateral received will be in an amount at least equal to 102% (for loans of U.S. securities) or 105% (for Non-U.S. securities) of the market value of the loaned securities at the inception of each loan. The market value of the loaned securities is determined at the close of business of the Funds and any additional required collateral is delivered to the Fund the next day. Should the borrower of the securities fail financially, there is a risk of delay in recovery of the securities or loss of rights in the collateral. Consequently, loans are made only to borrowers which are deemed to be of good financial standing.
The Funds that participate in securities lending have cash collateral invested in the State Street Securities Lending Quality Trust Fund (“SLQT”). The short-term portfolio instruments held by SLQT are valued on the basis of amortized cost. Issuances and redemptions of interests in SLQT are made on each business day (“valuation date”). Currently, interests in SLQT are purchased and redeemed at a constant net asset value of $1.00 per unit for daily operational liquidity purposes, although redemptions for certain other purposes may be in-kind. In the event that a significant disparity develops between the net asset value based on amortized cost and the market based net asset value of SLQT, the Trustee of SLQT may determine that continued redemption at a constant $1.00 net asset value would create inequitable results for the SLQT’s interest holders. In these circumstances, the Trustee of SLQT, in its sole discretion and acting on behalf of the SLQT interest holders, may direct that interests be redeemed at the market-based net asset value until such time as the disparity between the market-based and the constant net asset value per unit is deemed to be insignificant.
At December 31, 2008, the SLQT Fund was transacting at its amortized cost value of $1.00 per unit for daily operational liquidity purposes. In accordance with GAAP and SFAS 157, the Funds’ financial statements reflect the current market value of SLQT as of December 31, 2008. The SLQT’s market value per unit is lower than its amortized cost value per unit. Effective February 10, 2009, the Funds began valuing the units of SLQT for purposes of the Funds’ daily valuation calculation at the unit’s market value rather than the unit’s amortized cost value.
As of December 31, 2008, the non-cash collateral received for the securities on loan in the following funds was:
| | | | | |
| Funds | | Non-Cash
Collateral Value | | Non-Cash Collateral Holding |
| | | | | |
| Multi-Style Equity | | $ | 182,684 | | Pool of US Government Securities and Corporate Bonds |
| Aggressive Equity | | | 362,923 | | Pool of US Government Securities and Corporate Bonds |
| Non-U.S. | | | 70,792 | | Pool of US Government Securities and Corporate Bonds |
Custodian
The Funds have entered into arrangements with their Custodian whereby custody credits realized as a result of uninvested cash balances are used to reduce a portion of the Funds’ expenses. During the period ended December 31, 2008, the Funds’ custodian fees were reduced by the following amounts under these arrangements which are included in expense reductions on the Statements of Operations:
| | | |
| Funds | | Custody Credit
Amount |
| | | |
Multi-Style Equity | | $ | 5,505 |
Aggressive Equity | | | 3,298 |
Non-U.S. | | | 5,950 |
Core Bond | | | 8,505 |
Real Estate Securities | | | 465 |
Brokerage Commissions
The Funds effect certain transactions through various brokers as part of Russell’s commission recapture program as administered by BNY ConvergeFX Group — Execution Solutions LLC (“BNY”) is a registered broker and is not an affiliate of the Funds or RIMCo. Trades placed through BNY and its correspondents are used to generate commission rebates to the Funds on whose behalf the trades were made. For purposes of trading to generate commission rebates to the Funds, the Funds’ money managers are requested to and RIMCo may, with respect to transactions it places, effect transactions with or through BNY and its correspondents or other brokers only to the extent that the Funds will receive competitive execution, price and commissions. In addition, RIMCo recommends targets for the amount of trading that money managers allocate through BNY based upon asset class, investment style and other factors.
BNY may also rebate to the Funds a portion of commissions earned on certain trading by the Funds through BNY and their correspondents in the form of commission recapture. Commission recapture is paid solely to those Funds generating the applicable trades. Commission recapture is generated on the instructions of the Soft Dollar Committee once RIMCo’s research budget has been met, as determined annually in the Soft Dollar Committee budgeting process.
Effective January 1, 2008, transactions effected through BNY are used solely to generate commission rebate to the Funds and no longer to obtain research services.
| | |
| 108 | | Notes to Financial Statements |
Russell Investment Funds
Notes to Financial Statements, continued — December 31, 2008
Additionally, the Fund paid brokerage commissions to non-affiliated brokers who provided brokerage and research services to the Adviser.
4. Related Party Transactions, Fees and Expenses
Adviser and Administrator
RIMCo is the Funds’ investment adviser and RFSC is the Funds’ administrator. RFSC is a wholly-owned subsidiary of RIMCo. RIMCo is a wholly-owned subsidiary of Frank Russell Company (a subsidiary of The Northwestern Mutual Life Insurance Company). Frank Russell Company provides ongoing money manager research and trade placement services to RIF and RIMCo.
The Investment Company Funds are permitted to invest their cash reserves (i.e., cash awaiting investment or cash held to meet redemption requests or to pay expenses) in the RIC Russell Money Market Fund. As of December 31, 2008, $91,920,000 represents Investment Company Funds in the RIC Russell Money Market Fund. RIC is a registered investment company that employs the same investment adviser as the Investment Company.
The advisory and administrative fees are based upon the average daily net assets of each Fund at the rates specified in the table below, are payable monthly and total $13,234,201 and $866,655 respectively, for the period ended December 31, 2008.
| | | | | | |
| | | Annual Rate | |
| Funds | | Advisor | | | Administrator | |
Multi-Style Equity | | 0.73 | % | | 0.05 | % |
Aggressive Equity | | 0.90 | | | 0.05 | |
Non-U.S. Equity | | 0.90 | | | 0.05 | |
Core Bond | | 0.55 | | | 0.05 | |
Real Estate Securities | | 0.80 | | | 0.05 | |
RIMCo agreed to certain waivers of its advisory fees as follows:
Multi-Style Equity Fund — RIMCo contractually agreed to waive, at least until April 29, 2009, a portion of its 0.73% advisory fee, up to the full amount of that fee, equal to the amount by which the Fund’s total direct Fund-level operating expenses exceed 0.87% of the Fund’s average daily net assets on an annual basis and then to reimburse the Fund for all remaining expenses, after fee waivers, that exceed 0.87% of the average daily net assets on an annual basis. Direct Fund-level expenses do not include expenses of other investment companies in which the Fund invests which are borne indirectly by the Fund. The total amount of the waiver for the period ended December 31, 2008 was $62,146. There were no reimbursements during the period.
Aggressive Equity Fund — RIMCo contractually agreed to waive, at least until April 29, 2009, a portion of its 0.90% advisory fee, up to the full amount of that fee, equal to the amount by which the Fund’s total direct Fund-level operating expenses exceed 1.05% of the Fund’s average daily net assets on an annual basis and to then reimburse the Fund for all remaining expenses, after fee waivers, that exceed 1.05% of the average daily net assets on an annual basis. Direct Fund-level expenses do not include expenses of other investment companies in which the Fund invests which are borne indirectly by the Fund. The total amount of the waiver for the period ended December 31, 2008 was $231,505. There were no reimbursements during the period.
Non-U.S. Fund — RIMCo contractually agreed to waive, at least until April 29, 2009, a portion of its 0.90% advisory fee, up to the full amount of that fee, equal to amount by which the Fund’s total direct Fund-level operating expenses exceed 1.15% of the Fund’s average daily net assets on an annual basis and to then reimburse the Fund for all remaining expenses, after fee waivers, that exceed 1.15% of the average daily net assets on an annual basis. Direct Fund-level expenses do not include expenses of other investment companies in which the Fund invests which are borne indirectly by the Fund. The total amount of the waiver for the period ended December 31, 2008 was $209,156. There were no reimbursements during the period.
Core Bond Fund — RIMCo contractually agreed to waive, at least until April 29, 2009, a portion of its 0.55% advisory fee, up to the full amount of that fee, equal to the amount by which the Fund’s total direct Fund-level operating expenses exceed 0.70% of the Fund’s average daily net assets on an annual basis and to then reimburse the Fund for all remaining expenses, after fee waivers, that exceed 0.70% of the average daily net assets on an annual basis. Direct Fund-level expenses do not include expenses of other investment companies in which the Fund invests which are borne indirectly by the Fund. The total amount of the waiver for the period ended December 31, 2008 was $252,045. There were no reimbursements during the period.
Real Estate Securities Fund — RIMCo contractually agreed to waive, at least until April 29, 2009, a portion of its 0.80% advisory fee, up to the full amount of that fee, equal to the amount by which the Fund’s total direct Fund-level operating expenses exceed 1.10% of the Fund’s average daily net assets on an annual basis and then to reimburse the Fund for all remaining expenses, after fee waivers, that exceed 1.10% of the average daily net assets on an annual basis. Direct Fund-level expenses do not include expenses of other investment companies in which the Fund invests which are borne indirectly by the Fund. There were no amounts waived or reimbursed during the period.
RIMCo do not have the ability to recover amounts waived or reimbursed from previous periods.
| | |
| Notes to Financial Statements | | 109 |
Russell Investment Funds
Notes to Financial Statements, continued — December 31, 2008
Transfer and Dividend Disbursing Agent
RFSC serves as Transfer and Dividend Disbursing Agent for the Investment Company. For this service, RIMCo and RFSC are paid a fee for transfer agency and dividend disbursing services provided to the Funds. RIMCo and RFSC retain a portion of this fee for their services provided to the Funds and pay the balance to unaffiliated agents who assist in providing these services. Total transfer agency fees paid by the Funds presented herein for the period ended December 31, 2008 were $76,266.
Accrued Fees Payable to Affiliates
Accrued fees payable to affiliates as of December 31, 2008 were as follows:
| | | | | | | | | | | | | | | |
| | | | | |
| | | Multi-Style Equity
Fund | | Aggressive Equity
Fund | | Non-U.S.
Fund | | Core Bond
Fund | | Real Estate
Securities Fund |
| | | | | | | | | | | | | | | |
Advisory Fees | | $ | 173,754 | | $ | 58,607 | | $ | 164,264 | | $ | 130,236 | | $ | 188,841 |
Administrative Fees | | | 12,174 | | | 4,967 | | | 10,313 | | | 13,399 | | | 11,803 |
Transfer agent Fees | | | 1,075 | | | 447 | | | 904 | | | 1,138 | | | 1,068 |
Trustee Fees | | | 1,461 | | | 736 | | | 1,205 | | | 1,057 | | | 2,050 |
| | | | | | | | | | | | | | | |
| | $ | 188,464 | | $ | 64,757 | | $ | 176,686 | | $ | 145,830 | | $ | 203,762 |
| | | | | | | | | | | | | | | |
Distributor
On June 2, 2008, Russell Fund Distributors, Inc., a wholly-owned subsidiary of RIMCo, changed its name to Russell Financial Services, Inc. (the “Distributor’). The Distributor serves as distributor for RIF, pursuant to the Distribution Agreement with the Investment Company. The Distributor receives no compensation from the Investment Company for its services.
Affiliated Brokerage Commissions
The Funds will effect certain transactions through Russell Implementation Services Inc. (“RIS”) and its global network of unaffiliated correspondent brokers. RIS is a registered broker and investment adviser and an affiliate of RIMCo. Trades placed through RIS and its correspondents are made (i) to manage trading associated with changes in managers, rebalancing across existing managers, cash flows and other portfolio transitions or (ii) to execute portfolio securities transactions for each Fund’s assets that RIMCo determines not to allocate to money managers and for each Fund’s cash reserves.
Board of Trustees
The Russell Fund Complex consists of RIC, which has 38 Funds, and RIF, which has nine Funds. Each of the Trustees is a Trustee of both RIC and RIF. During the period, the Russell Fund Complex paid each of its independent Trustees a retainer of $60,000 per year, $6,500 for each regular quarterly meeting attended in person, $2,500 for each special meeting attended in person, and $2,500 for each Audit Committee meeting, Nominating and Governance Committee meeting, Investment Committee meeting or any other committee meeting established and approved by the Board that is attended in person. Each Trustee receives a $1,000 fee for attending the quarterly and special meetings and a $500 fee for attending the committee meeting by phone instead of receiving the full fee had the member attended in person. Trustees’ out of pocket expenses are also paid by the Russell Fund Complex. The Audit Committee Chair and Investment Committee Chair are each paid a fee of $12,000 per year and the Nominating and Governance Committee Chair is paid a fee of $6,000 per year. The chairman of the Board receives additional annual compensation of $52,000.
At December 31, 2008, the following Funds had net tax basis capital loss carryforwards which may be applied against any realized net taxable gains in each succeeding year or until their respective expiration dates, whichever occurs first. Available capital loss carryforwards and expiration dates are as follows:
| | | | | | |
| Funds | | 12/31/16 | | Totals |
| | | | | | |
Multi-Style Equity | | $ | 47,156,528 | | $ | 47,156,528 |
Aggressive Equity | | | 35,188,160 | | | 35,188,160 |
Non-U.S. | | | 51,015,389 | | | 51,015,389 |
Real Estate | | | 26,296,790 | | | 26,296,790 |
| | |
| 110 | | Notes to Financial Statements |
Russell Investment Funds
Notes to Financial Statements, continued — December 31, 2008
At December 31, 2008, the cost of investments, net unrealized appreciation (depreciation), undistributed ordinary income and undistributed long-term capital gains for income tax purposes were as follows:
| | | | | | | | | | | | | | | | | | | | |
| | | Multi-Style Equity
Fund | | | Aggressive Equity
Fund | | | Non-U.S.
Fund | | | Core Bond
Fund | | | Real Estate
Securities Fund | |
| | | | | | | | | | | | | | | | | | | | |
Cost of Investments for Tax Purposes | | $ | 439,265,952 | | | $ | 212,648,127 | | | $ | 341,459,535 | | | $ | 452,500,958 | | | $ | 487,921,333 | |
| | | | | | | | | | | | | | | | | | | | |
Unrealized Appreciation | | $ | 14,217,717 | | | $ | 5,963,920 | | | $ | 10,861,747 | | | $ | 17,775,512 | | | $ | 53,131,098 | |
Unrealized Depreciation | | | (106,549,192 | ) | | | (46,286,435 | ) | | | (82,369,953 | ) | | | (53,495,923 | ) | | | (138,795,460 | ) |
| | | | | | | | | | | | | | | | | | | | |
Net Tax Unrealized Appreciation (Depreciation) | | $ | (92,331,475 | ) | | $ | (40,322,515 | ) | | $ | (71,508,206 | ) | | $ | (35,720,411 | ) | | $ | (85,664,362 | ) |
| | | | | | | | | | | | | | | | | | | | |
Undistributed Ordinary Income | | $ | 1,690,300 | | | $ | — | | | $ | 3,432,328 | | | $ | 3,174,296 | | | $ | 4,032,989 | |
Undistributed Long-Term Gains (Capital Loss Carryforward) | | $ | (47,156,528 | ) | | $ | (35,188,160 | ) | | $ | (51,015,389 | ) | | $ | 348,882 | | | $ | (26,296,790 | ) |
Tax Composition of Distributions: | | | | | | | | | | | | | | | | | | | | |
Ordinary Income | | $ | 5,807,059 | | | $ | 1,580,838 | | | $ | 1,321 | | | $ | 18,795,290 | | | $ | 8,442,892 | |
Long-Term Capital Gains | | $ | 3,971,718 | | | $ | 41,420 | | | $ | 3,343,645 | | | $ | 2,360,093 | | | $ | — | |
Post October Loss Deferrals | | $ | 23,941,457 | | | $ | 17,044,024 | | | $ | 23,686,099 | | | $ | — | | | $ | 16,705,163 | |
| 6. | | Fund Share Transactions (amounts in thousands) |
Share transactions for the periods ended December 31, 2008 and December 31, 2007 were as follows:
| | | | | | | | | | | | | | |
| | | Shares | | | Dollars | |
| | | 2008 | | | 2007 | | | 2008 | | | 2007 | |
| | | | | | | | | | | | | | |
| | | | | | | | | | | | | | |
Multi-Style Equity Fund | | | | | | | | | | | | | | |
Proceeds from shares sold | | 4,217 | | | 3,423 | | | $ | 50,056 | | | $ | 54,038 | |
Proceeds from reinvestment of distributions | | 720 | | | 1,528 | | | | 9,779 | | | | 23,579 | |
Payments for shares redeemed | | (2,477 | ) | | (2,246 | ) | | | (31,519 | ) | | | (35,711 | ) |
| | | | | | | | | | | | | | |
Total net increase (decrease) | | 2,460 | | | 2,705 | | | $ | 28,316 | | | $ | 41,906 | |
| | | | | | | | | | | | | | |
| | | | | | | | | | | | | | |
Aggressive Equity Fund | | | | | | | | | | | | | | |
Proceeds from shares sold | | 1,687 | | | 1,325 | | | $ | 16,796 | | | $ | 19,061 | |
Proceeds from reinvestment of distributions | | 176 | | | 2,315 | | | | 1,622 | | | | 30,456 | |
Payments for shares redeemed | | (2,345 | ) | | (1,505 | ) | | | (23,355 | ) | | | (21,845 | ) |
| | | | | | | | | | | | | | |
Total net increase (decrease) | | (482 | ) | | 2,135 | | | $ | (4,937 | ) | | $ | 27,672 | |
| | | | | | | | | | | | | | |
| | | | | | | | | | | | | | |
Non-U.S. Fund | | | | | | | | | | | | | | |
Proceeds from shares sold | | 4,132 | | | 3,562 | | | $ | 41,756 | | | $ | 52,185 | |
Proceeds from reinvestment of distributions | | 286 | | | 6,481 | | | | 3,345 | | | | 86,474 | |
Payments for shares redeemed | | (2,955 | ) | | (1,975 | ) | | | (30,761 | ) | | | (29,055 | ) |
| | | | | | | | | | | | | | |
Total net increase (decrease) | | 1,463 | | | 8,068 | | | $ | 14,340 | | | $ | 109,604 | |
| | | | | | | | | | | | | | |
| | | | | | | | | | | | | | |
Core Bond Fund | | | | | | | | | | | | | | |
Proceeds from shares sold | | 6,353 | | | 8,092 | | | $ | 64,412 | | | $ | 82,694 | |
Proceeds from reinvestment of distributions | | 2,179 | | | 1,601 | | | | 21,155 | | | | 16,240 | |
Payments for shares redeemed | | (7,885 | ) | | (2,377 | ) | | | (75,964 | ) | | | (24,283 | ) |
| | | | | | | | | | | | | | |
Total net increase (decrease) | | 647 | | | 7,316 | | | $ | 9,603 | | | $ | 74,651 | |
| | | | | | | | | | | | | | |
| | | | | | | | | | | | | | |
Real Estate Securities Fund | | | | | | | | | | | | | | |
Proceeds from shares sold | | 3,828 | | | 2,871 | | | $ | 46,717 | | | $ | 60,833 | |
Proceeds from reinvestment of distributions | | 585 | | | 4,945 | | | | 8,443 | | | | 78,706 | |
Payments for shares redeemed | | (3,880 | ) | | (5,015 | ) | | | (55,931 | ) | | | (99,943 | ) |
| | | | | | | | | | | | | | |
Total net increase (decrease) | | 533 | | | 2,801 | | | $ | (771 | ) | | $ | 39,596 | |
| | | | | | | | | | | | | | |
| 7. | | Interfund Lending Program |
The Investment Company Funds have received permission from the Securities and Exchange Commission to participate in a joint lending and borrowing facility (the “Credit Facility”). Portfolios of the Funds may borrow money from each other for temporary purposes. All such borrowing and lending will be subject to a participating Fund’s fundamental investment limitations. Typically, Funds will borrow from the RIC Russell Money Market Fund. The RIC Russell Money Market Fund will lend through the program
| | |
| Notes to Financial Statements | | 111 |
Russell Investment Funds
Notes to Financial Statements, continued — December 31, 2008
only when the returns are higher than those available from an investment in repurchase agreements or short-term reserves and the portfolio manager determines it is in the best interest of the RIC Russell Money Market Fund. The Investment Company Funds will borrow through the program only when the costs are equal to or lower than the cost of bank loans. Interfund loans and borrowings normally extend overnight, but can have a maximum duration of seven days. Loans may be called on one business day’s notice. A participating fund may have to borrow from a bank at a higher interest rate if an interfund loan is called or not renewed. Any delay in repayment to the RIC Russell Money Market Fund could result in a lost investment opportunity or additional borrowing costs. For the period ended December 31, 2008, the Funds presented herein did not borrow through the interfund lending program.
As of December 31, 2008, the following table includes shareholders of record with greater than 10% of the total outstanding shares of each respective Fund. The Northwestern Mutual Life Insurance Company separate accounts were the largest shareholder in each Fund.
| | | | |
| | | # of Shareholders | | % |
| | | | |
Multi-Style Equity Fund | | 2 | | 83.0 |
Aggressive Equity Fund | | 2 | | 83.5 |
Non-U.S. Fund | | 2 | | 86.6 |
Core Bond Fund | | 2 | | 79.0 |
Real Estate Securities Fund | | 2 | | 90.0 |
Restricted securities are subject to contractual limitations on resale, are often issued in private placement transactions, and are not registered under the Securities Act of 1933 (the “Act”). The most common types of restricted securities are those sold under Rule 144A of the Act and commercial paper sold under Section 4(2) of the Act.
A Fund may invest a portion of its net assets not to exceed 15% in securities that are illiquid. Illiquid securities are securities that may not be readily marketable, and that cannot be sold within seven days in the ordinary course of business at the approximate amount at which the Fund has valued the securities. Restricted securities are generally considered to be illiquid.
| | |
| 112 | | Notes to Financial Statements |
Russell Investment Funds
Notes to Financial Statements, continued — December 31, 2008
The following table lists restricted securities held by a Fund that are illiquid. The following table does not include (1) securities deemed liquid by RIMCo or a money manager pursuant to Board approved policies and procedures or (2) illiquid securities that are not restricted securities as designated on the Fund’s Schedule of Investments.
| | | | | | | | | | |
Fund - % of Net Assets
Securities | | Acquisition
Date | | Principal
Amount ($)
or Shares | | Cost per
Unit
$ | | Cost
(000)
$ | | Market Value
(000)
$ |
| | | | | | | | | | |
Aggressive Equity Fund - 0.2% | | | | | | | | | | |
Monterey Gourmet Foods, Inc. | | 03/10/08 | | 125,695 | | 2.84 | | 357 | | 133 |
Retractable Technologies, Inc. | | 03/10/08 | | 72,750 | | 1.52 | | 110 | | 62 |
| | | | | | | | | | |
| | | | | | | | | | 195 |
| | | | | | | | | | |
Non-U.S. Fund - 0.4% | | | | | | | | | | |
East Japan Railway Co. | | 11/18/08 | | 52 | | 7,885.95 | | 410 | | 415 |
Mizuho Financial Group, Inc. | | 02/28/08 | | 168 | | 2,598.19 | | 436 | | 501 |
| | | | | | | | | | |
| | | | | | | | | | 916 |
| | | | | | | | | | |
Core Bond Fund - 1.2% | | | | | | | | | | |
Adam Aircraft Industries | | 02/13/08 | | 55,855 | | 99.05 | | 55 | | 5 |
Americo Life, Inc. | | 12/12/06 | | 75,000 | | 102.07 | | 77 | | 71 |
Ballyrock CDO, Ltd. | | 02/13/08 | | 1,000,000 | | 80.04 | | 800 | | 764 |
Black Diamond CLO, Ltd. | | 09/11/08 | | 1,000,000 | | 83.02 | | 830 | | 700 |
BNP Paribas Capital Trust | | 06/01/06 | | 450,000 | | 112.14 | | 505 | | 276 |
Bombardier, Inc. | | 11/10/06 | | EUR 125,000 | | 128.47 | | 161 | | 104 |
Callidus Debt Partners Fund, Ltd. | | 09/26/08 | | 973,409 | | 77.81 | | 757 | | 779 |
Catlin Insurance Co., Ltd. | | 01/11/07 | | 100,000 | | 100.00 | | 100 | | 40 |
CIT Mortgage Loan Trust | | 10/05/07 | | 327,778 | | 100.00 | | 328 | | 267 |
CIT Mortgage Loan Trust | | 10/05/07 | | 130,000 | | 100.00 | | 130 | | 49 |
CIT Mortgage Loan Trust | | 10/05/07 | | 180,000 | | 100.00 | | 180 | | 61 |
DG Funding Trust | | 11/04/03 | | 49 | | 10,537.12 | | 516 | | 491 |
Freddie Mac REMICS | | 07/09/06 | | 125,232 | | 101.94 | | 128 | | 113 |
Freddie Mac REMICS | | 06/28/07 | | 126,022 | | 0.17 | | — | | — |
Freddie Mac REMICS | | 07/17/07 | | 60,120 | | 109.13 | | 66 | | 69 |
Symetra Financial Corp. | | 06/26/06 | | 150,000 | | 98.47 | | 148 | | 123 |
Washington Mutual Mortgage Pass Through Certificates | | 04/01/05 | | 196,509 | | 100.00 | | 197 | | 24 |
| | | | | | | | | | |
| | | | | | | | | | 3,936 |
| | | | | | | | | | |
Illiquid securities and restricted securities may be priced by the Funds using fair value procedures approved by the Board of Trustees.
| | |
| Notes to Financial Statements | | 113 |
Report of Independent Registered Public Accounting Firm
To the Board of Trustees and Shareholders
of Russell Investment Funds:
In our opinion, the accompanying statements of assets and liabilities, including the schedules of investments, and the related statements of operations and of changes in net assets and the financial highlights present fairly, in all material respects, the financial position of Multi-Style Equity Fund, Aggressive Equity Fund, Non-U.S. Fund, Real Estate Securities Fund, and Core Bond Fund (five of the portfolios constituting the Russell Investment Funds, hereafter referred to as the “Funds”) at December 31, 2008, the results of each of their operations for the year then ended, the changes in each of their net assets for each of the two years in the period then ended and the financial highlights for each of the periods indicated, in conformity with accounting principles generally accepted in the United States of America. These financial statements and financial highlights (hereafter referred to as “financial statements”) are the responsibility of the Funds’ management; our responsibility is to express an opinion on these financial statements based on our audits. We conducted our audits of these financial statements in accordance with the standards of the Public Company Accounting Oversight Board (United States). Those standards require that we plan and perform the audits to obtain reasonable assurance about whether the financial statements are free of material misstatement. An audit includes examining, on a test basis, evidence supporting the amounts and disclosures in the financial statements, assessing the accounting principles used and significant estimates made by management, and evaluating the overall financial statement presentation. We believe that our audits, which included confirmation of securities at December 31, 2008 by correspondence with the custodian, brokers and transfer agent, provide a reasonable basis for our opinion.

Seattle, Washington
February 12, 2009
| | |
| 114 | | Report of Independent Registered Public Accounting Firm |
Russell Investment Funds
Tax Information — December 31, 2008 (Unaudited)
For the tax year ended December 31, 2008, the Funds hereby designate 100% or the maximum amount allowable, of its net taxable income as qualified dividends taxed at individual net capital gain rates.
The Form 1099 you receive in January 2009 will show the tax status of all distributions paid to your account in calendar year 2008.
The Funds designate dividends distributed during the fiscal year as qualifying for the dividends received deduction for corporate shareholders as follows:
| | | |
Multi-Style Equity | | 100.0 | % |
Aggressive Equity | | 100.0 | % |
Non-U.S. | | 0.0 | % |
Real Estate Securities | | 4.1 | % |
Core Bond | | 0.0 | % |
Pursuant to Section 852 of the Internal Revenue Code, the Funds designate the following amounts as long-term capital gain dividends for their taxable year ended December 31, 2008:
| | | |
| | | Long-Term
Capital Gains |
| | | |
Multi-Style Equity | | $ | 3,971,718 |
Aggressive Equity | | | 41,420 |
Non-U.S. | | | 3,343,645 |
Real Estate Securities | �� | | 0 |
Core Bond | | | 2,360,093 |
Please consult a tax adviser for any questions about federal or state income tax laws.
The Non-U.S Fund paid foreign taxes of $1,007,175 and recognized $9,878,146 of foreign source income during the taxable year ended December 31, 2008. Pursuant to Section 853 of the Internal Revenue Code, the Fund designates $.0295 per share of foreign taxes paid and $.2891 of gross income per share earned from foreign sources in the taxable year ended December 31, 2008.
Russell Investment Funds
Basis for Approval of Investment Advisory Contracts (Unaudited)
Approval of Investment Advisory Agreement
The Board of Trustees, including all of the Independent Trustees, last considered and approved the continuation of the advisory agreement with RIMCo (the “RIMCo Agreement”) and the portfolio management contract with each Money Manager of the Funds (collectively, the “portfolio management contracts”) at a meeting held on April 22, 2008. During the course of a year, the Trustees receive a wide variety of materials regarding the investment performance of the Funds, sales and redemptions of the Funds’ shares, and the management of the Funds by RIMCo. In preparation for the annual review, the Independent Trustees, with the advice and assistance of their independent counsel, also requested and the Board considered (1) information and reports prepared by RIMCo relating to the services provided by RIMCo (and its affiliates) to the Funds; and (2) information (the “Third-Party Information”) received from an independent, nationally recognized provider of investment company information comparing the performance of each of the Funds and their respective operating expenses over various periods of time with other peer funds (“Comparable Funds”) not managed by RIMCo, believed by the provider to be generally comparable in investment objectives and size to the Funds; The foregoing information requested by the Trustees or provided by RIMCo is collectively called the “Agreement Renewal Information.” The Trustees’ evaluations also reflected the knowledge and familiarity gained as Board members of the Funds and other funds in the same complex with respect to services provided by RIMCo, RIMCo’s affiliates and each Money Manager. The Trustees received a memorandum from counsel to the Funds discussing the legal standards for their consideration of the continuations of the RIMCo Agreement and the portfolio management contracts and the Independent Trustees separately received a memorandum regarding their responsibilities from their independent counsel.
On April 21, 2008, the Independent Trustees met to review the Agreement Renewal Information in a private session with their independent counsel at which no representatives of RIMCo or the Funds’ management were present. At the April 22 meeting of the Board of Trustees, the Board, including the Independent Trustees, reviewed the proposed continuance of the RIMCo Agreement and the portfolio management contracts with management, counsel to the Funds and independent counsel to the Independent Trustees. Presentations made by RIMCo to the Board as part of this review encompassed the Funds and all other RIMCo-managed funds for which the Board has supervisory responsibility. Following this review, but prior to voting, the Independent Trustees again met in a private session with their independent counsel to evaluate additional information and analyses received from RIMCo and management at the Board meeting. The discussion below reflects all of these reviews.
In evaluating the portfolio management contracts, the Board considered that the Funds, in employing a manager-of-managers method of investment, operate in a manner that is distinctly different from most other investment companies. In the case of most other investment companies, an advisory fee is paid by the investment company to its adviser which, in turn, employs and compensates individual portfolio managers to make specific securities selections consistent with the adviser’s style and investment philosophy. RIMCo has engaged multiple unaffiliated Money Managers for all Funds.
The Board considered that RIMCo (rather than any Money Manager) is responsible under the RIMCo Agreement for determining, implementing and maintaining the investment program for each Fund. Assets of each Fund generally have been allocated among the multiple Money Managers selected by RIMCo, subject to Board approval, for that Fund. RIMCo manages directly a portion of certain Funds’ assets employing a “select holdings strategy,” as described below, and directly manages the investment of each Fund’s cash reserves. RIMCo also may manage directly any portion of each Fund’s assets that RIMCo determines not to allocate to the Money Managers and portions of a Fund during transitions between Money Managers. In all cases, assets are managed directly by RIMCo pursuant to authority provided by the RIMCo Agreement.
RIMCo is responsible for selecting, subject to Board approval, Money Managers for each Fund and for actively managing allocations and reallocations of assets among the Money Managers. RIMCo’s goal is to construct and manage diversified portfolios in a risk aware manner. Each Money Manager for a Fund in effect performs the function of an individual portfolio manager who is responsible for selecting portfolio securities for the portion of the Fund assigned to it by RIMCo (each, a “segment”) in accordance with the Fund’s applicable investment objective, policies and restrictions, any constraints placed by RIMCo upon their selection of portfolio securities and the Money Manager’s specified role in a Fund. RIMCo is responsible for communicating performance expectations to each Money Manager; supervising compliance by each Money Manager with each Fund’s investment objective and policies; authorizing Money Managers to engage in certain investment strategies for a Fund; and recommending annually to the Board whether portfolio management contracts should be renewed, modified or terminated. In addition to its annual recommendation as to the renewal, modification or termination of portfolio management contracts, RIMCo is responsible for recommending to the Board additions of new Money Managers or replacements of existing Money Managers at any time when, based on RIMCo’s research and ongoing review and analysis, such actions are appropriate. RIMCo may impose specific investment constraints from time to time for each Money Manager intended to capitalize on the strengths of that Money Manager or to coordinate the investment activities of Money Managers for the Fund in a complementary manner. Therefore, RIMCo’s selection of Money Managers is made not only on the basis of performance considerations but anticipated compatibility with other Money Managers in the same Fund. In light of the foregoing, the overall performance of each Fund over appropriate periods reflects, in great part, the performance of RIMCo in designing the Fund’s investment program, structuring the Fund, selecting an effective Money Manager with a particular investment style or sub-style for a segment that is complementary to the styles of the Money Managers of other Fund segments, and allocating assets among the Money Managers in a manner designed to achieve the objectives of the Fund.
| | |
| 116 | | Basis for Approval of Investment Advisory Contracts |
Russell Investment Company
Basis for Approval of Investment Advisory Contracts, continued (Unaudited)
The Board considered that the prospectuses for the Funds and other public disclosures emphasize to investors RIMCo’s role as the principal investment manager for each Fund, rather than the investment selection role of the Funds’ Money Managers, and describe the manner in which the Funds operate so that investors may take that information into account when deciding to purchase shares of any such Fund.
The Board also considered the demands and complexity of managing the Funds pursuant to the manager-of-managers structure, the special expertise of RIMCo with respect to the manager-of-managers structure of the Funds and the likelihood that, at the current expense ratio of each Fund, there would be no acceptable alternative investment managers to replace RIMCo on comparable terms given the need to continue the manager-of-managers strategy of such Fund selected by shareholders in purchasing their shares.
In addition to these general factors relating to the manager-of-managers structure of the Funds, the Trustees considered, with respect to each Fund, various specific factors in evaluating renewal of the RIMCo Agreement, including the following:
| 1. | The nature, scope and quality of the services provided to the Fund by RIMCo; |
| 2. | The advisory fee paid by the Fund to RIMCo and the fact that it encompasses all investment advisory fees paid by the Fund, including the fees for any Money Managers of such Fund; |
| 3. | Information provided by RIMCo as to other fees and benefits received by RIMCo or its affiliates from the Fund, including any administrative, transfer agent, cash management and securities lending fees, soft dollar arrangements and commissions in connection with portfolio securities transactions; |
| 4. | Information provided by RIMCo as to expenses incurred by the Fund; and |
| 5. | Information provided by RIMCo as to the profits that RIMCo derives from its mutual fund operations generally and from the Fund. |
As noted above, RIMCo, pursuant to the terms of the RIMCo Agreement, directly managed a portion—up to 10%—of the assets of the Multi-Style Equity Fund (the “Participating Fund”) during the past year utilizing a select holdings strategy, the actual allocation being determined by the Participating Fund’s RIMCo portfolio manager. The select holdings strategy utilized by RIMCo in managing such assets for the Participating Fund is designed to increase the Participating Fund’s exposure to stocks that are viewed as attractive by multiple Money Managers of the Participating Fund. The Board reviewed the results of the select holdings strategy in respect of the Participating Fund since implementation, taking into account that the strategy has been utilized for a limited period of time. The Trustees considered that RIMCo is not required to pay investment advisory fees to a Money Manager with respect to assets for which the select holdings strategy is utilized and that the profits derived by RIMCo generally and from the Participating Fund consequently may increase incrementally. The Board, however, also considered RIMCo’s advice that it pays certain Money Managers additional fees for providing information and other services in connection with the select holdings strategy and incurs additional costs in carrying out the select holdings strategy, the limited amount of assets that are managed directly by RIMCo pursuant to the select holdings strategy, and the fact that the aggregate investment advisory fees paid by the Participating Fund are not increased as a result of the select holdings strategy.
In evaluating the reasonableness of the Funds’ investment advisory fees in light of Fund performance, the Board considered that RIMCo, in the Agreement Renewal Information and at past meetings, noted differences between the investment strategies of certain Funds and their respective Comparable Funds in pursuing their investment objectives, including Fund strategies which seek to achieve a lower tracking error (i.e., the difference, whether positive or negative, between the return of a fund and its benchmark) and resulting lower return volatility than Comparable Funds. According to RIMCo, these strategies may be expected to result, and for certain Funds during the periods covered by the Third-Party Information did result, in lower performance than that of some of their respective Comparable Funds. According to RIMCo, the strategies pursued by the Funds, among other things, are intended to result in less volatile, more moderate returns relative to each Fund’s performance benchmark rather than more volatile, more extreme returns that its Comparable Funds may experience over time.
The Board considered for each Fund whether economies of scale have been realized and whether the fees for such Fund appropriately reflect or should be revised to reflect any such economies. The Board determined that, after giving effect to any applicable fee or expense caps, waivers and/or reimbursements, the investment advisory fees for each Fund appropriately reflect any economies of scale realized by that Fund, based upon such factors as the variability of Money Manager investment advisory fees and other factors associated with the manager-of-managers structure employed by the Funds. The Trustees considered that fees payable to RIMCo by institutional clients with investment objectives similar to those of the Funds and other funds under the Board’s supervision are lower, and may, in some cases by substantially lower that the rates paid by funds supervised by the Board, including the Funds. The Trustees considered the differences in the scope of services it provides to institutional clients and the Funds. In response to the Trustees’ inquiries, RIMCO has previously noted, among other things, that institutional clients have fewer administrative needs than the Funds. RIMCo noted that since the Funds must constantly issue and redeem their shares, they are more difficult to manage than institutional accounts, where assets are relatively stable. Accordingly, the Trustees did not regard these fee differences as relevant to their deliberations.
| | |
| Basis for Approval of Investment Advisory Contracts | | 117 |
Russell Investment Company
Basis for Approval of Investment Advisory Contracts, continued (Unaudited)
On the basis of the Agreement Renewal Information, and other information previously received by the Board from RIMCo during the course of the current year or prior years or presented at the April 22 Board meeting by RIMCo, the Board, in respect of each Fund, found, after giving effect to any applicable waivers and/or reimbursements, (1) the advisory fee charged by RIMCo to be reasonable in light of the nature, scope and quality of the services provided to the Funds; (2) the relative expense ratio of the Fund was comparable to those of its Comparable Funds; (3) RIMCo’s methodology of allocating expenses of operating funds in the complex was reasonable; and (4) RIMCo’s profitability with respect to the Fund was not excessive in light of the nature, scope and quality of the services provided by RIMCo.
The Board further concluded that, under the circumstances, the performance of each of the Funds supported continuation of the RIMCo Agreement except that the Board concluded that, as discussed below, performance of the Non-U.S. Fund did not support a determination against continuation of the RIMCo Agreement in respect of that Fund. The Board, in assessing the Funds’ performance, focused upon each Fund’s performance for the 1-, 3- and 5-year periods as most relevant.
With respect to the RIF Non-U.S. Fund, the Third-Party Information showed that the Fund’s performance was ranked in the fourth quintile for the 1- and 3-year periods ended December 31, 2007 and in the third quintile for the 5- and 10-year periods ended such date. RIMCo noted that the quantitative investment strategy employed by one Money Manager for the Fund, like quantitative strategies generally, had been adversely affected by market conditions in the past year and that another Money Manager performed below expectations in a market environment that should have been more favorable for it and was subsequently replaced by a higher confidence manager. RIMCo noted further that the relatively small size of the RIF Non-U.S. Fund has constrained the number of Money Managers that may be employed to manage its portfolio, limiting its exposure to multiple, different investment strategies. Lastly, RIMCo noted that the Comparable Funds for the RIF Non-U.S. Fund have had greater emerging markets exposure and that the Fund tends to invest in larger cap stocks than the Comparable Funds, a tendency which has put it at a disadvantage in periods when emerging markets stocks and smaller cap stocks were the best performers.
In evaluating performance, the Board considered each Fund’s absolute performance and its performance relative to appropriate benchmarks and indices and its Comparable Funds. In assessing performance, the Board also considered RIMCo’s investment strategy of managing the Funds in a risk aware manner.
After considering the foregoing and other relevant factors, the Board concluded that continuation of the RIMCo Agreement on its current terms and conditions would be in the best interests of the Funds and their respective shareholders and voted to approve the continuation of the Agreement.
At the April 22 Board meeting, with respect to the evaluation of the terms of portfolio management contracts with Money Managers, the Board received and considered information from RIMCo reporting, among other things, for each Money Manager, the Money Manager’s performance over various periods; RIMCo’s assessment of the performance of each Money Manager; any significant business relationships between the Money Manager and RIMCo or Russell Financial Services, Inc., the Funds’ underwriter; and RIMCo’s recommendation to retain the Money Manager at the current fee rate, to retain the Money Manager at a reduced fee rate or to terminate the Money Manager. RIMCo recommended that each Money Manager be retained at its current fee rate. RIMCo has advised the Board that it does not regard Money Manager profitability as relevant to its evaluation of the portfolio management contracts with Money Managers because the willingness of Money Managers to serve in such capacity depends upon arm’s-length negotiations with RIMCo; RIMCo is aware of the fees charged by Money Managers to other clients; and RIMCo believes that the fees agreed upon with Money Managers are reasonable in light of the anticipated quality of investment advisory services to be rendered. The Board accepted RIMCo’s explanation in light of the Board’s findings as to the reasonableness of the aggregate investment advisory fees paid by each Fund and the fact that each Money Manager’s fee is paid by RIMCo.
Based substantially upon RIMCo’s recommendations, together with the information received from RIMCo in support of its recommendations at the April 22 meeting, the Board concluded that the fees paid to the Money Managers of each Fund are reasonable in light of the quality of the investment advisory services provided and that continuation of the portfolio management contract with each Money Manager of each Fund would be in the best interests of the Fund and its shareholders.
In their deliberations, the Trustees did not identify any particular information as to the RIMCo Agreement or, other than RIMCo’s recommendation, the portfolio management contract with any Money Manager that was all-important or controlling and each Trustee attributed different weights to the various factors considered. The Trustees evaluated all information available to them on a Fund-by-Fund basis and their determinations were made in respect of each Fund.
Subsequently, the Board of Trustees received a proposal from RIMCo at a meeting held on October 10, 2008, to effect a money manager change for the Multi-Style Equity Fund resulting from a change of control of one of the Fund’s Money Managers. In the case the proposed change, the Trustees approved the terms of the proposed portfolio management contract based substantially upon RIMCo’s recommendation to hire the Money Manager at the proposed fee rate; any significant business relationships between the Money Manager and RIMCo or Russell Financial Services, Inc. the Fund’s underwriter; RIMCo’s explanation as to the lack of relevance of profitability to the evaluation of portfolio management contracts with money managers because the willingness of Money Managers to serve in such capacity depends upon arm’s-length negotiations with RIMCo; RIMCo’s awareness of the fees charged by
| | |
| 118 | | Basis for Approval of Investment Advisory Contracts |
Russell Investment Company
Basis for Approval of Investment Advisory Contracts, continued (Unaudited)
the Money Manager to other clients; and RIMCo’s belief that the proposed investment advisory fees would be reasonable in light of the anticipated quality of investment advisory services to be rendered. The Trustees also considered their findings at their April 22, 2008 meeting as to the reasonableness of the aggregate investment advisory fees paid by the Fund, and the fact that the aggregate investment advisory fees paid by the Fund would not increase as a result of the implementation of the proposed money manager change because the money managers’ investment advisory fee is paid by RIMCo.
| | |
| Basis for Approval of Investment Advisory Contracts | | 119 |
Russell Investment Funds
Shareholder Requests for Additional Information — December 31, 2008 (Unaudited)
A complete unaudited schedule of investments is made available generally no later than 60 days after the end of the first and third quarters of each year. These reports are available (i) free of charge, upon request, by calling the Funds at (800) 787-7354, (ii) on the Securities and Exchange Commission’s website at www.sec.gov, and (iii) at the Securities and Exchange Commission’s public reference room.
The Board has delegated to RIMCo, as RIF’s investment adviser, the primary responsibility for monitoring, evaluating and voting proxies solicited by or with respect to issuers of securities in which assets of the Funds may be invested. RIMCo has established a proxy voting committee (“Committee”) and has adopted written proxy voting policies and procedures (“P&P”) and proxy voting guidelines (“Guidelines”). The Funds maintain a Portfolio Holdings Disclosure Policy that governs the timing and circumstances of disclosure to shareholders and third parties of information regarding the portfolio investments held by the Funds. A description of the P&P, Guidelines, Portfolio Holdings Disclosure Policy and additional information about Fund Trustees are contained in the Funds’ Statement of Additional Information (“SAI”). The SAI is available (i) free of charge, upon request, by calling the Funds at (800) 787-7354, and (ii) on the Securities and Exchange Commission’s website at www.sec.gov.
If possible, depending on contract owner registration and address information, and unless you have otherwise opted out, only one copy of the RIF prospectus and each annual and semi-annual report will be sent to contract owners at the same address. If you would like to receive a separate copy of these documents, please contact your Insurance Company. If you currently receive multiple copies of the prospectus, annual report and semi-annual report and would like to request to receive a single copy of these documents in the future, please call your Insurance Company.
Some Insurance Companies may offer electronic delivery of the Funds’ prospectus and annual and semiannual reports. Please contact your Insurance Company for further details.
| | |
| 120 | | Shareholder Requests for Additional Information |
Russell Investment Funds
Disclosure of Information about Fund Trustees and Officers — December 31, 2008 (Unaudited)
The following tables provide information for each officer and trustee of the Russell Fund Complex. The Russell Fund Complex consists of Russell Investment Company (“RIC”), which has 38 funds, and Russell Investment Funds (“RIF”), which has 9 funds. Each of the trustees is a trustee of both RIC and RIF. The first table provides information for the interested trustee. The second table provides information for the independent trustees. The third table provides information for the trustees emeritus. The fourth table provides information for the officers.
| | | | | | | | | | |
Name,
Age,
Address | | Position(s) Held
with Fund and
Length of
Time Served | | Term
of
Office* | | Principal Occupation(s)
During the
Past 5 Years | | No. of
Portfolios
in Russell
Fund
Complex
Overseen
by Trustee | | Other Directorships
Held by Trustee |
INTERESTED TRUSTEES | | | | | | | | | | |
#Greg J. Stark Born May 3, 1968 909 A Street Tacoma, Washington 98402-1616 | | President and Chief Executive Officer since 2004 Trustee since 2007 | | Appointed until successor is duly elected and qualified Until successor is chosen and qualified by Trustees | | • President and CEO RIC and RIF • Chairman of the Board, President and CEO, RIMCo • Chairman of the Board, President and CEO, Russell Fund Services Company (“RFSC”) • Chairman of the Board, President and CEO, Russell Financial Services, Inc. • Chairman of the Board and President, Russell Insurance Agency, Inc. (insurance agency (“RIA”)) • Until 2004, Managing Director, of Individual Investor Services, FRC • 2000 to 2004 Managing Director, Sales and Client Service, RIMCo | | 47 | | None |
INDEPENDENT TRUSTEES | | | | | | | | |
Thaddas L. Alston Born April 7, 1945 909 A Street Tacoma, Washington 98402-1616 | | Trustee since 2006 | | Appointed until successor is duly elected and qualified | | • Senior Vice President, Larco Investments, Ltd. (real estate firm) | | 47 | | None |
| | | | | | | | | | | |
Kristianne Blake, Born January 22, 1954 909 A Street Tacoma, Washington 98402-1616 | | Trustee since 2000 Chairman since 2005 | | Appointed until successor is duly elected and qualified Annual | | • Director and Chairman of the Audit Committee, Avista Corp. • Trustee and Chairman of the Operations Committee, Principal Investors Funds and Principal Variable Contracts Funds • Regent, University of Washington • President, Kristianne Gates Blake, P.S. (accounting services) • February 2002 to June 2005, Chairman of the Audit Committee, RIC and RIF Trustee and Chairman of the Operations and Distribution Committee, WM Group of Funds, 1999–2006 | | 47 | | • Director, Avista Corp; (electric utilities) • Trustee, Principal Investors Funds (investment company); • Trustee, Principal Variable Contracts Funds (investment company) |
| | | | | | | | | | | |
Daniel P. Connealy Born June 6, 1946 909 A Street Tacoma, Washington 98402-1616 | | Trustee since 2003 Chairman of Audit Committee since 2005 | | Appointed until successor is duly elected and qualified Appointed until successor is duly elected and qualified | | • June 2004 to present, Senior Vice President and Chief Financial Officer, Waddell & Reed Financial, Inc. • 2001–2003, Vice President and Chief Financial Officer, Janus Capital Group Inc. | | 47 | | None |
| # | Mr. Stark is also an officer and/or director of one or more affiliates of RIC and RIF and is therefore an Interested Trustee. |
| | |
| Disclosure of Information about Fund Trustees and Officers | | 121 |
Russell Investment Funds
Disclosure of Information about Fund Trustees and Officers, continued — December 31, 2008 (Unaudited)
| | | | | | | | | | |
Name,
Age,
Address | | Position(s) Held
With Fund and
Length of
Time Served | | Term
of
Office* | | Principal Occupation(s)
During the
Past 5 Years | | No. of
Portfolios
in Russell
Fund
Complex
Overseen
by Trustee | | Other
Directorships Held
by Trustee |
INDEPENDENT TRUSTEES (continued) | | | | | | | | |
Jonathan Fine Born July 8, 1954 909 A Street Tacoma, Washington 98402-1616 | | Trustee since 2004 | | Appointed until successor is duly elected and qualified | | • President and Chief Executive Officer, United Way of King County, WA | | 47 | | None |
| | | | | | | | | | | |
Raymond P. Tennison, Jr. Born December 21, 1955 909 A Street Tacoma, Washington 98402-1616 | | Trustee since 2000 Chairman of the Nominating and Governance Committee since 2007 | | Appointed until successor is duly elected and qualified. Appointed until successor is duly elected and qualified | | • President, Simpson Investment Company and several additional subsidiary companies, including Simpson Timber Company, Simpson Paper Company and Simpson Tacoma Kraft Company | | 47 | | None |
| | | | | | | | | | | |
Jack R. Thompson, Born March 21, 1949 909 A Street Tacoma, Washington 98402-1616 | | Trustee since 2005 | | Appointed until successor is duly elected and qualified | | • September 2003 to present, Independent Board Chair and Chairman of the Audit Committee, Sparx Asia Funds • September 2007 to present, Director, Board Chairman, and Audit Committee Chairman, LifeVantage Corporation (health products company) • May 1999 to May 2003, President, Chief Executive Officer and Director, Berger Financial Group, LLC • May 1999 to May 2003, President and Trustee, Berger Funds | | 47 | | • Director, Sparx Asia Funds (investment company) • Director, Board Chairman, and Audit Committee Chairman, LifeVantage Corporation (health products company) |
| | | | | | | | | | | |
Julie W. Weston, Born October 2, 1943 909 A Street Tacoma, Washington 98402-1616 | | Trustee since 2002 Chairperson of the Investment Committee since 2006 | | Appointed until successor is duly elected and qualified Appointed until successor is duly elected and qualified | | • Retired | | 47 | | None |
| * | Each Trustee is subject to mandatory retirement at age 72. |
| | |
| 122 | | Disclosure of Information about Fund Trustees and Officers |
Russell Investment Funds
Disclosure of Information about Fund Trustees and Officers, continued — December 31, 2008 (Unaudited)
| | | | | | | | | | |
Name,
Age,
Address | | Position(s) Held
with Fund and
Length of
Time Served | | Term
of
Office | | Principal Occupation(s)
During the
Past 5 Years | | No. of
Portfolios
in Russell
Fund
Complex
Overseen
by Trustee | | Other
Directorships Held
by Trustee |
TRUSTEES EMERITUS | | | | | | | | | | |
*George F. Russell, Jr., Born July 3, 1932 909 A Street Tacoma, Washington 98402-1616 | | Trustee Emeritus and Chairman Emeritus since 1999 | | Until resignation or removal | | • Director Emeritus, Frank Russell Company (investment consultant to institutional investors (“FRC”)); and RIMCo • Chairman Emeritus, RIC and RIF; Russell Implementation Services Inc. (broker-dealer and investment adviser (“RIS”)); Russell 20-20 Association (non-profit corporation); and Russell Trust Company (non-depository trust company (“RTC”)) • Chairman, Sunshine Management Services, LLC (investment adviser) | | 47 | | None |
| | | | | | | | | | | |
Paul E. Anderson, Born October 15, 1931 909 A Street Tacoma, Washington 98402-1616 | | Trustee Emeritus since 2007 | | Five year term | | • President, Anderson Management Group LLC (private investments consulting) • February 2002 to June 2005, Lead Trustee, RIC and RIF • Trustee of RIC and RIF until 2006 • Chairman of the Nominating and Governance Committee 2006 | | 47 | | None |
| | | | | | | | | | | |
William E. Baxter, Born June 8, 1925 909 A Street Tacoma, Washington 98402-1616 | | Trustee Emeritus since 2004 | | Five year term | | • Retired since 1986 • Trustee of RIC and RIF until 2004 | | 47 | | None |
| | | | | | | | | | | |
Lee C. Gingrich, Born October 6, 1930 909 A Street Tacoma, Washington 98402-1616 | | Trustee Emeritus since 2006 | | Five year term | | • Retired since 1995 • Trustee of RIC and RIF until 2005 • Chairman of the Nominating and Governance Committee 2001–2005 | | 47 | | None |
| | | | | | | | | | | |
Eleanor W. Palmer, Born May 5, 1926 909 A Street Tacoma, Washington 98402-1616 | | Trustee Emeritus since 2004 | | Five year term | | • Retired since 1981 • Trustee of RIC and RIF until 2004 | | 47 | | None |
| * | Mr. Russell is also a director emeritus of one or more affiliates of RIC and RIF. |
| | |
| Disclosure of Information about Fund Trustees and Officers | | 123 |
Russell Investment Funds
Disclosure of Information about Fund Trustees and Officers, continued — December 31, 2008 (Unaudited)
| | | | | | |
Name,
Age,
Address | | Position(s) Held
with Fund and
Length of
Time Served | | Term
of
Office | | Principal Occupation(s)
During the
Past 5 Years |
OFFICERS | | | | | | |
Cheryl Wichers Born December 16, 1966 909 A Street Tacoma, Washington 98402-1616 | | Chief Compliance Officer since 2005 | | Until removed by Independent Trustees | | • Chief Compliance Officer, RIC • Chief Compliance Officer, RIF • Chief Compliance Officer, RIMCo • Chief Compliance Officer, RFSC • April 2002–May 2005, Manager, Global Regulatory Policy |
| | | | | | | |
Greg J. Stark, Born May 3, 1968 909 A Street Tacoma, Washington 98402-1616 | | President and Chief Executive Officer since 2004 | | Until successor is chosen and qualified by Trustees | | • President and CEO, RIC and RIF • Chairman of the Board, President and CEO, RIMCo • Chairman of the Board, President and CEO, Russell Financial Services, Inc. • Chairman of the Board, President and CEO, RFSC • Chairman of the Board and President, Russell Insurance Agency, Inc. (insurance agency (“RIA”)) • Until 2004, Managing Director of Individual Investor Services, FRC • 2000 to 2004, Managing Director, Sales and Client Service, RIMCo |
| | | | | | | |
Mark E. Swanson, Born November 26, 1963 909 A Street Tacoma, Washington 98402-1616 | | Treasurer and Chief Accounting Officer since 1998 | | Until successor is chosen and qualified by Trustees | | • Treasurer, Chief Accounting Officer and CFO, RIC and RIF • Director, Funds Administration, RIMCo, RFSC, RTC and Russell Financial Services, Inc. • Treasurer and Principal Accounting Officer, SSgA Funds |
| | | | | | | |
Peter Gunning, Born February 22, 1967 909 A Street Tacoma, Washington 98402-1616 | | Chief Investment Officer since 2008 | | Until removed by Trustees | | • Chief Investment Officer, RIC, RIF • 1996 to 2008 Chief Investment Officer, Russell, Asia Pacific |
| | | | | | | |
Gregory J. Lyons, Born August 24, 1960 909 A Street Tacoma, Washington 98402-1616 | | Secretary since 2007 | | Until successor is chosen and qualified by Trustees | | • Associate General Counsel and Assistant Secretary FRC and RIA • Director and Secretary, RIMCo, RFSC and Russell Financial Services, Inc. • Secretary and Chief Legal Counsel, RIC and RIF |
| | |
| 124 | | Disclosure of Information about Fund Trustees and Officers |
Russell Investment Funds
909 A Street, Tacoma, Washington 98402
(800) 787-7354
Interested Trustees
Greg J. Stark
Independent Trustees
Thaddas L. Alston
Kristianne Blake
Daniel P. Connealy
Jonathan Fine
Raymond P. Tennison, Jr.
Jack R. Thompson
Julie W. Weston
Trustees Emeritus
George F. Russell, Jr.
Paul E. Anderson
William E. Baxter
Lee C. Gingrich
Eleanor W. Palmer
Officers
Greg J. Stark, President and Chief Executive Officer
Cheryl Wichers, Chief Compliance Officer
Peter Gunning, Chief Investment Officer
Mark E. Swanson, Treasurer and Chief Accounting Officer
Gregory J. Lyons, Secretary
Adviser
Russell Investment Management Company
909 A Street
Tacoma, WA 98402
Administrator and Transfer and Dividend Disbursing Agent
Russell Fund Services Company
909 A Street
Tacoma, WA 98402
Custodian
State Street Bank and Trust Company
Josiah Quincy Building
200 Newport Avenue
North Quincy, MA 02171
Office of Shareholder Inquiries
909 A Street
Tacoma, WA 98402
(800) 787-7354
Legal Counsel
Dechert LLP
200 Clarendon Street, 27th Floor
Boston, MA 02116-5021
Distributor
Russell Financial Services, Inc.
909 A Street
Tacoma, WA 98402
Independent Registered Public Accounting Firm
PricewaterhouseCoopers LLP
1420 5th Avenue
Suite 1900
Seattle, WA 98101
Money Managers as of December 31, 2008
Multi-Style Equity Fund
Arnhold and S. Bleichroeder Advisers, LLC, New York, NY
Columbus Circle Investors, Stamford, CT
DePrince, Race & Zollo, Inc., Winter Park, FL
Institutional Capital LLC, Chicago, IL
Jacobs Levy Equity Management, Inc., Florham Park, NJ
Montag & Caldwell, Inc., Atlanta, GA
Suffolk Capital Management, LLC, New York, NY
Turner Investment Partners, Inc., Berwyn, PA
Aggressive Equity Fund
ClariVest Asset Management LLC, San Diego, CA
DePrince, Race & Zollo, Inc., Winter Park, FL
Gould Investment Partners LLC, Berwyn, PA
Jacobs Levy Equity Management, Inc., Florham Park, NJ
PanAgora Asset Management, Inc., Boston, MA
Ranger Investment Management, L.P., Dallas, TX
Signia Capital Management, LLC, Spokane, WA
Tygh Capital Management, Inc., Portland, OR
Non-U.S. Fund
Altrinsic Global Advisors, LLC, Stamford, CT
AQR Capital Management, LLC, Greenwich, CT
MFS Institutional Advisors, Inc., Boston, MA
Wellington Management Company, LLP, Boston, MA
Real Estate Securities Fund
AEW Management and Advisors, L.P., Boston, MA
Cohen & Steers Capital Management, Inc., New York, NY
Heitman Real Estate Securities LLC, Chicago, IL
INVESCO Institutional (N.A.), Inc. which acts as a money manager to the Fund through its INVESCO Real Estate division, Dallas, TX
RREEF America L.L.C., Chicago, IL
Core Bond Fund
Goldman Sachs Asset Management, L.P., New York, NY
Metropolitan West Asset Management, LLC, Los Angeles, CA
Pacific Investment Management Company LLC, Newport Beach, CA
This report is prepared from the books and records of the Funds and is submitted for the general information of shareholders and is not authorized for distribution to prospective investors unless accompanied or preceded by an effective Prospectus. Nothing herein contained is to be considered an offer of sale or a solicitation of an offer to buy shares of Russell Investment Funds. Such offering is made only by Prospectus, which includes details as to offering price and other material information.
| | |
| Adviser, Money Managers and Service Providers | | 125 |
| | | | |
| Russell Investment Funds | | 909 A Street | | 800-787-7354 |
| | Tacoma, Washington 98402 | | Fax: 253-591-3495 |
| | | | www.russell.com |


36-08-023
| Item 2. | Code of Ethics. [Annual Report Only] |
| (a) | As of the end of the period covered by the report, the registrant has adopted a code of ethics that applies to the registrant’s principal executive officer and principal financial officer (“Code”). |
| (b) | That Code comprises written standards that are reasonably designed to deter wrongdoing and to promote: |
| | 1) | honest and ethical conduct, including the ethical handling of actual or apparent conflicts of interest between personal and professional relationships; |
| | 2) | full, fair, accurate, timely and understandable disclosure in reports and documents that a registrant files with, or submits to, the Securities and Exchange Commission (“SEC”) and in other public communications made by each Mutual Fund; |
| | 3) | compliance with applicable laws and governmental rules and regulations; |
| | 4) | the prompt internal reporting to an appropriate person or persons identified in the Code of violations of the Code; and |
| | 5) | accountability for adherence to the Code. |
| (c) | The Code was restated as of December 6, 2004; the restatement did not involve any material change. |
| (d) | As of the end of the period covered by the report, there have been no waivers granted from a provision of the Code that applies to the registrant’s principal executive officer and principal financial officer. |
| (f) | The registrant has filed with the SEC, pursuant to Item 12(a)(1), a copy of the Code that applies to the registrant’s principal executive officer, principal financial officer, principal accounting officer or controller, or persons performing similar functions, as an exhibit to its annual report on this Form N-CSR. |
| Item 3. | Audit Committee Financial Expert. [Annual Report Only] |
Registrant’s board of trustees has determined at a meeting held on February 23, 2005, that the Registrant has at least one audit committee financial expert serving on its audit committee. Daniel P. Connealy was determined to be the Audit Committee Financial Expert and is also determined to be “independent” for purposes of Item 3, paragraph (a)(2)(i) and (ii) of Form N-CSR.
| Item 4. | Principal Accountant Fees and Services. [Annual Report Only] |
Audit Fees
(a) The aggregate fees billed for each of the last two fiscal years for professional services rendered by the principal accountant for the audit of the registrant’s annual financial statements or services that are normally provided by the accountant in connection with statutory and regulatory filings or engagements for those fiscal years were as follows:
| | | |
2007 | | $ | 249,100 |
2008 | | $ | 236,130 |
Audit-Related Fees
(b) The aggregate fees billed in each of the last two fiscal years for assurance and related services by the principal accountant that are reasonably related to the performance of the audit of the registrant’s financial statements and are not reported under paragraph (a) of this Item and the nature of the services comprising those fees were as follows:
| | | | | |
| | | Fees | | Nature of Services |
| 2007 | | $ | 7,651 | | Performance of agreed-upon procedures with respect to 06/30/07 semi-annual reports |
| 2008 | | $ | 2,305 | | Performance of agreed-upon procedures with respect to 06/30/08 semi-annual reports |
Tax Fees
(c) The aggregate fees billed in each of the last two fiscal years for professional services rendered by the principal accountant for tax compliance, tax advice, and tax planning and the nature of the services comprising the fees were as follows:
| | | | | |
| | | Fees | | Nature of Services |
| 2007 | | $ | 62,100 | | Tax services |
| 2008 | | $ | 66,440 | | Tax services |
All Other Fees
(d) The aggregate fees billed in each of the last two fiscal years for products and services provided by the principal accountant, other than the services reported in paragraphs (a) through (c) of this Item and the nature of the services comprising those fees were as follows:
| | | | | |
| | | Fees | | Nature of Services |
| 2007 | | $ | 1,210 | | Anti-money laundering, overhead/travel |
| 2008 | | $ | 892 | | Overhead/travel |
(e) (1) Registrant’s audit committee has adopted the following pre-approval policies and procedures for certain services provided by Registrant’s accountants:
Russell Investment Company
Russell Investment Funds
Audit and Non-Audit Services Pre-Approval Policy
Effective Date: May 19, 2003
As amended through November 14, 2005
This Policy has been adopted by the Audit Committee (the “RIC Audit Committee”) of the Board of Trustees of Russell Investment Company (“RIC”) and the Audit Committee (the “RIF Audit Committee”) of the Russell Investment Funds (“RIF”) to apply to any and all engagements of the independent auditor to RIC and RIF, respectively, for audit, non-audit, tax or other services. In the case of RIC, the term “Audit Committee” as used in this policy shall refer to the RIC Audit Committee and the term “Fund” shall refer to RIC. In the case of RIF, the term “Audit Committee” as used in this Policy shall refer to the RIF Audit Committee and the term “Fund” shall refer to RIF. The term “Investment Adviser” shall refer to Russell Investment Management Company. This Policy does not delegate to management the responsibilities set forth herein for the pre-approval of services performed by the Funds’ independent auditor.
| II. | Statement of Principles. |
Under the Sarbanes-Oxley Act of 2002 (the “Act”), the Audit Committee of the Fund’s Board of Trustees (the “Audit Committee”) is charged with responsibility for the appointment, compensation and oversight of the work of the independent auditor for the Fund. As part of these responsibilities, the Audit Committee is required to pre-approve the audit services and permissible non-audit services (“non-audit services”) performed by the independent auditor for the Fund to assure that the independence of the auditor is not in any way compromised or impaired. In determining whether an auditor is independent, there are three guiding principles under the Act that must be considered. In general, the independence of the auditor to the Fund would be deemed impaired if the auditor provides a service whereby it:
| | • | | Functions in the role of management of the Fund, the adviser of the Fund or any other affiliate* of the Fund; |
| | • | | Is in the position of auditing its own work; or |
| | • | | Serves in an advocacy role for the Fund, the adviser of the Fund or any other affiliate of the Fund. |
Accordingly, it is the policy of the Fund that the independent auditor for the Fund must not be engaged to perform any service that contravenes any of the three guidelines set forth above, or which in any way could be deemed to impair or compromise the independence of the auditor for
| * | For purposes of this Policy, an affiliate of the Funds is defined as the Funds’ investment adviser (but not a sub-adviser whose role is primarily portfolio management and whose activities are overseen by the principal investment adviser), and any entity controlling, controlled by, or under common control with the investment adviser that provides ongoing services to the Fund. |
the Fund. This Policy is designed to accomplish those requirements and will henceforth be applied to all engagements by the Fund of its independent auditor, whether for audit, audit-related, tax, or other non-audit services.
Rules adopted by the United States Securities and Exchange Commission (the “SEC”) establish two distinct approaches to the pre-approval of services by the Audit Committee. The proposed services either may receive general pre-approval through adoption by the Audit Committee of a list of authorized services for the Fund, together with a budget of expected costs for those services (“general pre-approval”), or specific pre-approval by the Audit Committee of all services provided to the Fund on a case-by-case basis (“specific pre-approval”). The Audit Committee believes that the combination of these two approaches reflected in this Policy will result in an effective and efficient procedure for the pre-approval of permissible services performed by the Fund’s independent audit. The appendices to this Policy list the audit, audit-related, tax and other services that have the general pre-approval of the Audit Committee. As set forth in this Policy, unless a particular service has received general pre-approval, those services will require specific pre-approval by the Audit Committee before any such services can be provided by the independent auditor. Any proposed service to the Fund that exceeds the pre-approved budget for those services will also require specific pre-approval by the appropriate Audit Committee.
In assessing whether a particular audit or non-audit service should be approved, the Audit Committee will take into account the ratio between the total amounts paid for audit, audit-related, tax and other services, based on historical patterns at the Fund, with a view toward assuring that the level of fees paid for non-audit services as they relate to the fees paid for audit services does not compromise or impair the independence of the auditor. The Audit Committee will review the list of general pre-approved services, including the pre-approved budget for those services, at least annually and more frequently if deemed appropriate by the Audit Committee, and may implement changes thereto from time to time.
As provided in the Act and in the SEC’s rules, the Audit Committee from time to time may delegate either general or specific pre-approval authority to one or more of its members. Any member to whom such authority is delegated must report, for informational purposes only, any pre-approval decisions to the Audit Committee at its next scheduled meeting.
The annual audit services engagement terms and fees for the independent auditor for the Fund require specific pre-approval of the Audit Committee. Audit services include the annual financial statement audit and other procedures required to be performed by the independent auditor in order to be able to form an opinion on the financial statements for the Fund for that year. These other procedures include reviews of information systems, procedural reviews and testing performed in order to understand and rely on the Fund’s systems of internal control, and consultations relating to the audit. Audit services also include the attestation engagement for the independent auditor’s report on the report from management on financial reporting internal controls. The Audit Committee will review the audit services engagement as necessary or appropriate in the sole judgment of the Audit Committee.
In addition to the pre-approval by the Audit Committee of the annual engagement of the independent auditor to perform audit services, the Audit Committee may grant general pre-approval to other audit services, which are those services that only the independent auditor reasonably can provide. These may include statutory audits and services associated with the Fund’s SEC registration statement on Form N-1A, periodic reports and documents filed with the SEC or other documents issued in connection with the Fund’s securities offerings.
The Audit Committee has pre-approved the audit services set forth in Schedule A of the Audit and Non-Audit Pre-Approved Services. All other audit services not listed in Schedule A of the Audit and Non-Audit Pre-Approved Services must be specifically pre-approved by the Audit Committee.
| V. | Audit-Related Services. |
Audit-related services are assurance and related services that are reasonably related to the performance of the audit or review of the financial statements for the Fund, or the separate financial statements for a series of the Fund that are traditionally performed by the independent auditor. Because the Audit Committee believes that the provision of audit-related services does not compromise or impair the independence of the auditor and is consistent with the SEC’s rules on auditor independence, the Audit Committee may grant pre-approval to audit related services. “Audit related services” include, among others, accounting consultations related to accounting, financial reporting or disclosure matters not classified as “audit services;” assistance with understanding and implementing new accounting and financial report or disclosure matters not classified as “audit services;” assistance with understanding and implementing new accounting and financial reporting guidance from rulemaking authorities; agreed upon or expanded audit procedures related to accounting and/or billing records required to respond to or comply with financial, accounting or regulatory reporting matters; and assistance with internal reporting requirements under Form N-SAR and Form N-CSR.
The Audit Committee has pre-approved the audit-related services set forth in Schedule B of the Audit and Non-Audit Pre-Approved Services. All other audit-related services not listed in Schedule B of the Audit and Non-Audit Pre-Approved Services must be specifically pre-approved by the Audit Committee.
The Audit Committee believes that the independent auditor can provide tax services to the Fund, such as tax compliance, tax planning and tax advice, without impairing the auditor’s independence and the SEC has stated that the independent auditor may provide such services. Consequently, the Audit Committee believes that it may grant general pre-approval to those tax services that have historically been provided by the auditor, that the Audit Committee has reviewed and believes would not impair the independence of the auditor, and that are consistent with the SEC’s rules on auditor independence. However, the Audit Committee will not permit
the retention of the independent auditor to provide tax advice in connection with any transaction recommended by the independent auditor, the sole business purpose of which may be tax avoidance and the tax treatment of which may not be supported by the United States Internal Revenue Code and related regulations or the applicable tax statutes and regulations that apply to the Funds investments outside the United States. The Audit Committees will consult with the Treasurer of the Fund or outside counsel to determine that the Fund’s tax planning and reporting positions are consistent with this policy. The Audit Committee has pre-approved the tax services set forth in Schedule C of the Audit and Non-Audit Pre-Approved Services. All other tax services not listed in Schedule C of the Audit and Non-Audit Pre-Approved Services must be specifically pre-approved by the Audit Committee.
The Audit Committee believes, based on the SEC’s rules prohibiting the independent auditor from providing specific non-audit services, that other types of non-audit services are permitted. Accordingly, the Audit Committee believes that it may grant general pre-approval to those permissible non-audit services classified as “all other” services that the Audit Committee believes are routine and recurring services, would not impair or compromise the independence of the auditor and are consistent with the SEC’s rules on auditor independence.
The Audit Committee has pre-approved the permissible “all other services” set forth in Schedule D of the Audit and Non-Audit Pre-Approved Services. Permissible “all other services” not listed in Schedule D of the Audit and Non-Audit Pre-Approved Services must be specifically pre-approved by the Audit Committee.
A list of the SEC’s prohibited non-audit services is attached to this Policy as Schedule E of the Audit and Non-Audit Pre-Approved Services. The SEC’s rules and relevant official interpretations and guidance should be consulted to determine the scope of these prohibited services and the applicability of any exceptions to certain of the prohibitions. Under no circumstance may an executive, manager or associate of the Fund, or the Investment Adviser, authorize the independent auditor for the Fund to provide prohibited non-audit services.
| VIII. | Pre-Approval Fee Levels or Budgeted Amounts. |
Pre-Approval fee levels or budgeted amounts for all services to be provided by the independent auditor will be established annually by the Audit Committee and shall be subject to periodic subsequent review during the year if deemed appropriate by the Audit Committee. (Separate amounts may be specified for the Fund and for other affiliates in the investment company complex subject to pre-approval). Any proposed services exceeding these levels or amounts will require specific pre-approval by the Audit Committee. The Audit Committee will be mindful of the overall relationship of fees for audit and non-audit services in determining whether to pre-approve any such services. For each fiscal year, the Audit Committee may determine the appropriateness of the ratio between the total amount of fees for Audit, Audit-related, and Tax services for the Fund (including any Audit-related or Tax services fees for affiliates subject to pre-approval), and the total amount of fees for certain permissible non-audit services classified as “all other services” for the Fund (including any such services for affiliates subject to pre-approval by the Audit Committee).
All requests or applications for services to be provided by the independent auditor that do not require specific pre-approval by the Audit Committee will be submitted to the “RIC/RIF Clearance Committee” (the “Clearance Committee”) (which shall be comprised of not less than three members, including the Treasurer of the Fund who shall serve as its Chairperson) and must include a detailed description of the services to be rendered and the estimated costs of those services. The Clearance Committee will determine whether such services are included within the list of services that have received general pre-approval by the Audit Committee. The Audit Committee will be informed not less frequently than quarterly by the Chairperson of the Clearance Committee of any such services rendered by the independent auditor for the Fund and the fees paid to the independent auditors for such services.
Requests or applications to provide services that require specific pre-approval by the Audit Committee will be submitted to the Audit Committee by both the independent auditor and the Clearance Committee and must include a joint certification by the engagement partner of the independent auditor and the Chairperson of the Clearing Committee that, in their view, the request or application is consistent with the SEC’s rules governing auditor independence.
The Internal Audit Department of Frank Russell Company, the parent company of RFSC, and the officers of RIC and RIF will report to the Chairman of the Audit Committee any breach of this Policy that comes to the attention of the Internal Audit Department of Frank Russell Company or an officer of RIC or RIF.
| X. | Additional Requirements. |
The Audit Committee has determined to take additional measures on an annual basis to meet its responsibility to oversee the work performed by the independent auditor and to assure the internal auditor’s continuing independence from the Fund and its affiliates, including Frank Russell Company. Such efforts will include, but not be limited to, reviewing a written annual statement from the independent auditor delineating all relationships between the independent auditor and RIC, RIF, and Russell and its subsidiaries and affiliates, consistent with Independence Standards Board Standard No. 1, and discussing with the independent auditor its methods and procedures for ensuring its independence.
(e) (2) The percentage of services described in each of paragraphs (b) through (d) of this Item that were approved by the audit committee pursuant to paragraph (c)(7)(i)(C) of Rule 2-01 of Regulation S-X is as follows:
| | | |
Audit Fees | | 100 | % |
Audit-Related Fees | | 100 | % |
Tax Fees | | 100 | % |
All Other Fees | | 100 | % |
(f) For services, 50 percent or more of which were pre-approved, the percentage of hours expended on the principal accountant’s engagement to audit the registrant’s financial statements for the most recent fiscal year that were attributed to work performed by persons other than the principal accountant’s full-time, permanent employees was 0%.
(g) The aggregate non-audit fees billed by registrant’s accountant for services rendered to the registrant, and rendered to the registrant’s investment adviser (not including any sub-adviser whose role is primarily portfolio management and is subcontracted with or overseen by another investment adviser), and any entity controlling, controlled by, or under common control with the adviser that provides ongoing services to the registrant for each of the last two fiscal years of the registrant were as follows:
(h) The registrant’s audit committee of the board of trustees has considered whether the provision of nonaudit services that were rendered to the registrant’s investment adviser (not including any subadviser whose role is primarily portfolio management and is subcontracted with or overseen by another investment adviser), and any entity controlling, controlled by, or under common control with the investment adviser that provides ongoing services to the registrant that were not pre-approved pursuant to paragraph (c)(7)(ii) of Rule 2-01 of Regulation S-X is compatible with maintaining the principal accountant’s independence.
| Item 5. | Audit Committee of Listed Registrants. [Not Applicable] |
| Item 6. | [Schedules of Investments are included as part of the Report to Shareholders filed under Item 1 of this form] |
| Items 7-9. | [Not Applicable] |
| Item 10. | Submission of Matters to a Vote of Security Holders |
There have been no changes to the procedures by which shareholders may recommend nominees to the Registrant’s Board of Trustees that would require disclosure herein.
| Item 11. | Controls and Procedures |
(a) Registrant’s principal executive officer and principal financial officer have concluded that Registrant’s disclosure controls and procedures (as defined in Rule 30a-2(c) under the Investment Company Act of 1940 (the “Act”)) are effective, based on their evaluation of these controls and procedures as of a date within 90 days of the date this report is filed with the Securities and Exchange Commission.
(b) There were no significant changes in Registrant’s internal control over financial reporting that occurred during the period covered by this report that has materially affected or is likely to materially affect Registrant’s internal control over financial reporting.
(a) Registrant’s code of ethics described in Item 2.
(b) Certification for principal executive officer of Registrant as required by Rule 30a-2(a) under the Act and certification for principal financial officer of Registrant as required by Rule 30a-2(a) under the Act.
SIGNATURES
Pursuant to the requirements of the Securities Exchange Act of 1934 and the Investment Company Act of 1940, the Registrant has duly caused this report to be signed on its behalf by the undersigned, thereunto duly authorized.
Russell Investment Funds
| | |
| |
| By: | | /s/ Greg J. Stark |
| | Greg J. Stark |
| | Principal Executive Officer and Chief Executive Officer |
Date: March 6, 2009
Pursuant to the requirements of the Securities Exchange Act of 1934 and the Investment Company Act of 1940, this report has been signed below by the following persons on behalf of the Registrant and in the capacities and on the dates indicated.
| | |
| |
| By: | | /s/ Greg J. Stark |
| | Greg J. Stark |
| | Principal Executive Officer and Chief Executive Officer |
Date: March 6, 2009
| | |
| |
| By: | | /s/ Mark E. Swanson |
| | Mark E. Swanson |
| | Principal Financial Officer, Principal Accounting Officer and Treasurer |
Date: March 6, 2009