| | |
OMB APPROVAL |
OMB Number: | | 3235-0570 |
Expires: | | August 31, 2010 |
Estimated average burden |
hours per response: | | 18.9 |
UNITED STATES
SECURITIES AND EXCHANGE COMMISSION
Washington, D.C. 20549
FORM N-CSR
CERTIFIED SHAREHOLDER REPORT OF REGISTERED MANAGEMENT
INVESTMENT COMPANIES
Investment Company Act file number: 811-05371
Russell Investment Funds
(Exact name of registrant as specified in charter)
909 A Street, Tacoma Washington 98402
(Address of principal executive offices) (Zip code)
Gregory J. Lyons, Assistant Secretary
Russell Investment Funds
909 A Street
Tacoma, Washington 98402
253-439-2406
(Name and address of agent for service)
Registrant’s telephone number, including area code: 253-572-9500
Date of fiscal year end: December 31
Date of reporting period: January 1, 2007 to December 31, 2007
| Item 1. | Reports to Stockholders |

2007 ANNUAL REPORT
Russell Investment Funds
DECEMBER 31, 2007
FUND
Multi-Style Equity Fund
Aggressive Equity Fund
Non-U.S. Fund
Real Estate Securities Fund
Core Bond Fund

Russell Investment Funds
Russell Investment Funds is a series investment company with nine different investment portfolios referred to as Funds. These financial statements report on five of these Funds.
Russell Investment Funds
Annual Report
December 31, 2007
Table of Contents
Russell Investment Funds
Copyright © Russell Investment Group 2008. All rights reserved.
Russell Investment Group is a Washington, USA corporation, which operates through subsidiaries worldwide and is a subsidiary of The Northwestern Mutual Life Insurance Company.
Fund objectives, risks, charges and expenses should be carefully considered before investing. A prospectus containing this and other important information must precede or accompany this material. Please read the prospectus carefully before investing.
Securities distributed through Russell Fund Distributors, Inc. member Financial Industry Regulatory Authority, part of Russell Investment Group.
Russell Investment Group and Standard & Poor’s Corporation are the owners of the trademarks, service marks, and copyrights related to their respective indexes. Index performance is not indicative of the performance of any specific investment. Indexes are not managed and may not be invested in directly.
Performance quoted represents past performance and does not guarantee future results. The investment return and principal value of an investment will fluctuate so that shares, when redeemed, may be worth more or less than their original cost. Current performance may be lower or higher than the performance data quoted.
To Our Shareholders
Thank you for taking the time to review Russell Investment Funds’ 2007 Annual Report. The portfolio management discussions and fund-specific details will give you a deeper understanding of fund performance for the fiscal year ended December 31, 2007.
Every day, we strive to improve financial security for people and earn the continued support of our investors.
Our decades of experience evaluating global markets — and the people who make investment decisions in them — extends through numerous cycles, trends and turnarounds. It’s a perspective that allows us to deliver you long-term investment strategies.
Our dedicated money manager research analysts and portfolio managers perform the vital work to select some of the world’s best managers for the funds. This deliberate combination of investment managers is intended to help provide more consistent returns through all kinds of market environments.
We appreciate your continued support.
Regards,

Greg Stark
Chief Executive Officer, Chairman and President
Russell Investment Management Company
Russell Investment Funds
Market Summary as of December 31, 2007 (Unaudited)
U.S. Equity Markets
For the fiscal year ending December 31, 2007, US equity markets were positive, with the broad market Russell 3000® Index returning 5.1%. Stocks benefited from increased merger and acquisition activity during the first half of the year, and from surprisingly strong corporate profits. For the fiscal year, the growth rates of gross domestic product and corporate profits remained strong but decelerated toward year end. After almost four years of double-digit profit growth, earnings growth fell to single digit levels.
The housing slowdown that began in the summer of 2006 continued through this fiscal year, and was further impacted by rising defaults rates in subprime loans. At the same time, there was significant weakness in the US dollar, as it depreciated against all major currencies. In the fiscal year, The Federal Reserve Board lowered the federal funds rate three times, the first such cuts in four years, citing the slowing pace of economic expansion and the intensification of the housing correction as the reason behind the cuts. The period also saw significantly higher commodity prices across the board due in part to significant global demand from developing nations.
Although the domestic economy was decelerating, the U.S. equity market was buoyed by strong exports to faster growing developing, non-U.S. economies. With approximately 40% of U.S. corporation’s revenues derived from international customers, the declining U.S. dollar provided increased demand for U.S. products abroad.
In the wake of these powerful macroeconomic forces, the fiscal year was a transitional one marked by three distinct themes: Multinational companies with exposure to developing markets outpaced domestically-driven companies, growth companies fared better than their value counterparts and U.S. large capitalization stocks outperformed U.S. small capitalization stocks.
US companies with revenue streams that could benefit either directly or indirectly from the expanding global economy were rewarded over the fiscal year. The best performing sectors in the Russell 3000® Index were those that had some tie to the global markets — commodities, technology, and industrials. Agriculture and fertilizer stocks led the Russell 3000® Index due to increased global demand for food and an increase in corn production due to ethanol demand. Similarly, commodities related companies, especially copper, benefited from the construction boom in Asia and elsewhere. For the fiscal year, the other energy sector of the Russell 3000® Index returned 38.9%, the integrated oils sector returned 29.6%, and the materials and processing sector returned 26.0%.
The worst performing sectors in the Russell 3000® Index were those tied closely to domestic consumer spending and the housing and subprime markets, particularly mortgage lenders. The repercussions of the developments in the subprime lending market and the resulting housing slowdown caused homebuilders and building related industries to struggle as well. The financial services sector returned - -16.3% for the fiscal year and consumer discretionary sector returned -3.6%, both significantly trailing the Russell 3000® Index return of 5.1%.
Russell Investment Funds
Reversing a trend that had prevailed for the last six years, growth stocks outperformed value stocks over the fiscal year. Growth and momentum factors were rewarded over the period, especially exposure to high price to book stocks and those with high historical growth rates. The Russell 1000® Growth Index returned 11.8% while the Russell 1000® Value Index returned -0.2%. A similar trend was seen in small cap markets, with the Russell 2000® Growth Index and Russell 2000® Value Index returning 7.1% and -9.8%, respectively.
In a turnaround from the previous fiscal year, large capitalization stocks outperformed small capitalization stocks. The Russell 1000® Index returned 5.8% for the fiscal year, while the Russell 2000® Index returned -1.6%. The larger in capitalization a company was, the better its returns were over the fiscal period. Microcap stocks struggled even more than the broader small cap Russell 2000® Index, with the Russell Microcap Index returning -8.0% for the fiscal year.
During the fiscal year, the market environment was largely favorable for active growth managers. The Lipper Large Cap Growth Funds Average outperformed the Russell 1000® Growth Index by 2.33%, as active managers held companies with strong momentum that were growing faster than the companies in the Russell 1000® Growth Index. The period was also favorable for active value managers who typically do not have as much exposure to the financial services sector as the Russell 1000® Value Index. The Lipper® Large Cap Value Funds Average outperformed the Russell 1000® Value Index by 2.28%. The market environment was more challenging for active core, or market-oriented, managers as the markets were driven by commodity based companies, not an area where market-oriented managers typically focus. The Lipper® Large Cap Core Funds Average barely trailed the Russell 1000® Index by 0.19% net of fees, but modestly outperformed on a gross of fee basis. The Lipper® Small Cap Core Funds Average slightly outpaced the Russell 2000® Index by 0.18%.
U.S. Real Estate Markets
For the fiscal year ending December 31, 2007, real estate investment trusts (REITs) generated a -15.69% return, as measured by the FTSE NAREIT Equity Index. As well as being well below the overall U.S. equity market return, this return represented a substantial pull-back from the prior year’s return of 35.06%. The low REIT return was also accompanied by exceptionally high volatility during the period. In January, REITs were up over 8%; in June and July, REITs lost over 16%. From August through October, REITs rallied with a gain of over 12% and, finally, during the last two months, REITs experienced a decline of over 13%.
Early in the fiscal year, the REIT market continued to be driven by the same factors that made the prior year so successful, mainly mergers and acquisitions by private investors acquiring public REITs at large premiums to their share prices. The most prominent privatization was Equity Office Property, the industry’s largest REIT, which became the prize in a bidding war between Blackstone, a private equity firm and Vornado, a public company. The REIT market peaked at all-time record levels in mid-February 2007. At that time, while property market fundamentals were improving and REIT earnings were solid, REIT pricing appeared to be well ahead of earnings expectations.
By June 2007, concerns arose among REIT investors that problems in the residential subprime mortgage loan market would be a precursor to similar issues in the commercial mortgage market. Additionally, the 0.6% increase in the 10 year treasury rate which occurred during that month caused investors to reassess the capitalization rates used to value real estate. These events combined to put substantial downward pressure on REIT share prices.
During the last few months of the year, REITs suffered along with the other financial sector stocks as sentiment turned decidedly negative for this broad market sector. Concerns about a weaker economy and tightened credit put upward pressure on dividend yields and contributed to higher capitalization rates and
Russell Investment Funds
discount rates used to value underlying properties. Over the course of the year, the average dividend yield for companies in the FTSE NAREIT Equity Index increased sharply, from 3.69% to 4.91%. In the fourth quarter, the average dividend yield increased from 4.12% to 4.91%. REITs ended the year with dividend yields trading at a premium to the 10-year Treasuries, which ended the year at 4.03%.
Non-U.S. Equity Markets
Non-U.S. stocks gained 11.17% as measured by the MSCI EAFE Index for the fiscal year ending December 31, 2007. Non-U.S. stocks were boosted as the U.S. dollar weakened over the course of the fiscal year. In local currency, the MSCI EAFE Index rose 3.54% over the 12-month period.
The market continued to benefit from global growth, merger and acquisition activity and strong corporate earnings, especially in the first half of the year. In the second half of the year, the market withstood several periods of increased market volatility brought on by investors’ risk aversion relating to the potential negative spillover effects of the developments in the subprime lending market and housing slowdown in the U.S. Growth in emerging economies, like India and China, also had a positive impact on the strength of developed markets through their demand for goods and infrastructure development throughout the year.
Europe, as represented by the MSCI Europe Index, returned 13.86% over the fiscal year. Merger and acquisition-related gains combined with strong earnings drove European equities higher, with merger-and-acquisition activity in the year surpassing last year’s record pace. Across Europe, the best performing sectors were materials and utilities, up 38.95% and 33.00%, respectively. By country, Germany was a notable contributor to performance, benefiting from the strong performance of its automobiles industry. Elsewhere, MSCI United Kingdom Index lagged Continental Europe with a gain of 8.36%. The U.K. underperformed the rest of Europe due to weakness in its financials sector.
The MSCI Japan Index continued to lag other major non-U.S. markets in the fiscal year, with a return of -4.23% for the year. Investor concerns included weak economic data, lackluster earnings, and political turmoil. Elsewhere in the region, the MSCI Pacific ex-Japan Index gained 30.73% with strong gains in the Hong Kong, Singapore and Australian markets.
From a sector perspective, materials stocks had the best returns, up 31.75%, especially in the area of metals and mining, which was driven by industry consolidation and the continued upturn in commodities prices. Telecommunication services, up 28.21%, also benefited from strong earnings results. Health care and financials were the notable laggards, returning 0.55% and -1.82%, respectively, as measured by the MSCI EAFE health care and financials sector groupings.
The year also saw a change in market leadership from previous years, both in terms of style and market cap. Market leadership during the period favored growth stocks, with the MSCI EAFE Growth Index rising 16.45%, compared with 5.96% for the MSCI EAFE Value Index. Investors, in general, favored larger capitalization stocks over smaller capitalization stocks with the S&P/Citigroup PMI World ex-U.S. Index (an index of larger capitalization companies) up 14.17% in the period versus the S&P/Citigroup EMI World ex-U.S. (in index of smaller capitalization companies) up 7.32%.
Markets not represented in the MSCI EAFE Index, but commonly included in non-U.S. stock funds, offered significant opportunities for gains during the period. Emerging markets outperformed their developed counterparts, as the MSCI Emerging Markets Index rose 39.39%. Emerging markets countries benefited from continued strong economic growth, which benefited the materials and industrials sectors (both posting over 60% returns for the period.) Canadian stocks, as measured by the MSCI Canada Index, rose 29.57% during the period.
Russell Investment Funds
U.S. Fixed Income Markets
The Lehman Brothers U.S. Aggregate Bond Index, a broad measure of U.S. investment grade fixed income securities, returned 6.97% for the year ended December 31, 2007. All major sub-sectors trailed U.S. Treasuries as the subprime crisis largely caused a widespread “flight to quality” throughout fixed income markets, where investors moved their capital away from riskier investments to the safest possible investments (in this case U.S. Treasuries).
There were two predominant factors that affected fixed income markets throughout fiscal 2007. The first, occurring during the third quarter of calendar 2007, took the form of a massive re-pricing of risk across many fixed income sectors, largely as a result of developments within the subprime lending market. The second was the Federal Reserve’s second and third quarter cuts to the target federal funds rate for overnight loans between banks, combined with the global liquidity plan the Fed orchestrated with other major central banks.
The Subprime Market
Subprime borrowers are often defined loosely as those borrowers with higher risk/higher interest rate loans because of lack of income documentation, poor credit history, and/or high loan-to-value ratios. The proliferation of the subprime mortgages – and securities firms packaging the subprime debt into AAA-rated bonds — helped fuel the U.S. housing boom over the past decade.
Many factors contributed to a surge in what some regard as looser mortgage lending practices in late 2005 and 2006. The strength of the real estate market created additional demand for mortgage-backed securities, including those that were backed by subprime loans. This increased the potential profit for originating subprime mortgages, loans which many banks had previously avoided making because of their higher default risk. Traditional requirements to obtaining a mortgage (such as proof of income, a down payment or a moderate loan-to-value ratio) were abandoned and adjustable rate loans with artificially low introductory rates and interest-only loans became more common. Record low interest rates and loosening lending standards assisted in pushing real estate prices to record highs and resulted in a record number of re-financings. A high level of liquidity in the market enabled investment banks to borrow more to produce more “structured” financial products. This included buying lower credit rated mortgage-backed securities and re-packaging them into higher rated collateralized debt obligations (CDOs), which were in turn re-introduced into the market.
Problems in the subprime market appeared during the fourth quarter of 2006 when borrower delinquencies reached a four-year high1. Adjustable rate mortgages reset to higher rates and some borrowers could not afford to make the new higher monthly payments. The housing market began to cool, with some borrowers now owing more than their homes were worth.
Concerns increased in May 2007 when the U.S. housing market continued to soften and, for the first time since 1991, national home prices posted a year-over-year decrease2. During 2007, the level of payment delinquencies and early defaults on mortgage loans to subprime borrowers increased significantly. Demand for CDOs evaporated and mortgage lenders no longer had easy access to capital to originate loans. Investors became more risk averse and a flight to quality ensued.
1 | | Bloomberg, U.S. Subprime Mortgage Delinquencies at 4-Year High, 13-Mar-07. |
2 | | Bloomberg, Fed Sees Housing Dampening Growth Longer than Expected (per S&P/Case-Shiller study), 30-May-07. |
Russell Investment Funds
The subsequent fallout from developments in the subprime market has been widespread. The housing market, consumer confidence and companies in the financial services sector were negatively impacted. Access to capital became more constrained resulting in less liquidity in the markets and a “credit crunch” (an environment where investment capital is difficult to obtain). Some mortgage lenders declared bankruptcy or exited the business. Non-U.S. Treasury fixed income sectors generally performed poorly as investors moved out of those sectors and into U.S. Treasuries. The uncertainty surrounding the extent of the impact to the global economy led to market volatility and impacted equity and fixed income markets around the globe.
The Federal Reserve’s rate cuts and global liquidity plan
On two separate occasions during the third quarter of 2007, the Federal Reserve (“the Fed”) cut the target rate for overnight loans between banks. On September 18, the Fed lowered the target rate by 0.50% to 4.75%, the first rate change since the Fed last raised the target to 5.25% in June 2006. The reason cited for the cut was that “the tightening of credit conditions has the potential to intensify the housing correction and to restrain economic growth more generally” and that the rate cut “is intended to help forestall some of the adverse effects on the broader economy that might otherwise arise from the disruptions in financial markets and to promote moderate growth over time”3. On October 31, a further 0.25% cut lowered the target rate to 4.50%, with the Fed stating that inflation and growth risks were approximately balanced.
On December 11, the Fed cut the target rate for overnight loans between banks by 25 basis points (less than the anticipated 50 basis point cut) to 4.25%, stating that recent developments “have increased the uncertainty surrounding the outlook for economic growth and inflation.” Stocks declined and Treasuries surged as investors thought that the move was not sufficient to hold off an economic downturn. The following day the Fed, in conjunction with the European Central Bank (ECB) and central banks in England, Switzerland and Canada, announced the biggest act of global economic cooperation since the September 11th terrorist attacks, a multi-stage plan designed to provide liquidity to the stressed credit markets. In a related move, the ECB flooded financial markets with $500 billion in two-week loans to banks, the largest amount ever extended in a single move by the ECB. This was done in order to maintain liquidity in other markets at year-end.
Prior to the Fed rate cuts, the flight to quality pushed up U.S. Treasury prices, which, in turn, lowered their yields (also referred to as a downward shift in the yield curve). The Fed’s rate cuts propelled this downward progression of yields across all maturities. During 2007, yields on 2-year maturity Treasuries declined 1.76 % while yields on 10-year maturities declined 0.68%. A major change was the yield curve shifting from its beginning-of-year inverted (i.e. downward sloping) position by steepening significantly between 2- and 10-year maturities. The 2-year/10-year spread widened 1.08%, going from (0.11)% to 0.98%.
3 | | Bloomberg, Fed Surprises with a 50-basis point Rate Cut, 18-Sep-07. |
(This page intentionally left blank)
Russell Investment Funds
Multi-Style Equity Fund
Portfolio Management Discussion and Analysis — December 31, 2007 (Unaudited)
| | | |
|
| Multi-Style Equity Fund | |
| | | Total
Return | |
1 Year | | 10.36 | % |
5 Years | | 13.56 | %§ |
10 Years | | 5.11 | %§ |
| | | |
|
| Russell 1000® Index ** | |
| | | Total
Return | |
1 Year | | 5.77 | % |
5 Years | | 13.43 | %§ |
10 Years | | 6.20 | %§ |
| * | | Assumes initial investment on January 1, 1998. |
** | | Russell 1000® Index includes the 1,000 largest companies in the Russell 3000® Index. The Russell 1000® Index represents the universe of stocks from which most active money managers typically select. The Russell 1000® Index return reflects adjustments from income dividends and capital gain distributions reinvested as of the ex-dividend dates. |
Performance is historical and assumes reinvestment of all dividends and capital gains. Investment return and principal value will fluctuate so that an investor’s shares, when redeemed, may be worth more or less than when purchased. Past performance is not indicative of future results.
| | |
| 10 | | Multi-Style Equity Fund |
Russell Investment Funds
Multi-Style Equity Fund
Portfolio Management Discussion and Analysis — December 31, 2007 (Unaudited)
The Multi-Style Equity Fund (the “Fund”) allocates most of its assets among multiple money managers. Russell Investment Management Company (“RIMCo”), as the Fund’s advisor, may change the allocation of the Fund’s assets among money managers at any time. An exemptive order from the Securities and Exchange Commission (SEC) permits RIMCo to engage or terminate a money manager at any time, subject to the approval by the Fund’s Board without a shareholder vote. Pursuant to the terms of the exemptive order, the Fund is required to notify its shareholders within 60 days of when a money manager begins providing services. The Fund currently has eight money managers.
What is the Fund’s investment objective?
The Fund seeks to provide long term capital growth.
How did the Fund perform relative to its benchmark for the fiscal year ended December 31, 2007?
For the fiscal year ended December 31, 2007, the Multi-Style Equity Fund gained 10.36%. This compared to the Russell 1000® Index, which gained 5.77% during the same period. The Fund’s performance includes operating expenses, whereas Index returns are unmanaged and do not include expenses of any kind.
For the year ended December 31, 2007, the Lipper® Large-Cap Core Funds (VIP) Average returned 5.93%. This result serves as a peer comparison and is expressed net of operating expenses.
RIMCo may assign a money manager a specific style or capitalization benchmark other than the Fund’s index. However, the Fund’s primary index remains the benchmark for the Fund and is representative of the aggregate of each money manager’s benchmark index.
How did the market conditions described in the Market Summary report affect the Fund’s performance?
The market environment for the year favored large capitalization stocks, and companies with a growth focus. Additionally, multinational companies that export to emerging markets performed particularly well. This was a favorable environment for the Fund.
The Fund was overweight in growth stocks, large cap stocks and exporters to developing markets stocks, and underweight to utilities. This strategy emphasized companies that were believed to be sustainable growth companies on the one hand and cyclical companies with strong long-term prospects due to global demand (e.g., agriculture, infrastructure) on the other.
How did the investment strategies and techniques employed by the Fund and its money managers affect its performance?
Over the past year, the Fund maintained its overweight to companies with above-average growth rates that managers
believed were selling at attractive valuations. That positioning was rewarded in this period where growth stocks outpaced value stocks. The Fund benefited from growing global demand through its exposure to infrastructure and agriculture related stocks.
The Fund had strong stock selection in most sectors, especially the consumer discretionary, health care and financial sectors. Fund tilts toward growth stocks, beta (stocks whose price fluctuate more than the market), and momentum (stocks that show superior earnings and price performance) contributed positively as these factors were rewarded in the period. The Fund also benefited from an underweight to the financials sector and an overweight to technology, consumer staples and materials and processing sectors.
The Fund’s growth money managers, Turner Investment Partners, Inc., Montag & Caldwell, Inc. and Columbus Circle benefited from the strong growth environment as well as favorable stock selection and all outperformed both the Russell 1000 Index return of 5.8%, as well as the Russell 1000 Growth Index return of 11.8%. Value manager DePrince, Race & Zollo had a negative return for the year, but its results were within expectations given the market environment and its investment approach.
RIMCo currently employs a “select holdings” strategy for a portion of the Fund’s assets that RIMCo determines not to allocate to the money managers. Pursuant to this strategy, RIMCo analyzes the holdings of the Fund’s money managers in their Fund segments to identify particular stocks that have been selected by multiple money managers. RIMCo uses a proprietary model to rank these stocks. Based on this ranking, RIMCo purchases additional shares of certain stocks for the Fund. The strategy is designed to increase the Fund’s exposure to stocks that are viewed as attractive by multiple money managers. As the Fund outperformed for the period, the select holdings strategy also outperformed the benchmark.
At the stock selection level, the Fund benefited from overweight positions in strong performers such as Apple, Research in Motion, Google, Hess, Schlumberger and Occidental Petroleum. Overweights to US Air and AIG, and underweights to Exxon Mobil and Chevron, detracted from performance.
Describe any changes to the Fund’s structure or the money manager line-up.
In July 2007, Ark Asset Management Company, Inc. was replaced with Columbus Circle Investors. In September, Arnhold and S. Bleichroeder was added as a market-oriented manager in the Fund.
| | |
| Multi-Style Equity Fund | | 11 |
Russell Investment Funds
Multi-Style Equity Fund
Shareholder Expense Example — December 31, 2007 (Unaudited)
Fund Expenses
The following disclosure provides important information regarding each Fund’s Expense Example, which appears on each Fund’s individual page in this Annual Report. Please refer to this information when reviewing the Expense Example for a Fund.
Example
As a shareholder of the Fund, you incur two types of costs: (1) transaction costs, and (2) ongoing costs, including management fees and other Fund expenses. The Example is intended to help you understand your ongoing costs (in dollars) of investing in the Fund and to compare these costs with the ongoing costs of investing in other mutual funds. The Example is based on an investment of $1,000 invested at the beginning of the period and held for the entire period indicated, which for this Fund is from July 1, 2007 to December 31, 2007.
Actual Expenses
The information in the table under the heading “Actual Performance” provides information about actual account values and actual expenses. You may use the information in this column, together with the amount you invested, to estimate the expenses that you paid over the period. Simply divide your account value by $1,000 (for example, an $8,600 account value divided by $1,000 = 8.6), then multiply the result by the number in the first column in the row entitled “Expenses Paid During Period” to estimate the expenses you paid on your account during this period.
Hypothetical Example for Comparison Purposes
The information in the table under the heading “Hypothetical Performance (5% return before expenses)” provides information about hypothetical account values and hypothetical expenses based on the Fund’s actual expense ratio and an assumed rate of return of 5% per year before expenses, which is not the Fund’s actual return. The hypothetical account values and expenses may not be used to estimate the actual ending account balance or expenses you paid for the period. You may use this information to compare the ongoing costs of investing in the Fund and other funds. To do so, compare this 5% hypothetical example with the 5% hypothetical examples that appear in the shareholder reports of other funds.
Please note that the expenses shown in the table are meant to highlight your ongoing costs only and do not reflect any transactional costs. Therefore, the information under the heading “Hypothetical Performance (5% return before expenses)” is useful in comparing ongoing costs only, and will not help you determine the relative total costs of owning different funds. In addition, if these transactional costs were included, your costs would have been higher.
| | | | | | |
| | | Actual
Performance | | Hypothetical
Performance
(5% return
before expenses) |
| | | | | | |
Beginning Account Value | | | | | | |
July 1, 2007 | | $ | 1,000.00 | | $ | 1,000.00 |
Ending Account Value | | | | | | |
December 31, 2007 | | $ | 1,021.00 | | $ | 1,020.77 |
Expenses Paid During Period* | | $ | 4.48 | | $ | 4.48 |
| * | Expenses are equal to the Fund’s annualized expense ratio of 0.88% (representing the six month period annualized), multiplied by the average account value over the period, multiplied by 184/365 (to reflect the one-half year period). Reflects amounts waived and/or reimbursed by the investment adviser. Without the waiver and/or reimbursement, expenses would have been higher. |
| | |
| 12 | | Multi-Style Equity Fund |
Russell Investment Funds
Multi-Style Equity Fund
Schedule of Investments — December 31, 2007
Amounts in thousands (except share amounts)
| | | | |
| | | Principal
Amount ($)
or Shares | | Market
Value
$ |
| | | | |
Common Stocks - 95.5% | | | | |
Auto and Transportation - 1.4% | | | | |
Daimler AG | | 5,800 | | 555 |
Ford Motor Co. (Æ)(Ñ) | | 11,900 | | 80 |
General Motors Corp. (Ñ) | | 40,665 | | 1,012 |
Norfolk Southern Corp. | | 41,900 | | 2,113 |
Northwest Airlines Corp. (Æ) | | 14,100 | | 204 |
Tidewater, Inc. | | 6,300 | | 346 |
TRW Automotive Holdings Corp. (Æ)(Ñ) | | 6,400 | | 134 |
UAL Corp. (Æ)(Ñ) | | 25,100 | | 895 |
Union Pacific Corp. | | 5,860 | | 736 |
United Parcel Service, Inc. Class B | | 11,000 | | 778 |
US Airways Group, Inc. (Æ)(Ñ) | | 3,100 | | 46 |
| | | | |
| | | | 6,899 |
| | | | |
| | |
Consumer Discretionary - 10.8% | | | | |
Activision, Inc. (Æ) | | 14,550 | | 432 |
Amazon.Com, Inc. (Æ)(Ñ) | | 21,920 | | 2,031 |
Apollo Group, Inc. Class A (Æ) | | 8,210 | | 576 |
Avon Products, Inc. | | 27,500 | | 1,087 |
Barnes & Noble, Inc. (Ñ) | | 7,600 | | 262 |
BJ’s Wholesale Club, Inc. (Æ)(Ñ) | | 9,000 | | 305 |
Black & Decker Corp. (Ñ) | | 9,600 | | 669 |
Clear Channel Communications, Inc. (Ñ) | | 2,800 | | 97 |
Clear Channel Outdoor Holdings, Inc. Class A (Æ)(Ñ) | | 80,684 | | 2,232 |
Convergys Corp. (Æ) | | 9,200 | | 151 |
Costco Wholesale Corp. (Ñ) | | 33,400 | | 2,330 |
DreamWorks Animation SKG, Inc. Class A (Æ)(Ñ) | | 3,300 | | 84 |
eBay, Inc. (Æ) | | 58,000 | | 1,925 |
EchoStar Communications Corp. Class A (Æ)(Ñ) | | 4,555 | | 172 |
Electronic Arts, Inc. (Æ)(Ñ) | | 31,540 | | 1,842 |
Foot Locker, Inc. | | 51,200 | | 699 |
GameStop Corp. Class A (Æ)(Ñ) | | 8,410 | | 522 |
Gap, Inc. (The) | | 44,800 | | 953 |
Google, Inc. Class A (Æ) | | 13,990 | | 9,674 |
Guess?, Inc. (Ñ) | | 24,860 | | 942 |
Home Depot, Inc. | | 30,800 | | 830 |
Intercontinental Hotels Group
PLC - ADR (Ñ) | | 30,759 | | 535 |
International Game Technology | | 20,300 | | 892 |
JC Penney Co., Inc. | | 20,100 | | 884 |
Jones Apparel Group, Inc. (Ñ) | | 29,500 | | 472 |
Kohl’s Corp. (Æ) | | 13,200 | | 605 |
| | | | |
| | | Principal
Amount ($)
or Shares | | Market
Value
$ |
Las Vegas Sands Corp. (Æ)(Ñ) | | 6,515 | | 671 |
Leggett & Platt, Inc. (Ñ) | | 28,900 | | 504 |
Limited Brands, Inc. (Ñ) | | 49,200 | | 931 |
McDonald’s Corp. | | 85,898 | | 5,060 |
Nike, Inc. Class B (Ñ) | | 24,500 | | 1,574 |
Nintendo Co., Ltd. - ADR (Ñ) | | 6,970 | | 516 |
OfficeMax, Inc. (Ñ) | | 39,800 | | 822 |
Phillips-Van Heusen Corp. | | 11,800 | | 435 |
RR Donnelley & Sons Co. | | 18,400 | | 694 |
Saks, Inc. (Æ)(Ñ) | | 36,600 | | 760 |
Starbucks Corp. (Æ)(Ñ) | | 21,810 | | 446 |
Target Corp. | | 26,650 | | 1,333 |
Tech Data Corp. (Æ) | | 3,300 | | 125 |
TJX Cos., Inc. | | 8,900 | | 256 |
Under Armour, Inc. Class A (Æ)(Ñ) | | 9,250 | | 404 |
VeriSign, Inc. (Æ)(Ñ) | | 13,950 | | 525 |
Viacom, Inc. Class B (Æ) | | 28,400 | | 1,247 |
Virgin Media, Inc. | | 1,400 | | 24 |
Wal-Mart Stores, Inc. (Ñ) | | 41,200 | | 1,958 |
Walt Disney Co. (The) (Ñ) | | 18,600 | | 600 |
Waste Management, Inc. | | 31,000 | | 1,013 |
Yahoo!, Inc. (Æ) | | 12,800 | | 298 |
Yum! Brands, Inc. | | 11,580 | | 443 |
| | | | |
| | | | 51,842 |
| | | | |
| | |
Consumer Staples - 8.4% | | | | |
Campbell Soup Co. (Ñ) | | 27,300 | | 975 |
Clorox Co. | | 16,700 | | 1,088 |
Coca-Cola Co. (The) | | 176,970 | | 10,861 |
Colgate-Palmolive Co. | | 25,740 | | 2,007 |
ConAgra Foods, Inc. | | 22,800 | | 542 |
Diageo PLC - ADR | | 5,330 | | 457 |
Fomento Economico Mexicano SAB
de CV - ADR | | 9,900 | | 378 |
Hershey Co. (The) (Ñ) | | 22,700 | | 894 |
Kraft Foods, Inc. Class A (Ñ) | | 68,900 | | 2,248 |
Kroger Co. (The) | | 17,900 | | 478 |
McCormick & Co., Inc. (Ñ) | | 16,900 | | 641 |
Molson Coors Brewing Co. Class B (Ñ) | | 20,700 | | 1,069 |
Pepsi Bottling Group, Inc. | | 2,500 | | 99 |
PepsiCo, Inc. | | 73,500 | | 5,579 |
Procter & Gamble Co. | | 124,000 | | 9,104 |
Safeway, Inc. (Ñ) | | 15,800 | | 540 |
Sara Lee Corp. | | 26,400 | | 424 |
SUPERVALU, Inc. (Ñ) | | 12,000 | | 450 |
Unilever NV | | 36,800 | | 1,342 |
Walgreen Co. | | 7,184 | | 274 |
Wm. Wrigley Jr. Co. (Ñ) | | 18,892 | | 1,106 |
| | | | |
| | | | 40,556 |
| | | | |
| | |
| Multi-Style Equity Fund | | 13 |
Russell Investment Funds
Multi-Style Equity Fund
Schedule of Investments, continued — December 31, 2007
Amounts in thousands (except share amounts)
| | | | |
| | | Principal
Amount ($)
or Shares | | Market
Value
$ |
| | | | |
Financial Services - 14.2% | | | | |
ACE, Ltd. (Ñ) | | 33,700 | | 2,082 |
AMB Property Corp. (ö) | | 2,200 | | 127 |
American Express Co. | | 27,300 | | 1,420 |
American International Group, Inc. (Ñ) | | 103,350 | | 6,025 |
Annaly Capital Management, Inc. (ö) | | 74,800 | | 1,360 |
AON Corp. | | 15,000 | | 715 |
Arch Capital Group, Ltd. (Æ) | | 4,400 | | 310 |
Astoria Financial Corp. | | 22,600 | | 526 |
Automatic Data Processing, Inc. | | 12,300 | | 548 |
Axis Capital Holdings, Ltd. (Ñ) | | 8,100 | | 316 |
Bank of America Corp. | | 63,900 | | 2,636 |
Bank of New York Mellon Corp. (The) | | 65,526 | | 3,195 |
BlackRock, Inc. Class A (Ñ) | | 1,680 | | 364 |
Capital One Financial Corp. (Ñ) | | 25,200 | | 1,191 |
Chubb Corp. | | 6,600 | | 360 |
Citigroup, Inc. | | 82,300 | | 2,423 |
CME Group, Inc. Class A (Ñ) | | 1,330 | | 912 |
CNA Financial Corp. (Ñ) | | 7,400 | | 250 |
Colonial BancGroup, Inc. (The) (Ñ) | | 34,500 | | 467 |
Cullen/Frost Bankers, Inc. (Ñ) | | 9,700 | | 491 |
Discover Financial Services (Ñ) | | 28,900 | | 436 |
Duke Realty Corp. (ö)(Ñ) | | 15,100 | | 394 |
Fannie Mae (Ñ) | | 13,000 | | 520 |
First Horizon National Corp. (Ñ) | | 13,600 | | 247 |
Freddie Mac (Ñ) | | 10,700 | | 365 |
Goldman Sachs Group, Inc. (The) (Ñ) | | 21,330 | | 4,587 |
H&R Block, Inc. (Ñ) | | 24,900 | | 462 |
Hartford Financial Services Group, Inc. (Ñ) | | 16,700 | | 1,456 |
Hospitality Properties Trust (ö) | | 9,300 | | 300 |
Host Hotels & Resorts, Inc. (ö) | | 78,500 | | 1,338 |
IntercontinentalExchange, Inc. (Æ) | | 4,430 | | 853 |
JPMorgan Chase & Co. (Ñ) | | 186,350 | | 8,134 |
Lehman Brothers Holdings, Inc. (Ñ) | | 15,600 | | 1,021 |
Loews Corp. | | 11,700 | | 589 |
Mack-Cali Realty Corp. (ö)(Ñ) | | 9,000 | | 306 |
Marshall & Ilsley Corp. | | 23,900 | | 633 |
Mastercard, Inc. Class A (Ñ) | | 10,370 | | 2,232 |
Mercury General Corp. (Ñ) | | 19,800 | | 986 |
MetLife, Inc. (Ñ) | | 9,500 | | 585 |
Morgan Stanley (Ñ) | | 70,950 | | 3,768 |
Nasdaq Stock Market, Inc. (The) (Æ)(Ñ) | | 4,400 | | 218 |
Northern Trust Corp. (Ñ) | | 9,800 | | 750 |
OneBeacon Insurance Group, Ltd. Class A | | 1,800 | | 39 |
Paychex, Inc. (Ñ) | | 37,100 | | 1,344 |
| | | | |
| | | Principal
Amount ($)
or Shares | | Market
Value
$ |
Prologis (ö)(Ñ) | | 2,700 | | 171 |
Protective Life Corp. | | 13,700 | | 562 |
Prudential Financial, Inc. (Ñ) | | 7,300 | | 679 |
South Financial Group, Inc. (The) (Ñ) | | 28,400 | | 444 |
Sovereign Bancorp, Inc. | | 35,100 | | 400 |
SunTrust Banks, Inc. (Ñ) | | 13,800 | | 862 |
TCF Financial Corp. (Ñ) | | 19,400 | | 348 |
Transatlantic Holdings, Inc. (Ñ) | | 500 | | 36 |
Travelers Cos., Inc. (The) | | 13,400 | | 721 |
Wachovia Corp. (Ñ) | | 30,700 | | 1,167 |
Wells Fargo & Co. | | 92,300 | | 2,787 |
Western Union Co. (The) | | 46,700 | | 1,134 |
Wilmington Trust Corp. (Ñ) | | 23,900 | | 841 |
WR Berkley Corp. | | 11,000 | | 328 |
XL Capital, Ltd. Class A (Ñ) | | 7,000 | | 352 |
| | | | |
| | | | 68,113 |
| | | | |
| | |
Health Care - 14.9% | | | | |
Abbott Laboratories | | 36,300 | | 2,038 |
Aetna, Inc. | | 9,300 | | 537 |
Alcon, Inc. | | 6,000 | | 858 |
Allergan, Inc. (Ñ) | | 42,180 | | 2,710 |
AMERIGROUP Corp. Class A (Æ) | | 7,200 | | 262 |
Baxter International, Inc. | | 15,280 | | 887 |
Beckman Coulter, Inc. (Ñ) | | 500 | | 36 |
Boston Scientific Corp. (Æ) | | 41,200 | | 479 |
Bristol-Myers Squibb Co. | | 87,700 | | 2,326 |
Cardinal Health, Inc. | | 21,400 | | 1,236 |
Celgene Corp. (Æ)(Ñ) | | 2,800 | | 129 |
Charles River Laboratories International, Inc. (Æ)(Ñ) | | 5,940 | | 391 |
Community Health Systems, Inc. (Æ)(Ñ) | | 16,500 | | 608 |
Cooper Cos., Inc. (The) (Ñ) | | 11,300 | | 429 |
Covidien, Ltd. | | 34,500 | | 1,528 |
CVS Caremark Corp. | | 175,900 | | 6,992 |
Dentsply International, Inc. | | 7,720 | | 348 |
Eli Lilly & Co. | | 21,400 | | 1,143 |
Express Scripts, Inc. Class A (Æ) | | 15,900 | | 1,161 |
Genzyme Corp. (Æ) | | 8,590 | | 639 |
Gilead Sciences, Inc. (Æ)(Ñ) | | 117,020 | | 5,384 |
Human Genome Sciences, Inc. (Æ)(Ñ) | | 71,800 | | 750 |
Intuitive Surgical, Inc. (Æ)(Ñ) | | 6,890 | | 2,236 |
Johnson & Johnson | | 55,600 | | 3,709 |
King Pharmaceuticals, Inc. (Æ)(Ñ) | | 26,700 | | 273 |
McKesson Corp. | | 7,800 | | 511 |
Medco Health Solutions, Inc. (Æ) | | 21,120 | | 2,142 |
Merck & Co., Inc. | | 159,011 | | 9,240 |
| | |
| 14 | | Multi-Style Equity Fund |
Russell Investment Funds
Multi-Style Equity Fund
Schedule of Investments, continued — December 31, 2007
Amounts in thousands (except share amounts)
| | | | |
| | | Principal
Amount ($)
or Shares | | Market
Value
$ |
| | | | |
Millennium Pharmaceuticals, Inc. (Æ)(Ñ) | | 40,400 | | 605 |
Mylan, Inc. (Ñ) | | 46,500 | | 654 |
Myriad Genetics, Inc. (Æ)(Ñ) | | 6,800 | | 316 |
Novartis AG - ADR | | 50,350 | | 2,734 |
Pfizer, Inc. | | 120,600 | | 2,741 |
Schering-Plough Corp. | | 113,600 | | 3,026 |
Shire PLC - ADR (Ñ) | | 7,550 | | 521 |
St. Jude Medical, Inc. (Æ)(Ñ) | | 23,037 | | 936 |
Stericycle, Inc. (Æ) | | 4,470 | | 266 |
Stryker Corp. | | 28,100 | | 2,100 |
Teva Pharmaceutical Industries, Ltd. - ADR | | 20,100 | | 934 |
Thermo Fisher Scientific, Inc. (Æ)(Ñ) | | 72,420 | | 4,177 |
Wyeth | | 79,682 | | 3,521 |
| | | | |
| | | | 71,513 |
| | | | |
| | |
Integrated Oils - 6.2% | | | | |
Chevron Corp. | | 35,600 | | 3,323 |
ConocoPhillips | | 20,100 | | 1,775 |
Exxon Mobil Corp. | | 89,400 | | 8,376 |
Hess Corp. (Ñ) | | 31,200 | | 3,147 |
Marathon Oil Corp. | | 38,400 | | 2,337 |
Occidental Petroleum Corp. (Ñ) | | 101,600 | | 7,822 |
Total SA - ADR | | 33,650 | | 2,779 |
| | | | |
| | | | 29,559 |
| | | | |
| |
Materials and Processing - 6.5% | | |
Agrium, Inc. | | 22,400 | | 1,617 |
Alcoa, Inc. | | 15,500 | | 567 |
Archer-Daniels-Midland Co. | | 24,490 | | 1,137 |
Ashland, Inc. (Ñ) | | 29,400 | | 1,394 |
Avery Dennison Corp. | | 12,800 | | 680 |
Bemis Co., Inc. (Ñ) | | 21,200 | | 580 |
Bunge, Ltd. | | 6,820 | | 794 |
Cabot Corp. | | 17,700 | | 590 |
Chicago Bridge & Iron Co. NV | | 8,300 | | 502 |
Commercial Metals Co. (Ñ) | | 7,100 | | 209 |
Cytec Industries, Inc. | | 9,700 | | 597 |
Dow Chemical Co. (The) | | 12,800 | | 505 |
EI Du Pont de Nemours & Co. (Ñ) | | 83,000 | | 3,659 |
EMCOR Group, Inc. (Æ) | | 9,600 | | 227 |
Freeport-McMoRan Copper & Gold, Inc. Class B | | 11,400 | | 1,168 |
International Paper Co. (Ñ) | | 52,000 | | 1,684 |
KBR, Inc. (Æ)(Ñ) | | 5,400 | | 210 |
Lubrizol Corp. | | 800 | | 43 |
Masco Corp. (Ñ) | | 79,950 | | 1,728 |
| | | | |
| | | Principal
Amount ($)
or Shares | | Market
Value
$ |
Monsanto Co. | | 42,770 | | 4,777 |
Mosaic Co. (The) (Æ) | | 4,570 | | 431 |
Nalco Holding Co. (Ñ) | | 9,300 | | 225 |
Newmont Mining Corp. | | 3,600 | | 176 |
Nucor Corp. (Ñ) | | 13,500 | | 799 |
Perini Corp. (Æ)(Ñ) | | 4,000 | | 166 |
Potash Corp. of Saskatchewan | | 8,800 | | 1,267 |
PPG Industries, Inc. | | 8,600 | | 604 |
Rohm & Haas Co. (Ñ) | | 45,600 | | 2,420 |
RPM International, Inc. | | 33,400 | | 678 |
Sonoco Products Co. | | 22,800 | | 745 |
Timken Co. | | 17,500 | | 575 |
USEC, Inc. (Æ)(Ñ) | | 10,900 | | 98 |
Valspar Corp. (Ñ) | | 23,300 | | 525 |
| | | | |
| | | | 31,377 |
| | | | |
| | |
Miscellaneous - 3.7% | | | | |
3M Co. | | 15,578 | | 1,314 |
ABB, Ltd. - ADR | | 28,350 | | 816 |
Brunswick Corp. (Ñ) | | 31,400 | | 535 |
General Electric Co. | | 322,700 | | 11,963 |
Textron, Inc. | | 41,600 | | 2,966 |
Tyco International, Ltd. | | 3,700 | | 147 |
| | | | |
| | | | 17,741 |
| | | | |
| | |
Other Energy - 4.9% | | | | |
Baker Hughes, Inc. | | 22,600 | | 1,833 |
Cameron International Corp. (Æ)(Ñ) | | 33,860 | | 1,630 |
Consol Energy, Inc. | | 13,080 | | 936 |
Continental Resources, Inc. (Æ)(Ñ) | | 4,100 | | 107 |
Devon Energy Corp. (Ñ) | | 40,967 | | 3,642 |
Diamond Offshore Drilling, Inc. (Ñ) | | 5,310 | | 754 |
Frontier Oil Corp. (Ñ) | | 5,900 | | 239 |
Halliburton Co. (Ñ) | | 46,900 | | 1,778 |
National Oilwell Varco, Inc. (Æ) | | 15,300 | | 1,124 |
Patterson - UTI Energy, Inc. (Ñ) | | 7,900 | | 154 |
Schlumberger, Ltd. | | 52,100 | | 5,125 |
Sunoco, Inc. | | 13,000 | | 942 |
Valero Energy Corp. | | 8,500 | | 595 |
Western Refining, Inc. (Ñ) | | 1,800 | | 44 |
Williams Cos., Inc. | | 40,555 | | 1,451 |
XTO Energy, Inc. (Ñ) | | 59,850 | | 3,074 |
| | | | |
| | | | 23,428 |
| | | | |
Producer Durables - 4.4% | | | | |
Applied Materials, Inc. | | 115,170 | | 2,045 |
Deere & Co. (Ñ) | | 26,780 | | 2,494 |
Diebold, Inc. | | 16,600 | | 481 |
| | |
| Multi-Style Equity Fund | | 15 |
Russell Investment Funds
Multi-Style Equity Fund
Schedule of Investments, continued — December 31, 2007
Amounts in thousands (except share amounts)
| | | | |
| | | Principal
Amount ($)
or Shares | | Market
Value
$ |
| | | | |
Dover Corp. | | 23,700 | | 1,092 |
DR Horton, Inc. (Ñ) | | 17,500 | | 230 |
Emerson Electric Co. | | 63,900 | | 3,621 |
Gardner Denver, Inc. (Æ) | | 3,900 | | 129 |
Graco, Inc. (Ñ) | | 15,300 | | 570 |
KB Home (Ñ) | | 10,600 | | 229 |
Lexmark International, Inc. Class A (Æ)(Ñ) | | 6,500 | | 227 |
Molex, Inc. (Ñ) | | 22,500 | | 614 |
Nokia OYJ - ADR | | 41,800 | | 1,605 |
Northrop Grumman Corp. | | 7,200 | | 566 |
Parker Hannifin Corp. (Ñ) | | 20,382 | | 1,535 |
Pentair, Inc. | | 22,700 | | 790 |
Raytheon Co. (Ñ) | | 28,126 | | 1,707 |
Roper Industries, Inc. (Ñ) | | 6,730 | | 421 |
Steelcase, Inc. Class A (Ñ) | | 7,600 | | 121 |
United Technologies Corp. | | 22,404 | | 1,715 |
Varian Semiconductor Equipment Associates, Inc. (Æ)(Ñ) | | 9,050 | | 335 |
Waters Corp. (Æ) | | 5,540 | | 438 |
| | | | |
| | | | 20,965 |
| | | | |
| | |
Technology - 16.1% | | | | |
Advanced Micro Devices, Inc. (Æ)(Ñ) | | 21,800 | | 163 |
Amphenol Corp. Class A (Ñ) | | 57,766 | | 2,679 |
Analog Devices, Inc. (Ñ) | | 52,497 | | 1,664 |
Apple, Inc. (Æ) | | 44,910 | | 8,896 |
Applera Corp. - Applied Biosystems Group | | 23,200 | | 787 |
AU Optronics Corp. - ADR | | 1 | | — |
Broadcom Corp. Class A (Æ)(Ñ) | | 16,900 | | 442 |
Cisco Systems, Inc. (Æ) | | 339,440 | | 9,189 |
Citrix Systems, Inc. (Æ) | | 8,320 | | 316 |
Computer Sciences Corp. (Æ)(Ñ) | | 9,200 | | 455 |
Corning, Inc. 2008 | | 39,300 | | 943 |
Dell, Inc. (Æ)(Ñ) | | 46,800 | | 1,147 |
Electronic Data Systems Corp. | | 18,600 | | 386 |
EMC Corp. (Æ) | | 42,500 | | 788 |
First Solar, Inc. (Æ)(Ñ) | | 2,400 | | 641 |
Garmin, Ltd. (Ñ) | | 10,400 | | 1,009 |
General Dynamics Corp. | | 6,100 | | 543 |
Hewlett-Packard Co. | | 121,900 | | 6,153 |
Intel Corp. | | 269,300 | | 7,180 |
International Business Machines Corp. | | 10,100 | | 1,092 |
Juniper Networks, Inc. (Æ)(Ñ) | | 44,640 | | 1,482 |
Linear Technology Corp. (Ñ) | | 10,500 | | 334 |
LSI Corp. (Æ)(Ñ) | | 19,500 | | 104 |
Maxim Integrated Products, Inc. (Ñ) | | 84,400 | | 2,235 |
| | | | |
| | | Principal
Amount ($)
or Shares | | Market
Value
$ |
MEMC Electronic Materials, Inc. (Æ) | | 15,100 | | 1,336 |
Microsoft Corp. | | 227,879 | | 8,112 |
Motorola, Inc. | | 147,000 | | 2,358 |
Nvidia Corp. (Ñ) | | 24,300 | | 827 |
Qualcomm, Inc. | | 91,500 | | 3,600 |
Research In Motion, Ltd. (Æ) | | 24,795 | | 2,812 |
Salesforce.com, Inc. (Æ)(Ñ) | | 5,970 | | 374 |
Sanmina-SCI Corp. (Æ) | | 46,400 | | 84 |
Seagate Technology | | 24,320 | | 620 |
Seagate Technology, Inc. (Æ) | | 2,300 | | — |
Sun Microsystems, Inc. (Æ) | | 27,125 | | 492 |
Sunpower Corp. Class A (Æ)(Ñ) | | 6,280 | | 819 |
Taiwan Semiconductor Manufacturing Co., Ltd. - ADR | | 102,334 | | 1,019 |
Texas Instruments, Inc. | | 55,450 | | 1,852 |
Tyco Electronics, Ltd. | | 96,933 | | 3,599 |
Unisys Corp. (Æ)(Ñ) | | 7,200 | | 34 |
VMware, Inc. Class A (Æ)(Ñ) | | 4,400 | | 374 |
Western Digital Corp. (Æ)(Ñ) | | 7,100 | | 214 |
| | | | |
| | | | 77,154 |
| | | | |
| | |
Utilities - 4.0% | | | | |
AGL Resources, Inc. | | 10,500 | | 395 |
Alliant Energy Corp. (Ñ) | | 6,800 | | 277 |
Aqua America, Inc. (Ñ) | | 31,800 | | 674 |
AT&T, Inc. | | 139,011 | | 5,777 |
Citizens Communications Co. (Ñ) | | 63,300 | | 806 |
Edison International (Ñ) | | 9,600 | | 512 |
Embarq Corp. | | 5,900 | | 292 |
NiSource, Inc. (Ñ) | | 23,300 | | 440 |
Pepco Holdings, Inc. | | 21,300 | | 625 |
PG&E Corp. (Ñ) | | 8,100 | | 349 |
Progress Energy, Inc. - CVO | | 1,300 | | — |
Public Service Enterprise Group, Inc. | | 500 | | 49 |
SCANA Corp. | | 7,800 | | 329 |
TECO Energy, Inc. (Ñ) | | 21,100 | | 363 |
Telephone & Data Systems, Inc. | | 1,400 | | 88 |
Verizon Communications, Inc. (Ñ) | | 93,500 | | 4,085 |
Vimpel-Communications - ADR | | 25,000 | | 1,040 |
Vodafone Group PLC - ADR | | 56,750 | | 2,118 |
Windstream Corp. (Ñ) | | 61,900 | | 806 |
| | | | |
| | | | 19,025 |
| | | | |
| | |
| Total Common Stocks | | | | |
(cost $411,021) | | | | 458,172 |
| | | | |
| | |
| 16 | | Multi-Style Equity Fund |
Russell Investment Funds
Multi-Style Equity Fund
Schedule of Investments, continued — December 31, 2007
Amounts in thousands (except share amounts)
| | | | | |
| | | Principal
Amount ($)
or Shares | | Market
Value
$ | |
| | | | | |
Short-Term Investments - 4.5% | | | |
Russell Investment Company Money Market Fund | | 20,640,000 | | 20,640 | |
United States Treasury Bills (ž)(§) | | | | | |
2.962% due 03/20/08 | | 1,200 | | 1,191 | |
| | | | | |
| | |
Total Short-Term Investments
| | | | | |
(cost $21,832) | | | | 21,831 | |
| | | | | |
| | |
| Other Securities - 23.0% | | | | | |
State Street Securities Lending Quality Trust (×) | | 110,488,585 | | 110,489 | |
| | | | | |
| | |
Total Other Securities
| | | | | |
(cost $110,489) | | | | 110,489 | |
| | | | | |
| | |
| Total Investments - 123.0% | | | | | |
(identified cost $543,342) | | | | 590,492 | |
| | |
| Other Assets and Liabilities, Net - (23.0%) | | | | (110,570 | ) |
| | | | | |
| | |
| Net Assets - 100.0% | | | | 479,922 | |
| | | | | |
See accompanying notes which are an integral part of the financial statements.
| | |
| Multi-Style Equity Fund | | 17 |
Russell Investment Funds
Multi-Style Equity Fund
Schedule of Investments, continued — December 31, 2007
Amounts in thousands (except share amounts)
| | | | | | |
Futures Contracts
(Number of Contracts) | | Notional
Amount | | Unrealized
Appreciation
(Depreciation)
$ | |
| | | | | | |
| | | | | | |
Long Positions | | | | | | |
Russell 1000 Index expiration date 03/08 (7) | | USD | 2,818 | | (29 | ) |
S&P 500 E-Mini Index (CME) expiration date 03/08 (50) | | USD | 3,693 | | (53 | ) |
S&P 500 Index (CME)
expiration date 03/08 (8) | | USD | 2,954 | | (40 | ) |
S&P Midcap 400 E-Mini Index (CME)
expiration date 03/08 (138) | | USD | 11,934 | | (176 | ) |
| | | | | | |
| | |
Total Unrealized Appreciation (Depreciation) on Open Futures Contracts | | | | | (298 | ) |
| | | | | | |
Presentation of Portfolio Holdings — December 31, 2007
| | | |
| Portfolio Summary | | % of Net
Assets | |
| | | |
| | | |
Auto and Transportation | | 1.4 | |
Consumer Discretionary | | 10.8 | |
Consumer Staples | | 8.4 | |
Financial Services | | 14.2 | |
Health Care | | 14.9 | |
Integrated Oils | | 6.2 | |
Materials and Processing | | 6.5 | |
Miscellaneous | | 3.7 | |
Other Energy | | 4.9 | |
Producer Durables | | 4.4 | |
Technology | | 16.1 | |
Utilities | | 4.0 | |
Short-Term Investments | | 4.5 | |
Other Securities | | 23.0 | |
| | | |
| |
Total Investments | | 123.0 | |
Other Assets and Liabilities, Net | | (23.0 | ) |
| | | |
| |
| | 100.0 | |
| | | |
| |
Futures Contracts | | (0.1 | ) |
See accompanying notes which are an integral part of the financial statements.
| | |
| 18 | | Multi-Style Equity Fund |
(This page intentionally left blank)
Russell Investment Funds
Aggressive Equity Fund
Portfolio Management Discussion and Analysis — December 31, 2007 (Unaudited)
| | | |
|
| Aggressive Equity Fund | |
| | | Total
Return | |
1 Year | | 3.42 | % |
5 Years | | 16.10 | %§ |
10 Years | | 5.90 | %§ |
| | | |
|
| Russell 2500™ Index ** | |
| | | Total
Return | |
1 Year | | 1.38 | % |
5 Years | | 16.99 | %§ |
10 Years | | 9.01 | %§ |
| * | | Assumes initial investment on January 1, 1998. |
** | | Russell 2500™ Index is composed of the bottom 500 stocks the Russell 1000® Index and all the stocks in the Russell 2000® Index. The Russell 2500™ Index return reflects adjustments for income dividends and capital gains distributions reinvested as of the ex-dividend dates. |
Performance is historical and assumes reinvestment of all dividends and capital gains. Investment return and principal value will fluctuate so that an investor’s shares, when redeemed, may be worth more or less than when purchased. Past performance is not indicative of future results.
| | |
| 20 | | Aggressive Equity Fund |
Russell Investment Funds
Aggressive Equity Fund
Portfolio Management Discussion and Analysis — December 31, 2007 (Unaudited)
The Aggressive Equity Fund (the “Fund”) allocates most of its assets among multiple money managers. Russell Investment Management Company (“RIMCo”), as the Fund’s advisor, may change the allocation of the Fund’s assets among money managers at any time. An exemptive order from the Securities and Exchange Commission (SEC) permits RIMCo to engage or terminate a money manager at any time, subject to the approval by the Fund’s Board without a shareholder vote. Pursuant to the terms of the exemptive order, the Fund is required to notify its shareholders within 60 days of when a money manager begins providing services. The Fund currently has eight money managers.
What is the Fund’s investment objective?
The Fund seeks to provide long term capital growth.
How did the Fund perform relative to its benchmark for the fiscal year ended December 31, 2007?
For the fiscal year ended December 31, 2007, the Aggressive Equity Fund gained 3.42%. This compared to the Russell 2500™ Index, which gained 1.38% during the same period. The Fund’s performance includes operating expenses, whereas Index returns are unmanaged and do not include expenses of any kind.
For the year ended December 31, 2007, the Lipper® Small-Cap Core Funds (VIP) Average returned -1.64%. This result serves as a peer comparison and is expressed net of operating expenses.
How did the market conditions described in the Market Summary report affect the Fund’s performance?
The switch from value leadership to growth leadership helped the Fund during the year as the Fund was overweight stocks with higher estimated earnings. Additionally, the Fund was underweight deeper value stocks.
Throughout the year, stock selection in consumer discretionary and financial services was additive. Stock returns within these sectors were extremely volatile depending on their exposure to subprime mortgages and housing. This presented a positive environment for active managers to outperform based on stock selection.
Additionally, exposure to U.S. companies with non-U.S. sales tended to help managers particularly as the U.S. dollar fell and investors began to question the strength of the U.S. consumer. Managers also benefited by being underweight sectors with exposure to housing or credit risk. Engineering, solar energy, and chemicals companies held by the Fund contributed positively to performance.
How did the investment strategies and techniques employed by the Fund and its money managers affect its performance?
The Fund outperformed its Index for the year. Returns were largely driven by stock selection in the consumer discretionary sector as well as an underweight to financial services. The high growth and high valuation stocks performed best.
Gould Investment Partners LLC and Tygh Capital Management, Inc. were the best performing managers in the Fund. Gould’s outperformance was driven largely by stock selection in the consumer discretionary sector. Additionally, Gould’s stock selection in producer durables, technology, and other energy were additive. The largest contributor at the stock level was Crocs, which was up 70.42% for the year and consistently one of Gould’s largest holdings. Solar stocks (Suntech Power Holdings, SunPower Corp, JA Solar Holdings, First Solar) were a major source of Gould’s returns throughout the year. Gould benefited significantly by investing in high-growth stocks regardless of valuations, both factors that were rewarded significantly throughout most of the year.
Tygh benefited from stock selection in the consumer discretionary and technology sectors in addition to strong stock selection in industrial stocks such as McDermott International and Foster Wheeler. The consumer discretionary sector was led by an overweight in aQuantive, which was up significantly. Consumer discretionary companies that focused on home entertainment systems led the sector. Tygh benefited significantly from not being overly valuation sensitive, as valuation metrics underperformed during the year due to the shift from value leadership to growth leadership.
PanAgora Asset Management, Inc. and Jacobs Levy Equity Management, Inc. underperformed the Fund’s benchmark. Exposure to ten of the twelve economic sectors negatively contributed to performance. Stock selection in financial services, consumer discretionary, and health care sectors was the largest detractor. PanAgora’s exposure to valuation factors was a detriment, as these factors went largely unrewarded in the market as growth began to outperform value. Additionally, selection of lower market capitalization securities detracted from performance.
Jacobs Levy’s underperformance was due to its overweight in the consumer discretionary sector, a combination of its underweight and weak stock selection in the other energy sector, and its underweight in the utilities sector. Additionally, Jacob Levy’s weak stock selection in the technology sector detracted from performance.
| | |
| Aggressive Equity Fund | | 21 |
Russell Investment Funds
Aggressive Equity Fund
Portfolio Management Discussion and Analysis — December 31, 2007 (Unaudited)
Describe any changes to the Fund’s structure or the money manager line-up.
In March 2007, DePrince, Race & Zollo, Inc. was hired to replace Geewax, Terker & Company and Nicholas-Applegate Capital Management, LLC. Also in March, pursuant to an asset purchase agreement with CapitalWorks Investment Partners, LLC, the CapitalWorks investment team became Berkeley Capital Management, LLP. In September of 2007, Berkeley was replaced with Ranger Investment Management, LP.
| | |
| |
Money Managers as of
December 31, 2007 | | Styles |
ClariVest Asset Management LLC | | Market-Oriented |
David J. Greene and Company, LLC | | Value |
DePrince, Race & Zollo, Inc. | | Value |
Gould Investment Partners LLC | | Growth |
Jacobs Levy Equity Management, Inc. | | Value |
PanAgora Asset Management, Inc. | | Market-Oriented |
Ranger Investment Management, L.P. | | Growth |
Tygh Capital Management, Inc. | | Growth |
The views expressed in this report reflect those of the portfolio managers only through the end of the period covered by the report. These views do not necessarily represent the views of Russell Investment Management Company (RIMCo), or any other person in RIMCo or any other affiliated organization. These views are subject to change at any time based upon market conditions or other events, and RIMCo disclaims any responsibility to update the views contained herein. These views should not be relied on as investment advice and, because investment decisions for Russell Investment Funds (RIF) are based on numerous factors, should not be relied on as an indication of investment decisions of any RIF Fund.
| | |
| 22 | | Aggressive Equity Fund |
Russell Investment Funds
Aggressive Equity Fund
Shareholder Expense Example — December 31, 2007 (Unaudited)
Fund Expenses
The following disclosure provides important information regarding each Fund’s Expense Example, which appears on each Fund’s individual page in this Annual Report. Please refer to this information when reviewing the Expense Example for a Fund.
Example
As a shareholder of the Fund, you incur two types of costs: (1) transaction costs, and (2) ongoing costs, including management fees and other Fund expenses. The Example is intended to help you understand your ongoing costs (in dollars) of investing in the Fund and to compare these costs with the ongoing costs of investing in other mutual funds. The Example is based on an investment of $1,000 invested at the beginning of the period and held for the entire period indicated, which for this Fund is from July 1, 2007 to December 31, 2007.
Actual Expenses
The information in the table under the heading “Actual Performance” provides information about actual account values and actual expenses. You may use the information in this column, together with the amount you invested, to estimate the expenses that you paid over the period. Simply divide your account value by $1,000 (for example, an $8,600 account value divided by $1,000 = 8.6), then multiply the result by the number in the first column in the row entitled “Expenses Paid During Period” to estimate the expenses you paid on your account during this period.
Hypothetical Example for Comparison Purposes
The information in the table under the heading “Hypothetical Performance (5% return before expenses)” provides information about hypothetical account values and hypothetical expenses based on the Fund’s actual expense ratio and an assumed rate of return of 5% per year before expenses, which is not the Fund’s actual return. The hypothetical account values and expenses may not be used to estimate the actual ending account balance or expenses you paid for the period. You may use this information to compare the ongoing costs of investing in the Fund and other funds. To do so, compare this 5% hypothetical example with the 5% hypothetical examples that appear in the shareholder reports of other funds.
Please note that the expenses shown in the table are meant to highlight your ongoing costs only and do not reflect any transactional costs. Therefore, the information under the heading “Hypothetical Performance (5% return before expenses)” is useful in comparing ongoing costs only, and will not help you determine the relative total costs of owning different funds. In addition, if these transactional costs were included, your costs would have been higher.
| | | | | | |
| | | Actual
Performance | | Hypothetical
Performance
(5% return
before expenses) |
| | | | | | |
Beginning Account Value | | | | | | |
July 1, 2007 | | $ | 1,000.00 | | $ | 1,000.00 |
Ending Account Value | | | | | | |
December 31, 2007 | | $ | 953.90 | | $ | 1,019.91 |
Expenses Paid During Period* | | $ | 5.17 | | $ | 5.35 |
| * | Expenses are equal to the Fund’s annualized expense ratio of 1.05% (representing the six month period annualized), multiplied by the average account value over the period, multiplied by 184/365 (to reflect the one-half year period). Reflects amounts waived and/or reimbursed by the investment adviser. Without the waiver and/or reimbursement, expenses would have been higher. |
| | |
| Aggressive Equity Fund | | 23 |
Russell Investment Funds
Aggressive Equity Fund
Schedule of Investments — December 31, 2007
Amounts in thousands (except share amounts)
| | | | |
| | | Principal
Amount ($)
or Shares | | Market
Value
$ |
| | | | |
Common Stocks - 96.3% | | | | |
Auto and Transportation - 2.7% | | | | |
AAR Corp. (Æ)(Ñ) | | 24,492 | | 931 |
ABX Holdings, Inc. (Æ)(Ñ) | | 100 | | — |
Accuride Corp. (Æ) | | 248 | | 2 |
Aftermarket Technology Corp. (Æ) | | 6,800 | | 185 |
Alaska Air Group, Inc. (Æ)(Ñ) | | 5,200 | | 130 |
Allegiant Travel Co. (Æ)(Ñ) | | 5,000 | | 161 |
Amerigon, Inc. (Æ)(Ñ) | | 9,300 | | 197 |
Autoliv, Inc. | | 55 | | 3 |
BorgWarner, Inc. | | 18 | | 1 |
Con-way, Inc. (Ñ) | | 6,000 | | 249 |
Continental Airlines, Inc. Class A (Æ) | | 9,778 | | 218 |
Dana Corp. (Æ)(Ñ) | | 47,300 | | 1 |
Danaos Corp. | | 4,200 | | 111 |
Double Hull Tankers, Inc. (Ñ) | | 15,000 | | 184 |
Expeditors International of Washington, Inc. (Ñ) | | 6,801 | | 304 |
Genco Shipping & Trading, Ltd. (Ñ) | | 1,800 | | 99 |
Hub Group, Inc. Class A (Æ) | | 11,515 | | 306 |
Kansas City Southern (Æ)(Ñ) | | 5,700 | | 196 |
Kirby Corp. (Æ)(Ñ) | | 8,651 | | 402 |
Lear Corp. (Æ) | | 4,600 | | 127 |
Modine Manufacturing Co. (Ñ) | | 6,900 | | 114 |
Navistar International Corp. (Æ)(Ñ) | | 2,000 | | 108 |
Northwest Airlines Corp. (Æ) | | 9,600 | | 139 |
Overseas Shipholding Group, Inc. | | 2,900 | | 216 |
Skywest, Inc. (Ñ) | | 5,974 | | 160 |
Standard Motor Products, Inc. | | 3,312 | | 27 |
Stoneridge, Inc. (Æ)(Ñ) | | 1,600 | | 13 |
TBS International, Ltd. Class A (Æ)(Ñ) | | 600 | | 20 |
Tidewater, Inc. | | 323 | | 18 |
TRW Automotive Holdings Corp. (Æ)(Ñ) | | 11,200 | | 234 |
UAL Corp. (Æ) | | 4,478 | | 160 |
US Airways Group, Inc. (Æ)(Ñ) | | 13,000 | | 191 |
UTI Worldwide, Inc. (Ñ) | | 11,708 | | 229 |
Visteon Corp. (Æ)(Ñ) | | 9,700 | | 43 |
Wabtec Corp. (Ñ) | | 20,300 | | 699 |
| | | | |
| | | | 6,178 |
| | | | |
| |
Consumer Discretionary - 14.6% | | |
Abercrombie & Fitch Co. Class A | | 6,970 | | 557 |
ABM Industries, Inc. (Ñ) | | 3,500 | | 71 |
Activision, Inc. (Æ) | | 45,968 | | 1,365 |
Administaff, Inc. | | 1,791 | | 51 |
Advance Auto Parts, Inc. (Ñ) | | 4,800 | | 182 |
Advisory Board Co. (The) (Æ)(Ñ) | | 7,569 | | 486 |
| | | | |
| | | Principal
Amount ($)
or Shares | | Market
Value
$ |
AFC Enterprises (Æ)(Ñ) | | 5,000 | | 57 |
Alberto-Culver Co. Class B | | 12,700 | | 312 |
American Woodmark Corp. | | 6,145 | | 112 |
Ameristar Casinos, Inc. (Ñ) | | 17,200 | | 474 |
Apollo Group, Inc. Class A (Æ) | | 5,799 | | 407 |
Asbury Automotive Group, Inc. (Ñ) | | 4,100 | | 62 |
AutoNation, Inc. (Æ)(Ñ) | | 19,000 | | 298 |
Bally Technologies, Inc. (Æ)(Ñ) | | 18,388 | | 914 |
Barnes & Noble, Inc. | | 9,300 | | 320 |
Big Lots, Inc. (Æ) | | 11,019 | | 176 |
BJ’s Wholesale Club, Inc. (Æ)(Ñ) | | 17,000 | | 575 |
Black & Decker Corp. | | 3,058 | | 213 |
Blockbuster, Inc. Class A (Æ) | | 27,999 | | 109 |
Blyth, Inc. (Ñ) | | 6,200 | | 136 |
Bob Evans Farms, Inc. | | 1,819 | | 49 |
Books-A-Million, Inc. Class A | | 437 | | 5 |
Borders Group, Inc. (Ñ) | | 24,634 | | 262 |
Brightpoint, Inc. (Æ)(Ñ) | | 22,400 | | 344 |
Brown Shoe Co., Inc. (Ñ) | | 9,900 | | 150 |
Buckle, Inc. (The) | | 4,600 | | 152 |
Capella Education Co. (Æ)(Ñ) | | 500 | | 33 |
Carter’s, Inc. (Æ)(Ñ) | | 4,400 | | 85 |
CBRL Group, Inc. | | 6,879 | | 223 |
CDI Corp. (Ñ) | | 2,100 | | 51 |
Chemed Corp. (Ñ) | | 11,286 | | 631 |
Chipotle Mexican Grill, Inc. Class A (Æ)(Ñ) | | 3,700 | | 544 |
Churchill Downs, Inc. (Ñ) | | 4,700 | | 254 |
CMGI, Inc. (Æ)(Ñ) | | 13,980 | | 183 |
Convergys Corp. (Æ) | | 41,552 | | 684 |
Corinthian Colleges, Inc. (Æ)(Ñ) | | 15,100 | | 233 |
Corrections Corp. of America (Æ)(Ñ) | | 9,800 | | 289 |
CROCS, Inc. (Æ)(Ñ) | | 10,500 | | 387 |
CSS Industries, Inc. (Ñ) | | 1,500 | | 55 |
Denny’s Corp. (Æ) | | 12,278 | | 46 |
DeVry, Inc. | | 2,471 | | 128 |
Discovery Holding Co. Class A (Æ)(Ñ) | | 6,700 | | 168 |
Dolby Laboratories, Inc. Class A (Æ) | | 12,600 | | 626 |
Dollar Tree Stores, Inc. (Æ) | | 16,259 | | 421 |
DreamWorks Animation SKG, Inc. Class A (Æ)(Ñ) | | 13,956 | | 356 |
DynCorp International, Inc. Class A (Æ)(Ñ) | | 8,200 | | 220 |
Earthlink, Inc. (Æ)(Ñ) | | 37,900 | | 268 |
Electronic Arts, Inc. (Æ)(Ñ) | | 8,964 | | 524 |
Family Dollar Stores, Inc. | | 268 | | 5 |
Focus Media Holding, Ltd. - ADR (Æ)(Ñ) | | 8,600 | | 489 |
FTD Group, Inc. (Ñ) | | 22,600 | | 291 |
| | |
| 24 | | Aggressive Equity Fund |
Russell Investment Funds
Aggressive Equity Fund
Schedule of Investments, continued — December 31, 2007
Amounts in thousands (except share amounts)
| | | | |
| | | Principal
Amount ($)
or Shares | | Market
Value
$ |
| | | | |
FTI Consulting, Inc. (Æ)(Ñ) | | 12,300 | | 758 |
Gaiam, Inc. Class A (Æ)(Ñ) | | 10,900 | | 324 |
GameStop Corp. Class A (Æ)(Ñ) | | 5,799 | | 360 |
Gaylord Entertainment Co. (Æ)(Ñ) | | 4,900 | | 198 |
Geo Group, Inc. (The) (Æ)(Ñ) | | 21,722 | | 608 |
Gray Television, Inc. (Ñ) | | 34,500 | | 277 |
Great Lakes Dredge & Dock Co. | | 2,300 | | 20 |
Greenfield Online, Inc. (Æ) | | 7,127 | | 104 |
Group 1 Automotive, Inc. (Ñ) | | 5,200 | | 124 |
Harris Interactive, Inc. (Æ)(Ñ) | | 5,100 | | 22 |
Hasbro, Inc. (Ñ) | | 22,470 | | 575 |
Hertz Global Holdings, Inc. (Æ)(Ñ) | | 9,700 | | 154 |
Hewitt Associates, Inc. Class A (Æ) | | 17,134 | | 656 |
Hooker Furniture Corp. (Ñ) | | 1,000 | | 20 |
ICF International, Inc. (Æ)(Ñ) | | 7,300 | | 184 |
IHOP Corp. | | 2,522 | | 92 |
IKON Office Solutions, Inc. | | 3,662 | | 48 |
Infospace, Inc. | | 6,100 | | 115 |
infoUSA, Inc. (Ñ) | | 21,671 | | 194 |
Insight Enterprises, Inc. (Æ)(Ñ) | | 1,000 | | 18 |
International Speedway Corp. Class A | | 4,600 | | 189 |
inVentiv Health, Inc. (Æ)(Ñ) | | 12,600 | | 390 |
Jack in the Box, Inc. (Æ) | | 7,900 | | 204 |
Jakks Pacific, Inc. (Æ)(Ñ) | | 6,600 | | 156 |
Jo-Ann Stores, Inc. (Æ) | | 7,836 | | 103 |
Journal Communications, Inc. Class A (Ñ) | | 8,000 | | 72 |
Kelly Services, Inc. Class A (Ñ) | | 3,400 | | 63 |
Kenneth Cole Productions, Inc. Class A (Ñ) | | 2,700 | | 47 |
Leapfrog Enterprises, Inc. Class A (Æ)(Ñ) | | 5,800 | | 39 |
Learning Tree International, Inc. (Æ) | | 8,666 | | 199 |
LECG Corp. (Æ) | | 102 | | 2 |
Lin TV Corp. Class A (Æ)(Ñ) | | 5,600 | | 68 |
LKQ Corp. (Æ) | | 15,690 | | 330 |
Maidenform Brands, Inc. (Æ)(Ñ) | | 2,500 | | 34 |
MAXIMUS, Inc. | | 2,589 | | 100 |
Meredith Corp. (Ñ) | | 2,600 | | 143 |
Mohawk Industries, Inc. (Æ) | | 1,287 | | 96 |
MSC Industrial Direct Co. Class A (Ñ) | | 4,654 | | 188 |
Net 1 UEPS Technologies, Inc. (Æ) | | 4,170 | | 122 |
New Oriental Education & Technology Group - ADR (Æ) | | 5,400 | | 435 |
Nu Skin Enterprises, Inc. Class A (Ñ) | | 4,300 | | 71 |
O’Charleys, Inc. (Ñ) | | 18,594 | | 279 |
O’Reilly Automotive, Inc. (Æ)(Ñ) | | 14,191 | | 460 |
Orient-Express Hotels, Ltd. Class A (Ñ) | | 7,362 | | 423 |
| | | | |
| | | Principal
Amount ($)
or Shares | | Market
Value
$ |
Overstock.com, Inc. (Æ) | | 2,887 | | 45 |
Papa John’s International, Inc. (Æ)(Ñ) | | 5,400 | | 123 |
PC Connection, Inc. (Æ)(Ñ) | | 2,800 | | 32 |
Perficient, Inc. (Æ)(Ñ) | | 39,900 | | 628 |
Perry Ellis International, Inc. (Æ)(Ñ) | | 8,776 | | 135 |
Phillips-Van Heusen Corp. (Ñ) | | 10,000 | | 369 |
Pier 1 Imports, Inc. (Æ)(Ñ) | | 31,600 | | 165 |
Prestige Brands Holdings, Inc. (Æ) | | 2,010 | | 15 |
Quiksilver, Inc. (Æ)(Ñ) | | 26,900 | | 231 |
RadioShack Corp. | | 12,112 | | 204 |
Red Robin Gourmet Burgers, Inc. (Æ) | | 1,748 | | 56 |
Rent-A-Center, Inc. Class A (Æ) | | 3,300 | | 48 |
Republic Services, Inc. Class A | | 23,689 | | 743 |
Revlon, Inc. Class A (Æ)(Ñ) | | 11,100 | | 13 |
Rush Enterprises, Inc. Class A (Æ) | | 2,295 | | 42 |
Scholastic Corp. (Æ)(Ñ) | | 11,290 | | 394 |
Service Corp. International (Ñ) | | 12,400 | | 174 |
Shanda Interactive Entertainment, Ltd. - ADR (Æ)(Ñ) | | 9,600 | | 320 |
Sinclair Broadcast Group, Inc. Class A (Ñ) | | 27,581 | | 226 |
Sohu.com, Inc. (Æ)(Ñ) | | 1,900 | | 104 |
Sonic Automotive, Inc. Class A (Ñ) | | 5,800 | | 112 |
Source Interlink Cos., Inc. (Æ)(Ñ) | | 11,200 | | 32 |
Spectrum Brands, Inc. (Æ)(Ñ) | | 7,500 | | 40 |
Speedway Motorsports, Inc. (Ñ) | | 1,400 | | 44 |
Spherion Corp. (Æ)(Ñ) | | 28,200 | | 205 |
Stewart Enterprises, Inc. Class A (Ñ) | | 30,300 | | 270 |
Strayer Education, Inc. (Ñ) | | 1,800 | | 307 |
Tech Data Corp. (Æ) | | 8,045 | | 303 |
Tiffany & Co. | | 4,115 | | 189 |
Toro Co. (Ñ) | | 1,700 | | 93 |
United Natural Foods, Inc. (Æ)(Ñ) | | 14,450 | | 458 |
United Online, Inc. (Ñ) | | 55,200 | | 652 |
United Stationers, Inc. (Æ)(Ñ) | | 3,400 | | 157 |
Urban Outfitters, Inc. (Æ)(Ñ) | | 24,940 | | 680 |
VeriSign, Inc. (Æ)(Ñ) | | 18,130 | | 682 |
Volcom, Inc. (Æ)(Ñ) | | 9,600 | | 211 |
Volt Information Sciences, Inc. (Æ) | | 2,200 | | 40 |
Warnaco Group, Inc. (The) (Æ)(Ñ) | | 8,300 | | 289 |
Warner Music Group Corp. (Ñ) | | 24,600 | | 149 |
West Marine, Inc. (Æ)(Ñ) | | 5,534 | | 50 |
Westwood One, Inc. (Ñ) | | 17,200 | | 34 |
World Wrestling Entertainment, Inc. Class A (Ñ) | | 14,300 | | 211 |
| | | | |
| | | | 33,372 |
| | | | |
| | |
Consumer Staples - 2.4% | | | | |
Alliance One International, Inc. (Æ)(Ñ) | | 37,391 | | 152 |
| | |
| Aggressive Equity Fund | | 25 |
Russell Investment Funds
Aggressive Equity Fund
Schedule of Investments, continued — December 31, 2007
Amounts in thousands (except share amounts)
| | | | |
| | | Principal
Amount ($)
or Shares | | Market
Value
$ |
| | | | |
B&G Foods, Inc. Class A (Ñ) | | 23,700 | | 242 |
Boston Beer Co., Inc. Class A (Æ)(Ñ) | | 1,469 | | 55 |
Chiquita Brands International, Inc. (Æ) | | 3,094 | | 57 |
Church & Dwight Co., Inc. | | 3,842 | | 208 |
Coca-Cola Bottling Co. Consolidated (Ñ) | | 200 | | 12 |
Del Monte Foods Co. | | 15,500 | | 147 |
Flowers Foods, Inc. (Ñ) | | 2,400 | | 56 |
Fresh Del Monte Produce, Inc. (Æ)(Ñ) | | 24,900 | | 836 |
Green Mountain Coffee Roasters, Inc. (Æ)(Ñ) | | 7,800 | | 317 |
Hormel Foods Corp. | | 2,000 | | 81 |
JM Smucker Co. (The) | | 9,142 | | 470 |
Loews Corp. - Carolina Group | | 7,400 | | 631 |
Molson Coors Brewing Co. Class B (Ñ) | | 8,700 | | 449 |
Nash Finch Co. | | 7,237 | | 255 |
NBTY, Inc. (Æ) | | 7,338 | | 201 |
PepsiAmericas, Inc. (Ñ) | | 8,900 | | 297 |
Ralcorp Holdings, Inc. (Æ) | | 14 | | 1 |
Ruddick Corp. | | 1,600 | | 56 |
Sanderson Farms, Inc. (Ñ) | | 5,852 | | 198 |
Schweitzer-Mauduit International, Inc. | | 4,469 | | 116 |
Spartan Stores, Inc. (Ñ) | | 3,200 | | 73 |
Tootsie Roll Industries, Inc. (Ñ) | | 8,459 | | 232 |
TreeHouse Foods, Inc. (Æ)(Ñ) | | 6,000 | | 138 |
Universal Corp. | | 4,127 | | 211 |
| | | | |
| | | | 5,491 |
| | | | |
| | |
Financial Services - 14.4% | | | | |
Advance America Cash Advance Centers, Inc. | | 7,697 | | 78 |
Affiliated Managers Group, Inc. (Æ)(Ñ) | | 7,755 | | 911 |
Allied World Assurance Co. Holdings, Ltd. | | 3,200 | | 161 |
American Financial Group, Inc. | | 16,641 | | 481 |
Amerisafe, Inc. (Æ) | | 10,294 | | 160 |
AmTrust Financial Services, Inc. | | 3,486 | | 48 |
Annaly Capital Management, Inc. (ö)(Ñ) | | 56,844 | | 1,033 |
Anthracite Capital, Inc. (ö) | | 3,898 | | 28 |
Anworth Mortgage Asset Corp. (ö)(Ñ) | | 32,200 | | 266 |
Apollo Investment Corp. (Ñ) | | 11,000 | | 188 |
Arch Capital Group, Ltd. (Æ)(Ñ) | | 9,200 | | 647 |
Ashford Hospitality Trust, Inc. (ö)(Ñ) | | 23,700 | | 170 |
Aspen Insurance Holdings, Ltd. (Ñ) | | 12,700 | | 366 |
Assurant, Inc. (Ñ) | | 9,404 | | 629 |
Astoria Financial Corp. (Ñ) | | 9,600 | | 223 |
Axis Capital Holdings, Ltd. | | 11,600 | | 452 |
| | | | |
| | | Principal
Amount ($)
or Shares | | Market
Value
$ |
Bancfirst Corp. (Ñ) | | 1,000 | | 43 |
Banco Latinoamericano de Exportaciones SA Class E | | 3,300 | | 54 |
Bancorpsouth, Inc. (Ñ) | | 4,200 | | 99 |
Bank of Hawaii Corp. (Ñ) | | 6,000 | | 307 |
BankUnited Financial Corp. Class A | | 15,336 | | 106 |
BioMed Realty Trust, Inc. (ö) | | 7,000 | | 162 |
BOK Financial Corp. (Ñ) | | 930 | | 48 |
Broadridge Financial Solutions, Inc. (Ñ) | | 30,200 | | 677 |
Calamos Asset Management, Inc. Class A | | 2,886 | | 86 |
Capitol Bancorp, Ltd. | | 2,600 | | 52 |
Capstead Mortgage Corp. (ö)(Ñ) | | 23,200 | | 306 |
Cash America International, Inc. | | 7,797 | | 252 |
CIT Group, Inc. (Ñ) | | 4,800 | | 115 |
City Bank (Ñ) | | 1,200 | | 27 |
City National Corp. (Ñ) | | 3,800 | | 226 |
CNA Surety Corp. (Æ)(Ñ) | | 2,800 | | 55 |
Colonial BancGroup, Inc. (The) | | 203 | | 3 |
Commerce Bancshares, Inc. (Ñ) | | 4,826 | | 216 |
Corus Bankshares, Inc. | | 17,894 | | 191 |
CyberSource Corp. (Æ) | | 17,600 | | 313 |
Darwin Professional Underwriters, Inc. (Æ) | | 900 | | 22 |
Deerfield Capital Corp. (ö)(Ñ) | | 14,400 | | 115 |
Deluxe Corp. (Ñ) | | 35,813 | | 1,178 |
Digital Realty Trust, Inc. (ö) | | 3,493 | | 134 |
Dime Community Bancshares (Ñ) | | 14,100 | | 180 |
DST Systems, Inc. (Æ) | | 1,986 | | 164 |
East West Bancorp, Inc. (Ñ) | | 12,533 | | 304 |
EastGroup Properties, Inc. (ö)(Ñ) | | 700 | | 29 |
Eaton Vance Corp. | | 6,213 | | 282 |
EMC Insurance Group, Inc. (Ñ) | | 900 | | 21 |
Equity Lifestyle Properties, Inc. (ö) | | 1,731 | | 79 |
Euronet Worldwide, Inc. (Æ)(Ñ) | | 26,107 | | 783 |
Evercore Partners, Inc. Class A (Ñ) | | 1,000 | | 22 |
Factset Research Systems, Inc. (Ñ) | | 5,000 | | 279 |
Fair Isaac Corp. | | 115 | | 4 |
FBL Financial Group, Inc. Class A | | 1,800 | | 62 |
FCStone Group, Inc. (Æ)(Ñ) | | 7,900 | | 364 |
Federated Investors, Inc. Class B | | 6,861 | | 282 |
Fidelity National Financial, Inc. Class A (Ñ) | | 17,200 | | 251 |
First American Corp. (Ñ) | | 9,600 | | 328 |
First Marblehead Corp. (The) | | 1,626 | | 25 |
FirstFed Financial Corp. (Æ) | | 4,882 | | 175 |
Flushing Financial Corp. (Ñ) | | 10,800 | | 173 |
Frontier Financial Corp. | | 1,344 | | 25 |
| | |
| 26 | | Aggressive Equity Fund |
Russell Investment Funds
Aggressive Equity Fund
Schedule of Investments, continued — December 31, 2007
Amounts in thousands (except share amounts)
| | | | |
| | | Principal
Amount ($)
or Shares | | Market
Value
$ |
| | | | |
GAMCO Investors, Inc. Class A (Ñ) | | 1,500 | | 104 |
Global Payments, Inc. | | 15,139 | | 704 |
Gramercy Capital Corp. (ö)(Ñ) | | 1,000 | | 24 |
Great Southern Bancorp, Inc. (Ñ) | | 700 | | 15 |
Green Bankshares, Inc. (Ñ) | | 1,200 | | 23 |
Greenhill & Co., Inc. | | 1,738 | | 116 |
Hallmark Financial Services, Inc. (Æ) | | 1,300 | | 21 |
Hanover Insurance Group, Inc. (The) | | 6,000 | | 275 |
Harleysville Group, Inc. (Ñ) | | 2,000 | | 71 |
HCC Insurance Holdings, Inc. | | 9,750 | | 280 |
Heartland Payment Systems, Inc. | | 1,791 | | 48 |
Hercules Technology Growth Capital, Inc. (Ñ) | | 26,300 | | 327 |
Hersha Hospitality Trust (ö)(Ñ) | | 3,400 | | 32 |
Hospitality Properties Trust (ö)(Ñ) | | 10,100 | | 325 |
HRPT Properties Trust (ö)(Ñ) | | 27,400 | | 212 |
Huron Consulting Group, Inc. (Æ)(Ñ) | | 6,300 | | 508 |
Hypercom Corp. (Æ)(Ñ) | | 3,400 | | 17 |
IBERIABANK Corp. (Ñ) | | 1,100 | | 51 |
Imperial Capital Bancorp, Inc. | | 987 | | 18 |
Intervest Bancshares Corp. Class A (Ñ) | | 2,300 | | 40 |
Invesco, Ltd. (Ñ) | | 22,629 | | 710 |
Investors Bancorp, Inc. (Æ) | | 17,700 | | 250 |
Investors Real Estate Trust (ö) | | 2,600 | | 23 |
IPC Holdings, Ltd. (Ñ) | | 13,300 | | 384 |
Jack Henry & Associates, Inc. | | 4,445 | | 108 |
Janus Capital Group, Inc. (Ñ) | | 4,700 | | 154 |
Jefferies Group, Inc. (Ñ) | | 14,828 | | 342 |
JER Investment Trust, Inc. (Æ)(Þ) | | 9,200 | | 99 |
Jones Lang LaSalle, Inc. | | 1,498 | | 107 |
Kearny Financial Corp. (Ñ) | | 5,800 | | 69 |
Liberty Property Trust (ö)(Ñ) | | 7,700 | | 222 |
MCG Capital Corp. (Ñ) | | 9,400 | | 109 |
Meadowbrook Insurance Group, Inc. (Æ)(Ñ) | | 20,200 | | 190 |
MFA Mortgage Investments, Inc. (ö) | | 89,500 | | 828 |
Midwest Banc Holdings, Inc. | | 15,400 | | 191 |
MVC Capital, Inc. | | 2,400 | | 39 |
Nasdaq Stock Market, Inc. (The) (Æ)(Ñ) | | 21,759 | | 1,077 |
National Retail Properties, Inc. (ö) | | 10,722 | | 251 |
Nationwide Financial Services, Inc. | | 5,900 | | 266 |
Nationwide Health Properties, Inc. (ö) | | 418 | | 13 |
NewStar Financial, Inc. (Æ)(Ñ) | | 2,200 | | 18 |
NorthStar Realty Finance Corp. (ö)(Ñ) | | 4,600 | | 41 |
Ocwen Financial Corp. (Æ) | | 8,817 | | 49 |
Odyssey Re Holdings Corp. (Ñ) | | 5,800 | | 213 |
Old National Bancorp (Ñ) | | 15,200 | | 227 |
| | | | |
| | | Principal
Amount ($)
or Shares | | Market
Value
$ |
OMEGA Healthcare Investors, Inc. (ö) | | 1,182 | | 19 |
OneBeacon Insurance Group, Ltd. Class A | | 3,500 | | 75 |
optionsXpress Holdings, Inc. (Ñ) | | 13,757 | | 465 |
Pacific Capital Bancorp NA | | 1,323 | | 27 |
Pennsylvania Real Estate Investment Trust (ö)(Ñ) | | 5,100 | | 151 |
People’s United Financial, Inc. (Ñ) | | 27,207 | | 484 |
Philadelphia Consolidated Holding Co. (Æ) | | 5,247 | | 206 |
Phoenix Cos., Inc. (The) (Ñ) | | 13,100 | | 156 |
Platinum Underwriters Holdings, Ltd. | | 9,900 | | 352 |
Potlatch Corp. (ö)(Ñ) | | 9,788 | | 435 |
Preferred Bank (Ñ) | | 1,050 | | 27 |
Protective Life Corp. | | 7,600 | | 312 |
Provident New York Bancorp (Ñ) | | 3,500 | | 45 |
Raymond James Financial, Inc. (Ñ) | | 24,300 | | 794 |
Realty Income Corp. (ö) | | 4,040 | | 109 |
Reinsurance Group of America, Inc. (Ñ) | | 5,700 | | 299 |
RenaissanceRe Holdings, Ltd. | | 2,400 | | 145 |
Ryder System, Inc. (Ñ) | | 3,800 | | 179 |
S1 Corp. (Æ)(Ñ) | | 35,540 | | 259 |
Safety Insurance Group, Inc. | | 3,611 | | 132 |
SEI Investments Co. (Ñ) | | 29,000 | | 933 |
StanCorp Financial Group, Inc. | | 6,800 | | 343 |
Sterling Bancorp (Ñ) | | 9,100 | | 124 |
Sterling Bancshares, Inc. (Ñ) | | 11,200 | | 125 |
Strategic Hotels & Resorts, Inc. (ö) | | 5,582 | | 93 |
Sun Bancorp, Inc. (Æ)(Ñ) | | 1,500 | | 24 |
Superior Bancorp (Æ)(Ñ) | | 3,700 | | 20 |
SWS Group, Inc. (Ñ) | | 10,327 | | 131 |
Taylor Capital Group, Inc. (Ñ) | | 1,834 | | 37 |
Total System Services, Inc. (Ñ) | | 10,037 | | 281 |
Transatlantic Holdings, Inc. (Ñ) | | 1,600 | | 116 |
United America Indemnity, Ltd. Class A (Æ) | | 3,500 | | 70 |
United Fire & Casualty Co. (Ñ) | | 1,600 | | 47 |
Universal American Financial Corp. (Æ)(Ñ) | | 7,672 | | 196 |
Universal Health Realty Income Trust (ö) | | 1,204 | | 43 |
Unum Group (Ñ) | | 13,600 | | 324 |
Ventas, Inc. (ö) | | 3,424 | | 155 |
ViewPoint Financial Group | | 8,800 | | 145 |
Waddell & Reed Financial, Inc. Class A | | 4,840 | | 175 |
Webster Financial Corp. (Ñ) | | 7,894 | | 252 |
West Coast Bancorp (Ñ) | | 900 | | 17 |
| | |
| Aggressive Equity Fund | | 27 |
Russell Investment Funds
Aggressive Equity Fund
Schedule of Investments, continued — December 31, 2007
Amounts in thousands (except share amounts)
| | | | |
| | | Principal
Amount ($)
or Shares | | Market
Value
$ |
| | | | |
Whitney Holding Corp. (Ñ) | | 6,900 | | 180 |
Wilmington Trust Corp. (Ñ) | | 3,500 | | 123 |
Winthrop Realty Trust (ö) | | 6,900 | | 37 |
WP Stewart & Co., Ltd. (Æ) | | 2,300 | | 12 |
Wright Express Corp. (Æ) | | 3,585 | | 127 |
Zenith National Insurance Corp. (Ñ) | | 13,874 | | 621 |
| | | | |
| | | | 33,073 |
| | | | |
| | |
Health Care - 11.2% | | | | |
Abaxis, Inc. (Æ) | | 8,700 | | 312 |
Accelrys, Inc. (Æ)(Ñ) | | 24,600 | | 185 |
Advanced Medical Optics, Inc. (Æ)(Ñ) | | 14,200 | | 348 |
Air Methods Corp. (Æ) | | 1,067 | | 53 |
Albany Molecular Research, Inc. (Æ) | | 2,654 | | 38 |
Allscripts Healthcare Solutions, Inc. (Æ)(Ñ) | | 18,848 | | 366 |
Alnylam Pharmaceuticals, Inc. (Æ) | | 12 | | — |
Amedisys, Inc. (Æ)(Ñ) | | 6,700 | | 325 |
American Medical Systems Holdings, Inc. (Æ)(Ñ) | | 15,140 | | 219 |
AMERIGROUP Corp. Class A (Æ)(Ñ) | | 19,900 | | 725 |
Amsurg Corp. Class A (Æ) | | 555 | | 15 |
Applera Corp. - Celera Group (Æ) | | 13,500 | | 214 |
Apria Healthcare Group, Inc. (Æ) | | 1,425 | | 31 |
Arthrocare Corp. (Æ)(Ñ) | | 5,156 | | 248 |
Beckman Coulter, Inc. (Ñ) | | 3,100 | | 226 |
Bio-Rad Laboratories, Inc. Class A (Æ) | | 3,700 | | 383 |
Bradley Pharmaceuticals, Inc. (Æ) | | 3,108 | | 61 |
Centene Corp. (Æ)(Ñ) | | 9,900 | | 272 |
Cephalon, Inc. (Æ) | | 2,158 | | 155 |
Cepheid, Inc. (Æ)(Ñ) | | 6,800 | | 179 |
Charles River Laboratories International, Inc. (Æ)(Ñ) | | 2,500 | | 164 |
Community Health Systems, Inc. (Æ)(Ñ) | | 10,800 | | 398 |
Conmed Corp. (Æ)(Ñ) | | 7,831 | | 181 |
Cooper Cos., Inc. (The) (Ñ) | | 11,600 | | 441 |
Cubist Pharmaceuticals, Inc. (Æ) | | 5,598 | | 115 |
Cypress Bioscience, Inc. (Æ) | | 8,100 | | 89 |
Datascope Corp. (Ñ) | | 8,500 | | 309 |
DENTSPLY International, Inc. | | 4,969 | | 224 |
Discovery Laboratories, Inc. (Æ)(Ñ) | | 14,200 | | 31 |
Eclipsys Corp. (Æ) | | 6,231 | | 158 |
Emergency Medical Services Corp. Class A (Æ)(Ñ) | | 4,082 | | 120 |
Endo Pharmaceuticals Holdings, Inc. (Æ) | | 5,692 | | 152 |
eResearchTechnology, Inc. (Æ)(Ñ) | | 22,400 | | 265 |
| | | | |
| | | Principal
Amount ($)
or Shares | | Market
Value
$ |
Gen-Probe, Inc. (Æ)(Ñ) | | 6,100 | | 384 |
Greatbatch, Inc. (Æ) | | 4,590 | | 92 |
Haemonetics Corp. (Æ)(Ñ) | | 9,511 | | 599 |
Hanger Orthopedic Group, Inc. (Æ)(Ñ) | | 1,400 | | 15 |
Health Net, Inc. (Æ) | | 5,114 | | 247 |
Healthspring, Inc. (Æ) | | 25,106 | | 478 |
Healthways, Inc. (Æ)(Ñ) | | 4,426 | | 259 |
Henry Schein, Inc. (Æ) | | 606 | | 37 |
HMS Holdings Corp. (Æ)(Ñ) | | 30,088 | | 999 |
Hologic, Inc. (Æ)(Ñ) | | 12,412 | | 852 |
I-Flow Corp. (Æ) | | 3,615 | | 57 |
Icon PLC - ADR (Æ) | | 8,290 | | 513 |
Illumina, Inc. (Æ)(Ñ) | | 19,472 | | 1,154 |
Immucor, Inc. (Æ)(Ñ) | | 32,424 | | 1,102 |
IMS Health, Inc. | | 5,900 | | 136 |
Intuitive Surgical, Inc. (Æ)(Ñ) | | 2,598 | | 843 |
Invacare Corp. (Ñ) | | 22,068 | | 556 |
Invitrogen Corp. (Æ)(Ñ) | | 8,100 | | 757 |
Isis Pharmaceuticals, Inc. (Æ)(Ñ) | | 6,100 | | 96 |
Kendle International, Inc. (Æ) | | 2,989 | | 146 |
Kindred Healthcare, Inc. (Æ)(Ñ) | | 3,000 | | 75 |
King Pharmaceuticals, Inc. (Æ)(Ñ) | | 34,534 | | 354 |
KV Pharmaceutical Co. Class A (Æ)(Ñ) | | 12,800 | | 365 |
Lincare Holdings, Inc. (Æ) | | 4,049 | | 142 |
Martek Biosciences Corp. (Æ) | | 2,859 | | 85 |
Masimo Corp. (Æ)(Ñ) | | 6,133 | | 242 |
Matria Healthcare, Inc. (Æ) | | 3,593 | | 85 |
Medcath Corp. (Æ) | | 3,698 | | 91 |
Medicis Pharmaceutical Corp. Class A (Ñ) | | 8,664 | | 225 |
Medtox Scientific, Inc. (Æ) | | 1,275 | | 23 |
Meridian Bioscience, Inc. (Ñ) | | 12,000 | | 361 |
Millipore Corp. (Æ)(Ñ) | | 4,100 | | 300 |
Molina Healthcare, Inc. (Æ)(Ñ) | | 5,200 | | 201 |
Myriad Genetics, Inc. (Æ)(Ñ) | | 7,400 | | 344 |
Neurocrine Biosciences, Inc. (Æ)(Ñ) | | 13,100 | | 59 |
NuVasive, Inc. (Æ) | | 3,800 | | 150 |
Omrix Biopharmaceuticals, Inc. (Æ)(Ñ) | | 7,000 | | 243 |
OSI Pharmaceuticals, Inc. (Æ) | | 2,519 | | 122 |
Par Pharmaceutical Cos., Inc. (Æ) | | 3,000 | | 72 |
Patterson Cos., Inc. (Æ) | | 3,740 | | 127 |
Pediatrix Medical Group, Inc. (Æ)(Ñ) | | 12,145 | | 828 |
Perrigo Co. (Ñ) | | 12,053 | | 422 |
Pharmacopeia, Inc. (Æ)(Ñ) | | 16,050 | | 77 |
PharmaNet Development Group, Inc. (Æ) | | 654 | | 26 |
PharMerica Corp. (Æ)(Ñ) | | 9,400 | | 130 |
Phase Forward, Inc. (Æ)(Ñ) | | 2,700 | | 59 |
Psychiatric Solutions, Inc. (Æ)(Ñ) | | 33,199 | | 1,079 |
| | |
| 28 | | Aggressive Equity Fund |
Russell Investment Funds
Aggressive Equity Fund
Schedule of Investments, continued — December 31, 2007
Amounts in thousands (except share amounts)
| | | | |
| | | Principal
Amount ($)
or Shares | | Market
Value
$ |
| | | | |
Quality Systems, Inc. (Ñ) | | 10,474 | | 319 |
Resmed, Inc. (Æ)(Ñ) | | 8,335 | | 438 |
Sciele Pharma, Inc. (Æ) | | 5,609 | | 115 |
Sirona Dental Systems, Inc. (Æ)(Ñ) | | 15,510 | | 519 |
SurModics, Inc. (Æ) | | 167 | | 9 |
Symmetry Medical, Inc. (Æ) | | 2,116 | | 37 |
Techne Corp. (Æ) | | 9,496 | | 627 |
VCA Antech, Inc. (Æ) | | 15,600 | | 690 |
Watson Pharmaceuticals, Inc. Class B (Æ) | | 9,726 | | 264 |
WellCare Health Plans, Inc. (Æ) | | 579 | | 25 |
West Pharmaceutical Services, Inc. | | 1,300 | | 53 |
| | | | |
| | | | 25,707 |
| | | | |
| |
Materials and Processing - 11.5% | | |
Airgas, Inc. | | 12,845 | | 669 |
AK Steel Holding Corp. (Æ) | | 3,544 | | 164 |
Albemarle Corp. (Ñ) | | 16,288 | | 672 |
Ashland, Inc. (Ñ) | | 6,300 | | 299 |
Ball Corp. | | 8,784 | | 395 |
Barnes Group, Inc. (Ñ) | | 9,936 | | 332 |
Bluegreen Corp. (Æ)(Ñ) | | 3,000 | | 22 |
Buckeye Technologies, Inc. (Æ)(Ñ) | | 41,375 | | 517 |
Cambrex Corp. (Ñ) | | 23,500 | | 197 |
Carpenter Technology Corp. (Ñ) | | 6,926 | | 521 |
Celanese Corp. Class A | | 23,389 | | 990 |
CF Industries Holdings, Inc. | | 4,144 | | 456 |
Chemtura Corp. | | 52,600 | | 410 |
Chicago Bridge & Iron Co. NV | | 12,423 | | 751 |
Cie Generale de Geophysique-Veritas - ADR (Æ) | | 5,109 | | 286 |
Comfort Systems USA, Inc. (Ñ) | | 9,800 | | 125 |
Commercial Metals Co. | | 4,637 | | 137 |
Constar International, Inc. (Æ)(Ñ) | | 10,500 | | 43 |
Corn Products International, Inc. (Ñ) | | 8,502 | | 312 |
Crown Holdings, Inc. (Æ) | | 17,600 | | 451 |
Cytec Industries, Inc. (Ñ) | | 12,100 | | 745 |
DuPont Fabros Technology, Inc. (ö)(Ñ) | | 11,200 | | 220 |
Dycom Industries, Inc. (Æ) | | 2,800 | | 75 |
Dynamic Materials Corp. (Ñ) | | 5,900 | | 348 |
Eastman Chemical Co. (Ñ) | | 9,289 | | 567 |
EMCOR Group, Inc. (Æ) | | 28,912 | | 683 |
EnerSys (Æ)(Ñ) | | 2,400 | | 60 |
Ennis, Inc. (Ñ) | | 5,900 | | 106 |
Ferro Corp. | | 1,911 | | 40 |
Glatfelter | | 18,900 | | 289 |
GrafTech International, Ltd. (Æ) | | 12,251 | | 217 |
Granite Construction, Inc. | | 5,500 | | 199 |
| | | | |
| | | Principal
Amount ($)
or Shares | | Market
Value
$ |
Haynes International, Inc. (Æ)(Ñ) | | 6,100 | | 424 |
HB Fuller Co. | | 7,300 | | 164 |
Hecla Mining Co. (Æ) | | 6,937 | | 65 |
Hercules, Inc. (Ñ) | | 19,344 | | 374 |
Hilltop Holdings, Inc. (Æ)(Ñ) | | 3,800 | | 41 |
Innospec, Inc. | | 5,538 | | 95 |
Interface, Inc. Class A | | 792 | | 13 |
Jacobs Engineering Group, Inc. (Æ)(Ñ) | | 12,570 | | 1,202 |
KBR, Inc. (Æ)(Ñ) | | 17,850 | | 693 |
Koppers Holdings, Inc. (Ñ) | | 4,400 | | 190 |
Layne Christensen Co. (Æ)(Ñ) | | 2,600 | | 128 |
LB Foster Co. Class A (Æ)(Ñ) | | 7,961 | | 412 |
Lennox International, Inc. (Ñ) | | 14,293 | | 592 |
LSI Industries, Inc. | | 4,300 | | 78 |
Lubrizol Corp. | | 3,600 | | 195 |
Lydall, Inc. (Æ) | | 1,200 | | 13 |
McDermott International, Inc. (Æ) | | 23,409 | | 1,382 |
Meruelo Maddux Properties, Inc. (Æ)(Ñ) | | 1,800 | | 7 |
Michael Baker Corp. (Æ) | | 767 | | 32 |
Myers Industries, Inc. (Ñ) | | 12,900 | | 187 |
NewMarket Corp. (Ñ) | | 500 | | 28 |
Olin Corp. (Ñ) | | 25,200 | | 487 |
OM Group, Inc. (Æ) | | 12,993 | | 748 |
Owens-Illinois, Inc. (Æ) | | 6,558 | | 325 |
Perini Corp. (Æ)(Ñ) | | 5,159 | | 214 |
PolyOne Corp. (Æ)(Ñ) | | 11,600 | | 76 |
Quanta Services, Inc. (Æ)(Ñ) | | 22,800 | | 598 |
Reliance Steel & Aluminum Co. | | 236 | | 13 |
Rock-Tenn Co. Class A (Ñ) | | 22,197 | | 564 |
Rockwood Holdings, Inc. (Æ) | | 3,647 | | 121 |
RTI International Metals, Inc. (Æ)(Ñ) | | 5,150 | | 355 |
Schnitzer Steel Industries, Inc. Class A (Ñ) | | 5,343 | | 369 |
Shaw Group, Inc. (The) (Æ) | | 3,178 | | 192 |
Sigma-Aldrich Corp. | | 10,100 | | 551 |
Simpson Manufacturing Co., Inc. | | 3,315 | | 88 |
Sonoco Products Co. | | 19,029 | | 622 |
Spartech Corp. | | 18,762 | | 265 |
Standard Register Co. (The) (Ñ) | | 2,100 | | 24 |
Superior Essex, Inc. (Æ)(Ñ) | | 5,451 | | 131 |
Terra Nitrogen Co., LP (Ñ) | | 2,000 | | 299 |
Timken Co. | | 10,700 | | 351 |
Tredegar Corp. | | 4,868 | | 78 |
Tronox, Inc. Class B (Ñ) | | 4,800 | | 42 |
URS Corp. (Æ)(Ñ) | | 30,586 | | 1,662 |
USEC, Inc. (Æ)(Ñ) | | 27,010 | | 243 |
Valspar Corp. (Ñ) | | 5,600 | | 126 |
| | |
| Aggressive Equity Fund | | 29 |
Russell Investment Funds
Aggressive Equity Fund
Schedule of Investments, continued — December 31, 2007
Amounts in thousands (except share amounts)
| | | | |
| | | Principal
Amount ($)
or Shares | | Market
Value
$ |
| | | | |
Wausau Paper Corp. (Ñ) | | 4,700 | | 42 |
Xerium Technologies, Inc. | | 3,100 | | 16 |
Zep, Inc. (Æ) | | 212 | | 3 |
| | | | |
| | | | 26,218 |
| | | | |
| | |
Miscellaneous - 0.6% | | | | |
Brunswick Corp. (Ñ) | | 18,575 | | 317 |
Castlepoint Holdings, Ltd. (Æ)(Þ) | | 30,900 | | 371 |
iPCS, Inc. | | 177 | | 6 |
Lancaster Colony Corp. (Ñ) | | 4,400 | | 175 |
Teleflex, Inc. | | 7,771 | | 489 |
| | | | |
| | | | 1,358 |
| | | | |
| | |
Other Energy - 6.3% | | | | |
Atlas America, Inc. (Ñ) | | 6,500 | | 385 |
ATP Oil & Gas Corp. (Æ) | | 5,400 | | 273 |
Atwood Oceanics, Inc. (Æ)(Ñ) | | 7,740 | | 776 |
Berry Petroleum Co. Class A (Ñ) | | 7,600 | | 338 |
Bois d’Arc Energy, Inc. (Æ)(Ñ) | | 16,200 | | 321 |
Brigham Exploration Co. (Æ)(Ñ) | | 40,790 | | 307 |
Bronco Drilling Co., Inc. (Æ) | | 2,499 | | 37 |
Cameron International Corp. (Æ)(Ñ) | | 6,600 | | 318 |
CARBO Ceramics, Inc. (Ñ) | | 6,000 | | 223 |
Carrizo Oil & Gas, Inc. (Æ)(Ñ) | | 7,900 | | 432 |
Comstock Resources, Inc. (Æ) | | 524 | | 18 |
Continental Resources, Inc. (Æ)(Ñ) | | 2,100 | | 55 |
Core Laboratories NV (Æ)(Ñ) | | 7,015 | | 875 |
Dawson Geophysical Co. (Æ)(Ñ) | | 1,100 | | 79 |
Delek US Holdings, Inc. (Ñ) | | 9,800 | | 198 |
Dresser-Rand Group, Inc. (Æ) | | 8,374 | | 327 |
Dril-Quip, Inc. (Æ)(Ñ) | | 11,400 | | 634 |
EnerNOC, Inc. - ADR (Æ)(Ñ) | | 5,600 | | 275 |
FMC Technologies, Inc. (Æ)(Ñ) | | 8,494 | | 482 |
Frontier Oil Corp. (Ñ) | | 2,400 | | 97 |
Global Industries, Ltd. (Æ) | | 15,056 | | 322 |
Goodrich Petroleum Corp. (Æ)(Ñ) | | 8,124 | | 184 |
Grey Wolf, Inc. (Æ)(Ñ) | | 41,900 | | 223 |
Helmerich & Payne, Inc. (Ñ) | | 9,900 | | 397 |
Hornbeck Offshore Services, Inc. (Æ)(Ñ) | | 9,700 | | 436 |
JA Solar Holdings Co., Ltd. - ADR (Æ)(Ñ) | | 5,000 | | 349 |
Mariner Energy, Inc. (Æ) | | 5,658 | | 129 |
Meridian Resource Corp. (Æ) | | 8,689 | | 16 |
NATCO Group, Inc. Class A (Æ)(Ñ) | | 6,815 | | 369 |
Newfield Exploration Co. (Æ) | | 5,050 | | 266 |
Oceaneering International, Inc. (Æ) | | 12,392 | | 835 |
Ormat Technologies, Inc. (Ñ) | | 4,900 | | 269 |
Patterson-UTI Energy, Inc. | | 5,000 | | 98 |
| | | | |
| | | Principal
Amount ($)
or Shares | | Market
Value
$ |
Petrohawk Energy Corp. (Æ) | | 9,346 | | 162 |
Petroquest Energy, Inc. (Æ)(Ñ) | | 42,900 | | 613 |
Quicksilver Resources, Inc. (Æ) | | 3,000 | | 179 |
Range Resources Corp. | | 5,000 | | 257 |
Rosetta Resources, Inc. (Æ) | | 2,648 | | 52 |
SEACOR Holdings, Inc. (Æ)(Ñ) | | 3,600 | | 334 |
Southwestern Energy Co. (Æ)(Ñ) | | 9,200 | | 513 |
Stone Energy Corp. (Æ) | | 14,000 | | 657 |
T-3 Energy Services, Inc. (Æ) | | 400 | | 19 |
Targa Resources Partners, LP (Ñ) | | 5,700 | | 169 |
Tesoro Corp. (Ñ) | | 14,435 | | 688 |
TETRA Technologies, Inc. (Æ)(Ñ) | | 11,100 | | 173 |
Union Drilling, Inc. (Æ)(Ñ) | | 2,900 | | 46 |
W&T Offshore, Inc. | | 4,390 | | 131 |
Western Refining, Inc. (Ñ) | | 6,400 | | 155 |
| | | | |
| | | | 14,491 |
| | | | |
| | |
Producer Durables - 9.1% | | | | |
Actuant Corp. Class A | | 290 | | 10 |
AGCO Corp. (Æ)(Ñ) | | 10,227 | | 695 |
Arris Group, Inc. (Æ)(Ñ) | | 36,090 | | 360 |
BE Aerospace, Inc. (Æ) | | 26,600 | | 1,407 |
Belden, Inc. (Ñ) | | 14,611 | | 650 |
Chart Industries, Inc. (Æ) | | 12,971 | | 401 |
Cognex Corp. (Ñ) | | 22,400 | | 451 |
Cohu, Inc. (Ñ) | | 14,700 | | 225 |
Crane Co. (Ñ) | | 8,200 | | 352 |
Credence Systems Corp. (Æ)(Ñ) | | 51,799 | | 125 |
CTS Corp. (Ñ) | | 12,913 | | 128 |
Darling International, Inc. (Æ) | | 14,357 | | 166 |
Dionex Corp. (Æ)(Ñ) | | 3,200 | | 265 |
EnPro Industries, Inc. (Æ) | | 528 | | 16 |
ESCO Technologies, Inc. (Æ)(Ñ) | | 5,400 | | 216 |
Esterline Technologies Corp. (Æ) | | 2,509 | | 130 |
Flowserve Corp. | | 7,900 | | 760 |
Gardner Denver, Inc. (Æ) | | 15,700 | | 518 |
General Cable Corp. (Æ)(Ñ) | | 6,637 | | 486 |
Goodrich Corp. (Ñ) | | 18,571 | | 1,311 |
HNI Corp. (Ñ) | | 6,100 | | 214 |
Hubbell, Inc. Class B (Ñ) | | 14,554 | | 751 |
Joy Global, Inc. (Ñ) | | 5,255 | | 346 |
Kennametal, Inc. | | 11,300 | | 428 |
Kimball International, Inc. Class B (Ñ) | | 3,800 | | 52 |
Knoll, Inc. | | 4,382 | | 72 |
Lexmark International, Inc. Class A (Æ) | | 5,049 | | 176 |
LTX Corp. (Æ) | | 10,396 | | 33 |
Manitowoc Co., Inc. (The) (Ñ) | | 2,000 | | 98 |
MasTec, Inc. (Æ)(Ñ) | | 4,200 | | 43 |
| | |
| 30 | | Aggressive Equity Fund |
Russell Investment Funds
Aggressive Equity Fund
Schedule of Investments, continued — December 31, 2007
Amounts in thousands (except share amounts)
| | | | |
| | | Principal
Amount ($)
or Shares | | Market
Value
$ |
| | | | |
Mercadolibre, Inc. (Æ) | | 6,400 | | 473 |
Milacron, Inc. (Æ)(Ñ) | | 3,124 | | 10 |
Molex, Inc. (Ñ) | | 7,700 | | 210 |
Moog, Inc. Class A (Æ)(Ñ) | | 4,515 | | 207 |
Pall Corp. | | 20,800 | | 839 |
Park-Ohio Holdings Corp. (Æ)(Ñ) | | 700 | | 18 |
Plantronics, Inc. | | 338 | | 9 |
Polycom, Inc. (Æ)(Ñ) | | 19,945 | | 554 |
Ritchie Bros Auctioneers, Inc. | | 12,387 | | 1,024 |
Robbins & Myers, Inc. (Ñ) | | 13,200 | | 998 |
Steelcase, Inc. Class A (Ñ) | | 26,227 | | 416 |
Sun Hydraulics Corp. (Ñ) | | 3,000 | | 76 |
Suntech Power Holdings Co., Ltd. - ADR (Æ)(Ñ) | | 7,000 | | 576 |
Tecumseh Products Co. Class A (Æ)(Ñ) | | 19,318 | | 452 |
Teledyne Technologies, Inc. (Æ)(Ñ) | | 6,600 | | 352 |
Tennant Co. (Ñ) | | 3,200 | | 142 |
Teradyne, Inc. (Æ) | | 41,792 | | 432 |
Terex Corp. (Æ) | | 2,924 | | 192 |
TransDigm Group, Inc. (Æ) | | 9,200 | | 416 |
Triumph Group, Inc. (Ñ) | | 8,300 | | 683 |
Ultra Clean Holdings, Inc. (Æ) | | 3,486 | | 42 |
Ultratech, Inc. (Æ)(Ñ) | | 19,200 | | 218 |
Waters Corp. (Æ) | | 8,200 | | 648 |
Woodward Governor Co. (Ñ) | | 6,642 | | 451 |
WW Grainger, Inc. | | 4,600 | | 403 |
| | | | |
| | | | 20,726 |
| | | | |
| | |
Technology - 17.6% | | | | |
ActivIdentity Corp. (Æ)(Ñ) | | 500 | | 2 |
Adaptec, Inc. (Æ) | | 21,100 | | 71 |
ADC Telecommunications, Inc. (Æ)(Ñ) | | 17,400 | | 271 |
Adtran, Inc. (Ñ) | | 11,200 | | 239 |
Alliance Semiconductor Corp. | | 16,700 | | 27 |
Amkor Technology, Inc. (Æ)(Ñ) | | 10,800 | | 92 |
Amphenol Corp. Class A (Ñ) | | 26,871 | | 1,246 |
Ansys, Inc. (Æ)(Ñ) | | 34,801 | | 1,443 |
Applied Micro Circuits Corp. (Æ)(Ñ) | | 9,099 | | 80 |
ARM Holdings PLC - ADR | | 35,200 | | 260 |
Arrow Electronics, Inc. (Æ) | | 2,190 | | 86 |
AsiaInfo Holdings, Inc. (Æ) | | 1,862 | | 20 |
Atheros Communications, Inc. (Æ)(Ñ) | | 3,800 | | 116 |
Atmel Corp. (Æ)(Ñ) | | 6,500 | | 28 |
Avanex Corp. (Æ)(Ñ) | | 64,900 | | 65 |
Avici Systems, Inc. | | 2,200 | | 17 |
Avnet, Inc. (Æ) | | 18,634 | | 652 |
Avocent Corp. (Æ) | | 1,056 | | 25 |
AVX Corp. | | 11,950 | | 160 |
BearingPoint, Inc. (Æ)(Ñ) | | 36,500 | | 103 |
| | | | |
| | | Principal
Amount ($)
or Shares | | Market
Value
$ |
Blackboard, Inc. (Æ)(Ñ) | | 14,000 | | 564 |
BMC Software, Inc. (Æ) | | 5,757 | | 205 |
Bookham, Inc. (Æ)(Ñ) | | 12,600 | | 30 |
Brocade Communications Systems, Inc. (Æ)(Ñ) | | 68,500 | | 503 |
CACI International, Inc. Class A (Æ) | | 3,277 | | 147 |
Captaris, Inc. (Æ) | | 2,903 | | 13 |
Cavium Networks, Inc. (Æ)(Ñ) | | 13,700 | | 315 |
Cbeyond, Inc. (Æ)(Ñ) | | 4,300 | | 168 |
Checkpoint Systems, Inc. (Æ)(Ñ) | | 9,000 | | 234 |
Ciber, Inc. (Æ)(Ñ) | | 2,500 | | 15 |
Ciena Corp. (Æ)(Ñ) | | 7,021 | | 239 |
Cognizant Technology Solutions Corp. Class A (Æ) | | 10,200 | | 346 |
CommScope, Inc. (Æ)(Ñ) | | 9,937 | | 489 |
Compuware Corp. (Æ)(Ñ) | | 6,600 | | 59 |
Comtech Telecommunications Corp. (Æ)(Ñ) | | 10,323 | | 558 |
Comverse Technology, Inc. (Æ)(Ñ) | | 20,700 | | 357 |
Conexant Systems, Inc. (Æ)(Ñ) | | 53,700 | | 45 |
Cray, Inc. (Æ) | | 3,300 | | 20 |
CSG Systems International, Inc. (Æ)(Ñ) | | 12,237 | | 180 |
Cubic Corp. (Ñ) | | 8,400 | | 329 |
Data Domain, Inc. (Æ) | | 11,900 | | 313 |
Digital River, Inc. (Æ) | | 3,096 | | 102 |
Diodes, Inc. (Æ)(Ñ) | | 20,451 | | 615 |
DivX, Inc. (Æ)(Ñ) | | 17,300 | | 242 |
DRS Technologies, Inc. | | 101 | | 5 |
EPIQ Systems, Inc. (Æ)(Ñ) | | 31,274 | | 544 |
Equinix, Inc. (Æ)(Ñ) | | 8,748 | | 884 |
Extreme Networks, Inc. (Æ)(Ñ) | | 16,200 | | 57 |
F5 Networks, Inc. (Æ)(Ñ) | | 10,655 | | 304 |
First Solar, Inc. (Æ)(Ñ) | | 1,800 | | 481 |
Flir Systems, Inc. (Æ)(Ñ) | | 27,140 | | 849 |
Foundry Networks, Inc. (Æ)(Ñ) | | 41,859 | | 733 |
GeoEye, Inc. (Æ)(Ñ) | | 17,295 | | 582 |
Gerber Scientific, Inc. (Æ)(Ñ) | | 3,300 | | 36 |
Harris Corp. (Ñ) | | 11,151 | | 699 |
Hittite Microwave Corp. (Æ)(Ñ) | | 14,296 | | 683 |
Ikanos Communications, Inc. (Æ) | | 16,600 | | 89 |
Imation Corp. (Ñ) | | 12,600 | | 265 |
Informatica Corp. (Æ)(Ñ) | | 42,067 | | 758 |
Ingram Micro, Inc. Class A (Æ) | | 18,100 | | 327 |
Interactive Intelligence, Inc. (Æ) | | 529 | | 14 |
Intermec, Inc. (Æ)(Ñ) | | 13,518 | | 275 |
Interwoven, Inc. (Æ) | | 26,000 | | 370 |
Intuit, Inc. (Æ)(Ñ) | | 14,426 | | 456 |
ION Geophysical Corp. (Æ)(Ñ) | | 19,900 | | 314 |
Ixia (Æ) | | 1,700 | | 16 |
| | |
| Aggressive Equity Fund | | 31 |
Russell Investment Funds
Aggressive Equity Fund
Schedule of Investments, continued — December 31, 2007
Amounts in thousands (except share amounts)
| | | | |
| | | Principal
Amount ($)
or Shares | | Market
Value
$ |
| | | | |
JDA Software Group, Inc. (Æ)(Ñ) | | 4,500 | | 92 |
JDS Uniphase Corp. (Æ)(Ñ) | | 14,400 | | 192 |
Keynote Systems, Inc. (Æ)(Ñ) | | 14,700 | | 207 |
Lawson Software, Inc. (Æ) | | 12,751 | | 131 |
Manhattan Associates, Inc. (Æ) | | 9,838 | | 259 |
Marvell Technology Group, Ltd. (Æ) | | 18,750 | | 262 |
MEMC Electronic Materials, Inc. (Æ) | | 4,400 | | 389 |
Mercury Computer Systems, Inc. (Æ)(Ñ) | | 11,200 | | 180 |
Merrimac Industries, Inc. (Æ)(Ñ) | | 3,300 | | 33 |
Methode Electronics, Inc. | | 11,237 | | 185 |
Micrel, Inc. (Ñ) | | 56,890 | | 481 |
Micros Systems, Inc. (Æ)(Ñ) | | 17,634 | | 1,237 |
Microsemi Corp. (Æ)(Ñ) | | 19,424 | | 430 |
Monolithic Power Systems, Inc. (Æ)(Ñ) | | 12,470 | | 268 |
NAM TAI Electronics, Inc. (Ñ) | | 13,500 | | 152 |
Netlogic Microsystems, Inc. (Æ)(Ñ) | | 13,000 | | 419 |
NetSuite, Inc. (Æ)(Ñ) | | 2,446 | | 96 |
Nice Systems, Ltd. - ADR (Æ)(Ñ) | | 35,781 | | 1,228 |
Nuance Communications, Inc. (Æ)(Ñ) | | 9,600 | | 179 |
Omniture, Inc. (Æ) | | 10,500 | | 350 |
ON Semiconductor Corp. (Æ) | | 16,923 | | 150 |
Openwave Systems, Inc. (Ñ) | | 7,700 | | 20 |
Orckit Communications, Ltd. (Æ)(Ñ) | | 12,300 | | 82 |
PerkinElmer, Inc. | | 33,951 | | 883 |
Power Integrations, Inc. (Æ) | | 2,600 | | 90 |
Rackable Systems, Inc. (Æ)(Ñ) | | 8,300 | | 83 |
RADWARE, Ltd. (Æ)(Ñ) | | 7,600 | | 117 |
RealNetworks, Inc. (Æ)(Ñ) | | 45,300 | | 276 |
RF Micro Devices, Inc. (Æ) | | 21,206 | | 121 |
SAIC, Inc. (Æ)(Ñ) | | 6,700 | | 135 |
SanDisk Corp. (Æ)(Ñ) | | 9,809 | | 325 |
Sanmina-SCI Corp. (Æ)(Ñ) | | 90,700 | | 165 |
Sapient Corp. (Æ)(Ñ) | | 17,200 | | 152 |
Satyam Computer Services, Ltd. - ADR (Ñ) | | 21,030 | | 562 |
Seachange International, Inc. (Æ)(Ñ) | | 24,300 | | 176 |
Seagate Technology | | 3,397 | | 87 |
Secure Computing Corp. (Æ) | | 11,886 | | 114 |
Sigma Designs, Inc. (Æ)(Ñ) | | 3,900 | | 215 |
Sigmatel, Inc. (Æ)(Ñ) | | 6,200 | | 13 |
Silicon Image, Inc. (Æ) | | 8,800 | | 40 |
SiRF Technology Holdings, Inc. (Æ)(Ñ) | | 20,213 | | 508 |
Skyworks Solutions, Inc. (Æ)(Ñ) | | 77,000 | | 654 |
SonicWALL, Inc. (Æ)(Ñ) | | 16,300 | | 175 |
SRA International, Inc. Class A (Æ) | | 4,838 | | 142 |
Sunpower Corp. Class A (Æ)(Ñ) | | 1,900 | | 248 |
Sybase, Inc. (Æ) | | 12,441 | | 325 |
| | | | |
| | | Principal
Amount ($)
or Shares | | Market
Value
$ |
Sycamore Networks, Inc. (Æ)(Ñ) | | 17,800 | | 68 |
Synchronoss Technologies, Inc. (Æ) | | 3,310 | | 117 |
Syniverse Holdings, Inc. (Æ)(Ñ) | | 33,783 | | 526 |
SYNNEX Corp. (Æ)(Ñ) | | 5,600 | | 110 |
Syntel, Inc. (Ñ) | | 2,100 | | 81 |
Taleo Corp. Class A (Æ) | | 3,584 | | 107 |
Tekelec (Æ)(Ñ) | | 39,100 | | 489 |
Tessera Technologies, Inc. (Æ)(Ñ) | | 20,317 | | 845 |
TIBCO Software, Inc. (Æ)(Ñ) | | 49,200 | | 397 |
Trimble Navigation, Ltd. (Æ)(Ñ) | | 16,527 | | 500 |
TriQuint Semiconductor, Inc. (Æ)(Ñ) | | 44,700 | | 296 |
Unisys Corp. (Æ)(Ñ) | | 49,900 | | 236 |
Utstarcom, Inc. (Æ)(Ñ) | | 31,000 | | 85 |
VeriFone Holdings, Inc. (Æ)(Ñ) | | 19,800 | | 460 |
Verigy, Ltd. (Æ) | | 37,346 | | 1,015 |
Verint Systems, Inc. (Æ)(Ñ) | | 23,712 | | 464 |
Vignette Corp. (Æ) | | 10,435 | | 152 |
Vocus, Inc. (Æ)(Ñ) | | 16,200 | | 559 |
Wavecom SA - ADR (Æ) | | 5,300 | | 90 |
Western Digital Corp. (Æ)(Ñ) | | 22,500 | | 680 |
Zebra Technologies Corp. Class A (Æ) | | 2,048 | | 71 |
Zoran Corp. (Æ)(Ñ) | | 17,700 | | 398 |
| | | | |
| | | | 40,206 |
| | | | |
| | |
Utilities - 5.9% | | | | |
AGL Resources, Inc. | | 7,655 | | 288 |
Alliant Energy Corp. (Ñ) | | 18,400 | | 749 |
Atmos Energy Corp. (Ñ) | | 21,732 | | 609 |
Black Hills Corp. | | 6,366 | | 281 |
Canadian Solar, Inc. (Æ)(Ñ) | | 18,800 | | 529 |
Centerpoint Energy, Inc. (Ñ) | | 17,400 | | 298 |
CenturyTel, Inc. (Ñ) | | 21,536 | | 893 |
Cincinnati Bell, Inc. (Æ) | | 17,294 | | 82 |
Citizens Communications Co. | | 8,082 | | 103 |
Cleco Corp. (Ñ) | | 33,516 | | 932 |
CMS Energy Corp. (Ñ) | | 15,200 | | 264 |
Energen Corp. | | 12,361 | | 794 |
FiberTower Corp. (Æ)(Ñ) | | 12,800 | | 29 |
IDT Corp. Class B (Æ)(Ñ) | | 7,400 | | 63 |
Laclede Group, Inc. (The) (Ñ) | | 1,524 | | 52 |
MDU Resources Group, Inc. (Ñ) | | 5,400 | | 149 |
MGE Energy, Inc. (Ñ) | | 100 | | 4 |
New Jersey Resources Corp. (Ñ) | | 2,200 | | 110 |
NII Holdings, Inc. (Æ) | | 4,276 | | 207 |
Northeast Utilities | | 38,400 | | 1,202 |
NTELOS Holdings Corp. (Ñ) | | 11,556 | | 343 |
OGE Energy Corp. | | 6,717 | | 244 |
Oneok, Inc. (Ñ) | | 5,300 | | 237 |
| | |
| 32 | | Aggressive Equity Fund |
Russell Investment Funds
Aggressive Equity Fund
Schedule of Investments, continued — December 31, 2007
Amounts in thousands (except share amounts)
| | | | | |
| | | Principal
Amount ($)
or Shares | | Market
Value
$ | |
| | | | | |
Pepco Holdings, Inc. (Ñ) | | 13,900 | | 408 | |
Piedmont Natural Gas Co. (Ñ) | | 11,400 | | 298 | |
Portland General Electric Co. (Ñ) | | 7,312 | | 203 | |
Premiere Global Services, Inc. (Æ) | | 11,100 | | 165 | |
SCANA Corp. | | 3,688 | | 155 | |
Sierra Pacific Resources | | 26,300 | | 447 | |
Southern Union Co. (Ñ) | | 15,193 | | 446 | |
Southwest Gas Corp. (Ñ) | | 20,874 | | 621 | |
Suburban Propane Partners, LP | | 3,100 | | 126 | |
Telephone & Data Systems, Inc. | | 7,653 | | 479 | |
Time Warner Telecom, Inc. Class A (Æ)(Ñ) | | 23,011 | | 467 | |
UGI Corp. (Ñ) | | 30,900 | | 842 | |
UIL Holdings Corp. (Ñ) | | 9,200 | | 340 | |
USA Mobility, Inc. (Æ) | | 5,476 | | 78 | |
| | | | | |
| | | | 13,537 | |
| | | | | |
| | |
Total Common Stocks | | | | | |
(cost $210,006) | | | | 220,357 | |
| | | | | |
| | |
Warrants & Rights - 0.0% | | | | | |
Financial Services - 0.0% | | | | | |
Washington Mutual, Inc.
2050 Warrants (Æ) | | 42,200 | | 7 | |
| | | | | |
| | |
| Total Warrants & Rights | | | | | |
(cost $10) | | | | 7 | |
| | | | | |
| | |
| Short-Term Investments - 3.9% | | | | | |
Russell Investment Company Money Market Fund | | 8,009,000 | | 8,009 | |
United States Treasury Bills (ž)(§) | | | | | |
2.962% due 03/20/08 | | 1,000 | | 993 | |
| | | | | |
| | |
| Total Short-Term Investments | | | | | |
(cost $9,003) | | | | 9,002 | |
| | | | | |
| | |
| Other Securities - 42.7% | | | | | |
State Street Securities Lending Quality Trust (×) | | 97,816,591 | | 97,817 | |
| | | | | |
| | |
| Total Other Securities | | | | | |
(cost $97,817) | | | | 97,817 | |
| | | | | |
| | |
| Total Investments - 142.9% | | | | | |
(identified cost $316,836) | | | | 327,183 | |
| | |
Other Assets and Liabilities,
Net - (42.9%) | | | | (98,256 | ) |
| | | | | |
| | |
| Net Assets - 100.0% | | | | 228,927 | |
| | | | | |
See accompanying notes which are an integral part of the financial statements.
| | |
| Aggressive Equity Fund | | 33 |
Russell Investment Funds
Aggressive Equity Fund
Schedule of Investments, continued — December 31, 2007
Amounts in thousands
| | | | | | |
Futures Contracts
(Number of Contracts) | | Notional
Amount | | Unrealized
Appreciation
(Depreciation)
$ | |
| | | | | | |
| | | | | | |
| Long Positions | | | | | | |
Russell 2000 Mini Index (CME)
expiration date 03/08 (114) | | USD | 8,803 | | (30 | ) |
| | | | | | |
| | |
Total Unrealized Appreciation
(Depreciation) on Open Futures
Contracts | | | | | (30 | ) |
| | | | | | |
Presentation of Portfolio Holdings — December 31, 2007
| | | |
| Portfolio Summary | | % of Net
Assets | |
| | | |
Auto and Transportation | | 2.7 | |
Consumer Discretionary | | 14.6 | |
Consumer Staples | | 2.4 | |
Financial Services | | 14.4 | |
Health Care | | 11.2 | |
Materials and Processing | | 11.5 | |
Miscellaneous | | 0.6 | |
Other Energy | | 6.3 | |
Producer Durables | | 9.1 | |
Technology | | 17.6 | |
Utilities | | 5.9 | |
Warrants & Rights | | — | * |
Short-Term Investments | | 3.9 | |
Other Securities | | 42.7 | |
| | | |
| |
Total Investments | | 142.9 | |
Other Assets and Liabilities, Net | | (42.9 | ) |
| | | |
| |
| | 100.0 | |
| | | |
| |
Futures Contracts | | (— | )* |
| Less | than .05% of net assets. |
See accompanying notes which are an integral part of the financial statements.
| | |
| 34 | | Aggressive Equity Fund |
(This page intentionally left blank)
Russell Investment Funds
Non-U.S. Fund
Portfolio Management Discussion and Analysis — December 31, 2007 (Unaudited)
| | | |
|
| Non-U.S. Fund | |
| | | Total
Return | |
1 Year | | 10.12 | % |
5 Years | | 20.51 | %§ |
10 Years | | 8.04 | %§ |
| | | |
|
| MSCI EAFE® Index ** | |
| | | Total
Return | |
1 Year | | 11.17 | % |
5 Years | | 21.59 | %§ |
10 Years | | 8.66 | %§ |
| * | | Assumes initial investment on January 1, 1998. |
| ** | | Morgan Stanley Capital International Europe, Australia, Far East (MSCI EAFE) Index is an index composed of an arithmetic, market value-weighted average of the performance of approximately 1,600 securities listed on the stock exchange of the countries of Europe, Australia, and the Far East. The index is calculated on a total-return basis, which includes reinvestment of gross dividends before deduction of withholding taxes. |
Performance is historical and assumes reinvestment of all dividends and capital gains. Investment return and principal value will fluctuate so that an investor’s shares, when redeemed, may be worth more or less than when purchased. Past performance is not indicative of future results.
Russell Investment Funds
Non-U.S. Fund
Portfolio Management Discussion and Analysis — December 31, 2007 (Unaudited)
The Non-US Fund (the “Fund”) allocates most of its assets among multiple money managers. Russell Investment Management Company (“RIMCo”), as the Fund’s advisor, may change the allocation of the Fund’s assets among money managers at any time. An exemptive order from the Securities and Exchange Commission (SEC) permits RIMCo to engage or terminate a money manager at any time, subject to the approval by the Fund’s Board without a shareholder vote. Pursuant to the terms of the exemptive order, the Fund is required to notify its shareholders within 60 days of when a money manager begins providing services. The Fund currently has four money managers.
What is the Fund’s investment objective?
The Fund seeks to provide long term capital growth.
How did the Fund perform relative to its benchmark for the fiscal year ended December 31, 2007?
For the fiscal year ended December 31, 2007, the Non-U.S. Fund gained 10.12%. This compared to its benchmark the MSCI EAFE® Index, which gained 11.17%. The Fund’s performance includes operating expenses, whereas Index returns are unmanaged and do not include expenses of any kind.
For the year ended December 31, 2007, the Lipper® International Core Funds (VIP) Average returned 12.36%. This result serves as a peer comparison and is expressed net of operating expenses.
How did the market conditions described in the Market Summary report affect the Fund’s performance?
During 2007, the market was quite narrowly led. This was evident in the Fund by the fact that only one manager, Wellington Management Company, LLP, outperformed the MSCI EAFE Index for the year. The market environment was more challenging for each of the other managers. AQR Capital Management, LLC, a quantitative manager, struggled as increased market volatility late in the year negatively affected quantitative strategies in particular. MFS Institutional Advisors, Inc.’s and Altrinsic Global Advisors, LLC’s emphases on growth-at-a-reasonable-price were not rewarded as the market favored stocks with high growth rates, good price momentum, and high valuations.
The Fund’s largest positions during the period were an underweight position in financials and an overweight to consumer staples. While both of these made a positive contribution to the Fund’s relative performance, the effects were overshadowed by underweight positions in some of the stronger returning sectors, including materials, telecommunications and utilities.
Similarly, the Fund’s regional positioning benefited from underweights of Japan and the United Kingdom, but suffered
from an underweight to Asia ex-Japan and a more modest position than most stronger-performing peers in emerging markets.
How did the investment strategies and techniques employed by the Fund and its money managers affect its performance?
Fund results reflect several key exposures during the period. The primary detractors to performance stemmed from the following underweights relative to the index benchmark and/or peers during the period:
| • | | The collective impact of underweights to materials, energy, and telecommunications resulted in missing a substantial opportunity as these sectors provided some of the strongest gains throughout the year. In addition, an overweight of the consumer discretionary sector combined with ineffective security selection also detracted from performance. An underweight of the financials sector made the strongest contribution to performance from a single sector perspective. However, this was overshadowed by the aforementioned underweights. |
| • | | The Fund was underweight stocks with high valuations. These stocks produced some of the strongest gains over the period, but gains were concentrated in sectors of the market where earnings were at or near record earnings levels. This created challenges for active managers with any degree of valuation sensitivity with a negative implication for security selection. Wellington’s willingness to pay higher valuations for high growth captured this trend effectively, but it was the only manager to do so. |
Non-index exposure was critical during the year given the strength of emerging markets, as well as strong returns of many Canadian stocks. Exposure to these two regions accounted for the largest contributions to performance from a regional perspective. However, relative to peers, the Fund had less exposure to emerging markets and Canada resulting in less positive contributions to performance in peer-relative terms.
Only one of the four managers in the Fund outperformed for the period. Wellington, the Fund’s aggressive growth manager, was a strong performer with significant contributions from regional positioning (particularly emerging markets and Canada) and strong stock selection in financials, industrials, and technology. In contrast, MFS and Altrinsic’s investment approaches, which were focused on a balanced trade-off between growth and value, were not rewarded. AQR, a quantitative manager, was negatively impacted by a steep sell off affecting quantitative managers in the second half of the year. Its emphasis on stocks with both attractive valuations and momentum was out-of-favor particularly in the latter half of the year.
Russell Investment Funds
Non-U.S. Fund
Portfolio Management Discussion and Analysis — December 31, 2007 (Unaudited)
Describe any changes to the Fund’s structure or the money manager line-up.
In May 2007, Altrinsic Global Advisors, LLC was hired to replace The Boston Company Asset Management, LLC.
| | |
| |
Money Managers as of
December 31, 2007 | | Styles |
Altrinsic Global Advisors, LLC | | Value |
AQR Capital Management, LLC | | Market-Oriented |
MFS Institutional Advisors, Inc. | | Market-Oriented |
Wellington Management Company, LLP | | Growth |
The views expressed in this report reflect those of the portfolio managers only through the end of the period covered by the report. These views do not necessarily represent the views of Russell Investment Management Company (RIMCo), or any other person in RIMCo or any other affiliated organization. These views are subject to change at any time based upon market conditions or other events, and RIMCo disclaims any responsibility to update the views contained herein. These views should not be relied on as investment advice and, because investment decisions for Russell Investment Funds (RIF) are based on numerous factors, should not be relied on as an indication of investment decisions of any RIF Fund.
Russell Investment Funds
Non-U.S. Fund
Shareholder Expense Example — December 31, 2007 (Unaudited)
Fund Expenses
The following disclosure provides important information regarding each Fund’s Expense Example, which appears on each Fund’s individual page in this Annual Report. Please refer to this information when reviewing the Expense Example for a Fund.
Example
As a shareholder of the Fund, you incur two types of costs: (1) transaction costs, and (2) ongoing costs, including management fees and other Fund expenses. The Example is intended to help you understand your ongoing costs (in dollars) of investing in the Fund and to compare these costs with the ongoing costs of investing in other mutual funds. The Example is based on an investment of $1,000 invested at the beginning of the period and held for the entire period indicated, which for this Fund is from July 1, 2007 to December 31, 2007.
Actual Expenses
The information in the table under the heading “Actual Performance” provides information about actual account values and actual expenses. You may use the information in this column, together with the amount you invested, to estimate the expenses that you paid over the period. Simply divide your account value by $1,000 (for example, an $8,600 account value divided by $1,000 = 8.6), then multiply the result by the number in the first column in the row entitled “Expenses Paid During Period” to estimate the expenses you paid on your account during this period.
Hypothetical Example for Comparison Purposes
The information in the table under the heading “Hypothetical Performance (5% return before expenses)” provides information about hypothetical account values and hypothetical expenses based on the Fund’s actual expense ratio and an assumed rate of return of 5% per year before expenses, which is not the Fund’s actual return. The hypothetical account values and expenses may not be used to estimate the actual ending account balance or expenses you paid for the period. You may use this information to compare the ongoing costs of investing in the Fund and other funds. To do so, compare this 5% hypothetical example with the 5% hypothetical examples that appear in the shareholder reports of other funds.
Please note that the expenses shown in the table are meant to highlight your ongoing costs only and do not reflect any transactional costs. Therefore, the information under the heading “Hypothetical Performance (5% return before expenses)” is useful in comparing ongoing costs only, and will not help you determine the relative total costs of owning different funds. In addition, if these transactional costs were included, your costs would have been higher.
| | | | | | |
| | | Actual
Performance | | Hypothetical
Performance
(5% return
before expenses) |
| | | | | | |
Beginning Account Value | | | | | | |
| July 1, 2007 | | $ | 1,000.00 | | $ | 1,000.00 |
Ending Account Value | | | | | | |
| December 31, 2007 | | $ | 1,002.50 | | $ | 1,019.41 |
Expenses Paid During Period* | | $ | 5.80 | | $ | 5.85 |
| * | Expenses are equal to the Fund’s annualized expense ratio of 1.15% (representing the six month period annualized), multiplied by the average account value over the period, multiplied by 184/365 (to reflect the one-half year period). Reflects amounts waived and/or reimbursed by the investment adviser. Without the waiver and/or reimbursement, expenses would have been higher. |
Russell Investment Funds
Non-U.S. Fund
Schedule of Investments — December 31, 2007
Amounts in thousands (except share amounts)
| | | | |
| | | Principal
Amount ($)
or Shares | | Market
Value
$ |
| | | | |
Common Stocks - 90.3% | | | | |
Australia - 2.1% | | | | |
Adelaide Brighton, Ltd. | | 17,542 | | 53 |
AGL Energy, Ltd. | | 2,791 | | 33 |
Amcor, Ltd. | | 5,761 | | 35 |
AMP, Ltd. | | 12,265 | | 107 |
Ansell, Ltd. | | 13,178 | | 139 |
APN News & Media, Ltd. | | 1,926 | | 9 |
Asciano Group | | 1,774 | | 11 |
ASX, Ltd. | | 960 | | 51 |
Austereo Group, Ltd. | | 2,782 | | 6 |
Australia & New Zealand Banking Group, Ltd. | | 13,053 | | 313 |
BHP Billiton, Ltd. | | 27,958 | | 980 |
BlueScope Steel, Ltd. | | 9,876 | | 83 |
Caltex Australia, Ltd. | | 5,746 | | 97 |
Centro Properties Group (ö) | | 6,423 | | 6 |
CFS Retail Property Trust (ö) | | 4,243 | | 9 |
Challenger Financial Services Group, Ltd. | | 17,805 | | 77 |
Coca-Cola Amatil, Ltd. | | 9,635 | | 80 |
Commonwealth Bank of Australia | | 9,434 | | 487 |
CSL, Ltd. | | 27,228 | | 865 |
CSR, Ltd. (Ñ) | | 14,571 | | 40 |
DB RREEF Trust (ö) | | 28,562 | | 50 |
Goodman Fielder, Ltd. | | 72,155 | | 120 |
Goodman Group (ö) | | 8,246 | | 35 |
GPT Group (ö) | | 13,500 | | 48 |
Harvey Norman Holdings, Ltd. | | 11,871 | | 71 |
ING Industrial Fund (ö) | | 1,357 | | 3 |
Insurance Australia Group, Ltd. | | 8,788 | | 32 |
Leighton Holdings, Ltd. (Ñ) | | 15,121 | | 806 |
Macquarie Airports | | 1,354 | | 5 |
Macquarie Group, Ltd. | | 475 | | 31 |
Macquarie Infrastructure Group | | 18,627 | | 49 |
Macquarie Office Trust (ö) | | 10,185 | | 13 |
Mirvac Group (ö) | | 6,629 | | 35 |
National Australia Bank, Ltd. | | 36,045 | | 1,189 |
Newcrest Mining, Ltd. | | 289 | | 8 |
Orica, Ltd. | | 2,210 | | 61 |
Origin Energy, Ltd. | | 8,697 | | 67 |
Pacific Brands, Ltd. | | 49,459 | | 141 |
PaperlinX, Ltd. | | 20,959 | | 49 |
Qantas Airways, Ltd. | | 40,977 | | 195 |
QBE Insurance Group, Ltd. | | 25,148 | | 733 |
Rio Tinto, Ltd. (Ñ) | | 2,990 | | 349 |
Santos, Ltd. | | 15,899 | | 197 |
Sons of Gwalia, Ltd. (Æ)(Ñ)(ß) | | 8,400 | | — |
| | | | |
| | | Principal
Amount ($)
or Shares | | Market
Value
$ |
Stockland (ö) | | 9,521 | | 70 |
Suncorp-Metway, Ltd. | | 5,081 | | 75 |
Symbion Health, Ltd. | | 4,125 | | 14 |
TABCORP Holdings, Ltd. | | 3,308 | | 43 |
Telstra Corp., Ltd. | | 35,749 | | 140 |
Toll Holdings, Ltd. | | 2,278 | | 23 |
Wesfarmers, Ltd. | | 1,120 | | 40 |
Wesfarmers, Ltd. (Æ) | | 1,120 | | 40 |
Westfield Group (ö) | | 13,530 | | 248 |
Westpac Banking Corp. | | 11,549 | | 281 |
Woodside Petroleum, Ltd. | | 1,222 | | 54 |
Woolworths, Ltd. | | 8,034 | | 238 |
WorleyParsons, Ltd. | | 567 | | 26 |
Zinifex, Ltd. | | 864 | | 9 |
| | | | |
| | | | 9,069 |
| | | | |
| | |
Austria - 0.5% | | | | |
Erste Bank der Oesterreichischen Sparkassen AG | | 29,053 | | 2,065 |
| | | | |
| | |
Belgium - 0.4% | | | | |
D’ieteren SA | | 66 | | 24 |
Delhaize Group | | 1,756 | | 154 |
Hansen Transmissions International NV (Æ) | | 102,035 | | 585 |
KBC Groep NV | | 1,267 | | 177 |
Nationale A Portefeuille | | 427 | | 30 |
Solvay SA | | 4,961 | | 691 |
| | | | |
| | | | 1,661 |
| | | | |
| | |
Bermuda - 1.2% | | | | |
Benfield Group, Ltd. | | 138,664 | | 777 |
Catlin Group, Ltd. | | 2,688 | | 20 |
Cnpc Hong Kong, Ltd. | | 50,000 | | 32 |
Esprit Holdings, Ltd. | | 8,200 | | 120 |
Giordano International, Ltd. | | 14,000 | | 7 |
Guoco Group, Ltd. | | 2,000 | | 27 |
Investco, Ltd. (Æ) | | 80,777 | | 2,524 |
Jardine Matheson Holdings, Ltd. | | 3,200 | | 88 |
Jardine Strategic Holdings, Ltd. | | 3,000 | | 47 |
Li & Fung, Ltd. | | 206,000 | | 823 |
Noble Group, Ltd. | | 22,000 | | 37 |
Orient Overseas International, Ltd. | | 6,300 | | 46 |
Seadrill, Ltd. (Æ) | | 26,300 | | 633 |
VTech Holdings, Ltd. | | 4,719 | | 34 |
| | | | |
| | | | 5,215 |
| | | | |
| | |
Brazil - 0.5% | | | | |
Bolsa de Mercadorias e Futuros (Æ) | | 56,300 | | 791 |
Russell Investment Funds
Non-U.S. Fund
Schedule of Investments, continued — December 31, 2007
Amounts in thousands (except share amounts)
| | | | |
| | | Principal
Amount ($)
or Shares | | Market
Value
$ |
| | | | |
Cia Vale do Rio Doce - ADR | | 14,800 | | 483 |
Petroleo Brasileiro SA - ADR | | 6,600 | | 761 |
| | | | |
| | | | 2,035 |
| | | | |
| | |
Canada - 1.0% | | | | |
Canadian National Railway Co. (Ñ) | | 22,190 | | 1,041 |
Gammon Gold, Inc. (Æ) | | 47,624 | | 384 |
Potash Corp. of Saskatchewan | | 13,000 | | 1,872 |
Research In Motion, Ltd. (Æ) | | 5,600 | | 635 |
Suncor Energy, Inc. | | 5,000 | | 547 |
| | | | |
| | | | 4,479 |
| | | | |
| | |
Cayman Islands - 0.7% | | | | |
Alibaba.com, Ltd. (Æ)(Þ) | | 181,200 | | 642 |
ASM Pacific Technology | | 4,500 | | 33 |
Focus Media Holding, Ltd. - ADR (Æ)(Ñ) | | 2,200 | | 125 |
Kingboard Chemical Holdings, Ltd. | | 12,500 | | 74 |
Suntech Power Holdings Co., Ltd. - ADR (Æ)(Ñ) | | 24,400 | | 2,009 |
Tencent Holdings, Ltd. | | 5,000 | | 37 |
| | | | |
| | | | 2,920 |
| | | | |
| | |
China - 0.1% | | | | |
China Communications Construction Co., Ltd. Class H | | 104,000 | | 268 |
| | | | |
| | |
Czech Republic - 0.2% | | | | |
Komercni Banka AS | | 3,164 | | 760 |
| | | | |
| | |
Denmark - 1.0% | | | | |
Carlsberg A/S Class B | | 3,700 | | 445 |
East Asiatic Co., Ltd. A/S | | 1,325 | | 103 |
FLSmidth & Co. A/S | | 400 | | 41 |
Novo Nordisk A/S Series B | | 7,850 | | 512 |
Rockwool International AS Class B (Ñ) | | 145 | | 33 |
Vestas Wind Systems A/S (Æ) | | 28,100 | | 3,004 |
| | | | |
| | | | 4,138 |
| | | | |
| | |
Egypt - 0.4% | | | | |
Orascom Telecom Holding SAE - GDR | | 19,200 | | 1,590 |
| | | | |
| | |
Finland - 1.6% | | | | |
Kesko OYJ Class B | | 4,139 | | 227 |
Metso OYJ | | 1,272 | | 69 |
Nokia OYJ | | 154,598 | | 5,953 |
OKO Bank PLC Class A | | 5,204 | | 99 |
Oriola-KD OYJ | | 3,400 | | 15 |
Orion OYJ Class B | | 7,439 | | 173 |
| | | | |
| | | Principal
Amount ($)
or Shares | | Market
Value
$ |
Outotec OYJ | | 3,925 | | 213 |
Rautaruukki OYJ | | 2,904 | | 123 |
Stora Enso OYJ Class R | | 4,445 | | 66 |
UPM-Kymmene OYJ | | 5,318 | | 106 |
| | | | |
| | | | 7,044 |
| | | | |
| | |
France - 12.9% | | | | |
ADP (Æ) | | 416 | | 42 |
Air Liquide | | 15,418 | | 2,284 |
Alcatel-Lucent - ADR (Ñ) | | 125,840 | | 921 |
Alstom | | 11,293 | | 2,400 |
Arkema (Æ) | | 6,044 | | 394 |
AXA SA | | 67,526 | | 2,689 |
BNP Paribas | | 17,087 | | 1,837 |
Bouygues (Ñ) | | 274 | | 23 |
Business Objects SA (Æ) | | 374 | | 23 |
Carrefour SA | | 21,113 | | 1,637 |
Casino Guichard Perrachon SA (Ñ) | | 2,400 | | 261 |
Christian Dior SA | | 1,470 | | 192 |
Cie de Saint-Gobain | | 1,483 | | 141 |
Cie Generale de Geophysique-Veritas (Æ) | | 1,153 | | 324 |
Ciments Francais SA | | 180 | | 31 |
CNP Assurances | | 3,732 | | 484 |
Credit Agricole SA | | 40,563 | | 1,361 |
France Telecom SA | | 49,609 | | 1,780 |
Gaz de France SA (Ñ) | | 23,789 | | 1,385 |
Ipsen | | 691 | | 42 |
Klepierre (ö) | | 767 | | 39 |
L’Oreal SA | | 10,667 | | 1,523 |
Lafarge SA | | 452 | | 82 |
Legrand SA | | 44,959 | | 1,527 |
LVMH Moet Hennessy Louis
Vuitton SA | | 32,732 | | 3,934 |
NicOx SA (Æ)(Ñ) | | 4,249 | | 68 |
Pernod-Ricard SA | | 9,362 | | 2,156 |
Peugeot SA | | 1,907 | | 143 |
Publicis Groupe | | 10,810 | | 420 |
Rallye SA (Æ) | | 1,254 | | 89 |
Sanofi-Aventis SA | | 36,204 | | 3,309 |
Schneider Electric SA (Ñ) | | 25,560 | | 3,418 |
SEB SA | | 392 | | 71 |
Societe BIC SA | | 2,159 | | 154 |
Societe Generale | | 5,707 | | 816 |
Societe Television Francaise 1 | | 22,156 | | 590 |
Suez SA | | 27,830 | | 1,886 |
Suez SA | | 1,228 | | — |
Teleperformance | | 1,666 | | 65 |
Russell Investment Funds
Non-U.S. Fund
Schedule of Investments, continued — December 31, 2007
Amounts in thousands (except share amounts)
| | | | |
| | | Principal
Amount ($)
or Shares | | Market
Value
$ |
| | | | |
Thales SA | | 9,622 | | 570 |
Thomson (Æ) | | 5,255 | | 74 |
Total SA | | 86,364 | | 7,167 |
UBISOFT Entertainment (Æ) | | 3,752 | | 378 |
Unibail-Rodamco (ö) | | 715 | | 156 |
Valeo SA (Ñ) | | 3,884 | | 159 |
Vallourec (Ñ) | | 569 | | 153 |
Veolia Environnement | | 39,234 | | 3,563 |
Vivendi (Ñ) | | 111,602 | | 5,085 |
| | | | |
| | | | 55,846 |
| | | | |
| | |
Germany - 8.3% | | | | |
Allianz SE | | 8,134 | | 1,740 |
Altana AG | | 17,789 | | 430 |
Arcandor AG (Æ)(Ñ) | | 107,309 | | 2,542 |
Arques Industries AG (Ñ) | | 7,880 | | 269 |
BASF AG | | 5,767 | | 852 |
Bayer AG (Ñ) | | 46,270 | | 4,219 |
Bayerische Motoren Werke AG (Ñ) | | 22,330 | | 1,379 |
Daimler AG | | 36,292 | | 3,515 |
Deutsche Bank AG | | 3,443 | | 445 |
Deutsche Boerse AG | | 9,993 | | 1,973 |
Deutsche Telekom AG | | 49,245 | | 1,077 |
E.ON AG (Ñ) | | 18,417 | | 3,910 |
Epcos AG | | 14,770 | | 255 |
Freenet AG (Ñ) | | 4,501 | | 105 |
Hochtief AG | | 2,446 | | 326 |
Kloeckner & Co. AG | | 4,175 | | 166 |
KUKA AG (Æ) | | 5,689 | | 213 |
Lanxess AG (Ñ) | | 9,474 | | 460 |
Linde AG | | 21,320 | | 2,808 |
Merck KGAA | | 13,400 | | 1,721 |
Metro AG | | 28,011 | | 2,338 |
MTU Aero Engines Holding AG | | 4,235 | | 246 |
Norddeutsche Affinerie AG (Ñ) | | 2,972 | | 115 |
RWE AG | | 3,167 | | 444 |
Salzgitter AG | | 5,646 | | 831 |
Siemens AG | | 17,541 | | 2,754 |
Suedzucker AG (Ñ) | | 4,988 | | 117 |
ThyssenKrupp AG | | 897 | | 50 |
Volkswagen AG (Ñ) | | 2,296 | | 522 |
Vossloh AG | | 1,900 | | 222 |
| | | | |
| | | | 36,044 |
| | | | |
| | |
Greece - 0.2% | | | | |
National Bank of Greece SA | | 10,329 | | 712 |
| | | | |
| | |
Hong Kong - 0.8% | | | | |
BOC Hong Kong Holdings, Ltd. | | 43,000 | | 119 |
| | | | |
| | | Principal
Amount ($)
or Shares | | Market
Value
$ |
Cathay Pacific Airways, Ltd. | | 12,000 | | 31 |
Cheung Kong Holdings, Ltd. | | 49,640 | | 905 |
China Resources Enterprise | | 72,000 | | 307 |
China Unicom, Ltd. | | 4,000 | | 9 |
CLP Holdings, Ltd. | | 11,500 | | 78 |
Hang Lung Group, Ltd. | | 6,000 | | 32 |
Hang Lung Properties, Ltd. | | 4,000 | | 18 |
Hang Seng Bank, Ltd. | | 3,000 | | 61 |
Henderson Land Development Co., Ltd. | | 9,000 | | 83 |
Hong Kong & China Gas Co. | | 5,000 | | 15 |
Hong Kong Exchanges and Clearing, Ltd. | | 7,500 | | 211 |
HongKong Electric Holdings | | 11,500 | | 66 |
Hopewell Holdings | | 22,000 | | 101 |
Hutchison Whampoa, Ltd. | | 11,000 | | 124 |
Hysan Development Co., Ltd. | | 6,000 | | 17 |
Industrial and Commercial Bank of China Asia, Ltd. | | 2,000 | | 5 |
Link REIT (The) (ö) | | 12,500 | | 27 |
Minmetals Resources, Ltd. | | 40,000 | | 22 |
New World Development, Ltd. | | 14,000 | | 49 |
Sun Hung Kai Properties, Ltd. | | 38,000 | | 799 |
Swire Pacific, Ltd. | | 9,000 | | 123 |
Techtronic Industries Co. | | 6,500 | | 7 |
Television Broadcasts, Ltd. | | 9,000 | | 54 |
Wharf Holdings, Ltd. | | 16,000 | | 83 |
Wheelock & Co., Ltd. | | 16,000 | | 49 |
| | | | |
| | | | 3,395 |
| | | | |
| | |
India - 0.2% | | | | |
Satyam Computer Services, Ltd. - ADR | | 31,100 | | 831 |
| | | | |
| | |
Indonesia - 0.1% | | | | |
Bank Central Asia Tbk PT | | 245,500 | | 189 |
Telekomunikasi Indonesia Tbk PT - ADR | | 1,750 | | 73 |
| | | | |
| | | | 262 |
| | | | |
| | |
Ireland - 0.5% | | | | |
Elan Corp. PLC - ADR (Æ)(Ñ) | | 64,300 | | 1,413 |
Ryanair Holdings PLC - ADR (Æ)(Ñ) | | 19,710 | | 778 |
| | | | |
| | | | 2,191 |
| | | | |
| | |
Italy - 3.5% | | | | |
Alleanza Assicurazioni SpA | | 93,388 | | 1,200 |
Ansaldo STS SpA (Æ) | | 68,608 | | 867 |
Russell Investment Funds
Non-U.S. Fund
Schedule of Investments, continued — December 31, 2007
Amounts in thousands (except share amounts)
| | | | |
| | | Principal
Amount ($)
or Shares | | Market
Value
$ |
| | | | |
Arnoldo Mondadori Editore SpA (Ñ) | | 105,444 | | 858 |
Assicurazioni Generali SpA | | 16,253 | | 729 |
Danieli SPA (Æ) | | 2,115 | | 50 |
Enel SpA | | 42,845 | | 506 |
ENI SpA | | 72,544 | | 2,643 |
Fiat SpA | | 19,870 | | 511 |
Finmeccanica SpA | | 5,693 | | 180 |
Fondiaria-Sai SpA | | 8,774 | | 362 |
Impregilo SPA (Æ) | | 29,685 | | 199 |
Indesit Co. SpA | | 8,743 | | 134 |
Intesa Sanpaolo SpA | | 189,425 | | 1,486 |
Mediaset SpA | | 205,256 | | 2,064 |
Milano Assicurazioni SPA | | 33,598 | | 261 |
Parmalat Finanziaria SpA (Ñ)(Æ)(ß) | | 12,500 | | — |
Prysmian SpA (Æ) | | 2,317 | | 57 |
Telecom Italia SpA | | 878,082 | | 2,064 |
UniCredito Italiano SpA | | 89,635 | | 746 |
Unione di Banche Italiane SCPA | | 1,315 | | 36 |
| | | | |
| | | | 14,953 |
| | | | |
| | |
Japan - 15.8% | | | | |
77 Bank, Ltd. (The) | | 12,000 | | 75 |
Aeon Credit Service Co., Ltd. | | 43,100 | | 637 |
Alfresa Holdings Corp. (Ñ) | | 1,500 | | 91 |
Alpine Electronics, Inc. | | 3,000 | | 50 |
Alps Electric Co., Ltd. | | 10,100 | | 131 |
AOC Holdings, Inc. | | 4,300 | | 63 |
Asahi Glass Co., Ltd. (Ñ) | | 98,000 | | 1,300 |
Asahi Kasei Corp. (Ñ) | | 27,000 | | 180 |
Astellas Pharma, Inc. (Ñ) | | 9,900 | | 432 |
Awa Bank, Ltd. (The) | | 3,000 | | 17 |
Bank of Yokohama, Ltd. (The) (Ñ) | | 33,000 | | 233 |
Bosch Corp. (Ñ) | | 38,000 | | 186 |
Bridgestone Corp. (Ñ) | | 46,100 | | 812 |
Brother Industries, Ltd. (Ñ) | | 3,700 | | 48 |
Canon Marketing Japan, Inc. (Ñ) | | 2,800 | | 52 |
Canon, Inc. (Ñ) | | 74,700 | | 3,413 |
Capcom Co., Ltd. (Ñ) | | 2,100 | | 54 |
Chuo Mitsui Trust Holdings, Inc. | | 4,000 | | 31 |
COMSYS Holdings Corp. | | 19,000 | | 156 |
Daihatsu Motor Co., Ltd. | | 5,000 | | 47 |
Daiichi Sankyo Co., Ltd. | | 1,900 | | 58 |
Daishi Bank, Ltd. (The) | | 5,000 | | 20 |
Daiwa House Industry Co., Ltd. | | 84,420 | | 1,086 |
Daiwa Securities Group, Inc. | | 68,950 | | 635 |
Denki Kagaku Kogyo K K | | 18,000 | | 78 |
Eisai Co., Ltd. | | 1,400 | | 55 |
Exedy Corp. | | 1,200 | | 40 |
Ezaki Glico Co., Ltd. (Ñ) | | 2,000 | | 20 |
| | | | |
| | | Principal
Amount ($)
or Shares | | Market
Value
$ |
FamilyMart Co., Ltd. | | 2,600 | | 81 |
Fanuc, Ltd. | | 11,200 | | 1,093 |
FCC Co., Ltd. | | 2,300 | | 41 |
Fuji Fire & Marine Insurance Co., Ltd. (The) | | 32,000 | | 86 |
Fuji Television Network, Inc. | | 554 | | 919 |
FUJIFILM Holdings Corp. | | 4,800 | | 203 |
Fujitsu, Ltd. (Ñ) | | 11,000 | | 74 |
H2O Retailing Corp. (Ñ) | | 8,000 | | 62 |
Hachijuni Bank, Ltd. (The) (Ñ) | | 25,000 | | 168 |
Higo Bank, Ltd. (The) | | 6,000 | | 39 |
Hino Motors, Ltd. | | 34,000 | | 220 |
Hirose Electric Co., Ltd. (Ñ) | | 7,100 | | 823 |
Hitachi Kokusai Electric, Inc. | | 6,000 | | 74 |
Hitachi, Ltd. | | 14,000 | | 103 |
Hokkaido Electric Power Co., Inc. | | 2,300 | | 50 |
Hokkoku Bank, Ltd. (The) | | 7,000 | | 32 |
Honda Motor Co., Ltd. (Ñ) | | 6,100 | | 202 |
Hyakujushi Bank, Ltd. (The) | | 3,000 | | 15 |
Idemitsu Kosan Co., Ltd. (Ñ) | | 400 | | 42 |
Inpex Holdings, Inc. | | 174 | | 1,872 |
ITOCHU Corp. (Ñ) | | 29,000 | | 282 |
Iyo Bank, Ltd. (The) | | 6,000 | | 58 |
Japan Steel Works, Ltd. (The) | | 6,000 | | 88 |
Japan Tobacco, Inc. (Ñ) | | 268 | | 1,589 |
JFE Holdings, Inc. | | 6,600 | | 333 |
JFE Shoji Holdings, Inc. | | 26,000 | | 166 |
JGC Corp. | | 12,000 | | 206 |
Joyo Bank, Ltd. (The) | | 266,940 | | 1,488 |
Juki Corp. | | 22,000 | | 135 |
Kagoshima Bank, Ltd. (The) | | 12,000 | | 82 |
Kansai Electric Power Co., Inc. (The) | | 9,700 | | 226 |
Kao Corp. (Ñ) | | 132,000 | | 3,972 |
Kawasaki Kisen Kaisha, Ltd. | | 14,000 | | 137 |
KDDI Corp. | | 47 | | 349 |
Keihin Corp. | | 3,600 | | 64 |
Keiyo Bank, Ltd. (The) (Ñ) | | 14,000 | | 80 |
Kintetsu World Express, Inc. | | 3,500 | | 121 |
Kobe Steel, Ltd. | | 68,000 | | 220 |
Komatsu, Ltd. (Ñ) | | 4,300 | | 116 |
Komori Corp. | | 3,000 | | 67 |
Kose Corp. (Ñ) | | 58,240 | | 1,552 |
Kyocera Corp. | | 1,200 | | 105 |
Kyoei Steel, Ltd. | | 1,400 | | 26 |
Kyowa Hakko Kogyo Co., Ltd. (Ñ) | | 2,000 | | 21 |
Leopalace21 Corp. | | 1,600 | | 43 |
Makino Milling Machine Co., Ltd. | | 5,000 | | 35 |
Makita Corp. | | 1,600 | | 67 |
Marubeni Corp. | | 7,000 | | 49 |
Russell Investment Funds
Non-U.S. Fund
Schedule of Investments, continued — December 31, 2007
Amounts in thousands (except share amounts)
| | | | |
| | | Principal
Amount ($)
or Shares | | Market
Value
$ |
| | | | |
Matsushita Electric Industrial Co., Ltd. | | 19,000 | | 389 |
Matsushita Electric Works, Ltd. | | 19,000 | | 211 |
Mazda Motor Corp. | | 19,000 | | 95 |
Meiji Dairies Corp. | | 15,000 | | 76 |
MID Reit, Inc. (ö)(Ñ) | | 138 | | 644 |
Millea Holdings, Inc. | | 5,800 | | 196 |
Mitsubishi Chemical Holdings Corp. | | 10,500 | | 80 |
Mitsubishi Corp. | | 8,300 | | 226 |
Mitsubishi Electric Corp. | | 10,000 | | 103 |
Mitsubishi Estate Co., Ltd. | | 10,000 | | 240 |
Mitsubishi Heavy Industries, Ltd. | | 20,000 | | 86 |
Mitsubishi Materials Corp. | | 19,000 | | 81 |
Mitsubishi UFJ Financial Group, Inc. | | 117,630 | | 1,095 |
Mitsui & Co., Ltd. (Ñ) | | 11,000 | | 233 |
Mitsui Fudosan Co., Ltd. | | 8,000 | | 173 |
Mitsui OSK Lines, Ltd. | | 16,000 | | 203 |
Mitsui Sumitomo Insurance Co., Ltd. | | 45,980 | | 449 |
Mitsui-Soko Co., Ltd. | | 114,560 | | 614 |
Mizuho Financial Group, Inc. | | 37 | | 176 |
Mori Seiki Co., Ltd. (Ñ) | | 800 | | 16 |
New City Residence Investment Corp. (ö) | | 94 | | 383 |
Nichirei Corp. | | 35,000 | | 145 |
Nifco, Inc. | | 800 | | 19 |
Nikko Cordial Corp. (Æ)(Ñ) | | 2,000 | | 30 |
Nintendo Co., Ltd. | | 3,800 | | 2,307 |
Nippon Commercial Investment Corp. (ö) | | 179 | | 789 |
Nippon Express Co., Ltd. | | 37,000 | | 189 |
Nippon Kayaku Co., Ltd. | | 18,000 | | 117 |
Nippon Konpo Unyu Soko Co., Ltd. | | 3,000 | | 40 |
Nippon Mining Holdings, Inc. | | 6,000 | | 39 |
Nippon Oil Corp. | | 38,000 | | 310 |
Nippon Residential Investment Corp. (ö) | | 117 | | 526 |
Nippon Seiki Co., Ltd. | | 1,000 | | 22 |
Nippon Steel Corp. | | 52,000 | | 320 |
Nippon Telegraph & Telephone Corp. | | 73 | | 361 |
Nippon Yusen KK | | 11,000 | | 88 |
Nipponkoa Insurance Co., Ltd. (Ñ) | | 239,490 | | 2,171 |
Nissan Motor Co., Ltd. (Ñ) | | 17,000 | | 184 |
Nissan Shatai Co., Ltd. (Æ) | | 9,000 | | 73 |
Nisshin Seifun Group, Inc. | | 5,000 | | 50 |
Nisshin Steel Co., Ltd. (Ñ) | | 8,000 | | 28 |
Nisshinbo Industries, Inc. (Ñ) | | 2,000 | | 24 |
Nissin Kogyo Co., Ltd. | | 6,200 | | 145 |
Nomura Holdings, Inc. (Ñ) | | 146,620 | | 2,451 |
NTN Corp. (Ñ) | | 16,000 | | 139 |
| | | | |
| | | Principal
Amount ($)
or Shares | | Market
Value
$ |
Okinawa Electric Power Co., Inc. (The) | | 600 | | 28 |
OKUMA Corp. | | 1,000 | | 11 |
Omron Corp. | | 36,300 | | 859 |
ORIX Corp. | | 830 | | 139 |
Pacific Metals Co., Ltd. (Ñ) | | 2,000 | | 19 |
Resona Holdings, Inc. (Ñ) | | 35 | | 64 |
Ricoh Co., Ltd. | | 87,000 | | 1,600 |
Sankyo Co., Ltd. | | 2,200 | | 102 |
Santen Pharmaceutical Co., Ltd. | | 2,100 | | 52 |
Sanwa Holdings Corp. (Ñ) | | 6,000 | | 30 |
Sasebo Heavy Industries Co., Ltd. | | 5,000 | | 23 |
Seiko Epson Corp. | | 1,400 | | 30 |
Seino Holdings Corp. (Ñ) | | 2,000 | | 14 |
Sekisui House, Ltd. | | 5,000 | | 54 |
Seven & I Holdings Co., Ltd. | | 35,460 | | 1,031 |
Sharp Corp. (Ñ) | | 7,000 | | 125 |
Shiga Bank, Ltd. (The) | | 10,000 | | 67 |
Shima Seiki Manufacturing, Ltd. | | 500 | | 23 |
Shin-Etsu Chemical Co., Ltd. | | 12,700 | | 794 |
Shinwa Kaiun Kaisha, Ltd. | | 9,000 | | 54 |
Shizuoka Bank, Ltd. (The) | | 55,000 | | 605 |
Showa Shell Sekiyu KK (Ñ) | | 10,205 | | 114 |
SMC Corp. | | 13,748 | | 1,636 |
Sohgo Security Services Co., Ltd. | | 2,000 | | 32 |
Sony Corp. (Ñ) | | 30,900 | | 1,677 |
Star Micronics Co., Ltd. | | 2,100 | | 46 |
Sugi Pharmacy Co., Ltd. (Ñ) | | 36,340 | | 1,041 |
Sumco Techxiv Corp. (Ñ) | | 600 | | 21 |
Sumitomo Bakelite Co., Ltd. (Ñ) | | 188,250 | | 1,131 |
Sumitomo Corp. | | 6,700 | | 95 |
Sumitomo Heavy Industries, Ltd. (Ñ) | | 13,000 | | 119 |
Sumitomo Metal Industries, Ltd. | | 14,000 | | 65 |
Sumitomo Metal Mining Co., Ltd. | | 1,000 | | 17 |
Sumitomo Mitsui Financial Group, Inc. (Ñ) | | 17 | | 127 |
Sumitomo Realty & Development Co., Ltd. | | 2,000 | | 49 |
Sumitomo Trust & Banking Co., Ltd. (The) | | 312,660 | | 2,082 |
Suzuki Motor Corp. | | 35,760 | | 1,076 |
Takeda Pharmaceutical Co., Ltd. | | 33,420 | | 1,954 |
TDK Corp. | | 4,100 | | 304 |
THK Co., Ltd. | | 500 | | 10 |
Toho Co., Ltd. (Ñ) | | 3,100 | | 69 |
Toho Pharmaceutical Co., Ltd. | | 5,590 | | 109 |
Tokai Rubber Industries, Inc. | | 8,400 | | 144 |
Tokyo Electric Power Co., Inc. (The) (Ñ) | | 9,500 | | 246 |
Russell Investment Funds
Non-U.S. Fund
Schedule of Investments, continued — December 31, 2007
Amounts in thousands (except share amounts)
| | | | |
| | | Principal
Amount ($)
or Shares | | Market
Value
$ |
| | | | |
Tokyo Gas Co., Ltd. | | 159,000 | | 742 |
Tokyu Land Corp. (Ñ) | | 8,000 | | 68 |
TonenGeneral Sekiyu KK (Ñ) | | 7,000 | | 69 |
Toshiba Corp. (Ñ) | | 20,000 | | 149 |
Toshiba TEC Corp. | | 20,000 | | 135 |
Toyo Engineering Corp. | | 17,000 | | 84 |
Toyo Ink Manufacturing Co., Ltd. | | 5,000 | | 17 |
Toyo Seikan Kaisha, Ltd. (Ñ) | | 1,500 | | 27 |
Toyo Suisan Kaisha, Ltd. | | 15,000 | | 273 |
Toyota Auto Body Co., Ltd. | | 4,400 | | 71 |
Toyota Boshoku Corp. | | 800 | | 26 |
Toyota Motor Corp. (Ñ) | | 50,800 | | 2,734 |
United Urban Investment Corp. (ö) | | 80 | | 537 |
West Japan Railway Co. | | 17 | | 84 |
Yamada Denki Co., Ltd. (Ñ) | | 4,220 | | 480 |
Yamaha Corp. | | 6,700 | | 153 |
Yamato Holdings Co., Ltd. | | 14,000 | | 202 |
Yamato Kogyo Co., Ltd. | | 3,400 | | 139 |
Yokohama Rubber Co., Ltd. (The) | | 11,000 | | 65 |
| | | | |
| | | | 68,155 |
| | | | |
| | |
Luxembourg - 0.7% | | | | |
ArcelorMittal | | 4,694 | | 361 |
Millicom International Cellular SA (Æ)(Ñ) | | 19,900 | | 2,347 |
SES | | 13,157 | | 345 |
| | | | |
| | | | 3,053 |
| | | | |
| | |
Mexico - 0.1% | | | | |
Grupo Modelo SAB de CV | | 56,000 | | 264 |
| | | | |
| | |
Netherlands - 4.2% | | | | |
Akzo Nobel NV | | 4,056 | | 323 |
ASM International NV | | 7,555 | | 185 |
ASML Holding NV (Æ) | | 67,526 | | 2,122 |
CSM | | 1,286 | | 43 |
Fugro NV | | 609 | | 47 |
Heineken NV | | 63,842 | | 4,112 |
ING Groep NV | | 39,169 | | 1,529 |
Koninklijke Ahold NV (Æ) | | 5,211 | | 72 |
Koninklijke Philips Electronics NV | | 39,155 | | 1,697 |
OCE NV (Ñ) | | 23,090 | | 416 |
Rodamco Europe NV (ö) | | 817 | | 102 |
Royal KPN NV | | 7,397 | | 134 |
TNT NV | | 55,160 | | 2,295 |
TomTom NV (Æ)(Ñ) | | 4,003 | | 299 |
Unilever NV | | 132,463 | | 4,850 |
| | | | |
| | | | 18,226 |
| | | | |
| | | | |
| | | Principal
Amount ($)
or Shares | | Market
Value
$ |
Netherlands Antilles - 0.0% | | | | |
Hunter Douglas NV | | 1,774 | | 131 |
| | | | |
| | |
Norway - 0.2% | | | | |
StatoilHydro ASA | | 30,502 | | 943 |
| | | | |
| | |
Papua New Guinea - 0.0% | | | | |
Oil Search, Ltd. | | 2,425 | | 10 |
| | | | |
| | |
Portugal - 0.2% | | | | |
Energias de Portugal SA | | 148,542 | | 966 |
| | | | |
| | |
Russia - 0.4% | | | | |
Gazprom OAO - ADR | | 30,200 | | 1,701 |
| | | | |
| | |
Singapore - 0.7% | | | | |
Allgreen Properties, Ltd. | | 40,000 | | 41 |
Ascendas Real Estate Investment Trust (Æ)(ö) | | 4,000 | | 7 |
CapitaCommercial Trust (Æ)(ö) | | 2,000 | | 3 |
CapitaLand, Ltd. | | 11,000 | | 47 |
CapitaMall Trust (ö) | | 4,000 | | 9 |
China Aviation Oil Singapore Corp., Ltd. | | 6,000 | | 9 |
Cosco Corp. Singapore, Ltd. | | 6,000 | | 24 |
Creative Technology, Ltd. | | 3,600 | | 16 |
DBS Group Holdings, Ltd. | | 44,000 | | 623 |
Haw Par Corp., Ltd. | | 2,000 | | 10 |
Jardine Cycle & Carriage, Ltd. | | 1,000 | | 15 |
Keppel Corp., Ltd. | | 10,000 | | 89 |
NatSteel, Ltd. | | 10,000 | | 10 |
Neptune Orient Lines, Ltd. | | 16,000 | | 43 |
Oversea-Chinese Banking Corp. | | 13,000 | | 75 |
Pacific Century Regional Developments, Ltd. (Æ) | | 68,000 | | 16 |
SembCorp Industries, Ltd. | | 10,880 | | 43 |
Singapore Airlines, Ltd. | | 9,470 | | 113 |
Singapore Petroleum Co., Ltd. | | 8,000 | | 42 |
Singapore Technologies Engineering, Ltd. | | 1,000 | | 3 |
Singapore Telecommunications, Ltd. | | 619,000 | | 1,699 |
STATS ChipPAC, Ltd. (Æ) | | 3,425 | | 4 |
Suntec Real Estate Investment Trust (Æ)(ö) | | 3,000 | | 3 |
United Overseas Bank, Ltd. | | 8,000 | | 111 |
Wing Tai Holdings, Ltd. | | 13,000 | | 24 |
| | | | |
| | | | 3,079 |
| | | | |
| | |
South Africa - 0.1% | | | | |
MTN Group, Ltd. | | 22,200 | | 416 |
| | | | |
Russell Investment Funds
Non-U.S. Fund
Schedule of Investments, continued — December 31, 2007
Amounts in thousands (except share amounts)
| | | | |
| | | Principal
Amount ($)
or Shares | | Market
Value
$ |
| | | | |
South Korea - 0.8% | | | | |
Kookmin Bank - ADR (Ñ) | | 14,070 | | 1,032 |
LG Electronics, Inc. (Æ) | | 9,333 | | 983 |
Samsung Electronics Co., Ltd. | | 2,816 | | 1,655 |
| | | | |
| | | | 3,670 |
| | | | |
| | |
Spain - 2.2% | | | | |
Altadis SA | | 1,592 | | 116 |
Banco Bilbao Vizcaya Argentaria SA | | 49,515 | | 1,216 |
Banco Santander SA | | 48,633 | | 1,051 |
Bolsas y Mercados Espanoles (Æ) | | 611 | | 41 |
Gamesa Corp. Tecnologica SA | | 26,985 | | 1,248 |
Gas Natural SDG SA (Ñ) | | 364 | | 21 |
Gestevision Telecinco SA | | 6,557 | | 166 |
Grifols SA | | 881 | | 20 |
Iberdrola Renovables (Æ) | | 177,697 | | 1,468 |
Iberdrola SA | | 5,784 | | 87 |
Iberia Lineas Aereas de Espana | | 43,891 | | 190 |
Inditex SA | | 3,115 | | 189 |
Repsol YPF SA | | 10,826 | | 386 |
Tecnicas Reunidas SA | | 2,143 | | 136 |
Telefonica SA | | 96,420 | | 3,116 |
Union Fenosa SA | | 398 | | 27 |
Vertice Trescientos Sesenta Grados SA (Æ) | | 4,020 | | 13 |
| | | | |
| | | | 9,491 |
| | | | |
| | |
Sweden - 1.3% | | | | |
Alfa Laval AB | | 1,625 | | 90 |
Boliden AB (Æ) | | 7,900 | | 98 |
Electrolux AB | | 25,100 | | 418 |
Industrivarden AB Class A | | 3,500 | | 61 |
Nordea Bank AB | | 86,810 | | 1,440 |
OMX AB | | 500 | | 20 |
Peab AB | | 2,000 | | 20 |
Peab Industri AB (Æ) | | 1,000 | | 9 |
SAS AB (Æ) | | 12,700 | | 162 |
Scania AB Class B (Æ) | | 21,800 | | 515 |
Skandinaviska Enskilda Banken AB Class A | | 7,000 | | 177 |
SKF AB Class B | | 14,000 | | 235 |
Ssab Svenskt Stal AB Series A | | 12,600 | | 338 |
Telefonaktiebolaget LM Ericsson Series B Class B | | 713,330 | | 1,668 |
TeliaSonera AB | | 29,500 | | 274 |
Volvo AB (Æ) | | | | |
Class A | | 3,400 | | 56 |
Class B | | 5,700 | | 95 |
| | | | |
| | | | 5,676 |
| | | | |
| | | | |
| | | Principal
Amount ($)
or Shares | | Market
Value
$ |
Switzerland - 8.3% | | | | |
ABB, Ltd. | | 10,779 | | 311 |
Actelion, Ltd. (Æ)(Ñ) | | 13,680 | | 623 |
Baloise Holding AG | | 837 | | 83 |
Bucher Industries AG (Æ) | | 104 | | 24 |
Ciba Specialty Chemicals AG | | 1,792 | | 83 |
Credit Suisse Group | | 13,998 | | 842 |
Georg Fischer AG (Æ) | | 80 | | 49 |
Givaudan SA | | 2,130 | | 2,046 |
Helvetia Holding AG | | 532 | | 191 |
Julius Baer Holding AG | | 39,498 | | 3,211 |
Kuoni Reisen Holding AG | | 93 | | 48 |
Logitech International SA (Æ) | | 75,790 | | 2,752 |
Nestle SA | | 22,754 | | 10,426 |
Novartis AG | | 16,418 | | 894 |
Rieter Holding AG | | 41 | | 18 |
Roche Holding AG | | 30,829 | | 5,310 |
Sika AG | | 50 | | 94 |
Sonova Holding AG | | 21,737 | | 2,431 |
Swatch Group AG | | 2,189 | | 656 |
Swiss Life Holding (Æ) | | 1,197 | | 296 |
Swiss Reinsurance | | 29,177 | | 2,047 |
Swisscom AG | | 277 | | 108 |
UBS AG | | 66,982 | | 3,111 |
Zurich Financial Services AG | | 678 | | 200 |
| | | | |
| | | | 35,854 |
| | | | |
| | |
Taiwan - 0.2% | | | | |
Taiwan Semiconductor Manufacturing Co., Ltd. - ADR | | 87,390 | | 870 |
| | | | |
| | |
Thailand - 0.1% | | | | |
Bangkok Bank PCL | | 173,500 | | 613 |
| | | | |
| | |
Turkey - 0.2% | | | | |
Turkcell Iletisim Hizmet AS - ADR | | 29,900 | | 824 |
| | | | |
| | |
United Kingdom - 18.2% | | | | |
3i Group PLC | | 823 | | 16 |
Amec PLC | | 14,568 | | 242 |
Anglo American PLC | | 9,642 | | 584 |
Antofagasta PLC | | 3,122 | | 44 |
ARM Holdings PLC | | 354,995 | | 870 |
AstraZeneca PLC | | 17,536 | | 753 |
Atkins WS PLC | | 3,918 | | 89 |
BAE Systems PLC | | 73,509 | | 720 |
Barclays PLC | | 32,017 | | 324 |
BBA Aviation PLC | | 8,576 | | 35 |
BG Group PLC | | 35,085 | | 808 |
Russell Investment Funds
Non-U.S. Fund
Schedule of Investments, continued — December 31, 2007
Amounts in thousands (except share amounts)
| | | | |
| | | Principal
Amount ($)
or Shares | | Market
Value
$ |
| | | | |
BHP Billiton PLC | | 49,892 | | 1,537 |
Bovis Homes Group PLC | | 1,154 | | 14 |
BP PLC | | 157,032 | | 1,920 |
BP PLC - ADR (Ñ) | | 23,720 | | 1,736 |
Brit Insurance Holdings PLC | | 26,788 | | 121 |
British Airways PLC (Æ) | | 11,418 | | 70 |
British American Tobacco PLC | | 9,838 | | 387 |
British Energy Group PLC | | 14,973 | | 163 |
British Land Co. PLC (ö) | | 3,265 | | 61 |
BT Group PLC | | 115,685 | | 624 |
Burberry Group PLC | | 119,110 | | 1,341 |
Cable & Wireless PLC | | 10,106 | | 37 |
Cadbury Schweppes PLC | | 122,682 | | 1,529 |
Carphone Warehouse Group PLC | | 315,575 | | 2,153 |
Centrica PLC | | 28,754 | | 204 |
Charter PLC (Æ) | | 1,607 | | 25 |
Cobham PLC | | 25,068 | | 104 |
Compass Group PLC | | 5,785 | | 35 |
Daily Mail & General Trust PLC Class A | | 1,037 | | 10 |
Davis Service Group PLC | | 15,107 | | 153 |
Dawnay Day Treveria PLC | | 586,180 | | 693 |
De La Rue PLC | | 1,365 | | 26 |
Diageo PLC | | 237,860 | | 5,091 |
easyJet PLC (Æ) | | 71,525 | | 867 |
Friends Provident PLC | | 9,621 | | 31 |
Galiform PLC (Æ) | | 4,993 | | 9 |
GlaxoSmithKline PLC | | 254,922 | | 6,469 |
HBOS PLC | | 27,396 | | 397 |
Home Retail Group PLC | | 87,756 | | 564 |
HSBC Holdings PLC | | 93,215 | | 1,564 |
IG Group Holdings PLC | | 10,051 | | 81 |
Invensys PLC (Æ) | | 5,611 | | 25 |
J Sainsbury PLC | | 51,870 | | 437 |
Kesa Electricals PLC | | 57,426 | | 265 |
Kingfisher PLC | | 222,493 | | 641 |
Ladbrokes PLC | | 150,385 | | 960 |
Land Securities Group PLC (ö) | | 3,833 | | 114 |
Legal & General Group PLC | | 100,982 | | 261 |
Liberty International PLC (ö) | | 471 | | 10 |
Lloyds TSB Group PLC | | 28,773 | | 268 |
Man Group PLC | | 233,925 | | 2,691 |
National Express Group PLC | | 4,128 | | 101 |
National Grid PLC | | 63,147 | | 1,044 |
Next PLC | | 4,290 | | 138 |
Pearson PLC | | 20,708 | | 301 |
Petrofac, Ltd. | | 10,160 | | 110 |
Premier Farnell PLC | | 3,208 | | 9 |
Provident Financial PLC | | 14,263 | | 235 |
Reckitt Benckiser Group PLC | | 97,747 | | 5,647 |
| | | | |
| | | Principal
Amount ($)
or Shares | | Market
Value
$ |
Reed Elsevier PLC | | 5,030 | | 68 |
Regus Group PLC | | 95,727 | | 156 |
Resolution PLC | | 4,157 | | 59 |
Reuters Group PLC | | 8,904 | | 112 |
Rio Tinto PLC | | 7,416 | | 777 |
Rolls-Royce Group PLC (Æ) | | 9,742 | | 105 |
Royal Bank of Scotland Group PLC | | 224,330 | | 2,017 |
Royal Dutch Shell PLC Class A | | 82,086 | | 3,458 |
Royal Dutch Shell PLC Class B | | 27,539 | | 1,152 |
Royal Dutch Shell PLC Class A | | 274 | | 12 |
SABMiller PLC | | 4,856 | | 137 |
Schroders PLC | | 56,804 | | 1,462 |
Scottish & Southern Energy PLC | | 31,198 | | 1,013 |
Shire PLC | | 3,812 | | 88 |
Smiths Group PLC | | 86,838 | | 1,741 |
Stagecoach Group PLC | | 83,571 | | 469 |
Standard Chartered PLC | | 20,456 | | 743 |
Tesco PLC | | 529,817 | | 5,003 |
Tomkins PLC | | 22,652 | | 80 |
Tullett Prebon PLC | | 20,315 | | 188 |
Unilever PLC | | 32,541 | | 1,220 |
Vodafone Group PLC | | 337,503 | | 1,258 |
Vodafone Group PLC - ADR | | 71,630 | | 2,673 |
Weir Group PLC (The) | | 5,771 | | 93 |
WH Smith PLC | | 17,622 | | 113 |
William Hill PLC | | 193,817 | | 2,010 |
WM Morrison Supermarkets PLC | | 46,272 | | 298 |
WPP Group PLC | | 362,599 | | 4,642 |
Xstrata PLC | | 25,008 | | 1,761 |
| | | | |
| | | | 78,666 |
| | | | |
| | |
United States - 0.4% | | | | |
NYSE Euronext | | 855 | | 74 |
Synthes, Inc. | | 14,256 | | 1,762 |
| | | | |
| | | | 1,836 |
| | | | |
| | |
| Total Common Stocks | | | | |
(cost $342,859) | | | | 389,922 |
| | | | |
|
| Preferred Stocks - 0.6% |
Germany - 0.5% | | | | |
Henkel KGaA | | 36,107 | | 2,024 |
Volkswagen AG | | 115 | | 17 |
| | | | |
| | | | 2,041 |
| | | | |
| | |
Italy - 0.1% | | | | |
Unipol Gruppo Finanziario SpA | | 77,511 | | 244 |
| | | | |
| | |
| Total Preferred Stocks | | | | |
(cost $2,116) | | | | 2,285 |
| | | | |
Russell Investment Funds
Non-U.S. Fund
Schedule of Investments, continued — December 31, 2007
Amounts in thousands (except share amounts)
| | | | | | |
| | | Notional
Amount | | Market
Value
$ | |
| | | | | | |
Options Purchased - 0.0% | | | |
Switzerland - 0.0% | | | | | | |
Swiss Market Index Futures | | | | | | |
Mar 2008 8,398.00 Put (9) | | CHF | 668 | | 40 | |
Mar 2008 8,532.77 Put (13) | | CHF | 980 | | 57 | |
| | | | | | |
| | |
| Total Options Purchased | | | | | | |
(cost $95) | | | | | 97 | |
| | | | | | |
| | |
| | | Principal
Amount ($)
or Shares | | | |
Short-Term Investments - 8.2% | | | |
United States - 8.2% | | | | | | |
Russell Investment Company Money Market Fund | | | 33,315,000 | | 33,315 | |
United States Treasury Bills (§)(ž) 2.952% due 03/20/08 | | | 2,200 | | 2,184 | |
| | | | | | |
| |
| Total Short-Term Investments | | | |
(cost $35,501) | | | | | 35,499 | |
| | | | | | |
| | |
| Other Securities - 9.1% | | | | | | |
State Street Securities Lending Quality Trust (×) | | | 39,195,360 | | 39,195 | |
| | | | | | |
| | |
| Total Other Securities | | | | | | |
(cost $39,195) | | | | | 39,195 | |
| | | | | | |
| | |
| Total Investments - 108.2% | | | | | | |
(identified cost $419,766) | | | | | 466,998 | |
| | |
Other Assets and Liabilities,
Net - (8.2%) | | | | | (35,312 | ) |
| | | | | | |
| | |
| Net Assets - 100.0% | | | | | 431,686 | |
| | | | | | |
A portion of the portfolio has been fair valued as of period end.
See accompanying notes which are an integral part of the financial statements.
Russell Investment Funds
Non-U.S. Fund
Schedule of Investments, continued — December 31, 2007
Amounts in thousands
| | | | | | |
Futures Contracts
(Number of Contracts) | | Notional
Amount | | Unrealized
Appreciation
(Depreciation)
$ | |
| | | | | | |
| | | | | | |
Long Positions | | | | | | |
AEX Index (Netherlands) expiration date 01/08 (11) | | EUR | 1,137 | | 24 | |
CAC-40 Index (France) expiration date 01/08 (57) | | EUR | 3,204 | | 45 | |
DAX Index (Germany) expiration date 03/08 (23) | | EUR | 4,683 | | 216 | |
EUR STOXX 50 Index
(EMU) expiration date 03/08 (96) | | EUR | 4,258 | | 131 | |
FTSE-100 Index (UK)
expiration date 03/08 (119) | | GBP | 7,681 | | 270 | |
Hang Seng Index (Hong Kong) expiration date 01/08 (21) | | HKD | 29,306 | | 10 | |
MSCI Singapore Index
expiration date 01/08 (1) | | SGD | 85 | | 1 | |
TOPIX Index (Japan)
expiration date 03/08 (132) | | JPY | 1,940,400 | | (971 | ) |
| | |
Short Positions | | | | | | |
IBEX Plus Index (Spain)
expiration date 01/08 (19) | | EUR | 2,871 | | 44 | |
MIB-30 (Italy)
expiration date 03/08 (9) | | EUR | 1,751 | | (19 | ) |
OMX Stockholm 30 Index (Sweden) expiration date 01/08 (100) | | SEK | 10,838 | | (15 | ) |
SPI 200 Index (Australia) expiration date 03/08 (44) | | AUD | 6,983 | | (111 | ) |
| | | | | | |
| | |
Total Unrealized Appreciation (Depreciation) on Open Futures Contracts | | | | | (375 | ) |
| | | | | | |
| | | | | | |
Options Written
(Number of Contracts) | | Notional
Amount | | Market
Value
$ | |
| �� | | | | | |
| Switzerland | | | | | | |
| Swiss Market Index Futures | | | | | | |
| Mar 2008 8,398.00 Call (9) | | CHF | 668 | | (40 | ) |
| Mar 2008 8,532.77 Call (13) | | CHF | 980 | | (57 | ) |
| | | | | | |
| | |
Total Liability for Options Written
(premiums received $95) | | | | | (97 | ) |
| | | | | | |
See accompanying notes which are an integral part of the financial statements.
Russell Investment Funds
Non-U.S. Fund
Schedule of Investments, continued — December 31, 2007
Amounts in thousands
| | | | | | | | | | | | | |
| Index Swap Contracts | | | | | | | | | | | | | |
Fund Receives
Underlying Security | | Counter
Party | | Notional
Amount | | Fund Pays
Floating Rate | | Termination
Date | | Unrealized
Appreciation
(Depreciation)
$ | |
| | | | | | | | | | | | | |
MSCI Denmark
Local Net Total Return Index | | Merrill Lynch | | DKK | | 3,994 | | 1 Month EUR LIBOR
minus 0.80% | | 03/19/08 | | (14 | ) |
MSCI Denmark
Local Net Total Return Index | | Merrill Lynch | | DKK | | 708 | | 1 Month EUR LIBOR
minus 0.80% | | 03/19/08 | | (2 | ) |
MSCI Belgium
Local Net Total Return Index | | Merrill Lynch | | EUR | | 325 | | 1 Month EUR LIBOR
plus 0.12% | | 03/19/08 | | 11 | |
| | | | | | | | | | | | | |
| | |
Total Unrealized Appreciation (Depreciation) on Open Index Swap Contracts | | | | (5 | ) |
| | | | | | | | | | | | | |
| | | | | | |
Industry Diversification
(Unaudited) | | % of
Net
Assets | | | Market Value
$ | |
| | | | | | |
| | | | | | |
Auto and Transportation | | 5.0 | | | 21,408 | |
Consumer Discretionary | | 10.5 | | | 45,552 | |
Consumer Staples | | 12.5 | | | 52,711 | |
Financial Services | | 17.7 | | | 74,227 | |
Health Care | | 6.8 | | | 29,616 | |
Information Technology | | 0.2 | | | 791 | |
Integrated Oils | | 5.1 | | | 21,533 | |
Materials and Processing | | 8.7 | | | 38,040 | |
Miscellaneous | | 1.2 | | | 4,922 | |
Other Energy | | 1.3 | | | 5,858 | |
Producer Durables | | 9.8 | | | 44,451 | |
Technology | | 3.3 | | | 13,952 | |
Utilities | | 8.8 | | | 39,146 | |
Options Purchased | | — | | | 97 | |
Short-Term Investments | | 8.2 | | | 35,499 | |
Other Securities | | 9.1 | | | 39,195 | |
| | | | | | |
| | |
Total Investments | | 108.2 | | | 466,998 | |
Other Assets and Liabilities, Net | | (8.2 | ) | | (35,312 | ) |
| | | | | | |
| | |
Net Assets | | 100.0 | | | 431,686 | |
| | | | | | |
| | | | | | |
Geographic Diversification
(Unaudited) | | % of
Net
Assets | | | Market
Value
$ | |
| | | | | | |
Africa | | 0.1 | | | 416 | |
Asia | | 5.1 | | | 22,067 | |
Europe | | 47.4 | | | 204,530 | |
Japan | | 15.8 | | | 68,155 | |
Latin America | | 2.5 | | | 10,434 | |
Middle East | | 0.4 | | | 1,590 | |
Other Regions | | 9.6 | | | 41,945 | |
United Kingdom | | 18.2 | | | 78,666 | |
Other Securities | | 9.1 | | | 39,195 | |
| | | | | | |
| | |
Total Investments | | 108.2 | | | 466,998 | |
Other Assets and Liabilities, Net | | (8.2 | ) | | (35,312 | ) |
| | | | | | |
| | |
Net Assets | | 100.0 | | | 431,686 | |
| | | | | | |
See accompanying notes which are an integral part of the financial statements.
Russell Investment Funds
Non-U.S. Fund
Schedule of Investments, continued — December 31, 2007
Amounts in thousands
| | | | | | | | | | | |
| Foreign Currency Exchange Contracts | |
| | | | | | | | | | | |
Amount
Sold | | Amount
Bought | | Settlement
Date | | Unrealized
Appreciation
(Depreciation)
$ | |
| USD | | 25 | | CHF | | 29 | | 01/03/08 | | — | |
| USD | | 50 | | CHF | | 57 | | 03/19/08 | | 1 | |
| USD | | 111 | | EUR | | 77 | | 01/02/08 | | 2 | |
| USD | | 43 | | EUR | | 29 | | 01/03/08 | | — | |
| USD | | 288 | | EUR | | 200 | | 03/19/08 | | 5 | |
| USD | | 292 | | EUR | | 200 | | 03/19/08 | | 1 | |
| USD | | 295 | | EUR | | 200 | | 03/19/08 | | (2 | ) |
| USD | | 430 | | EUR | | 300 | | 03/19/08 | | 9 | |
| USD | | 732 | | EUR | | 500 | | 03/19/08 | | (1 | ) |
| USD | | 1,320 | | EUR | | 900 | | 03/19/08 | | (3 | ) |
| USD | | 1,903 | | EUR | | 1,300 | | 03/19/08 | | (1 | ) |
| USD | | 2,261 | | EUR | | 1,570 | | 03/19/08 | | 37 | |
| USD | | 2,345 | | EUR | | 1,627 | | 03/19/08 | | 36 | |
| USD | | 3,515 | | EUR | | 2,440 | | 03/19/08 | | 55 | |
| USD | | 5,857 | | EUR | | 4,067 | | 03/19/08 | | 94 | |
| USD | | 12,897 | | EUR | | 8,800 | | 03/19/08 | | (21 | ) |
| USD | | 13,600 | | EUR | | 9,300 | | 03/19/08 | | 7 | |
| USD | | 30 | | GBP | | 15 | | 01/02/08 | | — | |
| USD | | 26 | | GBP | | 13 | | 01/03/08 | | — | |
| USD | | 56 | | GBP | | 28 | | 01/03/08 | | — | |
| USD | | 199 | | GBP | | 100 | | 03/19/08 | | — | |
| USD | | 399 | | GBP | | 200 | | 03/19/08 | | (1 | ) |
| USD | | 504 | | GBP | | 250 | | 03/19/08 | | (8 | ) |
| USD | | 607 | | GBP | | 300 | | 03/19/08 | | (11 | ) |
| USD | | 1,313 | | GBP | | 650 | | 03/19/08 | | (22 | ) |
| USD | | 8,071 | | GBP | | 4,000 | | 03/19/08 | | (125 | ) |
| USD | | 9,091 | | GBP | | 4,500 | | 03/19/08 | | (153 | ) |
| USD | | 101 | | HKD | | 789 | | 03/19/08 | | — | |
| USD | | 234 | | HKD | | 1,822 | | 03/19/08 | | — | |
| USD | | 65 | | JPY | | 7,318 | | 01/07/08 | | 1 | |
| USD | | 77 | | JPY | | 8,624 | | 01/08/08 | | — | |
| USD | | 446 | | JPY | | 50,000 | | 03/19/08 | | 5 | |
| USD | | 545 | | JPY | | 60,000 | | 03/19/08 | | (4 | ) |
| USD | | 909 | | JPY | | 100,000 | | 03/19/08 | | (6 | ) |
| USD | | 909 | | JPY | | 100,000 | | 03/19/08 | | (7 | ) |
| USD | | 1,898 | | JPY | | 212,137 | | 03/19/08 | | 17 | |
| USD | | 2,182 | | JPY | | 240,000 | | 03/19/08 | | (15 | ) |
| USD | | 2,958 | | JPY | | 325,000 | | 03/19/08 | | (24 | ) |
| USD | | 3,912 | | JPY | | 430,000 | | 03/19/08 | | (30 | ) |
| USD | | 4,071 | | JPY | | 455,817 | | 03/19/08 | | 44 | |
| USD | | 4,869 | | JPY | | 535,000 | | 03/19/08 | | (39 | ) |
| USD | | 2 | | MXN | | 21 | | 01/02/08 | | — | |
| USD | | 2 | | MXN | | 21 | | 01/03/08 | | — | |
| USD | | 16,047 | | NOK | | 89,379 | | 03/19/08 | | 377 | |
| USD | | 87 | | SEK | | 571 | | 03/19/08 | | 1 | |
| USD | | 520 | | SGD | | 756 | | 03/19/08 | | 8 | |
| AUD | | 324 | | USD | | 276 | | 03/19/08 | | (7 | ) |
| AUD | | 324 | | USD | | 276 | | 03/19/08 | | (7 | ) |
| AUD | | 701 | | USD | | 598 | | 03/19/08 | | (14 | ) |
| | | | | | | | | | | |
| Foreign Currency Exchange Contracts | |
Amount
Sold | | Amount
Bought | | Settlement
Date | | Unrealized
Appreciation
(Depreciation)
$ | |
| CHF | | 6,601 | | USD | | 5,758 | | 03/19/08 | | (99 | ) |
| DKK | | 11 | | USD | | 2 | | 03/19/08 | | — | |
| DKK | | 890 | | USD | | 172 | | 03/19/08 | | (3 | ) |
| EUR | | 19 | | USD | | 28 | | 01/02/08 | | — | |
| EUR | | 39 | | USD | | 57 | | 01/02/08 | | — | |
| EUR | | 42 | | USD | | 61 | | 01/02/08 | | — | |
| EUR | | 39 | | USD | | 57 | | 01/03/08 | | — | |
| EUR | | 39 | | USD | | 57 | | 01/03/08 | | — | |
| EUR | | 100 | | USD | | 147 | | 03/19/08 | | 1 | |
| EUR | | 100 | | USD | | 148 | | 03/19/08 | | 2 | |
| EUR | | 200 | | USD | | 292 | | 03/19/08 | | — | |
| EUR | | 400 | | USD | | 586 | | 03/19/08 | | 1 | |
| EUR | | 500 | | USD | | 733 | | 03/19/08 | | 1 | |
| EUR | | 500 | | USD | | 733 | | 03/19/08 | | 1 | |
| EUR | | 600 | | USD | | 880 | | 03/19/08 | | 2 | |
| EUR | | 800 | | USD | | 1,178 | | 03/19/08 | | 7 | |
| EUR | | 1,200 | | USD | | 1,759 | | 03/19/08 | | 3 | |
| EUR | | 6,148 | | USD | | 8,844 | | 03/19/08 | | (151 | ) |
| EUR | | 8,100 | | USD | | 11,858 | | 03/19/08 | | 7 | |
| GBP | | 95 | | USD | | 189 | | 01/02/08 | | — | |
| GBP | | 61 | | USD | | 122 | | 01/03/08 | | 1 | |
| GBP | | 100 | | USD | | 202 | | 03/19/08 | | 3 | |
| GBP | | 100 | | USD | | 202 | | 03/19/08 | | 4 | |
| GBP | | 100 | | USD | | 204 | | 03/19/08 | | 5 | |
| GBP | | 200 | | USD | | 408 | | 03/19/08 | | 11 | |
| GBP | | 237 | | USD | | 477 | | 03/19/08 | | 7 | |
| GBP | | 250 | | USD | | 505 | | 03/19/08 | | 9 | |
| GBP | | 300 | | USD | | 606 | | 03/19/08 | | 11 | |
| GBP | | 570 | | USD | | 1,148 | | 03/19/08 | | 16 | |
| GBP | | 700 | | USD | | 1,415 | | 03/19/08 | | 25 | |
| GBP | | 1,140 | | USD | | 2,295 | | 03/19/08 | | 31 | |
| GBP | | 2,105 | | USD | | 4,254 | | 03/19/08 | | 73 | |
| GBP | | 3,000 | | USD | | 6,060 | | 03/19/08 | | 101 | |
| GBP | | 5,675 | | USD | | 11,414 | | 03/19/08 | | 142 | |
| JPY | | 5,000 | | USD | | 46 | | 03/19/08 | | — | |
| JPY | | 50,000 | | USD | | 450 | | 03/19/08 | | (2 | ) |
| JPY | | 50,000 | | USD | | 461 | | 03/19/08 | | 9 | |
| JPY | | 100,000 | | USD | | 905 | | 03/19/08 | | 2 | |
| JPY | | 150,000 | | USD | | 1,366 | | 03/19/08 | | 12 | |
| JPY | | 595,000 | | USD | | 5,411 | | 03/19/08 | | 39 | |
| NOK | | 3,259 | | USD | | 584 | | 03/19/08 | | (15 | ) |
| NOK | | 3,259 | | USD | | 585 | | 03/19/08 | | (14 | ) |
| NOK | | 18,725 | | USD | | 3,352 | | 03/19/08 | | (89 | ) |
| SEK | | 18,888 | | USD | | 2,878 | | 03/19/08 | | (46 | ) |
| SGD | | 22 | | USD | | 15 | | 03/19/08 | | — | |
| ZAR | | 751 | | USD | | 107 | | 01/02/08 | | (3 | ) |
| | | | | | | | | | | |
| | | | | |
| | | | | | | | | | 303 | |
| | | | | | | | | | | |
See accompanying notes which are an integral part of the financial statements.
Russell Investment Funds
Non-U.S. Fund
Presentation of Portfolio Holdings — December 31, 2007
| | | |
| Categories | | % of Net
Assets | |
| | | |
| | | |
| | | |
Australia | | 2.1 | |
Austria | | 0.5 | |
Belgium | | 0.4 | |
Bermuda | | 1.2 | |
Brazil | | 0.5 | |
Canada | | 1.0 | |
Cayman Islands | | 0.7 | |
China | | 0.1 | |
Czech Republic | | 0.2 | |
Denmark | | 1.0 | |
Egypt | | 0.4 | |
Finland | | 1.6 | |
France | | 12.9 | |
Germany | | 8.3 | |
Greece | | 0.2 | |
Hong Kong | | 0.8 | |
India | | 0.2 | |
Indonesia | | 0.1 | |
Ireland | | 0.5 | |
Italy | | 3.5 | |
Japan | | 15.8 | |
Luxembourg | | 0.7 | |
Mexico | | 0.1 | |
Netherlands | | 4.2 | |
Netherlands Antilles | | — | * |
Norway | | 0.2 | |
Papua New Guinea | | — | * |
Portugal | | 0.2 | |
Russia | | 0.4 | |
Singapore | | 0.7 | |
South Africa | | 0.1 | |
South Korea | | 0.8 | |
Spain | | 2.2 | |
Sweden | | 1.3 | |
Switzerland | | 8.3 | |
Taiwan | | 0.2 | |
Thailand | | 0.1 | |
Turkey | | 0.2 | |
United Kingdom | | 18.2 | |
United States | | 0.4 | |
Preferred Stocks | | 0.6 | |
Options Purchased | | — | * |
Short-Term Investments | | 8.2 | |
Other Securities | | 9.1 | |
| | | |
| |
Total Investments | | 108.2 | |
Other Assets and Liabilities Net | | (8.2 | ) |
| | | |
| |
| | 100.0 | |
| | | |
| | | |
| Categories | | % of Net
Assets | |
| | | |
Futures Contracts | | (— | *) |
Options Written | | (— | *) |
Foreign Currency Exchange Contracts | | — | * |
Index Swap Contracts | | (— | *) |
| * | Less than .05% of net assets. |
See accompanying notes which are an integral part of the financial statements.
(This page intentionally left blank)
Russell Investment Funds
Real Estate Securities Fund
Portfolio Management Discussion and Analysis — December 31, 2007 (Unaudited)

| | | |
|
| Real Estate Securities Fund | |
| | | Total
Return | |
1 Year | | (15.86 | )% |
5 Years | | 19.03 | %§ |
Inception* | | 14.17 | %§ |
| | | |
|
| FTSE NAREIT Equity REIT Index ** | |
| | | Total
Return | |
1 Year | | (15.69 | )% |
5 Years | | 18.17 | %§ |
Inception* | | 14.16 | %§ |
| * | | The Fund commenced operations on April 30, 1999. |
| ** | | FTSE National Association of Real Estate Investment Trusts (NAREIT) Equity REIT Index is an index composed of all the data based on the last closing price of the month for all tax-qualified REITs listed on the New York Stock Exchange, American Stock Exchange, and the NASDAQ National Market System. The data is market value-weighted. The total-return calculation is based upon whether it is 1-month, 3-months or 12-months. Only those REITs listed for the entire period are used in the total return calculation. |
Performance is historical and assumes reinvestment of all dividends and capital gains. Investment return and principal value will fluctuate so that an investor’s shares, when redeemed, may be worth more or less than when purchased. Past performance is not indicative of future results.
| | |
| 54 | | Real Estate Securities Fund |
Russell Investment Funds
Real Estate Securities Fund
Portfolio Management Discussion and Analysis — December 31, 2007 (Unaudited)
The Real Estate Securities Fund (the “Fund”) allocates most of its assets among multiple money managers. Russell Investment Management Company (“RIMCo”), as the Fund’s advisor, may change the allocation of the Fund’s assets among money managers at any time. An exemptive order from the Securities and Exchange Commission (SEC) permits RIMCo to engage or terminate a money manager at any time, subject to the approval by the Fund’s Board without a shareholder vote. Pursuant to the terms of the exemptive order, the Fund is required to notify its shareholders within 60 days of when a money manager begins providing services. The Fund currently has five money managers.
What is the Fund’s investment objective?
The Fund seeks to provide current income and long term capital growth.
How did the Fund perform relative to its benchmark for the fiscal year ended December 31, 2007?
For the fiscal year ended December 31, 2007, the Real Estate Securities Fund returned (15.86)%. This compared to the FTSE NAREIT Equity REIT Index, which returned (15.69)% during the same period. The Fund’s performance includes operating expenses, whereas Index returns are unmanaged and do not include expenses of any kind.
For the year ended December 31, 2007, the Lipper® Real Estate Funds (VIP) Average returned (14.87)%. This result serves as a peer comparison and is expressed net of operating expenses.
How did the market conditions described in the Market Summary report affect the Fund’s performance?
The money managers positioned the Fund to benefit from property sectors with the strongest supply and demand fundamentals. The largest overweight positions were in the regional malls and office sectors. The market favored the more defensive sectors, including industrial, health care and specialty. As discussed below, sector positioning was a negative contributor to the Fund’s performance during the fiscal year.
The Fund maintained a primary focus on the larger and more liquid REITs during the fiscal year. With the exceptional volatility experienced during the fiscal year, this positioning generally benefited the Fund during periods when the REIT market was rising, but detracted during periods when the market was declining. Non-dedicated REIT investors typically trade the more liquid securities when they rotate into or out of the sector.
Mergers and acquisitions activity was a positive contributor to the Fund’s performance. The Fund maintained overweight positions in two companies that were acquisition targets: Hilton Hotels Corporation and Archstone-Smith Trust. Both companies were acquired by private market investors at significant premiums to their share prices.
How did the investment strategies and techniques employed by the Fund and its money managers affect its performance?
AEW Management and Advisors, L.P. pursues a value-oriented style that focuses on identifying companies that it believes are mispriced relative to underlying real estate net asset value. AEW underperformed the benchmark during the fiscal year due primarily to adverse sector selection. The primary detractors were underweight positions in the outperforming health care and specialty sectors. Stock selection had a neutral impact on performance.
INVESCO Institutional (N.A.) maintains a broadly diversified portfolio with exposure to all major property sectors. Its investment style incorporates fundamental property market research and bottom-up quantitative securities analysis. INVESCO outperformed the benchmark during the fiscal year due to contributions from stock selection and, to a lesser extent, sector selection. Stock selection was strongest in the industrial and health care sectors. Positive sector selection was driven by an overweight in the health care sector and an underweight in the mixed industrial/office sector. An underweight in the outperforming specialty sector partially offset these positive effects.
RREEF America L.L.C.’s style emphasizes a top-down approach to property sector weights based on an assessment of property market fundamentals. RREEF outperformed the benchmark during the fiscal year due to contributions from stock selection. Stock selection was strongest in the shopping centers, apartments, health care and industrial sectors. Sector selection had a negative impact on overall performance, driven by underweight positions in the outperforming specialty and health care sectors.
Heitman Real Estate Securities LLC manages a concentrated portfolio with a bottom-up approach to stock selection focusing on companies that it believes have attractive valuations relative to growth prospects. Heitman outperformed the benchmark during the fiscal year, primarily as a result of effective stock selection. Stock selection was strongest in the regional malls, shopping centers, health care and apartments sectors. Sector selection detracted from performance, due primarily to an underweight in the outperforming specialty sector.
Cohen & Steers Capital Management Inc. was added to the Fund in May 2007 and manages a broadly diversified portfolio of global property securities. Cohen & Steers uses a bottom-up approach to portfolio construction, emphasizing the relationship between price and net asset value as the principal valuation metric. From its hire through the end of the fiscal year, its global portfolio had a positive impact on Fund performance. Investments in the Asia Pacific region, particularly in Hong Kong, had a positive
| | |
| Real Estate Securities Fund | | 55 |
Russell Investment Funds
Real Estate Securities Fund
Portfolio Management Discussion and Analysis — December 31, 2007 (Unaudited)
contribution, but this was partially offset by investments in the underperforming United Kingdom market.
Describe any changes to the Fund’s structure or the money manager line-up.
Cohen & Steers was added to the manager line-up in May 2007 at a 10% target weight to implement a global strategy for the Fund. The global strategy is intended to provide diversification benefits and the potential to participate in the evolving non-U.S. REIT market. The non-U.S. REIT market continues to grow as more countries adopt REIT structures.
| | |
| |
Money Managers as of
December 31, 2007 | | Styles |
AEW Management and Advisors, L.P. | | Value |
Cohen & Steers Capital Management, Inc. | | Global
Market-Oriented |
Heitman Real Estate Securities LLC | | Growth |
INVESCO Institutional (N.A.), Inc. which acts
as a money manager to the Fund through its
INVESCO Real Estate division | | Market-Oriented |
RREEF America L.L.C. | | Market-Oriented |
The views expressed in this report reflect those of the portfolio managers only through the end of the period covered by the report. These views do not necessarily represent the views of Russell Investment Management Company (RIMCo), or any other person in RIMCo or any other affiliated organization. These views are subject to change at any time based upon market conditions or other events, and RIMCo disclaims any responsibility to update the views contained herein. These views should not be relied on as investment advice and, because investment decisions for Russell Investment Funds (RIF) are based on numerous factors, should not be relied on as an indication of investment decisions of any RIF Fund.
| | |
| 56 | | Real Estate Securities Fund |
Russell Investment Funds
Real Estate Securities Fund
Shareholder Expense Example — December 31, 2007 (Unaudited)
Fund Expenses
The following disclosure provides important information regarding each Fund’s Expense Example, which appears on each Fund’s individual page in this Annual Report. Please refer to this information when reviewing the Expense Example for a Fund.
Example
As a shareholder of the Fund, you incur two types of costs: (1) transaction costs, and (2) ongoing costs, including management fees and other Fund expenses. The Example is intended to help you understand your ongoing costs (in dollars) of investing in the Fund and to compare these costs with the ongoing costs of investing in other mutual funds. The Example is based on an investment of $1,000 invested at the beginning of the period and held for the entire period indicated, which for this Fund is from July 1, 2007 to December 31, 2007.
Actual Expenses
The information in the table under the heading “Actual Performance” provides information about actual account values and actual expenses. You may use the information in this column, together with the amount you invested, to estimate the expenses that you paid over the period. Simply divide your account value by $1,000 (for example, an $8,600 account value divided by $1,000 = 8.6), then multiply the result by the number in the first column in the row entitled “Expenses Paid During Period” to estimate the expenses you paid on your account during this period.
Hypothetical Example for Comparison Purposes
The information in the table under the heading “Hypothetical Performance (5% return before expenses)” provides information about hypothetical account values and hypothetical expenses based on the Fund’s actual expense ratio and an assumed rate of return of 5% per year before expenses, which is not the Fund’s actual return. The hypothetical account values and expenses may not be used to estimate the actual ending account balance or expenses you paid for the period. You may use this information to compare the ongoing costs of investing in the Fund and other funds. To do so, compare this 5% hypothetical example with the 5% hypothetical examples that appear in the shareholder reports of other funds.
Please note that the expenses shown in the table are meant to highlight your ongoing costs only and do not reflect any transactional costs. Therefore, the information under the heading “Hypothetical Performance (5% return before expenses)” is useful in comparing ongoing costs only, and will not help you determine the relative total costs of owning different funds. In addition, if these transactional costs were included, your costs would have been higher.
| | | | | | |
| | | Actual
Performance | | Hypothetical
Performance
(5% return
before expenses) |
| | | | | | |
Beginning Account Value | | | | | | |
July 1, 2007 | | $ | 1,000.00 | | $ | 1,000.00 |
Ending Account Value | | | | | | |
December 31, 2007 | | $ | 900.10 | | $ | 1,020.42 |
Expenses Paid During Period* | | $ | 4.55 | | $ | 4.84 |
| * | Expenses are equal to the Fund’s annualized expense ratio of 0.95% (representing the six month period annualized), multiplied by the average account value over the period, multiplied by 184/365 (to reflect the one-half year period). |
| | |
| Real Estate Securities Fund | | 57 |
Russell Investment Funds
Real Estate Securities Fund
Schedule of Investments — December 31, 2007
Amounts in thousands (except share amounts)
| | | | |
| | | Principal
Amount ($)
or Shares | | Market
Value
$ |
| | | | |
Common Stocks - 96.4% | | | | |
Apartments - 13.5% | | | | |
Apartment Investment & Management Co. Class A (ö)(Ñ) | | 156,403 | | 5,432 |
AvalonBay Communities, Inc. (ö) | | 189,941 | | 17,881 |
BRE Properties, Inc. Class A (ö)(Ñ) | | 156,472 | | 6,342 |
Camden Property Trust (ö)(Ñ) | | 158,900 | | 7,651 |
Colonial Properties Trust (ö) | | 29,500 | | 668 |
Deutsche Wohnen AG | | 3,915 | | 120 |
Equity Residential (ö)(Ñ) | | 463,018 | | 16,886 |
Essex Property Trust, Inc. (ö)(Ñ) | | 64,137 | | 6,253 |
Home Properties, Inc. (ö)(Ñ) | | 11,000 | | 493 |
Mid-America Apartment Communities, Inc. (ö) | | 34,700 | | 1,483 |
UDR, Inc. (ö)(Ñ) | | 128,203 | | 2,545 |
| | | | |
| | | | 65,754 |
| | | | |
| | |
Diversified - 10.4% | | | | |
British Land Co. PLC (ö) | | 56,095 | | 1,046 |
CA Immobilien Anlagen AG (Æ) | | 10,010 | | 222 |
CapitaLand, Ltd. | | 29,000 | | 125 |
Castellum AB | | 42,000 | | 431 |
Cheung Kong Holdings, Ltd. | | 21,429 | | 390 |
DB RREEF Trust (ö) | | 144,028 | | 252 |
Eurocastle Investment, Ltd. | | 2,309 | | 56 |
Forest City Enterprises, Inc. Class A | | 8,459 | | 376 |
GPT Group (ö) | | 208,378 | | 736 |
Great Eagle Holdings, Ltd. | | 203,361 | | 751 |
Heiwa Real Estate Co., Ltd. | | 43,000 | | 272 |
Helical Bar PLC | | 34,700 | | 224 |
Henderson Land Development Co., Ltd. | | 158,822 | | 1,472 |
Hysan Development Co., Ltd. | | 194,264 | | 550 |
ICADE (ö) | | 1,372 | | 205 |
iStar Financial, Inc. (ö)(Ñ) | | 56,000 | | 1,459 |
IVG Immobilien AG | | 4,609 | | 156 |
Kenedix Realty Investment Corp. Class A (ö) | | 25 | | 165 |
Kerry Properties, Ltd. | | 15,000 | | 120 |
Land Securities Group PLC (ö) | | 79,627 | | 2,368 |
Mirvac Group (ö) | | 65,396 | | 344 |
Mitsubishi Estate Co., Ltd. | | 100,000 | | 2,397 |
Mitsui Fudosan Co., Ltd. | | 93,000 | | 2,010 |
New World China Land, Ltd. | | 432,435 | | 386 |
Sino Land Co. | | 133,912 | | 470 |
Sino-Ocean Land Holdings, Ltd. (Æ) | | 944 | | 1 |
Sponda OYJ | | 19,281 | | 229 |
Stockland (ö) | | 52,925 | | 390 |
| | | | |
| | | Principal
Amount ($)
or Shares | | Market
Value
$ |
Sumitomo Realty & Development Co., Ltd. | | 9,000 | | 221 |
Sun Hung Kai Properties, Ltd. | | 66,409 | | 1,397 |
Unibail-Rodamco (ö) | | 10,617 | | 2,311 |
Vornado Realty Trust (ö)(Ñ) | | 294,397 | | 25,892 |
Washington Real Estate Investment Trust (ö)(Ñ) | | 83,000 | | 2,607 |
Wharf Holdings, Ltd. | | 120,577 | | 622 |
| | | | |
| | | | 50,653 |
| | | | |
| | |
Free Standing Retail - 0.1% | | | | |
Realty Income Corp. (ö)(Ñ) | | 24,400 | | 659 |
| | | | |
| | |
Health Care - 8.0% | | | | |
HCP, Inc. (ö)(Ñ) | | 253,550 | | 8,818 |
Health Care REIT, Inc. (ö)(Ñ) | | 79,800 | | 3,566 |
Healthcare Realty Trust, Inc. (ö)(Ñ) | | 36,300 | | 922 |
LTC Properties, Inc. (ö) | | 40,000 | | 1,002 |
Nationwide Health Properties, Inc. (ö) | | 301,050 | | 9,444 |
Omega Healthcare Investors, Inc. (ö) | | 106,500 | | 1,709 |
Senior Housing Properties Trust (ö)(Ñ) | | 86,000 | | 1,951 |
Ventas, Inc. (ö) | | 257,300 | | 11,643 |
| | | | |
| | | | 39,055 |
| | | | |
| | |
Industrial - 7.4% | | | | |
AMB Property Corp. (ö)(Ñ) | | 126,200 | | 7,264 |
DCT Industrial Trust, Inc. (ö)(Ñ) | | 275,800 | | 2,568 |
First Potomac Realty Trust (ö)(Ñ) | | 62,800 | | 1,086 |
Goodman Group (ö) | | 115,824 | | 499 |
Prologis (ö) | | 379,969 | | 24,082 |
Segro PLC (ö) | | 82,813 | | 769 |
| | | | |
| | | | 36,268 |
| | | | |
| | |
Lodging/Resorts - 6.7% | | | | |
Ashford Hospitality Trust, Inc. (ö)(Ñ) | | 125,800 | | 905 |
DiamondRock Hospitality Co. (ö)(Ñ) | | 48,300 | | 724 |
FelCor Lodging Trust, Inc. (ö) | | 77,950 | | 1,215 |
Hospitality Properties Trust (ö) | | 16,000 | | 516 |
Host Hotels & Resorts, Inc. (ö) | | 1,132,591 | | 19,299 |
LaSalle Hotel Properties (ö)(Ñ) | | 83,213 | | 2,654 |
Shangri-La Asia, Ltd. | | 151,211 | | 470 |
Starwood Hotels & Resorts Worldwide, Inc. | | 155,609 | | 6,851 |
Sunstone Hotel Investors, Inc. (ö) | | 10,951 | | 200 |
| | | | |
| | | | 32,834 |
| | | | |
| | |
Manufactured Homes - 0.4% | | | | |
Equity Lifestyle Properties, Inc. (ö) | | 46,250 | | 2,112 |
| | | | |
| | |
| 58 | | Real Estate Securities Fund |
Russell Investment Funds
Real Estate Securities Fund
Schedule of Investments, continued — December 31, 2007
Amounts in thousands (except share amounts)
| | | | |
| | | Principal
Amount ($)
or Shares | | Market
Value
$ |
| | | | |
Mixed Industrial/Office - 1.0% | | | | |
Liberty Property Trust (ö)(Ñ) | | 126,091 | | 3,633 |
PS Business Parks, Inc. (ö) | | 23,400 | | 1,229 |
| | | | |
| | | | 4,862 |
| | | | |
| | |
Office - 15.3% | | | | |
Alexandria Real Estate Equities, Inc. (ö)(Ñ) | | 43,500 | | 4,423 |
Alstria Office REIT-AG (Æ)(ö) | | 12,291 | | 184 |
Beni Stabili SpA | | 355,394 | | 385 |
BioMed Realty Trust, Inc. (ö) | | 200,561 | | 4,647 |
Boston Properties, Inc. (ö) | | 224,473 | | 20,609 |
Brandywine Realty Trust (ö)(Ñ) | | 206,881 | | 3,709 |
Brookfield Properties Corp. (Ñ) | | 183,588 | | 3,534 |
CapitaCommercial Trust (Æ)(ö) | | 147,000 | | 250 |
Commonwealth Property Office Fund (ö) | | 488,644 | | 664 |
Corporate Office Properties Trust SBI MD (ö)(Ñ) | | 58,600 | | 1,846 |
DA Office Investment Corp. Class A (ö) | | 15 | | 96 |
Derwent London PLC (ö) | | 53,227 | | 1,485 |
Douglas Emmett, Inc. (ö) | | 291,690 | | 6,595 |
Great Portland Estates PLC (ö) | | 94,633 | | 897 |
Highwoods Properties, Inc. (ö)(Ñ) | | 35,400 | | 1,040 |
Hongkong Land Holdings, Ltd. | | 274,000 | | 1,345 |
HRPT Properties Trust (ö)(Ñ) | | 173,000 | | 1,337 |
Kilroy Realty Corp. (ö)(Ñ) | | 70,862 | | 3,895 |
Mack-Cali Realty Corp. (ö)(Ñ) | | 69,051 | | 2,348 |
Maguire Properties, Inc. (ö) | | 13,678 | | 403 |
Nomura Real Estate Office Fund, Inc. Class A (ö) | | 22 | | 207 |
Norwegian Property ASA | | 16,291 | | 198 |
Parkway Properties, Inc. (ö)(Ñ) | | 10,600 | | 392 |
SL Green Realty Corp. (ö)(Ñ) | | 149,120 | | 13,937 |
Societe Immobiliere de Location pour l’Industrie et le Commerce (ö) | | 1,741 | | 254 |
Tishman Speyer Office Fund (ö) | | 137,300 | | 195 |
Tokyo Tatemono Co., Ltd. | | 2,000 | | 19 |
| | | | |
| | | | 74,894 |
| | | | |
| | |
Regional Malls - 16.0% | | | | |
Aeon Mall Co., Ltd. | | 22,600 | | 593 |
CBL & Associates Properties, Inc. (ö)(Ñ) | | 72,300 | | 1,729 |
CFS Retail Property Trust (ö) | | 202,360 | | 415 |
General Growth Properties, Inc. (ö) | | 376,220 | | 15,493 |
| | | | |
| | | Principal
Amount ($)
or Shares | | Market
Value
$ |
Macerich Co. (The) (ö)(Ñ) | | 188,102 | | 13,366 |
Simon Property Group, Inc. (ö) | | 447,627 | | 38,881 |
Taubman Centers, Inc. (ö)(Ñ) | | 145,900 | | 7,177 |
Westfield Group (ö) | | 34,463 | | 631 |
| | | | |
| | | | 78,285 |
| | | | |
| | |
Self Storage - 4.4% | | | | |
Extra Space Storage, Inc. (ö)(Ñ) | | 95,800 | | 1,369 |
Public Storage (ö)(Ñ) | | 273,851 | | 20,103 |
| | | | |
| | | | 21,472 |
| | | | |
| | |
Shopping Centers - 11.0% | | | | |
Cedar Shopping Centers, Inc. (ö) | | 62,000 | | 634 |
Citycon Oyj | | 46,277 | | 246 |
Corio NV (ö) | | 3,418 | | 275 |
Developers Diversified Realty Corp. (ö) | | 258,163 | | 9,885 |
Federal Realty Invs Trust (ö)(Ñ) | | 206,458 | | 16,960 |
Hammerson PLC (ö) | | 44,579 | | 907 |
Kimco Realty Corp. (ö)(Ñ) | | 187,900 | | 6,840 |
Kite Realty Group Trust (ö)(Ñ) | | 102,400 | | 1,564 |
Mercialys SA (ö) | | 3,681 | | 140 |
Regency Centers Corp. (ö) | | 191,467 | | 12,348 |
Saul Centers, Inc. (ö) | | 17,600 | | 940 |
Tanger Factory Outlet Centers (ö)(Ñ) | | 78,750 | | 2,970 |
| | | | |
| | | | 53,709 |
| | | | |
| | |
Specialty - 2.2% | | | | |
Digital Realty Trust, Inc. (ö)(Ñ) | | 167,700 | | 6,435 |
DuPont Fabros Technology, Inc. (ö)(Ñ) | | 53,600 | | 1,050 |
Entertainment Properties Trust (ö)(Ñ) | | 18,000 | | 846 |
Plum Creek Timber Co., Inc. (ö)(Ñ) | | 49,500 | | 2,279 |
| | | | |
| | | | 10,610 |
| | | | |
| | |
| Total Common Stocks | | | | |
(cost $402,796) | | | | 471,167 |
| | | | |
| | |
| Warrants & Rights - 0.0% | | | | |
Wharf Holdings, Ltd. (Æ) | | 15,071 | | 21 |
| | | | |
| | |
| Total Warrants & Rights | | | | |
(cost $—) | | | | 21 |
| | | | |
| | |
| Short-Term Investments - 3.1% | | | | |
Russell Investment Company Money Market Fund | | 15,210,000 | | 15,210 |
| | | | |
| | |
| Total Short-Term Investments | | | | |
(cost $15,210) | | | | 15,210 |
| | | | |
| | |
| Real Estate Securities Fund | | 59 |
Russell Investment Funds
Real Estate Securities Fund
Schedule of Investments, continued — December 31, 2007
Amounts in thousands (except share amounts)
| | | | | |
| | | Principal
Amount ($)
or Shares | | Market
Value
$ | |
| | | | | |
| | |
| Other Securities - 19.8% | | | | | |
State Street Securities Lending Quality Trust (×) | | 96,537,248 | | 96,537 | |
| | | | | |
| | |
| Total Other Securities | | | | | |
(cost $96,537) | | | | 96,537 | |
| | | | | |
| | |
| Total Investments - 119.3% | | | | | |
(identified cost $514,543) | | | | 582,935 | |
| | |
| Other Assets and Liabilities, Net - (19.3%) | | | | (94,126 | ) |
| | | | | |
| | |
| Net Assets - 100.0% | | | | 488,809 | |
| | | | | |
See accompanying notes which are an integral part of the financial statements.
| | |
| 60 | | Real Estate Securities Fund |
Russell Investment Funds
Real Estate Securities Fund
Schedule of Investments, continued — December 31, 2007
Amounts in thousands
| | | | | | | | | | |
| Foreign Currency Exchange Contracts |
| | | | | | | | | | |
Amount
Sold | | Amount
Bought | | Settlement
Date | | Unrealized
Appreciation
(Depreciation)
$ |
| USD | | 3 | | AUD | | 4 | | 01/02/08 | | — |
| USD | | 11 | | AUD | | 12 | | 01/02/08 | | — |
| USD | | 13 | | AUD | | 15 | | 01/02/08 | | — |
| USD | | 26 | | AUD | | 30 | | 01/02/08 | | — |
| USD | | 4 | | AUD | | 5 | | 01/03/08 | | — |
| USD | | 11 | | AUD | | 12 | | 01/03/08 | | — |
| USD | | 15 | | AUD | | 17 | | 01/03/08 | | — |
| USD | | 66 | | AUD | | 76 | | 01/03/08 | | — |
| USD | | 63 | | HKD | | 492 | | 01/02/08 | | — |
| USD | | 73 | | HKD | | 571 | | 01/02/08 | | — |
| USD | | 58 | | HKD | | 452 | | 01/08/08 | | — |
| USD | | 102 | | SGD | | 148 | | 01/02/08 | | — |
| EUR | | 6 | | USD | | 8 | | 01/03/08 | | — |
| EUR | | 9 | | USD | | 13 | | 01/03/08 | | — |
| EUR | | 12 | | USD | | 17 | | 01/03/08 | | — |
| SGD | | 39 | | USD | | 27 | | 01/02/08 | | — |
| SGD | | 14 | | USD | | 10 | | 01/03/08 | | — |
| | | | | | | | | | |
| |
| Total Unrealized Appreciation (Depreciation) on Open Foreign Currency Exchange Contracts | | — |
| | | | | | | | | | |
Presentation of Portfolio Holdings — December 31, 2007
| | | |
| Categories | | % of Net
Assets | |
| | | |
Apartments | | 13.5 | |
Diversified | | 10.4 | |
Free Standing Retail | | 0.1 | |
Health Care | | 8.0 | |
Industrial | | 7.4 | |
Lodging/Resorts | | 6.7 | |
Manufactured Homes | | 0.4 | |
Mixed Industrial/Office | | 1.0 | |
Office | | 15.3 | |
Regional Malls | | 16.0 | |
Self Storage | | 4.4 | |
Shopping Centers | | 11.0 | |
Specialty | | 2.2 | |
Warrants & Rights | | — | * |
Short-Term Investments | | 3.1 | |
Other Securities | | 19.8 | |
| | | |
| |
Total Investments | | 119.3 | |
Other Assets and Liabilities, Net | | (19.3 | ) |
| | | |
| |
| | 100.0 | |
| | | |
| |
Foreign Currency Exchange Contracts | | — | * |
| * | Less than .05% of net assets. |
See accompanying notes which are an integral part of the financial statements.
| | |
| Real Estate Securities Fund | | 61 |
Russell Investment Funds
Core Bond Fund
Portfolio Management Discussion and Analysis — December 31, 2007 (Unaudited)
| | | |
| |
| Core Bond Fund | | | |
| | | Total
Return | |
1 Year | | 7.24 | % |
5 Years | | 4.74 | %§ |
10 Years | | 5.63 | %§ |
| | | |
|
| Lehman Brothers Aggregate Bond Index ** | |
| | | Total
Return | |
1 Year | | 6.97 | % |
5 Years | | 4.42 | %§ |
10 Years | | 5.97 | %§ |
| * | | Assumes initial investment on January 1, 1998. |
| ** | | Lehman Brothers Aggregate Bond Index is composed of securities from Lehman Brothers Government/Corporate Bond Index, Mortgage-Backed Securities Index, and the Asset-Backed Securities Index. Total return comprises price appreciation/ depreciation and income as a percentage of the original investment. Indexes are rebalanced monthly by market capitalization. |
Performance is historical and assumes reinvestment of all dividends and capital gains. Investment return and principal value will fluctuate so that an investor’s shares, when redeemed, may be worth more or less than when purchased. Past performance is not indicative of future results.
Russell Investment Funds
Core Bond Fund
Portfolio Management Discussion and Analysis — December 31, 2007 (Unaudited)
The Core Bond Fund (the “Fund”) allocates most of its assets among multiple money managers. Russell Investment Management Company (“RIMCo”), as the Fund’s advisor, may change the allocation of the Fund’s assets among money managers at any time. An exemptive order from the Securities and Exchange Commission (SEC) permits RIMCo to engage or terminate a money manager at any time, subject to the approval by the Fund’s Board without a shareholder vote. Pursuant to the terms of the exemptive order, the Fund is required to notify its shareholders within 60 days of when a money manager begins providing services. The Fund currently has three money managers.
What is the Fund’s investment objective?
The Fund seeks to provide current income and the preservation of capital.
How did the Fund perform relative to its benchmark for the fiscal year ended December 31, 2007?
For the fiscal year ended December 31, 2007, the Core Bond Fund gained 7.24%. This compared to its benchmark the Lehman Brothers Aggregate Bond Index, which gained 6.97%. The Fund’s performance includes operating expenses, whereas Index returns are unmanaged and do not include expenses of any kind.
For the year ended December 31, 2007, the Lipper® BBB Rated Corp Debt Funds (VIP) Average returned 5.27%. This result serves as a peer comparison and is expressed net of operating expenses.
How did the market conditions described in the Market Summary report affect the Fund’s performance?
Investors’ flight to the relative safety of U.S. Treasuries and the subsequent re-pricing of risk (i.e., the market demanding increased compensation for assuming a given level of risk) impacted nearly all non-Treasury fixed income investments. As a result, non-Treasury investments posted lower returns than the benchmark. Given that the Fund’s money managers typically invest in non-Treasury sectors, the Fund was generally hurt by exposure to so-called “spread sectors” (e.g., mortgages, corporates, asset-backed securities), but benefited significantly by underweighting investment grade corporates versus its benchmark.
The decline in short-term interest rates benefited the Fund as several of the Fund’s managers anticipated the decline and increased sensitivity to interest rates (also called increased duration). In general, as interest rates decline bond prices increase. Therefore, the increase in duration had a positive impact on performance.
Finally, as the Federal Reserve decreased the federal funds rate, intermediate maturity yields also declined resulting in a shift in yields otherwise known as a shift in the yield curve. This yield curve movement benefited the Fund as the Fund’s money managers anticipated the change and varied the maturity of their holdings.
Overall, managers’ investment decisions resulted in the Fund outperforming both its Index and its peers as measured by the Lipper® BBB Rated Corp Debt Funds (VIP) Average.
How did the investment strategies and techniques employed by the Fund and its money managers affect its performance?
By far, the largest impact on Fund performance was from the re-pricing of risk (i.e., the market demanding increased compensation for assuming a given level of risk) and the concern with the consumer’s ability to make mortgage payments. This fear of consumer creditworthiness also spread to broader market sectors and securities that have less exposure to consumer risk, which in turn added to volatility and lower returns. The Fund’s exposure to consumer-related investments in mortgage-backed and asset-backed sectors negatively impacted performance in these sectors. Being defensively positioned with respect to credit, however, was beneficial.
At the manager level, Pacific Investment Management Company LLC (“PIMCO”) was the best performing manager mainly due to its yield curve and sector allocation decisions. Goldman Sachs Asset Management, L.P. also generated positive performance as duration management as well as investments in securities outside of the United States generated positive excess return. Bear Stearns Asset Management Inc. underperformed over the year due to its duration positioning and exposure to securitized products such as mortgage-backed and asset-backed securities.
Describe any changes to the Fund’s structure or the money manager line-up.
There were no changes to the Fund’s structure or money manager line-up during the fiscal year.
| | |
| |
Money Managers as of
December 31, 2007 | | Styles |
Bear Stearns Asset Management Inc. | | Sector Rotation |
Goldman Sachs Asset Management, L.P. | | Fully Discretionary |
Pacific Investment Management Company LLC | | Fully Discretionary |
The views expressed in this report reflect those of the portfolio managers only through the end of the period covered by the report. These views do not necessarily represent the views of Russell Investment Management Company (RIMCo), or any other person in RIMCo or any other affiliated organization. These views are subject to change at any time based upon market conditions or other events, and RIMCo disclaims any responsibility to update the views contained herein. These views should not be relied on as investment advice and, because investment decisions for Russell Investment Funds (RIF) are based on numerous factors, should not be relied on as an indication of investment decisions of any RIF Fund.
Russell Investment Funds
Core Bond Fund
Shareholder Expense Example — December 31, 2007 (Unaudited)
Fund Expenses
The following disclosure provides important information regarding each Fund’s Expense Example, which appears on each Fund’s individual page in this Annual Report. Please refer to this information when reviewing the Expense Example for a Fund.
Example
As a shareholder of the Fund, you incur two types of costs: (1) transaction costs, and (2) ongoing costs, including management fees and other Fund expenses. The Example is intended to help you understand your ongoing costs (in dollars) of investing in the Fund and to compare these costs with the ongoing costs of investing in other mutual funds. The Example is based on an investment of $1,000 invested at the beginning of the period and held for the entire period indicated, which for this Fund is from July 1, 2007 to December 31, 2007.
Actual Expenses
The information in the table under the heading “Actual Performance” provides information about actual account values and actual expenses. You may use the information in this column, together with the amount you invested, to estimate the expenses that you paid over the period. Simply divide your account value by $1,000 (for example, an $8,600 account value divided by $1,000 = 8.6), then multiply the result by the number in the first column in the row entitled “Expenses Paid During Period” to estimate the expenses you paid on your account during this period.
Hypothetical Example for Comparison Purposes
The information in the table under the heading “Hypothetical Performance (5% return before expenses)” provides information about hypothetical account values and hypothetical expenses based on the Fund’s actual expense ratio and an assumed rate of return of 5% per year before expenses, which is not the Fund’s actual return. The hypothetical account values and expenses may not be used to estimate the actual ending account balance or expenses you paid for the period. You may use this information to compare the ongoing costs of investing in the Fund and other funds. To do so, compare this 5% hypothetical example with the 5% hypothetical examples that appear in the shareholder reports of other funds.
Please note that the expenses shown in the table are meant to highlight your ongoing costs only and do not reflect any transactional costs. Therefore, the information under the heading “Hypothetical Performance (5% return before expenses)” is useful in comparing ongoing costs only, and will not help you determine the relative total costs of owning different funds. In addition, if these transactional costs were included, your costs would have been higher.
| | | | | | |
| | | Actual
Performance | | Hypothetical
Performance
(5% return
before expenses) |
| | | | | | |
Beginning Account Value | | | | | | |
July 1, 2007 | | $ | 1,000.00 | | $ | 1,000.00 |
Ending Account Value | | | | | | |
December 31, 2007 | | $ | 1,060.60 | | $ | 1,021.68 |
Expenses Paid During Period* | | $ | 3.64 | | $ | 3.57 |
| * | Expenses are equal to the Fund’s annualized expense ratio of 0.70% (representing the six month period annualized), multiplied by the average account value over the period, multiplied by 184/365 (to reflect the one-half year period). Reflects amounts waived and/or reimbursed by the investment adviser. Without the waiver and/or reimbursement, expenses would have been higher. |
Russell Investment Funds
Core Bond Fund
Schedule of Investments — December 31, 2007
Amounts in thousands (except share amounts)
| | | | |
| | | Principal
Amount ($)
or Shares | | Market
Value
$ |
| | | | |
Long-Term Investments - 90.6% | | | | |
Asset-Backed Securities - 3.6% | | | | |
Accredited Mortgage Loan Trust (Ê) | | | | |
Series 2004-2 Class A2 | | | | |
5.165% due 07/25/34 | | 41 | | 40 |
ACE Securities Corp. (Ê) | | | | |
Series 2003-OP1 Class M2 | | | | |
6.365% due 12/25/33 | | 55 | | 53 |
Series 2005-SD3 Class A | | | | |
5.265% due 08/25/45 | | 236 | | 223 |
Aegis Asset Backed Securities Trust (Ê)
Series 2003-3 Class M2
6.515% due 01/25/34 | | 110 | | 72 |
American Express Credit Account Master Trust (Ê) | | | | |
Series 2004-C Class C (Å) | | | | |
5.528% due 02/15/12 | | 207 | | 207 |
Series 2005-3 Class A | | | | |
5.028% due 01/18/11 | | 700 | | 700 |
Ameriquest Mortgage Securities, Inc. (Ê) | | | | |
Series 2002-D Class M1 | | | | |
7.236% due 02/25/33 | | 90 | | 67 |
Series 2004-R8 Class A5 | | | | |
5.235% due 09/25/34 | | 29 | | 29 |
Bayview Financial Acquisition Trust
Series 2006-A Class 1A3
5.865% due 02/28/41 | | 190 | | 183 |
CIT Mortgage Loan Trust (Ê)(Þ) | | | | |
Series 2007-1 Class 2A1 | | | | |
5.865% due 10/01/37 | | 425 | | 418 |
Series 2007-1 Class 2A2 | | | | |
6.115% due 10/01/37 | | 130 | | 124 |
Series 2007-1 Class 2A3 | | | | |
6.239% due 10/01/37 | | 180 | | 164 |
Countrywide Asset-Backed Certificates | | | | |
Series 2004-13 Class AF3 | | | | |
3.989% due 02/25/31 | | 7 | | 7 |
Series 2004-AB2 Class M3 (Ê) | | | | |
5.465% due 05/25/36 | | 95 | | 83 |
Series 2004-BC1 Class M1 (Ê) | | | | |
5.365% due 02/25/34 | | 95 | | 88 |
Series 2006-11 Class 1AF4 | | | | |
6.300% due 09/25/46 | | 170 | | 158 |
Countrywide Home Equity Loan Trust (Ê)
Series 2006-HW Class 2A1B
5.178% due 11/15/36 | | 698 | | 652 |
| | | | |
| | | Principal
Amount ($)
or Shares | | Market
Value
$ |
First Franklin Mortgage Loan Asset Backed Certificates (Ê)
Series 2006-FF1 Class A3
4.915% due 11/25/36 | | 213 | | 207 |
GMAC Mortgage Corp. Loan Trust
Series 2007-HE3 Class 2A1
7.000% due 09/25/37 | | 97 | | 98 |
GSAA Trust | | | | |
Series 2006-2 Class 2A3 (Ê) | | | | |
5.135% due 12/25/35 | | 320 | | 314 |
Series 2006-4 Class 1A2 | | | | |
5.951% due 03/25/36 | | 234 | | 232 |
GSAMP Trust (Ê) | | | | |
Series 2003-HE2 Class M1 | | | | |
5.515% due 08/25/33 | | 131 | | 117 |
Series 2004-SEA Class A2A | | | | |
5.155% due 03/25/34 | | 59 | | 59 |
HFC Home Equity Loan Asset Backed Certificates (Ê) | | | | |
Series 2005-1 Class A | | | | |
5.239% due 01/20/34 | | 224 | | 219 |
Series 2007-3 Class APT | | | | |
6.149% due 11/20/36 | | 434 | | 424 |
Home Equity Asset Trust (Ê)
Series 2005-2 Class 2A2
5.065% due 07/25/35 | | 4 | | 4 |
HSI Asset Securitization Corp. Trust (Ê)
Series 2006-HE2 Class 2A1
4.833% due 12/25/36 | | 73 | | 70 |
Indymac Residential Asset Backed Trust (Ê)
Series 2006-H2 Class A
4.950% due 06/28/36 | | 427 | | 387 |
Lehman XS Trust (Ê) | | | | |
Series 2005-1 Class 2A2 | | | | |
4.660% due 07/25/35 | | 117 | | 117 |
Series 2006-16N Class A1A | | | | |
4.945% due 11/25/46 | | 173 | | 166 |
Series 2007-4N Class 3A2A | | | | |
5.683% due 04/25/37 | | 900 | | 846 |
Long Beach Mortgage Loan Trust (Ê) | | | | |
Series 2004-4 Class 1A1 | | | | |
5.145% due 10/25/34 | | 5 | | 4 |
Series 2006-9 Class 2A1 | | | | |
4.925% due 10/25/36 | | 606 | | 591 |
Mastr Asset Backed Securities Trust (Ê)
Series 2003-WMC Class M2
7.340% due 08/25/33 | | 57 | | 48 |
Russell Investment Funds
Core Bond Fund
Schedule of Investments, continued — December 31, 2007
Amounts in thousands (except share amounts)
| | | | |
| | | Principal
Amount ($)
or Shares | | Market
Value
$ |
| | | | |
Morgan Stanley ABS Capital I (Ê) | | | | |
Series 2003-NC8 Class M3 | | | | |
6.965% due 09/25/33 | | 38 | | 32 |
Series 2006-HE7 Class A2A | | | | |
4.915% due 09/25/36 | | 552 | | 538 |
New Century Home Equity Loan Trust (Ê) Series 2004-4 Class M2
5.395% due 02/25/35 | | 215 | | 202 |
Option One Mortgage Loan Trust (Ê) | | | | |
Series 2003-2 Class M2 | | | | |
6.565% due 04/25/33 | | 48 | | 41 |
Series 2003-3 Class M3 | | | | |
6.865% due 06/25/33 | | 38 | | 29 |
Series 2003-4 Class M2 | | | | |
6.515% due 07/25/33 | | 31 | | 28 |
Park Place Securities, Inc. (Ê)
Series 2005-WCW Class M1
5.315% due 09/25/35 | | 210 | | 176 |
Popular ABS Mortgage Pass-Through Trust Series 2005-6 Class A3
5.680% due 01/25/36 | | 230 | | 228 |
Renaissance Home Equity Loan Trust | | | | |
Series 2005-1 Class M1 | | | | |
5.357% due 05/25/35 | | 80 | | 70 |
Series 2005-2 Class AF4 | | | | |
4.934% due 08/25/35 | | 85 | | 78 |
Series 2006-1 Class AF6 | | | | |
5.746% due 05/25/36 | | 175 | | 162 |
Residential Asset Mortgage Products, Inc. | | | | |
Series 2003-RS1 Class AI6A | | | | |
5.980% due 12/25/33 | | 197 | | 196 |
Series 2006-RZ4 Class A1A (Ê) | | | | |
4.945% due 10/25/36 | | 711 | | 692 |
Residential Asset Securities Corp. | | | | |
Series 2003-KS2 Class MI1 | | | | |
4.800% due 04/25/33 | | 450 | | 426 |
Series 2003-KS2 Class MI3 | | | | |
6.100% due 04/25/33 | | 83 | | 61 |
Series 2006-KS9 Class AI1 (Ê) | | | | |
4.935% due 11/25/36 | | 168 | | 164 |
Series 2007-KS2 Class AI1 (Ê) | | | | |
4.935% due 02/25/37 | | 390 | | 382 |
SBI Heloc Trust (Ê)(þ)
Series 2006-1A Class 1A2A
5.035% due 08/25/36 | | 113 | | 108 |
SLM Student Loan Trust (Ê)
Series 2007-3 Class A1
5.074% due 10/27/14 | | 683 | | 682 |
| | | | |
| | | Principal
Amount ($)
or Shares | | Market
Value
$ |
Small Business Administration
Series 2000-P10 Class 1
7.449% due 08/10/10 | | 6 | | 6 |
Soundview Home Equity Loan Trust | | | | |
Series 2006-2 Class A2 (Ê) | | | | |
4.995% due 03/25/36 | | 155 | | 154 |
Series 2006-WF1 Class A2 | | | | |
5.645% due 10/25/36 | | 290 | | 287 |
Structured Asset Investment Loan Trust (Ê)
Series 2005-3 Class M2
5.305% due 04/25/35 | | 120 | | 100 |
Structured Asset Securities Corp. | | | | |
Series 2004-19X Class A2 | | | | |
4.370% due 10/25/34 | | 120 | | 119 |
Series 2006-BC3 Class A2 (Ê) | | | | |
4.915% due 10/25/36 | | 182 | | 179 |
VTB 24 Capital PLC (Ê)
5.971% due 12/07/09 | | 100 | | 97 |
| | | | |
| | | | 12,408 |
| | | | |
| | |
Certificates of Deposit - 0.2% | | | | |
Calyon NY
5.204% due 01/16/09 | | 300 | | 300 |
Nordea Bank Finland PLC
5.443% due 04/09/09 | | 400 | | 400 |
| | | | |
| | | | 700 |
| | | | |
| |
Corporate Bonds and Notes - 19.0% | | |
Abbott Laboratories | | | | |
5.600% due 05/15/11 | | 260 | | 269 |
5.875% due 05/15/16 | | 80 | | 84 |
Ace Capital Trust II
9.700% due 04/01/30 | | 175 | | 222 |
Alamosa Delaware, Inc.
8.500% due 01/31/12 | | 100 | | 102 |
Alion Science and Technology Corp.
10.250% due 02/01/15 | | 200 | | 171 |
Allied Waste NA, Inc. (Ñ)
Series B
7.125% due 05/15/16 | | 90 | | 89 |
Altria Group, Inc.
7.750% due 01/15/27 | | 25 | | 32 |
American Casino & Entertainment Properties LLC
7.850% due 02/01/12 | | 115 | | 119 |
American Electric Power Co., Inc.
Series C
5.375% due 03/15/10 | | 35 | | 36 |
Russell Investment Funds
Core Bond Fund
Schedule of Investments, continued — December 31, 2007
Amounts in thousands (except share amounts)
| | | | |
| | | Principal
Amount ($)
or Shares | | Market
Value
$ |
| | | | |
American Express Bank FSB
Series BKNT
6.000% due 09/13/17 | | 400 | | 402 |
American Express Centurion Bank
Series BKNT
5.550% due 10/17/12 | | 250 | | 254 |
Series BKN1 | | | | |
6.000% due 09/13/17 | | 400 | | 402 |
American General Finance Corp. | | | | |
4.875% due 05/15/10 | | 225 | | 226 |
6.900% due 12/15/17 | | 400 | | 400 |
American International Group, Inc. | | | | |
4.700% due 10/01/10 | | 130 | | 130 |
5.375% due 10/18/11 | | 195 | | 198 |
5.050% due 10/01/15 | | 265 | | 256 |
5.850% due 01/16/18 | | 900 | | 906 |
6.250% due 03/15/87 | | 150 | | 134 |
Americo Life, Inc. (Å)
7.875% due 05/01/13 | | 75 | | 77 |
Amkor Technology, Inc.
7.750% due 05/15/13 | | 175 | | 165 |
Anadarko Petroleum Corp.
5.950% due 09/15/16 | | 100 | | 102 |
ANZ Capital Trust (ƒ)(Þ)
4.484% due 12/31/49 | | 225 | | 221 |
Appalachian Power Co. | | 65 | | 66 |
Series O
5.650% due 08/15/12 | | | | |
Arizona Public Service Co. | | | | |
5.800% due 06/30/14 | | 100 | | 100 |
6.250% due 08/01/16 | | 150 | | 153 |
AT&T Mobility LLC
6.500% due 12/15/11 | | 120 | | 126 |
AT&T, Inc. | | | | |
5.100% due 09/15/14 | | 45 | | 45 |
6.500% due 09/01/37 | | 125 | | 131 |
6.300% due 01/15/38 | | 875 | | 889 |
Atmos Energy Corp.
6.350% due 06/15/17 | | 65 | | 66 |
BAE Systems Holdings, Inc. (Þ)
6.400% due 12/15/11 | | 395 | | 416 |
Bank of America Corp. | | | | |
5.875% due 02/15/09 | | 80 | | 81 |
4.875% due 11/06/09 (Ê) | | 100 | | 100 |
5.625% due 10/14/16 | | 115 | | 116 |
6.000% due 09/01/17 | | 335 | | 342 |
5.750% due 12/01/17 | | 150 | | 150 |
| | | | |
| | | Principal
Amount ($)
or Shares | | Market
Value
$ |
Bank of America NA
Series BKNT (Ê) | | | | |
5.133% due 06/12/09 | | 700 | | 698 |
5.271% due 06/15/16 | | 200 | | 195 |
Bank of New York Mellon Corp. (The)
5.125% due 11/01/11 | | 215 | | 218 |
Bausch & Lomb, Inc. (Þ)
9.875% due 11/01/15 | | 125 | | 127 |
Bear Stearns Cos., Inc. (The) | | | | |
5.494% due 07/16/09 (Ê) | | 1,200 | | 1,154 |
6.950% due 08/10/12 | | 600 | | 617 |
BellSouth Corp. | | | | |
4.240% due 04/26/21 (Þ) | | 300 | | 299 |
6.550% due 06/15/34 | | 35 | | 36 |
Bellsouth Telecommunications, Inc.
7.000% due 12/01/95 | | 245 | | 255 |
BNP Paribas Capital Trust (ƒ)(Å)
9.003% due 12/29/49 | | 450 | | 482 |
Boardwalk Pipelines, LP
5.875% due 11/15/16 | | 225 | | 230 |
Boeing Capital Corp., Ltd. (Ñ)
6.100% due 03/01/11 | | 50 | | 52 |
Burlington Northern Santa Fe Corp. | | | | |
5.650% due 05/01/17 | | 105 | | 104 |
6.875% due 12/01/27 | | 25 | | 26 |
6.750% due 03/15/29 | | 10 | | 10 |
California Steel Industries, Inc.
6.125% due 03/15/14 | | 385 | | 339 |
Caterpillar Financial Services Corp. | | | | |
4.965% due 05/18/09 (Ê) | | 1,100 | | 1,097 |
4.300% due 06/01/10 | | 170 | | 169 |
4.850% due 12/07/12 (Ñ) | | 145 | | 145 |
5.850% due 09/01/17 | | 95 | | 98 |
Catlin Insurance Co., Ltd. (ƒ)(Å)
7.249% due 12/31/49 | | 100 | | 91 |
CenterPoint Energy Houston
Electric LLC | | | | |
Series J2
5.700% due 03/15/13 | | 110 | | 111 |
CenterPoint Energy Resources Corp. | | | | |
6.125% due 11/01/17 | | 50 | | 51 |
Series B | | | | |
7.875% due 04/01/13 | | 165 | | 181 |
Chubb Corp. | | | | |
6.375% due 03/29/37 (Ñ) | | 175 | | 171 |
6.000% due 05/11/37 | | 95 | | 90 |
CIT Group, Inc.
6.875% due 11/01/09 | | 45 | | 45 |
Russell Investment Funds
Core Bond Fund
Schedule of Investments, continued — December 31, 2007
Amounts in thousands (except share amounts)
| | | | |
| | | Principal
Amount ($)
or Shares | | Market
Value
$ |
| | | | |
Citigroup Capital XXI
8.300% due 12/21/77 | | 100 | | 106 |
Citigroup Funding, Inc. (Ê) | | | | |
4.896% due 04/23/09 | | 100 | | 99 |
4.858% due 06/26/09 | | 200 | | 197 |
Citigroup Global Markets
Holdings, Inc. (Ê)
Series MTNA
5.091% due 03/17/09 | | 200 | | 198 |
Citigroup, Inc. | | | | |
5.024% due 01/30/09 (Ê) | | 100 | | 99 |
5.228% due 12/28/09 (Ê) | | 400 | | 393 |
6.500% due 01/18/11 | | 245 | | 256 |
5.500% due 08/27/12 (Ñ) | | 200 | | 204 |
5.850% due 07/02/13 | | 425 | | 438 |
4.700% due 05/29/15 (Ñ) | | 50 | | 47 |
5.850% due 08/02/16 (Ñ) | | 55 | | 56 |
6.000% due 08/15/17 (Ñ) | | 400 | | 408 |
6.125% due 08/25/36 | | 300 | | 284 |
Citizens Communications Co.(Ñ)
9.250% due 05/15/11 | | 125 | | 135 |
Clorox Co.
4.200% due 01/15/10 | | 100 | | 99 |
CNA Financial Corp.
6.500% due 08/15/16 | | 125 | | 128 |
Columbus Southern Power Co.
Series C
5.500% due 03/01/13 | | 10 | | 10 |
Comcast Cable Communications Holdings, Inc. | | |
9.455% due 11/15/22 | | 125 | | 159 |
Comcast Cable Holdings LLC | | | | |
9.800% due 02/01/12 | | 180 | | 208 |
7.875% due 08/01/13 | | 335 | | 367 |
Comcast Corp. | | | | |
5.900% due 03/15/16 | | 115 | | 116 |
6.500% due 01/15/17 | | 65 | | 68 |
6.450% due 03/15/37 | | 80 | | 81 |
Commonwealth Edison Co. | | | | |
6.950% due 07/15/18 | | 50 | | 51 |
5.900% due 03/15/36 | | 75 | | 70 |
Series 105 | | | | |
5.400% due 12/15/11 | | 125 | | 126 |
Series 98 | | | | |
6.150% due 03/15/12 | | 80 | | 83 |
Community Health Systems, Inc.
8.875% due 07/15/15 | | 165 | | 168 |
COX Communications, Inc. | | | | |
4.625% due 01/15/10 (Ñ) | | 350 | | 347 |
5.875% due 12/01/16 (Þ) | | 75 | | 75 |
| | | | |
| | | Principal
Amount ($)
or Shares | | Market
Value
$ |
Credit Suisse USA, Inc. | | | | |
4.875% due 08/15/10 | | 65 | | 66 |
5.250% due 03/02/11 (Ñ) | | 55 | | 56 |
6.500% due 01/15/12 | | 25 | | 26 |
5.500% due 08/15/13 (Ñ) | | 45 | | 46 |
4.875% due 01/15/15 | | 55 | | 54 |
CSC Holdings, Inc. | | | | |
Series B | | | | |
8.125% due 07/15/09 | | 210 | | 213 |
8.125% due 08/15/09 | | 175 | | 178 |
6.750% due 04/15/12 | | 90 | | 86 |
CVS Caremark Corp. | | | | |
5.750% due 08/15/11 | | 215 | | 220 |
5.750% due 06/01/17 | | 180 | | 181 |
Daimler Finance NA LLC | | | | |
5.461% due 03/13/09 (Ê) | | 400 | | 398 |
5.541% due 03/13/09 (Ê)(Ñ) | | 300 | | 298 |
6.500% due 11/15/13 | | 145 | | 152 |
Dayton Power & Light Co. (The)
5.125% due 10/01/13 | | 135 | | 134 |
DCP Midstream LLC (Ñ)
6.875% due 02/01/11 | | 20 | | 21 |
Delta Air Lines, Inc.
Series 00-1
7.570% due 11/18/10 | | 205 | | 207 |
Detroit Edison Co. (The)
6.350% due 10/15/32 | | 50 | | 51 |
Devon Financing Corp. ULC
7.875% due 09/30/31 | | 100 | | 121 |
Dex Media West LLC/Dex Media Finance Co.
Series B
9.875% due 08/15/13 | | 245 | | 255 |
Dominion Resources, Inc. | | | | |
Series A | | | | |
5.200% due 01/15/16 | | 240 | | 233 |
Series B | | | | |
6.250% due 06/30/12 (Ñ) | | 66 | | 69 |
DPL, Inc.
6.875% due 09/01/11 | | 193 | | 205 |
Drummond Co., Inc. (Þ)
7.375% due 02/15/16 | | 160 | | 148 |
Echostar DBS Corp.
7.125% due 02/01/16 | | 125 | | 128 |
El Paso Corp.
8.050% due 10/15/30 | | 200 | | 208 |
El Paso Natural Gas Co.
7.500% due 11/15/26 | | 100 | | 105 |
Russell Investment Funds
Core Bond Fund
Schedule of Investments, continued — December 31, 2007
Amounts in thousands (except share amounts)
| | | | |
| | | Principal
Amount ($)
or Shares | | Market
Value
$ |
| | | | |
Eli Lilly & Co. (Ñ)
5.200% due 03/15/17 | | 305 | | 305 |
Energy Transfer Partners, LP
5.950% due 02/01/15 | | 325 | | 319 |
Enterprise Products Operating, LP | | | | |
4.950% due 06/01/10 | | 125 | | 125 |
8.375% due 08/01/66 | | 100 | | 102 |
Exelon Generation Co. LLC
6.200% due 10/01/17 | | 40 | | 40 |
FedEx Corp.
7.600% due 07/01/97 | | 75 | | 89 |
.Financing Corp. | | | | |
Principal Only STRIP | | | | |
Series 2P | | | | |
Zero coupon due 11/30/17 | | 60 | | 38 |
Series 6P | | | | |
Zero coupon due 08/03/18 | | 300 | | 184 |
Series 10P | | | | |
Zero coupon due 11/30/17 | | 510 | | 325 |
Series 15P | | | | |
Zero coupon due 03/07/19 | | 70 | | 42 |
FirstEnergy Corp. | | | | |
Series B | | | | |
6.450% due 11/15/11 | | 280 | | 289 |
Series C | | | | |
7.375% due 11/15/31 | | 125 | | 137 |
Fiserv, Inc.
6.125% due 11/20/12 | | 335 | | 341 |
Ford Motor Credit Co. LLC
7.875% due 06/15/10 | | 200 | | 185 |
Freeport-McMoRan Copper & Gold, Inc. 8.375% due 04/01/17 | | 415 | | 445 |
General Electric Capital Corp. | | | | |
5.250% due 01/20/10 (Ê) | | 200 | | 198 |
5.250% due 10/19/12 | | 175 | | 179 |
6.375% due 11/15/67 | | 1,900 | | 1,962 |
Series GMTN | | | | |
5.500% due 04/28/11 | | 220 | | 226 |
Series MTN (Ê) | | | | |
5.095% due 10/26/09 | | 500 | | 499 |
Series MTNA | | | | |
5.450% due 01/15/13 | | 405 | | 417 |
General Electric Co.
5.250% due 12/06/17 | | 65 | | 65 |
Goldman Sachs Group, Inc. (The) | | | | |
5.248% due 03/30/09 (Ê) | | 400 | | 398 |
6.875% due 01/15/11 | | 565 | | 599 |
5.350% due 01/15/16 (Ñ) | | 410 | | 406 |
5.625% due 01/15/17 (Ñ) | | 80 | | 78 |
6.250% due 09/01/17 (Ñ) | | 600 | | 624 |
6.750% due 10/01/37 | | 935 | | 916 |
| | | | |
| | | Principal
Amount ($)
or Shares | | Market
Value
$ |
GrafTech Finance, Inc.
10.250% due 02/15/12 | | 125 | | 129 |
Harrah’s Operating Co., Inc.
5.500% due 07/01/10 | | 125 | | 116 |
Hawaiian Telcom Communications, Inc. (Ê)
Series B
10.318% due 05/01/13 | | 240 | | 242 |
HCA, Inc. | | | | |
9.125% due 11/15/14 | | 125 | | 130 |
9.250% due 11/15/16 | | 120 | | 126 |
HCP, Inc.
5.950% due 09/15/11 | | 300 | | 301 |
Historic TW, Inc. | | | | |
8.050% due 01/15/16 | | 195 | | 217 |
6.625% due 05/15/29 | | 10 | | 10 |
Home Depot, Inc.
5.400% due 03/01/16 | | 35 | | 33 |
HSBC Finance Corp. | | | | |
5.240% due 10/21/09 (Ê) | | 100 | | 100 |
5.213% due 03/12/10 (Ê) | | 300 | | 294 |
5.137% due 05/10/10 (Ê) | | 100 | | 97 |
6.375% due 11/27/12 | | 185 | | 190 |
5.000% due 06/30/15 | | 110 | | 105 |
Idearc, Inc.
8.000% due 11/15/16 | | 125 | | 115 |
Inmarsat Finance PLC (Ñ)
10.375% due 11/15/12 | | 125 | | 121 |
International Business Machines Corp.
7.125% due 12/01/96 | | 230 | | 250 |
International Lease Finance Corp. | | | | |
5.750% due 06/15/11 | | 80 | | 81 |
5.625% due 09/20/13 (Ñ) | | 80 | | 80 |
International Paper Co.
5.850% due 10/30/12 | | 510 | | 519 |
International Steel Group, Inc. (Ñ)
6.500% due 04/15/14 | | 210 | | 216 |
iPCS, Inc. (Ê)
7.036% due 05/01/13 | | 35 | | 33 |
iStar Financial, Inc.
Series B
5.125% due 04/01/11 | | 200 | | 178 |
Jersey Central Power & Light Co.
5.625% due 05/01/16 | | 90 | | 88 |
Johnson & Johnson | | | | |
5.550% due 08/15/17 | | 75 | | 79 |
5.950% due 08/15/37 | | 40 | | 43 |
JP Morgan Chase Bank
Series EMTN
6.000% due 05/22/45 | | 860 | | 758 |
Russell Investment Funds
Core Bond Fund
Schedule of Investments, continued — December 31, 2007
Amounts in thousands (except share amounts)
| | | | |
| | | Principal
Amount ($)
or Shares | | Market
Value
$ |
| | | | |
JPMorgan Chase & Co. | | | | |
5.600% due 06/01/11 | | 115 | | 119 |
5.375% due 01/15/14 | | 170 | | 169 |
6.000% due 01/15/18 | | 265 | | 270 |
JPMorgan Chase Bank NA | | | | |
Series BKNT | | | | |
5.875% due 06/13/16 | | 70 | | 71 |
6.000% due 10/01/17 | | 400 | | 407 |
Kellogg Co.
Series B
6.600% due 04/01/11 | | 445 | | 472 |
Kerr-McGee Corp.
6.950% due 07/01/24 | | 125 | | 134 |
Kraft Foods, Inc. | | | | |
5.625% due 11/01/11 | | 575 | | 588 |
6.500% due 08/11/17 | | 100 | | 103 |
6.125% due 02/01/18 | | 200 | | 202 |
Kroger Co. (The) | | | | |
8.000% due 09/15/29 | | 15 | | 17 |
7.500% due 04/01/31 | | 25 | | 28 |
L-3 Communications Corp.
Series B
6.375% due 10/15/15 | | 125 | | 123 |
Lehman Brothers Holdings, Inc. | | | | |
5.241% due 01/23/09 (Ê)(Ñ) | | 600 | | 588 |
5.320% due 04/03/09 (Ê) | | 400 | | 391 |
5.170% due 05/25/10 (Ê) | | 200 | | 192 |
5.250% due 02/06/12 | | 85 | | 84 |
5.375% due 10/17/12 | | 250 | | 348 |
6.200% due 09/26/14 (Ñ) | | 375 | | 382 |
5.500% due 04/04/16 | | 100 | | 96 |
Level 3 Communications, Inc.
6.000% due 09/15/09 | | 60 | | 56 |
Level 3 Financing, Inc.
12.250% due 03/15/13 | | 150 | | 152 |
M&T Bank Corp.
5.375% due 05/24/12 | | 215 | | 214 |
Mandalay Resort Group
6.500% due 07/31/09 | | 90 | | 90 |
Manufacturers & Traders Trust Co.
5.585% due 12/28/20 | | 84 | | 78 |
Mashantucket Western Pequot Tribe (Þ)
8.500% due 11/15/15 | | 235 | | 237 |
McLeodUSA, Inc. (Þ)
10.500% due 10/01/11 | | 225 | | 251 |
MedQuest, Inc. (Ñ)
Series B
11.875% due 08/15/12 | | 225 | | 235 |
| | | | |
| | | Principal
Amount ($)
or Shares | | Market
Value
$ |
Merrill Lynch & Co., Inc. | | | | |
5.211% due 12/04/09 (Ê) | | 200 | | 194 |
6.050% due 08/15/12 | | 290 | | 296 |
6.050% due 05/16/16 | | 85 | | 84 |
5.700% due 05/02/17 (Ñ) | | 65 | | 62 |
6.400% due 08/28/17 (Ñ) | | 435 | | 442 |
Series MTN (Ê) | | | | |
4.948% due 05/08/09 | | 900 | | 876 |
Series MTNC | | | | |
4.250% due 02/08/10 | | 25 | | 25 |
MetLife, Inc.
6.400% due 12/15/36 | | 100 | | 92 |
Metropolitan Life Global
Funding I (Ê)(Þ)
4.945% due 05/17/10 | | 400 | | 397 |
MGM Mirage
6.750% due 09/01/12 | | 300 | | 292 |
Midamerican Energy Holdings Co.
6.125% due 04/01/36 | | 150 | | 150 |
Miller Brewing Co. (Þ)
5.500% due 08/15/13 | | 110 | | 111 |
Mohegan Tribal Gaming Authority
8.000% due 04/01/12 | | 125 | | 127 |
Morgan Stanley | | | | |
4.925% due 05/07/09 (Ê) | | 300 | | 296 |
5.375% due 10/15/15 | | 125 | | 122 |
5.550% due 04/27/17 | | 70 | | 68 |
6.250% due 08/28/17 (Ñ) | | 100 | | 102 |
5.950% due 12/28/17 (Ñ) | | 225 | | 225 |
Series GMTN | | | | |
5.006% due 02/09/09 (Ê) | | 500 | | 494 |
5.750% due 08/31/12 | | 125 | | 128 |
Series MTN (Ê) | | | | |
5.333% due 01/15/10 | | 300 | | 297 |
Natexis Ambs Co. LLC (ƒ)(Þ)
8.440% due 12/29/49 | | 120 | | 122 |
National Rural Utilities Cooperative Finance Corp. | | | | |
5.750% due 08/28/09 | | 45 | | 46 |
5.450% due 04/10/17 | | 215 | | 214 |
Neff Corp. (Ñ)
10.000% due 06/01/15 | | 80 | | 44 |
Nelnet, Inc.
7.400% due 09/29/36 | | 125 | | 120 |
Nevada Power Co.
Series L
5.875% due 01/15/15 | | 100 | | 99 |
New Cingular Wireless Services, Inc. | | | | |
7.875% due 03/01/11 | | 150 | | 162 |
8.125% due 05/01/12 | | 155 | | 172 |
8.750% due 03/01/31 | | 85 | | 110 |
Russell Investment Funds
Core Bond Fund
Schedule of Investments, continued — December 31, 2007
Amounts in thousands (except share amounts)
| | | | |
| | | Principal
Amount ($)
or Shares | | Market
Value
$ |
| | | | |
News America Holdings, Inc. | | | | |
7.750% due 12/01/45 | | 65 | | 70 |
7.900% due 12/01/95 | | 90 | | 100 |
8.250% due 10/17/96 | | 20 | | 23 |
News America, Inc. (Å)
6.650% due 11/15/37 | | 225 | | 232 |
NGPL PipeCo LLC (Þ)
6.514% due 12/15/12 | | 200 | | 203 |
Nisource Finance Corp. | | | | |
7.875% due 11/15/10 | | 125 | | 133 |
6.400% due 03/15/18 | | 145 | | 145 |
Noranda Aluminium Acquisition
Corp. (Ê)(Þ)
8.738% due 05/15/15 | | 130 | | 109 |
Norfolk Southern Corp. | | | | |
7.700% due 05/15/17 | | 20 | | 23 |
7.050% due 05/01/37 | | 90 | | 98 |
7.900% due 05/15/97 | | 470 | | 544 |
Nuveen Investments, Inc. (Þ)
10.500% due 11/15/15 | | 235 | | 234 |
Ohio Power Co.
Series F
5.500% due 02/15/13 | | 20 | | 20 |
ONEOK Partners, LP | | | | |
6.650% due 10/01/36 | | 100 | | 101 |
6.850% due 10/15/37 | | 100 | | 104 |
Pacific Gas & Electric Co. | | | | |
4.200% due 03/01/11 | | 60 | | 59 |
6.050% due 03/01/34 | | 95 | | 95 |
PAETEC Holding Corp. (Þ)
9.500% due 07/15/15 | | 305 | | 297 |
PartnerRe Finance II
6.440% due 12/01/66 | | 50 | | 44 |
Phoenix Life Insurance Co. (Þ)
7.150% due 12/15/34 | | 150 | | 164 |
Pride International, Inc.
7.375% due 07/15/14 | | 185 | | 190 |
Progress Energy, Inc. | | | | |
7.100% due 03/01/11 | | 77 | | 82 |
5.625% due 01/15/16 | | 40 | | 40 |
7.000% due 10/30/31 | | 90 | | 98 |
Prudential Financial, Inc.
6.000% due 12/01/17 | | 110 | | 110 |
Qwest Corp.
7.625% due 06/15/15 | | 100 | | 102 |
RBS Capital Trust III (ƒ)
5.512% due 09/29/49 | | 200 | | 184 |
Reckson Operating Partnership, LP | | | | |
7.750% due 03/15/09 | | 25 | | 26 |
5.150% due 01/15/11 | | 92 | | 93 |
| | | | |
| | | Principal
Amount ($)
or Shares | | Market
Value
$ |
Reinsurance Group of America, Inc. (Ñ)
6.750% due 12/15/65 | | 75 | | 67 |
Residential Capital LLC
7.875% due 06/30/10 | | 200 | | 128 |
Rohm & Haas Co. (Ñ)
6.000% due 09/15/17 | | 100 | | 102 |
Ryerson, Inc. (Þ)
12.000% due 11/01/15 | | 225 | | 222 |
Safeway, Inc.
7.250% due 02/01/31 | | 20 | | 22 |
SB Treasury Co. LLC (ƒ)(Å)
12/29/2049
9.400% due 12/29/49 | | 350 | | 357 |
Schering-Plough Corp.
5.550% due 12/01/13 | | 200 | | 202 |
Simon Property Group, LP
5.600% due 09/01/11 | | 200 | | 201 |
Southern Natural Gas Co.
7.350% due 02/15/31 | | 75 | | 78 |
Spansion, Inc. (Ñ)(Þ)
11.250% due 01/15/16 | | 45 | | 38 |
Sprint Capital Corp. | | | | |
7.625% due 01/30/11 | | 350 | | 365 |
8.750% due 03/15/32 | | 70 | | 79 |
Sprint Nextel Corp.
6.000% due 12/01/16 | | 350 | | 335 |
SPX Corp. (Þ)
7.625% due 12/15/14 | | 75 | | 77 |
Swiss Re Capital I, LP (ƒ)(Þ)
6.854% due 05/29/49 | | 225 | | 221 |
Symetra Financial Corp. (Å)
6.125% due 04/01/16 | | 150 | | 149 |
Temple-Inland, Inc.
7.875% due 05/01/12 | | 202 | | 223 |
Tennessee Gas Pipeline Co. (Ñ)
7.000% due 10/15/28 | | 50 | | 50 |
Time Warner Cable, Inc. | | | | |
5.400% due 07/02/12 | | 600 | | 601 |
5.850% due 05/01/17 | | 155 | | 155 |
6.550% due 05/01/37 (Ñ) | | 175 | | 179 |
Time Warner, Inc. (Ñ)
5.875% due 11/15/16 | | 400 | | 398 |
Travelers Cos., Inc. (The) | | | | |
5.375% due 06/15/12 | | 40 | | 41 |
6.250% due 06/15/37 | | 100 | | 97 |
Travelport LLC (Ñ)
11.875% due 09/01/16 | | 130 | | 139 |
UBS AG
Series MTN
Zero coupon due 12/31/17 | | 270 | | 157 |
Russell Investment Funds
Core Bond Fund
Schedule of Investments, continued — December 31, 2007
Amounts in thousands (except share amounts)
| | | | |
| | | Principal
Amount ($)
or Shares | | Market
Value
$ |
| | | | |
Unilever Capital Corp. (Ñ)
5.900% due 11/15/32 | | 130 | | 129 |
Union Electric Co.
6.400% due 06/15/17 | | 205 | | 215 |
Union Pacific Corp.
6.125% due 01/15/12 | | 120 | | 125 |
Union Planters Corp.
7.750% due 03/01/11 | | 50 | | 53 |
United States Steel Corp. | | | | |
5.650% due 06/01/13 | | 135 | | 131 |
6.050% due 06/01/17 | | 95 | | 89 |
6.650% due 06/01/37 | | 40 | | 36 |
United Technologies Corp.
5.375% due 12/15/17 | | 145 | | 146 |
UnitedHealth Group, Inc. | | | | |
5.250% due 03/15/11 | | 95 | | 96 |
6.000% due 06/15/17 (Þ) | | 35 | | 35 |
6.500% due 06/15/37 (Þ) | | 45 | | 45 |
Verizon Communications, Inc. (Ê)
5.280% due 04/03/09 | | 500 | | 495 |
Verizon Global Funding Corp. (Ñ)
6.875% due 06/15/12 | | 1,465 | | 1,585 |
Wachovia Capital Trust III (ƒ)
5.800% due 03/15/42 | | 125 | | 112 |
Wachovia Corp. | | | | |
5.625% due 10/15/16 | | 100 | | 99 |
5.750% due 06/15/17 (Ñ) | | 155 | | 154 |
Wachovia Mortgage FSB (Ê)
Series BKNT
4.938% due 05/08/09 | | 1,000 | | 1,001 |
Wells Fargo & Co. | | | | |
5.250% due 10/23/12 | | 135 | | 136 |
4.950% due 10/16/13 | | 65 | | 65 |
5.625% due 12/11/17 | | 1,005 | | 1,006 |
Wells Fargo Bank NA
5.750% due 05/16/16 | | 140 | | 142 |
Weyerhaeuser Co.
6.750% due 03/15/12 | | 400 | | 420 |
Windstream Corp.
8.625% due 08/01/16 | | 125 | | 131 |
Wyeth | | | | |
6.950% due 03/15/11 | | 285 | | 304 |
5.500% due 03/15/13 | | 140 | | 144 |
5.950% due 04/01/37 | | 140 | | 140 |
Xerox Corp.
5.500% due 05/15/12 | | 185 | | 188 |
| | | | |
| | | | 65,682 |
| | | | |
| | | | |
| | | Principal
Amount ($)
or Shares | | Market
Value
$ |
| | |
International Debt - 6.4% | | | | |
Abbey National PLC (ƒ)
6.700% due 06/29/49 | | 150 | | 147 |
Altos Hornos de Mexico SA de CV (Ø) | | | | |
Series A
11.375% due 04/30/49 | | 220 | | 158 |
America Movil SAB de CV
5.500% due 03/01/14 | | 100 | | 99 |
Argentina Bonos
Series VII
7.000% due 09/12/13 | | 650 | | 572 |
Aspen Insurance Holdings, Ltd.
6.000% due 08/15/14 | | 50 | | 51 |
AstraZeneca PLC (Ñ)
5.900% due 09/15/17 | | 100 | | 105 |
AXA SA | | | | |
8.600% due 12/15/30 | | 35 | | 43 |
6.463% due 12/31/49 (ƒ)(Ñ)(Þ) | | 100 | | 90 |
Bank of Scotland PLC (Ê)(Þ)
Series MTN
5.254% due 07/17/09 | | 300 | | 300 |
Barclays Bank PLC | | | | |
5.450% due 09/12/12 | | 1,300 | | 1,331 |
6.050% due 12/04/17 (Þ) | | 200 | | 199 |
BNP Paribas (ƒ)(Þ)
5.186% due 06/29/49 | | 300 | | 273 |
British Telecommunications PLC | | | | |
8.625% due 12/15/10 | | 300 | | 329 |
9.125% due 12/15/30 | | 5 | | 7 |
Canadian Natural Resources, Ltd. | | | | |
6.000% due 08/15/16 | | 40 | | 41 |
5.700% due 05/15/17 (Ñ) | | 75 | | 75 |
6.500% due 02/15/37 | | 170 | | 170 |
CIT Group Funding Co. of Canada
5.600% due 11/02/11 | | 80 | | 76 |
Citigroup Global Markets | | | | |
Deutschland AG for OAO Gazprom
10.500% due 10/21/09 | | 200 | | 216 |
Conoco Funding Co.
6.350% due 10/15/11 | | 340 | | 361 |
Deutsche Bank AG (Ñ)
6.000% due 09/01/17 | | 600 | | 622 |
Deutsche Telekom International Finance BV | | | | |
5.064% due 03/23/09 (Ê) | | 300 | | 299 |
8.000% due 06/15/10 | | 60 | | 64 |
5.375% due 03/23/11 | | 75 | | 76 |
8.250% due 06/15/30 (Ñ) | | 180 | | 225 |
Russell Investment Funds
Core Bond Fund
Schedule of Investments, continued — December 31, 2007
Amounts in thousands (except share amounts)
| | | | |
| | | Principal
Amount ($)
or Shares | | Market
Value
$ |
| | | | |
DNB Nor Bank ASA (Ê)(Þ)
5.313% due 10/13/09 | | 1,000 | | 1,000 |
Egypt Government AID Bonds
4.450% due 09/15/15 | | 295 | | 293 |
EnCana Corp. (Ñ)
6.500% due 02/01/38 | | 225 | | 233 |
Endurance Specialty Holdings, Ltd.
6.150% due 10/15/15 | | 100 | | 98 |
Enel Finance International SA (Þ)
6.250% due 09/15/17 | | 600 | | 607 |
Export-Import Bank of China (Þ)
4.875% due 07/21/15 | | 110 | | 108 |
Export-Import Bank of Korea | | | | |
5.125% due 02/14/11 | | 100 | | 100 |
5.500% due 10/17/12 | | 100 | | 100 |
Federative Republic of Brazil (Ñ)
6.000% due 01/17/17 | | 590 | | 599 |
10.25% due 01/10/28 | | 1,845 | | 995 |
FMG Finance Pty, Ltd. (Þ)
10.625% due 09/01/16 | | 565 | | 647 |
Gaz Capital for Gazprom (Å)
6.212% due 11/22/16 | | 115 | | 110 |
GTL Trade Finance, Inc. (Þ)
7.250% due 10/20/17 | | 105 | | 107 |
HSBC Holdings PLC (Ñ) | | | | |
6.500% due 05/02/36 | | 175 | | 170 |
6.500% due 09/15/37 | | 100 | | 97 |
Inco, Ltd.
5.700% due 10/15/15 | | 175 | | 175 |
Intelsat Bermuda, Ltd. | | | | |
8.886% due 01/15/15 (Ê) | | 110 | | 110 |
11.250% due 06/15/16 | | 270 | | 279 |
Intelsat Subsidiary Holding Co., Ltd.
8.625% due 01/15/15 | | 205 | | 206 |
Intergen NV (Þ)
9.000% due 06/30/17 | | 185 | | 195 |
Ispat Inland ULC
9.750% due 04/01/14 | | 639 | | 692 |
Korea Development Bank (Ê)(Ñ)
5.370% due 04/03/10 | | 900 | | 897 |
Korea Electric Power Corp. (Þ)
5.125% due 04/23/34 | | 60 | | 61 |
Lukoil International Finance BV (Þ)
6.356% due 06/07/17 | | 340 | | 322 |
Mizuho Financial Group Cayman, Ltd. (Þ)
5.790% due 04/15/14 | | 100 | | 105 |
MUFG Capital Finance 1, Ltd. (ƒ)
6.346% due 07/25/99 | | 200 | | 189 |
Peruvian Government International Bond (Ñ)
8.375% due 05/03/16 | | 160 | | 188 |
| | | | |
| | | Principal
Amount ($)
or Shares | | Market
Value
$ |
Petrobras International Finance Co. (Ñ) 8.375% due 12/10/18 | | 295 | | 351 |
Province of Quebec Canada Series PJ
6.125% due 01/22/11 | | 390 | | 412 |
Ras Laffan Liquefied Natural Gas Co., Ltd. II (Þ)
5.298% due 09/30/20 | | 75 | | 73 |
Ras Laffan Liquefied Natural Gas Co., Ltd. III (Þ)
5.838% due 09/30/27 | | 250 | | 236 |
Resona Bank, Ltd. (ƒ)(Þ)
5.850% due 09/29/49 | | 255 | | 237 |
Resona Preferred Global Securities Cayman, Ltd. (ƒ)(Å)
7.191% due 12/29/49 | | 325 | | 322 |
Rogers Wireless, Inc.
6.375% due 03/01/14 | | 365 | | 376 |
Royal Bank of Scotland Group PLC (ƒ)
6.990% due 10/29/49 (Å) | | 450 | | 449 |
Series 1
9.118% due 03/31/49 | | 700 | | 748 |
Russia Government International
Bond (Þ)
7.500% due 03/31/30 | | 342 | | 389 |
Santander Perpetual SA Unipersonal (ƒ)(Þ) 6.671% due 10/29/49 | | 300 | | 301 |
Sanwa Finance Aruba AEC
8.350% due 07/15/09 | | 135 | | 142 |
SMFG Preferred Capital USD 1,
Ltd. (ƒ)(Å)
6.078% due 01/29/49 | | 100 | | 92 |
Sumitomo Mitsui Banking Corp. (ƒ)(Þ) 5.625% due 07/29/49 | | 400 | | 374 |
Systems 2001 Asset Trust LLC (Þ) 7.156% due 12/15/11 | | 88 | | 92 |
Telecom Italia Capital SA | | | | |
4.875% due 10/01/10 | | 150 | | 149 |
6.200% due 07/18/11 | | 105 | | 108 |
5.250% due 10/01/15 | | 150 | | 146 |
Telefonica Emisiones SAU | | | | |
5.226% due 06/19/09 (Ê) | | 300 | | 298 |
6.221% due 07/03/17 | | 90 | | 94 |
TNK-BP Finance SA (Þ)
7.500% due 03/13/13 | | 110 | | 110 |
Transocean, Inc.
6.800% due 03/15/38 | | 50 | | 51 |
Tyco Electronics Group SA (Þ) 6.000% due 10/01/12 | | 50 | | 51 |
Russell Investment Funds
Core Bond Fund
Schedule of Investments, continued — December 31, 2007
Amounts in thousands (except share amounts)
| | | | |
| | | Principal
Amount ($)
or Shares | | Market
Value
$ |
| | | | |
Tyco International Group SA
6.750% due 02/15/11 | | 210 | | 220 |
UBS AG Series DPNT
5.875% due 12/20/17 | | 200 | | 201 |
UFJ Finance Aruba AEC
6.750% due 07/15/13 | | 35 | | 38 |
Vale Overseas, Ltd. | | | | |
6.250% due 01/11/16 | | 35 | | 35 |
6.250% due 01/23/17 | | 120 | | 120 |
Vedanta Resources PLC (Þ)
6.625% due 02/22/10 | | 245 | | 244 |
Vodafone Group PLC
6.150% due 02/27/37 | | 125 | | 123 |
VTB Capital SA (Þ)
6.609% due 10/31/12 | | 130 | | 129 |
Western Oil Sands, Inc.
8.375% due 05/01/12 | | 255 | | 284 |
Westfield Capital Corp., Ltd. (Þ)
5.125% due 11/15/14 | | 125 | | 117 |
Westfield Group (Þ)
5.400% due 10/01/12 | | 125 | | 125 |
Xstrata Canada Corp. | | | | |
7.250% due 07/15/12 | | 50 | | 54 |
6.000% due 10/15/15 | | 225 | | 228 |
Xstrata Finance Canada, Ltd. (Þ)
5.500% due 11/16/11 | | 45 | | 46 |
| | | | |
| | | | 22,177 |
| | | | |
| | |
Loan Agreements - 0.3% | | | | |
Adam Aircraft
11.860% due 05/01/12 | | 85 | | 68 |
DB UFC Zuffa Bank Loan
6.938% due 06/28/12 | | 239 | | 199 |
Flextronics International, Ltd., Term Loan | | | | |
7.394% due 10/01/14 | | 135 | | 131 |
7.395% due 10/03/14 | | 9 | | 9 |
7.455% due 10/15/14 | | 41 | | 40 |
Starbound Reinsurance, Ltd.
8.090% due 08/20/09 | | 420 | | 420 |
Travelport Holdings, Ltd.
12.198% due 03/01/13 | | 125 | | 118 |
TXU Corp.
8.747% due 10/10/14 | | 225 | | 221 |
| | | | |
| | | | 1,206 |
| | | | |
| |
Mortgage-Backed Securities - 54.5% | | |
ABN Amro Mortgage Corp.
Series 2003-13 Class A3
5.500% due 01/25/34 | | 1,612 | | 1,529 |
| | | | |
| | | Principal
Amount ($)
or Shares | | Market
Value
$ |
Adjustable Rate Mortgage Trust (Ê)
Series 2004-5 Class 2A1
4.990% due 04/25/35 | | 87 | | 87 |
Series 2005-3 Class 8A2
5.105% due 07/25/35 | | 180 | | 176 |
American Home Mortgage Assets (Ê)
Series 2007-1 Class A1
5.563% due 02/25/47 | | 887 | | 828 |
American Home Mortgage Investment Trust (Ê) Series 2004-4 Class 4A
4.390% due 02/25/45 | | 126 | | 121 |
Series 2005-2 Class 5A2
5.015% due 09/25/35 | | 25 | | 25 |
Banc of America Alternative Loan Trust | | | | |
Series 2003-2 Class CB2 (Ê) | | | | |
5.365% due 04/25/33 | | 87 | | 86 |
Series 2003-10 Class 2A2 (Ê) | | | | |
5.315% due 12/25/33 | | 212 | | 208 |
Series 2006-5 Class CB17 | | | | |
6.000% due 06/25/36 | | 220 | | 217 |
Banc of America Commercial Mortgage, Inc. | | | | |
Series 2004-3 Class A3 | | | | |
4.875% due 06/10/39 | | 264 | | 264 |
Series 2004-4 Class A3 | | | | |
4.128% due 07/10/42 | | 710 | | 704 |
Series 2005-2 Class A4 | | | | |
4.783% due 07/10/43 | | 333 | | 328 |
Series 2005-3 Class A2 | | | | |
4.501% due 07/10/43 | | 150 | | 148 |
Series 2005-5 Class A4 | | | | |
5.115% due 10/10/45 | | 500 | | 493 |
Series 2006-1 Class A4 | | | | |
5.372% due 09/10/45 | | 200 | | 201 |
Banc of America Funding Corp. | | | | |
Series 2005-D Class A1 (Ê) | | | | |
4.112% due 05/25/35 | | 142 | | 141 |
Series 2006-3 Class 5A8 | | | | |
5.500% due 03/25/36 | | 475 | | 464 |
Series 2006-A Class 3A2 | | | | |
5.880% due 02/20/36 | | 182 | | 181 |
Series 2006-A Class 4A1 (Ê) | | | | |
5.565% due 02/20/36 | | 473 | | 469 |
Banc of America Mortgage Securities, Inc. | | | | |
Series 2003-9 Class 1A12 (Ê) | | | | |
5.315% due 12/25/33 | | 403 | | 401 |
Series 2004-1 Class 5A1 | | | | |
6.500% due 09/25/33 | | 16 | | 16 |
Russell Investment Funds
Core Bond Fund
Schedule of Investments, continued — December 31, 2007
Amounts in thousands (except share amounts)
| | | | |
| | | Principal
Amount ($)
or Shares | | Market
Value
$ |
| | | | |
Series 2004-2 Class 1A9 (Ê) | | | | |
5.315% due 03/25/34 | | 205 | | 204 |
Series 2004-11 Class 2A1 | | | | |
5.750% due 01/25/35 | | 406 | | 405 |
Series 2005-H Class 2A5 (Ê) | | | | |
4.803% due 09/25/35 | | 220 | | 214 |
Series 2005-L Class 3A1 (Ê) | | | | |
5.464% due 01/25/36 | | 236 | | 233 |
Series 2006-2 Class A15 | | | | |
6.000% due 07/25/36 | | 268 | | 273 |
Series 2007-3 Class 1A1 | | | | |
6.000% due 09/25/37 | | 909 | | 906 |
Bear Stearns Adjustable Rate Mortgage Trust | | | | |
Series 2003-1 Class 6A1 | | | | |
5.037% due 04/25/33 | | 65 | | 65 |
Series 2003-8 Class 4A1 | | | | |
4.609% due 01/25/34 | | 133 | | 131 |
Series 2004-1 Class 21A1 | | | | |
4.457% due 04/25/34 | | 112 | | 111 |
Series 2004-9 Class 22A1 (Ê) | | | | |
4.780% due 11/25/34 | | 98 | | 98 |
Series 2005-2 Class A1 (Ê) | | | | |
4.125% due 03/25/35 | | 1,668 | | 1,652 |
Series 2005-3 Class 2A1 | | | | |
5.072% due 06/25/35 | | 313 | | 310 |
Bear Stearns Alt-A Trust | | | | |
Series 2005-4 Class 23A1 | | | | |
5.368% due 05/25/35 | | 245 | | 242 |
Series 2005-7 Class 22A1 | | | | |
5.527% due 09/25/35 | | 114 | | 112 |
Bear Stearns Alt-A Trust II
Series 2007-1 Class 1A1
6.278% due 09/25/47 | | 958 | | 956 |
Bear Stearns Mortgage Funding Trust (Ê) | | | | |
Series 2006-AR2 Class 1A1 | | | | |
5.065% due 09/25/36 | | 913 | | 856 |
Series 2006-AR2 Class 2A1 | | | | |
5.095% due 10/25/36 | | 884 | | 853 |
Chase Mortgage Finance Corp. | | | | |
Series 2003-S8 Class A1 | | | | |
4.500% due 09/25/18 | | 158 | | 154 |
Series 2006-S4 Class A3 | | | | |
6.000% due 12/25/36 | | 266 | | 270 |
Series 2006-S4 Class A4 | | | | |
6.000% due 12/25/36 | | 145 | | 146 |
Series 2007-A1 Class 1A3 | | | | |
4.355% due 02/25/37 | | 844 | | 837 |
| | | | |
| | | Principal
Amount ($)
or Shares | | Market
Value
$ |
Citigroup Mortgage Loan Trust, Inc. | | | | |
Series 2005-11 Class A2A (Ê) | | | | |
4.700% due 12/25/35 | | 80 | | 78 |
Series 2006-WFH Class A2 (Ê) | | | | |
4.883% due 11/25/36 | | 1,000 | | 952 |
Series 2007-AR8 Class 2A1A | | | | |
5.925% due 08/25/37 | | 241 | | 243 |
Citigroup/Deutsche Bank Commercial Mortgage Trust | | | | |
Series 2005-CD1 Class A4 | | | | |
5.225% due 07/15/44 | | 1,000 | | 997 |
Series 2006-CD3 Class A5 | | | | |
5.617% due 10/15/48 | | 190 | | 194 |
Citimortgage Alternative Loan Trust
Series 2006-A3 Class 1A5
6.000% due 07/25/36 | | 156 | | 155 |
Countrywide Alternative Loan Trust | | | | |
Series 2005-32T Class A7 (Ê) | | | | |
5.115% due 08/25/35 | | 160 | | 160 |
Series 2005-J8 Class 1A3 | | | | |
5.500% due 07/25/35 | | 210 | | 205 |
Series 2005-J13 Class 2A3 | | | | |
5.500% due 11/25/35 | | 141 | | 138 |
Series 2006-9T1 Class A7 | | | | |
6.000% due 05/25/36 | | 114 | | 113 |
Series 2006-43C Class 1A7 | | | | |
6.000% due 02/25/37 | | 325 | | 322 |
Series 2006-J2 Class A3 | | | | |
6.000% due 04/25/36 | | 170 | | 168 |
Series 2006-OA1 Class 4A1 (Ê) | | | | |
5.055% due 08/25/46 | | 684 | | 645 |
Series 2006-OA1 Class A1 (Ê) | | | | |
5.129% due 02/20/47 | | 821 | | 775 |
Series 2007-J2 Class 2A1 | | | | |
6.000% due 07/25/37 | | 271 | | 273 |
Series 2007-OA1 Class A1A (Ê) | | | | |
6.168% due 04/25/43 | | 994 | | 954 |
Countrywide Home Loan Mortgage Pass Through Trust | | | | |
Series 2003-8 Class A2 (Ê) | | | | |
5.365% due 05/25/18 | | 185 | | 184 |
Series 2003-52 Class A1 | | | | |
4.501% due 02/19/34 | | 297 | | 296 |
Series 2004-16 Class 1A1 (Ê) | | | | |
5.265% due 09/25/34 | | 189 | | 185 |
Series 2004-22 Class A3 | | | | |
4.801% due 11/25/34 | | 243 | | 241 |
Russell Investment Funds
Core Bond Fund
Schedule of Investments, continued — December 31, 2007
Amounts in thousands (except share amounts)
| | | | |
| | | Principal
Amount ($)
or Shares | | Market
Value
$ |
| | | | |
Series 2004-HYB Class 1A1 | | | | |
4.726% due 02/20/35 | | 423 | | 421 |
Series 2004-HYB Class A2 | | | | |
4.556% due 11/20/34 | | 102 | | 101 |
Series 2005-3 Class 1A2 (Ê) | | | | |
5.155% due 04/25/35 | | 33 | | 31 |
Series 2005-HYB Class 2A1 | | | | |
4.901% due 08/20/35 | | 416 | | 410 |
Series 2005-HYB Class 3A2A (Ê) | | | | |
5.250% due 02/20/36 | | 74 | | 74 |
Series 2006-OA5 Class 2A1 (Ê) | | | | |
5.065% due 04/25/46 | | 764 | | 714 |
Series 2007-18 Class 2A1 | | | | |
6.500% due 09/25/37 | | 296 | | 301 |
Series 2007-HY1 Class 1A2 | | | | |
5.694% due 04/25/37 | | 100 | | 99 |
CS First Boston Mortgage Securities Corp. | | | | |
Series 1998-C1 Class A1B | | | | |
6.480% due 05/17/40 | | 29 | | 29 |
Series 1998-C2 Class A2 | | | | |
6.300% due 11/15/30 | | 83 | | 84 |
Series 2005-9 Class 2A1 | | | | |
5.500% due 10/25/35 | | 451 | | 437 |
Deutsche ALT-A Securities, Inc.
Alternate Loan Trust
Series 2005-AR1 Class 2A3
4.997% due 08/25/35 | | 465 | | 450 |
DLJ Commercial Mortgage Corp. | | | | |
Series 1998-CF1 Class A1B | | | | |
6.410% due 02/18/31 | | 4 | | 4 |
Series 1999-CG1 Class S | | | | |
Interest Only STRIP | | | | |
0.817% due 03/10/32 | | 3,284 | | 34 |
Fannie Mae | | | | |
5.190% due 2012 | | 210 | | 214 |
6.000% due 2016 | | 16 | | 16 |
5.000% due 2017 | | 531 | | 533 |
5.510% due 2017 (Ê) | | 48 | | 48 |
6.000% due 2017 | | 89 | | 91 |
4.000% due 2018 | | 813 | | 782 |
4.500% due 2018 | | 4,008 | | 3,948 |
5.000% due 2018 | | 207 | | 207 |
4.500% due 2019 | | 175 | | 171 |
5.000% due 2019 | | 1,181 | | 1,184 |
6.000% due 2019 | | 492 | | 504 |
4.500% due 2020 | | 395 | | 388 |
5.000% due 2020 | | 1,510 | | 1,513 |
6.000% due 2020 | | 618 | | 633 |
| | | | |
| | | Principal
Amount ($)
or Shares | | Market
Value
$ |
5.000% due 2021 | | 1,429 | | 1,430 |
6.500% due 2024 | | 508 | | 525 |
6.000% due 2026 | | 1,149 | | 1,170 |
6.000% due 2027 | | 553 | | 563 |
6.000% due 2028 | | 34 | | 35 |
5.500% due 2029 | | 94 | | 95 |
6.000% due 2032 | | 543 | | 555 |
7.000% due 2032 | | 187 | | 193 |
3.910% due 2033 (Ê) | | 251 | | 255 |
5.000% due 2033 | | 581 | | 568 |
5.070% due 2033 (Ê) | | 130 | | 134 |
5.500% due 2033 | | 2,656 | | 2,657 |
6.000% due 2033 | | 198 | | 201 |
5.000% due 2034 | | 674 | | 658 |
5.500% due 2034 | | 4,189 | | 4,190 |
5.000% due 2035 | | 609 | | 595 |
5.500% due 2035 | | 19,922 | | 19,913 |
6.000% due 2035 | | 160 | | 162 |
5.000% due 2036 | | 45 | | 44 |
5.500% due 2036 | | 923 | | 922 |
5.630% due 2036 (Ê) | | 443 | | 446 |
6.000% due 2036 | | 7,457 | | 7,571 |
6.500% due 2036 | | 113 | | 117 |
7.000% due 2036 | | 25 | | 25 |
5.000% due 2037 | | 6,938 | | 6,770 |
5.500% due 2037 | | 4,055 | | 4,051 |
5.560% due 2037 (Ê) | | 289 | | 294 |
6.000% due 2037 | | 3,047 | | 3,095 |
6.500% due 2037 | | 2,719 | | 2,787 |
7.000% due 2037 | | 3,156 | | 3,283 |
7.500% due 2037 | | 969 | | 1,014 |
Series 2003-337 Class 1 | | | | |
Principal Only STRIP | | | | |
Zero coupon due 07/01/33 | | 275 | | 202 |
Series 2003-343 Class 6 | | | | |
Interest Only STRIP | | | | |
5.000% due 10/01/33 | | 270 | | 61 |
Series 2003-345 Class 18 | | | | |
Interest Only STRIP | | | | |
4.500% due 12/01/18 | | 729 | | 105 |
Series 2003-345 Class 19 | | | | |
Interest Only STRIP | | | | |
4.500% due 01/01/19 | | 815 | | 118 |
Series 2004-353 Class 2 | | | | |
Interest Only STRIP | | | | |
5.000% due 08/01/34 | | 572 | | 143 |
Series 2004-356 Class 35 | | | | |
Interest Only STRIP | | | | |
4.500% due 03/01/20 | | 141 | | 21 |
Russell Investment Funds
Core Bond Fund
Schedule of Investments, continued — December 31, 2007
Amounts in thousands (except share amounts)
| | | | |
| | | Principal
Amount ($)
or Shares | | Market
Value
$ |
| | | | |
Series 2004-356 Class 36 | | | | |
Interest Only STRIP | | | | |
4.500% due 03/01/20 | | 240 | | 37 |
Series 2005-365 Class 12 | | | | |
Interest Only STRIP | | | | |
5.500% due 12/01/35 | | 1,062 | | 232 |
Series 2006-369 Class 8 | | | | |
Interest Only STRIP | | | | |
5.500% due 04/01/36 | | 216 | | 50 |
Series 2006-372 Class 2 | | | | |
Interest Only STRIP | | | | |
6.000% due 08/01/36 | | 557 | | 122 |
15 Year TBA (Ï) | | | | |
4.500% | | 340 | | 335 |
5.000% | | 1,210 | | 1,211 |
5.500% | | 1,000 | | 1,013 |
30 Year TBA (Ï) | | | | |
4.500% | | 530 | | 502 |
5.000% | | 3,175 | | 3,092 |
6.000% | | 4,810 | | 4,884 |
6.500% | | 1,695 | | 1,742 |
7.000% | | 9,000 | | 9,360 |
Fannie Mae REMICS | | | | |
Series 1992-10 Class ZD | | | | |
8.000% due 11/25/21 | | 33 | | 33 |
Series 1999-56 Class Z | | | | |
7.000% due 12/18/29 | | 103 | | 105 |
Series 2003-32 Class FH (Ê) | | | | |
5.265% due 11/25/22 | | 323 | | 323 |
Series 2003-35 Class FY (Ê) | | | | |
5.265% due 05/25/18 | | 415 | | 418 |
Series 2003-78 Class FI (Ê) | | | | |
5.265% due 01/25/33 | | 317 | | 317 |
Series 2004-21 Class FL (Ê) | | | | |
5.215% due 11/25/32 | | 158 | | 158 |
Series 2005-36 Class AI | | | | |
Interest Only STRIP | | | | |
5.500% due 10/25/26 | | 257 | | 14 |
Series 2005-79 Class FC (Ê) | | | | |
5.165% due 02/25/22 | | 150 | | 149 |
Series 2006-48 Class LG | | | | |
Principal Only STRIP | | | | |
Zero coupon due 06/25/36 | | 70 | | 39 |
Fannie Mae Whole Loan
Series 2003-W1 Class 1A1
6.500% due 12/25/42 | | 40 | | 42 |
Federal Home Loan Mortgage
Corp. Structured Pass
Through Securities (Ê)
Series 2005-63 Class 1A1
6.063% due 02/25/45 | | 35 | | 35 |
| | | | |
| | | Principal
Amount ($)
or Shares | | Market
Value
$ |
First Horizon Alternative Mortgage Securities | | | | |
Series 2004-AA3 Class A1 (Ê) | | | | |
5.302% due 09/25/34 | | 53 | | 53 |
Series 2006-AA5 Class A2 (Ê) | | | | |
6.522% due 09/25/36 | | 150 | | 153 |
Series 2006-FA3 Class A6 | | | | |
6.000% due 07/25/36 | | 236 | | 235 |
First Horizon Asset Securities, Inc. (Ê) | | | | |
Series 2004-AR6 Class 2A1 | | | | |
4.750% due 12/25/34 | | 46 | | 45 |
Series 2005-AR5 Class 3A1 | | | | |
5.535% due 10/25/35 | | 114 | | 113 |
Freddie Mac | | | | |
6.000% due 2016 | | 26 | | 26 |
5.000% due 2018 | | 649 | | 651 |
4.000% due 2019 | | 1,648 | | 1,583 |
5.000% due 2019 | | 739 | | 741 |
5.000% due 2020 | | 1,346 | | 1,348 |
5.500% due 2020 | | 789 | | 799 |
7.360% due 2030 (Ê) | | 1 | | 2 |
5.000% due 2033 | | 206 | | 201 |
6.890% due 2034 (Ê) | | 102 | | 103 |
6.000% due 2035 | | 146 | | 147 |
5.870% due 2036 (Ê) | | 119 | | 120 |
5.940% due 2036 (Ê) | | 233 | | 236 |
5.970% due 2036 (Ê) | | 139 | | 141 |
5.540% due 2037 (Ê) | | 427 | | 433 |
5.570% due 2037 (Ê) | | 183 | | 185 |
5.720% due 2037 (Ê) | | 712 | | 724 |
5.760% due 2037 (Ê) | | 250 | | 255 |
5.810% due 2037 (Ê) | | 204 | | 207 |
5.830% due 2037 (Ê) | | 189 | | 192 |
5.870% due 2037 (Ê) | | 89 | | 90 |
5.890% due 2037 (Ê) | | 69 | | 71 |
6.000% due 2037 | | 1,979 | | 2,009 |
30 Year TBA (Ï) | | | | |
5.000% | | 1,485 | | 1,449 |
5.500% | | 2,520 | | 2,514 |
Freddie Mac REMICS | | | | |
Series 2000-226 Class F (Ê) | | | | |
5.478% due 11/15/30 | | 16 | | 16 |
Series 2003-256 Class FJ (Ê) | | | | |
5.428% due 02/15/33 | | 142 | | 143 |
Series 2003-258 Class IG | | | | |
Interest Only STRIP | | | | |
4.500% due 10/15/16 | | 111 | | 9 |
Series 2003-262 Class AB | | | | |
2.900% due 11/15/14 | | 239 | | 235 |
Russell Investment Funds
Core Bond Fund
Schedule of Investments, continued — December 31, 2007
Amounts in thousands (except share amounts)
| | | | |
| | | Principal
Amount ($)
or Shares | | Market
Value
$ |
| | | | |
Series 2004-276 Class IP | | | | |
Interest Only STRIP | | | | |
5.500% due 07/15/23 | | 152 | | 3 |
Series 2004-281 Class DF (Ê) | | | | |
5.478% due 06/15/23 | | 121 | | 122 |
Series 2005-292 Class IG | | | | |
Interest Only STRIP | | | | |
5.000% due 04/15/23 | | 169 | | 25 |
Series 2005-294 Class FA (Ê) | | | | |
5.198% due 03/15/20 | | 233 | | 233 |
Series 2005-299 Class KF (Ê) | | | | |
5.428% due 06/15/35 | | 76 | | 75 |
Series 2005-301 Class IM | | | | |
Interest Only STRIP | | | | |
5.500% due 01/15/31 | | 167 | | 17 |
Series 2006-313 Class FP (Ê) | | | | |
Zero coupon due 04/15/36 | | 165 | | 168 |
Series 2006-317 Class XI (Ê) | | | | |
Principal Only STRIP | | | | |
Zero coupon due 10/15/35 | | 260 | | 3 |
Series 2006-323 Class PA | | | | |
6.000% due 03/15/26 | | 281 | | 285 |
Series 2007-330 Class GL (Ê) | | | | |
6.514% due 04/15/37 | | 87 | | 95 |
Series 2007-333 Class AF (Ê) | | | | |
5.178% due 10/15/20 | | 2,000 | | 1,991 |
Series 2007-333 Class BF (Ê) | | | | |
5.178% due 07/15/19 | | 363 | | 361 |
Series 2007-333 Class FT (Ê) | | | | |
5.178% due 08/15/19 | | 1,449 | | 1,442 |
Series 2007-334 Class FA (Ê) | | | | |
5.258% due 02/15/19 | | 1,396 | | 1,388 |
Ginnie Mae I | | | | |
6.000% due 2029 | | 13 | | 13 |
6.000% due 2036 | | 473 | | 485 |
6.000% due 2037 | | 506 | | 518 |
30 Year TBA (Ï) | | | | |
5.500% | | 1,650 | | 1,662 |
Ginnie Mae II (Ê) | | | | |
6.380% due 2026 | | 200 | | 202 |
5.630% due 2027 | | 12 | | 13 |
5.750% due 2032 | | 87 | | 88 |
GMAC Commercial Mortgage Securities, Inc. Series 1999-C2 Class A2
6.945% due 09/15/33 | | 189 | | 194 |
GMAC Mortgage Corp. Loan Trust | | | | |
Series 2004-JR1 Class A6 (Ê) | | | | |
5.315% due 12/25/33 | | 96 | | 95 |
| | | | |
| | | Principal
Amount ($)
or Shares | | Market
Value
$ |
Series 2007-HE3 Class 1A1 | | | | |
7.000% due 09/25/37 | | 98 | | 98 |
Government National Mortgage Association (Ê) | | | | |
Series 1999-40 Class FE | | | | |
5.578% due 11/16/29 | | 117 | | 118 |
Series 2000-29 Class F | | | | |
5.449% due 09/20/30 | | 22 | | 22 |
Greenwich Capital Commercial Funding Corp. | | | | |
Series 2003-C2 Class A2 | | | | |
4.022% due 01/05/36 | | 200 | | 198 |
Series 2004-GG1 Class A7 | | | | |
5.317% due 06/10/36 | | 465 | | 473 |
Series 2007-GG9 Class A4 | | | | |
5.444% due 03/10/39 | | 215 | | 216 |
GS Mortgage Securities Corp. II | | | | |
Series 2006-FL8 Class A1 (Ê)(Þ) | | | | |
5.352% due 06/06/20 | | 1 | | 1 |
Series 2006-GG6 Class A4 | | | | |
5.553% due 04/10/38 | | 135 | | 137 |
Series 2006-GG8 Class AAB | | | | |
5.535% due 11/10/39 | | 200 | | 202 |
Series 2007-GG1 Class A4 | | | | |
5.799% due 08/10/45 | | 645 | | 667 |
GSR Mortgage Loan Trust
Series 2005-AR7 Class 6A1
5.251% due 11/25/35 | | 261 | | 252 |
Harborview Mortgage Loan Trust | | | | |
Series 2005-4 Class 3A1 | | | | |
5.148% due 07/19/35 | | 189 | | 187 |
Series 2005-14 Class 3A1A | | | | |
5.300% due 12/19/35 | | 111 | | 111 |
Series 2005-16 Class 3A1A (Ê) | | | | |
5.215% due 01/19/36 | | 449 | | 428 |
Indymac Index Mortgage Loan Trust | | | | |
Series 2005-AR1 Class A1 | | | | |
5.443% due 09/25/35 | | 684 | | 671 |
Series 2006-AR2 Class A2 (Ê) | | | | |
4.945% due 11/25/36 | | 118 | | 117 |
JP Morgan Chase Commercial Mortgage Securities Corp. | | | | |
Series 2001-CIB Class A2 | | | | |
6.244% due 04/15/35 | | 155 | | 156 |
Series 2004-LN2 Class A1 | | | | |
4.475% due 07/15/41 | | 340 | | 338 |
Series 2005-LDP Class A3A1 | | | | |
4.871% due 10/15/42 | | 210 | | 208 |
Russell Investment Funds
Core Bond Fund
Schedule of Investments, continued — December 31, 2007
Amounts in thousands (except share amounts)
| | | | |
| | | Principal
Amount ($)
or Shares | | Market
Value
$ |
| | | | |
Series 2005-LDP Class A4 | | | | |
4.918% due 10/15/42 | | 325 | | 315 |
5.179% due 12/15/44 | | 390 | | 388 |
Series 2006-CB1 Class A4 | | | | |
5.552% due 05/12/45 | | 220 | | 223 |
Series 2006-LDP Class A3 | | | | |
5.336% due 05/15/47 | | 305 | | 304 |
Series 2006-LDP Class A3B | | | | |
5.447% due 05/15/45 | | 250 | | 251 |
Series 2006-LDP Class A4 | | | | |
5.875% due 04/15/45 | | 650 | | 676 |
5.399% due 05/15/45 | | 290 | | 291 |
Series 2007-LDP Class A3 | | | | |
5.420% due 01/15/49 | | 275 | | 275 |
JP Morgan Mortgage Trust (Ê) | | | | |
Series 2005-A1 Class 6T1 | | | | |
5.405% due 02/25/35 | | 137 | | 134 |
Series 2007-A1 Class 2A2 | | | | |
4.755% due 07/25/35 | | 872 | | 866 |
LB-UBS Commercial Mortgage Trust | | | | |
Series 2004-C4 Class A3 | | | | |
4.976% due 06/15/29 | | 155 | | 158 |
Series 2006-C1 Class A4 | | | | |
5.156% due 02/15/31 | | 1,000 | | 989 |
Series 2006-C4 Class A4 | | | | |
5.883% due 06/15/38 | | 105 | | 110 |
Series 2007-C6 Class A4 | | | | |
5.858% due 07/15/40 | | 270 | | 280 |
Lehman Mortgage Trust
Series 2005-3 Class 1A3
5.500% due 01/25/36 | | 629 | | 627 |
Lehman XS Trust (Ê) | | | | |
Series 2005-5N Class 3A1A | | | | |
5.165% due 11/25/35 | | 503 | | 477 |
Series 2006-16N Class A4A | | | | |
5.055% due 11/25/46 | | 829 | | 787 |
Mastr Adjustable Rate Mortgages Trust (Ê) | | | | |
Series 2004-13 Class 3A4 | | | | |
3.787% due 11/21/34 | | 198 | | 196 |
Series 2006-OA2 Class 4A1A | | | | |
5.713% due 12/25/46 | | 836 | | 813 |
MASTR Alternative Loans Trust | | | | |
Series 2003-4 Class B1 | | | | |
5.677% due 06/25/33 | | 195 | | 192 |
Series 2004-10 Class 5A6 | | | | |
5.750% due 09/25/34 | | 170 | | 168 |
MASTR Asset Securitization Trust (Ê) | | | | |
Series 2003-7 Class 4A35 | | | | |
5.265% due 09/25/33 | | 237 | | 235 |
| | | | |
| | | Principal
Amount ($)
or Shares | | Market
Value
$ |
Series 2004-4 Class 2A2 | | | | |
5.315% due 04/25/34 | | 88 | | 88 |
Mellon Residential Funding Corp. (Ê)
Series 2000-TBC Class A1
5.508% due 06/15/30 | | 197 | | 194 |
Merrill Lynch Floating Trust (Ê)(Þ)
Series 2006-1 Class A1
5.098% due 06/15/22 | | 842 | | 849 |
Merrill Lynch Mortgage Investors, Inc. (Ê)
Series 2005-A10 Class A
5.075% due 02/25/36 | | 105 | | 101 |
MLCC Mortgage Investors, Inc. (Ê) | | | | |
Series 2004-HB1 Class A2 | | | | |
5.750% due 04/25/29 | | 42 | | 41 |
Series 2005-3 Class 5A | | | | |
5.115% due 11/25/35 | | 61 | | 59 |
Morgan Stanley Capital I | | | | |
Series 2005-IQ1 Class AAB | | | | |
5.178% due 09/15/42 | | 415 | | 415 |
Series 2006-HQ1 Class A4 | | | | |
5.328% due 11/12/41 | | 130 | | 130 |
Series 2006-HQ8 Class A4 | | | | |
5.388% due 03/12/44 | | 310 | | 313 |
Series 2006-HQ9 Class A4 | | | | |
5.731% due 07/12/44 | | 200 | | 206 |
MortgageIT Trust (Ê)
Series 2005-AR1 Class 1A1
5.115% due 11/25/35 | | 499 | | 472 |
Prime Mortgage Trust (Ê)
Series 2004-CL1 Class 1A2
5.265% due 02/25/34 | | 41 | | 40 |
Residential Accredit Loans, Inc. | | | | |
Series 2004-QS5 Class A6 (Ê) | | | | |
5.465% due 04/25/34 | | 61 | | 59 |
Series 2004-QS8 Class A4 (Ê) | | | | |
5.265% due 06/25/34 | | 308 | | 302 |
Series 2005-QA8 Class NB3 | | | | |
5.479% due 07/25/35 | | 255 | | 252 |
Series 2005-QO5 Class A1 (Ê) | | | | |
5.863% due 01/25/46 | | 592 | | 566 |
Series 2006-QS6 Class 1A13 | | | | |
6.000% due 06/25/36 | | 395 | | 394 |
Series 2007-QH9 Class A1 | | | | |
6.550% due 11/25/37 | | 995 | | 985 |
Residential Asset Securities Corp. (Ê)
Series 2003-KS4 Class AIIB
5.445% due 06/25/33 | | 56 | | 55 |
Russell Investment Funds
Core Bond Fund
Schedule of Investments, continued — December 31, 2007
Amounts in thousands (except share amounts)
| | | | |
| | | Principal
Amount ($)
or Shares | | Market
Value
$ |
| | | | |
Residential Asset Securitization Trust | | | | |
Series 2003-A15 Class 1A2 (Ê) | | | | |
5.315% due 02/25/34 | | 344 | | 338 |
Series 2007-A5 Class 2A3 | | | | |
6.000% due 05/25/37 | | 136 | | 135 |
Residential Funding Mortgage Securities I | | | | |
Series 2003-S5 Class 1A2 (Ê) | | | | |
5.315% due 11/25/18 | | 183 | | 183 |
Series 2003-S14 Class A5 (Ê) | | | | |
5.265% due 07/25/18 | | 196 | | 195 |
Series 2003-S20 Class 1A7 (Ê) | | | | |
5.365% due 12/25/33 | | 71 | | 71 |
Series 2005-SA4 Class 2A1 | | | | |
5.207% due 09/25/35 | | 735 | | 730 |
Series 2006-SA4 Class 2A1 | | | | |
6.123% due 11/25/36 | | 491 | | 492 |
Sequoia Mortgage Trust (Ê)
Series 2001-5 Class A
5.315% due 10/19/26 | | 71 | | 70 |
Small Business Administration Participation Certificates
Series 2005-20G Class 1
4.750% due 07/01/25 | | 879 | | 863 |
Structured Adjustable Rate Mortgage Loan Trust | | | | |
Series 2004-5 Class 3A1 | | | | |
4.380% due 05/25/34 | | 156 | | 154 |
Series 2004-12 Class 3A2 | | | | |
5.250% due 09/25/34 | | 70 | | 70 |
Series 2004-16 Class 3A1 | | | | |
5.450% due 11/25/34 | | 255 | | 253 |
Structured Asset Mortgage Investments, Inc. (Ê) | | | | |
Series 2005-AR5 Class A3 | | | | |
5.215% due 07/19/35 | | 184 | | 179 |
Series 2006-AR2 Class A1 | | | | |
5.095% due 02/25/36 | | 606 | | 573 |
Series 2006-AR8 Class A1A | | | | |
5.065% due 10/25/36 | | 845 | | 808 |
Series 2007-AR6 Class A1 | | | | |
6.363% due 11/25/37 | | 996 | | 970 |
Structured Asset Securities Corp.
Series 2004-21X Class 1A3
4.440% due 12/25/34 | | 467 | | 465 |
Thornburg Mortgage Securities Trust (Ê) | | | | |
Series 2003-2 Class A1 | | | | |
5.205% due 04/25/43 | | 120 | | 120 |
| | | | |
| | | Principal
Amount ($)
or Shares | | Market
Value
$ |
Series 2006-5 Class A1 | | | | |
4.985% due 09/25/46 | | 782 | | 765 |
Series 2006-6 Class A1 | | | | |
4.975% due 12/25/36 | | 156 | | 153 |
Wachovia Bank Commercial Mortgage Trust Series 2005-C21 Class A4
5.210% due 10/15/44 | | 1,000 | | 990 |
Washington Mutual Alternative Mortgage Pass-Through Certificates | | | | |
Series 2005-4 Class CB11 | | | | |
5.500% due 06/25/35 | | 90 | | 86 |
Series 2006-AR8 Class 2A (Ê) | | | | |
5.638% due 10/25/46 | | 801 | | 777 |
Series 2006-AR9 Class 2A (Ê) | | | | |
5.628% due 11/25/46 | | 879 | | 848 |
Series 2007-OA1 Class 2A (Ê) | | | | |
5.508% due 12/25/46 | | 760 | | 703 |
Washington Mutual Mortgage Pass Through Certificates | | | | |
Series 2003-S9 Class A2 (Ê) | | | | |
5.415% due 10/25/33 | | 344 | | 342 |
Series 2004-AR3 Class A2 | | | | |
4.243% due 06/25/34 | | 169 | | 168 |
Series 2005-AR1 Class 1A1 | | | | |
4.835% due 10/25/35 | | 292 | | 290 |
Series 2005-AR1 Class A1A1 (Ê) | | | | |
5.155% due 10/25/45 | | 38 | | 36 |
5.135% due 12/25/45 | | 477 | | 452 |
Series 2005-AR6 Class B3 (Ê) | | | | |
5.525% due 04/25/45 | | 210 | | 194 |
Series 2006-AR1 Class 3A1A (Ê) | | | | |
5.708% due 09/25/46 | | 793 | | 770 |
Series 2006-AR2 Class 1A1 | | | | |
5.313% due 03/25/37 | | 805 | | 806 |
Series 2007-HY3 Class 4A1 | | | | |
5.349% due 03/25/37 | | 904 | | 900 |
Series 2007-HY3 Class 4B1 | | | | |
5.350% due 03/25/37 | | 125 | | 118 |
Series 2007-HY4 Class 1A1 (Ê) | | | | |
5.554% due 04/25/37 | | 165 | | 163 |
Wells Fargo Alternative Loan Trust
Series 2007-PA6 Class A1
6.607% due 12/26/37 | | 937 | | 939 |
Wells Fargo Mortgage Backed Securities Trust | | | | |
Series 2005-17 Class 2A1 | | | | |
5.500% due 01/25/36 | | 658 | | 644 |
Series 2005-AR6 Class A1 (Ê) | | | | |
5.039% due 04/25/35 | | 758 | | 722 |
Russell Investment Funds
Core Bond Fund
Schedule of Investments, continued — December 31, 2007
Amounts in thousands (except share amounts)
| | | | | |
| | | Principal
Amount ($)
or Shares | | Market
Value
$ |
| | | | | |
Series 2006-2 Class 2A3 | | | | | |
5.500% due 03/25/36 | | | 444 | | 446 |
Series 2006-AR1 Class AIO | | | | | |
Interest Only STRIP | | | | | |
0.450% due 10/25/36 | | | 9,532 | | 99 |
Series 2006-AR2 Class 2A1 | | | | | |
4.950% due 03/25/36 | | | 321 | | 317 |
Series 2007-8 Class 1A16 | | | | | |
6.000% due 07/25/37 | | | 358 | | 357 |
Series 2007-10 Class 2A5 | | | | | |
6.250% due 07/25/37 | | | 181 | | 184 |
| | | | | |
| | | | | 188,516 |
| | | | | |
Municipal Bonds - 0.4% | | | | | |
New York City Municipal Water Finance Authority Revenue Bonds
4.750% due 06/15/37 | | | 1,300 | | 1,303 |
| | | | | |
| | |
Non-US Bonds - 0.3% | | | | | |
Argentina Bocon
Series PR12
2.000% due 01/03/16 | | ARS | 1,078 | | 449 |
Bombardier, Inc. (Å)
7.250% due 11/15/16 | | EUR | 125 | | 183 |
Federative Republic of Brazil | | | | | |
12.570% due 01/05/22 | | BRL | 300 | | 189 |
10.250% due 01/10/28 (Ñ) | | BRL | 140 | | 76 |
Ineos Group Holdings PLC
Series REGS
7.875% due 02/15/16 | | EUR | 125 | | 153 |
| | | | | |
| | | | | 1,050 |
| | | | | |
| |
United States Government Agencies - 3.0% | | |
Fannie Mae (Ñ)
4.150% due 09/10/09 (Ñ) | | | 2,200 | | 2,220 |
3.875% due 02/15/10 | | | 510 | | 513 |
4.750% due 04/20/10 | | | 1,400 | | 1,436 |
4.125% due 05/12/10 | | | 1,500 | | 1,518 |
5.050% due 02/07/11 | | | 1,200 | | 1,249 |
Federal Home Loan Bank
5.375% due 08/19/11 | | | 295 | | 311 |
Federal Home Loan Bank Discount Notes | | | | | |
5.310% due 12/28/12 (Ñ) | | | 1,000 | | 1,060 |
Financing Corp. | | | | | |
Principal Only STRIP
Series 1
Zero coupon due 05/11/16 | | | 80 | | 55 |
| | | | |
| | | Principal
Amount ($)
or Shares | | Market
Value
$ |
Series 1P | | | | |
Zero coupon due 05/11/18 | | 95 | | 59 |
Series 3P | | | | |
Zero coupon due 11/30/17 | | 170 | | 108 |
Series 5P | | | | |
Zero coupon due 02/08/18 | | 65 | | 41 |
Series 8P | | | | |
Zero coupon due 08/03/18 | | 605 | | 371 |
Series 9P | | | | |
Zero coupon due 10/06/17 | | 310 | | 200 |
Series 12P | | | | |
Zero coupon due 12/06/18 | | 245 | | 147 |
Series 13 | | | | |
Zero coupon due 12/27/16 | | 275 | | 184 |
Series 13P | | | | |
Zero coupon due 12/27/18 | | 1,130 | | 678 |
Series 16P | | | | |
Zero coupon due 04/05/19 | | 380 | | 224 |
Series 19 | | | | |
Zero coupon due 06/06/16 | | 230 | | 158 |
| | | | |
| | | | 10,532 |
| | | | |
|
United States Government Treasuries - 2.9% |
United States Treasury Principal (Ñ) | | | | |
Principal Only STRIP | | | | |
Zero coupon due 11/15/21 | | 445 | | 235 |
Zero coupon due 08/15/25 | | 300 | | 132 |
Zero coupon due 08/15/26 | | 300 | | 127 |
United States Treasury Inflation Indexed Bonds | | | | |
0.875% due 04/15/10 | | 1,331 | | 1,326 |
2.375% due 04/15/11 | | 212 | | 221 |
3.375% due 01/15/12 (Ñ) | | 982 | | 1,072 |
2.000% due 04/15/12 | | 103 | | 107 |
2.000% due 01/15/14 (Ñ) | | 113 | | 117 |
2.000% due 07/15/14 (Ñ) | | 1,518 | | 1,569 |
2.625% due 07/15/17 | | 101 | | 108 |
2.375% due 01/15/25 (Ñ) | | 120 | | 126 |
2.000% due 01/15/26 (Ñ) | | 316 | | 314 |
2.375% due 01/15/27 (Ñ) | | 207 | | 219 |
United States Treasury Notes (Ñ) | | | | |
4.000% due 08/31/09 | | 900 | | 913 |
4.750% due 05/31/12 | | 600 | | 633 |
4.250% due 08/15/15 | | 345 | | 354 |
6.000% due 02/15/26 | | 2,310 | | 2,734 |
| | | | |
| | | | 10,307 |
| | | | |
| | |
| Total Long-Term Investments | | | | |
(cost $315,146) | | | | 313,881 |
| | | | |
Russell Investment Funds
Core Bond Fund
Schedule of Investments, continued — December 31, 2007
Amounts in thousands (except share amounts)
| | | | | |
| | | Principal
Amount ($)
or Shares | | Market
Value
$ |
| | | | | |
| | |
| Preferred Stocks - 0.3% | | | | | |
Financial Services - 0.3% | | | | | |
DG Funding Trust (Æ)(Å) | | | 49 | | 517 |
Fannie Mae (Æ) | | | 14,000 | | 360 |
| | | | | |
| | |
| Total Preferred Stocks | | | | | |
(cost $866) | | | | | 877 |
| | | | | |
| | |
| | | Notional
Amount | | |
Options Purchased - 0.4% | | | | | |
(Number of Contracts) | | | | | |
Eurodollar Futures | | | | | |
Mar 2008 91.75 Put (241) | | USD | 603 | | 2 |
Mar 2008 92.00 Put (43) | | USD | 108 | | — |
Mar 2008 92.50 Put (58) | | USD | 145 | | — |
Mar 2008 92.75 Put (53) | | USD | 133 | | — |
Mar 2008 93.00 Put (68) | | USD | 170 | | — |
Jun 2008 92.75 Put (40) | | USD | 100 | | — |
Swaptions (Fund Pays/Fund Receives) | | | | | |
USD Three Month LIBOR/USD
4.750%
| | | | | |
Feb 2008 0.00 Call (1) | | | 5,000 | | 38 |
USD Three Month LIBOR/USD
5.000% | | | | | |
Feb 2008 0.00 Call (1) | | | 6,000 | | 140 |
USD Three Month LIBOR/USD
4.750% | | | | | |
Mar 2008 0.00 Call (2) | | | 15,000 | | 302 |
USD Three Month LIBOR/USD
4.750% | | | | | |
Sep 2008 0.00 Call (3) | | | 13,900 | | 288 |
USD Three Month LIBOR/USD
4.750% | | | | | |
Dec 2008 0.00 Call (1) | | | 6,200 | | 123 |
USD Three Month LIBOR/USD
5.000% | | | | | |
Dec 2008 0.00 Call (1) | | | 15,100 | | 356 |
USD Three Month LIBOR/USD
5.200% | | | | | |
Feb 2009 0.00 Call (1) | | | 5,000 | | 130 |
| | | | | |
| | |
| Total Options Purchased | | | | | |
(cost $305) | | | | | 1,379 |
| | | | | |
| | | | |
| | | Principal
Amount ($)
or Shares | | Market
Value
$ |
Short-Term Investments - 15.3% | | |
Abbey National Treasury Services PLC (Ê)
Series YCD
5.175% due 07/02/08 | | 500 | | 500 |
American Express Bank FSB (Ê)
Series BKNT
5.038% due 10/16/08 | | 300 | | 299 |
AMFM, Inc.
8.000% due 11/01/08 | | 50 | | 52 |
Amstel Funding Corp.
5.887% due 01/16/08 | | 510 | | 509 |
Atlantic Asset Securitization
5.907% due 01/15/08 | | 510 | | 509 |
Barclays Bank PLC
4.619% due 03/17/08 | | 600 | | 600 |
Chariot Funding, LLC
5.857% due 01/16/08 | | 510 | | 509 |
Citigroup Funding, Inc. (Ê)
5.136% due 12/08/08 | | 100 | | 99 |
Citigroup Global Markets Holdings, Inc. (Ê)
Series MTNM
5.191% due 03/07/08 | | 400 | | 400 |
Citigroup, Inc.
3.500% due 02/01/08 | | 560 | | 559 |
Clear Channel Communications, Inc.
4.625% due 01/15/08 | | 125 | | 125 |
Clipper Receivables Co.
6.145% due 01/17/08 | | 510 | | 509 |
CSC Holdings, Inc. (Ñ)
7.250% due 07/15/08 | | 125 | | 125 |
Dexia Credit SA
4.759% due 09/29/08 | | 1,100 | | 1,099 |
Falcon Asset Securitization Co. LLC
5.857% due 01/16/08 | | 510 | | 509 |
Federal Home Loan Bank D (ç)(ž)
Zero coupon due 01/11/08 | | 60 | | 60 |
Federal Home Loan Bank Discount Notes | | | | |
4.800% due 05/02/08 (Ñ) | | 3,100 | | 3,102 |
Series 577 (Ñ) | | | | |
4.500% due 09/26/08 | | 900 | | 902 |
Series IY08 | | | | |
3.400% due 03/18/08 | | 1,000 | | 997 |
Federal National Mortgage Association | | | | |
4.200% due 03/24/08 (Ñ) | | 2,000 | | 1,998 |
Fortis Bank
4.745% due 09/30/08 | | 500 | | 500 |
Russell Investment Funds
Core Bond Fund
Schedule of Investments, continued — December 31, 2007
Amounts in thousands (except share amounts)
| | | | |
| | | Principal
Amount ($)
or Shares | | Market
Value
$ |
| | | | |
Freddie Mac
3.450% due 03/12/08 | | 1,000 | | 998 |
Galleon Capital Corp.
6.145% due 01/17/08 | | 510 | | 509 |
Gazinvest Luxembourg SA for Gazprombank
7.250% due 10/30/08 | | 160 | | 160 |
General Electric Capital Corp. (Ê)
Series MTNA
5.111% due 07/28/08 | | 700 | | 700 |
General Electric Co. (Ê)
5.186% due 12/09/08 | | 200 | | 200 |
German Treasury Bills
Series 0807
Zero Coupon due 02/13/08 | | 1,100 | | 1,601 |
Goldman Sachs Group, Inc. (The) (Ê) | | | | |
Series MTNB | | | | |
4.974% due 12/22/08 | | 300 | | 299 |
4.924% due 12/23/08 (Ê) | | 600 | | 598 |
Greater Bay Bancorp
Series B
5.250% due 03/31/08 | | 150 | | 150 |
JetBlue Airways Corp. (Ê)
Series 04-1
9.241% due 03/15/08 | | 153 | | 153 |
Nordea Bank Finland PLC
4.991% due 05/28/08 | | 200 | | 200 |
Parker Hannifin Employee Stock
Ownership Trust (Å)
6.340% due 07/15/08 | | 56 | | 56 |
Popular NA, Inc.
Series MTNE
3.875% due 10/01/08 | | 275 | | 272 |
Rabobank USA Financial Corp.
3.980% due 01/02/08 | | 1,400 | | 1,400 |
Royal Bank of Scotland
4.734% due 03/26/08 | | 100 | | 100 |
Russell Investment Company
Money Market Fund | | 23,482,000 | | 23,482 |
Santander US Debt SA Unipersonal (Ê)(Þ)
5.151% due 11/20/08 | | 500 | | 498 |
Skandinaviska Enskilda Banken
4.962% due 08/21/08 | | 400 | | 400 |
Societe Generale (Ê)
4.815% due 03/26/08 | | 100 | | 100 |
| | | | | |
| | | Principal
Amount ($)
or Shares | | Market
Value
$ | |
Three Pillars Funding Corp.
5.908% due 01/16/08 | | 510 | | 509 | |
Transocean, Inc. (Ê)
5.341% due 09/05/08 | | 200 | | 199 | |
UBS Financial Del LLC
4.000% due 01/02/08 | | 3,700 | | 3,700 | |
Unicredit Luxembourg Finance SA (Ê)(Å)
5.143% due 10/24/08 | | 1,000 | | 998 | |
Unicredito Italiano NY (Ê)
Series YCD
5.062% due 05/29/08 | | 200 | | 200 | |
United States Treasury Bills (ž) | | | | | |
3.200% due 02/28/08 (ç) | | 410 | | 408 | |
2.980% due 03/13/08 (Ñ) | | 800 | | 794 | |
VTB Capital SA (Ê)(Þ)
5.494% due 08/01/08 | | 230 | | 228 | |
| | | | | |
| | |
| Total Short-Term Investments | | | | | |
(cost $50,744) | | | | 52,874 | |
| | | | | |
| | |
| Other Securities - 8.3% | | | | | |
State Street Securities Lending
Quality Trust (×) | | 28,696,765 | | 28,697 | |
| | | | | |
| | |
| Total Other Securities | | | | | |
(cost $28,697)
| | | | 28,697 | |
| | | | | |
| | |
| Total Investments - 114.9% | | | | | |
(identified cost $395,758) | | | | 397,708 | |
| | |
Other Assets and Liabilities,
Net - (14.9%) | | | | (51,641 | ) |
| | | | | |
| | |
| Net Assets - 100.0% | | | | 346,067 | |
| | | | | |
See accompanying notes which are an integral part of the financial statements.
Russell Investment Funds
Core Bond Fund
Schedule of Investments, continued — December 31, 2007
Amounts in thousands
| | | | | | |
Futures Contracts (Number of Contracts) | | Notional
Amount | | Unrealized
Appreciation
(Depreciation)
$ | |
| | | | | | |
| | | | | | |
| Long Positions | | | | | | |
Euro-Bund Futures (Germany)
expiration date 03/08 (16) | | EUR | 1,810 | | (59 | ) |
Eurodollar Futures (CME)
expiration date 03/08 (35) | | USD | 8,379 | | 17 | |
| expiration date 06/08 (286) | | USD | 68,822 | | 758 | |
| expiration date 09/08 (80) | | USD | 19,302 | | 293 | |
| expiration date 12/08 (236) | | USD | 57,012 | | 738 | |
| expiration date 03/09 (176) | | USD | 42,517 | | 474 | |
| expiration date 06/09 (17) | | USD | 4,102 | | 48 | |
LIBOR Futures
expiration date 03/08 (2) | | GBP | 236 | | 1 | |
| expiration date 06/08 (16) | | GBP | 1,895 | | 16 | |
| expiration date 09/08 (8) | | GBP | 950 | | 18 | |
| expiration date 12/08 (5) | | GBP | 595 | | 15 | |
| expiration date 03/09 (8) | | GBP | 952 | | 24 | |
| expiration date 06/09 (4) | | GBP | 476 | | 13 | |
Long Gilt Futures (UK)
expiration date 03/08 (3) | | GBP | 331 | | (5 | ) |
United States Treasury 2 Year Notes
expiration date 03/08 (39) | | USD | 8,200 | | 10 | |
United States Treasury 5 Year Notes
expiration date 03/08 (165) | | USD | 18,196 | | 49 | |
United States Treasury 10 Year Notes
expiration date 03/08 (136) | | USD | 15,421 | | 341 | |
United States Treasury Bonds
expiration date 03/08 (27) | | USD | 3,142 | | (44 | ) |
| | |
| Short Positions | | | | | | |
Euro-Bobl Futures (Germany)
expiration date 03/08 (28) | | EUR | 3,022 | | 46 | |
United States Treasury 2 Year Notes
expiration date 03/08 (27) | | USD | 5,677 | | (23 | ) |
United States Treasury 5 Year Notes
expiration date 03/08 (211) | | USD | 23,269 | | (115 | ) |
United States Treasury 10 Year Notes
expiration date 03/08 (47) | | USD | 5,329 | | (57 | ) |
United States Treasury Bonds
expiration date 03/08 (37) | | USD | 4,306 | | 35 | |
| | | | | | |
| | |
Total Unrealized Appreciation
(Depreciation) on Open Futures
Contracts | | | | | 2,593 | |
| | | | | | |
| | | | | | |
Options Written (Number of Contracts) | | Notional
Amount | | Market
Value
$ | |
| | | | | | |
Swaptions | | | | | | |
(Fund Receives/Fund Pays) | | | | | | |
USD Three Month LIBOR/USD 4.900% | | | | | | |
Feb 2008 0.00 Call (1) | | | 1,000 | | (32 | ) |
USD Three Month LIBOR/USD 5.100% | | | | | | |
Feb 2008 0.00 Call (1) | | | 3,000 | | (123 | ) |
USD Three Month LIBOR/USD 4.900% | | | | | | |
Mar 2008 0.00 Call (2) | | | 4,200 | | (142 | ) |
USD Three Month LIBOR/USD 4.950% | | | | | | |
Mar 2008 0.00 Call (1) | | | 2,000 | | (71 | ) |
USD Three Month LIBOR/USD 4.950% | | | | | | |
Sep 2008 0.00 Call (3) | | | 6,800 | | (243 | ) |
USD Three Month LIBOR/USD 5.000% | | | | | | |
Dec 2008 0.00 Call (1) | | | 2,100 | | (81 | ) |
USD Three Month LIBOR/USD 5.200% | | | | | | |
Dec 2008 0.00 Call (1) | | | 5,000 | | (232 | ) |
USD Three Month LIBOR/USD 5.450% | | | | | | |
Feb 2009 0.00 Call (1) | | | 2,000 | | (100 | ) |
| | |
United States Treasury Notes 10 Year Futures | | | | | | |
Feb 2008 111.00 Call (3) | | USD | 333 | | (9 | ) |
Feb 2008 114.00 Call (15) | | USD | 1,710 | | (17 | ) |
Feb 2008 110.00 Put (15) | | USD | 1,650 | | (4 | ) |
| | | | | | |
| | |
Total Liability for Options Written (premiums received $322) | | | | | (1,054 | ) |
| | | | | | |
See accompanying notes which are an integral part of the financial statements.
Russell Investment Funds
Core Bond Fund
Schedule of Investments, continued — December 31, 2007
Amounts in thousands
| | | | | | | | | | | |
| Foreign Currency Exchange Contracts | |
| | | | | | | | | | | |
Amount
Sold | | Amount
Bought | | Settlement
Date | | Unrealized
Appreciation
(Depreciation)
$ | |
| | | | | | | | | | | |
| USD | | 322 | | AUD | | 367 | | 01/24/08 | | — | |
| USD | | 20 | | BRL | | 35 | | 02/06/08 | | — | |
| USD | | 1,558 | | BRL | | 2,837 | | 02/06/08 | | 27 | |
| USD | | 1,584 | | EUR | | 1,100 | | 01/17/08 | | 25 | |
| USD | | 582 | | EUR | | 398 | | 01/23/08 | | — | |
| USD | | 608 | | EUR | | 409 | | 03/19/08 | | (10 | ) |
| USD | | 607 | | EUR | | 412 | | 03/19/08 | | (4 | ) |
| USD | | 626 | | EUR | | 425 | | 03/19/08 | | (4 | ) |
| USD | | 627 | | EUR | | 427 | | 03/19/08 | | (3 | ) |
| USD | | 886 | | EUR | | 600 | | 03/19/08 | | (8 | ) |
| USD | | 888 | | EUR | | 600 | | 03/19/08 | | (9 | ) |
| USD | | 378 | | GBP | | 190 | | 01/31/08 | | — | |
| USD | | 607 | | GBP | | 294 | | 03/19/08 | | (22 | ) |
| USD | | 626 | | GBP | | 309 | | 03/19/08 | | (13 | ) |
| USD | | 190 | | INR | | 7,507 | | 02/22/08 | | — | |
| USD | | 226 | | INR | | 8,894 | | 02/22/08 | | (1 | ) |
| USD | | 288 | | JPY | | 32,000 | | 01/23/08 | | (1 | ) |
| USD | | 1,431 | | JPY | | 162,510 | | 01/23/08 | | 28 | |
| USD | | 80 | | JPY | | 8,985 | | 03/19/08 | | 1 | |
| USD | | 293 | | JPY | | 31,450 | | 03/19/08 | | (9 | ) |
| USD | | 626 | | JPY | | 68,869 | | 03/19/08 | | (4 | ) |
| USD | | 626 | | JPY | | 69,355 | | 03/19/08 | | — | |
| USD | | 909 | | JPY | | 97,122 | | 03/19/08 | | (32 | ) |
| USD | | 46 | | KRW | | 41,727 | | 01/30/08 | | (1 | ) |
| USD | | 50 | | KRW | | 45,188 | | 01/30/08 | | (2 | ) |
| USD | | 1,531 | | KRW | | 1,396,623 | | 01/30/08 | | (35 | ) |
| USD | | 20 | | MXN | | 216 | | 01/17/08 | | — | |
| USD | | 328 | | MXN | | 3,609 | | 01/17/08 | | 3 | |
| USD | | 81 | | MYR | | 273 | | 02/04/08 | | 2 | |
| USD | | 20 | | PLN | | 50 | | 01/17/08 | | — | |
| USD | | 1,403 | | PLN | | 3,737 | | 01/17/08 | | 115 | |
| USD | | 54 | | RUB | | 1,338 | | 01/11/08 | | 1 | |
| USD | | 60 | | RUB | | 1,484 | | 01/11/08 | | — | |
| USD | | 80 | | SEK | | 528 | | 03/19/08 | | 2 | |
| USD | | 607 | | SEK | | 3,874 | | 03/19/08 | | (7 | ) |
| USD | | 46 | | SGD | | 66 | | 02/20/08 | | — | |
| USD | | 50 | | SGD | | 72 | | 02/20/08 | | — | |
| USD | | 1,580 | | SGD | | 2,301 | | 02/20/08 | | 24 | |
| AUD | | 66 | | USD | | 58 | | 01/31/08 | | — | |
| BRL | | 178 | | USD | | 100 | | 02/06/08 | | 1 | |
| BRL | | 354 | | USD | | 197 | | 02/06/08 | | (1 | ) |
| BRL | | 354 | | USD | | 199 | | 02/06/08 | | 1 | |
| BRL | | 539 | | USD | | 297 | | 02/06/08 | | (4 | ) |
| EUR | | 388 | | NOK | | 3,149 | | 03/19/08 | | 2 | |
| EUR | | 388 | | NOK | | 3,149 | | 03/19/08 | | 9 | |
| EUR | | 811 | | SEK | | 7,573 | | 03/19/08 | | (43 | ) |
| EUR | | 811 | | SEK | | 7,573 | | 03/19/08 | | 28 | |
| | | | | | | | | | | |
| Foreign Currency Exchange Contracts | |
Amount
Sold | | Amount
Bought | | Settlement
Date | | Unrealized
Appreciation
(Depreciation)
$ | |
| | | | | | | | | | | |
| EUR | | 1,076 | | USD | | 1,576 | | 01/17/08 | | 2 | |
| EUR | | 1,095 | | USD | | 1,578 | | 01/17/08 | | (23 | ) |
| EUR | | 15 | | USD | | 23 | | 01/23/08 | | — | |
| EUR | | 99 | | USD | | 142 | | 01/23/08 | | (2 | ) |
| EUR | | 475 | | USD | | 697 | | 01/23/08 | | 2 | |
| EUR | | 414 | | USD | | 607 | | 03/19/08 | | 1 | |
| EUR | | 421 | | USD | | 613 | | 03/19/08 | | (3 | ) |
| EUR | | 439 | | USD | | 639 | | 03/19/08 | | (3 | ) |
| GBP | | 190 | | USD | | 378 | | 01/03/08 | | — | |
| GBP | | 259 | | USD | | 523 | | 01/31/08 | | 8 | |
| GBP | | 122 | | USD | | 251 | | 02/20/08 | | 9 | |
| GBP | | 76 | | USD | | 150 | | 03/19/08 | | — | |
| GBP | | 264 | | USD | | 538 | | 03/19/08 | | 13 | |
| GBP | | 296 | | USD | | 607 | | 03/19/08 | | 19 | |
| GBP | | 301 | | USD | | 618 | | 03/19/08 | | 20 | |
| GBP | | 301 | | USD | | 620 | | 03/19/08 | | 22 | |
| GBP | | 333 | | USD | | 677 | | 03/19/08 | | 16 | |
| GBP | | 602 | | USD | | 1,239 | | 03/19/08 | | 44 | |
| JPY | | 26,941 | | USD | | 246 | | 01/22/08 | | 4 | |
| JPY | | 52,000 | | USD | | 477 | | 01/23/08 | | 10 | |
| JPY | | 58,500 | | USD | | 538 | | 01/23/08 | | 13 | |
| JPY | | 65,882 | | USD | | 607 | | 03/19/08 | | 12 | |
| JPY | | 139,364 | | USD | | 1,254 | | 03/19/08 | | (4 | ) |
| NOK | | 3,368 | | USD | | 607 | | 03/19/08 | | (12 | ) |
| PLN | | 150 | | USD | | 60 | | 01/17/08 | | (1 | ) |
| PLN | | 150 | | USD | | 60 | | 01/17/08 | | (1 | ) |
| PLN | | 283 | | USD | | 114 | | 01/17/08 | | (1 | ) |
| PLN | | 3,205 | | USD | | 1,292 | | 01/17/08 | | (11 | ) |
| RUB | | 163 | | USD | | 7 | | 01/11/08 | | — | |
| RUB | | 217 | | USD | | 9 | | 01/11/08 | | — | |
| RUB | | 616 | | USD | | 25 | | 01/11/08 | | — | |
| RUB | | 616 | | USD | | 25 | | 01/11/08 | | — | |
| SEK | | 3,839 | | USD | | 607 | | 03/19/08 | | 13 | |
| SEK | | 4,019 | | USD | | 626 | | 03/19/08 | | 4 | |
| | | | | | | | | | | |
| | | | | |
| | | | | | | | | | 207 | |
| | | | | | | | | | | |
See accompanying notes which are an integral part of the financial statements.
Russell Investment Funds
Core Bond Fund
Schedule of Investments, continued — December 31, 2007
Amounts in thousands
| | | | | | | | | | | | | | |
| Credit Default Swap Contracts | | | | | | | | | | | | | | |
Reference
Entity | | Counter
Party | | Notional
Amount | | Fund (Pays)/
Receives
Fixed Rate | | | Termination
Date | | Market Value
$ | |
| | | | | | | | | | | | | | |
ABX - HE Index for Sub-Prime Home Equity Sector | | Credit Suisse First Boston | | USD | | 350 | | 0.090 | | | 08/25/37 | | (85 | ) |
ABX - HE Index for Sub-Prime Home Equity Sector | | Credit Suisse First Boston | | USD | | 350 | | 0.090 | | | 08/25/37 | | (85 | ) |
ABX - HE Index for Sub-Prime Home Equity Sector | | Credit Suisse First Boston | | USD | | 300 | | 0.760 | | | 01/25/38 | | (76 | ) |
Anadarko Petroleum Corp. | | Goldman Sachs | | USD | | 100 | | 0.150 | | | 03/20/08 | | — | |
Argentina (REP) | | Deutsche Bank | | USD | | 230 | | (4.786 | ) | | 09/20/12 | | — | |
Argentina (REP) | | Deutsche Bank | | USD | | 220 | | (4.984 | ) | | 09/20/12 | | 1 | |
Argentina (REP) | | JP Morgan | | USD | | 200 | | (5.055 | ) | | 09/20/12 | | 1 | |
Brazil Government International bond | | Deutsche Bank | | USD | | 800 | | (1.500 | ) | | 08/22/11 | | 20 | |
Corning Incorporated | | Morgan Stanley | | USD | | 270 | | (0.320 | ) | | 03/20/13 | | — | |
Countrywide Home Loan | | Lehman Brothers | | USD | | 736 | | 0.480 | | | 06/20/12 | | (188 | ) |
Countrywide Home Loan | | Lehman Brothers | | USD | | 438 | | (0.710 | ) | | 06/20/17 | | (131 | ) |
Dow Jones CDX High Volatility Index | | Citibank | | USD | | 500 | | 2.144 | | | 06/20/12 | | (6 | ) |
Ford Motor Credit Co. | | Barclays Bank PLC | | USD | | 1,000 | | 6.150 | | | 09/20/12 | | (20 | ) |
Ford Motor Credit Co. | | Goldman Sachs | | USD | | 600 | | 5.850 | | | 09/20/12 | | (17 | ) |
Ford Motor Credit Co. | | Lehman Brothers | | USD | | 210 | | (1.100 | ) | | 03/20/08 | | (1 | ) |
Ford Motor Credit Co. | | Lehman Brothers | | USD | | 200 | | (1.200 | ) | | 03/20/08 | | (1 | ) |
Ford Motor Credit Co. | | Lehman Brothers | | USD | | 100 | | 2.200 | | | 03/20/08 | | — | |
Gaz Capital for Gazprom | | Barclays Bank PLC | | USD | | 300 | | 1.600 | | | 12/20/12 | | (1 | ) |
Gaz Capital for Gazprom | | JP Morgan | | USD | | 100 | | 0.970 | | | 11/20/08 | | — | |
General Motors Acceptance Corp. | | Lehman Brothers | | USD | | 500 | | 1.680 | | | 09/20/08 | | (21 | ) |
General Motors Acceptance Corp. | | Merrill Lynch | | USD | | 1,000 | | 1.850 | | | 09/20/09 | | (91 | ) |
General Motors Acceptance Corp. | | Morgan Stanley | | USD | | 1,000 | | 0.970 | | | 09/20/08 | | (47 | ) |
General Motors Corp. | | Citibank | | USD | | 2,000 | | 4.630 | | | 12/20/12 | | (164 | ) |
Indonesia Government International Bond | | Lehman Brothers | | USD | | 100 | | 0.400 | | | 12/20/08 | | — | |
International Paper | | Lehman Brothers | | USD | | 510 | | (0.340 | ) | | 06/20/12 | | (3 | ) |
Lehman Brothers | | JP Morgan | | USD | | 100 | | 0.300 | | | 09/20/08 | | (1 | ) |
Lyondell Chemical Co. | | Lehman Brothers | | USD | | 230 | | (4.025 | ) | | 09/20/12 | | (34 | ) |
MeadWestvaco Corporation | | Lehman Brothers | | USD | | 135 | | (0.740 | ) | | 09/20/12 | | — | |
Mexico Government International Bond | | Lehman Brothers | | USD | | 130 | | (0.630 | ) | | 12/20/12 | | — | |
Mexico Government International Bond | | Lehman Brothers | | USD | | 130 | | (0.490 | ) | | 12/20/12 | | (1 | ) |
Panama Government International Bond | | Morgan Stanley | | USD | | 100 | | 0.750 | | | 01/20/12 | | — | |
Pitney Bowes Inc. | | Lehman Brothers | | USD | | 250 | | (0.220 | ) | | 09/20/12 | | (1 | ) |
Russia Government International Bond | | Morgan Stanley | | USD | | 100 | | 0.245 | | | 06/20/08 | | — | |
Talisman Energy Inc. | | Lehman Brothers | | USD | | 105 | | (0.510 | ) | | 09/20/12 | | — | |
Verizon Communications Inc. | | Lehman Brothers | | USD | | 850 | | (0.180 | ) | | 06/20/12 | | (3 | ) |
Weyerhaeuser Company | | Lehman Brothers | | USD | | 255 | | (0.700 | ) | | 09/20/12 | | 2 | |
| | | | | | | | | | | | | | |
| | |
Total Market Value of Open Credit Default Swap Contracts
Premiums Paid (Received) - ($230) | | | | | (953 | ) |
| | | | | | | | | | | | | | |
See accompanying notes which are an integral part of the financial statements.
Russell Investment Funds
Core Bond Fund
Schedule of Investments, continued — December 31, 2007
Amounts in thousands
| | | | | | | | | | | | | |
| Interest Rate Swaps Contracts | |
Counter
Party | | Notional
Amount | | Fund Receives | | Fund Pays | | Termination
Date | | Market Value
$ | |
| | | | | | | | | | | | | |
Bank of America | | USD | | 400 | | 5.000% | | Three Month LIBOR | | 06/18/10 | | 10 | |
Bank of America | | USD | | 5,200 | | 4.000% | | Three Month LIBOR | | 06/18/10 | | 32 | |
Bank of America | | USD | | 6,500 | | 5.473% | | Three Month LIBOR | | 06/14/11 | | 305 | |
Bank of America | | USD | | 1,000 | | 4.000% | | Three Month LIBOR | | 06/18/13 | | (9 | ) |
Bank of America | | USD | | 2,000 | | 4.500% | | Three Month LIBOR | | 06/18/13 | | 25 | |
Bank of America | | USD | | 4,400 | | 4.500% | | Three Month LIBOR | | 06/18/13 | | 56 | |
Bank of America | | USD | | 1,800 | | 5.548% | | Three Month LIBOR | | 06/14/16 | | 124 | |
Bank of America | | USD | | 1,500 | | 5.548% | | Three Month LIBOR | | 06/14/16 | | 138 | |
Bank of America | | USD | | 800 | | Three Month LIBOR | | 5.000% | | 06/18/38 | | 4 | |
Barclays Bank PLC | | GBP | | 100 | | 6.000% | | Six Month LIBOR | | 12/20/08 | | 1 | |
Barclays Bank PLC | | BRL | | 100 | | 11.360% | | Brazil Interbank Deposit Rate | | 01/04/10 | | (1 | ) |
Barclays Bank PLC | | USD | | 1,300 | | 4.000% | | Three Month LIBOR | | 06/18/10 | | 8 | |
Barclays Bank PLC | | EUR | | 4,705 | | Six Month LIBOR | | 4.250% | | 06/18/13 | | 87 | |
Barclays Bank PLC | | JPY | | 10,000 | | 2.000% | | Six Month LIBOR | | 12/19/17 | | 3 | |
Barclays Bank PLC | | GBP | | 530 | | Six Month LIBOR | | 5.250% | | 06/18/18 | | (25 | ) |
Barclays Bank PLC | | SEK | | 14,700 | | Three Month LIBOR | | 4.750% | | 06/18/18 | | 33 | |
Bear Stearns | | USD | | 2,800 | | Three Month LIBOR | | 5.282% | | 08/20/12 | | (169 | ) |
Bear Stearns | | USD | | 1,600 | | Three Month LIBOR | | 5.000% | | 06/18/18 | | (37 | ) |
Bear Stearns | | USD | | 1,600 | | 5.250% | | Three Month LIBOR | | 06/18/28 | | 50 | |
BNP Paribas | | EUR | | 500 | | 2.090% | | Consumer Price Index (France) | | 10/15/10 | | 3 | |
Citibank | | USD | | 1,000 | | 4.000% | | Three Month LIBOR | | 06/18/13 | | (9 | ) |
Citibank | | GBP | | 1,260 | | 5.250% | | Six Month LIBOR | | 06/18/13 | | 28 | |
Citibank | | USD | | 300 | | Three Month LIBOR | | 5.000% | | 06/18/38 | | 1 | |
Credit Suisse First Boston | | GBP | | 100 | | 5.000% | | Six Month LIBOR | | 06/15/09 | | (1 | ) |
Credit Suisse First Boston | | EUR | | 725 | | Six Month LIBOR | | 4.250% | | 06/18/10 | | 3 | |
Credit Suisse First Boston | | USD | | 2,150 | | Three Month LIBOR | | 4.500% | | 06/18/13 | | (27 | ) |
Credit Suisse First Boston | | EUR | | 1,780 | | Six Month LIBOR | | 4.500% | | 06/18/18 | | 46 | |
Credit Suisse First Boston | | EUR | | 3,330 | | 4.500% | | Six Month LIBOR | | 06/18/18 | | (87 | ) |
Credit Suisse First Boston | | SEK | | 15,000 | | Three Month LIBOR | | 4.750% | | 06/18/18 | | 33 | |
Credit Suisse First Boston | | EUR | | 390 | | 4.750% | | Six Month LIBOR | | 06/18/38 | | (12 | ) |
Deutsche Bank | | USD | | 3,100 | | 4.000% | | Three Month LIBOR | | 06/18/10 | | 19 | |
Deutsche Bank | | USD | | 8,280 | | Three Month LIBOR | | 4.315% | | 11/17/10 | | (84 | ) |
Deutsche Bank | | JPY | | 105,000 | | 1.183% | | Six Month LIBOR | | 12/17/10 | | 3 | |
Deutsche Bank | | JPY | | 139,000 | | 1.170% | | Six Month LIBOR | | 12/17/10 | | 4 | |
Deutsche Bank | | JPY | | 139,000 | | 1.160% | | Six Month LIBOR | | 12/17/10 | | 3 | |
Deutsche Bank | | JPY | | 276,000 | | 1.181% | | Six Month LIBOR | | 12/17/10 | | 8 | |
Deutsche Bank | | JPY | | 290,000 | | 1.183% | | Six Month LIBOR | | 12/17/10 | | 8 | |
Deutsche Bank | | USD | | 3,090 | | Three Month LIBOR | | 3.780% | | 12/24/10 | | 2 | |
Deutsche Bank | | USD | | 1,520 | | Three Month LIBOR | | 4.000% | | 12/29/10 | | (5 | ) |
Deutsche Bank | | USD | | 2,290 | | Three Month LIBOR | | 3.868% | | 12/29/10 | | (2 | ) |
Deutsche Bank | | AUD | | 280 | | 7.250% | | Six Month LIBOR | | 06/18/13 | | (3 | ) |
Deutsche Bank | | USD | | 3,700 | | 4.500% | | Three Month LIBOR | | 06/18/13 | | 47 | |
Deutsche Bank | | USD | | 5,700 | | 4.500% | | Three Month LIBOR | | 06/18/13 | | 72 | |
Deutsche Bank | | USD | | 7,300 | | 4.920% | | Three Month LIBOR | | 11/17/15 | | 153 | |
Deutsche Bank | | JPY | | 67,000 | | Six Month LIBOR | | 1.703% | | 12/17/15 | | (6 | ) |
Deutsche Bank | | JPY | | 88,000 | | Six Month LIBOR | | 1.670% | | 12/17/15 | | (7 | ) |
See accompanying notes which are an integral part of the financial statements.
Russell Investment Funds
Core Bond Fund
Schedule of Investments, continued — December 31, 2007
Amounts in thousands
| | | | | | | | | | | | | |
| Interest Rate Swaps Contracts | |
Counter
Party | | Notional
Amount | | Fund Receives | | Fund Pays | | Termination
Date | | Market Value
$ | |
| | | | | | | | | | | | | |
Deutsche Bank | | JPY | | 88,000 | | Six Month LIBOR | | 1.641% | | 12/17/15 | | (5 | ) |
Deutsche Bank | | JPY | | 175,000 | | Six Month LIBOR | | 1.699% | | 12/17/15 | | (16 | ) |
Deutsche Bank | | JPY | | 184,000 | | Six Month LIBOR | | 1.691% | | 12/17/15 | | (16 | ) |
Deutsche Bank | | USD | | 2,700 | | 4.520% | | Three Month LIBOR | | 12/24/15 | | (10 | ) |
Deutsche Bank | | USD | | 1,300 | | 4.745% | | Three Month LIBOR | | 12/29/15 | | 12 | |
Deutsche Bank | | USD | | 2,000 | | 4.630% | | Three Month LIBOR | | 12/29/15 | | 5 | |
Deutsche Bank | | JPY | | 30,000 | | 2.000% | | Six Month LIBOR | | 12/19/17 | | 8 | |
Deutsche Bank | | USD | | 2,700 | | 5.250% | | Three Month LIBOR | | 06/18/23 | | 95 | |
Deutsche Bank | | EUR | | 390 | | Six Month LIBOR | | 4.750% | | 06/18/38 | | 12 | |
Deutsche Bank | | USD | | 2,040 | | Three Month LIBOR | | 5.309% | | 11/17/38 | | (74 | ) |
Deutsche Bank | | JPY | | 14,000 | | 2.595% | | Six Month LIBOR | | 12/17/38 | | 2 | |
Deutsche Bank | | JPY | | 18,000 | | 2.570% | | Six Month LIBOR | | 12/17/38 | | 2 | |
Deutsche Bank | | JPY | | 18,000 | | 2.540% | | Six Month LIBOR | | 12/17/38 | | 1 | |
Deutsche Bank | | JPY | | 35,000 | | 2.594% | | Six Month LIBOR | | 12/17/38 | | 5 | |
Deutsche Bank | | JPY | | 37,000 | | 2.585% | | Six Month LIBOR | | 12/17/38 | | 5 | |
Deutsche Bank | | USD | | 740 | | Three Month LIBOR | | 5.011% | | 12/24/38 | | 7 | |
Deutsche Bank | | USD | | 370 | | Three Month LIBOR | | 5.215% | | 12/29/38 | | (8 | ) |
Deutsche Bank | | USD | | 550 | | Three Month LIBOR | | 5.121% | | 12/29/38 | | (4 | ) |
Goldman Sachs | | GBP | | 900 | | 5.000% | | Six Month LIBOR | | 06/15/09 | | (11 | ) |
Goldman Sachs | | GBP | | 500 | | 6.000% | | Six Month LIBOR | | 06/19/09 | | 9 | |
Goldman Sachs | | MXN | | 1,500 | | 7.780% | | Mexico Interbank 28 Day Deposit Rate | | 04/03/12 | | (3 | ) |
JP Morgan | | BRL | | 2,800 | | 12.700% | | Brazil Interbank Deposit Rate | | 01/04/10 | | — | |
JP Morgan | | BRL | | 3,200 | | 12.700% | | Brazil Interbank Deposit Rate | | 01/04/10 | | — | |
JP Morgan | | EUR | | 500 | | 4.500% | | Six Month LIBOR | | 03/19/10 | | 1 | |
JP Morgan | | USD | | 5,500 | | 4.500% | | Three Month LIBOR | | 06/18/11 | | 94 | |
JP Morgan | | EUR | | 500 | | 1.958% | | Consumer Price Index (France) | | 04/10/12 | | (10 | ) |
JP Morgan | | USD | | 3,500 | | 4.500% | | Three Month LIBOR | | 06/18/13 | | 44 | |
JP Morgan | | USD | | 3,500 | | 4.500% | | Three Month LIBOR | | 06/18/13 | | 44 | |
JP Morgan | | USD | | 6,000 | | 4.500% | | Three Month LIBOR | | 06/18/13 | | 76 | |
JP Morgan | | USD | | 2,600 | | 5.000% | | Three Month LIBOR | | 06/18/15 | | 83 | |
JP Morgan | | USD | | 6,900 | | 5.000% | | Three Month LIBOR | | 06/18/15 | | 219 | |
JP Morgan | | USD | | 400 | | 5.000% | | Three Month LIBOR | | 06/18/18 | | 9 | |
JP Morgan | | USD | | 600 | | 5.000% | | Three Month LIBOR | | 06/18/18 | | 14 | |
JP Morgan | | USD | | 800 | | 5.000% | | Three Month LIBOR | | 06/18/18 | | 19 | |
JP Morgan | | USD | | 800 | | Three Month LIBOR | | 5.250% | | 06/18/28 | | (25 | ) |
JP Morgan | | USD | | 1,600 | | Three Month LIBOR | | 5.250% | | 06/18/28 | | (51 | ) |
JP Morgan | | USD | | 1,000 | | 5.250% | | Three Month LIBOR | | 06/18/38 | | 33 | |
Lehman Brothers | | JPY | | 241,000 | | 1.188 | | Six Month LIBOR | | 12/17/10 | | 7 | |
Lehman Brothers | | JPY | | 153,000 | | Six Month LIBOR | | 1.709% | | 12/17/15 | | (15 | ) |
Lehman Brothers | | USD | | 2,430 | | Three Month LIBOR | | 4.603% | | 03/01/18 | | (92 | ) |
Lehman Brothers | | JPY | | 31,000 | | 2.648% | | Six Month LIBOR | | 12/17/38 | | 8 | |
Louis Pauls & Co. | | USD | | 1,600 | | 4.000% | | Three Month LIBOR | | 06/18/10 | | 10 | |
Merrill Lynch | | BRL | | 200 | | 12.948% | | Brazil Interbank Deposit Rate | | 01/04/10 | | 1 | |
Merrill Lynch | | BRL | | 700 | | 11.980% | | Brazil Interbank Deposit Rate | | 01/02/12 | | (8 | ) |
Merrill Lynch | | GBP | | 100 | | Six Month LIBOR | | 4.000% | | 12/15/35 | | 8 | |
See accompanying notes which are an integral part of the financial statements.
Russell Investment Funds
Core Bond Fund
Schedule of Investments, continued — December 31, 2007
Amounts in thousands
| | | | | | | | | | | | | |
| Interest Rate Swaps Contracts | |
Counter
Party | | Notional
Amount | | Fund Receives | | Fund Pays | | Termination
Date | | Market Value
$ | |
| | | | | | | | | | | | | |
Morgan Stanley | | EUR | | 300 | | 4.500% | | Six Month LIBOR | | 03/19/10 | | — | |
Morgan Stanley | | USD | | 400 | | Three Month LIBOR | | 5.000% | | 12/19/17 | | (10 | ) |
Royal Bank of Scotland | | USD | | 4,100 | | 4.000% | | Three Month LIBOR | | 06/18/10 | | 26 | |
Royal Bank of Scotland | | EUR | | 100 | | 1.955% | | Consumer Price Index (France) | | 03/28/12 | | (2 | ) |
Royal Bank of Scotland | | GBP | | 100 | | Six Month LIBOR | | 4.000% | | 12/15/36 | | 20 | |
Royal Bank of Scotland | | USD | | 200 | | Three Month LIBOR | | 5.000% | | 06/18/38 | | 1 | |
UBS | | AUD | | 2,700 | | 7.000% | | Three Month LIBOR | | 09/15/09 | | (12 | ) |
UBS | | BRL | | 900 | | 10.575% | | Brazil Interbank Deposit Rate | | 01/02/12 | | (30 | ) |
UBS | | GBP | | 670 | | 5.250% | | Six Month LIBOR | | 06/18/13 | | 15 | |
| | | | | | | | | | | | | |
| | | |
Total Market Value of Open Interest Rate Swap Contracts
Premiums Paid (Received) - $696 | | | | | | 1,318 | |
| | | | | | | | | | | | | |
| | | | | | | | | | | |
| Index Swap Contract | |
Fund Receives
Underlying Security | | Counter
Party | | Notional
Amount
$ | | Fund Pays
Floating Rate | | Termination
Date | | Unrealized
Appreciation
(Depreciation)
$ | |
| | | | | | | | | | | |
CMBS AAA 10 Yr. Index | | Bank of America | | 1,000 | | CMBS AAA 10 Yr.
Index minus 0.075% | | 01/31/08 | | 15 | |
CMBS AAA 10 Yr. Index | | Bank of America | | 1,000 | | CMBS AAA 10 Yr.
Index minus 0.100% | | 01/31/08 | | 15 | |
CMBS AAA 10 Yr. Index | | Bank of America | | 1,000 | | CMBS AAA 10 Yr.
Index plus 0.140% | | 01/31/08 | | 17 | |
CMBS AAA 10 Yr. Index | | Bank of America | | 1,000 | | CMBS AAA 10 Yr.
Index minus 0.500% | | 01/31/08 | | (15 | ) |
CMBS AAA 10 Yr. Index | | Bank of America | | 1,000 | | CMBS AAA 10 Yr.
Index minus 0.250% | | 02/29/08 | | (15 | ) |
CMBS AAA 10 Yr. Index | | Bank of America | | 1,000 | | CMBS AAA 10 Yr.
Index minus 0.100% | | 02/29/08 | | 15 | |
CMBS AAA 10 Yr. Index | | Deutsche Bank | | 400 | | CMBS AAA 10 Yr.
Index minus 0.500% | | 01/31/08 | | (6 | ) |
CMBS AAA 10 Yr. Index | | Deutsche Bank | | 300 | | CMBS AAA 10 Yr.
Index minus 1.00% | | 05/30/08 | | 4 | |
CMBS AAA 10 Yr. Index | | JP Morgan | | 600 | | CMBS AAA 10 Yr.
Index plus 0.025% | | 01/31/08 | | (9 | ) |
CMBS AAA 10 Yr. Index | | JP Morgan | | 1,000 | | CMBS AAA 10 Yr.
Index plus 0.100% | | 01/31/08 | | 15 | |
CMBS AAA 10 Yr. Index | | JP Morgan | | 1,000 | | CMBS AAA 10 Yr.
Index minus 0.300% | | 01/31/08 | | 15 | |
| | | | | | | | | | | |
| |
Total Unrealized Appreciation (Depreciation) on Open Index Swap Contracts | | 51 | |
| | | | | | | | | | | |
See accompanying notes which are an integral part of the financial statements.
Russell Investment Funds
Core Bond Fund
Presentation of Portfolio Holdings — December 31, 2007
| | | |
| Categories | | % of Net
Assets | |
| | | |
| | | |
Asset-Backed Securities | | 3.6 | |
Certificates of Deposit | | 0.2 | |
Corporate Bonds and Notes | | 19.0 | |
International Debt | | 6.4 | |
Loan Agreements | | 0.3 | |
Mortgage-Backed Securities | | 54.5 | |
Municipal Bonds | | 0.4 | |
Non-US Bonds | | 0.3 | |
United States Government Agencies | | 3.0 | |
United States Government Treasuries | | 2.9 | |
Preferred Stocks | | 0.3 | |
Options Purchased | | 0.4 | |
Short-Term Investments | | 15.3 | |
Other Securities | | 8.3 | |
| | | |
| |
Total Investments | | 114.9 | |
Other Assets and Liabilities, Net | | (14.9 | ) |
| | | |
| |
| | 100.0 | |
| | | |
| |
Futures Contracts | | 0.7 | |
Options Written | | (0.3 | ) |
Foreign Currency Exchange Contracts | | 0.1 | * |
Credit Default Swap Contracts | | (0.3 | )* |
Interest Rate Swap Contracts | | 0.4 | |
Index Swap Contracts | | — | * |
| * | Less than .05% of net assets |
See accompanying notes which are an integral part of the financial statements.
Russell Investment Funds
Notes to Schedules of Investments — December 31, 2007
Footnotes:
| (Æ) | Nonincome-producing security. |
| (ö) | Real Estate Investment Trust (REIT). |
| (§) | All or a portion of the shares of this security are held as collateral in connection with futures contracts purchased (sold), options written, or swaps entered into by the Fund. |
| (ž) | Rate noted is yield-to-maturity from date of acquisition. |
| (ç) | At amortized cost, which approximates market. |
| (Ê) | Adjustable or floating rate security. Rate shown reflects rate in effect at period end. |
| (ƒ) | Perpetual floating rate security. Rate shown reflects rate in effect at period end. |
| (m) | Bond is insured by a guarantor. |
| (æ) | Pre-refunded: These bonds are collateralized by US Treasury securities, which are held in escrow by a trustee and used to pay principal and interest in the tax-exempt issue and to retire the bonds in full at the earliest refunding date. The rate noted is for descriptive purposes; effective yield may vary. |
| (×) | The security is purchased with the cash collateral from the securities loaned. |
| (Ñ) | All or a portion of the shares of this security are on loan. |
| (Þ) | Restricted security. Security may have contractual restrictions on resale, may have been offered in a private placement transaction, and may not be registered under the Securities Act of 1933. |
| (Å) | Illiquid and restricted security. |
| (å) | Currency balances were held in connection with futures contracts purchased (sold), options written, or swaps entered into by the Fund. See Note 2. |
Abbreviations:
144A - Represents private placement security for qualified buyers according to rule 144A of the Securities Act of 1933.
ADR - American Depositary Receipt
ADS - American Depositary Share
CIBOR - Copenhagen Interbank Offered Rate
CME - Chicago Mercantile Exchange
CMO - Collateralized Mortgage Obligation
CVO - Contingent Value Obligation
FDIC - Federal Deposit Insurance Company
GDR - Global Depositary Receipt
GDS - Global Depositary Share
LIBOR - London Interbank Offered Rate
NIBOR - Norwegian Interbank Offered Rate
PIK - Payment in Kind
REMIC - Real Estate Mortgage Investment Conduit
STRIP - Separate Trading of Registered Interest and Principal of Securities
TBA - To Be Announced Security
Foreign Currency Abbreviations:
| | | | |
ARS - Argentine peso | | HKD - Hong Kong dollar | | PLN - Polish zloty |
AUD - Australian dollar | | HUF - Hungarian forint | | RUB - Russian ruble |
BRL - Brazilian real | | IDR - Indonesian rupiah | | SEK - Swedish krona |
CAD - Canadian dollar | | ILS - Israeli shekel | | SGD - Singapore dollar |
CHF - Swiss franc | | INR - Indian rupee | | SKK - Slovakian koruna |
CLP - Chilean peso | | JPY - Japanese yen | | THB - Thai baht |
CNY - Chinese renminbi yuan | | KES - Kenyan schilling | | TRY - Turkish lira |
COP - Colombian peso | | KRW - South Korean won | | TWD - Taiwanese dollar |
CRC - Costa Rica colon | | MXN - Mexican peso | | USD - United States dollar |
CZK - Czech koruna | | MYR - Malaysian ringgit | | VEB - Venezuelan bolivar |
DKK - Danish krone | | NOK - Norweigian Krone | | VND - Vietnamese dong |
EGP - Egyptian pound | | NZD - New Zealand dollar | | ZAR - South African rand |
EUR - Euro | | PEN - Peruvian nouveau sol | | |
GBP - British pound sterling | | PHP - Philippine peso | | |
| | |
| Notes to Schedules of Investments | | 91 |
Russell Investment Funds
Statements of Assets and Liabilities — December 31, 2007
| | | | | | | | | | | | | | | |
| Amounts in thousands | | Multi-Style Equity
Fund | | Aggressive Equity
Fund | | Non-U.S.
Fund | | Real Estate
Securities Fund | | Core Bond
Fund |
| | | | | | | | | | | | | | | |
Assets | | | | | | | | | | | | | | | |
Investments, at identified cost | | $ | 543,342 | | $ | 316,836 | | $ | 419,766 | | $ | 514,543 | | $ | 395,758 |
Investments, at market*** | | | 590,492 | | | 327,183 | | | 466,998 | | | 582,935 | | | 397,708 |
Cash | | | 83 | | | 251 | | | 85 | | | 113 | | | 2,857 |
Cash (restricted) | | | — | | | — | | | 2,630 | | | — | | | 1,338 |
Foreign currency holdings* | | | — | | | — | | | 364 | | | 252 | | | 683 |
Unrealized appreciation on foreign currency exchange contracts | | | — | | | — | | | 1,226 | | | — | | | 481 |
Receivables: | | | | | | | | | | | | | | | |
Dividends and interest | | | 584 | | | 268 | | | 388 | | | 4,341 | | | 2,481 |
Dividends from affiliated money market funds | | | 85 | | | 36 | | | 134 | | | 60 | | | 109 |
Investments sold | | | 1,611 | | | 2,080 | | | 910 | | | 1,799 | | | 19,468 |
Fund shares sold | | | 872 | | | 340 | | | 469 | | | 214 | | | 404 |
Foreign taxes recoverable | | | — | | | — | | | 27 | | | — | | | — |
Daily variation margin on futures contracts | | | — | | | — | | | 43 | | | — | | | 680 |
Prepaid expenses | | | — | | | — | | | — | | | 1 | | | 11 |
Unrealized appreciation on index swap contracts | | | — | | | — | | | 11 | | | — | | | 96 |
Interest rate swap contracts, at market value**** | | | — | | | — | | | — | | | — | | | 2,204 |
Credit default swap contracts, at market value***** | | | — | | | — | | | — | | | — | | | 24 |
| | | | | | | | | | | | | | | |
Total assets | | | 593,727 | | | 330,158 | | | 473,285 | | | 589,715 | | | 428,544 |
| | | | | | | | | | | | | | | |
| | | | | |
| Liabilities | | | | | | | | | | | | | | | |
Payables: | | | | | | | | | | | | | | | |
Investments purchased | | | 2,697 | | | 3,113 | | | 741 | | | 3,929 | | | 50,170 |
Fund shares redeemed | | | 130 | | | 40 | | | 59 | | | 26 | | | 21 |
Accrued fees to affiliates | | | 340 | | | 209 | | | 406 | | | 368 | | | 177 |
Other accrued expenses | | | 47 | | | 40 | | | 102 | | | 46 | | | 59 |
Daily variation margin on futures contracts | | | 102 | | | 12 | | | 60 | | | — | | | 117 |
Unrealized depreciation on foreign currency exchange contracts | | | — | | | — | | | 923 | | | — | | | 274 |
Options written, at market value** | | | — | | | — | | | 97 | | | — | | | 1,054 |
Payable upon return of securities loaned | | | 110,489 | | | 97,817 | | | 39,195 | | | 96,537 | | | 28,697 |
Unrealized depreciation on index swap contracts | | | — | | | — | | | 16 | | | — | | | 45 |
Interest rate swap contracts, at market value**** | | | — | | | — | | | — | | | — | | | 886 |
Credit default swap contracts, at market value***** | | | — | | | — | | | — | | | — | | | 977 |
| | | | | | | | | | | | | | | |
Total liabilities | | | 113,805 | | | 101,231 | | | 41,599 | | | 100,906 | | | 82,477 |
| | | | | | | | | | | | | | | |
| | | | | | | | | | | | | | | |
Net Assets | | $ | 479,922 | | $ | 228,927 | | $ | 431,686 | | $ | 488,809 | | $ | 346,067 |
| | | | | | | | | | | | | | | |
See accompanying notes which are an integral part of the financial statements.
| | |
| 92 | | Statements of Assets and Liabilities |
Russell Investment Funds
Statements of Assets and Liabilities, continued — December 31, 2007
| | | | | | | | | | | | | | | | | | | | |
| Amounts in thousands | | Multi-Style Equity
Fund | | | Aggressive Equity
Fund | | | Non-U.S.
Fund | | | Real Estate
Securities Fund | | | Core Bond
Fund | |
| | | | | | | | | | | | | | | | | | | | |
Net Assets Consist of: | | | | | | | | | | | | | | | | | | | | |
Undistributed (overdistributed) net investment income | | $ | 1,423 | | | $ | — | | | $ | (1,232 | ) | | $ | (62 | ) | | $ | 14 | |
Accumulated net realized gain (loss) | | | 13 | | | | (1,990 | ) | | | 2,007 | | | | (8,145 | ) | | | (608 | ) |
Unrealized appreciation (depreciation) on: | | | | | | | | | | | | | | | | | | | | |
Investments | | | 47,150 | | | | 10,347 | | | | 47,232 | | | | 68,392 | | | | 1,950 | |
Futures contracts | | | (298 | ) | | | (30 | ) | | | (375 | ) | | | — | | | | 2,593 | |
Options written | | | — | | | | — | | | | (2 | ) | | | — | | | | (732 | ) |
Credit default swap contracts | | | — | | | | — | | | | — | | | | — | | | | (723 | ) |
Index swap contracts | | | — | | | | — | | | | (5 | ) | | | — | | | | 51 | |
Interest rate swap contracts | | | — | | | | — | | | | — | | | | — | | | | 622 | |
Foreign currency-related transactions | | | — | | | | — | | | | 298 | | | | 2 | | | | 210 | |
Shares of beneficial interest | | | 307 | | | | 176 | | | | 327 | | | | 321 | | | | 335 | |
Additional paid-in capital | | | 431,327 | | | | 220,424 | | | | 383,436 | | | | 428,301 | | | | 342,355 | |
| | | | | | | | | | | | | | | | | | | | |
Net Assets | | $ | 479,922 | | | $ | 228,927 | | | $ | 431,686 | | | $ | 488,809 | | | $ | 346,067 | |
| | | | | | | | | | | | | | | | | | | | |
| | | | | |
Net Asset Value, offering and redemption price per share: | | | | | | | | | | | | | | | | | | | | |
Net asset value per share****** | | $ | 15.65 | | | $ | 12.99 | | | $ | 13.20 | | | $ | 15.22 | | | $ | 10.32 | |
Net assets | | $ | 479,922,297 | | | $ | 228,927,258 | | | $ | 431,685,687 | | | $ | 488,808,592 | | | $ | 346,066,761 | |
Shares outstanding ($.01 par value) | | | 30,673,212 | | | | 17,617,417 | | | | 32,707,648 | | | | 32,109,017 | | | | 33,539,726 | |
| Amounts in thousands | | | | | | | | | | | | | | | | | | | | |
* Foreign currency holdings - cost | | $ | — | | | $ | — | | | $ | 364 | | | $ | 249 | | | $ | 682 | |
** Premiums received on options written | | $ | — | | | $ | — | | | $ | 95 | | | $ | — | | | $ | 322 | |
*** Securities on loan included in investments | | $ | 107,444 | | | $ | 95,572 | | | $ | 38,412 | | | $ | 104,671 | | | $ | 28,128 | |
**** Interest rate swap contracts - premiums paid (received) | | $ | — | | | $ | — | | | $ | — | | | $ | — | | | $ | 696 | |
***** Credit default swap contracts - premiums paid (received) | | $ | — | | | $ | — | | | $ | — | | | $ | — | | | $ | (230 | ) |
****** Net asset value per share equals net assets divided by shares of beneficial interest outstanding. | |
See accompanying notes which are an integral part of the financial statements.
| | |
| Statements of Assets and Liabilities | | 93 |
Russell Investment Funds
Statements of Operations — For the Year Ended December 31, 2007
| | | | | | | | | | | | | | | | | | | | |
| Amounts in thousands | | Multi-Style Equity
Fund | | | Aggressive Equity
Fund | | | Non-U.S.
Fund | | | Real Estate
Securities Fund | | | Core Bond
Fund | |
| | | | | | | | | | | | | | | | | | | | |
Investment Income | | | | | | | | | | | | | | | | | | | | |
Dividends | | $ | 7,344 | | | $ | 2,641 | | | $ | 10,431 | | | $ | 14,907 | | | $ | 81 | |
Dividends from affiliated money market funds | | | 1,103 | | | | 422 | | | | 1,655 | | | | 839 | | | | 1,284 | |
Interest | | | 54 | | | | 45 | | | | 89 | | | | — | | | | 15,678 | |
Securities lending income | | | 215 | | | | 280 | | | | 320 | | | | 200 | | | | 63 | |
Less foreign taxes withheld | | | — | | | | — | | | | (790 | ) | | | — | | | | — | |
| | | | | | | | | | | | | | | | | | | | |
Total investment income | | | 8,716 | | | | 3,388 | | | | 11,705 | | | | 15,946 | | | | 17,106 | |
| | | | | | | | | | | | | | | | | | | | |
| | | | | |
Expenses | | | | | | | | | | | | | | | | | | | | |
Management fees | | | 3,565 | | | | 2,228 | | | | 3,894 | | | | 5,084 | | | | 1,805 | |
Custodian fees | | | 269 | | | | 323 | | | | 750 | | | | 214 | | | | 418 | |
Transfer agent fees | | | 20 | | | | 11 | | | | 18 | | | | 26 | | | | 13 | |
Professional fees | | | 47 | | | | 44 | | | | 68 | | | | 50 | | | | 41 | |
Trustees’ fees | | | 8 | | | | 4 | | | | 7 | | | | 11 | | | | 6 | |
Printing fees | | | 8 | | | | 5 | | | | 9 | | | | 13 | | | | 6 | |
Miscellaneous | | | 78 | | | | 41 | | | | 93 | | | | 109 | | | | 51 | |
| | | | | | | | | | | | | | | | | | | | |
Expenses before reductions | | | 3,995 | | | | 2,656 | | | | 4,839 | | | | 5,507 | | | | 2,340 | |
Expense reductions | | | (19 | ) | | | (193 | ) | | | (125 | ) | | | (4 | ) | | | (234 | ) |
| | | | | | | | | | | | | | | | | | | | |
Net expenses | | | 3,976 | | | | 2,463 | | | | 4,714 | | | | 5,503 | | | | 2,106 | |
| | | | | | | | | | | | | | | | | | | | |
Net investment income (loss) | | | 4,740 | | | | 925 | | | | 6,991 | | | | 10,443 | | | | 15,000 | |
| | | | | | | | | | | | | | | | | | | | |
| | | | | |
Net Realized and Unrealized Gain (Loss) | | | | | | | | | | | | | | | | | | | | |
Net realized gain (loss) on: | | | | | | | | | | | | | | | | | | | | |
Investments | | | 41,863 | | | | 19,396 | | | | 45,598 | | | | 51,285 | | | | 1,820 | |
Futures contracts | | | 567 | | | | (226 | ) | | | 1,638 | | | | — | | | | (35 | ) |
Options written | | | — | | | | — | | | | (1,074 | ) | | | — | | | | (92 | ) |
Credit default swap contracts | | | — | | | | — | | | | — | | | | — | | | | 360 | |
Index swap contracts | | | — | | | | — | | | | (159 | ) | | | — | | | | 31 | |
Interest rate swap contracts | | | — | | | | — | | | | — | | | | — | | | | 1,271 | |
Foreign currency-related transactions | | | — | | | | — | | | | 1,879 | | | | 64 | | | | 475 | |
| | | | | | | | | | | | | | | | | | | | |
Net realized gain (loss) | | | 42,430 | | | | 19,170 | | | | 47,882 | | | | 51,349 | | | | 3,830 | |
| | | | | | | | | | | | | | | | | | | | |
Net change in unrealized appreciation (depreciation) on: | | | | | | | | | | | | | | | | | | | | |
Investments | | | (2,937 | ) | | | (12,067 | ) | | | (15,784 | ) | | | (159,353 | ) | | | 478 | |
Futures contracts | | | (145 | ) | | | 37 | | | | (826 | ) | | | — | | | | 2,933 | |
Options written | | | — | | | | — | | | | 9 | | | | — | | | | (623 | ) |
Credit default swap contracts | | | — | | | | — | | | | — | | | | — | | | | (813 | ) |
Index swap contracts | | | — | | | | — | | | | (5 | ) | | | — | | | | 31 | |
Interest rate swap contracts | | | — | | | | — | | | | — | | | | — | | | | 930 | |
Foreign currency-related transactions | | | — | | | | — | | | | 405 | | | | 2 | | | | 107 | |
| | | | | | | | | | | | | | | | | | | | |
Net change in unrealized appreciation (depreciation) | | | (3,082 | ) | | | (12,030 | ) | | | (16,201 | ) | | | (159,351 | ) | | | 3,043 | |
| | | | | | | | | | | | | | | | | | | | |
Net realized and unrealized gain (loss) | | | 39,348 | | | | 7,140 | | | | 31,681 | | | | (108,002 | ) | | | 6,873 | |
| | | | | | | | | | | | | | | | | | | | |
Net Increase (Decrease) in Net Assets from Operations | | $ | 44,088 | | | $ | 8,065 | | | $ | 38,672 | | | $ | (97,559 | ) | | $ | 21,873 | |
| | | | | | | | | | | | | | | | | | | | |
See accompanying notes which are an integral part of the financial statements.
| | |
| 94 | | Statements of Operations |
(This page intentionally left blank)
Russell Investment Funds
Statements of Changes in Net Assets — For the Year Ended December 31, 2007
| | | | | | | | | | | | | | | | |
| | | Multi-Style Equity
Fund | | | Aggressive Equity
Fund | |
| | | | | | | | | | | | | | | | |
| Amounts in thousands | | 2007 | | | 2006 | | | 2007 | | | 2006 | |
Increase (Decrease) in Net Assets | | | | | | | | | | | | | | | | |
| | | | |
Operations | | | | | | | | | | | | | | | | |
Net investment income (loss) | | $ | 4,740 | | | $ | 3,896 | | | $ | 925 | | | $ | 352 | |
Net realized gain (loss) | | | 42,430 | | | | 28,237 | | | | 19,170 | | | | 36,184 | |
Net change in unrealized appreciation (depreciation) | | | (3,082 | ) | | | 13,801 | | | | (12,030 | ) | | | (6,802 | ) |
| | | | | | | | | | | | | | | | |
Net increase (decrease) in net assets from operations | | | 44,088 | | | | 45,934 | | | | 8,065 | | | | 29,734 | |
| | | | | | | | | | | | | | | | |
| | | | |
Distributions | | | | | | | | | | | | | | | | |
From net investment income | | | (4,459 | ) | | | (3,606 | ) | | | (866 | ) | | | (423 | ) |
From net realized gain | | | (19,120 | ) | | | — | | | | (29,590 | ) | | | (30,314 | ) |
| | | | | | | | | | | | | | | | |
Net decrease in net assets from distributions | | | (23,579 | ) | | | (3,606 | ) | | | (30,456 | ) | | | (30,737 | ) |
| | | | | | | | | | | | | | | | |
| | | | |
Share Transactions | | | | | | | | | | | | | | | | |
Net increase (decrease) in net assets from share transactions | | | 41,906 | | | | 25,520 | | | | 27,672 | | | | 20,357 | |
| | | | | | | | | | | | | | | | |
| | | | |
Total Net Increase (Decrease) in Net Assets | | | 62,415 | | | | 67,848 | | | | 5,281 | | | | 19,354 | |
| | | | |
Net Assets | | | | | | | | | | | | | | | | |
Beginning of period | | | 417,507 | | | | 349,659 | | | | 223,646 | | | | 204,292 | |
| | | | | | | | | | | | | | | | |
End of period | | $ | 479,922 | | | $ | 417,507 | | | $ | 228,927 | | | $ | 223,646 | |
| | | | | | | | | | | | | | | | |
Undistributed (overdistributed) net investment income included in net assets | | $ | 1,423 | | | $ | 1,142 | | | $ | — | | | $ | — | |
See accompanying notes which are an integral part of the financial statements.
| | |
| 96 | | Statements of Changes in Net Assets |
| | | | | | | | | | | | | | | | | | | | | | |
Non-U.S.
Fund | | | Real Estate
Securities Fund | | | Core Bond
Fund | |
| | | | | | | | | | | | | | | | | | | | | | |
| 2007 | | | 2006 | | | 2007 | | | 2006 | | | 2007 | | | 2006 | |
| | | | | | | | | | | | | | | | | | | | | | |
| | | | | |
| | | | | | | | | | | | | | | | | | | | | | |
| $ | 6,991 | | | $ | 5,611 | | | $ | 10,443 | | | $ | 9,841 | | | $ | 15,000 | | | $ | 10,499 | |
| | 47,882 | | | | 65,969 | | | | 51,349 | | | | 48,221 | | | | 3,830 | | | | (2,016 | ) |
| | (16,201 | ) | | | (523 | ) | | | (159,351 | ) | | | 101,743 | | | | 3,043 | | | | 439 | |
| | | | | | | | | | | | | | | | | | | | | | | |
| | 38,672 | | | | 71,057 | | | | (97,559 | ) | | | 159,805 | | | | 21,873 | | | | 8,922 | |
| | | | | | | | | | | | | | | | | | | | | | | |
| | | | | |
| | | | | | | | | | | | | | | | | | | | | | |
| | (10,855 | ) | | | (8,763 | ) | | | (13,544 | ) | | | (10,448 | ) | | | (16,240 | ) | | | (10,963 | ) |
| | (75,619 | ) | | | (7,690 | ) | | | (65,161 | ) | | | (44,446 | ) | | | — | | | | — | |
| | | | | | | | | | | | | | | | | | | | | | | |
| | (86,474 | ) | | | (16,453 | ) | | | (78,705 | ) | | | (54,894 | ) | | | (16,240 | ) | | | (10,963 | ) |
| | | | | | | | | | | | | | | | | | | | | | | |
| | | | | |
| | | | | | | | | | | | | | | | | | | | | | |
| | 109,604 | | | | 13,019 | | | | 39,596 | | | | 77,474 | | | | 74,651 | | | | 51,050 | |
| | | | | | | | | | | | | | | | | | | | | | | |
| | | | | |
| | 61,802 | | | | 67,623 | | | | (136,668 | ) | | | 182,385 | | | | 80,284 | | | | 49,009 | |
| | | | | |
| | | | | | | | | | | | | | | | | | | | | | |
| | 369,884 | | | | 302,261 | | | | 625,477 | | | | 443,092 | | | | 265,783 | | | | 216,774 | |
| | | | | | | | | | | | | | | | | | | | | | | |
| $ | 431,686 | | | $ | 369,884 | | | $ | 488,809 | | | $ | 625,477 | | | $ | 346,067 | | | $ | 265,783 | |
| | | | | | | | | | | | | | | | | | | | | | | |
$ |
(1,232 |
) | | $ | (687 | ) | | $ | (62 | ) | | $ | — | | | $ | 14 | | | $ | 54 | |
See accompanying notes which are an integral part of the financial statements.
| | |
| Statements of Changes in Net Assets | | 97 |
Russell Investment Funds
Financial Highlights — For the Years Ended
For a Share Outstanding Throughout Each Period.
| | | | | | | | | | | | | | | | | | | |
| | | $
Net Asset Value,
Beginning of
Period | | $
Net
Investment
Income (Loss)(a) | | $
Net Realized
and Unrealized
Gain (Loss) | | |
$
Total Income
(Loss) from
Operations | | | $
Distributions
from Net
Investment Income | | | $
Distributions
from Net
Realized Gain | | | $
Return of
Capital | |
| Multi-Style Equity Fund | | | | | | | | | | | | | | | | | |
December 31, 2007 | | 14.93 | | .16 | | 1.37 | | | 1.53 | | | (.16 | ) | | (.65 | ) | | — | |
December 31, 2006 | | 13.37 | | .14 | | 1.55 | | | 1.69 | | | (.13 | ) | | — | | | — | |
December 31, 2005 | | 12.60 | | .12 | | .79 | | | .91 | | | (.14 | ) | | — | | | — | |
December 31, 2004 | | 11.56 | | .11 | | 1.02 | | | 1.13 | | | (.09 | ) | | — | | | — | |
December 31, 2003 | | 9.04 | | .08 | | 2.51 | | | 2.59 | | | (.07 | ) | | — | | | — | |
| Aggressive Equity Fund | | | | | | | | | | | | | | | | | |
December 31, 2007 | | 14.45 | | .06 | | .40 | | | .46 | | | (.05 | ) | | (1.87 | ) | | — | |
December 31, 2006 | | 14.40 | | .03 | | 2.10 | | | 2.13 | | | (.03 | ) | | (2.05 | ) | | — | |
December 31, 2005 | | 14.90 | | .03 | | .90 | | | .93 | | | (.03 | ) | | (1.40 | ) | | — | |
December 31, 2004 | | 13.47 | | .02 | | 1.95 | | | 1.97 | | | (.02 | ) | | (.52 | ) | | — | |
December 31, 2003 | | 9.26 | | .01 | | 4.21 | | | 4.22 | | | (.01 | ) | | — | | | — | |
| Non-U.S. Fund | | | | | | | | | | | | | | | | | |
December 31, 2007 | | 15.01 | | .25 | | 1.14 | | | 1.39 | | | (.38 | ) | | (2.82 | ) | | — | |
December 31, 2006 | | 12.68 | | .23 | | 2.75 | | | 2.98 | | | (.35 | ) | | (.30 | ) | | — | |
December 31, 2005 | | 11.33 | | .16 | | 1.38 | | | 1.54 | | | (.19 | ) | | — | | | — | |
December 31, 2004 | | 9.76 | | .11 | | 1.66 | | | 1.77 | | | (.20 | ) | | — | | | — | |
December 31, 2003 | | 7.20 | | .09 | | 2.69 | | | 2.78 | | | (.22 | ) | | — | | | — | |
| Real Estate Securities Fund | | | | | | | | | | | | | | | | | |
December 31, 2007 | | 21.34 | | .35 | | (3.68 | ) | | (3.33 | ) | | (.47 | ) | | (2.32 | ) | | — | |
December 31, 2006 | | 17.28 | | .37 | | 5.72 | | | 6.09 | | | (.39 | ) | | (1.64 | ) | | — | |
December 31, 2005 | | 17.09 | | .32 | | 1.82 | | | 2.14 | | | (.37 | ) | | (1.58 | ) | | — | |
December 31, 2004 | | 13.71 | | .36 | | 4.33 | | | 4.69 | | | (.36 | ) | | (.95 | ) | | — | |
December 31, 2003 | | 10.51 | | .55 | | 3.28 | | | 3.83 | | | (.61 | ) | | — | | | (.02 | ) |
| Core Bond Fund | | | | | | | | | | | | | | | | | |
December 31, 2007 | | 10.14 | | .51 | | .20 | | | .71 | | | (.53 | ) | | — | | | — | |
December 31, 2006 | | 10.23 | | .45 | | (.08 | ) | | .37 | | | (.46 | ) | | — | | | — | |
December 31, 2005 | | 10.50 | | .38 | | (.17 | ) | | .21 | | | (.37 | ) | | (.11 | ) | | — | |
December 31, 2004 | | 10.47 | | .24 | | .24 | | | .48 | | | (.26 | ) | | (.19 | ) | | — | |
December 31, 2003 | | 10.43 | | .31 | | .31 | | | .62 | | | (.38 | ) | | (.20 | ) | | — | |
See accompanying notes which are an integral part of the financial statements.
| | | | | | | | | | | | | | | | |
$
Total
Distributions | | | $
Net Asset Value,
End of
Period | | %
Total
Return | | | $
Net Assets,
End of Period
(000) | | %
Ratio of Expenses
to Average
Net Assets,
Net(b) | | %
Ratio of Expenses
to Average
Net Assets,
Gross | | %
Ratio of Net
Investment Income
to Average
Net Assets(b) | | %
Portfolio
Turnover Rate |
| | | | | | | | | | | | | | | | |
| (.81 | ) | | 15.65 | | 10.36 | | | 479,922 | | .87 | | .87 | | 1.04 | | 135.80 |
| (.13 | ) | | 14.93 | | 12.75 | | | 417,507 | | .87 | | .87 | | 1.03 | | 128.33 |
| (.14 | ) | | 13.37 | | 7.27 | | | 349,659 | | .83 | | .87 | | .94 | | 130.00 |
| (.09 | ) | | 12.60 | | 9.81 | | | 332,759 | | .87 | | .88 | | .96 | | 123.29 |
| (.07 | ) | | 11.56 | | 28.86 | | | 296,767 | | .87 | | .95 | | .82 | | 107.67 |
| | | | | | | | | | | | | | | | |
| (1.92 | ) | | 12.99 | | 3.42 | | | 228,927 | | 1.05 | | 1.13 | | .39 | | 179.82 |
| (2.08 | ) | | 14.45 | | 14.79 | | | 223,646 | | 1.05 | | 1.12 | | .16 | | 183.55 |
| (1.43 | ) | | 14.40 | | 6.36 | | | 204,292 | | .99 | | 1.13 | | .21 | | 130.09 |
| (.54 | ) | | 14.90 | | 14.73 | | | 195,583 | | 1.05 | | 1.17 | | .17 | | 150.26 |
| (.01 | ) | | 13.47 | | 45.60 | | | 166,385 | | 1.06 | | 1.26 | | .10 | | 138.95 |
| | | | | | | | | | | | | | | | |
| (3.20 | ) | | 13.20 | | 10.12 | | | 431,686 | | 1.15 | | 1.18 | | 1.70 | | 106.21 |
| (.65 | ) | | 15.01 | | 23.64 | | | 369,884 | | 1.15 | | 1.21 | | 1.64 | | 110.77 |
| (.19 | ) | | 12.68 | | 13.69 | | | 302,261 | | 1.12 | | 1.26 | | 1.41 | | 87.98 |
| (.20 | ) | | 11.33 | | 18.30 | | | 258,766 | | 1.15 | | 1.28 | | 1.11 | | 73.45 |
| (.22 | ) | | 9.76 | | 38.78 | | | 206,619 | | 1.16 | | 1.41 | | 1.14 | | 50.29 |
| | | | | | | | | | | | | | | | |
| (2.79 | ) | | 15.22 | | (15.86 | ) | | 488,809 | | .92 | | .92 | | 1.75 | | 76.84 |
| (2.03 | ) | | 21.34 | | 35.84 | | | 625,477 | | .90 | | .91 | | 1.86 | | 52.63 |
| (1.95 | ) | | 17.28 | | 12.96 | | | 443,092 | | .91 | | .91 | | 1.86 | | 64.24 |
| (1.31 | ) | | 17.09 | | 34.88 | | | 379,733 | | .92 | | .92 | | 2.43 | | 47.21 |
| (.63 | ) | | 13.71 | | 37.21 | | | 254,691 | | .95 | | .95 | | 4.66 | | 38.84 |
| | | | | | | | | | | | | | | | |
| (.53 | ) | | 10.32 | | 7.24 | | | 346,067 | | .70 | | .78 | | 5.04 | | 964.78 |
| (.46 | ) | | 10.14 | | 3.72 | | | 265,783 | | .70 | | .73 | | 4.40 | | 452.50 |
| (.48 | ) | | 10.23 | | 2.01 | | | 216,774 | | .70 | | .72 | | 3.70 | | 192.66 |
| (.45 | ) | | 10.50 | | 4.66 | | | 175,851 | | .70 | | .73 | | 2.41 | | 216.23 |
| (.58 | ) | | 10.47 | | 6.15 | | | 147,202 | | .71 | | .78 | | 2.86 | | 232.64 |
See accompanying notes which are an integral part of the financial statements.
Russell Investment Funds
Notes to Financial Highlights — December 31, 2007
| (a) | Average month-end shares outstanding were used for this calculation. |
| (b) | May reflect amounts waived and/or reimbursed by RIMCo as the manager and transfer agent, and custody credit arrangements. |
See accompanying notes which are an integral part of the financial statements.
| | |
| 100 | | Notes to Financial Highlights |
Russell Investment Funds
Notes to Financial Statements — December 31, 2007
Russell Investment Funds (the “Investment Company” or “RIF”) is a series investment company with nine different investment portfolios referred to as Funds. These financial statements report on five of these Funds (each a “Fund” and collectively the “Funds”). The Investment Company provides the investment base for one or more variable insurance products issued by one or more insurance companies. These Funds are offered at net asset value to qualified insurance company separate accounts offering variable insurance products. The Investment Company is registered under the Investment Company Act of 1940, as amended, as an open-end management investment company. It is organized and operates as a Massachusetts business trust under a master trust agreement dated July 11, 1996, as amended. The Investment Company’s master trust agreement permits the Board of Trustees (the “Board”) to issue an unlimited number of shares of beneficial interest at a $.01 par value per share.
Through December 31, 2007, Russell Investment Management Company (“RIMCo”) was the manager and transfer agent of the Funds providing advisory, administrative and transfer agency services to the Funds. Effective January 1, 2008, RIMCo advises the Funds and Russell Fund Services Company (“RFSC”), a wholly-owned subsidiary of RIMCo, is the Funds’ administrator and transfer agent. There was no change in the services provided to the Funds or, in aggregate, fees paid by the Funds for advisory, administrative and transfer agency services.
| 2. | | Significant Accounting Policies |
The Funds’ financial statements are prepared in accordance with accounting principles generally accepted in the United States of America (“GAAP”) which require the use of management estimates and assumptions at the date of the financial statements. Actual results could differ from those estimates. The following is a summary of the significant accounting policies consistently followed by each Fund in the preparation of its financial statements.
Security Valuation
The Funds value portfolio securities according to Board-approved securities valuation procedures, including market value procedures, fair value procedures and pricing services. Debt obligation securities maturing within 60 days of the time of purchase are priced using the amortized cost method of valuation, unless the Board determines that amortized cost does not represent market value of short-term debt obligations. The Board has delegated the responsibility for administration of the Securities Valuation Procedures to RFSC.
Ordinarily, the Funds value each portfolio security based on market quotations provided by pricing services or alternative pricing services or dealers (when permitted by the market value procedures). Generally, Fund securities are valued at the close of the market on which they are traded as follows:
| | • | | US listed equities; equity and fixed income options: Last sale price; last bid price if no last sale price; |
| | • | | US over-the-counter equities: Official closing price; last bid price if no closing price; |
| | • | | Listed ADRs/GDRs: Last sale price; last bid price if no sales; |
| | • | | Municipal bonds, US bonds, Eurobonds/foreign bonds: Evaluated bid price; broker quote if no evaluated bid price; |
| | • | | Futures: Settlement price; |
| | • | | Investments in other mutual funds are valued at their net asset value per share, calculated at 4 p.m. Eastern time or as of the close of the New York Stock Exchange, whichever is earlier; |
| | • | | The value of swap agreements is equal to the Funds’ obligation (or rights) under swap contracts which will generally be equal to the net amounts to be paid or received under the contracts based upon the relative values of the positions held by each party to the contracts. |
| | • | | Equity securities traded on a national foreign securities exchange or a foreign over the counter market are valued on the basis of the official closing price, or lacking the official closing price, at the last sale price of the primary exchange on which the security is traded. |
If market quotations are not readily available for a security or if subsequent events suggest that a market quotation is not reliable, the Funds will use the security’s fair value, as determined in accordance with the fair value procedures. The effect of fair value pricing is that securities may not be priced on the basis of quotations from the primary market in which they are traded, but rather may be priced by another method that the Funds’ Board of Trustees believes reflects fair value. The use of fair value pricing by a Fund may cause the net asset value of its shares to differ significantly from the net asset value that would be calculated using normal pricing methods. Fair value pricing could also cause discrepancies between the daily movement of the value of Fund shares and the daily movement of the benchmark index if the index is valued using another pricing method.
| | |
| Notes to Financial Statements | | 101 |
Russell Investment Funds
Notes to Financial Statements, continued — December 31, 2007
This policy is intended to assure that the Funds’ net asset values fairly reflect security values as of the time of pricing. Events or circumstances affecting the values of Fund securities that occur between the closing of the principal markets on which they trade and the time the net asset value of Fund shares is determined may be reflected in the calculation of net asset values for each applicable Fund when the Funds deem that the particular event or circumstance would materially affect such Fund’s net asset value. Funds that invest primarily in frequently traded exchange listed securities will use fair value pricing in limited circumstances since reliable market quotations will often be readily available. Funds that invest in foreign securities are likely to use fair value pricing more often since significant events may occur between the close of foreign markets and the time of pricing which would trigger fair value pricing of the foreign securities. Funds that invest in low rated debt securities are also likely to use fair value pricing more often since the markets in which such securities are traded are generally thinner, more limited and less active than those for higher rated securities. Examples of events that could trigger fair value pricing of one or more securities are: a material market movement of the US securities market (defined in the fair value procedures as the movement by any two of four major US Indexes greater than a certain percentage) or other significant event; foreign market holidays if on a daily basis, Fund exposure exceeds 20% in aggregate (all closed markets combined); a company development; a natural disaster; or an armed conflict.
Because foreign securities can trade on non-business days, the net asset value of a Fund’s portfolio that includes foreign securities may change on days when shareholders will not be able to purchase or redeem fund shares.
In September 2006, Statement of Financial Accounting Standards No. 157, Fair Value Measurements (“SFAS 157”), was issued and is effective for fiscal years beginning after November 15, 2007. SFAS 157 defines fair value, establishes a framework for measuring fair value and expands disclosures about fair value measurements. Management is currently evaluating the impact the adoption of SFAS 157 will have on the Funds’ financial statement disclosure.
Investment Transactions
Securities transactions are recorded on a trade date basis. Realized gains and losses from securities transactions, if any, are recorded on the basis of specific identified cost incurred by each money manager within a particular Fund.
Investment Income
Dividend income is recorded net of applicable withholding taxes on the ex-dividend date, except that certain dividends from foreign securities are recorded as soon thereafter as the Funds are informed of the ex-dividend date. Interest income is recorded daily on the accrual basis. The Core Bond Fund classifies gains and losses realized on prepayments received on mortgage-backed securities as part of interest income. All premiums and discounts, including original issue discounts, are amortized/accreted using the interest method.
Federal Income Taxes
Since the Investment Company is a Massachusetts business trust, each Fund is a separate corporate taxpayer and determines its net investment income and capital gains (or losses) and the amounts to be distributed to each Fund’s shareholders without regard to the income and capital gains (or losses) of the other Funds.
It is each Fund’s intention to qualify as a regulated investment company and distribute all of its taxable income and capital gains. Therefore, no federal income tax provision is required for the Funds.
The Financial Accounting Standards Board (FASB) issued Interpretation No. 48, “Accounting for Uncertainty in Income Taxes, an Interpretation of FASB Statement No. 109” (“FIN 48”), in June 2006. FIN 48 permits the recognition of tax benefits of an uncertain tax position only when the position is “more likely than not” to be sustained assuming examination by taxing authorities. The Funds adopted the provisions of FIN 48 on January 1, 2007. Management has reviewed the Funds tax positions for all open tax years, and concluded that adoption had no effect on the Funds financial position or results of operations. At December 31, 2007, the Funds have recorded no liabilities for net unrecognized tax benefits relating to uncertain income tax positions they have taken or expects to take in future tax returns.
The Funds file U.S. tax returns. While the statute of limitations remain open to examine the Funds U.S. tax returns filed for the fiscal years ending December 31, 2004 through December 31, 2006, no examinations are in progress or anticipated at this time. The Funds are not aware of any tax positions for which it is reasonably possible that the total amounts of unrecognized tax benefits will significantly change in the next twelve months.
| | |
| 102 | | Notes to Financial Statements |
Russell Investment Funds
Notes to Financial Statements, continued — December 31, 2007
Dividends and Distributions to Shareholders
For all Funds, income and capital gain distributions, if any, are recorded on the ex-dividend date. Income distributions are generally declared and paid quarterly, except for the Non-U.S. Fund, which generally declares and pays income distributions annually. Capital gain distributions are generally declared and paid annually. An additional distribution may be paid by the Funds to avoid imposition of federal income and excise tax on any remaining undistributed capital gains and net investment income.
The timing and characterization of certain income and capital gain distributions are determined in accordance with federal tax regulations which may differ from GAAP. As a result, net investment income and net realized gain (or loss) on investment and foreign currency-related transactions for a reporting period may differ significantly from distributions during such period. The differences between tax regulations and GAAP primarily relate to investments in options, futures, forward contracts, swap contracts, passive foreign investment companies, foreign-denominated investments, mortgage-backed securities, certain securities sold at a loss and capital loss carryforwards.
Expenses
The Funds will pay their own expenses other than those expressly assumed by RIMCo or its affiliates. Most expenses can be directly attributed to the individual Funds. Expenses which cannot be directly attributed to a specific Fund are allocated among all Funds principally based on their relative net assets.
Foreign Currency Translations
The books and records of the Funds are maintained in US dollars. Foreign currency amounts and transactions of the Funds are translated into US dollars on the following basis:
| | (a) | Market value of investment securities, other assets and liabilities at the closing rate of exchange on the valuation date. |
| | (b) | Purchases and sales of investment securities and income at the closing rate of exchange prevailing on the respective trade dates of such transactions. |
Net realized gains or losses from foreign currency-related transactions arise from: sales and maturities of short-term securities; sales of foreign currencies; currency gains or losses realized between the trade and settlement dates on securities transactions; the difference between the amounts of dividends, interest, and foreign withholding taxes recorded on the Non-U.S. Fund’s books and the US dollar equivalent of the amounts actually received or paid. Net unrealized gains or losses from foreign currency-related transactions arise from changes in the value of assets and liabilities, other than investments in securities, at year-end, as a result of changes in the exchange rates.
The Funds do not isolate that portion of the results of operations of the Funds that arises as a result of changes in exchange rates from that portion that arises from changes in market prices of investments during the year. Such fluctuations are included with the net realized and unrealized gain or loss from investments. However, for federal income tax purposes the Funds do isolate the effects of changes in foreign exchange rates from the fluctuations arising from changes in market prices for realized gain (or loss) on debt obligations.
Capital Gains Taxes
The Non-U.S. Fund may be subject to capital gains taxes and repatriation taxes imposed by certain countries in which it invests. The Non-U.S. Fund may record a deferred tax liability in respect of unrealized appreciation on foreign securities for potential capital gains and repatriation taxes at December 31, 2007. The accrual for capital gains and repatriation taxes is included in net unrealized appreciation (depreciation) on investments in the Statement of Assets and Liabilities for both Funds, if applicable. The amounts related to capital gains taxes are included in net realized gain (loss) on investments in the Statement of Operations for both Funds. The Non-U.S. Fund had no deferred tax liability or capital gains taxes for the period ended December 31, 2007.
Derivatives
To the extent permitted by the investment objectives, restrictions and policies set forth in the Funds’ Prospectus and Statement of Additional Information, the Funds may participate in various derivative-based transactions. Derivative securities are instruments or agreements whose value is derived from an underlying security or index. They include options, futures, swaps, swaptions, forwards, structured notes and stripped securities. These instruments offer unique characteristics and risks that assist the Funds in meeting their investment strategies.
| | |
| Notes to Financial Statements | | 103 |
Russell Investment Funds
Notes to Financial Statements, continued — December 31, 2007
The Funds typically use derivatives in three ways: exposing cash reserves to markets, hedging and return enhancement. The Funds, other than the Real Estate Securities Fund, may pursue their strategy to be fully invested by exposing cash reserves in a Fund to the performance of appropriate markets by purchasing securities and/or derivatives. This is intended to cause the Funds to perform as though their cash reserves were actually invested in those markets. Hedging is also used by some Funds to limit or control risks, such as adverse movements in exchange rates and interest rates. Return enhancement can be accomplished through the use of derivatives in a Fund. By purchasing certain instruments, Funds may more effectively achieve the desired portfolio characteristics that assist them in meeting their investment objectives. Depending on how the derivatives are structured and utilized, the risks associated with them may vary widely. These risks are generally categorized as market risk, liquidity risk and counterparty or credit risk.
Foreign Currency Exchange Contracts
In connection with investment transactions consistent with the Funds’ investment objective and strategies, certain Funds may enter into foreign currency exchange spot contracts and forward foreign currency exchange contracts (“contracts”). The Funds may enter into foreign currency forward overlays on liquidity reserve balances. Additionally, from time to time the Funds may enter into contracts to hedge certain foreign currency-denominated assets. Contracts are recorded at market value. Certain risks may arise upon entering into these contracts from the potential inability of counterparties to meet the terms of their contracts and are generally limited to the amount of unrealized gain on the contracts, if any, that are recognized in the Statement of Assets and Liabilities. Realized gains or losses arising from such transactions are included in net realized gain (or loss) from foreign currency-related transactions. Open contracts at December 31, 2007 are presented on the Schedule of Investments.
Forward Commitments
Certain Funds may contract to purchase securities for a fixed price at a future date beyond customary settlement time consistent with a Fund’s ability to manage its investment portfolio and meet redemption requests. The price of the underlying securities and the date when the securities will be delivered and paid for are fixed at the time the transaction is negotiated. The Funds may dispose of a forward commitment transaction prior to settlement if it is appropriate to do so and realize short-term gains (or losses) upon such sale. When effecting such transactions, cash or liquid high-grade debt obligations of the Fund in a dollar amount sufficient to make payment for the portfolio securities to be purchased will be segregated on the Fund’s records at the trade date and maintained until the transaction is settled. A forward commitment transaction involves a risk of loss if the value of the security to be purchased declines prior to the settlement date or the other party to the transaction fails to complete the transaction.
Loan Agreements
The Core Bond Fund may invest in direct debt instruments which are interests in amounts owed by corporate, governmental, or other borrowers to lenders or lending syndicates. A Fund’s investments in loans may be in the form of participations in loans or assignments of all or a portion of loans from third parties. A loan is often administered by a bank or other financial institution (the “lender”) that acts as agent for all holders. The agent administers the terms of the loan, as specified in the loan agreement. When investing in a loan participation, a Fund has the right to receive payments of principal, interest and any fees to which it is entitled only from the lender selling the loan agreement and only upon receipt by the lender of payments from the borrower. A Fund generally has no right to enforce compliance with the terms of the loan agreement with the borrower. As a result, a Fund may be subject to the credit risk of both the borrower and the lender that is selling the loan agreement. When a Fund purchases assignments from lenders it acquires direct rights against the borrower on the loan. For the period ended December 31, 2007, there were no unfunded loan commitments in the Core Bond Fund.
Options
The Funds may purchase and sell (write) call and put options on securities and securities indices, provided such options are traded on a national securities exchange or in an over-the-counter market. The Funds may also purchase and sell call and put options on foreign currencies. The Funds may utilize options to equitize liquidity reserve balances.
When a Fund writes a covered call or a put option, an amount equal to the premium received by the Fund is included in the Fund’s Statement of Assets and Liabilities as an asset and as an equivalent liability. The amount of the liability is subsequently marked-to-market to reflect the current market value of the option written. The Fund receives a premium on the sale of a call option but gives up the opportunity to profit from any increase in stock value above the exercise price of the option, and when the Fund writes a put option it is exposed to a decline in the price of the underlying security.
| | |
| 104 | | Notes to Financial Statements |
Russell Investment Funds
Notes to Financial Statements, continued — December 31, 2007
Whether an option which the Fund has written either expires on its stipulated expiration date or the Fund enters into a closing purchase transaction, the Fund realizes a gain (or loss, if the cost of a closing purchase transaction exceeds the premium received when the option was sold) without regard to any unrealized gain or loss on the underlying security, and the liability related to such option is extinguished. If a call option which the Fund has written is exercised, the Fund realizes a capital gain or loss from the sale of the underlying security, and the proceeds from such sale are increased by the premium originally received. When a put option which a Fund has written is exercised, the amount of the premium originally received will reduce the cost of the security which a Fund purchases upon exercise of the option. Realized gains (losses) on purchased options are included in net realized gain (loss) from investments.
The Funds’ use of written options involves, to varying degrees, elements of market risk in excess of the amount recognized in the Statement of Assets and Liabilities. The face or contract amounts of these instruments reflect the extent of the Funds’ exposure to market risk. The risks may be caused by an imperfect correlation between movements in the price of the instrument and the price of the underlying securities and interest rates.
Futures Contracts
The Funds may invest in futures contracts (i.e., interest rate, foreign currency and index futures contracts) to a limited extent. The face or contract amounts of these instruments reflect the extent of the Funds’ exposure to off balance sheet risk. The primary risks associated with the use of futures contracts are an imperfect correlation between the change in market value of the securities held by the Fund and the prices of futures contracts and the possibility of an illiquid market. Upon entering into a futures contract, the Funds are required to deposit with a broker an amount, termed the initial margin, which typically represents 5% of the purchase price indicated in the futures contract. Payments to and from the broker, known as variation margin, are made as the price of the futures contract fluctuates. Changes in initial settlement value are accounted for as unrealized appreciation (depreciation) until the contracts are terminated, at which time realized gains and losses are recognized. As of December 31, 2007, included in the Statement of Assets and Liabilities, the Non-U.S. Fund had a cash collateral balance of $2,630,311 in connection with futures contracts purchased (sold).
Swap Agreements
The Funds may enter into several different types of agreements including interest rate, index, credit default and currency swaps.
The Funds may enter into index swap agreements as an additional hedging strategy for cash reserves held by those Funds or to effect investment transactions consistent with these Funds’ investment objectives and strategies. Swap agreements are two party contracts entered into primarily by institutional investors for periods ranging from a few weeks to more than one year. In a standard swap transaction, the two parties agree to exchange the returns (or differentials in rates of return) earned or realized on particular investments or instruments. The returns to be exchanged between the parties are calculated with respect to a “notional amount” (i.e. a specified dollar amount that is hypothetically invested in a “basket” of securities representing a particular index).
Amounts paid to and received from the swap counterparties representing capital appreciation and depreciation on the underlying securities and accrued interest expense and interest income are recorded as net realized gain (loss). The Funds are exposed to credit risk in the event of non-performance by the swap counterparties; however, the Funds do not anticipate non-performance by the counterparties.
The Funds may enter into swap agreements, on either an asset-based or liability-based basis, depending on whether they are hedging their assets or liabilities, and will usually enter into swaps on a net basis, i.e., the two payment streams are netted out, with the Funds receiving or paying, as the case may be, only the net amount of the two payments. When the Funds engage in a swap, they exchange their obligations to pay or rights to receive payments for the obligations to pay or rights to receive payments of another party (i.e., an exchange of floating rate payments for fixed rate payments).
Interest rate swaps are counterparty agreements and can be customized to meet each party’s needs and involves the exchange of a fixed payment per period for a payment that is not fixed. Currency swaps are agreements where two parties exchange specified amounts of different currencies which are followed by a series of interest payments that are exchanged based on the principal cash flow. At maturity the principal amounts are exchanged back to the original party. Credit default swaps are counterparty agreements which allow the transfer of third party credit risk (the possibility that an issuer will default on their obligation by failing to pay principal or interest in a timely manner) from one party to another. The lender faces the credit risk from a third party and the counterparty in the swap agrees to insure this risk in exchange for regular periodic payments.
| | |
| Notes to Financial Statements | | 105 |
Russell Investment Funds
Notes to Financial Statements, continued — December 31, 2007
The Funds expect to enter into these transactions primarily to preserve a return or spread on a particular investment or portion of its portfolio or to protect against any increase in the price of securities they anticipate purchasing at a later date. The net amount of the excess, if any, of the Funds’ obligations over its entitlements with respect to each swap will be accrued on a daily basis and an amount of cash or liquid high-grade debt securities having an aggregate net asset value at least equal to the accrued excess will be maintained in a segregated account by the Funds’ custodian. To the extent that the Funds enter into swaps on other than a net basis, the amount maintained in a segregated account will be the full amount of the Funds’ obligations, if any, with respect to such swaps, accrued on a daily basis. If there is a default by the other party to such a transaction, the Funds will have contractual remedies pursuant to the agreement related to the transaction. The swap market has grown substantially in recent years with a large number of banks and investment banking firms acting both as principals and as agents utilizing standardized swap documentation. As a result, the swap market has become relatively liquid. As of December 31, 2007, included in the Statement of Assets and Liabilities, the Core Bond Fund had a cash collateral balance of $1,338,476 in connection with swaps contracts purchased (sold).
Investments in Emerging Markets
Investing in emerging markets may involve special risks and considerations not typically associated with investing in the United States markets. These risks include revaluation of currencies, high rates of inflation, repatriation, restrictions on income and capital, and future adverse political and economic developments. Moreover, securities issued in these markets may be less liquid, subject to government ownership controls, delayed settlements, and their prices may be more volatile than those of comparable securities in the United States.
Mortgage-Related and Other Asset-Backed Securities
The Core Bond Fund may invest in mortgage or other asset-backed securities. These securities may include mortgage pass-through securities, collateralized mortgage obligations (“CMOs”), commercial mortgage-backed securities, mortgage dollar rolls, CMO residuals, stripped mortgage-backed securities (“SMBSs”) and other securities that directly or indirectly represent a participation in, or are secured by a payable from, mortgage loans on real property. Mortgage-backed securities often have stated maturities of up to thirty years when they are issued, depending upon the length of the mortgages underlying the securities. In practice, however, unscheduled or early payments of principal and interest on the underlying mortgages may make the securities’ effective maturity shorter than this, and the prevailing interest rates may be higher or lower than the current yield of a Fund’s portfolio at the time the Fund receives the payments for reinvestment. Mortgage-backed securities may have less potential for capital appreciation than comparable fixed income securities due to the likelihood of increased prepayments of mortgages as interest rates decline. If a Fund buys mortgage-backed securities at a premium, mortgage foreclosures and prepayments of principal by mortgagors (which may be made at any time without penalty) may result in some loss of the Fund’s principal investment to the extent of the premium paid. The value of mortgage-backed securities may also change due to shifts in the market’s perception of issuers. In addition, regulatory or tax changes may adversely affect the mortgage securities markets as a whole. Non-governmental mortgage-backed securities may offer higher yields than those issued by government entities, but also may be subject to greater price changes than governmental issues.
Through its investments in mortgage-backed securities (“MBS”), including those that are issued by private issuers, a Fund may have some exposure to subprime loans as well as to the mortgage and credit markets generally. Private issuers include commercial banks, savings associations, mortgage companies, investment banking firms, finance companies and special purpose finance entities (called special purpose vehicles or SPVs) and other entities that acquire and package mortgage loans for resale as MBS. Unlike MBS issued or guaranteed by the U.S. government or one of its sponsored entities, MBS issued by private issuers do not have a government or government-sponsored entity guarantee, but may have credit enhancements provided by external entities such as banks or financial institutions or achieved through the structuring of the transaction itself. Examples of such credit support arising out of the structure of the transaction include the issue of senior and subordinated securities (e.g., the issuance of securities by an SPV in multiple classes or “tranches”, with one or more classes being senior to other subordinated classes as to the payment of principal and interest, with the result that defaults on the underlying mortgage loans are borne first by the holders of the subordinated class); creation of “reserve funds” (in which case cash or investments, sometimes funded from a portion of the payments on the underlying mortgage loans, are held in reserve against future losses); and “overcollateralization” (in which case the scheduled payments on, or the principal amount of, the underlying mortgage loans exceeds that required to make payment of the securities and pay any servicing or other fees). However, there can be no guarantee that credit enhancements, if any, will be sufficient to prevent losses in the event of defaults on the underlying mortgage loans. In addition, MBS that are issued by private issuers are not subject to the underwriting requirements for the underlying mortgages that are
| | |
| 106 | | Notes to Financial Statements |
Russell Investment Funds
Notes to Financial Statements, continued — December 31, 2007
applicable to those MBS that have a government or government-sponsored entity guarantee. As a result, the mortgage loans underlying private MBS may, and frequently do, have less favorable collateral, credit risk or other underwriting characteristics than government or government-sponsored MBS and have wider variances in a number of terms including interest rate, term, size, purpose and borrower characteristics. Privately issued pools more frequently include second mortgages, high loan-to-value mortgages and manufactured housing loans. The coupon rates and maturities of the underlying mortgage loans in a private-label MBS pool may vary to a greater extent than those included in a government guaranteed pool, and the pool may include subprime mortgage loans. Subprime loans refer to loans made to borrowers with weakened credit histories or with a lower capacity to make timely payments on their loans. For these reasons, the loans underlying these securities have had in many cases higher default rates than those loans that meet government underwriting requirements. The risk of non-payment is greater for MBS that are backed by mortgage pools that contain subprime loans, but a level of risk exists for all loans. Privately issued MBS are not traded on an exchange and there may be a limited market for the securities, especially when there is a perceived weakness in the mortgage and real estate market sectors. Without an active trading market, MBS held in a Fund’s portfolio may be particularly difficult to value because of the complexities involved in assessing the value of the underlying mortgage loans.
Asset-backed securities may include pools of MBS loans, receivables or other assets. Payment of principal and interest may be largely dependent upon the cash flows generated by the assets backing the securities. For purposes of determining the percentage of a Fund’s total assets invested in securities of issuers having their principal business activities in a particular industry, asset-backed securities will be classified separately, based on the nature of the underlying assets, according to the following categories: captive auto, diversified, retail and consumer loans, captive equipment and business, business trade receivables, nuclear fuel and capital and mortgage lending. Asset-backed securities (other than MBS) present certain risks that are not presented by MBS. Primarily, these securities may not have the benefit of any security interest in the related assets. Credit card receivables are generally unsecured and the debtors are entitled to the protection of a number of state and federal consumer credit laws, many of which give such debtors the right to set off certain amounts owed on the credit cards, thereby reducing the balance due. There is the possibility that recoveries on repossessed collateral may not, in some cases, be available to support payments on these securities. Asset-backed securities are often backed by a pool of assets representing the obligations of a number of different parties. To lessen the effect of failures by obligors on underlying assets to make payments, the securities may contain elements of credit support which fall into two categories: (i) liquidity protection, and (ii) protection against losses resulting from ultimate default by an obligor on the underlying assets. Liquidity protection refers to the provision of advances, generally by the entity administering the pool of assets, to ensure that the receipt of payments on the underlying pool occurs in a timely fashion. Protection against losses results from payment of the insurance obligations on at least a portion of the assets in the pool. This protection may be provided through guarantees, policies or letters of credit obtained by the issuer or sponsor from third parties, through various means of structuring the transaction or through a combination of such approaches. The Funds will not pay any additional or separate fees for credit support. The degree of credit support provided for each issue is generally based on historical information respecting the level of credit risk associated with the underlying assets. Delinquency or loss in excess of that anticipated or failure of the credit support could adversely affect the return on an investment in such a security. The availability of asset-backed securities may be affected by legislative or regulatory developments. It is possible that such developments may require the Funds to dispose of any then existing holdings of such securities.
Inflation-Indexed Bonds
The Core Bond Fund may invest in inflation-indexed bonds. Inflation-indexed bonds are fixed-income securities whose principal value is periodically adjusted to the rate of inflation. The interest rate on these bonds is generally fixed at issuance at a rate lower than typical bonds. Over the life of an inflation-indexed bond, however, interest will be paid based on a principal value, which is adjusted for inflation. Any increase in the principal amount of an inflation-indexed bond will be included as interest income in the Statement of Operations, even though investors do not receive their principal until maturity.
Guarantees
In the normal course of business the Funds enter into contracts that contain a variety of representations which provide general indemnifications. The Funds’ maximum exposure under these arrangements is unknown as this would involve future claims that may be made against the Funds that have not yet occurred. However, the Funds expect the risk of loss to be remote.
| | |
| Notes to Financial Statements | | 107 |
Russell Investment Funds
Notes to Financial Statements, continued — December 31, 2007
| 3. | | Investment Transactions |
Securities
During the period ended December 31, 2007, purchases and sales of investment securities (excluding US Government and Agency obligations, short-term investments, options, futures and repurchase agreements) were as follows:
| | | | | | |
| Funds | | Purchases | | Sales |
| | | | | | |
Multi-Style Equity | | $ | 607,804,462 | | $ | 584,939,251 |
Aggressive Equity | | | 353,941,073 | | | 355,947,286 |
Non-U.S. | | | 420,644,403 | | | 396,948,243 |
Real Estate Securities | | | 445,466,877 | | | 460,966,714 |
Core Bond | | | 2,442,041,839 | | | 2,390,820,108 |
Purchases and sales of US Government and Agency obligations (excluding short-term investments, options, futures and repurchase agreements) were as follows:
| | | | | | |
| Fund | | Purchases | | Sales |
| | | | | | |
Core Bond | | $ | 238,309,768 | | $ | 228,017,734 |
Written Options Contracts
Transactions in written options contracts for the period ended December 31, 2007 were as follows:
| | | | | | | | | | | | | | |
| | | Non-U.S. Fund | | | Core Bond Fund | |
| | | Number of Contracts | | | Premiums Received | | | Number of Contracts | | | Premiums Received | |
| | | | | | | | | | | | | | |
Outstanding December 31, 2006 | | 60 | | | $ | 306,054 | | | 253 | | | $ | 329,796 | |
Opened | | 549 | | | | 2,357,819 | | | 14,534 | | | | 5,173,472 | |
Closed | | (587 | ) | | | (2,568,693 | ) | | (12,658 | ) | | | (4,574,375 | ) |
Expired | | — | | | | — | | | (2,085 | ) | | | (606,611 | ) |
| | | | | | | | | | | | | | |
Outstanding December 31, 2007 | | 22 | | | $ | 95,180 | | | 44 | | | $ | 322,282 | |
| | | | | | | | | | | | | | |
Securities Lending
The Investment Company has a securities lending program whereby each Fund can loan securities with a value up to 33 1/3% of each Fund’s total assets. The Fund receives cash (US currency), US Government or US Government agency obligations as collateral against the loaned securities. To the extent that a loan is collateralized by cash, such collateral is invested by the securities lending agent, State Street Corporation (“State Street”), in short-term instruments, money market mutual funds and other short-term investments that meet certain quality and diversification requirements. Cash collateral invested in money market funds is included in the Schedule of Investments. The collateral received is recorded on a lending Fund’s statement of assets and liabilities along with the related obligation to return the collateral.
Income generated from the investment of cash collateral, less negotiated rebate fees paid to participating brokers and transaction costs, is divided between the Fund and State Street and is recorded as income for the Fund. To the extent that a loan is secured by non-cash collateral, brokers pay the Fund negotiated lenders’ fees, which are divided between the Fund and State Street and are recorded as securities lending income for the Fund. All collateral received will be in an amount at least equal to 102% (for loans of US securities) or 105% (for Non-U.S. securities) of the market value of the loaned securities at the inception of each loan. The market value of the loaned securities is determined at the close of business of the Funds and any additional required collateral is delivered to the Fund the next day. Should the borrower of the securities fail financially, there is a risk of delay in recovery of the securities or loss of rights in the collateral. Consequently, loans are made only to borrowers which are deemed to be of good financial standing.
As of December 31, 2007, the non-cash collateral received for the securities on loan in the following funds was:
| | | | | |
| Funds | | Non-Cash
Collateral Value | | Non-Cash Collateral Holding |
| | | | | |
Multi-Style Equity | | $ | 623,392 | | Pool of US Government Securities |
Aggressive Equity | | | 988,382 | | Pool of US Government Securities |
Non-U.S. | | | 755,483 | | Pool of US Government Securities |
Real Estate Securities | | | 9,659,932 | | Pool of US Government Securities |
| | |
| 108 | | Notes to Financial Statements |
Russell Investment Funds
Notes to Financial Statements, continued — December 31, 2007
Custodian
The Funds have entered into a custody agreement with their Custodian whereby custody credits realized as a result of uninvested cash balances are used to reduce a portion of the Funds’ expenses. For the period ended December 31, 2007, the Funds’ custodian fees were reduced by the following amounts under these arrangements:
| | | |
| Funds | | Custody Credit Amount |
| | | |
Multi-Style Equity | | $ | 2,354 |
Aggressive Equity | | | 4,618 |
Non-U.S. | | | 6,652 |
Real Estate Securities | | | 3,697 |
Core Bond | | | 37,517 |
Brokerage Commissions
The Funds effect certain transactions through BNY ConvergeFX Group — LJR recapture Services (“LJR”) and its global network of correspondent brokers. LJR is a registered broker and is not an affiliate of the Funds or RIMCo. Trades placed through LJR and its correspondents are used (i) to obtain research services for RIMCo to assist it in its capacity as a manager of managers and (ii) to generate commission rebates to the Funds on whose behalf the trades were made. For purposes of trading to obtain research services for RIMCo or to generate commission rebates to the Funds, the Funds’ money managers are requested to and RIMCo may, with respect to transactions it places, effect transactions with or through LJR and its correspondents or other brokers only to the extent that the Funds will receive competitive execution, price and commissions. In addition, RIMCo recommends targets for the amount of trading that money managers allocate through LJR based upon asset class, investment style and other factors. Research services provided to RIMCo by LJR or other brokers include performance measurement statistics, fund analytics systems and market monitoring systems. Research services will generally be obtained from unaffiliated third parties at market rates. Research provided to RIMCo may benefit the particular Funds generating the trading activity and may also benefit other Funds within the Investment Company and other funds and clients managed or advised by RIMCo or its affiliates. Similarly, the Funds may benefit from research provided with respect to trading by those other funds and clients.
LJR also may rebate to the Funds a portion of commissions earned on certain trading by the Funds through LJR and their correspondents in the form of commission recapture. Commission recapture is paid solely to those Funds generating the applicable trades. Commission recapture is generated on the instructions of the Soft Dollar Committee once RIMCo’s research budget has been met, as determined annually in the Soft Dollar Committee budgeting process.
| 4. | | Related Party Transactions, Fees and Expenses |
Adviser and Administrator
Through December 31, 2007, RIMCo managed all of the Funds which comprise the Investment Company. Effective January 1, 2008, RIMCo advises the Funds and RFSC is the Funds’ administrator. RFSC is a wholly-owned subsidiary of RIMCo. RIMCo is a wholly-owned subsidiary of Frank Russell Company (a subsidiary of The Northwestern Mutual Life Insurance Company). Frank Russell Company provides money manager research services to RIMCo.
The Funds are permitted to invest their cash reserves (i.e., cash awaiting investment or cash held to meet redemption requests or to pay expenses), and also may invest a portion of the collateral received from the Investment Company’s securities lending program in the Russell Investment Company (“RIC”) Money Market Fund. RIC is a registered investment company that employs the same investment adviser as the Investment Company. As of December 31, 2007, $100,656,000 of the RIC Money Market Fund’s net assets represents investments by the Funds.
The management fees are based upon the average daily net assets of each Fund at the rates specified in the table below, are payable monthly and total $16,576,450 for the period ended December 31, 2007.
| | | |
| Funds | | Annual Rate | |
| | | |
Multi-Style Equity | | 0.78 | % |
Aggressive Equity | | 0.95 | |
Non-U.S. | | 0.95 | |
Real Estate Securities | | 0.85 | |
Core Bond | | 0.60 | |
| | |
| Notes to Financial Statements | | 109 |
Russell Investment Funds
Notes to Financial Statements, continued — December 31, 2007
Through December 31, 2007, RIMCo agreed to certain waivers of its management fees as follows:
Multi-Style Equity Fund — RIMCo contractually agreed to waive a portion of its 0.78% management fee, up to the full amount of that fee, equal to the amount by which the Fund’s total direct Fund-level operating expenses exceeded 0.87% of the Fund’s average daily net assets on an annual basis and then to reimburse the Fund for all remaining expenses, after fee waivers, that exceed 0.87% of the average daily net assets on an annual basis. Direct Fund-level expenses do not include expenses of other investment companies in which the Fund invests which are borne indirectly by the Fund. The total amount of the waiver for the period ended December 31, 2007 was $16,711. There were no reimbursements during the period.
Aggressive Equity Fund — RIMCo contractually agreed to waive a portion of its 0.95% management fee, up to the full amount of that fee, equal to the amount by which the Fund’s total direct Fund-level operating expenses exceeded 1.05% of the Fund’s average daily net assets on an annual basis and to then reimburse the Fund for all remaining expenses, after fee waivers, that exceed 1.05% of the average daily net assets on an annual basis. Direct Fund-level expenses do not include expenses of other investment companies in which the Fund invests which are borne indirectly by the Fund. The total amount of the waiver for the period ended December 31, 2007 was $188,195. There were no reimbursements during the period.
Non-U.S. Fund — RIMCo contractually agreed to waive a portion of its 0.95% management fee, up to the full amount of that fee, equal to amount by which the Fund’s total direct Fund-level operating expenses exceeded 1.15% of the Fund’s average daily net assets on an annual basis and to then reimburse the Fund for all remaining expenses, after fee waivers, that exceed 1.15% of the average daily net assets on an annual basis. Direct Fund-level expenses do not include expenses of other investment companies in which the Fund invests which are borne indirectly by the Fund. The total amount of the waiver for the period ended December 31, 2007 was $118,717. There were no reimbursements during the period.
Core Bond Fund — RIMCo contractually agreed to waive a portion of its 0.60% management fee, up to the full amount of that fee, equal to the amount by which the Fund’s total direct Fund-level operating expenses exceeded 0.70% of the Fund’s average daily net assets on an annual basis and to then reimburse the Fund for all remaining expenses, after fee waivers, that exceed 0.70% of the average daily net assets on an annual basis. Direct Fund-level expenses do not include expenses of other investment companies in which the Fund invests which are borne indirectly by the Fund. The total amount of the waiver for the period ended December 31, 2007 was $196,055. There were no reimbursements during the period.
Through December 31, 2007 the Funds paid RIMCo a single management fee for advisory and administrative services. Beginning on January 1, 2008, the Funds began paying an advisory fee to RIMCo and an administrative fee to Russell Fund Services Company (“RFSC”). There was no change in the services provided to the Funds or, in aggregate, fees paid by the Funds for advisory and administrative services.
RIMCo and RFSC do not have the ability to recover amounts waived or reimbursed from previous periods.
Transfer and Dividend Disbursing Agent
Until January 1, 2008, RIMCo served as Transfer and Dividend Disbursing Agent for the Investment Company. For this service, RIMCo was paid a fee for transfer agency and dividend disbursing services provided to the Funds. RIMCo retained a portion of this fee for its services provided to the Funds and paid the balance to unaffiliated agents who assisted in providing these services. Total transfer agency fees paid by the Funds for the period ended December 31, 2007 were $88,021. Effective January 1, 2008, RFSC is the Funds’ Transfer and Dividend Disbursing Agent.
Accrued fees payable to affiliates as of December 31, 2007 were as follows:
| | | | | | | | | | | | | | | |
| | | Multi-Style
Equity Fund | | Aggressive
Equity Fund | | Non-U.S.
Fund | | Real Estate
Securities Fund | | Core
Bond Fund |
| | | | | | | | | | | | | | | |
Management fees | | $ | 334,197 | | $ | 206,686 | | $ | 401,601 | | $ | 361,826 | | $ | 173,313 |
Transfer agent fees | | | 3,475 | | | 1,667 | | | 3,129 | | | 3,734 | | | 2,422 |
Trustees’ fees | | | 1,923 | | | 995 | | | 1,688 | | | 2,734 | | | 1,210 |
| | | | | | | | | | | | | | | |
| | $ | 339,595 | | $ | 209,348 | | $ | 406,418 | | $ | 368,294 | | $ | 176,945 |
| | | | | | | | | | | | | | | |
Distributor
Pursuant to the Distribution Agreement with the Investment Company, Russell Fund Distributor, Inc. (“Distributor”), a wholly-owned subsidiary of RIMCo, serves as distributor for all Investment Company portfolio shares. The Distributor receives no compensation from the Investment Company for its services.
| | |
| 110 | | Notes to Financial Statements |
Russell Investment Funds
Notes to Financial Statements, continued — December 31, 2007
Affiliated Brokerage Commissions
The Funds will effect certain transactions through Russell Implementation Services Inc. (“RIS”) and its global network of unaffiliated correspondent brokers. RIS is a registered broker and investment adviser and an affiliate of RIMCo. Trades placed through RIS and its correspondents are made (i) to manage trading associated with changes in managers, rebalancing across existing managers, cash flows and other portfolio transitions or (ii) to execute portfolio securities transactions for each Fund’s assets that RIMCo determines not to allocate to money managers and for each Fund’s cash reserves.
Board of Trustees
Through December 31, 2007, the Russell Fund Complex consisted of Russell Investment Company, which had 32 Funds, and Russell Investment Funds (“RIF”), which had nine Funds. Each of the Trustees was a Trustee for both RIC and RIF. During the period, the Russell Fund Complex paid each of its independent Trustees a retainer of $52,000 per year, $6,500 for each regular quarterly meeting attended in person, $2,000 for each special meeting attended in person, and $2,000 for each Audit Committee meeting, Nominating and Governance Committee meeting, Investment Committee meeting or any other committee meeting established and approved by the Board that is attended in person. Each Trustee received a $500 fee for attending the meetings (quarterly, special, committee) by phone instead of receiving the full fee had the member attended in person. Trustees’ out of pocket expenses were also paid by the Russell Fund Complex. The Audit Committee Chair and Investment Committee Chair were each paid a fee of $12,000 per year and the Nominating and Governance Committee chair were each paid a fee of $6,000 per year. The chair person of the Board received additional annual compensation of $52,000.
Effective January 1, 2008, the Russell Fund Complex consists of RIC, which has 38 Funds, and RIF, which has nine Funds. Each of the Trustees is a Trustee of both RIC and RIF. During the period, the Russell Fund Complex paid each of its independent Trustees a retainer of $60,000 per year, $6,500 for each regular quarterly meeting attended in person, $2,500 for each special meeting attended in person, $2,500 for the Annual 38a-1 meeting attended in person, and $2,500 for each Audit Committee meeting, Nominating and Governance Committee meeting, Investment Committee meeting or any other committee meeting established and approved by the Board that is attended in person. Each Trustee receives a $1,000 fee for attending the quarterly and special meetings and a $500 fee for attending the committee meeting by phone instead of receiving the full fee had the member attended in person. Trustees’ out of pocket expenses are also paid by the Russell Fund Complex. The Audit Committee Chair and Investment Committee Chair are each paid a fee of $12,000 per year and the Nominating and Governance Committee Chair is paid a fee of $6,000 per year. The chair person of the Board receives additional annual compensation of $52,000.
At December 31, 2007, the Funds did not have any net tax basis capital loss carryforwards.
At December 31, 2007, the cost of investments, net unrealized appreciation (depreciation), undistributed ordinary income and undistributed long-term capital gains for income tax purposes were as follows:
| | | | | | | | | | | | | | | | | | | | |
| | | | | |
| | | Multi-Style
Equity Fund | | | Aggressive
Equity Fund | | | Non-U.S.
Fund | | | Real Estate
Securities Fund | | | Core Bond
Fund | |
| | | | | | | | | | | | | | | | | | | | |
Cost of Investments | | $ | 547,535,363 | | | $ | 318,281,537 | | | $ | 421,999,413 | | | $ | 522,750,961 | | | $ | 395,857,988 | |
| | | | | | | | | | | | | | | | | | | | |
Unrealized Appreciation | | $ | 60,599,870 | | | $ | 23,504,442 | | | $ | 59,119,311 | | | $ | 92,753,219 | | | $ | 9,416,107 | |
Unrealized Depreciation | | | (17,643,628 | ) | | | (14,602,969 | ) | | | (14,121,100 | ) | | | (32,568,793 | ) | | | (7,566,304 | ) |
| | | | | | | | | | | | | | | | | | | | |
Unrealized Appreciation
(Depreciation) | | $ | 42,956,242 | | | $ | 8,901,473 | | | $ | 44,998,211 | | | $ | 60,184,426 | | | $ | 1,849,803 | |
| | | | | | | | | | | | | | | | | | | | |
Undistributed Ordinary Income | | $ | 1,422,972 | | | $ | — | | | $ | — | | | $ | — | | | $ | 914,609 | |
Undistributed Long-Term Gains
(Capital Loss Carryforward) | | $ | 3,908,605 | | | $ | 43,227 | | | $ | 3,299,607 | | | $ | — | | | $ | 1,236,487 | |
Tax Composition of Distributions: | | | | | | | | | | | | | | | | | | | | |
Ordinary Income | | $ | 4,458,668 | | | $ | 11,613,955 | | | $ | 24,329,802 | | | $ | 15,097,748 | | | $ | 16,238,826 | |
Long-Term Capital Gains | | $ | 19,120,099 | | | $ | 18,841,913 | | | $ | 62,144,372 | | | $ | 63,607,866 | | | $ | — | |
As permitted by tax regulations, the Aggressive Equity Fund intends to defer a net realized capital loss of $617,700 incurred from November 1, 2007 to December 31, 2007.
| | |
| Notes to Financial Statements | | 111 |
Russell Investment Funds
Notes to Financial Statements, continued — December 31, 2007
| 6. | | Fund Share Transactions (amounts in thousands) |
Share transactions for the periods ended December 31, 2007 and December 31, 2006 were as follows:
| | | | | | | | | | | | | | |
| | | Shares | | | Dollars | |
| | | 2007 | | | 2006 | | | 2007 | | | 2006 | |
| | | | | | | | | | | | | | |
| | | | | | | | | | | | | | |
Multi-Style Equity Fund | | | | | | | | | | | | | | |
Proceeds from shares sold | | 3,423 | | | 3,072 | | | $ | 54,038 | | | $ | 43,060 | |
Proceeds from reinvestment of distributions | | 1,528 | | | 259 | | | | 23,579 | | | | 3,605 | |
Payments for shares redeemed | | (2,246 | ) | | (1,514 | ) | | | (35,711 | ) | | | (21,145 | ) |
| | | | | | | | | | | | | | |
Total net increase (decrease) | | 2,705 | | | 1,817 | | | $ | 41,906 | | | $ | 25,520 | |
| | | | | | | | | | | | | | |
| | | | | | | | | | | | | | |
| | | | | | | | | | | | | | |
Aggressive Equity Fund | | | | | | | | | | | | | | |
Proceeds from shares sold | | 1,325 | | | 2,111 | | | $ | 19,061 | | | $ | 32,794 | |
Proceeds from reinvestment of distributions | | 2,315 | | | 2,097 | | | | 30,456 | | | | 30,737 | |
Payments for shares redeemed | | (1,505 | ) | | (2,910 | ) | | | (21,845 | ) | | | (43,174 | ) |
| | | | | | | | | | | | | | |
Total net increase (decrease) | | 2,135 | | | 1,298 | | | $ | 27,672 | | | $ | 20,357 | |
| | | | | | | | | | | | | | |
| | | | | | | | | | | | | | |
| | | | | | | | | | | | | | |
Non-U.S. Fund | | | | | | | | | | | | | | |
Proceeds from shares sold | | 3,562 | | | 4,156 | | | $ | 52,185 | | | $ | 58,314 | |
Proceeds from reinvestment of distributions | | 6,481 | | | 1,115 | | | | 86,474 | | | | 16,452 | |
Payments for shares redeemed | | (1,975 | ) | | (4,464 | ) | | | (29,055 | ) | | | (61,747 | ) |
| | | | | | | | | | | | | | |
Total net increase (decrease) | | 8,068 | | | 807 | | | $ | 109,604 | | | $ | 13,019 | |
| | | | | | | | | | | | | | |
| | | | | | | | | | | | | | |
Real Estate Securities Fund | | | | | | | | | | | | | | |
Proceeds from shares sold | | 2,871 | | | 3,955 | | | $ | 60,833 | | | $ | 78,527 | |
Proceeds from reinvestment of distributions | | 4,945 | | | 2,646 | | | | 78,706 | | | | 54,893 | |
Payments for shares redeemed | | (5,015 | ) | | (2,929 | ) | | | (99,943 | ) | | | (55,946 | ) |
| | | | | | | | | | | | | | |
Total net increase (decrease) | | 2,801 | | | 3,672 | | | $ | 39,596 | | | $ | 77,474 | |
| | | | | | | | | | | | | | |
| | | | | | | | | | | | | | |
Core Bond Fund | | | | | | | | | | | | | | |
Proceeds from shares sold | | 8,092 | | | 5,342 | | | $ | 82,694 | | | $ | 54,242 | |
Proceeds from reinvestment of distributions | | 1,601 | | | 1,088 | | | | 16,240 | | | | 10,962 | |
Payments for shares redeemed | | (2,377 | ) | | (1,397 | ) | | | (24,283 | ) | | | (14,154 | ) |
| | | | | | | | | | | | | | |
Total net increase (decrease) | | 7,316 | | | 5,033 | | | $ | 74,651 | | | $ | 51,050 | |
| | | | | | | | | | | | | | |
| 7. | | Interfund Lending Program |
The Investment Company has been granted permission from the Securities and Exchange Commission to participate in a joint lending and borrowing facility (the “Credit Facility”). Funds of the Investment Company may borrow money from the RIC Money Market Fund for temporary purposes. All such borrowing and lending will be subject to a participating Fund’s fundamental investment limitations. The RIC Money Market Fund will lend through the program only when the returns are higher than those available from an investment in repurchase agreements or short-term reserves. The Funds will borrow through the program only when the costs are equal to or lower than the cost of bank loans. Interfund loans and borrowings normally extend overnight, but can have a maximum duration of seven days. Loans may be called on one business day’s notice. A participating Fund may have to borrow from a bank at a higher interest rate if an interfund loan is called or not renewed. Any delay in repayment to the RIC Money Market Fund could result in a lost investment opportunity or additional borrowing costs. For the period ended December 31, 2007, the Funds presented herein did not participate in the interfund lending program.
| | |
| 112 | | Notes to Financial Statements |
Russell Investment Funds
Notes to Financial Statements, continued — December 31, 2007
As of December 31, 2007, the following table includes shareholders of record with greater than 10% of the total outstanding shares of each respective Fund. The Northwestern Mutual Life Insurance Company separate accounts were the largest shareholder in each Fund.
| | | | |
| Funds | | # of Shareholders | | % |
Multi-Style Equity | | 2 | | 88.1 |
Aggressive Equity | | 2 | | 85.6 |
Non-U.S. | | 2 | | 92.8 |
Real Estate Securities | | 2 | | 87.2 |
Core Bond | | 2 | | 89.7 |
Restricted securities are subject to contractual limitations on resale, are often issued in private placement transactions, and are not registered under the Securities Act of 1933 (the “Act”). The most common types of restricted securities are those sold under Rule 144A of the Act and commercial paper sold under Section 4(2) of the Act.
A Fund may invest a portion of its net assets not to exceed 15% in securities that are illiquid. Illiquid securities are securities that may not be readily marketable, and that cannot be sold within seven days in the ordinary course of business at the approximate amount at which the Fund has valued the securities. Restricted securities are generally considered to be illiquid.
The following table lists restricted securities held by a Fund that are illiquid. The following table does not include (1) securities deemed liquid by RIMCo or a money manager pursuant to Board approved policies and procedures or (2) illiquid securities that are not restricted securities as designated on the Fund’s Schedule of Investments.
| | | | | | | | | | | |
Fund - % of Net Assets
Securities | | Acquisition
Date | | | Principal
Amount ($)
or Shares | | Cost per Unit
$ | | Cost
(000)
$ | | Market Value
(000)
$ |
| | | | | | | | | | | |
Core Bond Fund - 1.2% | | | | | | | | | | | |
Americo Life, Inc. | | 12/12/06 | | | 75,000 | | 102.46 | | 77 | | 77 |
American Express Credit Account Master Trust | | 03/09/07 | | | 207,160 | | 100.22 | | 208 | | 207 |
BNP Paribas Capital Trust | | 06/01/06 | | | 450,000 | | 112.21 | | 505 | | 482 |
Bombardier, Inc. | | 11/10/06 | EUR | | 125,000 | | 128.47 | | 161 | | 183 |
Catlin Insurance Co., Ltd. | | 01/11/07 | | | 100,000 | | 100.00 | | 100 | | 91 |
DG Funding Trust | | 11/04/03 | | | 49 | | 10,537.12 | | 516 | | 517 |
Gaz Capital for Gazprom | | 11/17/06 | | | 115,000 | | 100.00 | | 115 | | 110 |
News America, Inc. | | 11/08/07 | | | 225,000 | | 99.87 | | 225 | | 232 |
Parker Hannifin Employee Stock Ownership Trust | | 03/09/99 | | | 56,171 | | 100.00 | | 56 | | 56 |
Resona Preferred Global Securities Cayman, Ltd. | | 02/06/07 | | | 325,000 | | 103.67 | | 337 | | 322 |
Royal Bank of Scotland Group PLC | | 11/05/07 | | | 450,000 | | 100.69 | | 451 | | 449 |
SB Treasury Co. LLC | | 06/01/06 | | | 350,000 | | 106.80 | | 374 | | 357 |
SMFG Preferred Capital USD 1, Ltd. | | 12/13/06 | | | 100,000 | | 100.00 | | 100 | | 92 |
Symetra Financial Corp. | | 06/02/06 | | | 150,000 | | 98.31 | | 147 | | 149 |
Unicredit Luxembourg Finance SA | | 10/17/06 | | | 1,000,000 | | 100.00 | | 1,000 | | 998 |
| | | | | | | | | | | |
| | | | | | | | | | | 4,322 |
| | | | | | | | | | | |
Illiquid securities and restricted securities may be priced by the Funds using fair value procedures approved by the Board of Trustees.
| | |
| Notes to Financial Statements | | 113 |
Report of Independent Registered Public Accounting Firm
To the Board of Trustees and Shareholders
of the Russell Investment Funds:
In our opinion, the accompanying statements of assets and liabilities, including the schedules of investments, and the related statements of operations and of changes in net assets and the financial highlights present fairly, in all material respects, the financial position of Multi-Style Equity Fund, Aggressive Equity Fund, Non-U.S. Fund, Real Estate Securities Fund, and Core Bond Fund (five of the portfolios constituting the Russell Investment Funds, hereafter referred to as the “Funds”) at December 31, 2007, the results of each of their operations for the year then ended, the changes in each of their net assets for each of the two years in the period then ended and the financial highlights for each of the periods indicated, in conformity with accounting principles generally accepted in the United States of America. These financial statements and financial highlights (hereafter referred to as “financial statements”) are the responsibility of the Funds’ management; our responsibility is to express an opinion on these financial statements based on our audits. We conducted our audits of these financial statements in accordance with the standards of the Public Company Accounting Oversight Board (United States). Those standards require that we plan and perform the audit to obtain reasonable assurance about whether the financial statements are free of material misstatement. An audit includes examining, on a test basis, evidence supporting the amounts and disclosures in the financial statements, assessing the accounting principles used and significant estimates made by management, and evaluating the overall financial statement presentation. We believe that our audits, which included confirmation of securities at December 31, 2007 by correspondence with the custodian and brokers, provide a reasonable basis for our opinion.

Seattle, Washington
February 15, 2008
| | |
| 114 | | Report of Independent Registered Public Accounting Firm |
Russell Investment Funds
Tax Information — December 31, 2007 (Unaudited)
For the tax year ended December 31, 2007, the Funds hereby designate 100% or the maximum amount allowable, of its net taxable income as qualified dividends taxed at individual net capital gain rates.
The Form 1099 you receive in January 2008 will show the tax status of all distributions paid to your account in calendar year 2007.
The Funds designate dividends distributed during the fiscal year as qualifying for the dividends received deduction for corporate shareholders as follows:
| | | |
Multi-Style Equity Fund | | 100.0 | % |
Aggressive Equity Fund | | 15.9 | % |
Non-U.S. Fund | | 0.0 | % |
Real Estate Securities Fund | | 1.8 | % |
Core Bond Fund | | 0.0 | % |
Pursuant to Section 852 of the Internal Revenue Code, the Funds designate the following amounts as long-term capital gain dividends for their taxable year ended December 31, 2007:
| | | |
| | | Long-Term
Capital Gains |
| | | |
Multi-Style Equity Fund | | $ | 19,120,099 |
Aggressive Equity Fund | | | 18,841,913 |
Non-U.S. Fund | | | 62,144,372 |
Real Estate Securities Fund | | | 63,607,866 |
Core Bond Fund | | | — |
Please consult a tax adviser for any questions about federal or state income tax laws.
The Non-U.S. Fund paid foreign taxes of $789,631 and recognized $9,844,235 of foreign source income during the taxable year ended December 31, 2007. Pursuant to Section 853 of the Internal Revenue Code, the Fund designates $.0241 per share of foreign taxes paid and $.3010 of gross income per share earned from foreign sources in the taxable year ended December 31, 2007.
Russell Investment Funds
Basis for Approval of Investment Advisory Contracts (Unaudited)
Approval of Investment Advisory Agreement
The Board of Trustees, including all of the Independent Trustees, considered and approved the continuation of the management agreement with RIMCo (the “RIMCo Agreement”) and the portfolio management contract with each Money Manager of the Funds (collectively, the “portfolio management contracts”) at a meeting held on April 24, 2007. During the course of a year, the Trustees receive a wide variety of materials regarding the investment performance of the Funds, sales and redemptions of the Funds’ shares, and the management of the Funds by RIMCo. In preparation for the annual review, the Independent Trustees, with the advice and assistance of their independent counsel, also requested and the Board considered (1) information and reports prepared by RIMCo relating to the services provided by RIMCo (and its affiliates) to the Funds; (2) information (the “Third-Party Information”) received from an independent, nationally recognized provider of investment company information comparing the performance of each of the Funds and their respective operating expenses over various periods of time with other peer funds (“Comparable Funds”) not managed by RIMCo believed by the provider to be generally comparable in investment objectives and size to the Funds; and (3) RIMCo’s response to questions from the Board concerning the Third-Party Information addressing, among other things, performance and expense differentials between certain Funds and their respective Comparable Funds. The foregoing information requested by the Trustees or provided by RIMCo is collectively called the “Agreement Renewal Information.” The Independent Trustees also received a memorandum from their independent counsel discussing the legal standards for their consideration of the proposed continuances.
On April 23, 2007, the Independent Trustees met to review the Agreement Renewal Information in a private session with their independent counsel at which no representatives of RIMCo or management were present. At the April 24 meeting of the Board of Trustees, the Board, including the Independent Trustees, reviewed the proposed continuance of the RIMCo Agreement and the portfolio management contracts with management and independent counsel to the Independent Trustees. Presentations made by RIMCo to the Board as part of this review encompassed the Funds and all other RIMCo-managed funds for which the Board has supervisory responsibility. Following this review, but prior to voting, the Independent Trustees again met in a private session with their independent counsel to evaluate additional information and analyses received from RIMCo and management at the Board meeting. The discussion below reflects all of these reviews.
In evaluating the portfolio management contracts, the Board considered that the Funds, in employing a manager-of-managers method of investment, operate in a manner that is distinctly different from most other investment companies. In the case of most other investment companies, an advisory fee is paid by the investment company to its adviser which in turn employs and compensates individual portfolio managers to make specific securities selections consistent with the adviser’s style and investment philosophy. RIMCo has engaged multiple Money Managers for all Funds.
The Board considered that RIMCo (rather than any Money Manager) is responsible under the RIMCo Agreement for determining, implementing and maintaining the investment program for each Fund. Assets of each Fund generally have been allocated among the multiple Money Managers selected by RIMCo, subject to Board approval, for that Fund. RIMCo manages directly a portion of certain Funds’ assets employing a “select holdings strategy,” as described below, and directly manages the investment of each Fund’s cash reserves. RIMCo also may manage directly any portion of each Fund’s assets that RIMCo determines not to allocate to the Money Managers and portions of a Fund during transitions between Money Managers. In all cases, assets are managed directly by RIMCo in accordance with the RIMCo Agreement.
RIMCo is responsible for selecting, subject to Board approval, Money Managers for each Fund and for actively managing allocations and reallocations of assets among the Money Managers. RIMCo’s goal is to construct and manage diversified portfolios in a risk aware manner. Each Money Manager for a Fund in effect performs the function of an individual portfolio manager who is responsible for selecting portfolio securities for the portion of the Fund assigned to it by RIMCo (each, a “segment”) in accordance with the Fund’s applicable investment objective, policies and restrictions, any constraints placed by RIMCo upon their selection of portfolio securities and the Money Manager’s specified role in a Fund. RIMCo is responsible for communicating performance expectations to each Money Manager; supervising compliance by each Money Manager with each Fund’s investment objective and policies; authorizing Money Managers to engage in certain investment strategies for a Fund; and recommending annually to the Board whether portfolio management contracts should be renewed, modified or terminated. In addition to its annual recommendation as to the renewal, modification or termination of portfolio management contracts, RIMCo is responsible for recommending to the Board the restructuring of Fund segments and additions of new Money Managers or replacements of existing Money Managers at any time when, based on RIMCo’s research and ongoing review and analysis, such actions are appropriate. RIMCo may assign specific investment constraints from time to time for each Money Manager intended to capitalize on the strengths of that Money Manager or to coordinate the investment activities of Money Managers for the Fund in a complementary manner. Therefore, RIMCo’s selection of
| | |
| 116 | | Basis for Approval of Investment Advisory Contracts |
Russell Investment Company
Basis for Approval of Investment Advisory Contracts, continued (Unaudited)
Money Managers is made not only on the basis of performance considerations but anticipated compatibility with other Money Managers in the same Fund. In light of the foregoing, the overall performance of each Fund over appropriate periods reflects, in great part, the performance of RIMCo in designing the Fund’s investment program, structuring the Fund, selecting an effective Money Manager with a particular investment style or sub-style for a segment that is complementary to the styles of the Money Managers of other Fund segments, and allocating assets among the Money Managers in a manner designed to achieve the objectives of the Fund.
The Board considered that the prospectuses for the Funds and other public disclosures emphasize to investors RIMCo’s role as the principal investment manager for each Fund, rather than the investment selection role of the Funds’ Money Managers, and describe the manner in which the Funds operate so that investors may take that information into account when deciding to purchase shares of any such Fund.
The Board also considered the special expertise of RIMCo with respect to the manager-of-managers structure of the Funds and the likelihood that, at the current expense ratio of each such Fund, there would be no acceptable alternative investment managers to replace RIMCo on comparable terms given the need to continue the manager-of-managers strategy of each such Fund selected by shareholders in purchasing their shares.
In addition to these general factors relating to the manager-of-managers structure of the Funds, the Trustees considered, with respect to each Fund, various specific factors in evaluating renewal of the RIMCo Agreement, including the following:
| 1. | The nature, scope and quality of the services provided to the Fund by RIMCo; |
| 2. | The management fee paid by the Fund to RIMCo and the fact that it encompasses all investment advisory fees paid by the Fund, including the fees for any Money Managers of such Fund; |
| 3. | Information provided by RIMCo as to other fees and benefits received by RIMCo or its affiliates from the Fund, including any administrative, transfer agent, cash management and securities lending fees, soft dollar arrangements and commissions in connection with portfolio securities transactions; |
| 4. | Information provided by RIMCo as to expenses incurred by the Fund; and |
| 5. | Information provided by RIMCo as to the profits that RIMCo derives from its mutual fund operations generally and from the Fund. |
As noted above, RIMCo pursuant to the terms of the RIMCo Agreement directly manages a portion — up to 10% — of the assets of the Multi-Style Equity Fund (the “Participating Fund”) utilizing a select holdings strategy, the actual allocation being determined by the Participating Fund’s RIMCo portfolio manager. The select holdings strategy utilized by RIMCo in managing such assets for the Participating Fund is designed to increase the Participating Fund’s exposure to stocks that are viewed as attractive by multiple Money Managers of the Participating Fund. The Board reviewed the results of the select holdings strategy in respect of the Participating Fund since implementation taking into account that the strategy has been utilized for a limited period of time. The Trustees considered that RIMCo would not be required to pay investment advisory fees to a Money Manager with respect to assets for which the select holdings strategy is utilized and that the profits derived by RIMCo generally and from the Participating Fund consequently may increase incrementally. The Board, however, also considered RIMCo’s advice that it will pay certain Money Managers additional fees for providing information and other services in connection with the select holdings strategy and expects to incur additional costs in carrying out the select holdings strategy; the limited amount of assets that are managed directly by RIMCo pursuant to the select holdings strategy; and the fact that the aggregate investment advisory fees paid by the Participating Fund are not increased as a result of the select holdings strategy.
At the April 24 Board meeting, RIMCo and management discussed the reasonableness of the Funds’ investment advisory fees. In discussing whether the Funds’ performance supported these fees, RIMCo noted differences between the investment strategies of certain Funds and their respective Comparable Funds in pursuing their investment objectives, including Fund strategies which seek to achieve a lower tracking error (i.e., the difference, whether positive or negative, between the return of a fund and its benchmark) and resulting lower return volatility than Comparable Funds. According to RIMCo, these strategies may be expected to result, and for certain Funds during the periods covered by the Third-Party Information did result, in lower performance than that of some of their respective Comparable Funds. RIMCo stated that the strategies pursued by the Funds are intended to result in less volatile, more moderate returns relative to each Fund’s performance benchmark rather than more volatile, more extreme returns that its Comparable Funds may experience over time.
| | |
| Basis for Approval of Investment Advisory Contracts | | 117 |
Russell Investment Company
Basis for Approval of Investment Advisory Contracts, continued (Unaudited)
On the basis of the Agreement Renewal Information, and other information previously received by the Board from RIMCo during the course of the year or presented at the April 24 Board meeting by RIMCo, the Board, in respect of each Fund, found, after giving effect to any applicable waivers and/or reimbursements (1) the management fee charged by RIMCo to be reasonable in light of the nature, scope and quality of the services provided to the Funds; (2) the relative expense ratio of the Fund was comparable to those of its Comparable Funds; (3) RIMCo’s methodology of allocating expenses of operating funds in the complex was reasonable; and (4) RIMCo’s profitability with respect to the Fund was not excessive in light of the nature, scope and quality of the services provided by RIMCo. The Board also concluded that the performance of each of the Funds supported continuation of the RIMCo Agreement. In evaluating performance, the Board considered each Fund’s absolute performance and its performance relative to appropriate benchmarks and indices and its Comparable Funds. The Board also considered RIMCo’s investment strategy of managing the Funds in a risk aware manner.
At the April 24 Board meeting, the Board considered for each Fund whether economies of scale have been realized and whether the fees for such Fund appropriately reflect or should be revised to reflect any such economies. The Board determined that the management fees for each Fund appropriately reflect any economies of scale realized by that Fund, based upon such factors as the variability of Money Manager investment advisory fees and other factors associated with the manager-of-managers structure employed by the Funds. The Trustees considered that fees payable to RIMCo by institutional clients with investment objectives similar to those of the Funds and other funds under the Board’s supervision are lower, and may, in some cases, be substantially lower, than the rates paid by the Funds. The Trustees reviewed with RIMCo the differences in the scope of services it provides to institutional clients and the Funds. In response to the Trustees’ inquiries, RIMCo noted, among other things, that institutional clients have fewer administrative needs than the Funds. It was further noted by RIMCo that since the Funds must constantly issue and redeem their shares, they are more difficult to manage than institutional accounts, where assets are relatively stable. Accordingly, the Trustees did not regard these fee differences as relevant to their deliberations.
After considering the foregoing and other relevant factors, the Board concluded that continuation of the RIMCo Agreement on its current terms and conditions would be in the best interests of the Funds and their respective shareholders and voted to approve the continuation of the agreement.
At the April 24 Board meeting, with respect to the evaluation of the terms of portfolio management contracts with Money Managers, the Board received and considered information from RIMCo reporting for each Money Manager, among other things, the Money Manager’s performance over various periods; RIMCo’s assessment of the performance of each Money Manager; any significant business relationships between the Money Manager and RIMCo or Russell Fund Distributors, Inc. (“RFD”), the Funds’ underwriter; and RIMCo’s recommendation to retain the Money Manager at the current fee rate, to retain the Money Manager at a reduced fee rate or to terminate the Money Manager. RIMCo recommended that each Money Manager be retained at its current fee rate. RIMCo has advised the Board that it does not regard Money Manager profitability as relevant to its evaluation of the portfolio management contracts with Money Managers because the willingness of Money Managers to serve in such capacity depends upon arm’s-length negotiations with RIMCo; RIMCo is aware of the fees charged by Money Managers to other clients; and RIMCo believes that the fees agreed upon with Money Managers are reasonable in light of the anticipated quality of investment advisory services to be rendered. The Board accepted RIMCo’s explanation in light of the Board’s findings as to the reasonableness of the aggregate investment advisory fees paid by each Fund and the fact that each Money Manager’s fee is paid by RIMCo.
Based substantially upon RIMCo’s recommendations together with the information received from RIMCo in support of its recommendations at the April 24 meeting, the Board concluded that the fees paid to the Money Managers of each Fund are reasonable in light of the quality of the investment advisory services provided and that continuation of the portfolio management agreement with each Money Manager of each Fund would be in the best interests of the Fund and its shareholders.
In their deliberations, the Trustees did not identify any particular information as to the RIMCo Agreement or, other than RIMCo’s recommendation, the portfolio management agreement with any Money Manager that was all-important or controlling and each Trustee attributed different weights to the various factors considered. The Trustees evaluated all information available to them on a Fund-by-Fund basis and their determinations were made in respect of each Fund.
Subsequently, the Board of Trustees received the following proposals from RIMCo: (1) at a meeting held on May 22, 2007, to effect a money manager change for the Real Estate Securities Fund and the Non-US Fund; (2) at a meeting held on July 23, 2007, to effect a money manager change for the RIF Multi-Style Equity Fund; (3) at a meeting held on August 28, 2007, to effect a money manager change for the RIF Multi-Style Equity Fund and the RIF Aggressive Equity Fund; (4) at a meeting held on October 26, 2007, to effect a money manager change for the RIF Multi-Style Equity Fund resulting from a change of control of one of the Fund’s Money Managers (5) at a meeting held on December 4, 2007, to effect a money manager change for the RIF Multi-style Equity Fund. In the
| | |
| 118 | | Basis for Approval of Investment Advisory Contracts |
Russell Investment Company
Basis for Approval of Investment Advisory Contracts, continued (Unaudited)
case of each such proposed change, the Trustees approved the terms of the portfolio management contract with the new Money Manager based substantially upon RIMCo’s recommendation to hire the Money Manager at the proposed fee rate; any significant business relationships between the Money Manager and RIMCo or Russell Fund Distributors, Inc., the Fund’s underwriter; RIMCo’s explanation as to the lack of relevance of profitability to the evaluation of portfolio management contracts with Money Managers because the willingness of Money Managers to serve in such capacity depends upon arm’s-length negotiations with RIMCo; RIMCo’s awareness of the fees charged by the Money Manager to other clients; and RIMCo’s belief that the proposed investment advisory fees would be reasonable in light of the anticipated quality of investment advisory services to be rendered. The Trustees also considered their findings at their April 24 meeting as to the reasonableness of the aggregate investment advisory fees paid by the Fund, and the fact that the aggregate investment advisory fees paid by the Fund would not increase as a result of the proposed Money Manager change because the Money Managers’ investment advisory fee is paid by RIMCo.
At a meeting held on December 4, 2007, the Board of Trustees, including each of the Independent Trustees, unanimously voted to approve the amendment and restatement of the Funds’ management agreement with RIMCo (the “Management Agreement”) to reflect an internal RIMCo restructuring. The Management Agreement was amended to delete references to certain administrative services that formerly had been performed by RIMCo but that going forward would be performed by Russell Fund Services Company (“RFSC”), an affiliate of RIMCo, pursuant to an administrative services agreement with the Funds (the “Administrative Agreement”). The Management Agreement was further amended to reduce the fee payable to RIMCo under the Management Agreement by 5 basis points (0.05%) and to change its title from Management Agreement to Advisory Agreement.
In connection with its consideration of the amended Management Agreement, the Board received and reviewed materials from RIMCo relating to the amended Management Agreement and the Administrative Agreement, and received an in-person presentation by RIMCo personnel at the December 4, 2007 meeting. The Board considered RIMCo’s view that the separation of investment management and administrative services between RIMCo and RFSC will enhance RIMCo’s ability to track revenue, expense and profitability associated with the provision of both types of services. The Board considered that RFSC is a wholly-owned subsidiary of RIMCo that was formed to perform transfer agent and Fund administrative services for the Funds. The Board considered that the same personnel who formerly performed investment management and administrative services for the Funds on behalf of RIMCo would perform those services on behalf of RIMCo and RFSC, respectively, for the same aggregate fees under the same contractual terms. The Board also considered that RIMCo has agreed to guarantee RFSC’s performance of its obligations as Fund administrator and to assume any liability or obligation incurred or undertaken by RFSC with respect to RIF under the Administrative Agreement.
The Board noted RIMCo’s representation that the nature, extent and quality of the services to be provided by RIMCo and RFSC under the amended Management Agreement and the Administrative Agreement would be the same as the nature, extent and quality of the services that previously had been provided to the Funds by RIMCo. The Board noted that under the Administrative Agreement, RFSC will receive a fee of 0.05% calculated on an annual basis of the Funds’ average daily net assets. Thus, the combined fees payable by the Funds under both amended Management Agreement and the Administrative Agreement will not exceed the fee payable under the Management Agreement prior to its amendment. The Board considered that the fee to be paid under the Administrative Agreement is the same as the fee that is paid pursuant to RIMCo’s administrative agreement with Russell Investment Company, which had been renewed by the Board in April 2007.
The Board noted that it had received and considered extensive information relating to the Management Agreement in connection with its renewal of the Management Agreement at its meeting held on April 24, 2007, and that it is scheduled to consider the renewal of the Advisory Agreement and the Administrative Agreement in April of 2008. The Board also took into account information provided to the Board at its meetings since April 2007, including reports on Fund performance, compliance, shareholder services, and the other services provided to the Fund by RIMCo and its affiliates. The Board considered the representation of the Funds’ Chief Compliance Officer that she was not aware of any material compliance matters that had not been previously disclosed to the Board. Under the circumstances, the conclusions reached by the Board in approving the renewal of the Management Agreement at its meeting held on April 24, 2007 generally were not changed in any material respect by the proposal for the amendment and restatement of the Management Agreement.
After considering the foregoing and other relevant factors, the Board concluded that approval of the amended Management Agreement would be in the best interests of the Funds and their respective shareholders, and voted to approve the amended Management Agreement. In reaching this decision, the Board did not assign relative weights to the factors discussed above or deem any one or group of them to be controlling in and of themselves. The Board was advised by the Funds’ counsel that, under the circumstances, the Agreement did not require any approvals other than the Board’s approval. The Independent Trustees were advised by separate independent legal counsel on their consideration of the Management and Administrative Agreements.
| | |
| Basis for Approval of Investment Advisory Contracts | | 119 |
Russell Investment Funds
Shareholder Requests for Additional Information — December 31, 2007 (Unaudited)
A complete unaudited schedule of investments is made available generally no later than 60 days after the end of the first and third quarters of each year. These reports are available (i) free of charge, upon request, by calling the Fund at (800) 787-7354, (ii) on the Securities and Exchange Commission’s website at www.sec.gov, and (iii) at the Securities and Exchange Commission’s public reference room.
The Board has delegated to RIMCo, as RIF’s investment adviser, the primary responsibility for monitoring, evaluating and voting proxies solicited by or with respect to issuers of securities in which assets of the Funds may be invested. RIMCo has established a proxy voting committee (“Committee”) and has adopted written proxy voting policies and procedures (“P&P”) and proxy voting guidelines (“Guidelines”). The Funds maintain a Portfolio Holdings Disclosure Policy that governs the timing and circumstances of disclosure to shareholders and third parties of information regarding the portfolio investments held by a Fund. A description of the P&P, Guidelines, Portfolio Holdings Disclosure Policy and additional information about Fund Directors are contained in the Funds’ Statement of Additional Information (“SAI”). The SAI is available (i) free of charge, upon request, by calling the Funds at (800) 787-7354, and (ii) on the Securities and Exchange Commission’s website at www.sec.gov.
If possible, depending on contract owner registration and address information, and unless you have otherwise opted out, only one copy of the RIF prospectus and each annual and semi-annual report will be sent to contract owners at the same address. If you would like to receive a separate copy of these documents, please contact your Insurance Company. If you currently receive multiple copies of the prospectus, annual report and semi-annual report and would like to request to receive a single copy of these documents in the future, please call your Insurance Company. Some Insurance Companies may offer electronic delivery of the Fund’s prospectus and annual and semiannual reports. Please contact your Insurance Company for further details.
| | |
| 120 | | Shareholder Requests for Additional Information |
Russell Investment Funds
Disclosure of Information about Fund Directors — December 31, 2007 (Unaudited)
The following tables provide information for each officer and trustee of the Russell Fund Complex. The Russell Fund Complex consists of Russell Investment Company (“RIC”), which has 38 funds, and Russell Investment Funds (“RIF”), which has 9 funds. Each of the trustees is a trustee of both RIC and RIF. The first table provides information for the interested trustee. The second table provides information for the independent trustees. The third table provides information for the trustees emeritus. The fourth table provides information for the officers.
| | | | | | | | | | |
Name, Age, Address | | Position(s) Held with Fund and Length of Time Served | | Term of Office* | | Principal Occupation(s) During the Past 5 Years | | No. of
Portfolios
in Russell
Fund
Complex
Overseen
by Trustee | | Other
Directorships Held
by Trustee |
INTERESTED TRUSTEES |
#Greg J. Stark Born May 3, 1968 909 A Street Tacoma, Washington 98402-1616 | | • President and Chief Executive Officer since 2004 • Trustee since 2007 | | • Appointed until successor is duly elected and qualified • Until successor is chosen and qualified by Trustees | | • President and CEO RIC and RIF • Chairman of the Board, President and CEO, RIMCo • Chairman of the Board, President and CEO, RFD • Chairman of the Board and President, Russell Insurance Agency, Inc. (insurance agency (“RIA”)) • Until 2004, Managing Director, of Individual Investor Services, FRC • 2000 to 2004 Managing Director, Sales and Client Service, RIMCo | | 47 | | None |
| # | Mr. Stark is also an officer and/or director of one or more affiliates of RIC and RIF and is therefore an Interested Trustee. |
| | | | | | | | | | |
Name, Age, Address | | Position(s) Held with Fund and Length of Time Served | | Term of Office* | | Principal Occupation(s) During the Past 5 Years | | No. of
Portfolios
in Russell
Fund
Complex
Overseen
by Trustee | | Other
Directorships Held
by Trustee |
INDEPENDENT TRUSTEES |
Thaddas L. Alston Born April 7, 1945 909 A Street Tacoma, Washington 98402-1616 | | Trustee since 2006 | | Appointed until successor is duly elected and qualified | | • Senior Vice President, Larco Investments, Ltd. (real estate firm) | | 47 | | None |
| |
Kristianne Blake Born January 22, 1954 909 A Street Tacoma, Washington 98402-1616 | | • Trustee since 2000 • Chairperson since 2005 | | • Appointed until successor is duly elected and qualified • Annual | | • Director and Chairman of the Audit Committee, Avista Corp. • Trustee and Chairman of the Operations Committee, Principal Funds and Principal Variable Contracts Funds • Regent, University of Washington • President, Kristianne Gates Blake, P.S. (accounting services) • February 2002 to June 2005, Chairman of the Audit Committee, RIC and RIF • Trustee and Chairman of the Operations and Distribution Committee, WM Group of Funds, 1999-2006 | | 47 | | • Director, Avista Corp; (electric utilities) • Trustee, Principal Investors Funds (investment company); • Trustee, Principal Variable Contracts Funds (investment company) |
| * | Each Trustee is subject to mandatory retirement at age 72. |
| | |
| Disclosure of Information about Fund Directors | | 121 |
Russell Investment Funds
Disclosure of Information about Fund Directors, continued — December 31, 2007 (Unaudited)
| | | | | | | | | | |
Name, Age, Address | | Position(s) Held with Fund and Length of Time Served | | Term of Office* | | Principal Occupation(s) During the Past 5 Years | | No. of
Portfolios
in Russell
Fund
Complex
Overseen
by Trustee | | Other
Directorships Held
by Trustee |
INDEPENDENT TRUSTEES (continued) |
Daniel P. Connealy Born June 6, 1946 909 A Street Tacoma, Washington 98402-1616 | | • Trustee since 2003 • Chairman of Audit Committee since 2005 | | • Appointed until successor is duly elected and qualified • Appointed until successor is duly elected and qualified | | • June 2004 to present, Senior Vice President and Chief Financial Officer, Waddell & Reed Financial, Inc. • 2001–2003, Vice President and Chief Financial Officer, Janus Capital Group Inc. | | 47 | | None |
| |
Jonathan Fine Born July 8, 1954 909 A Street Tacoma, Washington 98402-1616 | | Trustee since 2004 | | Appointed until successor is duly elected and qualified | | • President and Chief Executive Officer, United Way of King County, WA | | 47 | | None |
| |
Raymond P. Tennison, Jr. Born December 21, 1955 909 A Street Tacoma, Washington 98402-1616 | | • Trustee since 2000 • Chairman of the Nominating and Governance Committee since 2007 | | • Appointed until successor is duly elected and qualified. • Appointed until successor is duly elected and qualified | | • President, Simpson Investment Company and several additional subsidiary companies, including Simpson Timber Company, Simpson Paper Company and Simpson Tacoma Kraft Company | | 47 | | None |
| |
Jack R. Thompson Born March 21, 1949 909 A Street Tacoma, Washington 98402-1616 | | Trustee since 2005 | | Appointed until successor is duly elected and qualified | | • September 2003 to present, Independent Board Chair and Chairman of the Audit Committee, Sparx Funds • September 2007 to present, Director, Life Advantage Corporation (health products company) • May 1999 to May 2003, President, Chief Executive Officer and Director, Berger Financial Group, LLC • May 1999 to May 2003, President and Trustee, Berger Funds | | 47 | | • Director, Sparx Japan Funds (investment company) • Director, Life Advantage Corporation (health products company) |
| |
Julie W. Weston Born October 2, 1943 909 A Street Tacoma, Washington 98402-1616 | | • Trustee since 2002 • Chairperson of the Investment Committee since 2006 | | • Appointed until successor is duly elected and qualified • Appointed until successor is duly elected and qualified | | • Retired | | 47 | | None |
| * | Each Trustee is subject to mandatory retirement at age 72. |
| | |
| 122 | | Disclosure of Information about Fund Directors |
Russell Investment Funds
Disclosure of Information about Fund Directors, continued — December 31, 2007 (Unaudited)
| | | | | | | | | | |
Name,
Age,
Address | | Position(s) Held
with Fund and
Length of
Time Served | | Term
of
Office | | Principal Occupation(s)
During the
Past 5 Years | | No. of
Portfolios
in Russell
Fund
Complex
Overseen
by Trustee | | Other
Directorships Held
by Trustee |
TRUSTEES EMERITUS |
*George F. Russell, Jr. Born July 3, 1932 909 A Street Tacoma, Washington 98402-1616 | | Trustee Emeritus and Chairman Emeritus since 1999 | | Until resignation or removal | | • Director Emeritus, Frank Russell Company (investment consultant to institutional investors (“FRC”)); and RIMCo • Chairman Emeritus, RIC and RIF; Russell Implementation Services Inc. (broker-dealer and investment adviser (“RIS”)); Russell 20-20 Association (non-profit corporation); and Russell Trust Company (non-depository trust company (“RTC”)) • Chairman, Sunshine Management Services, LLC (investment adviser) | | 47 | | None |
| |
Paul E. Anderson Born October 15, 1931 909 A Street Tacoma, Washington 98402-1616 | | Trustee Emeritus since 2007 | | Five year term | | • President, Anderson Management Group LLC (private investments consulting) • February 2002 to June 2005, Lead Trustee, RIC and RIF • Trustee of RIC and RIF Until 2006 • Chairman of the Nominating and Governance Committee 2006 | | 47 | | None |
| |
William E. Baxter Born June 8, 1925 909 A Street Tacoma, Washington 98402-1616 | | Trustee Emeritus since 2004 | | Five year term | | • Retired since 1986 • Trustee of RIC and RIF Until 2004 | | 47 | | None |
| |
Lee C. Gingrich Born October 6, 1930 909 A Street Tacoma, Washington 98402-1616 | | Trustee Emeritus since 2006 | | Five year term | | • Retired since 1995 • Trustee of RIC and RIF Until 2005 • Chairman of the Nominating and Governance Committee 2001–2005 | | 47 | | None |
| |
Eleanor W. Palmer Born May 5, 1926 909 A Street Tacoma, Washington 98402-1616 | | Trustee Emeritus since 2004 | | Five year term | | • Retired since 1981 • Trustee of RIC and RIF Until 2004 | | 47 | | None |
| * | Mr. Russell is also a director emeritus of one or more affiliates of RIC and RIF. |
| | |
| Disclosure of Information about Fund Directors | | 123 |
Russell Investment Funds
Disclosure of Information about Fund Directors, continued — December 31, 2007 (Unaudited)
| | | | | | |
Name,
Age,
Address | | Position(s) Held
with Fund and
Length of
Time Served | | Term
of
Office | | Principal Occupation(s)
During the
Past 5 Years |
OFFICERS |
Greg J. Stark Born May 3, 1968 909 A Street Tacoma, Washington 98402-1616 | | President and Chief Executive Officer since 2004 | | Until successor is chosen and qualified by Trustees | | • President and CEO, RIC and RIF • Chairman of the Board, President and CEO, RIMCo • Chairman of the Board, President and CEO, RFD • Chairman of the Board and President, Russell Insurance Agency, Inc. (insurance agency (“RIA”)) • Until 2004, Managing Director of Individual Investor Services, FRC • 2000 to 2004, Managing Director, Sales and Client Service, RIMCo |
| |
Cheryl Wichers Born December 16, 1966 909 A Street Tacoma, Washington 98402-1616 | | Chief Compliance Officer since 2005 | | Until removed by Independent Trustees | | • Chief Compliance Officer, RIC • Chief Compliance Officer, RIF • Chief Compliance Officer, RIMCo • April 2002–May 2005, Manager, Global Regulatory Policy • 1998–2002, Compliance Supervisor, Russell Investment Group |
| |
Thomas F. Hanly Born November 17, 1964 909 A Street Tacoma, Washington 98402-1616 | | Chief Investment Officer since 2004 | | Until removed by Trustees | | • Chief Investment Officer, RIC, RIF, FRC, RTC • Director and Chief Investment Officer, RIMCo and RFD • 1999 to 2003, Chief Financial Officer, FRC, RIC and RIF |
| |
Mark E. Swanson Born November 26, 1963 909 A Street Tacoma, Washington 98402-1616 | | Treasurer and Chief Accounting Officer since 1998 | | Until successor is chosen and qualified by Trustees | | • Treasurer, Chief Accounting Officer and CFO, RIC and RIF • Director, Funds Administration, RIMCo, RTC and RFD • Treasurer and Principal Accounting Officer, SSgA Funds |
| |
Gregory J. Lyons Born August 24, 1960 909 A Street Tacoma, Washington 98402-1616 | | Secretary since 2007 | | Until successor is chosen and qualified by Trustees | | • Associate General Counsel and Assistant Secretary FRC and RIA • Director and Secretary, RIMCo and RFD • Secretary and Chief Legal Counsel, RIC and RIF |
| | |
| 124 | | Disclosure of Information about Fund Directors |
Russell Investment Funds
Matter Submitted to a Vote of Shareholders — December 31, 2007 (Unaudited)
There was a Special Meeting in Lieu of Annual Meeting of Shareholders of the Russell Investment Funds (“the Investment Company”) held at 909 A Street, Tacoma, Washington on October 25, 2007.
THE FOLLOWING MATTERS WERE VOTED UPON AT THE MEETING
The result of each vote accompany the description of each matter
1. Election of Trustees.
Vote:
| | | | | | |
| | | For | | | | Against |
Greg J. Stark | | 131,623,711.552 | | | | 3,323,807.727 |
Thaddas L. Alston | | 131,489,307.992 | | | | 3,458,211.287 |
Kristianne Blake | | 131,522,555.852 | | | | 3,424,963.427 |
Daniel P. Connealy | | 131,542,379.471 | | | | 3,405,139.808 |
Jonathan Fine | | 131,349,760.255 | | | | 3,597,759.024 |
Raymond P. Tennison, Jr. | | 131,542,839.379 | | | | 3,404,679.900 |
Jack R. Thompson | | 131,672,873.051 | | | | 3,274,646.228 |
Julie W. Weston | | 131,622,933.964 | | | | 3,324,585.315 |
2. Approve Changes to the Liquidation Provision of the Master Trust Agreement.
Vote:
| | | | | | |
| | | For | | Against | | Abstain |
Multi-Style Equity Fund | | 26,571,421.430 | | 1,473,016.661 | | 945,738.311 |
Aggressive Equity Fund | | 14,073,975.361 | | 1,203,040.304 | | 387,374.580 |
Non-U.S. Fund | | 24,903,274.660 | | 2,282,057.532 | | 954,356.046 |
Real Estate Securities Fund | | 26,373,509.805 | | 1,886,263.836 | | 917,491.771 |
Core Bond Fund | | 27,813,496.627 | | 1,548,105.451 | | 895,032.461 |
3. Approve Changes to the Reorganization Provision of the Master Trust Agreement.
Vote:
| | | | | | |
| | | For | | Against | | Abstain |
Multi-Style Equity Fund | | 26,566,516.191 | | 1,508,835.774 | | 914,824.438 |
Aggressive Equity Fund | | 14,057,232.761 | | 1,233,973.367 | | 373,184.117 |
Non-U.S. Fund | | 24,822,374.272 | | 2,352,786.803 | | 964,527.163 |
Real Estate Securities Fund | | 26,344,938.642 | | 1,958,408.709 | | 873,918.062 |
Core Bond Fund | | 27,653,188.331 | | 1,778,080.714 | | 825,365.493 |
4. Approve a status change for the Real Estate Securities Fund.
Vote:
| | | | | | |
| | | For | | Against | | Abstain |
Real Estate Securities Fund | | 26,380,293.990 | | 1,865,014.262 | | 931,957.161 |
| | |
| Matter Submitted to a Vote of Shareholders | | 125 |
Russell Investment Funds
909 A Street, Tacoma, Washington 98402
(800) 787-7354
Interested Trustees
Greg J. Stark
Independent Trustees
Thaddas L. Alston
Kristianne Blake
Daniel P. Connealy
Jonathan Fine
Raymond P. Tennison, Jr.
Jack R. Thompson
Julie W. Weston
Trustees Emeritus
George F. Russell, Jr.
Paul E. Anderson
William E. Baxter
Lee C. Gingrich
Eleanor W. Palmer
Officers
Greg J. Stark, President and Chief Executive Officer
Cheryl Wichers, Chief Compliance Officer
Thomas F. Hanly, Chief Investment Officer
Mark E. Swanson, Treasurer and Chief Accounting Officer
Gregory J. Lyons, Secretary
Adviser
Russell Investment Management Company
909 A Street
Tacoma, WA 98402
Administrator and Transfer and Dividend Disbursing Agent
Russell Fund Services Company
909 A Street
Tacoma, WA 98402
Custodian
State Street Bank and Trust Company
Josiah Quincy Building
200 Newport Avenue
North Quincy, MA 02171
Office of Shareholder Inquiries
909 A Street
Tacoma, WA 98402
(800) 787-7354
Legal Counsel
Dechert LLP
200 Clarendon Street, 27th Floor
Boston, MA 02116-5021
Distributor
Russell Fund Distributors, Inc.
909 A Street
Tacoma, WA 98402
Independent Registered Public Accounting Firm
PricewaterhouseCoopers LLP
1420 5th Avenue
Suite 1900
Seattle, WA 98101
Money Managers as of December 31, 2007
Multi-Style Equity Fund
Arnhold and S. Bleichroeder Advisers, LLC, New York, NY
Columbus Circle Investors, Stamford, CT
DePrince, Race & Zollo, Inc., Winter Park, FL
Institutional Capital LLC, Chicago, IL
Jacobs Levy Equity Management, Inc., Florham Park, NJ
Montag & Caldwell, Inc., Atlanta, GA
Suffolk Capital Management, LLC, New York, NY
Aggressive Equity Fund
ClariVest Asset Management LLC, San Diego, CA
David J. Greene and Company, LLC, New York, NY
DePrince, Race & Zollo, Inc., Winter Park, FL
Gould Investment Partners LLC, Berwyn, PA
Jacobs Levy Equity Management, Inc., Florham Park, NJ
PanAgora Asset Management, Inc., Boston, MA
Ranger Investment Management, L.P., Dallas, TX
Tygh Capital Management, Inc., Portland, OR
Non-U.S. Fund
Altrinsic Global Advisors, LLC, Stamford, CT
AQR Capital Management, LLC, Greenwich, CT
MFS Institutional Advisors, Inc., Boston, MA
Wellington Management Company, LLP, Boston, MA
Real Estate Securities Fund
AEW Management and Advisors, L.P., Boston, MA
Cohen & Steers Capital Management, Inc., New York, NY
Heitman Real Estate Securities LLC, Chicago, IL
INVESCO Institutional (N.A.), Inc. which acts as a money manager to the Fund through its INVESCO Real Estate division, Dallas, TX
RREEF America L.L.C., Chicago, IL
Core Bond Fund
Bear Stearns Asset Management Inc., New York, NY
Goldman Sachs Asset Management, L.P., New York, NY
Pacific Investment Management Company LLC, Newport Beach, CA
This report is prepared from the books and records of the Funds and is submitted for the general information of shareholders and is not authorized for distribution to prospective investors unless accompanied or preceded by an effective Prospectus. Nothing herein contained is to be considered an offer of sale or a solicitation of an offer to buy shares of Russell Investment Funds. Such offering is made only by Prospectus, which includes details as to offering price and other material information.
| | |
| 126 | | Manager, Money Managers and Service Providers |
| | | | |
| Russell Investment Funds | | 909 A Street | | 800-787-7354 |
| | Tacoma, Washington 98402 | | Fax: 253-591-3495 |
| | | | www.russell.com |


36-08-022

2007 ANNUAL REPORT
Russell Investment Funds
Lifepoints® Variable Target Portfolio Series
DECEMBER 31, 2007
FUND
Moderate Strategy Fund
Balanced Strategy Fund
Growth Strategy Fund
Equity Growth Strategy Fund

Russell Investment Funds
Russell Investment Funds is a series investment company with nine different investment portfolios referred to as Funds. These financial statements report on four of these Funds.
Russell Investment Funds
LifePoints® Funds
Variable Target Portfolio Series
Annual Report
December 31, 2007
Table of Contents
Russell Investment Funds - LifePoints® Funds Variable Target Portfolio Series
Copyright© Russell Investments 2008. All rights reserved.
Russell Investment Group is a Washington, USA corporation, which operates through subsidiaries worldwide and is a subsidiary of The Northwestern Mutual Life Insurance Company.
Fund objectives, risks, charges and expenses should be carefully considered before investing. A prospectus containing this and other important information must precede or accompany this material. Please read the prospectus carefully before investing.
Securities distributed through Russell Fund Distributors, Inc. member Financial Industry Regulatory Authority, part of Russell Investment Group.
Russell Investment Group and Standard & Poor’s Corporation are the owners of the trademarks, service marks, and copyrights related to their respective indexes. Index performance is not indicative of the performance of any specific investment. Indexes are not managed and may not be invested in directly.
Performance quoted represents past performance and does not guarantee future results. The investment return and principal value of an investment will fluctuate so that shares, when redeemed, may be worth more or less than their original cost. Current performance may be lower or higher than the performance data quoted.
To Our Shareholders
Thank you for taking the time to review Russell Investment Funds’ 2007 Annual Report. The portfolio management discussions and fund-specific details will give you a deeper understanding of fund performance for the fiscal year ended December 31, 2007.
Every day, we strive to improve financial security for people and earn the continued support of our investors.
Our decades of experience evaluating global markets — and the people who make investment decisions in them — extends through numerous cycles, trends and turnarounds. It’s a perspective that allows us to deliver you long-term investment strategies.
Our dedicated money manager research analysts and portfolio managers perform the vital work to select some of the world’s best managers for the funds. This deliberate combination of investment managers is intended to help provide more consistent returns through all kinds of market environments.
We appreciate your continued support.
Regards,

Greg Stark
Chief Executive Officer, Chairman and President
Russell Investment Management Company
To Our Shareholders
Thank you for taking the time to review Russell Investment Funds’ 2007 Annual Report. The portfolio management discussions and fund-specific details will give you a deeper understanding of fund performance for the fiscal year ended December 31, 2007.
Every day, we strive to improve financial security for people and earn the continued support of our investors.
Our decades of experience evaluating global markets — and the people who make investment decisions in them — extends through numerous cycles, trends and turnarounds. It’s a perspective that allows us to deliver you long-term investment strategies.
Our dedicated money manager research analysts and portfolio managers perform the vital work to select some of the world’s best managers for the funds. This deliberate combination of investment managers is intended to help provide more consistent returns through all kinds of market environments.
We appreciate your continued support.
Regards,
Greg Stark
Chief Executive Officer, Chairman and President
Russell Investment Management Company
Russell Investment Funds
Market Summary as of December 31, 2007 (Unaudited)
U.S. Equity Markets
For the fiscal year ending December 31, 2007, US equity markets were positive, with the broad market Russell 3000® Index returning 5.1%. Stocks benefited from increased merger and acquisition activity during the first half of the year, and from surprisingly strong corporate profits. For the fiscal year, the growth rates of gross domestic product and corporate profits remained strong but decelerated toward year end. After almost four years of double-digit profit growth, earnings growth fell to single digit levels.
The housing slowdown that began in the summer of 2006 continued through this fiscal year, and was further impacted by rising default rates in subprime loans. At the same time, there was significant weakness in the US dollar, as it depreciated against all major currencies. In the fiscal year, The Federal Reserve Board lowered the federal funds rate three times, the first such cuts in four years, citing the slowing pace of economic expansion and the intensification of the housing correction as the reason behind the cuts. The period also saw significantly higher commodity prices across the board due in part to significant global demand from developing nations.
Although the domestic economy was decelerating, the U.S. equity market was buoyed by strong exports to faster growing developing, non-U.S. economies. With approximately 40% of U.S. corporation’s revenues derived from international customers, the declining U.S. dollar provided increased demand for U.S. products abroad.
In the wake of these powerful macroeconomic forces, the fiscal year was a transitional one marked by three distinct themes: Multinational companies with exposure to developing markets outpaced domestically-driven companies, growth companies fared better than their value counterparts and U.S. large capitalization stocks outperformed U.S. small capitalization stocks.
US companies with revenue streams that could benefit either directly or indirectly from the expanding global economy were rewarded over the fiscal year. The best performing sectors in the Russell 3000® Index were those that had some tie to the global markets — commodities, technology, and industrials. Agriculture and fertilizer stocks led the Russell 3000® Index due to increased global demand for food and an increase in corn production due to ethanol demand. Similarly, commodities related companies, especially copper, benefited from the construction boom in Asia and elsewhere. For the fiscal year, the other energy sector of the Russell 3000® Index returned 38.9%, the integrated oils sector returned 29.6%, and the materials and processing sector returned 26.0%.
The worst performing sectors in the Russell 3000® Index were those tied closely to domestic consumer spending and the housing and subprime markets, particularly mortgage lenders. The repercussions of the developments in the subprime lending market and the resulting housing slowdown caused homebuilders and building related industries to struggle as well. The financial services sector returned - -16.3% for the fiscal year and consumer discretionary sector returned -3.6%, both significantly trailing the Russell 3000® Index return of 5.1%.
Russell Investment Funds
Reversing a trend that had prevailed for the last six years, growth stocks outperformed value stocks over the fiscal year. Growth and momentum factors were rewarded over the period, especially exposure to high price to book stocks and those with high historical growth rates. The Russell 1000® Growth Index returned 11.8% while the Russell 1000® Value Index returned -0.2%. A similar trend was seen in small cap markets, with the Russell 2000® Growth Index and Russell 2000® Value Index returning 7.1% and -9.8%, respectively.
In a turnaround from the previous fiscal year, large capitalization stocks outperformed small capitalization stocks. The Russell 1000® Index returned 5.8% for the fiscal year, while the Russell 2000® Index returned -1.6%. The larger in capitalization a company was, the better its returns were over the fiscal period. Microcap stocks struggled even more than the broader small cap Russell 2000® Index, with the Russell Microcap Index returning -8.0% for the fiscal year.
During the fiscal year, the market environment was largely favorable for active growth managers. The Lipper Large Cap Growth Funds Average outperformed the Russell 1000® Growth Index by 2.33%, as active managers held companies with strong momentum that were growing faster than the companies in the Russell 1000® Growth Index. The period was also favorable for active value managers who typically do not have as much exposure to the financial services sector as the Russell 1000® Value Index. The Lipper® Large Cap Value Funds Average outperformed the Russell 1000® Value Index by 2.28%. The market environment was more challenging for active core, or market-oriented, managers as the markets were driven by commodity based companies, not an area where market-oriented managers typically focus. The Lipper® Large Cap Core Funds Average barely trailed the Russell 1000® Index by 0.19% net of fees, but modestly outperformed on a gross of fee basis. The Lipper® Small Cap Core Funds Average slightly outpaced the Russell 2000® Index by 0.18%.
U.S. Real Estate Markets
For the fiscal year ending December 31, 2007, real estate investment trusts (REITs) generated a -15.69% return, as measured by the FTSE NAREIT Equity Index. As well as being well below the overall U.S. equity market return, this return represented a substantial pull-back from the prior year’s return of 35.06%. The low REIT return was also accompanied by exceptionally high volatility during the period. In January, REITs were up over 8%; in June and July, REITs lost over 16%. From August through October, REITs rallied with a gain of over 12% and, finally, during the last two months, REITs experienced a decline of over 13%.
Early in the fiscal year, the REIT market continued to be driven by the same factors that made the prior year so successful, mainly mergers and acquisitions by private investors acquiring public REITs at large premiums to their share prices. The most prominent privatization was Equity Office Property, the industry’s largest REIT, which became the prize in a bidding war between Blackstone, a private equity firm and Vornado, a public company. The REIT market peaked at all-time record levels in mid-February 2007. At that time, while property market fundamentals were improving and REIT earnings were solid, REIT pricing appeared to be well ahead of earnings expectations.
By June 2007, concerns arose among REIT investors that problems in the residential subprime mortgage loan market would be a precursor to similar issues in the commercial mortgage market. Additionally, the 0.6% increase in the 10 year treasury rate which occurred during that month caused investors to reassess the capitalization rates used to value real estate. These events combined to put substantial downward pressure on REIT share prices.
During the last few months of the year, REITs suffered along with the other financial sector stocks as sentiment turned decidedly negative for this broad market sector. Concerns about a weaker economy and
Russell Investment Funds
tightened credit put upward pressure on dividend yields and contributed to higher capitalization rates and discount rates used to value underlying properties. Over the course of the year, the average dividend yield for companies in the FTSE NAREIT Equity Index increased sharply, from 3.69% to 4.91%. In the fourth quarter, the average dividend yield increased from 4.12% to 4.91%. REITs ended the year with dividend yields trading at a premium to the 10-year Treasuries, which ended the year at 4.03%.
Non-U.S. Equity Markets
Non-U.S. stocks gained 11.17% as measured by the MSCI EAFE Index for the fiscal year ending December 31, 2007. Non-U.S. stocks were boosted as the U.S. dollar weakened over the course of the fiscal year. In local currency, the MSCI EAFE Index rose 3.54% over the 12-month period.
The market continued to benefit from global growth, merger and acquisition activity and strong corporate earnings, especially in the first half of the year. In the second half of the year, the market withstood several periods of increased market volatility brought on by investors’ risk aversion relating to the potential negative spillover effects of the developments in the subprime lending market and housing slowdown in the U.S. Growth in emerging economies, like India and China, also had a positive impact on the strength of developed markets through their demand for goods and infrastructure development throughout the year.
Europe, as represented by the MSCI Europe Index, returned 13.86% over the fiscal year. Merger and acquisition-related gains combined with strong earnings drove European equities higher, with merger-and-acquisition activity in the year surpassing last year’s record pace. Across Europe, the best performing sectors were materials and utilities, up 38.95% and 33.00%, respectively. By country, Germany was a notable contributor to performance, benefiting from the strong performance of its automobiles industry. Elsewhere, MSCI United Kingdom Index lagged Continental Europe with a gain of 8.36%. The U.K. underperformed the rest of Europe due to weakness in its financials sector.
The MSCI Japan Index continued to lag other major non-U.S. markets in the fiscal year, with a return of -4.23% for the year. Investor concerns included weak economic data, lackluster earnings, and political turmoil. Elsewhere in the region, the MSCI Pacific ex-Japan Index gained 30.73% with strong gains in the Hong Kong, Singapore and Australian markets.
From a sector perspective, materials stocks had the best returns, up 31.75%, especially in the area of metals and mining, which was driven by industry consolidation and the continued upturn in commodities prices. Telecommunication services, up 28.21%, also benefited from strong earnings results. Health care and financials were the notable laggards, returning 0.55% and -1.82%, respectively, as measured by the MSCI EAFE health care and financials sector groupings.
The year also saw a change in market leadership from previous years, both in terms of style and market cap. Market leadership during the period favored growth stocks, with the MSCI EAFE Growth Index rising 16.45%, compared with 5.96% for the MSCI EAFE Value Index. Investors, in general, favored larger capitalization stocks over smaller capitalization stocks with the S&P/Citigroup PMI World ex-U.S. Index (an index of larger capitalization companies) up 14.17% in the period versus the S&P/Citigroup EMI World ex–U.S. (in index of smaller capitalization companies) up 7.32%.
Markets not represented in the MSCI EAFE Index, but commonly included in non-U.S. stock funds, offered significant opportunities for gains during the period. Emerging markets outperformed their developed counterparts, as the MSCI Emerging Markets Index rose 39.39%. Emerging markets countries benefited from continued strong economic growth, which benefited the materials and industrials sectors (both posting over
Russell Investment Funds
60% returns for the period.) Canadian stocks, as measured by the MSCI Canada Index, rose 29.57% during the period.
U.S. Fixed Income Markets
The Lehman Brothers U.S. Aggregate Bond Index, a broad measure of U.S. investment grade fixed income securities, returned 6.97% for the year ended December 31, 2007. All major sub-sectors trailed U.S. Treasuries as the subprime crisis largely caused a widespread “flight to quality” throughout fixed income markets, where investors moved their capital away from riskier investments to the safest possible investments (in this case U.S. Treasuries).
There were two predominant factors that affected fixed income markets throughout fiscal 2007. The first, occurring during the third quarter of calendar 2007, took the form of a massive re-pricing of risk across many fixed income sectors, largely as a result of developments within the subprime lending market. The second was the Federal Reserve’s second and third quarter cuts to the target federal funds rate for overnight loans between banks, combined with the global liquidity plan the Fed orchestrated with other major central banks.
The Subprime Market
Subprime borrowers are often defined loosely as those borrowers with higher risk/higher interest rate loans because of lack of income documentation, poor credit history, and/or high loan-to-value ratios. The proliferation of the subprime mortgages — and securities firms packaging the subprime debt into AAA-rated bonds — helped fuel the U.S. housing boom over the past decade.
Many factors contributed to a surge in what some regard as looser mortgage lending practices in late 2005 and 2006. The strength of the real estate market created additional demand for mortgage-backed securities, including those that were backed by subprime loans. This increased the potential profit for originating subprime mortgages, loans which many banks had previously avoided making because of their higher default risk. Traditional requirements to obtaining a mortgage (such as proof of income, a down payment or a moderate loan-to-value ratio) were abandoned and adjustable rate loans with artificially low introductory rates and interest-only loans became more common. Record low interest rates and loosening lending standards assisted in pushing real estate prices to record highs and resulted in a record number of re-financings. A high level of liquidity in the market enabled investment banks to borrow more to produce more “structured” financial products. This included buying lower credit rated mortgage-backed securities and re-packaging them into higher rated collateralized debt obligations (CDOs), which were in turn re-introduced into the market.
Problems in the subprime market appeared during the fourth quarter of 2006 when borrower delinquencies reached a four-year high1. Adjustable rate mortgages reset to higher rates and some borrowers could not afford to make the new higher monthly payments. The housing market began to cool, with some borrowers now owing more than their homes were worth.
Concerns increased in May 2007 when the U.S. housing market continued to soften and, for the first time since 1991, national home prices posted a year-over-year decrease2. During 2007, the level of payment delinquencies and early defaults on mortgage loans to subprime borrowers increased significantly. Demand for CDOs evaporated and mortgage lenders no longer had easy access to capital to originate loans. Investors became more risk averse and a flight to quality ensued.
1 | Bloomberg, U.S. Subprime Mortgage Delinquencies at 4-Year High, 13-Mar-07. |
2 | Bloomberg, Fed Sees Housing Dampening Growth Longer than Expected (per S&P/Case-Shiller study), 30-May-07. |
Russell Investment Funds
The subsequent fallout from developments in the subprime market has been widespread. The housing market, consumer confidence and companies in the financial services sector were negatively impacted. Access to capital became more constrained resulting in less liquidity in the markets and a “credit crunch” (an environment where investment capital is difficult to obtain). Some mortgage lenders declared bankruptcy or exited the business. Non-U.S. Treasury fixed income sectors generally performed poorly as investors moved out of those sectors and into U.S. Treasuries. The uncertainty surrounding the extent of the impact to the global economy led to market volatility and impacted equity and fixed income markets around the globe.
The Federal Reserve’s rate cuts and global liquidity plan
On two separate occasions during the third quarter of 2007, the Federal Reserve (“the Fed”) cut the target rate for overnight loans between banks. On September 18, the Fed lowered the target rate by 0.50% to 4.75%, the first rate change since the Fed last raised the target to 5.25% in June 2006. The reason cited for the cut was that “the tightening of credit conditions has the potential to intensify the housing correction and to restrain economic growth more generally” and that the rate cut “is intended to help forestall some of the adverse effects on the broader economy that might otherwise arise from the disruptions in financial markets and to promote moderate growth over time”3. On October 31, a further 0.25% cut lowered the target rate to 4.50%, with the Fed stating that inflation and growth risks were approximately balanced.
On December 11, the Fed cut the target rate for overnight loans between banks by 25 basis points (less than the anticipated 50 basis point cut) to 4.25%, stating that recent developments “have increased the uncertainty surrounding the outlook for economic growth and inflation.” Stocks declined and Treasuries surged as investors thought that the move was not sufficient to hold off an economic downturn. The following day the Fed, in conjunction with the European Central Bank (ECB) and central banks in England, Switzerland and Canada, announced the biggest act of global economic cooperation since the September 11th terrorist attacks, a multi-stage plan designed to provide liquidity to the stressed credit markets. In a related move, the ECB flooded financial markets with $500 billion in two-week loans to banks, the largest amount ever extended in a single move by the ECB. This was done in order to maintain liquidity in other markets at year-end.
Prior to the Fed rate cuts, the flight to quality pushed up U.S. Treasury prices, which, in turn, lowered their yields (also referred to as a downward shift in the yield curve). The Fed’s rate cuts propelled this downward progression of yields across all maturities. During 2007, yields on 2-year maturity Treasuries declined 1.76 % while yields on 10-year maturities declined 0.68%. A major change was the yield curve shifting from its beginning-of-year inverted (i.e. downward sloping) position by steepening significantly between 2- and 10-year maturities. The 2-year/10-year spread widened 1.08%, going from (0.11)% to 0.98%.
3 | Bloomberg, Fed Surprises with a 50-basis point Rate Cut, 18-Sep-07. |
(This page intentionally left blank)
Russell Investment Funds
Moderate Strategy Fund
Portfolio Management Discussion and Analysis — December 31, 2007 (Unaudited)
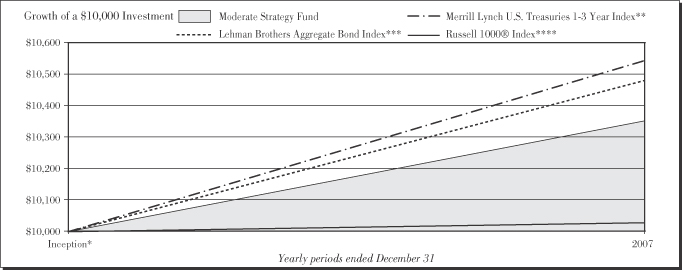
| | | | | |
| |
| Moderate Strategy Fund | | | |
| | | Total
Return | |
Inception* | | | | 3.54 | % |
| | | | | |
|
| Merrill Lynch U.S. Treasuries 1-3 Year Index** | |
| | | Total
Return | |
Inception* | | | | 5.46 | % |
| | | | | |
|
| Lehman Brothers Aggregate Bond Index*** | |
| | | Total
Return | |
Inception* | | | | 4.82 | % |
| | | | | |
|
| Russell 1000® Index**** | |
| | | Total
Return | |
Inception* | | | | 0.29 | % |
| * | | The Fund commenced operation on April 30, 2007. |
| ** | | Merrill Lynch U.S. Treasuries 1-3 Year Index is an index composed of approximately 160 issues in the form of publicly placed, coupon-bearing US Treasury debt. Issues must carry a term to maturity of at least one year and par amounts outstanding must be no less than $10 million at the start and at the close of the performance measurement periods. |
| *** | | Lehman Brothers Aggregate Bond Index is composed of securities from Lehman Brothers Government/Corporate Bond Index, Mortgage Backed Securities Index, and the Asset-Backed Securities Index. Total return comprises price appreciation/depreciation and income as a percentage of the original investment. Indexes are rebalanced monthly by market capitalization. |
**** | | Russell 1000® Index includes the 1,000 largest companies in the Russell 3000® Index. The Russell 1000® Index represents the universe of stocks from which most active money managers typically select. The Russell 1000® Index return reflects adjustments from income dividends and capital gain distributions reinvested as of the ex-dividend dates. |
Performance is historical and assumes reinvestment of all dividends and capital gains. Investment return and principal value will fluctuate so that an investor’s shares, when redeemed, may be worth more or less than when purchased. Past performance is not indicative of future results.
| | |
| 10 | | Moderate Strategy Fund |
Russell Investment Funds
Moderate Strategy Fund
Portfolio Management Discussion and Analysis — December 31, 2007 (Unaudited)
The Fund is a fund of funds that invests in other Russell Investment Funds and Russell Investment Company mutual funds (the “Underlying Funds”). The Underlying Funds allocate most of their assets among multiple money managers. Russell Investment Management Company (“RIMCo”), as the Underlying Funds’ advisor, may change the allocation of the Underlying Funds’ assets among money managers at any time. An exemptive order from the Securities and Exchange Commission (SEC) permits RIMCo to engage or terminate a money manager in an Underlying Fund at any time, subject to the approval by the Underlying Fund’s Board without a shareholder vote.
What is the Fund’s investment objective?
The Moderate Strategy Fund (“Fund”) seeks to provide high current income and moderate long term capital appreciation.
How did the Fund perform relative to its benchmark for the fiscal year ended December 31, 2007?
For the period April 30, 2007 (inception of the Fund) through December 31, 2007, the Moderate Strategy Fund gained 3.54%. This compared to the Lehman Brothers Aggregate Bond Index, which gained 4.82% during the same period. The Fund’s returns relative to Lehman Brothers Aggregate Bond Index were dampened by exposure to equities, especially from U.S. real estate.
The Fund’s performance includes operating expenses, whereas the Index returns are unmanaged and do not include expenses of any kind.
How did the market conditions described in the Market Summary report affect the Fund’s performance?
The Fund is a fund of funds and its performance is based on the performance of the underlying mutual funds (the “Underlying Funds”) in which it invests. The largest impact on performance was from the re-pricing of risk (i.e., the market demanding increased compensation for assuming a given level of risk).
In the fixed income markets, all major sub-sectors trailed U.S. Treasuries as the subprime crisis caused a widespread “flight to quality.” The Fund has a 60% allocation to a fixed income Underlying Fund whose money managers held consumer-related fixed income investments in the mortgage-backed and asset-backed securities, which negatively impacted performance in these sectors. Several managers of the fixed income Underlying Fund anticipated the short-term interest rate decline and increased sensitivity to interest rates benefiting that Underlying Fund. As the Federal Reserve lowered the federal funds rate, intermediate maturity yields declined resulting in a shift in the yield curve. The Underlying Fund’s money managers anticipated the change and varied the maturity of their securities, thus benefiting the Fund.
The performance of the equity Underlying Funds dampened the Fund’s return for the fiscal year relative to the Fund’s fixed income Lehman Brothers Aggregate Bond Index. While the allocation to the emerging markets Underlying Fund added to performance, the allocation to the real estate Underlying Fund offset this.
How did the investment strategies and techniques employed by the Fund and its money managers of the Underlying Funds affect the Fund’s performance?
At the Fund level, exposure to emerging markets equity bolstered returns; however, exposure to both U.S. and non-U.S. equities offset those gains. Exposure to the fixed income markets strengthened returns, while REITs were a drag on performance.
In the fixed income Underlying Fund, two of the three managers benefited from yield curve and sector allocation decisions, duration management and investments in securities outside of the U.S. One manager faced a challenging environment due to duration positioning and exposure to securitized products such as mortgage-backed and asset-backed securities.
The emerging markets, non-U.S., and global Underlying Funds provided strong absolute returns. The emerging markets Underlying Fund led all other asset classes due to strong demand for energy and materials and continued cash inflows into these markets. The non-U.S. developed market Underlying Fund added value through its positioning in growth stocks, an underweight in Japan and exposure to non-benchmark emerging markets stocks. The global equity Underlying Fund benefited from emerging markets exposure and strong stock selection. Sector allocations partly dampened these gains, as did weak stock selection in Europe.
The U.S. equity Underlying Funds maintained an overall preference for companies with above-average growth rates and attractive valuations. That positioning was rewarded in an environment where growth outpaced value. These Underlying Funds benefited from growing global demand through exposure to infrastructure and agricultural stocks. Strong stock selection in industrials, technology, and health care and an underweight to financials sectors contributed to returns. Quantitatively managed strategies faced a difficult environment due to their valuation bias and dampened the U.S. equity segment return.
The real estate Underlying Fund focused primarily on the larger and more liquid REITs during the fiscal year. With the exceptional volatility experienced during the period due to the subprime mortgage crisis and substantial cash outflows, this positioning hurt Fund performance. Non-dedicated REIT investors typically trade the more liquid securities when they rotate into or out of the sector.
| | |
| Moderate Strategy Fund | | 11 |
Russell Investment Funds
Moderate Strategy Fund
Portfolio Management Discussion and Analysis — December 31, 2007 (Unaudited)
Describe any changes to the Fund’s structure or allocation to the Underlying Funds.
The Fund opened on April 30, 2007. No changes were made to the Fund’s structure or allocation to the Underlying Funds.
The views expressed in this report reflect those of the portfolio managers only through the end of the period covered by the report. These views do not necessarily represent the views of Russell Investment Management Company (RIMCo), or any other person in RIMCo or any other affiliated organization. These views are subject to change at any time based upon market conditions or other events, and RIMCo disclaims any responsibility to update the views contained herein. These views should not be relied on as investment advice and, because investment decisions for a Russell Investment Fund (RIF) or Russell Investment Company (RIC) Fund are based on numerous factors, should not be relied on as an indication of investment decisions of any RIF or RIC Fund.
| | |
| 12 | | Moderate Strategy Fund |
Russell Investment Funds
Moderate Strategy Fund
Shareholder Expense Example — December 31, 2007 (Unaudited)
Fund Expenses
The following disclosure provides important information regarding each Fund’s Expense Example, which appears on each Fund’s individual page in this Annual Report. Please refer to this information when reviewing the Expense Example for a Fund.
Example
As a shareholder of the Fund, you incur two types of costs: (1) transaction costs, and (2) ongoing costs, including management fees and other Fund expenses. The Example is intended to help you understand your ongoing costs (in dollars) of investing in the Fund and to compare these costs with the ongoing costs of investing in other mutual funds. The Example is based on an investment of $1,000 invested at the beginning of the period and held for the entire period indicated, which for this Fund is from July 1, 2007 to December 31, 2007.
Actual Expenses
The information in the table under the heading “Actual Performance” provides information about actual account values and actual expenses. You may use the information in this column, together with the amount you invested, to estimate the expenses that you paid over the period. Simply divide your account value by $1,000 (for example, an $8,600 account value divided by $1,000 = 8.6), then multiply the result by the number in the first column in the row entitled “Expenses Paid During Period” to estimate the expenses you paid on your account during this period.
Hypothetical Example for Comparison Purposes
The information in the table under the heading “Hypothetical Performance (5% return before expenses)” provides information about hypothetical account values and hypothetical expenses based on the Fund’s actual expense ratio and an assumed rate of return of 5% per year before expenses, which is not the Fund’s actual return. The hypothetical account values and expenses may not be used to estimate the actual ending account balance or expenses you paid for the period. You may use this information to compare the ongoing costs of investing in the Fund and other funds. To do so, compare this 5% hypothetical example with the 5% hypothetical examples that appear in the shareholder reports of other funds.
Please note that the expenses shown in the table are meant to highlight your ongoing costs only and do not reflect any transactional costs. Therefore, the information under the heading “Hypothetical Performance (5% return before expenses)” is useful in comparing ongoing costs only, and will not help you determine the relative total costs of owning different funds. In addition, if these transactional costs were included, your costs would have been higher.
| | | | | | |
| | | Actual
Performance | | Hypothetical
Performance
(5% return
before expenses) |
| | | | | | |
Beginning Account Value
July 1, 2007 | | $ | 1,000.00 | | $ | 1,000.00 |
| Ending Account Value December 31, 2007 | | $ | 1,034.30 | | $ | 1,024.65 |
Expenses Paid During Period* | | $ | 0.56 | | $ | 0.56 |
| * | Expenses are equal to the Fund’s annualized expense ratio of 0.11% (representing the six month period annualized), multiplied by the average account value over the period, multiplied by 184/365 (to reflect the six month period). Reflects amounts waived and/or reimbursed by the investment adviser. Without the waiver and/or reimbursement, expenses would have been higher. |
| | |
| Moderate Strategy Fund | | 13 |
Russell Investment Funds
Moderate Strategy Fund
Schedule of Investments — December 31, 2007
Amounts in thousands (except share amounts)
| | | | |
| | | Shares | | Market
Value $ |
| | | | |
Investments - 100.0% | | | | |
Other Russell Investment Funds (“RIF”) and Russell Investment Company (“RIC”) Series Mutual Funds - Class S Shares | | | | |
| | |
| Bonds - 60.0% | | | | |
RIF Core Bond Fund | | 503,192 | | 5,193 |
| | | | |
| | |
| Domestic Equities - 25.8% | | | | |
RIF Aggressive Equity Fund | | 19,843 | | 258 |
RIF Multi-Style Equity Fund | | 54,609 | | 854 |
RIC Quantitative Equity Fund | | 22,247 | | 855 |
RIF Real Estate Securities Fund | | 17,262 | | 263 |
| | | | |
| | | | 2,230 |
| | | | |
| | |
| International Equities - 14.2% | | | | |
RIC Emerging Markets Fund | | 8,373 | | 189 |
RIC Global Equity Fund | | 24,635 | | 257 |
RIF Non-U.S. Fund | | 59,525 | | 785 |
| | | | |
| | | | 1,231 |
| | | | |
| | |
| Total Investments - 100.0% | | | | |
(identified cost $8,819) | | | | 8,654 |
| | |
Other Assets and Liabilities, Net - 0.0% | | | | — |
| | | | |
Net Assets - 100.0% | | | | 8,654 |
| | | | |
Presentation of Portfolio Holdings — December 31, 2007
| | | |
| |
| Categories | | % of Net
Assets | |
| | | |
Bonds | | 60.0 | |
Domestic Equities | | 25.8 | |
International Equities | | 14.2 | |
| | | |
Total Investments | | 100.0 | |
Other Assets and Liabilities, Net | | — | * |
| | | |
| |
| | 100.0 | |
| | | |
| * | Less than .05% of net assets. |
See accompanying notes which are an integral part of the financial statements.
| | |
| 14 | | Moderate Strategy Fund |
(This page intentionally left blank)
Russell Investment Funds
Balanced Strategy Fund
Portfolio Management Discussion and Analysis — December 31, 2007 (Unaudited)
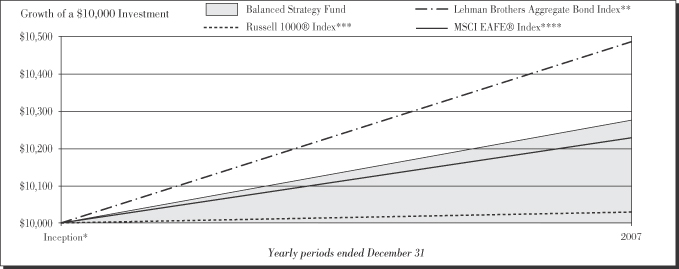
| | | | | |
|
| Balanced Strategy Fund | |
| | | Total
Return | |
Inception* | | | | 2.73 | % |
| | | | | |
|
| Lehman Brothers Aggregate Bond Index** | |
| | | Total
Return | |
Inception* | | | | 4.82 | % |
| | | | | |
|
| Russell 1000® Index*** | |
| | | Total
Return | |
Inception* | | | | 0.29 | % |
| | | | | |
|
| MSCI EAFE® Index**** | |
| | | Total
Return | |
Inception* | | | | 2.27 | % |
| * | | The Fund commenced operation on April 30, 2007. |
| ** | | Lehman Brothers Aggregate Bond Index is composed of securities from Lehman Brothers Government/Corporate Bond Index, Mortgage Backed Securities Index, and the Asset-Backed Securities Index. Total return comprises price appreciation/depreciation and income as a percentage of the original investment. Indexes are rebalanced monthly by market capitalization. |
*** | | Russell 1000® Index includes the 1,000 largest companies in the Russell 3000® Index. The Russell 1000® Index represents the universe of stocks from which most active money managers typically select. The Russell 1000® Index return reflects adjustments from income dividends and capital gain distributions reinvested as of the ex-dividend dates. |
| **** | | Morgan Stanley Capital International Europe, Australia, Far East (MSCI EAFE) Index is an index composed of an arithmetic, market value-weighted average of the performance of approximately 1,600 securities listed on the stock exchange of the countries of Europe, Australia, and the Far East. The index is calculated on a total-return basis, which included reinvestment of gross dividends before deduction of withholding taxes. |
Performance is historical and assumes reinvestment of all dividends and capital gains. Investment return and principal value will fluctuate so that an investor’s shares, when redeemed, may be worth more or less than when purchased. Past performance is not indicative of future results.
| | |
| 16 | | Balanced Strategy Fund |
Russell Investment Funds
Balanced Strategy Fund
Portfolio Management Discussion and Analysis — December 31, 2007 (Unaudited)
The Fund is a fund of funds that invests in other Russell Investment Funds and Russell Investment Company mutual funds (the “Underlying Funds”). The Underlying Funds allocate most of their assets among multiple money managers. Russell Investment Management Company (“RIMCo”), as the Underlying Funds’ advisor, may change the allocation of the Underlying Funds’ assets among money managers at any time. An exemptive order from the Securities and Exchange Commission (SEC) permits RIMCo to engage or terminate a money manager in an Underlying Fund at any time, subject to the approval by the Underlying Fund’s Board without a shareholder vote.
What is the Fund’s investment objective?
The Balanced Strategy Fund (“Fund”) seeks to provide above average capital appreciation and a moderate level of current income.
How did the Fund perform relative to its benchmark for the fiscal year ended December 31, 2007?
For the period April 30, 2007 (inception of the Fund) through December 31, 2007, the Balanced Strategy Fund gained 2.73%. This compared to the Lehman Brothers Aggregate Bond Index, which gained 4.82% during the same period. The Fund’s returns relative to Lehman Brothers Aggregate Bond Index were dampened by exposure to equities, especially from U.S. real estate.
The Fund’s performance includes operating expenses, whereas the Index returns are unmanaged and do not include expenses of any kind.
How did the market conditions described in the Market Summary report affect the Fund’s performance?
The Fund is a fund of funds and its performance is based on the performance of the underlying mutual funds (the “Underlying Funds”) in which it invests. The largest impact on performance was from the re-pricing of risk (i.e., the market demanding increased compensation for assuming a given level of risk). The performance of the equity Underlying Funds (60% of the Fund) dampened returns relative to the Fund’s all-fixed income Lehman Brothers Aggregate Bond Index. While the allocation to the emerging markets Underlying Fund added to performance, the allocation to the U.S. and non-U.S. equity and real estate Underlying Fund offset that gain.
In the fixed income markets, all major sub-sectors trailed U.S. Treasuries as the subprime crisis caused a widespread “flight to quality.” The Fund has a 40% allocation to a fixed income Underlying Fund whose money managers held consumer-related fixed income investments in the mortgage-backed and asset-backed securities, which negatively impacted performance in these sectors. Several managers of the fixed income Underlying Fund anticipated the short-term interest rate decline and
increased sensitivity to interest rates benefiting that Underlying Fund. As the Federal Reserve lowered the federal funds rate, intermediate maturity yields declined resulting in a shift in the yield curve. The Underlying Fund’s money managers anticipated the change and varied the maturity of their securities, thus benefiting the Fund.
How did the investment strategies and techniques employed by the Fund and its money managers of the Underlying Funds affect the Fund’s performance?
At the Fund level, exposure to emerging markets bolstered returns; however, exposure to both U.S. and non-U.S. equities offset those gains. Exposure to the fixed income markets strengthened returns, while REITs were a drag on performance.
In the fixed income Underlying Fund, two of the three managers benefited from yield curve and sector allocation decisions, duration management and investments in securities outside of the U.S. One manager faced a challenging environment due to duration positioning and exposure to securitized products such as mortgage-backed and asset-backed securities.
The emerging markets, non-U.S., and global Underlying Funds provided strong absolute returns. The emerging markets Underlying Fund led all other asset classes due to strong demand for energy and materials and continued cash inflows into these markets. The non-U.S. developed market Underlying Fund added value through its positioning in growth stocks, an underweight in Japan and exposure to non-benchmark emerging markets stocks. The global equity Underlying Fund benefited from emerging markets exposure and strong stock selection. Sector allocations partly dampened these gains, as did weak stock selection in Europe.
The U.S. equity Underlying Funds maintained an overall preference for companies with above-average growth rates and attractive valuations. That positioning was rewarded in an environment where growth outpaced value. These Underlying Funds benefited from growing global demand through exposure to infrastructure and agricultural stocks. Strong stock selection in industrials, technology, and health care and an underweight to financials sectors contributed to returns. Quantitatively managed strategies faced a difficult environment due to their valuation bias and dampened the U.S. equity segment return.
The real estate Underlying Fund focused primarily on the larger and more liquid REITs during the fiscal year. With the exceptional volatility experienced during the period due to the subprime mortgage crisis and substantial cash outflows, this positioning hurt Fund performance. Non-dedicated REIT investors typically trade the more liquid securities when they rotate into or out of the sector.
| | |
| Balanced Strategy Fund | | 17 |
Russell Investment Funds
Balanced Strategy Fund
Portfolio Management Discussion and Analysis — December 31, 2007 (Unaudited)
Describe any changes to the Fund’s structure or allocation to the Underlying Funds.
The Fund opened on April 30, 2007. No changes were made to the Fund’s structure or allocation to the Underlying Funds.
The views expressed in this report reflect those of the portfolio managers only through the end of the period covered by the report. These views do not necessarily represent the views of Russell Investment Management Company (RIMCo), or any other person in RIMCo or any other affiliated organization. These views are subject to change at any time based upon market conditions or other events, and RIMCo disclaims any responsibility to update the views contained herein. These views should not be relied on as investment advice and, because investment decisions for a Russell Investment Fund (RIF) or Russell Investment Company (RIC) Fund are based on numerous factors, should not be relied on as an indication of investment decisions of any RIF or RIC Fund.
| | |
| 18 | | Balanced Strategy Fund |
Russell Investment Funds
Balanced Strategy Fund
Shareholder Expense Example — December 31, 2007 (Unaudited)
Fund Expenses
The following disclosure provides important information regarding each Fund’s Expense Example, which appears on each Fund’s individual page in this Annual Report. Please refer to this information when reviewing the Expense Example for a Fund.
Example
As a shareholder of the Fund, you incur two types of costs: (1) transaction costs, and (2) ongoing costs, including management fees and other Fund expenses. The Example is intended to help you understand your ongoing costs (in dollars) of investing in the Fund and to compare these costs with the ongoing costs of investing in other mutual funds. The Example is based on an investment of $1,000 invested at the beginning of the period and held for the entire period indicated, which for this Fund is from July 1, 2007 to December 31, 2007.
Actual Expenses
The information in the table under the heading “Actual Performance” provides information about actual account values and actual expenses. You may use the information in this column, together with the amount you invested, to estimate the expenses that you paid over the period. Simply divide your account value by $1,000 (for example, an $8,600 account value divided by $1,000 = 8.6), then multiply the result by the number in the first column in the row entitled “Expenses Paid During Period” to estimate the expenses you paid on your account during this period.
Hypothetical Example for Comparison Purposes
The information in the table under the heading “Hypothetical Performance (5% return before expenses)” provides information about hypothetical account values and hypothetical expenses based on the Fund’s actual expense ratio and an assumed rate of return of 5% per year before expenses, which is not the Fund’s actual return. The hypothetical account values and expenses may not be used to estimate the actual ending account balance or expenses you paid for the period. You may use this information to compare the ongoing costs of investing in the Fund and other funds. To do so, compare this 5% hypothetical example with the 5% hypothetical examples that appear in the shareholder reports of other funds.
Please note that the expenses shown in the table are meant to highlight your ongoing costs only and do not reflect any transactional costs. Therefore, the information under the heading “Hypothetical Performance (5% return before expenses)” is useful in comparing ongoing costs only, and will not help you determine the relative total costs of owning different funds. In addition, if these transactional costs were included, your costs would have been higher.
| | | | | | |
| | | Actual
Performance | | Hypothetical
Performance
(5% return
before expenses) |
| | | | | | |
Beginning Account Value
July 1, 2007 | | $ | 1,000.00 | | $ | 1,000.00 |
| Ending Account Value December 31, 2007 | | $ | 1,023.20 | | $ | 1,024.80 |
Expenses Paid During Period* | | $ | 0.41 | | $ | 0.41 |
| * | Expenses are equal to the Fund’s annualized expense ratio of 0.08% (representing the six month period annualized), multiplied by the average account value over the period, multiplied by 184/365 (to reflect the six month period). Reflects amounts waived and/or reimbursed by the investment adviser. Without the waiver and/or reimbursement, expenses would have been higher. |
| | |
| Balanced Strategy Fund | | 19 |
Russell Investment Funds
Balanced Strategy Fund
Schedule of Investments — December 31, 2007
Amounts in thousands (except share amounts)
| | | | | |
| | | Shares | | Market
Value $ | |
| | | | | |
Investments - 100.0% | | | | | |
Other Russell Investment Funds (“RIF”) and Russell Investment Company (“RIC”) Series Mutual Funds - Class S Shares | | | | | |
| | |
| Bonds - 40.0% | | | | | |
RIF Core Bond Fund | | 1,383,800 | | 14,281 | |
| | | | | |
| | |
| Domestic Equities - 39.0% | | | | | |
RIF Aggressive Equity Fund | | 109,937 | | 1,428 | |
RIF Multi-Style Equity Fund | | 342,192 | | 5,356 | |
RIC Quantitative Equity Fund | | 139,389 | | 5,355 | |
RIF Real Estate Securities Fund | | 117,287 | | 1,785 | |
| | | | | |
| | | | 13,924 | |
| | | | | |
International Equities - 21.0% | | | | | |
RIC Emerging Markets Fund | | 47,413 | | 1,071 | |
RIC Global Equity Fund | | 136,921 | | 1,428 | |
RIF Non-U.S. Fund | | 378,945 | | 4,998 | |
| | | | | |
| | | | 7,497 | |
| | | | | |
Total Investments - 100.0% | | | | | |
(identified cost $37,183) | | | | 35,702 | |
| | |
Other Assets and Liabilities, Net - 0.0% | | | | (5 | ) |
| | | | | |
Net Assets - 100.0% | | | | 35,697 | |
| | | | | |
Presentation of Portfolio Holdings — December 31, 2007
| | | |
| |
| Categories | | % of Net
Assets | |
| | | |
Bonds | | 40.0 | |
Domestic Equities | | 39.0 | |
International Equities | | 21.0 | |
| | | |
Total Investments | | 100.0 | |
Other Assets and Liabilities, Net | | — | * |
| | | |
| |
| | 100.0 | |
| | | |
| * | Less than .05% of net assets. |
See accompanying notes which are an integral part of the financial statements.
| | |
| 20 | | Balanced Strategy Fund |
(This page intentionally left blank)
Russell Investment Funds
Growth Strategy Fund
Portfolio Management Discussion and Analysis — December 31, 2007 (Unaudited)
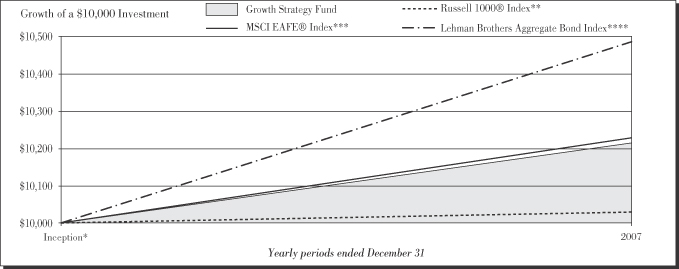
| | | | | |
|
| Growth Strategy Fund | |
| | | Total
Return | |
Inception* | | | | 2.13 | % |
| | | | | |
|
| Russell 1000® Index** | |
| | | Total
Return | |
Inception* | | | | 0.29 | % |
| | | | | |
|
| MSCI EAFE® Index*** | |
| | | Total
Return | |
Inception* | | | | 2.27 | % |
| | | | | |
|
| Lehman Brothers Aggregate Bond Index**** | |
| | | Total
Return | |
Inception* | | | | 4.82 | % |
| * | | The Fund commenced operation on April 30, 2007. |
** | | Russell 1000® Index includes the 1,000 largest companies in the Russell 3000® Index. The Russell 1000® Index represents the universe of stocks from which most active money managers typically select. The Russell 1000® Index return reflects adjustments from income dividends and capital gain distributions reinvested as of the ex-dividend dates. |
| *** | | Morgan Stanley Capital International Europe, Australia, Far East (MSCI EAFE) Index is an index composed of an arithmetic, market value-weighted average of the performance of approximately 1,600 securities listed on the stock exchange of the countries of Europe, Australia, and the Far East. The index is calculated on a total-return basis, which included reinvestment of gross dividends before deduction of withholding taxes. |
| **** | | Lehman Brothers Aggregate Bond Index is composed of securities from Lehman Brothers Government/Corporate Bond Index, Mortgage Backed Securities Index, and the Asset-Backed Securities Index. Total return comprises price appreciation/depreciation and income as a percentage of the original investment. Indexes are rebalanced monthly by market capitalization. |
Performance is historical and assumes reinvestment of all dividends and capital gains. Investment return and principal value will fluctuate so that an investor’s shares, when redeemed, may be worth more or less than when purchased. Past performance is not indicative of future results.
Russell Investment Funds
Growth Strategy Fund
Portfolio Management Discussion and Analysis — December 31, 2007 (Unaudited)
The Fund is a fund of funds that invests in other Russell Investment Funds and Russell Investment Company mutual funds (the “Underlying Funds”). The Underlying Funds allocate most of their assets among multiple money managers. Russell Investment Management Company (“RIMCo”), as the Underlying Funds’ advisor, may change the allocation of the Underlying Funds’ assets among money managers at any time. An exemptive order from the Securities and Exchange Commission (SEC) permits RIMCo to engage or terminate a money manager in an Underlying Fund at any time, subject to the approval by the Underlying Fund’s Board without a shareholder vote.
What is the Fund’s investment objective?
The Growth Strategy Fund (“Fund”) seeks to provide high long term capital appreciation with low current income.
How did the Fund perform relative to its benchmark for the fiscal year ended December 31, 2007?
For the period April 30, 2007 (inception of the Fund) through December 31, 2007, the Growth Strategy Fund gained 2.13%. This compared to the Russell 1000® Index, which gained 0.29% during the same period. The Fund’s returns relative to Russell 1000® Index were aided by exposure to emerging and non-U.S. developed markets.
The Fund’s performance includes operating expenses, whereas the Index returns are unmanaged and do not include expenses of any kind.
How did the market conditions described in the Market Summary report affect the Fund’s performance?
The Fund is a fund of funds and its performance is based on the performance of the underlying mutual funds (the “Underlying Funds”) in which it invests. The largest impact on performance was from the re-pricing of risk (i.e., the market demanding increased compensation for assuming a given level of risk). This caused bonds, especially U.S. Treasuries, to outperform stocks. Within equity markets, larger capitalization companies outperformed smaller capitalization companies and companies with sustainable growth trends outperformed those considered to be undervalued. The strong performance of the equity Underlying Funds (80% of the Fund) supported the Fund’s return for the fiscal year as those Underlying Funds were well-positioned in the large cap growth segment of the market. The allocation to the top-performing emerging markets Underlying Fund boosted performance and had the greatest positive impact to Fund performance. The Fund also benefited from its allocation to the non-U.S. Underlying Funds with most gains coming from the devaluation of the U.S. dollar. The impact of the allocation to the real estate Underlying Fund on Fund performance was negative.
In the fixed income markets, all major sub-sectors trailed U.S. Treasuries as the subprime crisis caused a widespread “flight to quality.” The Fund has a 20% allocation to a fixed income Underlying Fund whose money managers held consumer-related fixed income investments in the mortgage-backed and asset-backed securities, which negatively impacted performance in these sectors. Several managers of the fixed income Underlying Fund anticipated the short-term interest rate decline and increased sensitivity to interest rates benefiting that Underlying Fund. As the Federal Reserve lowered the federal funds rate, intermediate maturity yields declined resulting in a shift in the yield curve. The Underlying Fund’s money managers anticipated the change and varied the maturity of their securities, thus benefiting the Fund.
How did the investment strategies and techniques employed by the Underlying Funds and their money managers affect the Fund’s performance?
At the Fund level, exposure to both emerging markets and non-U.S. equities bolstered returns. Bonds also strengthened returns, while REITs were a drag on performance. In the fixed income Underlying Fund, two of the three managers benefited from yield curve and sector allocation decisions, duration management and investments in securities outside of the U.S. One fixed income manager faced a challenging environment due to duration positioning and exposure to securitized products such as mortgage-backed and asset-backed securities.
The emerging markets, non-U.S., and global Underlying Funds provided strong absolute returns. The emerging markets Underlying Fund led all other asset classes due to strong demand for energy and materials and continued cash inflows into these markets. The non-U.S. developed market Underlying Fund added value through its positioning in growth stocks, an underweight in Japan and exposure to non-benchmark emerging markets stocks. The global equity Underlying Fund benefited from emerging markets exposure and strong stock selection. Sector allocations partly dampened these gains, as did weak stock selection in Europe.
The U.S. equity Underlying Funds maintained an overall preference for companies with above-average growth rates and attractive valuations. That positioning was rewarded in an environment where growth outpaced value. These Underlying Funds benefited from growing global demand through exposure to infrastructure and agricultural stocks. Strong stock selection in industrials, technology, and health care and an underweight to financials sectors contributed to returns. Quantitatively managed strategies faced a difficult environment due to their valuation bias and dampened the U.S. equity segment return.
Russell Investment Funds
Growth Strategy Fund
Portfolio Management Discussion and Analysis — December 31, 2007 (Unaudited)
The real estate Underlying Fund focused primarily on the larger and more liquid REITs during the fiscal year. With the exceptional volatility experienced during the period due to the subprime mortgage crisis and substantial cash outflows, this positioning hurt Fund performance. Non-dedicated REIT investors typically trade the more liquid securities when they rotate into or out of the sector.
Describe any changes to the Fund’s structure or allocation to the Underlying Funds.
The Fund opened on April 30, 2007. No changes were made to the Fund’s structure or allocation to the Underlying Funds.
The views expressed in this report reflect those of the portfolio managers only through the end of the period covered by the report. These views do not necessarily represent the views of Russell Investment Management Company (RIMCo), or any other person in RIMCo or any other affiliated organization. These views are subject to change at any time based upon market conditions or other events, and RIMCo disclaims any responsibility to update the views contained herein. These views should not be relied on as investment advice and, because investment decisions for a Russell Investment Fund (RIF) or Russell Investment Company (RIC) Fund are based on numerous factors, should not be relied on as an indication of investment decisions of any RIF or RIC Fund.
Russell Investment Funds
Growth Strategy Fund
Shareholder Expense Example — December 31, 2007 (Unaudited)
Fund Expenses
The following disclosure provides important information regarding each Fund’s Expense Example, which appears on each Fund’s individual page in this Annual Report. Please refer to this information when reviewing the Expense Example for a Fund.
Example
As a shareholder of the Fund, you incur two types of costs: (1) transaction costs, and (2) ongoing costs, including management fees and other Fund expenses. The Example is intended to help you understand your ongoing costs (in dollars) of investing in the Fund and to compare these costs with the ongoing costs of investing in other mutual funds. The Example is based on an investment of $1,000 invested at the beginning of the period and held for the entire period indicated, which for this Fund is from July 1, 2007 to December 31, 2007.
Actual Expenses
The information in the table under the heading “Actual Performance” provides information about actual account values and actual expenses. You may use the information in this column, together with the amount you invested, to estimate the expenses that you paid over the period. Simply divide your account value by $1,000 (for example, an $8,600 account value divided by $1,000 = 8.6), then multiply the result by the number in the first column in the row entitled “Expenses Paid During Period” to estimate the expenses you paid on your account during this period.
Hypothetical Example for Comparison Purposes
The information in the table under the heading “Hypothetical Performance (5% return before expenses)” provides information about hypothetical account values and hypothetical expenses based on the Fund’s actual expense ratio and an assumed rate of return of 5% per year before expenses, which is not the Fund’s actual return. The hypothetical account values and expenses may not be used to estimate the actual ending account balance or expenses you paid for the period. You may use this information to compare the ongoing costs of investing in the Fund and other funds. To do so, compare this 5% hypothetical example with the 5% hypothetical examples that appear in the shareholder reports of other funds.
Please note that the expenses shown in the table are meant to highlight your ongoing costs only and do not reflect any transactional costs. Therefore, the information under the heading “Hypothetical Performance (5% return before expenses)” is useful in comparing ongoing costs only, and will not help you determine the relative total costs of owning different funds. In addition, if these transactional costs were included, your costs would have been higher.
| | | | | | |
| | | Actual
Performance | | Hypothetical
Performance
(5% return
before expenses) |
| | | | | | |
Beginning Account Value
July 1, 2007 | | $ | 1,000.00 | | $ | 1,000.00 |
| Ending Account Value December 31, 2007 | | $ | 1,009.20 | | $ | 1,025.00 |
Expenses Paid During Period* | | $ | 0.20 | | $ | 0.20 |
| * | Expenses are equal to the Fund’s annualized expense ratio of 0.04% (representing the six month period annualized), multiplied by the average account value over the period, multiplied by 184/365 (to reflect the six month period). Reflects amounts waived and/or reimbursed by the investment adviser. Without the waiver and/or reimbursement, expenses would have been higher. |
Russell Investment Funds
Growth Strategy Fund
Schedule of Investments — December 31, 2007
Amounts in thousands (except share amounts)
| | | | | |
| | | Shares | | Market
Value $ | |
| | | | | |
Investments - 100.0% | | | | | |
Other Russell Investment Funds (“RIF”) and Russell Investment Company (“RIC”) Series Mutual Funds - Class S Shares | | | | | |
| | |
| Bonds - 20.0% | | | | | |
RIF Core Bond Fund | | 530,849 | | 5,478 | |
| | | | | |
| | |
| Domestic Equities - 53.0% | | | | | |
RIF Aggressive Equity Fund | | 126,521 | | 1,644 | |
RIF Multi-Style Equity Fund | | 367,558 | | 5,752 | |
RIC Quantitative Equity Fund | | 142,591 | | 5,478 | |
RIF Real Estate Securities Fund | | 107,983 | | 1,644 | |
| | | | | |
| | | | 14,518 | |
| | | | | |
| | |
| International Equities - 27.0% | | | | | |
RIC Emerging Markets Fund | | 48,503 | | 1,096 | |
RIC Global Equity Fund | | 157,575 | | 1,643 | |
RIF Non-U.S. Fund | | 353,040 | | 4,657 | |
| | | | | |
| | | | 7,396 | |
| | | | | |
Total Investments - 100.0% | | | | | |
(identified cost $28,905) | | | | 27,392 | |
| | |
Other Assets and Liabilities,
Net - 0.0% | | | | (2 | ) |
| | | | | |
Net Assets - 100.0% | | | | 27,390 | |
| | | | | |
Presentation of Portfolio Holdings — December 31, 2007
| | | |
| |
| Categories | | % of Net
Assets | |
| | | |
Bonds | | 20.0 | |
Domestic Equities | | 53.0 | |
International Equities | | 27.0 | |
| | | |
Total Investments | | 100.0 | |
Other Assets and Liabilities, Net | | — | * |
| | | |
| |
| | 100.0 | |
| | | |
| * | Less than .05% of net assets. |
See accompanying notes which are an integral part of the financial statements.
(This page intentionally left blank)
Russell Investment Funds
Equity Growth Strategy Fund
Portfolio Management Discussion and Analysis — December 31, 2007 (Unaudited)
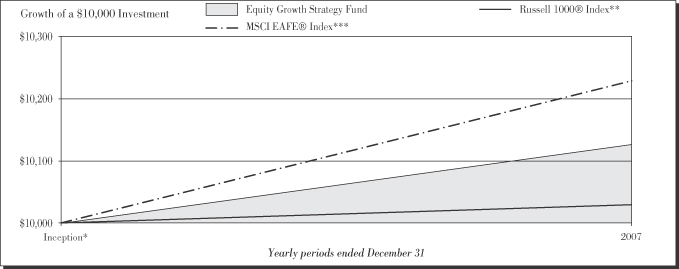
| | | | | |
| |
| Equity Growth Strategy Fund | | | |
| | | Total
Return | |
Inception* | | | | 1.25 | % |
| | | | | |
| |
| Russell 1000® Index** | | | |
| | | Total
Return | |
Inception* | | | | 0.29 | % |
| | | | | |
| |
| MSCI EAFE® Index*** | | | |
| | | Total
Return | |
Inception* | | | | 2.27 | % |
| * | | The Fund commenced operation on April 30, 2007. |
** | | Russell 1000® Index includes the 1,000 largest companies in the Russell 3000® Index. The Russell 1000® Index represents the universe of stocks from which most active money managers typically select. The Russell 1000® Index return reflects adjustments from income dividends and capital gain distributions reinvested as of the ex-dividend dates. |
| *** | | Morgan Stanley Capital International Europe, Australia, Far East (MSCI EAFE) Index is an index composed of an arithmetic, market value-weighted average of the performance of approximately 1,600 securities listed on the stock exchange of the countries of Europe, Australia, and the Far East. The index is calculated on a total-return basis, which included reinvestment of gross dividends before deduction of withholding taxes. |
Performance is historical and assumes reinvestment of all dividends and capital gains. Investment return and principal value will fluctuate so that an investor’s shares, when redeemed, may be worth more or less than when purchased. Past performance is not indicative of future results.
| | |
| 28 | | Equity Growth Strategy Fund |
Russell Investment Funds
Equity Growth Strategy Fund
Portfolio Management Discussion and Analysis — December 31, 2007 (Unaudited)
The Fund is a fund of funds that invests in other Russell Investment Funds and Russell Investment Company mutual funds (the “Underlying Funds”). The Underlying Funds allocate most of their assets among multiple money managers. Russell Investment Management Company (“RIMCo”), as the Underlying Funds’ advisor, may change the allocation of the Underlying Funds’ assets among money managers at any time. An exemptive order from the Securities and Exchange Commission (SEC) permits RIMCo to engage or terminate a money manager in an Underlying Fund at any time, subject to the approval by the Underlying Fund’s Board without a shareholder vote.
What is the Fund’s investment objective?
The Equity Growth Strategy Fund (“Fund”) seeks to provide high long term capital appreciation.
How did the Fund perform relative to its benchmark for the fiscal year ended December 31, 2007?
For the period April 30, 2007 (inception of the Fund) through December 31, 2007, the Equity Growth Strategy Fund gained 1.25%. This compared to the Russell 1000® Index, which gained 0.29% during the same period. The Fund’s returns relative to Russell 1000® Index were aided by exposure to emerging and non-U.S. developed markets.
The Fund’s performance includes operating expenses, whereas the Index returns are unmanaged and do not include expenses of any kind.
How did the market conditions described in the Market Summary report affect the Fund’s performance?
The Fund is a fund of funds and its performance is based on the performance of the underlying mutual funds (the “Underlying Funds”) in which it invests. The largest impact on performance was from the re-pricing of risk (i.e., the market demanding increased compensation for assuming a given level of risk). This caused larger capitalization companies to outperform smaller capitalization companies and companies with sustainable growth trends to outperform those considered to be undervalued. The U.S. and non-U.S. equity Underlying Funds were well-positioned in these well-performing areas of the market. The allocation to the emerging markets Underlying Fund boosted Fund performance as emerging markets was the top-performing asset class. The Fund benefited from its allocation to the non-U.S. Underlying Fund with most gains coming from the devaluation of the U.S. dollar. The impact of the allocation to the real estate Underlying Fund on Fund performance was negative.
How did the investment strategies and techniques employed by the Fund and its money managers of the Underlying Funds affect the Fund’s performance?
At the Fund level, exposure to both emerging markets and non-U.S. equities bolstered returns, while REITs were a drag on
performance. The emerging markets, non-U.S., and global Underlying Funds provided strong absolute returns. The emerging markets Underlying Fund led all other asset classes due to strong demand for energy and materials and continued cash inflows into these markets. The non-U.S. developed market Underlying Fund added value through its positioning in growth stocks, an underweight in Japan and exposure to non-benchmark emerging markets stocks. The global equity Underlying Fund benefited from emerging markets exposure and strong stock selection. Sector allocations partly dampened these gains, as did weak stock selection in Europe.
The U.S. equity Underlying Funds maintained an overall preference for companies with above-average growth rates and attractive valuations. That positioning was rewarded in an environment where growth outpaced value. These Underlying Funds benefited from growing global demand through exposure to infrastructure and agricultural stocks. Strong stock selection in industrials, technology, and health care and an underweight to financials sectors contributed to returns. Quantitatively managed strategies faced a difficult environment due to their valuation bias and dampened the U.S. equity segment return.
The real estate Underlying Fund focused primarily on the larger and more liquid REITs during the fiscal year. With the exceptional volatility experienced during the period due to the subprime mortgage crisis and substantial cash outflows, this positioning hurt Fund performance. Non-dedicated REIT investors typically trade the more liquid securities when they rotate into or out of the sector.
Describe any changes to the Fund’s structure or allocation to the Underlying Funds.
The Fund opened on April 30, 2007. No changes were made to the Fund’s structure or allocation to the Underlying Funds.
The views expressed in this report reflect those of the portfolio managers only through the end of the period covered by the report. These views do not necessarily represent the views of Russell Investment Management Company (RIMCo), or any other person in RIMCo or any other affiliated organization. These views are subject to change at any time based upon market conditions or other events, and RIMCo disclaims any responsibility to update the views contained herein. These views should not be relied on as investment advice and, because investment decisions for a Russell Investment Fund (RIF) or Russell Investment Company (RIC) Fund are based on numerous factors, should not be relied on as an indication of investment decisions of any RIF or RIC Fund.
| | |
| Equity Growth Strategy Fund | | 29 |
Russell Investment Funds
Equity Growth Strategy Fund
Shareholder Expense Example — December 31, 2007 (Unaudited)
Fund Expenses
The following disclosure provides important information regarding each Fund’s Expense Example, which appears on each Fund’s individual page in this Annual Report. Please refer to this information when reviewing the Expense Example for a Fund.
Example
As a shareholder of the Fund, you incur two types of costs: (1) transaction costs, and (2) ongoing costs, including management fees and other Fund expenses. The Example is intended to help you understand your ongoing costs (in dollars) of investing in the Fund and to compare these costs with the ongoing costs of investing in other mutual funds. The Example is based on an investment of $1,000 invested at the beginning of the period and held for the entire period indicated, which for this Fund is from July 1, 2007 to December 31, 2007.
Actual Expenses
The information in the table under the heading “Actual Performance” provides information about actual account values and actual expenses. You may use the information in this column, together with the amount you invested, to estimate the expenses that you paid over the period. Simply divide your account value by $1,000 (for example, an $8,600 account value divided by $1,000 = 8.6), then multiply the result by the number in the first column in the row entitled “Expenses Paid During Period” to estimate the expenses you paid on your account during this period.
Hypothetical Example for Comparison Purposes
The information in the table under the heading “Hypothetical Performance (5% return before expenses)” provides information about hypothetical account values and hypothetical expenses based on the Fund’s actual expense ratio and an assumed rate of return of 5% per year before expenses, which is not the Fund’s actual return. The hypothetical account values and expenses may not be used to estimate the actual ending account balance or expenses you paid for the period. You may use this information to compare the ongoing costs of investing in the Fund and other funds. To do so, compare this 5% hypothetical example with the 5% hypothetical examples that appear in the shareholder reports of other funds.
Please note that the expenses shown in the table are meant to highlight your ongoing costs only and do not reflect any transactional costs. Therefore, the information under the heading “Hypothetical Performance (5% return before expenses)” is useful in comparing ongoing costs only, and will not help you determine the relative total costs of owning different funds. In addition, if these transactional costs were included, your costs would have been higher.
| | | | | | |
| | | Actual
Performance | | Hypothetical
Performance
(5% return
before expenses) |
| | | | | | |
Beginning Account Value
July 1, 2007 | | $ | 1,000.00 | | $ | 1,000.00 |
| Ending Account Value December 31, 2007 | | $ | 995.60 | | $ | 1,025.00 |
Expenses Paid During Period* | | $ | 0.20 | | $ | 0.20 |
| * | Expenses are equal to the Fund’s annualized expense ratio of 0.04% (representing the six month period annualized), multiplied by the average account value over the period, multiplied by 184/365 (to reflect the six month period). Reflects amounts waived and/or reimbursed by the investment adviser. Without the waiver and/or reimbursement, expenses would have been higher. |
| | |
| 30 | | Equity Growth Strategy Fund |
Russell Investment Funds
Equity Growth Strategy Fund
Schedule of Investments — December 31, 2007
Amounts in thousands (except share amounts)
| | | | |
| | | Shares | | Market
Value $ |
| | | | |
Investments - 100.0% | | | | |
Other Russell Investment Funds (“RIF”) and Russell Investment Company (“RIC”) Series Mutual Funds - Class S Shares | | | | |
| | |
Domestic Equities - 64.8% | | | | |
RIF Aggressive Equity Fund | | 69,786 | | 907 |
RIF Multi-Style Equity Fund | | 215,335 | | 3,370 |
RIC Quantitative Equity Fund | | 84,318 | | 3,240 |
RIF Real Estate Securities Fund | | 59,932 | | 912 |
| | | | |
| | | | 8,429 |
| | | | |
| | |
International Equities - 35.2% | | | | |
RIC Emerging Markets Fund | | 29,070 | | 657 |
RIC Global Equity Fund | | 87,178 | | 909 |
RIF Non-U.S. Fund | | 228,315 | | 3,011 |
| | | | |
| | | | 4,577 |
| | | | |
| | |
| Total Investments - 100.0% | | | | |
(identified cost $14,191) | | | | 13,006 |
| | |
Other Assets and Liabilities,
Net - 0.0% | | | | — |
| | | | |
| | |
| Net Assets - 100.0% | | | | 13,006 |
| | | | |
Presentation of Portfolio Holdings — December 31, 2007
| | | |
| |
| Categories | | % of Net
Assets | |
Domestic Equities | | 64.8 | |
International Equities | | 35.2 | |
| | | |
Total Investments | | 100.0 | |
Other Assets and Liabilities, Net | | — | * |
| | | |
| |
| | 100.0 | |
| | | |
| * | Less than .05% of net assets. |
See accompanying notes which are an integral part of the financial statements.
| | |
| Equity Growth Strategy Fund | | 31 |
Russell Investment Funds
LifePoints® Funds Variable Target Portfolio Series
Statements of Assets and Liabilities — December 31, 2007
| | | | | | | | | | | | | | | | |
| Amounts in thousands | | Moderate Strategy
Fund | | | Balanced Strategy
Fund | | | Growth Strategy
Fund | | | Equity Growth Strategy
Fund | |
| | | | | | | | | | | | | | | | |
Assets | | | | | | | | | | | | | | | | |
Investments, at identified cost | | $ | 8,819 | | | $ | 37,183 | | | $ | 28,905 | | | $ | 14,191 | |
Investments, at market | | | 8,654 | | | | 35,702 | | | | 27,392 | | | | 13,006 | |
Receivables: | | | | | | | | | | | | | | | | |
Fund shares sold | | | — | | | | 870 | | | | 406 | | | | 10 | |
From Manager | | | 8 | | | | 9 | | | | 10 | | | | 9 | |
Prepaid expenses | | | 5 | | | | 5 | | | | 5 | | | | 5 | |
| | | | | | | | | | | | | | | | |
Total assets | | | 8,667 | | | | 36,586 | | | | 27,813 | | | | 13,030 | |
| | | | | | | | | | | | | | | | |
| | | | |
| Liabilities | | | | | | | | | | | | | | | | |
Payables: | | | | | | | | | | | | | | | | |
Investments purchased | | | — | | | | 870 | | | | 406 | | | | 10 | |
Accrued fees to affiliates | | | — | | | | — | | | | — | | | | — | |
Other accrued expenses | | | 13 | | | | 19 | | | | 17 | | | | 14 | |
| | | | | | | | | | | | | | | | |
Total liabilities | | | 13 | | | | 889 | | | | 423 | | | | 24 | |
| | | | | | | | | | | | | | | | |
| | | | | | | | | | | | | | | | |
Net Assets | | $ | 8,654 | | | $ | 35,697 | | | $ | 27,390 | | | $ | 13,006 | |
| | | | | | | | | | | | | | | | |
Net Assets Consist of: | | | | | | | | | | | | | | | | |
Accumulated net realized gain (loss) | | $ | 128 | | | $ | 1,102 | | | $ | 1,088 | | | $ | 698 | |
Unrealized appreciation (depreciation) on investments | | | (165 | ) | | | (1,481 | ) | | | (1,513 | ) | | | (1,185 | ) |
Shares of beneficial interest | | | 9 | | | | 36 | | | | 28 | | | | 13 | |
Additional paid-in capital | | | 8,682 | | | | 36,040 | | | | 27,787 | | | | 13,480 | |
| | | | | | | | | | | | | | | | |
Net Assets | | $ | 8,654 | | | $ | 35,697 | | | $ | 27,390 | | | $ | 13,006 | |
| | | | | | | | | | | | | | | | |
| | | | | | | | | | | | | | | | | |
| | | | |
Net Asset Value, offering and redemption price per share: | | | | | | | | | | | | | | | | |
Net asset value per share* | | $ | 9.99 | | | $ | 9.93 | | | $ | 9.90 | | | $ | 9.83 | |
Net assets | | $ | 8,654,351 | | | $ | 35,697,181 | | | $ | 27,389,847 | | | $ | 13,005,621 | |
Shares outstanding ($.01 par value) | | | 865,891 | | | | 3,595,074 | | | | 2,767,420 | | | | 1,322,932 | |
|
* Net asset value per share equals net assets divided by shares of beneficial interest outstanding. | |
See accompanying notes which are an integral part of the financial statements.
| | |
| 32 | | Statements of Assets and Liabilities |
Russell Investment Funds
LifePoints® Funds Variable Target Portfolio Series
Statements of Operations — For the Period Ended December 31, 2007
| | | | | | | | | | | | | | | | |
| Amounts in thousands | | Moderate Strategy
Fund* | | | Balanced Strategy
Fund* | | | Growth Strategy
Fund* | | | Equity Growth
Strategy Fund* | |
| | | | | | | | | | | | | | | | |
Investment Income | | | | | | | | | | | | | | | | |
Income distributions from Underlying Funds | | $ | 197 | | | $ | 898 | | | $ | 641 | | | $ | 348 | |
| | | | | | | | | | | | | | | | |
| | | | |
Expenses | | | | | | | | | | | | | | | | |
Management fees | | | 6 | | | | 28 | | | | 21 | | | | 10 | |
Custodian fees | | | 1 | | | | 4 | | | | 3 | | | | 2 | |
Transfer agent fees | | | — | | | | — | | | | — | | | | — | |
Professional fees | | | 28 | | | | 29 | | | | 28 | | | | 28 | |
Printing fees | | | 2 | | | | 9 | | | | 6 | | | | 5 | |
Offering fees | | | 11 | | | | 11 | | | | 11 | | | | 11 | |
Miscellaneous | | | 1 | | | | 2 | | | | 2 | | | | — | |
| | | | | | | | | | | | | | | | |
Expenses before reductions | | | 49 | | | | 83 | | | | 71 | | | | 56 | |
Expense reductions | | | (46 | ) | | | (74 | ) | | | (68 | ) | | | (55 | ) |
| | | | | | | | | | | | | | | | |
Net expenses | | | 3 | | | | 9 | | | | 3 | | | | 1 | |
| | | | | | | | | | | | | | | | |
Net investment income (loss) | | | 194 | | | | 889 | | | | 638 | | | | 347 | |
| | | | | | | | | | | | | | | | |
| | | | |
Net Realized and Unrealized Gain (Loss) | | | | | | | | | | | | | | | | |
Net realized gain (loss) on: | | | | | | | | | | | | | | | | |
Investments | | | (28 | ) | | | (35 | ) | | | (19 | ) | | | (48 | ) |
Capital gain distributions from Underlying Funds | | | 170 | | | | 1,149 | | | | 1,120 | | | | 757 | |
| | | | | | | | | | | | | | | | |
Net realized gain (loss) | | | 142 | | | | 1,114 | | | | 1,101 | | | | 709 | |
Net change in unrealized appreciation (depreciation) on investments | | | (165 | ) | | | (1,481 | ) | | | (1,513 | ) | | | (1,185 | ) |
| | | | | | | | | | | | | | | | |
Net realized and unrealized gain (loss) | | | (23 | ) | | | (367 | ) | | | (412 | ) | | | (476 | ) |
| | | | | | | | | | | | | | | | |
Net Increase (Decrease) in Net Assets from Operations | | $ | 171 | | | $ | 522 | | | $ | 226 | | | $ | (129 | ) |
| | | | | | | | | | | | | | | | |
| | | | | | | | | | | | | | | | | |
|
* For the period April 30, 2007 (commencement of operations) to December 31, 2007. | |
See accompanying notes which are an integral part of the financial statements.
| | |
| Statements of Operations | | 33 |
Russell Investment Funds
LifePoints® Funds Variable Target Portfolio Series
Statements of Changes In Net Assets — For the Period Ended December 31, 2007
| | | | | | | | | | | | | | | | |
| Amounts in thousands | | Moderate Strategy
Fund* | | | Balanced Strategy
Fund* | | | Growth Strategy
Fund* | | | Equity Growth
Strategy Fund* | |
| | | | | | | | | | | | | | | | |
Increase (Decrease) in Net Assets | | | | | | | | | | | | | | | | |
| | | | |
Operations | | | | | | | | | | | | | | | | |
Net investment income (loss) | | $ | 194 | | | $ | 889 | | | $ | 638 | | | $ | 347 | |
Net realized gain (loss) | | | 142 | | | | 1,114 | | | | 1,101 | | | | 709 | |
Net change in unrealized appreciation (depreciation) | | | (165 | ) | | | (1,481 | ) | | | (1,513 | ) | | | (1,185 | ) |
| | | | | | | | | | | | | | | | |
Net increase (decrease) in net assets from operations | | | 171 | | | | 522 | | | | 226 | | | | (129 | ) |
| | | | | | | | | | | | | | | | |
| | | | |
Distributions | | | | | | | | | | | | | | | | |
From net investment income | | | (207 | ) | | | (901 | ) | | | (651 | ) | | | (358 | ) |
From net realized gain | | | (2 | ) | | | (2 | ) | | | — | | | | — | |
| | | | | | | | | | | | | | | | |
Net decrease in net assets from distributions | | | (209 | ) | | | (903 | ) | | | (651 | ) | | | (358 | ) |
| | | | | | | | | | | | | | | | |
| | | | |
Share Transactions | | | | | | | | | | | | | | | | |
Net increase (decrease) in net assets from share transactions | | | 8,692 | | | | 36,078 | | | | 27,815 | | | | 13,493 | |
| | | | | | | | | | | | | | | | |
| | | | |
Total Net Increase (Decrease) in Net Assets | | | 8,654 | | | | 35,697 | | | | 27,390 | | | | 13,006 | |
| | | | |
Net Assets | | | | | | | | | | | | | | | | |
Beginning of period | | | — | | | | — | | | | — | | | | — | |
| | | | | | | | | | | | | | | | |
End of period | | $ | 8,654 | | | $ | 35,697 | | | $ | 27,390 | | | $ | 13,006 | |
| | | | | | | | | | | | | | | | |
Undistributed (overdistributed) net investment income included in net assets | | $ | — | | | $ | — | | | $ | — | | | $ | — | |
|
* For the period April 30, 2007 (commencement of operations) to December 31, 2007. | |
See accompanying notes which are an integral part of the financial statements.
| | |
| 34 | | Statements of Changes In Net Assets |
(This page intentionally left blank)
Russell Investment Funds
LifePoints® Funds Variable Target Portfolio Series
Financial Highlights
For a Share Outstanding Throughout the Period.
| | | | | | | | | | | | | | | |
| | |
$
Net Asset Value,
Beginning of
Period | | $
Net
Investment
Income (Loss)(a)(b) | | $
Net Realized
and Unrealized
Gain (Loss) | | | $
Total Income
(Loss) from
Operations | | $
Distributions
from Net
Investment Income | | | $
Distributions
from Net
Realized Gain | |
| Moderate Strategy Fund | |
December 31, 2007* | | 10.00 | | .46 | | (.11 | ) | | .35 | | (.36 | ) | | — | (g) |
| Balanced Strategy Fund | |
December 31, 2007* | | 10.00 | | .47 | | (.20 | ) | | .27 | | (.34 | ) | | — | (g) |
| Growth Strategy Fund | |
December 31, 2007* | | 10.00 | | .45 | | (.24 | ) | | .21 | | (.31 | ) | | — | |
| Equity Growth Strategy Fund | |
December 31, 2007* | | 10.00 | | .50 | | (.38 | ) | | .12 | | (.29 | ) | | — | |
See accompanying notes which are an integral part of the financial statements.
| | | | | | | | | | | | | | | |
$
Total
Distributions | | | $
Net Asset Value,
End of
Period | | %
Total
Return(c) | | $
Net Assets,
End of Period
(000) | | %
Ratio of Expenses
to Average
Net Assets,
Net(d)(e)(f) | | %
Ratio of Expenses
to Average
Net Assets,
Gross(d)(e) | | %
Ratio of Net
Investment Income
to Average
Net Assets(c) (f) | | %
Portfolio
Turnover Rate(c) |
| | | | | | | | | | | | | | | |
| (.36 | ) | | 9.99 | | 3.54 | | 8,654 | | .11 | | 2.01 | | 5.37 | | 24.20 |
| | | | | | | | | | | | | | | |
| (.34 | ) | | 9.93 | | 2.73 | | 35,697 | | .08 | | .74 | | 5.37 | | 10.88 |
| | | | | | | | | | | | | | | |
| (.31 | ) | | 9.90 | | 2.13 | | 27,390 | | .04 | | .84 | | 5.05 | | 2.72 |
| | | | | | | | | | | | | | | |
| (.29 | ) | | 9.83 | | 1.25 | | 13,006 | | .04 | | 1.36 | | 5.59 | | 5.68 |
See accompanying notes which are an integral part of the financial statements.
Russell Investment Funds
LifePoints® Funds Variable Target Portfolio Series
Notes to Financial Highlights — December 31, 2007
| * | For the period April 30, 2007 (commencement of operations) to December 31, 2007. |
| (a) | Average month-end shares outstanding were used for this calculation. |
| (b) | Recognition of net investment income by the Fund is affected by the timing of the declaration of dividends by the Underlying Funds in which the Fund invests. |
| (c) | Periods less than one year are not annualized. |
| (d) | The ratios for periods less than one year are annualized. |
| (e) | The calculation includes only those expenses charged directly to the Fund and does not include expenses charged to the Underlying Funds in which the Fund invests. |
| (f) | May reflect amounts waived and/or reimbursed by RIMCo as the investment adviser and transfer agent. |
| (g) | Less than $.01 per share. |
See accompanying notes which are an integral part of the financial statements.
| | |
| 38 | | Notes to Financial Highlights |
Russell Investment Funds
LifePoints® Funds Variable Target Portfolio Series
Notes to Financial Statements — December 31, 2007
Russell Investment Funds (the “Investment Company” or “RIF”) is a series investment company with nine different investment portfolios referred to as Funds. These financial statements report on four of these Funds (each a “Fund” and collectively the “Funds”). The Investment Company provides the investment base for one or more variable insurance products issued by one or more insurance companies. These Funds are offered at net asset value to qualified insurance company separate accounts offering variable insurance products. The Investment Company is registered under the Investment Company Act of 1940, as amended, as an open-end management investment company. It is organized and operates as a Massachusetts business trust under a master trust agreement dated July 11, 1996, as amended. The Investment Company’s master trust agreement permits the Board of Trustees (the “Board”) to issue an unlimited number of shares of beneficial interest at a $.01 par value per share.
Through December 31, 2007, Russell Investment Management Company (“RIMCo”) was the manager and transfer agent of the Funds providing advisory, administrative and transfer agency services to the Funds. Effective January 1, 2008, RIMCo advises the Funds and Russell Fund Services Company (“RFSC”), a wholly-owned subsidiary of RIMCo, is the Funds’ administrator and transfer agent. There was no change in the services provided to the Funds or, in aggregate, fees paid by the Funds for advisory, administrative and transfer agency services.
Each of the Funds listed in the table below allocates its assets by investing in a combination of Class S shares of Russell Investment Company (“RIC”) funds and other of the Investment Company’s funds (the “Underlying Funds”). RIMCo, the Funds’ and Underlying Funds’ investment adviser, may modify the target asset allocation for any Fund and/or the Underlying Funds in which the Funds invest. From time to time, each Fund may adjust its investments within the ranges below based on RIMCo’s outlook for the economy, financial markets generally and relative market valuation of the asset classes represented by each Underlying Fund. Additionally, each Fund may deviate from ranges below when, in RIMCo’s opinion, it is necessary to do so to pursue the Fund’s investment objective. In the future, the Funds may also invest in other funds which are not currently Underlying Funds.
| | | | | | | | | | | | |
| | | Asset Allocation Targets per Prospectus | |
| Asset Class/Underlying Funds | | Moderate Strategy Fund | | | Balanced Strategy Fund | | | Growth Strategy Fund | | | Equity Growth Strategy Fund | |
| | | | | | | | | | | | |
Bonds | | | | | | | | | | | | |
RIF Core Bond Fund | | 55-65 | % | | 35-45 | % | | 15-25 | % | | — | % |
| | | | |
Domestic Equities | | | | | | | | | | | | |
RIF Aggressive Equity Fund | | 0-8 | | | 0-9 | | | 1-11 | | | 2-12 | |
RIF Multi-Style Equity Fund | | 5-15 | | | 10-20 | | | 16-26 | | | 21-31 | |
RIC Quantitative Equity Fund | | 5-15 | | | 10-20 | | | 15-25 | | | 20-30 | |
RIF Real Estate Securities Fund | | 0-8 | | | 0-10 | | | 1-11 | | | 2-12 | |
| | | | |
International Equities | | | | | | | | | | | | |
RIC Emerging Markets Fund | | 0-7 | | | 0-8 | | | 0-9 | | | 0-10 | |
RIC Global Equity Fund | | 0-8 | | | 0-9 | | | 1-11 | | | 2-12 | |
RIF Non-U.S. Fund | | 14-24 | | | 9-19 | | | 12-22 | | | 18-28 | |
Investment Objectives of the Underlying Funds:
RIF Core Bond Fund
Seeks to provide current income and preservation of capital.
RIF Aggressive Equity Fund
Seeks to provide long term capital growth.
RIF Multi-Style Equity Fund
Seeks to provide long term capital growth.
RIC Quantitative Equity Fund
Seeks to provide long term capital growth.
RIF Real Estate Securities Fund
| | |
| Notes to Financial Statements | | 39 |
Russell Investment Funds
LifePoints® Funds Variable Target Portfolio Series
Notes to Financial Statements, continued — December 31, 2007
Seeks to provide current income and long term capital growth.
RIC Emerging Markets Fund
Seeks to provide long term capital growth.
RIC Global Equity Fund
Seeks to provide long term capital growth.
RIF Non-U.S. Fund
Seeks to provide long term capital growth.
| 2. | | Significant Accounting Policies |
The Funds’ financial statements are prepared in accordance with accounting principles generally accepted in the United States of America (“GAAP”) which require the use of management estimates and assumptions at the date of the financial statements. Actual results could differ from those estimates. The following is a summary of the significant accounting policies consistently followed by each Fund in the preparation of its financial statements.
Security Valuation
The Funds value their portfolio securities, the shares of the Underlying Funds, at the current net asset value per share of each Underlying Fund.
The Underlying Funds value portfolio securities according to Board-approved securities valuation procedures, including market value procedures, fair value procedures and pricing services. Debt obligation securities maturing within 60 days of the time of purchase are priced using the amortized cost method of valuation, unless the Board determines that amortized cost does not represent market value of short-term debt obligations. The Board has delegated the responsibility for administration of the securities valuation procedures to RFSC.
Ordinarily, the Underlying Funds value each portfolio security based on market quotations provided by pricing services or alternative pricing services or dealers (when permitted by the market value procedures). Generally, Underlying Fund securities are valued at the close of the market on which they are traded as follows:
| | • | | US listed equities; equity and fixed income options: Last sale price; last bid price if no last sale; |
| | • | | US over-the-counter equities: Official closing price; last bid price if no closing price; |
| | • | | Listed ADRs/GDRs: Last sale price; last bid price if no sales; |
| | • | | Municipal bonds, US bonds, Eurobonds/foreign bonds: Evaluated bid price; broker quote if no evaluated bid price; |
| | • | | Futures: Settlement price; |
| | • | | Investments in other mutual funds are valued at their net asset value per share, calculated at 4 p.m. Eastern time or as of the close of the New York Stock Exchange, whichever is earlier; |
| | • | | The value of swap agreements is equal to the Funds’ obligation (or rights) under swap contracts which will generally be equal to the net amounts to be paid or received under the contracts based upon the relative values of the positions held by each party to the contracts. |
| | • | | Equity securities traded on a national foreign securities exchange or a foreign over the counter market are valued on the basis of the official closing price, or lacking the official closing price, at the last sale price of the primary exchange on which the security is traded. |
If market quotations are not readily available for a security or if subsequent events suggest that a market quotation is not reliable, the Underlying Funds will use the security’s fair value, as determined in accordance with the fair value procedures. The effect of fair value pricing is that securities may not be priced on the basis of quotations from the primary market on which they are traded, but rather may be priced by another method that the Funds’ Board of Trustees believes reflects fair value. The use of fair value pricing by an Underlying Fund may cause the net asset value of its shares to differ significantly from the net asset value that would be calculated using normal pricing methods. Fair value pricing could also cause discrepancies between the daily movement of the value of Underlying Fund shares and daily movement of the benchmark index if the index is valued using another pricing method.
| | |
| 40 | | Notes to Financial Statements |
Russell Investment Funds
LifePoints® Funds Variable Target Portfolio Series
Notes to Financial Statements, continued — December 31, 2007
This policy is intended to assure that the Underlying Funds’ net asset values fairly reflect security values as of the time of pricing. Events or circumstances affecting the values of Underlying Fund securities that occur between the closing of the principal markets on which they trade and the time the net asset value of Underlying Fund shares is determined may be reflected in the calculation of net asset values for each applicable Underlying Fund (and each Fund which invests in such Underlying Fund) when the Underlying Funds deem that the particular event or circumstance would materially affect such Underlying Fund’s net asset value. Underlying Funds that invest primarily in frequently traded exchange listed securities will use fair value pricing in limited circumstances since reliable market quotations will often be readily available. Underlying Funds that invest in foreign securities are likely to use fair value pricing more often since significant events may occur between the close of foreign markets and the time of pricing which would trigger fair value pricing of the foreign securities. Underlying Funds that invest in low rated debt securities are also likely to use fair value pricing more often since the markets in which such securities are traded are generally thinner, more limited and less active than those for higher rated securities. Examples of events that could trigger fair value pricing of one or more securities are: a material market movement of the US securities market (defined in the fair value procedures as the movement by any two of four major US Indexes greater than a certain percentage) or other significant event; foreign market holidays if on a daily basis, Fund exposure exceeds 20% in aggregate (all closed markets combined); a company development; a natural disaster; or an armed conflict.
Because foreign securities can trade on non-business days, the net asset value of a Fund’s portfolio that includes an Underlying Fund which invests in foreign securities may change on days when shareholders will not be able to purchase or redeem fund shares.
In September 2006, Statement of Financial Accounting Standards No. 157, Fair Value Measurements (“SFAS 157”), was issued and is effective for fiscal years beginning after November 15, 2007. SFAS 157 defines fair value, establishes a framework for measuring fair value and expands disclosures about fair value measurements. Management is currently evaluating the impact the adoption of SFAS 157 will have on the Funds’ financial statement disclosure.
Investment Transactions
Securities transactions are recorded on a trade date basis. Realized gains and losses from securities transactions, if any, are recorded on the basis of specific identified cost.
Investment Income
Distributions of income and capital gains from the Underlying Funds are recorded on the ex-dividend date.
Federal Income Taxes
Since the Investment Company is a Massachusetts business trust, each Fund is a separate corporate taxpayer and determines its net investment income and capital gains (or losses) and the amounts to be distributed to each Fund’s shareholders without regard to the income and capital gains (or losses) of the other Funds.
It is each Fund’s intention to qualify as a regulated investment company and distribute all of its taxable income and capital gains. Therefore, no federal income tax provision is required for the Funds.
The Financial Accounting Standards Board (FASB) issued Interpretation No. 48, “Accounting for Uncertainty in Income Taxes, an Interpretation of FASB Statement No. 109” (“FIN 48”), in June 2006. FIN 48 permits the recognition of tax benefits of an uncertain tax position only when the position is “more likely than not” to be sustained assuming examination by taxing authorities. The Funds adopted the provisions of FIN 48 on January 1, 2007. Management has reviewed the Funds tax positions for all open tax years, and concluded that adoption had no effect on the Funds financial position or results of operations. At December 31, 2007, the Funds have recorded no liabilities for net unrecognized tax benefits relating to uncertain income tax positions they have taken or expect to take in future tax returns.
The Funds intend to file U. S. tax returns for the period ending December 31, 2007. The Funds are not aware of any tax positions for which it is reasonably possible that the total amounts of unrecognized tax benefits will significantly change in the next twelve months.
| | |
| Notes to Financial Statements | | 41 |
Russell Investment Funds
LifePoints® Funds Variable Target Portfolio Series
Notes to Financial Statements, continued — December 31, 2007
Dividends and Distributions to Shareholders
Income, dividends and capital gain distributions, if any, are recorded on the ex-dividend date. Income dividends are generally declared and paid quarterly. Capital gain distributions are generally declared and paid annually. An additional distribution may be paid by the Funds to avoid imposition of federal income and excise tax on any remaining undistributed capital gains and net investment income.
The timing and characterization of certain income and capital gain distributions are determined in accordance with federal tax regulations which may differ from GAAP. As a result, net investment income and net realized gain (or loss) from investment transactions for a reporting period may differ significantly from distributions during such period. The differences between tax regulations and GAAP relate primarily to investments in the Underlying Funds sold at a loss, wash sale deferrals and capital loss carryforwards. Accordingly, the Funds may periodically make reclassifications among certain of their capital accounts without impacting their net asset value.
Expenses
Expenses included in the accompanying financial statements reflect the expenses of each Fund and do not include those expenses incurred by the Underlying Funds. Because the Underlying Funds have varied expense and fee levels and the Funds may own different proportions of the Underlying Funds at different times, the amount of the fees and expenses incurred indirectly by the Funds will vary. Most expenses can be directly attributed to the individual Funds. Expenses which cannot be directly attributed to a specific Fund are allocated among all Funds principally based on their relative net assets.
Guarantees
In the normal course of business the Funds enter into contracts that contain a variety of representations which provide general indemnifications. The Funds’ maximum exposure under these arrangements is unknown as this would involve future claims that may be made against the Funds that have not yet occurred. However, the Funds expect the risk of loss to be remote.
| 3. | | Investment Transactions |
Securities
During the period ended December 31, 2007, purchases and sales of the Underlying Funds (excluding short-term investments) were as follows:
| | | | | | |
| Funds | | Purchases | | Sales |
| | | | | | |
Moderate Strategy | | $ | 9,879,515 | | $ | 1,032,014 |
Balanced Strategy | | | 39,306,741 | | | 2,089,159 |
Growth Strategy | | | 29,319,088 | | | 395,289 |
Equity Growth Strategy | | | 14,639,407 | | | 400,559 |
Adviser and Administrator
Through December 31, 2007, RIMCo managed all of the Funds which comprise the Investment Company. Effective January 1, 2008, RIMCo advises the Funds and RFSC is the Funds’ administrator. RFSC is a wholly-owned subsidiary of RIMCo. RIMCo is a wholly-owned subsidiary of Frank Russell Company (a subsidiary of The Northwestern Mutual Life Insurance Company). Frank Russell Company provides money manager research services to RIMCo.
Transfer and Dividend Disbursing Agent
Through December 31, 2007, RIMCo served as Transfer and Dividend Disbursing Agent for the Investment Company. For this service, RIMCo was paid a fee for transfer agency and dividend disbursing services provided to the Funds. RIMCo retained a portion of this fee for its services provided to the Funds and paid the balance to unaffiliated agents who assisted in providing these services. Effective January 1, 2008, RFSC replaced RIMCo as the Funds Transfer and Dividend Disbursing Agent.
| | |
| 42 | | Notes to Financial Statements |
Russell Investment Funds
LifePoints® Funds Variable Target Portfolio Series
Notes to Financial Statements, continued — December 31, 2007
Through December 31, 2007, RIMCo contractually agreed to waive 0.20% of its 0.25% management fee for each Fund. This waiver may not be terminated during the relevant period except at the Board’s discretion. Additionally, through December 31, 2007, RIMCo contractually agreed to waive up to the remaining 0.05% of its 0.25% management fee and all of its transfer agency fees and then to reimburse each Fund for other direct Fund-level expenses to the extent that direct Fund-level expenses exceed 0.11%, 0.08%, 0.04% and 0.04% of the average daily net assets of the Moderate Strategy, Balanced Strategy, Growth Strategy and Equity Growth Strategy Funds, respectively, on an annual basis. Direct Fund-level expenses for the Funds do not include the expenses of other investment companies in which the Fund invests which are borne indirectly by the Fund.
Through December 31, 2007, the Funds paid RIMCo a single management fee for advisory and administrative services. Beginning on January 1, 2008, the Funds began paying an advisory fee to RIMCo and an administrative fee to RFSC. There was no change in the services provided to the Funds or, in aggregate, fees paid by the Funds for advisory and administrative services.
For the period ended December 31, 2007, the fees waived and reimbursed by RIMCo amounted to:
| | | | | | | | | | | | |
| Funds | | Management Fee
Waiver | | Transfer Agent Fee
Waiver | | Reimbursement | | Total |
| | | | | | | | | | | | |
Moderate Strategy | | $ | 6,077 | | $ | 107 | | $ | 40,085 | | $ | 46,269 |
Balanced Strategy | | | 27,948 | | | 492 | | | 45,650 | | | 74,090 |
Growth Strategy | | | 21,192 | | | 373 | | | 46,569 | | | 68,134 |
Equity Growth Strategy | | | 10,412 | | | 183 | | | 44,280 | | | 54,875 |
RIMCo and RFSC do not have the ability to recover amounts waived or reimbursed from previous periods.
Accrued fees payable to affiliates for the period ended December 31, 2007 were as follows:
| | | | | | | | | | | | |
| | | Moderate Strategy Fund | | Balanced Strategy Fund | | Growth Strategy Fund | | Equity Growth
Strategy Fund |
| | | | | | | | | | | | |
Trustee fees | | $ | 23 | | $ | 91 | | $ | 64 | | $ | 47 |
Distributor
Pursuant to the Distribution Agreement with the Investment Company, Russell Fund Distributor, Inc. (“Distributor”), a wholly-owned subsidiary of RIMCo, serves as distributor for all Investment Company portfolio shares. The Distributor receives no compensation from the Investment Company for its services.
Board of Trustees
Through December 31, 2007, the Russell Fund Complex consisted of Russell Investment Company, which had 32 Funds, and Russell Investment Funds (“RIF”), which had nine Funds. Each of the Trustees was a Trustee for both RIC and RIF. During the period, the Russell Fund Complex paid each of its independent Trustees a retainer of $52,000 per year, $6,500 for each regular quarterly meeting attended in person, $2,000 for each special meeting attended in person, and $2,000 for each Audit Committee meeting, Nominating and Governance Committee meeting, Investment Committee meeting or any other committee meeting established and approved by the Board that is attended in person. Each Trustee received a $500 fee for attending the meetings (quarterly, special, committee) by phone instead of receiving the full fee had the member attended in person. Trustees’ out of pocket expenses were also paid by the Russell Fund Complex. The Audit Committee Chair and Investment Committee Chair were each paid a fee of $12,000 per year and the Nominating and Governance Committee chair were each paid a fee of $6,000 per year. The chair person of the Board received additional annual compensation of $52,000.
Effective January 1, 2008, the Russell Fund Complex consists of RIC, which has 38 Funds, and RIF, which has nine Funds. Each of the Trustees is a Trustee of both RIC and RIF. During the period, the Russell Fund Complex paid each of its independent Trustees a retainer of $60,000 per year, $6,500 for each regular quarterly meeting attended in person, $2,500 for each special meeting attended in person, $2,500 for the Annual 38a-1 meeting attended in person, and $2,500 for each Audit Committee meeting, Nominating and Governance Committee meeting, Investment Committee meeting or any other committee meeting established and approved by the Board that is attended in person. Each Trustee receives a $1,000 fee for attending the quarterly and special meetings and a $500 fee for attending the committee meeting by phone instead of receiving the full fee had the member attended in person. Trustees’ out of pocket expenses are also paid by the Russell Fund Complex. The Audit Committee Chair and Investment Committee Chair are each paid a fee of $12,000 per year and the Nominating and Governance Committee Chair is paid a fee of $6,000 per year. The chair person of the Board receives additional annual compensation of $52,000.
| | |
| Notes to Financial Statements | | 43 |
Russell Investment Funds
LifePoints® Funds Variable Target Portfolio Series
Notes to Financial Statements, continued — December 31, 2007
Transactions With Affiliated Companies
An affiliated company is a company in which a Fund has ownership of at least 5% of the voting securities or under common control. Transactions during the period ended December 31, 2007 with Underlying Funds which are an affiliated company or under common control are as follows:
| | | | | | | | | | | | |
| Affiliate | | Purchases Cost | | Sales Cost | | Income
Distributions | | Capital Gains
Distributions |
| | | | | | | | | | | | |
Moderate Strategy Fund | | | | | | | | | | | | |
RIF Core Bond Fund | | $ | 5,654,037 | | $ | 505,898 | | $ | 118,286 | | $ | — |
RIF Aggressive Equity Fund | | | 350,322 | | | 75,830 | | | 6,009 | | | 13,390 |
RIF Multi-Style Equity Fund | | | 1,106,392 | | | 241,612 | | | 1,349 | | | 29,357 |
RIC Quantitative Equity Fund | | | 999,557 | | | 83,500 | | | 12,376 | | | 43,151 |
RIF Real Estate Securities Fund | | | 335,338 | | | 28,306 | | | 4,740 | | | 24,076 |
RIC Emerging Markets Fund | | | 224,251 | | | 21,839 | | | 11,063 | | | 19,154 |
RIC Global Equity Fund | | | 284,068 | | | 25,016 | | | 6,215 | | | 255 |
RIF Non-U.S. Fund | | | 925,550 | | | 78,295 | | | 36,983 | | | 41,115 |
| | | | | | | | | | | | |
| | $ | 9,879,515 | | $ | 1,060,296 | | $ | 197,021 | | $ | 170,498 |
| | | | | | | | | | | | |
Balanced Strategy Fund | | | | | | | | | | | | |
RIF Core Bond Fund | | $ | 15,169,236 | | $ | 1,054,057 | | $ | 369,606 | | $ | — |
RIF Aggressive Equity Fund | | | 1,633,981 | | | 71,883 | | | 35,547 | | | 78,985 |
RIF Multi-Style Equity Fund | | | 5,739,915 | | | 259,356 | | | 10,013 | | | 196,073 |
RIC Quantitative Equity Fund | | | 6,072,560 | | | 259,510 | | | 84,146 | | | 290,455 |
RIF Real Estate Securities Fund | | | 2,229,072 | | | 89,315 | | | 34,587 | | | 172,771 |
RIC Emerging Markets Fund | | | 1,228,763 | | | 60,090 | | | 74,525 | | | 129,045 |
RIC Global Equity Fund | | | 1,519,692 | | | 70,726 | | | 37,242 | | | 1,529 |
RIF Non-U.S. Fund | | | 5,713,522 | | | 259,196 | | | 252,135 | | | 280,304 |
| | | | | | | | | | | | |
| | $ | 39,306,741 | | $ | 2,124,133 | | $ | 897,801 | | $ | 1,149,162 |
| | | | | | | | | | | | |
Growth Strategy Fund | | | | | | | | | | | | |
RIF Core Bond Fund | | $ | 5,439,844 | | $ | 30,957 | | $ | 134,754 | | $ | — |
RIF Aggressive Equity Fund | | | 1,828,099 | | | 28,743 | | | 39,874 | | | 88,797 |
RIF Multi-Style Equity Fund | | | 5,982,725 | | | 95,196 | | | 10,095 | | | 205,196 |
RIC Quantitative Equity Fund | | | 6,026,504 | | | 87,571 | | | 83,721 | | | 289,904 |
RIF Real Estate Securities Fund | | | 2,040,799 | | | 74,815 | | | 30,830 | | | 155,439 |
RIC Emerging Markets Fund | | | 1,214,317 | | | 24,724 | | | 73,694 | | | 127,607 |
RIC Global Equity Fund | | | 1,682,788 | | | 20,949 | | | 41,540 | | | 1,706 |
RIF Non-U.S. Fund | | | 5,104,012 | | | 51,622 | | | 226,455 | | | 251,755 |
| | | | | | | | | | | | |
| | $ | 29,319,088 | | $ | 414,577 | | $ | 640,963 | | $ | 1,120,404 |
| | | | | | | | | | | | |
Equity Growth Strategy Fund | | | | | | | | | | | | |
RIF Aggressive Equity Fund | | $ | 1,054,238 | | $ | 52,405 | | $ | 25,086 | | $ | 55,851 |
RIF Multi-Style Equity Fund | | | 3,625,592 | | | 139,825 | | | 6,370 | | | 136,902 |
RIC Quantitative Equity Fund | | | 3,700,117 | | | 140,786 | | | 56,022 | | | 195,302 |
RIF Real Estate Securities Fund | | | 1,157,226 | | | 38,188 | | | 19,433 | | | 97,959 |
RIC Emerging Markets Fund | | | 755,583 | | | 25,386 | | | 49,750 | | | 86,145 |
RIC Global Equity Fund | | | 953,812 | | | 17,102 | | | 26,146 | | | 1,074 |
RIF Non-U.S. Fund | | | 3,392,839 | | | 35,128 | | | 165,573 | | | 184,071 |
| | | | | | | | | | | | |
| | $ | 14,639,407 | | $ | 448,820 | | $ | 348,380 | | $ | 757,304 |
| | | | | | | | | | | | |
| | |
| 44 | | Notes to Financial Statements |
Russell Investment Funds
LifePoints® Funds Variable Target Portfolio Series
Notes to Financial Statements, continued — December 31, 2007
At December 31, 2007, the cost of investments, net unrealized appreciation (depreciation), undistributed ordinary income and undistributed long-term capital gains income tax purposes were as follows:
| | | | | | | | | | | | | | | | |
| | | Moderate Strategy Fund | | | Balanced Strategy Fund | | | Growth Strategy Fund | | | Equity Growth
Strategy Fund | |
| | | | | | | | | | | | | | | | |
Cost of Investments | | $ | 8,849,329 | | | $ | 37,219,401 | | | $ | 28,923,862 | | | $ | 14,238,897 | |
| | | | | | | | | | | | | | | | |
Unrealized Appreciation | | $ | 52,965 | | | $ | 169,755 | | | $ | 70,359 | | | $ | — | |
Unrealized Depreciation | | | (248,295 | ) | | | (1,687,112 | ) | | | (1,602,435 | ) | | | (1,233,306 | ) |
| | | | | | | | | | | | | | | | |
Net Unrealized Appreciation (Depreciation) | | $ | (195,330 | ) | | $ | (1,517,357 | ) | | $ | (1,532,076 | ) | | $ | (1,233,306 | ) |
| | | | | | | | | | | | | | | | |
Undistributed Ordinary Income | | $ | — | | | $ | — | | | $ | — | | | $ | 5,129 | |
Undistributed Long-Term Gains
(Capital Loss Carryforward) | | $ | 158,005 | | | $ | 1,138,562 | | | $ | 1,107,965 | | | $ | 741,432 | |
Tax Composition of Distributions: | | | | | | | | | | | | | | | | |
Ordinary Income | | $ | 197,557 | | | $ | 892,989 | | | $ | 638,973 | | | $ | 357,879 | |
Long-Term Capital Gains | | $ | 11,764 | | | $ | 9,881 | | | $ | 11,771 | | | $ | — | |
| 6. | | Fund Share Transactions (amounts in thousands) |
Share transactions for the period April 30, 2007 (commencement of operations) to December 31, 2007 were as follows:
| | | | | | | |
| | | Shares | | | Dollars | |
Moderate Strategy Fund | | | | | | | |
Proceeds from shares sold | | 950 | | | $ | 9,530 | |
Proceeds from reinvestment of distributions | | 22 | | | | 209 | |
Payments for shares redeemed | | (106 | ) | | | (1,047 | ) |
| | | | | | | |
Net increase (decrease) | | 866 | | | $ | 8,692 | |
| | | | | | | |
| | | | | | | |
Balanced Strategy Fund | | | | | | | |
Proceeds from shares sold | | 3,701 | | | $ | 37,178 | |
Proceeds from reinvestment of distributions | | 91 | | | | 903 | |
Payments for shares redeemed | | (197 | ) | | | (2,003 | ) |
| | | | | | | |
Net increase (decrease) | | 3,595 | | | $ | 36,078 | |
| | | | | | | |
| | | | | | | |
Growth Strategy Fund | | | | | | | |
Proceeds from shares sold | | 2,762 | | | $ | 27,787 | |
Proceeds from reinvestment of distributions | | 66 | | | | 651 | |
Payments for shares redeemed | | (61 | ) | | | (623 | ) |
| | | | | | | |
Net increase (decrease) | | 2,767 | | | $ | 27,815 | |
| | | | | | | |
| | | | | | | |
Equity Growth Strategy Fund | | | | | | | |
Proceeds from shares sold | | 1,332 | | | $ | 13,593 | |
Proceeds from reinvestment of distributions | | 37 | | | | 358 | |
Payments for shares redeemed | | (46 | ) | | | (458 | ) |
| | | | | | | |
Net increase (decrease) | | 1,323 | | | $ | 13,493 | |
| | | | | | | |
| 7. | | Interfund Lending Program |
The Investment Company has been granted permission from the Securities and Exchange Commission to participate in a joint lending and borrowing facility (the “Credit Facility”). Funds of the Investment Company may borrow money from the RIC Money Market Fund for temporary purposes. All such borrowing and lending will be subject to a participating Fund’s fundamental investment limitations. The RIC Money Market Fund will lend through the program only when the returns are higher than those
| | |
| Notes to Financial Statements | | 45 |
Russell Investment Funds
LifePoints® Funds Variable Target Portfolio Series
Notes to Financial Statements, continued — December 31, 2007
available from an investment in repurchase agreements or short-term reserves. The Funds will borrow through the program only when the costs are equal to or lower than the cost of bank loans. Interfund loans and borrowings normally extend overnight, but can have a maximum duration of seven days. Loans may be called on one business day’s notice. A participating Fund may have to borrow from a bank at a higher interest rate if an interfund loan is called or not renewed. Any delay in repayment to the RIC Money Market Fund could result in a lost investment opportunity or additional borrowing costs. For the period ended December 31, 2007, the Funds presented herein did not participate in the interfund lending program.
available from an investment in repurchase agreements or short-term reserves. The Funds will borrow through the program only when the costs are equal to or lower than the cost of bank loans. Interfund loans and borrowings normally extend overnight, but can have a maximum duration of seven days. Loans may be called on one business day’s notice. A participating Fund may have to borrow from a bank at a higher interest rate if an interfund loan is called or not renewed. Any delay in repayment to the RIC Money Market Fund could result in a lost investment opportunity or additional borrowing costs. For the period ended December 31, 2007, the Funds presented herein did not participate in the interfund lending program.
As of December 31, 2007, the following table includes shareholders of record with greater than 10% of the total outstanding shares of each respective Fund. Northwestern Mutual Life Insurance Company accounts were the largest shareholders in each Fund.
| | | | |
| Funds | | # of Shareholders | | % |
Moderate Strategy | | 2 | | 100.0 |
Balanced Strategy | | 1 | | 94.2 |
Growth Strategy | | 1 | | 98.1 |
Equity Growth Strategy | | 1 | | 99.0 |
| | |
| 46 | | Notes to Financial Statements |
Report of Independent Registered Public Accounting Firm
To the Board of Trustees and Shareholders
of the Russell Investment Funds:
In our opinion, the accompanying statements of assets and liabilities, including the schedules of investments, and the related statements of operations and of changes in net assets and the financial highlights present fairly, in all material respects, the financial position of Moderate Strategy Fund, Balanced Strategy Fund, Growth Strategy Fund, and Equity Growth Strategy Fund (four of the portfolios constituting the Russell Investment Funds, hereafter referred to as the “Funds”) at December 31, 2007, the results of each of their operations, the changes in each of their net assets, and the financial highlights for the period May 1, 2007 (commencement of operations) through December 31, 2007, in conformity with accounting principles generally accepted in the United States of America. These financial statements and financial highlights (hereafter referred to as “financial statements”) are the responsibility of the Funds’ management; our responsibility is to express an opinion on these financial statements based on our audits. We conducted our audits of these financial statements in accordance with the standards of the Public Company Accounting Oversight Board (United States). Those standards require that we plan and perform the audit to obtain reasonable assurance about whether the financial statements are free of material misstatement. An audit includes examining, on a test basis, evidence supporting the amounts and disclosures in the financial statements, assessing the accounting principles used and significant estimates made by management, and evaluating the overall financial statement presentation. We believe that our audits, which included confirmation of securities at December 31, 2007 by correspondence with the custodian and brokers, provide a reasonable basis for our opinion.

Seattle, Washington
February 15, 2008
| | |
| Report of Independent Registered Public Accounting Firm | | 47 |
Russell Investment Funds
LifePoints® Funds Variable Target Portfolio Series
Tax Information — December 31, 2007 (Unaudited)
For the tax year ended December 31, 2007, the Funds hereby designate 100% or the maximum amount allowable, of its net taxable income as qualified dividends taxed at individual net capital gain rates.
The Form 1099 you receive in January 2008 will show the tax status of all distributions paid to your account in calendar year 2007.
The Funds designate dividends distributed during the fiscal year as qualifying for the dividends received deduction for corporate shareholders as follows:
| | | |
Moderate Strategy Fund | | 5.8 | % |
Balanced Strategy Fund | | 9.2 | % |
Growth Strategy Fund | | 12.8 | % |
Equity Growth Strategy Fund | | 15.4 | % |
Pursuant to Section 852 of the Internal Revenue Code, the Funds designate the following amounts as long-term capital gain dividends for their taxable year ended December 31, 2007:
| | | |
| | | Long-Term
Capital Gains |
| | | |
Moderate Strategy Fund | | $ | 11,764 |
Balanced Strategy Fund | | | 9,881 |
Growth Strategy Fund | | | 11,771 |
Equity Growth Strategy Fund | | | — |
Please consult a tax adviser for any questions about federal or state income tax laws.
Russell Investment Funds
LifePoints® Funds Variable Target Portfolio Series
Basis for Approval of Investment Advisory Contracts (Unaudited)
Approval of Investment Advisory Agreement
The Board of Trustees, including all of the Independent Trustees, considered and approved the continuation of the management agreement with RIMCo (the “RIMCo Agreement”) and the portfolio management contract with each Money Manager of the Underlying Funds (collectively, the “portfolio management contracts”) at a meeting held on April 24, 2007. The RIMCo Agreement was approved for the Funds at a Board meeting held on December 6, 2006. At the December 6, 2006 meeting, the Board received information from management as to management fees for the Funds and a proposed waiver of all but 5 basis points of such fees through at least April 30, 2008. The Board was advised that RIMCo intends to waive and/or reimburse temporarily other direct expenses incurred at the Fund level to keep their total direct and indirect expenses at the median for comparable fund products. During the course of a year, the Trustees received a wide variety of materials regarding the investment performance of the Underlying Funds, sales and redemptions of the Underlying Funds’ shares, and the management by RIMCo of the Underlying Funds and of all other funds under the Board’s supervision currently in operation (the “Other Operating Funds”). At the time of the April 24, 2007 meeting, none of the Funds had commenced operations. In preparation for the review, the Independent Trustees, with the advice and assistance of their independent counsel, also requested and the Board considered (1) information and reports prepared by RIMCo relating to the services provided by RIMCo (and its affiliates) to the Underlying Funds and the Other Operating Funds; (2) information (the “Third-Party Information”) received from an independent, nationally recognized provider of investment company information comparing the performance of each of the Underlying Funds and their respective operating expenses over various periods of time with other peer funds (“Comparable Funds”) not managed by RIMCo believed by the provider to be generally comparable in investment objectives and size to the Underlying Funds and the Other Operating Funds; and (3) RIMCo’s response to questions from the Board concerning the Third-Party Information addressing, among other things, performance and expense differentials between certain Underlying Funds and the Other Operating Funds and their respective Comparable Funds. The foregoing information requested by the Trustees or provided by RIMCo is collectively called the “Agreement Renewal Information.” The Independent Trustees also received a memorandum from their independent counsel discussing the legal standards for their consideration of the proposed continuances.
On April 23, 2007, the Independent Trustees met to review the Agreement Renewal Information in a private session with their independent counsel at which no representatives of RIMCo or management were present. At the April 24 meeting of the Board of Trustees, the Board, including the Independent Trustees, reviewed the proposed continuance of the RIMCo Agreement and the portfolio management contracts with management and independent counsel to the Independent Trustees. Presentations made by RIMCo to the Board as part of this review encompassed all RIMCo-managed funds for which the Board has supervisory responsibility. Following this review, but prior to voting, the Independent Trustees again met in a private session with their independent counsel to evaluate additional information and analyses received from RIMCo and management at the Board meeting. The discussion below reflects all of these reviews.
In evaluating the portfolio management contracts, the Board considered that the Underlying Funds, in employing a manager-of-managers method of investment, operate in a manner that is distinctly different from most other investment companies. In the case of most other investment companies, an advisory fee is paid by the investment company to its adviser which in turn employs and compensates individual portfolio managers to make specific securities selections consistent with the adviser’s style and investment philosophy. RIMCo has engaged multiple Money Managers for all Underlying Funds.
The Board considered that RIMCo (rather than any Money Manager) will be responsible under the RIMCo Agreement for allocating assets of each Fund among its Underlying Funds and for determining, implementing and maintaining the investment program for each Underlying Fund. The assets of each Fund will be invested in different combinations of the Underlying Funds pursuant to target asset allocations set by RIMCo. RIMCo may modify the target asset allocation for any Fund and/or the Underlying Funds in which the Funds invest. Assets of each Underlying Fund generally have been allocated among the multiple Money Managers selected by RIMCo, subject to Board approval, for that Underlying Fund. RIMCo manages directly a portion of certain Underlying Funds’ assets employing a “select holdings strategy,” as described below, and directly manages the investment of each Underlying Fund’s cash reserves. RIMCo also may manage directly any portion of each Underlying Fund’s assets that RIMCo determines not to allocate to the Money Managers and portions of an Underlying Fund during transitions between Money Managers. In all cases, assets are managed directly by RIMCo in accordance with the RIMCo Agreement.
RIMCo is responsible for selecting, subject to Board approval, Money Managers for each Underlying Fund and for actively managing allocations and reallocations of its assets among the Money Managers. RIMCo’s goal is to construct and manage diversified portfolios
| | |
| Basis for Approval of Investment Advisory Contracts | | 49 |
Russell Investment Funds
LifePoints® Funds Variable Target Portfolio Series
Basis for Approval of Investment Advisory Contracts, continued (Unaudited)
in a risk aware manner. Each Money Manager for an Underlying Fund in effect performs the function of an individual portfolio manager who is responsible for selecting portfolio securities for the portion of the Underlying Fund assigned to it by RIMCo (each, a “segment”) in accordance with the Fund’s applicable investment objective, policies and restrictions, any constraints placed by RIMCo upon their selection of portfolio securities and the Money Manager’s specified role in an Underlying Fund. RIMCo is responsible for communicating performance expectations to each Money Manager; supervising compliance by each Money Manager with each Underlying Fund’s investment objective and policies; authorizing Money Managers to engage in certain investment strategies for an Underlying Fund; and recommending annually to the Board whether portfolio management contracts should be renewed, modified or terminated. In addition to its annual recommendation as to the renewal, modification or termination of portfolio management contracts, RIMCo is responsible for recommending to the Board the restructuring of Underlying Fund segments and additions of new Money Managers or replacements of existing Money Managers at any time when, based on RIMCo’s research and ongoing review and analysis, such actions are appropriate. RIMCo may assign specific investment constraints from time to time for each Money Manager intended to capitalize on the strengths of that Money Manager or to coordinate the investment activities of Money Managers for an Underlying Fund in a complementary manner. Therefore, the performance of individual Money Managers for an Underlying Fund may reflect the roles assigned to them by RIMCo in the Underlying Funds’ investment activities and any constraints placed by RIMCo upon their selection of portfolio securities. In light of the foregoing, the overall performance of each Underlying Fund over appropriate periods reflects, in great part, the performance of RIMCo in designing the Underlying Fund’s investment program, structuring an Underlying Fund, selecting an effective Money Manager with a particular investment style or sub-style for a segment that is complementary to the styles of the Money Managers of other Underlying Fund segments, and allocating assets among the Money Managers in a manner designed to achieve the objectives of the Underlying Fund.
The Board considered that the prospectuses for the Funds and the Underlying Funds and other public disclosures emphasize to investors RIMCo’s role as the principal investment manager for each Underlying Fund, rather than the investment selection role of the Underlying Funds’ Money Managers, and describe the manner in which the Funds or the Underlying Funds operate so that investors may take that information into account when deciding to purchase shares of any Fund.
The Board also considered the special expertise of RIMCo with respect to the manager-of-managers structure of the Underlying Funds and the likelihood that, at the current expense ratio of each such Underlying Fund, there would be no acceptable alternative investment managers to replace RIMCo on comparable terms given the need to continue the manager-of-managers strategy of each such Underlying Fund.
In addition to these general factors relating to the manager-of-managers structure of the Underlying Funds, the Trustees considered, with respect to each Fund and Underlying Fund, various specific factors in evaluating renewal of the RIMCo Agreement, including the following:
| 1. | The nature, scope and quality of the services provided to the Underlying Fund by RIMCo and expected to be provided to the Fund based upon their familiarity with services provided to the Other Operating Funds; |
| 2. | The advisory or management fee paid by the Underlying Fund and to be paid by the Fund to RIMCo and the fact that it encompasses all investment advisory or management fees to be paid by the Fund or Underlying Fund, including the fees for any Money Managers of such Underlying Fund; |
| 3. | Information provided by RIMCo as to other fees and benefits received by RIMCo or its affiliates from the Underlying Fund or to be received from the Fund, including any administrative, transfer agent, cash management and securities lending fees, soft dollar arrangements and commissions in connection with portfolio securities transactions; |
| 4. | Information provided by RIMCo as to expenses incurred by the Underlying Fund; and |
| 5. | Information provided by RIMCo as to the profits that RIMCo has derived from its mutual fund operations generally and from the Underlying Fund. |
As noted above, RIMCo pursuant to the terms of the RIMCo Agreement directly manages a portion — up to 10% — of the assets of each of the Quantitative Equity Fund and the Multi-Style Equity Fund (each a “Participating Underlying Fund”) utilizing a select holdings strategy, the actual allocation being determined by each Participating Underlying Fund’s RIMCo portfolio manager. The select holdings strategy utilized by RIMCo in managing such assets for a Participating Underlying Fund is designed to increase the Participating Underlying Fund’s exposure to stocks that are viewed as attractive by multiple Money Managers of that Participating
| | |
| 50 | | Basis for Approval of Investment Advisory Contracts |
Russell Investment Funds
LifePoints® Funds Variable Target Portfolio Series
Basis for Approval of Investment Advisory Contracts, continued (Unaudited)
Underlying Fund. The Board reviewed the results of the select holdings strategy in respect of each Participating Underlying Fund since implementation taking into account that the strategy has been utilized for a limited period of time. The Trustees considered that RIMCo would not be required to pay investment advisory fees to a Money Manager with respect to assets for which the select holdings strategy is utilized and that the profits derived by RIMCo generally and from the Participating Underlying Fund consequently may increase incrementally. The Board, however, also considered RIMCo’s advice that it will pay certain Money Managers additional fees for providing information and other services in connection with the select holdings strategy and expects to incur additional costs in carrying out the select holdings strategy; the limited amount of assets that are managed directly by RIMCo pursuant to the select holdings strategy; and the fact that the aggregate investment advisory fees paid by the Participating Underlying Fund are not increased as a result of the select holdings strategy.
At the April 24 Board meeting, RIMCo and management discussed the reasonableness of the investment advisory or management fees for the Underlying Funds having discussed the Funds’ investment management fees at its December 6, 2006 meeting. In discussing whether the Underlying Funds’ performance supported their fees, RIMCo noted differences between the investment strategies of certain Underlying Funds and their respective Comparable Funds in pursuing their investment objectives, including Fund strategies which seek to achieve a lower tracking error (i.e., the difference, whether positive or negative, between the return of a fund and its benchmark) and resulting lower return volatility than Comparable Funds. According to RIMCo, these strategies may be expected to result, and for certain Underlying Funds during the periods covered by the Third-Party Information did result, in lower performance of the Underlying Funds than that of some of their respective Comparable Funds. Among other things, RIMCo stated that the strategies pursued by the Underlying Funds are intended to result in less volatile, more moderate returns relative to each Underlying Fund’s performance benchmark rather than more volatile, more extreme returns that its Comparable Funds may experience over time.
On the basis of the Agreement Renewal Information, and other information previously received by the Board from RIMCo during the course of the year or presented at the December 6, 2006 and April 24, 2007 Board meetings by RIMCo, the Board, in respect of each Fund and Underlying Fund as applicable, found, after giving effect to waivers and/or reimbursements and considering differences in the composition and investment strategies of the Underlying Funds’ respective Comparable Funds (1) the management fee charged or, in the case of the Funds, to be charged, by RIMCo to be reasonable in light of the nature, scope and quality of the services provided or, in the case of the Funds, expected to be provided, to the Funds and Underlying Funds; (2) the relative expense ratio of each Underlying Fund was comparable to those of its Comparable Funds; (3) RIMCo’s methodology of allocating expenses of operating funds in the complex was reasonable; and (4) RIMCo’s profitability with respect to each Underlying Fund was not excessive in light of the nature, scope and quality of the services provided by RIMCo. The Board also concluded that the performance of each of the Underlying Funds supported continuation of the RIMCo Agreement. In evaluating performance, the Board considered each Underlying Fund’s absolute performance and its performance relative to appropriate benchmarks and indices and its Comparable Funds. The Board also considered RIMCo’s investment strategy of managing the Underlying Funds in a risk aware manner. Because the Funds had not commenced operation by the April 24 meeting, no performance or expense information was presented at the April 24 meeting relating specifically to the Funds.
At the April 24 Board meeting, the Board considered for each Underlying Fund whether economies of scale have been realized and whether the fees for such Underlying Fund appropriately reflect or should be revised to reflect any such economies. The Board determined that the investment management or advisory fees for each Underlying Fund appropriately reflect any economies of scale realized by that Underlying Fund, based upon such factors as the variability of Money Manager investment advisory fees and other factors associated with the manager-of-managers structure employed by the Underlying Funds. The Trustees considered that fees payable to RIMCo by institutional clients with investment objectives similar to those of the funds under the Board’s supervision, including the Underlying Funds are lower, and may, in some cases, be substantially lower, than the rates paid by other funds supervised by the Board. The Trustees reviewed with RIMCo the differences in the scope of services it provides to institutional clients and the funds under its supervision, including the Underlying Funds. In response to the Trustees’ inquiries, RIMCo noted, among other things, that institutional clients have fewer administrative needs than the Underlying Funds. It was further noted by RIMCo that since the Underlying Funds must constantly issue and redeem their shares, they are more difficult to manage than institutional accounts, where assets are relatively stable. Accordingly, the Trustees did not regard these fee differences as relevant to their deliberations. Because the Funds had not commenced operations, the Board did not consider whether economies of scale have been realized or whether the fees for any Fund appropriately reflect any such economies.
| | |
| Basis for Approval of Investment Advisory Contracts | | 51 |
Russell Investment Funds
LifePoints® Funds Variable Target Portfolio Series
Basis for Approval of Investment Advisory Contracts, continued (Unaudited)
After considering the foregoing and other relevant factors, the Board concluded that continuation of the RIMCo Agreement for the Funds on its current terms and conditions would be in the best interests of the Funds and the Underlying Funds and their respective shareholders and voted to approve the continuation of the agreement.
At the April 24 Board meeting, with respect to the evaluation of the terms of portfolio management contracts with Money Managers for the Underlying Funds, the Board received and considered information from RIMCo reporting for each Money Manager, among other things, the Money Manager’s performance over various periods; RIMCo’s assessment of the performance of each Money Manager; any significant business relationships between the Money Manager and RIMCo or Russell Fund Distributors, Inc. (“RFD”), the Funds’ and the Underlying Funds’ underwriter; and RIMCo’s recommendation to retain the Money Manager at the current fee rate, to retain the Money Manager at a reduced fee rate or to terminate the Money Manager. RIMCo recommended that each Money Manager be retained at its current fee rate. RIMCo has advised the Board that it does not regard Money Manager profitability as relevant to its evaluation of the portfolio management contracts with Money Managers because the willingness of Money Managers to serve in such capacity depends upon arm’s-length negotiations with RIMCo; RIMCo is aware of the fees charged by Money Managers to other clients; and RIMCo believes that the fees agreed upon with Money Managers are reasonable in light of the anticipated quality of investment advisory services to be rendered. The Board accepted RIMCo’s explanation in light of the Board’s findings as to the reasonableness of the aggregate investment advisory or management fees paid or to be paid by each Fund and Underlying Fund and the fact that each Money Manager’s fee is paid by RIMCo.
Based substantially upon RIMCo’s recommendations together with the information received from RIMCo in support of its recommendations at the April 24 meeting, the Board concluded that the fees paid to the Money Managers of each Underlying Fund are reasonable in light of the quality of the investment advisory services provided and that continuation of the portfolio management agreement with each Money Manager of each Underlying Fund would be in the best interests of the Underlying Fund and its shareholders.
In their deliberations, the Trustees did not identify any particular information as to the RIMCo Agreement or, other than RIMCo’s recommendation, the portfolio management agreement with any Money Manager for an Underlying Fund that was all-important or controlling and each Trustee attributed different weights to the various factors considered. The Trustees evaluated all information available to them on a Fund-by-Fund basis and their determinations were made in respect of each Fund and Underlying Fund.
Subsequently, the Board of Trustees received the following proposals from RIMCo: (1) at a meeting held on May 22, 2007, to effect a money manager change for the RIF Real Estate Securities Fund and the RIF Non-US Fund; (2) at a meeting held on July 23, 2007, to effect a money manager change for the RIC Emerging Markets Fund and the RIF Multi-Style Equity Fund; (3) at a meeting held on August 28, 2007, to effect a money manager change for the RIC Global Equity Fund, the RIF Multi-Style Equity Fund and the RIF Aggressive Equity Fund; (4) at a meeting held on October 26, 2007, to effect a money manager change for the RIF Multi-Style Equity Fund resulting from a change of control of one of the Fund’s Money Managers (5) at a meeting held on December 4, 2007, to effect a money manager change for the RIF Multi-style Equity Fund. In the case of each such proposed change, the Trustees approved the terms of the proposed portfolio management contract based substantially upon RIMCo’s recommendation to hire the Money Manager at the proposed fee rate; any significant business relationships between the Money Manager and RIMCo or RFD, the Fund’s underwriter; RIMCo’s explanation as to the lack of relevance of profitability to the evaluation of portfolio management contracts with money managers because the willingness of Money Managers to serve in such capacity depends upon arm’s-length negotiations with RIMCo; RIMCo’s awareness of the fees charged by the Money Manager to other clients; and RIMCo’s belief that the proposed investment advisory fees would be reasonable in light of the anticipated quality of investment advisory services to be rendered. The Trustees also considered their findings at their April 24, 2007 meeting as to the reasonableness of the aggregate investment advisory fees paid by the Underlying Fund, and the fact that the aggregate investment advisory fees paid by the Underlying Fund would not increase as a result of the implementation of the proposed money manager change because the money managers’ investment advisory fee is paid by RIMCo.
At a meeting held on December 4, 2007, the Board of Trustees, including each of the Independent Trustees, unanimously voted to approve the amendment and restatement of the Funds’ management agreement with RIMCo (the “Management Agreement”) to reflect an internal RIMCo restructuring. The Management Agreement was amended to delete references to certain administrative services that formerly had been performed by RIMCo but that going forward would be performed by Russell Fund Services Company (“RFSC”), an affiliate of RIMCo, pursuant to an administrative services agreement with the Funds (the “Administrative Agreement”).
| | |
| 52 | | Basis for Approval of Investment Advisory Contracts |
Russell Investment Funds
LifePoints® Funds Variable Target Portfolio Series
Basis for Approval of Investment Advisory Contracts, continued (Unaudited)
The Management Agreement was further amended to reduce the fee payable to RIMCo under the Management Agreement by 5 basis points (0.05%) and to change its title from Management Agreement to Advisory Agreement.
In connection with its consideration of the amended Management Agreement, the Board received and reviewed materials from RIMCo relating to the amended Management Agreement and the Administrative Agreement, and received an in-person presentation by RIMCo personnel at the December 4, 2007 meeting. The Board considered RIMCo’s view that the separation of investment management and administrative services between RIMCo and RFSC will enhance RIMCo’s ability to track revenue, expense and profitability associated with the provision of both types of services. The Board considered that RFSC is a wholly-owned subsidiary of RIMCo that was formed to perform transfer agent and Fund administrative services for the Funds. The Board considered that the same personnel who formerly performed investment management and administrative services for the Funds on behalf of RIMCo would perform those services on behalf of RIMCo and RFSC, respectively, for the same aggregate fees under the same contractual terms. The Board also considered that RIMCo has agreed to guarantee RFSC’s performance of its obligations as Fund administrator and to assume any liability or obligation incurred or undertaken by RFSC with respect to RIF under the Administrative Agreement.
The Board noted RIMCo’s representation that the nature, extent and quality of the services to be provided by RIMCo and RFSC under the amended Management Agreement and the Administrative Agreement would be the same as the nature, extent and quality of the services that previously had been provided to the Funds by RIMCo. The Board noted that under the Administrative Agreement, RFSC will receive a fee of 0.05% calculated on an annual basis of the Funds’ average daily net assets. Thus, the combined fees payable by the Funds under both amended Management Agreement and the Administrative Agreement will not exceed the fee payable under the Management Agreement prior to its amendment. The Board considered that the fee to be paid under the Administrative Agreement is the same as the fee that is paid pursuant to RIMCo’s administrative agreement with Russell Investment Company, which had been renewed by the Board in April 2007.
The Board noted that it had received and considered extensive information relating to the Management Agreement in connection with its renewal of the Management Agreement at its meeting held on April 24, 2007, and that it is scheduled to consider the renewal of the Advisory Agreement and the Administrative Agreement in April of 2008. The Board also took into account information provided to the Board at its meetings since April 2007, including reports on Fund performance, compliance, shareholder services, and the other services provided to the Fund by RIMCo and its affiliates. The Board considered the representation of the Funds’ Chief Compliance Officer that she was not aware of any material compliance matters that had not been previously disclosed to the Board. Under the circumstances, the conclusions reached by the Board in approving the renewal of the Management Agreement at its meeting held on April 24, 2007 generally were not changed in any material respect by the proposal for the amendment and restatement of the Management Agreement.
After considering the foregoing and other relevant factors, the Board concluded that approval of the amended Management Agreement would be in the best interests of the Funds and their respective shareholders, and voted to approve the amended Management Agreement. In reaching this decision, the Board did not assign relative weights to the factors discussed above or deem any one or group of them to be controlling in and of themselves. The Board was advised by the Funds’ counsel that, under the circumstances, the Agreement did not require any approvals other than the Board’s approval. The Independent Trustees were advised by separate independent legal counsel on their consideration of the Management and Administrative Agreements.
| | |
| Basis for Approval of Investment Advisory Contracts | | 53 |
Russell Investment Funds
LifePoints® Funds Variable Target Portfolio Series
Shareholder Requests for Additional Information (Unaudited)
A complete unaudited schedule of investments is made available generally no later than 60 days after the end of the first and third quarters of each year. These reports are available (i) free of charge, upon request, by calling the Fund at (800) 787-7354, (ii) on the Securities and Exchange Commission’s website at www.sec.gov, and (iii) at the Securities and Exchange Commission’s public reference room.
The Board has delegated to RIMCo, as RIF’s investment adviser, the primary responsibility for monitoring, evaluating and voting proxies solicited by or with respect to issuers of securities in which assets of the Funds may be invested. RIMCo has established a proxy voting committee (“Committee”) and has adopted written proxy voting policies and procedures (“P&P”) and proxy voting guidelines (“Guidelines”). The Funds maintain a Portfolio Holdings Disclosure Policy that governs the timing and circumstances of disclosure to shareholders and third parties of information regarding the portfolio investments held by a Fund. A description of the P&P, Guidelines, Portfolio Holdings Disclosure Policy and additional information about Fund Directors are contained in the Funds’ Statement of Additional Information (“SAI”). The SAI is available (i) free of charge, upon request, by calling the Funds at (800) 787-7354, and (ii) on the Securities and Exchange Commission’s website at www.sec.gov.
Financial Statements of the Underlying Fund can be obtained at no charge by calling the Funds at (800) 787-7354.
If possible, depending on contract owner registration and address information, and unless you have otherwise opted out, only one copy of the RIF prospectus and each annual and semi-annual report will be sent to contract owners at the same address. If you would like to receive a separate copy of these documents, please contact your Insurance Company. If you currently receive multiple copies of the prospectus, annual report and semi-annual report and would like to request to receive a single copy of these documents in the future, please call your Insurance Company.
Some Insurance Companies may offer electronic delivery of the Fund’s prospectus and annual and semiannual reports. Please contact your Insurance Company for further details.
| | |
| 54 | | Shareholder Requests for Additional Information |
Russell Investment Funds
LifePoints® Funds Variable Target Portfolio Series
Disclosure of Information about Fund Directors — December 31, 2007 (Unaudited)
The following tables provide information for each officer and trustee of the Russell Fund Complex. The Russell Fund Complex consists of Russell Investment Company (“RIC”), which has 38 funds, and Russell Investment Funds (“RIF”), which has 9 funds. Each of the trustees is a trustee of both RIC and RIF. The first table provides information for the interested trustee. The second table provides information for the independent trustees. The third table provides information for the trustees emeritus. The fourth table provides information for the officers.
| | | | | | | | | | |
Name,
Age,
Address | | Position(s) Held
with Fund and
Length of
Time Served | | Term
of
Office* | | Principal Occupation(s)
During the
Past 5 Years | | No. of
Portfolios
in Russell
Fund
Complex
Overseen
by Trustee | | Other
Directorships Held
by Trustee |
INTERESTED TRUSTEES | | | | | | | | | | |
#Greg J. Stark Born May 3, 1968 909 A Street Tacoma, Washington 98402-1616 | | • President and Chief Executive Officer since 2004 • Trustee since 2007 | | • Appointed until successor is duly elected and qualified • Until successor is chosen and qualified by Trustees | | • President and CEO RIC and RIF • Chairman of the Board, President and CEO, RIMCo • Chairman of the Board, President and CEO, RFD • Chairman of the Board and President, Russell Insurance Agency, Inc. (insurance agency (“RIA”)) • Until 2004, Managing Director, of Individual Investor Services, FRC • 2000 to 2004 Managing Director, Sales and Client Service, RIMCo | | 47 | | None |
| # | Mr. Stark is also an officer and/or director of one or more affiliates of RIC and RIF and is therefore an Interested Trustee. |
| | | | | | | | | | |
Name,
Age,
Address | | Position(s) Held
With Fund and
Length of
Time Served | | Term
of
Office* | | Principal Occupation(s)
During the
Past 5 Years | | No. of
Portfolios
in Russell
Fund
Complex
Overseen
by Trustee | | Other
Directorships Held
by Trustee |
INDEPENDENT TRUSTEES | | | | | | | | |
Thaddas L. Alston Born April 7, 1945 909 A Street Tacoma, Washington 98402-1616 | | Trustee
since 2006 | | Appointed until successor is duly elected and qualified | | • Senior Vice President, Larco Investments, Ltd. (real estate firm) | | 47 | | None |
| | | | | | | | | | | |
Kristianne Blake
Born January 22, 1954 909 A Street
Tacoma, Washington 98402-1616 | | • Trustee
since 2000 • Chairperson since 2005 | | • Appointed until successor is duly elected and qualified • Annual | | • Director and Chairman of the Audit Committee, Avista Corp. • Trustee and Chairman of the Operations Committee, Principal Funds and Principal Variable Contracts Funds • Regent, University of Washington • President, Kristianne Gates Blake, P.S. (accounting services) • February 2002 to June 2005, Chairman of the Audit Committee, RIC and RIF • Trustee and Chairman of the Operations and Distribution Committee, WM Group of Funds, 1999-2006 | | 47 | | • Director, Avista Corp; (electric utilities) • Trustee, Principal Investors Funds (investment company); • Trustee, Principal Variable Contracts Funds (investment company) |
| * | Each Trustee is subject to mandatory retirement at age 72. |
| | |
| Disclosure of Information about Fund Directors | | 55 |
Russell Investment Funds
LifePoints® Funds Variable Target Portfolio Series
Disclosure of Information about Fund Directors, continued — December 31, 2007 (Unaudited)
| | | | | | | | | | |
Name,
Age,
Address | | Position(s) Held
with Fund and
Length of
Time Served | | Term
of
Office* | | Principal Occupation(s)
During the
Past 5 Years | | No. of
Portfolios
in Russell
Fund
Complex
Overseen
by Trustee | | Other
Directorships Held
by Trustee |
INDEPENDENT TRUSTEES (continued) | | | | | | | | |
Daniel P. Connealy Born June 6, 1946 909 A Street Tacoma, Washington 98402-1616 | | • Trustee since 2003 • Chairman of Audit Committee since 2005 | | • Appointed until successor is duly elected and qualified • Appointed until successor is duly elected and qualified | | • June 2004 to present, Senior Vice President and Chief Financial Officer, Waddell & Reed Financial, Inc. • 2001–2003, Vice President and Chief Financial Officer, Janus Capital Group Inc. | | 47 | | None |
| | | | | | | | | | | |
Jonathan Fine Born July 8, 1954 909 A Street Tacoma, Washington 98402-1616 | | Trustee since 2004 | | • Appointed until successor is duly elected and qualified | | • President and Chief Executive Officer, United Way of King County, WA | | 47 | | None |
| | | | | | | | | | | |
Raymond P. Tennison, Jr. Born December 21, 1955 909 A Street Tacoma, Washington 98402-1616 | | • Trustee
since 2000 • Chairman of the Nominating and Governance Committee since 2007 | | • Appointed until successor is duly elected and qualified. • Appointed until successor is duly elected and qualified | | • President, Simpson Investment Company and several additional subsidiary companies, including Simpson Timber Company, Simpson Paper Company and Simpson Tacoma Kraft Company | | 47 | | None |
| | | | | | | | | | | |
Jack R. Thompson Born March 21, 1949 909 A Street Tacoma, Washington 98402-1616 | | Trustee since 2005 | | • Appointed until successor is duly elected and qualified | | • September 2003 to present, Independent Board Chair and Chairman of the Audit Committee, Sparx Funds • September 2007 to present, Director, Life Advantage Corporation (health products company) • May 1999 to May 2003, President, Chief Executive Officer and Director, Berger Financial Group, LLC • May 1999 to May 2003, President and Trustee, Berger Funds | | 47 | | • Director, Sparx Japan Funds (investment company) • Director, Life Advantage Corporation (health products company) |
| | | | | | | | | | | |
Julie W. Weston Born October 2, 1943 909 A Street Tacoma, Washington 98402-1616 | | • Trustee
since 2002 • Chairperson of the Investment Committee since 2006 | | • Appointed until successor is duly elected and qualified • Appointed until successor is duly elected and qualified | | • Retired | | 47 | | None |
| * | Each Trustee is subject to mandatory retirement at age 72. |
| | |
| 56 | | Disclosure of Information about Fund Directors |
Russell Investment Funds
LifePoints® Funds Variable Target Portfolio Series
Disclosure of Information about Fund Directors, continued — December 31, 2007 (Unaudited)
| | | | | | | | | | |
Name,
Age,
Address | | Position(s) Held
with Fund and
Length of
Time Served | | Term
of
Office | | Principal Occupation(s)
During the
Past 5 Years | | No. of
Portfolios
in Russell
Fund
Complex
Overseen
by Trustee | | Other
Directorships Held
by Trustee |
TRUSTEES EMERITUS | | | | | | | | | | |
*George F. Russell, Jr. Born July 3, 1932 909 A Street Tacoma, Washington 98402-1616 | | Trustee Emeritus and Chairman Emeritus since 1999 | | Until resignation or removal | | • Director Emeritus, Frank Russell Company (investment consultant to institutional investors (“FRC”)); and RIMCo • Chairman Emeritus, RIC and RIF; Russell Implementation Services Inc. (broker-dealer and investment adviser (“RIS”)); Russell 20-20 Association (non-profit corporation); and Russell Trust Company (non-depository trust company (“RTC”)) • Chairman, Sunshine Management Services, LLC (investment adviser) | | 47 | | None |
| | | | | | | | | | | |
Paul E. Anderson Born October 15, 1931 909 A Street Tacoma, Washington 98402-1616 | | Trustee Emeritus since 2007 | | Five year term | | • President, Anderson Management Group LLC (private investments consulting) • February 2002 to June 2005, Lead Trustee, RIC and RIF • Trustee of RIC and RIF Until 2006 • Chairman of the Nominating and Governance Committee 2006 | | 47 | | None |
| | | | | | | | | | | |
William E. Baxter Born June 8, 1925 909 A Street Tacoma, Washington 98402-1616 | | Trustee Emeritus since 2004 | | Five year term | | • Retired since 1986 • Trustee of RIC and RIF Until 2004 | | 47 | | None |
| | | | | | | | | | | |
Lee C. Gingrich Born October 6, 1930 909 A Street Tacoma, Washington 98402-1616 | | Trustee Emeritus since 2006 | | Five year term | | • Retired since 1995 • Trustee of RIC and RIF Until 2005 • Chairman of the Nominating and Governance Committee 2001-2005 | | 47 | | None |
| | | | | | | | | | | |
Eleanor W. Palmer Born May 5, 1926 909 A Street Tacoma, Washington 98402-1616 | | Trustee Emeritus since 2004 | | Five year term | | • Retired since 1981 • Trustee of RIC and RIF Until 2004 | | 47 | | None |
| * | Mr. Russell is also a director emeritus of one or more affiliates of RIC and RIF. |
| | |
| Disclosure of Information about Fund Directors | | 57 |
Russell Investment Funds
LifePoints® Funds Variable Target Portfolio Series
Disclosure of Information about Fund Directors, continued — December 31, 2007 (Unaudited)
| | | | | | |
Name,
Age,
Address | | Position(s) Held
with Fund and
Length of
Time Served | | Term
of
Office | | Principal Occupation(s)
During the
Past 5 Years |
OFFICERS |
Greg J. Stark Born May 3, 1968 909 A Street Tacoma, Washington 98402-1616 | | President and Chief Executive Officer since 2004 | | Until successor is chosen and qualified by Trustees | | • President and CEO, RIC and RIF • Chairman of the Board, President and CEO, RIMCo • Chairman of the Board, President and CEO, RFD • Chairman of the Board and President, Russell Insurance Agency, Inc. (insurance agency (“RIA”)) • Until 2004, Managing Director of Individual Investor Services, FRC • 2000 to 2004, Managing Director, Sales and Client Service, RIMCo |
| | | | | | | |
Cheryl Wichers Born December 16, 1966 909 A Street Tacoma, Washington 98402-1616 | | Chief Compliance Officer since 2005 | | Until removed by Independent Trustees | | • Chief Compliance Officer, RIC • Chief Compliance Officer, RIF • Chief Compliance Officer, RIMCo • April 2002–May 2005, Manager, Global Regulatory Policy • 1998–2002, Compliance Supervisor, Russell Investment Group |
| | | | | | | |
Thomas F. Hanly Born November 17, 1964 909 A Street Tacoma, Washington 98402-1616 | | Chief Investment Officer since 2004 | | Until removed by Trustees | | • Chief Investment Officer, RIC, RIF, FRC, RTC • Director and Chief Investment Officer, RIMCo and RFD • 1999 to 2003, Chief Financial Officer, FRC, RIC and RIF |
| | | | | | | |
Mark E. Swanson Born November 26, 1963 909 A Street Tacoma, Washington 98402-1616 | | Treasurer and Chief Accounting Officer since 1998 | | Until successor is chosen and qualified by Trustees | | • Treasurer, Chief Accounting Officer and CFO, RIC and RIF • Director, Funds Administration, RIMCo, RTC and RFD • Treasurer and Principal Accounting Officer, SSgA Funds |
| | | | | | | |
Gregory J. Lyons Born August 24, 1960 909 A Street Tacoma, Washington 98402-1616 | | Secretary since 2007 | | Until successor is chosen and qualified by Trustees | | • Associate General Counsel and Assistant Secretary FRC and RIA • Director and Secretary, RIMCo and RFD • Secretary and Chief Legal Counsel, RIC and RIF |
| | |
| 58 | | Disclosure of Information about Fund Directors |
Russell Investment Funds
LifePoints® Funds Variable Target Portfolio Series
Matter Submitted to a Vote of Shareholders — December 31, 2007 (Unaudited)
There was a Special Meeting in Lieu of Annual Meeting of Shareholders of the Russell Investment Funds (“the Investment Company”) held at 909 A Street, Tacoma, Washington on October 25, 2007.
THE FOLLOWING MATTERS WERE VOTED UPON AT THE MEETING
The result of each vote accompany the description of each matter
1. Election of Trustees.
Vote:
| | | | |
| | | For | | Against |
Greg J. Stark | | 131,623,711.552 | | 3,323,807.727 |
Thaddas L. Alston | | 131,489,307.992 | | 3,458,211.287 |
Kristianne Blake | | 131,522,555.852 | | 3,424,963.427 |
Daniel P. Connealy | | 131,542,379.471 | | 3,405,139.808 |
Jonathan Fine | | 131,349,760.255 | | 3,597,759.024 |
Raymond P. Tennison, Jr. | | 131,542,839.379 | | 3,404,679.900 |
Jack R. Thompson | | 131,672,873.051 | | 3,274,646.228 |
Julie W. Weston | | 131,622,933.964 | | 3,324,585.315 |
| | |
| Matter Submitted to a Vote of Shareholders | | 59 |
Russell Investment Funds
LifePoints® Funds Variable Target Portfolio Series
909 A Street, Tacoma, Washington 98402
(800) 787-7354
Interested Trustees
Greg J. Stark
Independent Trustees
Thaddas L. Alston
Kristianne Blake
Daniel P. Connealy
Jonathan Fine
Raymond P. Tennison, Jr.
Jack R. Thompson
Julie W. Weston
Trustees Emeritus
George F. Russell, Jr.
Paul E. Anderson
William E. Baxter
Lee C. Gingrich
Eleanor W. Palmer
Officers
Greg J. Stark, President and Chief Executive Officer
Cheryl Wichers, Chief Compliance Officer
Thomas F. Hanly, Chief Investment Officer
Mark E. Swanson, Treasurer and Chief Accounting Officer
Gregory J. Lyons, Secretary
Adviser
Russell Investment Management Company
909 A Street
Tacoma, WA 98402
Administrator and Transfer and Dividend Disbursing Agent
Russell Fund Services Company
909 A Street
Tacoma, WA 98402
Custodian
State Street Bank and Trust Company
Josiah Quincy Building
200 Newport Avenue
North Quincy, MA 02171
Office of Shareholder Inquiries
909 A Street
Tacoma, WA 98402
(800) 787-7354
Legal Counsel
Dechert LLP
200 Clarendon Street, 27th Floor
Boston, MA 02116-5021
Distributor
Russell Fund Distributors, Inc.
909 A Street
Tacoma, WA 98402
Independent Registered Public Accounting Firm
PricewaterhouseCoopers LLP
1420 5th Avenue
Suite 1900
Seattle, WA 98101
Money Managers of Underlying Funds as of December 31, 2007
RIF Core Bond Fund
Bear Stearns Asset Management Inc., New York, NY
Goldman Sachs Asset Management, L.P., New York, NY
Pacific Investment Management Company LLC, Newport Beach, CA
RIF Aggressive Equity Fund
ClariVest Asset Management LLC, San Diego, CA
David J. Greene and Company, LLC, New York, NY
DePrince, Race & Zollo, Inc., Winter Park, FL
Gould Investment Partners LLC, Berwyn, PA
Jacobs Levy Equity Management, Inc., Florham Park, NJ
PanAgora Asset Management, Inc., Boston, MA
Ranger Investment Management, L.P., Dallas, TX
Tygh Capital Management, Inc., Portland, OR
RIF Multi-Style Equity Fund
Arnhold and S. Bleichroeder Advisers, LLC, New York, NY
Columbus Circle Investors, Stamford, CT
DePrince, Race & Zollo, Inc., Winter Park, FL
Institutional Capital LLC, Chicago, IL
Jacobs Levy Equity Management, Inc., Florham Park, NJ
Montag & Caldwell, Inc., Atlanta, GA
Suffolk Capital Management, LLC, New York, NY
RIC Quantitative Equity Fund
Aronson+Johnson+Ortiz, LP, Philadelphia, PA
Franklin Portfolio Associates, LLC, Boston, MA
Goldman Sachs Asset Management, L.P., New York, NY
Jacobs Levy Equity Management, Inc., Florham Park, NJ
RIF Real Estate Securities Fund
AEW Management and Advisors, L.P., Boston, MA
Cohen & Steers Capital Management, Inc., New York, NY
Heitman Real Estate Securities LLC, Chicago, IL
INVESCO Institutional (N.A.), Inc. which acts as a money manager to the Fund through its INVESCO Real Estate division, Dallas, TX
RREEF America L.L.C., Chicago, IL
RIC Emerging Markets Fund
AllianceBernstein L.P., New York, NY
Arrowstreet Capital, Limited Partnership, Cambridge, MA
Genesis Asset Managers, LLP, London, United Kingdom
Harding, Loevner Management, L.P., Somerville, NJ
T. Rowe Price International, Inc., Baltimore, MD
UBS Global Asset Management (Americas) Inc., Chicago, IL
| | |
| 60 | | Adviser, Money Managers and Service Providers |
Russell Investment Funds
LifePoints® Funds Variable Target Portfolio Series
909 A Street, Tacoma, Washington 98402
(800) 787-7354
RIC Global Equity Fund
Altrinsic Global Advisors, LLC, Stamford, CT
ClariVest Asset Management, LLC, San Diego, CA
Gartmore Global Partners, London, United Kingdom
T. Rowe Price International, Inc., Baltimore, MD
RIF Non-U.S. Fund
Altrinsic Global Advisors, LLC, Stamford, CT
AQR Capital Management, LLC, Greenwich, CT
MFS Institutional Advisors, Inc., Boston, MA
Wellington Management Company, LLP, Boston, MA
This report is prepared from the books and records of the Funds and is submitted for the general information of shareholders and is not authorized for distribution to prospective investors unless accompanied or preceded by an effective Prospectus. Nothing herein contained is to be considered an offer of sale or a solicitation of an offer to buy shares of Russell Investment Funds. Such offering is made only by Prospectus, which includes details as to offering price and other material information.
| | |
| Adviser, Money Managers and Service Providers | | 61 |
| | | | |
| Russell Investment Funds | | 909 A Street | | 800-787-7354 |
| | Tacoma, Washington 98402 | | Fax: 253-591-3495 |
| | | | www.russell.com |


36-08-023
| Item 2. | Code of Ethics. [Annual Report Only] |
| (a) | As of the end of the period covered by the report, the registrant has adopted a code of ethics that applies to the registrant’s principal executive officer and principal financial officer (“Code”). |
| (b) | That Code comprises written standards that are reasonably designed to deter wrongdoing and to promote: |
| | 1) | honest and ethical conduct, including the ethical handling of actual or apparent conflicts of interest between personal and professional relationships; |
| | 2) | full, fair, accurate, timely and understandable disclosure in reports and documents that a registrant files with, or submits to, the Securities and Exchange Commission (“SEC”) and in other public communications made by each Mutual Fund; |
| | 3) | compliance with applicable laws and governmental rules and regulations; |
| | 4) | the prompt internal reporting to an appropriate person or persons identified in the Code of violations of the Code; and |
| | 5) | accountability for adherence to the Code. |
| (c) | The Code was restated as of December 6, 2004; the restatement did not involve any material change. |
| (d) | As of the end of the period covered by the report, there have been no waivers granted from a provision of the Code that applies to the registrant’s principal executive officer and principal financial officer. |
| (f) | The registrant has filed with the SEC, pursuant to Item 12(a)(1), a copy of the Code that applies to the registrant’s principal executive officer, principal financial officer, principal accounting officer or controller, or persons performing similar functions, as an exhibit to its annual report on this Form N-CSR. |
| Item 3. | Audit Committee Financial Expert. [Annual Report Only] |
Registrant’s board of trustees has determined that the Registrant has at least one audit committee financial expert serving on its audit committee. Daniel P. Connealy was determined to be the Audit Committee Financial Expert and is also determined to be “independent” for purposes of Item 3, paragraph (a)(2)(i) and (ii) of Form N-CSR.
| Item 4. | Principal Accountant Fees and Services. [Annual Report Only] |
Audit Fees
(a) The aggregate fees billed for each of the last two fiscal years for professional services rendered by the principal accountant for the audit of the registrant’s annual financial statements
or services that are normally provided by the accountant in connection with statutory and regulatory filings or engagements for those fiscal years were as follows:
| | |
2006 | | $153,999 |
2007 | | $249,100 |
Audit-Related Fees
(b) The aggregate fees billed in each of the last two fiscal years for assurance and related services by the principal accountant that are reasonably related to the performance of the audit of the registrant’s financial statements and are not reported under paragraph (a) of this Item and the nature of the services comprising those fees were as follows:
| | | | |
| | | Fees | | Nature of Services |
| 2006 | | $2,206 | | Performance of agreed-upon procedures with respect to 06/30/06 semi-annual reports |
| 2007 | | $7,651 | | Performance of agreed-upon procedures with respect to 06/30/07 semi-annual reports |
Tax Fees
(c) The aggregate fees billed in each of the last two fiscal years for professional services rendered by the principal accountant for tax compliance, tax advice, and tax planning and the nature of the services comprising the fees were as follows:
| | | | | |
| | | Fees | | Nature of Services |
2006 | | $ | 51,053 | | Tax services |
2007 | | $ | 62,100 | | Tax services |
All Other Fees
(d) The aggregate fees billed in each of the last two fiscal years for products and services provided by the principal accountant, other than the services reported in paragraphs (a) through (c) of this Item and the nature of the services comprising those fees were as follows:
| | | | | |
| | | Fees | | Nature of Services |
| 2006 | | $ | 1,157 | | Anti-money laundering, overhead/travel |
| 2007 | | $ | 1,210 | | Anti-money laundering, overhead/travel |
(e) (1) Registrant’s audit committee has adopted the following pre-approval policies and procedures for certain services provided by Registrant’s accountants:
Russell Investment Company
Russell Investment Funds
Audit and Non-Audit Services Pre-Approval Policy
Effective Date: May 19, 2003
As amended through November 14, 2005
This Policy has been adopted by the Audit Committee (the “RIC Audit Committee”) of the Board of Trustees of Russell Investment Company (“RIC”) and the Audit Committee (the “RIF Audit Committee”) of the Russell Investment Funds (“RIF”) to apply to any and all engagements of the independent auditor to RIC and RIF, respectively, for audit, non-audit, tax or other services. In the case of RIC, the term “Audit Committee” as used in this policy shall refer to the RIC Audit Committee and the term “Fund” shall refer to RIC. In the case of RIF, the term “Audit Committee” as used in this Policy shall refer to the RIF Audit Committee and the term “Fund” shall refer to RIF. The term “Investment Adviser” shall refer to Russell Investment Management Company. This Policy does not delegate to management the responsibilities set forth herein for the pre-approval of services performed by the Funds’ independent auditor.
| II. | Statement of Principles. |
Under the Sarbanes-Oxley Act of 2002 (the “Act”), the Audit Committee of the Fund’s Board of Trustees (the “Audit Committee”) is charged with responsibility for the appointment, compensation and oversight of the work of the independent auditor for the Fund. As part of these responsibilities, the Audit Committee is required to pre-approve the audit services and permissible non-audit services (“non-audit services”) performed by the independent auditor for the Fund to assure that the independence of the auditor is not in any way compromised or impaired. In determining whether an auditor is independent, there are three guiding principles under the Act that must be considered. In general, the independence of the auditor to the Fund would be deemed impaired if the auditor provides a service whereby it:
| | • | | Functions in the role of management of the Fund, the adviser of the Fund or any other affiliate* of the Fund; |
| | • | | Is in the position of auditing its own work; or |
| | • | | Serves in an advocacy role for the Fund, the adviser of the Fund or any other affiliate of the Fund. |
Accordingly, it is the policy of the Fund that the independent auditor for the Fund must not be engaged to perform any service that contravenes any of the three guidelines set forth above, or which in any way could be deemed to impair or compromise the independence of the auditor for
| * | For purposes of this Policy, an affiliate of the Funds is defined as the Funds’ investment adviser (but not a sub-adviser whose role is primarily portfolio management and whose activities are overseen by the principal investment adviser), and any entity controlling, controlled by, or under common control with the investment adviser that provides ongoing services to the Fund. |
the Fund. This Policy is designed to accomplish those requirements and will henceforth be applied to all engagements by the Fund of its independent auditor, whether for audit, audit-related, tax, or other non-audit services.
Rules adopted by the United States Securities and Exchange Commission (the “SEC”) establish two distinct approaches to the pre-approval of services by the Audit Committee. The proposed services either may receive general pre-approval through adoption by the Audit Committee of a list of authorized services for the Fund, together with a budget of expected costs for those services (“general pre-approval”), or specific pre-approval by the Audit Committee of all services provided to the Fund on a case-by-case basis (“specific pre-approval”). The Audit Committee believes that the combination of these two approaches reflected in this Policy will result in an effective and efficient procedure for the pre-approval of permissible services performed by the Fund’s independent audit. The appendices to this Policy list the audit, audit-related, tax and other services that have the general pre-approval of the Audit Committee. As set forth in this Policy, unless a particular service has received general pre-approval, those services will require specific pre-approval by the Audit Committee before any such services can be provided by the independent auditor. Any proposed service to the Fund that exceeds the pre-approved budget for those services will also require specific pre-approval by the appropriate Audit Committee.
In assessing whether a particular audit or non-audit service should be approved, the Audit Committee will take into account the ratio between the total amounts paid for audit, audit-related, tax and other services, based on historical patterns at the Fund, with a view toward assuring that the level of fees paid for non-audit services as they relate to the fees paid for audit services does not compromise or impair the independence of the auditor. The Audit Committee will review the list of general pre-approved services, including the pre-approved budget for those services, at least annually and more frequently if deemed appropriate by the Audit Committee, and may implement changes thereto from time to time.
As provided in the Act and in the SEC’s rules, the Audit Committee from time to time may delegate either general or specific pre-approval authority to one or more of its members. Any member to whom such authority is delegated must report, for informational purposes only, any pre-approval decisions to the Audit Committee at its next scheduled meeting.
The annual audit services engagement terms and fees for the independent auditor for the Fund require specific pre-approval of the Audit Committee. Audit services include the annual financial statement audit and other procedures required to be performed by the independent auditor in order to be able to form an opinion on the financial statements for the Fund for that year. These other procedures include reviews of information systems, procedural reviews and testing performed in order to understand and rely on the Fund’s systems of internal control, and consultations relating to the audit. Audit services also include the attestation engagement for the independent auditor’s report on the report from management on financial reporting internal controls. The Audit Committee will review the audit services engagement as necessary or appropriate in the sole judgment of the Audit Committee.
In addition to the pre-approval by the Audit Committee of the annual engagement of the independent auditor to perform audit services, the Audit Committee may grant general pre-approval to other audit services, which are those services that only the independent auditor reasonably can provide. These may include statutory audits and services associated with the Fund’s SEC registration statement on Form N-1A, periodic reports and documents filed with the SEC or other documents issued in connection with the Fund’s securities offerings.
The Audit Committee has pre-approved the audit services set forth in Schedule A of the Audit and Non-Audit Pre-Approved Services. All other audit services not listed in Schedule A of the Audit and Non-Audit Pre-Approved Services must be specifically pre-approved by the Audit Committee.
| V. | Audit-Related Services. |
Audit-related services are assurance and related services that are reasonably related to the performance of the audit or review of the financial statements for the Fund, or the separate financial statements for a series of the Fund that are traditionally performed by the independent auditor. Because the Audit Committee believes that the provision of audit-related services does not compromise or impair the independence of the auditor and is consistent with the SEC’s rules on auditor independence, the Audit Committee may grant pre-approval to audit related services. “Audit related services” include, among others, accounting consultations related to accounting, financial reporting or disclosure matters not classified as “audit services;” assistance with understanding and implementing new accounting and financial report or disclosure matters not classified as “audit services;” assistance with understanding and implementing new accounting and financial reporting guidance from rulemaking authorities; agreed upon or expanded audit procedures related to accounting and/or billing records required to respond to or comply with financial, accounting or regulatory reporting matters; and assistance with internal reporting requirements under Form N-SAR and Form N-CSR.
The Audit Committee has pre-approved the audit-related services set forth in Schedule B of the Audit and Non-Audit Pre-Approved Services. All other audit-related services not listed in Schedule B of the Audit and Non-Audit Pre-Approved Services must be specifically pre-approved by the Audit Committee.
The Audit Committee believes that the independent auditor can provide tax services to the Fund, such as tax compliance, tax planning and tax advice, without impairing the auditor’s independence and the SEC has stated that the independent auditor may provide such services. Consequently, the Audit Committee believes that it may grant general pre-approval to those tax services that have historically been provided by the auditor, that the Audit Committee has reviewed and believes would not impair the independence of the auditor, and that are consistent with the SEC’s rules on auditor independence. However, the Audit Committee will not permit
the retention of the independent auditor to provide tax advice in connection with any transaction recommended by the independent auditor, the sole business purpose of which may be tax avoidance and the tax treatment of which may not be supported by the United States Internal Revenue Code and related regulations or the applicable tax statutes and regulations that apply to the Funds investments outside the United States. The Audit Committees will consult with the Treasurer of the Fund or outside counsel to determine that the Fund’s tax planning and reporting positions are consistent with this policy. The Audit Committee has pre-approved the tax services set forth in Schedule C of the Audit and Non-Audit Pre-Approved Services. All other tax services not listed in Schedule C of the Audit and Non-Audit Pre-Approved Services must be specifically pre-approved by the Audit Committee.
The Audit Committee believes, based on the SEC’s rules prohibiting the independent auditor from providing specific non-audit services, that other types of non-audit services are permitted. Accordingly, the Audit Committee believes that it may grant general pre-approval to those permissible non-audit services classified as “all other” services that the Audit Committee believes are routine and recurring services, would not impair or compromise the independence of the auditor and are consistent with the SEC’s rules on auditor independence.
The Audit Committee has pre-approved the permissible “all other services” set forth in Schedule D of the Audit and Non-Audit Pre-Approved Services. Permissible “all other services” not listed in Schedule D of the Audit and Non-Audit Pre-Approved Services must be specifically pre-approved by the Audit Committee.
A list of the SEC’s prohibited non-audit services is attached to this Policy as Schedule E of the Audit and Non-Audit Pre-Approved Services. The SEC’s rules and relevant official interpretations and guidance should be consulted to determine the scope of these prohibited services and the applicability of any exceptions to certain of the prohibitions. Under no circumstance may an executive, manager or associate of the Fund, or the Investment Adviser, authorize the independent auditor for the Fund to provide prohibited non-audit services.
| VIII. | Pre-Approval Fee Levels or Budgeted Amounts. |
Pre-Approval fee levels or budgeted amounts for all services to be provided by the independent auditor will be established annually by the Audit Committee and shall be subject to periodic subsequent review during the year if deemed appropriate by the Audit Committee. (Separate amounts may be specified for the Fund and for other affiliates in the investment company complex subject to pre-approval). Any proposed services exceeding these levels or amounts will require specific pre-approval by the Audit Committee. The Audit Committee will be mindful of the overall relationship of fees for audit and non-audit services in determining whether to pre-approve any such services. For each fiscal year, the Audit Committee may determine the appropriateness of the ratio between the total amount of fees for Audit, Audit-related, and Tax services for the Fund (including any Audit-related or Tax services fees for affiliates subject to pre-approval), and the total amount of fees for certain permissible non-audit services classified as “all other services” for the Fund (including any such services for affiliates subject to pre-approval by the Audit Committee).
All requests or applications for services to be provided by the independent auditor that do not require specific pre-approval by the Audit Committee will be submitted to the “RIC/RIF Clearance Committee” (the “Clearance Committee”) (which shall be comprised of not less than three members, including the Treasurer of the Fund who shall serve as its Chairperson) and must include a detailed description of the services to be rendered and the estimated costs of those services. The Clearance Committee will determine whether such services are included within the list of services that have received general pre-approval by the Audit Committee. The Audit Committee will be informed not less frequently than quarterly by the Chairperson of the Clearance Committee of any such services rendered by the independent auditor for the Fund and the fees paid to the independent auditors for such services.
Requests or applications to provide services that require specific pre-approval by the Audit Committee will be submitted to the Audit Committee by both the independent auditor and the Clearance Committee and must include a joint certification by the engagement partner of the independent auditor and the Chairperson of the Clearing Committee that, in their view, the request or application is consistent with the SEC’s rules governing auditor independence.
The Internal Audit Department of Frank Russell Company, the parent company of RIMCo, and the officers of RIC and RIF will report to the Chairman of the Audit Committee any breach of this Policy that comes to the attention of the Internal Audit Department of Frank Russell Company or an officer of RIC or RIF.
| X. | Additional Requirements. |
The Audit Committee has determined to take additional measures on an annual basis to meet its responsibility to oversee the work performed by the independent auditor and to assure the internal auditor’s continuing independence from the Fund and its affiliates, including Frank Russell Company. Such efforts will include, but not be limited to, reviewing a written annual statement from the independent auditor delineating all relationships between the independent auditor and RIC, RIF, and Russell and its subsidiaries and affiliates, consistent with Independence Standards Board Standard No. 1, and discussing with the independent auditor its methods and procedures for ensuring its independence.
(e) (2) The percentage of services described in each of paragraphs (b) through (d) of this Item that were approved by the audit committee pursuant to paragraph (c)(7)(i)(C) of Rule 2-01 of Regulation S-X is as follows:
| | |
Audit Fees | | 100% |
Audit-Related Fees | | 100% |
Tax Fees | | 100% |
All Other Fees | | 100% |
(f) For services, 50 percent or more of which were pre-approved, the percentage of hours expended on the principal accountant’s engagement to audit the registrant’s financial statements for the most recent fiscal year that were attributed to work performed by persons other than the principal accountant’s full-time, permanent employees was 0%.
(g) The aggregate non-audit fees billed by registrant’s accountant for services rendered to the registrant, and rendered to the registrant’s investment adviser (not including any sub-adviser whose role is primarily portfolio management and is subcontracted with or overseen by another investment adviser), and any entity controlling, controlled by, or under common control with the adviser that provides ongoing services to the registrant for each of the last two fiscal years of the registrant were as follows:
| | | |
2006 | | $ | 149,250 |
2007 | | $ | 11,581 |
(h) The registrant’s audit committee of the board of trustees has considered whether the provision of nonaudit services that were rendered to the registrant’s investment adviser (not including any subadviser whose role is primarily portfolio management and is subcontracted with or overseen by another investment adviser), and any entity controlling, controlled by, or under common control with the investment adviser that provides ongoing services to the registrant that were not pre-approved pursuant to paragraph (c)(7)(ii) of Rule 2-01 of Regulation S-X is compatible with maintaining the principal accountant’s independence.
| Item 5. | Audit Committee of Listed Registrants. [Not Applicable] |
| Item 6. | [Schedules of Investments are included as part of the Report to Shareholders filed under Item 1 of this form] |
| Items 7-9. | [Not Applicable] |
| Item 10. | Submission of Matters to a Vote of Security Holders |
There have been no changes to the procedures by which shareholders may recommend nominees to the Registrant’s Board of Trustees that would require disclosure herein.
| Item 11. | Controls and Procedures |
(a) Registrant’s principal executive officer and principal financial officer have concluded that Registrant’s disclosure controls and procedures (as defined in Rule 30a-2(c) under the Investment Company Act of 1940 (the “Act”)) are effective, based on their evaluation of these controls and procedures as of a date within 90 days of the date this report is filed with the Securities and Exchange Commission.
(b) There were no significant changes in Registrant’s internal control over financial reporting that occurred during the period covered by this report that has materially affected or is likely to materially affect Registrant’s internal control over financial reporting.
| | |
| (a) | | Registrant’s code of ethics described in Item 2. |
| |
| (b) | | Certification for principal executive officer of Registrant as required by Rule 30a-2(a) under the Act and certification for principal financial officer of Registrant as required by Rule 30a-2(a) under the Act. |
SIGNATURES
Pursuant to the requirements of the Securities Exchange Act of 1934 and the Investment Company Act of 1940, the Registrant has duly caused this report to be signed on its behalf by the undersigned, thereunto duly authorized.
| | |
| Russell Investment Funds |
| |
| By: | | /s/ Greg J. Stark |
| | Greg J. Stark |
| | Principal Executive Officer and Chief Executive Officer |
| |
| Date: | | February 27, 2008 |
Pursuant to the requirements of the Securities Exchange Act of 1934 and the Investment Company Act of 1940, this report has been signed below by the following persons on behalf of the Registrant and in the capacities and on the dates indicated.
| | |
| |
| By: | | /s/ Greg J. Stark |
| | Greg J. Stark |
| | Principal Executive Officer and Chief Executive Officer |
| |
| Date: | | February 27, 2008 |
| |
| By: | | /s/ Mark E. Swanson |
| | Mark E. Swanson |
| | Principal Financial Officer, Principal Accounting Officer and Treasurer |
| |
| Date: | | February 27, 2008 |