Table of Contents
UNITED STATES
SECURITIES AND EXCHANGE COMMISSION
Washington, D.C. 20549
FORM N-CSR
CERTIFIED SHAREHOLDER REPORT OF REGISTERED
MANAGEMENT INVESTMENT COMPANIES
Investment Company Act file number: 811-05371
| Russell Investment Funds |
(Exact name of registrant as specified in charter)
| 1301 2nd Avenue 18th Floor, Seattle Washington 98101 |
(Address of principal executive offices) (Zip code)
Mary Beth Rhoden, Secretary and Chief Legal Officer Russell Investment Funds 1301 2nd Avenue 18th Floor Seattle, Washington 98101 206-505-4846 |
(Name and address of agent for service)
Registrant’s telephone number, including area code: 206-505-7877
Date of fiscal year end: December 31
Date of reporting period: January 1, 2010 to December 31, 2010
Table of Contents
Item 1. Reports to Stockholders
Table of Contents

2010 ANNUAL REPORT
Russell Investment Funds
DECEMBER 31, 2010
FUND
Multi-Style Equity Fund
Aggressive Equity Fund
Non-U.S. Fund
Core Bond Fund
Real Estate Securities Fund

Table of Contents
Russell Investment Funds
Russell Investment Funds is a series investment company with nine different investment portfolios referred to as Funds. These financial statements report on five of these Funds.
Table of Contents
Russell Investment Funds
Annual Report
December 31, 2010
Table of Contents
Russell Investment Funds
Copyright © Russell Investments 2011. All rights reserved.
Russell Investments is a Washington, USA corporation, which operates through subsidiaries worldwide and is a subsidiary of The Northwestern Mutual Life Insurance Company.
Fund objectives, risks, charges and expenses should be carefully considered before investing. A prospectus containing this and other important information must precede or accompany this material. Please read the prospectus carefully before investing.
Securities products and services offered through Russell Financial Services, Inc., a member of FINRA and part of Russell Investments.
Indices and benchmarks are unmanaged and cannot be invested in directly. Returns represent past performance, are not a guarantee of future performance, and are not indicative of any specific investment. Index return information is provided by vendors and although deemed reliable, is not guaranteed by Russell Investments or its affiliates.
Russell Investments is the owner of the trademarks, service marks, and copyrights related to its respective indexes.
Performance quoted represents past performance and does not guarantee future results. The investment return and principal value of an investment will fluctuate so that shares, when redeemed, may be worth more or less than their original cost. Current performance may be lower or higher than the performance data quoted.
Table of Contents
I am pleased to share with you the results from the Russell Investment Funds’ 2010 Annual Report. It provides portfolio management discussions and fund-specific insights regarding fund performance for the fiscal year ending December 31, 2010.
Russell Investments’ mission is plain and simple — to improve financial security for people. We work to achieve this goal by delivering disciplined investment strategies, objective research and industry-leading service. Despite the difficult economic times and volatile investment markets, we will never lose sight of this primary mission.
Looking back at 2010, it has been a year of progress and challenges. Investors are still wrestling with the aftershocks of market disruptions. The broad equity market, represented by the Russell Global Index, is up more than 9% year-to-date at the writing of this letter in December. But employment numbers in the U.S. are still a cause for concern, as are the debt challenges of several European countries. We believe the experiences of 2010 continue to demonstrate the value of diversification and proactive investment management.
Now more than ever, we believe investors are best served by remaining focused on long-term investing using well-diversified, asset allocated portfolios. We believe it is equally important for investors to continue to talk with their financial advisors to ensure their portfolios remain aligned with their goals. Working with a trusted advisor is the best way to maintain this focus.
The Russell Investments team has decades of experience managing people’s investments through all kinds of market cycles. We believe monitoring investment managers continuously, and maintaining a disciplined approach to portfolio management and implementation is the best way to achieve long-term goals.
On behalf of the Russell Investments team, thank you for your continued support.
Best regards,

Sandra Cavanaugh
CEO, Americas Private Client Services
Russell Investment Management Company
| To Our Shareholders | 3 |
Table of Contents
Russell Investment Funds
Market Summary as of December 31, 2010 (Unaudited)
U.S. Equity Markets
For the fiscal year ended December 31, 2010, the U.S. equity market experienced high levels of volatility, but less than in the one year period ended December 31, 2009. While the markets experienced numerous reversals during the period, investors became increasingly, though cautiously, optimistic regarding the sustainability of the global economic recovery. Strong corporate earnings growth translated into strong positive returns for the major market indexes. The broad market Russell 3000® Index rose 16.93% over the period as global growth recovered and the U.S. economy appeared to be stabilizing.
The economy continued to grow over the fiscal year, but at a slow pace. Relative to past recoveries from deep recessions, economic growth as measured by gross domestic product (GDP) failed to rebound as quickly or with the strength necessary to increase employment and provide assurances that the recessionary period was truly over. Unemployment remained high, averaging approximately 9.5% over the period while wage growth remained stagnant. The national savings rate increased from a modestly negative percentage to a more substantial 6%. While this is a longer-term positive factor for the U.S. economy as it improves the financial health of consumers, the short-term result has been to lower consumer spending. Given the key role that consumer spending continues to play in driving U.S. GDP, expectations for a strong economic recovery moderated as the fiscal year progressed and investors began to expect a more slowly paced increase in economic activity going forward. Expectations were further moderated by a persistently weak housing market, where sales declined following the expiration of the first time home buyers tax credit in the spring.
In response to the slow pace of the economic recovery, and its jobless nature, the U.S. government stepped up its efforts to stimulate economic growth. Unemployment benefits were extended to support consumer demand, while stimulus spending injected capital into the economy. Toward the latter part of the fiscal year, the Federal Reserve announced its intention to expand its quantitative easing efforts beyond the purchase of mortgage backed securities and into direct purchases of U.S. government debt. The market rose as a result due to expectations that this direct injection of money into the economy would cause interest rates to decline in the intermediate-term, and inflationary expectations to rise in the longer-term. Investors took comfort in the Federal Reserve taking such actions to help provide support for the economy and guide it towards a sustainable recovery.
Over the course of the period, global economic growth rebounded on the strength of emerging markets demand and growth. This has been a key to improving investor sentiment and has driven the relative outperformance of some of the more export-oriented sectors including producer durables, materials and processing, and technology. The consumer discretionary sector, which was the best performing sector over the one year period, benefited from both international demand and a modest domestic recovery. Increased global wealth has driven up demand for aspirational goods and services, with leisure travel, lodging and gaming all benefiting.
Domestically, retailers with strong market share and the ability to increase profit margins performed well. The utilities sector outperformed as well. Demand for companies with a lower degree of perceived downside risk increased, as did the desire for steady sources of income. On the other end of the return spectrum, the financial services sector underperformed relative to the benchmark. Increasing financial regulations and an uncertain business landscape made investors wary of investing in banks, brokerage companies and other financial institutions. Concerns over additional losses related to the housing market and uncertainty over the health of loan portfolios also concerned investors. Health care stocks lagged as well, due largely to the uncertainty associated with the passage of new health care legislation and its impact on corporate profitability. Energy stocks underperformed due to concerns over weaker demand growth for gas and oil in a sluggish economic recovery. Potential fallout from the Gulf Coast oil spill also created uncertainty around deep water exploration and drilling firms. Lastly, the consumer staples sector lagged despite strong demand from overseas markets, as investors gravitated away from these companies’ higher relative valuations and the potential margin pressure they could face if commodity prices rise.
Overall, the period was marked by a high degree of correlation among stock price movements across large segments of the benchmark. As such, benchmark and market returns were driven by the performance of the higher and lower ends of
| 4 | Market Summary |
Table of Contents
Russell Investment Company
the risk spectrum where there was more stock price return differentiation. This was largely a result of significant oscillations in investor sentiment driven by macro-economic news and events. This resulted in a “risk on/risk off” phenomenon. Positive economic and company specific news resulted in a “risk on” scenario where companies with more economic sensitivity outperformed the benchmark when “risk” was in favor. In contrast, negative news on the economy, employment, housing, and the European sovereign debt situation resulted in a highly risk-averse (“risk off”) environment in which investors sought safe haven or more defensively oriented investments. Throughout the fiscal year it was a struggle between these two forces, as investors were heavily swayed more by macro-economic news than by company-specific data.
The high degree of uncertainty in the market regarding regulatory, fiscal and monetary policy resulted in a challenging active management environment in U.S. equities. Value-oriented managers had a particularly difficult time due to their almost perennial underweight to the strongly performing utilities sector, while growth-oriented managers fared better. The relative outperformance of consumer staples and parts of the health care sector in the more defensive periods decreased returns for value managers. Additionally, commodity-oriented stocks performed relatively well as investors bet on a sustainable global economic recovery. In contrast, value managers were overweight in technology and consumer discretionary sector companies that they believed had relatively higher and more sustainable growth characteristics. The more cyclical consumer and technology companies as well as those focusing on lower-end domestic consumer spending and targeting international growth performed relatively well.
Growth managers fared relatively well as investors favored growth companies, pushing up the price of stocks associated with international and emerging markets. This applied to technology and consumer product companies as well as agricultural, commodities, and industrial companies producing goods and basic resources needed to satiate emerging market demand. The stocks of the fastest growing companies outperformed the stocks of companies whose earnings grew at a slower rate. This is based on return data categorizing stocks according to each company’s 5-year historical EPS Growth, 1-Year Sales Growth, and IBES Long-Term Forecasted Growth.
Driven by expectations for a moderate global economic recovery, stock prices in the U.S. rose strongly across the investment style as well as the market capitalization spectra.
For the period, the Russell 1000® Growth Index returned 16.7% and the Russell 1000® Value Index returned 15.51%, while the Russell 2000® Growth Index returned 29.1% and the Russell 2000® Value Index returned 24.5%. Small capitalization stocks outperformed large capitalization stocks for the one year period as the Russell 2000® Index returned 26.9% and the Russell 1000® Index returned 16.1% for the period. Mid capitalization stocks once again performed well over the period, while micro capitalization stocks performed best as the Russell Midcap® Index returned 25.47% and the Russell Microcap® Index returned 28.9% for the fiscal year.
The Lipper® Small Cap Value Funds Average outperformed the Russell 2000® Value Index by 1.25%, the Lipper® Small Cap Core Funds Average underperformed the Russell 2000® Index by 1.12% and the Lipper® Small Cap Growth Funds Average underperformed the Russell 2000® Growth Index by 2.05%. The Lipper® Large Cap Growth Funds Average underperformed the Russell 1000® Growth Index by 1.58%, the Lipper® Large Cap Core Funds Average underperformed the Russell 1000® Index by 3.94%, and the Lipper® Large Cap Value Funds Average underperformed the Russell 1000® Value Index by 1.81%.
Non-U.S. Developed Equity Markets
2010 was a rollercoaster year for investors. The Non-U.S. developed equity markets, as measured by the MSCI EAFE Index, rose 7.75% during the year, with most of the Index’s gains coming in the second half of the year. Fears of the European sovereign debt crisis igniting another global economic downturn subsided as a gradual recovery became more likely. Markets fell sharply at the end of April and remained extremely volatile until September, when riskier stocks began to improve as investors gained optimism. On a month-by-month basis, market leadership was inconsistent, but trends became more apparent when the whole of 2010 was taken into account.
The risk factor that was most rewarded was high beta, followed by high price-volatility and high price-momentum. All three factors are a reflection of the market environment that benefited riskier stocks. The prices of high beta stocks tend to rise faster than the broad market in positive return environments, but also fall faster when markets are negative. The price volatility factor represents stocks whose prices tend to change more than the average stock, meaning performance gains and losses are amplified. This is similar to market beta, except that there isn’t necessarily a relationship between the performance of the market and its underlying stocks. Stocks with high-price momentum performed better than the market during the 12 months prior. Their outperformance signals the fact that stocks that did well in 2009 continued to
| Market Summary | 5 |
Table of Contents
Russell Investment Company
outperform in 2010. Momentum made a comeback in 2010, as many of the stocks that rose in 2009 continued to lead the market. Stocks that are typically considered higher-quality, those with high profitability or return on equity, underperformed. However, financial leverage was the worst performing market factor. Financial leverage is a characteristic that investors can use to determine balance sheet quality. Financial leverage is the degree to which a company is utilizing borrowed money (debt) to finance its operations. Financial leverage can boost profits in certain periods, but when debt repayment is a concern, as it was in 2010, companies with a high-level of financial leverage, can perform poorly. Growth stocks significantly outperformed value stocks, with the MSCI EAFE Growth Index returning 12.25% and outperforming the MSCI EAFE Value Index by 9.0%.
Small cap stocks outperformed large cap stocks by a wide margin, as measured by the MSCI EAFE Small Cap Index and the MSCI EAFE Index. U.S. stocks, as measured by the Russell 1000® Index, outperformed developed non-U.S. stocks, as measured by the MSCI EAFE Index, by more than 8.35%, indicating that signs of economic recovery were more evident in the U.S. Extremely negative performance outcomes by the PIIGS countries (Portugal, Ireland, Italy, Greece and Spain), catalyzed by fears surrounding sovereign debt, weighed heavily on international markets. Greece and Spain were penalized most, with returns of -44.87% and -21.95%, respectively, as measured by the MSCI Greece Index and MSCI Spain Index. Both countries’ performance suffered due to uncertainty regarding their ability to service sovereign debt, but experienced some recovery toward the end of the year. Although markets tended to reward risk, stocks with severe debt issues lagged the market. Investors’ dislike for financial leverage impacted country-level returns as well. The weak performance from Greece and Spain confirm this sentiment. Japan as measured by MSCI Japan, out-performed the MSCI EAFE Index returning 15.44% for the year. Emerging markets companies continued to outpace developed markets with the strong return of 18.88%, as measured by the MSCI Emerging Markets Index. Argentina, Thailand, and Peru were the best performing emerging markets countries, all returning over 50% for the year, as measured by the MSCI Argentina Index, MSCI Thailand Index and MSCI Peru Index. China severely underperformed the broader MSCI Emerging Markets Index and the MSCI EAFE Index with a positive return of only 4.63%, as measured by the MSCI China Index , due to inflationary pressures and fears of economic overheating.
The industrials sector was the best performing of the ten sectors in the MSCI EAFE Index, with a return of 20.39%. The companies that make up the sector tend to be economically sensitive and thus performed well given the improving economic environment. Consumer discretionary stocks benefited from the upswing in consumer spending and the sector ended the year up 19.73%. The materials, technology and consumer staples sectors also out-performed the MSCI EAFE Index. Utilities and financials were the only two sectors with negative performance during the year, with returns of -4.88% and -1.62%, respectively, as measured by the MSCI EAFE Utilities and MSCI EAFE Financials Sector Indices . Consumer stocks were led by automobiles and retail. There remains a great deal of skepticism surrounding the health of commercial banks.
Emerging Markets
The MSCI Emerging Markets Index (“the Index”) was up 18.88% over the fiscal year ended December 31, 2010. In spite of persistent volatility, Emerging Markets finished ahead of Developed Markets, which gained 11.76% over the year, as measured by the MSCI Daily TR Net Developed Markets Index in U.S. dollar terms.
Emerging market gains during 2010 were largely driven by a strong recovery in the second half of the fiscal year as the global economic backdrop turned positive. The Index had a modest return of 2.40% during the first calendar quarter, driven by concerns over the sustainability of economic recovery resulting from moves to withdraw stimulus funding in the U.S. and China and by concerns about a growing debt crisis in Europe.
This was followed by a negative and challenging second quarter in which emerging market stocks, commodities and currencies fell sharply, as investor appetite for risk diminished in favor of safer assets, including gold — which reached a record high — and the U.S. dollar. The Index gave up 8.37%, led by heavy losses in May, when the Index endured its worst month since October 2008. The intensifying debt crisis in Europe, evidence of a slowdown in the U.S. and Chinese economies, a massive overhaul of the U.S. banking system and a crisis on the Korean peninsula all had a negative impact.
Emerging market stocks went on to rally sharply over the third quarter, notably in July and September, when the Index enjoyed its best monthly gain since July 2009. The Index gained 18.03% over the period, helped by the secular growth stories that prevailed in certain markets. Investors were also buoyed by news in July that the IMF had raised its global growth forecast and by second-quarter earnings releases from a number of the world’s biggest companies that were well in excess of expectations. Gains were reinforced by more upbeat news from Europe, where the results of the stress tests on banks were largely welcomed.
| 6 | Market Summary |
Table of Contents
Russell Investment Company
The positive trend continued in the fourth quarter, driven by further signs of a burgeoning recovery in the U.S., strong growth in China and by speculation that the second round of quantitative easing (i.e., a policy by which the Federal Reserve purchases U.S. treasuries with newly created central bank money) would help global growth accelerate. A very positive third quarter earnings season and central bank intervention in Europe also helped offset the negative impact of monetary tightening in China and renewed concerns over the debt crisis in Western Europe.
Throughout, there was notable dispersion across country returns over the calendar year, with the smaller emerging market countries performing best. Thailand gained 55.71%, as measured by the MSCI Daily TR Net Emerging Markets Thailand Index. In Latin America, key beneficiaries of the demand for raw materials and the increased risk appetite were strongest, including Peruvian stocks, which gained 53.32%, as measured by the MSCI Daily TR Net Emerging Markets Peru Index, Chilean stocks, which increased 44.16%, as measured by the MSCI daily TR Net Emerging Markets Chile Index in U.S. dollar terms, and Colombian stocks, which gained 43.41%, as measured by the MSCI Daily TR Net Emerging Markets Colombia Index in U.S. dollar terms.
From a regional standpoint, returns in Europe were generally weaker, reflected by the negative returns from Hungary, which declined 9.58%, as measured by the MSCI Daily TR Net Emerging Markets Hungary Index in U.S. dollar terms, and the Czech Republic, which fell 2.53%, as measured by MSCI Daily TR Net Emerging Markets Czech Republic Index in U.S. dollar terms. The larger emerging market countries China and Brazil also stood out in that both had modest returns over the calendar year relative to others, gaining just 4.63% and 6.54%, respectively, as per the MSCI daily TR Net Emerging Markets China Index in U.S. dollar terms and MSCI Daily TR Net Emerging Markets Brazil Index in U.S. dollar terms. At the sector level, the consumer theme dominated returns, with consumer staples stocks gaining 30.35%, as measured by the MSCI Daily TR Net Emerging Markets Consumer Staples Index in U.S. dollar terms, and consumer discretionary stocks gaining 31.40%, as measured by the MSCI Daily TR Net Emerging Markets Consumer Discretionary Index in U.S. dollar terms. This was well ahead of the more defensive utilities sector, which gained 8.10%, as measured by the MSCI Daily TR Net Emerging Markets Utilities Index in U.S. dollar terms, and energy, which gained 9.91%, as measured by the MSCI Daily TR Net Emerging Markets Energy Index in U.S. dollar terms over the calendar year.
Small capitalization stocks, as measured by the MSCI Daily TR Net Emerging Markets Small Cap Index in U.S. dollar terms, gained 27.17%, beating larger-capitalization counterparts, which rose 18.34%, as measured by the MSCI Daily TR Net Emerging Markets Large Cap Index in U.S. dollar terms.
U.S./Global Fixed Income Markets
Over most of the fiscal year ended December 31, 2010, fixed income markets largely continued the global credit rally that started in the early part of 2009, which began with the announcement of government stimulus programs and the release of generally positive U.S. bank stress test results. Despite bouts of volatility brought on by concerns around European sovereign debt, the uncertainty of U.S. economic recovery, the Gulf Coast oil spill, and Federal Reserve market intervention, U.S. interest rates declined and broad bond market indices did well: The 2-year Treasury yield decreased 54 bps to 0.60% and the 10-year yield decreased 54 bps to 3.30%; the Barclays Capital U.S. Aggregate (investment grade) Bond Index, U.S. High Yield Bond Index and Emerging Market Bond Index returned 6.54%, 15.12% and 12.84%, respectively.
There was little market turmoil at the beginning of 2010. Investors anticipated that the U.S. economic recovery would soon stabilize and transition off of government stimulus support. As an example of this, at the end of March 2010, the U.S. Federal Reserve Bank (the Fed) completed its $1.25 trillion agency mortgage-backed security buying program without credit markets being materially disturbed.
By late April and early May, investors saw the return of volatility: The Greek and peripheral European sovereign debt crisis made investors anxious that credit events originating in one region could again spread to other parts of the world. At the same time, the Gulf Coast oil spill reminded investors that unexpected and seemingly random negative events could still pop up and roil financial markets. The U.S. Treasury yield curve reflected this anxiety, with the two-year Treasury yield dropping from 0.58% to 0.60%, and the ten-year Treasury yield dropping from 1.06% to 2.93%i, as investors ran to (and bid up the prices on) low-risk debt backstopped by the U.S. government. Simultaneously, the Fed again became concerned with the U.S. economy, and began to signal that it would hold the overnight target rate at its historically low range of 0.00% to 0.25% for an extended period (which it did through the end of the year). This effectively signaled to investors who had been expecting a rate increase by the end of 2010 to not look for one until well into 2011. Included in this message was that the Fed believed deflation was a greater near-term risk than inflation.
| Market Summary | 7 |
Table of Contents
Russell Investment Company
The housing market, which precipitated the financial crisis in the summer of 2007, continued to have an impact on the overall market throughout the year. Investors were concerned about the effectiveness of U.S. government programs to help borrowers refinance or modify their mortgages in an attempt to stem the rising tide of foreclosures. This problem was exacerbated in the latter part of the year with news that several large residential mortgage servicers were halting foreclosures due to inaccurate or incomplete paperwork, and lawsuits were filed that contended banks did not legally have the right to proceed with certain foreclosures. Despite these issues (which remained unresolved at year end), over the period both residential and commercial mortgage-backed securities performed well, both in terms of total return and relative returns, as compared to equivalent-duration U.S. Treasuries.
Despite the aforementioned bouts of volatility, it was the Fed’s announcement of more support in the form of another round of quantitative easing dubbed “QE2” (i.e., purchasing U.S. Treasuries with newly created central bank money) that caused the fixed income market to fluctuate and turn negative in the last two months of the year. The Fed had previously indicated the possibility of another round of monetary easing and the general expectation had been that QE2 would keep Treasury rates low and thus bode well for credit markets. However, investors focused on the inflationary and U.S. dollar-depressing effects of QE2, with many openly criticizing the $600 billion program. This caused Treasury yields to reverse course and start heading back up. During the first ten months of the year, the 2-year Treasury yield decreased 80 bps to 0.34% and the 10-year yield decreased 124 bps to 2.60%. Following the announcement of QE2, over November and December, 2-year and 10-year Treasury yields increased 26 bps and 69 bps, respectively. Thus it was the Fed’s effort to bolster the economy that caused Treasuries to return -2.6% in the fourth quarter of 2010, which in turn moved the U.S. Aggregate Bond Index to post its first negative quarterly total return in two years.
| i | April-June 2010 peak-to-trough changes |
| 8 | Market Summary |
Table of Contents
[This page intentionally left blank]
Table of Contents
Russell Investment Funds
Portfolio Management Discussion — December 31, 2010 (Unaudited)
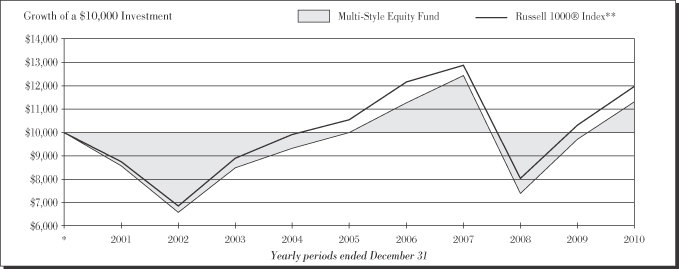
Multi-Style Equity Fund | ||||
| Total Return | ||||
1 Year | 16.46 | % | ||
5 Years | 2.51 | %§ | ||
10 Years | 1.25 | %§ | ||
| Russell 1000® Index ** | ||||
| Total Return | ||||
1 Year | 16.10 | % | ||
5 Years | 2.59 | %§ | ||
10 Years | 1.83 | %§ | ||
| 10 | Multi-Style Equity Fund |
Table of Contents
Russell Investment Funds
Multi-Style Equity Fund
Portfolio Management Discussion — December 31, 2010 (Unaudited)
The Multi-Style Equity Fund (the “Fund”) allocates most of its assets among multiple money managers. Russell Investment Management Company (“RIMCo”), as the Fund’s advisor, may change the allocation of the Fund’s assets among money managers at any time. An exemptive order from the Securities and Exchange Commission (“SEC”) permits RIMCo to engage or terminate a money manager at any time, subject to approval by the Fund’s Board without a shareholder vote. Pursuant to the terms of the exemptive order, the Fund is required to notify its shareholders within 60 days of when a money manager begins providing services. The Fund currently has eight money managers.
What is the Fund’s investment objective?
The Fund seeks to provide long-term capital growth.
How did the Fund perform relative to its benchmark for the fiscal year ended December 31, 2010?
For the fiscal year ended December 31, 2010, the Multi-Style Equity Fund gained 16.46%. This compared to the Russell 1000® Index, which gained 16.10% during the same period. The Fund’s performance includes operating expenses, whereas Index returns are unmanaged and do not include expenses of any kind.
For the fiscal year ended December 31, 2010, the Lipper® Large-Cap Core Funds (VIP) Average gained 13.50%. This average return serves as a peer comparison and is expressed net of operating expenses.
RIMCo may assign a money manager a specific style or capitalization benchmark other than the Fund’s index. However, the Fund’s primary index remains the benchmark for the Fund and is representative of the aggregate of each money manager’s benchmark index.
How did the market conditions described in the Market Summary report affect the Fund’s performance?
The fiscal year ended December 31, 2010 was marked by two almost separate periods — pre and post quantitative easing announced by the U.S. Federal Reserve. Quantitative easing involves purchasing U.S. Treasuries with newly created central bank money. During the first quarter, equity markets maintained some of the positive momentum generated during 2009, but gave back all gains and were posting negative year to date returns as late as August. Concerns over sovereign debt issues in Europe and negative housing data dragged down equity markets during the second and early third quarters. Near the end of the third quarter the U.S. Federal Reserve announced an additional amount of monetary stimulus and equity markets responded strongly by rallying for the duration of the year.
Growth stocks outperformed value stocks by more than 1.2% for the fiscal year ended December 31, 2010, as measured by the Russell 1000® Growth Index against the Russell 1000® Value Index. Stocks with high forecasted growth outperformed those with low forecasted growth and stocks with high historical growth outperformed those with low historical growth, Small cap stocks outperformed large cap stocks by more than 10% for the
year ended December 31, 2010, as measured by the Russell 2000® Index against the Russell 1000® Index. The relative performance of small capitalization stocks reflects the market’s preference for risk over the fiscal year. Stocks with greater volatility outperformed those with lower volatility, reinforcing the market’s increasing appetite for risk. Stocks with high long-term debt-to-capital outperformed those with low long-term debt-to-capital, as financials and other previously poor performing stocks rallied toward the end of the year.
The market also rewarded pro-cyclical sectors during the year. The consumer discretionary sector was the best performer as investors reacted to positive spending data and better-than- expected holiday sales. Utilities and consumer staples, both considered defensive sectors, posted negative returns for the year as investors looked for riskier stocks. The Fund benefited from the pro-cyclical trend through its overweight to consumer discretionary and underweight to consumer staples and utilities. The Fund also benefited from an underweight to health care, the worst performing sector in the Russell 1000® Index.
During the second half of the year, a focus on the performance of individual stocks began to outweigh some of the focus on general macro-economic conditions that had prevailed earlier in the year. The increased appetite for risk among investors, along with declining correlations among stocks in particular, provided a favorable backdrop for active money management in general and for the Fund. General views of the overall equity market began to improve at the end of the third quarter, led by a subsiding fear of European debt contagion and improved confidence in the sustainability of the global recovery. This trend was illustrated by a rotation into the financial services industry by the Fund, particularly into the diversified banks sector.
How did the investment strategies and techniques employed by the Fund and its money managers affect its performance?
Over the fiscal year, the Fund’s managers emphasized companies with high forecasted growth. They looked to companies with overseas exposure, particularly to emerging markets and companies with limited risk of sovereign debt contagion. This contributed positively to returns as the market rewarded risk over the year and emerging market economies, particularly China, exhibited incredible gross domestic product growth. From a strategic standpoint, the Fund aims to be positioned neutrally between growth and value. However, as managers rotated and markets rallied, the Fund experienced some tilt toward increased growth and momentum exposure, both of which contributed positively to returns during the year.
Manager sector weighting decisions played a critical role in determining manager and Fund performance during the year with the consumer discretionary, producer durables and materials & processing sectors all outperforming the Russell 1000® Index. Managers with overweights to these sectors tended to perform better during the year. On the other hand, health care and utilities stocks underperformed the Fund’s benchmark.
| Multi-Style Equity Fund | 11 |
Table of Contents
Russell Investment Funds
Multi-Style Equity Fund
Portfolio Management Discussion — December 31, 2010 (Unaudited)
Stock selection in the health care sector was the largest detractor from returns during the fiscal year. The Fund was overweight to some of the worst performing stocks in the pharmaceuticals and biotechnology industries. Stock selection within the financial services sector was the second largest detractor from returns. Holdings within the financial data & systems and diversified financial services industries hurt performance. The Fund’s underweight to real estate investment trusts (REITs) also detracted from performance, as this industry outperformed the rest of the index during the year.
Stock selection within the producer durables, consumer discretionary and energy sectors contributed positively to the Fund’s performance during the fiscal year. Expectations that demand for oil would continue to increase due to the ongoing economic expansion in China and other emerging economies drove up select stock prices in the energy sector, especially in the second half of the year. Within the producer durables sector, returns were led by engines and construction & handling companies on the improved sentiment surrounding global, but specifically emerging market, economic growth. In the consumer discretionary sector, the casinos & gambling industry was the best performing industry, reflecting hopes of more discretionary spending by consumers.
First Eagle Investment Management, LLC (“First Eagle”), outperformed the Russell 1000® Index as a result of both sector allocation decisions and stock selection particularly within the consumer discretionary and materials & processing sectors. First Eagle also benefited from an overweight to the energy sector, specifically from a large overweight to the oil crude producers industry. In addition, they generated positive performance from the financial services sector, particularly in the diversified banks industry. Holdings within the consumer staples sector detracted from returns, mainly due to stock selection in the food industry.
BlackRock Capital Management, Inc. (“BlackRock”), outperformed the Russell 1000® Growth Index on the strength of their stock selection. The effect was strongest within the technology sector where positions in the computer services software & systems industry added to performance. BlackRock also benefited from stock selection within producer durables, where they benefited from holdings in engines and industrial machinery companies. Sector allocation detracted from returns due primarily to an overweight to technology and a neutral weighting to health care.
Given the pro-risk, cyclically driven environment particularly during the second half of the year, Montag & Caldwell, LLC’s (“Montag”) more defensively oriented consistent growth strategy underperformed the Russell 1000® Growth Index during the fiscal year due to both negative stock selection and sector allocation decisions. Stock selection in the financial services sector detracted most from returns, primarily through holdings in the financial data & systems and securities brokerage & services industries. An overweight to the health care sector also detracted from performance. Negative stock selection in the
consumer staples sector, particularly in the food industry, detracted from returns. In contrast, Montag benefited from positive stock selection in the energy sector.
RIMCo currently employs a “select holdings” strategy for a portion of the Fund’s assets that RIMCo determines not to allocate to the money managers. Pursuant to this strategy, RIMCo analyzes the holdings in the Fund segments assigned to money managers to identify particular stocks that have been selected and are held in overweight positions by multiple money managers. RIMCo uses a proprietary model to rank these stocks. Based on this ranking, RIMCo purchases additional shares of certain stocks for the Fund. RIMCo performs this analysis and ranking, and purchases or sells stocks based on this analysis and ranking, on a regular, periodic basis. The strategy is designed to increase the Fund’s exposure to stocks that are viewed as attractive by multiple money managers
The “select holdings” portions of the Fund’s portfolio underperformed the Russell 1000® Index during the year due to negative stock selection. The largest detractor from returns during the year was stock selection within the financial services industry. Poor stock selection in the health care and technology sectors also detracted meaningfully from returns. Large underweights to the consumer discretionary and materials & processing sectors hurt performance, as the two sectors performed well during the year. The portfolio’s large underweight to smaller cap companies further detracted from the Fund’s performance as small capitalization stocks substantially outperformed large capitalization stocks.
Describe any changes to the Fund’s structure or the money manager line-up.
During the year, there were no changes to the Fund’s structure or to the money manager line-up.
| Money Managers as of December 31, 2010 | Style | |
| BlackRock Capital Management, Inc. | Growth | |
| Columbus Circle Investors | Growth | |
| DePrince, Race & Zollo, Inc. | Value | |
| First Eagle Investment Management, LLC | Market Oriented | |
| Institutional Capital LLC | Value | |
| Jacobs Levy Equity Management, Inc. | Value | |
| Montag & Caldwell, LLC | Growth | |
| Suffolk Capital Management, Inc. | Market Oriented | |
The views expressed in this report reflect those of the portfolio managers only through the end of the period covered by the report. These views do not necessarily represent the views of RIMCo, or any other person in RIMCo or any other affiliated organization. These views are subject to change at any time based upon market conditions or other events, and RIMCo disclaims any responsibility to update the views contained herein. These views should not be relied on as investment advice and, because investment decisions for Russell Investment Funds (“RIF”) are based on numerous factors, should not be relied on as an indication of investment decisions of any RIF Fund.
| 12 | Multi-Style Equity Fund |
Table of Contents
Russell Investment Funds
Multi-Style Equity Fund
Portfolio Management Discussion — December 31, 2010 (Unaudited)
| * | Assumes initial investment on January 1, 2001. |
| ** | Russell 1000® Index includes the 1,000 largest companies in the Russell 3000® Index. The Russell 1000® Index represents the universe of stocks from which most active money managers typically select. The Russell 1000® Index return reflects adjustments from income dividends and capital gain distributions reinvested as of the ex-dividend dates. |
| § | Annualized. |
The performance shown in this section does not reflect any Insurance Company Separate Account or Policy Charges. Performance is historical and assumes reinvestment of all dividends and capital gains. Investment return and principal value will fluctuate so that an investor’s shares, when redeemed, may be worth more or less than when purchased. Past performance is not indicative of future results.
| Multi-Style Equity Fund | 13 |
Table of Contents
Russell Investment Funds
Multi-Style Equity Fund
Shareholder Expense Example — December 31, 2010 (Unaudited)
Fund Expenses
The following disclosure provides important information regarding each Fund’s Expense Example, which appears on each Fund’s individual page in this Annual Report. Please refer to this information when reviewing the Expense Example for a Fund.
Example
As a shareholder of the Fund, you incur two types of costs: (1) transaction costs, and (2) ongoing costs, including advisory fees and other Fund expenses. The Example is intended to help you understand your ongoing costs (in dollars) of investing in the Fund and to compare these costs with the ongoing costs of investing in other mutual funds. The Example is based on an investment of $1,000 invested at the beginning of the period and held for the entire period indicated, which for this Fund is from July 1, 2010 to December 31, 2010.
Actual Expenses
The information in the table under the heading “Actual Performance” provides information about actual account values and actual expenses. You may use the information in this column, together with the amount you invested, to estimate the expenses that you paid over the period. Simply divide your account value by $1,000 (for example, an $8,600 account value divided by $1,000 = 8.6), then multiply the result by the number in the first column in the row entitled “Expenses Paid During Period” to estimate the expenses you paid on your account during this period.
Hypothetical Example for Comparison Purposes
The information in the table under the heading “Hypothetical Performance (5% return before expenses)” provides information about hypothetical account values and hypothetical expenses based on the Fund’s actual expense ratio and an assumed rate of return of 5% per year before expenses, which is not the Fund’s actual return. The hypothetical account values and expenses may not be used to estimate the actual ending account balance or expenses you paid for the period. You may use this information to compare the ongoing costs of investing in the Fund and other funds. To do so, compare this 5% hypothetical example with the 5% hypothetical examples that appear in the shareholder reports of other funds.
Please note that the expenses shown in the table are meant to highlight your ongoing costs only and do not reflect any transactional costs. Therefore, the information under the heading “Hypothetical Performance (5% return before expenses)” is useful in comparing ongoing costs only, and will not help you determine the relative total costs of owning different funds. In addition, if these transactional costs were included, your costs would have been higher. The fee and expenses shown in this section do not reflect any Insurance Company Separate Account or Policy Charges.
Core Class | Actual Performance | Hypothetical Performance (5% return before expenses) | ||||||
Beginning Account Value July 1, 2010 | $ | 1,000.00 | $ | 1,000.00 | ||||
Ending Account Value December 31, 2010 | $ | 1,244.50 | $ | 1,020.67 | ||||
Expenses Paid During Period* | $ | 5.09 | $ | 4.58 | ||||
| * | Expenses are equal to the Fund’s annualized expense ratio of 0.90% (representing the six month period annualized), multiplied by the average account value over the period, multiplied by 184/365 (to reflect the one-half year period). May reflect amounts waived, reimbursed and/or other credits. Without any waivers, reimbursements and/or other credits, expenses would have been higher. |
| 14 | Multi-Style Equity Fund |
Table of Contents
Russell Investment Funds
Multi-Style Equity Fund
Schedule of Investments — December 31, 2010
Amounts in thousands (except share amounts)
| Principal Amount ($) or Shares | Market Value $ | |||||||
| Common Stocks - 97.3% | ||||||||
| Consumer Discretionary - 13.8% | ||||||||
Amazon.com, Inc. (Æ) | 16,882 | 3,038 | ||||||
Autoliv, Inc. (Ñ) | 600 | 47 | ||||||
Baidu, Inc. - ADR (Æ) | 3,800 | 367 | ||||||
Bed Bath & Beyond, Inc. (Æ) | 18,651 | 917 | ||||||
BJ’s Wholesale Club, Inc. (Æ) | 4,500 | 216 | ||||||
Carnival Corp. | 23,100 | 1,065 | ||||||
CBS Corp. Class B | 63,833 | 1,216 | ||||||
Coach, Inc. | 12,200 | 675 | ||||||
Comcast Corp. Class A | 55,376 | 1,217 | ||||||
Costco Wholesale Corp. (Ñ) | 26,000 | 1,877 | ||||||
DISH Network Corp. Class A (Æ) | 10,000 | 197 | ||||||
eBay, Inc. (Æ) | 16,800 | 468 | ||||||
Estee Lauder Cos., Inc. (The) Class A | 11,619 | 938 | ||||||
Ford Motor Co. (Æ)(Ñ) | 149,545 | 2,511 | ||||||
Gap, Inc. (The) (Ñ) | 41,400 | 917 | ||||||
General Motors Co. (Æ)(Ñ) | 24,964 | 921 | ||||||
Harman International Industries, Inc. (Æ) | 2,900 | 134 | ||||||
Home Depot, Inc. | 83,710 | 2,935 | ||||||
Hyatt Hotels Corp. (Æ) | 5,300 | 242 | ||||||
Johnson Controls, Inc. | 92,325 | 3,526 | ||||||
Kohl’s Corp. (Æ)(Ñ) | 13,300 | 723 | ||||||
Las Vegas Sands Corp. (Æ) | 39,915 | 1,834 | ||||||
Lear Corp. (Æ)(Ñ) | 4,334 | 428 | ||||||
Lowe’s Cos., Inc. | 82,150 | 2,059 | ||||||
McDonald’s Corp. | 25,200 | 1,934 | ||||||
NetFlix, Inc. (Æ)(Ñ) | 2,300 | 404 | ||||||
Nike, Inc. Class B | 31,100 | 2,657 | ||||||
priceline.com, Inc. (Æ)(Ñ) | 3,196 | 1,277 | ||||||
Royal Caribbean Cruises, Ltd. (Æ)(Ñ) | 15,400 | 724 | ||||||
Stanley Black & Decker, Inc. (Ñ) | 30,150 | 2,016 | ||||||
Starbucks Corp. | 45,760 | 1,470 | ||||||
Starwood Hotels & Resorts Worldwide, Inc. (Ñ)(ö) | 26,200 | 1,593 | ||||||
Target Corp. | 29,700 | 1,786 | ||||||
Tiffany & Co. (Ñ) | 6,800 | 423 | ||||||
Time Warner, Inc. | 18,000 | 579 | ||||||
TJX Cos., Inc. | 29,600 | 1,314 | ||||||
Tyco Electronics, Ltd. | 24,152 | 855 | ||||||
Urban Outfitters, Inc. (Æ)(Ñ) | 6,700 | 240 | ||||||
Viacom, Inc. Class A | 93,642 | 3,708 | ||||||
Wal-Mart Stores, Inc. | 28,800 | 1,554 | ||||||
Walt Disney Co. (The) | 94,940 | 3,561 | ||||||
Warnaco Group, Inc. (The) (Æ) | 9,800 | 540 | ||||||
Wendy’s/Arby’s Group, Inc. Class A | 26,700 | 123 | ||||||
| 55,226 | ||||||||
| Consumer Staples - 8.0% | ||||||||
Archer-Daniels-Midland Co. | 20,300 | 611 | ||||||
Clorox Co. | 4,300 | 272 | ||||||
Coca-Cola Co. (The) | 109,179 | 7,181 | ||||||
Colgate-Palmolive Co. | 6,200 | 498 | ||||||
ConAgra Foods, Inc. | 35,900 | 811 | ||||||
Corn Products International, Inc. | 8,000 | 368 | ||||||
CVS Caremark Corp. | 18,600 | 647 | ||||||
Energizer Holdings, Inc. (Æ) | 3,200 | 233 | ||||||
| Principal Amount ($) or Shares | Market Value $ | |||||||
JM Smucker Co. (The) | 16,200 | 1,064 | ||||||
Kimberly-Clark Corp. | 6,800 | 429 | ||||||
Kraft Foods, Inc. Class A (Ñ) | 49,800 | 1,569 | ||||||
Kroger Co. (The) | 20,000 | 447 | ||||||
Lorillard, Inc. | 4,800 | 394 | ||||||
Molson Coors Brewing Co. Class B | 16,450 | 826 | ||||||
PepsiCo, Inc. | 109,838 | 7,174 | ||||||
Procter & Gamble Co. (The) | 103,784 | 6,677 | ||||||
Safeway, Inc. (Ñ) | 25,300 | 569 | ||||||
Walgreen Co. (Ñ) | 18,800 | 732 | ||||||
Whole Foods Market, Inc. (Ñ) | 31,499 | 1,594 | ||||||
| 32,096 | ||||||||
| Energy - 11.9% | ||||||||
Anadarko Petroleum Corp. | 13,200 | 1,005 | ||||||
Apache Corp. | 42,006 | 5,009 | ||||||
Cameron International Corp. (Æ) | 27,200 | 1,380 | ||||||
Chevron Corp. | 70,707 | 6,452 | ||||||
ConocoPhillips | 75,797 | 5,162 | ||||||
Devon Energy Corp. | 13,633 | 1,070 | ||||||
Dresser-Rand Group, Inc. (Æ) | 3,400 | 145 | ||||||
EnCana Corp. | 15,600 | 454 | ||||||
Exxon Mobil Corp. | 12,100 | 885 | ||||||
Halliburton Co. | 44,500 | 1,817 | ||||||
Marathon Oil Corp. | 119,647 | 4,430 | ||||||
Massey Energy Co. | 16,600 | 891 | ||||||
Murphy Oil Corp. | 18,700 | 1,394 | ||||||
Nabors Industries, Ltd. (Æ) | 5,600 | 131 | ||||||
National Oilwell Varco, Inc. | 19,635 | 1,321 | ||||||
Occidental Petroleum Corp. | 74,330 | 7,291 | ||||||
Pioneer Natural Resources Co. (Ñ) | 23,235 | 2,017 | ||||||
Rowan Cos., Inc. (Æ)(Ñ) | 4,800 | 168 | ||||||
Royal Dutch Shell PLC - ADR | 10,400 | 695 | ||||||
Schlumberger, Ltd. | 37,300 | 3,114 | ||||||
SEACOR Holdings, Inc. (Ñ) | 740 | 75 | ||||||
Spectra Energy Corp. | 5,100 | 127 | ||||||
Statoil ASA - ADR (Ñ) | 30,400 | 723 | ||||||
SunPower Corp. Class B (Æ)(Ñ) | 62,000 | 769 | ||||||
Valero Energy Corp. (Ñ) | 21,700 | 502 | ||||||
Williams Cos., Inc. (The) | 27,700 | 685 | ||||||
| 47,712 | ||||||||
| Financial Services—16.0% | ||||||||
Aflac, Inc. | 31,650 | 1,786 | ||||||
Allied World Assurance Co. Holdings, Ltd. (Ñ) | 3,100 | 184 | ||||||
Allstate Corp. (The) (Ñ) | 37,700 | 1,202 | ||||||
American Express Co. | 47,570 | 2,041 | ||||||
American Financial Group, Inc. | 7,500 | 242 | ||||||
Ameriprise Financial, Inc. | 6,900 | 397 | ||||||
AON Corp. (Ñ) | 31,750 | 1,461 | ||||||
Ares Capital Corp. | 4,300 | 71 | ||||||
Assurant, Inc. | 7,900 | 304 | ||||||
Axis Capital Holdings, Ltd. (Ñ) | 5,700 | 205 | ||||||
Bank of America Corp. | 74,700 | 997 | ||||||
Bank of Hawaii Corp. (Ñ) | 1,900 | 90 | ||||||
Bank of New York Mellon Corp. (The) (Ñ) | 64,600 | 1,951 | ||||||
| Multi-Style Equity Fund | 15 |
Table of Contents
Russell Investment Funds
Multi-Style Equity Fund
Schedule of Investments, continued — December 31, 2010
Amounts in thousands (except share amounts)
| Principal Amount ($) or Shares | Market Value $ | |||||||
BB&T Corp. (Ñ) | 87,950 | 2,312 | ||||||
Berkshire Hathaway, Inc. Class B (Æ) | 1,700 | 136 | ||||||
BlackRock, Inc. Class A | 7,150 | 1,363 | ||||||
Charles Schwab Corp. (The) (Ñ) | 54,150 | 927 | ||||||
Chubb Corp. (Ñ) | 7,600 | 453 | ||||||
CIT Group, Inc. (Æ) | 8,100 | 382 | ||||||
Citigroup, Inc. (Æ) | 581,070 | 2,749 | ||||||
CNA Financial Corp. (Æ)(Ñ) | 3,500 | 95 | ||||||
Discover Financial Services (Ñ) | 24,400 | 452 | ||||||
Endurance Specialty Holdings, Ltd. (Ñ) | 7,000 | 322 | ||||||
Federated Investors, Inc. Class B (Ñ) | 18,800 | 492 | ||||||
Fifth Third Bancorp (Ñ) | 72,426 | 1,063 | ||||||
Fulton Financial Corp. (Ñ) | 17,500 | 181 | ||||||
Goldman Sachs Group, Inc. (The) | 21,178 | 3,561 | ||||||
Hartford Financial Services Group, Inc. (Ñ) | 36,100 | 956 | ||||||
HCC Insurance Holdings, Inc. | 8,800 | 255 | ||||||
Hersha Hospitality Trust Class A (ö) | 5,000 | 33 | ||||||
Hudson City Bancorp, Inc. (Ñ) | 50,900 | 648 | ||||||
Huntington Bancshares, Inc. | 171,100 | 1,175 | ||||||
Jefferies Group, Inc. (Ñ) | 12,800 | 341 | ||||||
JPMorgan Chase & Co. | 111,251 | 4,719 | ||||||
KeyCorp | 57,200 | 506 | ||||||
Liberty Property Trust (Ñ)(ö) | 5,100 | 163 | ||||||
Lincoln National Corp. | 40,300 | 1,121 | ||||||
Loews Corp. | 8,100 | 315 | ||||||
Marsh & McLennan Cos., Inc. | 26,400 | 722 | ||||||
Mastercard, Inc. Class A | 3,828 | 858 | ||||||
Mercury General Corp. (Ñ) | 11,200 | 482 | ||||||
MetLife, Inc. | 71,694 | 3,186 | ||||||
Morgan Stanley | 40,700 | 1,108 | ||||||
Netspend Holdings, Inc. (Æ)(Ñ) | 2,088 | 27 | ||||||
Northern Trust Corp. (Ñ) | 16,100 | 892 | ||||||
NYSE Euronext | 7,400 | 222 | ||||||
People’s United Financial, Inc. (Ñ) | 29,000 | 406 | ||||||
Piedmont Office Realty Trust, Inc. Class A (Ñ)(ö) | 1,200 | 24 | ||||||
Plum Creek Timber Co., Inc. (Ñ)(ö) | 15,000 | 562 | ||||||
PNC Financial Services Group, Inc. | 33,100 | 2,010 | ||||||
Progressive Corp. (The) | 13,600 | 270 | ||||||
Prudential Financial, Inc. | 27,300 | 1,603 | ||||||
Reinsurance Group of America, Inc. Class A (Ñ) | 3,100 | 167 | ||||||
Senior Housing Properties Trust (ö) | 8,800 | 193 | ||||||
State Street Corp. | 23,400 | 1,084 | ||||||
SunTrust Banks, Inc. (Ñ) | 28,000 | 826 | ||||||
Transatlantic Holdings, Inc. | 6,500 | 336 | ||||||
Travelers Cos., Inc. (The) (Ñ) | 8,500 | 474 | ||||||
Unum Group | 9,300 | 225 | ||||||
US Bancorp (Ñ) | 160,159 | 4,319 | ||||||
Valley National Bancorp (Ñ) | 32,239 | 461 | ||||||
Visa, Inc. Class A | 11,737 | 826 | ||||||
Washington Federal, Inc. (Ñ) | 2,900 | 49 | ||||||
Webster Financial Corp. (Ñ) | 4,700 | 93 | ||||||
Wells Fargo & Co. | 221,011 | 6,848 | ||||||
| 63,924 | ||||||||
| Principal Amount ($) or Shares | Market Value $ | |||||||
| Health Care - 11.3% | ||||||||
Abbott Laboratories | 61,026 | 2,924 | ||||||
Aetna, Inc. | 13,500 | 412 | ||||||
Alexion Pharmaceuticals, Inc. (Æ)(Ñ) | 4,500 | 362 | ||||||
Allergan, Inc. | 63,462 | 4,358 | ||||||
Amgen, Inc. (Æ) | 12,151 | 667 | ||||||
Baxter International, Inc. | 15,300 | 774 | ||||||
Boston Scientific Corp. (Æ)(Ñ) | 50,000 | 379 | ||||||
Bristol-Myers Squibb Co. | 19,004 | 503 | ||||||
Cardinal Health, Inc. | 3,800 | 146 | ||||||
Celgene Corp. (Æ) | 18,602 | 1,100 | ||||||
Cerner Corp. (Æ)(Ñ) | 5,400 | 512 | ||||||
Cigna Corp. | 9,000 | 330 | ||||||
Covance, Inc. (Æ)(Ñ) | 8,800 | 452 | ||||||
Coventry Health Care, Inc. (Æ) | 12,100 | 319 | ||||||
Covidien PLC | 33,850 | 1,546 | ||||||
Dendreon Corp. (Æ)(Ñ) | 10,100 | 353 | ||||||
Eli Lilly & Co. (Ñ) | 14,400 | 505 | ||||||
Express Scripts, Inc. Class A (Æ) | 13,200 | 713 | ||||||
Hologic, Inc. (Æ)(Ñ) | 8,900 | 167 | ||||||
Humana, Inc. (Æ) | 8,600 | 471 | ||||||
Illumina, Inc. (Æ)(Ñ) | 18,957 | 1,201 | ||||||
Johnson & Johnson | 34,600 | 2,140 | ||||||
Life Technologies Corp. (Æ) | 7,600 | 422 | ||||||
Lincare Holdings, Inc. (Ñ) | 16,400 | 440 | ||||||
Medicis Pharmaceutical Corp. Class A (Ñ) | 32,000 | 857 | ||||||
Medtronic, Inc. | 22,516 | 835 | ||||||
Merck & Co., Inc. | 169,450 | 6,107 | ||||||
Pfizer, Inc. | 372,184 | 6,518 | ||||||
Sanofi-Aventis SA - ADR | 72,050 | 2,322 | ||||||
St. Jude Medical, Inc. (Æ)(Ñ) | 25,416 | 1,087 | ||||||
Stryker Corp. (Ñ) | 36,000 | 1,933 | ||||||
Teleflex, Inc. (Ñ) | 7,000 | 377 | ||||||
Teva Pharmaceutical Industries, Ltd. - ADR | 11,900 | 620 | ||||||
Thermo Fisher Scientific, Inc. (Æ) | 16,517 | 914 | ||||||
UnitedHealth Group, Inc. | 23,600 | 852 | ||||||
Watson Pharmaceuticals, Inc. Class B (Æ) | 19,900 | 1,028 | ||||||
WellPoint, Inc. (Æ) | 8,500 | 483 | ||||||
| 45,129 | ||||||||
| Materials and Processing - 5.1% | ||||||||
Agnico-Eagle Mines, Ltd. (Þ) | 2,400 | 184 | ||||||
Air Products & Chemicals, Inc. (Ñ) | 10,400 | 946 | ||||||
Airgas, Inc. | 1,737 | 108 | ||||||
Alcoa, Inc. | 18,100 | 279 | ||||||
Celanese Corp. Class A | 12,100 | 498 | ||||||
CF Industries Holdings, Inc. (Ñ) | 4,466 | 604 | ||||||
Cytec Industries, Inc. | 4,700 | 249 | ||||||
Ecolab, Inc. | 5,900 | 297 | ||||||
EI du Pont de Nemours & Co. | 16,700 | 833 | ||||||
Freeport-McMoRan Copper & Gold, Inc. Class B | 13,100 | 1,574 | ||||||
Huntsman Corp. | 42,500 | 663 | ||||||
MeadWestvaco Corp. | 10,200 | 267 | ||||||
Monsanto Co. | 36,069 | 2,512 | ||||||
Newmont Mining Corp. | 41,317 | 2,537 | ||||||
| 16 | Multi-Style Equity Fund |
Table of Contents
Russell Investment Funds
Multi-Style Equity Fund
Schedule of Investments, continued — December 31, 2010
Amounts in thousands (except share amounts)
| Principal Amount ($) or Shares | Market Value $ | |||||||
Nucor Corp. (Ñ) | 17,700 | 776 | ||||||
Owens-Illinois, Inc. (Æ) | 31,850 | 978 | ||||||
Packaging Corp. of America | 9,200 | 238 | ||||||
Potash Corp. of Saskatchewan, Inc. | 9,362 | 1,449 | ||||||
Reliance Steel & Aluminum Co. | 3,100 | 158 | ||||||
Rio Tinto PLC - ADR | 14,800 | 1,061 | ||||||
Sealed Air Corp. (Ñ) | 31,300 | 797 | ||||||
SPX Corp. | 12,400 | 887 | ||||||
Steel Dynamics, Inc. (Ñ) | 30,000 | 549 | ||||||
Textron, Inc. (Ñ) | 3,300 | 78 | ||||||
Vulcan Materials Co. (Ñ) | 18,100 | 803 | ||||||
Weyerhaeuser Co. (Ñ) | 54,266 | 1,027 | ||||||
| 20,352 | ||||||||
| Producer Durables - 10.3% | ||||||||
Accenture PLC Class A | 67,250 | 3,262 | ||||||
AGCO Corp. (Æ)(Ñ) | 2,300 | 117 | ||||||
Agilent Technologies, Inc. (Æ) | 18,382 | 762 | ||||||
AO Smith Corp. | 1,900 | 72 | ||||||
Atlas Air Worldwide Holdings, Inc. (Æ) | 600 | 33 | ||||||
Automatic Data Processing, Inc. (Ñ) | 15,600 | 722 | ||||||
Avery Dennison Corp. (Ñ) | 2,900 | 123 | ||||||
Boeing Co. (The) | 13,200 | 862 | ||||||
Carlisle Cos., Inc. | 9,900 | 393 | ||||||
Caterpillar, Inc. (Ñ) | 33,525 | 3,140 | ||||||
Chicago Bridge & Iron Co. NV (Æ) | 1,100 | 36 | ||||||
CNH Global NV (Æ) | 1,200 | 57 | ||||||
Crane Co. | 5,400 | 222 | ||||||
Danaher Corp. (Ñ) | 23,200 | 1,094 | ||||||
Deere & Co. | 13,802 | 1,146 | ||||||
Delta Air Lines, Inc. (Æ)(Ñ) | 62,200 | 784 | ||||||
Embraer SA (Æ) | 13,000 | 382 | ||||||
EMCOR Group, Inc. (Æ) | 1,200 | 35 | ||||||
Emerson Electric Co. | 23,000 | 1,315 | ||||||
FedEx Corp. (Ñ) | 12,378 | 1,151 | ||||||
Fluor Corp. (Ñ) | 35,600 | 2,360 | ||||||
General Dynamics Corp. | 18,000 | 1,277 | ||||||
General Electric Co. | 48,200 | 882 | ||||||
Harsco Corp. | 20,500 | 581 | ||||||
Honeywell International, Inc. | 87,798 | 4,668 | ||||||
Ingersoll-Rand PLC (Ñ) | 22,600 | 1,064 | ||||||
Jacobs Engineering Group, Inc. (Æ) | 2,800 | 128 | ||||||
Joy Global, Inc. | 5,100 | 442 | ||||||
KBR, Inc. | 7,200 | 219 | ||||||
L-3 Communications Holdings, Inc. | 4,600 | 324 | ||||||
Lexmark International, Inc. Class A (Æ) | 8,300 | 289 | ||||||
Lockheed Martin Corp. (Ñ) | 8,000 | 559 | ||||||
Manpower, Inc. (Ñ) | 15,300 | 960 | ||||||
McDermott International, Inc. (Æ) | 3,500 | 72 | ||||||
Moody’s Corp. (Ñ) | 20,000 | 531 | ||||||
Moog, Inc. Class A (Æ)(Ñ) | 2,100 | 84 | ||||||
Northrop Grumman Corp. (Ñ) | 7,400 | 479 | ||||||
PACCAR, Inc. | 15,000 | 861 | ||||||
Pitney Bowes, Inc. (Ñ) | 25,700 | 621 | ||||||
Robert Half International, Inc. (Ñ) | 14,700 | 450 | ||||||
Rockwell Automation, Inc. (Ñ) | 20,700 | 1,484 | ||||||
Ryder System, Inc. (Ñ) | 3,500 | 184 | ||||||
| Principal Amount ($) or Shares | Market Value $ | |||||||
Shaw Group, Inc. (The) (Æ) | 2,000 | 68 | ||||||
Terex Corp. (Æ)(Ñ) | 6,400 | 199 | ||||||
Tidewater, Inc. (Ñ) | 13,400 | 721 | ||||||
Union Pacific Corp. | 5,800 | 537 | ||||||
United Continental Holdings, Inc. (Æ) | 12,800 | 305 | ||||||
United Parcel Service, Inc. Class B | 53,262 | 3,866 | ||||||
URS Corp. (Æ) | 6,600 | 275 | ||||||
Verisk Analytics, Inc. Class A (Æ) | 322 | 11 | ||||||
Waste Management, Inc. (Ñ) | 12,200 | 450 | ||||||
Xerox Corp. (Ñ) | 40,000 | 461 | ||||||
| 41,120 | ||||||||
| Technology - 17.6% | ||||||||
Akamai Technologies, Inc. (Æ) | 7,000 | 329 | ||||||
Amdocs, Ltd. (Æ) | 13,100 | 360 | ||||||
Amphenol Corp. Class A (Ñ) | 37,733 | 1,992 | ||||||
Apple, Inc. (Æ) | 27,597 | 8,901 | ||||||
Applied Materials, Inc. (Ñ) | 94,400 | 1,326 | ||||||
BCE, Inc. (Ñ) | 51,900 | 1,840 | ||||||
Broadcom Corp. Class A | 109,444 | 4,766 | ||||||
Brocade Communications Systems, Inc. (Æ) | 16,500 | 87 | ||||||
CA, Inc. (Ñ) | 6,400 | 156 | ||||||
Check Point Software Technologies, Ltd. (Æ)(Ñ) | 17,100 | 791 | ||||||
Cisco Systems, Inc. (Æ) | 52,700 | 1,066 | ||||||
Citrix Systems, Inc. (Æ) | 9,400 | 643 | ||||||
Cognizant Technology Solutions Corp. Class A (Æ) | 22,671 | 1,661 | ||||||
Computer Sciences Corp. | 8,000 | 397 | ||||||
Cree, Inc. (Æ) | 9,000 | 593 | ||||||
Ctrip.com International, Ltd. - ADR (Æ) | 11,200 | 453 | ||||||
Diebold, Inc. (Ñ) | 10,500 | 337 | ||||||
Electronic Arts, Inc. (Æ)(Ñ) | 12,800 | 210 | ||||||
F5 Networks, Inc. (Æ)(Ñ) | 10,892 | 1,418 | ||||||
Google, Inc. Class A (Æ) | 11,815 | 7,018 | ||||||
Harris Corp. (Ñ) | 7,400 | 335 | ||||||
Hewlett-Packard Co. | 22,300 | 939 | ||||||
Ingram Micro, Inc. Class A (Æ) | 11,300 | 216 | ||||||
Intel Corp. | 33,000 | 694 | ||||||
International Business Machines Corp. | 11,145 | 1,636 | ||||||
Intuit, Inc. (Æ)(Ñ) | 9,180 | 453 | ||||||
Juniper Networks, Inc. (Æ) | 37,192 | 1,373 | ||||||
Lam Research Corp. (Æ) | 7,900 | 409 | ||||||
LSI Corp. (Æ) | 37,700 | 226 | ||||||
Maxim Integrated Products, Inc. (Ñ) | 43,600 | 1,030 | ||||||
Micron Technology, Inc. (Æ)(Ñ) | 45,400 | 364 | ||||||
Microsoft Corp. | 144,350 | 4,031 | ||||||
Molex, Inc. (Ñ) | 14,800 | 336 | ||||||
Motorola, Inc. (Æ) | 57,700 | 523 | ||||||
National Semiconductor Corp. (Ñ) | 58,400 | 804 | ||||||
NetApp, Inc. (Æ)(Ñ) | 28,581 | 1,571 | ||||||
Nokia OYJ - ADR (Ñ) | 32,100 | 331 | ||||||
Oracle Corp. | 131,440 | 4,115 | ||||||
QUALCOMM, Inc. | 157,653 | 7,802 | ||||||
Red Hat, Inc. (Æ) | 26,059 | 1,189 | ||||||
Salesforce.com, Inc. (Æ)(Ñ) | 9,400 | 1,241 | ||||||
SanDisk Corp. (Æ) | 12,782 | 637 | ||||||
| Multi-Style Equity Fund | 17 |
Table of Contents
Russell Investment Funds
Multi-Style Equity Fund
Schedule of Investments, continued — December 31, 2010
Amounts in thousands (except share amounts)
| Principal Amount ($) or Shares | Market Value $ | |||||||
Synopsys, Inc. (Æ) | 13,200 | 355 | ||||||
Tech Data Corp. (Æ) | 6,300 | 277 | ||||||
Texas Instruments, Inc. (Ñ) | 86,226 | 2,803 | ||||||
VMware, Inc. Class A (Æ)(Ñ) | 5,200 | 462 | ||||||
Vodafone Group PLC - ADR (Ñ) | 95,700 | 2,529 | ||||||
| 71,025 | ||||||||
| Utilities - 3.3% | ||||||||
AGL Resources, Inc. | 4,600 | 165 | ||||||
American Electric Power Co., Inc. | 19,400 | 699 | ||||||
American Water Works Co., Inc. | 21,000 | 531 | ||||||
AT&T, Inc. | 54,800 | 1,609 | ||||||
Calpine Corp. (Æ)(Ñ) | 59,368 | 792 | ||||||
CenterPoint Energy, Inc. (Ñ) | 25,800 | 406 | ||||||
Constellation Energy Group, Inc. | 11,800 | 361 | ||||||
Duke Energy Corp. | 25,900 | 461 | ||||||
Edison International (Ñ) | 11,600 | 448 | ||||||
Energen Corp. | 5,200 | 251 | ||||||
Entergy Corp. | 5,000 | 354 | ||||||
Exelon Corp. (Ñ) | 9,300 | 387 | ||||||
Frontier Communications Corp. (Ñ) | 23,900 | 233 | ||||||
Great Plains Energy, Inc. (Ñ) | 22,200 | 430 | ||||||
MDU Resources Group, Inc. | 21,800 | 442 | ||||||
NextEra Energy, Inc. | 22,300 | 1,160 | ||||||
NII Holdings, Inc. (Æ) | 8,100 | 362 | ||||||
NiSource, Inc. (Ñ) | 23,500 | 414 | ||||||
Northeast Utilities | 10,900 | 347 | ||||||
NV Energy, Inc. | 22,600 | 318 | ||||||
OGE Energy Corp. | 6,400 | 291 | ||||||
Pepco Holdings, Inc. (Ñ) | 20,400 | 372 | ||||||
PG&E Corp. | 8,100 | 388 | ||||||
PNM Resources, Inc. (Ñ) | 7,400 | 96 | ||||||
PPL Corp. (Ñ) | 11,100 | 292 | ||||||
Progress Energy, Inc. Class D | 7,700 | 335 | ||||||
Questar Corp. (Ñ) | 9,400 | 164 | ||||||
Southern Union Co. (Ñ) | 9,700 | 233 | ||||||
Veolia Environnement SA - ADR | 13,400 | 393 | ||||||
Verizon Communications, Inc. | 12,200 | 437 | ||||||
| 13,171 | ||||||||
| Total Common Stocks (cost $317,038) | 389,755 | |||||||
| Short-Term Investments - 2.2% | ||||||||
Russell U.S. Cash Management Fund | 8,880,639 | (¥) | 8,881 | |||||
| Total Short-Term Investments (cost $8,881) | 8,881 | |||||||
| Principal Amount ($) or Shares | Market Value $ | |||||||
| Other Securities - 17.0% | ||||||||
Russell Investment Funds Liquidating Trust (×) | 1,329,628 | (¥) | 1,330 | |||||
Russell U.S. Cash Collateral Fund (×) | 66,617,631 | (¥) | 66,617 | |||||
| Total Other Securities (cost $67,947) | 67,947 | |||||||
| Total Investments - 116.5% (identified cost $393,866) | 466,583 | |||||||
| Other Assets and Liabilities, Net - (16.5%) | (66,112 | ) | ||||||
| Net Assets - 100.0% | 400,471 | |||||||
See accompanying notes which are an integral part of the financial statements.
| 18 | Multi-Style Equity Fund |
Table of Contents
Russell Investment Funds
Multi-Style Equity Fund
Schedule of Investments, continued — December 31, 2010
Amounts in thousands
| Futures Contracts | Number of Contracts | Notional | Expiration Date | Unrealized Appreciation (Depreciation) $ | ||||||||||||||
Long Positions | ||||||||||||||||||
Russell 1000 Mini Index | 21 | USD | 1,458 | 03/11 | 30 | |||||||||||||
S&P 500 E-Mini Index (CME) | 96 | USD | 6,014 | 03/11 | 89 | |||||||||||||
S&P 500 Index (CME) | 7 | USD | 2,193 | 03/11 | 46 | |||||||||||||
S&P Midcap 400 E-Mini Index (CME) | 9 | USD | 815 | 03/11 | 9 | |||||||||||||
Total Unrealized Appreciation (Depreciation) on Open Futures Contracts | 174 | |||||||||||||||||
Presentation of Portfolio Holdings — December 31, 2010
Amounts in thousands
| Market Value | % of Net | |||||||||||||||||||
| Portfolio Summary | Level 1 | Level 2 | Level 3 | Total | ||||||||||||||||
Common Stocks | ||||||||||||||||||||
Consumer Discretionary | $ | 55,226 | $ | — | $ | — | $ | 55,226 | 13.8 | |||||||||||
Consumer Staples | 32,096 | — | — | 32,096 | 8.0 | |||||||||||||||
Energy | 47,712 | — | — | 47,712 | 11.9 | |||||||||||||||
Financial Services | 63,924 | — | — | 63,924 | 16.0 | |||||||||||||||
Health Care | 45,129 | — | — | 45,129 | 11.3 | |||||||||||||||
Materials and Processing | 20,352 | — | — | 20,352 | 5.1 | |||||||||||||||
Producer Durables | 41,120 | — | — | 41,120 | 10.3 | |||||||||||||||
Technology | 71,025 | — | — | 71,025 | 17.6 | |||||||||||||||
Utilities | 13,171 | — | — | 13,171 | 3.3 | |||||||||||||||
Short-Term Investments | — | 8,881 | — | 8,881 | 2.2 | |||||||||||||||
Other Securities | — | 67,947 | — | 67,947 | 17.0 | |||||||||||||||
Total Investments | 389,755 | 76,828 | — | 466,583 | 116.5 | |||||||||||||||
Other Assets and Liabilities, Net | (16.5 | ) | ||||||||||||||||||
| 100.0 | ||||||||||||||||||||
Other Financial Instruments | ||||||||||||||||||||
Futures Contracts | 174 | — | — | 174 | — | * | ||||||||||||||
Total Other Financial Instruments** | 174 | — | — | 174 | ||||||||||||||||
| * | Less than .05% of net assets. |
| ** | Other financial instruments reflected in the Schedule of Investments, such as futures, forwards, and swap contracts which are valued at the unrealized appreciation/depreciation on the instruments. |
For a description of the levels see note 2 in the Notes to Financial Statements.
See accompanying notes which are an integral part of the financial statements.
| Multi-Style Equity Fund | 19 |
Table of Contents
Russell Investment Funds
Multi-Style Equity Fund
Fair Value of Derivative Instruments — December 31, 2010
Amounts in thousands
| Derivatives not accounted for as hedging instruments | Equity Contracts | |||
Location: Statement of Assets and Liabilities - Assets | ||||
Daily variation margin on futures contracts* | $ | 174 | ||
| Derivatives not accounted for as hedging instruments | Equity Contracts | |||
Location: Statement of Operations - Net realized gain (loss) | ||||
Futures contracts | $ | 2,066 | ||
Location: Statement of Operations - Net change in unrealized appreciation (depreciation) | ||||
Futures contracts | $ | (189 | ) | |
| * | Includes cumulative appreciation/depreciation of futures contracts as reported in Schedule of Investments. Only current day’s variation margin is reported within the statement of assets and liabilities |
For further disclosure on derivatives see note 2 in Notes to Financial Statements.
See accompanying notes which are an integral part of the financial statements.
| 20 | Multi-Style Equity Fund |
Table of Contents
[This page intentionally left blank]
Table of Contents
Russell Investment Funds
Portfolio Management Discussion — December 31, 2010 (Unaudited)
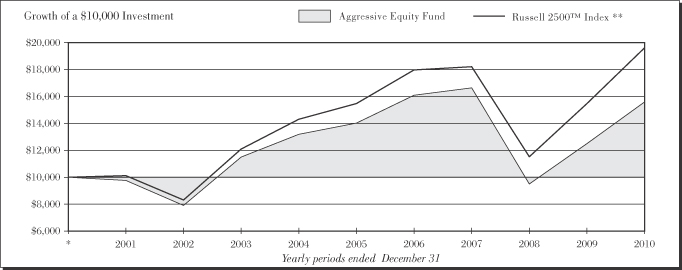
| Aggressive Equity Fund | ||||
| Total Return | ||||
1 Year | 24.88 | % | ||
5 Years | 2.14 | %§ | ||
10 Years | 4.56 | %§ | ||
| Russell 2500™ Index ** | ||||
| Total Return | ||||
1 Year | 26.71 | % | ||
5 Years | 4.86 | %§ | ||
10 Years | 6.98 | %§ | ||
| 22 | Aggressive Equity Fund |
Table of Contents
Russell Investment Funds
Aggressive Equity Fund
Portfolio Management Discussion — December 31, 2010 (Unaudited)
The Aggressive Equity Fund (the “Fund”) allocates most of its assets among multiple money managers. Russell Investment Management Company (“RIMCo”), as the Fund’s advisor, may change the allocation of the Fund’s assets among money managers at any time. An exemptive order from the Securities and Exchange Commission (“SEC”) permits RIMCo to engage or terminate a money manager at any time, subject to approval by the Fund’s Board without a shareholder vote. Pursuant to the terms of the exemptive order, the Fund is required to notify its shareholders within 60 days of when a money manager begins providing services. The Fund currently has six money managers.
What is the Fund’s investment objective?
The Fund seeks to provide long-term capital growth.
How did the Fund perform relative to its benchmark for the fiscal year ended December 31, 2010?
For the fiscal year ended December 31, 2010, the Aggressive Equity Fund gained 24.88%. This is compared to the Russell 2500™ Index, which gained 26.71% during the same period. The Fund’s performance includes operating expenses, whereas index returns are unmanaged and do not include expenses of any kind.
For the fiscal year ended December 31, 2010, the Lipper® Small-Cap Core Funds (VIP) Average gained 25.96%. This average return serves as a peer comparison and is expressed net of operating expenses.
RIMCo may assign a money manager a specific style or capitalization benchmark other than the Fund’s index. However, the Fund’s primary index remains the benchmark for the Fund and is representative of the aggregate of each money manager’s benchmark index.
How did the market conditions described in the Market Summary report affect the Fund’s performance?
A high degree of correlation among stock price movements resulted in a more difficult environment for active management. Price differentiation in the market was more prevalent at the higher and lower ends of the risk and growth spectrum and the returns of the Fund decreased when the “risk on” scenario was present. A “risk on” scenario exists where positive economic and company-specific news leads companies with more economic sensitivity to outperform the benchmark when “risk” is in favor. In this environment, companies with significant economic sensitivity and often poor fundamentals (in the form of high debt and low cash on the balance sheet) outperformed the market. This market environment was prevalent during the fiscal year and detracted from Fund performance as the Fund was clearly positioned in stocks with stronger fundamentals. The fiscal year could be characterized as driven more by macroeconomic forces than company specific data, which did not favor the multi-manager process of the Fund.
How did the investment strategies and techniques employed by the Fund and its money managers affect its performance?
The Fund employs six money managers: two growth-oriented, one market-oriented and three value-oriented. Three of the six managers and two of the three value managers outperformed their respective benchmarks. This was reflective of the conditions in the market with managers benefiting from a moderation in investors’ appetite for riskier companies (i.e., companies with significant levels of debt and negative earnings), but penalized by elevated stock correlations (i.e. similar as opposed to differentiated return patterns) caused investors’ focus on macro related events, such as European sovereign debt worries and ongoing weak U.S. housing and employment data, rather than on corporate earnings and company announcements. This made it a more difficult market for active management.
While the U.S. economic recovery was slower than many investors anticipated, which curtailed investors’ appetite for speculation, investors retained an overweight exposure to companies that were sensitive to these economic conditions. Consequently, managers across the style spectrum with exposure to cyclical stocks or sectors, specifically the technology sector, fared better than those managers without such exposure.
DePrince, Race & Zollo, Inc., (“DePrince”) a yield-focused value manager, underperformed its style benchmark, the Russell 2500™ Value Index, for the fiscal year. DePrince faced several headwinds during the fiscal year that meaningfully impeded their ability to outperform their benchmark. First, their focus on sustainable dividend yield was not rewarded, as investors alternated between high-yield stocks and zero yielding stocks. In addition, DePrince’s macro positioning created significant difficulties as DePrince reduced its risk exposure starting in late 2009 and into early 2010. This was in response to the duration and magnitude of the risk rally, which was predicated on the belief that the U.S. would rebound strongly from the recession. However, DePrince’s risk reduction efforts were premature, as a high tolerance for risk continued to be rewarded during the fiscal year. As a result of this environment, stock selection detracted from performance, with selection in financial services representing the largest detractor. DePrince’s overweight exposure to regional banks also detracted from performance relative to the style benchmark.
Tygh Capital Management, Inc. (“Tygh”), a quality-focused growth-oriented manager, underperformed its style benchmark, the Russell 2500™Growth Index, for the fiscal year. While investor preference for risk detracted from Tygh’s process, underperformance was driven mainly by weak stock selection. The largest detractors to performance relative to its style benchmark were in the consumer discretionary sector, specifically in Tygh’s specialty retail and restaurant holdings. This negative selection was a function of both the companies
| Aggressive Equity Fund | 23 |
Table of Contents
Russell Investment Funds
Aggressive Equity Fund
Portfolio Management Discussion — December 31, 2010 (Unaudited)
held in the sector and Tygh’s underweight or lack of exposure to several larger index constituents that performed well during the period.
Jacobs Levy Equity Management, Inc., like other quantitative managers, faced a number of difficulties during the fiscal year arising from the unfavorable active management environment, particularly the ongoing macroeconomic uncertainty and investors’ preference for risk. Nevertheless, the manager, driven by its macroeconomic model, had a bias to smaller, lower valuation, more economically sensitive stocks. These exposures were beneficial for the manager and were reflected in positive stock selection, which was positive across the majority of sectors and accounted for all of the manager’s outperformance relative to its style benchmark, the Russell 2500™ Value Index.
Ranger Investment Management, L.P., a growth manager that focuses on higher quality stocks with sustainable earnings growth, underperformed its style benchmark, the Russell 2500™ Growth Index. Investor preference for risk and stock selection detracted from returns. Health care stock selection detracted from returns due to holdings in the health care services and pharmaceutical sectors. Stock selection within the materials and processing and consumer discretionary sector detracted from benchmark-relative performance as a result of retail and metal related holdings. Stock selection within the producer durables and technology sectors, however, had a positive impact on returns.
Signia Capital Management, LLC, (“Signia”) a value-oriented manager, outperformed its style benchmark, the Russell 2500™ Value Index, for the fiscal year. Signia’s preference for attractively priced, higher-risk stocks was rewarded during the fiscal year, as investors continued to prefer economically sensitive, higher-risk companies. Signia’s stock selection drove performance, as several precious and industrial metal sector holdings accounted for much of its outperformance through the fiscal year due to an improving global economic outlook and a
weakening U.S. Dollar. Technology sector stock selection contributed as well on the strength of semi-conductor holdings.
ClariVest Asset Management, LLC, has a quantitative process that focuses on identifying companies with sustainable trends in earnings, price and analyst estimate revisions. This approach met with limited success during the year, due to the volatility of the market and U.S. economic uncertainty. In addition, elevated stock correlations created significant difficulties for quantitative processes that look to exploit stock differentiation, which further undermined Clarivest’s ability to outperform its style benchmark, the Russell 2500.
Describe any changes to the Fund’s structure or the money manager line-up.
There were no changes to the Fund’s structure or the money manager lineup in 2010.
| Money Managers as of December 31, 2010 | Styles | |
| ClariVest Asset Management LLC | Market Oriented | |
| DePrince, Race, & Zollo, Inc. | Value | |
| Jacobs Levy Equity Management, Inc. | Value | |
| Ranger Investment Management, L.P. | Growth | |
| Signia Capital Management, LLC | Value | |
| Tygh Capital Management, Inc. | Growth | |
The views expressed in this report reflect those of the portfolio managers only through the end of the period covered by the report. These views do not necessarily represent the views of RIMCo, or any other person in RIMCo or any other affiliated organization. These views are subject to change at any time based upon market conditions or other events, and RIMCo disclaims any responsibility to update the views contained herein. These views should not be relied on as investment advice and, because investment decisions for Russell Investment Funds (“RIF”) are based on numerous factors, should not be relied on as an indication of investment decisions of any RIF Fund.
| * | Assumes initial investment on January 1, 2001. |
| ** | Russell 2500tm Index is composed of the bottom 500 stocks the Russell 1000® Index and all the stocks in the Russell 2000® Index. The Russell 2500tm Index return reflects adjustments for income dividends and capital gains distributions reinvested as of the ex-dividend dates. |
| § | Annualized. |
The performance shown in this section does not reflect any Insurance Company Separate Account or Policy Charges. Performance is historical and assumes reinvestment of all dividends and capital gains. Investment return and principal value will fluctuate so that an investor’s shares, when redeemed, may be worth more or less than when purchased. Past performance is not indicative of future results.
| 24 | Aggressive Equity Fund |
Table of Contents
Russell Investment Funds
Aggressive Equity Fund
Shareholder Expense Example — December 31, 2010 (Unaudited)
Fund Expenses
The following disclosure provides important information regarding each Fund’s Expense Example, which appears on each Fund’s individual page in this Annual Report. Please refer to this information when reviewing the Expense Example for a Fund.
Example
As a shareholder of the Fund, you incur two types of costs: (1) transaction costs, and (2) ongoing costs, including advisory fees and other Fund expenses. The Example is intended to help you understand your ongoing costs (in dollars) of investing in the Fund and to compare these costs with the ongoing costs of investing in other mutual funds. The Example is based on an investment of $1,000 invested at the beginning of the period and held for the entire period indicated, which for this Fund is from July 1, 2010 to December 31, 2010.
Actual Expenses
The information in the table under the heading “Actual Performance” provides information about actual account values and actual expenses. You may use the information in this column, together with the amount you invested, to estimate the expenses that you paid over the period. Simply divide your account value by $1,000 (for example, an $8,600 account value divided by $1,000 = 8.6), then multiply the result by the number in the first column in the row entitled “Expenses Paid During Period” to estimate the expenses you paid on your account during this period.
Hypothetical Example for Comparison Purposes
The information in the table under the heading “Hypothetical Performance (5% return before expenses)” provides information about hypothetical account values and hypothetical expenses based on the Fund’s actual expense ratio and an assumed rate
of return of 5% per year before expenses, which is not the Fund’s actual return. The hypothetical account values and expenses may not be used to estimate the actual ending account balance or expenses you paid for the period. You may use this information to compare the ongoing costs of investing in the Fund and other funds. To do so, compare this 5% hypothetical example with the 5% hypothetical examples that appear in the shareholder reports of other funds.
Please note that the expenses shown in the table are meant to highlight your ongoing costs only and do not reflect any transactional costs. Therefore, the information under the heading “Hypothetical Performance (5% return before expenses)” is useful in comparing ongoing costs only, and will not help you determine the relative total costs of owning different funds. In addition, if these transactional costs were included, your costs would have been higher. The fee and expenses shown in this section do not reflect any Insurance Company Separate Account or Policy Charges.
Core Class | Actual Performance | Hypothetical Performance (5% return before expenses) | ||||||
Beginning Account Value July 1, 2010 | $ | 1,000.00 | $ | 1,000.00 | ||||
Ending Account Value December 31, 2010 | $ | 1,296.90 | $ | 1,019.91 | ||||
Expenses Paid During Period* | $ | 6.08 | $ | 5.35 | ||||
| * | Expenses are equal to the Fund’s annualized expense ratio of 1.05% (representing the six month period annualized), multiplied by the average account value over the period, multiplied by 184/365 (to reflect the one-half year period). May reflect amounts waived, reimbursed and/or other credits. Without any waivers, reimbursements and/or other credits, expenses would have been higher. |
| Aggressive Equity Fund | 25 |
Table of Contents
Russell Investment Funds
Aggressive Equity Fund
Schedule of Investments — December 31, 2010
Amounts in thousands (except share amounts)
| Principal Amount ($) or Shares | Market Value $ | |||||||
| Common Stocks - 95.4% | ||||||||
| Consumer Discretionary - 12.2% | ||||||||
Acacia Research - Acacia Technologies (Æ) | 11,940 | 310 | ||||||
Advance Auto Parts, Inc. | 2,800 | 185 | ||||||
Amerco, Inc. (Æ)(Ñ) | 2,100 | 202 | ||||||
America’s Car-Mart, Inc. (Æ)(Ñ) | 9,610 | 260 | ||||||
Arctic Cat, Inc. (Æ) | 1,800 | 26 | ||||||
Asbury Automotive Group, Inc. (Æ) | 12,631 | 233 | ||||||
Ascena Retail Group, Inc. (Æ) | 13,887 | 367 | ||||||
Bebe Stores, Inc. (Ñ) | 64,400 | 384 | ||||||
BJ’s Wholesale Club, Inc. (Æ) | 5,600 | 268 | ||||||
Bob Evans Farms, Inc. (Ñ) | 2,400 | 79 | ||||||
Buffalo Wild Wings, Inc. (Æ) | 5,261 | 231 | ||||||
Callaway Golf Co. (Ñ) | 26,456 | 213 | ||||||
Cato Corp. (The) Class A (Ñ) | 3,300 | 90 | ||||||
Chico’s FAS, Inc. (Ñ) | 36,400 | 438 | ||||||
Childrens Place Retail Stores, Inc. (The) (Æ)(Ñ) | 7,080 | 351 | ||||||
Christopher & Banks Corp. (Ñ) | 29,282 | 180 | ||||||
Coinstar, Inc. (Æ)(Ñ) | 11,808 | 667 | ||||||
Columbia Sportswear Co. (Ñ) | 2,805 | 169 | ||||||
Corinthian Colleges, Inc. (Æ)(Ñ) | 26,203 | 137 | ||||||
Cracker Barrel Old Country Store, Inc. (Ñ) | 1,200 | 66 | ||||||
CROCS, Inc. (Æ)(Ñ) | 23,274 | 398 | ||||||
Dick’s Sporting Goods, Inc. (Æ)(Ñ) | 12,153 | 456 | ||||||
Dillard’s, Inc. Class A (Ñ) | 9,200 | 349 | ||||||
Dollar Tree, Inc. (Æ) | 13,300 | 747 | ||||||
Elizabeth Arden, Inc. (Æ)(Ñ) | 3,100 | 71 | ||||||
Expedia, Inc. | 13,390 | 336 | ||||||
Federal-Mogul Corp. (Æ) | 19,019 | 392 | ||||||
Finish Line, Inc. (The) Class A (Ñ) | 29,335 | 504 | ||||||
Flextronics International, Ltd. (Æ) | 18,570 | 146 | ||||||
Foot Locker, Inc. (Ñ) | 24,850 | 488 | ||||||
Fossil, Inc. (Æ)(Ñ) | 6,700 | 472 | ||||||
Fred’s, Inc. Class A (Ñ) | 20,000 | 276 | ||||||
Furniture Brands International, Inc. (Æ)(Ñ) | 2,300 | 12 | ||||||
Gentex Corp. (Ñ) | 17,540 | 518 | ||||||
G-III Apparel Group, Ltd. (Æ)(Ñ) | 8,650 | 304 | ||||||
Harley-Davidson, Inc. (Ñ) | 3,400 | 118 | ||||||
Harman International Industries, Inc. (Æ) | 8,600 | 398 | ||||||
Helen of Troy, Ltd. (Æ) | 3,100 | 92 | ||||||
Hillenbrand, Inc. (Ñ) | 18,600 | 387 | ||||||
Hyatt Hotels Corp. (Æ)(Ñ) | 3,800 | 174 | ||||||
Jones Group, Inc. (The) | 28,100 | 437 | ||||||
Kenneth Cole Productions, Inc. Class A (Æ)(Ñ) | 20,764 | 259 | ||||||
Leapfrog Enterprises, Inc. Class A (Æ)(Ñ) | 8,900 | 49 | ||||||
Lear Corp. (Æ)(Ñ) | 1,400 | 138 | ||||||
Lifetime Brands, Inc. (Æ) | 1,500 | 21 | ||||||
LKQ Corp. (Æ) | 30,661 | 697 | ||||||
Meredith Corp. (Ñ) | 11,300 | 392 | ||||||
MGM Resorts International (Æ)(Ñ) | 32,195 | 478 | ||||||
OfficeMax, Inc. (Æ)(Ñ) | 19,662 | 348 | ||||||
Oxford Industries, Inc. (Ñ) | 5,825 | 149 | ||||||
Panera Bread Co. Class A (Æ)(Ñ) | 4,070 | 412 | ||||||
Penn National Gaming, Inc. (Æ)(Ñ) | 6,100 | 214 | ||||||
Perry Ellis International, Inc. (Æ)(Ñ) | 1,600 | 44 | ||||||
| Principal Amount ($) or Shares | Market Value $ | |||||||
PF Chang’s China Bistro, Inc. (Ñ) | 14,548 | 705 | ||||||
Pool Corp. (Ñ) | 11,400 | 257 | ||||||
RC2 Corp. (Æ) | 6,900 | 150 | ||||||
Rent-A-Center, Inc. Class A (Ñ) | 3,300 | 107 | ||||||
Rick’s Cabaret International, Inc. (Æ) | 900 | 7 | ||||||
Ross Stores, Inc. | 2,300 | 145 | ||||||
Ruby Tuesday, Inc. (Æ)(Ñ) | 26,896 | 351 | ||||||
Scholastic Corp. | 5,400 | 160 | ||||||
Shoe Carnival, Inc. (Æ)(Ñ) | 1,400 | 38 | ||||||
Standard Motor Products, Inc. (Ñ) | 24,000 | 328 | ||||||
Stein Mart, Inc. (Ñ) | 1,000 | 9 | ||||||
Steven Madden, Ltd. (Æ)(Ñ) | 19,326 | 807 | ||||||
Stewart Enterprises, Inc. Class A (Ñ) | 53,800 | 360 | ||||||
Superior Industries International, Inc. (Ñ) | 30,025 | 637 | ||||||
Systemax, Inc. (Æ)(Ñ) | 1,700 | 24 | ||||||
Tempur-Pedic International, Inc. (Æ)(Ñ) | 9,004 | 361 | ||||||
Texas Roadhouse, Inc. Class A (Æ)(Ñ) | 33,180 | 570 | ||||||
TRW Automotive Holdings Corp. (Æ)(Ñ) | 11,300 | 596 | ||||||
Urban Outfitters, Inc. (Æ)(Ñ) | 1,247 | 45 | ||||||
Warnaco Group, Inc. (The) (Æ)(Ñ) | 6,396 | 352 | ||||||
Wendy’s/Arby’s Group, Inc. Class A | 51,100 | 236 | ||||||
WESCO International, Inc. (Æ)(Ñ) | 500 | 26 | ||||||
Wet Seal, Inc. (The) Class A (Æ)(Ñ) | 19,900 | 74 | ||||||
Williams-Sonoma, Inc. (Ñ) | 12,220 | 436 | ||||||
WMS Industries, Inc. (Æ)(Ñ) | 5,719 | 259 | ||||||
Wolverine World Wide, Inc. (Ñ) | 16,820 | 536 | ||||||
Wyndham Worldwide Corp. | 20,000 | 599 | ||||||
| 23,307 | ||||||||
| Consumer Staples - 2.2% | ||||||||
Andersons, Inc. (The) (Ñ) | 5,388 | 196 | ||||||
Constellation Brands, Inc. Class A (Æ)(Ñ) | 37,800 | 837 | ||||||
Corn Products International, Inc. (Ñ) | 25,500 | 1,173 | ||||||
Energizer Holdings, Inc. (Æ) | 5,500 | 401 | ||||||
Hansen Natural Corp. (Æ) | 3,200 | 167 | ||||||
Nash Finch Co. (Ñ) | 1,500 | 64 | ||||||
Omega Protein Corp. (Æ)(Ñ) | 1,300 | 11 | ||||||
Pilgrim’s Pride Corp. (Æ) | 1,300 | 9 | ||||||
Rite Aid Corp. (Æ) | 80,500 | 71 | ||||||
Sanderson Farms, Inc. (Ñ) | 6,100 | 239 | ||||||
Spartan Stores, Inc. (Ñ) | 4,600 | 78 | ||||||
Susser Holdings Corp. (Æ) | 900 | 12 | ||||||
Tootsie Roll Industries, Inc. | 8,600 | 249 | ||||||
TreeHouse Foods, Inc. (Æ)(Ñ) | 6,980 | 357 | ||||||
Tyson Foods, Inc. Class A | 22,109 | 381 | ||||||
| 4,245 | ||||||||
| Energy - 5.1% | ||||||||
Alpha Natural Resources, Inc. (Æ) | 9,108 | 546 | ||||||
Bronco Drilling Co., Inc. (Æ) | 3,700 | 30 | ||||||
Complete Production Services, Inc. (Æ)(Ñ) | 8,675 | 256 | ||||||
Comstock Resources, Inc. (Æ)(Ñ) | 8,862 | 218 | ||||||
Core Laboratories NV | 4,867 | 433 | ||||||
CVR Energy, Inc. (Æ) | 6,900 | 105 | ||||||
Dawson Geophysical Co. (Æ)(Ñ) | 1,300 | 41 | ||||||
Exterran Holdings, Inc. (Æ) | 9,876 | 237 | ||||||
Forest Oil Corp. (Æ)(Ñ) | 10,619 | 403 | ||||||
| 26 | Aggressive Equity Fund |
Table of Contents
Russell Investment Funds
Aggressive Equity Fund
Schedule of Investments, continued — December 31, 2010
Amounts in thousands (except share amounts)
| Principal Amount ($) or Shares | Market Value $ | |||||||
Global Industries, Ltd. (Æ)(Ñ) | 27,998 | 194 | ||||||
Gulf Island Fabrication, Inc. | 2,200 | 62 | ||||||
Helix Energy Solutions Group, Inc. (Æ)(Ñ) | 14,024 | 170 | ||||||
Helmerich & Payne, Inc. (Ñ) | 9,404 | 456 | ||||||
Oil States International, Inc. (Æ) | 8,600 | 551 | ||||||
Parker Drilling Co. (Æ) | 2,500 | 11 | ||||||
Patterson-UTI Energy, Inc. | 31,046 | 669 | ||||||
Penn Virginia Corp. (Ñ) | 29,300 | 493 | ||||||
Pioneer Natural Resources Co. (Ñ) | 3,450 | 300 | ||||||
Precision Drilling Corp. (Æ) | 28,161 | 273 | ||||||
Rosetta Resources, Inc. (Æ)(Ñ) | 15,190 | 571 | ||||||
Rowan Cos., Inc. (Æ)(Ñ) | 14,881 | 520 | ||||||
SEACOR Holdings, Inc. (Ñ) | 4,800 | 486 | ||||||
Sunoco, Inc. | 15,887 | 641 | ||||||
Tesoro Corp. (Æ)(Ñ) | 21,600 | 400 | ||||||
Tetra Technologies, Inc. (Æ)(Ñ) | 19,655 | 233 | ||||||
Thompson Creek Metals Co., Inc. - | 15,532 | 229 | ||||||
Unit Corp. (Æ)(Ñ) | 8,681 | 404 | ||||||
USEC, Inc. (Æ)(Ñ) | 21,700 | 131 | ||||||
Walter Energy, Inc. Class A | 5,015 | 640 | ||||||
Western Refining, Inc. (Æ) | 9,924 | 105 | ||||||
| 9,808 | ||||||||
| Financial Services - 17.1% | ||||||||
Advance America Cash Advance Centers, Inc. (Ñ) | 3,100 | 17 | ||||||
Affiliated Managers Group, Inc. (Æ)(Ñ) | 13,723 | 1,362 | ||||||
Allied World Assurance Co. Holdings, Ltd. | 2,000 | 119 | ||||||
American Capital Agency Corp. (Ñ)(ö) | 23,900 | 687 | ||||||
American Financial Group, Inc. | 11,400 | 368 | ||||||
American National Insurance Co. | 700 | 60 | ||||||
American Safety Insurance Holdings, | 1,400 | 30 | ||||||
Ameriprise Financial, Inc. | 5,324 | 306 | ||||||
Amtrust Financial Services, Inc. (Ñ) | 3,000 | 53 | ||||||
Apollo Commercial Real Estate Finance, Inc. (Ñ)(ö) | 4,000 | 65 | ||||||
Ares Capital Corp. | 53,980 | 890 | ||||||
Argo Group International Holdings, Ltd. | 3,800 | 142 | ||||||
Ashford Hospitality Trust, Inc. (Æ)(Ñ)(ö) | 10,300 | 99 | ||||||
Aspen Insurance Holdings, Ltd. (Ñ) | 6,300 | 180 | ||||||
Assurant, Inc. (Ñ) | 4,300 | 166 | ||||||
Astoria Financial Corp. | 7,200 | 100 | ||||||
Axis Capital Holdings, Ltd. | 1,100 | 39 | ||||||
BancorpSouth, Inc. (Ñ) | 16,800 | 268 | ||||||
BioMed Realty Trust, Inc. (Ñ)(ö) | 18,883 | 352 | ||||||
BOK Financial Corp. (Ñ) | 13,590 | 727 | ||||||
Boston Private Financial Holdings, Inc. (Ñ) | 47,121 | 309 | ||||||
Brandywine Realty Trust (Ñ)(ö) | 15,000 | 175 | ||||||
Broadridge Financial Solutions, Inc. (Ñ) | 2,700 | 59 | ||||||
Brookline Bancorp, Inc. (Ñ) | 30,900 | 335 | ||||||
Camden Property Trust (ö) | 4,700 | 254 | ||||||
Capitol Federal Financial, Inc. (Ñ) | 27,591 | 329 | ||||||
CapLease, Inc. (Ñ)(ö) | 1,100 | 6 | ||||||
Chesapeake Lodging Trust (Ñ)(ö) | 1,200 | 23 | ||||||
City National Corp. (Ñ) | 5,900 | 362 | ||||||
| Principal Amount ($) or Shares | Market Value $ | |||||||
Cogdell Spencer, Inc. (Ñ)(ö) | 6,000 | 35 | ||||||
Cohen & Steers, Inc. (Ñ) | 3,400 | 89 | ||||||
Colonial Properties Trust (ö) | 39,162 | 707 | ||||||
CommonWealth REIT (Ñ)(ö) | 12,675 | 323 | ||||||
Community Bank System, Inc. | 13,700 | 380 | ||||||
Community Trust Bancorp, Inc. (Ñ) | 1,000 | 29 | ||||||
CoreLogic, Inc. (Æ) | 13,600 | 252 | ||||||
Cousins Properties, Inc. (Ñ)(ö) | 18,869 | 157 | ||||||
DiamondRock Hospitality Co. (Æ)(Ñ)(ö) | 41,769 | 502 | ||||||
Dime Community Bancshares, Inc. (Ñ) | 8,700 | 127 | ||||||
Duff & Phelps Corp. Class A (Ñ) | 30,800 | 519 | ||||||
Dynex Capital, Inc. (Ñ)(ö) | 28,000 | 306 | ||||||
Education Realty Trust, Inc. (ö) | 9,600 | 75 | ||||||
Endurance Specialty Holdings, Ltd. (Ñ) | 6,600 | 304 | ||||||
Ezcorp, Inc. Class A (Æ) | 24,774 | 672 | ||||||
FBL Financial Group, Inc. Class A (Ñ) | 1,800 | 52 | ||||||
Fidelity National Financial, Inc. Class A (Ñ) | 26,100 | 357 | ||||||
First Financial Bancorp (Ñ) | 7,200 | 133 | ||||||
First Interstate Bancsystem, Inc. | 1,100 | 17 | ||||||
First Midwest Bancorp, Inc. (Ñ) | 11,900 | 137 | ||||||
First Potomac Realty Trust (Ñ)(ö) | 4,400 | 74 | ||||||
FirstMerit Corp. (Ñ) | 13,400 | 265 | ||||||
Flagstone Reinsurance Holdings SA (Ñ) | 23,800 | 300 | ||||||
Flushing Financial Corp. (Ñ) | 2,500 | 35 | ||||||
FPIC Insurance Group, Inc. (Æ) | 900 | 33 | ||||||
Franklin Street Properties Corp. (Ñ)(ö) | 22,243 | 317 | ||||||
Fulton Financial Corp. (Ñ) | 30,900 | 320 | ||||||
Glacier Bancorp, Inc. (Ñ) | 8,800 | 133 | ||||||
Global Cash Access Holdings, Inc. (Æ) | 2,400 | 8 | ||||||
Global Indemnity PLC Class A (Æ) | 1,200 | 25 | ||||||
Hancock Holding Co. (Ñ) | 9,701 | 338 | ||||||
Hanmi Financial Corp. (Æ) | 16,400 | 19 | ||||||
Hatteras Financial Corp. (Ñ)(ö) | 7,700 | 233 | ||||||
HCC Insurance Holdings, Inc. | 12,400 | 359 | ||||||
Healthcare Realty Trust, Inc. (ö) | 9,700 | 205 | ||||||
Hercules Technology Growth Capital, Inc. (Ñ) | 3,900 | 40 | ||||||
Hersha Hospitality Trust Class A (ö) | 11,300 | 75 | ||||||
Hilltop Holdings, Inc. (Æ) | 600 | 6 | ||||||
Home Bancshares, Inc. | 2,750 | 61 | ||||||
Horace Mann Educators Corp. | 7,600 | 137 | ||||||
Hospitality Properties Trust (Ñ)(ö) | 23,043 | 531 | ||||||
Huntington Bancshares, Inc. | 15,000 | 103 | ||||||
Iberiabank Corp. (Ñ) | 600 | 35 | ||||||
Infinity Property & Casualty Corp. | 1,100 | 68 | ||||||
IntercontinentalExchange, Inc. (Æ)(Ñ) | 2,817 | 336 | ||||||
Invesco Mortgage Capital, Inc. (Ñ)(ö) | 27,000 | 590 | ||||||
Investment Technology Group, Inc. (Æ) | 1,900 | 31 | ||||||
JER Investors Trust, Inc. (Æ)(Þ) | 1,771 | — | ||||||
Jones Lang LaSalle, Inc. | 3,200 | 269 | ||||||
Knight Capital Group, Inc. Class A (Æ)(Ñ) | 19,093 | 263 | ||||||
Kohlberg Capital Corp. (Ñ) | 2,800 | 20 | ||||||
LaSalle Hotel Properties (Ñ)(ö) | 12,977 | 342 | ||||||
Lazard, Ltd. Class A | 29,191 | 1,153 | ||||||
Liberty Property Trust (ö) | 11,100 | 354 | ||||||
Mack-Cali Realty Corp. (Ñ)(ö) | 10,200 | 337 | ||||||
| Aggressive Equity Fund | 27 |
Table of Contents
Russell Investment Funds
Aggressive Equity Fund
Schedule of Investments, continued — December 31, 2010
Amounts in thousands (except share amounts)
| Principal Amount ($) or Shares | Market Value $ | |||||||
Maiden Holdings, Ltd. (Ñ) | 4,500 | 35 | ||||||
MCG Capital Corp. | 8,900 | 62 | ||||||
Meadowbrook Insurance Group, Inc. | 7,785 | 80 | ||||||
Medical Properties Trust, Inc. (Ñ)(ö) | 18,400 | 199 | ||||||
MFA Financial, Inc. (Ñ)(ö) | 38,300 | 313 | ||||||
Montpelier Re Holdings, Ltd. (Ñ) | 15,800 | 315 | ||||||
MSCI, Inc. Class A (Æ)(Ñ) | 9,014 | 351 | ||||||
Nelnet, Inc. Class A | 8,800 | 208 | ||||||
Newcastle Investment Corp. (Æ)(ö) | 3,600 | 24 | ||||||
OceanFirst Financial Corp. | 1,700 | 22 | ||||||
Old National Bancorp (Ñ) | 19,951 | 237 | ||||||
OneBeacon Insurance Group, Ltd. | 2,800 | 42 | ||||||
Oritani Financial Corp. (Ñ) | 13,900 | 170 | ||||||
Parkway Properties, Inc. (Ñ)(ö) | 1,900 | 33 | ||||||
PennantPark Investment Corp. (Ñ) | 27,758 | 340 | ||||||
Phoenix Cos., Inc. (The) (Æ)(Ñ) | 16,800 | 43 | ||||||
Piedmont Office Realty Trust, Inc. | 8,900 | 179 | ||||||
Piper Jaffray Cos. (Æ) | 8,238 | 288 | ||||||
Post Properties, Inc. (Ñ)(ö) | 7,300 | 265 | ||||||
Potlatch Corp. (Ñ)(ö) | 12,500 | 407 | ||||||
Prosperity Bancshares, Inc. (Ñ) | 26,780 | 1,053 | ||||||
Protective Life Corp. (Ñ) | 11,600 | 309 | ||||||
PS Business Parks, Inc. (ö) | 2,300 | 128 | ||||||
Raymond James Financial, Inc. (Ñ) | 10,497 | 343 | ||||||
Reinsurance Group of America, Inc. | 5,500 | 295 | ||||||
Republic Bancorp, Inc. Class A | 1,100 | 26 | ||||||
Resource Capital Corp. (Ñ)(ö) | 44,713 | 330 | ||||||
Retail Opportunity Investments Corp. (Ñ)(ö) | 2,800 | 28 | ||||||
Sandy Spring Bancorp, Inc. (Ñ) | 1,200 | 22 | ||||||
SeaBright Holdings, Inc. (Ñ) | 2,000 | 18 | ||||||
Selective Insurance Group, Inc. (Ñ) | 22,300 | 405 | ||||||
Signature Bank NY (Æ)(Ñ) | 5,950 | 298 | ||||||
SL Green Realty Corp. (Ñ)(ö) | 4,700 | 317 | ||||||
Southwest Bancorp, Inc. (Æ)(Ñ) | 1,700 | 21 | ||||||
Sovran Self Storage, Inc. (ö) | 2,200 | 81 | ||||||
StanCorp Financial Group, Inc. (Ñ) | 4,500 | 203 | ||||||
StellarOne Corp. (Ñ) | 19,587 | 285 | ||||||
Sterling Bancorp Class N (Ñ) | 10,700 | 112 | ||||||
Sterling Bancshares, Inc. (Ñ) | 37,200 | 261 | ||||||
Strategic Hotels & Resorts, Inc. (Æ)(ö) | 10,100 | 53 | ||||||
Susquehanna Bancshares, Inc. (Ñ) | 22,100 | 214 | ||||||
SVB Financial Group (Æ)(Ñ) | 5,270 | 280 | ||||||
Symetra Financial Corp. | 30,000 | 411 | ||||||
Texas Capital Bancshares, Inc. (Æ)(Ñ) | 12,619 | 268 | ||||||
TICC Capital Corp. (Ñ) | 32,000 | 359 | ||||||
Transatlantic Holdings, Inc. | 6,700 | 346 | ||||||
Trustmark Corp. (Ñ) | 13,200 | 328 | ||||||
UMB Financial Corp. (Ñ) | 8,800 | 364 | ||||||
United Financial Bancorp, Inc. (Ñ) | 1,500 | 23 | ||||||
Unitrin, Inc. | 4,800 | 118 | ||||||
Washington Federal, Inc. (Ñ) | 45,226 | 765 | ||||||
Webster Financial Corp. | 12,100 | 238 | ||||||
West Coast Bancorp (Æ) | 3,900 | 11 | ||||||
White Mountains Insurance Group, Ltd. (Ñ) | 400 | 134 | ||||||
| Principal Amount ($) or Shares | Market Value $ | |||||||
Whitney Holding Corp. (Ñ) | 12,604 | 178 | ||||||
| 32,708 | ||||||||
| Health Care - 10.1% | ||||||||
Affymetrix, Inc. (Æ)(Ñ) | 23,800 | 120 | ||||||
Albany Molecular Research, Inc. (Æ)(Ñ) | 24,017 | 135 | ||||||
Allscripts Healthcare Solutions, Inc. (Æ) | 28,546 | 550 | ||||||
Amedisys, Inc. (Æ) | 6,968 | 233 | ||||||
American Oriental Bioengineering, Inc. (Æ)(Ñ) | 5,000 | 12 | ||||||
AMERIGROUP Corp. Class A (Æ) | 4,400 | 193 | ||||||
Analogic Corp. (Ñ) | 8,394 | 415 | ||||||
Angiodynamics, Inc. (Æ) | 2,700 | 41 | ||||||
Brookdale Senior Living, Inc. (Æ)(Ñ) | 20,369 | 436 | ||||||
Catalyst Health Solutions, Inc. (Æ)(Ñ) | 18,288 | 851 | ||||||
Celera Corp. (Æ) | 5,500 | 35 | ||||||
Centene Corp. (Æ)(Ñ) | 3,400 | 86 | ||||||
Conmed Corp. (Æ)(Ñ) | 8,966 | 237 | ||||||
Cooper Cos., Inc. (The) | 6,584 | 371 | ||||||
Coventry Health Care, Inc. (Æ) | 17,100 | 451 | ||||||
Cross Country Healthcare, Inc. (Æ) | 2,800 | 24 | ||||||
Cynosure, Inc. Class A (Æ)(Ñ) | 16,320 | 166 | ||||||
Emergency Medical Services Corp. | 14,011 | 906 | ||||||
Endo Pharmaceuticals Holdings, Inc. (Æ) | 13,100 | 468 | ||||||
Ensign Group, Inc. (The) (Ñ) | 3,800 | 95 | ||||||
Five Star Quality Care, Inc. (Æ)(Ñ) | 38,300 | 271 | ||||||
Gentiva Health Services, Inc. (Æ) | 11,316 | 301 | ||||||
Greatbatch, Inc. (Æ)(Ñ) | 8,836 | 213 | ||||||
Harvard Bioscience, Inc. (Æ)(Ñ) | 39,716 | 162 | ||||||
Health Management Associates, Inc. Class A (Æ) | 46,126 | 440 | ||||||
Health Net, Inc. (Æ) | 30,800 | 840 | ||||||
Healthsouth Corp. (Æ)(Ñ) | 11,697 | 242 | ||||||
Healthspring, Inc. (Æ) | 21,655 | 575 | ||||||
Healthways, Inc. (Æ)(Ñ) | 1,500 | 17 | ||||||
HMS Holdings Corp. (Æ) | 10,450 | 676 | ||||||
Hologic, Inc. (Æ)(Ñ) | 23,400 | 440 | ||||||
Humana, Inc. (Æ)(Ñ) | 6,900 | 378 | ||||||
IDEXX Laboratories, Inc. (Æ)(Ñ) | 5,858 | 405 | ||||||
Illumina, Inc. (Æ)(Ñ) | 7,436 | 471 | ||||||
Impax Laboratories, Inc. (Æ) | 5,000 | 101 | ||||||
Kindred Healthcare, Inc. (Æ)(Ñ) | 16,548 | 304 | ||||||
LifePoint Hospitals, Inc. (Æ)(Ñ) | 5,300 | 195 | ||||||
Magellan Health Services, Inc. (Æ) | 7,930 | 375 | ||||||
Medicines Co. (The) (Æ)(Ñ) | 10,300 | 146 | ||||||
Mednax, Inc. (Æ)(Ñ) | 5,884 | 396 | ||||||
Meridian Bioscience, Inc. (Ñ) | 9,100 | 211 | ||||||
Molina Healthcare, Inc. (Æ)(Ñ) | 9,700 | 270 | ||||||
Palomar Medical Technologies, Inc. (Æ)(Ñ) | 2,300 | 33 | ||||||
Par Pharmaceutical Cos., Inc. (Æ)(Ñ) | 25,400 | 977 | ||||||
PerkinElmer, Inc. (Ñ) | 8,968 | 232 | ||||||
Quality Systems, Inc. (Ñ) | 6,030 | 421 | ||||||
Salix Pharmaceuticals, Ltd. (Æ)(Ñ) | 7,747 | 364 | ||||||
SuperGen, Inc. (Æ)(Ñ) | 4,200 | 11 | ||||||
SXC Health Solutions Corp. (Æ) | 26,680 | 1,143 | ||||||
Symmetry Medical, Inc. (Æ)(Ñ) | 16,118 | 150 | ||||||
| 28 | Aggressive Equity Fund |
Table of Contents
Russell Investment Funds
Aggressive Equity Fund
Schedule of Investments, continued — December 31, 2010
Amounts in thousands (except share amounts)
| Principal Amount ($) or Shares | Market Value $ | |||||||
Teleflex, Inc. (Ñ) | 2,200 | 118 | ||||||
TomoTherapy, Inc. (Æ)(Ñ) | 3,400 | 12 | ||||||
Triple-S Management Corp. Class B (Æ) | 2,400 | 46 | ||||||
United Therapeutics Corp. (Æ)(Ñ) | 5,404 | 342 | ||||||
Universal American Corp. (Ñ) | 7,500 | 153 | ||||||
Viropharma, Inc. (Æ)(Ñ) | 26,100 | 452 | ||||||
Vital Images, Inc. (Æ) | 1,000 | 14 | ||||||
Warner Chilcott PLC Class A (Ñ) | 15,860 | 358 | ||||||
Watson Pharmaceuticals, Inc. Class B (Æ) | 6,100 | 315 | ||||||
West Pharmaceutical Services, Inc. (Ñ) | 14,600 | 602 | ||||||
Zoll Medical Corp. (Æ)(Ñ) | 9,710 | 362 | ||||||
| 19,359 | ||||||||
| Materials and Processing - 8.2% | ||||||||
A Schulman, Inc. (Ñ) | 20,500 | 469 | ||||||
Albemarle Corp. | 13,090 | 731 | ||||||
Apogee Enterprises, Inc. (Ñ) | 4,200 | 57 | ||||||
Arch Chemicals, Inc. (Ñ) | 7,500 | 284 | ||||||
Ashland, Inc. | 11,700 | 595 | ||||||
Ball Corp. | 10,800 | 736 | ||||||
Boise, Inc. (Ñ) | 7,900 | 63 | ||||||
Buckeye Technologies, Inc. | 21,187 | 445 | ||||||
Cabot Corp. | 11,310 | 425 | ||||||
Comfort Systems USA, Inc. (Ñ) | 9,800 | 129 | ||||||
Commercial Metals Co. (Ñ) | 26,400 | 438 | ||||||
Cytec Industries, Inc. | 17,649 | 937 | ||||||
Domtar Corp. | 2,600 | 197 | ||||||
Fastenal Co. (Ñ) | 5,834 | 350 | ||||||
Ferro Corp. (Æ)(Ñ) | 19,478 | 285 | ||||||
HB Fuller Co. | 17,400 | 357 | ||||||
Horsehead Holding Corp. (Æ)(Ñ) | 17,654 | 230 | ||||||
Huntsman Corp. | 19,500 | 304 | ||||||
Interline Brands, Inc. (Æ) | 20,300 | 462 | ||||||
Kaiser Aluminum Corp. (Ñ) | 6,150 | 308 | ||||||
KapStone Paper and Packaging | 25,400 | 389 | ||||||
Kaydon Corp. (Ñ) | 7,600 | 309 | ||||||
Kronos Worldwide, Inc. (Æ)(Ñ) | 1,000 | 42 | ||||||
Lexicon Pharmaceuticals, Inc. (Æ)(Ñ) | 22,800 | 33 | ||||||
MeadWestvaco Corp. (Ñ) | 2,500 | 65 | ||||||
Minerals Technologies, Inc. | 3,900 | 255 | ||||||
Mueller Water Products, Inc. Class A (Ñ) | 54,900 | 229 | ||||||
Neenah Paper, Inc. (Ñ) | 1,800 | 35 | ||||||
OM Group, Inc. (Æ) | 13,634 | 525 | ||||||
Owens & Minor, Inc. (Ñ) | 11,000 | 324 | ||||||
Packaging Corp. of America | 13,900 | 359 | ||||||
Pan American Silver Corp. | 5,268 | 217 | ||||||
PolyOne Corp. (Æ) | 12,800 | 160 | ||||||
Polypore International, Inc. (Æ)(Ñ) | 6,711 | 273 | ||||||
Reliance Steel & Aluminum Co. (Ñ) | 7,800 | 399 | ||||||
RTI International Metals, Inc. (Æ) | 7,474 | 202 | ||||||
Scotts Miracle-Gro Co. (The) Class A (Ñ) | 6,192 | 314 | ||||||
ShengdaTech, Inc. (Æ)(Ñ) | 3,100 | 15 | ||||||
Simpson Manufacturing Co., Inc. (Ñ) | 1,300 | 40 | ||||||
Timken Co. | 16,600 | 793 | ||||||
Titanium Metals Corp. (Æ)(Ñ) | 20,630 | 354 | ||||||
TPC Group, Inc. (Æ)(Ñ) | 26,790 | 813 | ||||||
| Principal Amount ($) or Shares | Market Value $ | |||||||
Universal Forest Products, Inc. (Ñ) | 10,250 | 399 | ||||||
Valspar Corp. | 10,600 | 365 | ||||||
Watsco, Inc. | 5,002 | 316 | ||||||
WR Grace & Co. (Æ)(Ñ) | 19,048 | 669 | ||||||
| 15,696 | ||||||||
| Producer Durables - 20.7% | ||||||||
ABM Industries, Inc. (Ñ) | 16,800 | 442 | ||||||
Actuant Corp. Class A (Ñ) | 13,309 | 354 | ||||||
Advanced Battery Technologies, Inc. (Æ)(Ñ) | 3,800 | 15 | ||||||
Aecom Technology Corp. (Æ)(Ñ) | 10,300 | 288 | ||||||
AGCO Corp. (Æ)(Ñ) | 12,139 | 615 | ||||||
Aircastle, Ltd. (Ñ) | 38,200 | 399 | ||||||
Alaska Air Group, Inc. (Æ) | 12,800 | 727 | ||||||
Alexander & Baldwin, Inc. (Ñ) | 12,717 | 509 | ||||||
AO Smith Corp. | 8,400 | 320 | ||||||
Applied Industrial Technologies, Inc. | 19,900 | 647 | ||||||
Arkansas Best Corp. (Ñ) | 2,700 | 74 | ||||||
Astec Industries, Inc. (Æ)(Ñ) | 6,703 | 217 | ||||||
Atlas Air Worldwide Holdings, Inc. (Æ)(Ñ) | 3,500 | 195 | ||||||
Avery Dennison Corp. (Ñ) | 2,100 | 89 | ||||||
Barnes Group, Inc. (Ñ) | 12,500 | 258 | ||||||
BE Aerospace, Inc. (Æ) | 28,550 | 1,058 | ||||||
Booz Allen Hamilton Holding Corp. | 12,867 | 250 | ||||||
Brady Corp. Class A (Ñ) | 12,500 | 408 | ||||||
Briggs & Stratton Corp. (Ñ) | 24,900 | 490 | ||||||
CAI International, Inc. (Æ)(Ñ) | 12,923 | 253 | ||||||
Carlisle Cos., Inc. (Ñ) | 9,400 | 374 | ||||||
Celadon Group, Inc. (Æ) | 2,300 | 34 | ||||||
Ceradyne, Inc. (Æ) | 9,059 | 286 | ||||||
Chart Industries, Inc. (Æ)(Ñ) | 13,756 | 465 | ||||||
Compass Diversified Holdings | 15,700 | 278 | ||||||
Consolidated Graphics, Inc. (Æ) | 2,380 | 115 | ||||||
Convergys Corp. (Æ)(Ñ) | 1,700 | 22 | ||||||
Con-way, Inc. (Ñ) | 8,600 | 315 | ||||||
CRA International, Inc. (Æ)(Ñ) | 1,100 | 26 | ||||||
Crane Co. | 8,300 | 341 | ||||||
Cubic Corp. | 4,100 | 193 | ||||||
Curtiss-Wright Corp. (Ñ) | 16,100 | 535 | ||||||
DHT Holdings, Inc. | 3,300 | 15 | ||||||
Diana Shipping, Inc. (Æ)(Ñ) | 17,932 | 216 | ||||||
Ducommun, Inc. | 1,800 | 39 | ||||||
Dycom Industries, Inc. (Æ) | 2,500 | 37 | ||||||
Electro Rent Corp. | 5,474 | 88 | ||||||
Electronics for Imaging, Inc. (Æ)(Ñ) | 4,952 | 71 | ||||||
EMCOR Group, Inc. (Æ) | 5,300 | 154 | ||||||
EnerSys (Æ) | 17,790 | 571 | ||||||
Ennis, Inc. (Ñ) | 1,600 | 27 | ||||||
EnPro Industries, Inc. (Æ)(Ñ) | 8,186 | 340 | ||||||
Esterline Technologies Corp. (Æ) | 8,800 | 604 | ||||||
Excel Maritime Carriers, Ltd. | 11,100 | 62 | ||||||
Forward Air Corp. (Ñ) | 7,800 | 221 | ||||||
G&K Services, Inc. Class A (Ñ) | 10,400 | 321 | ||||||
Genesee & Wyoming, Inc. Class A (Æ)(Ñ) | 9,022 | 478 | ||||||
GrafTech International, Ltd. (Æ) | 13,259 | 263 | ||||||
| Aggressive Equity Fund | 29 |
Table of Contents
Russell Investment Funds
Aggressive Equity Fund
Schedule of Investments, continued — December 31, 2010
Amounts in thousands (except share amounts)
| Principal Amount ($) or Shares | Market Value $ | |||||||
Granite Construction, Inc. (Ñ) | 13,700 | 376 | ||||||
Greenbrier Cos., Inc. (Æ)(Ñ) | 10,000 | 210 | ||||||
Group 1 Automotive, Inc. (Ñ) | 7,020 | 293 | ||||||
Gulfmark Offshore, Inc. Class A (Æ) | 4,000 | 122 | ||||||
Harsco Corp. (Ñ) | 18,100 | 512 | ||||||
Haynes International, Inc. (Ñ) | 700 | 29 | ||||||
HUB Group, Inc. Class A (Æ) | 8,709 | 306 | ||||||
Insituform Technologies, Inc. | 6,542 | 173 | ||||||
JB Hunt Transport Services, Inc. | 12,570 | 513 | ||||||
Joy Global, Inc. | 14,835 | 1,287 | ||||||
Kansas City Southern (Æ) | 3,700 | 177 | ||||||
KBR, Inc. | 58,528 | 1,784 | ||||||
Kelly Services, Inc. Class A (Æ)(Ñ) | 4,400 | 83 | ||||||
Kennametal, Inc. (Ñ) | 17,876 | 705 | ||||||
Knight Transportation, Inc. (Ñ) | 34,875 | 662 | ||||||
Layne Christensen Co. (Æ)(Ñ) | 9,305 | 320 | ||||||
Lexmark International, Inc. Class A (Æ) | 10,500 | 366 | ||||||
Littelfuse, Inc. | 3,200 | 151 | ||||||
LMI Aerospace, Inc. (Æ)(Ñ) | 1,400 | 22 | ||||||
M&F Worldwide Corp. (Æ)(Ñ) | 3,600 | 83 | ||||||
Manpower, Inc. (Ñ) | 6,347 | 398 | ||||||
MAXIMUS, Inc. | 8,500 | 557 | ||||||
McDermott International, Inc. (Æ)(Ñ) | 51,377 | 1,063 | ||||||
Michael Baker Corp. (Æ)(Ñ) | 300 | 9 | ||||||
Miller Industries, Inc. (Ñ) | 1,300 | 18 | ||||||
MSC Industrial Direct Co. Class A | 7,115 | 460 | ||||||
NACCO Industries, Inc. Class A | 800 | 87 | ||||||
Nalco Holding Co. (Ñ) | 12,121 | 387 | ||||||
National Instruments Corp. (Ñ) | 9,329 | 351 | ||||||
Navistar International Corp. (Æ)(Ñ) | 13,820 | 800 | ||||||
Ness Technologies, Inc. (Æ) | 4,100 | 24 | ||||||
Oshkosh Corp. (Æ)(Ñ) | 18,000 | 635 | ||||||
OSI Systems, Inc. (Æ)(Ñ) | 5,632 | 205 | ||||||
Railamerica, Inc. (Æ)(Ñ) | 4,900 | 63 | ||||||
Resources Connection, Inc. (Ñ) | 17,300 | 322 | ||||||
Robbins & Myers, Inc. (Ñ) | 16,462 | 589 | ||||||
Robert Half International, Inc. (Ñ) | 11,767 | 360 | ||||||
Roper Industries, Inc. (Ñ) | 10,296 | 787 | ||||||
RR Donnelley & Sons Co. | 17,000 | 297 | ||||||
RSC Holdings, Inc. (Æ)(Ñ) | 10,900 | 106 | ||||||
Ryder System, Inc. | 9,300 | 490 | ||||||
Saia, Inc. (Æ)(Ñ) | 2,100 | 35 | ||||||
Sensata Technologies Holding NV (Æ) | 15,256 | 459 | ||||||
SFN Group, Inc. (Æ)(Ñ) | 6,800 | 66 | ||||||
Shaw Group, Inc. (The)(Æ) | 8,200 | 281 | ||||||
Sims Metal Management, Ltd. - ADR | 8,204 | 179 | ||||||
Skywest, Inc. (Ñ) | 27,700 | 433 | ||||||
Snyders-Lance, Inc. (Ñ) | 13,000 | 305 | ||||||
Southwest Airlines Co. | 15,879 | 206 | ||||||
Spirit Aerosystems Holdings, Inc. | 9,900 | 206 | ||||||
Steelcase, Inc. Class A (Ñ) | 16,100 | 170 | ||||||
TAL International Group, Inc. (Ñ) | 10,000 | 309 | ||||||
Tecumseh Products Co. Class A (Æ) | 1,900 | 25 | ||||||
Teekay Corp. (Ñ) | 6,000 | 198 | ||||||
Teledyne Technologies, Inc. (Æ) | 9,100 | 400 | ||||||
| Principal Amount ($) or Shares | Market Value $ | |||||||
TeleTech Holdings, Inc. (Æ) | 1,500 | 31 | ||||||
Textainer Group Holdings, Ltd. (Ñ) | 14,073 | 401 | ||||||
TransDigm Group, Inc. (Æ) | 5,360 | 386 | ||||||
Trimas Corp. (Æ) | 4,600 | 94 | ||||||
Trimble Navigation, Ltd. (Æ) | 11,227 | 448 | ||||||
Trinity Industries, Inc. (Ñ) | 14,600 | 389 | ||||||
Triumph Group, Inc. (Ñ) | 10,520 | 942 | ||||||
Tsakos Energy Navigation, Ltd. (Ñ) | 31,200 | 312 | ||||||
Tutor Perini Corp. | 8,600 | 184 | ||||||
Unifirst Corp. | 1,500 | 83 | ||||||
Unisys Corp. (Æ) | 2,600 | 67 | ||||||
URS Corp. (Æ) | 23,950 | 996 | ||||||
UTi Worldwide, Inc. | 22,940 | 486 | ||||||
Wabtec Corp. (Ñ) | 9,140 | 483 | ||||||
Watts Water Technologies, Inc. Class A (Ñ) | 4,800 | 176 | ||||||
Werner Enterprises, Inc. (Ñ) | 10,000 | 226 | ||||||
Woodward Governor Co. (Ñ) | 10,529 | 395 | ||||||
| 39,652 | ||||||||
| Technology - 14.6% | ||||||||
ADTRAN, Inc. (Ñ) | 14,123 | 511 | ||||||
Advanced Analogic Technologies, Inc. (Æ) | 600 | 2 | ||||||
Amdocs, Ltd. (Æ) | 3,700 | 102 | ||||||
American Reprographics Co. (Æ)(Ñ) | 5,000 | 38 | ||||||
Amkor Technology, Inc. (Æ)(Ñ) | 21,300 | 157 | ||||||
Amphenol Corp. Class A (Ñ) | 14,793 | 782 | ||||||
Anadigics, Inc. (Æ)(Ñ) | 4,800 | 33 | ||||||
Ansys, Inc. (Æ) | 10,777 | 562 | ||||||
Arris Group, Inc. (Æ) | 5,900 | 66 | ||||||
Aruba Networks, Inc. (Æ)(Ñ) | 11,081 | 231 | ||||||
Atmel Corp. (Æ) | 45,909 | 567 | ||||||
Avago Technologies, Ltd. | 11,168 | 318 | ||||||
Aviat Networks, Inc. (Æ) | 7,900 | 40 | ||||||
Avid Technology, Inc. (Æ) | 600 | 10 | ||||||
AVX Corp. | 18,100 | 279 | ||||||
Axcelis Technologies, Inc. (Æ)(Ñ) | 6,300 | 22 | ||||||
Benchmark Electronics, Inc. (Æ)(Ñ) | 8,000 | 145 | ||||||
Black Box Corp. (Ñ) | 3,000 | 115 | ||||||
Brocade Communications Systems, Inc. (Æ) | 60,100 | 318 | ||||||
Cogo Group, Inc. (Æ) | 900 | 8 | ||||||
Coherent, Inc. (Æ) | 13,133 | 592 | ||||||
Cohu, Inc. (Ñ) | 18,250 | 303 | ||||||
Concur Technologies, Inc. (Æ)(Ñ) | 8,200 | 426 | ||||||
CSG Systems International, Inc. (Æ)(Ñ) | 17,837 | 338 | ||||||
Cypress Semiconductor Corp. (Æ) | 25,253 | 469 | ||||||
Digi International, Inc. (Æ)(Ñ) | 2,000 | 22 | ||||||
Dolby Laboratories, Inc. Class A (Æ) | 6,930 | 462 | ||||||
DSP Group, Inc. (Æ) | 1,700 | 14 | ||||||
Earthlink, Inc. (Ñ) | 71,700 | 617 | ||||||
Electro Scientific Industries, Inc. (Æ) | 28,388 | 455 | ||||||
EMS Technologies, Inc. (Æ) | 1,900 | 38 | ||||||
Emulex Corp. (Æ) | 18,667 | 218 | ||||||
Entropic Communications, Inc. (Æ)(Ñ) | 26,090 | 315 | ||||||
Epicor Software Corp. (Æ) | 4,900 | 49 | ||||||
Equinix, Inc. (Æ)(Ñ) | 4,960 | 403 | ||||||
Exar Corp. (Æ)(Ñ) | 4,500 | 31 | ||||||
Extreme Networks (Æ)(Ñ) | 13,800 | 43 | ||||||
| 30 | Aggressive Equity Fund |
Table of Contents
Russell Investment Funds
Aggressive Equity Fund
Schedule of Investments, continued — December 31, 2010
Amounts in thousands (except share amounts)
| Principal Amount ($) or Shares | Market Value $ | |||||||
FEI Co. (Æ)(Ñ) | 1,000 | 26 | ||||||
Formfactor, Inc. (Æ)(Ñ) | 9,900 | 88 | ||||||
Global Crossing, Ltd. (Æ) | 1,500 | 19 | ||||||
Hittite Microwave Corp. (Æ) | 7,353 | 449 | ||||||
Hutchinson Technology, Inc. (Æ)(Ñ) | 1,100 | 4 | ||||||
IAC/InterActiveCorp (Æ)(Ñ) | 7,294 | 209 | ||||||
Imation Corp. (Æ)(Ñ) | 4,000 | 41 | ||||||
Informatica Corp. (Æ)(Ñ) | 16,077 | 708 | ||||||
Infospace, Inc. (Æ)(Ñ) | 3,800 | 32 | ||||||
Ingram Micro, Inc. Class A (Æ) | 18,300 | 349 | ||||||
Insight Enterprises, Inc. (Æ)(Ñ) | 2,000 | 26 | ||||||
Integrated Device Technology, Inc. (Æ) | 22,300 | 149 | ||||||
Integrated Silicon Solution, Inc. (Æ)(Ñ) | 3,000 | 24 | ||||||
Internap Network Services Corp. (Æ)(Ñ) | 15,082 | 92 | ||||||
International Rectifier Corp. (Æ)(Ñ) | 19,816 | 588 | ||||||
Intersil Corp. Class A (Ñ) | 28,900 | 441 | ||||||
Intevac, Inc. (Æ) | 1,600 | 22 | ||||||
Kemet Corp. (Æ) | 28,100 | 410 | ||||||
Kulicke & Soffa Industries, Inc. (Æ)(Ñ) | 14,100 | 102 | ||||||
Lam Research Corp. (Æ) | 8,428 | 436 | ||||||
Lattice Semiconductor Corp. (Æ)(Ñ) | 18,510 | 112 | ||||||
Lawson Software, Inc. (Æ) | 32,610 | 302 | ||||||
LSI Corp. (Æ) | 62,500 | 374 | ||||||
MEMC Electronic Materials, Inc. (Æ)(Ñ) | 14,426 | 162 | ||||||
Methode Electronics, Inc. (Ñ) | 22,900 | 297 | ||||||
MICROS Systems, Inc. (Æ) | 14,013 | 616 | ||||||
Microsemi Corp. (Æ) | 22,721 | 520 | ||||||
MIPS Technologies, Inc. Class A (Æ)(Ñ) | 33,450 | 507 | ||||||
Molex, Inc. (Ñ) | 16,400 | 373 | ||||||
Motricity, Inc. (Æ)(Ñ) | 21,071 | 391 | ||||||
Multi-Fineline Electronix, Inc. (Æ)(Ñ) | 8,746 | 232 | ||||||
Netlogic Microsystems, Inc. (Æ)(Ñ) | 8,241 | 259 | ||||||
NICE Systems, Ltd. - ADR (Æ) | 18,173 | 635 | ||||||
Novatel Wireless, Inc. (Æ) | 10,500 | 100 | ||||||
Novellus Systems, Inc. (Æ) | 22,800 | 738 | ||||||
Omnivision Technologies, Inc. (Æ)(Ñ) | 1,886 | 56 | ||||||
PMC - Sierra, Inc. (Æ) | 33,694 | 289 | ||||||
Polycom, Inc. (Æ)(Ñ) | 8,346 | 325 | ||||||
Powerwave Technologies, Inc. (Æ) | 26,000 | 66 | ||||||
Radisys Corp. (Æ)(Ñ) | 1,900 | 17 | ||||||
RealNetworks, Inc. (Æ)(Ñ) | 15,100 | 63 | ||||||
RightNow Technologies, Inc. (Æ) | 3,583 | 85 | ||||||
Rovi Corp. (Æ)(Ñ) | 14,940 | 927 | ||||||
Rudolph Technologies, Inc. (Æ)(Ñ) | 2,000 | 16 | ||||||
SBA Communications Corp. Class A (Æ)(Ñ) | 13,279 | 544 | ||||||
Seachange International, Inc. (Æ)(Ñ) | 4,400 | 38 | ||||||
Sigma Designs, Inc. (Æ)(Ñ) | 4,900 | 69 | ||||||
Silicon Graphics International Corp. (Æ) | 700 | 6 | ||||||
Silicon Image, Inc. (Æ) | 26,900 | 198 | ||||||
Skyworks Solutions, Inc. (Æ)(Ñ) | 24,060 | 689 | ||||||
Smith Micro Software, Inc. (Æ)(Ñ) | 17,328 | 273 | ||||||
Sourcefire, Inc. (Æ)(Ñ) | 19,390 | 503 | ||||||
Standard Microsystems Corp. (Æ)(Ñ) | 3,300 | 95 | ||||||
SuccessFactors, Inc. (Æ)(Ñ) | 27,401 | 793 | ||||||
Symmetricom, Inc. (Æ) | 3,000 | 21 | ||||||
Synchronoss Technologies, Inc. (Æ)(Ñ) | 12,190 | 326 | ||||||
SYNNEX Corp. (Æ)(Ñ) | 3,100 | 97 | ||||||
| Principal Amount ($) or Shares | Market Value $ | |||||||
Synopsys, Inc. (Æ)(Ñ) | 14,800 | 398 | ||||||
Taleo Corp. Class A (Æ)(Ñ) | 12,220 | 338 | ||||||
Tech Data Corp. (Æ) | 6,300 | 277 | ||||||
Tekelec (Æ) | 8,100 | 96 | ||||||
TeleCommunication Systems, Inc. | 6,500 | 30 | ||||||
Tellabs, Inc. | 35,500 | 241 | ||||||
Tier Technologies, Inc. Class B (Æ) | 21,377 | 128 | ||||||
Trident Microsystems, Inc. (Æ) | 7,800 | 14 | ||||||
TTM Technologies, Inc. (Æ)(Ñ) | 3,400 | 51 | ||||||
United Online, Inc. (Ñ) | 100,657 | 664 | ||||||
Varian Semiconductor Equipment Associates, Inc. (Æ) | 12,537 | 463 | ||||||
VeriFone Systems, Inc. (Æ)(Ñ) | 12,386 | 477 | ||||||
Verint Systems, Inc. (Æ) | 5,209 | 165 | ||||||
Vishay Intertechnology, Inc. (Æ)(Ñ) | 13,776 | 202 | ||||||
Zoran Corp. (Æ) | 5,300 | 47 | ||||||
| 28,021 | ||||||||
| Utilities - 5.2% | ||||||||
AGL Resources, Inc. | 11,400 | 408 | ||||||
Allete, Inc. (Ñ) | 12,000 | 447 | ||||||
Approach Resources, Inc. (Æ)(Ñ) | 24,487 | 567 | ||||||
Atmos Energy Corp. (Ñ) | 9,700 | 303 | ||||||
Black Hills Corp. (Ñ) | 13,100 | 393 | ||||||
California Water Service Group (Ñ) | 7,500 | 280 | ||||||
Central Vermont Public Service Corp. (Ñ) | 900 | 20 | ||||||
Chesapeake Utilities Corp. (Ñ) | 1,200 | 50 | ||||||
Clayton Williams Energy, Inc. (Æ)(Ñ) | 500 | 42 | ||||||
DPL, Inc. (Ñ) | 2,800 | 72 | ||||||
El Paso Electric Co. (Æ) | 31,700 | 873 | ||||||
Energen Corp. | 7,800 | 376 | ||||||
GenOn Energy, Inc. (Æ)(Ñ) | 7,654 | 29 | ||||||
Georesources, Inc. (Æ)(Ñ) | 2,000 | 44 | ||||||
Great Plains Energy, Inc. (Ñ) | 10,100 | 196 | ||||||
Idacorp, Inc. | 5,800 | 214 | ||||||
Integrys Energy Group, Inc. (Ñ) | 3,700 | 179 | ||||||
Laclede Group, Inc. (The)(Ñ) | 1,600 | 58 | ||||||
MDU Resources Group, Inc. | 11,600 | 235 | ||||||
NII Holdings, Inc. (Æ) | 9,406 | 420 | ||||||
NiSource, Inc. (Ñ) | 29,300 | 517 | ||||||
NorthWestern Corp. | 2,300 | 66 | ||||||
NV Energy, Inc. | 21,400 | 301 | ||||||
OGE Energy Corp. (Ñ) | 6,600 | 300 | ||||||
Ormat Technologies, Inc. (Ñ) | 11,900 | 352 | ||||||
Otter Tail Corp. (Ñ) | 15,200 | 343 | ||||||
Pinnacle West Capital Corp. | 8,400 | 348 | ||||||
PNM Resources, Inc. (Ñ) | 16,100 | 210 | ||||||
Portland General Electric Co. | 28,500 | 618 | ||||||
Questar Corp. (Ñ) | 3,200 | 56 | ||||||
Southern Union Co. | 3,600 | 87 | ||||||
Southwest Gas Corp. (Ñ) | 6,200 | 227 | ||||||
Telephone & Data Systems, Inc. (Ñ) | 5,800 | 212 | ||||||
UGI Corp. (Ñ) | 12,100 | 382 | ||||||
UIL Holdings Corp. (Ñ) | 5,600 | 168 | ||||||
US Cellular Corp. (Æ)(Ñ) | 2,300 | 115 | ||||||
USA Mobility, Inc. (Ñ) | 2,200 | 39 | ||||||
| Aggressive Equity Fund | 31 |
Table of Contents
Russell Investment Funds
Aggressive Equity Fund
Schedule of Investments, continued — December 31, 2010
Amounts in thousands (except share amounts)
| Principal Amount ($) or Shares | Market Value $ | |||||||
Vaalco Energy, Inc. (Æ) | 7,900 | 57 | ||||||
Vectren Corp. | 7,700 | 195 | ||||||
W&T Offshore, Inc. (Ñ) | 8,300 | 148 | ||||||
Warren Resources, Inc. (Æ)(Ñ) | 11,700 | 53 | ||||||
| 10,000 | ||||||||
| Total Common Stocks (cost $146,934) | 182,796 | |||||||
| Short-Term Investments - 4.5% | ||||||||
Russell U.S. Cash Management Fund | 8,699,200 | (¥) | 8,699 | |||||
| Total Short-Term Investments (cost $8,699) | 8,699 | |||||||
| Other Securities - 38.6% | ||||||||
Russell Investment Funds Liquidating Trust (×) | 2,947,920 | (¥) | 2,948 | |||||
Russell U.S. Cash Collateral Fund (×) | 71,139,132 | (¥) | 71,139 | |||||
| Total Other Securities (cost $74,087) | 74,087 | |||||||
| Total Investments - 138.5% (identified cost $229,720) | 265,582 | |||||||
| Other Assets and Liabilities, Net - (38.5%) | (73,819 | ) | ||||||
| Net Assets - 100.0% | 191,763 | |||||||
See accompanying notes which are an integral part of the financial statements.
| 32 | Aggressive Equity Fund |
Table of Contents
Russell Investment Funds
Aggressive Equity Fund
Schedule of Investments, continued — December 31, 2010
Amounts in thousands (except share amounts)
| Futures Contracts | Number of Contracts | Notional Amount | Expiration Date | Unrealized Appreciation (Depreciation) $ | ||||||||||||||
| Long Positions | ||||||||||||||||||
Russell 2000 Mini Index Futures (CME) | 114 | USD | 8,918 | 03/11 | 122 | |||||||||||||
Total Unrealized Appreciation (Depreciation) on Open Futures Contracts | 122 | |||||||||||||||||
Presentation of Portfolio Holdings — December 31, 2010
Amounts in thousands
| Market Value | % of Net Assets | |||||||||||||||||||
| Portfolio Summary | Level 1 | Level 2 | Level 3 | Total | ||||||||||||||||
Common Stocks | ||||||||||||||||||||
Consumer Discretionary | $ | 23,307 | $ | — | $ | — | $ | 23,307 | 12.2 | |||||||||||
Consumer Staples | 4,245 | — | — | 4,245 | 2.2 | |||||||||||||||
Energy | 9,808 | — | — | 9,808 | 5.1 | |||||||||||||||
Financial Services | 32,708 | — | — | 32,708 | 17.1 | |||||||||||||||
Health Care | 19,359 | — | — | 19,359 | 10.1 | |||||||||||||||
Materials and Processing | 15,696 | — | — | 15,696 | 8.2 | |||||||||||||||
Producer Durables | 39,652 | — | — | 39,652 | 20.7 | |||||||||||||||
Technology | 28,021 | — | — | 28,021 | 14.6 | |||||||||||||||
Utilities | 10,000 | — | — | 10,000 | 5.2 | |||||||||||||||
Short-Term Investments | — | 8,699 | — | 8,699 | 4.5 | |||||||||||||||
Other Securities | — | 74,087 | — | 74,087 | 38.6 | |||||||||||||||
Total Investments | 182,796 | 82,786 | — | 265,582 | 138.5 | |||||||||||||||
Other Assets and Liabilities, Net | (38.5 | ) | ||||||||||||||||||
| 100.0 | ||||||||||||||||||||
Other Financial Instruments | ||||||||||||||||||||
Futures Contracts | 122 | — | — | 122 | 0.1 | |||||||||||||||
Total Other Financial Instruments* | 122 | — | — | 122 | ||||||||||||||||
| * | Other financial instruments reflected in the Schedule of Investments, such as futures, forwards, and swap contracts which are valued at the unrealized appreciation/depreciation on the instruments. |
For a description of the levels see note 2 in the Notes to Financial Statements.
See accompanying notes which are an integral part of the financial statements.
| Aggressive Equity Fund | 33 |
Table of Contents
Russell Investment Funds
Aggressive Equity Fund
Fair Value of Derivative Instruments — December 31, 2010
Amounts in thousands
| Derivatives not accounted for as hedging instruments | Equity Contracts | |||
Location: Statement of Assets and Liabilities - Assets | ||||
Daily variation margin on futures contracts* | $ | 122 | ||
| Derivatives not accounted for as hedging instruments | Equity Contracts | |||
Location: Statement of Operations - Net realized gain (loss) | ||||
Futures contracts | $ | 2,062 | ||
Location: Statement of Operations - Net change in unrealized appreciation (depreciation) | ||||
Futures contracts | $ | (255 | ) | |
| * | Includes cumulative appreciation/depreciation of futures contracts as reported in Schedule of Investments. Only current day’s variation margin is reported within the statement of assets and liabilities |
For further disclosure on derivatives see note 2 in Notes to Financial Statements.
See accompanying notes which are an integral part of the financial statements.
| 34 | Aggressive Equity Fund |
Table of Contents
[This page intentionally left blank]
Table of Contents
Russell Investment Funds
Portfolio Management Discussion — December 31, 2010 (Unaudited)
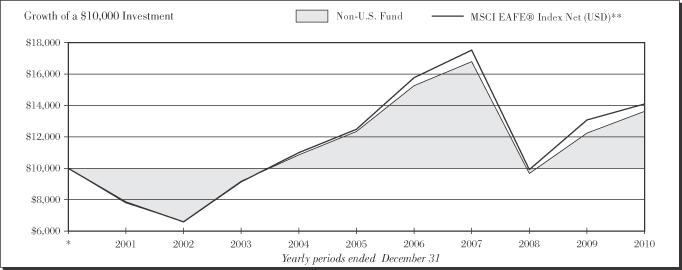
| Non-U.S. Fund | ||||
| Total Return | ||||
1 Year | 11.42 | % | ||
5 Years | 2.02 | %§ | ||
10 Years | 3.16 | %§ | ||
| MSCI EAFE® Index Net (USD)** | ||||
| Total Return | ||||
1 Year | 7.75 | % | ||
5 Years | 2.46 | %§ | ||
10 Years | 3.50 | %§ | ||
| 36 | Non-U.S. Fund |
Table of Contents
Russell Investment Funds
Non-U.S. Fund
Portfolio Management Discussion — December 31, 2010 (Unaudited)
The Non-U.S. Fund (the “Fund”) allocates most of its assets among multiple money managers. Russell Investment Management Company (“RIMCo”), as the Fund’s advisor, may change the allocation of the Fund’s assets among money managers at any time. An exemptive order from the Securities and Exchange Commission (“SEC”) permits RIMCo to engage or terminate a money manager at any time, subject to approval by the Fund’s Board without a shareholder vote. Pursuant to the terms of the exemptive order, the Fund is required to notify its shareholders within 60 days of when a new money manager begins providing services. The Fund currently has four money managers.
What is the Fund’s investment objective?
The Fund seeks to provide long-term capital growth.
How did the Fund perform relative to its benchmark for the fiscal year ended December 31, 2010?
For the fiscal year ended December 31, 2010, the Non-U.S. Fund gained 11.42%. This compared to its benchmark, the MSCI EAFE® Index (net of tax on dividends from foreign holdings), which returned 7.75% over the same period. The Fund’s performance includes operating expenses, whereas index returns are unmanaged and do not include expenses of any kind.
For the fiscal year ended December 31, 2010, the Lipper® International Core Funds (VIP) Average returned 9.40%. This average return serves as a peer comparison and is expressed net of operating expenses.
How did the market conditions described in the Market Summary report affect the Fund’s performance?
In 2010, the Fund outperformed its benchmark by 3.67%. Growth managers Marsico Capital Management, LLC (“Marsico”) and MFS Institutional Advisors, Inc. (“MFS”) were the best performers, although all four of the Fund’s managers out-performed the MSCI EAFE Index over the fiscal year. Growth managers were best able to capture market trends that favored stocks with strong earnings growth potential, as measured by analysts’ earnings forecasts.
The Fund was well positioned to take advantage of the volatile market conditions in 2010. Collectively, the money managers’ preferred quality balance sheets, which boosted performance in a market where investors were skeptical of companies with high debt levels. Stocks with high financial leverage, as measured by debt/capital ratios, were the worst performers in the MSCI EAFE Index and the Fund was underweight to such stocks.
Spain was one of the worst performing countries during the fiscal year, losing 22% as measured by the MSCI EAFE Index. During the fiscal year, the Fund had only about 2% allocated to the country and was underweight in many of the country’s financial stocks, such as Banco Bilbao Vizcaya Argentaria and Banco Santander, that performed the worst on a relative basis. This contributed significantly to the Fund’s outperformance during 2010. In addition, the Fund had no exposure to Greece
which, with a return of -45%, was the worst performing country in the index during the fiscal year. The PIIGS countries (Portugal, Ireland, Italy, Greece and Spain) lagged the broader market in 2010 due to sovereign debt issues that threatened to derail the financial system. The Fund was underweight all of the above markets, except for Italy. The Fund was overweight Italy relative to the MSCI EAFE Index by approximately 0.4%, with an average allocation of 3.4%. Italy was the only one of the five above-named markets to detract from the Fund’s performance.
Exposure to stocks in non-index countries, such as Canada and certain emerging markets countries, also contributed positively to performance relative to the MSCI EAFE Index. Three holdings in Canada were particularly helpful. An allocation of over 1% to the stock Canadian National Railway resulted in strong positive contribution, making it among the top 10 positive contributing stocks in the Fund. There were 6 Canadian stocks held in the Fund during the course of the year, but none were as substantial or beneficial as Canadian National Railway, which benefited along with other economically sensitive stocks in the industrials sector. The Fund had an average allocation of 7.7% to emerging markets stocks, which was a positive, given the relative strength versus developed markets stocks. The money managers allocated slightly more than 1% of the Fund’s assets to stocks in China, India and Brazil. Emerging markets exposure remained stable over the course of the year. Growth managers maintained an optimistic view of emerging markets stocks, while value managers were skeptical of high valuations and their prolonged outperformance.
The Fund’s biggest detractor to performance relative to the MSCI EAFE Index came from its underweight to the materials sector, which returned just under 18% during the year. The underweight reflected money managers concern that commodity prices have accelerated too quickly and companies who have outperformed will be unable to sustain such strong relative performance.
How did the investment strategies and techniques employed by the Fund and its money managers affect its performance?
Investment strategies that favored small capitalization stocks with high prospects for earnings growth and low financial leverage performed best during the period. Stocks with high price momentum and high valuations generally outperformed the Fund’s benchmark. The best performing market factor was high beta, which is a factor that describes stocks that perform better than the broader market when it has a positive return. Investment strategies that were able to avoid the financial turmoil in the PIIGS countries also performed well.
Money managers’ positioning translated into strong performance at the Fund level. While the Fund was neutral in terms of its exposure to growth, it benefited significantly from its underweight to financial leverage and overweight to price
| Non-U.S. Fund | 37 |
Table of Contents
Russell Investment Funds
Non-U.S. Fund
Portfolio Management Discussion — December 31, 2010 (Unaudited)
momentum as compared to the Fund’s benchmark. Country positioning was also favorable. In addition to the beneficial market environment, it was the money managers’ stock selection within sectors and countries that positively impacted the Fund’s relative performance most significantly. It was a unique fiscal year in which all four of the Fund’s money managers outperformed the Fund’s benchmark.
Marsico was the best performing money manager in the Fund, out-pacing the MSCI EAFE Index by about 7% during the fiscal year. In addition to high exposure to growth, emerging markets and price momentum, Marsico’s stock selection was significantly positive. Strong stock selection in the consumer discretionary sector contributed significantly where the Fund’s overweight was backed by gains from a position in Swiss luxury goods company Swatch.
MFS outperformed the MSCI EAFE Index by about 4% during the fiscal year. Its quality-growth strategy favored stocks with strong earnings growth and low financial leverage, particularly stocks with high growth prospects due to emerging markets demand. LVMH Moet Hennessy Louis Vuitton was the top contributor in MFS’s portfolio. It is a good example of a luxury goods stock in the consumer discretionary sector that benefited from growing demand from emerging markets countries. MFS’s underweight to the financials sector and strong stock selection that underweighted commercial banks in favor of capital markets stocks like Julius Baer Group also helped relative performance.
Barrow Hanley’s outperformed the MSCI EAFE Index by over 5%. Its small capitalization stock exposure was a positive tailwind during the year. Barrow’s strongest gains came from stock selection in the industrials and technology sectors. Its large overweight in Georg Fischer, a Swiss manufacturer of piping components, resulted in the biggest single stock contributor to relative performance. The company benefited from higher expectations in growth for manufacturing.
Pzena Investment Management, LLC (“Pzena”) outperformed the MSCI EAFE Index by just over 3% during the period. Pzena had the deepest value exposure of all the Fund’s money managers and was overweight to the underperforming financials sector. However, strong stock selection allowed it to overcome less than ideal style exposure. Pzena’s biggest gains came from stock selection and a 7% overweight to the technology sector. The two top contributing stocks in Pzena’s portfolio came from the technology sector: OMRON Corp and Tyco Electronics. Within the financials sector, the portfolio’s lack of exposure to Spanish bank, Banco Santander S.A., also contributed positively to relative performance.
Describe any changes to the Fund’s structure or the money manager line-up.
There were no changes to the Fund’s structure or money manager line-up during the year.
| Money Managers as of December 31, 2010 | Styles | |
| Barrow Hanley Mewhinney & Strauss, Inc. | Value | |
| Marsico Capital Management, LLC | Growth | |
| MFS Institutional Advisors, Inc. | Growth | |
| Pzena Investment Management, LLC | Value | |
The views expressed in this report reflect those of the portfolio managers only through the end of the period covered by the report. These views do not necessarily represent the views of RIMCo, or any other person in RIMCo or any other affiliated organization. These views are subject to change at any time based upon market conditions or other events, and RIMCo disclaims any responsibility to update the views contained herein. These views should not be relied on as investment advice and, because investment decisions for Russell Investment Funds (“RIF”) are based on numerous factors, should not be relied on as an indication of investment decisions of any RIF Fund.
| * | Assumes initial investment on January 1, 2001. |
| ** | Morgan Stanley Capital International Europe, Australia, Far East (MSCI EAFE®) Index Net (USD) is an index, with dividends reinvested, representative of the securities markets of 20 developed countries in Europe, Australasia and the Far East. |
| § | Annualized. |
The performance shown in this section does not reflect any Insurance Company Separate Account or Policy Charges. Performance is historical and assumes reinvestment of all dividends and capital gains. Investment return and principal value will fluctuate so that an investor’s shares, when redeemed, may be worth more or less than when purchased. Past performance is not indicative of future results.
| 38 | Non-U.S. Fund |
Table of Contents
Russell Investment Funds
Non-U.S. Fund
Shareholder Expense Example — December 31, 2010 (Unaudited)
Fund Expenses
The following disclosure provides important information regarding each Fund’s Expense Example, which appears on each Fund’s individual page in this Annual Report. Please refer to this information when reviewing the Expense Example for a Fund.
Example
As a shareholder of the Fund, you incur two types of costs: (1) transaction costs, and (2) ongoing costs, including advisory fees and other Fund expenses. The Example is intended to help you understand your ongoing costs (in dollars) of investing in the Fund and to compare these costs with the ongoing costs of investing in other mutual funds. The Example is based on an investment of $1,000 invested at the beginning of the period and held for the entire period indicated, which for this Fund is from July 1, 2010 to December 31, 2010.
Actual Expenses
The information in the table under the heading “Actual Performance” provides information about actual account values and actual expenses. You may use the information in this column, together with the amount you invested, to estimate the expenses that you paid over the period. Simply divide your account value by $1,000 (for example, an $8,600 account value divided by $1,000 = 8.6), then multiply the result by the number in the first column in the row entitled “Expenses Paid During Period” to estimate the expenses you paid on your account during this period.
Hypothetical Example for Comparison Purposes
The information in the table under the heading “Hypothetical Performance (5% return before expenses)” provides information about hypothetical account values and hypothetical expenses based on the Fund’s actual expense ratio and an assumed rate
of return of 5% per year before expenses, which is not the Fund’s actual return. The hypothetical account values and expenses may not be used to estimate the actual ending account balance or expenses you paid for the period. You may use this information to compare the ongoing costs of investing in the Fund and other funds. To do so, compare this 5% hypothetical example with the 5% hypothetical examples that appear in the shareholder reports of other funds.
Please note that the expenses shown in the table are meant to highlight your ongoing costs only and do not reflect any transactional costs. Therefore, the information under the heading “Hypothetical Performance (5% return before expenses)” is useful in comparing ongoing costs only, and will not help you determine the relative total costs of owning different funds. In addition, if these transactional costs were included, your costs would have been higher. The fee and expenses shown in this section do not reflect any Insurance Company Separate Account or Policy Charges.
Core Class | Actual Performance | Hypothetical Performance (5% return before expenses) | ||||||
Beginning Account Value July 1, 2010 | $ | 1,000.00 | $ | 1,000.00 | ||||
Ending Account Value | $ | 1,262.10 | $ | 1,019.96 | ||||
Expenses Paid During Period* | $ | 5.93 | $ | 5.30 | ||||
| * | Expenses are equal to the Fund’s annualized expense ratio of 1.04% (representing the six month period annualized), multiplied by the average account value over the period, multiplied by 184/365 (to reflect the one-half year period). May reflect amounts waived, reimbursed and/or other credits. Without any waivers, reimbursements and/or other credits, expenses would have been higher. |
| Non-U.S. Fund | 39 |
Table of Contents
Russell Investment Funds
Non-U.S. Fund
Schedule of Investments — December 31, 2010
Amounts in thousands (except share amounts)
| Principal Amount ($) or Shares | Market Value $ | |||||||
| Common Stocks - 92.7% | ||||||||
| Australia - 0.5% | ||||||||
Billabong International, Ltd. (Ñ) | 175,800 | 1,465 | ||||||
Westpac Banking Corp. | 20,750 | 471 | ||||||
| 1,936 | ||||||||
| Austria - 0.1% | ||||||||
Erste Group Bank AG | 11,177 | 525 | ||||||
| Belgium - 0.7% | ||||||||
Anheuser-Busch InBev NV Class 2 | 31,116 | 1,778 | ||||||
KBC Groep NV (Æ) | 17,798 | 608 | ||||||
| 2,386 | ||||||||
| Bermuda - 2.2% | ||||||||
Esprit Holdings, Ltd. | 157,900 | 751 | ||||||
Jardine Matheson Holdings, Ltd. | 68,900 | 3,028 | ||||||
Li & Fung, Ltd. | 626,000 | 3,629 | ||||||
RenaissanceRe Holdings, Ltd. | 13,200 | 841 | ||||||
| 8,249 | ||||||||
| Brazil - 2.1% | ||||||||
Anhanguera Educacional Participacoes SA | 21,500 | 518 | ||||||
Banco Santander Brasil SA - ADR | 44,840 | 610 | ||||||
BR Malls Participacoes SA | 161,800 | 1,667 | ||||||
OGX Petroleo e Gas Participacoes SA (Æ) | 259,800 | 3,131 | ||||||
PDG Realty SA Empreendimentos e Participacoes | 265,900 | 1,628 | ||||||
| 7,554 | ||||||||
| Canada - 1.5% | ||||||||
Canadian National Railway Co. (Þ) | 66,234 | 4,403 | ||||||
Teck Resources, Ltd. Class B | 19,343 | 1,202 | ||||||
| 5,605 | ||||||||
| Cayman Islands - 0.2% | ||||||||
Baidu, Inc. - ADR (Æ) | 6,791 | 656 | ||||||
| China - 0.5% | ||||||||
Ping An Insurance Group Co. of China, Ltd. Class H | 171,500 | 1,917 | ||||||
| Czech Republic - 0.2% | ||||||||
Komercni Banka AS | 2,759 | 653 | ||||||
| Denmark - 1.2% | ||||||||
Danske Bank A/S (Æ) | 26,851 | 688 | ||||||
Novo Nordisk A/S Class B | 16,896 | 1,902 | ||||||
Novozymes A/S Class B (Ñ) | 5,486 | 764 | ||||||
Pandora A/S (Æ) | 15,111 | 911 | ||||||
| 4,265 | ||||||||
| Finland - 0.7% | ||||||||
Fortum OYJ | 26,700 | 810 | ||||||
Pohjola Bank PLC Class A | 142,425 | 1,707 | ||||||
| 2,517 | ||||||||
| Principal Amount ($) or Shares | Market Value $ | |||||||
| France - 9.1% | ||||||||
Accor SA | 32,888 | 1,466 | ||||||
Air France-KLM | 48,506 | 885 | ||||||
Air Liquide SA Class A | 13,962 | 1,766 | ||||||
AXA SA - ADR | 22,414 | 374 | ||||||
BNP Paribas | 13,727 | 876 | ||||||
Capital Gemini SA | 25,000 | 1,169 | ||||||
CNP Assurances | 39,164 | 708 | ||||||
Credit Agricole SA | 80,710 | 1,027 | ||||||
Danone | 20,233 | 1,271 | ||||||
GDF Suez | 30,200 | 1,086 | ||||||
Lagardere SCA | 20,281 | 836 | ||||||
Legrand SA - ADR | 20,057 | 817 | ||||||
LVMH Moet Hennessy Louis Vuitton | 18,822 | 3,096 | ||||||
Natixis (Æ) | 72,658 | 340 | ||||||
Pernod-Ricard SA | 26,225 | 2,469 | ||||||
Publicis Groupe SA - ADR | 34,527 | 1,801 | ||||||
Rallye SA | 46,885 | 2,018 | ||||||
Safran SA | 11,328 | 401 | ||||||
Sanofi-Aventis SA - ADR | 26,882 | 1,726 | ||||||
Schneider Electric SA | 33,787 | 5,059 | ||||||
SCOR SE - ADR | 38,980 | 990 | ||||||
Total SA | 14,563 | 773 | ||||||
UBISOFT Entertainment (Æ)(Ñ) | 87,645 | 936 | ||||||
Vivendi SA - ADR | 57,700 | 1,560 | ||||||
| 33,450 | ||||||||
| Germany - 8.0% | ||||||||
Adidas AG | 12,652 | 826 | ||||||
BASF SE | 31,084 | 2,480 | ||||||
Bayer AG | 21,622 | 1,598 | ||||||
Beiersdorf AG | 21,963 | 1,219 | ||||||
Daimler AG (Æ) | 18,292 | 1,240 | ||||||
Deutsche Boerse AG | 15,906 | 1,101 | ||||||
E.ON AG | 37,700 | 1,156 | ||||||
Henkel AG & Co. KGaA | 7,262 | 375 | ||||||
Infineon Technologies AG - ADR (Æ) | 49,879 | 464 | ||||||
Linde AG | 24,154 | 3,665 | ||||||
MAN SE | 21,469 | 2,553 | ||||||
Merck & Co., Inc. | 10,986 | 879 | ||||||
Metro AG | 17,530 | 1,262 | ||||||
MTU Aero Engines Holding AG | 39,071 | 2,641 | ||||||
Muenchener Rueckversicherungs AG | 4,599 | 698 | ||||||
SAP AG - ADR | 14,004 | 713 | ||||||
Siemens AG | 23,932 | 2,962 | ||||||
ThyssenKrupp AG - ADR | 31,253 | 1,295 | ||||||
Volkswagen AG (Ñ) | 16,680 | 2,359 | ||||||
| 29,486 | ||||||||
| Hong Kong - 0.9% | ||||||||
AIA Group, Ltd. (Æ) | 76,000 | 214 | ||||||
China Unicom Hong Kong, Ltd. (Ñ) | 516,000 | 736 | ||||||
CNOOC, Ltd. | 592,000 | 1,409 | ||||||
Hang Lung Properties, Ltd. - ADR | 230,000 | 1,075 | ||||||
| 3,434 | ||||||||
| 40 | Non-U.S. Fund |
Table of Contents
Russell Investment Funds
Non-U.S. Fund
Schedule of Investments, continued — December 31, 2010
Amounts in thousands (except share amounts)
| Principal Amount ($) or Shares | Market Value $ | |||||||
| India - 1.5% | ||||||||
ICICI Bank, Ltd. - ADR | 76,664 | 3,883 | ||||||
Infosys Technologies, Ltd. - ADR | 21,310 | 1,621 | ||||||
| 5,504 | ||||||||
| Indonesia - 0.1% | ||||||||
Astra International Tbk PT | 73,500 | 445 | ||||||
| Ireland - 0.3% | ||||||||
Accenture PLC Class A | 21,400 | 1,038 | ||||||
| Israel - 0.6% | ||||||||
Teva Pharmaceutical Industries, Ltd. - ADR | 41,327 | 2,154 | ||||||
| Italy - 2.4% | ||||||||
ENI SpA -ADR | 60,207 | 1,316 | ||||||
Finmeccanica SpA | 193,047 | 2,195 | ||||||
Parmalat SpA | 728,570 | 1,995 | ||||||
Snam Rete Gas SpA | 298,425 | 1,484 | ||||||
UniCredit SpA | 618,941 | 1,280 | ||||||
Unione di Banche Italiane SCPA | 78,220 | 685 | ||||||
| 8,955 | ||||||||
| Japan - 13.1% | ||||||||
Aeon Credit Service Co., Ltd. (Ñ) | 14,400 | 203 | ||||||
Amada Co., Ltd. | 149,700 | 1,217 | ||||||
Canon, Inc. (Ñ) | 127,200 | 6,523 | ||||||
Dai-ichi Life Insurance Co., Ltd. (The) | 500 | 811 | ||||||
Daikin Industries, Ltd. | 15,000 | 532 | ||||||
Dena Co., Ltd. (Ñ) | 26,200 | 939 | ||||||
Denso Corp. | 21,800 | 752 | ||||||
FamilyMart Co., Ltd. | 28,900 | 1,089 | ||||||
Fanuc, Ltd. | 11,500 | 1,764 | ||||||
Hirose Electric Co., Ltd. | 1,600 | 180 | ||||||
Honda Motor Co., Ltd. (Ñ) | 42,000 | 1,660 | ||||||
Hoya Corp. | 64,900 | 1,575 | ||||||
Inpex Corp. | 243 | 1,421 | ||||||
ITOCHU Corp. | 208,600 | 2,110 | ||||||
Japan Tobacco, Inc. (Ñ) | 296 | 1,094 | ||||||
Komatsu, Ltd. | 64,500 | 1,950 | ||||||
Konica Minolta Holdings, Inc. | 43,500 | 452 | ||||||
Lawson, Inc. | 20,800 | 1,029 | ||||||
Mabuchi Motor Co., Ltd. (Ñ) | 29,300 | 1,509 | ||||||
Marubeni Corp. | 182,000 | 1,279 | ||||||
Mitsubishi Chemical Holdings Corp. | 225,500 | 1,529 | ||||||
Mitsubishi UFJ Financial Group, Inc. | 138,800 | 750 | ||||||
Mizuho Financial Group, Inc. | 190,900 | 359 | ||||||
Mori Seiki Co., Ltd. (Ñ) | 74,100 | 878 | ||||||
MS&AD Insurance Group Holdings | 46,400 | 1,162 | ||||||
NGK Spark Plug Co., Ltd. | 56,000 | 858 | ||||||
Nintendo Co., Ltd. | 3,000 | 880 | ||||||
Nissan Motor Co., Ltd. | 93,400 | 888 | ||||||
Nomura Holdings, Inc. | 89,200 | 565 | ||||||
NTT DoCoMo, Inc. - ADR | 2,050 | 36 | ||||||
NTT DoCoMo, Inc. | 900 | 1,571 | ||||||
Omron Corp. | 30,200 | 800 | ||||||
| Principal Amount ($) or Shares | Market Value $ | |||||||
Shin-Etsu Chemical Co., Ltd. | 32,100 | 1,738 | ||||||
Sumitomo Mitsui Financial Group, Inc. | 48,400 | 1,723 | ||||||
Suzuken Co., Ltd. | 25,300 | 772 | ||||||
Takeda Pharmaceutical Co., Ltd. | 24,300 | 1,195 | ||||||
THK Co., Ltd. (Ñ) | 50,500 | 1,160 | ||||||
Toshiba TEC Corp. | 310,379 | 1,504 | ||||||
Toyota Motor Corp. | 42,900 | 1,689 | ||||||
| 48,146 | ||||||||
| Luxembourg - 0.7% | ||||||||
ArcelorMittal | 31,873 | 1,213 | ||||||
Millicom International Cellular SA | 12,810 | 1,224 | ||||||
| 2,437 | ||||||||
| Malaysia - 0.1% | ||||||||
Genting BHD - ADR | 135,900 | 493 | ||||||
| Mexico - 0.1% | ||||||||
America Movil SAB de CV - ADR | 5,430 | 311 | ||||||
| Netherlands - 6.1% | ||||||||
Aegon NV | 166,382 | 1,020 | ||||||
Akzo Nobel NV | 63,410 | 3,947 | ||||||
Brit Insurance Holdings NV (ö) | 62,259 | 1,012 | ||||||
Core Laboratories NV (Ñ) | 4,076 | 363 | ||||||
European Aeronautic Defence and Space Co. NV | 66,490 | 1,551 | ||||||
Heineken NV | 50,227 | 2,461 | ||||||
ING Groep NV (Æ) | 459,525 | 4,484 | ||||||
Koninklijke Philips Electronics NV | 52,080 | 1,595 | ||||||
LyondellBasell Industries NV Class A (Æ) | 12,860 | 442 | ||||||
Randstad Holding NV (Æ) | 20,605 | 1,088 | ||||||
Reed Elsevier NV | 93,400 | 1,157 | ||||||
Sensata Technologies Holding NV (Æ) | 28,840 | 868 | ||||||
Unilever NV | 36,450 | 1,134 | ||||||
Wolters Kluwer NV | 63,040 | 1,382 | ||||||
| 22,504 | ||||||||
| Norway - 0.8% | ||||||||
DnB NOR ASA | 137,800 | 1,934 | ||||||
Statoil ASA Class N | 43,900 | 1,043 | ||||||
| 2,977 | ||||||||
| Russia - 0.5% | ||||||||
Gazprom OAO - ADR | 69,870 | 1,766 | ||||||
| Singapore - 2.0% | ||||||||
CapitaLand, Ltd. | 354,000 | 1,027 | ||||||
Jardine Cycle & Carriage, Ltd. (Ñ) | 125,900 | 3,591 | ||||||
Keppel Corp., Ltd. - ADR | 31,000 | 273 | ||||||
Singapore Telecommunications, Ltd. | 362,000 | 860 | ||||||
United Overseas Bank, Ltd. | 112,400 | 1,594 | ||||||
| 7,345 | ||||||||
| Non-U.S. Fund | 41 |
Table of Contents
Russell Investment Funds
Non-U.S. Fund
Schedule of Investments, continued — December 31, 2010
Amounts in thousands (except share amounts)
| Principal Amount ($) or Shares | Market Value $ | |||||||
| South Africa - 0.8% | ||||||||
MTN Group, Ltd. | 107,157 | 2,186 | ||||||
Naspers, Ltd. | 14,860 | 875 | ||||||
| 3,061 | ||||||||
| South Korea - 0.4% | ||||||||
Samsung Electronics Co., Ltd. | 1,600 | 1,337 | ||||||
| Spain - 1.5% | ||||||||
Banco Santander SA - ADR | 238,732 | 2,536 | ||||||
Inditex SA | 27,592 | 2,068 | ||||||
Indra Sistemas SA (Ñ) | 30,400 | 520 | ||||||
Red Electrica Corp. SA (Ñ) | 7,263 | 341 | ||||||
| 5,465 | ||||||||
| Sweden - 1.1% | ||||||||
Assa Abloy AB Class B | 28,573 | 806 | ||||||
Skandinaviska Enskilda Banken AB Class A | 55,751 | 465 | ||||||
Svenska Cellulosa AB Class B | 46,263 | 730 | ||||||
Telefonaktiebolaget LM Ericsson Class B | 173,695 | 2,011 | ||||||
| 4,012 | ||||||||
| Switzerland - 9.4% | ||||||||
ACE, Ltd. | 19,550 | 1,217 | ||||||
Cie Financiere Richemont SA | 18,164 | 1,069 | ||||||
Clariant AG (Æ) | 53,200 | 1,079 | ||||||
Credit Suisse Group AG | 27,999 | 1,130 | ||||||
GAM Holding AG | 58,201 | 962 | ||||||
Georg Fischer AG (Æ) | 5,253 | 2,961 | ||||||
Givaudan SA | 1,006 | 1,086 | ||||||
Helvetia Holding AG | 4,615 | 1,775 | ||||||
Julius Baer Group, Ltd. | 69,814 | 3,270 | ||||||
Nestle SA | 94,533 | 5,536 | ||||||
Novartis AG | 38,700 | 2,277 | ||||||
Roche Holding AG | 13,283 | 1,947 | ||||||
Sonova Holding AG | 4,066 | 527 | ||||||
Swatch Group AG (The) Class B | 5,347 | 2,384 | ||||||
Swiss Reinsurance Co., Ltd. | 11,952 | 651 | ||||||
Tyco Electronics, Ltd. | 64,750 | 2,292 | ||||||
UBS AG (Æ) | 177,482 | 2,913 | ||||||
Zurich Financial Services AG | 5,053 | 1,309 | ||||||
| 34,385 | ||||||||
| Taiwan - 0.9% | ||||||||
Hon Hai Precision Industry Co., Ltd. (Þ) | 147,840 | 595 | ||||||
Hon Hai Precision Industry Co., Ltd. - GDR | 70,168 | 567 | ||||||
HTC Corp. | 14,200 | 438 | ||||||
Taiwan Semiconductor Manufacturing Co., Ltd. - ADR | 126,705 | 1,588 | ||||||
| 3,188 | ||||||||
| Thailand - 0.3% | ||||||||
Bangkok Bank PCL | 208,800 | 1,056 | ||||||
| Principal Amount ($) or Shares | Market Value $ | |||||||
| United Kingdom - 20.6% | ||||||||
Aegis Group PLC | 755,902 | 1,657 | ||||||
Anglo American PLC | 43,974 | 2,291 | ||||||
ARM Holdings PLC | 66,894 | 455 | ||||||
Aviva PLC | 152,921 | 941 | ||||||
BAE Systems PLC | 279,500 | 1,438 | ||||||
Barclays PLC | 1,244,116 | 5,119 | ||||||
BG Group PLC | 35,277 | 714 | ||||||
BP PLC | 525,047 | 3,847 | ||||||
BP PLC - ADR | 6,700 | 296 | ||||||
Bunzl PLC | 62,900 | 705 | ||||||
Burberry Group PLC | 44,980 | 789 | ||||||
Cable & Wireless Worldwide PLC | 1,313,900 | 1,347 | ||||||
Carillion PLC | 213,025 | 1,278 | ||||||
Compass Group PLC | 164,569 | 1,491 | ||||||
Dairy Crest Group PLC | 163,809 | 1,082 | ||||||
Diageo PLC | 110,407 | 2,045 | ||||||
Ensco PLC - ADR | 24,400 | 1,302 | ||||||
Hays PLC | 238,908 | 481 | ||||||
Home Retail Group PLC | 227,803 | 670 | ||||||
HSBC Holdings PLC | 810,607 | 8,262 | ||||||
Imperial Tobacco Group PLC | 110,747 | 3,397 | ||||||
National Grid PLC | 132,514 | 1,155 | ||||||
Reckitt Benckiser Group PLC | 74,764 | 4,112 | ||||||
Rolls-Royce Group PLC (Æ) | 88,362 | 858 | ||||||
Royal Bank of Scotland Group PLC - ADR (Æ)(Å) | 1,267,698 | 777 | ||||||
Royal Dutch Shell PLC Class A | 177,649 | 5,884 | ||||||
Sage Group PLC (The) | 473,167 | 2,019 | ||||||
Smith & Nephew PLC | 144,960 | 1,523 | ||||||
Smiths Group PLC | 53,578 | 1,041 | ||||||
Spectris PLC | 104,213 | 2,131 | ||||||
Standard Chartered PLC | 106,227 | 2,860 | ||||||
Tesco PLC | 442,630 | 2,935 | ||||||
Travis Perkins PLC | 113,950 | 1,882 | ||||||
Tullow Oil PLC | 66,929 | 1,317 | ||||||
Vodafone Group PLC - ADR | 1,718,792 | 4,476 | ||||||
William Hill PLC | 79,497 | 212 | ||||||
WPP PLC | 115,025 | 1,421 | ||||||
Xstrata PLC | 39,930 | 940 | ||||||
| 75,150 | ||||||||
| United States - 1.4% | ||||||||
MercadoLibre, Inc. (Æ) | 13,619 | 908 | ||||||
Philip Morris International, Inc. | 44,900 | 2,628 | ||||||
Synthes, Inc. (Æ)(Ñ) | 12,708 | 1,726 | ||||||
| 5,262 | ||||||||
| Virgin Islands, British - 0.1% | ||||||||
Mail.ru Group, Ltd. - GDR (Æ)(Å) | 10,389 | 357 | ||||||
| Total Common Stocks (cost $288,764) | 339,981 | |||||||
| 42 | Non-U.S. Fund |
Table of Contents
Russell Investment Funds
Non-U.S. Fund
Schedule of Investments, continued — December 31, 2010
Amounts in thousands (except share amounts)
| Principal Amount ($) or Shares | Market Value $ | |||||||
| Preferred Stocks - 0.1% | ||||||||
| Germany - 0.1% | ||||||||
Porsche Automobil Holding SE | 6,600 | 526 | ||||||
| Total Preferred Stocks (cost $393) | 526 | |||||||
| Short-Term Investments - 6.2% | ||||||||
| United States - 6.2% | ||||||||
Russell U.S. Cash Management Fund | 22,674,026 | (¥) | 22,674 | |||||
| Total Short-Term Investments (cost $22,674) | 22,674 | |||||||
| Other Securities - 4.7% | ||||||||
Russell Investment Funds Liquidating | 10,154,873 | (¥) | 10,155 | |||||
Russell U.S. Cash Collateral Fund (X) | | 7,153,147 | (¥) | 7,153 | ||||
| Total Other Securities (cost $17,308) | 17,308 | |||||||
| Total Investments - 103.7% (identified cost $329,139) | 380,489 | |||||||
| Other Assets and Liabilities, Net - (3.7%) | (13,619 | ) | ||||||
| Net Assets - 100.0% | 366,870 | |||||||
See accompanying notes which are an integral part of the financial statements.
| Non-U.S. Fund | 43 |
Table of Contents
Russell Investment Funds
Non-U.S. Fund
Schedule of Investments, continued — December 31, 2010
Amounts in thousands (except share amounts)
| Futures Contracts | Number of Contracts | Notional Amount | Expiration Date | Unrealized Appreciation (Depreciation) $ | ||||||||||||||
Long Positions | ||||||||||||||||||
ASX SPI 200 Index Futures (Australia) | 4 | AUD | 473 | 03/11 | (1 | ) | ||||||||||||
CAC-40 Index Futures (France) | 48 | EUR | 1,829 | 01/11 | (56 | ) | ||||||||||||
DAX Index Futures (Germany) | 9 | EUR | 1,559 | 03/11 | (37 | ) | ||||||||||||
EURO STOXX 50 Index Futures (EMU) | 136 | EUR | 3,800 | 03/11 | (109 | ) | ||||||||||||
FTSE-100 Index Futures (UK) | 43 | GBP | 2,534 | 03/11 | 30 | |||||||||||||
Hang Seng Index Futures (Hong Kong) | 2 | HKD | 2,302 | 01/11 | — | |||||||||||||
S&P TSE 60 Index Futures (Canada) | 10 | CAD | 1,534 | 03/11 | 3 | |||||||||||||
TOPIX Index Futures (Japan) | 80 | JPY | 716,800 | 03/11 | 181 | |||||||||||||
Total Unrealized Appreciation (Depreciation) on Open Futures Contracts | 11 | |||||||||||||||||
| Foreign Currency Exchange Contracts | ||||||||||||||||||||||
Counterparty | Amount Sold | Amount Bought | Settlement | Unrealized Appreciation (Depreciation) $ | ||||||||||||||||||
Bank of America | USD | 1,524 | AUD | 1,500 | 03/16/11 | (3 | ) | |||||||||||||||
Bank of America | EUR | 500 | USD | 656 | 03/16/11 | (6 | ) | |||||||||||||||
Bank of America | GBP | 100 | USD | 154 | 03/16/11 | (1 | ) | |||||||||||||||
Barclays Bank PLC | USD | 1,604 | EUR | 1,212 | 03/16/11 | 15 | ||||||||||||||||
Barclays Bank PLC | USD | 821 | GBP | 524 | 03/16/11 | (4 | ) | |||||||||||||||
BNP Paribas | USD | 821 | GBP | 524 | 03/16/11 | (5 | ) | |||||||||||||||
BNP Paribas | USD | 1,390 | JPY | 115,000 | 03/16/11 | 22 | ||||||||||||||||
Brown Brothers Harriman & Co. | USD | 36 | GBP | 23 | 01/04/11 | — | ||||||||||||||||
Brown Brothers Harriman & Co. | USD | 44 | GBP | 29 | 01/04/11 | — | ||||||||||||||||
Brown Brothers Harriman & Co. | USD | 29 | GBP | 19 | 01/05/11 | — | ||||||||||||||||
Brown Brothers Harriman & Co. | USD | 260 | GBP | 168 | 01/05/11 | 3 | ||||||||||||||||
Brown Brothers Harriman & Co. | USD | 471 | GBP | 305 | 01/05/11 | 5 | ||||||||||||||||
Brown Brothers Harriman & Co. | EUR | 190 | USD | 252 | 01/05/11 | (2 | ) | |||||||||||||||
Brown Brothers Harriman & Co. | EUR | 351 | USD | 466 | 01/05/11 | (3 | ) | |||||||||||||||
Credit Suisse First Boston | EUR | 100 | USD | 131 | 03/16/11 | (2 | ) | |||||||||||||||
Credit Suisse First Boston | GBP | 130 | USD | 200 | 03/16/11 | (3 | ) | |||||||||||||||
Credit Suisse First Boston | JPY | 30,000 | USD | 366 | 03/16/11 | (4 | ) | |||||||||||||||
Deutsche Bank AG | USD | 981 | EUR | 750 | 03/16/11 | 21 | ||||||||||||||||
Deutsche Bank AG | USD | 1,604 | EUR | 1,212 | 03/16/11 | 14 | ||||||||||||||||
Deutsche Bank AG | USD | 386 | GBP | 250 | 03/16/11 | 4 | ||||||||||||||||
Deutsche Bank AG | USD | 1,390 | JPY | 115,000 | 03/16/11 | 27 | ||||||||||||||||
HSBC Bank PLC | USD | 1,605 | EUR | 1,212 | 03/16/11 | 14 | ||||||||||||||||
HSBC Bank PLC | USD | 358 | JPY | 30,000 | 03/16/11 | 12 | ||||||||||||||||
HSBC Bank PLC | USD | 1,390 | JPY | 115,000 | 03/16/11 | 27 | ||||||||||||||||
JP Morgan Chase Bank | USD | 327 | EUR | 250 | 03/16/11 | 7 | ||||||||||||||||
JP Morgan Chase Bank | USD | 1,605 | EUR | 1,212 | 03/16/11 | 14 | ||||||||||||||||
JP Morgan Chase Bank | USD | 821 | GBP | 524 | 03/16/11 | (4 | ) | |||||||||||||||
JP Morgan Chase Bank | USD | 10 | JPY | 846 | 01/04/11 | — | ||||||||||||||||
JP Morgan Chase Bank | USD | 1,390 | JPY | 115,000 | 03/16/11 | 26 | ||||||||||||||||
JP Morgan Chase Bank | JPY | 6,570 | USD | 80 | 01/05/11 | — | ||||||||||||||||
Mellon Bank | USD | 821 | GBP | 524 | 03/16/11 | (4 | ) | |||||||||||||||
Mellon Bank | USD | 1,390 | JPY | 115,000 | 03/16/11 | 27 | ||||||||||||||||
Royal Bank of Canada | USD | 1,604 | EUR | 1,212 | 03/16/11 | 15 | ||||||||||||||||
Royal Bank of Canada | USD | 821 | GBP | 524 | 03/16/11 | (4 | ) | |||||||||||||||
Royal Bank of Canada | USD | 1,390 | JPY | 115,000 | 03/16/11 | 26 | ||||||||||||||||
Royal Bank of Scotland PLC | GBP | 700 | USD | 1,095 | 03/16/11 | 5 | ||||||||||||||||
See accompanying notes which are an integral part of the financial statements.
| 44 | Non-U.S. Fund |
Table of Contents
Russell Investment Funds
Non-U.S. Fund
Schedule of Investments, continued — December 31, 2010
Amounts in thousands (except share amounts)
| Foreign Currency Exchange Contracts | ||||||||||||||||||||||
Counterparty | Amount Sold | Amount Bought | Settlement | Unrealized Appreciation (Depreciation) $ | ||||||||||||||||||
Societe Generale | USD | 1,605 | EUR | 1,212 | 03/16/11 | 14 | ||||||||||||||||
Societe Generale | USD | 821 | GBP | 524 | 03/16/11 | (4 | ) | |||||||||||||||
State Street Bank & Trust Co. | USD | 48 | EUR | 36 | 01/04/11 | — | ||||||||||||||||
State Street Bank & Trust Co. | HKD | 48 | USD | 6 | 01/03/11 | — | ||||||||||||||||
State Street Bank & Trust Co. | JPY | 324 | USD | 4 | 01/06/11 | — | ||||||||||||||||
State Street Bank & Trust Co. | JPY | 913 | USD | 11 | 01/06/11 | — | ||||||||||||||||
State Street Bank & Trust Co. | JPY | 30,000 | USD | 362 | 03/16/11 | (8 | ) | |||||||||||||||
Westpac Banking Corp. | USD | 1,507 | CAD | 1,500 | 03/16/11 | (1 | ) | |||||||||||||||
Westpac Banking Corp. | USD | 772 | HKD | 6,000 | 03/16/11 | — | ||||||||||||||||
Westpac Banking Corp. | EUR | 200 | USD | 263 | 03/16/11 | (4 | ) | |||||||||||||||
Westpac Banking Corp. | JPY | 200,000 | USD | 2,468 | 03/16/11 | 2 | ||||||||||||||||
Total Unrealized Appreciation (Depreciation) on Open Foreign Currency Exchange Contracts | 240 | |||||||||||||||||||||
See accompanying notes which are an integral part of the financial statements.
| Non-U.S. Fund | 45 |
Table of Contents
Russell Investment Funds
Non-U.S. Fund
Presentation of Portfolio Holdings — December 31, 2010
Amounts in thousands
| Market Value | % of Net | |||||||||||||||||||
| Portfolio Summary | Level 1 | Level 2 | Level 3 | Total | ||||||||||||||||
Common Stocks | ||||||||||||||||||||
Australia | $ | — | $ | 1,936 | $ | — | $ | 1,936 | 0.5 | |||||||||||
Austria | — | 525 | — | 525 | 0.1 | |||||||||||||||
Belgium | — | 2,386 | — | 2,386 | 0.7 | |||||||||||||||
Bermuda | 841 | 7,408 | — | 8,249 | 2.2 | |||||||||||||||
Brazil | 1,128 | 6,426 | — | 7,554 | 2.1 | |||||||||||||||
Canada | 5,605 | — | — | 5,605 | 1.5 | |||||||||||||||
Cayman Islands | 656 | — | — | 656 | 0.2 | |||||||||||||||
China | — | 1,917 | — | 1,917 | 0.5 | |||||||||||||||
Czech Republic | — | 653 | — | 653 | 0.2 | |||||||||||||||
Denmark | — | 4,265 | — | 4,265 | 1.2 | |||||||||||||||
Finland | — | 2,517 | — | 2,517 | 0.7 | |||||||||||||||
France | — | 33,450 | — | 33,450 | 9.1 | |||||||||||||||
Germany | — | 29,486 | — | 29,486 | 8.0 | |||||||||||||||
Hong Kong | 214 | 3,220 | — | 3,434 | 0.9 | |||||||||||||||
India | 5,504 | — | — | 5,504 | 1.5 | |||||||||||||||
Indonesia | — | 445 | — | 445 | 0.1 | |||||||||||||||
Ireland | 1,038 | — | — | 1,038 | 0.3 | |||||||||||||||
Israel | 2,154 | — | — | 2,154 | 0.6 | |||||||||||||||
Italy | — | 8,955 | — | 8,955 | 2.4 | |||||||||||||||
Japan | 36 | 48,110 | — | 48,146 | 13.1 | |||||||||||||||
Luxembourg | 1,224 | 1,213 | — | 2,437 | 0.7 | |||||||||||||||
Malaysia | — | 493 | — | 493 | 0.1 | |||||||||||||||
Mexico | 311 | — | — | 311 | 0.1 | |||||||||||||||
Netherlands | 1,673 | 20,831 | — | 22,504 | 6.1 | |||||||||||||||
Norway | — | 2,977 | — | 2,977 | 0.8 | |||||||||||||||
Russia | — | 1,766 | — | 1,766 | 0.5 | |||||||||||||||
Singapore | — | 7,345 | — | 7,345 | 2.0 | |||||||||||||||
South Africa | — | 3,061 | — | 3,061 | 0.8 | |||||||||||||||
South Korea | — | 1,337 | — | 1,337 | 0.4 | |||||||||||||||
Spain | — | 5,465 | — | 5,465 | 1.5 | |||||||||||||||
Sweden | — | 4,012 | — | 4,012 | 1.1 | |||||||||||||||
Switzerland | 3,509 | 30,876 | — | 34,385 | 9.4 | |||||||||||||||
Taiwan | 1,588 | 1,600 | — | 3,188 | 0.9 | |||||||||||||||
Thailand | — | 1,056 | — | 1,056 | 0.3 | |||||||||||||||
United Kingdom | 6,120 | 69,030 | — | 75,150 | 20.6 | |||||||||||||||
United States | 5,262 | — | — | 5,262 | 1.4 | |||||||||||||||
Virgin Islands, British | 357 | — | — | 357 | 0.1 | |||||||||||||||
Preferred Stocks | — | 526 | — | 526 | 0.1 | |||||||||||||||
Short-Term Investments | — | 22,674 | — | 22,674 | 6.2 | |||||||||||||||
Other Securities | — | 17,308 | — | 17,308 | 4.7 | |||||||||||||||
Total Investments | 37,220 | 343,269 | — | 380,489 | 103.7 | |||||||||||||||
Other Assets and Liabilities, Net | (3.7 | ) | ||||||||||||||||||
| 100.0 | ||||||||||||||||||||
Other Financial Instruments | ||||||||||||||||||||
Futures Contracts | 11 | — | — | 11 | — | * | ||||||||||||||
Foreign Currency Exchange Contracts | 4 | 236 | — | 240 | 0.1 | |||||||||||||||
Total Other Financial Instruments** | 15 | 236 | — | 251 | ||||||||||||||||
| * | Less than .05% of net assets. |
| ** | Other financial instruments reflected in the Schedule of Investments, such as futures, forwards, and swap contracts which are valued at the unrealized appreciation/depreciation on the instruments. |
For a description of the levels see note 2 in the Notes to Financial Statements.
See accompanying notes which are an integral part of the financial statements.
| 46 | Non-U.S. Fund |
Table of Contents
Russell Investment Funds
Non-U.S. Fund
Fair Value of Derivative Instruments — December 31, 2010
Amounts in thousands
| Derivatives not accounted for as hedging instruments | Foreign Currency Contracts | Equity Contracts | ||||||
Location: Statement of Assets and Liabilities - Assets | ||||||||
Unrealized appreciation on foreign currency exchange contracts | $ | 302 | $ | — | ||||
Daily variation margin on futures contracts* | — | 214 | ||||||
Total | $ | 302 | $ | 214 | ||||
Location: Statement of Assets and Liabilities - Liabilities | ||||||||
Unrealized depreciation on foreign currency exchange contracts | $ | 62 | $ | — | ||||
Daily variation margin on futures contracts* | — | (203 | ) | |||||
Total | $ | 62 | $ | (203 | ) | |||
| Derivatives not accounted for as hedging instruments | Foreign Currency Contracts | Equity Contracts | ||||||
Location: Statement of Operations - Net realized gain (loss) | ||||||||
Futures contracts | $ | — | $ | 915 | ||||
Foreign currency-related transactions | (539 | ) | — | |||||
Total | $ | (539 | ) | $ | 915 | |||
Location: Statement of Operations - Net change in unrealized appreciation (depreciation) | ||||||||
Futures contracts | $ | — | $ | (544 | ) | |||
Foreign currency-related transactions | 1,069 | — | ||||||
Total | $ | 1,069 | $ | (544 | ) | |||
| * | Includes cumulative appreciation/depreciation of futures contracts as reported in Schedule of Investments. Only current day’s variation margin is reported within the statement of assets and liabilities |
For further disclosure on derivatives see note 2 in Notes to Financial Statements.
See accompanying notes which are an integral part of the financial statements.
| Non-U.S. Fund | 47 |
Table of Contents
Russell Investment Funds
Portfolio Management Discussion — December 31, 2010 (Unaudited)
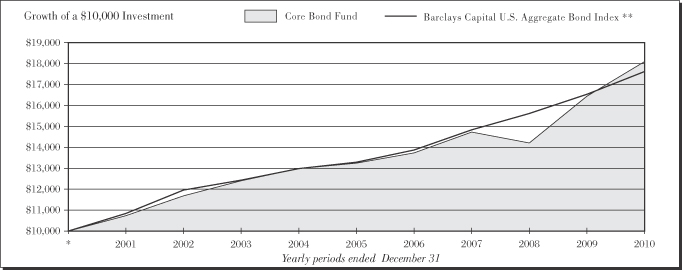
| Core Bond Fund | ||||
| Total Return | ||||
1 Year | 10.02 | % | ||
5 Years | 6.45 | %§ | ||
10 Years | 6.12 | %§ | ||
| Barclays Capital U.S. Aggregate Bond Index** | ||||
| Total Return | ||||
1 Year | 6.54 | % | ||
5 Years | 5.80 | %§ | ||
10 Years | 5.84 | %§ | ||
| 48 | Core Bond Fund |
Table of Contents
Russell Investment Funds
Core Bond Fund
Portfolio Management Discussion — December 31, 2010 (Unaudited)
The Core Bond Fund (the “Fund”) allocates most of its assets among multiple money managers. Russell Investment Management Company (“RIMCo”), as the Fund’s advisor, may change the allocation of the Fund’s assets among money managers at any time. An exemptive order from the Securities and Exchange Commission (“SEC”) permits RIMCo to engage or terminate a money manager at any time, subject to approval by the Fund’s Board without a shareholder vote. Pursuant to the terms of the exemptive order, the Fund is required to notify its shareholders within 60 days of when a money manager begins providing services. The Fund currently has three money managers.
What is the Fund’s investment objective?
The Fund seeks to provide current income, and as a secondary objective, capital appreciation.
How did the Fund perform relative to its benchmark for the fiscal year ended December 31, 2010?
For the fiscal year ended December 31, 2010, the Core Bond Fund gained 10.02%. This compared to its benchmark the Barclays Capital U.S. Aggregate Bond Index, which gained 6.54% during the same period. The Fund’s performance includes operating expenses, whereas index returns are unmanaged and do not include expenses of any kind.
For the year ended December 31, 2010, the Lipper® BBB Rated Corp Debt Funds (VIP) Average had a 7.85% return. This average return serves as a peer comparison and is expressed net of operating expenses.
How did the market conditions described in the Market Summary report affect the Fund’s performance?
During the fiscal year, the Fund was well positioned to take advantage of the broad fixed income rally, which occurred when assets returned to a level of pricing that more accurately reflected their credit risk. The key drivers of the Fund’s relatively strong performance in 2010 were a material overweight position in non-agency mortgage-backed securities (MBS), an overweight position in investment grade credit/corporate debts (with an emphasis on financials) and overweight positions in high yield corporate securities. The Fund’s investment grade credit positions benefited from the recovery the credit markets exhibited in 2010, which had resulted from sectors recovering from depressed levels through improved credit fundamentals and decreased investor risk aversion. Similarly, MBS also exhibited a recovery from depressed levels, which was a result of the market’s search for yield and a realization that pricing was too low relative to the security fundamentals of the instruments. Among the primary corporate debt sub-sectors (i.e., financials, industrials and utilities), financials outperformed the other sub-sectors. The performance of the financials sub-sector was largely driven by its relatively poor performance in 2008 as result of the credit crisis exhibited in that year. Because of its poor performance in 2008, the financials sub-sector represented a good value in 2010. Additionally, financials also benefited in 2010 from a modification to the U.S. Treasury yield curve, which allowed
banks to borrow inexpensively in the short term and lend out at a higher rate in the long term.
To a lesser extent, allocations to commercial mortgage-backed securities (CMBS), emerging market debt (EMD), and non-dollar investments also contributed positively to the Fund’s performance in 2010. CMBS performed well as the sector did not suffer the same crisis as the residential mortgage sector experienced in 2008. Because of this, investors pursued the relatively high yields available within the CMBS sector. EMD performed well as the general global recovery during the year appeared to occur sooner in emerging economies, many of which had better fiscal positions than those of certain developed economies. The Fund’s positions in non-dollar investments benefited from issue selection and tactical currency investments aimed at capturing returns resulting from the volatility exhibited within the currency markets.
During 2010, duration and yield curve positioning generally did not have an impact on the Fund’s performance. Over the period, the U.S. Treasury yield curve experienced many fluctuations. Though the shorter end of the curve was anchored by a Federal Reserve low-rate policy, the longer end of the curve was weakened by investor concerns about sovereign credit risk in Europe, the uncertain future of the U.S. dollar as a reserve currency resulting from statements by certain countries and inflation concerns stemming from the Federal Reserve’s second round of quantitative easing (QE2) (i.e., the injection of capital into the market through the direct purchase of certain types of assets). The shorter end of the yield curve represents yields on shorter maturity treasury securities, while the longer end of the curve represents yields on the longer maturity treasury securities.
How did the investment strategies and techniques employed by the Fund and its money managers affect its performance?
The Fund’s money managers tend to invest the Fund’s assets in non-Treasury sectors and in types of securities that are not found within the Index (e.g. high yield credit, MBS and EMD. As a result of having a more aggressive asset allocation relative to the Index, as more aggressive risk profiles continued to experience positive returns during 2010, the Fund’s underweight to U.S. Treasuries and overweight to non-Treasury securities resulted in the Fund generating returns in excess of the Index. While sector positions varied throughout 2010, allocations to some of the best performing sectors of the fixed income markets were beneficial to Fund performance. Overweight exposure to both investment grade financials and CMBS and the transition of the Fund’s position in agency mortgages from overweight to underweight over the course of the year contributed positively to Fund performance in 2010. Exposure to MBS was the largest contributor to Fund performance in 2010.
The Fund’s money managers rotate in and out of various sectors in order to gain exposure to those sectors or securities that the
| Core Bond Fund | 49 |
Table of Contents
Russell Investment Funds
Core Bond Fund
Portfolio Management Discussion — December 31, 2010 (Unaudited)
money managers believe could provide the highest value relative to other areas of the market. For example, Pacific Investment Management Company LLC put significant emphasis on non agency mortgage backed securities in an attempt to benefit from such sector’s significant yield and price appreciation which contributed positively to performance. Metropolitan West Asset Management, LLC maintained an emphasis on MBS and CMBS throughout the year and, as a result, the Fund’s performance benefited from the increased demand for these securities. Similarly, Goldman Sachs Asset Management, L.P., also maintained an emphasis on MBS throughout the year and the Fund’s performance benefited from increased demand for these securities. Although investment strategies and techniques will vary across the Fund’s money managers (e.g., different sector emphasis or the same emphasis at different times), the Fund’s performance over the year generally benefited from sector rotation implemented by the money managers.
Describe any changes to the Fund’s structure or the money manager line-up.
There were no changes to the Fund’s money manager line-up during the year. Manager weights were adjusted throughout the year.
| Money Managers as of December 31, 2010 | Styles | |
| Goldman Sachs Asset Management, L.P. | Fully Discretionary | |
| Metropolitan West Asset Management, LLC | Sector Rotation | |
| Pacific Investment Management Company LLC | Fully Discretionary | |
The views expressed in this report reflect those of the portfolio managers only through the end of the period covered by the report. These views do not necessarily represent the views of RIMCo, or any other person in RIMCo or any other affiliated organization. These views are subject to change at any time based upon market conditions or other events, and RIMCo disclaims any responsibility to update the views contained herein. These views should not be relied on as investment advice and, because investment decisions for Russell Investment Funds (“RIF”) are based on numerous factors, should not be relied on as an indication of investment decisions of any RIF Fund.
| * | Assumes initial investment on January 1, 2001. |
| ** | The Barclays Capital U.S. Aggregate Bond Index is an index, with income reinvested, generally representative of intermediate-term government bonds, investment-grade corporate debt securities and mortgage-backed securities. |
| § | Annualized. |
The performance shown in this section does not reflect any Insurance Company Separate Account or Policy Charges. Performance is historical and assumes reinvestment of all dividends and capital gains. Investment return and principal value will fluctuate so that an investor’s shares, when redeemed, may be worth more or less than when purchased. Past performance is not indicative of future results.
| 50 | Core Bond Fund |
Table of Contents
Russell Investment Funds
Core Bond Fund
Shareholder Expense Example — December 31, 2010 (Unaudited)
Fund Expenses
The following disclosure provides important information regarding each Fund’s Expense Example, which appears on each Fund’s individual page in this Annual Report. Please refer to this information when reviewing the Expense Example for a Fund.
Example
As a shareholder of the Fund, you incur two types of costs: (1) transaction costs, and (2) ongoing costs, including advisory fees and other Fund expenses. The Example is intended to help you understand your ongoing costs (in dollars) of investing in the Fund and to compare these costs with the ongoing costs of investing in other mutual funds. The Example is based on an investment of $1,000 invested at the beginning of the period and held for the entire period indicated, which for this Fund is from July 1, 2010 to December 31, 2010.
Actual Expenses
The information in the table under the heading “Actual Performance” provides information about actual account values and actual expenses. You may use the information in this column, together with the amount you invested, to estimate the expenses that you paid over the period. Simply divide your account value by $1,000 (for example, an $8,600 account value divided by $1,000 = 8.6), then multiply the result by the number in the first column in the row entitled “Expenses Paid During Period” to estimate the expenses you paid on your account during this period.
Hypothetical Example for Comparison Purposes
The information in the table under the heading “Hypothetical Performance (5% return before expenses)” provides information about hypothetical account values and hypothetical expenses
based on the Fund’s actual expense ratio and an assumed rate
of return of 5% per year before expenses, which is not the Fund’s actual return. The hypothetical account values and expenses may not be used to estimate the actual ending account balance or expenses you paid for the period. You may use this information to compare the ongoing costs of investing in the Fund and other funds. To do so, compare this 5% hypothetical example with the 5% hypothetical examples that appear in the shareholder reports of other funds.
Please note that the expenses shown in the table are meant to highlight your ongoing costs only and do not reflect any transactional costs. Therefore, the information under the heading “Hypothetical Performance (5% return before expenses)” is useful in comparing ongoing costs only, and will not help you determine the relative total costs of owning different funds. In addition, if these transactional costs were included, your costs would have been higher. The fee and expenses shown in this section do not reflect and Insurance Company Separate Account or Policy Charges.
Core Class | Actual Performance | Hypothetical Performance (5% return before expenses) | ||||||
Beginning Account Value July 1, 2010 | $ | 1,000.00 | $ | 1,000.00 | ||||
Ending Account Value | $ | 1,030.20 | $ | 1,021.73 | ||||
Expenses Paid During Period* | $ | 3.53 | $ | 3.52 | ||||
| * | Expenses are equal to the Fund’s annualized expense ratio of 0.69% (representing the six month period annualized), multiplied by the average account value over the period, multiplied by 184/365 (to reflect the one-half year period). May reflect amounts waived, reimbursed and/or other credits. Without any waivers, reimbursements and/or other credits, expenses would have been higher. |
| Core Bond Fund | 51 |
Table of Contents
Russell Investment Funds
Core Bond Fund
Schedule of Investments — December 31, 2010
Amounts in thousands (except share amounts)
| Principal Amount ($) or Shares | Market Value $ | |||||||
| Long-Term Investments - 92.8% | ||||||||
| Asset-Backed Securities - 4.8% | ||||||||
Access Group, Inc. | 757 | 773 | ||||||
Accredited Mortgage Loan Trust | 27 | 20 | ||||||
ACE Securities Corp. | 14 | 11 | ||||||
Series 2005-SD3 Class A | 84 | 80 | ||||||
Aegis Asset Backed Securities Trust | 92 | 68 | ||||||
Ally Auto Receivables Trust | 74 | 74 | ||||||
Ameriquest Mortgage Securities, Inc. | 90 | 53 | ||||||
Series 2004-R10 Class A5 | — | — | ||||||
Asset Backed Securities Corp. Home Equity | 1,050 | 764 | ||||||
Bayview Financial Acquisition Trust | 190 | 149 | ||||||
Brazos Higher Education Authority | 411 | 408 | ||||||
Series 2010-1 Class A1 | 300 | 299 | ||||||
Centex Home Equity | 700 | 461 | ||||||
CIT Mortgage Loan Trust | 92 | 88 | ||||||
Series 2007-1 Class 2A2 | 130 | 92 | ||||||
Series 2007-1 Class 2A3 | 180 | 96 | ||||||
Citigroup Mortgage Loan Trust, Inc. | 520 | 471 | ||||||
Series 2006-WFH3 Class A2 | 77 | 77 | ||||||
Series 2007-WFH1 Class A3 | 1,045 | 797 | ||||||
Series 2007-WFH1 Class A4 | 840 | 432 | ||||||
Series 2007-WFH4 Class A2B | 1,290 | 749 | ||||||
| Principal Amount ($) or Shares | Market Value $ | |||||||
Conseco Financial Corp. | 700 | 699 | ||||||
Series 1999-2 Class A5 | 832 | 846 | ||||||
Countrywide Asset-Backed Certificates | 95 | 21 | ||||||
Series 2004-BC1 Class M1 | 76 | 63 | ||||||
Series 2006-11 Class 1AF4 | 164 | 64 | ||||||
Countrywide Home Equity Loan Trust | 335 | 254 | ||||||
First Franklin Mortgage Loan Asset Backed Certificates | 20 | 20 | ||||||
Series 2007-FF1 Class A2B | 862 | 536 | ||||||
GMAC Mortgage Corp. Loan Trust | 47 | 34 | ||||||
Series 2007-HE3 Class 2A1 | 59 | 40 | ||||||
Goal Capital Funding Trust | 97 | 96 | ||||||
GSAA Trust | 320 | 292 | ||||||
GSAMP Trust | 60 | 41 | ||||||
HSBC Home Equity Loan Trust | 163 | 149 | ||||||
Series 2006-4 Class A3V | 800 | 760 | ||||||
Series 2007-1 Class AS | 584 | 546 | ||||||
Series 2007-3 Class APT | 258 | 238 | ||||||
HSI Asset Securitization Corp. Trust | 5 | 5 | ||||||
Indymac Residential Asset Backed Trust | 224 | 83 | ||||||
IXIS Real Estate Capital Trust | 399 | 379 | ||||||
JP Morgan Mortgage Acquisition Corp. | 1,000 | 468 | ||||||
| 52 | Core Bond Fund |
Table of Contents
Russell Investment Funds
Core Bond Fund
Schedule of Investments, continued — December 31, 2010
Amounts in thousands (except share amounts)
| Principal Amount ($) or Shares | Market Value $ | |||||||
Knowledgeworks Foundation | 292 | 288 | ||||||
Lehman XS Trust | 314 | 242 | ||||||
Series 2005-7N Class 1A1A | 349 | 237 | ||||||
Series 2006-16N Class A4A | 574 | 356 | ||||||
Long Beach Mortgage Loan Trust | 5 | 4 | ||||||
Mastr Asset Backed Securities Trust | 57 | 47 | ||||||
Series 2005-WMC1 Class M1 | 252 | 252 | ||||||
Missouri Higher Education Loan Authority | 910 | 914 | ||||||
Morgan Stanley ABS Capital I | 25 | 6 | ||||||
Series 2006-HE1 Class A4 | 1,950 | 1,107 | ||||||
Series 2007-HE2 Class A2B | 1,043 | 528 | ||||||
Nelnet Student Loan Trust | 394 | 393 | ||||||
New Century Home Equity Loan Trust | 215 | 145 | ||||||
Northstar Education Finance, Inc. | 1,000 | 988 | ||||||
Option One Mortgage Loan Trust | 36 | 17 | ||||||
Series 2003-3 Class M3 | 23 | 8 | ||||||
Series 2003-4 Class M2 | 24 | 9 | ||||||
Park Place Securities, Inc. | 210 | 157 | ||||||
Popular ABS Mortgage Pass-Through Trust | 127 | 117 | ||||||
Renaissance Home Equity Loan Trust | 61 | 33 | ||||||
Series 2005-2 Class AF4 | 85 | 72 | ||||||
Series 2006-1 Class AF6 | 166 | 128 | ||||||
| Principal Amount ($) or Shares | Market Value $ | |||||||
Residential Asset Mortgage Products, Inc. | 381 | 372 | ||||||
Series 2003-RS11 Class AI6A | 116 | 110 | ||||||
Residential Asset Securities Corp. | 120 | 71 | ||||||
Series 2003-KS2 Class MI3 | 46 | 6 | ||||||
Series 2003-KS4 Class AIIB 0.841% due 06/25/33 (Ê) | 32 | 16 | ||||||
Series 2007-KS2 Class AI1 | 37 | 37 | ||||||
SG Mortgage Securities Trust | 1,500 | 567 | ||||||
SLM Student Loan Trust | 39 | 39 | ||||||
Series 2008-7 Class A2 | 2,800 | 2,803 | ||||||
Small Business Administration Participation Certificates | 620 | 660 | ||||||
Soundview Home Equity Loan Trust | 586 | 557 | ||||||
Structured Asset Securities Corp. | 11 | 11 | ||||||
| 22,893 | ||||||||
| Corporate Bonds and Notes - 16.7% | ||||||||
Agilent Technologies, Inc. | 300 | 326 | ||||||
Alcoa, Inc. | 800 | 853 | ||||||
Allied Waste NA, Inc. | 90 | 95 | ||||||
Allstate Life Global Funding Trusts | 200 | 218 | ||||||
Ally Financial, Inc. | 1,900 | 2,039 | ||||||
7.500% due 09/15/20 (Þ) | 100 | 105 | ||||||
Series UNRE | 400 | 414 | ||||||
Altria Group, Inc. | 200 | 264 | ||||||
American Express Bank FSB | 300 | 323 | ||||||
6.000% due 09/13/17 | 400 | 446 | ||||||
American Express Centurion Bank | 400 | 446 | ||||||
| Core Bond Fund | 53 |
Table of Contents
Russell Investment Funds
Core Bond Fund
Schedule of Investments, continued — December 31, 2010
Amounts in thousands (except share amounts)
| Principal Amount ($) or Shares | Market Value $ | |||||||
American Express Co. | 200 | 233 | ||||||
American General Finance Corp. | 300 | 242 | ||||||
Series MTNI 4.875% due 07/15/12 (Ñ) | 100 | 94 | ||||||
American International Group, Inc. | 700 | 721 | ||||||
5.450% due 05/18/17 | 1,000 | 1,013 | ||||||
5.850% due 01/16/18 | 900 | 928 | ||||||
Amgen, Inc. | 1,000 | 1,213 | ||||||
Anadarko Petroleum Corp. | 250 | 272 | ||||||
Anheuser-Busch InBev Worldwide, Inc. | 125 | 143 | ||||||
4.125% due 01/15/15 | 225 | 237 | ||||||
7.750% due 01/15/19 (Þ) | 125 | 156 | ||||||
Appalachian Power Co. | 65 | 69 | ||||||
Arizona Public Service Co. | 100 | 110 | ||||||
6.250% due 08/01/16 | 75 | 84 | ||||||
AT&T, Inc. | 200 | 214 | ||||||
5.500% due 02/01/18 | 200 | 222 | ||||||
6.300% due 01/15/38 | 900 | 949 | ||||||
6.400% due 05/15/38 | 175 | 186 | ||||||
BAC Capital Trust XV | 375 | 233 | ||||||
Bank of America Corp. | 115 | 119 | ||||||
6.000% due 09/01/17 | 335 | 351 | ||||||
5.750% due 12/01/17 | 140 | 146 | ||||||
5.625% due 07/01/20 | 175 | 178 | ||||||
5.875% due 01/05/21 | 225 | 233 | ||||||
Bank of America NA | 200 | 179 | ||||||
6.100% due 06/15/17 | 175 | 183 | ||||||
BankAmerica Capital III | 350 | 249 | ||||||
Bear Stearns Cos. LLC (The) | 600 | 655 | ||||||
7.250% due 02/01/18 | 445 | 527 | ||||||
Boardwalk Pipelines, LP | 225 | 247 | ||||||
Boston Scientific Corp. | 275 | 281 | ||||||
7.000% due 11/15/35 | 63 | 63 | ||||||
Burlington Northern Santa Fe LLC | 25 | 29 | ||||||
6.750% due 03/15/29 | 10 | 11 | ||||||
Capital One Capital III | 150 | 150 | ||||||
| Principal Amount ($) or Shares | Market Value $ | |||||||
Caterpillar Financial Services Corp. | 100 | 107 | ||||||
Cellco Partnership / Verizon Wireless Capital LLC | 700 | 733 | ||||||
8.500% due 11/15/18 | 175 | 229 | ||||||
CenterPoint Energy Resources Corp. | 50 | 56 | ||||||
Chase Capital III Series C | 295 | 233 | ||||||
CHS/Community Health Systems, Inc. | 335 | 352 | ||||||
Chubb Corp. | 175 | 182 | ||||||
CIT Group, Inc. (Ñ) | 156 | 160 | ||||||
7.000% due 05/01/14 | 85 | 86 | ||||||
7.000% due 05/01/15 | 285 | 285 | ||||||
7.000% due 05/01/17 | 198 | 198 | ||||||
Series . 7.000% due 05/01/16 | 141 | 142 | ||||||
Citigroup Capital XXI | 500 | 520 | ||||||
Citigroup, Inc. | 200 | 212 | ||||||
5.625% due 08/27/12 | 200 | 210 | ||||||
5.500% due 04/11/13 | 700 | 745 | ||||||
5.850% due 07/02/13 | 100 | 108 | ||||||
2.286% due 08/13/13 (Ê) | 100 | 102 | ||||||
6.375% due 08/12/14 | 150 | 166 | ||||||
5.000% due 09/15/14 | 400 | 414 | ||||||
4.700% due 05/29/15 | 50 | 52 | ||||||
5.850% due 08/02/16 (Ñ) | 55 | 59 | ||||||
6.000% due 08/15/17 | 850 | 922 | ||||||
6.125% due 11/21/17 | 405 | 444 | ||||||
5.375% due 08/09/20 (Ñ) | 250 | 260 | ||||||
6.125% due 08/25/36 | 300 | 287 | ||||||
6.875% due 03/05/38 | 600 | 666 | ||||||
8.125% due 07/15/39 | 165 | 210 | ||||||
Columbus Southern Power Co. | 10 | 11 | ||||||
Comcast Cable Communications Holdings, Inc. | 100 | 138 | ||||||
Comcast Cable Holdings LLC | 180 | 196 | ||||||
Comcast Holdings Corp. | 125 | 142 | ||||||
Continental Airlines 1999-1 Class A Pass Through Trust | 190 | 201 | ||||||
Continental Airlines 2007-1 Class A Pass Through Trust | 145 | 153 | ||||||
| 54 | Core Bond Fund |
Table of Contents
Russell Investment Funds
Core Bond Fund
Schedule of Investments, continued — December 31, 2010
Amounts in thousands (except share amounts)
| Principal Amount ($) or Shares | Market Value $ | |||||||
Continental Airlines 2009-1 Pass Through Trust | 240 | 275 | ||||||
Countrywide Financial Corp. | 100 | 105 | ||||||
COX Communications, Inc. | 75 | 84 | ||||||
Credit Suisse USA, Inc. | 45 | 49 | ||||||
DCP Midstream LLC | 100 | 129 | ||||||
Dell, Inc. | 400 | 429 | ||||||
Delta Air Lines, Inc. | 382 | 416 | ||||||
Developers Diversified Realty Corp. | 175 | 195 | ||||||
Discover Bank | 250 | 294 | ||||||
DISH DBS Corp. | 125 | 129 | ||||||
Dow Chemical Co. (The) | 300 | 346 | ||||||
Dynegy Roseton / Danskammer Pass Through Trust | 700 | 658 | ||||||
Edison Mission Energy | 675 | 535 | ||||||
El Paso Corp. | 200 | 203 | ||||||
El Paso Natural Gas Co. | 100 | 110 | ||||||
El Paso Pipeline Partners Operating Co. LLC | 75 | 79 | ||||||
Energy Transfer Partners, LP | 300 | 329 | ||||||
Enterprise Products Operating LLC | 125 | 143 | ||||||
Series A | 100 | 107 | ||||||
Farmers Exchange Capital | 500 | 483 | ||||||
7.200% due 07/15/48 (Þ) | 300 | 272 | ||||||
Fifth Third Bancorp | 1,100 | 1,266 | ||||||
Fifth Third Bank | 250 | 240 | ||||||
First Niagara Financial Group, Inc. | 125 | 130 | ||||||
Ford Motor Credit Co. LLC | 1,000 | 1,063 | ||||||
| Principal Amount ($) or Shares | Market Value $ | |||||||
FPL Energy Wind Funding LLC | 235 | 229 | ||||||
Freeport-McMoRan Copper & Gold, Inc. | 300 | 332 | ||||||
General Electric Capital Corp. | 75 | 75 | ||||||
5.900% due 05/13/14 | 350 | 387 | ||||||
5.625% due 05/01/18 | 230 | 251 | ||||||
4.375% due 09/16/20 (Ñ) | 300 | 295 | ||||||
5.875% due 01/14/38 | 300 | 311 | ||||||
6.375% due 11/15/67 | 1,900 | 1,881 | ||||||
Series EMTN | 400 | 380 | ||||||
General Electric Co. | 250 | 270 | ||||||
Goldman Sachs Group, Inc. (The) | 150 | 165 | ||||||
6.250% due 09/01/17 | 600 | 662 | ||||||
6.150% due 04/01/18 | 400 | 440 | ||||||
7.500% due 02/15/19 | 550 | 641 | ||||||
6.000% due 06/15/20 (Ñ) | 285 | 308 | ||||||
6.750% due 10/01/37 | 800 | 818 | ||||||
Series MTNB | 100 | 96 | ||||||
HCA, Inc. | 300 | 329 | ||||||
7.875% due 02/15/20 (Ñ) | 125 | 134 | ||||||
HCP, Inc. | 425 | 456 | ||||||
Health Care REIT, Inc. | 400 | 399 | ||||||
4.950% due 01/15/21 (Ñ) | 300 | 289 | ||||||
Healthcare Realty Trust, Inc. | 700 | 755 | ||||||
Historic TW, Inc. | 195 | 233 | ||||||
Hospira, Inc. | 150 | 147 | ||||||
HSBC Bank USA | 600 | 596 | ||||||
Indiantown Cogeneration, LP | 275 | 298 | ||||||
International Lease Finance Corp. | 720 | 763 | ||||||
6.750% due 09/01/16 (Þ) | 100 | 107 | ||||||
International Paper Co. | 75 | 89 | ||||||
JP Morgan Chase Capital XIII | 480 | 380 | ||||||
JP Morgan Chase Capital XX | 200 | 201 | ||||||
JP Morgan Chase Capital XXIII | 545 | 420 | ||||||
| Core Bond Fund | 55 |
Table of Contents
Russell Investment Funds
Core Bond Fund
Schedule of Investments, continued — December 31, 2010
Amounts in thousands (except share amounts)
| Principal Amount ($) or Shares | Market Value $ | |||||||
JPMorgan Chase & Co. | 170 | 185 | ||||||
6.000% due 01/15/18 | 200 | 223 | ||||||
4.250% due 10/15/20 (Ñ) | 300 | 293 | ||||||
Series 1 | 300 | 319 | ||||||
JPMorgan Chase Bank NA | 70 | 77 | ||||||
6.000% due 10/01/17 | 570 | 631 | ||||||
JPMorgan Chase Capital XXI | 335 | 259 | ||||||
KCP&L Greater Missouri Operations Co. | 640 | 726 | ||||||
Kinder Morgan Energy Partners, LP | 700 | 771 | ||||||
Kraft Foods, Inc. | 200 | 228 | ||||||
6.125% due 08/23/18 | 125 | 143 | ||||||
6.500% due 02/09/40 | 175 | 196 | ||||||
L-3 Communications Corp. | 125 | 129 | ||||||
Lehman Brothers Holdings, Inc. | 200 | 49 | ||||||
6.200% due 09/26/14 (Ø) | 200 | 46 | ||||||
Liberty Property, LP | 275 | 272 | ||||||
Life Technologies Corp. | 145 | 155 | ||||||
5.000% due 01/15/21 | 275 | 272 | ||||||
Manufacturers & Traders Trust Co. | 84 | 80 | ||||||
MBNA Capital B | 985 | 687 | ||||||
MBNA Corp. | 200 | 215 | ||||||
Merrill Lynch & Co., Inc. | 100 | 106 | ||||||
6.050% due 05/16/16 | 300 | 309 | ||||||
6.400% due 08/28/17 | 325 | 343 | ||||||
6.875% due 04/25/18 | 500 | 547 | ||||||
MetLife, Inc. | 350 | 357 | ||||||
6.400% due 12/15/36 | 100 | 94 | ||||||
Metropolitan Life Global Funding I | 200 | 218 | ||||||
Mirant Mid Atlantic Pass Through Trust A | 150 | 155 | ||||||
Mirant Mid Atlantic Pass Through Trust B | 282 | 303 | ||||||
Morgan Stanley | 435 | 402 | ||||||
| Principal Amount ($) or Shares | Market Value $ | |||||||
5.450% due 01/09/17 | 225 | 233 | ||||||
6.250% due 08/28/17 (Ñ) | 600 | 647 | ||||||
5.950% due 12/28/17 | 125 | 132 | ||||||
6.625% due 04/01/18 | 450 | 488 | ||||||
5.500% due 07/24/20 (Ñ) | 425 | 429 | ||||||
Series GMTN 2.786% due 05/14/13 (Ê) | 200 | 207 | ||||||
National City Bank | 700 | 631 | ||||||
NBC Universal, Inc. | 300 | 291 | ||||||
Nevada Power Co. | 100 | 112 | ||||||
News America Holdings, Inc. | 20 | 24 | ||||||
NGPL PipeCo LLC | 200 | 216 | ||||||
Nisource Finance Corp. | 145 | 161 | ||||||
6.125% due 03/01/22 | 335 | 361 | ||||||
Oncor Electric Delivery Co. LLC | 550 | 644 | ||||||
Panhandle Eastern Pipeline Co., LP | 450 | 519 | ||||||
Philip Morris International, Inc. | 100 | 116 | ||||||
PNC Bank NA | 175 | 200 | ||||||
Progress Energy, Inc. | 40 | 45 | ||||||
7.050% due 03/15/19 | 200 | 237 | ||||||
ProLogis | 150 | 148 | ||||||
Prudential Financial, Inc. | 375 | 387 | ||||||
4.500% due 11/15/20 | 100 | 98 | ||||||
Prudential Holdings LLC | 550 | 655 | ||||||
Public Service Co. of New Mexico | 260 | 292 | ||||||
Puget Sound Energy, Inc. | 125 | 123 | ||||||
Pulte Group, Inc. | 1,000 | 985 | ||||||
Qwest Corp. | 100 | 113 | ||||||
8.375% due 05/01/16 (Ñ) | 175 | 207 | ||||||
Reinsurance Group of America, Inc. | 75 | 69 | ||||||
Reliant Energy Mid-Atlantic Power Holdings LLC | 299 | 323 | ||||||
| 56 | Core Bond Fund |
Table of Contents
Russell Investment Funds
Core Bond Fund
Schedule of Investments, continued — December 31, 2010
Amounts in thousands (except share amounts)
| Principal Amount ($) or Shares | Market Value $ | |||||||
Rensselaer Polytechnic Institute | 325 | 335 | ||||||
Sabine Pass LNG, LP | 730 | 710 | ||||||
7.500% due 11/30/16 (Ñ) | 65 | 61 | ||||||
Series 144a | 380 | 356 | ||||||
Simon Property Group, LP | 130 | 146 | ||||||
5.650% due 02/01/20 | 275 | 297 | ||||||
4.375% due 03/01/21 | 100 | 99 | ||||||
SLM Corp. | 1,800 | 1,734 | ||||||
Southern Union Co. | 740 | 682 | ||||||
Sprint Capital Corp. | 125 | 132 | ||||||
State Street Capital Trust III | 200 | 203 | ||||||
Symetra Financial Corp. | 150 | 151 | ||||||
Target Corp. | 400 | 433 | ||||||
Tennessee Gas Pipeline Co. | 200 | 232 | ||||||
7.500% due 04/01/17 | 75 | 86 | ||||||
8.375% due 06/15/32 | 100 | 118 | ||||||
Time Warner, Inc. | 400 | 451 | ||||||
Transatlantic Holdings, Inc. | 150 | 154 | ||||||
TransDigm, Inc. | 250 | 259 | ||||||
UAL 2009-1 Pass Through Trust | 94 | 109 | ||||||
Union Electric Co. | 205 | 232 | ||||||
Union Pacific Corp. | 400 | 449 | ||||||
UnitedHealth Group, Inc. | 200 | 213 | ||||||
6.000% due 06/15/17 | 3 | 3 | ||||||
6.500% due 06/15/37 | 45 | 50 | ||||||
Valero Energy Corp. | 450 | 559 | ||||||
6.125% due 02/01/20 | 100 | 106 | ||||||
Wachovia Corp. | 100 | 109 | ||||||
5.750% due 02/01/18 (Ñ) | 500 | 555 | ||||||
WCI Finance LLC / WEA Finance LLC | 75 | 80 | ||||||
WEA Finance LLC / WT Finance Aust Pty, Ltd. | 205 | 233 | ||||||
6.750% due 09/02/19 (Þ) | 95 | 106 | ||||||
| Principal Amount ($) or Shares | Market Value $ | |||||||
Wells Fargo & Co. | 300 | 332 | ||||||
Series K | 3,300 | 3,483 | ||||||
Whirlpool Corp. | 25 | 27 | ||||||
8.600% due 05/01/14 | 75 | 86 | ||||||
Williams Cos., Inc. (The) | 416 | 491 | ||||||
8.750% due 03/15/32 (Ñ) | 175 | 214 | ||||||
Windstream Corp. | 125 | 132 | ||||||
ZFS Finance USA Trust II | 300 | 295 | ||||||
| 79,022 | ||||||||
| International Debt - 9.2% | ||||||||
Achmea Hypotheekbank NV | 900 | 936 | ||||||
AK Transneft OJSC Via TransCapitalInvest, Ltd. | 100 | 124 | ||||||
Anglo American Capital PLC | 100 | 120 | ||||||
9.375% due 04/08/19 (Þ) | 100 | 135 | ||||||
ANZ National International, Ltd. | 600 | 660 | ||||||
ArcelorMittal | 175 | 186 | ||||||
ARES CLO Funds | 384 | 371 | ||||||
Series 2005-10A Class A3 | 635 | 597 | ||||||
Arkle Master Issuer PLC | 600 | 599 | ||||||
Armstrong Loan Funding, Ltd. | 306 | 303 | ||||||
AstraZeneca PLC | 100 | 116 | ||||||
AWAS Aviation Capital, Ltd. | 365 | 362 | ||||||
Bank of Montreal | 100 | 102 | ||||||
Barclays Bank PLC | 1,300 | 1,392 | ||||||
6.050% due 12/04/17 (Þ) | 200 | 205 | ||||||
BAT International Finance PLC | 150 | 197 | ||||||
BBVA Bancomer SA | 300 | 317 | ||||||
Black Diamond CLO, Ltd. | 750 | 677 | ||||||
| Core Bond Fund | 57 |
Table of Contents
Russell Investment Funds
Core Bond Fund
Schedule of Investments, continued — December 31, 2010
Amounts in thousands (except share amounts)
| Principal Amount ($) or Shares | Market Value $ | |||||||
BM&FBovespa SA | 100 | 102 | ||||||
BNP Paribas | 300 | 273 | ||||||
Bolivarian Republic of Venezuela | 60 | 39 | ||||||
BP Capital Markets PLC | 175 | 190 | ||||||
3.875% due 03/10/15 | 150 | 155 | ||||||
4.500% due 10/01/20 | 150 | 150 | ||||||
BRFkredit AS | 1,200 | 1,219 | ||||||
Canadian Natural Resources, Ltd. | 100 | 108 | ||||||
Chatham Light CLO, Ltd. | 495 | 463 | ||||||
Cie de Financement Foncier | 500 | 502 | ||||||
2.125% due 04/22/13 (Þ) | 200 | 202 | ||||||
Corp. Nacional del Cobre de Chile | 200 | 243 | ||||||
Covidien International Finance SA | 175 | 175 | ||||||
Credit Agricole SA | 150 | 154 | ||||||
Credit Suisse NY | 770 | 826 | ||||||
CSN Islands XI Corp. | 200 | 216 | ||||||
Danske Bank A/S | 500 | 512 | ||||||
Deutsche Bank AG | 600 | 672 | ||||||
Dexia Credit Local SA | 500 | 498 | ||||||
DnB NOR Boligkreditt | 500 | 475 | ||||||
Dolphin Energy, Ltd. | 120 | 128 | ||||||
Electricite De France | 200 | 220 | ||||||
6.500% due 01/26/19 (Þ) | 200 | 233 | ||||||
6.950% due 01/26/39 (Þ) | 200 | 237 | ||||||
Endurance Specialty Holdings, Ltd. | 100 | 105 | ||||||
Enel Finance International SA | 300 | 328 | ||||||
5.125% due 10/07/19 (Ñ)(Þ) | 175 | 173 | ||||||
Export-Import Bank of Korea | 700 | 758 | ||||||
FIH Erhvervsbank A/S | 500 | 513 | ||||||
Gazprom International SA for Gazprom | 58 | 62 | ||||||
| Principal Amount ($) or Shares | Market Value $ | |||||||
Gazprom Via Gaz Capital SA | 110 | 135 | ||||||
HBOS PLC | 825 | 772 | ||||||
Holmes Master Issuer PLC | 300 | 300 | ||||||
HSBC Bank USA | 590 | 734 | ||||||
HSBC Holdings PLC | ||||||||
6.500% due 05/02/36 | 100 | 104 | ||||||
6.500% due 09/15/37 | 100 | 105 | ||||||
Indian Oil Corp., Ltd. | 400 | 412 | ||||||
ING Bank NV | 600 | 585 | ||||||
Israel Government AID Bond | 400 | 444 | ||||||
Korea Electric Power Corp. | 60 | 63 | ||||||
LeasePlan Corp. NV | 400 | 411 | ||||||
Lloyds TSB Bank PLC | 200 | 184 | ||||||
Macquarie Bank, Ltd. | 1,000 | 1,056 | ||||||
Majapahit Holding BV | 100 | 116 | ||||||
Mexico Government International Bond | 260 | 266 | ||||||
Monument Park CDO, Ltd. | 628 | 607 | ||||||
Morgan Stanley Bank AG for OAO | 900 | 1,020 | ||||||
MUFG Capital Finance 1, Ltd. | 200 | 202 | ||||||
National Australia Bank, Ltd. | 800 | 867 | ||||||
Nexen, Inc. | 125 | 136 | ||||||
Noble Group, Ltd. | 100 | 111 | ||||||
North American Development Bank | 400 | 412 | ||||||
Peruvian Government International Bond | 40 | 37 | ||||||
Petrobras International Finance Co. - Pifco | 800 | 946 | ||||||
Petro-Canada | 100 | 114 | ||||||
Petroleos Mexicanos | 320 | 386 | ||||||
| 58 | Core Bond Fund |
Table of Contents
Russell Investment Funds
Core Bond Fund
Schedule of Investments, continued — December 31, 2010
Amounts in thousands (except share amounts)
| Principal Amount ($) or Shares | Market Value $ | |||||||
Qatar Government International Bond | 520 | 549 | ||||||
Ras Laffan Liquefied Natural Gas | 250 | 258 | ||||||
Series REGS | 300 | 346 | ||||||
Republic of Venezuela | 60 | 41 | ||||||
Resona Bank, Ltd. | 100 | 100 | ||||||
Royal Bank of Scotland Group PLC | 300 | 231 | ||||||
Series 1 | 300 | 296 | ||||||
Royal Bank of Scotland PLC (The) | 1,200 | 1,209 | ||||||
2.625% due 05/11/12 (Þ) | 300 | 307 | ||||||
4.875% due 08/25/14 (Þ) | 1,000 | 1,024 | ||||||
5.625% due 08/24/20 (Ñ) | 200 | 199 | ||||||
Russia Government International Bond | 107 | 124 | ||||||
RZD Capital, Ltd. | 500 | 520 | ||||||
Santander US Debt SA Unipersonal | 400 | 389 | ||||||
Silverstone Master Issuer PLC | 500 | 501 | ||||||
SLM Corp. | 150 | 178 | ||||||
Sparebanken 1 Boligkreditt | 1,000 | 993 | ||||||
Stadshypotek AB | 800 | 799 | ||||||
State of Qatar | 100 | 107 | ||||||
Suncor Energy, Inc. | 100 | 115 | ||||||
Swedbank AB | ||||||||
2.800% due 02/10/12 (Þ) | 100 | 102 | ||||||
2.900% due 01/14/13 (Þ) | 100 | 103 | ||||||
Swedish Housing Finance Corp. | 1,000 | 1,027 | ||||||
Teck Resources, Ltd. | 200 | 260 | ||||||
Telecom Italia Capital SA | 225 | 211 | ||||||
Telemar Norte Leste SA | 125 | 120 | ||||||
TransCanada PipeLines, Ltd. | 225 | 222 | ||||||
Transocean, Inc. | ||||||||
4.950% due 11/15/15 | 75 | 78 | ||||||
6.500% due 11/15/20 | 300 | 319 | ||||||
| Principal Amount ($) or Shares | Market Value $ | |||||||
UBS AG | 270 | 123 | ||||||
Series DPNT | ||||||||
5.875% due 12/20/17 | 400 | 440 | ||||||
5.750% due 04/25/18 | 100 | 109 | ||||||
Vale Overseas, Ltd. | 400 | 426 | ||||||
Venezuela Government International Bond | 150 | 106 | ||||||
Vivendi SA | 400 | 431 | ||||||
Wells Fargo & Co. | 400 | 507 | ||||||
Westpac Banking Corp. | ||||||||
1.900% due 12/14/12 (Þ) | 800 | 814 | ||||||
3.585% due 08/14/14 (Þ) | 700 | 746 | ||||||
WG Horizons CLO | 800 | 730 | ||||||
White Nights Gazprom | ||||||||
10.500% due 03/08/14 | 200 | 239 | ||||||
10.500% due 03/25/14 | 300 | 358 | ||||||
| 43,612 | ||||||||
| Loan Agreements - 0.2% | ||||||||
Adam Aircraft Industries, Term Loan | 49 | — | ||||||
CIT Group, Inc. Term Loan | 500 | 510 | ||||||
HCA, Inc. | 507 | 501 | ||||||
| 1,011 | ||||||||
| Mortgage-Backed Securities - 45.4% | ||||||||
ABN Amro Mortgage Corp. | 1,909 | 1,806 | ||||||
Adjustable Rate Mortgage Trust | 51 | 45 | ||||||
American Home Mortgage Assets | 1,009 | 728 | ||||||
American Home Mortgage Investment Trust | 72 | 64 | ||||||
Banc of America Commercial Mortgage, Inc. | 533 | 552 | ||||||
Series 2005-2 Class A | 316 | 328 | ||||||
Series 2006-1 Class A | 280 | 300 | ||||||
Series 2006-2 Class A | 200 | 219 | ||||||
| Core Bond Fund | 59 |
Table of Contents
Russell Investment Funds
Core Bond Fund
Schedule of Investments, continued — December 31, 2010
Amounts in thousands (except share amounts)
| Principal Amount ($) or Shares | Market Value $ | |||||||
Series 2006-4 Class A | 500 | 536 | ||||||
Banc of America Funding Corp. | 85 | 82 | ||||||
Series 2006-3 Class 5A | 475 | 433 | ||||||
Series 2006-A Class 4A1 | 353 | 294 | ||||||
Series 2006-I Class 5A | 1,345 | 1,191 | ||||||
Banc of America Mortgage Securities, Inc. | 6 | 6 | ||||||
Series 2004-11 Class 2A | 213 | 220 | ||||||
Series 2005-H Class 2A5 | 220 | 177 | ||||||
Series 2006-B Class 1A | 69 | 41 | ||||||
Bear Stearns Adjustable Rate Mortgage Trust | 25 | 24 | ||||||
Series 2003-8 Class 4A1 | 73 | 69 | ||||||
Series 2004-9 Class 22A1 | 47 | 46 | ||||||
Series 2005-2 Class | 773 | 734 | ||||||
Series 2007-3 Class 1A1 | 277 | 208 | ||||||
Bear Stearns Alt-A Trust | 164 | 128 | ||||||
Series 2005-7 Class 22A1 | 398 | 302 | ||||||
Citigroup Mortgage Loan Trust, Inc. | 49 | 47 | ||||||
Series 2006-AR7 Class 1A4A | 633 | 477 | ||||||
Series 2007-AR8 Class 2A1A | 823 | 602 | ||||||
Citigroup/Deutsche Bank Commercial Mortgage Trust | 340 | 366 | ||||||
Series 2006-CD3 Class A5 | 190 | 204 | ||||||
Commercial Mortgage Pass Through Certificates | 200 | 209 | ||||||
Series 2007-C9 Class A4 | 360 | 387 | ||||||
| Principal Amount ($) or Shares | Market Value $ | |||||||
Countrywide Alternative Loan Trust | 39 | 37 | ||||||
Series 2005-48T1 Class A6 | 897 | 664 | ||||||
Series 2006-36T2 Class 1A9 | 288 | 157 | ||||||
Series 2006-OA16 Class A2 | 1,596 | 1,017 | ||||||
Series 2006-OA19 Class A1 | 681 | 394 | ||||||
Series 2007-15CB Class A5 | 683 | 498 | ||||||
Series 2007-J2 Class 2A1 | 190 | 152 | ||||||
Series 2007-OA11 Class A1A | 896 | 495 | ||||||
Countrywide Home Loan Mortgage Pass Through Trust | 111 | 96 | ||||||
Series 2004-22 Class A3 | 155 | 124 | ||||||
Series 2004-HYB9 Class 1A1 | 256 | 221 | ||||||
Series 2005-1 Class 2A1 | 1,508 | 842 | ||||||
Series 2005-3 Class 1A2 | 23 | 15 | ||||||
Series 2005-HYB9 Class 3A2A | 48 | 39 | ||||||
Series 2007-1 Class A1 | 1,390 | 1,183 | ||||||
Series 2007-2 Class A2 | 2,100 | 1,808 | ||||||
Series 2007-4 Class 1A10 | 2,000 | 1,632 | ||||||
Series 2007-HY1 Class 1A2 | 64 | 9 | ||||||
Credit Suisse First Boston Mortgage Securities Corp. | 335 | 291 | ||||||
Credit Suisse Mortgage Capital Certificates | 473 | 360 | ||||||
Series 2006-C2 Class A3 | 100 | 105 | ||||||
Deutsche ALT-A Securities, Inc. Alternate Loan Trust | 465 | 251 | ||||||
Series 2007-OA1 Class A1 | 2,253 | 1,232 | ||||||
Series 2007-OA2 Class A1 | 1,240 | 738 | ||||||
| 60 | Core Bond Fund |
Table of Contents
Russell Investment Funds
Core Bond Fund
Schedule of Investments, continued — December 31, 2010
Amounts in thousands (except share amounts)
| Principal Amount ($) or Shares | Market Value $ | |||||||
Fannie Mae | ||||||||
2.896% due 2017 (Ê) | 27 | 27 | ||||||
6.000% due 2017 | 29 | 32 | ||||||
4.000% due 2018 | 422 | 440 | ||||||
4.500% due 2018 | 114 | 122 | ||||||
6.000% due 2019 | 218 | 237 | ||||||
5.500% due 2020 | 94 | 101 | ||||||
6.000% due 2020 | 269 | 292 | ||||||
5.500% due 2021 | 185 | 199 | ||||||
5.500% due 2022 | 243 | 261 | ||||||
5.500% due 2023 | 226 | 245 | ||||||
4.500% due 2025 | 1,267 | 1,341 | ||||||
6.000% due 2026 | 452 | 491 | ||||||
6.000% due 2027 | 246 | 267 | ||||||
6.000% due 2028 | 18 | 20 | ||||||
6.000% due 2032 | 252 | 278 | ||||||
5.000% due 2033 | 102 | 108 | ||||||
5.500% due 2033 | 16 | 18 | ||||||
6.000% due 2033 | 13 | 14 | ||||||
5.000% due 2034 | 788 | 834 | ||||||
5.500% due 2034 | 613 | 662 | ||||||
5.500% due 2035 | 6 | 6 | ||||||
3.865% due 2036 (Ê) | 271 | 270 | ||||||
5.500% due 2037 | 880 | 942 | ||||||
6.000% due 2037 | 596 | 653 | ||||||
6.500% due 2037 | 9,795 | 10,893 | ||||||
5.500% due 2038 | 4,303 | 4,627 | ||||||
6.000% due 2038 | 1,168 | 1,283 | ||||||
4.500% due 2039 | 2,694 | 2,779 | ||||||
4.000% due 2040 | 7,137 | 7,111 | ||||||
4.500% due 2040 | 4,848 | 4,985 | ||||||
15 Year TBA(Ï) | ||||||||
3.000% | 4,000 | 3,909 | ||||||
3.500% | 1,865 | 1,878 | ||||||
4.000% | 2,000 | 2,060 | ||||||
30 Year TBA(Ï) | ||||||||
4.000% | 1,000 | 995 | ||||||
4.500% | 25,000 | 25,658 | ||||||
5.000% | 2,000 | 2,103 | ||||||
5.500% | 7,000 | 7,489 | ||||||
Series 2003-343 Class 6 | 149 | 27 | ||||||
Series 2003-345 Class 18 | 370 | 40 | ||||||
Series 2003-345 Class 19 | 409 | 44 | ||||||
Series 2005-365 Class 12 | 573 | 94 | ||||||
Series 2006-369 Class 8 | 105 | 18 | ||||||
Fannie Mae REMICS | ||||||||
Series 1999-56 Class Z | 63 | 71 | ||||||
| Principal Amount ($) or Shares | Market Value $ | |||||||
Series 2003-32 Class FH | 126 | 126 | ||||||
Series 2003-35 Class FY | 199 | 200 | ||||||
Series 2006-27 Class SH | 3,078 | 444 | ||||||
Series 2006-48 Class LG | 12 | 11 | ||||||
Series 2007-30 Class AF | 105 | 105 | ||||||
Series 2010-95 Class S | 3,125 | 514 | ||||||
Fannie Mae Whole Loan | ||||||||
Series 2003-W1 Class 1A1 | 29 | 33 | ||||||
Federal Home Loan Mortgage Corp. Structured Pass Through Securities | 23 | 22 | ||||||
Freddie Mac | ||||||||
6.000% due 2016 | 12 | 13 | ||||||
5.000% due 2018 | 173 | 184 | ||||||
5.000% due 2019 | 337 | 360 | ||||||
5.000% due 2020 | 308 | 329 | ||||||
3.500% due 2025 | 1,500 | 1,511 | ||||||
2.813% due 2030 (Ê) | 1 | 1 | ||||||
5.000% due 2035 | 1,072 | 1,130 | ||||||
5.293% due 2037 (Ê) | 235 | 249 | ||||||
5.500% due 2037 | 1,018 | 1,079 | ||||||
6.000% due 2037 | 924 | 1,020 | ||||||
5.500% due 2038 | 4,082 | 4,412 | ||||||
6.000% due 2038 | 2,677 | 2,945 | ||||||
4.500% due 2039 | 3,020 | 3,121 | ||||||
6.000% due 2039 | 94 | 104 | ||||||
4.500% due 2040 | 1,871 | 1,919 | ||||||
5.500% due 2040 | 928 | 990 | ||||||
15 Year TBA (Ï) | ||||||||
3.500% | 8,110 | 8,158 | ||||||
30 Year TBA (Ï) | ||||||||
4.000% | 3,000 | 2,978 | ||||||
5.000% | 3,000 | 3,146 | ||||||
5.500% | 3,000 | 3,197 | ||||||
Freddie Mac REMICS | 9 | 9 | ||||||
Series 2005-3019 Class IM | 55 | 2 | ||||||
Series 2007-3335 Class BF | 148 | 148 | ||||||
Series 2007-3335 Class FT | 307 | 306 | ||||||
Ginnie Mae I | ||||||||
3.950% due 2025 | 100 | 100 | ||||||
6.000% due 2029 | 7 | 8 | ||||||
| Core Bond Fund | 61 |
Table of Contents
Russell Investment Funds
Core Bond Fund
Schedule of Investments, continued — December 31, 2010
Amounts in thousands (except share amounts)
| Principal Amount ($) or Shares | Market Value $ | |||||||
6.500% due 2037 | 537 | 606 | ||||||
6.500% due 2038 | 1,928 | 2,177 | ||||||
4.500% due 2039 | 1,814 | 1,887 | ||||||
5.500% due 2039 | 162 | 176 | ||||||
6.500% due 2039 | 747 | 843 | ||||||
30 Year TBA (Ï) | ||||||||
3.500% | 3,000 | 2,888 | ||||||
4.000% | 3,755 | 3,780 | ||||||
Ginnie Mae II | ||||||||
3.375% due 2026 (Ê) | 117 | 121 | ||||||
2.625% due 2027 (Ê) | 8 | 8 | ||||||
2.750% due 2032 (Ê) | 43 | 44 | ||||||
30 Year TBA(Ï) | ||||||||
4.000% | 4,840 | 4,833 | ||||||
5.000% | 1,000 | 1,063 | ||||||
Goldman Sachs Mortgage Securities Corp. II | 500 | 523 | ||||||
Government National Mortgage Association | 13 | 13 | ||||||
Interest Only STRIP | 2,923 | 435 | ||||||
Series 2010-116 Class MP | 2,094 | 2,094 | ||||||
Greenwich Capital Commercial Funding Corp. | 685 | 717 | ||||||
Series 2004-GG1 Class A7 | 465 | 502 | ||||||
Series 2006-GG7 Class A4 | 1,105 | 1,206 | ||||||
Series 2007-GG9 Class A4 | 1,115 | 1,175 | ||||||
GS Mortgage Securities Corp. II | 320 | 344 | ||||||
Series 2006-GG8 Class AAB | 200 | 212 | ||||||
GSR Mortgage Loan Trust | 160 | 156 | ||||||
Series 2006-2F Class 3A3 | 812 | 652 | ||||||
Series 2006-3F Class 2A3 | 385 | 340 | ||||||
Series 2006-8F Class 4A17 | 543 | 467 | ||||||
Series 2007-AR1 Class 1A1 | 1,708 | 1,081 | ||||||
Series 2007-AR2 Class 2A1 | 1,006 | 763 | ||||||
Harborview Mortgage Loan Trust | 1,404 | 951 | ||||||
Series 2005-4 Class 3A1 | 122 | 97 | ||||||
| Principal Amount ($) or Shares | Market Value $ | |||||||
Indymac Index Mortgage Loan Trust | 512 | 426 | ||||||
Series 2006-AR35 Class 2A1A | 544 | 292 | ||||||
Series 2007-AR5 Class 1A1 | 632 | 317 | ||||||
JP Morgan Chase Commercial Mortgage Securities Corp. | 646 | 664 | ||||||
Series 2004-LN2 Class A1 | 231 | 236 | ||||||
Series 2005-LDP4 Class A3A1 | 185 | 187 | ||||||
Series 2005-LDP4 Class A4 | 325 | 344 | ||||||
Series 2005-LDP5 Class A4 | 390 | 420 | ||||||
Series 2006-CB16 Class A4 | 220 | 235 | ||||||
Series 2006-LDP7 Class A4 | 650 | 711 | ||||||
Series 2006-LDP8 Class A3B | 250 | 261 | ||||||
Series 2006-LDP8 Class A4 | 290 | 309 | ||||||
Series 2007-CB18 Class A4 | 1,200 | 1,258 | ||||||
Series 2007-CB19 Class A4 | 340 | 361 | ||||||
Series 2007-LD12 Class A4 | 100 | 106 | ||||||
Series 2007-LDPX Class A3 | 700 | 728 | ||||||
JP Morgan Mortgage Trust | 60 | 60 | ||||||
Series 2005-A5 Class TA1 | 562 | 551 | ||||||
Series 2005-S3 Class 1A2 | ||||||||
5.750% due 01/25/36 | 95 | 86 | ||||||
Series 2007-A1 Class 2A2 | 406 | 377 | ||||||
Series 2007-A4 Class 3A1 | 2,182 | 1,900 | ||||||
Series 2007-S3 Class 1A8 | 1,401 | 1,339 | ||||||
LB-UBS Commercial Mortgage Trust | 1,500 | 1,602 | ||||||
Lehman Mortgage Trust | 258 | 211 | ||||||
Series 2006-8 Class 2A1 | 639 | 363 | ||||||
Series 2007-8 Class 3A1 | 797 | 438 | ||||||
| 62 | Core Bond Fund |
Table of Contents
Russell Investment Funds
Core Bond Fund
Schedule of Investments, continued — December 31, 2010
Amounts in thousands (except share amounts)
| Principal Amount ($) or Shares | Market Value $ | |||||||
Lehman XS Trust | 785 | 425 | ||||||
MASTR Alternative Loans Trust Series | 147 | 99 | ||||||
Series 2004-10 Class 5A6 | 152 | 152 | ||||||
Mellon Residential Funding Corp. | 108 | 105 | ||||||
Merrill Lynch Floating Trust | 405 | 393 | ||||||
Merrill Lynch Mortgage Investors, Inc. | 83 | 63 | ||||||
Merrill Lynch/Countrywide Commercial Mortgage Trust | 100 | 102 | ||||||
MLCC Mortgage Investors, Inc. | 49 | 44 | ||||||
Morgan Stanley Capital I | 740 | 784 | ||||||
Series 2005-IQ10 Class AAB | 407 | 427 | ||||||
Series 2006-HQ9 Class A4 | 295 | 320 | ||||||
Series 2006-HQ10 Class A4 | 130 | 138 | ||||||
Series 2007-T27 Class A4 | 675 | 733 | ||||||
NCUA Guaranteed Notes | 498 | 484 | ||||||
Series 2010-R1 Class 1A | 1,572 | 1,570 | ||||||
Series 2010-R2 Class 1A | 1,591 | 1,591 | ||||||
Series 2010-R2 Class 2A | 806 | 801 | ||||||
Prime Mortgage Trust | 19 | 17 | ||||||
Residential Accredit Loans, Inc. | 1,708 | 981 | ||||||
Series 2005-QS13 Class 2A3 | 386 | 338 | ||||||
Series 2007-QO4 Class A1 | 1,383 | 811 | ||||||
Residential Asset Securitization Trust | 151 | 140 | ||||||
| Principal Amount ($) or Shares | Market Value $ | |||||||
Series 2005-A10 Class A3 | 319 | 269 | ||||||
Series 2006-A9CB Class A6 | 259 | 156 | ||||||
Residential Funding Mortgage Securities I | 440 | 352 | ||||||
Series 2006-SA4 Class 2A1 | 281 | 208 | ||||||
Sequoia Mortgage Trust | 46 | 39 | ||||||
Structured Adjustable Rate Mortgage Loan Trust | 48 | 41 | ||||||
Series 2004-16 Class 3A1 | 187 | 161 | ||||||
Series 2006-12 Class 2A1 | 620 | 481 | ||||||
Structured Asset Mortgage Investments, Inc. | 138 | 128 | ||||||
Series 2006-AR2 Class A1 | 446 | 290 | ||||||
Series 2006-AR8 Class A1A | 623 | 403 | ||||||
Structured Asset Securities Corp. | 733 | 712 | ||||||
Suntrust Adjustable Rate Mortgage Loan Trust | 3,044 | 2,586 | ||||||
Thornburg Mortgage Securities Trust | 752 | 745 | ||||||
Series 2006-6 Class A1 | 76 | 75 | ||||||
Wachovia Bank Commercial Mortgage Trust | 1,000 | 1,081 | ||||||
Series 2006-C27 Class A3 | 700 | 753 | ||||||
Washington Mutual Alternative Mortgage Pass-Through Certificates | 585 | 278 | ||||||
Washington Mutual Mortgage Pass Through Certificates | 189 | 10 | ||||||
Series 2005-AR13 Class A1A1 | 28 | 23 | ||||||
Series 2005-AR17 Class A1A1 | 332 | 283 | ||||||
Series 2006-AR2 Class 1A1 | 475 | 386 | ||||||
| Core Bond Fund | 63 |
Table of Contents
Russell Investment Funds
Core Bond Fund
Schedule of Investments, continued — December 31, 2010
Amounts in thousands (except share amounts)
| Principal Amount ($) or Shares | Market Value $ | |||||||
Series 2007-HY3 Class 4B1 Interest Only STRIP | 124 | 9 | ||||||
Wells Fargo Mortgage Backed Securities Trust | 250 | 233 | ||||||
Series 2006-6 Class 1A22 | 1,300 | 1,208 | ||||||
Series 2006-AR2 Class 2A1 | 205 | 181 | ||||||
Series 2006-AR10 Class 4A1 | 55 | 43 | ||||||
Series 2006-AR14 Class 1A7 | 1,700 | 1,450 | ||||||
Series 2006-AR17 Class A1 | 1,116 | 908 | ||||||
Series 2007-8 Class 1A16 | 224 | 200 | ||||||
Series 2007-AR8 Class A1 | 375 | 302 | ||||||
| 214,431 | ||||||||
| Municipal Bonds - 1.9% | ||||||||
Chicago Transit Authority Revenue Bonds | 400 | 396 | ||||||
City of New York New York General Obligation Unlimited | 1,100 | 1,077 | ||||||
Connecticut State Health & Educational Facility Authority Revenue Bonds | 100 | 101 | ||||||
County of Clark Nevada Revenue Bonds | 100 | 98 | ||||||
Illinois Municipal Electric Agency Revenue Bonds | 100 | 103 | ||||||
Irvine Ranch Water District Revenue Bonds | 1,000 | 1,003 | ||||||
Los Angeles Unified School District General Obligation Unlimited | 400 | 392 | ||||||
New Jersey State Turnpike Authority Revenue Bonds | 1,000 | 1,084 | ||||||
New York State Dormitory Authority Revenue Bonds | 50 | 50 | ||||||
North Carolina Turnkpike Authority Revenue Bonds | 100 | 104 | ||||||
Northern California Power Agency Revenue Bonds | 1,000 | 1,011 | ||||||
Public Power Generation Agency Revenue Bonds | 100 | 99 | ||||||
| Principal Amount ($) or Shares | Market Value $ | |||||||
State of California General Obligation Unlimited | 425 | 439 | ||||||
7.950% due 03/01/36 | 110 | 113 | ||||||
5.650% due 04/01/39 (Ê) | 100 | 106 | ||||||
7.550% due 04/01/39 | 655 | 680 | ||||||
7.625% due 03/01/40 | 400 | 417 | ||||||
7.600% due 11/01/40 | 325 | 338 | ||||||
State of Illinois General Obligation Unlimited | 100 | 101 | ||||||
7.350% due 07/01/35 | 550 | 539 | ||||||
State of Louisiana Revenue Bonds | 400 | 404 | ||||||
University of California Revenue Bonds | 400 | 388 | ||||||
| 9,043 | ||||||||
| Non-US Bonds - 1.5% | ||||||||
Argentina Government International Bond | EUR 1,730 | 290 | ||||||
Canadian Government Bond | CAD 400 | 409 | ||||||
2.000% due 12/01/14 | CAD 1,000 | 997 | ||||||
FCE Bank plc | EUR 600 | 838 | ||||||
Federative Republic of Brazil | BRL 300 | 215 | ||||||
10.250% due 01/10/28 | BRL 1,400 | 875 | ||||||
Fortis Bank Nederland Holding NV | EUR 200 | 273 | ||||||
Hellas Telecommunications Luxembourg V Series REGS | EUR 128 | 38 | ||||||
Impress Holdings BV Series REGS | EUR 125 | 166 | ||||||
Mexican Bonos Series M 20 | MXN 3,991 | 403 | ||||||
Mexican Bonos Desarr | MXN 1,726 | 149 | ||||||
Morgan Stanley | EUR 600 | 766 | ||||||
Province of Ontario Canada | CAD 400 | 423 | ||||||
4.600% due 06/02/39 | CAD 100 | 105 | ||||||
Societe Financement de l’Economie Francaise | EUR 100 | 136 | ||||||
South Africa Government Bond | ZAR 1,900 | 287 | ||||||
Series R208 | ZAR 4,340 | 594 | ||||||
| 6,964 | ||||||||
| United States Government Agencies - 3.8% | ||||||||
Fannie Mae | 900 | 1,036 | ||||||
| 64 | Core Bond Fund |
Table of Contents
Russell Investment Funds
Core Bond Fund
Schedule of Investments, continued — December 31, 2010
Amounts in thousands (except share amounts)
| Principal Amount ($) or Shares | Market Value $ | |||||||
Federal Home Loan Banks | 1,570 | 1,570 | ||||||
3.625% due 10/18/13 | 100 | 107 | ||||||
3.125% due 12/13/13 | 200 | 211 | ||||||
4.500% due 09/13/19 | 1,100 | 1,183 | ||||||
Federal Home Loan Mortgage Corp. | 2,970 | 2,976 | ||||||
1.750% due 09/10/15 | 1,000 | 983 | ||||||
Federal National Mortgage Association | 855 | 855 | ||||||
0.420% due 09/13/12 (Ê) | 1,455 | 1,457 | ||||||
0.291% due 10/18/12 (Ê) | 1,485 | 1,486 | ||||||
1.250% due 08/20/13 | 100 | 101 | ||||||
1.125% due 09/30/13 | 100 | 100 | ||||||
2.875% due 12/11/13 | 100 | 105 | ||||||
0.750% due 12/18/13 | 2,600 | 2,571 | ||||||
3.000% due 09/16/14 | 500 | 527 | ||||||
1.625% due 10/26/15 | 100 | 97 | ||||||
Freddie Mac | 500 | 560 | ||||||
4.375% due 07/17/15 | 900 | 993 | ||||||
5.250% due 04/18/16 | 600 | 686 | ||||||
5.000% due 02/16/17 | 100 | 113 | ||||||
Tennessee Valley Authority | 100 | 94 | ||||||
| 17,811 | ||||||||
| United States Government Treasuries - 9.3% | ||||||||
United States Treasury Principal | 1,938 | 1,288 | ||||||
United States Treasury Inflation Indexed Bonds | ||||||||
3.375% due 01/15/12 (Æ) | 1,293 | 1,352 | ||||||
3.000% due 07/15/12 | 730 | 775 | ||||||
2.000% due 01/15/16 (Æ) | 1,320 | 1,437 | ||||||
1.250% due 07/15/20 (Æ) | 401 | 411 | ||||||
2.375% due 01/15/25 (Æ) | 4,125 | 4,590 | ||||||
2.375% due 01/15/27 (Æ) | 2,169 | 2,410 | ||||||
1.750% due 01/15/28 (Æ) | 104 | 106 | ||||||
2.500% due 01/15/29 (Æ) | 1,324 | 1,503 | ||||||
3.375% due 04/15/32 | 862 | 1,115 | ||||||
United States Treasury Notes | ||||||||
0.500% due 11/30/12 | 1,300 | 1,298 | ||||||
1.125% due 06/15/13 | 100 | 101 | ||||||
0.500% due 11/15/13 | 1,500 | 1,481 | ||||||
0.750% due 12/15/13 | 1,100 | 1,092 | ||||||
2.375% due 09/30/14 | 1,600 | 1,657 | ||||||
1.250% due 10/31/15 | 900 | 871 | ||||||
3.000% due 09/30/16 | 2,635 | 2,733 | ||||||
3.125% due 04/30/17 | 8,468 | 8,775 | ||||||
3.375% due 11/15/19 | 4,595 | 4,691 | ||||||
3.625% due 02/15/20 | 2,170 | 2,252 | ||||||
8.000% due 11/15/21 | 840 | 1,188 | ||||||
4.375% due 05/15/40 | 1,730 | 1,738 | ||||||
4.250% due 11/15/40 | 800 | 787 | ||||||
| 43,651 | ||||||||
| Total Long-Term Investments (cost $430,319) | 438,438 | |||||||
| Principal Amount ($) or Shares | Market Value $ | |||||||
| Preferred Stocks - 0.2% | ||||||||
| Consumer Discretionary - 0.1% | ||||||||
Motors Liquidation Co. (Æ) | 80,000 | 656 | ||||||
| Financial Services - 0.1% | ||||||||
DG Funding Trust (Å)(Æ) | 49 | 374 | ||||||
| Total Preferred Stocks (cost $766) | 1,030 | |||||||
| Short-Term Investments - 19.4% | ||||||||
Ally Financial, Inc. | 525 | 539 | ||||||
Series * | 525 | 528 | ||||||
American Express Travel Related Services Co., Inc. | 100 | 100 | ||||||
Cellco Partnership / Verizon Wireless Capital LLC | 400 | 404 | ||||||
Countrywide Home Loans, Inc. | 290 | 292 | ||||||
DCP Midstream LLC | 20 | 20 | ||||||
Delta Air Lines 2001-1 Class A-2 | 400 | 413 | ||||||
Deutsche Bank AG | 7,250 | 1,221 | ||||||
DPL, Inc. | 193 | 200 | ||||||
FirstEnergy Corp. | 12 | 12 | ||||||
General Electric Capital Corp. | 220 | 223 | ||||||
Goldman Sachs Group, Inc. (The) | 1,020 | 1,028 | ||||||
HCP, Inc. | 585 | 604 | ||||||
International Lease Finance Corp. | 600 | 602 | ||||||
5.750% due 06/15/11 | 800 | 804 | ||||||
1.058% due 08/15/11 (Ê) | 100 | 130 | ||||||
Jackson National Life Fund LLC | 2,800 | 2,785 | ||||||
MetLife, Inc. | 205 | 215 | ||||||
Progress Energy, Inc. | 77 | 78 | ||||||
Qwest Corp. | 120 | 124 | ||||||
Reckson Operating Partnership, LP | 92 | 92 | ||||||
Royal Bank of Scotland PLC (The) | 800 | 800 | ||||||
3.000% due 12/09/11 (Þ) | 400 | 408 | ||||||
| Core Bond Fund | 65 |
Table of Contents
Russell Investment Funds
Core Bond Fund
Schedule of Investments, continued — December 31, 2010
Amounts in thousands (except share amounts)
| Principal Amount ($) or Shares | Market Value $ | |||||||
Russell U.S. Cash Management Fund | 69,483,132 | (¥) | 69,483 | |||||
Systems 2001 AT LLC | 25 | 26 | ||||||
Telecom Italia Capital SA | 255 | 262 | ||||||
UBS Finance Delaware LLC | 935 | 935 | ||||||
United States Treasury Bills | 1,220 | 1,220 | ||||||
0.171% due 02/10/11 (ç)(ž) | 32 | 32 | ||||||
0.175% due 02/10/11 (ç) | 25 | 25 | ||||||
0.183% due 02/10/11 (ç) | 90 | 90 | ||||||
0.180% due 06/09/11 (ž) | 290 | 290 | ||||||
United States Treasury Inflation Indexed Bonds | 1,464 | 1,465 | ||||||
2.375% due 04/15/11 | 661 | 667 | ||||||
United States Treasury Notes | 4,830 | 4,841 | ||||||
UnitedHealth Group, Inc. | 95 | 96 | ||||||
Westpac Banking Corp. | 300 | 307 | ||||||
| Total Short-Term Investments (cost $91,618) | 91,361 | |||||||
| Repurchase Agreements - 0.9% | ||||||||
Agreement with Credit Suisse Securities (USA) LLC and State Street Bank | 4,100 | 4,100 | ||||||
| Total Repurchase Agreements (cost $4,100) | 4,100 | |||||||
| Other Securities - 2.8% | ||||||||
Russell Investment Funds Liquidating Trust (X) | 8,273,541 | (¥) | 8,274 | |||||
Russell U.S. Cash Collateral Fund (X) | 4,890,399 | (¥) | 4,890 | |||||
| Total Other Securities (cost $13,164) | 13,164 | |||||||
| Total Investments - 116.1% (identified cost $539,967) | 548,093 | |||||||
| Other Assets and Liabilities, Net - (16.1%) | (76,195 | ) | ||||||
| Net Assets - 100.0% | 471,898 | |||||||
See accompanying notes which are an integral part of the financial statements.
| 66 | Core Bond Fund |
Table of Contents
Russell Investment Funds
Core Bond Fund
Schedule of Investments, continued — December 31, 2010
Amounts in thousands (except share amounts)
| Futures Contracts | Number of Contracts | Notional Amount | Expiration Date | Unrealized Appreciation (Depreciation) $ | ||||||||||||
Long Positions | ||||||||||||||||
Euribor Futures (Germany) | 2 | GBP | 247 | 12/11 | (1 | ) | ||||||||||
Euribor Futures (Germany) | 2 | GBP | 246 | 03/12 | (1 | ) | ||||||||||
Euribor Futures (Germany) | 2 | GBP | 246 | 06/12 | (2 | ) | ||||||||||
Euribor Futures (Germany) | 1 | GBP | 122 | 09/12 | (1 | ) | ||||||||||
Euro Bobl Futures (Germany) | 43 | EUR | 5,108 | 03/11 | 21 | |||||||||||
Euro Bund Futures (Germany) | 27 | EUR | 3,383 | 03/11 | 17 | |||||||||||
Eurodollar Futures (CME) | 73 | USD | 18,183 | 03/11 | 8 | |||||||||||
Eurodollar Futures (CME) | 163 | USD | 40,571 | 06/11 | 39 | |||||||||||
Eurodollar Futures (CME) | 16 | USD | 3,978 | 09/11 | 8 | |||||||||||
Eurodollar Futures (CME) | 30 | USD | 7,445 | 12/11 | (3 | ) | ||||||||||
Eurodollar Futures (CME) | 42 | USD | 10,400 | 03/12 | (18 | ) | ||||||||||
Eurodollar Futures (CME) | 39 | USD | 9,631 | 06/12 | (28 | ) | ||||||||||
Eurodollar Futures (CME) | 38 | USD | 9,358 | 09/12 | (60 | ) | ||||||||||
Eurodollar Futures (CME) | 40 | USD | 9,822 | 12/12 | (54 | ) | ||||||||||
Eurodollar Futures (CME) | 9 | USD | 2,204 | 03/13 | (21 | ) | ||||||||||
Eurodollar Futures (CME) | 2 | USD | 488 | 06/13 | (5 | ) | ||||||||||
Eurodollar Futures (CME) | 6 | USD | 1,461 | 09/13 | (17 | ) | ||||||||||
Long Gilt Bond (UK) | 1 | GBP | 119 | 03/11 | — | |||||||||||
Ultra Long Term U.S. Treasury Bond Future | 36 | USD | 4,575 | 03/11 | 77 | |||||||||||
United States Treasury 2 Year Note Futures | 50 | USD | 10,945 | 03/11 | (11 | ) | ||||||||||
United States Treasury 5 Year Note Futures | 161 | USD | 18,953 | 03/11 | (227 | ) | ||||||||||
United States Treasury 10 Year Note Futures | 64 | USD | 7,708 | 03/11 | (175 | ) | ||||||||||
United States Treasury 30 Year Bond Futures | 7 | USD | 855 | 03/11 | 8 | |||||||||||
| Short Positions | ||||||||||||||||
Japanese Government 10 Year Bond Futures (Japan) | 2 | JPY | 281,220 | 03/11 | (1 | ) | ||||||||||
United States Treasury 5 Year Note Futures | 1 | USD | 118 | 03/11 | 2 | |||||||||||
United States Treasury 10 Year Note Futures | 23 | USD | 2,770 | 03/11 | 32 | |||||||||||
United States Treasury 30 Year Bond Futures | 8 | USD | 977 | 03/11 | 10 | |||||||||||
Total Unrealized Appreciation (Depreciation) on Open Futures Contracts | (403 | ) | ||||||||||||||
See accompanying notes which are an integral part of the financial statements.
| Core Bond Fund | 67 |
Table of Contents
Russell Investment Funds
Core Bond Fund
Schedule of Investments, continued — December 31, 2010
Amounts in thousands
| Options Written (Number of Contracts) | Notional | Market Value $ | ||||||||||
| Eurodollar Futures | ||||||||||||
Sep 2011 99.38 Call (29) | USD | 73 | (17 | ) | ||||||||
Sep 2011 99.38 Put (29) | USD | 73 | (12 | ) | ||||||||
| Forward Volatility Agreements | ||||||||||||
Oct 2011 0.00 Call (1) | USD | 3,500 | (59 | ) | ||||||||
Oct 2011 0.01 Call (2) | USD | 2,100 | (17 | ) | ||||||||
Nov 2011 0.00 Call (1) | USD | 1,600 | (27 | ) | ||||||||
| Inflationary Floor Options | ||||||||||||
Nov 2020 0.00 Call (1) | USD | 810 | (9 | ) | ||||||||
Mar 2020 0.00 Put (2) | USD | 2,400 | (24 | ) | ||||||||
Apr 2020 0.00 Put (1) | USD | 5,500 | (55 | ) | ||||||||
Sep 2020 0.00 Put (1) | USD | 300 | (3 | ) | ||||||||
| Swaptions | ||||||||||||
| (Fund Receives/Fund Pays) USD Three Month LIBOR/USD 1.250% Feb 2011 0.00 Call (2) | 4,800 | — | ||||||||||
| USD Three Month LIBOR/USD 3.670% Jun 2011 0.00 Call (1) | 4,000 | (104 | ) | |||||||||
| USD 5.000%/USD 3 Month LIBOR Jan 2011 0.00 Put (1) | 1,100 | — | ||||||||||
| USD 1.800%/USD Three Month LIBOR Feb 2011 0.00 Put (2) | 4,800 | (114 | ) | |||||||||
| USD 3.670%/USD Three Month LIBOR Jun 2011 0.00 Put (1) | 4,000 | (121 | ) | |||||||||
| USD 4.000%/USD 3 Month LIBOR Jun 2011 0.00 Put (5) | 1,700 | (27 | ) | |||||||||
| USD 0.650%/USD Three Month LIBOR Nov 2011 0.00 Put (1) | 2,200 | (11 | ) | |||||||||
| USD 3.000%/USD 3 Month LIBOR Jun 2012 0.00 Put (6) | 17,100 | (216 | ) | |||||||||
| USD 10.000%/USD 3 Month LIBOR Jul 2012 0.00 Put (2) | 10,200 | (7 | ) | |||||||||
| USD 2.250%/USD 3 Month LIBOR Sep 2012 0.00 Put (5) | 12,300 | (166 | ) | |||||||||
| USD 1.000%/USD 3 Month LIBOR Nov 2012 0.00 Put (1) | 2,500 | (30 | ) | |||||||||
| USD 1.750%/USD Three Month LIBOR Nov 2012 0.00 Put (1) | 2,900 | (22 | ) | |||||||||
| United States Treasury 10 Year Note Futures | ||||||||||||
Feb 2011 118.00 Put (10) | USD | 10 | (6 | ) | ||||||||
Feb 2011 122.00 Put (10) | USD | 10 | (24 | ) | ||||||||
Feb 2011 123.00 Put (10) | USD | 10 | (30 | ) | ||||||||
Total Liability for Options Written (premiums received $873) | (1,101 | ) | ||||||||||
See accompanying notes which are an integral part of the financial statements.
| 68 | Core Bond Fund |
Table of Contents
Russell Investment Funds
Core Bond Fund
Schedule of Investments, continued — December 31, 2010
Amounts in thousands
| Foreign Currency Exchange Contracts | ||||||||||||||||||
Counterparty | Amount Sold | Amount Bought | Settlement Date | Unrealized Appreciation (Depreciation) $ | ||||||||||||||
Bank of America | USD | 198 | CAD | 201 | 02/17/11 | 4 | ||||||||||||
Bank of America | USD | 100 | PHP | 4,268 | 02/07/11 | (3 | ) | |||||||||||
Bank of America | USD | 100 | SGD | 129 | 01/14/11 | 1 | ||||||||||||
Bank of America | USD | 99 | TWD | 3,017 | 01/14/11 | 5 | ||||||||||||
Barclays Bank PLC | USD | 211 | CNY | 1,400 | 01/10/11 | 1 | ||||||||||||
Barclays Bank PLC | USD | 99 | JPY | 8,270 | 01/14/11 | 3 | ||||||||||||
Barclays Bank PLC | USD | 100 | MXN | 1,249 | 02/22/11 | 1 | ||||||||||||
Barclays Bank PLC | USD | 203 | PHP | 8,808 | 02/14/11 | (2 | ) | |||||||||||
Barclays Bank PLC | USD | 100 | TRY | 155 | 01/27/11 | — | ||||||||||||
Barclays Bank PLC | EUR | 87 | SEK | 804 | 03/16/11 | 3 | ||||||||||||
Barclays Bank PLC | EUR | 30 | USD | 39 | 01/25/11 | (1 | ) | |||||||||||
Barclays Bank PLC | GBP | 41 | USD | 64 | 03/21/11 | — | ||||||||||||
BNP Paribas | USD | 99 | CAD | 101 | 02/17/11 | 2 | ||||||||||||
BNP Paribas | USD | 211 | CNY | 1,400 | 04/07/11 | 1 | ||||||||||||
BNP Paribas | USD | 1,087 | KRW | 1,258,138 | 03/09/11 | 18 | ||||||||||||
BNP Paribas | CNY | 1,400 | USD | 210 | 01/10/11 | (2 | ) | |||||||||||
BNP Paribas | EUR | 100 | USD | 131 | 01/25/11 | (2 | ) | |||||||||||
BNP Paribas | KRW | 1,258,138 | USD | 1,089 | 01/19/11 | (19 | ) | |||||||||||
Citibank | USD | 1,962 | BRL | 3,361 | 02/02/11 | 49 | ||||||||||||
Citibank | USD | 2,089 | EUR | 1,544 | 01/06/11 | (26 | ) | |||||||||||
Citibank | USD | 217 | EUR | 162 | 03/16/11 | — | ||||||||||||
Citibank | USD | 428 | EUR | 318 | 03/16/11 | (3 | ) | |||||||||||
Citibank | USD | 100 | JPY | 8,112 | 01/06/11 | — | ||||||||||||
Citibank | USD | 100 | KRW | 111,020 | 01/19/11 | (2 | ) | |||||||||||
Citibank | USD | 100 | KRW | 112,000 | 01/19/11 | (1 | ) | |||||||||||
Citibank | USD | 308 | MXN | 3,977 | 01/14/11 | 14 | ||||||||||||
Citibank | USD | 288 | MXN | 3,588 | 01/21/11 | 2 | ||||||||||||
Citibank | USD | 100 | MXN | 1,232 | 02/22/11 | (1 | ) | |||||||||||
Citibank | USD | 100 | MXN | 1,231 | 02/22/11 | (1 | ) | |||||||||||
Citibank | USD | 129 | NZD | 174 | 03/16/11 | 6 | ||||||||||||
Citibank | USD | 33 | PHP | 1,470 | 02/07/11 | — | ||||||||||||
Citibank | USD | 33 | PHP | 1,471 | 02/07/11 | — | ||||||||||||
Citibank | USD | 100 | PHP | 4,280 | 02/07/11 | (2 | ) | |||||||||||
Citibank | USD | 100 | PHP | 4,287 | 02/07/11 | (2 | ) | |||||||||||
Citibank | USD | 100 | PHP | 4,360 | 02/07/11 | — | ||||||||||||
Citibank | EUR | 3,705 | USD | 5,151 | 01/25/11 | 200 | ||||||||||||
Citibank | EUR | 162 | USD | 214 | 03/16/11 | (2 | ) | |||||||||||
Citibank | SEK | 1,459 | EUR | 160 | 03/16/11 | (3 | ) | |||||||||||
Credit Suisse First Boston | USD | 473 | AUD | 497 | 01/28/11 | 34 | ||||||||||||
Credit Suisse First Boston | USD | 214 | EUR | 161 | 03/16/11 | 1 | ||||||||||||
Credit Suisse First Boston | USD | 197 | JPY | 16,561 | 01/14/11 | 7 | ||||||||||||
Credit Suisse First Boston | USD | 1,028 | JPY | 84,327 | 03/16/11 | 12 | ||||||||||||
Credit Suisse First Boston | EUR | 198 | USD | 266 | 01/25/11 | 1 | ||||||||||||
Credit Suisse First Boston | EUR | 164 | USD | 214 | 03/16/11 | (5 | ) | |||||||||||
Credit Suisse First Boston | JPY | 31,882 | USD | 381 | 03/16/11 | (12 | ) | |||||||||||
Deutsche Bank AG | USD | 2,439 | CAD | 2,457 | 02/17/11 | 29 | ||||||||||||
Deutsche Bank AG | USD | 153 | GBP | 100 | 03/16/11 | 2 | ||||||||||||
Deutsche Bank AG | USD | 204 | INR | 9,181 | 01/21/11 | 1 | ||||||||||||
Deutsche Bank AG | USD | 162 | MXN | 2,031 | 01/21/11 | 3 | ||||||||||||
Deutsche Bank AG | USD | 193 | NZD | 260 | 03/16/11 | 9 | ||||||||||||
Deutsche Bank AG | USD | 61 | TWD | 1,800 | 04/06/11 | 1 | ||||||||||||
Deutsche Bank AG | AUD | 131 | JPY | 10,542 | 03/16/11 | (3 | ) | |||||||||||
Deutsche Bank AG | AUD | 217 | NZD | 284 | 03/16/11 | — | ||||||||||||
Deutsche Bank AG | EUR | 199 | CAD | 266 | 03/16/11 | 1 | ||||||||||||
See accompanying notes which are an integral part of the financial statements.
| Core Bond Fund | 69 |
Table of Contents
Russell Investment Funds
Core Bond Fund
Schedule of Investments, continued — December 31, 2010
Amounts in thousands
| Foreign Currency Exchange Contracts | ||||||||||||||||||||
Counterparty | Amount Sold | Amount Bought | Settlement Date | Unrealized Appreciation (Depreciation) $ | ||||||||||||||||
Deutsche Bank AG | EUR | 165 | GBP | 139 | 03/16/11 | (4 | ) | |||||||||||||
Deutsche Bank AG | EUR | 8 | USD | 11 | 01/11/11 | — | ||||||||||||||
Deutsche Bank AG | GBP | 41 | USD | 64 | 03/21/11 | — | ||||||||||||||
Deutsche Bank AG | MXN | 1,033 | USD | 83 | 01/21/11 | — | ||||||||||||||
Deutsche Bank AG | MXN | 1,920 | USD | 154 | 01/21/11 | (1 | ) | |||||||||||||
Deutsche Bank AG | TWD | 1,800 | USD | 60 | 01/14/11 | (2 | ) | |||||||||||||
Deutsche Bank AG | ZAR | 5,841 | USD | 850 | 01/31/11 | (33 | ) | |||||||||||||
Goldman Sachs | USD | 403 | IDR | 3,613,500 | 01/19/11 | (3 | ) | |||||||||||||
Goldman Sachs | USD | 100 | SGD | 130 | 01/14/11 | 1 | ||||||||||||||
Goldman Sachs | USD | 41 | TWD | 1,217 | 04/06/11 | 1 | ||||||||||||||
Goldman Sachs | JPY | 27,328 | USD | 325 | 01/14/11 | (12 | ) | |||||||||||||
Goldman Sachs | TWD | 1,217 | USD | 41 | 01/14/11 | (1 | ) | |||||||||||||
HSBC Bank PLC | USD | 431 | EUR | 323 | 03/16/11 | 1 | ||||||||||||||
HSBC Bank PLC | USD | 100 | TRY | 148 | 01/27/11 | (5 | ) | |||||||||||||
HSBC Bank PLC | USD | 100 | TRY | 144 | 01/27/11 | (7 | ) | |||||||||||||
HSBC Bank PLC | USD | 411 | ZAR | 2,882 | 01/28/11 | 25 | ||||||||||||||
HSBC Bank PLC | EUR | 166 | CHF | 218 | 03/16/11 | 12 | ||||||||||||||
HSBC Bank PLC | EUR | 161 | GBP | 137 | 03/16/11 | (1 | ) | |||||||||||||
HSBC Bank PLC | EUR | 163 | SEK | 1,491 | 03/16/11 | 3 | ||||||||||||||
HSBC Bank PLC | EUR | 160 | USD | 213 | 03/16/11 | (1 | ) | |||||||||||||
HSBC Bank PLC | GBP | 136 | EUR | 162 | 03/16/11 | 5 | ||||||||||||||
HSBC Bank PLC | NOK | 805 | SEK | 917 | 03/16/11 | (1 | ) | |||||||||||||
JP Morgan Chase Bank | USD | 174 | EUR | 132 | 03/16/11 | 3 | ||||||||||||||
JP Morgan Chase Bank | USD | 217 | EUR | 166 | 03/16/11 | 5 | ||||||||||||||
JP Morgan Chase Bank | USD | 426 | EUR | 319 | 03/16/11 | — | ||||||||||||||
JP Morgan Chase Bank | USD | 396 | IDR | 3,613,500 | 04/15/11 | (1 | ) | |||||||||||||
JP Morgan Chase Bank | USD | 100 | JPY | 8,169 | 01/06/11 | 1 | ||||||||||||||
JP Morgan Chase Bank | USD | 33 | KRW | 38,666 | 01/19/11 | 1 | ||||||||||||||
JP Morgan Chase Bank | USD | 33 | KRW | 38,376 | 01/19/11 | — | ||||||||||||||
JP Morgan Chase Bank | USD | 33 | KRW | 38,200 | 01/19/11 | — | ||||||||||||||
JP Morgan Chase Bank | USD | 100 | KRW | 114,120 | 01/19/11 | — | ||||||||||||||
JP Morgan Chase Bank | USD | 100 | KRW | 113,440 | 01/19/11 | — | ||||||||||||||
JP Morgan Chase Bank | USD | 100 | MXN | 1,236 | 02/22/11 | — | ||||||||||||||
JP Morgan Chase Bank | USD | 33 | PHP | 1,469 | 02/07/11 | — | ||||||||||||||
JP Morgan Chase Bank | USD | 100 | PHP | 4,295 | 02/07/11 | (2 | ) | |||||||||||||
JP Morgan Chase Bank | USD | 100 | PHP | 4,353 | 02/07/11 | (1 | ) | |||||||||||||
JP Morgan Chase Bank | USD | 33 | SGD | 44 | 01/14/11 | 1 | ||||||||||||||
JP Morgan Chase Bank | USD | 33 | SGD | 44 | 01/14/11 | 1 | ||||||||||||||
JP Morgan Chase Bank | USD | 33 | SGD | 44 | 01/14/11 | 1 | ||||||||||||||
JP Morgan Chase Bank | USD | 100 | SGD | 130 | 01/14/11 | 1 | ||||||||||||||
JP Morgan Chase Bank | USD | 100 | SGD | 129 | 01/14/11 | — | ||||||||||||||
JP Morgan Chase Bank | USD | 100 | SGD | 129 | 01/14/11 | — | ||||||||||||||
JP Morgan Chase Bank | USD | 692 | SGD | 909 | 03/09/11 | 16 | ||||||||||||||
JP Morgan Chase Bank | USD | 100 | TRY | 144 | 01/27/11 | (7 | ) | |||||||||||||
JP Morgan Chase Bank | CAD | 265 | EUR | 197 | 03/16/11 | (2 | ) | |||||||||||||
JP Morgan Chase Bank | CHF | 205 | EUR | 160 | 03/16/11 | (6 | ) | |||||||||||||
JP Morgan Chase Bank | EUR | 322 | NOK | 2,613 | 03/16/11 | 16 | ||||||||||||||
JP Morgan Chase Bank | EUR | 164 | USD | 215 | 03/16/11 | (4 | ) | |||||||||||||
JP Morgan Chase Bank | EUR | 619 | USD | 810 | 03/16/11 | (17 | ) | |||||||||||||
JP Morgan Chase Bank | GBP | 139 | EUR | 163 | 03/16/11 | 1 | ||||||||||||||
JP Morgan Chase Bank | IDR | 3,613,500 | USD | 398 | 01/19/11 | (2 | ) | |||||||||||||
JP Morgan Chase Bank | JPY | 11,105 | NOK | 794 | 03/16/11 | (1 | ) | |||||||||||||
JP Morgan Chase Bank | MXN | 10,124 | USD | 819 | 01/21/11 | — | ||||||||||||||
JP Morgan Chase Bank | SGD | 909 | USD | 692 | 01/14/11 | (16 | ) | |||||||||||||
Morgan Stanley & Co., Inc. | USD | 155 | GBP | 100 | 03/16/11 | 1 | ||||||||||||||
Morgan Stanley & Co., Inc. | USD | 100 | KRW | 112,960 | 01/19/11 | (1 | ) | |||||||||||||
See accompanying notes which are an integral part of the financial statements.
| 70 | Core Bond Fund |
Table of Contents
Russell Investment Funds
Core Bond Fund
Schedule of Investments, continued — December 31, 2010
Amounts in thousands
| Foreign Currency Exchange Contracts | ||||||||||||||||||||
Counterparty | Amount Sold | Amount Bought | Settlement Date | Unrealized Appreciation (Depreciation)$ | ||||||||||||||||
Morgan Stanley & Co., Inc. | USD | 100 | KRW | 113,025 | 01/19/11 | — | ||||||||||||||
Morgan Stanley & Co., Inc. | USD | 100 | KRW | 114,460 | 01/19/11 | 1 | ||||||||||||||
Morgan Stanley & Co., Inc. | USD | 100 | KRW | 115,110 | 01/19/11 | 1 | ||||||||||||||
Morgan Stanley & Co., Inc. | USD | 100 | MXN | 1,231 | 02/22/11 | (1 | ) | |||||||||||||
Morgan Stanley & Co., Inc. | USD | 100 | MXN | 1,233 | 02/22/11 | — | ||||||||||||||
Morgan Stanley & Co., Inc. | USD | 100 | MXN | 1,237 | 02/22/11 | — | ||||||||||||||
Morgan Stanley & Co., Inc. | USD | 100 | MXN | 1,238 | 02/22/11 | — | ||||||||||||||
Morgan Stanley & Co., Inc. | USD | 100 | MXN | 1,243 | 02/22/11 | — | ||||||||||||||
Morgan Stanley & Co., Inc. | USD | 100 | MXN | 1,248 | 02/22/11 | 1 | ||||||||||||||
Morgan Stanley & Co., Inc. | USD | 100 | MXN | 1,249 | 02/22/11 | 1 | ||||||||||||||
Morgan Stanley & Co., Inc. | USD | 100 | MXN | 1,253 | 02/22/11 | 1 | ||||||||||||||
Morgan Stanley & Co., Inc. | EUR | 111 | USD | 146 | 01/25/11 | (3 | ) | |||||||||||||
Morgan Stanley & Co., Inc. | EUR | 139 | USD | 191 | 01/25/11 | 5 | ||||||||||||||
Royal Bank of Canada | USD | 121 | CAD | 123 | 02/17/11 | 3 | ||||||||||||||
Royal Bank of Canada | USD | 298 | CAD | 304 | 03/16/11 | 8 | ||||||||||||||
Royal Bank of Canada | USD | 214 | EUR | 162 | 03/16/11 | 2 | ||||||||||||||
Royal Bank of Canada | USD | 129 | GBP | 82 | 03/16/11 | (1 | ) | |||||||||||||
Royal Bank of Canada | BRL | 82 | USD | 48 | 01/18/11 | (1 | ) | |||||||||||||
Royal Bank of Canada | CAD | 214 | EUR | 160 | 03/16/11 | (1 | ) | |||||||||||||
Royal Bank of Canada | EUR | 159 | CAD | 214 | 03/16/11 | 2 | ||||||||||||||
Royal Bank of Canada | EUR | 160 | CAD | 216 | 03/16/11 | 3 | ||||||||||||||
Royal Bank of Canada | EUR | 320 | CHF | 407 | 03/16/11 | 8 | ||||||||||||||
Royal Bank of Canada | EUR | 164 | USD | 217 | 03/16/11 | (2 | ) | |||||||||||||
Royal Bank of Canada | GBP | 178 | USD | 277 | 01/20/11 | (1 | ) | |||||||||||||
Royal Bank of Canada | JPY | 16,266 | USD | 193 | 01/14/11 | (7 | ) | |||||||||||||
Royal Bank of Canada | JPY | 13,852 | USD | 167 | 03/16/11 | (4 | ) | |||||||||||||
Royal Bank of Canada | JPY | 18,192 | USD | 217 | 03/16/11 | (7 | ) | |||||||||||||
Royal Bank of Scotland PLC | USD | 212 | KRW | 236,760 | 01/19/11 | (3 | ) | |||||||||||||
Royal Bank of Scotland PLC | USD | 58 | MYR | 180 | 01/28/11 | — | ||||||||||||||
Royal Bank of Scotland PLC | USD | 100 | SGD | 131 | 01/14/11 | 2 | ||||||||||||||
Royal Bank of Scotland PLC | CHF | 212 | EUR | 162 | 03/16/11 | (10 | ) | |||||||||||||
Royal Bank of Scotland PLC | EUR | 163 | CAD | 218 | 03/16/11 | 1 | ||||||||||||||
Royal Bank of Scotland PLC | EUR | 166 | USD | 217 | 03/16/11 | (4 | ) | |||||||||||||
Royal Bank of Scotland PLC | EUR | 325 | USD | 429 | 03/16/11 | (5 | ) | |||||||||||||
Royal Bank of Scotland PLC | EUR | 612 | USD | 809 | 03/16/11 | (9 | ) | |||||||||||||
Royal Bank of Scotland PLC | GBP | 28 | USD | 44 | 03/21/11 | — | ||||||||||||||
Royal Bank of Scotland PLC | JPY | 32,533 | USD | 387 | 01/14/11 | (14 | ) | |||||||||||||
Royal Bank of Scotland PLC | JPY | 84,327 | USD | 1,010 | 03/16/11 | (29 | ) | |||||||||||||
UBS AG | USD | 1,953 | BRL | 3,361 | 04/04/11 | 34 | ||||||||||||||
UBS AG | USD | 26 | EUR | 20 | 03/16/11 | 1 | ||||||||||||||
UBS AG | USD | 215 | GBP | 137 | 03/16/11 | (2 | ) | |||||||||||||
UBS AG | USD | 100 | JPY | 8,375 | 01/14/11 | 3 | ||||||||||||||
UBS AG | USD | 202 | JPY | 16,751 | 01/14/11 | 4 | ||||||||||||||
UBS AG | USD | 216 | JPY | 18,114 | 03/16/11 | 7 | ||||||||||||||
UBS AG | USD | 100 | MXN | 1,238 | 02/22/11 | — | ||||||||||||||
UBS AG | USD | 100 | MXN | 1,247 | 02/22/11 | 1 | ||||||||||||||
UBS AG | BRL | 1,062 | USD | 609 | 01/18/11 | (29 | ) | |||||||||||||
UBS AG | BRL | 3,361 | USD | 1,977 | 02/02/11 | (34 | ) | |||||||||||||
UBS AG | CHF | 214 | EUR | 163 | 03/16/11 | (11 | ) | |||||||||||||
UBS AG | CHF | 206 | USD | 212 | 03/16/11 | (8 | ) | |||||||||||||
UBS AG | CHF | 490 | USD | 488 | 03/16/11 | (37 | ) | |||||||||||||
UBS AG | EUR | 163 | CHF | 212 | 03/16/11 | 10 | ||||||||||||||
UBS AG | EUR | 75 | USD | 98 | 01/25/11 | (2 | ) | |||||||||||||
UBS AG | EUR | 165 | USD | 216 | 03/16/11 | (4 | ) | |||||||||||||
UBS AG | EUR | 166 | USD | 217 | 03/16/11 | (5 | ) | |||||||||||||
See accompanying notes which are an integral part of the financial statements.
| Core Bond Fund | 71 |
Table of Contents
Russell Investment Funds
Core Bond Fund
Schedule of Investments, continued — December 31, 2010
Amounts in thousands
| Foreign Currency Exchange Contracts | ||||||||||||||||||
Counterparty | Amount Sold | Amount Bought | Settlement Date | Unrealized Appreciation (Depreciation) $ | ||||||||||||||
UBS AG | JPY | 17,825 | USD | 215 | 03/16/11 | (5 | ) | |||||||||||
Westpac Banking Corp. | USD | 128 | AUD | 135 | 03/16/11 | 9 | ||||||||||||
Westpac Banking Corp. | USD | 212 | AUD | 217 | 03/16/11 | 8 | ||||||||||||
Westpac Banking Corp. | USD | 214 | AUD | 225 | 03/16/11 | 14 | ||||||||||||
Westpac Banking Corp. | USD | 313 | AUD | 330 | 03/16/11 | 22 | ||||||||||||
Westpac Banking Corp. | USD | 215 | EUR | 163 | 03/16/11 | 2 | ||||||||||||
Westpac Banking Corp. | USD | 142 | NZD | 191 | 03/16/11 | 6 | ||||||||||||
Westpac Banking Corp. | EUR | 159 | AUD | 216 | 03/16/11 | 7 | ||||||||||||
Westpac Banking Corp. | GBP | 37 | USD | 57 | 01/05/11 | — | ||||||||||||
Total Unrealized Appreciation (Depreciation) on Open Foreign Currency Exchange Contracts | 212 | |||||||||||||||||
| Interest Rate Swap Contracts | ||||||||||||||||
Counterparty | Notional Amount | Fund Receives | Fund Pays | Termination | Market Value $ | |||||||||||
Bank of America | USD | 4,900 | Three Month LIBOR | 2.116% | 11/23/14 | 48 | ||||||||||
Bank of America | USD | 4,400 | 3.587% | Three Month LIBOR | 11/23/19 | (104 | ) | |||||||||
Bank of America | USD | 1,600 | Three Month LIBOR | 4.206% | 11/23/27 | 47 | ||||||||||
Bank of America | USD | 600 | Three Month LIBOR | 3.750% | 06/15/41 | 49 | ||||||||||
Barclays Bank PLC | BRL | 600 | 10.835% | Brazil Interbank Deposit Rate | 01/02/12 | 4 | ||||||||||
Barclays Bank PLC | EUR | 2,100 | 4.259% | Six Month EURIBOR | 04/23/20 | 12 | ||||||||||
Barclays Bank PLC | EUR | 2,370 | 4.270% | Six Month EURIBOR | 05/12/20 | 14 | ||||||||||
Barclays Bank PLC | USD | 144 | Three Month LIBOR | 4.524% | 11/15/21 | (31 | ) | |||||||||
Barclays Bank PLC | USD | 146 | Three Month LIBOR | 4.420% | 11/15/21 | (27 | ) | |||||||||
Barclays Bank PLC | USD | 266 | Three Month LIBOR | 4.540% | 11/15/21 | (57 | ) | |||||||||
Barclays Bank PLC | USD | 530 | Three Month LIBOR | 4.633% | 11/15/21 | (126 | ) | |||||||||
Barclays Bank PLC | EUR | 630 | Six Month EURIBOR | 4.085% | 04/23/40 | (25 | ) | |||||||||
Barclays Bank PLC | EUR | 700 | Six Month EURIBOR | 3.953% | 05/12/40 | (11 | ) | |||||||||
BNP Paribas | BRL | 300 | 11.390% | Brazil Interbank Deposit Rate | 01/02/12 | 1 | ||||||||||
BNP Paribas | BRL | 200 | 12.110% | One Month LIBOR | 01/02/14 | 2 | ||||||||||
Citibank | GBP | 950 | 1.750% | Six Month LIBOR | 06/15/14 | (24 | ) | |||||||||
Citibank | EUR | 750 | 2.096% | Six Month EURIBOR | 11/05/15 | (16 | ) | |||||||||
Citibank | EUR | 2,100 | 4.286% | Six Month EURIBOR | 04/23/20 | 15 | ||||||||||
Citibank | EUR | 630 | Six Month EURIBOR | 4.119% | 04/23/40 | (29 | ) | |||||||||
Credit Suisse Financial Products | BRL | 300 | 12.480% | Brazil Interbank Deposit Rate | 01/02/13 | 3 | ||||||||||
Credit Suisse Financial Products | GBP | 700 | 1.500% | Six Month LIBOR | 06/15/13 | (8 | ) | |||||||||
Credit Suisse Financial Products | GBP | 690 | 1.750% | Six Month LIBOR | 06/15/14 | (17 | ) | |||||||||
Credit Suisse Financial Products | EUR | 500 | 3.764% | Six Month EURIBOR | 08/06/20 | (12 | ) | |||||||||
Credit Suisse Financial Products | EUR | 150 | Six Month EURIBOR | 3.630% | 08/06/40 | 7 | ||||||||||
Deutsche Bank | KRW | 416,000 | 2.820% | Korean Interbank Offer Rate | 01/28/11 | — | ||||||||||
Deutsche Bank | KRW | 200,000 | 3.870% | Korean Interbank Offer Rate | 06/12/11 | 1 | ||||||||||
Deutsche Bank | AUD | 200 | 4.500% | Three Month BBSW | 06/15/11 | (1 | ) | |||||||||
Deutsche Bank | KRW | 1,120,000 | 3.693% | Korean Interbank Offer Rate | 06/26/11 | 4 | ||||||||||
Deutsche Bank | KRW | 467,700 | 3.620% | Korean Interbank Offer Rate | 07/06/11 | 3 | ||||||||||
Deutsche Bank | KRW | 781,412 | 3.626% | Three Month LIBOR | 07/07/11 | 4 | ||||||||||
Deutsche Bank | BRL | 2,670 | 11.450% | Brazil Interbank Deposit Rate | 01/02/12 | (6 | ) | |||||||||
Deutsche Bank | BRL | 6,580 | 11.514% | Brazil Interbank Deposit Rate | 01/02/12 | (13 | ) | |||||||||
Deutsche Bank | USD | 11,500 | Three Month LIBOR | 1.645% | 11/02/14 | 204 | ||||||||||
Deutsche Bank | USD | 4,100 | Three Month LIBOR | 1.432% | 02/28/15 | 64 | ||||||||||
Deutsche Bank | USD | 2,800 | Three Month LIBOR | 1.750% | 06/15/16 | 105 | ||||||||||
Deutsche Bank | USD | 4,500 | 1.750% | Three Month LIBOR | 06/15/16 | (168 | ) | |||||||||
Deutsche Bank | USD | 4,600 | 1.750% | Three Month LIBOR | 06/15/16 | (172 | ) | |||||||||
Deutsche Bank | USD | 6,900 | Three Month LIBOR | 1.750% | 06/15/16 | 258 | ||||||||||
Deutsche Bank | USD | 9,600 | 2.750% | Three Month LIBOR | 11/02/17 | (372 | ) | |||||||||
Deutsche Bank | USD | 2,200 | 2.560% | Three Month LIBOR | 10/20/20 | (140 | ) | |||||||||
See accompanying notes which are an integral part of the financial statements.
| 72 | Core Bond Fund |
Table of Contents
Russell Investment Funds
Core Bond Fund
Schedule of Investments, continued — December 31, 2010
Amounts in thousands
| Interest Rate Swap Contracts | ||||||||||||||||
Counterparty | Notional Amount | Fund Receives | Fund Pays | Termination | Market Value $ | |||||||||||
Deutsche Bank | USD | 500 | Three Month LIBOR | 2.750% | 06/15/21 | 37 | ||||||||||
Deutsche Bank | USD | 2,600 | Three Month LIBOR | 3.545% | 11/02/22 | 149 | ||||||||||
Deutsche Bank | USD | 1,900 | Three Month LIBOR | 3.250% | 06/15/26 | 167 | ||||||||||
Deutsche Bank | USD | 1,200 | 3.750% | Three Month LIBOR | 06/15/41 | (97 | ) | |||||||||
Deutsche Bank | USD | 1,200 | Three Month LIBOR | 3.750% | 06/15/41 | 97 | ||||||||||
Goldman Sachs | BRL | 400 | 10.835% | Brazil Interbank Deposit Rate | 01/02/12 | 3 | ||||||||||
Goldman Sachs | BRL | 600 | 10.990% | Brazil Interbank Deposit Rate | 01/02/12 | 4 | ||||||||||
Goldman Sachs | BRL | 1,200 | 11.890% | Brazil Interbank Deposit Rate | 01/02/13 | 7 | ||||||||||
Goldman Sachs | USD | 1,000 | 1.250% | Three Month LIBOR | 12/19/13 | (9 | ) | |||||||||
Goldman Sachs | BRL | 400 | 12.510% | Brazil Interbank Deposit Rate | 01/02/14 | 9 | ||||||||||
Goldman Sachs | BRL | 400 | 12.650% | One Month LIBOR | 01/02/14 | 10 | ||||||||||
Goldman Sachs | USD | 1,400 | 1.950% | Three Month LIBOR | 12/15/15 | (13 | ) | |||||||||
Goldman Sachs | USD | 3,800 | 1.700% | Three Month LIBOR | 12/15/15 | (80 | ) | |||||||||
HSBC | BRL | 400 | 11.360% | Brazil Interbank Deposit Rate | 01/02/12 | 4 | ||||||||||
HSBC | BRL | 400 | 11.140% | One Month LIBOR | 01/02/12 | 5 | ||||||||||
HSBC | BRL | 1,200 | 11.890% | Brazil Interbank Deposit Rate | 01/02/13 | 7 | ||||||||||
HSBC | BRL | 100 | 12.540% | One Month LIBOR | 01/02/14 | 2 | ||||||||||
HSBC | MXN | 2,000 | 7.330% | Mexico Interbank 28 Day Deposit Rate | 01/28/15 | 7 | ||||||||||
JP Morgan | KRW | 405,000 | 2.830% | Korean Interbank Offer Rate | 01/28/11 | — | ||||||||||
JP Morgan | KRW | 350,000 | 3.900% | Korean Interbank Offer Rate | 06/15/11 | 2 | ||||||||||
JP Morgan | KRW | 1,100,000 | 3.720% | Korean Interbank Offer Rate | 06/22/11 | 4 | ||||||||||
JP Morgan | KRW | 371,651 | 3.660% | Korean Interbank Offer Rate | 07/08/11 | 2 | ||||||||||
JP Morgan | BRL | 500 | 12.170% | Brazil Interbank Deposit Rate | 01/02/13 | 6 | ||||||||||
JP Morgan | BRL | 1,460 | 12.190% | Brazil Interbank Deposit Rate | 01/02/13 | — | ||||||||||
JP Morgan | BRL | 7,900 | 12.260% | Brazil Interbank Deposit Rate | 01/02/13 | 4 | ||||||||||
JP Morgan | GBP | 250 | 1.750% | Six Month LIBOR | 06/15/14 | (6 | ) | |||||||||
JP Morgan | EUR | 480 | 3.653% | Six Month EURIBOR | 08/07/20 | (14 | ) | |||||||||
JP Morgan | EUR | 640 | Six Month EURIBOR | 3.042% | 08/10/20 | 39 | ||||||||||
JP Morgan | EUR | 940 | 3.530% | Six Month EURIBOR | 08/10/20 | (33 | ) | |||||||||
JP Morgan | USD | 400 | Three Month LIBOR | 2.750% | 06/15/21 | 29 | ||||||||||
JP Morgan | USD | 2,800 | Three Month LIBOR | 2.750% | 06/15/21 | 206 | ||||||||||
JP Morgan | USD | 1,100 | Three Month LIBOR | 3.250% | 06/15/26 | 97 | ||||||||||
JP Morgan | USD | 1,300 | Three Month LIBOR | 3.250% | 06/15/26 | 114 | ||||||||||
JP Morgan | USD | 1,800 | Three Month LIBOR | 3.250% | 06/15/26 | 158 | ||||||||||
JP Morgan | EUR | 130 | Six Month EURIBOR | 3.542% | 08/07/40 | 8 | ||||||||||
JP Morgan | EUR | 260 | Six Month EURIBOR | 3.417% | 08/10/40 | 22 | ||||||||||
JP Morgan | EUR | 460 | 2.920% | Six Month EURIBOR | 08/10/40 | (80 | ) | |||||||||
Merrill Lynch | BRL | 100 | 14.765% | Brazil Interbank Deposit Rate | 01/02/12 | 10 | ||||||||||
Merrill Lynch | BRL | 500 | 10.990% | Brazil Interbank Deposit Rate | 01/02/12 | 3 | ||||||||||
Merrill Lynch | BRL | 800 | 12.540% | Brazil Interbank Deposit Rate | 01/02/12 | 37 | ||||||||||
Morgan Stanley | BRL | 200 | 11.630% | Brazil Interbank Deposit Rate | 01/02/12 | 1 | ||||||||||
Morgan Stanley | BRL | 100 | 12.590% | Brazil Interbank Deposit Rate | 01/02/13 | 1 | ||||||||||
Royal Bank of Canada | AUD | 1,900 | 4.500% | Three Month BBSW | 06/15/11 | (6 | ) | |||||||||
Royal Bank of Canada | CAD | 840 | Canadian Dealer Offer Rate | 2.140% | 11/03/15 | 16 | ||||||||||
Royal Bank of Canada | CAD | 1,270 | Canadian Dealer Offer Rate | 2.115% | 11/04/15 | 26 | ||||||||||
Royal Bank of Canada | EUR | 1,120 | 2.118% | Six Month EURIBOR | 11/08/15 | (22 | ) | |||||||||
Royal Bank of Scotland | GBP | 1,760 | 1.500% | Six Month LIBOR | 06/15/13 | (20 | ) | |||||||||
Royal Bank of Scotland | CAD | 1,500 | 5.700% | Canadian Dealer Offer Rate | 12/18/24 | 30 | ||||||||||
UBS | BRL | 700 | 11.980% | Brazil Interbank Deposit Rate | 01/02/12 | 22 | ||||||||||
UBS | BRL | 800 | 10.575% | Brazil Interbank Deposit Rate | 01/02/12 | (13 | ) | |||||||||
UBS | AUD | 1,600 | 6.000% | Six Month BBSW | 09/15/12 | 21 | ||||||||||
UBS | BRL | 300 | 12.070% | Brazil Interbank Deposit Rate | 01/02/13 | 3 | ||||||||||
UBS | BRL | 200 | 12.250% | One Month LIBOR | 01/02/14 | 3 | ||||||||||
Total Market Value on Open Interest Rate Swap Contracts Premiums Paid (Received) - $570 | 465 | |||||||||||||||
See accompanying notes which are an integral part of the financial statements.
| Core Bond Fund | 73 |
Table of Contents
Russell Investment Funds
Core Bond Fund
Schedule of Investments, continued — December 31, 2010
Amounts in thousands
| Credit Default Swap Contracts | ||||||||||||||||||||||||
| Corporate Issues | ||||||||||||||||||||||||
Reference Entity | Counterparty | Implied Credit Spread | Notional Amount | Fund (Pays)/ | Termination Date | Market Value $ | ||||||||||||||||||
Darden Restaurants, Inc. | Deutsche Bank | 0.738% | USD | 400 | (2.250%) | 03/20/14 | (19 | ) | ||||||||||||||||
Deutsche Bank | JP Morgan | 4.280% | USD | 1,000 | 5.000% | 12/20/15 | 20 | |||||||||||||||||
Dr Horton Inc. | Citibank | 2.482% | USD | 100 | (1.000%) | 09/20/16 | 8 | |||||||||||||||||
Dr Horton Inc. | Deutsche Bank | 2.482% | USD | 80 | (1.000%) | 09/20/16 | 6 | |||||||||||||||||
Dr Horton Inc. | Goldman Sachs | 2.482% | USD | 80 | (1.000%) | 09/20/16 | 6 | |||||||||||||||||
Federative Republic of Brazil | Barclays Bank PLC | 1.033% | USD | 500 | 1.000% | 06/20/15 | (1 | ) | ||||||||||||||||
Federative Republic of Brazil | Deutsche Bank | 1.033% | USD | 1,000 | 1.000% | 06/20/15 | (1 | ) | ||||||||||||||||
Federative Republic of Brazil | Goldman Sachs | 1.033% | USD | 500 | 1.000% | 06/20/15 | — | |||||||||||||||||
Federative Republic of Brazil | HSBC | 1.061% | USD | 100 | 1.000% | 09/20/15 | — | |||||||||||||||||
Federative Republic of Brazil | JP Morgan | 1.061% | USD | 100 | 1.000% | 09/20/15 | — | |||||||||||||||||
Federative Republic of Brazil | Barclays Bank PLC | 1.085% | USD | 700 | 1.000% | 12/20/15 | (4 | ) | ||||||||||||||||
GE Capital Corp. | Citibank | 1.079% | USD | 200 | 4.000% | 12/20/13 | 19 | |||||||||||||||||
GE Capital Corp. | Deutsche Bank | 1.079% | USD | 100 | 4.900% | 12/20/13 | 13 | |||||||||||||||||
Japan Government Bond | Bank of America | 0.718% | USD | 100 | 1.000% | 03/20/16 | 1 | |||||||||||||||||
Japan Government Bond | Bank of America | 0.718% | USD | 200 | 1.000% | 03/20/16 | 3 | |||||||||||||||||
Japan Government Bond | Deutsche Bank | 0.590% | USD | 100 | 1.000% | 03/20/15 | 1 | |||||||||||||||||
Japan Government Bond | JP Morgan | 0.590% | USD | 600 | 1.000% | 03/20/15 | 8 | |||||||||||||||||
JP Morgan | JP Morgan | 4.280% | USD | 1,000 | 5.000% | 12/20/15 | 32 | |||||||||||||||||
Lowe’s Companies, Inc. | Citigroupglobal Markets, Inc. | 0.340% | USD | 340 | (1.450%) | 03/20/14 | (13 | ) | ||||||||||||||||
Mexico Government International Bond | Morgan Stanley | 0.533% | USD | 100 | 0.750% | 01/20/12 | 1 | |||||||||||||||||
Pulte Homes, Inc. | JP Morgan | 2.698% | USD | 1,000 | (3.870%) | 03/20/14 | (84 | ) | ||||||||||||||||
Target Corp | Credit Suisse First Boston | 0.347% | USD | 125 | (1.000%) | 12/20/14 | (3 | ) | ||||||||||||||||
Target Corp | Deutsche Bank | 0.347% | USD | 125 | (1.000%) | 12/20/14 | (3 | ) | ||||||||||||||||
The Home Depot, Inc. | Citigroup Global Markets, Inc. | 0.326% | USD | 340 | (3.250%) | 03/20/14 | (35 | ) | ||||||||||||||||
Toll Brothers, Inc. | Credit Suisse First Boston | 1.803% | USD | 255 | (1.000%) | 09/20/16 | 11 | |||||||||||||||||
United Kingdom Gilt | Deutsche Bank | 0.616% | USD | 300 | 1.000% | 12/20/14 | 5 | |||||||||||||||||
United Kingdom Gilt | Morgan Stanley | 0.616% | USD | 100 | 1.000% | 12/20/14 | 2 | |||||||||||||||||
United Kingdom Gilt | JP Morgan | 0.637% | USD | 300 | 1.000% | 03/20/15 | 4 | |||||||||||||||||
United Kingdom Gilt | JP Morgan | 0.637% | USD | 700 | 1.000% | 03/20/15 | 10 | |||||||||||||||||
United Kingdom Gilt | Societe Generale | 0.637% | USD | 500 | 1.000% | 03/20/15 | 7 | |||||||||||||||||
Total Market Value on Open Corporate Issues Premiums Paid (Received) - $51 | (6 | ) | ||||||||||||||||||||||
| Credit Indices | ||||||||||||||||
Reference Entity | Counterparty | Notional Amount | Fund (Pays)/ Receives Fixed Rate | Termination Date | Market Value $ | |||||||||||
CMBX AJ Index | Bank of America | USD | 460 | (0.840)% | 10/12/52 | 37 | ||||||||||
CMBX AJ Index | Bank of America | USD | 100 | (0.840)% | 10/12/52 | 8 | ||||||||||
CMBX AJ Index | Barclays Bank PLC | USD | 340 | (0.840)% | 10/12/52 | 26 | ||||||||||
CMBX AJ Index | Barclays Bank PLC | USD | 360 | (0.840)% | 10/12/52 | 29 | ||||||||||
CMBX AJ Index | Credit Suisse First Boston | USD | 930 | (0.840)% | 10/12/52 | 73 | ||||||||||
Dow Jones CDX Index | Bank of America | USD | 1,000 | 1.000% | 12/20/15 | 7 | ||||||||||
Dow Jones CDX Index | Barclays Bank PLC | USD | 300 | 5.000% | 06/20/15 | 42 | ||||||||||
Dow Jones CDX Index | Barclays Bank PLC | USD | 300 | 5.000% | 12/20/15 | 41 | ||||||||||
Dow Jones CDX Index | Citibank | USD | 100 | 5.000% | 12/20/15 | 3 | ||||||||||
Dow Jones CDX Index | Citibank | USD | 100 | 1.000% | 12/20/15 | 1 | ||||||||||
Dow Jones CDX Index | Citibank | USD | 200 | 5.000% | 12/20/15 | 30 | ||||||||||
Dow Jones CDX Index | Credit Suisse First Boston | USD | 500 | 1.000% | 12/20/15 | 4 | ||||||||||
Dow Jones CDX Index | Deutsche Bank | USD | 900 | 5.000% | 06/20/15 | 127 | ||||||||||
Dow Jones CDX Index | Deutsche Bank | USD | 200 | 5.000% | 12/20/15 | 27 | ||||||||||
See accompanying notes which are an integral part of the financial statements.
| 74 | Core Bond Fund |
Table of Contents
Russell Investment Funds
Core Bond Fund
Schedule of Investments, continued — December 31, 2010
Amounts in thousands
| Credit Indices | ||||||||||||||||
Reference Entity | Counterparty | Notional Amount | Fund (Pays)/ Receives Fixed Rate | Termination Date | Market Value $ | |||||||||||
Dow Jones CDX Index | Deutsche Bank | USD 800 | 1.000% | 12/20/15 | 6 | |||||||||||
Dow Jones CDX Index | Deutsche Bank | USD 772 | 0.708% | 12/20/12 | 9 | |||||||||||
Dow Jones CDX Index | Goldman Sachs | USD 100 | 1.000% | 12/20/15 | 1 | |||||||||||
Dow Jones CDX Index | Goldman Sachs | USD 193 | 0.548% | 12/20/17 | 2 | |||||||||||
Dow Jones CDX Index | JP Morgan | USD 200 | 5.000% | 12/20/15 | 6 | |||||||||||
Dow Jones CDX Index | JP Morgan | USD 386 | 0.553% | 12/20/17 | 5 | |||||||||||
Dow Jones CDX Index | Morgan Stanley | USD 800 | 5.000% | 06/20/15 | 101 | |||||||||||
Dow Jones CDX Index | Morgan Stanley | USD 300 | 5.000% | 12/20/15 | 41 | |||||||||||
Dow Jones CDX Index | UBS | USD 1,000 | 1.000% | 12/20/15 | 8 | |||||||||||
Total Market Value on Open Credit Indices Premiums Paid (Received) - $1,161 | 634 | |||||||||||||||
Total Market Value on Open Credit Default Swap Contracts Premiums Paid (Received) - $1,212 | 628 | |||||||||||||||
See accompanying notes which are an integral part of the financial statements.
| Core Bond Fund | 75 |
Table of Contents
Russell Investment Funds
Core Bond Fund
Presentation of Portfolio Holdings — December 31, 2010
Amounts in thousands
| Market Value | ||||||||||||||||||||
| Portfolio Summary | Level 1 | Level 2 | Level 3 | Total | % of Net Assets | |||||||||||||||
Long-Term Investments | ||||||||||||||||||||
Asset-Backed Securities | $ | — | $ | 22,594 | $ | 299 | $ | 22,893 | 4.8 | |||||||||||
Corporate Bonds and Notes | — | 76,845 | 2,177 | 79,022 | 16.7 | |||||||||||||||
International Debt | — | 42,878 | 734 | 43,612 | 9.2 | |||||||||||||||
Loan Agreements | — | 1,011 | — | 1,011 | 0.2 | |||||||||||||||
Mortgage-Backed Securities | — | 210,469 | 3,962 | 214,431 | 45.4 | |||||||||||||||
Municipal Bonds | — | 8,639 | — | 8,639 | 1.9 | |||||||||||||||
Non-US Bonds | — | 6,964 | — | 6,964 | 1.5 | |||||||||||||||
United States Government Agencies | — | 17,811 | — | 17,811 | 3.8 | |||||||||||||||
United States Government Treasuries | — | 43,651 | — | 43,651 | 9.3 | |||||||||||||||
Preferred Stocks | 656 | — | 374 | 1,030 | 0.2 | |||||||||||||||
Short-Term Investments | — | 90,105 | 1,660 | 91,765 | 19.4 | |||||||||||||||
Repurchase Agreements | — | 4,100 | — | 4,100 | 0.9 | |||||||||||||||
Other Securities | — | 13,164 | — | 13,164 | 2.8 | |||||||||||||||
Total Investments | 656 | 538,231 | 9,206 | 548,093 | 116.1 | |||||||||||||||
Other Assets and Liabilities, Net | (16.1 | ) | ||||||||||||||||||
| 100.0 | ||||||||||||||||||||
Other Financial Instruments | ||||||||||||||||||||
Futures Contracts | (403 | ) | — | — | (403 | ) | (0.1 | ) | ||||||||||||
Options Written | (89 | ) | (819 | ) | (193 | ) | (1,101 | ) | (0.2 | ) | ||||||||||
Foreign Currency Exchange Contracts | (2 | ) | 214 | — | 212 | — | * | |||||||||||||
Interest Rate Swap Contracts | — | (105 | ) | — | (105 | ) | — | * | ||||||||||||
Credit Default Swap Contracts | — | (584 | ) | — | (584 | ) | (0.1 | ) | ||||||||||||
Total Other Financial Instruments** | (494 | ) | (1,294 | ) | (193 | ) | (1,981 | ) | ||||||||||||
| * | Less than .05% of net assets. |
| ** | Other financial instruments reflected in the Schedule of Investments, such as futures, forwards, and swap contracts which are valued at the unrealized appreciation/depreciation on the instruments. |
For a description of the levels see note 2 in the Notes to Financial Statements.
Balance as of 12/31/2009 | $ | 804 | ||
Accrued discounts/(premiums) | 65 | |||
Realized gain/(loss) | 3 | |||
Net change in unrealized appreciation/(depreciation) from investments still held as of 12/31/2010 | 147 | |||
Net purchases (sales) | 6,150 | |||
Net tranfers in and/or out of Level 3 | 1,844 | |||
Balance as of 12/31/2010 | $ | 9,013 | ||
See accompanying notes which are an integral part of the financial statements.
| 76 | Core Bond Fund |
Table of Contents
Russell Investment Funds
Core Bond Fund
Fair Value of Derivative Instruments — December 31, 2010
Amounts in thousands
| Derivatives not accounted for as hedging instruments | Credit Contracts | Foreign Currency Contracts | Interest Rate Contracts | |||||||||
Location: Statement of Assets and Liabilities - Assets | ||||||||||||
Unrealized appreciation on foreign currency exchange contracts | $ | — | $ | 674 | $ | — | ||||||
Daily variation margin on futures contracts* | — | — | 222 | |||||||||
Interest rate swap contracts, at market value | — | — | 2,217 | |||||||||
Credit default swap contracts, at market value | 791 | — | — | |||||||||
Total | $ | 791 | $ | 674 | $ | 2,439 | ||||||
Location: Statement of Assets and Liabilities - Liabilities | ||||||||||||
Unrealized depreciation on foreign currency exchange contracts | $ | — | $ | 462 | $ | — | ||||||
Daily variation margin on futures contracts* | — | — | 625 | |||||||||
Interest rate swap contracts, at market value | — | — | 1,752 | |||||||||
Credit default swap contracts, at market value | 163 | — | — | |||||||||
Options written, at market value | — | — | 1,101 | |||||||||
Total | $ | 163 | $ | 462 | $ | 3,478 | ||||||
| Derivatives not accounted for as hedging instruments | Credit Contracts | Foreign Currency Contracts | Interest Rate Contracts | |||||||||
Location: Statement of Operations - Net realized gain (loss) | ||||||||||||
Futures contracts | $ | — | $ | — | $ | 4,097 | ||||||
Options Written | — | — | 613 | |||||||||
Credit default swap contracts | 65 | — | — | |||||||||
Interest rate swap contracts | — | — | 117 | |||||||||
Foreign currency-related transactions | — | (163 | ) | — | ||||||||
Total | $ | 65 | $ | (163 | ) | $ | 4,827 | |||||
Location: Statement of Operations - Net change in unrealized appreciation (depreciation) | ||||||||||||
Futures contracts | $ | — | $ | — | $ | 511 | ||||||
Options Written | — | — | (436 | ) | ||||||||
Credit default swap contracts | 297 | — | — | |||||||||
Interest rate swap contracts | — | — | (614 | ) | ||||||||
Foreign currency-related transactions | — | 140 | — | |||||||||
Total | $ | 297 | $ | 140 | $ | (539 | ) | |||||
| * | Includes cumulative appreciation/depreciation of futures contracts as reported in Schedule of Investments. Only current day’s variation margin is reported within the statement of assets and liabilities |
For further disclosure on derivatives see note 2 in Notes to Financial Statements.
See accompanying notes which are an integral part of the financial statements.
| Core Bond Fund | 77 |
Table of Contents
Russell Investment Funds
Portfolio Management Discussion — December 31, 2010 (Unaudited)
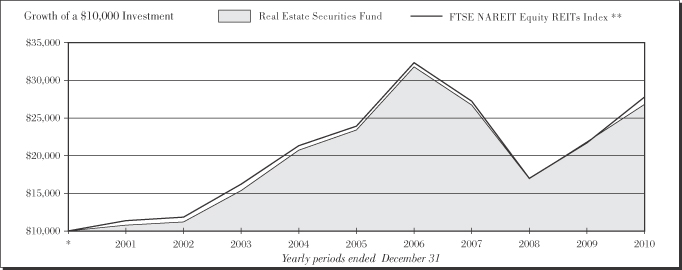
| Real Estate Securities Fund | ||||
| Total Return | ||||
1 Year | 22.92 | % | ||
5 Years | 2.78 | %§ | ||
10 Years | 10.38 | %§ | ||
| FTSE NAREIT Equity REITs Index** | ||||
| Total Return | ||||
1 Year | 27.95 | % | ||
5 Years | 3.03 | %§ | ||
10 Years | 10.76 | %§ | ||
| FTSE EPRA/NAREIT Developed Real Estate Index (net)*** | ||||
| Total Return | ||||
1 Year | 19.63 | % | ||
5 Years | 2.23 | %§ | ||
10 Years | N/A | |||
| 78 | Real Estate Securities Fund |
Table of Contents
Russell Investment Funds
Real Estate Securities Fund
Portfolio Management Discussion — December 31, 2010 (Unaudited)
The Real Estate Securities Fund (the “Fund”) allocates most of its assets among multiple money managers. Russell Investment Management Company (“RIMCo”), as the Fund’s advisor, may change the allocation of the Fund’s assets among money managers at any time. An exemptive order from the Securities and Exchange Commission (“SEC”) permits RIMCo to engage or terminate a money manager at any time, subject to approval by the Fund’s Board without a shareholder vote. Pursuant to the terms of the exemptive order, the Fund is required to notify its shareholders within 60 days of when a money manager begins providing services. The Fund currently has three money managers.
What is the Fund’s investment objective?
The Fund seeks to provide current income and long-term capital growth.
How did the Fund perform relative to its benchmark for the fiscal year ended December 31, 2010?
For the fiscal year ended December 31, 2010, the Real Estate Securities Fund gained 22.92%. This compared to the FTSE NAREIT Equity REIT Index, which gained 27.95% and the FTSE EPRA/NAREIT Developed Real Estate Index (Net), which gained 19.63% during the same period. Prior to October 1, 2010, the Fund’s benchmark was the FTSE NAREIT Equity REIT Index. Beginning October 1, 2010, the Fund’s benchmark was changed to the FTSE EPRA/NAREIT Developed Real Estate Index (Net) in connection with the Fund’s change in investment strategy from a predominantly U.S. based investment strategy to a global investment strategy. References in this discussion to the Fund’s benchmark refer to the FTSE NAREIT Equity REIT Index, which was the Fund’s benchmark for most of the period. The Fund’s performance includes operating expenses, whereas index returns are unmanaged and do not include expenses of any kind.
For the fiscal year ended December 31, 2010, the Lipper® Real Estate Funds (VIP) Average gained 23.83%. This average return serves as a peer comparison and is expressed net of operating expenses.
How did the market conditions described in the Market Summary report affect the Fund’s performance?
U.S. real estate investment trusts (“REITs”) outperformed both the broader U.S. equity market and the international real estate securities market during the fiscal year. As REIT share prices increased, dividend yields declined modestly, although the spread relative to 10-year Treasury notes increased due to declining interest rates. Despite the sluggish pace of the U.S. economic recovery, leverage in the REIT sector and the spread between REIT yields and bonds appeared attractive relative to peak levels. Generally, real estate securities were perceived to be in a strong position relative to cash-strapped private real estate owners, as REITs had the option to grant leasing concessions in order to attract tenants and retain occupancy. Companies that were able to maintain occupancy and stable cash flows generally experienced the most pronounced share
price appreciation. The market also reacted positively to the increasing availability of debt capital at attractive pricing.
The Fund underperformed relative to the FTSE NAREIT Equity REIT Index during the period spanning the beginning of the fiscal year through September 30, 2010 due to unfavorable stock selection and exposure to international real estate securities. The negative effect of weak stock selection in the diversified, apartments, regional malls and health care sectors outweighed the positive impact of stock selection in the office and lodging/resorts sectors. Generally, the money managers positioned the Fund somewhat defensively during the fiscal year, with a focus on higher-quality, larger-capitalization REITs with stronger balance sheets and more stable earnings prospects. In the diversified sector, exposure to several blue-chip Asian development companies detracted from performance, as these stocks had posted significant share price appreciation during the prior fiscal year and lacked a significant catalyst to drive further growth. Stock selection in the apartments and regional malls sectors was another area of weakness, as underweight position in smaller capitalization companies and owners of lower quality properties negatively impacted performance. Given the U.S. REIT market’s strong positive returns during the fiscal year, the Fund’s cash reserves detracted from performance.
The Fund’s international real estate securities holdings detracted from relative performance during the period spanning the beginning of the fiscal year through September 30, 2010, as the U.S. outperformed the rest of the globe (19.10% as measured by the FTSE NAREIT Equity REIT Index vs. 10.31% as measured by the international portion of the FTSE EPRA/NAREIT Developed Real Estate Index). Exposure to property stocks in the United Kingdom and Hong Kong was particularly detrimental to performance.
For the final three months of the fiscal year, the global real estate securities market produced a 6.15% return, as measured by the FTSE EPRA/NAREIT Developed Real Estate Index. During this period, the Fund’s performance was negatively affected by an overweight position in Hong Kong issuers, which performed poorly as a result of restrictive Chinese government policy measures. An underweight to the poorly performing Continental Europe region partially offset this negative impact.
How did the investment strategies and techniques employed by the Fund and its money managers affect its performance?
Cohen & Steers Capital Management, Inc. (“Cohen & Steers”) managed a broadly diversified portfolio of global property securities, taking a bottom-up approach to portfolio construction. Cohen & Steers’ process emphasizes the relationship between price and net asset value as the principal valuation metric. Cohen & Steers also evaluates multiple-to-growth ratios as indicators of value. Underperformance during the fiscal year was a result of adverse stock selection, particularly in the health care sector.
| Real Estate Securities Fund | 79 |
Table of Contents
Russell Investment Funds
Real Estate Securities Fund
Portfolio Management Discussion — December 31, 2010 (Unaudited)
Heitman Real Estate Securities, LLC (“Heitman”) managed a concentrated portfolio with a bottom-up approach to stock selection focusing on companies that it believed had attractive valuations relative to growth prospects. Heitman underperformed its benchmark during the period extending from the beginning of the fiscal year to Heitman’s June 2010 termination date. Weak stock selection in the industrial, lodging/resorts and retail sectors drove underperformance. Sector allocation had a slight positive effect on performance due to an underweight to the underperforming mixed industrial/office sector.
INVESCO Advisers, Inc. (“Invesco”) manages a broadly diversified portfolio with exposure to all major property sectors. Its investment style incorporates fundamental property market research and bottom-up quantitative securities analysis. Invesco’s underperformance during the fiscal year was a result of weak stock selection. Stock selection in the apartments, shopping centers and health care sectors had the largest negative impact on performance. Sector allocation further detracted from performance, due to overweight positions in the underperforming health care, industrial and specialty sectors.
AEW Capital Management, L.P. (“AEW”) pursues a value-oriented style that focuses on identifying companies that it believes are mispriced relative to underlying real estate net asset value. AEW’s outperformance during the fiscal year was a result of strong security selection, particularly in the diversified, industrial and office sectors. AEW’s sector allocation also contributed modestly to performance due to an overweight to the outperforming apartment sector.
Describe any changes to the Fund’s structure or the money manager line-up.
Heitman Real Estate Securities, LLC was terminated in June 2010. Heitman’s portion of the Fund was re-allocated to the remaining managers.
The Fund was transitioned to a fully global strategy beginning October 1, 2010. All three managers in the Fund at that date were retained, and their mandates were expanded to cover global real estate securities.
Additionally, effective October 1, 2010, the Fund changed its status from non-diversified to diversified for purposes of the Investment Company Act of 1940, as amended.
| Money Managers as of December 31, 2010 | Styles | |
| AEW Capital Management, L.P. | Value | |
| Cohen & Steers Capital Management, Inc. | Market-Oriented | |
| INVESCO Advisers, Inc. which acts as a money manager to the Fund through its INVESCO Real Estate division | Market-Oriented | |
The views expressed in this report reflect those of the portfolio managers only through the end of the period covered by the report. These views do not necessarily represent the views of RIMCo or any other person in RIMCo or any other affiliated organization. These views are subject to change at any time based upon market conditions or other events, and RIMCo disclaims any responsibility to update the views contained herein. These views should not be relied on as investment advice and, because investment decisions for Russell Investment Funds (“RIF”) are based on numerous factors, should not be relied on as an indication of investment decisions of any RIF Fund.
| * | Assumes initial investment on January 1, 2001. |
| ** | FTSE National Association of Real Estate Investment Trusts (NAREIT) Equity REITs Index is an index composed of all the data based on the last closing price of the month for all tax-qualified REITs listed on the New York Stock Exchange, American Stock Exchange, and the NASDAQ National Market System. The data is market value-weighted. The total-return calculation is based upon whether it is 1-month, 3-months or 12-months. Only those REITs listed for the entire period are used in the total return calculation. |
| *** | FTSE EPRA/NAREIT Developed Real Estate Index (net) is designed to represent general trends in eligible listed real estate stocks worldwide. Relevant real estate activities are defined as the ownership, trading and development of income-producing real estate. The index also includes a range of regional and country indices, Dividend+ indices, Global Sectors, Investment Focus, and a REITs and Non-REITs series. |
| § | Annualized. |
The performance shown in this section does not reflect any Insurance Company Separate Account or Policy Charges. Performance is historical and assumes reinvestment of all dividends and capital gains. Investment return and principal value will fluctuate so that an investor’s shares, when redeemed, may be worth more or less than when purchased. Past performance is not indicative of future results.
| 80 | Real Estate Securities Fund |
Table of Contents
Russell Investment Funds
Real Estate Securities Fund
Shareholder Expense Example — December 31, 2010 (Unaudited)
Fund Expenses
The following disclosure provides important information regarding each Fund’s Expense Example, which appears on each Fund’s individual page in this Annual Report. Please refer to this information when reviewing the Expense Example for a Fund.
Example
As a shareholder of the Fund, you incur two types of costs: (1) transaction costs, and (2) ongoing costs, including advisory fees and other Fund expenses. The Example is intended to help you understand your ongoing costs (in dollars) of investing in the Fund and to compare these costs with the ongoing costs of investing in other mutual funds. The Example is based on an investment of $1,000 invested at the beginning of the period and held for the entire period indicated, which for this Fund is from July 1, 2010 to December 31, 2010.
Actual Expenses
The information in the table under the heading “Actual Performance” provides information about actual account values and actual expenses. You may use the information in this column, together with the amount you invested, to estimate the expenses that you paid over the period. Simply divide your account value by $1,000 (for example, an $8,600 account value divided by $1,000 = 8.6), then multiply the result by the number in the first column in the row entitled “Expenses Paid During Period” to estimate the expenses you paid on your account during this period.
Hypothetical Example for Comparison Purposes
The information in the table under the heading “Hypothetical Performance (5% return before expenses)” provides information about hypothetical account values and hypothetical expenses based on the Fund’s actual expense ratio and an assumed rate of return of 5% per year before expenses, which is not the Fund’s actual return. The hypothetical account values and expenses may not be used to estimate the actual ending account balance or expenses you paid for the period. You may use this information to compare the ongoing costs of investing in the Fund and other funds. To do so, compare this 5% hypothetical example with the 5% hypothetical examples that appear in the shareholder reports of other funds.
Please note that the expenses shown in the table are meant to highlight your ongoing costs only and do not reflect any transactional costs. Therefore, the information under the heading “Hypothetical Performance (5% return before expenses)” is useful in comparing ongoing costs only, and will not help you determine the relative total costs of owning different funds. In addition, if these transactional costs were included, your costs would have been higher. The fee and expenses shown in this section do not reflect any Insurance Company Separate Account or Policy Charges.
Core Class | Actual Performance | Hypothetical Performance (5% return before expenses) | ||||||
| Beginning Account Value July 1, 2010 | $ | 1,000.00 | $ | 1,000.00 | ||||
| Ending Account Value December 31, 2010 | $ | 1,187.70 | $ | 1,020.11 | ||||
Expenses Paid During Period* | $ | 5.57 | $ | 5.14 | ||||
| * | Expenses are equal to the Fund’s annualized expense ratio of 1.01% (representing the six month period annualized), multiplied by the average account value over the period, multiplied by 184/365 (to reflect the one-half year period). May reflect amounts waived, reimbursed and/or other credits. Without any waivers, reimbursements and/or other credits, expenses would have been higher. |
| Real Estate Securities Fund | 81 |
Table of Contents
Russell Investment Funds
Real Estate Securities Fund
Schedule of Investments — December 31, 2010
Amounts in thousands (except share amounts)
| Principal Amount ($) or Shares | Market Value $ | |||||||
| Common Stocks - 96.6% | ||||||||
| Australia - 8.5% | ||||||||
BGP Holdings PLC (Æ)(ö)(þ) | 926,311 | — | ||||||
CFS Retail Property Trust (Ñ) | 1,715,215 | 3,088 | ||||||
Charter Hall Group - ADR | 323,757 | 821 | ||||||
Charter Hall Retail REIT (ö) | 124,753 | 375 | ||||||
Dexus Property Group (Ñ)(ö) | 1,833,199 | 1,490 | ||||||
FKP Property Group (Ñ)(ö) | 1,894,753 | 1,657 | ||||||
Goodman Group (Ñ)(ö) | 6,752,633 | 4,489 | ||||||
GPT Group (ö) | 1,169,784 | 3,517 | ||||||
ING Industrial Fund (ö) | 1,659,357 | 891 | ||||||
ING Office Fund (ö) | 1,382,086 | 785 | ||||||
Mirvac Group (ö) | 1,308,771 | 1,640 | ||||||
Stockland (Ñ)(ö) | 2,719,183 | 10,013 | ||||||
Westfield Group | 1,091,693 | 10,697 | ||||||
Westfield Retail Trust (Æ)(ö) | 1,008,948 | 2,652 | ||||||
| 42,115 | ||||||||
| Austria - 0.3% | ||||||||
Atrium European Real Estate, Ltd. | 33,423 | 195 | ||||||
Conwert Immobilien Invest SE | 73,474 | 1,056 | ||||||
| 1,251 | ||||||||
| Brazil - 1.0% | ||||||||
BR Malls Participacoes SA | 185,782 | 1,914 | ||||||
BR Properties SA | 151,936 | 1,662 | ||||||
MRV Engenharia e Participacoes SA | 124,317 | 1,169 | ||||||
| 4,745 | ||||||||
| Canada - 3.2% | ||||||||
Boardwalk Real Estate Investment Trust (ö) | 61,619 | 2,556 | ||||||
Brookfield Properties Corp. | 113,100 | 1,993 | ||||||
Chartwell Seniors Housing Real Estate Investment Trust (ö) | 90,764 | 747 | ||||||
Cominar Real Estate Investment Trust (ö) | 34,297 | 719 | ||||||
Dundee Real Estate Investment Trust (ö) | 61,100 | 1,855 | ||||||
First Capital Realty, Inc. Class A (Ñ) | 20,300 | 308 | ||||||
Morguard Real Estate Investment Trust (ö) | 32,200 | 476 | ||||||
Primaris Retail Real Estate Investment Trust (ö) | 149,756 | 2,944 | ||||||
RioCan Real Estate Investment Trust (ö) | 186,695 | 4,131 | ||||||
| 15,729 | ||||||||
| Finland - 0.8% | ||||||||
Citycon OYJ | 124,468 | 512 | ||||||
Sponda OYJ | 634,645 | 3,291 | ||||||
| 3,803 | ||||||||
| France - 3.7% | ||||||||
Fonciere Des Regions (ö) | 10,579 | 1,024 | ||||||
Gecina SA | 7,600 | 836 | ||||||
ICADE | 2,500 | 255 | ||||||
Klepierre - GDR (ö) | 54,709 | 1,974 | ||||||
Mercialys SA | 13,911 | 522 | ||||||
Societe de la Tour Eiffel (ö) | 3,184 | 247 | ||||||
| Principal Amount ($) or Shares | Market Value $ | |||||||
Societe Immobiliere de Location pour l’Industrie et le Commerce | 12,534 | 1,553 | ||||||
Unibail-Rodamco SE - ADR | 60,154 | 11,895 | ||||||
| 18,306 | ||||||||
| Germany - 0.3% | ||||||||
Deutsche Euroshop AG | 4,411 | 171 | ||||||
Deutsche Wohnen AG (Æ) | 91,470 | 1,284 | ||||||
GAGFAH SA | 19,000 | 170 | ||||||
| 1,625 | ||||||||
| Hong Kong - 16.7% | ||||||||
Agile Property Holdings, Ltd. (Ñ) | 2,020,000 | 2,973 | ||||||
China Overseas Land & Investment, Ltd. (Ñ) | 3,396,000 | 6,282 | ||||||
China Resources Land, Ltd. | 840,000 | 1,535 | ||||||
Glorious Property Holdings, Ltd. | 2,205,000 | 757 | ||||||
Guangzhou R&F Properties Co., Ltd. (Ñ) | 568,400 | 813 | ||||||
Hang Lung Properties, Ltd. - ADR | 1,156,000 | 5,406 | ||||||
Henderson Land Development Co., Ltd. | 496,000 | 3,382 | ||||||
Hongkong Land Holdings, Ltd. (Ñ) | 1,442,000 | 10,412 | ||||||
Hysan Development Co., Ltd. | 618,000 | 2,910 | ||||||
Kerry Properties, Ltd. | 723,000 | 3,767 | ||||||
KWG Property Holding, Ltd. (Ñ) | 2,130,068 | 1,622 | ||||||
Link REIT (The) (ö) | 679,500 | 2,112 | ||||||
Longfor Properties Co., Ltd. | 621,000 | 864 | ||||||
New World Development, Ltd. (Ñ) | 1,596,775 | 3,000 | ||||||
Shangri-La Asia, Ltd. | 276,000 | 749 | ||||||
Shimao Property Holdings, Ltd. (Ñ) | 2,434,000 | 3,676 | ||||||
Sino Land Co., Ltd. | 1,294,817 | 2,422 | ||||||
Sino-Ocean Land Holdings, Ltd. | 618,000 | 405 | ||||||
Sun Hung Kai Properties, Ltd. | 1,364,000 | 22,655 | ||||||
Swire Pacific, Ltd. Class A | 77,500 | 1,274 | ||||||
Wharf Holdings, Ltd. | 731,809 | 5,630 | ||||||
| 82,646 | ||||||||
| Italy - 0.2% | ||||||||
Beni Stabili SpA | 925,099 | 783 | ||||||
| Japan - 9.1% | ||||||||
Advance Residence Investment Corp. Class A (ö) | 320 | 717 | ||||||
Aeon Mall Co., Ltd. | 25,100 | 674 | ||||||
Frontier Real Estate Investment Corp. (ö) | 88 | 840 | ||||||
Japan Prime Realty Investment Corp. Class A (Ñ)(ö) | 272 | 838 | ||||||
Japan Real Estate Investment Corp. Class A (ö) | 334 | 3,464 | ||||||
Japan Retail Fund Investment Corp. Class A (ö) | 955 | 1,831 | ||||||
Kenedix Realty Investment Corp. Class A (ö) | 167 | 785 | ||||||
Mitsubishi Estate Co., Ltd. | 574,000 | 10,647 | ||||||
Mitsui Fudosan Co., Ltd. | 829,000 | 16,528 | ||||||
Nippon Building Fund, Inc. Class A (Ñ)(ö) | 232 | 2,381 | ||||||
Nomura Real Estate Holdings, Inc. | 45,700 | 832 | ||||||
NTT Urban Development Corp. | 1,630 | 1,606 | ||||||
Orix JREIT, Inc. Class A (ö) | 53 | 345 | ||||||
| 82 | Real Estate Securities Fund |
Table of Contents
Russell Investment Funds
Real Estate Securities Fund
Schedule of Investments, continued — December 31, 2010
Amounts in thousands (except share amounts)
| Principal Amount ($) or Shares | Market Value $ | |||||||
Sumitomo Realty & Development Co., Ltd. | 136,600 | 3,263 | ||||||
| 44,751 | ||||||||
| Netherlands - 1.4% | ||||||||
Corio NV (ö) | 71,610 | 4,595 | ||||||
Eurocommercial Properties NV (ö) | 31,872 | 1,467 | ||||||
Wereldhave NV (ö) | 11,226 | 1,096 | ||||||
| 7,158 | ||||||||
| Norway - 0.3% | ||||||||
Norwegian Property ASA (Æ) | 778,293 | 1,381 | ||||||
| Philippines - 0.3% | ||||||||
SM Prime Holdings, Inc. | 5,702,917 | 1,481 | ||||||
| Singapore - 5.7% | ||||||||
Allgreen Properties, Ltd. | 1,307,000 | 1,202 | ||||||
Ascendas Real Estate Investment Trust (Æ)(ö) | 754,009 | 1,216 | ||||||
CapitaCommercial Trust ()(Ñ)(ö) | 3,105,000 | 3,629 | ||||||
CapitaLand, Ltd. | 2,659,000 | 7,688 | ||||||
CapitaMall Trust Class A (Æ)(ö) | 612,000 | 930 | ||||||
CapitaMalls Asia, Ltd. (Ñ) | 1,543,000 | 2,332 | ||||||
City Developments, Ltd. | 160,000 | 1,566 | ||||||
Frasers Centrepoint Trust | 988,480 | 1,155 | ||||||
Global Logistic Properties, Ltd. (Ñ) | 416,000 | 700 | ||||||
Keppel Land, Ltd. (Ñ) | 959,435 | 3,588 | ||||||
Mapletree Logistics Trust (ö) | 1,374,608 | 1,034 | ||||||
Overseas Union Enterprise, Ltd. | 346,000 | 887 | ||||||
Suntec Real Estate Investment Trust | 1,974,500 | 2,308 | ||||||
| 28,235 | ||||||||
| Sweden - 1.2% | ||||||||
Castellum AB | 197,035 | 2,682 | ||||||
Fabege AB (Ñ) | 251,511 | 2,937 | ||||||
Hufvudstaden AB Class A | 45,000 | 526 | ||||||
| 6,145 | ||||||||
| Switzerland - 0.4% | ||||||||
PSP Swiss Property AG (Æ) | 12,076 | 969 | ||||||
Swiss Prime Site AG Class A (Æ) | 14,937 | 1,114 | ||||||
| 2,083 | ||||||||
| United Kingdom - 5.0% | ||||||||
Big Yellow Group PLC (ö) | 110,102 | 601 | ||||||
British Land Co. PLC (ö) | 690,757 | 5,648 | ||||||
Capital & Counties Properties PLC | 185,853 | 437 | ||||||
Derwent London PLC | 106,770 | 2,599 | ||||||
Great Portland Estates PLC | 297,415 | 1,673 | ||||||
Hammerson PLC | 691,416 | 4,498 | ||||||
Hansteen Holdings PLC (ö) | 261,491 | 332 | ||||||
Land Securities Group PLC (ö) | 432,321 | 4,544 | ||||||
Metric Property Investments PLC (Æ)(ö) | 172,700 | 289 | ||||||
Segro PLC (ö) | 580,549 | 2,592 | ||||||
Shaftesbury PLC (ö) | 84,519 | 590 | ||||||
| Principal Amount ($) or Shares | Market Value $ | |||||||
Unite Group PLC | 273,221 | 827 | ||||||
| 24,630 | ||||||||
| United States - 38.5% | ||||||||
Acadia Realty Trust (ö) | 39,000 | 711 | ||||||
Alexandria Real Estate Equities, Inc. (Ñ)(ö) | 31,800 | 2,329 | ||||||
AMB Property Corp. (ö) | 40,500 | 1,284 | ||||||
American Campus Communities, Inc. (ö) | 9,100 | 289 | ||||||
Apartment Investment & Management Co. Class A (Ñ)(ö) | 53,500 | 1,382 | ||||||
AvalonBay Communities, Inc. (Ñ)(ö) | 69,732 | 7,848 | ||||||
BioMed Realty Trust, Inc. (ö) | 113,587 | 2,118 | ||||||
Boston Properties, Inc. (ö) | 78,733 | 6,779 | ||||||
BRE Properties, Inc. Class A (ö) | 12,246 | 533 | ||||||
Brookdale Senior Living, Inc. (Æ) | 44,084 | 944 | ||||||
Camden Property Trust (Ñ)(ö) | 70,300 | 3,795 | ||||||
Campus Crest Communities, Inc. (Ñ)(ö) | 25,900 | 363 | ||||||
CBL & Associates Properties, Inc. (Ñ)(ö) | 145,102 | 2,540 | ||||||
Coresite Realty Corp. (Ñ)(ö) | 13,600 | 186 | ||||||
Corporate Office Properties Trust (Ñ)(ö) | 20,467 | 715 | ||||||
DCT Industrial Trust, Inc. (Ñ)(ö) | 209,700 | 1,113 | ||||||
Developers Diversified Realty Corp. (Ñ)(ö) | 290,909 | 4,098 | ||||||
DiamondRock Hospitality Co. (Æ)(ö) | 67,500 | 810 | ||||||
Digital Realty Trust, Inc. (Ñ)(ö) | 56,200 | 2,896 | ||||||
Duke Realty Corp. (ö) | 38,562 | 481 | ||||||
DuPont Fabros Technology, Inc. (Ñ)(ö) | 86,300 | 1,836 | ||||||
Entertainment Properties Trust (ö) | 21,400 | 990 | ||||||
Equity Lifestyle Properties, Inc. (ö) | 11,000 | 615 | ||||||
Equity Residential (ö) | 219,732 | 11,416 | ||||||
Essex Property Trust, Inc. (Ñ)(ö) | 24,400 | 2,787 | ||||||
Excel Trust, Inc. (Ñ)(ö) | 9,500 | 115 | ||||||
Extra Space Storage, Inc. (Ñ)(ö) | 94,400 | 1,643 | ||||||
Federal Realty Investment Trust (Ñ)(ö) | 25,000 | 1,948 | ||||||
First Potomac Realty Trust (Ñ)(ö) | 61,700 | 1,038 | ||||||
Forest City Enterprises, Inc. Class A (Æ) | 142,689 | 2,381 | ||||||
General Growth Properties, Inc. (Æ)(ö) | 165,157 | 2,557 | ||||||
HCP, Inc. (ö) | 77,200 | 2,840 | ||||||
Health Care REIT, Inc. (ö) | 70,600 | 3,364 | ||||||
Hersha Hospitality Trust Class A (ö) | 208,234 | 1,374 | ||||||
Highwoods Properties, Inc. (Ñ)(ö) | 41,500 | 1,322 | ||||||
Home Properties, Inc. (Ñ)(ö) | 17,400 | 966 | ||||||
Host Hotels & Resorts, Inc. (Ñ)(ö) | 534,464 | 9,551 | ||||||
Hudson Pacific Properties, Inc. (ö) | 12,200 | 184 | ||||||
Hyatt Hotels Corp. (Æ) | 39,213 | 1,794 | ||||||
Kilroy Realty Corp. (Ñ)(ö) | 66,000 | 2,407 | ||||||
Kimco Realty Corp. (ö) | 349,084 | 6,298 | ||||||
LaSalle Hotel Properties (ö) | 23,400 | 618 | ||||||
Liberty Property Trust (Ñ)(ö) | 172,479 | 5,506 | ||||||
Macerich Co. (The) (ö) | 117,467 | 5,564 | ||||||
Marriott International, Inc. Class A | 16,382 | 681 | ||||||
Mid-America Apartment Communities, Inc. (ö) | 10,100 | 641 | ||||||
National Retail Properties, Inc. (Ñ)(ö) | 65,600 | 1,738 | ||||||
Nationwide Health Properties, Inc. (ö) | 98,300 | 3,576 | ||||||
Omega Healthcare Investors, Inc. (ö) | 73,762 | 1,655 | ||||||
Pebblebrook Hotel Trust (Ñ)(ö) | 31,400 | 638 | ||||||
| Real Estate Securities Fund | 83 |
Table of Contents
Russell Investment Funds
Real Estate Securities Fund
Schedule of Investments, continued — December 31, 2010
Amounts in thousands (except share amounts)
| Principal Amount ($) or Shares | Market Value $ | |||||||
Piedmont Office Realty Trust, Inc. Class A (Ñ)(ö) | 64,100 | 1,291 | ||||||
Post Properties, Inc. (Ñ)(ö) | 80,430 | 2,920 | ||||||
ProLogis (ö) | 450,668 | 6,507 | ||||||
PS Business Parks, Inc. (ö) | 16,677 | 929 | ||||||
Public Storage (ö) | 68,568 | 6,954 | ||||||
Regency Centers Corp. (Ñ)(ö) | 87,300 | 3,687 | ||||||
Retail Opportunity Investments Corp. (Ñ)(ö) | 73,400 | 727 | ||||||
Senior Housing Properties Trust (ö) | 72,600 | 1,593 | ||||||
Simon Property Group, Inc. (ö) | 233,937 | 23,274 | ||||||
SL Green Realty Corp. (ö) | 61,426 | 4,147 | ||||||
Sovran Self Storage, Inc. (ö) | 16,900 | 622 | ||||||
Starwood Hotels & Resorts Worldwide, Inc. (Ñ)(ö) | 23,139 | 1,406 | ||||||
Sunstone Hotel Investors, Inc. (Æ)(ö) | 179,723 | 1,857 | ||||||
Taubman Centers, Inc. (ö) | 5,400 | 273 | ||||||
UDR, Inc. (ö) | 101,321 | 2,383 | ||||||
Ventas, Inc. (ö) | 82,501 | 4,330 | ||||||
Vornado Realty Trust (ö) | 71,200 | 5,933 | ||||||
Washington Real Estate Investment Trust (ö) | 29,200 | 905 | ||||||
Weingarten Realty Investors (Ñ)(ö) | 42,439 | 1,008 | ||||||
| 190,003 | ||||||||
| Total Common Stocks (cost $398,069) | 476,870 | |||||||
| Short-Term Investments - 2.9% | ||||||||
| United States - 2.9% | ||||||||
Russell U.S. Cash Management Fund | 14,148,240 | (¥) | 14,148 | |||||
| Total Short-Term Investments (cost $14,148) | 14,148 | |||||||
| Other Securities - 15.2% | ||||||||
Russell Investment Funds Liquidating Trust (×) | 31,749,921 | (¥) | 31,750 | |||||
Russell U.S. Cash Collateral Fund (×) | 43,540,636 | (¥) | 43,541 | |||||
| Total Other Securities (cost $75,291) | 75,291 | |||||||
| Total Investments - 114.7% (identified cost $487,508) | 566,309 | |||||||
| Other Assets and Liabilities, Net - (14.7%) | (72,413 | ) | ||||||
| Net Assets - 100.0% | 493,896 | |||||||
A portion of the portfolio has been fair valued as of period end.
See accompanying notes which are an integral part of the financial statements.
| 84 | Real Estate Securities Fund |
Table of Contents
Russell Investment Funds
Real Estate Securities Fund
Schedule of Investments, continued — December 31, 2010
Amounts in thousands (except share amounts)
| Foreign Currency Exchange Contracts | ||||||||||||||||||||||||||
| Counterparty | Amount Sold | Amount Bought | Settlement Date | Unrealized Appreciation (Depreciation) $ | ||||||||||||||||||||||
| Deutsche Bank AG | EUR | 4 | USD | 5 | 01/04/11 | — | ||||||||||||||||||||
| Deutsche Bank AG | EUR | 5 | USD | 6 | 01/04/11 | — | ||||||||||||||||||||
| State Street Bank & Trust Co. | USD | 6 | AUD | 6 | 01/04/11 | — | ||||||||||||||||||||
| State Street Bank & Trust Co. | USD | 92 | AUD | 91 | 01/04/11 | 1 | ||||||||||||||||||||
| State Street Bank & Trust Co. | USD | 51 | AUD | 50 | 01/05/11 | — | ||||||||||||||||||||
| State Street Bank & Trust Co. | USD | 17 | CAD | 17 | 01/05/11 | — | ||||||||||||||||||||
| State Street Bank & Trust Co. | USD | 15 | EUR | 11 | 01/03/11 | — | ||||||||||||||||||||
| State Street Bank & Trust Co. | USD | 9 | EUR | 7 | 01/04/11 | — | ||||||||||||||||||||
| State Street Bank & Trust Co. | USD | 2 | GBP | 1 | 01/04/11 | — | ||||||||||||||||||||
| State Street Bank & Trust Co. | USD | 2 | GBP | 1 | 01/04/11 | — | ||||||||||||||||||||
| State Street Bank & Trust Co. | USD | 2 | GBP | 1 | 01/04/11 | — | ||||||||||||||||||||
| State Street Bank & Trust Co. | USD | 3 | GBP | 2 | 01/05/11 | — | ||||||||||||||||||||
| State Street Bank & Trust Co. | USD | 4 | GBP | 3 | 01/05/11 | — | ||||||||||||||||||||
| State Street Bank & Trust Co. | USD | 9 | GBP | 6 | 01/05/11 | — | ||||||||||||||||||||
| State Street Bank & Trust Co. | USD | 37 | HKD | 284 | 01/03/11 | — | ||||||||||||||||||||
| State Street Bank & Trust Co. | USD | 135 | HKD | 1,054 | 01/03/11 | — | ||||||||||||||||||||
| State Street Bank & Trust Co. | USD | 110 | HKD | 857 | 01/04/11 | — | ||||||||||||||||||||
| State Street Bank & Trust Co. | USD | 122 | HKD | 948 | 01/04/11 | — | ||||||||||||||||||||
| State Street Bank & Trust Co. | USD | 13 | JPY | 1,038 | 01/04/11 | — | ||||||||||||||||||||
| State Street Bank & Trust Co. | USD | 18 | JPY | 1,496 | 01/04/11 | — | ||||||||||||||||||||
| State Street Bank & Trust Co. | USD | 5 | PHP | 201 | 01/03/11 | — | ||||||||||||||||||||
| State Street Bank & Trust Co. | USD | 2 | PHP | 89 | 01/04/11 | — | ||||||||||||||||||||
| State Street Bank & Trust Co. | USD | 20 | SGD | 26 | 01/03/11 | — | ||||||||||||||||||||
| State Street Bank & Trust Co. | USD | 94 | SGD | 121 | 01/03/11 | — | ||||||||||||||||||||
| State Street Bank & Trust Co. | USD | 111 | SGD | 143 | 01/03/11 | — | ||||||||||||||||||||
| State Street Bank & Trust Co. | USD | 17 | SGD | 21 | 01/04/11 | — | ||||||||||||||||||||
| State Street Bank & Trust Co. | USD | 38 | SGD | 49 | 01/04/11 | — | ||||||||||||||||||||
| State Street Bank & Trust Co. | USD | 56 | SGD | 72 | 01/04/11 | — | ||||||||||||||||||||
| State Street Bank & Trust Co. | AUD | 60 | USD | 61 | 01/04/11 | — | ||||||||||||||||||||
| State Street Bank & Trust Co. | AUD | 186 | USD | 189 | 01/05/11 | (1 | ) | |||||||||||||||||||
| State Street Bank & Trust Co. | CAD | 4 | USD | 4 | 01/04/11 | — | ||||||||||||||||||||
| State Street Bank & Trust Co. | CAD | 62 | USD | 62 | 01/04/11 | — | ||||||||||||||||||||
| State Street Bank & Trust Co. | CAD | 1 | USD | 1 | 01/05/11 | — | ||||||||||||||||||||
| State Street Bank & Trust Co. | EUR | 6 | GBP | 5 | 01/04/11 | — | ||||||||||||||||||||
| State Street Bank & Trust Co. | EUR | 43 | GBP | 36 | 01/04/11 | — | ||||||||||||||||||||
| State Street Bank & Trust Co. | EUR | — | USD | — | 01/03/11 | — | ||||||||||||||||||||
| State Street Bank & Trust Co. | EUR | 8 | USD | 11 | 01/03/11 | — | ||||||||||||||||||||
| State Street Bank & Trust Co. | EUR | 5 | USD | 7 | 01/05/11 | — | ||||||||||||||||||||
| State Street Bank & Trust Co. | GBP | 16 | EUR | 19 | 01/04/11 | — | ||||||||||||||||||||
| State Street Bank & Trust Co. | GBP | 25 | EUR | 29 | 01/04/11 | — | ||||||||||||||||||||
| State Street Bank & Trust Co. | HKD | 418 | USD | 54 | 01/03/11 | — | ||||||||||||||||||||
| State Street Bank & Trust Co. | HKD | 117 | USD | 15 | 01/04/11 | — | ||||||||||||||||||||
| State Street Bank & Trust Co. | HKD | 292 | USD | 38 | 01/04/11 | — | ||||||||||||||||||||
| State Street Bank & Trust Co. | JPY | 27,511 | USD | 337 | 01/05/11 | (2 | ) | |||||||||||||||||||
| State Street Bank & Trust Co. | JPY | 12,070 | USD | 148 | 01/06/11 | — | ||||||||||||||||||||
| State Street Bank & Trust Co. | SGD | 115 | USD | 89 | 01/03/11 | — | ||||||||||||||||||||
| State Street Bank & Trust Co. | SGD | 13 | USD | 10 | 01/04/11 | — | ||||||||||||||||||||
| Total Unrealized Appreciation (Depreciation) on Open Foreign Currency Exchange Contracts |
| (2 | ) | ||||||||||||||||||||||
See accompanying notes which are an integral part of the financial statements.
| Real Estate Securities Fund | 85 |
Table of Contents
Russell Investment Funds
Real Estate Securities Fund
Presentation of Portfolio Holdings — December 31, 2010
Amounts in thousands
| Market Value | % of Net Assets | |||||||||||||||||||
| Portfolio Summary | Level 1 | Level 2 | Level 3 | Total | ||||||||||||||||
Common Stocks | ||||||||||||||||||||
Australia | $ | 42,115 | $ | — | $ | — | $ | 42,115 | 8.5 | |||||||||||
Austria | 1,251 | — | — | 1,251 | 0.3 | |||||||||||||||
Brazil | 4,745 | — | — | 4,745 | 1.0 | |||||||||||||||
Canada | 15,729 | — | — | 15,729 | 3.2 | |||||||||||||||
Finland | 3,803 | — | — | 3,803 | 0.8 | |||||||||||||||
France | 18,306 | — | — | 18,306 | 3.7 | |||||||||||||||
Germany | 1,625 | — | — | 1,625 | 0.3 | |||||||||||||||
Hong Kong | 82,646 | — | — | 82,646 | 16.7 | |||||||||||||||
Italy | 783 | — | — | 783 | 0.2 | |||||||||||||||
Japan | 44,751 | — | — | 44,751 | 9.1 | |||||||||||||||
Netherlands | 7,158 | — | — | 7,158 | 1.4 | |||||||||||||||
Norway | 1,381 | — | — | 1,381 | 0.3 | |||||||||||||||
Philippines | 1,481 | — | — | 1,481 | 0.3 | |||||||||||||||
Singapore | 28,235 | — | — | 28,235 | 5.7 | |||||||||||||||
Sweden | 6,145 | — | — | 6,145 | 1.2 | |||||||||||||||
Switzerland | 2,083 | — | — | 2,083 | 0.4 | |||||||||||||||
United Kingdom | 24,630 | — | — | 24,630 | 5.0 | |||||||||||||||
United States | 190,003 | — | — | 190,003 | 38.5 | |||||||||||||||
Short-Term Investments | — | 14,148 | — | 14,148 | 2.9 | |||||||||||||||
Other Securities | — | 75,291 | — | 75,291 | 15.2 | |||||||||||||||
Total Investments | 476,870 | 89,439 | — | 566,309 | 114.7 | |||||||||||||||
Other Assets and Liabilities, Net | (14.7 | ) | ||||||||||||||||||
| 100.0 | ||||||||||||||||||||
Other Financial Instruments | ||||||||||||||||||||
Foreign Currency Exchange Contracts | (2 | ) | — | — | (2 | ) | — | * | ||||||||||||
Total Other Financial Instruments** | (2 | ) | — | — | (2 | ) | ||||||||||||||
| * | Less than .05% of net assets. |
| ** | Other financial instruments reflected in the Schedule of Investments, such as futures, forwards, and swap contracts which are valued at the unrealized appreciation/depreciation on the instruments. |
For a description of the levels see note 2 in the Notes to Financial Statements.
| 86 | Real Estate Securities Fund |
Table of Contents
Russell Investment Funds
Real Estate Securities Fund
Fair Value of Derivative Instruments — December 31, 2010
Amounts in thousands
| Derivatives not accounted for as hedging instruments | Foreign Currency Contracts | |||
Location: Statement of Assets and Liabilities - Assets | ||||
Unrealized appreciation on foreign currency exchange contracts | $ | 1 | ||
Location: Statement of Assets and Liabilities - Liabilities | ||||
Unrealized depreciation on foreign currency exchange contracts | $ | 3 | ||
| Derivatives not accounted for as hedging instruments | Foreign Currency Contracts | |||
Location: Statement of Operations - Net realized gain (loss) | ||||
Foreign currency-related transactions | $ | 642 | ||
Location: Statement of Operations - Net change in unrealized appreciation (depreciation) | ||||
Foreign currency-related transactions | $ | (2 | ) | |
For further disclosure on derivatives see note 2 in Notes to Financial Statements.
See accompanying notes which are an integral part of the financial statements.
| Real Estate Securities Fund | 87 |
Table of Contents
Notes to Schedules of Investments — December 31, 2010
Footnotes:
| (Æ) | Nonincome-producing security. |
| (ö) | Real Estate Investment Trust (REIT). |
| (§) | All or a portion of the shares of this security are held as collateral in connection with futures contracts purchased (sold), options written, or swaps entered into by the Fund. |
| (ž) | Rate noted is yield-to-maturity from date of acquisition. |
| (ç) | At amortized cost, which approximates market. |
| (Ê) | Adjustable or floating rate security. Rate shown reflects rate in effect at period end. |
| (Ï) | Forward commitment. |
| (ƒ) | Perpetual floating rate security. Rate shown reflects rate in effect at period end. |
| (µ) | Bond is insured by a guarantor. |
| (æ) | Pre-refunded: These bonds are collateralized by US Treasury securities, which are held in escrow by a trustee and used to pay principal and interest in the tax-exempt issue and to retire the bonds in full at the earliest refunding date. The rate noted is for descriptive purposes; effective yield may vary. |
| (Ø) | In default. |
| (ß) | Illiquid security. |
| (×) | The security is purchased with the cash collateral from the securities loaned. |
| (Ñ) | All or a portion of the shares of this security are on loan. |
| (Þ) | Restricted security. Security may have contractual restrictions on resale, may have been offered in a private placement transaction, and may not be registered under the Securities Act of 1933. |
| (Å) | Illiquid and restricted security. |
| (å) | Currency balances were held in connection with futures contracts purchased (sold), options written, or swaps entered into by the Fund. See Note 2. |
| (£) | A portion of this asset has been segregated to cover the liability caused by the valuation of SLQT. |
| (¥) | Unrounded units |
Abbreviations:
144A - Represents private placement security for qualified buyers according to rule 144A of the Securities Act of 1933.
ADR - American Depositary Receipt
ADS - American Depositary Share
BBSW - Australian Bank Bill Short Term Rate
CIBOR - Copenhagen Interbank Offered Rate
CME - Chicago Mercantile Exchange
CMO - Collateralized Mortgage Obligation
CVO - Contingent Value Obligation
EMU - European Economic and Monetary Union
EURIBOR - Euro Interbank Offered Rate
FDIC - Federal Deposit Insurance Company
GDR - Global Depositary Receipt
GDS - Global Depositary Share
LIBOR - London Interbank Offered Rate
NIBOR - Norwegian Interbank Offered Rate
PIK - Payment in Kind
REMIC - Real Estate Mortgage Investment Conduit
STRIP - Separate Trading of Registered Interest and Principal of Securities
TBA - To Be Announced Security
Foreign Currency Abbreviations:
| ARS - Argentine peso | HKD - Hong Kong dollar | PLN - Polish zloty | ||
| AUD - Australian dollar | HUF - Hungarian forint | RUB - Russian ruble | ||
| BRL - Brazilian real | IDR - Indonesian rupiah | SEK - Swedish krona | ||
| CAD - Canadian dollar | ILS - Israeli shekel | SGD - Singapore dollar | ||
| CHF - Swiss franc | INR - Indian rupee | SKK - Slovakian koruna | ||
| CLP - Chilean peso | JPY - Japanese yen | THB - Thai baht | ||
| CNY - Chinese renminbi yuan | KES - Kenyan schilling | TRY - Turkish lira | ||
| COP - Colombian peso | KRW - South Korean won | TWD - Taiwanese dollar | ||
| CRC - Costa Rica colon | MXN - Mexican peso | USD - United States dollar | ||
| CZK - Czech koruna | MYR - Malaysian ringgit | VEB - Venezuelan bolivar | ||
| DKK - Danish krone | NOK - Norweigian Krone | VND - Vietnamese dong | ||
| EGP - Egyptian pound | NZD - New Zealand dollar | ZAR - South African rand | ||
| EUR - Euro | PEN - Peruvian nouveau sol | |||
| GBP - British pound sterling | PHP - Philippine peso |
| 88 | Notes to Schedules of Investments |
Table of Contents
Russell Investment Funds
Statements of Assets and Liabilities — December 31, 2010
| Amounts in thousands | Multi-Style Equity Fund | Aggressive Equity Fund | Non-U.S. Fund | Core Bond Fund | Real Estate Securities Fund | |||||||||||||||
Assets | ||||||||||||||||||||
Investments, at identified cost | $ | 393,866 | $ | 229,720 | $ | 329,139 | $ | 539,967 | $ | 487,508 | ||||||||||
Investments, at market*** | 466,583 | 265,582 | 380,489 | 548,093 | 566,309 | |||||||||||||||
Cash | — | — | 13 | 91 | — | |||||||||||||||
Cash (restricted) | 1,950 | 700 | 2,000 | 602 | — | |||||||||||||||
Deposits with brokers for securities sold short | — | |||||||||||||||||||
Foreign currency holdings* | — | — | 996 | 280 | 3,243 | |||||||||||||||
Unrealized appreciation on foreign currency exchange contracts | — | — | 302 | 674 | 1 | |||||||||||||||
Receivables: | ||||||||||||||||||||
Dividends and interest | 446 | 208 | 591 | 3,255 | 1,343 | |||||||||||||||
Dividends from affiliated Russell money market funds | 1 | 1 | 2 | 6 | 1 | |||||||||||||||
Investments sold | 1,140 | 487 | 1,249 | 90,142 | 1,755 | |||||||||||||||
Fund shares sold | 300 | 78 | 287 | 426 | 177 | |||||||||||||||
Foreign taxes recoverable | — | — | 173 | — | 17 | |||||||||||||||
Investments Matured | — | — | — | 275 | — | |||||||||||||||
Daily variation margin on futures contracts | — | — | 4 | 573 | — | |||||||||||||||
Other receivable | — | — | 7 | 2 | ||||||||||||||||
Prepaid expenses | — | — | 4 | — | — | |||||||||||||||
Interest rate swap contracts, at market value***** | — | — | — | 2,217 | — | |||||||||||||||
Credit default swap contracts, at market value**** | — | — | — | 791 | — | |||||||||||||||
Total assets | 470,420 | 267,056 | 386,117 | 647,427 | 572,846 | |||||||||||||||
Liabilities | ||||||||||||||||||||
Payables: | ||||||||||||||||||||
Due to broker | — | — | — | 4,680 | — | |||||||||||||||
Investments purchased | 1,656 | 948 | 1,460 | 153,793 | 3,175 | |||||||||||||||
Fund shares redeemed | 6 | 21 | 8 | 89 | 34 | |||||||||||||||
Accrued fees to affiliates | 264 | 138 | 269 | 210 | 351 | |||||||||||||||
Other accrued expenses | 58 | 41 | 55 | 95 | 96 | |||||||||||||||
Daily variation margin on futures contracts | 18 | 58 | 64 | 20 | — | |||||||||||||||
Deferred tax liability | — | — | 21 | — | ||||||||||||||||
Unrealized depreciation on foreign currency exchange contracts | — | — | 62 | 462 | 3 | |||||||||||||||
Unrealized depreciation on index swaps | — | — | — | — | — | |||||||||||||||
Options written, at market value** | — | — | — | 1,101 | — | |||||||||||||||
Payable upon return of securities loaned | 67,947 | 74,087 | 17,308 | 13,164 | 75,291 | |||||||||||||||
Interest rate swap contracts, at market value***** | — | — | — | 1,752 | — | |||||||||||||||
Credit default swap contracts, at market value**** | — | — | — | 163 | — | |||||||||||||||
Total liabilities | 69,949 | 75,293 | 19,247 | 175,529 | 78,950 | |||||||||||||||
Net Assets | $ | 400,471 | $ | 191,763 | $ | 366,870 | $ | 471,898 | $ | 493,896 | ||||||||||
See accompanying notes which are an integral part of the financial statements.
| Statements of Assets and Liabilities | 89 |
Table of Contents
Russell Investment Funds
Statements of Assets and Liabilities, continued — December 31, 2010
| Amounts in thousands | Multi-Style Equity Fund | Aggressive Equity Fund | Non-U.S. Fund | Core Bond Fund | Real Estate Securities Fund | |||||||||||||||
Net Assets Consist of: | ||||||||||||||||||||
Undistributed (overdistributed) net investment income | $ | 876 | $ | 128 | $ | 3,754 | $ | 683 | $ | 1,865 | ||||||||||
Accumulated net realized gain (loss) | (93,588 | ) | (51,376 | ) | (102,124 | ) | 1,896 | (35,827 | ) | |||||||||||
Unrealized appreciation (depreciation) on: | ||||||||||||||||||||
Investments (Russell non-U.S. Funds — net of deferred tax liability for foreign capital gains taxes) | 72,717 | 35,862 | 51,329 | 8,126 | 78,801 | |||||||||||||||
Futures contracts | 174 | 122 | 11 | (403 | ) | — | ||||||||||||||
Options written | — | — | — | (228 | ) | — | ||||||||||||||
Credit default swap contracts | — | — | — | (584 | ) | — | ||||||||||||||
Index swap contracts | — | — | — | — | — | |||||||||||||||
Interest rate swap contracts | — | — | — | (105 | ) | — | ||||||||||||||
Investments matured | — | — | — | (925 | ) | — | ||||||||||||||
Foreign currency-related transactions | — | — | 254 | 222 | — | |||||||||||||||
Other investments | — | — | 7 | 2 | 74 | |||||||||||||||
Shares of beneficial interest | 295 | 161 | 359 | 449 | 355 | |||||||||||||||
Additional paid-in capital | 419,997 | 206,866 | 413,280 | 462,765 | 448,628 | |||||||||||||||
Net Assets | $ | 400,471 | $ | 191,763 | $ | 366,870 | $ | 471,898 | $ | 493,896 | ||||||||||
Net Asset Value, offering and redemption price per share: | ||||||||||||||||||||
Net asset value per share: | $ | 13.58 | $ | 11.92 | $ | 10.21 | $ | 10.51 | $ | 13.92 | ||||||||||
Net assets | $ | 400,470,952 | $ | 191,762,934 | $ | 366,870,460 | $ | 471,898,152 | $ | 493,896,005 | ||||||||||
Shares outstanding ($.01 par value) | 29,490,073 | 16,093,824 | 35,934,170 | 44,896,324 | 35,475,143 | |||||||||||||||
Amounts in thousands | ||||||||||||||||||||
* Foreign currency holdings - cost | $ | — | $ | — | $ | 994 | $ | 276 | $ | 3,173 | ||||||||||
** Premiums received on options written | $ | — | $ | — | $ | — | $ | 873 | $ | — | ||||||||||
*** Securities on loan included in investments | $ | 74,100 | $ | 73,000 | $ | 16,524 | $ | 12,933 | $ | 72,642 | ||||||||||
**** Credit default swap contracts - premiums paid (received) | $ | — | $ | — | $ | — | $ | 1,212 | $ | — | ||||||||||
***** Interest rate swap contracts - premiums paid (received) | $ | — | $ | — | $ | — | $ | 570 | $ | — | ||||||||||
****** Investments matured - cost | $ | — | $ | — | $ | — | $ | 1,200 | $ | — | ||||||||||
See accompanying notes which are an integral part of the financial statements.
| 90 | Statements of Assets and Liabilities |
Table of Contents
(This page intentionally left blank)
Table of Contents
Russell Investment Funds
Statements of Operations — For the Period Ended December 31, 2010
| Amounts in thousands | Multi-Style Equity Fund | Aggressive Equity Fund | ||||||
Investment Income | ||||||||
Dividends | $ | 6,718 | $ | 2,384 | ||||
Dividends from affiliated Russell money market funds | 15 | 7 | ||||||
Interest | — | — | ||||||
Securities lending income | 45 | 99 | ||||||
Less foreign taxes withheld | — | — | ||||||
Total investment income | 6,778 | 2,490 | ||||||
Expenses | ||||||||
Advisory fees | 2,717 | 1,502 | ||||||
Administrative fees | 186 | 83 | ||||||
Custodian fees | 147 | 121 | ||||||
Transfer agent fees - Core Class | 16 | 7 | ||||||
Professional fees | 59 | 48 | ||||||
Trustees’ fees | 8 | 4 | ||||||
Printing fees | 163 | 71 | ||||||
Dividends from securities sold short | — | — | ||||||
Miscellaneous | 20 | 14 | ||||||
Expenses before reductions | 3,316 | 1,850 | ||||||
Expense reductions | — | (100 | ) | |||||
Net expenses | 3,316 | 1,750 | ||||||
Net investment income (loss) | 3,462 | 740 | ||||||
Net Realized and Unrealized Gain (Loss) | ||||||||
Net realized gain (loss) on: | ||||||||
Investments (Russell non-U.S. funds - net of deferred tax liability for foreign capital gains taxes) | 26,918 | 20,726 | ||||||
Futures contracts | 2,066 | 2,062 | ||||||
Options written | — | — | ||||||
Credit default swap contracts | — | — | ||||||
Interest rate swap contracts | — | — | ||||||
Foreign currency-related transactions | (3 | ) | — | |||||
Net realized gain (loss) | 28,981 | 22,788 | ||||||
Net change in unrealized appreciation (depreciation) on: | ||||||||
Investments (Russell non-U.S. funds - net of deferred tax liability for foreign capital gains taxes) | 24,845 | 15,083 | ||||||
Futures contracts | (189 | ) | (255 | ) | ||||
Options written | — | — | ||||||
Credit default swap contracts | — | — | ||||||
Interest rate swap contracts | — | — | ||||||
Investments matured | — | — | ||||||
Foreign currency-related transactions | — | — | ||||||
Other investments | — | — | ||||||
Net change in unrealized appreciation (depreciation) | 24,656 | 14,828 | ||||||
Net realized and unrealized gain (loss) | 53,637 | 37,616 | ||||||
Net Increase (Decrease) in Net Assets from Operations | $ | 57,099 | $ | 38,356 | ||||
See accompanying notes which are an integral part of the financial statements.
| 92 | Statements of Operations |
Table of Contents
| Non-U.S. Fund | Core Bond Fund | Real Estate Securities Fund | ||||||||
| $ | 8,250 | $ | 4 | $ | 16,347 | |||||
| 24 | 39 | 16 | ||||||||
| — | 18,398 | 1 | ||||||||
| 213 | 29 | 206 | ||||||||
| (775 | ) | — | (409 | ) | ||||||
| 7,712 | 18,470 | 16,161 | ||||||||
| 2,950 | 2,435 | 3,582 | ||||||||
| 164 | 221 | 224 | ||||||||
| 281 | 352 | 301 | ||||||||
| 14 | 20 | 20 | ||||||||
| 70 | 80 | 69 | ||||||||
| 7 | 10 | 9 | ||||||||
| 141 | 183 | 171 | ||||||||
| — | 1 | — | ||||||||
| 29 | 25 | 39 | ||||||||
| 3,656 | 3,327 | 4,415 | ||||||||
| (197 | ) | (310 | ) | — | ||||||
| 3,459 | 3,017 | 4,415 | ||||||||
| 4,253 | 15,453 | 11,746 | ||||||||
| 3,688 | 7,242 | 85,209 | ||||||||
| 915 | 4,097 | — | ||||||||
| — | 613 | — | ||||||||
| — | 65 | — | ||||||||
| — | 117 | — | ||||||||
| (953 | ) | (194 | ) | (237 | ) | |||||
| 3,650 | 11,940 | 84,972 | ||||||||
| 29,138 | 14,682 | (4,409 | ) | |||||||
| (544 | ) | 511 | — | |||||||
| — | (436 | ) | — | |||||||
| — | 297 | — | ||||||||
| — | (614 | ) | — | |||||||
| — | (925 | ) | — | |||||||
| 1,077 | 147 | 74 | ||||||||
| — | (2 | ) | — | |||||||
| 29,671 | 13,660 | (4,335 | ) | |||||||
| 33,321 | 25,600 | 80,637 | ||||||||
| $ | 37,574 | $ | 41,053 | $ | 92,383 | |||||
See accompanying notes which are an integral part of the financial statements.
| Statements of Operations | 93 |
Table of Contents
Russell Investment Funds
Statements of Changes in Net Assets — For the Periods Ended December 31,
| Multi-Style Equity Fund | Aggressive Equity Fund | |||||||||||||||
| Amounts in thousands | 2010 | 2009 | 2010 | 2009 | ||||||||||||
Increase (Decrease) in Net Assets | ||||||||||||||||
Operations | ||||||||||||||||
Net investment income (loss) | $ | 3,462 | $ | 3,384 | $ | 740 | $ | 860 | ||||||||
Net realized gain (loss) | 28,981 | (37,389 | ) | 22,788 | (16,950 | ) | ||||||||||
Net change in unrealized appreciation (depreciation) | 24,656 | 126,483 | 14,828 | 56,497 | ||||||||||||
Net increase (decrease) in net assets from operations | 57,099 | 92,478 | 38,356 | 40,407 | ||||||||||||
Distributions | ||||||||||||||||
From net investment income | (3,360 | ) | (4,298 | ) | (778 | ) | (695 | ) | ||||||||
From net realized gain | — | — | — | — | ||||||||||||
Net decrease in net assets from distributions | (3,360 | ) | (4,298 | ) | (778 | ) | (695 | ) | ||||||||
Share Transactions | ||||||||||||||||
Net increase (decrease) in net assets from share transactions | (30,019 | ) | (9,640 | ) | (4,486 | ) | (4,129 | ) | ||||||||
Total Net Increase (Decrease) in Net Assets | 23,720 | 78,540 | 33,092 | 35,583 | ||||||||||||
Net Assets | ||||||||||||||||
Beginning of period | 376,751 | 298,211 | 158,671 | 123,088 | ||||||||||||
End of period | $ | 400,471 | $ | 376,751 | $ | 191,763 | $ | 158,671 | ||||||||
Undistributed (overdistributed) net investment income included in net assets | $ | 876 | $ | 777 | $ | 128 | $ | 165 | ||||||||
See accompanying notes which are an integral part of the financial statements.
| 94 | Statements of Changes in Net Assets |
Table of Contents
| Non-U.S. Fund | Core Bond Fund | Real Estate Securities Fund | ||||||||||||||||||||
| 2010 | 2009 | 2010 | 2009 | 2010 | 2009 | |||||||||||||||||
| $ | 4,253 | $ | 4,273 | $ | 15,453 | $ | 15,362 | $ | 11,746 | $ | 10,546 | |||||||||||
| 3,650 | (16,624 | ) | 11,940 | 6,556 | 84,972 | (39,112 | ) | |||||||||||||||
| 29,671 | 81,171 | 13,660 | 28,987 | (4,335 | ) | 130,393 | ||||||||||||||||
| 37,574 | 68,820 | 41,053 | 50,905 | 92,383 | 101,827 | |||||||||||||||||
| (2,908 | ) | (7,901 | ) | (16,869 | ) | (16,238 | ) | (9,960 | ) | (14,717 | ) | |||||||||||
| — | — | (12,359 | ) | (4,631 | ) | — | — | |||||||||||||||
| (2,908 | ) | (7,901 | ) | (29,228 | ) | (20,869 | ) | (9,960 | ) | (14,717 | ) | |||||||||||
| 10,059 |
| 5,476 | 59,504 | 51,424 | 765 | 20,182 | |||||||||||||||
| 44,725 | 66,395 | 71,329 | 81,460 | 83,188 | 107,292 | |||||||||||||||||
| 322,145 | 255,750 | 400,569 | 319,109 | 410,708 | 303,416 | |||||||||||||||||
| $ | 366,870 | $ | 322,145 | $ | 471,898 | $ | 400,569 | $ | 493,896 | $ | 410,708 | |||||||||||
| $ | 3,754 | | $ | 2,995 | $ | 683 | $ | 2,066 | $ | 1,865 | $ | 103 | ||||||||||
See accompanying notes which are an integral part of the financial statements.
| Statements of Changes in Net Assets | 95 |
Table of Contents
Russell Investment Funds
For a Share Outstanding Throughout Each Period.
| $ Net Asset Value, Beginning of Period | $ Net Investment Income (Loss)(a) | $ Net Realized and Unrealized Gain (Loss) | $ Total from Investment Operations | $ Distributions from Net Investment Income | $ Distributions from Net Realized Gain | $ Return of Capital | ||||||||||||||||||||||
Multi-Style Equity Fund | ||||||||||||||||||||||||||||
December 31, 2010 | 11.77 | .11 | 1.81 | 1.92 | (.11 | ) | — | — | ||||||||||||||||||||
December 31, 2009 | 9.00 | .10 | 2.80 | 2.90 | (.13 | ) | — | — | ||||||||||||||||||||
December 31, 2008 | 15.65 | .19 | (6.52 | ) | (6.33 | ) | (.19 | ) | (.13 | ) | — | |||||||||||||||||
December 31, 2007 | 14.93 | .16 | 1.37 | 1.53 | (.16 | ) | (.65 | ) | — | |||||||||||||||||||
December 31, 2006 | 13.37 | .14 | 1.55 | 1.69 | (.13 | ) | — | — | ||||||||||||||||||||
Aggressive Equity Fund | ||||||||||||||||||||||||||||
December 31, 2010 | 9.59 | .04 | 2.34 | 2.38 | (.05 | ) | — | — | ||||||||||||||||||||
December 31, 2009 | 7.18 | .05 | 2.40 | 2.45 | (.04 | ) | — | — | ||||||||||||||||||||
December 31, 2008 | 12.99 | .09 | (5.81 | ) | (5.72 | ) | (.09 | ) | — | (c) | — | |||||||||||||||||
December 31, 2007 | 14.45 | .06 | .40 | .46 | (.05 | ) | (1.87 | ) | — | |||||||||||||||||||
December 31, 2006 | 14.40 | .03 | 2.10 | 2.13 | (.03 | ) | (2.05 | ) | — | |||||||||||||||||||
Non-U.S. Fund | ||||||||||||||||||||||||||||
December 31, 2010 | 9.25 | .12 | .92 | 1.04 | (.08 | ) | — | — | ||||||||||||||||||||
December 31, 2009 | 7.48 | .12 | 1.88 | 2.00 | (.23 | ) | — | — | ||||||||||||||||||||
December 31, 2008 | 13.20 | .21 | (5.83 | ) | (5.62 | ) | — | (.10 | ) | — | ||||||||||||||||||
December 31, 2007 | 15.01 | .25 | 1.14 | 1.39 | (.38 | ) | (2.82 | ) | — | |||||||||||||||||||
December 31, 2006 | 12.68 | .23 | 2.75 | 2.98 | (.35 | ) | (.30 | ) | — | |||||||||||||||||||
Core Bond Fund | ||||||||||||||||||||||||||||
December 31, 2010 | 10.20 | .37 | .63 | 1.00 | (.40 | ) | (.29 | ) | — | |||||||||||||||||||
December 31, 2009 | 9.33 | .44 | 1.02 | 1.46 | (.46 | ) | (.13 | ) | — | |||||||||||||||||||
December 31, 2008 | 10.32 | .47 | (.86 | ) | (.39 | ) | (.39 | ) | (.21 | ) | — | |||||||||||||||||
December 31, 2007 | 10.14 | .51 | .20 | .71 | (.53 | ) | — | — | ||||||||||||||||||||
December 31, 2006 | 10.23 | .45 | (.08 | ) | .37 | (.46 | ) | — | — | |||||||||||||||||||
Real Estate Securities Fund |
| |||||||||||||||||||||||||||
December 31, 2010 | 11.58 | .33 | 2.29 | 2.62 | (.28 | ) | — | — | ||||||||||||||||||||
December 31, 2009 | 9.30 | .30 | 2.41 | 2.71 | (.43 | ) | — | — | ||||||||||||||||||||
December 31, 2008 | 15.22 | .38 | (6.03 | ) | (5.65 | ) | (.27 | ) | — | — | ||||||||||||||||||
December 31, 2007 | 21.34 | .35 | (3.68 | ) | (3.33 | ) | (.47 | ) | (2.32 | ) | — | |||||||||||||||||
December 31, 2006 | 17.28 | .37 | 5.72 | 6.09 | (.39 | ) | (1.64 | ) | — | |||||||||||||||||||
See accompanying notes which are an integral part of the financial statements.
| 96 | Financial Highlights |
Table of Contents
| $ Total Distributions | $ Net Asset Value, End of Period | % Total Return | $ Net Assets, End of Period (000) | % Ratio of Expenses to Average Net Assets, Net(b) | % Ratio of Expenses to Average Net Assets, Gross | % Ratio of Net Investment Income to Average Net Assets | % Portfolio Turnover Rate | |||||||||||||||||||||||
| (.11 | ) | 13.58 | 16.46 | 400,471 | .89 | .89 | .93 | 105 | ||||||||||||||||||||||
| (.13 | ) | 11.77 | 32.72 | 376,751 | .85 | .86 | 1.06 | 136 | ||||||||||||||||||||||
| (.32 | ) | 9.00 | (41.15 | ) | 298,211 | .87 | .89 | 1.50 | 135 | |||||||||||||||||||||
| (.81 | ) | 15.65 | 10.36 | 479,922 | .87 | .87 | 1.04 | 136 | ||||||||||||||||||||||
| (.13 | ) | 14.93 | 12.75 | 417,507 | .87 | .87 | 1.03 | 128 | ||||||||||||||||||||||
| (.05 | ) | 11.92 | 24.88 | 191,763 | 1.05 | 1.11 | .44 | 107 | ||||||||||||||||||||||
| (.04 | ) | 9.59 | 34.32 | 158,671 | 1.02 | 1.13 | .65 | 161 | ||||||||||||||||||||||
| (.09 | ) | 7.18 | (44.16 | ) | 123,088 | 1.05 | 1.18 | .84 | 161 | |||||||||||||||||||||
| (1.92 | ) | 12.99 | 3.42 | 228,927 | 1.05 | 1.13 | .39 | 180 | ||||||||||||||||||||||
| (2.08 | ) | 14.45 | 14.79 | 223,646 | 1.05 | 1.12 | .16 | 184 | ||||||||||||||||||||||
| (.08 | ) | 10.21 | 11.42 | 366,870 | 1.06 | 1.12 | 1.30 | 49 | ||||||||||||||||||||||
| (.23 | ) | 9.25 | 27.33 | 322,145 | 1.04 | 1.12 | 1.56 | 133 | ||||||||||||||||||||||
| (.10 | ) | 7.48 | (42.79 | ) | 255,750 | 1.15 | 1.21 | 2.01 | 123 | |||||||||||||||||||||
| (3.20 | ) | 13.20 | 10.12 | 431,686 | 1.15 | 1.18 | 1.70 | 106 | ||||||||||||||||||||||
| (.65 | ) | 15.01 | 23.64 | 369,884 | 1.15 | 1.21 | 1.64 | 111 | ||||||||||||||||||||||
| (.69 | ) | 10.51 | 10.02 | 471,898 | .68 | .75 | 3.48 | 195 | ||||||||||||||||||||||
| (.59 | ) | 10.20 | 16.18 | 400,569 | .66 | .73 | 4.49 | 151 | ||||||||||||||||||||||
| (.60 | ) | 9.33 | (3.87 | ) | 319,109 | .70 | .77 | 4.70 | 164 | |||||||||||||||||||||
| (.53 | ) | 10.32 | 7.24 | 346,067 | .70 | .78 | 5.04 | 965 | ||||||||||||||||||||||
| (.46 | ) | 10.14 | 3.72 | 265,783 | .70 | .73 | 4.40 | 453 | ||||||||||||||||||||||
| (.28 | ) | 13.92 | 22.92 | 493,896 | .99 | .99 | 2.62 | 150 | ||||||||||||||||||||||
| (.43 | ) | 11.58 | 31.16 | 410,708 | .97 | .97 | 3.36 | 110 | ||||||||||||||||||||||
| (.27 | ) | 9.30 | (37.76 | ) | 303,416 | .96 | .96 | 2.72 | 71 | |||||||||||||||||||||
| (2.79 | ) | 15.22 | (15.86 | ) | 488,809 | .92 | .92 | 1.75 | 77 | |||||||||||||||||||||
| (2.03 | ) | 21.34 | 35.84 | 625,477 | .90 | .91 | 1.86 | 53 | ||||||||||||||||||||||
See accompanying notes which are an integral part of the financial statements.
| Financial Highlights | 97 |
Table of Contents
Russell Investment Funds
Notes to Financial Highlights — December 31, 2010
| (a) | Average daily shares outstanding were used for this calculation. |
| (b) | May reflect amounts waived and/or reimbursed by RIMCo, and for certain funds, custody credit arrangements. |
| (c) | Less than $.01 per share. |
See accompanying notes which are an integral part of the financial statements.
| 98 | Notes to Financial Highlights |
Table of Contents
Russell Investment Funds
Notes to Financial Statements — December 31, 2010
| 1. | Organization |
Russell Investment Funds (the “Investment Company” or “RIF”) is a series investment company with nine different investment portfolios referred to as Funds. These financial statements report on five of these Funds (each a “Fund” and collectively the “Funds”). The Investment Company provides the investment base for one or more variable insurance products issued by one or more insurance companies. These Funds are offered at NAV to qualified insurance company separate accounts offering variable insurance products. The Investment Company is registered under the Investment Company Act of 1940, as amended, as an open-end management investment company. It is organized and operated as a Massachusetts business trust under an Amended and Restated Master Trust Agreement dated October 1, 2008 (“Master Trust Agreement”). The Investment Company’s Master Trust Agreement permits the Board of Trustees (the “Board”) to issue an unlimited number of shares of beneficial interest.
| 2. | Significant Accounting Policies |
The Funds’ financial statements are prepared in accordance with accounting principles generally accepted in the United States of America (“U.S. GAAP”), which require the use of management estimates and assumptions at the date of the financial statements. Actual results could differ from those estimates. The following is a summary of the significant accounting policies consistently followed by each Fund in the preparation of its financial statements.
Security Valuation
The Funds value portfolio securities according to Board-approved securities valuation procedures which include market and fair value procedures. Debt obligation securities maturing within 60 days at the time of purchase are priced using the amortized cost method of valuation, unless the Board determines that amortized cost does not represent the market value of short-term debt obligations. The Board has delegated the responsibility for administration of the securities valuation procedures to Russell Fund Services Company (“RFSC”).
U.S. GAAP defines fair market value as the price that a Fund would receive to sell an asset or pay to transfer a liability in an orderly transaction between market participants at the measurement date. It establishes a fair value hierarchy that prioritizes inputs to valuation methods and requires a separate disclosure of the fair value hierarchy, for each major category of assets and liabilities that segregates fair value measurements into levels (Level 1, 2, and 3). The inputs or methodology used for valuing securities are not necessarily an indication of the risk associated with investing in those securities. Levels 1, 2 and 3 of the fair value hierarchy are defined as follows:
| • | Level 1 — Inputs using quoted prices in active markets or exchanges for identical assets and liabilities. |
| • | Level 2 — Significant other observable inputs, which may include, but are not limited to, quoted prices for similar assets or liabilities in markets that are active, quoted prices for identical or similar assets or liabilities in markets that are non-active, inputs other than quoted prices that are observable for the assets or liabilities (such as interest rates, yield curves, volatilities, prepayment speeds, loss severities, credit risks and default rates) or other market corroborated inputs. |
| • | Level 3 — Significant unobservable inputs based on the best information available in the circumstances, to the extent observable inputs are not available, which may include assumptions made by the Board of Trustees (the “Board”) or persons acting at their direction that are used in determining the fair market value of investments. |
The valuation techniques and significant inputs used in determining the fair market values of financial instruments classified as Level 1 and Level 2 of the fair value hierarchy are as follows:
Common stocks, exchange traded funds and derivatives that are traded on a national securities exchange are stated at the last reported sale or settlement price on the day of valuation. To the extent these securities are actively traded and valuation adjustments are not applied, they are categorized as Level 1 of the fair value hierarchy.
Fixed income securities including corporate, convertible and municipal bonds and notes, U.S. government agencies, U.S. Treasury obligations, sovereign issues, bank loans, bank notes and non-U.S. bonds are normally valued by pricing service providers that use broker-dealer quotations or valuation estimates from their internal pricing models. The service providers’ internal models use inputs that are observable, such as issuer details, interest rates, yield curves, prepayment speeds, credit risks/spreads and default rates. Securities that use similar valuation techniques and inputs as described above are categorized as Level 2 of the fair value hierarchy.
Fixed income securities purchased on a delayed-delivery basis are marked-to-market daily until settlement at the forward settlement date are categorized as Level 2 of the fair value hierarchy.
Mortgage and asset-backed securities are usually issued as separate tranches, or classes, of securities within each deal. These securities are also normally valued by pricing service providers that use broker-dealer quotations or valuation estimates from their internal pricing models. The pricing models for these securities usually consider tranche-level attributes, estimated cash flows of each tranche, market-based yield spreads for each tranche, current market data and incorporates deal collateral
| Notes to Financial Statements | 99 |
Table of Contents
Russell Investment Funds
Notes to Financial Statements, continued — December 31, 2010
performance, as available. Mortgage and asset-backed securities that use similar valuation techniques and inputs as described above are categorized as Level 2 of the fair value hierarchy.
Investments in privately held investment funds will be valued based upon the Net Asset Value (“NAV”) of such investments and are categorized as Level 2 of the fair value hierarchy.
Short-term investments having a maturity of 60 days or less are generally valued at amortized cost, which approximates fair market value. These investments are categorized as Level 2 of the fair value hierarchy. The Fund has adopted the authoritative guidance under U.S. GAAP for estimating the fair value of investments in funds that have calculated NAV per share in accordance with the specialized accounting guidance for investment companies. Accordingly, while NAV per share of an investment may not be determinative of fair value, as defined by U.S. GAAP, the Fund estimates the fair value of an investment in a fund using the NAV per share of the investment (or its equivalent) without further adjustment as a practical expedient, if the NAV per share of the investment is determined in accordance with the specialized accounting guidance for investment companies as of the reporting entity’s measurement date. The adoption of this guidance did not have a material effect on the financial statements.
Financial over-the-counter derivative instruments are instruments such as foreign currency contracts, futures contracts, options contracts, or swap agreements that derive their value from underlying asset prices, indices, reference rates, and other inputs or a combination of these factors. These contracts are normally valued on the basis of broker-dealer quotations or pricing service providers. Depending on the product and the terms of the transaction, the value of the derivative contracts can be estimated by a pricing service provider using a series of techniques, including simulation pricing models. The pricing models use inputs that are observed from actively quoted markets such as issuer details, indices, spreads, interest rates, curves, dividends and exchange rates. Derivatives that use similar valuation techniques and inputs as described above are categorized as Level 2 of the fair value hierarchy.
Events or circumstances affecting the values of Fund securities that occur between the closing of the principal markets on which they trade and the time the NAV of Fund shares is determined may be reflected in the calculation of NAVs for each applicable Fund when the Funds deem that the particular event or circumstance would materially affect such Fund’s NAV. Funds that invest primarily in frequently traded exchange-listed securities will use fair value pricing in limited circumstances since reliable market quotations will often be readily available. Funds that invest in foreign securities are likely to use fair value pricing more often since significant events may occur between the close of foreign markets and the time of pricing which would trigger fair value pricing of the foreign securities. Although there are observable inputs assigned on a security level, prices are derived from factors using proprietary models or matrix pricing. For this reason, significant events will cause movement between Levels 1 and 2. Funds that invest in low-rated debt securities are also likely to use fair value pricing more often since the markets in which such securities are traded are generally thinner, more limited and less active than those for higher rated securities. Examples of events that could trigger fair value pricing of one or more securities are: a material market movement of the U.S. securities market (defined in the fair value procedures as the movement by a single major U.S. index greater than a certain percentage) or other significant event; foreign market holidays if, on a daily basis, a Fund’s foreign exposure exceeds 20% in the aggregate (all closed markets combined); a company development; a natural disaster; or an armed conflict.
Preferred stock and other equities traded on inactive markets or valued by reference to similar instruments are also categorized as Level 2 of the fair value hierarchy.
The NAV of a Fund’s portfolio that includes foreign securities may change on days when shareholders will not be able to purchase or redeem fund shares, since foreign securities can trade on non-business days.
Level 3 Trading Assets and Trading Liabilities, at Fair Value
The valuation techniques and significant inputs used in determining the fair values of financial instruments classified as Level 3 of the fair value hierarchy are as follows:
Securities and other assets for which market quotes are not readily available are valued at fair value as determined in good faith by the Board and are categorized as Level 3 of the fair value hierarchy. Market quotes are considered not readily available in circumstances where there is an absence of current or reliable market-based data (e.g., trade information or broker quotes).
When RFSC applies fair valuation methods that use significant unobservable inputs to determine a Fund’s NAV, securities will not be priced on the basis of quotes from the primary market in which they are traded, but instead may be priced by another method that the Board or persons acting at their direction believe accurately reflects fair value and are categorized as Level 3 of the fair value hierarchy. Fair value pricing may require subjective determinations about the value of a security. While the securities valuation procedures are intended to result in a calculation of a Fund’s NAV that fairly reflects security values as of the time of pricing, the process cannot guarantee that fair values determined by the Board or persons acting at their direction would accurately reflect the price that a Fund could obtain for a security if it were to dispose of that security as of the time of pricing (for instance, in a forced or distressed sale). The prices used by a Fund may differ from the value that would be realized if the securities were sold.
| 100 | Notes to Financial Statements |
Table of Contents
Russell Investment Funds
Notes to Financial Statements, continued — December 31, 2010
For fair valuations using significant unobservable inputs, U.S. GAAP requires a reconciliation of the beginning to ending balances for reported market values that presents changes attributable to total realized and unrealized gains or losses, purchases and sales, and transfers in/out of the Level 3 category during the period. In accordance with the requirements of U.S. GAAP, a fair value hierarchy and Level 3 reconciliation, if any, have been included in the Notes to the Schedule of Investments for each respective Fund.
New Accounting Pronouncements: In January 2010, the Financial Accounting Standards Board (“FASB”) issued an Accounting Standards Update (“ASU”) clarifying existing disclosure and requiring additional disclosure related to fair value measurements and disclosures. Effective for interim and annual reporting periods beginning after December 15, 2009, a reporting entity should disclose separately the amounts of significant transfers in and out of Levels 1, 2 and 3 fair value measurements and describe the reasons for the transfers, provide fair value measurement disclosures for each class of assets and liabilities and provide disclosures about the valuation techniques and inputs used to measure fair value for both recurring and non recurring fair value measurements that fall in either Level 2 or Level 3. The Funds will recognize significant transfers between levels as of the end of the reporting period. There were no significant transfers between the Levels as of December 31, 2010.
Effective for interim and reporting periods beginning after December 15, 2010, this ASU requires a reporting entity to present separately information about purchases, sales, issuances and settlements on a gross basis, rather than as one net number for Level 3 securities. Russell Investment Management Company (“RIMCo”) is currently evaluating the impact the adoption of this ASU will have on the Funds’ financial statement disclosures.
Investment Transactions
Investment transactions are reflected as of trade date for financial reporting purposes. This may cause the NAV stated in the financial statements to be different from the NAV shareholders transact at. Realized gains and losses from securities transactions, if any, are recorded on the basis of specific identified cost incurred by each money manager within a particular Fund.
Investment Income
Dividend income is recorded net of applicable withholding taxes on the ex-dividend date, except that certain dividends from foreign securities are recorded as soon thereafter as the Funds are informed of the ex-dividend date. Interest income is recorded daily on the accrual basis. The Core Bond Fund classifies gains and losses realized on prepayments received on mortgage-backed securities as an adjustment to interest income. All premiums and discounts, including original issue discounts, are amortized/ accreted using the effective interest method.
Federal Income Taxes
Since the Investment Company is a Massachusetts business trust, each Fund is a separate corporate taxpayer and determines its net investment income and capital gains (or losses) and the amounts to be distributed to each Fund’s shareholders without regard to the income and capital gains (or losses) of the other Funds.
Each Fund qualifies as a regulated investment company under sub-chapter M of the Internal Revenue Code and intends to distribute all of its taxable income and capital gains. Therefore, no federal income tax provision is required for the Funds.
Each Fund files a U.S. tax return. At December 31, 2010, the Funds have recorded no liabilities for net unrecognized tax benefits relating to uncertain income tax positions they have taken or expect to take in future tax returns. While the statute of limitations remains open to examine the Funds’ U.S. tax returns filed for the fiscal years ending December 31, 2007 through December 31, 2009, no examinations are in progress or anticipated at this time. The Funds are not aware of any tax positions for which it is reasonably possible that the total amounts of unrecognized tax benefits will significantly change in the next twelve months.
Dividends and Distributions to Shareholders
For all Funds, income and capital gain distributions, if any, are recorded on the ex-dividend date. Income distributions are generally declared and paid quarterly, except for the Non-U.S. Fund, which generally declares and pays income distributions annually. Capital gain distributions are generally declared and paid annually. An additional distribution may be paid by the Funds to avoid imposition of federal income and excise tax on any remaining undistributed capital gains and net investment income.
The timing and characterization of certain income and capital gain distributions are determined in accordance with federal tax regulations, which may differ from U.S. GAAP. As a result, net investment income and net realized gain (or loss) from investment and foreign currency-related transactions for a reporting period may differ significantly from distributions during such period. The differences between tax regulations and U.S. GAAP primarily relate to investments in options, futures, forward contracts, swap
| Notes to Financial Statements | 101 |
Table of Contents
Russell Investment Funds
Notes to Financial Statements, continued — December 31, 2010
contracts, passive foreign investment companies, foreign-denominated investments, mortgage-backed securities, certain securities sold at a loss and capital loss carryforwards.
Expenses
The Funds will pay their own expenses other than those expressly assumed by RIMCo or RFSC. Most expenses can be directly attributed to the individual Funds. Expenses which cannot be directly attributed to a specific Fund are allocated among all Funds principally based on their relative net assets.
Foreign Currency Translations
The books and records of the Funds are maintained in U.S. dollars. Foreign currency amounts and transactions of the Funds are translated into U.S. dollars on the following basis:
| (a) | Market value of investment securities, other assets and liabilities at the closing rate of exchange on the valuation date. |
| (b) | Purchases and sales of investment securities and income at the closing rate of exchange prevailing on the respective trade dates of such transactions. |
Net realized gains or losses from foreign currency-related transactions arise from: sales and maturities of short-term securities; sales of foreign currencies; currency gains or losses realized between the trade and settlement dates on securities transactions; the difference between the amounts of dividends, interest, and foreign withholding taxes recorded on the Non-U.S. Fund’s books and the U.S. dollar equivalent of the amounts actually received or paid. Net unrealized gains or losses from foreign currency-related transactions arise from changes in the value of assets and liabilities, other than investments in securities, as a result of changes in the exchange rates.
The Funds do not isolate that portion of the results of operations of the Funds that arises as a result of changes in exchange rates from that portion that arises from changes in market prices of investments during the year. Such fluctuations are included within the net realized and unrealized gain or loss from investments. However, for federal income tax purposes the Funds do isolate the effects of changes in foreign exchange rates from the fluctuations arising from changes in market prices for realized gain (or loss) on debt obligations.
Capital Gains Taxes
The Non-U.S. Fund may be subject to capital gains taxes and repatriation taxes imposed by certain countries in which it invests. The Non-U.S. Fund may record a deferred tax liability with respect to the unrealized appreciation on foreign securities for potential capital gains and repatriation taxes at December 31, 2010. The accrual for capital gains and repatriation taxes is included in net unrealized appreciation (depreciation) on investments in the Statements of Assets and Liabilities for the Fund. The amounts related to capital gains and repatriation taxes are included in net realized gain (loss) on investments in the Statements of Operations for the Fund. The Non-U.S. Fund had $20,765 in deferred tax liability but no capital gains taxes for the period ended December 31, 2010.
Derivatives
To the extent permitted by the investment objectives, restrictions and policies set forth in the Funds’ Prospectus and Statement of Additional Information, the Funds may participate in various derivative-based transactions. Derivative securities are instruments or agreements whose value is derived from an underlying security or index. They include options, futures, swaps and forwards. These instruments offer unique characteristics and risks that facilitate the Funds’ investment strategies.
The Funds typically use derivatives in three ways: exposing cash reserves to markets, hedging and return enhancement. In addition, the Non-U.S. and Real Estate Securities Funds may enter into foreign exchange contracts for trade settlement purposes. The Funds, other than the Real Estate Securities Fund, may pursue their strategy to be fully invested by exposing cash reserves to the performance of appropriate markets by purchasing securities and/or derivatives. This is intended to cause the Funds to perform as though cash reserves were actually invested in those markets. Hedging may also be used by certain Funds to limit or control risks, such as adverse movements in exchange rates and interest rates. Return enhancement can be accomplished through the use of derivatives in a Fund including using derivatives as a substitute for holding physical bonds, and using them to express various macro views (e.g., interest rate movements, currency movements, and macro credit strategies). By purchasing certain instruments, Funds may more effectively achieve the desired portfolio characteristics that assist them in meeting their investment objectives. Depending on how the derivatives are structured and utilized, the risks associated with them may vary widely. These risks include, but are not limited to, market risk, liquidity risk, counterparty risk, basis risk, reinvestment risk, political risk, prepayment risk, extension risk and credit risk.
The Funds’ period end Futures, Interest Rate Swap and Credit Default Swap Contracts, as presented in the tables following the Schedule of Investments, generally are indicative of the volume of their derivative activity during the period ended December 31, 2010.
| 102 | Notes to Financial Statements |
Table of Contents
Russell Investment Funds
Notes to Financial Statements, continued — December 31, 2010
For the period ended December 31, 2010, the Funds’ quarterly holdings of Options Written Contracts were as follows:
| Quarter Ended | Number of Options Written Contracts Outstanding | |||||||
March 31, 2010 | 218 | |||||||
June 30, 2010 | 192 | |||||||
September 30, 2010 | 100 | |||||||
December 31, 2010 | 125 | |||||||
For further information, please refer to the detailed Options disclosure within this Note.
For the period ended December 31, 2010, the Funds’ quarterly holdings of Foreign Currency Exchange Contracts were as follows:
| Quarter Ended | Amount Sold | Amount Bought | ||||||
March 31, 2010 | 891,931,678 | 2,054,557,911 | ||||||
June 30, 2010 | 10,621,800,174 | 1,762,989,352 | ||||||
September 30, 2010 | 10,281,641,850 | 16,522,751,742 | ||||||
December 31, 2010 | 5,553,055,452 | 10,836,721,368 | ||||||
For further information, please refer to the detailed Foreign Currency Exchange Contracts disclosure within this Note.
The effect of derivative instruments, categorized by risk exposure, on the Statements of Assets and Liabilities and the Statements of Operations, for the period ended December 31, 2010 are disclosed in the Fair Value of Derivative Instruments presentation following each Fund’s Schedule of Investments.
Foreign Currency Exchange Contracts
In connection with investment transactions consistent with the Funds’ investment objective and strategies, certain Funds may enter into foreign currency exchange spot contracts and forward foreign currency exchange contracts (“FX contracts”). From time to time the Funds may enter into FX contracts to hedge certain foreign currency-denominated assets. FX contracts are recorded at market value. Certain risks may arise upon entering into these FX contracts from the potential inability of counterparties to meet the terms of their FX contracts and are generally limited to the amount of unrealized gain on the FX contracts, if any, that are disclosed in the Statements of Assets and Liabilities. Realized gains or losses arising from such transactions are included in net realized gain (or loss) from foreign currency-related transactions.
For the period ended December 31, 2010, the following Funds entered into foreign currency exchange contracts primarily for the strategies listed below:
| Funds | Strategies | |
Non-U.S. Fund | Exposing cash reserves to markets and Trade Settlement | |
Core Bond Fund | Return Enhancement and Hedging | |
Real Estate Securities Fund | Trade Settlement |
Options
The Funds may purchase and sell (write) call and put options on securities and securities indices, provided such options are traded on a national securities exchange or in an over-the-counter market. The Funds may also purchase and sell call and put options on foreign currencies. The domestic equity Funds may utilize options to expose cash reserves to markets.
When a Fund writes a covered call or a put option, an amount equal to the premium received by the Fund is included in the Fund’s Statement of Assets and Liabilities as an asset and as an equivalent liability. The amount of the liability is subsequently marked-to-market to reflect the current market value of the option written. The Fund receives a premium on the sale of a call option but gives up the opportunity to profit from any increase in stock value above the exercise price of the option, and when the Fund writes a put option it is exposed to a decline in the price of the underlying security.
Whether an option which the Fund has written expires on its stipulated expiration date or the Fund enters into a closing purchase transaction, the Fund realizes a gain (or loss, if the cost of a closing purchase transaction exceeds the premium received when the option was sold) without regard to any unrealized gain or loss on the underlying security, and the liability related to such option is extinguished. If a call option which the Fund has written is exercised, the Fund realizes a capital gain or loss from the sale of the underlying security, and the proceeds from such sale are increased by the premium originally received. When a put option which a Fund has written is exercised, the amount of the premium originally received will reduce the cost of the security which a Fund purchases upon exercise of the option. Realized gains (losses) on purchased options are included in net realized gain (loss) from investments on the Statements of Operations.
| Notes to Financial Statements | 103 |
Table of Contents
Russell Investment Funds
Notes to Financial Statements, continued — December 31, 2010
The Funds’ use of written options involves, to varying degrees, elements of market risk in excess of the amount recognized in the Statements of Assets and Liabilities. The face or contract amounts of these instruments reflect the extent of the Funds’ exposure to market risk. The risks may be caused by an imperfect correlation between movements in the price of the instrument and the price of the underlying securities and interest rates.
A Fund may enter into a swaption (swap option). In a swaption, the buyer gains the right but not the obligation to enter into a specified swap agreement with the issuer on a specified future date. The writer of the contract receives the premium and bears the risk of unfavorable changes in the preset rate on the underlying interest rate swap. Unrealized gains/losses on swaptions are reflected in investment assets and investment liabilities in the Fund’s Statement of Assets and Liabilities.
For the period ended December 31, 2010, the Core Bond Fund purchased/sold options primarily for return enhancement and hedging.
Futures Contracts
The Funds may invest in futures contracts (i.e., interest rate, foreign currency and index futures contracts) to a limited extent. The face or contract amounts of these instruments reflect the extent of the Funds’ exposure to off balance-sheet risk. The primary risks associated with the use of futures contracts are an imperfect correlation between the change in market value of the securities held by the Fund and the prices of futures contracts and the possibility of an illiquid market. Upon entering into a futures contract, the Funds are required to deposit with a broker an amount, termed the initial margin, which typically represents 5% of the purchase price indicated in the futures contract. Payments to and from the broker, known as variation margin, are typically required to be made on a daily basis as the price of the futures contract fluctuates. Changes in initial settlement value are accounted for as unrealized appreciation (depreciation) until the contracts are terminated, at which time realized gains and losses are recognized.
For the period ended December 31, 2010, the following funds entered into future contracts primarily for the strategies listed below:
| Funds | Strategies | |
Multi Style Equity Fund | Exposing cash reserves to markets | |
Aggressive Equity Fund | Exposing cash reserves to markets | |
Non-U.S. Fund | Exposing cash reserves to markets | |
Core Bond Fund | Return Enhancement, Hedging and Exposing cash reserves to markets |
As of December 31, 2010, the Funds had cash collateral balances in connection with futures contracts purchased (sold) as follows:
| Cash Collateral for Futures | Due to Broker | |||||||
Multi-Style Equity Fund | $ | 1,950,000 | $ | — | ||||
Aggressive Equity Fund | 700,000 | — | ||||||
Non-U.S. Fund | 2,000,000 | — | ||||||
Core Bond Fund | 37,000 | — | ||||||
Swap Agreements
The Funds may enter into swap agreements, on either an asset-based or liability-based basis, depending on whether they are hedging their assets or their liabilities, and will usually enter into swaps on a net basis, i.e., the two payment streams are netted out, with the Funds receiving or paying, as the case may be, only the net amount of the two payments. When a Fund engages in a swap, it exchanges its obligations to pay or rights to receive payments for the obligations or rights to receive payments of another party (i.e., an exchange of floating rate payments for fixed rate payments).
Certain Funds may enter into several different types of agreements including interest rate, credit default and currency swaps. The Funds may enter into index swap agreements to expose cash reserves to markets or to effect investment transactions consistent with those Funds’ investment objectives and strategies. Interest rate swaps are a counterparty agreement, can be customized to meet each party’s needs, and involve the exchange of a fixed payment per period for a payment that is not fixed. Currency swaps are an agreement where two parties exchange specified amounts of different currencies followed by each paying the other a series of interest payments based on the principal cash flow. At maturity the principal amounts are returned. Credit default swaps are a counterparty agreement which allows the transfer of third party credit risk (the possibility that an issuer will default on their obligation by failing to pay principal or interest in a timely manner) from one party to another. The lender faces the credit risk from a third party and the counterparty in the swap agrees to insure this risk in exchange for regular periodic payments.
The Funds expect to enter into these transactions primarily to preserve a return or spread on a particular investment or portion of their portfolios, to protect against any increase in the price of securities they anticipate purchasing at a later date or for return enhancement. The net amount of the excess, if any, of the Funds’ obligations over their entitlements with respect to each swap
| 104 | Notes to Financial Statements |
Table of Contents
Russell Investment Funds
Notes to Financial Statements, continued — December 31, 2010
will be accrued on a daily basis and an amount of cash or liquid high-grade debt securities having an aggregate NAV at least equal to the accrued excess will be segregated. To the extent that the Funds enter into swaps on other than a net basis, the amount earmarked on the Funds’ records will be the full amount of the Funds’ obligations, if any, with respect to such interest rate swaps, accrued on a daily basis. If there is a default by the other party to such a transaction, the Funds will have contractual remedies pursuant to the agreement related to the transaction.
A Fund may not receive the expected amount under a swap agreement if the other party to the agreement defaults or becomes bankrupt. The market for swap agreements is largely unregulated. The Funds may enter into swap agreements with counterparties that meet RIMCo’s credit quality limitations. The Funds will not enter into any swap unless the counterparty has a minimum senior unsecured credit rating or long-term counterparty credit rating, including reassignments, of A- or better as defined by Standard & Poor’s or an equivalent rating from any nationally recognized statistical rating organization (using highest or split ratings) at the time of entering into such transaction.
Swap agreements generally are entered into by “eligible contract participants” and in compliance with certain other criteria necessary to render them excluded from regulation under the Commodity Exchange Act (“CEA”) and, therefore not subject to regulation as futures or commodity option transactions under the CEA.
As of December 31, 2010, the Core Bond Fund had cash collateral balances in connection with swaps contracts purchased (sold) as follows:
| Cash Collateral for Swaps | Due to Broker | |||||||
Core Bond Fund | $ | 565,071 | $ | 4,680,120 | ||||
Credit Default Swaps
The Core Bond Fund may enter into credit default swaps. A credit default swap can refer to corporate issues, asset-backed securities or an index of assets, each known as the reference entity or underlying asset. The fund may act as either the buyer or the seller of a credit default swap involving one party making a stream of payments to another party in exchange for the right to receive a specified return in the event of a default or other credit event. Depending upon the terms of the contract, the credit default swap may be closed via physical settlement. However, due to the possible or potential instability in the market, there is a risk that the fund may be unable to deliver the underlying debt security to the other party to the agreement. Additionally, the fund may not receive the expected amount under the swap agreement if the other party to the agreement defaults or becomes bankrupt. In an unhedged credit default swap, the fund enters into a credit default swap without owning the underlying asset or debt issued by the reference entity. Credit default swaps allow the fund to acquire or reduce credit exposure to a particular issuer, asset or basket of assets.
As the seller in a credit default swap, the fund would be required to pay the par or other agreed-upon value (or otherwise perform according to the swap contract) of a reference debt obligation to the counterparty in the event of a default (or other specified credit event); the counterparty would be required to surrender the reference debt obligation. In return, the fund would receive from the counterparty a periodic stream of payments over the term of the contract provided that no credit event has occurred. If no credit event occurs, the fund would keep the stream of payments and would have no payment obligations. As a seller of protection, the fund would effectively add leverage to its portfolio because, in addition to its total net assets, that fund would be subject to investment exposure on the notional amount of the swap.
The fund may also purchase protection via credit default swap contracts in order to offset the risk of default of debt securities held in its portfolio, in which case the Fund would function as the counterparty referenced in the preceding paragraph.
If a credit event occurs on a corporate issue and cash settlement is not elected, a variety of other deliverable obligations may be delivered in lieu of the specific referenced obligation. The ability to deliver other obligations may result in a cheapest-to-deliver option (the buyer of protection’s right to choose the deliverable obligation with the lowest value following a credit event). The fund may use credit default swaps on corporate issues to provide a measure of protection against defaults of the issuers (i.e., to reduce risk where the fund owns or has exposure to the referenced obligation) or to take an active long or short position with respect to the likelihood (as measured by the credit default swap’s spread) of a particular issuer’s default.
Unlike credit default swaps on corporate issues, deliverable obligations for credit default swaps on asset-backed securities in most instances are limited to the specific referenced obligation as performance for asset-backed securities can vary across deals. Prepayments, principal paydowns, and other write-down or loss events on the underlying mortgage loans will reduce the outstanding principal balance of the referenced obligation. These reductions may be temporary or permanent as defined under the terms of the swap agreement and the notional amount for the swap agreement generally will be adjusted by corresponding amounts. The fund may use credit default swaps on asset-backed securities to provide a measure of protection against defaults (or other defined credit events) of the referenced obligation or to take an active long or short position with respect to the likelihood of a particular referenced obligation’s default (or other defined credit events).
| Notes to Financial Statements | 105 |
Table of Contents
Russell Investment Funds
Notes to Financial Statements, continued — December 31, 2010
Credit default swap agreements on credit indices involve one party making a stream of payments to another party in exchange for the right to receive a specified return in the event of a write down, principal shortfall, interest shortfall or default of all or part of the referenced entities comprising the credit index. A credit index is of a basket of credit instruments or exposures designed to be representative of some part of the credit market as a whole. These indices are made up of reference credits that are judged by a poll of dealers to be the most liquid entities in the credit default swap market based on the sector of the index. Components of the indices may include, but are not limited to, investment grade securities, high yield securities, asset backed securities, emerging markets, and/or various credit ratings within each sector. Credit indices are traded using credit default swaps with standardized terms including a fixed spread and standard maturity dates. An index credit default swap references all the names in the index, and if there is a default, the credit event is settled based on that name’s weight in the index. The composition of the indices changes periodically, usually every six months, and for most indices, each name has an equal weight in the index. Traders may use credit default swaps on indices to speculate on changes in credit quality.
Implied credit spreads, represented in absolute terms, utilized in determining the market value of credit default swap agreements on corporate issues as of period end are disclosed in the Schedule of Investments and generally serve as an indicator of the current status of the payment/performance risk and represent the likelihood or risk of default (or other defined credit event) for the credit derivative. The implied credit spread of a particular referenced entity reflects the cost of entering into a credit default swap and may include upfront payments required to be made to enter into the agreement. For credit default swap agreements on asset-backed securities and credit indices, the quoted market prices and resulting values serve as the indicator of the current status of the payment/performance risk. Wider credit spreads and increasing market values, in absolute terms when compared to the notional amount of the swap, generally represent a deterioration of the referenced entity’s credit soundness and a greater likelihood or risk of default or other credit event occurring as defined under the terms of the agreement. The maximum potential amount of future payments (undiscounted) that the fund as a seller of protection could be required to make under a credit default swap agreement would be an amount equal to the notional amount of the agreement. Notional amounts of all credit default swap agreements outstanding as of December 31, 2010 for which the Fund is the seller of protection are disclosed in the Schedules of Investments. These potential amounts would be partially offset by any recovery values of the respective referenced obligations, upfront payments received upon entering into the agreement, or net amounts received from the settlement of buy protection credit default swap agreements entered into by the fund for the same referenced entity or entities.
Credit default swaps could result in losses if the fund does not correctly evaluate the creditworthiness of the company or companies on which the credit default swap is based. Credit default swap agreements may involve greater risks than if the fund had invested in the reference obligation directly since, in addition to risks relating to the reference obligation, credit default swaps are subject to illiquidity and counterparty risk. The fund will generally incur a greater degree of risk when it sells a credit default swap than when its purchases a credit default swap. As a buyer of credit default swap, the fund may lose its investment and recover nothing should a credit event fail to occur and the swap is held to its termination date. As seller of a credit default swap, if a credit event were to occur, the value of any deliverable obligation received by the fund, coupled with the upfront or periodic payments previously received, may be less than what it pays to the buyer, resulting in a loss of value to the fund.
If the creditworthiness of the fund’s swap counterparty declines, the risk that the counterparty may not perform could increase, potentially resulting in a loss to the fund. To limit the counterparty risk involved in swap agreements, the fund will only enter into swap agreements with counterparties that meet certain standards of creditworthiness. Although there can be no assurance that the fund will be able to do so, the fund may be able to reduce or eliminate its exposure under a swap agreement either by assignment or other disposition, or by entering into an offsetting swap agreement with the same party or another creditworthy party. The fund may have limited ability to eliminate its exposure under a credit default swap if the credit of the reference entity or underlying asset has declined.
For the period ended December 31, 2010, the Core Bond Fund entered into credit default swaps primarily for return enhancement and hedging.
Interest Rate Swaps
The use of interest rate swaps is a highly specialized activity which involves investment techniques and risks different from those associated with ordinary portfolio securities transactions. If a money manager using this technique is incorrect in its forecast of market values, interest rates and other applicable factors, the investment performance of a Fund would diminish compared to what it would have been if this investment technique were not used.
Interest rate swaps do not involve the delivery of securities or other underlying assets or principal. Accordingly, the risk of loss with respect to interest rate swaps is limited to the net amount of interest payments that the Funds are contractually obligated to make. If the other party to an interest rate swap defaults, the Funds’ risk of loss consists of the net amount of interest payments that the Funds are contractually entitled to receive. Since interest rate swaps are individually negotiated, the Funds expect to achieve an acceptable degree of correlation between their rights to receive interest on their portfolio securities and their rights and obligations to receive and pay interest pursuant to interest rate swaps.
| 106 | Notes to Financial Statements |
Table of Contents
Russell Investment Funds
Notes to Financial Statements, continued — December 31, 2010
For the period ended December 31, 2010, the Core Bond Fund entered into interest rate swaps primarily for return enhancement and hedging.
Index Swaps
Certain Funds may enter into index swap agreements to expose cash reserves to markets or to effect investment transactions consistent with these Funds’ investment objectives and strategies. Swap agreements are two party contracts entered into primarily by institutional investors for periods ranging from a few weeks to more than one year. In a standard swap transaction, the two parties agree to exchange the returns (or differentials in rates of return) earned or realized on particular investments or instruments. The returns to be exchanged between the parties are calculated with respect to a “notional amount” (i.e. a specified dollar amount that is hypothetically invested in a “basket” of securities representing a particular index).
For the period ended December 31, 2010, the Core Bond Fund did not enter into index swaps.
ISDA Master Agreements
The Funds are parties to International Swaps and Derivatives Association, Inc. Master Agreements (“ISDA Master Agreements”) with counterparties that govern transactions in over-the-counter derivative and foreign exchange contracts entered into by the Funds and those counterparties. The ISDA Master Agreements contain provisions for general obligations, representations, agreements, collateral and events of default or termination. Events of termination include conditions that may entitle counterparties to elect to terminate early and cause settlement of all outstanding transactions under the applicable ISDA Master Agreement. Any election to early terminate could be material to the financial statements.
Loan Agreements
The Core Bond Fund may invest in direct debt instruments which are interests in amounts owed by corporate, governmental, or other borrowers to lenders or lending syndicates. The fund’s investments in loans may be in the form of participations in loans or assignments of all or a portion of loans from third parties. A loan is often administered by a bank or other financial institution (the “agent”) that acts as agent for all holders. The agent administers the terms of the loan, as specified in the loan agreement. When investing in a loan participation, the fund has the right to receive payments of principal, interest and any fees to which it is entitled only from the agent selling the loan agreement and only upon receipt by the agent of payments from the borrower. The fund generally has no right to enforce compliance with the terms of the loan agreement with the borrower. As a result, the fund may be subject to the credit risk of both the borrower and the agent that is selling the loan agreement. When a fund purchases assignments from agents it acquires direct rights against the borrower on the loan. At December 31, 2010, the Core Bond Fund had no unfunded loan commitments.
Investments in Emerging Markets
Investing in emerging markets may involve special risks and considerations not typically associated with investing in the United States’ markets. These risks include revaluation of currencies, high rates of inflation, repatriation, restrictions on income and capital, and future adverse political and economic developments. Moreover, securities issued in these markets may be less liquid, subject to government ownership controls, delayed settlements, and their prices may be more volatile than those of comparable securities in the United States.
Repurchase Agreements
The Core Bond Fund may enter into repurchase agreements. A repurchase agreement is an agreement under which the fund acquires a fixed income security from a commercial bank, broker or dealer and simultaneously agrees to resell such security to the seller at an agreed upon price and date (normally within a few days or weeks). The resale price reflects an agreed upon interest rate effective for the period the security is held by the fund and is unrelated to the interest rate on the security. The securities acquired by the fund constitute collateral for the repurchase obligation. In these transactions, the securities acquired by the fund (including accrued interest earned thereon) must have a total value in excess of the value of the repurchase agreement and must be held by the custodian bank until repurchased. In addition, RIMCo will monitor the fund’s repurchase agreement transactions generally and will evaluate the credit worthiness of any bank, broker or dealer party to a repurchase agreement with the fund. The fund will not invest more than 15% of its net assets (taken at current market value) in repurchase agreements maturing in more than seven days.
Mortgage-Related and Other Asset-Backed Securities
The Core Bond Fund may invest in mortgage or other asset-backed securities (“ABS”). These securities may include mortgage instruments issued by U.S. government agencies (“agency mortgages”) or those issued by private entities (“non-agency mortgages”). Specific types of instruments may include mortgage pass-through securities, collateralized mortgage obligations
| Notes to Financial Statements | 107 |
Table of Contents
Russell Investment Funds
Notes to Financial Statements, continued — December 31, 2010
(“CMOs”), commercial mortgage-backed securities, mortgage dollar rolls, CMO residuals, stripped mortgage-backed securities and other securities that directly or indirectly represent a participation in, or are secured by a payable from, mortgage loans on real property. The value of a fund’s mortgage-backed securities (“MBS”) may be affected by, among other things, changes or perceived changes in interest rates, factors concerning the interests in and structure of the issuer or the originator of the mortgage, or the quality of the underlying assets. The quality and value of the underlying assets may decline, or default This has become an increasing risk for collateral related to non-agency mortgages (e.g., sub-prime, Alternative A - paper (“Alt - A loans”) and non-conforming mortgage loans, especially in a declining residential real estate market. In addition, regulatory or tax changes may adversely affect the mortgage securities markets as a whole.
MBS often have stated maturities of up to thirty years when they are issued, depending upon the length of the mortgages underlying the securities. In practice however, unscheduled or early payments of principal and interest on the underlying mortgages may make the securities’ effective maturity shorter than this, and the prevailing interest rates may be higher or lower than the current yield of a fund’s portfolio at the time the fund receives the payments for reinvestment.
Rising or high interest rates may result in slower than expected principal payments which may tend to extend the duration of MBS, making them more volatile and more sensitive to changes in interest rates. This is known as extension risk.
MBS may have less potential for capital appreciation than comparable fixed income securities due to the likelihood of increased prepayments of mortgages resulting from foreclosures or declining interest rates. These foreclosed or refinanced mortgages are paid off at face value (par) or less, causing a loss, particularly for any investor who may have purchased the security at a premium or a price above par. In such an environment, this risk limits the potential price appreciation of these securities.
Through its investments in MBS, including those that are issued by private issuers, the fund has exposure to agency mortgages, private non-agency mortgages (including those secured by subprime and Alt-A loans) and non-conforming loans as well as to the mortgage and credit markets generally. Private issuers include commercial banks, savings associations, mortgage companies, investment banking firms, finance companies and special purpose finance entities (called special purpose vehicles or “SPVs’’) and other entities that acquire and package mortgage loans for resale as MBS. These privately issued non-agency MBS may offer higher yields than those issued by government agencies, but also may be subject to greater price changes than governmental issues. Subprime loans refer to loans made to borrowers with weakened credit histories or with a lower capacity to make timely payments on their loans. Alt-A loans refers to loans extended to borrowers who have incomplete documentation of income, assets, or other variables that are important to the credit underwriting processes. Non-conforming mortgages are loans that do not meet the standards that allow purchase by government-sponsored enterprises. MBS with exposure to subprime loans, Alt-A loans or non-conforming loans have had in many cases higher default rates than those loans that meet government underwriting requirements. The risk of non-payment is greater for MBS that are backed by mortgage pools that contain subprime, Alt-A and non-conforming loans, but a level of risk exists for all loans.
Unlike MBS issued or guaranteed by the U.S. government or a government-sponsored entity (e.g., Fannie Mae (the Federal National Mortgage Association) and Freddie Mac (the Federal Home Loan Mortgage Corporation)), MBS issued by private issuers do not have a government or government-sponsored entity guarantee, but may have credit enhancements provided by external entities such as banks or financial institutions or achieved through the structuring of the transaction itself. Examples of such credit support arising out of the structure of the transaction include the issue of senior and subordinated securities (e.g., the issuance of securities by an SPV in multiple classes or “tranches,” with one or more classes being senior to other subordinated classes as to the payment of principal and interest, with the result that defaults on the underlying mortgage loans are borne first by the holders of the subordinated class); creation of “reserve funds” (in which case cash or investments, sometimes funded from a portion of the payments on the underlying mortgage loans, are held in reserve against future losses); and “overcollateralization” (in which case the scheduled payments on, or the principal amount of, the underlying mortgage loans exceeds that required to make payment on the securities and pay any servicing or other fees). However, there can be no guarantee that credit enhancements, if any, will be sufficient to prevent losses in the event of defaults on the underlying mortgages loans. In addition, MBS that are issued by private issuers are not subject to the underwriting requirements for the underlying mortgage that are applicable to those MBS that have a government or government-sponsored entity guarantee. As a result, the mortgage loans underlying private MBS may, and frequently do, have less favorable collateral, credit risk or other underwriting characteristics than government or government-sponsored MBS and have wider variances in a number of terms including interest rate, term, size, purpose and borrower characteristics. Privately issued pools more frequently include second mortgages, high loan-to-value mortgages and manufactured housing loans. The coupon rates and maturities of the underlying mortgage loans in a private-label MBS pool may vary to a greater extent than those included in a government guaranteed pool, and the pool may include subprime mortgage loans.
Privately issued MBS are not traded on an exchange and there may be a limited market for the securities, especially when there is a perceived weakness in the mortgage and real estate market sectors. Without an active trading market, MBS held in a fund’s portfolio may be particularly difficult to value because of the complexities involved in assessing the value of the underlying mortgage loans.
| 108 | Notes to Financial Statements |
Table of Contents
Russell Investment Funds
Notes to Financial Statements, continued — December 31, 2010
ABS may include MBS, loans, receivables or other assets. The value of the fund’s ABS may be affected by, among other things, actual or perceived changes in interest rates, factors concerning the interests in and structure of the issuer or the originator of the receivables, the market’s assessment of the quality of underlying assets or actual or perceived changes in the credit worthiness of the individual borrowers, the originator, the servicing agent or the financial institution providing the credit support.
Payment of principal and interest may be largely dependent upon the cash flows generated by the assets backing the securities. Rising or high interest rates tend to extend the duration of ABS, making them more volatile and more sensitive to changes in interest rates. The underlying assets are sometimes subject to prepayments which can shorten the security’s weighted average life and may lower its return. Defaults on loans underlying ABS have become an increasing risk for ABS that are secured by home-equity loans related to sub-prime, Alt-A or non-conforming mortgage loans, especially in a declining residential real estate market.
ABS (other than MBS) present certain risks that are not presented by MBS. Primarily, these securities may not have the benefit of any security interest in the related assets. Credit card receivables are generally unsecured and the debtors are entitled to the protection of a number of state and federal consumer credit laws, many of which give such debtors the right to set off certain amounts owed on the credit cards, thereby reducing the balance due. There is the possibility that recoveries on repossessed collateral may not, in some cases, be available to support payments on these securities. ABS are often backed by a pool of assets representing the obligations of a number of different parties. To lessen the effect of failures by obligors on underlying assets to make payments, the securities may contain elements of credit support which fall into two categories: (i) liquidity protection, and (ii) protection against losses resulting from ultimate default by an obligor on the underlying assets. Liquidity protection refers to the provision of advances, generally by the entity administering the pool of assets, to ensure that the receipt of payments on the underlying pool occurs in a timely fashion. Protection against losses results from payment of the insurance obligations on at least a portion of the assets in the pool. This protection may be provided through guarantees, policies or letters of credit obtained by the issuer or sponsor from third parties, through various means of structuring the transaction or through a combination of such approaches. The Funds will not pay any additional or separate fees for credit support. The degree of credit support provided for each issue is generally based on historical information respecting the level of credit risk associated with the underlying assets. Delinquency or loss in excess of that anticipated or failure of the credit support could adversely affect the return on an investment in such a security. The availability of ABS may be affected by legislative or regulatory developments. It is possible that such developments may require the Fund to dispose of any then existing holdings of such securities.
Forward Commitments
Certain Funds may contract to purchase securities for a fixed price at a future date beyond customary settlement time consistent with the Fund’s investment strategies. The price of the underlying securities and the date when the securities will be delivered and paid for are fixed at the time the transaction is negotiated. The Funds may dispose of a forward commitment transaction prior to settlement if it is appropriate to do so and realize short-term gains (or losses) upon such sale. When effecting such transactions, cash or liquid high-grade debt obligations of the funds in a dollar amount sufficient to make payment for the portfolio securities to be purchased will be earmarked on the Fund’s records at the trade date and until the transaction is settled. A forward commitment transaction involves a risk of loss if the value of the security to be purchased declines prior to the settlement date or the other party to the transaction fails to complete the transaction.
A be announced (“TBA”) is a forward mortgage-backed securities trade. The securities are purchased and sold on a forward commitment basis with an approximate principal amount and maturity date. The actual principal amount and maturity date will be determined upon settlement when the specific mortgage pools are assigned. As of December 31, 2010, the Core Bond Fund had no cash collateral balances in connection with TBAs.
Inflation-Indexed Bonds
The Core Bond Fund may invest in inflation-indexed securities, which are typically bonds or notes designed to provide a return higher than the rate of inflation (based on a designated index) if held to maturity. A common type of inflation-indexed security is the U.S. Treasury Inflation-Protected Security, or TIPS. The principal of a TIPS increases with inflation and decreases with deflation, as measured by the Consumer Price Index. When a TIPS matures, the adjusted principal or original principal is paid, whichever is greater. TIPS pay interest twice a year, at a fixed rate. The rate is applied to the adjusted principal, Therefore, like the principal, interest payments rise with inflation and fall with deflation.
Guarantees
In the normal course of business, the Funds enter into contracts that contain a variety of representations which provide general indemnifications. The Funds’ maximum exposure under these arrangements is unknown as this would involve future claims that may be made against the Funds that have not yet occurred. However, the Funds expect the risk of loss to be remote.
| Notes to Financial Statements | 109 |
Table of Contents
Russell Investment Funds
Notes to Financial Statements, continued — December 31, 2010
Market and Credit Risk
In the normal course of business the Funds trade financial instruments and enter into financial transactions where risk of potential loss exists due to changes in the market (market risk) or failure of the other party to a transaction to perform (credit risk). Similar to credit risk, the Funds may be exposed to counterparty risk or risk that an institution or other entity with which the Funds have unsettled or open transactions will default. The potential loss could exceed the value of the relevant assets recorded in the financial statements (the “Assets”). The Assets, which potentially expose the Funds to credit risk, consist principally of cash due from counterparties and investments. The extent of the Funds’ exposure to credit and counterparty risks in respect to the Assets approximates their carrying value as recorded in the Funds’ Statements of Assets and Liabilities.
On September 15, 2008, Lehman Brothers Holdings Inc. filed for protection under Chapter 11 of the United States Bankruptcy Code. On September 19, 2008, a proceeding under the Securities Investor Protection Act (SIPA) was commenced with respect to Lehman Brothers Inc., a broker-dealer. A trustee appointed under SIPA is administering the bankruptcy estate of Lehman Brothers Inc. Lehman Brothers International (Europe) was placed in administration under the UK Insolvency Act on September 15, 2008. Lehman Brothers Special Financing Inc., among other Lehman subsidiaries, filed for protection under Chapter 11 of the United States Bankruptcy Code on October 3, 2008. In connection with these filings, the Lehman Brothers group of companies (collectively “Lehman Brothers”) will be reorganized and/or liquidated in an orderly fashion, subject to court approval. Each Lehman Brothers entity is a separate legal entity that is subject to its own bankruptcy proceeding.
The Core Bond Fund and Non-U.S. Fund had direct holdings, swap agreements, and securities and derivatives transactions outstanding with Lehman Brothers entities as issuers or counterparties at the time the relevant Lehman Brothers entities filed for protection or were placed in administration. The direct holdings associated with Lehman Brothers have been written down to their estimated recoverable values and incorporated as components of other receivable and liabilities on the Statements of Assets and Liabilities and net change in realized gain (loss) or unrealized appreciation (depreciation) on the Statement of Operations. The Funds have also utilized certain netting arrangements to offset payables and receivables of Lehman securities.
RIMCo or the Funds’ money managers have delivered notices of default and early termination to the relevant Lehman Brothers entities where required. For transactions with Lehman Brothers counterparties, RIMCo or the Funds’ money managers have terminated trades, obtained quotations from brokers for replacement trades and, where deemed appropriate, re-opened positions with new counterparties.
The court overseeing all the U.S. Lehman entities’ bankruptcy cases set a filing deadline for all those entities. The Lehman Brothers Inc. claims filing deadline was January 30, 2009 for all customer claims and June 1, 2009 for all general creditor claims related to Lehman Brothers Inc. In the case of all other U.S. Lehman entities, the court set filing deadlines of September 22, 2009 and November 2, 2009 (for certain “Program Securities”). The Lehman Brothers International (Europe) court set a filing deadline of December 31, 2012. To the extent that the Funds held accounts with Lehman Brothers Inc., the Funds filed the appropriate customer claims on January 29, 2009 and filed all other claims related to U.S. Lehman entities on the foregoing deadlines. The relevant Funds have entered into a confidential settlement agreement with respect to certain claims for terminated derivatives transactions between the Funds, Lehman Brothers Special Financing Inc., its parent company Lehman Brothers Holdings Inc. and securities positions facing Lehman Brothers Inc.
| 3. | Investment Transactions |
Securities
During the period ended December 31, 2010, purchases and sales of investment securities (excluding U.S. Government and Agency obligations, short-term investments, options, futures and repurchase agreements) were as follows:
| Purchases | Sales | |||||||
Multi-Style Equity Fund | $ | 401,616,965 | $ | 420,675,194 | ||||
Aggressive Equity Fund | 182,988,520 | 185,959,692 | ||||||
Non-U.S. Fund | 171,363,716 | 158,517,256 | ||||||
Core Bond Fund | 132,316,260 | 108,378,996 | ||||||
Real Estate Securities Fund | 695,857,532 | 694,499,887 | ||||||
Purchases and sales of US Government and Agency obligations (excluding short-term investments, options, futures and repurchase agreements) were as follows:
| Purchases | Sales | |||||||
Core Bond Fund | $ | 790,453,105 | $ | 744,800,736 | ||||
| 110 | Notes to Financial Statements |
Table of Contents
Russell Investment Funds
Notes to Financial Statements, continued — December 31, 2010
Written Options Contracts
Transactions in written options contracts for the period ended December 31, 2010 were as follows:
| Core Bond Fund | ||||||||
| Number of Contracts | Premiums Received | |||||||
Outstanding December 31, 2009 | 88 | $ | 484,268 | |||||
Opened | 529 | 2,552,723 | ||||||
Closed | (104 | ) | (1,208,826 | ) | ||||
Expired | (388 | ) | (955,119 | ) | ||||
Outstanding December 31, 2010 | 125 | $ | 873,046 | |||||
Securities Lending
The Investment Company has a securities lending program whereby each Fund can loan securities with a value up to 331?3% of each Fund’s total assets. The Fund receives cash (U.S. currency), U.S. Government or U.S. Government Agency obligations as collateral against the loaned securities. To the extent that a loan is collateralized by cash, such collateral is invested by the securities lending agent, State Street Bank and Trust Company (“State Street”) in short-term instruments, money market mutual funds and other short-term investments that meet certain quality and diversification requirements. The collateral received is recorded on a lending Fund’s Statement of Assets and Liabilities along with the related obligation to return the collateral.
Income generated from the investment of cash collateral, less negotiated rebate fees paid to participating brokers and transaction costs, is divided between the Fund and State Street and is recorded as income for the Fund. To the extent that a loan is secured by non-cash collateral, brokers pay the Fund negotiated lenders’ fees, which are divided between the Fund and State Street and are recorded as securities lending income for the Fund. All collateral received will be in an amount at least equal to 102% (for loans of U.S. securities) or 105% (for loans of non-U.S. securities) of the market value of the loaned securities at the inception of each loan. The market value of the loaned securities is determined at the close of business of the Fund and any additional required collateral is delivered to the Fund the next day. Should the borrower of the securities fail financially, there is a risk of delay in recovery of the securities or loss of rights in the collateral. Consequently, loans are made only to borrowers which are deemed to be creditworthy.
Each Fund that participates in the securities lending program has cash collateral invested in the Russell U.S. Cash Collateral Fund, an unregistered fund advised by RIMCo. On December 3, 2010, the Funds redeemed in-kind out of SLQT (securities lending cash collateral vehicle), realizing certain losses as a result of such redemption, and proceeds of the redemption were invested in the RIF Liquidating Trust, an unregistered fund managed by State Street. The RIF Liquidating Trust was formed to hold the assets redeemed in-kind from SLQT. As securities mature in the RIF Liquidating Trust, the Funds will invest the cash proceeds into the Russell U.S. Cash Collateral Fund.
As of December 31, 2010, the non-cash collateral pledged for the securities on loan in the following funds was as follows:
| Non-Cash Collateral Value | Non-Cash Collateral Holding | |||||
Multi-Style Equity Fund | $ | 7,992,946 | Pool of U.S. Government Securities | |||
Aggressive Equity Fund | 1,217,079 | Pool of U.S. Government Securities | ||||
Non-U.S. Fund | 2,492 | Pool of U.S. Government Securities | ||||
Real Estate Securities Fund | 160,074 | Pool of U.S. Government Securities | ||||
Custodian
The Funds have entered into arrangements with their custodian whereby custody credits realized as a result of uninvested cash balances are used to reduce a portion of the Funds’ expenses. During the period ended December 31, 2010, the Funds’ custodian fees were reduced by the following amounts under these arrangements which are included in expense reductions on the Statements of Operations:
| Amount Paid | ||||
Multi-Style Equity Fund | $ | 5 | ||
Aggressive Equity Fund | 6 | |||
Non-U.S. Fund | 25 | |||
Core Bond Fund | 330 | |||
Real Estate Securities Fund | 10 | |||
| Notes to Financial Statements | 111 |
Table of Contents
Russell Investment Funds
Notes to Financial Statements, continued — December 31, 2010
Brokerage Commissions
The Funds effect certain transactions through Recapture Services, a division of BNY ConvergeEX Execution Solutions LLC (“BNY”) and its global network of correspondent brokers. BNY is a registered broker and is not an affiliate of the Funds or RIMCo. Trades placed through BNY and its correspondents are used (i) to obtain brokerage and research services for RIMCo to assist RIMCo in its investment decision-making process in its capacity as advisor to the funds or (ii) to generate commission rebates to the Funds on whose behalf the trades were made. For purposes of trading to obtain brokerage and research services for RIMCo or to generate commission rebates to the Funds, the Funds’ money managers are requested to and RIMCo may, with respect to transactions it places, effect transactions with or through BNY and its correspondents or other brokers only to the extent that the money managers or RIMCo believe that the Funds will receive best execution. In addition, RIMCo recommends targets for the amount of trading that money managers allocate through BNY based upon asset class, investment style and other factors. Brokerage and research services provided to RIMCo by BNY or other brokers include, but are not limited to (1) advice either directly or indirectly through publications or writings as to the advisability in investing in, purchasing or selling securities and the availability of securities or of purchasers or sellers of securities, (2) analysis and reports concerning issuers, industries, securities, economic factors and trends, portfolio strategy and the performance of accounts; and/or (3) that are required in connection therewith. Research services will generally be obtained from unaffiliated third parties at market rates. Research provided to RIMCo may benefit the particular Funds generating the trading activity and may also benefit other Funds within RIC and other funds and clients managed or advised by RIMCo or its affiliates. Similarly, the Funds may benefit from research provided with respect to trading by those other funds and clients. In some cases, research may also be provided by other non-affiliated brokers.
BNY may also rebate to the Funds a portion of commissions earned on certain trading by the Funds through BNY and their correspondents in the form of commission recapture. Commission recapture is paid solely to those Funds generating the applicable trades. Commission recapture is generated on the instructions of the Soft Commission Committee once RIMCo’s research budget has been met, as determined annually in the Soft Commission Committee budgeting process.
Additionally, the Funds paid brokerage commissions to non-affiliated brokers who provided brokerage and research services to RIMCo.
| 4. | Related Party Transactions, Fees and Expenses |
Adviser and Administrator
RIMCo is the Funds’ adviser and RFSC, a wholly-owned subsidiary of RIMCo, is the Funds’ administrator. RIMCo is a wholly-owned subsidiary of Frank Russell Company (a subsidiary of The Northwestern Mutual Life Insurance Company). Frank Russell Company provides ongoing money manager research and trade placement services to RIF and RIMCo.
The Investment Company Funds are permitted to invest their cash reserves (i.e., cash awaiting investment or cash held to meet redemption requests or to pay expenses) in the Russell U.S. Cash Management Fund an unregistered Fund advised by RIMCo. As of December 31, 2010, the Investment Company Funds have invested $123,885,237 in the Russell U.S. Cash Management Fund. In addition, a portion of the collateral received from the Investment Company’s securities lending program in the amount of $193,340,945 is invested in the Russell U.S. Cash Collateral Fund, an unregistered Fund advised by RIMCo.
The advisory and administrative fees specified in the table below are based upon the average daily net assets of each Fund and are payable monthly.
| Annual Rate | ||||||||
| Funds | Adviser | Administrator | ||||||
Multi-Style Equity Fund | 0.73 | % | .05 | % | ||||
Aggressive Equity Fund | 0.90 | .05 | ||||||
Non-U.S. Fund | 0.90 | .05 | ||||||
Core Bond Fund | 0.55 | .05 | ||||||
Real Estate Securities Fund | 0.80 | .05 | ||||||
The following shows the respective totals for advisory and administrative fees for the period ended December 31, 2010.
| Advisory | Administrative | |||||||
Multi-Style Equity Fund | $ | 2,717,357 | $ | 186,120 | ||||
Aggressive Equity Fund | 1,502,450 | 83,469 | ||||||
Non-U.S. Fund | 2,949,565 | 163,865 | ||||||
Core Bond Fund | 2,435,075 | 221,371 | ||||||
Real Estate Securities Fund | 3,581,738 | 223,859 | ||||||
| 112 | Notes to Financial Statements |
Table of Contents
Russell Investment Funds
Notes to Financial Statements, continued — December 31, 2010
RIMCo agreed to certain waivers of its advisory fees as follows:
For the Aggressive Equity Fund, RIMCo has contractually agreed, until April 30, 2011, to waive 0.06% of its 0.90% advisory fee. The waiver may not be terminated during the relevant period except with Board approval. The total amount of the waiver for the period ended December 31, 2010 was $100,163. There were no reimbursements during the period.
For the Non-U.S. Fund, RIMCo has contractually agreed, until April 30, 2011, to waive 0.06% of its 0.90% advisory fee. The waiver may not be terminated during the relevant period except with Board approval. The total amount of the waiver for the period ended December 31, 2010 was $196,638. There were no reimbursements during the period.
For the Core Bond Fund, RIMCo has contractually agreed, until April 30, 2011, to waive 0.07% of its 0.55% advisory fee. The waiver may not be terminated during the relevant period except with Board approval. The total amount of the waiver for the period ended December 31, 2010 was $309,919. There were no reimbursements during the period.
Transfer and Dividend Disbursing Agent
RFSC serves as transfer agent and provides dividend disbursing services to the Funds. For this service, RFSC is paid a fee based upon the average daily net assets of the Funds for transfer agency and dividend disbursing services. RFSC retains a portion of this fee for services provided to the Funds and pays the balance to unaffiliated agents who assist in providing these services. Transfer agency fees paid by the Funds presented herein for the period ended December 31, 2010 were as follows:
| Amount | ||||
Multi-Style Equity Fund | $ | 16,388 | ||
Aggressive Equity Fund | 7,348 | |||
Non-U.S. Fund | 14,429 | |||
Core Bond Fund | 19,542 | |||
Real Estate Securities Fund | 19,720 | |||
Distributor
Russell Financial Services, Inc. (the “Distributor’), a wholly-owned subsidiary of RIMCo, serves as distributor for RIF, pursuant to the Distribution Agreement with the Investment Company. The Distributor receives no compensation from the Investment Company for its services.
Accrued Fees Payable to Affiliates
Accrued fees payable to affiliates for the period ended December 31, 2010 were as follows:
| Multi-Style Equity Fund | Aggressive Equity Fund | Non-U.S. Fund | Core Bond Fund | Real Estate Securities Fund | ||||||||||||||||
Advisory fees | $ | 243,316 | $ | 128,460 | $ | 250,187 | $ | 186,302 | $ | 326,173 | ||||||||||
Administration fees | 16,792 | 8,030 | 15,309 | 19,853 | 20,386 | |||||||||||||||
Transfer agent fees | 1,478 | 707 | 1,346 | 1,747 | 1,794 | |||||||||||||||
Trustee fees | 2,151 | 931 | 1,900 | 2,061 | 2,429 | |||||||||||||||
| $ | 263,737 | $ | 138,128 | $ | 268,742 | $ | 209,963 | $ | 350,782 | |||||||||||
Affiliated Brokerage Commissions
The Funds will effect certain transactions through Russell Implementation Services Inc. (“RIS”) and its global network of unaffiliated correspondent brokers. RIS is a registered broker and investment adviser and an affiliate of RIMCo. Trades placed through RIS and its correspondents are made (i) to manage trading associated with changes in managers, rebalancing across existing managers, cash flows and other portfolio transitions or (ii) to execute portfolio securities transactions for each Fund’s assets that RIMCo determines not to allocate to money managers and for each Fund’s cash reserves.
Board of Trustees
The Russell Fund Complex consists of RIC, which has 41 Funds, and RIF, which has nine Funds. Each of the Trustees is a Trustee of both RIC and RIF. During the period, the Russell Fund Complex paid each of its independent Trustees a retainer of $72,000 per year (effective January 1 ,2011, $75,000 per year), $6,500 for each regular quarterly meeting attended in person, $2,500 for each special meeting attended in person, and $2,500 for each Audit Committee meeting, Nominating and Governance Committee meeting, Investment Committee meeting or any other committee meeting established and approved by the Board that is attended in person. Each Trustee receives a $1,000 fee for attending the quarterly and special meetings (except for telephonic meetings called pursuant to the Funds’ valuation and pricing procedures) and a $500 fee for attending the committee meeting by
| Notes to Financial Statements | 113 |
Table of Contents
Russell Investment Funds
Notes to Financial Statements, continued — December 31, 2010
phone instead of receiving the full fee had the member attended in person. Trustees’ out-of-pocket expenses are also paid by the Russell Fund Complex. The Audit Committee Chair and Investment Committee Chair are each paid a fee of $15,000 per year and the Nominating and Governance Committee Chair is paid a fee of $6,000 per year. The chairman of the Board receives additional annual compensation of $72,000 (effective January 1, 2011, $75,000 per year).
| 5. | Federal Income Taxes |
At December 31, 2010, the following Funds had net tax basis capital loss carryforwards which may be applied against any realized net taxable gains in each succeeding year or until their respective expiration dates, whichever occurs first. Available capital loss carryforwards and expiration dates are as follows:
| Funds | 12/31/2016 | 12/31/2017 | Totals | |||||||||
Multi-Style Strategy | $ | 23,583,170 | $ | 61,778,100 | $ | 85,361,270 | ||||||
Aggressive Equity | 13,608,848 | 36,496,484 | 50,105,332 | |||||||||
Non-U.S. | 48,403,470 | 51,040,031 | 99,443,501 | |||||||||
Real Estate Securities | — | 26,603,446 | 26,603,446 | |||||||||
At December 31, 2010, the cost of investments and net unrealized appreciation (depreciation), undistributed ordinary income and undistributed long-term capital gains for income tax purposes were as follows:
| Multi-Style Strategy Fund | Aggressive Equity Fund | Non U.S. Fund | Core Bond Fund | Real Estate Securities Fund | ||||||||||||||||
Cost of Investments | $ | 401,918,788 | $ | 230,873,271 | $ | 331,686,384 | $ | 540,398,804 | $ | 497,254,082 | ||||||||||
Unrealized Appreciation | $ | 67,124,818 | $ | 36,309,394 | $ | 59,222,141 | $ | 16,866,048 | $ | 74,545,751 | ||||||||||
Unrealized Depreciation | (2,460,840 | ) | (1,600,549 | ) | (10,419,705 | ) | (9,171,606 | ) | (5,490,738 | ) | ||||||||||
Net Unrealized Appreciation (Depreciation) | $ | 64,663,978 | $ | 34,708,845 | $ | 48,802,436 | $ | 7,694,442 | $ | 69,055,013 | ||||||||||
Components of Distributable Earnings | ||||||||||||||||||||
Undistributed Ordinary Income | $ | 875,879 | $ | 128,099 | $ | 4,087,677 | $ | 1,051,485 | $ | 2,384,871 | ||||||||||
Undistributed Long-Term Gains (Capital Loss Carryforward) | $ | (85,361,270 | ) | $ | (50,105,332 | ) | $ | (99,443,501 | ) | $ | 1,283,136 | $ | (26,603,446 | ) | ||||||
Tax Composition of Distributions | ||||||||||||||||||||
Ordinary Income | $ | 3,360,274 | $ | 777,833 | $ | 2,907,701 | $ | 28,040,779 | $ | 9,960,532 | ||||||||||
Long Term Capital Gains | $ | — | $ | — | $ | — | $ | 1,186,400 | $ | — | ||||||||||
Post October Loss Deferrals | $ | — | $ | — | $ | 133,028 | $ | 259,613 | $ | — | ||||||||||
| 6. | Fund Share Transactions (amounts in thousands) |
Share transactions for the periods ended December 31, 2010 and December 31, 2009 were as follows:
| 2010 | 2009 | |||||||||||||||
| Multi-Style Equity Fund | Shares | Dollars | Shares | Dollars | ||||||||||||
Proceeds from shares sold | 1,894 | 22,754 | 2,436 | 23,857 | ||||||||||||
Proceeds from reinvestment of distributions | 287 | 3,360 | 483 | 4,298 | ||||||||||||
Payments for shares redeemed | (4,706 | ) | (56,133 | ) | (4,036 | ) | (37,795 | ) | ||||||||
Net increase (decrease) | (2,525 | ) | (30,019 | ) | (1,117 | ) | (9,640 | ) | ||||||||
| 2010 | 2009 | |||||||||||||||
| Aggressive Equity Fund | Shares | Dollars | Shares | Dollars | ||||||||||||
Proceeds from shares sold | 1,360 | 13,976 | 1,485 | 11,475 | ||||||||||||
Proceeds from reinvestment of distributions | 76 | 778 | 95 | 695 | ||||||||||||
Payments for shares redeemed | (1,882 | ) | (19,240 | ) | (2,176 | ) | (16,299 | ) | ||||||||
Net increase (decrease) | (446 | ) | (4,486 | ) | (596 | ) | (4,129 | ) | ||||||||
| 2010 | 2009 | |||||||||||||||
| Non-U.S. Fund | Shares | Dollars | Shares | Dollars | ||||||||||||
Proceeds from shares sold | 3,705 | 33,734 | 2,904 | 22,918 | ||||||||||||
Proceeds from reinvestment of distributions | 331 | 2,908 | 1,010 | 7,901 | ||||||||||||
Payments for shares redeemed | (2,938 | ) | (26,583 | ) | (3,249 | ) | (25,343 | ) | ||||||||
Net increase (decrease) | 1,098 | 10,059 | 665 | 5,476 | ||||||||||||
| 114 | Notes to Financial Statements |
Table of Contents
Russell Investment Funds
Notes to Financial Statements, continued — December 31, 2010
| 2010 | 2009 | |||||||||||||||
| Core Bond Fund | Shares | Dollars | Shares | Dollars | ||||||||||||
Proceeds from shares sold | 8,107 | 86,343 | 7,232 | 71,125 | ||||||||||||
Proceeds from reinvestment of distributions | 2,784 | 29,227 | 2,152 | 20,869 | ||||||||||||
Payments for shares redeemed | (5,254 | ) | (56,066 | ) | (4,313 | ) | (40,570 | ) | ||||||||
Net increase (decrease) | 5,637 | 59,504 | 5,071 | 51,424 | ||||||||||||
| 2010 | 2009 | |||||||||||||||
| Real Estate Securities Fund | Shares | Dollars | Shares | Dollars | ||||||||||||
Proceeds from shares sold | 2,018 | 25,770 | 4,224 | 34,059 | ||||||||||||
Proceeds from reinvestment of distributions | 783 | 9,961 | 1,793 | 14,718 | ||||||||||||
Payments for shares redeemed | (2,807 | ) | (34,966 | ) | (3,178 | ) | (28,595 | ) | ||||||||
Net increase (decrease) | (6 | ) | 765 | 2,839 | 20,182 | |||||||||||
| 7. | Interfund Lending Program |
The Funds have been granted permission from the Securities and Exchange Commission to participate in a joint lending and borrowing facility (the “Credit Facility”). Portfolios of the Funds may borrow money from each other for temporary purposes. All such borrowing and lending will be subject to a participating Fund’s fundamental investment limitations. Typically, Funds will borrow from the Russell Investment Company (“RIC”) Funds. The RIC lending Fund will lend through the program only when the returns are higher than those available from an investment in repurchase agreements or short-term reserves and the portfolio manager determines it is in the best interest of the RIC lending Fund. The Funds will borrow through the program only when the costs are equal to or lower than the cost of bank loans. Interfund loans and borrowings normally extend overnight, but can have a maximum duration of seven days. Loans may be called on one business day’s notice. A participating Fund may have to borrow from a bank at a higher interest rate if an interfund loan is called or not renewed. Any delay in repayment to the RIC lending Fund could result in a lost investment opportunity or additional borrowing costs. For the period ended December 31, 2010, the Funds did not borrow through the interfund lending program.
| 8. | Record Ownership |
As of December 31, 2010, the following table includes shareholders of record with greater than 10% of the total outstanding shares of each respective Fund. The Northwestern Mutual Life Insurance Company accounts were the largest shareholder in each Fund.
| # of Shareholders | % | |||||||
Multi-Style Equity Fund | 2 | 83.3 | ||||||
Aggressive Equity Fund | 2 | 82.3 | ||||||
Non-U.S. Fund | 2 | 79.7 | ||||||
Core Bond Fund | 3 | 85.7 | ||||||
Real Estate Securities Fund | 2 | 92.7 | ||||||
| 9. | Restricted Securities |
Restricted securities are subject to contractual limitations on resale, are often issued in private placement transactions, and are not registered under the Securities Act of 1933 (the “Act”). The most common types of restricted securities are those sold under Rule 144A of the Act and commercial paper sold under Section 4(2) of the Act.
A Fund may invest a portion of its net assets not to exceed 15% in securities that are illiquid. This limitation is applied at the time of purchase. Illiquid securities are securities that may not be readily marketable, and that cannot be sold within seven days in the ordinary course of business at the approximate amount at which the Fund has valued the securities. Restricted securities are generally considered to be illiquid.
The following table lists restricted securities held by a Fund that are illiquid. The following table does not include (1) securities deemed liquid by RIMCo or a money manager pursuant to Board approved policies and procedures or (2) illiquid securities that are not restricted securities as designated on the Funds’ Schedule of Investments.
| Fund - % of Net Assets Securities | Acquisition Date | Principal Amount ($) or Shares | Cost per Unit $ | Cost (000) $ | Market Value (000) $ | |||||||||||||||
Non-U.S. Fund - 0.3% | ||||||||||||||||||||
Mail.ru Group, Ltd. | 11/05/10 | 10,389 | 35.43 | 368 | 357 | |||||||||||||||
Rolls-Royce Group PLC | 03/18/10 | 88,362 | 8.76 | 774 | 858 | |||||||||||||||
| 1,215 | ||||||||||||||||||||
| Notes to Financial Statements | 115 |
Table of Contents
Russell Investment Funds
Notes to Financial Statements, continued — December 31, 2010
Core Bond Fund - 1.0% | ||||||||||||||||||||
Adam Aircraft Industries, Term Loan | 02/13/08 | 48,786 | 99.00 | 48 | — | |||||||||||||||
ARES CLO Funds | 01/15/09 | 634,950 | 76.68 | 487 | 597 | |||||||||||||||
ARES CLO Funds | 01/15/09 | 384,473 | 95.53 | 367 | 371 | |||||||||||||||
Armstrong Loan Funding, Ltd. | 05/21/09 | 306,478 | 88.13 | 270 | 303 | |||||||||||||||
AWAS Aviation Capital, Ltd. | 10/01/10 | 365,000 | 100.00 | 365 | 362 | |||||||||||||||
Chatham Light CLO, Ltd. | 11/25/09 | 495,121 | 90.89 | 450 | 463 | |||||||||||||||
CIT Mortgage Loan Trust | 10/05/07 | 130,000 | 100.00 | 130 | 92 | |||||||||||||||
CIT Mortgage Loan Trust | 10/05/07 | 180,000 | 100.00 | 180 | 96 | |||||||||||||||
CIT Mortgage Loan Trust | 09/11/08 | 91,586 | 100.00 | 92 | 88 | |||||||||||||||
DG Funding Trust | 11/04/03 | 49 | 10,537.12 | 516 | 374 | |||||||||||||||
ING Bank NV | 11/17/10 | 600,000 | 99.66 | 598 | 585 | |||||||||||||||
Ras Laffan Liquefied Natural Gas Co., Ltd. III | 08/03/10 | 250,000 | 100.00 | 250 | 258 | |||||||||||||||
Sabine Pass LNG, LP | 12/14/10 | 380,000 | 88.81 | 337 | 356 | |||||||||||||||
Symetra Financial Corp. | 06/02/06 | 150,000 | 98.83 | 148 | 151 | |||||||||||||||
TransDigm, Inc. | 12/01/10 | 250,000 | 100.00 | 250 | 259 | |||||||||||||||
UBS AG | 01/11/08 | 270,000 | 50.32 | 136 | 123 | |||||||||||||||
Washington Mutual Mortgage Pass Through Certificates | 04/01/05 | 188,633 | 100.00 | 189 | 10 | |||||||||||||||
| 4,488 | ||||||||||||||||||||
Illiquid securities and restricted securities may be priced by the Funds using fair value procedures approved by the Board.
| 10. | Subsequent Events |
Management has evaluated the events and transactions that have occurred through the date the financial statements were issued and noted no items requiring adjustments of the financial statements or additional disclosures.
Effective January 1, 2011, RIMCo changed the Non-U.S. Fund’s primary benchmark from the MSCI EAFE Index (net of tax on dividends from foreign holdings) to the Russell Developed ex-U.S. Large Cap Index (net of tax on dividends from foreign holdings). RIMCo believes that the Russell Developed ex-U.S. Large Cap Index (net of tax on dividends from foreign holdings) is an appropriate benchmark which more broadly represents the investable universe of stocks.
| 116 | Notes to Financial Statements |
Table of Contents
Report of Independent Registered Public Accounting Firm
To the Board of Trustees and Shareholders
of Russell Investment Funds
In our opinion, the accompanying statements of assets and liabilities, including the schedules of investments, and the related statements of operations, of changes in net assets and the financial highlights present fairly, in all material respects, the financial position of Multi-Style Equity Fund, Aggressive Equity Fund, Non-U.S. Fund, Core Bond Fund and Real Estate Securities Fund (five of the portfolios constituting the Russell Investment Funds, hereafter referred to as the “Funds”) at December 31, 2010, the results of each of their operations for the year then ended, the changes in each of their net assets for each of the two years in the period then ended and the financial highlights for each of the five years in the period then ended, in conformity with accounting principles generally accepted in the United States of America. These financial statements and financial highlights (hereafter referred to as “financial statements”) are the responsibility of the Funds’ management; our responsibility is to express an opinion on these financial statements based on our audits. We conducted our audits of these financial statements in accordance with the standards of the Public Company Accounting Oversight Board (United States). Those standards require that we plan and perform the audits to obtain reasonable assurance about whether the financial statements are free of material misstatement. An audit includes examining, on a test basis, evidence supporting the amounts and disclosures in the financial statements, assessing the accounting principles used and significant estimates made by management, and evaluating the overall financial statement presentation. We believe that our audits, which included confirmation of securities at December 31, 2010 by correspondence with the custodian, brokers, and transfer agent, provide a reasonable basis for our opinion.

PricewaterhouseCoopers LLP
Seattle, Washington
February 15, 2011
| Report of Independent Registered Public Accounting Firm | 117 |
Table of Contents
Russell Investment Funds
Tax Information — December 31, 2010 (Unaudited)
For the tax year ended December 31, 2010, the Funds hereby designate 100% or the maximum amount allowable, of its net taxable income as qualified dividends taxed at individual net capital gain rates.
The Form 1099 you receive in January 2011 will show the tax status of all distributions paid to your account in calendar year 2010.
The Funds designate dividends distributed during the fiscal year as qualifying for the dividends received deduction for corporate shareholders as follows:
Multi-Style Equity | 100.0 | % | ||
Aggressive Equity | 100.0 | % | ||
Non-U.S. | 4.9 | % | ||
Real Estate Securities | 0.0 | % | ||
Core Bond | 0.0 | % |
Pursuant to Section 852 of the Internal Revenue Code, the Funds designate the following amounts as long-term capital gain dividends for their taxable year ended December 31, 2010:
| Long-Term Capital Gains | ||||
Core Bond | 1,186,400 | |||
Please consult a tax adviser for any questions about federal or state income tax laws.
The Non-U.S Fund paid foreign taxes of $774,473 and recognized $7,196,490 of foreign source income during the taxable year ended December 31, 2010. Pursuant to Section 853 of the Internal Revenue Code, the Fund designates $0.0216 per share of foreign taxes paid and $0.2003 of gross income per share earned from foreign sources in the taxable year ended December 31, 2010.
| 118 | Tax Information |
Table of Contents
Russell Investment Funds
Basis for Approval of Investment Advisory Contracts — (Unaudited)
Approval of Investment Advisory Agreement
The Board of Trustees, including all of the Independent Trustees, last considered and approved the continuation of the advisory agreement with RIMCo (the “RIMCo Agreement”) and the portfolio management contract with each Money Manager of the Funds (collectively, the “portfolio management contracts”) at a meeting held in person on April 20, 2010 (the “Agreement Evaluation Meeting”). During the course of a year, the Trustees receive a wide variety of materials regarding the investment performance of the Funds, sales and redemptions of the Funds’ shares, management of the Funds by RIMCo and compliance with applicable regulatory requirements. In preparation for the annual review, the Independent Trustees, with the advice and assistance of their independent counsel, also requested and the Board considered (1) information, analyses and reports prepared by RIMCo relating to the services provided by RIMCo (and its affiliates) to the Funds; and (2) information (the “Third-Party Information”) received from an independent, nationally recognized provider of investment company information comparing the performance of each of the Funds and their respective operating expenses over various periods of time with other peer funds not managed by RIMCo, believed by the provider to be generally comparable in investment objectives to the Funds. In the case of each Fund, its other peer funds are collectively hereinafter referred to as the Fund’s “Comparable Funds,” and, with the Fund, such Comparable Funds are collectively hereinafter referred to as the Fund’s “Performance Universe” in the case of performance comparisons and the Fund’s “Expense Universe” in the case of operating expense comparisons. In the case of certain Funds, the Third-Party Information reflected changes in the Comparable Funds requested by RIMCo, which changes were noted in the Third-Party Information. The foregoing information requested by the Trustees or provided by RIMCo is collectively called the “Agreement Evaluation Information.” The Trustees’ evaluations also reflected the knowledge and familiarity gained as Board members of the Funds and other funds in the same complex with respect to services provided by RIMCo, RIMCo’s affiliates and each Money Manager. The Trustees received a memorandum from counsel to the Funds discussing the legal standards for their consideration of the continuations of the RIMCo Agreement and the portfolio management contracts and the Independent Trustees separately received a memorandum regarding their responsibilities from their independent counsel.
On April 13, 2010, the Independent Trustees in preparation for the Agreement Evaluation Meeting met by conference telephone call to review Agreement Evaluation Information received to that date in a private session with their independent counsel at which no representatives of RIMCo or the Funds’ management were present and, on the basis of that review, requested additional Agreement Evaluation Information. At the Agreement Evaluation Meeting, the Board, including the Independent Trustees, reviewed the proposed continuance of the RIMCo Agreement and the portfolio management contracts with management, counsel to the Funds and independent counsel to the Independent Trustees. Presentations made by RIMCo to the Board as part of this review encompassed the Funds and all other RIMCo-managed funds for which the Board has supervisory responsibility. Following this review, but prior to voting, the Independent Trustees again met in executive session with their independent counsel to consider additional Agreement Evaluation Information received from RIMCo and management at the Agreement Evaluation Meeting. The discussion below reflects all of these reviews.
In evaluating the portfolio management contracts, the Board considered that the Funds, in employing a manager-of-managers method of investment, operate in a manner that is distinctly different from most other investment companies. In the case of most other investment companies, an advisory fee is paid by the investment company to its adviser which, in turn, employs and compensates individual portfolio managers to make specific securities selections consistent with the adviser’s style and investment philosophy. RIMCo has engaged multiple unaffiliated Money Managers for all Funds.
The Board considered that RIMCo (rather than any Money Manager) is responsible under the RIMCo Agreement for determining, implementing and maintaining the investment program for each Fund. Assets of each Fund generally have been allocated among the multiple Money Managers selected by RIMCo, subject to Board approval, for that Fund. RIMCo manages directly a portion of certain Funds’ assets employing a “select holdings strategy,” as described below, and directly manages the investment of each Fund’s cash reserves. RIMCo also may manage directly any portion of each Fund’s assets that RIMCo determines not to allocate to the Money Managers and portions of a Fund during transitions between Money Managers. In all cases, assets are managed directly by RIMCo pursuant to authority provided by the RIMCo Agreement.
RIMCo is responsible for selecting, subject to Board approval, Money Managers for each Fund and for actively managing allocations and reallocations of assets among the Money Managers. The Board has been advised that RIMCo’s goal is to construct and manage diversified portfolios in a risk-aware manner. Each Money Manager for a Fund in effect performs the function of an individual portfolio manager who is responsible for selecting portfolio securities for the portion of the Fund assigned to it by RIMCo (each, a “segment”) in accordance with the Fund’s applicable investment objective, policies and restrictions, any constraints placed by RIMCo upon their selection of portfolio securities and the Money Manager’s specified role in a Fund. RIMCo is responsible for communicating performance expectations to each Money Manager; supervising compliance by each Money Manager with each Fund’s investment objective and policies; authorizing Money Managers to engage in certain investment strategies for a Fund; and recommending annually to the Board whether portfolio management contracts should be renewed, modified or terminated. In addition to its annual recommendation as to the renewal, modification or termination of portfolio management contracts, RIMCo is responsible for recommending to the Board additions of new Money Managers or replacements of existing Money Managers at any
| Basis for Approval of Investment Advisory Contracts | 119 |
Table of Contents
Russell Investment Company
Basis for Approval of Investment Advisory Contracts, continued — (Unaudited)
time when, based on RIMCo’s research and ongoing review and analysis, such actions are appropriate. RIMCo may impose specific investment constraints from time to time for each Money Manager intended to capitalize on the strengths of that Money Manager or to coordinate the investment activities of Money Managers for the Fund in a complementary manner. Therefore, RIMCo’s selection of Money Managers is made not only on the basis of performance considerations but anticipated compatibility with other Money Managers in the same Fund. In light of the foregoing, the overall performance of each Fund over appropriate periods reflects, in great part, the performance of RIMCo in designing the Fund’s investment program, structuring the Fund, selecting an effective Money Manager with a particular investment style or sub-style for a segment that is complementary to the styles of the Money Managers of other Fund segments, and allocating assets among the Money Managers in a manner designed to achieve the objectives of the Fund.
The Board considered that the prospectuses for the Funds and other public disclosures emphasize to investors RIMCo’s role as the principal investment manager for each Fund, rather than the investment selection role of the Funds’ Money Managers, and describe the manner in which the Funds operate so that investors may take that information into account when deciding to purchase shares of any such Fund. The Board further considered that Fund investors in pursuing their investment goals and objectives likely purchased their shares on the basis of this information and RIMCo’s reputation for and performance record in managing the Funds’ manager-of-managers structure.
The Board also considered the demands and complexity of managing the Funds pursuant to the manager-of-managers structure, the special expertise of RIMCo with respect to the manager-of-managers structure of the Funds and the likelihood that, at the current expense ratio of each Fund, there would be no acceptable alternative investment managers to replace RIMCo on comparable terms given the need to continue the manager-of-managers strategy of such Fund selected by shareholders in purchasing their shares.
In addition to these general factors relating to the manager-of-managers structure of the Funds, the Trustees considered, with respect to each Fund, various specific factors in evaluating renewal of the RIMCo Agreement, including the following:
| 1. | The nature, scope and overall quality of the investment management and other services provided, and expected to be provided, to the Fund by RIMCo; |
| 2. | The advisory fee paid by the Fund to RIMCo (the “Advisory Fee”) and the fact that it encompasses all investment advisory fees paid by the Fund, including the fees for any Money Managers of such Fund; |
| 3. | Information provided by RIMCo as to other fees and benefits received by RIMCo or its affiliates from the Fund, including any administrative, transfer agent or cash management fees and fees received for management of securities lending cash collateral, soft dollar arrangements and commissions in connection with portfolio securities transactions; |
| 4. | Information provided by RIMCo as to expenses incurred by the Fund; and |
| 5. | Information provided by RIMCo as to the profits that RIMCo derives from its mutual fund operations generally and from the Fund. |
In evaluating the nature, scope and overall quality of the investment management and other services provided, and which are expected to be provided, to the Funds, including Fund portfolio management services, the Board inquired as to the possible impact on the Funds’ operations of significant changes in RIMCo’s senior management and other personnel providing services to the Funds during 2009 and 2010 to the date of the Agreement Evaluation Meeting and a planned relocation of the Russell organization’s headquarters by the end of 2010. At the Agreement Evaluation Meeting, senior representatives of RIMCo discussed these changes with the Board and assured the Board that, while these changes likely would have a near term impact because of increased demands upon continuing personnel, steps were being taken to avoid any long-term diminution in the nature, scope or quality of the services provided to the Funds. The Board also discussed the possible impact of such changes on the compliance programs of the Funds and RIMCo and received assurances from senior representatives of the Russell organization that such changes would not result in any long-term diminution in the nature and quality of the Funds’ compliance programs.
As noted above, RIMCo, pursuant to the terms of the RIMCo Agreement, directly manages, a portion—up to 10%—of the assets of the Multi-Style Equity Fund (the “Participating Fund”) utilizing a select holdings strategy, the actual allocation being determined by the Participating Fund’s RIMCo portfolio manager. The select holdings strategy utilized by RIMCo in managing such assets for the Participating Fund is designed to increase the Participating Fund’s exposure to stocks that are viewed as attractive by multiple Money Managers of the Participating Fund. The Board reviewed the results of the select holdings strategy in respect of the Participating Fund during the past year. The Trustees considered that RIMCo is not required to pay investment advisory fees to a Money Manager with respect to assets for which the select holdings strategy is utilized and that the profits derived by RIMCo generally and from the Participating Fund consequently may increase incrementally. The Board, however, also considered RIMCo’s advice that it pays certain Money Managers additional fees for providing information and other services in connection with the select holdings strategy and incurs additional costs in carrying out the select holdings strategy, the limited amount of assets that are managed directly by RIMCo pursuant to the select holdings strategy, and the fact that the aggregate investment advisory fees paid by the Participating Fund are not increased as a result of the select holdings strategy.
| 120 | Basis for Approval of Investment Advisory Contracts |
Table of Contents
Russell Investment Company
Basis for Approval of Investment Advisory Contracts, continued — (Unaudited)
In evaluating the reasonableness of the Funds’ Advisory Fees in light of Fund performance, the Board considered that, in the Agreement Evaluation Information and at past meetings, RIMCo noted differences between the investment strategies of certain Funds and their respective Comparable Funds in pursuing their investment objectives, including fund strategies which seek to achieve a lower tracking error (i.e., the difference, whether positive or negative, between the return of a fund and its benchmark) and resulting lower return volatility than their Comparable Funds. According to RIMCo, these strategies may be expected to result, and for certain Funds during the periods covered by the Third-Party Information did result, in lower performance than that of some of their Comparable Funds. According to RIMCo, the strategies pursued by the Funds, among other things, are intended to result in less volatile, more moderate returns relative to each Fund’s performance benchmark rather than more volatile, more extreme returns that its Comparable Funds may experience over time, although Fund results in 2008 and early 2009 generally did not reflect uniform success in achieving lesser volatility.
With respect to the Funds’ Advisory Fees, the Third-Party Information showed that the Multi-Style Equity and Core Bond Fund each had an Advisory Fee which on a contractual basis, an actual basis (i.e., giving effect to any voluntary fee waivers implemented by RIMCo and the advisers to such Fund’s Comparable Funds), or on both a contractual and actual basis was ranked more than 5 basis points below the third quintile of its Expense Universe in the fourth quintile of its Expense Universe. On an actual basis (i.e., giving effect to any voluntary fee waivers implemented by RIMCo and the advisers to such Fund’s Comparable Funds), the RIF Aggressive Equity Fund Advisory Fee was ranked in the third quintile of its Expense Universe but the actual Advisory Fee for each of the other Funds was ranked in the fourth quintile of its Expense Universe. The comparison was based upon the latest fiscal years for the Expense Universe funds. In assessing the Funds’ Advisory Fees, the Board focused on actual Advisory Fees. The Board considered that the actual Advisory Fee for each Fund other than the Multi-Style Equity Fund and the Core Bond Fund was ranked within 5 basis points of the third quintile of its Expense Universe. The Board considered RIMCo’s explanation of the reasons for these Funds’ actual Advisory Fee rankings and its belief that the Funds’ Advisory Fees are reasonable notwithstanding such rankings. The Board determined that it would continue to monitor those fees against the Funds’ Comparable Funds’ advisory fees.
In discussing the Funds’ Advisory Fees generally, RIMCo noted, among other things, that its Advisory Fees for the Funds encompass services that may not be provided by investment advisers to the Funds’ Comparable Funds, such as cash equitization and management of portfolio transition costs when Money Managers are added, terminated or replaced. RIMCo also observed that its “margins” in providing investment advisory services to the Funds tend to be lower than competitors’ margins because of the demands and complexities of managing the Funds’ manager-of-managers structure, including RIMCo’s payment of a significant portion of the Funds’ Advisory Fees to their Money Managers.
The Board considered for each Fund whether economies of scale have been realized and whether the Advisory Fee for such Fund appropriately reflects or should be revised to reflect any such economies. The Board noted that, generally, there was a reduction in the Funds’ assets as a result of market declines and related investor redemptions in 2008 and 2009 and that Fund asset levels generally have not rebounded completely from those levels. In the case of certain Funds, asset levels have continued to decline since 2008. The Board therefore determined that, after giving effect to any applicable fee or expense caps, waivers or reimbursements, the Advisory Fee for each Fund appropriately reflected any economies of scale realized by that Fund, based upon net asset flows since 2008 and such factors as the variability of Money Manager investment advisory fees and other factors associated with the manager-of-managers structure employed by the Funds.
The Board considered, as a general matter, that fees payable to RIMCo by institutional clients with investment objectives similar to those of the Funds and other RIC funds under the Board’s supervision are lower, and, in some cases, may be substantially lower, than the rates paid by RIC funds supervised by the Board, including the Funds. The Trustees considered the differences in the nature and scope of services RIMCo provides to institutional clients and the Funds. RIMCo explained, among other things, that institutional clients have fewer administrative needs than the Funds. RIMCo also noted that since the Funds must constantly issue and redeem their shares, they are more difficult to manage than institutional accounts, where assets are relatively stable. In addition, RIMCo noted that the Funds are subject to heightened regulatory requirements relative to institutional clients. The Board noted that RIMCo provides office space and facilities to the Funds and all of the Funds’ officers. Accordingly, the Trustees concluded that the services provided to the Funds are sufficiently different from the services provided to the other clients that comparisons are not probative and should not be given significant weight.
In evaluating the Funds’ Advisory Fees, the Board noted that none of the Funds had total expenses which ranked more than 5 basis points below the third quintile of its Expense Universe.
On the basis of the Agreement Evaluation Information, and other information previously received by the Board from RIMCo during the course of the current year or prior years, or presented at or in connection with the Agreement Evaluation Meeting by RIMCo, the Board, in respect of each Fund, found, after giving effect to any applicable waivers and/or reimbursements (1) the Advisory Fee charged by RIMCo was reasonable in light of the nature, scope and overall quality of the investment management and other services provided, and expected to be provided, to the Funds; (2) the relative expense ratio of the Fund was comparable to those of its Comparable Funds; (3) RIMCo’s methodology of allocating expenses of operating funds in the complex was reasonable; (4) other
| Basis for Approval of Investment Advisory Contracts | 121 |
Table of Contents
Russell Investment Company
Basis for Approval of Investment Advisory Contracts, continued — (Unaudited)
benefits and fees received by RIMCo or its affiliates from the Funds were not excessive; and (5) RIMCo’s profitability with respect to the Fund was not excessive in light of the nature, scope and overall quality of the investment management and other services provided by RIMCo.
The Board further concluded that, under the circumstances, the performance of each of the Funds was consistent with continuation of the RIMCo Agreement, although the Board regarded the performance of the Non-U.S. Fund and the Aggressive Equity Fund relative to their respective Comparable Funds as disappointing. The Board, in assessing the Funds’ performance, focused upon each Fund’s performance for the 1-, 3- and 5-year periods ended December 31, 2009 as most relevant.
In evaluating the performance of the Funds generally relative to their Comparable Funds, the Board, in addition to the factors described above, also considered RIMCo’s advice that many of the Funds’ Comparable Funds do not “equitize” their cash (i.e., cash awaiting investment or disbursement to satisfy redemptions or other fund obligations) and may hold large positions uninvested in their investment portfolios. By contrast, the Funds generally follow a strategy of equitizing their cash and fully investing their assets in pursuit of their investment objectives (the Funds’ strategy of equitizing cash and fully investing their assets is hereinafter referred to as their “full investment strategy”). In support of the Funds’ full investment strategy, RIMCo advised the Board of its belief that investors manage their own cash positions based upon their personal investment goals, strategies and risk tolerances and generally expect Fund assets to be fully invested. RIMCo noted that the Funds’ full investment strategy generally will detract from relative performance in a declining market, such as 2008, but may enhance the Funds’ relative performance in a rising market, such as 2009.
With respect to the Non-US Fund, the Third-Party Information showed that the Fund’s performance was ranked in the fourth quintile of its Performance Universe for each of the 1-, 3- and 5-year periods ended December 31, 2009. The Trustees considered management’s explanation of the Fund’s relative underperformance. According to RIMCo, the financial crisis that unfolded during 2008, along with certain portfolio positioning decisions by the Money Managers for the Fund, detracted from performance in both 2008 and 2009. During 2009, three of the Fund’s four Money Managers were replaced. RIMCo noted that the recent changes in the Fund’s Money Manager team made meaningful performance comparisons with its Comparable Funds difficult.
With respect to the Aggressive Equity Fund, the Third-Party Information showed that the Fund’s performance was ranked in the fifth and fourth quintiles of its Performance Universe for the 3- and 5-year periods ended December 31, 2009, respectively, but that its performance for the 1-year period was ranked in the second quintile. According to RIMCo, the financial crisis that unfolded throughout 2008 was detrimental to performance and the Fund was further affected by certain portfolio positioning decisions by certain Money Managers. In 2009, the fund’s quality bias was a disadvantage as speculative stocks outperformed. While Fund performance in 2009 was markedly better than 2008, RIMCo advised the Board that it intends to continue its focus on reviewing the Money Manager team to enhance the Fund’s structure, risk profile and excess return profile.
In evaluating performance, the Board considered each Fund’s absolute performance and performance relative to appropriate benchmarks and indices in addition to such Fund’s performance relative to its Comparable Funds. In assessing the Funds’ performance relative to their Comparable Funds or benchmarks or in absolute terms, the Board also considered RIMCo’s stated investment strategy of managing the Funds in a risk-aware manner and the extraordinary capital market conditions during 2008 and early 2009 that continue to impact the Funds’ relative performance for periods greater than one year.
After considering the foregoing and other relevant factors, the Board concluded that continuation of the RIMCo Agreement on its current terms and conditions would be in the best interests of each Fund and its respective shareholders and voted to approve the continuation of the RIMCo Agreement.
At the Agreement Evaluation Meeting, with respect to the evaluation of the terms of portfolio management contracts with Money Managers, the Board received and considered information from RIMCo reporting, among other things, for each Money Manager, the Money Manager’s performance over various periods; RIMCo’s assessment of the performance of each Money Manager; any significant business relationships between the Money Manager and RIMCo or Russell Financial Services, Inc., the Funds’ underwriter; and RIMCo’s recommendation to retain the Money Manager at the current fee rate, to retain the Money Manager at a reduced fee rate or to terminate the Money Manager. The Board received reports during the course of the year from the Funds’ Chief Compliance Officer regarding each Money Manager’s compliance program. RIMCo recommended that each Money Manager be retained at its current fee rate. RIMCo has advised the Board that it does not regard Money Manager profitability as relevant to its evaluation of the portfolio management contracts with Money Managers because the willingness of Money Managers to serve in such capacity depends upon arm’s-length negotiations with RIMCo; RIMCo is aware of the fees charged by Money Managers to other clients; and RIMCo believes that the fees agreed upon with Money Managers are reasonable in light of the anticipated quality of investment advisory services to be rendered. The Board accepted RIMCo’s explanation in light of the Board’s findings as to the reasonableness of the Advisory Fee paid by each Fund and the fact that each Money Manager’s fee is paid by RIMCo.
Based substantially upon RIMCo’s recommendations, together with the Agreement Evaluation Information and other information received from RIMCo in support of its recommendations at the Agreement Evaluation Meeting, the Board concluded that the fees paid to the Money Managers of each Fund are reasonable in light of the quality of the investment advisory services provided and that
| 122 | Basis for Approval of Investment Advisory Contracts |
Table of Contents
Russell Investment Company
Basis for Approval of Investment Advisory Contracts, continued — (Unaudited)
continuation of the portfolio management contract with each Money Manager of each Fund would be in the best interests of the Fund and its shareholders.
In their deliberations, the Trustees did not identify any particular information as to the RIMCo Agreement or, other than RIMCo’s recommendation, the portfolio management contract with any Money Manager that was all-important or controlling and each Trustee attributed different weights to the various factors considered. The Trustees evaluated all information available to them on a Fund-by-Fund basis and their determinations were made in respect of each Fund.
Subsequently, the Board of Trustees received a proposal from RIMCo at a meeting held on May 24, 2010, to a effect money manager change for the Real Estate Securities Fund; In the case of such proposed change, the Trustees approved the terms of the proposed portfolio management contract based substantially upon RIMCo’s recommendation to hire the Money Manager at the proposed fee rate; any significant business relationships between the Money Manager and RIMCo or Russell Financial Services, Inc. the Fund’s underwriter; RIMCo’s explanation as to the lack of relevance of profitability to the evaluation of portfolio management contracts with money managers because the willingness of Money Managers to serve in such capacity depends upon arm’s-length negotiations with RIMCo; RIMCo’s awareness of the fees charged by the Money Manager to other clients; and RIMCo’s belief that the proposed investment advisory fees would be reasonable in light of the anticipated quality of investment advisory services to be rendered. The Trustees also considered their findings at their April 20, 2010 meeting as to the reasonableness of the aggregate investment advisory fees paid by the Fund, and the fact that the aggregate investment advisory fees paid by the Fund would not increase as a result of the implementation of the proposed money manager change because the money managers’ investment advisory fee is paid by RIMCo.
| Basis for Approval of Investment Advisory Contracts | 123 |
Table of Contents
Russell Investment Funds
Shareholder Requests for Additional Information — December 31, 2010 (Unaudited)
A complete unaudited schedule of investments is made available generally no later than 60 days after the end of the first and third quarters of each year. These reports are available (i) free of charge, upon request, by calling the Fund at (800) 787-7354, (ii) on the Securities and Exchange Commission’s website at www.sec.gov, and (iii) at the Securities and Exchange Commission’s public reference room.
The Board has delegated to RIMCo, as RIF’s investment adviser, the primary responsibility for monitoring, evaluating and voting proxies solicited by or with respect to issuers of securities in which assets of the Funds may be invested. RIMCo has established a proxy voting committee (“Committee”) and has adopted written proxy voting policies and procedures (“P&P”) and proxy voting guidelines (“Guidelines”). The Funds maintain a Portfolio Holdings Disclosure Policy that governs the timing and circumstances of disclosure to shareholders and third parties of information regarding the portfolio investments held by the Fund. A description of the P&P, Guidelines, Portfolio Holdings Disclosure Policy and additional information about Fund Trustees are contained in the Funds’ Statement of Additional Information (“SAI”). The SAI is available (i) free of charge, upon request, by calling the Funds at (800) 787-7354, and (ii) on the Securities and Exchange Commission’s website at www.sec.gov.
If possible, depending on contract owner registration and address information, and unless you have otherwise opted out, only one copy of the RIF prospectus and each annual and semi-annual report will be sent to contract owners at the same address. If you would like to receive a separate copy of these documents, please contact your Insurance Company. If you currently receive multiple copies of the prospectus, annual report and semi-annual report and would like to request to receive a single copy of these documents in the future, please call your insurance company.
Some insurance companies may offer electronic delivery of the Funds’ prospectus and annual and semiannual reports. Please contact your insurance company for further details.
| 124 | Shareholder Requests for Additional Information |
Table of Contents
Russell Investment Funds
Disclosure of Information about Fund Trustees and Officers — December 31, 2010 (Unaudited)
The following tables provide information for each officer and Trustee of the Russell Fund Complex. The Russell Fund Complex consists of RIC, which has 41 funds, and RIF, which has nine funds. Each of the Trustees is a Trustee of both RIC and RIF. The first table provides information for the interested Trustee. The second table provides information for the independent Trustees. The third table provides information for the Trustees emeritus. The fourth table provides information for the officers.
| Name, Age, Address | Position(s) Held with Fund and Length of Time Served | Term of Office* | Principal Occupation(s) During the Past 5 Years | No. of Portfolios in Russell Fund Complex Overseen by Trustee | Other Directorships Held by Trustee | |||||||
INTERESTED TRUSTEE | ||||||||||||
# Sandra Cavanaugh
1301 Second Avenue | President and Chief Executive Officer since 2010
Trustee since 2010 | Appointed until successor is duly elected and qualified
Until successor is chosen and qualified by Trustees | • President and CEO RIC and RIF • Chairman of the Board, President and CEO, Russell Financial Services, Inc. • Chairman of the Board, President and CEO, Russell Fund Services Company (“RFSC”) • Chairman of the Board and President, Russell Insurance Agency, Inc. (insurance agency (“RIA”)) • May 2009 to December 2009, Executive Vice President, Retail Channel, SunTrust Bank • 2007 to January 2009, Senior Vice President, National Sales — Retail Distribution, JPMorgan Chase/Washington Mutual, Inc. • 1997 to 2007, President — WM Funds Distributor & Shareholder Services/WM Financial Services | 50 | None | |||||||
| # | Ms. Cavanaugh is also an officer and/or director of one or more affiliates of RIC and RIF and is therefore an Interested Trustee. |
| * | Each Trustee is subject to mandatory retirement at age 72. |
| Disclosure of Information about Fund Trustees and Officers | 125 |
Table of Contents
Russell Investment Funds
Disclosure of Information about Fund Trustees and Officers, continued — December 31, 2010 (Unaudited)
| Name, Age, Address | Position(s) Held with Fund and Length of Time Served | Term of Office* | Principal Occupation(s) During the Past 5 Years | No. of Portfolios in Russell Fund Complex Overseen by Trustee | Other Directorships Held by Trustee | |||||||
INDEPENDENT TRUSTEES | ||||||||||||
Thaddas L. Alston Born April 7, 1945
1301 Second Avenue Seattle, Washington 98101 | Trustee since 2006
Chairman of the Investment Committee since 2010 | Appointed until successor is duly elected and qualified Appointed until successor is duly elected and qualified | • Senior Vice President, Larco Investments, Ltd. (real estate firm) | 50 | None | |||||||
Kristianne Blake, Born January 22, 1954
1301 Second Avenue Seattle, Washington 98101 | Trustee since 2000
Chairman since 2005 | Appointed until successor is duly elected and qualified
Annual | • Director and Chairman of the Audit Committee, Avista Corp. • Trustee and Chairman of the Operations Committee, Principal Investor Funds and Principal Variable Contracts Funds • Regent, University of Washington • President, Kristianne Gates Blake, P.S. (accounting services) • February 2002 to June 2005, Chairman of the Audit Committee, RIC and RIF • Trustee and Chairman of the Operations and Distribution Committee, WM Group of Funds, 1999–2006 | 50 | • Director, Avista Corp (electric utilities) • Trustee, Principal Investor Funds (investment company); • Trustee, Principal Variable Contracts Funds (investment company) | |||||||
Daniel P. Connealy Born June 6, 1946
1301 Second Avenue Seattle, Washington 98101 | Trustee since 2003
Chairman of the Audit Committee since 2005 | Appointed until successor is duly elected and qualified Appointed until successor is duly elected and qualified | • June 2004 to present, Senior Vice President and Chief Financial Officer, Waddell & Reed Financial, Inc. | 50 | None | |||||||
Jonathan Fine, Born July 8, 1954
1301 Second Avenue Seattle, Washington 98101 | Trustee since 2004 | Appointed until successor is duly elected and qualified | • President and Chief Executive Officer, United Way of King County, WA | 50 | None | |||||||
Raymond P. Tennison, Jr. Born December 21, 1955
1301 Second Avenue Seattle, Washington 98101 | Trustee since 2000
Chairman of the Nominating and Governance Committee since 2007 | Appointed until successor is duly elected and qualified Appointed until successor is duly elected and qualified | • Vice Chairman, Simpson Investment Company • Until April 2009, President, Simpson Investment Company and several additional subsidiary companies, including Simpson Timber Company, Simpson Paper Company and Simpson Tacoma Kraft Company | 50 | None | |||||||
| 126 | Disclosure of Information about Fund Trustees and Officers |
Table of Contents
Russell Investment Funds
Disclosure of Information about Fund Trustees and Officers, continued — December 31, 2010 (Unaudited)
| Name, Age, Address | Position(s) Held with Fund and Length of Time Served | Term of Office* | Principal Occupation(s) During the Past 5 Years | No. of Portfolios in Russell Fund Complex Overseen by Trustee | Other Directorships Held by Trustee | |||||||
INDEPENDENT TRUSTEES (continued) | ||||||||||||
Jack R. Thompson, Born March 21, 1949
1301 Second Avenue Seattle, Washington 98101 | Trustee since 2005 | Appointed until successor is duly elected and qualified | • September 2003 to September 2009, Independent Board Chair and Chairman of the Audit Committee, Sparx Asia Funds • September 2007 to present, Director, Board Chairman and Chairman of the Audit Committee, LifeVantage Corporation (health products company) | 50 | • Director, Board Chairman and Chairman of the Audit Committee, LifeVantage Corporation (health products company) | |||||||
Julie W. Weston, Born October 2, 1943
1301 Second Avenue Seattle, Washington 98101 | Trustee since 2002 | Appointed until successor is duly elected and qualified Appointed until successor is duly elected and qualified | Retired | 50 | None | |||||||
| * | Each Trustee is subject to mandatory retirement at age 72. |
| Disclosure of Information about Fund Trustees and Officers | 127 |
Table of Contents
Russell Investment Funds
Disclosure of Information about Fund Trustees and Officers, continued — December 31, 2010 (Unaudited)
| Name, Age, Address | Position(s) Held with Fund and Length of Time Served | Term of Office | Principal Occupation(s) During the Past 5 Years | No. of Portfolios in Russell Fund Complex Overseen by Trustee | Other Directorships Held by Trustee | |||||||
TRUSTEES EMERITUS | ||||||||||||
* George F. Russell, Jr., Born July 3, 1932
1301 Second Avenue Seattle, Washington 98101 | Trustee Emeritus and Chairman Emeritus since 1999 | Until resignation or removal | • Director Emeritus, Frank Russell Company (investment consultant to institutional investors (“FRC”)) and RIMCo • Chairman Emeritus, RIC and RIF; Russell Implementation Services Inc. (broker-dealer and investment adviser (“RIS”)); Russell 20-20 Association (non-profit corporation); and Russell Trust Company (non-depository trust company (“RTC”)) • Chairman, Sunshine Management Services, LLC (investment adviser) | 50 | None | |||||||
Paul E. Anderson, Born October 15, 1931
1301 Second Avenue Seattle, Washington 98101 | Trustee Emeritus since 2007 | Five year term | • President, Anderson Management Group LLC (private investments consulting) • Trustee, RIC and RIF until 2006 • February 2002 to June 2005, Lead Trustee, RIC and RIF • Chairman of the Nominating and Governance Committee, 2006 | 50 | None | |||||||
Lee C. Gingrich, Born October 6, 1930
1301 Second Avenue Seattle, Washington 98101 | Trustee Emeritus since 2006 | Five year term | • Retired since 1995 • Trustee of RIC and RIF until 2005 • Chairman of the Nominating and Governance Committee 2001–2005 | 50 | None | |||||||
| * | Mr. Russell is also a director emeritus of one or more affiliates of RIC and RIF. |
| 128 | Disclosure of Information about Fund Trustees and Officers |
Table of Contents
Russell Investment Funds
Disclosure of Information about Fund Trustees and Officers, continued — December 31, 2010 (Unaudited)
| Name, Age, Address | Position(s) Held with Fund and Length of Time Served | Term of Office | Principal Occupation(s) During the Past 5 Years | |||
OFFICERS | ||||||
Cheryl Wichers Born December 16, 1966
1301 Second Avenue Seattle, Washington 98101 | Chief Compliance Officer since 2005 | Until removed by Independent Trustees | • Chief Compliance Officer, RIC • Chief Compliance Officer, RIF • Chief Compliance Officer, RIMCo • Chief Compliance Officer, RFSC • April 2002–May 2005, Manager, Global Regulatory Policy | |||
Sandra Cavanaugh Born May 10, 1954
1301 Second Avenue Seattle, Washington 98101 | President and Chief Executive Officer since 2010
| Appointed until successor is duly elected and qualified
| • President and CEO, RIC and RIF • Chairman of the Board, President and CEO, Russell Financial Services, Inc. • Chairman of the Board, President and CEO, RFSC • Chairman of the Board and President, Russell Insurance Agency, Inc. (insurance agency (“RIA”)) • May 2009 to December 2009, Executive Vice President, Retail Channel, SunTrust Bank • 2007 to January 2009, Senior Vice President, National Sales — Retail Distribution, JPMorgan Chase/Washington Mutual, Inc. • 1997 to 2007, President — WM Funds Distributor & Shareholder Services/WM Financial Services | |||
Mark E. Swanson, Born November 26, 1963
1301 Second Avenue Seattle, Washington 98101 | Treasurer and Chief Accounting Officer, Chief Financial Officer since 1998 | Until successor is chosen and qualified by Trustees | • Treasurer, Chief Accounting Officer and CFO, RIC and RIF • Director, Funds Administration, RIMCo, RFSC, RTC and Russell Financial Services, Inc. • Treasurer and Principal Accounting Officer, SSgA Funds | |||
Peter Gunning, Born February 22, 1967
1301 Second Avenue Seattle, Washington 98101 | Chief Investment Officer since 2008 | Until removed by Trustees | • Chief Investment Officer, RIC and RIF • Director, RIMCo and FRC • 1996 to 2008 Chief Investment Officer, Russell, Asia Pacific | |||
Mary Beth Rhoden Born April 25, 1969
1301 Second Avenue Seattle, Washington 98101 | Secretary since 2010 | Until successor is chosen and qualified by Trustees | • 1999 to 2010 Assistant Secretary, RIC and RIF • Associate General Counsel, FRC • Secretary, RIMCo, RFSC and Russell Financial Services, Inc. • Secretary and Chief Legal Counsel, RIC and RIF |
| Disclosure of Information about Fund Trustees and Officers | 129 |
Table of Contents
909 A Street, Tacoma, Washington 98402
(800) 787-7354
Russell Investment Funds
1301 Second Avenue, Seattle, Washington 98101
(800) 787-7354
Interested Trustee
Sandra Cavanaugh
Independent Trustees
Thaddas L. Alston
Kristianne Blake
Daniel P. Connealy
Jonathan Fine
Raymond P. Tennison, Jr.
Jack R. Thompson
Julie W. Weston
Trustees Emeritus
George F. Russell, Jr.
Paul E. Anderson
Lee C. Gingrich
Officers
Sandra Cavanaugh, President and Chief Executive Officer
Cheryl Wichers, Chief Compliance Officer
Peter Gunning, Chief Investment Officer
Mark E. Swanson, Treasurer and Chief Accounting Officer
Mary Beth Rhoden, Secretary
Adviser
Russell Investment Management Company
1301 Second Avenue
Seattle, Washington 98101
Administrator and Transfer and Dividend Disbursing Agent
Russell Fund Services Company
1301 Second Avenue
Seattle, Washington 98101
Custodian
State Street Bank and Trust Company
Josiah Quincy Building
200 Newport Avenue
North Quincy, MA 02171
Office of Shareholder Inquiries
1301 Second Avenue
Seattle, Washington 98101
(800) 787-7354
Legal Counsel
Dechert LLP
200 Clarendon Street, 27th Floor
Boston, MA 02116-5021
Distributor
Russell Financial Services, Inc.
1301 Second Avenue
Seattle, Washington 98101
Independent Registered Public Accounting Firm
PricewaterhouseCoopers LLP
1420 5th Avenue
Suite 1900
Seattle, WA 98101
Money Managers as of December 31, 2010
Multi-Style Equity Fund
BlackRock Capital Management, Inc., New York, NY
Columbus Circle Investors, Stamford, CT
DePrince, Race & Zollo, Inc., Winter Park, FL
First Eagle Investment Management, LLC, New York, NY
Institutional Capital LLC, Chicago, IL
Jacobs Levy Equity Management, Inc., Florham Park, NJ
Montag & Caldwell, LLC, Atlanta, GA
Suffolk Capital Management, LLC, New York, NY
Aggressive Equity Fund
ClariVest Asset Management LLC, San Diego, CA
DePrince, Race & Zollo, Inc., Winter Park, FL
Jacobs Levy Equity Management, Inc., Florham Park, NJ
Ranger Investment Management, L.P., Dallas, TX
Signia Capital Management, LLC, Spokane, WA
Tygh Capital Management, Inc., Portland, OR
Non-U.S. Fund
Barrow, Hanley, Mewhinney & Strauss, LLC, Dallas, TX
Marsico Capital Management, LLC, Denver, CO
MFS Institutional Advisors, Inc., Boston, MA
Pzena Investment Management, LLC, New York, NY
Core Bond Fund
Goldman Sachs Asset Management, L.P., New York, NY
Metropolitan West Asset Management, LLC, Los Angeles, CA
Pacific Investment Management Company LLC, Newport Beach, CA
Real Estate Securities Fund
AEW Capital Management, L.P., Boston, MA
Cohen & Steers Capital Management, Inc., New York, NY
INVESCO Advisers, Inc. which acts as a money manager to the Fund through its INVESCO Real Estate Division, Dallas, TX
This report is prepared from the books and records of the Funds and is submitted for the general information of shareholders and is not authorized for distribution to prospective investors unless accompanied or preceded by an effective Prospectus. Nothing herein contained is to be considered an offer of sale or a solicitation of an offer to buy shares of Russell Investment Funds. Such offering is made only by Prospectus, which includes details as to offering price and other material information.
| 130 | Adviser, Money Managers and Service Providers |
Table of Contents
| Russell Investment Funds | 1301 Second Avenue | 800-787-7354 | ||
| Seattle, Washington 98101 | Fax: 206-505-3495 | |||
| www.russell.com |


36-08-023
Table of Contents

2010 ANNUAL REPORT
Russell Investment Funds
LifePoints® Funds Variable Target Portfolio Series
DECEMBER 31, 2010
FUND
Moderate Strategy Fund
Balanced Strategy Fund
Growth Strategy Fund
Equity Growth Strategy Fund

Table of Contents
Russell Investment Funds
Russell Investment Funds is a series investment company with nine different investment portfolios referred to as Funds. These financial statements report on four of these Funds.
Table of Contents
Russell Investment Funds
LifePoints® Funds
Variable Target Portfolio Series
Annual Report
December 31, 2010
Table of Contents
Russell Investment Funds - LifePoints® Funds Variable Target Portfolio Series
Copyright© Russell Investments 2011. All rights reserved.
Russell Investments is a Washington, USA corporation, which operates through subsidiaries worldwide and is a subsidiary of The Northwestern Mutual Life Insurance Company.
Fund objectives, risks, charges and expenses should be carefully considered before investing. A prospectus containing this and other important information must precede or accompany this material. Please read the prospectus carefully before investing.
Securities products and services offered through Russell Financial Services, Inc. a member of FINRA and part of Russell Investments.
Indices and benchmarks are unmanaged and cannot be invested in directly. Returns represent past performance, are not a guarantee of future performance, and are not indicative of any specific investment. Index return information is provided by vendors and although deemed reliable, is not guaranteed by Russell Investments or its affiliates.
Russell Investments is the owner of the trademarks, service marks, and copyrights related to its respective indexes.
Performance quoted represents past performance and does not guarantee future results. The investment return and principal value of an investment will fluctuate so that shares, when redeemed, may be worth more or less than their original cost. Current performance may be lower or higher than the performance data quoted.
Table of Contents
I am pleased to share with you the results from the Russell Investment Funds’ 2010 Annual Report. It provides portfolio management discussions and fund-specific insights regarding fund performance for the fiscal year ending December 31, 2010.
Russell Investments’ mission is plain and simple — to improve financial security for people. We work to achieve this goal by delivering disciplined investment strategies, objective research and industry-leading service. Despite the difficult economic times and volatile investment markets, we will never lose sight of this primary mission.
Looking back at 2010, it has been a year of progress and challenges. Investors are still wrestling with the aftershocks of market disruptions. The broad equity market, represented by the Russell Global Index, is up more than 9% year-to-date at the writing of this letter in December. But employment numbers in the U.S. are still a cause for concern, as are the debt challenges of several European countries. We believe the experiences of 2010 continue to demonstrate the value of diversification and proactive investment management.
Now more than ever, we believe investors are best served by remaining focused on long-term investing using well-diversified, asset allocated portfolios. We believe it is equally important for investors to continue to talk with their financial advisors to ensure their portfolios remain aligned with their goals. Working with a trusted advisor is the best way to maintain this focus.
The Russell Investments team has decades of experience managing people’s investments through all kinds of market cycles. We believe monitoring investment managers continuously, and maintaining a disciplined approach to portfolio management and implementation is the best way to achieve long-term goals.
On behalf of the Russell Investments team, thank you for your continued support.
Best regards,

Sandra Cavanaugh
CEO, Americas Private Client Services
Russell Investment Management Company
| To Our Shareholders | 3 |
Table of Contents
Market Summary as of December 31, 2010 (Unaudited)
U.S. Equity Markets
For the fiscal year ended December 31, 2010, the U.S. equity market experienced high levels of volatility, but less than in the one year period ended December 31, 2009. While the markets experienced numerous reversals during the period, investors became increasingly, though cautiously, optimistic regarding the sustainability of the global economic recovery. Strong corporate earnings growth translated into strong positive returns for the major market indexes. The broad market Russell 3000® Index rose 16.93% over the period as global growth recovered and the U.S. economy appeared to be stabilizing.
The economy continued to grow over the fiscal year, but at a slow pace. Relative to past recoveries from deep recessions, economic growth as measured by gross domestic product (GDP) failed to rebound as quickly or with the strength necessary to increase employment and provide assurances that the recessionary period was truly over. Unemployment remained high, averaging approximately 9.5% over the period while wage growth remained stagnant. The national savings rate increased from a modestly negative percentage to a more substantial 6%. While this is a longer-term positive factor for the U.S. economy as it improves the financial health of consumers, the short-term result has been to lower consumer spending. Given the key role that consumer spending continues to play in driving U.S. GDP, expectations for a strong economic recovery moderated as the fiscal year progressed and investors began to expect a more slowly paced increase in economic activity going forward. Expectations were further moderated by a persistently weak housing market, where sales declined following the expiration of the first time home buyers tax credit in the spring.
In response to the slow pace of the economic recovery, and its jobless nature, the U.S. government stepped up its efforts to stimulate economic growth. Unemployment benefits were extended to support consumer demand, while stimulus spending injected capital into the economy. Toward the latter part of the fiscal year, the Federal Reserve announced its intention to expand its quantitative easing efforts beyond the purchase of mortgage backed securities and into direct purchases of U.S. government debt. The market rose as a result due to expectations that this direct injection of money into the economy would cause interest rates to decline in the intermediate-term, and inflationary expectations to rise in the longer-term. Investors took comfort in the Federal Reserve taking such actions to help provide support for the economy and guide it towards a sustainable recovery.
Over the course of the period, global economic growth rebounded on the strength of emerging markets demand and growth. This has been a key to improving investor sentiment and has driven the relative outperformance of some of the more export-oriented sectors including producer durables, materials and processing, and technology. The consumer discretionary sector, which was the best performing sector over the one year period, benefited from both international demand and a modest domestic recovery. Increased global wealth has driven up demand for aspirational goods and services, with leisure travel, lodging and gaming all benefiting.
Domestically, retailers with strong market share and the ability to increase profit margins performed well. The utilities sector outperformed as well. Demand for companies with a lower degree of perceived downside risk increased, as did the desire for steady sources of income. On the other end of the return spectrum, the financial services sector underperformed relative to the benchmark. Increasing financial regulations and an uncertain business landscape made investors wary of investing in banks, brokerage companies and other financial institutions. Concerns over additional losses related to the housing market and uncertainty over the health of loan portfolios also concerned investors. Health care stocks lagged as well, due largely to the uncertainty associated with the passage of new health care legislation and its impact on corporate profitability. Energy stocks underperformed due to concerns over weaker demand growth for gas and oil in a sluggish economic recovery. Potential fallout from the Gulf Coast oil spill also created uncertainty around deep water exploration and drilling firms. Lastly, the consumer staples sector lagged despite strong demand from overseas markets, as investors gravitated away from these companies’ higher relative valuations and the potential margin pressure they could face if commodity prices rise.
Overall, the period was marked by a high degree of correlation among stock price movements across large segments of the benchmark. As such, benchmark and market returns were driven by the performance of the higher and lower ends of
| 4 | Market Summary |
Table of Contents
Russell Investment Funds
the risk spectrum where there was more stock price return differentiation. This was largely a result of significant oscillations in investor sentiment driven by macro-economic news and events. This resulted in a “risk on/risk off” phenomenon. Positive economic and company specific news resulted in a “risk on” scenario where companies with more economic sensitivity outperformed the benchmark when “risk” was in favor. In contrast, negative news on the economy, employment, housing, and the European sovereign debt situation resulted in a highly risk-averse (“risk off”) environment in which investors sought safe haven or more defensively oriented investments. Throughout the fiscal year it was a struggle between these two forces, as investors were heavily swayed more by macro-economic news than by company-specific data.
The high degree of uncertainty in the market regarding regulatory, fiscal and monetary policy resulted in a challenging active management environment in U.S. equities. Value-oriented managers had a particularly difficult time due to their almost perennial underweight to the strongly performing utilities sector, while growth-oriented managers fared better. The relative outperformance of consumer staples and parts of the health care sector in the more defensive periods decreased returns for value managers. Additionally, commodity-oriented stocks performed relatively well as investors bet on a sustainable global economic recovery. In contrast, value managers were overweight in technology and consumer discretionary sector companies that they believed had relatively higher and more sustainable growth characteristics. The more cyclical consumer and technology companies as well as those focusing on lower-end domestic consumer spending and targeting international growth performed relatively well.
Growth managers fared relatively well as investors favored growth companies, pushing up the price of stocks associated with international and emerging markets. This applied to technology and consumer product companies as well as agricultural, commodities, and industrial companies producing goods and basic resources needed to satiate emerging market demand. The stocks of the fastest growing companies outperformed the stocks of companies whose earnings grew at a slower rate. This is based on return data categorizing stocks according to each company’s 5-year historical EPS Growth, 1-Year Sales Growth, and IBES Long-Term Forecasted Growth.
Driven by expectations for a moderate global economic recovery, stock prices in the U.S. rose strongly across the investment style as well as the market capitalization spectra.
For the period, the Russell 1000® Growth Index returned 16.7% and the Russell 1000® Value Index returned 15.51%, while the Russell 2000® Growth Index returned 29.1% and the Russell 2000® Value Index returned 24.5%. Small capitalization stocks outperformed large capitalization stocks for the one year period as the Russell 2000® Index returned 26.9% and the Russell 1000® Index returned 16.1% for the period. Mid capitalization stocks once again performed well over the period, while micro capitalization stocks performed best as the Russell Midcap® Index returned 25.47% and the Russell Microcap® Index returned 28.9% for the fiscal year.
The Lipper® Small Cap Value Funds Average outperformed the Russell 2000® Value Index by 1.25%, the Lipper® Small Cap Core Funds Average underperformed the Russell 2000® Index by 1.12% and the Lipper® Small Cap Growth Funds Average underperformed the Russell 2000® Growth Index by 2.05%. The Lipper® Large Cap Growth Funds Average underperformed the Russell 1000® Growth Index by 1.58%, the Lipper® Large Cap Core Funds Average underperformed the Russell 1000® Index by 3.94%, and the Lipper® Large Cap Value Funds Average underperformed the Russell 1000® Value Index by 1.81%.
Non-U.S. Developed Equity Markets
2010 was a rollercoaster year for investors. The Non-U.S. developed equity markets, as measured by the MSCI EAFE Index, rose 7.75% during the year, with most of the Index’s gains coming in the second half of the year. Fears of the European sovereign debt crisis igniting another global economic downturn subsided as a gradual recovery became more likely. Markets fell sharply at the end of April and remained extremely volatile until September, when riskier stocks began to improve as investors gained optimism. On a month-by-month basis, market leadership was inconsistent, but trends became more apparent when the whole of 2010 was taken into account.
The risk factor that was most rewarded was high beta, followed by high price-volatility and high price-momentum. All three factors are a reflection of the market environment that benefited riskier stocks. The prices of high beta stocks tend to rise faster than the broad market in positive return environments, but also fall faster when markets are negative. The price volatility factor represents stocks whose prices tend to change more than the average stock, meaning performance gains and losses are amplified. This is similar to market beta, except that there isn’t necessarily a relationship between the performance of the market and its underlying stocks. Stocks with high-price momentum performed better than the market during the 12 months prior. Their outperformance signals the fact that stocks that did well in 2009 continued to
| Market Summary | 5 |
Table of Contents
Russell Investment Funds
outperform in 2010. Momentum made a comeback in 2010, as many of the stocks that rose in 2009 continued to lead the market. Stocks that are typically considered higher-quality, those with high profitability or return on equity, underperformed. However, financial leverage was the worst performing market factor. Financial leverage is a characteristic that investors can use to determine balance sheet quality. Financial leverage is the degree to which a company is utilizing borrowed money (debt) to finance its operations. Financial leverage can boost profits in certain periods, but when debt repayment is a concern, as it was in 2010, companies with a high-level of financial leverage, can perform poorly. Growth stocks significantly outperformed value stocks, with the MSCI EAFE Growth Index returning 12.25% and outperforming the MSCI EAFE Value Index by 9.0%.
Small cap stocks outperformed large cap stocks by a wide margin, as measured by the MSCI EAFE Small Cap Index and the MSCI EAFE Index. U.S. stocks, as measured by the Russell 1000® Index, outperformed developed non-U.S. stocks, as measured by the MSCI EAFE Index, by more than 8.35%, indicating that signs of economic recovery were more evident in the U.S. Extremely negative performance outcomes by the PIIGS countries (Portugal, Ireland, Italy, Greece and Spain), catalyzed by fears surrounding sovereign debt, weighed heavily on international markets. Greece and Spain were penalized most, with returns of -44.87% and -21.95%, respectively, as measured by the MSCI Greece Index and MSCI Spain Index. Both countries’ performance suffered due to uncertainty regarding their ability to service sovereign debt, but experienced some recovery toward the end of the year. Although markets tended to reward risk, stocks with severe debt issues lagged the market. Investors’ dislike for financial leverage impacted country-level returns as well. The weak performance from Greece and Spain confirm this sentiment. Japan as measured by MSCI Japan, out-performed the MSCI EAFE Index returning 15.44% for the year. Emerging markets companies continued to outpace developed markets with the strong return of 18.88%, as measured by the MSCI Emerging Markets Index. Argentina, Thailand, and Peru were the best performing emerging markets countries, all returning over 50% for the year, as measured by the MSCI Argentina Index, MSCI Thailand Index and MSCI Peru Index. China severely underperformed the broader MSCI Emerging Markets Index and the MSCI EAFE Index with a positive return of only 4.63%, as measured by the MSCI China Index , due to inflationary pressures and fears of economic overheating.
The industrials sector was the best performing of the ten sectors in the MSCI EAFE Index, with a return of 20.39%. The companies that make up the sector tend to be economically sensitive and thus performed well given the improving economic environment. Consumer discretionary stocks benefited from the upswing in consumer spending and the sector ended the year up 19.73%. The materials, technology and consumer staples sectors also out-performed the MSCI EAFE Index. Utilities and financials were the only two sectors with negative performance during the year, with returns of -4.88% and -1.62%, respectively, as measured by the MSCI EAFE Utilities and MSCI EAFE Financials Sector Indices . Consumer stocks were led by automobiles and retail. There remains a great deal of skepticism surrounding the health of commercial banks.
Emerging Markets
The MSCI Emerging Markets Index (“the Index”) was up 18.88% over the fiscal year ended December 31, 2010. In spite of persistent volatility, Emerging Markets finished ahead of Developed Markets which gained 11.76% over the year as measured by the MSCI Daily TR Net Developed Markets Index in U.S. dollar terms.
Emerging market gains during 2010 were largely driven by a strong recovery in the second half of the fiscal year as the global economic backdrop turned positive. The Index had a modest return of 2.40% during the first calendar quarter driven by concerns over the sustainability of economic recovery, resulting from moves to withdraw stimulus funding in the U.S. and China and by concerns about a growing debt crisis in Europe.
This was followed by a negative and challenging second quarter in which emerging market stocks, commodities and currencies fell sharply as investor appetite for risk diminished in favor of safer assets including gold — which reached a record high — and the U.S. dollar. The Index gave up 8.37%, led by heavy losses in May, when the Index endured its worst month since October 2008. The intensifying debt crisis in Europe; evidence of a slowdown in the U.S. and Chinese economies; a massive overhaul of the U.S. banking system and a crisis on the Korean peninsula all had a negative impact.
Emerging market stocks went on to rally sharply over the third quarter, notably in July and September, when the Index enjoyed its best monthly gain since July 2009. The Index gained 18.03% over the period, helped by the secular growth stories that prevailed in certain markets. Investors were also buoyed by news in July that the International Monetary Fund (“IMF”) had raised its global growth forecast and by second-quarter earnings releases from a number of the world’s biggest companies that were well in excess of expectations. Gains were reinforced by more upbeat news from Europe, where the results of the stress tests on banks were largely welcomed.
The positive trend continued in the fourth quarter, driven by further signs of a burgeoning recovery in the U.S., strong growth in China and by speculation that the second round of quantitative easing (i.e., a policy by which the Federal
| 6 | Market Summary |
Table of Contents
Russell Investment Funds
Reserve purchases U.S. treasuries with newly created central bank money) would help global growth accelerate. A very positive third quarter earnings season and central bank intervention in Europe also helped offset the negative impact of monetary tightening in China and concerns over the debt crisis in Western Europe.
Throughout, there was notable dispersion across country returns over the calendar year, with the smaller emerging market countries performing best. Thailand gained 55.71% as measured by the MSCI Daily TR Net Emerging Markets Thailand Index. In Latin America, key beneficiaries of the demand for raw materials and the increased risk appetite were strongest, including Peruvian stocks which gained 53.32% as measured by the MSCI Daily TR Net Emerging Markets Peru Index, Chilean stocks which increased 44.16% as measured by the MSCI Daily TR Net Emerging Markets Chile Index in U.S. dollar terms and Colombian stocks which gained 43.41% as measured by the MSCI Daily TR Net Emerging Markets Colombia Index in U.S. dollar terms.
From a regional standpoint, returns in Europe were generally weaker, reflected by the negative returns from Hungary which declined 9.58% as measured by the MSCI Daily TR Net Emerging Markets Hungary Index in U.S. dollar terms and the Czech Republic which fell 2.53% as measured by MSCI Daily TR Net Emerging Markets Czech Republic Index in U.S. dollar terms. The larger emerging market countries China and Brazil also stood out in that both had modest returns over the calendar year relative to others, gaining just 4.63% and 6.54%, respectively, as per the MSCI Daily TR Net Emerging Markets China Index in U.S. dollar terms and MSCI Daily TR Net Emerging Markets Brazil Index in U.S. dollar terms respectively. At the sector level, the consumer theme dominated returns with consumer staples stocks gaining 30.35% as measured by the MSCI Daily TR Net Emerging Markets Consumer Staples Index in U.S. dollar terms and consumer discretionary stocks gaining 31.40% as measured by the MSCI Daily TR Net Emerging Markets Consumer Discretionary Index in U.S. dollar terms. This was well ahead of the more defensive utilities sector which gained 8.10% as measured by the MSCI Daily TR Net Emerging Markets Utilities Index in U.S. dollar terms and energy which gained 9.91% as measured by the MSCI Daily TR Net Emerging Markets Energy Index in U.S. dollar terms over the calendar year.
Small capitalization stocks as measured by the MSCI Daily TR Net Emerging Markets Small Cap Index in U.S. dollar terms gained 27.17%, beating larger capitalization counterparts which rose 18.34% as measured by the MSCI Daily TR Net Emerging Markets Large Cap Index in U.S. dollar terms.
U.S./Global Fixed Income Markets
Over most of the fiscal year ended December 31, 2010, fixed income markets largely continued the global credit rally that started in the early part of 2009, which began with the announcement of government stimulus programs and the release of generally positive U.S. bank stress test results. Despite bouts of volatility brought on by concerns around European sovereign debt, the uncertainty of U.S. economic recovery, the Gulf Coast oil spill, and Federal Reserve market intervention, U.S. interest rates declined and broad bond market indices did well: The 2-year Treasury yield decreased 54 bps to 0.60% and the 10-year yield decreased 54 bps to 3.30%; the Barclays Capital U.S. Aggregate (investment grade) Bond Index, U.S. High Yield Bond Index and Emerging Market Bond Index returned 6.54%, 15.12% and 12.84%, respectively.
There was little market turmoil at the beginning of 2010. Investors anticipated that the U.S. economic recovery would soon stabilize and transition off of government stimulus support. As an example of this, at the end of March 2010, the U.S. Federal Reserve Bank (the Fed) completed its $1.25 trillion agency mortgage-backed security buying program without credit markets being materially disturbed.
By late April and early May, investors saw the return of volatility: The Greek and peripheral European sovereign debt crisis made investors anxious that credit events originating in one region could again spread to other parts of the world. At the same time, the Gulf Coast oil spill reminded investors that unexpected and seemingly random negative events could still pop up and roil financial markets. The U.S. Treasury yield curve reflected this anxiety, with the two-year Treasury yield dropping from 0.58% to 0.60%, and the ten-year Treasury yield dropping from 1.06% to 2.93%i, as investors ran to (and bid up the prices on) low-risk debt backstopped by the U.S. government. Simultaneously, the Fed again became concerned with the U.S. economy, and began to signal that it would hold the overnight target rate at its historically low range of 0.00% to 0.25% for an extended period (which it did through the end of the year). This effectively signaled to investors who had been expecting a rate increase by the end of 2010 to not look for one until well into 2011. Included in this message was that the Fed believed deflation was a greater near-term risk than inflation.
The housing market, which precipitated the financial crisis in the summer of 2007, continued to have an impact on the overall market throughout the year. Investors were concerned about the effectiveness of U.S. government programs to help borrowers refinance or modify their mortgages in an attempt to stem the rising tide of foreclosures. This problem was exacerbated in the latter part of the year with news that several large residential mortgage servicers were halting
| Market Summary | 7 |
Table of Contents
Russell Investment Funds
foreclosures due to inaccurate or incomplete paperwork, and lawsuits were filed that contended banks did not legally have the right to proceed with certain foreclosures. Despite these issues (which remained unresolved at year end), over the period both residential and commercial mortgage-backed securities performed well, both in terms of total return and relative returns, as compared to equivalent-duration U.S. Treasuries.
Despite the aforementioned bouts of volatility, it was the Fed’s announcement of more support in the form of another round of quantitative easing dubbed “QE2” (i.e., purchasing U.S. Treasuries with newly created central bank money) that caused the fixed income market to fluctuate and turn negative in the last two months of the year. The Fed had previously indicated the possibility of another round of monetary easing and the general expectation had been that QE2 would keep Treasury rates low and thus bode well for credit markets. However, investors focused on the inflationary and U.S. dollar-depressing effects of QE2, with many openly criticizing the $600 billion program. This caused Treasury yields to reverse course and start heading back up. During the first ten months of the year, the 2-year Treasury yield decreased 80 bps to 0.34% and the 10-year yield decreased 124 bps to 2.60%. Following the announcement of QE2, over November and December, 2-year and 10-year Treasury yields increased 26 bps and 69 bps, respectively. Thus it was the Fed’s effort to bolster the economy that caused Treasuries to return -2.6% in the fourth quarter of 2010, which in turn moved the U.S. Aggregate Bond Index to post its first negative quarterly total return in two years.
| i | April-June 2010 peak-to-trough changes |
| 8 | Market Summary |
Table of Contents
[This page intentionally left blank]
Table of Contents
Moderate Strategy Fund
Portfolio Management Discussion and Analysis — December 31, 2010 (Unaudited)
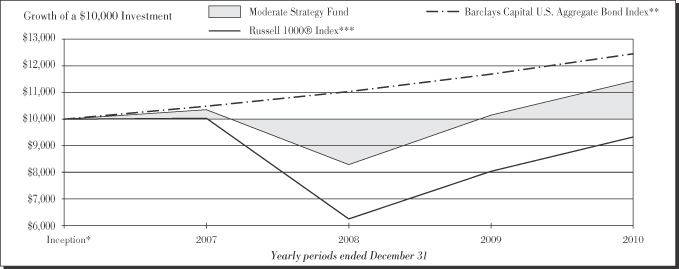
| Moderate Strategy Fund | ||||
| Total Return | ||||
1 Year | 12.62 | % | ||
Inception* | 3.70 | %§ | ||
| Barclays Capital U.S. Aggregate Bond Index ** | ||||
| Total Return | ||||
1 Year | 6.54 | % | ||
Inception* | 6.15 | %§ | ||
| Russell 1000® Index *** | ||||
| Total Return | ||||
1 Year | 16.10 | % | ||
Inception* | (1.87 | )%§ | ||
| 10 | Moderate Strategy Fund |
Table of Contents
Russell Investment Funds
Moderate Strategy Fund
Portfolio Management Discussion and Analysis — December 31, 2010 (Unaudited)
Portfolio Management Discussion and Analysis — December 31, 2010 (Unaudited)
The Fund is a fund of funds that invests in other Russell Investment Funds and Russell Investment Company mutual funds (the “Underlying Funds”). The Underlying Funds allocate most of their assets among multiple money managers. Russell Investment Management Company (“RIMCo”), as the Underlying Funds’ advisor, may change the allocation of the Underlying Funds’ assets among money managers at any time. An exemptive order from the Securities and Exchange Commission (“SEC”) permits RIMCo to engage or terminate a money manager in an Underlying Fund at any time, subject to approval by the Underlying Fund’s Board without a shareholder vote.
What is the Fund’s investment objective?
The Moderate Strategy Fund (“Fund”) seeks to provide high current income and moderate long-term capital appreciation.
How did the Fund perform relative to its benchmark for the fiscal year ended December 31, 2010?
For the fiscal year ended December 31, 2010, the Fund returned 12.62%. The Fund outperformed its benchmark, the Barclays Capital U.S. Aggregate Bond Index, which returned 6.54% during the same period.
For the fiscal year ended December 31, 2010, the Lipper® Mixed Asset Target Allocation Moderate Funds Average returned 11.18%. This average return serves as a peer comparison and is expressed net of operating expenses.
The Fund’s performance includes operating expenses, whereas index returns are unmanaged and do not include expenses of any kind. The Fund’s outperformance relative to its benchmark was due to the Fund’s exposure to both active fixed income management and to equity investments, particularly global investment mandates, which in the aggregate outperformed core fixed income.
How did the market conditions described in the Market Summary report affect the Fund’s performance?
The Fund is a fund of funds and its performance is based on Russell’s strategic asset allocations and the performance of the Underlying Funds in which the Fund invests.
As the economy began to recover from the recent financial crisis, investors’ appetite for risk returned. Underlying managers invested primarily in fixed income, U.S. large capitalization companies and developed non-U.S. equities were positioned to benefit from this environment relative to the Fund’s benchmark.
In general, riskier asset classes performed better than asset classes generally considered less risky. All of the Underlying Funds (which are designed to represent individual asset classes) outperformed the Fund’s benchmark. The Russell Commodity Strategies Fund, added as an Underlying Fund on
July 1, 2010, also outperformed the benchmark. Two of the Underlying Funds, the Russell Global Credit Strategies and Russell Global Infrastructure Funds, each added on October 1, 2010, had not been Underlying Funds long enough to meaningfully contribute to performance. The Fund’s exposure to core fixed income through its investment in the RIF Core Bond Fund contributed to relative outperformance. The RIF Core Bond Fund maintained its preference for overweight allocations to non-Treasury fixed income sectors, including securities that are not in the benchmark (e.g., high yield credit, non-agency mortgage-backed securities and emerging market debt). Exposure to U.S. small capitalization equities also added to the Fund’s relative outperformance through the RIF Aggressive Equity Fund.
How did the investment strategies and techniques employed by the Fund and the money managers of the Underlying Funds affect the Fund’s performance?
The Fund’s allocation to fixed income Underlying Funds during the fiscal year ranged from, 36% to 60% invested in the RIF Core Bond Fund; 0% to 20% invested in the Russell Investment Grade Bond Fund and 0% to 2% invested in the Russell Global Credit Strategies Fund (added as an Underlying Fund on October 1, 2010). The RIF Core Bond Fund’s underweight to U.S. Treasuries and overweight to non-Treasury securities generated returns in excess of the benchmark. In the aggregate, sector positions of the fixed income Underlying Funds varied throughout the fiscal year. Allocations to some of the relatively higher performing sectors of the fixed income markets, such as investment-grade financials, commercial mortgage-backed securities and credit card asset-backed securities, contributed positively to the Fund’s performance. Out-of-benchmark exposures to high yield financials and industrials in the RIF Core Bond Fund also contributed to the Fund’s outperformance.
Developed non-U.S. and global equity Underlying Funds (12% to 17% of the Fund’s assets), experienced high levels of volatility over the fiscal year and returned 11.42% and 14.96%, respectively. The resurgence of risk aversion in early 2010, stemming from the Greek sovereign debt crisis proved challenging for those Underlying Funds’ money managers with exposure to European financials. However, these same Underlying Funds recovered as the Greek crisis abated. In fact, the sell-off in Europe provided a unique opportunity for a number of the money managers to purchase what they considered to be well-managed, global companies which they believed were undervalued, but that also had the majority of their revenue originating from outside of Europe. These tactical purchases benefited Underlying Fund returns significantly over the course of the fiscal year.
The U.S. equity Underlying Funds (13% to 23% of the Fund’s assets during the fiscal year) were positioned more aggressively (e.g., greater volatility and more focus on emerging growth trends). The U.S. equity Underlying Funds’ benchmark-relative returns contributed positively to the Fund’s excess returns. Returns for U.S. equities, up 16.10% for the year, as measured
| Moderate Strategy Fund | 11 |
Table of Contents
Russell Investment Funds
Moderate Strategy Fund
Portfolio Management Discussion and Analysis — December 31, 2010 (Unaudited)
by the Russell 1000 Index, performed better in periods when investors were more confident in the sustainability of the global economic recovery, as was increasingly the perception towards year-end.
The Fund’s allocation to real asset Underlying Funds, during the fiscal year were 3% invested in the RIF Real Estate Securities Fund, 0% to 3% invested in the Russell Commodity Strategies Fund (added as an Underlying Fund on July 1, 2010), and 0% to 3.0% invested in the Russell Global Infrastructure Fund (added as an Underlying Fund on October 1, 2010). The Fund’s real estate holdings, represented by the RIF Real Estate Fund, returned 22.92% in the fiscal year, while the Russell Commodity Strategies Fund returned 15.39% following the Fund’s addition as an Underlying Fund. The Russell Global Infrastructure Fund returned 4.93% in the three months following its addition as an Underlying Fund.
The Russell Emerging Markets Fund (2% to 3% of the Fund’s assets during the fiscal year) returned 20.25%, resulting in a notable weighted excess return. After decreasing in the second quarter, the Russell Emerging Markets Fund’s performance recovered sharply, benefiting from exposure to the consumer sector and smaller emerging market countries such as the Philippines. An underweight position to Chinese financials also contributed positively to performance.
Describe any changes to the Fund’s structure or allocation to the Underlying Funds.
On March 1, 2010, the Fund reduced its exposure to U.S. equities by increasing its allocation to the Russell Global Equity Fund and by reducing allocations to both the RIF Multi-Style Equity and the Russell U.S. Quantitative Equity Funds. Also on March 1st, the Fund added the Russell Investment Grade Bond Fund as an Underlying Fund. On July 1, 2010, the Russell Commodity Strategies Fund was added as a new Underlying Fund. On October 1, 2010, the Fund added two new Underlying Funds, Russell Global Credit Strategies and Russell Global Infrastructure Funds.
The views expressed in this report reflect those of the portfolio managers only through the end of the fiscal year covered by the report. These views do not necessarily represent the views of RIMCo, or any other person in RIMCo or any other affiliated organization. These views are subject to change at any time based upon market conditions or other events, and RIMCo disclaims any responsibility to update the views contained herein. These views should not be relied on as investment advice and, because investment decisions for a Russell Investment Fund (“RIF”) or Russell Investment Company (“RIC”) Fund are based on numerous factors, should not be relied on as an indication of investment decisions of any RIF or RIC Fund.
| * | The Fund first issued shares on April 30, 2007. |
| ** | The Barclays Capital U.S. Aggregate Bond Index is an index, with income reinvested, generally representative of intermediate-term government bonds, investment-grade corporate debt securities and mortgage-backed securities. |
| *** | Russell 1000® Index includes the 1,000 largest companies in the Russell 3000® Index. The Russell 1000® Index represents the universe of stocks from which most active money managers typically select. The Russell 1000® Index return reflects adjustments from income dividends and capital gain distributions reinvested as of the ex-dividend dates. |
| § | Annualized. |
The performance shown in this section does not reflect any Insurance Company Separate Account or Policy Charges. Performance is historical and assumes reinvestment of all dividends and capital gains. Investment return and principal value will fluctuate so that an investor’s shares, when redeemed, may be worth more or less than when purchased. Past performance is not indicative of future results.
| 12 | Moderate Strategy Fund |
Table of Contents
Russell Investment Funds
Moderate Strategy Fund
Shareholder Expense Example — December 31, 2010 (Unaudited)
Fund Expenses
The following disclosure provides important information regarding each Fund’s Expense Example, which appears on each Fund’s individual page in this Annual Report. Please refer to this information when reviewing the Expense Example for a Fund.
Example
As a shareholder of the Fund, you incur two types of costs: (1) transaction costs, and (2) ongoing costs, including advisory fees and other Fund expenses. The Example is intended to help you understand your ongoing costs (in dollars) of investing in the Fund and to compare these costs with the ongoing costs of investing in other mutual funds. The Example is based on an investment of $1,000 invested at the beginning of the period and held for the entire period indicated, which for this Fund is from July 1, 2010 to December 31, 2010.
Actual Expenses
The information in the table under the heading “Actual Performance” provides information about actual account values and actual expenses. You may use the information in this column, together with the amount you invested, to estimate the expenses that you paid over the period. Simply divide your account value by $1,000 (for example, an $8,600 account value divided by $1,000 = 8.6), then multiply the result by the number in the first column in the row entitled “Expenses Paid During Period” to estimate the expenses you paid on your account during this period.
Hypothetical Example for Comparison Purposes
The information in the table under the heading “Hypothetical Performance (5% return before expenses)” provides information about hypothetical account values and hypothetical expenses based on the Fund’s actual expense ratio and an assumed rate of return of 5% per year before expenses, which is not the Fund’s actual return. The hypothetical account values and expenses may not be used to estimate the actual ending account balance or expenses you paid for the period. You may use this information to compare the ongoing costs of investing in the Fund and other funds. To do so, compare this 5% hypothetical example with the 5% hypothetical examples that appear in the shareholder reports of other funds.
Please note that the expenses shown in the table are meant to highlight your ongoing costs only and do not reflect any transactional costs. Therefore, the information under the heading “Hypothetical Performance (5% return before expenses)” is useful in comparing ongoing costs only, and will not help you determine the relative total costs of owning different funds. In addition, if these transactional costs were included, your costs would have been higher. The fee and expenses shown in this section do not reflect any Insurance Company Separate Account or Policy Charges.
| Actual Performance | Hypothetical Performance (5% return before expenses) | |||||||
Beginning Account Value July 1, 2010 | $ | 1,000.00 | $ | 1,000.00 | ||||
Ending Account Value December 31, 2010 | $ | 1,112.90 | $ | 1,024.70 | ||||
Expenses Paid During Period* | $ | 0.53 | $ | 0.51 | ||||
| * | Expenses are equal to the Fund’s annualized expense ratio of 0.10% (representing the six month period annualized), multiplied by the average account value over the period, multiplied by 184/365 (to reflect the one-half year period). May reflect amounts waived, reimbursed and/or other credits. Without any waivers, reimbursements and/or other credits, expenses would have been higher. |
| Moderate Strategy Fund | 13 |
Table of Contents
Russell Investment Funds
Moderate Strategy Fund
Schedule of Investments — December 31, 2010
Amounts in thousands (except share amounts)
| Shares | Market $ | |||||||
| Investments - 100.0% | ||||||||
Russell Investment Company (“RIC”) and other Russell Investment Funds (“RIF”) Series Mutual Funds | ||||||||
| Bonds - 57.9% | ||||||||
RIC Russell Global Credit Strategies Fund | 109,546 | 1,090 | ||||||
RIC Russell Investment Grade Bond Fund | 503,966 | 10,906 | ||||||
RIF Core Bond Fund | 1,867,551 | 19,628 | ||||||
| 31,624 | ||||||||
| Domestic Equities - 13.0% | ||||||||
RIC Russell U.S. Quantitative Equity Fund | 114,060 | 3,268 | ||||||
RIF Aggressive Equity Fund | 91,299 | 1,088 | ||||||
RIF Multi-Style Equity Fund | 200,531 | 2,723 | ||||||
| 7,079 | ||||||||
| International Equities - 20.0% | ||||||||
RIC Russell Emerging Markets Fund | 79,334 | 1,654 | ||||||
RIC Russell Global Equity Fund | 490,424 | 4,360 | ||||||
RIF Non-U.S. Fund | 480,693 | 4,908 | ||||||
| 10,922 | ||||||||
| Real Assets - 9.1% | ||||||||
RIC Russell Commodity Strategies Fund | 148,041 | 1,668 | ||||||
RIC Russell Global Infrastructure Fund | 158,286 | 1,637 | ||||||
RIF Real Estate Securities Fund | 118,543 | 1,650 | ||||||
| 4,955 | ||||||||
| Total Investments - 100.0% (identified cost $49,377) | 54,580 | |||||||
| Other Assets and Liabilities, Net - (0.0%) | (7 | ) | ||||||
| Net Assets - 100.0% | 54,573 | |||||||
See accompanying notes which are an integral part of the financial statements.
| 14 | Moderate Strategy Fund |
Table of Contents
[This page intentionally left blank]
Table of Contents
Balanced Strategy Fund
Portfolio Management Discussion and Analysis — December 31, 2010 (Unaudited)
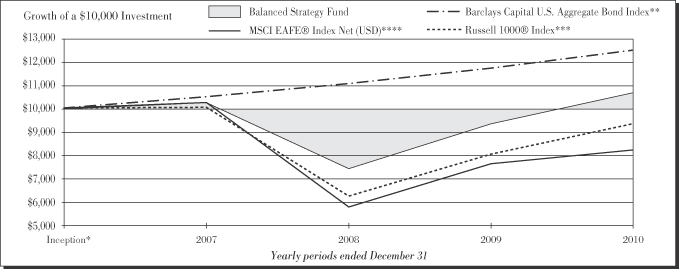
| Balanced Strategy Fund | ||||
| Total Return | ||||
1 Year | 14.06 | % | ||
Inception* | 1.84 | %§ | ||
| Barclays Capital U.S. Aggregate Bond Index ** | ||||
| Total Return | ||||
1 Year | 6.54 | % | ||
Inception* | 6.15 | %§ | ||
| Russell 1000® Index *** | ||||
| Total Return | ||||
1 Year | 16.10 | % | ||
Inception* | (1.87 | )%§ | ||
| MSCI EAFE® Index Net (USD) **** | ||||
| Total Return | ||||
1 Year | 7.75 | % | ||
Inception* | (5.19 | )%§ | ||
| 16 | Balanced Strategy Fund |
Table of Contents
Russell Investment Funds
Balanced Strategy Fund
Portfolio Management Discussion and Analysis — December 31, 2010 (Unaudited)
Portfolio Management Discussion and Analysis — December 31, 2010 (Unaudited)
The Fund is a fund of funds that invests in other Russell Investment Funds and Russell Investment Company mutual funds (the “Underlying Funds”). The Underlying Funds allocate most of their assets among multiple money managers. Russell Investment Management Company (“RIMCo”), as the Underlying Funds’ advisor, may change the allocation of the Underlying Funds’ assets among money managers at any time. An exemptive order from the Securities and Exchange Commission (“SEC”) permits RIMCo to engage or terminate a money manager in an Underlying Fund at any time, subject to approval by the Underlying Fund’s Board without a shareholder vote.
What is the Fund’s investment objective?
The Balanced Strategy Fund (“Fund”) seeks to provide above average capital appreciation and a moderate level of current income.
How did the Fund perform relative to its benchmark for the fiscal year ended December 31, 2010?
For the fiscal year ended December 31, 2010, the Fund returned 14.06%. The Fund outperformed its benchmark, the Barclays Capital U.S. Aggregate Bond Index, which returned 6.54% during the same period.
For the fiscal year ended December 31, 2010, the Lipper® Mixed Asset Target Allocation Moderate Funds Average returned 11.18%. This average return serves as a peer comparison and is expressed net of operating expenses.
The Fund’s performance includes operating expenses, whereas the Index returns are unmanaged and do not include expenses of any kind. The Fund’s outperformance relative to its benchmark was due to the Fund’s exposure to both active fixed income management and to equity investments, particularly global investment mandates, which in the aggregate outperformed core fixed income.
How did the market conditions described in the Market Summary report affect the Fund’s performance?
The Fund is a fund of funds and its performance is based on Russell’s strategic asset allocations and the performance of the Underlying Funds in which the Fund invests.
As the economy began to recover from the recent financial crisis, investors’ appetite for risk returned. Underlying managers invested primarily in fixed income, U.S. large-capitalization companies and developed non-U.S. equity were positioned to benefit from this environment relative to the benchmark.
In general, riskier asset classes performed better than asset classes generally considered less risky. All of the Underlying Funds (which are designed to represent individual asset
classes) outperformed the benchmark. The Russell Commodity Strategies Fund, added as an Underlying Fund on July 1, 2010, also outperformed the Barclays Capital U.S. Aggregate Bond Index. Two of the Underlying Funds, the Russell Global Credit Strategies and Russell Global Infrastructure Funds, had not been Underlying Funds long enough to meaningfully contribute to performance. The Fund’s exposure to core fixed income through its investment in the RIF Core Bond Fund contributed to relative outperformance. The RIF Core Bond Fund maintained its preference for larger-than-benchmark allocations to non-Treasury fixed income sectors, including securities that are not in the benchmark (e.g., high yield credit, non-agency mortgage-backed securities and emerging market debt). Exposure to U.S. small capitalization equities also added to the Fund’s relative outperformance through the RIF Aggressive Equity Fund.
How did the investment strategies and techniques employed by the Fund and the money managers of the Underlying Funds affect the Fund’s performance?
The Fund’s allocation to fixed income Underlying Funds during the fiscal year ranged from, 35% to 40% invested in the RIF Core Bond Fund and 0% to 3% invested in the Russell Global Credit Strategies (added as an Underlying Fund on October 1, 2010). The RIF Core Bond Fund’s underweight to U.S. Treasuries and overweight to non-Treasury securities generated returns in excess of the benchmark. In the aggregate, sector positions of the fixed income Underlying Funds varied throughout the fiscal year. Allocations to some of the relatively higher performing sectors of the fixed income markets, such as investment-grade financials, commercial mortgage-backed securities and credit card asset-backed securities, contributed positively to the Fund’s performance. Out-of-benchmark exposures to high yield financials and industrials in the RIF Core Bond Fund also contributed to the Fund’s outperformance.
The U.S. equity Underlying Funds (23% to 34% of the Fund’s assets during the fiscal year) were positioned more aggressively (e.g., greater volatility and more focus on emerging growth trends). The U.S. equity Underlying Funds’ benchmark relative returns contributed positively to the Fund’s excess returns. Returns for U.S. equities, up 16.10% for the year, as measured by the Russell 1000 Index, performed better in periods when investors were more confident in the sustainability of the global economic recovery as was increasingly the perception towards year-end.
Developed non-U.S. and global equity Underlying Funds (18% to 25% of the Fund’s assets) experienced high levels of volatility over the fiscal year and gained 11.42% and 14.96%, respectively. The resurgence of risk aversion in early 2010, stemming from the Greek sovereign debt crisis proved challenging for those Underlying Funds’ money managers with exposure to European financials. However, these same Underlying Funds recovered as the Greek crisis abated. In fact, the sell-off in Europe provided a unique opportunity for a number of money managers to purchase what they considered to be well-managed, global companies which they believed were
| Balanced Strategy Fund | 17 |
Table of Contents
Russell Investment Funds
Balanced Strategy Fund
Portfolio Management Discussion and Analysis — December 31, 2010 (Unaudited)
undervalued, but that also had the majority of their revenue originating from outside of Europe. These tactical purchases by Underlying Fund money managers benefited Underlying Fund returns significantly over the course of the fiscal year.
The Fund’s allocation to real asset Underlying Funds, during the fiscal year ranged from 3% to 5% invested in the RIF Real Estate Securities Fund, 0% to 4% invested in the Russell Commodity Strategies Fund (added as an Underlying Fund on July 1, 2010) and 0% to 3% invested in the Russell Global Infrastructure Fund (added as an Underlying Fund on October 1, 2010). The Fund’s real estate holdings, represented by the RIF Real Estate Fund, returned 22.92% in the fiscal year, while the Russell Commodity Strategies Fund returned 15.39% following its addition as an Underlying Fund. The Russell Global Infrastructure Fund returned 4.93% in the three months following its addition as an Underlying Fund.
The Russell Emerging Markets Fund (3% to 4% of the Fund’s assets during the fiscal year) returned 20.25%, resulting in a notable weighted excess return. After decreasing in the second quarter, the Russell Emerging Markets Fund’s performance recovered sharply, benefiting from exposure to the consumer sector and smaller emerging market countries such as the Philippines. An underweight position to Chinese financials also contributed positively to performance.
Describe any changes to the Fund’s structure or allocation to the Underlying Funds.
On March 1, 2010, the Fund reduced its exposure to U.S. equities by increasing its allocation to the Russell Global Equity Fund and by reducing allocations to both the RIF Multi-Style Equity and the Russell U.S. Quantitative Equity Funds. On July 1, 2010, the Russell Commodity Strategies Fund was
added as a new Underlying Fund. On October 1, 2010, the Fund added two new Underlying Funds, Russell Global Credit Strategies and Russell Global Infrastructure Funds.
The views expressed in this report reflect those of the portfolio managers only through the end of the fiscal year covered by the report. These views do not necessarily represent the views of RIMCo, or any other person in RIMCo or any other affiliated organization. These views are subject to change at any time based upon market conditions or other events, and RIMCo disclaims any responsibility to update the views contained herein. These views should not be relied on as investment advice and, because investment decisions for a Russell Investment Fund (“RIF”) or Russell Investment Company (“RIC”) Fund are based on numerous factors, should not be relied on as an indication of investment decisions of any RIF or RIC Fund.
| * | The Fund first issued shares on April 30, 2007. |
| ** | The Barclays Capital U.S. Aggregate Bond Index is an index, with income reinvested, generally representative of intermediate-term government bonds, investment-grade corporate debt securities and mortgage-backed securities. |
| *** | Russell 1000® Index includes the 1,000 largest companies in the Russell 3000® Index. The Russell 1000® Index represents the universe of stocks from which most active money managers typically select. The Russell 1000® Index return reflects adjustments from income dividends and capital gain distributions reinvested as of the ex-dividend dates. |
| **** | Morgan Stanley Capital International Europe, Australia, Far East (MSCI EAFE®) Index Net (USD) is an index, with dividends reinvested, representative of the securities markets of 20 developed countries in Europe, Australasia and the Far East. |
| § | Annualized. |
The performance shown in this section does not reflect any Insurance Company Separate Account or Policy Charges. Performance is historical and assumes reinvestment of all dividends and capital gains. Investment return and principal value will fluctuate so that an investor’s shares, when redeemed, may be worth more or less than when purchased. Past performance is not indicative of future results.
| 18 | Balanced Strategy Fund |
Table of Contents
Russell Investment Funds
Balanced Strategy Fund
Shareholder Expense Example — December 31, 2010 (Unaudited)
Fund Expenses
The following disclosure provides important information regarding each Fund’s Expense Example, which appears on each Fund’s individual page in this Annual Report. Please refer to this information when reviewing the Expense Example for a Fund.
Example
As a shareholder of the Fund, you incur two types of costs: (1) transaction costs, and (2) ongoing costs, including advisory fees and other Fund expenses. The Example is intended to help you understand your ongoing costs (in dollars) of investing in the Fund and to compare these costs with the ongoing costs of investing in other mutual funds. The Example is based on an investment of $1,000 invested at the beginning of the period and held for the entire period indicated, which for this Fund is from July 1, 2010 to December 31, 2010.
Actual Expenses
The information in the table under the heading “Actual Performance” provides information about actual account values and actual expenses. You may use the information in this column, together with the amount you invested, to estimate the expenses that you paid over the period. Simply divide your account value by $1,000 (for example, an $8,600 account value divided by $1,000 = 8.6), then multiply the result by the number in the first column in the row entitled “Expenses Paid During Period” to estimate the expenses you paid on your account during this period.
Hypothetical Example for Comparison Purposes
The information in the table under the heading “Hypothetical Performance (5% return before expenses)” provides information about hypothetical account values and hypothetical expenses based on the Fund’s actual expense ratio and an assumed rate of return of 5% per year before expenses, which is not the Fund’s actual return. The hypothetical account values and expenses may not be used to estimate the actual ending account balance or expenses you paid for the period. You may use this information to compare the ongoing costs of investing in the Fund and other funds. To do so, compare this 5% hypothetical example with the 5% hypothetical examples that appear in the shareholder reports of other funds.
Please note that the expenses shown in the table are meant to highlight your ongoing costs only and do not reflect any transactional costs. Therefore, the information under the heading “Hypothetical Performance (5% return before expenses)” is useful in comparing ongoing costs only, and will not help you determine the relative total costs of owning different funds. In addition, if these transactional costs were included, your costs would have been higher. The fee and expenses shown in this section do not reflect any Insurance Company Separate Account or Policy Charges.
| Actual Performance | Hypothetical Performance (5% return before expenses) | |||||||
Beginning Account Value July 1, 2010 | $ | 1,000.00 | $ | 1,000.00 | ||||
Ending Account Value | ||||||||
December 31, 2010 | $ | 1,158.70 | $ | 1,024.70 | ||||
Expenses Paid During Period* | $ | 0.54 | $ | 0.51 | ||||
| * | Expenses are equal to the Fund’s annualized expense ratio of 0.10% (representing the six month period annualized), multiplied by the average account value over the period, multiplied by 184/365 (to reflect the one-half year period). May reflect amounts waived, reimbursed and/or other credits. Without any waivers, reimbursements and/or other credits, expenses would have been higher. |
| Balanced Strategy Fund | 19 |
Table of Contents
Russell Investment Funds
Balanced Strategy Fund
Schedule of Investments — December 31, 2010
Amounts in thousands (except share amounts)
| Shares | Market Value $ | |||||||
| Investments - 100.0% | ||||||||
Russell Investment Company (“RIC”) and other Russell Investment Funds (“RIF”) Series Mutual Funds | ||||||||
| Bonds - 37.9% | ||||||||
RIC Russell Global Credit Strategies Fund | 472,271 | 4,699 | ||||||
RIF Core Bond Fund | 5,220,879 | 54,872 | ||||||
| 59,571 | ||||||||
| Domestic Equities - 23.0% | ||||||||
RIC Russell U.S. Quantitative Equity Fund | 491,844 | 14,091 | ||||||
RIF Aggressive Equity Fund | 528,733 | 6,303 | ||||||
RIF Multi-Style Equity Fund | 1,154,147 | 15,673 | ||||||
| 36,067 | ||||||||
| International Equities - 29.0% | ||||||||
RIC Russell Emerging Markets Fund | 303,734 | 6,333 | ||||||
RIC Russell Global Equity Fund | 1,763,431 | 15,677 | ||||||
RIF Non-U.S. Fund | 2,304,746 | 23,531 | ||||||
| 45,541 | ||||||||
| Real Assets - 10.1% | ||||||||
RIC Russell Commodity Strategies Fund | 576,972 | 6,503 | ||||||
RIC Russell Global Infrastructure Fund | 455,708 | 4,712 | ||||||
RIF Real Estate Securities Fund | 340,526 | 4,740 | ||||||
| 15,955 | ||||||||
| Total Investments - 100.0% (identified cost $142,089) | 157,134 | |||||||
| Other Assets and Liabilities, Net - (0.0%) | (12 | ) | ||||||
| Net Assets - 100.0% | 157,122 | |||||||
See accompanying notes which are an integral part of the financial statements.
| 20 | Balanced Strategy Fund |
Table of Contents
[This page intentionally left blank]
Table of Contents
Growth Strategy Fund
Portfolio Management Discussion and Analysis — December 31, 2010 (Unaudited)
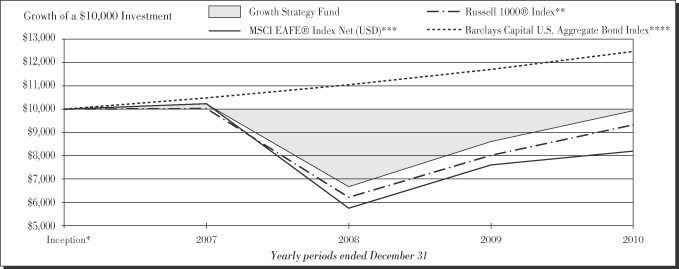
| Growth Strategy Fund | ||||
| Total Return | ||||
1 Year | 15.06 | % | ||
Inception* | (0.20 | )%§ | ||
| Russell 1000® Index ** | ||||
| Total Return | ||||
1 Year | 16.10 | % | ||
Inception* | (1.87 | )%§ | ||
| MSCI EAFE® Index Net (USD) *** | ||||
| Total Return | ||||
1 Year | 7.75 | % | ||
Inception* | (5.19 | )%§ | ||
| Barclays Capital U.S. Aggregate Bond Index **** | ||||
| Total Return | ||||
1 Year | 6.54 | % | ||
Inception* | 6.15 | %§ | ||
| 22 | Growth Strategy Fund |
Table of Contents
Russell Investment Funds
Growth Strategy Fund
Portfolio Management Discussion and Analysis — December 31, 2010 (Unaudited)
Portfolio Management Discussion and Analysis — December 31, 2010 (Unaudited)
The Fund is a fund of funds that invests in other Russell Investment Funds and Russell Investment Company mutual funds (the “Underlying Funds”). The Underlying Funds allocate most of their assets among multiple money managers. Russell Investment Management Company (“RIMCo”), as the Underlying Funds’ advisor, may change the allocation of the Underlying Funds’ assets among money managers at any time. An exemptive order from the Securities and Exchange Commission (“SEC”) permits RIMCo to engage or terminate a money manager in an Underlying Fund at any time, subject to approval by the Underlying Fund’s Board without a shareholder vote.
What is the Fund’s investment objective?
The Growth Strategy Fund (“Fund”) seeks to provide high long term capital appreciation with low current income.
How did the Fund perform relative to its benchmark for the fiscal year ended December 31, 2010?
For the fiscal year ended December 31, 2010, the Fund returned 15.06%. The Fund underperformed its benchmark, the Russell 1000® Index, which returned 16.10% during the same period.
For the fiscal year ended December 31, 2010, the Lipper® Mixed Asset Target Allocation Growth Funds Average returned 13.07%. This average return serves as a peer comparison and is expressed net of operating expenses.
The Fund’s performance includes operating expenses, whereas the Index returns are unmanaged and do not include expenses of any kind. The Fund’s underperformance relative to its benchmark was due in part to the Fund’s exposure to fixed income, which in the aggregate underperformed core equities.
How did the market conditions described in the Market Summary report affect the Fund’s performance?
The Fund is a fund of funds and its performance is based on Russell’s strategic asset allocations and the performance of the Underlying Funds in which the Fund invests.
As the economy began to recover from the recent financial crisis, investors’ appetite for risk returned. Underlying managers invested primarily in U.S. small capitalization companies, real assets and emerging markets were positioned to benefit from this environment relative to the Fund’s benchmark. However, the Fund’s exposures to the fixed income and non-U.S. developed equity markets detracted from Fund returns relative to the benchmark.
In general, riskier asset classes performed better than asset classes generally considered less risky. The RIF Aggressive Equity, RIF Real Estate Securities, Russell Emerging Markets, and RIF Multi-Style Equity Underlying Funds each outperformed the Fund’s benchmark. The RIF Non-U.S. Equity, Russell Global Equity and the Russell Quantitative Equity
Underlying Funds, however, lowered the aggregate large capitalization equity performance relative to the benchmark. The Russell Commodity Strategies Fund, added as an Underlying Fund on July 1, 2010, also outperformed the benchmark. However, the RIF Core Bond Fund underperformed the benchmark, which dampened overall Fund performance. Two of the Underlying Funds, the Russell Global Credit Strategies and Russell Global Infrastructure Funds, had not been Underlying Funds long enough to meaningfully contribute to performance.
How did the investment strategies and techniques employed by the Fund and the money managers of the Underlying Funds affect the Fund’s performance?
The U.S. equity Underlying Funds (29% to 47% of the Fund’s assets during the fiscal year) were positioned more aggressively (e.g., greater volatility and more focus on emerging growth trends). In the aggregate, the U.S. large capitalization equity Underlying Funds’ and non-U.S. developed markets equity benchmark relative returns contributed negatively to the Fund.
Developed non-U.S. and global equity Underlying Funds (23% to 33% of the Fund’s assets) experienced high levels of volatility over the fiscal year and returned 11.42% and 14.96%, respectively. The resurgence of risk aversion in early 2010, stemming from the Greek sovereign debt crisis, proved challenging for those money managers with exposure to European financials.
The Fund’s allocation to real asset Underlying Funds during the fiscal year ranged from 4% to 6% in the RIF Real Estate Securities Fund, 0% to 6% in the Russell Commodity Strategies Fund (added as an Underlying Fund on July 1, 2010) and 0% to 4% in the Russell Global Infrastructure Fund (added as an Underlying Fund on October 1, 2010). The Fund’s real estate holdings, represented by the RIF Real Estate Fund, returned 22.92% in the fiscal year, while the Russell Commodity Strategies Fund returned 16.83% following the Fund’s addition as an Underlying Fund. The Russell Global Infrastructure Fund returned 4.93% in the three months following its addition as an Underlying Fund.
The Russell Emerging Markets Fund (4% to 5% of the Fund’s assets during the fiscal year) returned 20.25%, resulting in a positive weighted excess return. After decreasing in the second quarter, the Russell Emerging Markets Fund’s performance recovered sharply, benefiting from exposure to the consumer sector and smaller emerging market countries such as the Philippines. An underweight position to Chinese financials also contributed positively to performance.
The Fund’s allocation to fixed income Underlying Funds during the fiscal year ranged from 15% to 20% invested in RIF Core Bond Fund and 0%-4% invested in the Russell Global Credit
| Growth Strategy Fund | 23 |
Table of Contents
Russell Investment Funds
Growth Strategy Fund
Portfolio Management Discussion and Analysis — December 31, 2010 (Unaudited)
Strategies Fund (added as an Underlying Fund on October 1, 2010). The RIF Core Bond Fund returned 10.02%, lagging the Russell 1000® Index. The Russell Global Credit Strategies Fund returned 0.46% since it was added on October 1, 2010.
Describe any changes to the Fund’s structure or allocation to the Underlying Funds.
On March 1, 2010, the Fund reduced its exposure to U.S. equities by increasing its allocation to the Russell Global Equity Fund and by reducing allocations to both the RIF Multi-Style Equity and the Russell U.S. Quantitative Equity Funds. On July 1, 2010, the Russell Commodity Strategies Fund was added as a new Underlying Fund. On October 1, 2010, the Fund added two new Underlying Funds, Russell Global Credit Strategies and Russell Global Infrastructure Funds.
The views expressed in this report reflect those of the portfolio managers only through the end of the fiscal year covered by the report. These views do not necessarily represent the views of RIMCo, or any other person in RIMCo or any other affiliated organization. These views are subject to change at any time based upon market conditions or other events, and RIMCo disclaims any responsibility to update the views contained herein. These views should not be relied on as investment advice and, because investment decisions for a Russell Investment Fund (“RIF”) or Russell Investment Company (“RIC”) Fund are based on numerous factors, should not be relied on as an indication of investment decisions of any RIF or RIC Fund.
| * | The Fund first issued shares on April 30, 2007. |
| ** | Russell 1000® Index includes the 1,000 largest companies in the Russell 3000® Index. The Russell 1000® Index represents the universe of stocks from which most active money managers typically select. The Russell 1000® Index return reflects adjustments from income dividends and capital gain distributions reinvested as of the ex-dividend dates. |
| *** | Morgan Stanley Capital International Europe, Australia, Far East (MSCI EAFE®) Index Net (USD) is an index, with dividends reinvested, representative of the securities markets of 20 developed countries in Europe, Australasia and the Far East. |
| **** | The Barclays Capital U.S. Aggregate Bond Index is an index, with income reinvested, generally representative of intermediate-term government bonds, investment-grade corporate debt securities and mortgage-backed securities. |
| § | Annualized. |
The performance shown in this section does not reflect any Insurance Company Separate Account or Policy Charges. Performance is historical and assumes reinvestment of all dividends and capital gains. Investment return and principal value will fluctuate so that an investor’s shares, when redeemed, may be worth more or less than when purchased. Past performance is not indicative of future results.
| 24 | Growth Strategy Fund |
Table of Contents
Russell Investment Funds
Growth Strategy Fund
Shareholder Expense Example — December 31, 2010 (Unaudited)
Fund Expenses
The following disclosure provides important information regarding each Fund’s Expense Example, which appears on each Fund’s individual page in this Annual Report. Please refer to this information when reviewing the Expense Example for a Fund.
Example
As a shareholder of the Fund, you incur two types of costs: (1) transaction costs, and (2) ongoing costs, including advisory fees and other Fund expenses. The Example is intended to help you understand your ongoing costs (in dollars) of investing in the Fund and to compare these costs with the ongoing costs of investing in other mutual funds. The Example is based on an investment of $1,000 invested at the beginning of the period and held for the entire period indicated, which for this Fund is from July 1, 2010 to December 31, 2010.
Actual Expenses
The information in the table under the heading “Actual Performance” provides information about actual account values and actual expenses. You may use the information in this column, together with the amount you invested, to estimate the expenses that you paid over the period. Simply divide your account value by $1,000 (for example, an $8,600 account value divided by $1,000 = 8.6), then multiply the result by the number in the first column in the row entitled “Expenses Paid During Period” to estimate the expenses you paid on your account during this period.
Hypothetical Example for Comparison Purposes
The information in the table under the heading “Hypothetical Performance (5% return before expenses)” provides information about hypothetical account values and hypothetical expenses based on the Fund’s actual expense ratio and an assumed rate of return of 5% per year before expenses, which is not the Fund’s actual return. The hypothetical account values and expenses may not be used to estimate the actual ending account balance or expenses you paid for the period. You may use this information to compare the ongoing costs of investing in the Fund and other funds. To do so, compare this 5% hypothetical example with the 5% hypothetical examples that appear in the shareholder reports of other funds.
Please note that the expenses shown in the table are meant to highlight your ongoing costs only and do not reflect any transactional costs. Therefore, the information under the heading “Hypothetical Performance (5% return before expenses)” is useful in comparing ongoing costs only, and will not help you determine the relative total costs of owning different funds. In addition, if these transactional costs were included, your costs would have been higher. The fee and expenses shown in this section do not reflect any Insurance Company Separate Account or Policy Charges.
| Actual Performance | Hypothetical Performance (5% return before expenses) | |||||||
Beginning Account Value July 1, 2010 | $ | 1,000.00 | $ | 1,000.00 | ||||
Ending Account Value | ||||||||
December 31, 2010 | $ | 1,202.30 | $ | 1,024.70 | ||||
Expenses Paid During Period* | $ | 0.56 | $ | 0.51 | ||||
| * | Expenses are equal to the Fund’s annualized expense ratio of 0.10% (representing the six month period annualized), multiplied by the average account value over the period, multiplied by 184/365 (to reflect the one-half year period). May reflect amounts waived, reimbursed and/or other credits. Without any waivers, reimbursements and/or other credits, expenses would have been higher. |
| Growth Strategy Fund | 25 |
Table of Contents
Russell Investment Funds
Growth Strategy Fund
Schedule of Investments — December 31, 2010
Amounts in thousands (except share amounts)
| Shares | Market Value $ | |||||||
| Investments - 100.0% | ||||||||
Russell Investment Company (“RIC”) and other Russell Investment Funds (“RIF”) Series Mutual Funds | ||||||||
| Bonds - 19.0% | ||||||||
RIC Russell Global Credit Strategies Fund | 363,344 | 3,616 | ||||||
RIF Core Bond Fund | 1,290,692 | 13,565 | ||||||
| 17,181 | ||||||||
| Domestic Equities - 28.9% | ||||||||
RIC Russell U.S. Quantitative Equity Fund | 346,556 | 9,929 | ||||||
RIF Aggressive Equity Fund | 455,205 | 5,426 | ||||||
RIF Multi-Style Equity Fund | 797,416 | 10,829 | ||||||
| 26,184 | ||||||||
| International Equities - 38.0% | ||||||||
RIC Russell Emerging Markets Fund | 219,106 | 4,568 | ||||||
RIC Russell Global Equity Fund | 1,423,274 | 12,653 | ||||||
RIF Non-U.S. Fund | 1,683,263 | 17,186 | ||||||
| 34,407 | ||||||||
| Real Assets - 14.1% | ||||||||
RIC Russell Commodity Strategies Fund | 493,045 | 5,557 | ||||||
RIC Russell Global Infrastructure Fund | 350,409 | 3,623 | ||||||
RIF Real Estate Securities Fund | 262,383 | 3,652 | ||||||
| 12,832 | ||||||||
| Total Investments - 100.0% (identified cost $82,369) | 90,604 | |||||||
| Other Assets and Liabilities, Net - (0.0%) | (12 | ) | ||||||
| Net Assets - 100.0% | 90,592 | |||||||
See accompanying notes which are an integral part of the financial statements.
| 26 | Growth Strategy Fund |
Table of Contents
[This page intentionally left blank]
Table of Contents
Equity Growth Strategy Fund
Portfolio Management Discussion and Analysis — December 31, 2010 (Unaudited)
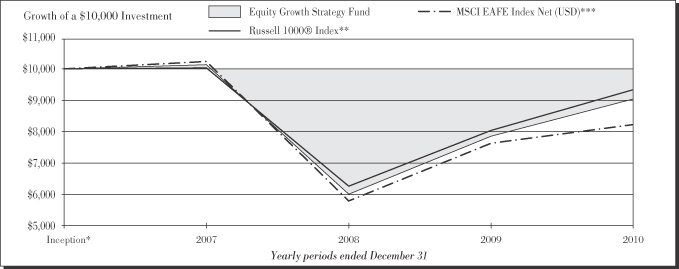
| Equity Growth Strategy Fund | ||||
| Total Return | ||||
1 Year | 15.09 | % | ||
Inception* | (2.73 | )%§ | ||
| Russell 1000® Index ** | ||||
| Total Return | ||||
1 Year | 16.10 | % | ||
Inception* | (1.87 | )%§ | ||
| MSCI EAFE® Index Net (USD) *** | ||||
| Total Return | ||||
1 Year | 7.75 | % | ||
Inception* | (5.19 | )%§ | ||
| 28 | Equity Growth Strategy Fund |
Table of Contents
Russell Investment Funds
Equity Growth Strategy Fund
Portfolio Management Discussion and Analysis — December 31, 2010 (Unaudited)
Portfolio Management Discussion and Analysis — December 31, 2010 (Unaudited)
The Fund is a fund of funds that invests in other Russell Investment Funds and Russell Investment Company mutual funds (the “Underlying Funds”). The Underlying Funds allocate most of their assets among multiple money managers. Russell Investment Management Company (“RIMCo”), as the Underlying Funds’ advisor, may change the allocation of the Underlying Funds’ assets among money managers at any time. An exemptive order from the Securities and Exchange Commission (“SEC”) permits RIMCo to engage or terminate a money manager in an Underlying Fund at any time, subject to approval by the Underlying Fund’s Board without a shareholder vote.
What is the Fund’s investment objective?
The Equity Growth Strategy Fund (“Fund”) seeks to provide high long-term capital appreciation.
How did the Fund perform relative to its benchmark for the fiscal year ended December 31, 2010?
For the fiscal year ended December 31, 2010, the Fund returned 15.09%. The Fund underperformed its benchmark, the Russell 1000® Index, which returned 16.10% during the same period.
For the fiscal year ended December 31, 2010, the Lipper® Global Core Funds Average returned 13.17%. This average return serves as a peer comparison and is expressed net of operating expenses.
The Fund’s performance includes operating expenses, whereas the index returns are unmanaged and do not include expenses of any kind. The Fund’s underperformance relative to its benchmark was due primarily to exposure to non-U.S. equities and U.S. large capitalization managers using quantitative investment approaches.
How did the market conditions described in the Market Summary report affect the Fund’s performance?
The Fund is a fund of funds and its performance is based on Russell’s strategic asset allocations and the performance of the Underlying Funds in which the Fund invests.
As the economy began to recover from the recent financial crisis, investors’ appetite for risk returned. Underlying managers invested primarily in U.S. small-capitalization companies, real assets and emerging markets’ were positioned to benefit from this environment relative to the Fund’s benchmark. However, the Fund’s exposures to non-U.S. developed equity markets and U.S. large-capitalization quantitative managers detracted from Fund returns relative to the benchmark.
In general, riskier asset classes performed better than asset classes generally considered less risky. The RIF Aggressive
Equity, RIF Real Estate Securities, Russell Emerging Markets and RIF Multi-Style Equity Underlying Funds each outperformed the Fund’s benchmark. The RIF Non-US Equity, Russell Global Equity and the RIC Quantitative Equity Underlying Funds, however, lowered the aggregate large capitalization equity performance relative to the benchmark. The Russell Commodity Strategies Fund added as an Underlying Fund on July 1, 2010, also outperformed the benchmark. Two of the Underlying Funds, the Russell Global Credit Strategies and Russell Global Infrastructure Funds, had not been Underlying Funds long enough to meaningfully contribute to performance.
How did the investment strategies and techniques employed by the Fund and its money managers of the Underlying Funds affect the Fund’s performance?
The U.S. equity Underlying Funds (36% to 58% of the Fund’s assets during the fiscal year) were positioned more aggressively (e.g., greater volatility and more focus on emerging growth trends). In the aggregate, the U.S. large-capitalization equity Underlying Funds’ and non-U.S. developed markets equity benchmark relative returns contributed negatively to the Fund. Developed non-U.S. and global equity Underlying Funds (30% to 37% of the Fund’s assets), experienced high levels of volatility over the fiscal year and returned 11.42% and 14.96%, respectively. The resurgence of risk aversion in early 2010, stemming from the Greek sovereign debt crisis proved challenging for those money managers with exposure to European financials. The Fund’s allocation to real asset Underlying Funds, during the fiscal year ranged from, 5% to 7% in the RIF Real Estate Securities Fund, 0% to 6% in the Russell Commodity Strategies Fund (added as an Underlying Fund on July 1, 2010), and 0% to 4% in the Russell Global Infrastructure Fund (added as an Underlying Fund on October 1, 2010). The Fund’s real estate holdings, represented by the RIF Real Estate Fund, returned 22.92% in the fiscal year, while the Russell Commodity Strategies Fund returned 16.83% following its addition as an Underlying Fund and the Russell Global Infrastructure Fund returned 4.93% in the three months following its addition as an Underlying Fund.
The Russell Emerging Markets Fund (5% to 7% of the Fund’s assets during the fiscal year) returned 20.25%, resulting in a positive weighted excess return. After decreasing in the second quarter, the Russell Emerging Markets Fund’s performance recovered sharply, benefiting from exposure to the consumer sector and smaller emerging market countries such as the Philippines. An underweight position to Chinese financials also contributed positively to performance.
Describe any changes to the Fund’s structure or allocation to the Underlying Funds.
On March 1, 2010, the Fund reduced its exposure to U.S. equities by increasing its allocation to the Russell Global Equity Fund and by reducing allocations to both the RIF Multi-Style Equity and the Russell U.S. Quantitative Equity Funds. On July 1, 2010, the Russell Commodity Strategies Fund was added as a new Underlying Fund. On October 1, 2010, the
| Equity Growth Strategy Fund | 29 |
Table of Contents
Russell Investment Funds
Equity Growth Strategy Fund
Portfolio Management Discussion and Analysis — December 31, 2010 (Unaudited)
Fund added two new Underlying Funds, Russell Global Credit Strategies and Russell Global Infrastructure Funds.
The views expressed in this report reflect those of the portfolio managers only through the end of the fiscal year covered by the report. These views do not necessarily represent the views of RIMCo, or any other person in RIMCo or any other affiliated organization. These views are subject to change at any time based upon market conditions or other events, and RIMCo disclaims any responsibility to update the views contained herein. These views should not be relied on as investment advice and, because investment decisions for a Russell Investment Fund (“RIF”) or Russell Investment Company (“RIC”) Fund are based on numerous factors, should not be relied on as an indication of investment decisions of any RIF or RIC Fund.
| * | The Fund first issued shares on April 30, 2007. |
| ** | Russell 1000® Index includes the 1,000 largest companies in the Russell 3000® Index. The Russell 1000® Index represents the universe of stocks from which most active money managers typically select. The Russell 1000® Index return reflects adjustments from income dividends and capital gain distributions reinvested as of the ex-dividend dates. |
| *** | Morgan Stanley Capital International Europe, Australia, Far East (MSCI EAFE®) Index Net (USD) is an index, with dividends reinvested, representative of the securities markets of 20 developed countries in Europe, Australasia and the Far East. |
| § | Annualized. |
The performance shown in this section does not reflect any Insurance Company Separate Account or Policy Charges. Performance is historical and assumes reinvestment of all dividends and capital gains. Investment return and principal value will fluctuate so that an investor’s shares, when redeemed, may be worth more or less than when purchased. Past performance is not indicative of future results.
| 30 | Equity Growth Strategy Fund |
Table of Contents
Russell Investment Funds
Equity Growth Strategy Fund
Shareholder Expense Example — December 31, 2010 (Unaudited)
Fund Expenses
The following disclosure provides important information regarding each Fund’s Expense Example, which appears on each Fund’s individual page in this Annual Report. Please refer to this information when reviewing the Expense Example for a Fund.
Example
As a shareholder of the Fund, you incur two types of costs: (1) transaction costs, and (2) ongoing costs, including advisory fees and other Fund expenses. The Example is intended to help you understand your ongoing costs (in dollars) of investing in the Fund and to compare these costs with the ongoing costs of investing in other mutual funds. The Example is based on an investment of $1,000 invested at the beginning of the period and held for the entire period indicated, which for this Fund is from July 1, 2010 to December 31, 2010.
Actual Expenses
The information in the table under the heading “Actual Performance” provides information about actual account values and actual expenses. You may use the information in this column, together with the amount you invested, to estimate the expenses that you paid over the period. Simply divide your account value by $1,000 (for example, an $8,600 account value divided by $1,000 = 8.6), then multiply the result by the number in the first column in the row entitled “Expenses Paid During Period” to estimate the expenses you paid on your account during this period.
Hypothetical Example for Comparison Purposes
The information in the table under the heading “Hypothetical Performance (5% return before expenses)” provides information about hypothetical account values and hypothetical expenses based on the Fund’s actual expense ratio and an assumed rate of return of 5% per year before expenses, which is not the Fund’s actual return. The hypothetical account values and expenses may not be used to estimate the actual ending account balance or expenses you paid for the period. You may use this information to compare the ongoing costs of investing in the Fund and other funds. To do so, compare this 5% hypothetical example with the 5% hypothetical examples that appear in the shareholder reports of other funds.
Please note that the expenses shown in the table are meant to highlight your ongoing costs only and do not reflect any transactional costs. Therefore, the information under the heading “Hypothetical Performance (5% return before expenses)” is useful in comparing ongoing costs only, and will not help you determine the relative total costs of owning different funds. In addition, if these transactional costs were included, your costs would have been higher. The fee and expenses shown in this section do not reflect any Insurance Company Separate Account or Policy Charges.
| Actual Performance | Hypothetical Performance (5% return before expenses) | |||||||
Beginning Account Value July 1, 2010 | $ | 1,000.00 | $ | 1,000.00 | ||||
Ending Account Value | ||||||||
December 31, 2010 | $ | 1,240.60 | $ | 1,024.70 | ||||
Expenses Paid During Period* | $ | 0.56 | $ | 0.51 | ||||
| * | Expenses are equal to the Fund’s annualized expense ratio of 0.10% (representing the six month period annualized), multiplied by the average account value over the period, multiplied by 184/365 (to reflect the one-half year period). May reflect amounts waived, reimbursed and/or other credits. Without any waivers, reimbursements and/or other credits, expenses would have been higher. |
| Equity Growth Strategy Fund | 31 |
Table of Contents
Russell Investment Funds
Equity Growth Strategy Fund
Schedule of Investments — December 31, 2010
Amounts in thousands (except share amounts)
| Shares | Market Value $ | |||||||
| Investments - 100.0% | ||||||||
Russell Investment Company (“RIC”) and other Russell Investment Funds (“RIF”) Series Mutual Funds | ||||||||
| Bonds - 5.0% | ||||||||
RIC Russell Global Credit Strategies Fund | 134,656 | 1,340 | ||||||
| Domestic Equities - 35.9% | ||||||||
RIC Russell U.S. Quantitative Equity Fund | 130,751 | 3,746 | ||||||
RIF Aggressive Equity Fund | 156,657 | 1,867 | ||||||
RIF Multi-Style Equity Fund | 295,545 | 4,014 | ||||||
| 9,627 | ||||||||
| International Equities - 44.0% | ||||||||
RIC Russell Emerging Markets Fund | 90,820 | 1,894 | ||||||
RIC Russell Global Equity Fund | 421,759 | 3,749 | ||||||
RIF Non-U.S. Fund | 603,466 | 6,161 | ||||||
| 11,804 | ||||||||
| Real Assets - 15.1% | ||||||||
RIC Russell Commodity Strategies Fund | 144,874 | 1,633 | ||||||
RIC Russell Global Infrastructure Fund | 103,771 | 1,073 | ||||||
RIF Russell Real Estate Securities Fund | 96,822 | 1,348 | ||||||
| 4,054 | ||||||||
| Total Investments - 100.0% (identified cost $22,716) | 26,825 | |||||||
| Other Assets and Liabilities, Net - (0.0%) | (9 | ) | ||||||
| Net Assets - 100.0% | 26,816 | |||||||
See accompanying notes which are an integral part of the financial statements.
| 32 | Equity Growth Strategy Fund |
Table of Contents
LifePoints® Funds Variable Target Portfolio Series
Statements of Assets and Liabilities — December 31, 2010
| Amounts in thousands | Moderate Strategy Fund | Balanced Strategy Fund | Growth Strategy Fund | Equity Growth Strategy Fund | ||||||||||||
Assets | ||||||||||||||||
Investments, at identified cost | $ | 49,377 | $ | 142,089 | $ | 82,369 | $ | 22,716 | ||||||||
Investments, at market | 54,580 | 157,134 | 90,604 | 26,825 | ||||||||||||
Receivables: | ||||||||||||||||
Fund shares sold | 195 | 620 | 356 | 20 | ||||||||||||
From affiliates | 12 | 21 | 13 | 7 | ||||||||||||
Total assets | 54,787 | 157,775 | 90,973 | 26,852 | ||||||||||||
Liabilities | ||||||||||||||||
Payables: | ||||||||||||||||
Investments purchased | 195 | 556 | �� | 301 | 17 | |||||||||||
Fund shares redeemed | — | 64 | 56 | 4 | ||||||||||||
Accrued fees to affiliates | 3 | 8 | 4 | 1 | ||||||||||||
Other accrued expenses | 16 | 25 | 20 | 14 | ||||||||||||
Total liabilities | 214 | 653 | 381 | 36 | ||||||||||||
Net Assets | $ | 54,573 | $ | 157,122 | $ | 90,592 | $ | 26,816 | ||||||||
Net Assets Consist of: | ||||||||||||||||
Undistributed (overdistributed) net investment income | $ | — | $ | — | $ | — | $ | — | ||||||||
Accumulated net realized gain (loss) | (3,043 | ) | (8,646 | ) | (6,299 | ) | (5,424 | ) | ||||||||
Unrealized appreciation (depreciation) on investments | 5,203 | 15,045 | 8,235 | 4,109 | ||||||||||||
Shares of beneficial interest | 57 | 173 | 106 | 34 | ||||||||||||
Additional paid-in capital | 52,356 | 150,550 | 88,550 | 28,097 | ||||||||||||
Net Assets | $ | 54,573 | $ | 157,122 | $ | 90,592 | $ | 26,816 | ||||||||
Net Asset Value, offering and redemption price per share: | ||||||||||||||||
Net asset value per share: | $ | 9.64 | $ | 9.07 | $ | 8.57 | $ | 7.82 | ||||||||
Net assets | $ | 54,573,260 | $ | 157,121,847 | $ | 90,592,425 | $ | 26,816,325 | ||||||||
Shares outstanding ($.01 par value) | 5,661,596 | 17,322,161 | 10,565,382 | 3,427,955 | ||||||||||||
See accompanying notes which are an integral part of the financial statements.
| Statement of Assets and Liabilities | 33 |
Table of Contents
LifePoints® Funds Variable Target Portfolio Series
Statements of Operations — For the Period Ended December 31, 2010
| Amounts in thousands | Moderate Strategy Fund | Balanced Strategy Fund | ||||||
Investment Income | ||||||||
Income distribution from Underlying Funds | $ | 2,034 | $ | 4,821 | ||||
Expenses | ||||||||
Advisory fees | 87 | 256 | ||||||
Administrative fees | 22 | 64 | ||||||
Custodian fees | 21 | 20 | ||||||
Transfer agent fees | 2 | 6 | ||||||
Professional fees | 30 | 38 | ||||||
Trustees’ fees | 1 | 3 | ||||||
Printing fees | 20 | 58 | ||||||
Miscellaneous | 9 | 14 | ||||||
Expenses before reductions | 192 | 459 | ||||||
Expense reductions | (148 | ) | (332 | ) | ||||
Net expenses | 44 | 127 | ||||||
Net investment income (loss) | 1,990 | 4,694 | ||||||
Net Realized and Unrealized Gain (Loss) | ||||||||
Net realized gain (loss) on: | ||||||||
Investments | (479 | ) | (4,115 | ) | ||||
Capital gain distributions from Underlying Funds | 136 | 141 | ||||||
Net realized gain (loss) | (343 | ) | (3,974 | ) | ||||
Net change in unrealized appreciation (depreciation) on investments | 3,733 | 16,989 | ||||||
Net realized and unrealized gain (loss) | 3,390 | 13,015 | ||||||
Net Increase (Decrease) in Net Assets from Operations | $ | 5,380 | $ | 17,709 | ||||
See accompanying notes which are an integral part of the financial statements.
| 34 | Statement of Operations |
Table of Contents
| Growth Strategy Fund | Equity Growth Strategy Fund | |||||
| $ | 2,151 | $ | 462 | |||
| 144 | 46 | |||||
| 36 | 12 | |||||
| 20 | 20 | |||||
| 3 | 1 | |||||
| 33 | 28 | |||||
| 2 | — | |||||
| 34 | 12 | |||||
| 11 | 4 | |||||
| 283 | 123 | |||||
| (211 | ) | (100 | ) | |||
| 72 | 23 | |||||
| 2,079 | 439 | |||||
| (4,235 | ) | (1,886 | ) | |||
| 38 | 1 | |||||
| (4,197 | ) | (1,885 | ) | |||
| 13,165 | 4,841 | |||||
| 8,968 | 2,956 | |||||
| $ | 11,047 | $ | 3,395 | |||
See accompanying notes which are an integral part of the financial statements.
| Statement of Operations | 35 |
Table of Contents
LifePoints® Funds Variable Target Portfolio Series
Statements of Changes in Net Assets — For the Periods Ended December 31,
| Moderate Strategy Fund | Balanced Strategy Fund | |||||||||||||||
| Amounts in thousands | 2010 | 2009 | 2010 | 2009 | ||||||||||||
Increase (Decrease) in Net Assets | ||||||||||||||||
Operations | ||||||||||||||||
Net investment income (loss) | $ | 1,990 | $ | 1,061 | $ | 4,694 | $ | 2,754 | ||||||||
Net realized gain (loss) | (343 | ) | (1,690 | ) | (3,974 | ) | (3,251 | ) | ||||||||
Net change in unrealized appreciation (depreciation) | 3,733 | 5,647 | 16,989 | 19,134 | ||||||||||||
Net increase (decrease) in net assets from operations | 5,380 | 5,018 | 17,709 | 18,637 | ||||||||||||
Distributions | ||||||||||||||||
From net investment income | (2,054 | ) | (1,078 | ) | (4,867 | ) | (2,602 | ) | ||||||||
From net realized gain | — | (120 | ) | — | (331 | ) | ||||||||||
From return of capital | (74 | ) | — | (284 | ) | — | ||||||||||
Net decrease in net assets from distributions | (2,128 | ) | (1,198 | ) | (5,151 | ) | (2,933 | ) | ||||||||
Share Transactions | ||||||||||||||||
Net increase (decrease) in net assets from share transactions | 15,650 | 12,543 | 39,379 | 29,323 | ||||||||||||
Total Net Increase (Decrease) in Net Assets | 18,902 | 16,363 | 51,937 | 45,027 | ||||||||||||
Net Assets | ||||||||||||||||
Beginning of period | 35,671 | 19,308 | 105,185 | 60,158 | ||||||||||||
End of period | $ | 54,573 | $ | 35,671 | $ | 157,122 | $ | 105,185 | ||||||||
Undistributed (overdistributed) net investment income included in net assets | $ | — | $ | 64 | $ | — | $ | 172 | ||||||||
See accompanying notes which are an integral part of the financial statements.
| 36 | Statement of Changes in Net Assets |
Table of Contents
| Growth Strategy Fund | Equity Growth Strategy Fund | |||||||||||||
| 2010 | 2009 | 2010 | 2009 | |||||||||||
| $ | 2,079 | $ | 1,237 | $ | 439 | $ | 307 | |||||||
| (4,197 | ) | (1,439 | ) | (1,885 | ) | (2,467 | ) | |||||||
| 13,165 | 12,548 | 4,841 | 6,654 | |||||||||||
| 11,047 | 12,346 | 3,395 | 4,494 | |||||||||||
| (2,140 | ) | (1,156 | ) | (480 | ) | (220 | ) | |||||||
| — | (213 | ) | — | (87 | ) | |||||||||
| (131 | ) | — | (198 | ) | — | |||||||||
| (2,271 | ) | (1,369 | ) | (678 | ) | (307 | ) | |||||||
| 20,310 |
| 15,787 | 4,042 | 3,257 | |||||||||
| 29,086 | 26,764 | 6,759 | 7,444 | |||||||||||
| 61,506 | 34,742 | 20,057 | 12,613 | |||||||||||
| $ | 90,592 | $ | 61,506 | $ | 26,816 | $ | 20,057 | |||||||
$ | — |
| $ | 61 | $ | — | $ | 41 | ||||||
See accompanying notes which are an integral part of the financial statements.
| Statement of Changes in Net Assets | 37 |
Table of Contents
LifePoints® Funds Variable Target Portfolio Series
Financial Highlights
For a Share Outstanding Throughout the Period.
| $ Net Asset Value, Beginning of Period | $ Net Investment Income (Loss)(a)(b) | $ Net Realized and Unrealized Gain (Loss) | $ Total from Investment Operations | $ Distributions from Net Investment Income | $ Distributions from Net Realized Gain | $ Return of Capital | ||||||||||||||||||||||
Moderate Strategy Fund |
| |||||||||||||||||||||||||||
December 31, 2010 | 8.95 | .42 | .69 | 1.11 | (.41 | ) | — | (.01 | ) | |||||||||||||||||||
December 31, 2009 | 7.67 | .36 | 1.34 | 1.70 | (.37 | ) | (.05 | ) | — | |||||||||||||||||||
December 31, 2008 | 9.99 | .33 | (2.32 | ) | (1.99 | ) | (.23 | ) | (.10 | ) | — | |||||||||||||||||
December 31, 2007(1) | 10.00 | .46 | (.11 | ) | .35 | (.36 | ) | — | (g) | — | ||||||||||||||||||
Balanced Strategy Fund |
| |||||||||||||||||||||||||||
December 31, 2010 | 8.25 | .31 | .84 | 1.15 | (.31 | ) | — | (.02 | ) | |||||||||||||||||||
December 31, 2009 | 6.80 | .26 | 1.47 | 1.73 | (.24 | ) | (.04 | ) | — | |||||||||||||||||||
December 31, 2008 | 9.93 | .23 | (2.88 | ) | (2.65 | ) | (.21 | ) | (.27 | ) | — | |||||||||||||||||
December 31, 2007(1) | 10.00 | .47 | (.20 | ) | .27 | (.34 | ) | — | (g) | — | ||||||||||||||||||
Growth Strategy Fund |
| |||||||||||||||||||||||||||
December 31, 2010 | 7.66 | .23 | .91 | 1.14 | (.22 | ) | — | (.01 | ) | |||||||||||||||||||
December 31, 2009 | 6.11 | .19 | 1.56 | 1.75 | (.17 | ) | (.03 | ) | — | |||||||||||||||||||
December 31, 2008 | 9.90 | .15 | (3.46 | ) | (3.31 | ) | (.14 | ) | (.34 | ) | — | |||||||||||||||||
December 31, 2007(1) | 10.00 | .45 | (.24 | ) | .21 | (.31 | ) | — | — | |||||||||||||||||||
Equity Growth Strategy Fund |
| |||||||||||||||||||||||||||
December 31, 2010 | 6.98 | .14 | .91 | 1.05 | (.15 | ) | — | (.06 | ) | |||||||||||||||||||
December 31, 2009 | 5.42 | .12 | 1.56 | 1.68 | (.09 | ) | (.03 | ) | — | |||||||||||||||||||
December 31, 2008 | 9.83 | .07 | (3.92 | ) | (3.85 | ) | (.05 | ) | (.51 | ) | — | |||||||||||||||||
December 31, 2007(1) | 10.00 | .50 | (.38 | ) | .12 | (.29 | ) | — | — | |||||||||||||||||||
See accompanying notes which are an integral part of the financial statements.
| 38 | Financial Highlights |
Table of Contents
| $ Total Distributions | $ Net Asset Value, End of Period | % Total Return(c) | $ Net Assets, End of Period (000) | % Ratio of Expenses to Average Net Assets, Net(d)(e)(f) | % Ratio of Expenses to Average Net Assets, Gross(d)(e) | % Ratio of Net Investment Income to Average Net Assets(c)(f) | % Portfolio Turnover Rate(c) | |||||||||||||||||||||||
| (.42 | ) | 9.64 | 12.62 | 54,573 | .10 | .44 | 4.56 | 45 | ||||||||||||||||||||||
| (.42 | ) | 8.95 | 23.09 | 35,671 | .10 | .48 | 4.40 | 21 | ||||||||||||||||||||||
| (.33 | ) | 7.67 | (20.39 | ) | 19,308 | .11 | .53 | 3.77 | 39 | |||||||||||||||||||||
| (.36 | ) | 9.99 | 3.54 | 8,654 | .11 | 2.01 | 5.37 | 24 | ||||||||||||||||||||||
| (.33 | ) | 9.07 | 14.06 | 157,122 | .10 | .36 | 3.67 | 23 | ||||||||||||||||||||||
| (.28 | ) | 8.25 | 26.23 | 105,185 | .09 | .35 | 3.62 | 8 | ||||||||||||||||||||||
| (.48 | ) | 6.80 | (27.70 | ) | 60,158 | .08 | .35 | 2.75 | 16 | |||||||||||||||||||||
| (.34 | ) | 9.93 | 2.73 | 35,697 | .08 | .74 | 5.37 | 11 | ||||||||||||||||||||||
| (.23 | ) | 8.57 | 15.06 | 90,592 | .10 | .39 | 2.88 | 29 | ||||||||||||||||||||||
| (.20 | ) | 7.66 | 29.43 | 61,506 | .09 | .40 | 2.80 | 6 | ||||||||||||||||||||||
| (.48 | ) | 6.11 | (34.73 | ) | 34,742 | .04 | .40 | 1.85 | 10 | |||||||||||||||||||||
| (.31 | ) | 9.90 | 2.13 | 27,390 | .04 | .84 | 5.05 | 3 | ||||||||||||||||||||||
| (.21 | ) | 7.82 | 15.09 | 26,816 | .10 | .53 | 1.89 | 42 | ||||||||||||||||||||||
| (.12 | ) | 6.98 | 31.79 | 20,057 | .08 | .59 | 2.02 | 21 | ||||||||||||||||||||||
| (.56 | ) | 5.42 | (41.18 | ) | 12,613 | .04 | .58 | .87 | 24 | |||||||||||||||||||||
| (.29 | ) | 9.83 | 1.25 | 13,006 | .04 | 1.36 | 5.59 | 6 | ||||||||||||||||||||||
See accompanying notes which are an integral part of the financial statements.
| Financial Highlights | 39 |
Table of Contents
LifePoints® Funds Variable Target Portfolio Series
Notes to Financial Highlights — December 31, 2010
| (a) | Average daily shares outstanding were used for this calculation. |
| (b) | Recognition of net investment income by the Fund is affected by the timing of the declaration of dividends by the Underlying Funds in which the Fund invests. |
| (c) | Periods less than one year are not annualized. |
| (d) | The ratios for periods less than one year are annualized. |
| (e) | The calculation includes only those expenses charged directly to the Fund and does not include expenses charged to the Underlying Funds in which the Fund invests. |
| (f) | May reflect amounts waived and reimbursed by Russell Investment Management Company (“RIMCo”) and Russell Fund Services Company (“RFSC”). |
| (g) | Less than $.01 per share. |
| (1) | For the period April 30, 2007 (date of first issue) to December 31, 2007. |
See accompanying notes which are an integral part of the financial statements.
| 40 | Notes to Financial Highlights |
Table of Contents
LifePoints® Funds Variable Target Portfolio Series
Notes to Financial Statements — December 31, 2010
| 1. | Organization |
Russell Investment Funds (the “Investment Company” or “RIF”) is a series investment company with nine different investment portfolios referred to as Funds. These financial statements report on four of these Funds (each a “Fund” and collectively the “Funds”). The Investment Company provides the investment base for one or more variable insurance products issued by one or more insurance companies. These Funds are offered at net asset value to qualified insurance company separate accounts offering variable insurance products. The Investment Company is registered under the Investment Company Act of 1940, as amended, as an open-end management investment company. It is organized and operated as a Massachusetts business trust under an Amended and Restated Master Trust Agreement dated October 1, 2008 (“Master Trust Agreement”). The Investment Company’s Master Trust Agreement permits the Board of Trustees (the “Board”) to issue an unlimited number of shares of beneficial interest.
The Funds seek to achieve their objective by investing in a combination of Russell Investment Company (“RIC”) Funds and other of the Investment Company’s Funds (the “Underlying Funds”) as set forth in the table below. Russell Investment Management Company (“RIMCo”) is the Funds’ adviser and may modify the target asset allocation for any Fund and/or the Underlying Funds in which the Funds invest from time to time based on strategic capital markets research or on factors such as RIMCo’s outlook for the economy, financial markets generally and/or relative market valuation of the asset classes represented by each Underlying Fund. In the future, the Fund may also invest in other Underlying Funds. Any modification in the asset allocation or changes to the Underlying Funds will be based on strategic, long-term allocation decisions and not tactical, short-term positioning and may be made one or more times per year. In the future, the Funds may also invest in other funds which are not currently Underlying Funds.
| Asset Allocation Targets as of December 20, 2010* | ||||||||||||||||
| Underlying Funds | Moderate Strategy Fund | Balanced Strategy Fund | Growth Strategy Fund | Equity Growth Strategy Fund | ||||||||||||
Bond Funds | ||||||||||||||||
RIF Core Bond Fund | 31-41 | % | 30-40 | % | 10-20 | % | 0 | % | ||||||||
RIC Russell Global Credit Strategies Fund | 0-7 | 0-8 | 0-9 | 0-10 | ||||||||||||
RIC Russell Investment Grade Bond Fund | 15-25 | 0 | 0 | 0 | ||||||||||||
Domestic Equity Funds | ||||||||||||||||
RIF Aggressive Equity Fund | 0-7 | 0-9 | 1-11 | 2-12 | ||||||||||||
RIF Multi-Style Equity Fund | 0-10 | 5-15 | 7-17 | 10-20 | ||||||||||||
RIC Russell U.S. Quantitative Equity Fund | 1-11 | 4-14 | 6-16 | 9-19 | ||||||||||||
International Equity Funds | ||||||||||||||||
RIF Non-U.S. Fund | 4-14 | 10-20 | 14-24 | 18-28 | ||||||||||||
RIC Russell Emerging Markets Fund | 0-8 | 0-9 | 0-10 | 2-12 | ||||||||||||
RIC Russell Global Equity Fund | 3-13 | 5-15 | 9-19 | 9-19 | ||||||||||||
Real Asset Funds | ||||||||||||||||
RIF Real Estate Securities Fund | 0-8 | 0-8 | 0-9 | 0-10 | ||||||||||||
RIC Russell Commodity Strategies Fund | 0-8 | 0-9 | 1-11 | 1-11 | ||||||||||||
RIC Russell Global Infrastructure Fund | 0-8 | 0-8 | 0-9 | 0-9 | ||||||||||||
| * | Prospectus dated May 1, 2010, as supplemented through December 20, 2010 |
| 2. | Significant Accounting Policies |
The Funds’ financial statements are prepared in accordance with accounting principles generally accepted in the United States of America (“U.S. GAAP”) which require the use of management estimates and assumptions at the date of the financial statements. Actual results could differ from those estimates. The following is a summary of the significant accounting policies consistently followed by each Fund in the preparation of its financial statements.
Security Valuation
The Funds value their portfolio securities, the shares of the Underlying Funds, at the current net asset value per share of each Underlying Fund.
Fair value of securities is defined as the price that the Funds would receive upon selling an investment in a timely transaction to an independent buyer in the principal or most advantageous market of the investment. To increase consistency and comparability in fair value measurement, the fair value hierarchy was established to maximize the use of observable market data and minimize the use of unobservable inputs and to establish classification of fair value measurements for disclosure purposes. Inputs refer broadly to the assumptions that market participants would use in pricing the asset, including assumptions about risk, (e.g., the risk inherent in a particular valuation technique, such as a pricing model or risks inherent in the inputs to a particular valuation technique). Inputs may be observable or unobservable. Observable inputs are inputs that reflect the assumptions market
| Notes to Financial Statements | 41 |
Table of Contents
Russell Investment Funds
LifePoints® Funds Variable Target Portfolio Series
Notes to Financial Statements, continued — December 31, 2010
participants would use in pricing the asset or liability developed based on market data obtained from sources independent of the reporting entity. Unobservable inputs are inputs that reflect the reporting entity’s own assumptions about the assumptions market participants would use in pricing the asset or liability developed based on the best information available in the circumstances.
The fair value hierarchy of inputs is summarized in the three broad levels listed below.
Level 1 — quoted prices (unadjusted) in active markets for identical investments
Level 2 — other significant observable inputs including quoted market prices in non-active markets or prices derived from market data.
Level 3 — significant unobservable inputs including the Fund’s own assumptions in determining the fair value of investments.
The levels associated with valuing the Funds’ investments for the period ended December 31, 2010 were level 1 for all Funds.
Investment Transactions
Investment transactions are reflected as of trade date for financial reporting purposes. This may cause the net asset value stated in the financial statements to be different from the net asset value shareholders transact at. Realized gains and losses from securities transactions, if any, are recorded on the basis of specific identified cost.
Investment Income
Distributions of income and capital gains from the Underlying Funds are recorded on the ex-dividend date.
Federal Income Taxes
Since the Investment Company is a Massachusetts business trust, each Fund is a separate corporate taxpayer and determines its net investment income and capital gains (or losses) and the amounts to be distributed to each Fund’s shareholders without regard to the income and capital gains (or losses) of the other Funds.
Each Fund qualifies as a regulated investment company and distributes all of its taxable income and capital gains. Therefore, no federal income tax provision was required for the Funds.
Each Fund files a U. S. tax return. At December 31, 2010, the Funds have recorded no liabilities for net unrecognized tax benefits relating to uncertain income tax positions they have taken or expect to take in future tax returns. While the statute of limitations remains open to examine the Funds’ U.S. tax returns filed for the fiscal years ending December 31, 2007, through December 31, 2009, no examinations are in progress or anticipated at this time. The Funds are not aware of any tax positions for which it is reasonably possible that the total amounts of unrecognized tax benefits will significantly change in the next twelve months.
Dividends and Distributions to Shareholders
Income dividends, capital gain distributions and return of capital, if any, are recorded on the ex-dividend date. Income dividends are generally declared and paid quarterly. Capital gain distributions are generally declared and paid annually. An additional distribution may be paid by the Funds to avoid imposition of federal income and excise tax on any remaining undistributed capital gains and net investment income.
The timing and characterization of certain income and capital gain distributions are determined in accordance with federal tax regulations which may differ from U.S. GAAP. As a result, net investment income and net realized gain (or loss) from investment transactions for a reporting period may differ significantly from distributions during such period. The differences between tax regulations and U.S. GAAP relate primarily to investments in the Underlying Funds sold at a loss, wash sale deferrals and capital loss carryforwards. Accordingly, the Funds may periodically make reclassifications among certain of their capital accounts without impacting their net asset values.
Expenses
Expenses included in the accompanying financial statements reflect the expenses of each Fund and do not include those expenses incurred by the Underlying Funds. Because the Underlying Funds have varied expense and fee levels and the Funds may own different proportions of the Underlying Funds at different times, the amount of the fees and expenses incurred indirectly by the Funds will vary.
| 42 | Notes to Financial Statements |
Table of Contents
Russell Investment Funds
LifePoints® Funds Variable Target Portfolio Series
Notes to Financial Statements, continued — December 31, 2010
Guarantees
In the normal course of business the Funds enter into contracts that contain a variety of representations which provide general indemnifications. The Funds’ maximum exposure under these arrangements is unknown as this would involve future claims that may be made against the Funds that have not yet occurred. However, the Funds expect the risk of loss to be remote.
Market and Credit Risk
In the normal course of business the Underlying Funds trade financial instruments and enter into financial transactions where risk of potential loss exists due to changes in the market (market risk) or failure of the other party to a transaction to perform (credit risk). Similar to the credit risk, the Underlying Funds may be exposed to counterparty risk or risk that an institution or other entity with which the Underlying Funds have unsettled or open transactions will default. The potential loss could exceed the value of the assets recorded in the Underlying Funds’ financial statements (the “Assets”). The Assets, which potentially expose the Underlying Funds to credit risk, consist principally of cash due from counterparties and investments. The extent of the Underlying Funds’ exposure to credit and counterparty risks in respect to the Assets approximates their carrying value as recorded in the Underlying Funds’ Statements of Assets and Liabilities.
| 3. | Investment Transactions |
Securities
During the period ended December 31, 2010, purchases and sales of the Underlying Funds (excluding short-term investments) were as follows:
| Purchases | Sales | |||||||
Moderate Strategy Fund | $ | 36,889,944 | $ | 21,240,588 | ||||
Balanced Strategy Fund | 70,608,674 | 31,542,911 | ||||||
Growth Strategy Fund | 42,395,328 | 22,233,704 | ||||||
Equity Growth Strategy Fund | 14,166,635 | 10,364,016 | ||||||
| 4. | Related Party Transactions, Fees and Expenses |
Adviser and Administrator
RIMCo advises the Funds and Russell Fund Services Company (“RFSC”) is the Funds’ administrator. RFSC is a wholly-owned subsidiary of RIMCo. RIMCo is a wholly-owned subsidiary of Frank Russell Company (a subsidiary of The Northwestern Mutual Life Insurance Company). Frank Russell Company provides ongoing money manager research and trade placement services to RIF and RIMCo.
The advisory fee of 0.20% and administrative fee of 0.05% are based upon the average daily net assets of the Funds and are payable monthly. The following shows the total amount of each of these fees paid by the Funds for the period ended December 31, 2010.
| Advisory | Administrative | |||||||
Moderate Strategy Fund | $ | 87,388 | $ | 21,847 | ||||
Balanced Strategy Fund | 255,754 | 63,938 | ||||||
Growth Strategy Fund | 144,490 | 36,122 | ||||||
Equity Growth Strategy Fund | 46,372 | 11,593 | ||||||
RIMCo has contractually agreed, until April 30, 2011, to waive up to the full amount of its 0.20% advisory fee and then reimburse each Fund for other direct Fund-level expenses to the extent that direct Fund-level expenses exceed 0.10% of the average daily net assets of the Fund on an annual basis. These waivers and reimbursements may not be terminated during the relevant period except with Board approval.
Direct Fund-level expenses do not include extraordinary expenses or the expenses of other investment companies in which the Funds invest, including the Underlying Funds, which are borne indirectly by the Funds.
| Notes to Financial Statements | 43 |
Table of Contents
Russell Investment Funds
LifePoints® Funds Variable Target Portfolio Series
Notes to Financial Statements, continued — December 31, 2010
For the period ended December 31, 2010, the fees waived and reimbursed by RIMCO amounted to:
| Waiver | Reimbursement | Total | ||||||||||
Moderate Strategy Fund | $ | 87,388 | $ | 60,557 | $ | 147,945 | ||||||
Balanced Strategy Fund | 255,754 | 75,844 | 331,598 | |||||||||
Growth Strategy Fund | 144,490 | 66,891 | 211,381 | |||||||||
Equity Growth Strategy Fund | 46,372 | 53,138 | 99,510 | |||||||||
RIMCo does not have the ability to recover amounts waived or reimbursed from previous periods.
Transfer and Dividend Disbursing Agent
RFSC serves as Transfer and Dividend Disbursing Agent for the Investment Company. For this service, RFSC is paid a fee based upon the average daily net assets of the Funds for transfer agency and dividend disbursing services. RFSC retains a portion of this fee for its services provided to the Funds and pays the balance to unaffiliated agents who assisted in providing these services. Total fees paid for the Funds presented herein for the period ended December 31, 2010, were as follows:
| Amount | ||||
Moderate Strategy Fund | $ | 1,934 | ||
Balanced Strategy Fund | 5,660 | |||
Growth Strategy Fund | 3,199 | |||
Equity Growth Strategy Fund | 1,025 | |||
Distributor
Russell Financial Services, Inc. (the “Distributor’), a wholly-owned subsidiary of RIMCo, is the distributor for RIF pursuant to a Distribution Agreement with the Investment Company. The Distributor receives no compensation from the Investment Company for its services.
Accrued Fees Payable to Affiliates
Accrued fees payable to affiliates for the period ended December 31, 2010 were as follows:
| Moderate Strategy Fund | Balanced Strategy Fund | Growth Strategy Fund | Equity Growth Strategy Fund | |||||||||||||
Administration Fees | $ | 2,260 | $ | 6,474 | $ | 3,710 | $ | 1,119 | ||||||||
Transfer Agent fees | 205 | 590 | 340 | 102 | ||||||||||||
Trustee Fees | 158 | 490 | 301 | 106 | ||||||||||||
| $ | 2,623 | $ | 7,554 | $ | 4,351 | $ | 1,327 | |||||||||
Board of Trustees
The Russell Fund Complex consists of RIC, which has 41 funds, and RIF, which has nine funds. Each of the Trustees is a Trustee of both RIC and RIF. During the period, the Russell Fund Complex paid each of its independent Trustees a retainer of $72,000 per year (effective January 1, 2011, $75,000 per year), $6,500 for each regular quarterly meeting attended in person, $2,500 for each special meeting attended in person, and $2,500 for each Audit Committee meeting, Nominating and Governance Committee meeting, Investment Committee meeting or any other committee meeting established and approved by the Board that is attended in person. Each Trustee receives a $1,000 fee for attending the quarterly and special meetings (except for telephonic meetings called pursuant to the Funds’ valuation and pricing procedures) and a $500 fee for attending the committee meeting by phone instead of receiving the full fee had the member attended in person. Trustees’ out-of-pocket expenses are also paid by the Russell Fund Complex. The Audit Committee Chair and Investment Committee Chair are each paid a fee of $15,000 per year and the Nominating and Governance Committee Chair is paid a fee of $6,000 per year. The chairman of the Board receives additional annual compensation of $72,000 (effective January 1, 2011, $75,000 per year).
| 44 | Notes to Financial Statements |
Table of Contents
Russell Investment Funds
LifePoints® Funds Variable Target Portfolio Series
Notes to Financial Statements, continued — December 31, 2010
Transactions with Affiliated Companies
An affiliated company is a company in which a Fund has ownership of at least 5% of the voting securities or under common control. Transactions during the period ended December 31, 2010, with Underlying Funds which are, or were, an affiliated company are as follows:
| Market Value | Purchases Cost | Sales Cost | Realized Gain (Loss) | Income Distributions | Capital Gains Distributions | |||||||||||||||||||
Moderate Strategy Fund | ||||||||||||||||||||||||
RIF Core Bond Fund | $ | 19,627,964 | $ | 9,572,455 | $ | 11,736,014 | $ | 139,055 | $ | 1,148,029 | $ | 48,281 | ||||||||||||
RIC Russell Global Credit Strategies Fund | 1,089,983 | 1,099,077 | 3,661 | (64 | ) | 10,308 | — | |||||||||||||||||
RIC Russell Investment Grade Bond Fund | 10,905,824 | 11,485,803 | 501,351 | 1,445 | 459,237 | 85,174 | ||||||||||||||||||
RIF Aggressive Equity Fund | 1,088,279 | 677,105 | 918,256 | 14,503 | 5,169 | — | ||||||||||||||||||
RIF Multi-Style Equity Fund | 2,723,212 | 1,734,108 | 3,133,544 | (158,138 | ) | 28,338 | — | |||||||||||||||||
RIC Russell U.S. Quantitative Equity Fund | 3,267,820 | 1,742,346 | 2,634,951 | (297,527 | ) | 46,290 | — | |||||||||||||||||
RIF Non-U.S. Fund | 4,907,871 | 2,231,075 | 1,263,331 | (163,891 | ) | 31,360 | — | |||||||||||||||||
RIC Russell Emerging Markets Fund | 1,654,122 | 1,021,203 | 287,668 | 3,927 | 33,915 | — | ||||||||||||||||||
RIC Russell Global Equity Fund | 4,359,873 | 3,355,677 | 688,350 | (48,458 | ) | 25,675 | — | |||||||||||||||||
RIF Real Estate Securities Fund | 1,650,112 | 724,709 | 386,895 | 23,692 | 30,279 | — | ||||||||||||||||||
RIC Russell Commodity Strategies Fund | 1,668,428 | 1,636,648 | 140,178 | 7,278 | 193,877 | — | ||||||||||||||||||
RIC Russell Global Infrastructure Fund | 1,636,675 | 1,609,738 | 24,975 | (408 | ) | 21,518 | 2,121 | |||||||||||||||||
| $ | 54,580,163 | $ | 36,889,944 | $ | 21,719,174 | $ | (478,586 | ) | $ | 2,033,995 | $ | 135,576 | ||||||||||||
Balanced Strategy Fund | ||||||||||||||||||||||||
RIF Core Bond Fund | $ | 54,871,543 | $ | 23,608,111 | $ | 11,863,710 | $ | 289,200 | $ | 3,118,751 | $ | 135,153 | ||||||||||||
RIF Aggressive Equity Fund | 6,302,500 | 1,253,081 | 637,237 | (132,220 | ) | 24,210 | — | |||||||||||||||||
RIF Multi-Style Equity Fund | 15,673,321 | 4,164,872 | 7,846,510 | (1,510,904 | ) | 140,473 | — | |||||||||||||||||
RIC Russell U.S. Quantitative Equity Fund | 14,091,337 | 4,623,291 | 9,616,138 | (2,001,755 | ) | 207,518 | — | |||||||||||||||||
RIF Non-U.S. Fund | 23,531,452 | 7,651,212 | 1,425,375 | (245,981 | ) | 144,680 | — | |||||||||||||||||
RIC Russell Emerging Markets Fund | 6,332,859 | 2,632,576 | 302,635 | (30,637 | ) | 129,762 | — | |||||||||||||||||
RIC Russell Global Credit Strategies Fund | 4,699,092 | 4,731,353 | 7,941 | (26 | ) | 44,425 | — | |||||||||||||||||
RIC Russell Global Equity Fund | 15,676,767 | 9,878,084 | 468,229 | (67,708 | ) | 92,247 | — | |||||||||||||||||
RIF Real Estate Securities Fund | 4,740,120 | 1,388,314 | 3,231,256 | (424,120 | ) | 100,996 | — | |||||||||||||||||
RIC Russell Commodity Strategies Fund | 6,502,509 | 6,085,040 | 234,875 | 8,507 | 756,707 | — | ||||||||||||||||||
RIC Russell Global Infrastructure Fund | 4,712,019 | 4,592,740 | 24,274 | 375 | 61,693 | 6,081 | ||||||||||||||||||
| $ | 157,133,519 | $ | 70,608,674 | $ | 35,658,180 | $ | (4,115,269 | ) | $ | 4,821,462 | $ | 141,234 | ||||||||||||
Growth Strategy Fund | ||||||||||||||||||||||||
RIF Core Bond Fund | $ | 13,565,168 | $ | 6,848,712 | $ | 5,772,806 | $ | 226,801 | $ | 811,814 | $ | 33,496 | ||||||||||||
RIC Russell Global Credit Strategies Fund | 3,615,573 | 3,655,208 | 22,029 | (152 | ) | 34,262 | — | |||||||||||||||||
RIF Aggressive Equity Fund | 5,426,041 | 891,583 | 412,352 | (110,557 | ) | 20,606 | — | |||||||||||||||||
RIF Multi-Style Equity Fund | 10,828,914 | 2,930,955 | 8,059,343 | (1,671,208 | ) | 105,136 | — | |||||||||||||||||
RIC Russell U.S. Quantitative Equity Fund | 9,928,815 | 3,204,371 | 8,461,061 | (2,056,657 | ) | 146,044 | — | |||||||||||||||||
RIF Non-U.S. Fund | 17,186,110 | 5,622,420 | 851,368 | (173,118 | ) | 98,664 | — | |||||||||||||||||
RIC Russell Emerging Markets Fund | 4,568,363 | 1,758,114 | 299,254 | (43,216 | ) | 94,233 | — | |||||||||||||||||
RIC Russell Global Equity Fund | 12,652,903 | 7,720,121 | 317,402 | (66,882 | ) | 74,293 | — | |||||||||||||||||
RIF Real Estate Securities Fund | 3,652,377 | 1,040,455 | 2,072,097 | (345,230 | ) | 73,782 | — | |||||||||||||||||
RIC Russell Commodity Strategies Fund | 5,556,615 | 5,198,577 | 189,535 | 5,106 | 645,006 | — | ||||||||||||||||||
RIC Russell Global Infrastructure Fund | 3,623,231 | 3,524,812 | 11,574 | (4 | ) | 47,593 | 4,691 | |||||||||||||||||
| $ | 90,604,110 | $ | 42,395,328 | $ | 26,468,821 | $ | (4,235,117 | ) | $ | 2,151,433 | $ | 38,187 | ||||||||||||
| Notes to Financial Statements | 45 |
Table of Contents
Russell Investment Funds
LifePoints® Funds Variable Target Portfolio Series
Notes to Financial Statements, continued — December 31, 2010
| Market Value | Purchases Cost | Sales Cost | Realized Gain (Loss) | Income Distributions | Capital Gains Distributions | |||||||||||||||||||
Equity Growth Strategy Fund | ||||||||||||||||||||||||
RIC Russell Global Credit Strategies Fund | $ | 1,339,832 | $ | 1,393,849 | $ | 47,472 | $ | (592 | ) | $ | 12,732 | $ | — | |||||||||||
RIF Aggressive Equity Fund | 1,867,352 | 574,488 | 596,018 | (95,578 | ) | 7,559 | — | |||||||||||||||||
RIF Multi-Style Equity Fund | 4,013,500 | 1,600,560 | 3,929,660 | (631,235 | ) | 42,947 | — | |||||||||||||||||
RIC Russell U.S. Quantitative Equity Fund | 3,746,018 | 1,662,083 | 3,980,764 | (739,199 | ) | 59,243 | — | |||||||||||||||||
RIF Non-U.S. Fund | 6,161,385 | 2,196,637 | 1,590,552 | (361,259 | ) | 44,449 | — | |||||||||||||||||
RIC Russell Emerging Markets Fund | 1,893,590 | 1,003,589 | 382,699 | (32,771 | ) | 38,859 | — | |||||||||||||||||
RIC Russell Global Equity Fund | 3,749,439 | 2,354,549 | 555,631 | (62,257 | ) | 22,002 | — | |||||||||||||||||
RIC Russell Real Estate Securities Fund | 1,347,767 | 601,725 | 892,193 | 26,722 | 29,714 | — | ||||||||||||||||||
RIC Russell Commodity Strategies Fund | 1,632,726 | 1,701,941 | 237,469 | 10,467 | 190,654 | — | ||||||||||||||||||
RIC Russell Global Infrastructure Fund | 1,072,994 | 1,077,214 | 37,641 | (381 | ) | 14,053 | 1,385 | |||||||||||||||||
| $ | 26,824,603 | $ | 14,166,635 | $ | 12,250,099 | $ | (1,886,083 | ) | $ | 462,212 | $ | 1,385 | ||||||||||||
| 5. | Federal Income Taxes |
At December 31, 2010, the following Funds had net tax basis capital loss carryforwards which may be applied against any net realized taxable gains in each succeeding year or until their respective expiration dates, whichever occurs first. Available capital loss carryforwards and expiration dates are as follows:
| Funds | 12/31/2016 | 12/31/2017 | 12/31/2018 | Totals | ||||||||||||
Moderate Strategy | $ | — | $ | 220,758 | $ | 70,709 | $ | 291,467 | ||||||||
Balanced Strategy | — | 216,848 | 2,756,512 | 2,973,360 | ||||||||||||
Growth Strategy | — | 284,614 | 3,007,030 | 3,291,644 | ||||||||||||
Equity Growth Strategy | 11,522 | 285,785 | 1,191,125 | 1,461,432 | ||||||||||||
At December 31, 2010, the cost of investments and net unrealized appreciation (depreciation), undistributed ordinary income and undistributed long-term capital gains for income tax purposes were as follows:
| Moderate Strategy Fund | Balanced Strategy Fund | Growth Strategy Fund | Equity Growth Strategy Fund | |||||||||||||
Cost of Investments | $ | 52,129,915 | $ | 147,760,888 | $ | 85,376,582 | $ | 26,634,361 | ||||||||
Unrealized Appreciation | $ | 2,489,840 | $ | 9,387,782 | $ | 5,238,594 | $ | 190,545 | ||||||||
Unrealized Depreciation | (39,592 | ) | (15,151 | ) | (11,367 | ) | (303 | ) | ||||||||
Net Unrealized Appreciation (Depreciation) | $ | 2,450,248 | $ | 9,372,631 | $ | 5,227,227 | $ | 190,242 | ||||||||
Components of Distributable Earnings | ||||||||||||||||
Undistributed Ordinary Income | $ | — | $ | — | $ | — | $ | — | ||||||||
Undistributed Long-Term Gains (Capital Loss Carryforward) | $ | (291,467 | ) | $ | (2,973,360 | ) | $ | (3,291,644 | ) | $ | (1,461,432 | ) | ||||
Tax Composition of Distributions | ||||||||||||||||
Ordinary Income | $ | 2,054,206 | $ | 4,866,493 | $ | 2,140,115 | $ | 479,786 | ||||||||
Long Term Capital Gains | $ | — | $ | — | $ | — | $ | — | ||||||||
Return of Capital | $ | 73,643 | $ | 284,276 | $ | 131,030 | $ | 198,166 | ||||||||
As permitted by tax regulations, the funds intend to defer a net realized capital loss incurred from November 1, 2010 to December 31 2010, and treat it as arising in the fiscal year 2011. As of December 31, 2010, the Equity Growth Strategy Fund realized a capital loss of $43,638.
| 6. | Fund Share Transactions (amounts in thousands) |
Share transactions for the periods ended December 31, 2010 and December 31, 2009 were as follows:
| 2010 | 2009 | |||||||||||||||
| Moderate Strategy Fund | Shares | Dollars | Shares | Dollars | ||||||||||||
Proceeds from shares sold | 2,236 | $ | 20,764 | 2,000 | $ | 16,613 | ||||||||||
Proceeds from reinvestment of distributions | 226 | 2,128 | 153 | 1,198 | ||||||||||||
Payments for shares redeemed | (784 | ) | (7,242 | ) | (684 | ) | (5,268 | ) | ||||||||
Net increase (decrease) | 1,678 | $ | 15,650 | 1,469 | $ | 12,543 | ||||||||||
| 46 | Notes to Financial Statements |
Table of Contents
Russell Investment Funds
LifePoints® Funds Variable Target Portfolio Series
Notes to Financial Statements, continued — December 31, 2010
| 6. | Fund Share Transactions (amounts in thousands) (continued) |
| 2010 | 2009 | |||||||||||||||
| Balanced Strategy Fund | Shares | Dollars | Shares | Dollars | ||||||||||||
Proceeds from shares sold | 4,844 | $ | 41,538 | 4,503 | $ | 33,006 | ||||||||||
Proceeds from reinvestment of distributions | 586 | 5,151 | 410 | 2,932 | ||||||||||||
Payments for shares redeemed | (861 | ) | (7,310 | ) | (1,007 | ) | (6,615 | ) | ||||||||
Net increase (decrease) | 4,569 | $ | 39,379 | 3,906 | $ | 29,323 | ||||||||||
| 2010 | 2009 | |||||||||||||||
| Growth Strategy Fund | Shares | Dollars | Shares | Dollars | ||||||||||||
Proceeds from shares sold | 2,715 | $ | 21,639 | 2,492 | $ | 16,740 | ||||||||||
Proceeds from reinvestment of distributions | 274 | 2,271 | 212 | 1,370 | ||||||||||||
Payments for shares redeemed | (454 | ) | (3,600 | ) | (359 | ) | (2,323 | ) | ||||||||
Net increase (decrease) | 2,535 | $ | 20,310 | 2,345 | $ | 15,787 | ||||||||||
| 2010 | 2009 | |||||||||||||||
| Equity Growth Strategy Fund | Shares | Dollars | Shares | Dollars | ||||||||||||
Proceeds from shares sold | 1,155 | $ | 8,348 | 1,048 | $ | 6,208 | ||||||||||
Proceeds from reinvestment of distributions | 89 | 678 | 59 | 306 | ||||||||||||
Payments for shares redeemed | (689 | ) | (4,984 | ) | (563 | ) | (3,257 | ) | ||||||||
Net increase (decrease) | 555 | $ | 4,042 | 544 | $ | 3,257 | ||||||||||
| 7. | Interfund Lending Program |
The Funds have been granted permission from the Securities and Exchange Commission to participate in a joint lending and borrowing facility (the “Credit Facility”). Portfolios of the Funds may borrow money from each other for temporary purposes. All such borrowing and lending will be subject to a participating Fund’s fundamental investment limitations. Typically, Funds will borrow from the RIC Funds. The RIC lending Fund will lend through the program only when the returns are higher than those available from an investment in repurchase agreements or short-term reserves and the portfolio manager determines it is in the best interest of the RIC lending Fund. The Funds will borrow through the program only when the costs are equal to or lower than the cost of bank loans. Interfund loans and borrowings normally extend overnight, but can have a maximum duration of seven days. Loans may be called on one business day’s notice. A participating Fund may have to borrow from a bank at a higher interest rate if an interfund loan is called or not renewed. Any delay in repayment to the RIC lending Fund could result in a lost investment opportunity or additional borrowing costs. For the period ended December 31, 2010, the Funds did not borrow through the interfund lending program.
| 8. | Record Ownership |
As of December 31, 2010, the following table includes shareholders of record with greater than 10% of the total outstanding shares of each respective Fund. The Northwestern Mutual Life Insurance Company accounts were the largest shareholders in each Fund.
| # of Shareholders | % | |||||||
Moderate Strategy Fund | 1 | 98.5 | ||||||
Balanced Strategy Fund | 1 | 98.0 | ||||||
Growth Strategy Fund | 1 | 97.7 | ||||||
Equity Growth Strategy Fund | 1 | 97.8 | ||||||
| 9. | Subsequent Events |
Management has evaluated the events and transactions that have occurred through the date the financial statements were issued and noted no items requiring adjustments of the financial statements or additional disclosures.
| Notes to Financial Statements | 47 |
Table of Contents
Report of Independent Registered Public Accounting Firm
To the Board of Trustees and Shareholders
of Russell Investment Funds
In our opinion, the accompanying statements of assets and liabilities, including the schedules of investments, and the related statements of operations, of changes in net assets and the financial highlights present fairly, in all material respects, the financial position of Moderate Strategy Fund, Balanced Strategy Fund, Growth Strategy Fund, and Equity Growth Strategy Fund (four of the portfolios constituting the Russell Investment Funds, hereafter referred to as the “Funds”) at December 31, 2010, the results of each of their operations for the year then ended, the changes in each of their net assets for each of the two years in the period then ended and the financial highlights for each of the periods indicated, in conformity with accounting principles generally accepted in the United States of America. These financial statements and financial highlights (hereafter referred to as “financial statements”) are the responsibility of the Funds’ management; our responsibility is to express an opinion on these financial statements based on our audits. We conducted our audits of these financial statements in accordance with the standards of the Public Company Accounting Oversight Board (United States). Those standards require that we plan and perform the audits to obtain reasonable assurance about whether the financial statements are free of material misstatement. An audit includes examining, on a test basis, evidence supporting the amounts and disclosures in the financial statements, assessing the accounting principles used and significant estimates made by management, and evaluating the overall financial statement presentation. We believe that our audits, which included confirmation of securities at December 31, 2010 by correspondence with the transfer agent, provide a reasonable basis for our opinion.

PricewaterhouseCoopers LLP
Seattle, Washington
February 15, 2011
| 48 | Report of Independent Registered Public Accounting Firm |
Table of Contents
LifePoints® Funds Variable Target Portfolio Series
Tax Information — December 31, 2010 (Unaudited)
For the tax year ended December 31, 2010, the Funds hereby designate 100% or the maximum amount allowable, of its net taxable income as qualified dividends taxed at individual net capital gain rates.
The Form 1099 you receive in January 2011 will show the tax status of all distributions paid to your account in calendar year 2010.
The Funds designate dividends distributed during the fiscal year as qualifying for the dividends received deduction for corporate shareholders as follows:
Moderate Strategy | 4.9% | |||
Balanced Strategy | 8.9% | |||
Growth Strategy | 15.0% | |||
Equity Growth Strategy | 19.4% |
| Tax Information | 49 |
Table of Contents
LifePoints® Variable Target Portfolio Series
Basis for Approval of Investment Advisory Contracts
Approval of Investment Advisory Agreement
The Board of Trustees, including all of the Independent Trustees, last considered and approved the continuation of the advisory agreement with RIMCo (the “RIMCo Agreement”) and the portfolio management contract (collectively, the “portfolio management contracts”) with each Money Manager of the funds in which the Funds invest (the “Underlying Funds”) at a meeting held in person on April 20, 2010 (the “Agreement Evaluation Meeting”). During the course of a year, the Trustees receive a wide variety of materials regarding the investment performance of the Funds, sales and redemptions of the Funds’ and Underlying Funds’ shares, management of the Funds and the Underlying Funds by RIMCo and compliance with applicable regulatory requirements. In preparation for the annual review, the Independent Trustees, with the advice and assistance of their independent counsel, also requested and the Board considered (1) information, reports and analyses prepared by RIMCo relating to the services provided by RIMCo (and its affiliates) to the Funds and the Underlying Funds; and (2) information (the “Third-Party Information”) received from an independent, nationally recognized provider of investment company information comparing the performance of each of the Funds and the Underlying Funds and their respective operating expenses over various periods of time with other peer funds not managed by RIMCo believed by the provider to be generally comparable in investment objectives to the Funds and the Underlying Funds. In the case of each Fund, its other peer funds are collectively hereinafter referred to as the Fund’s “Comparable Funds,” and, with the Fund, such Comparable Funds are collectively hereinafter referred to as the “Performance Universe” in the case of performance comparisons and the Fund’s “Expense Universe” in the case of operating expense comparisons. In the case of certain Funds, the Third-Party Information reflected changes in the Comparable Funds requested by RIMCo, which changes were noted in the Third-Party Information. The foregoing information requested by the Trustees or provided by RIMCo is collectively called the “Agreement Evaluation Information.” The Trustees’ evaluations also reflected the knowledge and familiarity gained as Board members of the Funds and other funds in the same complex with respect to services provided by RIMCo, RIMCo’s affiliates and each Money Manager. The Trustees received a memorandum from counsel to the Funds and Underlying Funds discussing the legal standards for their consideration of the continuations of the RIMCo Agreement and the portfolio management contracts and the Independent Trustees separately received a memorandum regarding their responsibilities from their independent counsel.
On April 13, 2010, the Independent Trustees in preparation for the Agreement Evaluation Meeting met by conference telephone call to review Agreement Evaluation Information received to that date in a private session with their independent counsel at which no representatives of RIMCo or the Funds’ management were present and, on the basis of that review, requested additional Agreement Evaluation Information. At the Agreement Evaluation Meeting, the Board, including the Independent Trustees, reviewed the proposed continuance of the RIMCo Agreement and the portfolio management contracts with management, counsel to the Funds and Underlying Funds and independent counsel to the Independent Trustees. Presentations made by RIMCo to the Board as part of this review encompassed the Funds and all other RIMCo-managed funds for which the Board has supervisory responsibility. Following this review, but prior to voting, the Independent Trustees again met in executive session with their independent counsel to consider additional Agreement Evaluation Information received from RIMCo and management at the Agreement Evaluation Meeting. The discussion below reflects all of these reviews.
In evaluating the portfolio management contracts, the Board considered that the Underlying Funds, in employing a manager-of-managers method of investment, operate in a manner that is distinctly different from most other investment companies. In the case of most other investment companies, an advisory fee is paid by the investment company to its adviser which in turn employs and compensates individual portfolio managers to make specific securities selections consistent with the adviser’s style and investment philosophy. RIMCo has engaged multiple unaffiliated Money Managers for all Underlying Funds.
The Board considered that RIMCo (rather than any Money Manager) is responsible under the RIMCo Agreement for allocating assets of each Fund among its Underlying Funds and for determining, implementing and maintaining the investment program for each Underlying Fund. The assets of each Fund are invested in different combinations of the Underlying Funds pursuant to target asset allocations set by RIMCo. RIMCo may modify the target asset allocation for any Fund and/or the Underlying Funds in which the Funds invest. Assets of each Underlying Fund generally have been allocated among the multiple Money Managers selected by RIMCo, subject to Board approval, for that Underlying Fund. RIMCo manages directly a portion of certain Underlying Funds’ assets employing a “select holdings strategy,” as described below, and directly manages the investment of each Underlying Fund’s cash reserves. RIMCo also may manage directly any portion of each Underlying Fund’s assets that RIMCo determines not to allocate to the Money Managers and portions of an Underlying Fund during transitions between Money Managers. In all cases, assets are managed directly by RIMCo pursuant to authority provided by the RIMCo Agreement.
RIMCo is responsible for selecting, subject to Board approval, Money Managers for each Underlying Fund and for actively managing allocations and reallocations of its assets among the Money Managers. The Board has been advised that RIMCo’s goal is to construct and manage diversified portfolios in a risk-aware manner. Each Money Manager for an Underlying Fund in effect performs the function of an individual portfolio manager who is responsible for selecting portfolio securities for the portion of the Underlying Fund assigned to it by RIMCo (each, a “segment”) in accordance with the Underlying Fund’s applicable investment objective, policies and
| 50 | Basis for Approval of Investment Advisory Contracts |
Table of Contents
Russell Investment Funds
LifePoints® Variable Target Portfolio Series
Basis for Approval of Investment Advisory Contracts, continued
restrictions, any constraints placed by RIMCo upon their selection of portfolio securities and the Money Manager’s specified role in an Underlying Fund. RIMCo is responsible for communicating performance expectations to each Money Manager; supervising compliance by each Money Manager with each Underlying Fund’s investment objective and policies; authorizing Money Managers to engage in certain investment strategies for an Underlying Fund; and recommending annually to the Board whether portfolio management contracts should be renewed, modified or terminated. In addition to its annual recommendation as to the renewal, modification or termination of portfolio management contracts, RIMCo is responsible for recommending to the Board additions of new Money Managers or replacements of existing Money Managers at any time when, based on RIMCo’s research and ongoing review and analysis, such actions are appropriate. RIMCo may impose specific investment constraints from time to time for each Money Manager intended to capitalize on the strengths of that Money Manager or to coordinate the investment activities of Money Managers for an Underlying Fund in a complementary manner. Therefore, the performance of individual Money Managers for an Underlying Fund may reflect the roles assigned to them by RIMCo in the Underlying Fund’s investment activities and any constraints placed by RIMCo upon their selection of portfolio securities. In light of the foregoing, the overall performance of each Underlying Fund over appropriate periods reflects, in great part, the performance of RIMCo in designing the Underlying Fund’s investment program, structuring an Underlying Fund, selecting an effective Money Manager with a particular investment style or sub-style for a segment that is complementary to the styles of the Money Managers of other Underlying Fund segments, and allocating assets among the Money Managers in a manner designed to achieve the objectives of the Underlying Fund.
The Board considered that the prospectuses for the Funds and the Underlying Funds and other public disclosures emphasize to investors RIMCo’s role as the principal investment manager for each Underlying Fund, rather than the investment selection role of the Underlying Funds’ Money Managers, and describe the manner in which the Funds or Underlying Funds operate so that investors may take that information into account when deciding to purchase shares of any Fund. The Board further considered that Fund investors in pursuing their investment goals and objectives likely purchased their shares on the basis of this information and RIMCo’s reputation and performance record in managing the Underlying Funds’ manager-of-managers structure.
The Board also considered the demands and complexity of managing the Underlying Funds pursuant to the manager-of-managers structure, the special expertise of RIMCo with respect to the manager-of-managers structure of the Underlying Funds and the likelihood that, at the current expense ratio of each Underlying Fund, there would be no acceptable alternative investment managers to replace RIMCo on comparable terms given the need to continue the manager-of-managers strategy of such Underlying Fund selected by shareholders in purchasing their shares of a Fund or Underlying Fund.
In addition to these general factors relating to the manager-of-managers structure of the Underlying Funds, the Trustees considered, with respect to each Fund and Underlying Fund, various specific factors in evaluating renewal of the RIMCo Agreement, including the following:
| 1. | The nature, scope and overall quality of the investment management and other services provided, and expected to be provided, to the Fund or the Underlying Fund by RIMCo; |
| 2. | The advisory fee paid by the Fund or the Underlying Fund to RIMCo (the “Advisory Fee”) and the fact that it encompasses all investment advisory fees paid by the Fund or Underlying Fund, including the fees for any Money Managers of such Underlying Fund; |
| 3. | Information provided by RIMCo as to other fees and benefits received by RIMCo or its affiliates from the Fund or Underlying Fund, including any administrative, transfer agent or cash management fees and fees received for management of securities lending cash collateral, soft dollar arrangements and commissions in connection with portfolio securities transactions; |
| 4. | Information provided by RIMCo as to expenses incurred by the Fund or the Underlying Fund; and |
| 5. | Information provided by RIMCo as to the profits that RIMCo derives from its mutual fund operations generally and from the Fund or Underlying Fund. |
In evaluating the nature, scope and overall quality of the investment management and other services provided and which are expected to be provided to the Funds, including Fund portfolio management services, the Board inquired as to the possible impact on the Funds’ operations of significant changes in RIMCo’s senior management and other personnel providing services to the Funds during 2009 and 2010 to the date of the Agreement Evaluation Meeting and a planned relocation of the Russell organization’s headquarters by the end of 2010. At the Agreement Evaluation Meeting, senior representatives of RIMCo discussed these changes with the Board and assured the Board that while these changes likely would have a near term impact because of increased demands upon continuing personnel, steps were being taken to avoid any long-term diminution in the nature, scope or quality of the services provided to the Funds or Underlying Funds. The Board also discussed the possible impact of such changes on the compliance programs of the Funds and RIMCo and received assurances from senior representatives of the Russell organization that such changes would not result in any long-term diminution in the scope and quality of the Funds’ compliance programs.
| Basis for Approval of Investment Advisory Contracts | 51 |
Table of Contents
Russell Investment Funds
LifePoints® Variable Target Portfolio Series
Basis for Approval of Investment Advisory Contracts, continued
As noted above, RIMCo, pursuant to the terms of the RIMCo Agreement, directly manages a portion—up to 10%—of the assets of each of the RIF Multi-Style Equity Fund and the Russell Investment Company Russell U.S. Quantitative Equity Fund (each a “Participating Underlying Fund”) during the past year, utilizing a select holdings strategy, the actual allocation being determined by each Participating Underlying Fund’s RIMCo portfolio manager. The select holdings strategy utilized by RIMCo in managing such assets for a Participating Underlying Fund is designed to increase the Participating Underlying Fund’s exposure to stocks that are viewed as attractive by multiple Money Managers of that Participating Underlying Fund. The Board reviewed the results of the select holdings strategy in respect of each Participating Underlying Fund during the past year. With respect to each Participating Underlying Fund, the Trustees considered that RIMCo is not required to pay investment advisory fees to a Money Manager with respect to assets for which the select holdings strategy is utilized and that the profits derived by RIMCo generally and from the Participating Underlying Fund consequently may increase incrementally. The Board, however, also considered RIMCo’s advice that it pays certain Money Managers additional fees for providing information and other services in connection with the select holdings strategy and incurs additional costs in carrying out the select holdings strategy, the limited amount of assets that are managed directly by RIMCo pursuant to the select holdings strategy, and the fact that the aggregate investment advisory fees paid by the Participating Underlying Fund are not increased as a result of the select holdings strategy.
In evaluating the reasonableness of the Funds’ and Underlying Funds’ Advisory Fees in light of Fund and Underlying Fund performance, the Board considered that, in the Agreement Evaluation Information and at past meetings, RIMCo noted differences between the investment strategies of certain Underlying Funds and their respective Comparable Funds in pursuing their investment objectives, including fund strategies which seek to achieve a lower tracking error (i.e., the difference, whether positive or negative, between the return of a fund and its benchmark) and resulting lower return volatility than their Comparable Funds. According to RIMCo, these strategies may be expected to result, and for certain Underlying Funds during the periods covered by the Third-Party Information did result, in lower performance of the Underlying Funds than that of some of their respective Comparable Funds. According to RIMCo, the strategies pursued by the Underlying Funds, among other things, are intended to result in less volatile, more moderate returns relative to each Underlying Fund’s performance benchmark rather than more volatile, more extreme returns that its Comparable Funds may experience over time, although Fund results in 2008 and early 2009 generally did not reflect uniform success in achieving lesser volatility.
With respect to the Fund’s Advisory Fees, the Third-Party Information showed that the Advisory Fee for each Fund on a contractual basis was ranked in the fourth quintile of its Expense Universe but was ranked in the first quintile of its Expense Universe on an actual basis (i.e., giving effect to any voluntary fee waivers implemented by RIMCo and the advisors to such Fund’s Comparable Funds). The comparisons were based upon the latest fiscal year for the Expense Universe Funds. In assessing the Funds’ Advisory Fees, the Board focused on actual Advisory Fees.
In discussing the Advisory Fees for the Underlying Funds generally, RIMCo noted, among other things, that its Advisory Fees for Underlying Funds encompass services that may not be provided by investment advisers to the Underlying Funds’ Comparable Funds, such as cash equitization and management of portfolio transition costs when Money Managers are added, terminated or replaced. RIMCo also observed that its “margins” in providing investment advisory services to the Underlying Funds tend to be lower than competitors’ margins because of the demands and complexities of managing the Underlying Funds’ manager-of-managers structure, including RIMCo’s payment of a significant portion of the Underlying Funds’ Advisory Fees to their Money Managers.
The Board considered for each Fund and Underlying Fund whether economies of scale have been realized and whether the Advisory Fees for such Fund or Underlying Fund appropriately reflect or should be revised to reflect any such economies. The Board noted that, generally, there was a reduction in the assets of the Funds and Underlying Funds as a result of market declines and related investor redemptions in 2008 and that Fund asset levels have not rebounded completely from those levels. In the case of certain Funds and Underlying Funds, asset levels have continued to decline since 2008. The Board, therefore, determined that, after giving effect to any applicable fee or expense caps, waivers or reimbursements, the Advisory Fee for each Fund or Underlying Fund appropriately reflected any economies of scale realized by that Fund, based upon net asset flows since 2008 and such factors as the variability of Money Manager investment advisory fees and other factors associated with the manager-of-managers structure employed by the Underlying Funds.
The Board considered, as a general matter, that fees payable to RIMCo by institutional clients with investment objectives similar to those of the Funds and other funds under the Board’s supervision, including the Underlying Funds, are lower, and, in some cases, may be substantially lower, than the rates paid by the funds supervised by the Board, including the Funds and Underlying Funds. The Trustees considered the differences in the nature and scope of services RIMCo provides to institutional clients and the funds under its supervision, including the Funds and Underlying Funds. RIMCo, as it has in the past, noted, among other things, that institutional clients have fewer administrative needs than the Funds. RIMCo also observed that since the Funds must constantly issue and redeem their shares, they are more difficult to manage than institutional accounts, where assets are relatively stable. In addition, RIMCo noted that the Funds and Underlying Funds are subject to heightened regulatory requirements relative to
| 52 | Basis for Approval of Investment Advisory Contracts |
Table of Contents
Russell Investment Funds
LifePoints® Variable Target Portfolio Series
Basis for Approval of Investment Advisory Contracts, continued
institutional clients. The Board noted that RIMCo provides office space and facilities to the Funds and Underlying Funds and all of the Funds’ and Underlying Funds’ officers. Accordingly, the Trustees concluded that the services provided to the Funds and Underlying Funds are sufficiently different from the services provided to the institutional clients that comparisons are not probative and should not be given significant weight.
On the basis of the Agreement Evaluation Information, and other information previously received by the Board from RIMCo during the course of the current year or prior years, or presented at or in connection with the Meeting by RIMCo, the Board, in respect of each Fund and Underlying Fund, found, after giving effect to any applicable waivers and/or reimbursements and considering differences in the composition and investment strategies of their respective Comparable Funds (1) the Advisory Fee charged by RIMCo was reasonable in light of the nature, scope and overall quality of the investment management and other services provided, and expected to be provided, to the Funds or Underlying Funds; (2) the relative expense ratio of each Fund and Underlying Fund was comparable to those of its Comparable Funds; (3) RIMCo’s methodology of allocating expenses of operating funds in the complex was reasonable; (4) other benefits and fees received by RIMCo or its affiliates from the Funds or Underlying Funds were not excessive; and (5) RIMCo’s profitability with respect to the Funds and each Underlying Fund was not excessive in light of the nature, scope and overall quality of the investment management and other services provided by RIMCo.
In evaluating the performance of the Funds and Underlying Funds generally relative to their Comparable Funds, the Board, in addition to factors discussed above, also considered RIMCo’s advice that many of the Underlying Funds’ Comparable Funds do not “equitize” their cash (i.e., cash awaiting investment or disbursement to satisfy redemptions or other fund obligations) and may hold large positions uninvested in their investment portfolios. By contrast, the Underlying Funds usually follow a strategy of equitizing their cash and fully investing their assets in pursuit of their investment objectives (the Underlying Funds’ strategy of equitizing cash and fully investing their assets is hereinafter referred to as their “full investment strategy”). RIMCo noted that the Underlying Funds’ full investment strategy generally will detract from their relative performance, and therefore the relative performance of the Funds, in a declining market, such as 2008, but may enhance relative performance in a rising market, such as 2009.
The Board further concluded that, under the circumstances, the performance of each of the Funds was consistent with continuation of the RIMCo Agreement. In evaluating performance, the Board considered each Fund’s and Underlying Fund’s absolute performance and such Fund’s performance relative to appropriate benchmarks and indices in addition to its performance relative to its Comparable Funds. In assessing performance relative to their Comparable Funds or benchmarks or in absolute terms, the Board also considered RIMCo’s stated investment strategy of managing the Underlying Funds in a risk-aware manner and the extraordinary capital market conditions during 2008. The Board noted that each of the Funds had been in existence for less than three years.
After considering the foregoing and other relevant factors and given the limited performance record of the Funds, the Board concluded for the reasons discussed herein that continuation of the RIMCo Agreement on its current terms and conditions would be in the best interests of each Fund and its shareholders and voted to approve the continuation of the RIMCo Agreement.
At the Agreement Evaluation Meeting, with respect to the evaluation of the terms of portfolio management contracts with Money Managers for the Underlying Funds, the Board received and considered information from RIMCo reporting, among other things, for each Money Manager, the Money Manager’s performance over various periods; RIMCo’s assessment of the performance of each Money Manager; any significant business relationships between the Money Manager and RIMCo or Russell Financial Services, Inc., the Funds’ and Underlying Funds’ underwriter; and RIMCo’s recommendation to retain the Money Manager at the current fee rate, to retain the Money Manager at a reduced fee rate or to terminate the Money Manager. The Board received reports during the course of the year from the Funds’ Chief Compliance Officer regarding each Money Manager’s compliance program. RIMCo recommended that each Money Manager be retained at its current fee rate. RIMCo has advised the Board that it does not regard Money Manager profitability as relevant to its evaluation of the portfolio management contracts with Money Managers because the willingness of Money Managers to serve in such capacity depends upon arm’s-length negotiations with RIMCo; RIMCo is aware of the fees charged by Money Managers to other clients; and RIMCo believes that the fees agreed upon with Money Managers are reasonable in light of the anticipated quality of investment advisory services to be rendered. The Board accepted RIMCo’s explanation in light of the Board’s findings as to the reasonableness of the Advisory Fee paid by each Fund and Underlying Fund and the fact that each Money Manager’s fee is paid by RIMCo.
Based substantially upon RIMCo’s recommendations, together with the Agreement Evaluation Information, the Board concluded that the fees paid to the Money Managers of each Underlying Fund are reasonable in light of the quality of the investment advisory services provided and that continuation of the portfolio management contract with each Money Manager of each Underlying Fund would be in the best interests of such Underlying Fund and its shareholders.
In their deliberations, the Trustees did not identify any particular information as to the RIMCo Agreement or, other than RIMCo’s recommendation, the portfolio management contract with any Money Manager for an Underlying Fund that was all-important or
| Basis for Approval of Investment Advisory Contracts | 53 |
Table of Contents
Russell Investment Funds
LifePoints® Variable Target Portfolio Series
Basis for Approval of Investment Advisory Contracts, continued
controlling and each Trustee attributed different weights to the various factors considered. The Trustees evaluated all information available to them on a Fund-by-Fund basis and their determinations were made in respect of each Fund and Underlying Fund.
Subsequently, the Board of Trustees received the following proposals from RIMCo: (1) at a meeting held on May 24, 2010, to a effect money manager change for the Real Estate Securities Fund and the Russell Investment Company Russell U.S. Quantitative Equity Fund; (2) at a meeting held on August 31, 2010, to effect a money manager change for the Russell Investment Company Russell Global Equity Fund; at that same meeting, to effect a money manager change for the Russell Investment Company Russell Global Equity Fund resulting from a change of control of one of the Fund’s Money Managers; (3) at a meeting held on October 6, 2010, to effect a money manager change for the Russell Investment Company Russell Global Credit Strategies Fund; and (4) at a meeting held on December 7, 2010, to effect a money manager change for the Russell Investment Company Russell Global Equity Fund; at that same meeting, to effect a money manager change for the Russell Investment Company Russell Global Equity Fund resulting from a change of control of one of the Fund’s Money Managers, to effect a money manager change for the Russell Investment Company Russell Emerging Markets Fund resulting from a change of control of one of the Fund’s Money Managers and to effect a money manager change for the Russell Investment Company Russell Global Infrastructure Fund resulting from a change of control of one of the Fund’s Money Managers. In the case of each such proposed change, the Trustees approved the terms of the proposed portfolio management contract based substantially upon RIMCo’s recommendation to hire the Money Manager at the proposed fee rate; any significant business relationships between the Money Manager and RIMCo or Russell Financial Services, Inc. the Fund’s underwriter; RIMCo’s explanation as to the lack of relevance of profitability to the evaluation of portfolio management contracts with money managers because the willingness of Money Managers to serve in such capacity depends upon arm’s-length negotiations with RIMCo; RIMCo’s awareness of the fees charged by the Money Manager to other clients; and RIMCo’s belief that the proposed investment advisory fees would be reasonable in light of the anticipated quality of investment advisory services to be rendered. The Trustees also considered their findings at their April 20, 2010 meeting as to the reasonableness of the aggregate investment advisory fees paid by the Fund, and the fact that the aggregate investment advisory fees paid by the Fund would not increase as a result of the implementation of the proposed money manager change because the money managers’ investment advisory fee is paid by RIMCo.
| 54 | Basis for Approval of Investment Advisory Contracts |
Table of Contents
LifePoints® Funds Variable Target Portfolio Series
Shareholder Requests for Additional Information — December 31, 2010 (Unaudited)
A complete unaudited schedule of investments is made available generally no later than 60 days after the end of the first and third quarters of each year. These reports are available (i) free of charge, upon request, by calling the Funds at (800) 787-7354, (ii) on the Securities and Exchange Commission’s website at www.sec.gov, and (iii) at the Securities and Exchange Commission’s public reference room.
The Board has delegated to RIMCo, as RIF’s investment adviser, the primary responsibility for monitoring, evaluating and voting proxies solicited by or with respect to issuers of securities in which assets of the Underlying Funds may be invested. RIMCo has established a proxy voting committee (“Committee”) and has adopted written proxy voting policies and procedures (“P&P”) and proxy voting guidelines (“Guidelines”). The Funds maintain a Portfolio Holdings Disclosure Policy that governs the timing and circumstances of disclosure to shareholders and third parties of information regarding the portfolio investments held by the Funds. A description of the P&P, Guidelines, Portfolio Holdings Disclosure Policy and additional information about Fund Trustees are contained in the Funds’ Statement of Additional Information (“SAI”). The SAI is available (i) free of charge, upon request, by calling the Funds at (800) 787-7354, and (ii) on the Securities and Exchange Commission’s website at www.sec.gov.
If possible, depending on contract owner registration and address information, and unless you have otherwise opted out, only one copy of the RIF prospectus and each annual and semi-annual report will be sent to contract owners at the same address. If you would like to receive a separate copy of these documents, please contact your Insurance Company. If you currently receive multiple copies of the prospectus, annual report and semi-annual report and would like to request to receive a single copy of these documents in the future, please call your Insurance Company.
Some Insurance Companies may offer electronic delivery of the Funds’ prospectuses and annual and semiannual reports. Please contact your Insurance Company for further details.
| Shareholder Requests for Additional Information | 55 |
Table of Contents
LifePoints® Funds Variable Target Portfolio Series
Disclosure of Information about Fund Trustees and Officers — December 31, 2010 (Unaudited)
The following tables provide information for each officer and Trustee of the Russell Fund Complex. The Russell Fund Complex consists of RIC, which has 41 funds, and RIF, which has nine funds. Each of the Trustees is a Trustee of both RIC and RIF. The first table provides information for the interested Trustee. The second table provides information for the independent Trustees. The third table provides information for the Trustees emeritus. The fourth table provides information for the officers.
| Name, Age, Address | Position(s) Held with Fund and Length of Time Served | Term of Office* | Principal Occupation(s) During the Past 5 Years | No. of Portfolios in Russell Fund Complex Overseen by Trustee | Other Directorships Held by Trustee | |||||||
INTERESTED TRUSTEE | ||||||||||||
# Sandra Cavanaugh
1301 Second Avenue | President and Chief Executive Officer since 2010
Trustee since 2010 | Appointed until successor is duly elected and qualified
Until successor is chosen and qualified by Trustees | • President and CEO RIC and RIF • Chairman of the Board, President and CEO, Russell Financial Services, Inc. • Chairman of the Board, President and CEO, Russell Fund Services Company (“RFSC”) • Chairman of the Board and President, Russell Insurance Agency, Inc. (insurance agency (“RIA”)) • May 2009 to December 2009, Executive Vice President, Retail Channel, SunTrust Bank • 2007 to January 2009, Senior Vice President, National Sales — Retail Distribution, JPMorgan Chase/Washington Mutual, Inc. • 1997 to 2007, President — WM Funds Distributor & Shareholder Services/WM Financial Services | 50 | None | |||||||
| # | Ms. Cavanaugh is also an officer and/or director of one or more affiliates of RIC and RIF and is therefore an Interested Trustee. |
| * | Each Trustee is subject to mandatory retirement at age 72. |
| 56 | Disclosure of Information about Fund Trustees and Officers |
Table of Contents
Russell Investment Funds
LifePoints® Funds Variable Target Portfolio Series
Disclosure of Information about Fund Trustees and Officers, continued — December 31, 2010 (Unaudited)
| Name, Age, Address | Position(s) Held with Fund and Length of Time Served | Term of Office* | Principal Occupation(s) During the Past 5 Years | No. of Portfolios in Russell Fund Complex Overseen by Trustee | Other Directorships Held by Trustee | |||||||
INDEPENDENT TRUSTEES | ||||||||||||
Thaddas L. Alston Born April 7, 1945
1301 Second Avenue Seattle, Washington 98101 | Trustee since 2006
Chairman of the Investment Committee since 2010 | Appointed until successor is duly elected and qualified Appointed until successor is duly elected and qualified | • Senior Vice President, Larco Investments, Ltd. (real estate firm) | 50 | None | |||||||
Kristianne Blake, Born January 22, 1954
1301 Second Avenue Seattle, Washington 98101 | Trustee since 2000
Chairman since 2005 | Appointed until successor is duly elected and qualified
Annual | • Director and Chairman of the Audit Committee, Avista Corp. • Trustee and Chairman of the Operations Committee, Principal Investor Funds and Principal Variable Contracts Funds • Regent, University of Washington • President, Kristianne Gates Blake, P.S. (accounting services) • February 2002 to June 2005, Chairman of the Audit Committee, RIC and RIF • Trustee and Chairman of the Operations and Distribution Committee, WM Group of Funds, 1999–2006 | 50 | • Director, Avista Corp (electric utilities) • Trustee, Principal Investor Funds (investment company); • Trustee, Principal Variable Contracts Funds (investment company) | |||||||
Daniel P. Connealy Born June 6, 1946
1301 Second Avenue Seattle, Washington 98101 | Trustee since 2003
Chairman of the Audit Committee since 2005 | Appointed until successor is duly elected and qualified Appointed until successor is duly elected and qualified | • June 2004 to present, Senior Vice President and Chief Financial Officer, Waddell & Reed Financial, Inc. | 50 | None | |||||||
Jonathan Fine, Born July 8, 1954
1301 Second Avenue Seattle, Washington 98101 | Trustee since 2004 | Appointed until successor is duly elected and qualified | • President and Chief Executive Officer, United Way of King County, WA | 50 | None | |||||||
Raymond P. Tennison, Jr. Born December 21, 1955
1301 Second Avenue Seattle, Washington 98101 | Trustee since 2000
Chairman of the Nominating and Governance Committee since 2007 | Appointed until successor is duly elected and qualified Appointed until successor is duly elected and qualified | • Vice Chairman, Simpson Investment Company • Until April 2009, President, Simpson Investment Company and several additional subsidiary companies, including Simpson Timber Company, Simpson Paper Company and Simpson Tacoma Kraft Company | 50 | None |
| Disclosure of Information about Fund Trustees and Officers | 57 |
Table of Contents
Russell Investment Funds
LifePoints® Funds Variable Target Portfolio Series
Disclosure of Information about Fund Trustees and Officers, continued — December 31, 2010 (Unaudited)
| Name, Age, Address | Position(s) Held with Fund and Length of Time Served | Term of Office* | Principal Occupation(s) During the Past 5 Years | No. of Portfolios in Russell Fund Complex Overseen by Trustee | Other Directorships Held by Trustee | |||||||
INDEPENDENT TRUSTEES (continued) | ||||||||||||
Jack R. Thompson, Born March 21, 1949
1301 Second Avenue Seattle, Washington 98101 | Trustee since 2005 | Appointed until successor is duly elected and qualified | • September 2003 to September 2009, Independent Board Chair and Chairman of the Audit Committee, Sparx Asia Funds • September 2007 to present, Director, Board Chairman and Chairman of the Audit Committee, LifeVantage Corporation (health products company) | 50 | • Director, Board Chairman and Chairman of the Audit Committee, LifeVantage Corporation (health products company) | |||||||
Julie W. Weston, Born October 2, 1943
1301 Second Avenue Seattle, Washington 98101 | Trustee since 2002 | Appointed until successor is duly elected and qualified Appointed until successor is duly elected and qualified | Retired | 50 | None | |||||||
| * | Each Trustee is subject to mandatory retirement at age 72. |
| 58 | Disclosure of Information about Fund Trustees and Officers |
Table of Contents
Russell Investment Funds
LifePoints® Funds Variable Target Portfolio Series
Disclosure of Information about Fund Trustees and Officers, continued — December 31, 2010 (Unaudited)
| Name, Age, Address | Position(s) Held with Fund and Length of Time Served | Term of Office | Principal Occupation(s) During the Past 5 Years | No. of Portfolios in Russell Fund Complex Overseen by Trustee | Other Directorships Held by Trustee | |||||||
TRUSTEES EMERITUS | ||||||||||||
* George F. Russell, Jr., Born July 3, 1932
1301 Second Avenue Seattle, Washington 98101 | Trustee Emeritus and Chairman Emeritus since 1999 | Until resignation or removal | • Director Emeritus, Frank Russell Company (investment consultant to institutional investors (“FRC”)) and RIMCo • Chairman Emeritus, RIC and RIF; Russell Implementation Services Inc. (broker-dealer and investment adviser (“RIS”)); Russell 20-20 Association (non-profit corporation); and Russell Trust Company (non-depository trust company (“RTC”)) • Chairman, Sunshine Management Services, LLC (investment adviser) | 50 | None | |||||||
Paul E. Anderson, Born October 15, 1931
1301 Second Avenue Seattle, Washington 98101 | Trustee Emeritus since 2007 | Five year term | • President, Anderson Management Group LLC (private investments consulting) • Trustee, RIC and RIF until 2006 • February 2002 to June 2005, Lead Trustee, RIC and RIF • Chairman of the Nominating and Governance Committee, 2006 | 50 | None | |||||||
Lee C. Gingrich, Born October 6, 1930
1301 Second Avenue Seattle, Washington 98101 | Trustee Emeritus since 2006 | Five year term | • Retired since 1995 • Trustee of RIC and RIF until 2005 • Chairman of the Nominating and Governance Committee 2001–2005 | 50 | None | |||||||
| * | Mr. Russell is also a director emeritus of one or more affiliates of RIC and RIF. |
| Disclosure of Information about Fund Trustees and Officers | 59 |
Table of Contents
Russell Investment Funds
LifePoints® Funds Variable Target Portfolio Series
Disclosure of Information about Fund Trustees and Officers, continued — December 31, 2010 (Unaudited)
| Name, Age, Address | Position(s) Held with Fund and Length of Time Served | Term of Office | Principal Occupation(s) During the Past 5 Years | |||
OFFICERS | ||||||
Cheryl Wichers Born December 16, 1966
1301 Second Avenue Seattle, Washington 98101 | Chief Compliance Officer since 2005 | Until removed by Independent Trustees | • Chief Compliance Officer, RIC • Chief Compliance Officer, RIF • Chief Compliance Officer, RIMCo • Chief Compliance Officer, RFSC • April 2002–May 2005, Manager, Global Regulatory Policy | |||
Sandra Cavanaugh Born May 10, 1954
1301 Second Avenue Seattle, Washington 98101 | President and Chief Executive Officer since 2010
| Appointed until successor is duly elected and qualified
| • President and CEO, RIC and RIF • Chairman of the Board, President and CEO, Russell Financial Services, Inc. • Chairman of the Board, President and CEO, RFSC • Chairman of the Board and President, Russell Insurance Agency, Inc. (insurance agency (“RIA”)) • May 2009 to December 2009, Executive Vice President, Retail Channel, SunTrust Bank • 2007 to January 2009, Senior Vice President, National Sales — Retail Distribution, JPMorgan Chase/Washington Mutual, Inc. • 1997 to 2007, President — WM Funds Distributor & Shareholder Services/WM Financial Services | |||
Mark E. Swanson, Born November 26, 1963
1301 Second Avenue Seattle, Washington 98101 | Treasurer and Chief Accounting Officer, Chief Financial Officer since 1998 | Until successor is chosen and qualified by Trustees | • Treasurer, Chief Accounting Officer and CFO, RIC and RIF • Director, Funds Administration, RIMCo, RFSC, RTC and Russell Financial Services, Inc. • Treasurer and Principal Accounting Officer, SSgA Funds | |||
Peter Gunning, Born February 22, 1967
1301 Second Avenue Seattle, Washington 98101 | Chief Investment Officer since 2008 | Until removed by Trustees | • Chief Investment Officer, RIC and RIF • Director, RIMCo and FRC • 1996 to 2008 Chief Investment Officer, Russell, Asia Pacific | |||
Mary Beth Rhoden Born April 25, 1969
1301 Second Avenue Seattle, Washington 98101 | Secretary since 2010 | Until successor is chosen and qualified by Trustees | • 1999 to 2010 Assistant Secretary, RIC and RIF • Associate General Counsel, FRC • Secretary, RIMCo, RFSC and Russell Financial Services, Inc. • Secretary and Chief Legal Counsel, RIC and RIF |
| 60 | Disclosure of Information about Fund Trustees and Officers |
Table of Contents
LifePoints® Funds Variable Target Portfolio Series
1301 Second Avenue, Seattle, Washington 98101
(800) 787-7354
Interested Trustee
Sandra Cavanaugh
Independent Trustees
Thaddas L. Alston
Kristianne Blake
Daniel P. Connealy
Jonathan Fine
Raymond P. Tennison, Jr.
Jack R. Thompson
Julie W. Weston
Trustees Emeritus
George F. Russell, Jr.
Paul E. Anderson
Lee C. Gingrich
Officers
Sandra Cavanaugh, President and Chief Executive Officer
Cheryl Wichers, Chief Compliance Officer
Peter Gunning, Chief Investment Officer
Mark E. Swanson, Treasurer and Chief Accounting Officer
Mary Beth Rhoden, Secretary
Adviser
Russell Investment Management Company
1301 Second Avenue
Seattle, Washington 98101
Administrator and Transfer and Dividend Disbursing Agent
Russell Fund Services Company
1301 Second Avenue
Seattle, Washington 98101
Custodian
State Street Bank and Trust Company
Josiah Quincy Building
200 Newport Avenue
North Quincy, MA 02171
Office of Shareholder Inquiries
1301 Second Avenue
Seattle, Washington 98101
(800) 787-7354
Legal Counsel
Dechert LLP
200 Clarendon Street, 27th Floor
Boston, MA 02116-5021
Distributor
Russell Financial Services, Inc.
1301 Second Avenue
Seattle, Washington 98101
Independent Registered Public Accounting Firm
PricewaterhouseCoopers LLP
1420 5th Avenue
Suite 1900
Seattle, WA 98101
Money Managers of Underlying Funds as of December 31, 2010
RIC Russell Global Credit Strategies Fund
DDJ Capital Management, LLC, Waltham, MA
Oaktree Capital Management, L.P., Los Angeles, CA
Stone Harbor Investment Partners LP, New York, NY
RIF Core Bond Fund
Goldman Sachs Asset Management, L.P., New York, NY
Metropolitan West Asset Management, LLC, Los Angeles, CA
Pacific Investment Management Company LLC, Newport Beach, CA
RIC Russell Investment Grade Bond Fund
Metropolitan West Asset Management, LLC, Los Angeles, CA
Neuberger Berman Fixed Income LLC, Chicago, IL
Pacific Investment Management Company LLC, Newport Beach, CA
Western Asset Management Company, Pasadena, CA
Western Asset Management Company Limited, London, England
RIC Russell U.S. Quantitative Equity Fund
Aronson+Johnson+Ortiz, LP, Philadelphia, PA
INTECH Investment Management LLC, West Palm Beach, FL
Jacobs Levy Equity Management, Inc., Florham Park, NJ
Numeric Investors LLC, Boston, MA
RIF Aggressive Equity Fund
ClariVest Asset Management LLC, San Diego, CA
DePrince, Race & Zollo, Inc., Winter Park, FL
Jacobs Levy Equity Management, Inc., Florham Park, NJ
Ranger Investment Management, L.P., Dallas, TX
Signia Capital Management, LLC, Spokane, WA
Tygh Capital Management, Inc., Portland, OR
RIF Multi-Style Equity Fund
BlackRock Capital Management, Inc., New York, NY
Columbus Circle Investors, Stamford, CT
DePrince, Race & Zollo, Inc., Winter Park, FL
First Eagle Investment Management, LLC, New York, NY
Institutional Capital LLC, Chicago, IL
Jacobs Levy Equity Management, Inc., Florham Park, NJ
Montag & Caldwell, LLC, Atlanta, GA
Suffolk Capital Management, LLC, New York, NY
RIC Russell Emerging Markets Fund
AllianceBernstein L.P., New York, NY
Arrowstreet Capital, Limited Partnership, Boston, MA
Genesis Asset Managers, LLP, Guernsey, Channel Islands
Harding Loevner LP, Somerville, NJ
T. Rowe Price Associates, Inc., Baltimore, MD
T. Rowe Price International, Inc., Baltimore, MD
T. Rowe Price International, Ltd, London, England
UBS Global Asset Management (Americas) Inc., Chicago, IL
| Adviser, Money Managers and Service Providers | 61 |
Table of Contents
Russell Investment Funds
LifePoints® Funds Variable Target Portfolio Series
1301 Second Avenue, Seattle, Washington 98101
(800) 787-7354
RIC Russell Global Equity Fund
GLG Inc., New York, NY
Harris Associates, L.P., Chicago, IL
MFS Institutional Advisors, Inc., Boston, MA
Sanders Capital, LLC, New York, NY
Tradewinds Global Investors, LLC, Los Angeles, CA
T. Rowe Price Associates, Inc., Baltimore, MD
T. Rowe Price International, Inc., Baltimore, MD
RIF Non-U.S. Fund
Barrow, Hanley, Mewhinney & Strauss, LLC, Dallas, TX
Marsico Capital Management, LLC, Denver, CO
MFS Institutional Advisors, Inc., Boston, MA
Pzena Investment Management, LLC, New York, NY
RIC Russell Commodity Strategies Fund
Credit Suisse Asset Management, LLC, New York, NY
Goldman Sachs Asset Management, L.P., New York, NY
RIC Russell Global Infrastructure Fund
Cohen & Steers Capital Management, Inc., New York, NY
Nuveen Asset Management, LLC, Minneapolis, MN
Macquarie Capital Investment Management LLC, New York, NY
RIF Real Estate Securities Fund
AEW Capital Management, L.P., Boston, MA
Cohen & Steers Capital Management, Inc., New York, NY
INVESCO Advisers, Inc. which acts as a money manager to the Fund through its INVESCO Real Estate Division, Dallas, TX
This report is prepared from the books and records of the Funds and is submitted for the general information of shareholders and is not authorized for distribution to prospective investors unless accompanied or preceded by an effective Prospectus. Nothing herein contained is to be considered an offer of sale or a solicitation of an offer to buy shares of Russell Investment Funds. Such offering is made only by Prospectus, which includes details as to offering price and other material information.
| 62 | Adviser, Money Managers and Service Providers |
Table of Contents
| Russell Investment Funds | 1301 Second Avenue | 800-787-7354 | ||
| Seattle, Washington 98101 | Fax: 206-505-3495 | |||
| www.russell.com |


36-08-195
Table of Contents
Item 2. Code of Ethics. [Annual Report Only]
| (a) | As of the end of the period covered by the report, the registrant has adopted a code of ethics that applies to the registrant’s principal executive officer and principal financial officer (“Code”). |
| (b) | That Code comprises written standards that are reasonably designed to deter wrongdoing and to promote: |
| 1) | honest and ethical conduct, including the ethical handling of actual or apparent conflicts of interest between personal and professional relationships; |
| 2) | full, fair, accurate, timely and understandable disclosure in reports and documents that a registrant files with, or submits to, the Securities and Exchange Commission (“SEC”) and in other public communications made by each Mutual Fund; |
| 3) | compliance with applicable laws and governmental rules and regulations; |
| 4) | the prompt internal reporting to an appropriate person or persons identified in the Code of violations of the Code; and |
| 5) | accountability for adherence to the Code. |
| (c) | The Code was restated as of December 6, 2004; the restatement did not involve any material change. |
| (d) | As of the end of the period covered by the report, there have been no waivers granted from a provision of the Code that applies to the registrant’s principal executive officer and principal financial officer. |
| (e) | Not applicable. |
| (f) | The registrant has filed with the SEC, pursuant to Item 12(a)(1), a copy of the Code that applies to the registrant’s principal executive officer, principal financial officer, principal accounting officer or controller, or persons performing similar functions, as an exhibit to its annual report on this Form N-CSR. |
Item 3. Audit Committee Financial Expert. [Annual Report Only]
Registrant’s board of trustees has determined at a meeting held on February 23, 2005, that the Registrant has at least one audit committee financial expert serving on its audit committee. Daniel P. Connealy was determined to be the Audit Committee Financial Expert and is also determined to be “independent” for purposes of Item 3, paragraph (a)(2)(i) and (ii) of Form N-CSR.
Item 4. Principal Accountant Fees and Services. [Annual Report Only]
Audit Fees
(a) The aggregate fees billed for each of the last two fiscal years for professional services rendered by the principal accountant for the audit of the registrant’s annual financial statements
Table of Contents
or services that are normally provided by the accountant in connection with statutory and regulatory filings or engagements for those fiscal years were as follows:
2009 | $ | 176,780 | ||
2010 | $ | 181,560 |
Audit-Related Fees
(b) The aggregate fees billed in each of the last two fiscal years for assurance and related services by the principal accountant that are reasonably related to the performance of the audit of the registrant’s financial statements and are not reported under paragraph (a) of this Item and the nature of the services comprising those fees were as follows:
Fees | Nature of Services | |||
| 2009 | $63,100 | Performance of agreed-upon procedures with respect to 06/30/09 semi-annual reports | ||
| 2010 | $65,991 | Performance of agreed-upon procedures with respect to 06/30/10 semi-annual reports | ||
Tax Fees
(c) The aggregate fees billed in each of the last two fiscal years for professional services rendered by the principal accountant for tax compliance, tax advice, and tax planning and the nature of the services comprising the fees were as follows:
Fees | Nature of Services | |||
| 2009 | $66,440 | Tax services | ||
| 2010 | $68,431 | Tax services | ||
All Other Fees
(d) The aggregate fees billed in each of the last two fiscal years for products and services provided by the principal accountant, other than the services reported in paragraphs (a) through (c) of this Item and the nature of the services comprising those fees were as follows:
Fees | Nature of Services | |||
| 2009 | $878 | Anti-money laundering, overhead/travel | ||
| 2010 | $0 | Overhead/travel | ||
(e) (1) Registrant’s audit committee has adopted the following pre-approval policies and procedures for certain services provided by Registrant’s accountants:
Table of Contents
Russell Investment Company
Russell Investment Funds
Audit and Non-Audit Services Pre-Approval Policy
Effective Date: May 19, 2003
As amended through November 14, 2005
| I. | Statement of Purpose. |
This Policy has been adopted by the Audit Committee (the “RIC Audit Committee”) of the Board of Trustees of Russell Investment Company (“RIC”) and the Audit Committee (the “RIF Audit Committee”) of the Russell Investment Funds (“RIF”) to apply to any and all engagements of the independent auditor to RIC and RIF, respectively, for audit, non-audit, tax or other services. In the case of RIC, the term “Audit Committee” as used in this policy shall refer to the RIC Audit Committee and the term “Fund” shall refer to RIC. In the case of RIF, the term “Audit Committee” as used in this Policy shall refer to the RIF Audit Committee and the term “Fund” shall refer to RIF. The term “Investment Adviser” shall refer to Russell Investment Management Company. This Policy does not delegate to management the responsibilities set forth herein for the pre-approval of services performed by the Funds’ independent auditor.
| II. | Statement of Principles. |
Under the Sarbanes-Oxley Act of 2002 (the “Act”), the Audit Committee of the Fund’s Board of Trustees (the “Audit Committee”) is charged with responsibility for the appointment, compensation and oversight of the work of the independent auditor for the Fund. As part of these responsibilities, the Audit Committee is required to pre-approve the audit services and permissible non-audit services (“non-audit services”) performed by the independent auditor for the Fund to assure that the independence of the auditor is not in any way compromised or impaired. In determining whether an auditor is independent, there are three guiding principles under the Act that must be considered. In general, the independence of the auditor to the Fund would be deemed impaired if the auditor provides a service whereby it:
| • | Functions in the role of management of the Fund, the adviser of the Fund or any other affiliate* of the Fund; |
| • | Is in the position of auditing its own work; or |
| • | Serves in an advocacy role for the Fund, the adviser of the Fund or any other affiliate of the Fund. |
Accordingly, it is the policy of the Fund that the independent auditor for the Fund must not be engaged to perform any service that contravenes any of the three guidelines set forth above, or which in any way could be deemed to impair or compromise the independence of the auditor for
| * | For purposes of this Policy, an affiliate of the Funds is defined as the Funds’ investment adviser (but not a sub-adviser whose role is primarily portfolio management and whose activities are overseen by the principal investment adviser), and any entity controlling, controlled by, or under common control with the investment adviser that provides ongoing services to the Fund. |
Table of Contents
the Fund. This Policy is designed to accomplish those requirements and will henceforth be applied to all engagements by the Fund of its independent auditor, whether for audit, audit-related, tax, or other non-audit services.
Rules adopted by the United States Securities and Exchange Commission (the “SEC”) establish two distinct approaches to the pre-approval of services by the Audit Committee. The proposed services either may receive general pre-approval through adoption by the Audit Committee of a list of authorized services for the Fund, together with a budget of expected costs for those services (“general pre-approval”), or specific pre-approval by the Audit Committee of all services provided to the Fund on a case-by-case basis (“specific pre-approval”). The Audit Committee believes that the combination of these two approaches reflected in this Policy will result in an effective and efficient procedure for the pre-approval of permissible services performed by the Fund’s independent audit. The appendices to this Policy list the audit, audit-related, tax and other services that have the general pre-approval of the Audit Committee. As set forth in this Policy, unless a particular service has received general pre-approval, those services will require specific pre-approval by the Audit Committee before any such services can be provided by the independent auditor. Any proposed service to the Fund that exceeds the pre-approved budget for those services will also require specific pre-approval by the appropriate Audit Committee.
In assessing whether a particular audit or non-audit service should be approved, the Audit Committee will take into account the ratio between the total amounts paid for audit, audit-related, tax and other services, based on historical patterns at the Fund, with a view toward assuring that the level of fees paid for non-audit services as they relate to the fees paid for audit services does not compromise or impair the independence of the auditor. The Audit Committee will review the list of general pre-approved services, including the pre-approved budget for those services, at least annually and more frequently if deemed appropriate by the Audit Committee, and may implement changes thereto from time to time.
| III. | Delegation. |
As provided in the Act and in the SEC’s rules, the Audit Committee from time to time may delegate either general or specific pre-approval authority to one or more of its members. Any member to whom such authority is delegated must report, for informational purposes only, any pre-approval decisions to the Audit Committee at its next scheduled meeting.
| IV. | Audit Services. |
The annual audit services engagement terms and fees for the independent auditor for the Fund require specific pre-approval of the Audit Committee. Audit services include the annual financial statement audit and other procedures required to be performed by the independent auditor in order to be able to form an opinion on the financial statements for the Fund for that year. These other procedures include reviews of information systems, procedural reviews and testing performed in order to understand and rely on the Fund’s systems of internal control, and consultations relating to the audit. Audit services also include the attestation engagement for the independent auditor’s report on the report from management on financial reporting internal
Table of Contents
controls. The Audit Committee will review the audit services engagement as necessary or appropriate in the sole judgment of the Audit Committee.
In addition to the pre-approval by the Audit Committee of the annual engagement of the independent auditor to perform audit services, the Audit Committee may grant general pre-approval to other audit services, which are those services that only the independent auditor reasonably can provide. These may include statutory audits and services associated with the Fund’s SEC registration statement on Form N-1A, periodic reports and documents filed with the SEC or other documents issued in connection with the Fund’s securities offerings.
The Audit Committee has pre-approved the audit services set forth in Schedule A of the Audit and Non-Audit Pre-Approved Services. All other audit services not listed in Schedule A of the Audit and Non-Audit Pre-Approved Services must be specifically pre-approved by the Audit Committee.
| V. | Audit-Related Services. |
Audit-related services are assurance and related services that are reasonably related to the performance of the audit or review of the financial statements for the Fund, or the separate financial statements for a series of the Fund that are traditionally performed by the independent auditor. Because the Audit Committee believes that the provision of audit-related services does not compromise or impair the independence of the auditor and is consistent with the SEC’s rules on auditor independence, the Audit Committee may grant pre-approval to audit related services. “Audit related services” include, among others, accounting consultations related to accounting, financial reporting or disclosure matters not classified as “audit services;” assistance with understanding and implementing new accounting and financial report or disclosure matters not classified as “audit services;” assistance with understanding and implementing new accounting and financial reporting guidance from rulemaking authorities; agreed upon or expanded audit procedures related to accounting and/or billing records required to respond to or comply with financial, accounting or regulatory reporting matters; and assistance with internal reporting requirements under Form N-SAR and Form N-CSR.
The Audit Committee has pre-approved the audit-related services set forth in Schedule B of the Audit and Non-Audit Pre-Approved Services. All other audit-related services not listed in Schedule B of the Audit and Non-Audit Pre-Approved Services must be specifically pre-approved by the Audit Committee.
| VI. | Tax Services. |
The Audit Committee believes that the independent auditor can provide tax services to the Fund, such as tax compliance, tax planning and tax advice, without impairing the auditor’s independence and the SEC has stated that the independent auditor may provide such services. Consequently, the Audit Committee believes that it may grant general pre-approval to those tax services that have historically been provided by the auditor, that the Audit Committee has reviewed and believes would not impair the independence of the auditor, and that are consistent with the SEC’s rules on auditor independence. However, the Audit Committee will not permit
Table of Contents
the retention of the independent auditor to provide tax advice in connection with any transaction recommended by the independent auditor, the sole business purpose of which may be tax avoidance and the tax treatment of which may not be supported by the United States Internal Revenue Code and related regulations or the applicable tax statutes and regulations that apply to the Funds investments outside the United States. The Audit Committees will consult with the Treasurer of the Fund or outside counsel to determine that the Fund’s tax planning and reporting positions are consistent with this policy. The Audit Committee has pre-approved the tax services set forth in Schedule C of the Audit and Non-Audit Pre-Approved Services. All other tax services not listed in Schedule C of the Audit and Non-Audit Pre-Approved Services must be specifically pre-approved by the Audit Committee.
| VII. | All Other Services. |
The Audit Committee believes, based on the SEC’s rules prohibiting the independent auditor from providing specific non-audit services, that other types of non-audit services are permitted. Accordingly, the Audit Committee believes that it may grant general pre-approval to those permissible non-audit services classified as “all other” services that the Audit Committee believes are routine and recurring services, would not impair or compromise the independence of the auditor and are consistent with the SEC’s rules on auditor independence.
The Audit Committee has pre-approved the permissible “all other services” set forth in Schedule D of the Audit and Non-Audit Pre-Approved Services. Permissible “all other services” not listed in Schedule D of the Audit and Non-Audit Pre-Approved Services must be specifically pre-approved by the Audit Committee.
A list of the SEC’s prohibited non-audit services is attached to this Policy as Schedule E of the Audit and Non-Audit Pre-Approved Services. The SEC’s rules and relevant official interpretations and guidance should be consulted to determine the scope of these prohibited services and the applicability of any exceptions to certain of the prohibitions. Under no circumstance may an executive, manager or associate of the Fund, or the Investment Adviser, authorize the independent auditor for the Fund to provide prohibited non-audit services.
| VIII. | Pre-Approval Fee Levels or Budgeted Amounts. |
Pre-Approval fee levels or budgeted amounts for all services to be provided by the independent auditor will be established annually by the Audit Committee and shall be subject to periodic subsequent review during the year if deemed appropriate by the Audit Committee. (Separate amounts may be specified for the Fund and for other affiliates in the investment company complex subject to pre-approval). Any proposed services exceeding these levels or amounts will require specific pre-approval by the Audit Committee. The Audit Committee will be mindful of the overall relationship of fees for audit and non-audit services in determining whether to pre-approve any such services. For each fiscal year, the Audit Committee may determine the appropriateness of the ratio between the total amount of fees for Audit, Audit-related, and Tax services for the Fund (including any Audit-related or Tax services fees for affiliates subject to pre-approval), and the total amount of fees for certain permissible non-audit services classified as
Table of Contents
“all other services” for the Fund (including any such services for affiliates subject to pre-approval by the Audit Committee).
| IX. | Procedures. |
All requests or applications for services to be provided by the independent auditor that do not require specific pre-approval by the Audit Committee will be submitted to the “RIC/RIF Clearance Committee” (the “Clearance Committee”) (which shall be comprised of not less than three members, including the Treasurer of the Fund who shall serve as its Chairperson) and must include a detailed description of the services to be rendered and the estimated costs of those services. The Clearance Committee will determine whether such services are included within the list of services that have received general pre-approval by the Audit Committee. The Audit Committee will be informed not less frequently than quarterly by the Chairperson of the Clearance Committee of any such services rendered by the independent auditor for the Fund and the fees paid to the independent auditors for such services.
Requests or applications to provide services that require specific pre-approval by the Audit Committee will be submitted to the Audit Committee by both the independent auditor and the Clearance Committee and must include a joint certification by the engagement partner of the independent auditor and the Chairperson of the Clearing Committee that, in their view, the request or application is consistent with the SEC’s rules governing auditor independence.
The Internal Audit Department of Frank Russell Company, the parent company of RFSC, and the officers of RIC and RIF will report to the Chairman of the Audit Committee any breach of this Policy that comes to the attention of the Internal Audit Department of Frank Russell Company or an officer of RIC or RIF.
| X. | Additional Requirements. |
The Audit Committee has determined to take additional measures on an annual basis to meet its responsibility to oversee the work performed by the independent auditor and to assure the internal auditor’s continuing independence from the Fund and its affiliates, including Frank Russell Company. Such efforts will include, but not be limited to, reviewing a written annual statement from the independent auditor delineating all relationships between the independent auditor and RIC, RIF, and Russell and its subsidiaries and affiliates, consistent with Independence Standards Board Standard No. 1, and discussing with the independent auditor its methods and procedures for ensuring its independence.
Table of Contents
(e) (2) The percentage of services described in each of paragraphs (b) through (d) of this Item that were approved by the audit committee pursuant to paragraph (c)(7)(i)(C) of Rule 2-01 of Regulation S-X is as follows:
Audit Fees | 100 | % | ||
Audit-Related Fees | 100 | % | ||
Tax Fees | 100 | % | ||
All Other Fees | 100 | % |
(f) For services, 50 percent or more of which were pre-approved, the percentage of hours expended on the principal accountant’s engagement to audit the registrant’s financial statements for the most recent fiscal year that were attributed to work performed by persons other than the principal accountant’s full-time, permanent employees was 0%.
(g) The aggregate non-audit fees billed by registrant’s accountant for services rendered to the registrant, and rendered to the registrant’s investment adviser (not including any sub-adviser whose role is primarily portfolio management and is subcontracted with or overseen by another investment adviser), and any entity controlling, controlled by, or under common control with the adviser that provides ongoing services to the registrant for each of the last two fiscal years of the registrant were as follows:
2009 | $ | 0 | ||
2010 | $ | 0 |
(h) The registrant’s audit committee of the board of trustees has considered whether the provision of nonaudit services that were rendered to the registrant’s investment adviser (not including any subadviser whose role is primarily portfolio management and is subcontracted with or overseen by another investment adviser), and any entity controlling, controlled by, or under common control with the investment adviser that provides ongoing services to the registrant that were not pre-approved pursuant to paragraph (c)(7)(ii) of Rule 2-01 of Regulation S-X is compatible with maintaining the principal accountant’s independence.
Item 5. Audit Committee of Listed Registrants. [Not Applicable]
Item 6. [Schedules of Investments are included as part of the Report to Shareholders filed under Item 1 of this form]
Items 7-9. [Not Applicable]
Item 10. Submission of Matters to a Vote of Security Holders
There have been no changes to the procedures by which shareholders may recommend nominees to the Registrant’s Board of Trustees that would require disclosure herein.
Table of Contents
Item 11. Controls and Procedures
(a) Registrant’s principal executive officer and principal financial officer have concluded that Registrant’s disclosure controls and procedures (as defined in Rule 30a-2(c) under the Investment Company Act of 1940 (the “Act”)) are effective, based on their evaluation of these controls and procedures as of a date within 90 days of the date this report is filed with the Securities and Exchange Commission.
(b) There were no significant changes in Registrant’s internal control over financial reporting that occurred during the period covered by this report that has materially affected or is likely to materially affect Registrant’s internal control over financial reporting.
Item 12. Exhibit List
(a) Registrant’s code of ethics described in Item 2.
(b) Certification for principal executive officer of Registrant as required by Rule 30a-2(a) under the Act and certification for principal financial officer of Registrant as required by Rule 30a-2(a) under the Act.
Table of Contents
SIGNATURES
Pursuant to the requirements of the Securities Exchange Act of 1934 and the Investment Company Act of 1940, the Registrant has duly caused this report to be signed on its behalf by the undersigned, thereunto duly authorized.
| Russell Investment Funds | ||
| By: | /s/ Sandra Cavanaugh | |
| Sandra Cavanaugh | ||
| Principal Executive Officer and Chief Executive Officer | ||
| Date: | March 8, 2011 | |
Pursuant to the requirements of the Securities Exchange Act of 1934 and the Investment Company Act of 1940, this report has been signed below by the following persons on behalf of the Registrant and in the capacities and on the dates indicated.
| By: | /s/ Sandra Cavanaugh | |
| Sandra Cavanaugh | ||
| Principal Executive Officer and Chief Executive Officer | ||
| Date: | March 8, 2011 | |
| By: | /s/ Mark E. Swanson | |
| Mark E. Swanson | ||
| Principal Financial Officer, Principal Accounting Officer and Treasurer | ||
| Date: | March 8, 2011 | |