| | | | |
OMB APPROVAL |
| OMB Number: | | 3235-0570 |
| Expires: | | August 31, 2011 |
| Estimated average burden |
| hours per response: | | 18.9 |
UNITED STATES
SECURITIES AND EXCHANGE COMMISSION
Washington, D.C. 20549
FORM N-CSR
CERTIFIED SHAREHOLDER REPORT OF REGISTERED MANAGEMENT
INVESTMENT COMPANIES
Investment Company Act file number: 811-05371
Russell Investment Funds
(Exact name of registrant as specified in charter)
909 A Street, Tacoma Washington 98402
(Address of principal executive offices) (Zip code)
Gregory J. Lyons, Secretary and Chief Legal Officer
Russell Investment Funds
909 A Street
Tacoma, Washington 98402
253-439-2406
(Name and address of agent for service)
Registrant’s telephone number, including area code: 253-572-9500
Date of fiscal year end: December 31
Date of reporting period: January 1, 2009 to December 31, 2009
| Item 1. | Reports to Stockholders |

2009 ANNUAL REPORT
Russell Investment Funds
DECEMBER 31, 2009
FUND
Multi-Style Equity Fund
Aggressive Equity Fund
Non-U.S. Fund
Core Bond Fund
Real Estate Securities Fund

Russell Investment Funds
Russell Investment Funds is a series investment company with nine different investment portfolios referred to as Funds. These financial statements report on five of these Funds.
Russell Investment Funds
Annual Report
December 31, 2009
Table of Contents
Russell Investment Funds
Copyright © Russell Investments 2010. All rights reserved.
Russell Investments is a Washington, USA corporation, which operates through subsidiaries worldwide and is a subsidiary of The Northwestern Mutual Life Insurance Company.
Fund objectives, risks, charges and expenses should be carefully considered before investing. A prospectus containing this and other important information must precede or accompany this material. Please read the prospectus carefully before investing.
Securities products and services offered through Russell Financial Services, Inc., member FINRA, part of Russell Investments.
Indices and benchmarks are unmanaged and cannot be invested in directly. Returns represent past performance, are not a guarantee of future performance, and are not indicative of any specific investment. Index return information is provided by vendors and although deemed reliable, is not guaranteed by Russell Investments or its affiliates.
Russell Investments is the owner of the trademarks, service marks, and copyrights related to its respective indexes.
Performance quoted represents past performance and does not guarantee future results. The investment return and principal value of an investment will fluctuate so that shares, when redeemed, may be worth more or less than their original cost. Current performance may be lower or higher than the performance data quoted.
To Our Shareholders
We are pleased to provide you with Russell Investment Funds’ 2009 Annual Report. It includes portfolio management discussions and fund-specific details that will give you an in-depth understanding of fund performance for the fiscal year ending December 31, 2009.
Every day, we strive to improve financial security for people and earn the continued support of our investors. Despite another year of economic uncertainty, the markets have rebounded sharply from the spring. We are sensitive to ongoing investor concerns and recognize the need for investment solutions that help provide the opportunities investors seek.
We continue to believe that investors are well served by remaining focused on long-term disciplined investing in well-diversified, asset allocated portfolios and that they should continue to talk with their financial advisors to ensure their portfolios remain aligned with long term goals.
The Russell Investments team has years of experience in managing people’s money through various market cycles, trends and turnarounds. As always, we are continuously monitoring our investment managers and our funds to ensure adherence to their long-term strategies.
We appreciate your continued support.
Best regards,

Greg Stark
Chief Executive Officer, Chairman and President
Russell Investment Management Company
Russell Investment Funds
Market Summary as of December 31, 2009 (Unaudited)
U.S. Equity Markets
The U.S. equity market began the year with elevated volatility and weakness before rebounding sharply and ultimately delivering a strong positive return for 2009. The broad market Russell 3000® Index rose 28.3% over the year ended December 31, 2009 as the global economy began to emerge from the worst recession and financial crisis in almost a century. The fear and panic which had pervaded the market in 2008 and early 2009 began to dissipate in March 2009 as investors increased their risk appetites.
Even with coordinated actions by central banks across the globe and a variety of highly stimulative governmental policies in place, liquidity remained an issue for many banks, consumers and small businesses at the start of 2009, leading them to cut spending and lay-off employees. With unemployment continuing to rise, expectations of a strong recovery were tempered. Meanwhile, consumer credit was slow to unfreeze and the housing market remained weak. Against this backdrop, anxiety about the health of banks and other financial services companies persisted. These and other factors led the broad U.S equity market to decline during the first two months of the year and to set a new low on March 6, 2009.
Following the March 6, 2009 low, the U.S. equity market, as measured by the Russell 3000® Index, experienced a rally led by the three largest U.S. banks announcing that they would likely earn a profit for the first quarter of 2009. The market continued to rise after the Federal Reserve Board stated that it would purchase “distressed assets” in order to remove them from the balance sheets of banks. The rebound was further extended by the early May announcement of positive results from the stress tests that the U.S. government conducted on 19 U.S. banks. While capital ratios were found not to be sufficient at all the banks at the time, there were no banks which the market deemed to be on the verge of insolvency. Reports that several banks were planning to pay back TARP funds as soon as possible also helped alleviate fears about the health of the financial sector. In addition to positive bank-related news, declining inventories across many sectors led to the expectation that restocking, and the related uptick in demand for manufactured goods, would soon follow. Around the same time, a series of reports showed consumer confidence improving more than expected, further adding to investors’ optimism. The Federal Reserve Board’s decision to keep the Fed Funds rate at an historical low near zero percent was also an important contributor in providing businesses with low cost financing to encourage growth.
Stocks that had been priced for an elevated probability of bankruptcy by investors during the downturn led the rally as the bankruptcy scenario appeared increasingly unlikely. Small capitalization stocks outperformed large capitalization stocks as investors’ risk appetites increased. After significantly underperforming during the downturn, cyclical companies (those more tied to the economic cycle) and large capitalization financial stocks were among the top performers at the outset of the rally. Small capitalization financial stocks continued to underperform as investors remained concerned about the health of smaller regional banks and the rising delinquencies in their commercial real estate loan portfolios. Higher beta (beta is a measure of the volatility of a given security compared to the volatility of the market as a whole) stocks and companies with low price-to-book ratios were among the top performers, as were stocks with higher earnings variability and higher debt-to-capital ratios. These factors were out of favor during the market decline of 2008 and early 2009. Consistent with the market’s sharp reversal, stocks with the lowest price momentum were among the best performers during the rally. Higher quality companies (typically those with more stable earnings growth, less leverage and attractive balance sheets) faced headwinds as investors took on more risk and increased the cyclicality of their portfolios. Defensive sectors, including the health care sector which faced significant uncertainty surrounding the Obama administration’s plan to overhaul healthcare, and factors such as higher yield and lower earning per share variability lagged during this period.
Mid-October 2009 marked a moderation of these trends, with lower risk and higher quality factors performing better as investors took profits in many of the names which had led the rally. The market shifted its focus away from deep cyclical areas and toward companies with more stable and sustainable earnings and business growth which investors believed had become undervalued. November was a more muted factor environment (no strong trends) which marginally extended the shift away from lower quality cyclical stocks. The market finished the year by rewarding earnings growth in
Russell Investment Funds
December and adding to growth stocks’ outperformance relative to value stocks. In the fourth quarter, the trend toward lower quality being rewarded moderated and there was a slight shift toward higher quality factors such as higher profitability (measured by return on assets), stronger balance sheets (including lower debt leverage) and less cyclicality.
For 2009, both gross domestic product and corporate profits rose from their 2008 lows. In addition, reports from the housing sector showed signs of stabilization. Most economic indicators turned from strongly negative, to less negative, to improving over the course of the year. Although the domestic economy began to recover during the year, companies with exports to faster-growing, developing, non-U.S. economies posted stronger performance as they benefited from the weakening of the U.S. dollar for most of the period. During the second half of 2009 in particular, exposure to U.S. companies which generated a portion of their revenues overseas was rewarded.
Despite strong performance off of the market’s early March low, the financial services sector posted the second lowest return of any sector for the year due to its extreme weakness in the first two months of the year. Only the defensive utilities sector finished behind the financials sector. The energy sector experienced a reversal similar to that of the financials sector during the year. The energy sector rebounded only after significant weakness early in the period amid concerns about the magnitude of the global economic slowdown earlier in the year and the related drop in demand. Other sectors which lagged the overall market included the more defensive consumer staples and health care sectors. Producer durables also lagged as it was hit by concerns about a slowdown in government defense spending.
The top-performing sectors in the Russell 3000® Index were the more cyclical ones. The technology sector led on expectations that businesses will increase IT expenditures as part of the equipment and software upgrade cycle after putting spending on hold amid the weak economic environment. Finishing behind technology, but still outperforming, were the materials and processing and consumer discretionary sectors. Materials stocks benefited from higher demand due to increased optimism about the economic recovery, especially as developing countries continue to build out their infrastructure. Improving consumer confidence contributed to the rebound of consumer discretionary stocks.
The recovery in stock prices occurred across investment styles as well as the market capitalization spectrum. While value stocks rebounded more strongly off the March lows, growth stocks led over the entire year. This was true for both the large capitalization and small capitalization market segments. For the year, the Russell 1000® Growth Index returned 37.2% and the Russell 1000® Value Index returned 19.7%, while the Russell 2000® Growth Index returned 34.5% and the Russell 2000® Value Index returned 20.6%. Small capitalization stocks outperformed large capitalization stocks off of the March lows, but lagged slightly over the year due to weakness early in the period. The Russell 2000® Index returned 27.2% and the Russell 1000® Index returned 28.4% for the year. Midcap stocks performed the best over the period, while microcap stocks lagged despite strong performance during the rally. The Russell Midcap® Index returned 40.5% and the Russell Microcap® Index returned 27.5% for the fiscal year.
The challenging active management environment of early 2009 improved during the year as there was more differentiation between stocks (lower correlation) and a substantial reduction in the indiscriminate selling of all riskier assets as the year progressed. Small capitalization managers across the style spectrum outperformed their benchmarks more consistently than their large capitalization counterparts, with small capitalization value managers in particular posting strong relative performance. Growth managers generally had a more difficult time relative to their benchmark as momentum was not in favor during a year which featured multiple sharp reversals in market direction. In addition, growth managers with less valuation sensitivity faced headwinds as stocks with low price to book and price to earnings ratios were rewarded. The Lipper® Small Cap Value Funds Average outperformed the Russell 2000® Value Index by 11.7%, the Lipper® Small Cap Core Funds Average outperformed the Russell 2000® Index by 4.9% and the Lipper® Small Cap Growth Funds Average outperformed the Russell 2000® Growth Index by 1.4%. The Lipper® Large Cap Growth Funds Average underperformed the Russell 1000® Growth Index by 1.9%, the Lipper® Large Cap Core Funds Average underperformed the Russell 1000® Index by 1.2%, and the Lipper® Large Cap Value Funds Average outperformed the Russell 1000® Value Index by 3.4%.
Real Estate Securities Market
For the fiscal year ending December 31, 2009, U.S. real estate investment trusts (“REITs”) generated a 27.99% return as measured by the FTSE NAREIT Equity REIT Index (the “Index”). During this period, U.S. REITs performed in line with the broader U.S. equity market and underperformed the international real estate securities market. Elevated volatility persisted, as evidenced by the double-digit value declines early in the year, while April marked the best month of performance since the inception of the Index in 1972. REIT share prices declined by 42% between the start of the fiscal year and early-March 2009 before sharply reversing course and gaining over 120% during the remainder of the year.
Russell Investment Funds
Early in the fiscal year, REIT share prices declined steeply, as the sector exhibited a high correlation to the broader financial services sector. Investor sentiment toward the sector remained negative on concerns over labor market softness, weak consumer spending, lack of available debt capital and a stagnant housing market. At the property level, the deepening recession continued to undercut demand for commercial space, which lowered both occupancy and asking rents. REIT earnings suffered as a result. This period of rapid decline was characterized by a flight to quality. The market favored REITs with the lowest amounts of leverage, limited near-term refinancing needs and limited development pipelines. Neither dividend yield nor market capitalization appeared to be contributing factors to differences in individual company performance.
Beginning in March, numerous REITs raised capital in the equity market to address financing needs. Despite being generally dilutive to earnings, these equity offerings enabled struggling REITs to pay down debt and improve balance sheets, causing concerns over near-term solvency to subside. Meanwhile, relatively well-capitalized REITs took the opportunity to expand their cash reserves in anticipation of acquisition opportunities that could arise as maturing debt forces sellers to the market. Ongoing equity raising activity reduced leverage and restored confidence in REITs, attracting some non-dedicated REIT investors to the sector. This sparked a recovery in share prices and a relaxation of investors’ aversion to risk in the sector. As the REIT market rebounded from March lows, the most highly leveraged names, which had sustained the largest declines during the downturn, experienced the most extreme rebounds in share price.
A stream of positive economic news further extended this rally. July employment figures beat expectations, credit markets showed signs of recovery, the Federal Reserve Board announced the extension of the Term Asset-Backed Securities Loan Facility (TALF) program through June 2010 and housing sales experienced a modest uptick. Investors also took comfort in the fact that the equity market remained open and the unsecured debt market showed improvement. A total of $20.4 billion of equity and $8 billion of unsecured debt was raised during the fiscal year by REITs. The REIT market rally moderated somewhat in September 2009, first on concerns over the accelerated run-up in share prices over the previous several months, and later in response to news that existing and new home sales came in below expectations. Following the release of additional unfavorable economic data, including employment numbers below expectations, REITs were sold off in October. However, these declines were short-lived, as expectations of an economic recovery drove positive REIT performance from early November through year-end.
The historic levels of volatility in the REIT market during the period were driven by two factors: the high correlation to the financial services sector and a rise in short selling of REIT shares. The elevated correlation between REITs and the financial services sector, which began in 2008 with the heightening of the credit crisis, continued during the fiscal year. Short selling in the REIT sector also began to increase from 2008 due to negative investor sentiment and continued to rise into 2009 amid weakening fundamentals and unfavorable market conditions. In March 2009, concurrent with the REIT market’s lows, short selling reached its peak at nearly 12% of shares outstanding (compared with 3-4% prior to the downturn). As REITs began to issue equity and share prices rallied in the following months, the level of short selling decreased by over 4%. REIT volatility consequently moderated from peak levels, but remained elevated in comparison to historical levels.
During the fiscal year, returns were widely dispersed across the property sectors. Among the poorest performing sectors were shopping centers, self storage, and industrial. Sentiment toward the shopping centers sector was particularly negative due to deteriorating occupancy and income metrics driven by weak consumer spending. Self storage was the only property sector to post a positive return in 2008, sparking investors to take profits and rotate out of this sector during this fiscal year. While struggling industrial REITs addressed concerns over bankruptcy risk through equity issuance, significant development pipelines amid weak leasing market conditions put pressure on earnings forecasts. The two best performing property sectors were lodging/resorts and regional malls. The lodging/resorts sector was among the poorest performing sectors during the period prior to March 2009 and subsequently staged a rally as investors displayed a greater appetite for risk. Numerous lodging/resorts stocks that had been sold off excessively during the downturn multiplied in value as investor sentiment recovered. After performing poorly early in the fiscal year, the regional malls sector rebounded led strongly by sector leader Simon Property Group, which helped to spur the trend of equity issuance with its notable capital raising efforts in March.
The U.S. REIT market underperformed relative to the international real estate securities market by a fairly wide margin during the fiscal year, as measured by the FTSE EPRA/NAREIT Developed Real Estate Index. After experiencing price corrections in the prior year, the REIT markets in both Asia and Continental Europe had large positive returns during the fiscal year. Real estate securities in the UK and Australia also posted meaningful gains during the fiscal year,
Russell Investment Funds
outperforming relative to U.S. REITs. Hong Kong property stocks recorded particularly strong gains for the fiscal year, while Japan was among the worst performing REIT markets globally, underperforming significantly relative to U.S. REITs.
Non-U.S. Developed Equity Markets
Non-U.S. equity markets rose more than 30% for the year ended December 31, 2009. The MSCI EAFE (Europe, Australasia, and Far East) Index gained 31.78% for the period. The gain reflects the strong rebound for global equity markets starting in March 2009, with a low to high return of more than 78% as measured by the MSCI EAFE.
For the period, investors in non-U.S. markets benefited from gains in foreign currencies relative to the U.S. dollar. EAFE’s gain, when measured in local currencies, was a more modest 21.00%. The more commodity-intensive economies such as Australia and Canada had very strong gains in their currencies. The Australian dollar gained nearly 28% and the Canadian dollar nearly 16% relative to the US dollar.
Value-driven investment strategies led the market recovery as economic conditions appeared to improve slowly, but steadily, beginning in March 2009. U.S. government-led stimulus helped restore confidence in the viability of global commerce, though not as much in the ability of global businesses to grow as rapidly. The MSCI EAFE Value Index rose 34.23% for the period, while the EAFE Growth Index rose 29.36%.
Regionally, the Pacific ex Japan region had the strongest gains. The region gained 72.81% for the period as measured by MSCI Pacific ex Japan Index led by the 76.43% gain in the Australian market as measured by MSCI Australia Index. European stocks rose 35.83% as measured by MSCI Europe Index. Japan was the notable laggard gaining 6.25% as measured by MSCI Japan Index for the period. While developed markets had strong returns, emerging markets had even stronger gains. The MSCI Emerging Markets Index gained 83.53% led by Brazil’s 128.06% gain as measured by the MSCI Brazil Index.
The strength of emerging markets reflected in large part the strong market for more economically-leveraged areas of the global stock market. Industrial metals producers and the other industrial cyclical companies posted very strong gains as investors grew more optimistic towards global economic recovery. The MSCI EAFE materials sector gained 69.3% for the year, led by the 95.16% gain of the metals and mining sector. The information technology, energy and financial sectors also posted strong gains. Financial stocks recovered as unprecedented economic stimulus and government-led relief programs convinced investors that these companies could survive and eventually possibly thrive.
In contrast to sectors highly levered to the global economy, more staid and predictable sectors lagged. The MSCI utilities sector gained 4.18%. The MSCI telecommunications and health care sectors also lagged with respective gains of 15.67% and 17.52%.
Emerging Markets
During 2009, the MSCI Emerging Markets Index (“Index”) increased 78.5%. The Index had four consecutive quarters of positive performance with the second and third quarter outperforming significantly. The Index gained 34.7% in the second quarter, its best quarterly return since inception of the Index in 1988. Emerging markets outperformed developed markets which gained 30.0% as measured by the MSCI World Index. Emerging markets returns were largely predicated on the belief that these markets would recover soonest given better capitalized, less leveraged financial systems and policymakers (particularly in Asia) that are experienced at navigating periods of economic turbulence. The positive performance in the fourth quarter of 2009 was largely driven by the improving economic situation, particularly in Latin America and a further rebound in commodity prices. The US dollar’s continued weakness helped increase the appeal of hard assets including gold and copper. The price of gold rose above the $1,000 an ounce ceiling and reached an all-time high of $1,227.5 an ounce in December, while copper gained nearly 140% in 2009. Crude oil, Russia’s major export, neared $80 a barrel on the improving economic situation in the US and concerns over unrest in Iran.
Inflows into the emerging markets asset class reached record levels in 2009 as the economic outlook improved for emerging countries’ exporters as stimulus measures from China to Brazil gained traction and US economic data improved. The best-performing markets over the year included Turkey, 97.5% as measured by MSCI Turkey Index, Brazil 128.1% as measured by MSCI Brazil Index and Russia 104.2% as measured by MSCI Russia Index. These markets typically perform strongly when risk appetite is robust. Indonesia, often regarded as the riskiest of emerging markets, gained 126.2% as measured by MSCI Indonesia Index. Resource rich Latin American markets strengthened as investors rotated assets away from developed economies and into countries that supply China with raw materials, such as Chile which gained 85.6% as measured by MSCI Chile Index and Peru which gained 71.9% as measured by MSCI Peru Index. Chinese equities increased 62.3% as measured by MSCI China Index on speculation that its economic strength will lead the world out of recession.
Russell Investment Funds
Several emerging market currencies, notably those closely linked to commodities, significantly outperformed the US dollar over the period. The leader among them was the Brazilian real, which was up over 45% relative to the U.S. dollar. The currency gained the most since its 1993 creation as the country emerged from recession in the second quarter and had its credit rating raised to the lowest investment-grade level in September. The South African rand also rose in 2009, up 38.4% relative to the U.S. dollar as record-low interest rates in developed nations encouraged purchases of high-yield assets and commodity prices rose on signs of a global economic recovery. The Chilean peso 26.6% had a strong start in 2009 as its central bank, the most aggressive monetary policy institution in Latin America, lowered interest rates by 6% between January and March in an effort to stimulate growth. Chile is the world’s biggest copper producer and it obtained the first credit ratings increase among investment-grade nations in 2009.
U.S. Fixed Income Markets
As much as 2008 was characterized by the credit crisis, investor anxiety and a flight to the relative safety of U.S. Treasuries, 2009 was a period of significant government intervention. Government action was crucial to restoring liquidity to the credit markets and investor confidence and served as a driver of the fixed income market rally during the second half of the year.
Following the bankruptcy of Lehman Brothers Holdings Inc. in September 2008, a massive reshuffling of banking institutions ensued. Some banks were compelled into competitor mergers/acquisitions while others sought bank holding status, all causing further unrest in the fixed income market and decreasing liquidity. This disruption was largely the impetus for the Emergency Economic Stabilization Act of 2008, which initially was designed to address weakness in the banking industry by allocating $700 billion for the purchase of distressed assets from banks. The U.S. Treasury used Troubled Asset Relief Program (TARP) funds for direct capital injections into financial institutions while the Federal Deposit Insurance Corporation (FDIC) temporarily increased retail bank deposit insurance to $250,000 per retail bank account.
In mid-November 2008, in a bid to restore liquidity in the asset-backed securities (ABS) market, the Federal Reserve Board announced the creation of the Term Asset-Backed Securities Lending Facility (TALF) under which the Federal Reserve Bank of New York planned to loan up to $200 billion on a non-recourse basis to purchasers of newly issued AAA-rated ABS collateralized primarily by consumer loans (credit card receivables and automobile loans). This program was well received and did much to increase liquidity in the fixed income markets. It was subsequently expanded to include other assets, such as commercial mortgage-backed securities (CMBS).
Numerous other programs were created by various U.S. government agencies and instrumentalities to address issues in the credit markets and broader economy and in doing so, the U.S. government has spent, lent or committed $12.8 trillion to these programs
In December 2008, the Federal Reserve decreased the rate to the historically low range of 0.00% - 0.25%, where it remained at the end of December 2009.
Despite the massive government intervention, the housing market, a key factor underlying the credit and economic crises, remained largely under pressure throughout the period. However, there were positive signs. The U.S. government reached its goal of modifying the mortgage loans of 500,000 troubled homeowners ahead of schedule and the S&P/Case-Shiller 20-City Home Price Index increased every month from April through September when it plateaued. However, a record 2.8 million U.S. properties received foreclosure notices in 2009, up 21% from 2008 and up 120% from 2007, according to the RealtyTrac 2009 Year-End U.S. Foreclosure Market Report.
The increase in foreclosures was exacerbated by unemployment and the recession. While gross domestic product for the third quarter of 2009 grew at an annualized rate of 2.2% (largely due to government stimulus), it remained depressed at - -2.6% for the 12 months ending September 2009. From December 2008 to December 2009, unemployment increased from 7% to 10%, its highest level in recent history. Total writedowns at banks from the start of the credit crisis (summer 2007) through end of 2009 have totaled $1.74 trillion.
In April 2009, the U.S. government announced the results of bank stress tests. The capital markets positively received these results, interpreting them to mean that the prospect of financial disaster had become more remote. Against a backdrop of extremely low interest rates and explicit government support, this news started the fixed income rally which lasted throughout the second half of the year. The Barclays Capital U.S. Aggregate Index (BarCap Agg), a broad measure of U.S. investment grade fixed income securities, returned 5.93% (outperforming equivalent-duration Treasuries by 7.46%) for the period, up significantly from its calendar 2008 return of 5.24% (when it underperformed Treasuries by 7.10%).
Russell Investment Funds
In sharp contrast to 2008, all major investment grade and non-investment grade sectors outperformed Treasuries in 2009, as investor anxiety decreased, the credit crisis abated and liquidity returned to the markets. Corporate credit was the most notable outperforming sector during the period, as investors saw confirmation of their beliefs that the high default rates implied by corporate bond prices were unrealistic. The investment grade corporate sector of the BarCap Agg returned 18.68% (outperforming Treasuries by 22.76%) and the Barclays Capital High Yield (corporate) Index returned 58.21% (outperforming Treasuries by 59.55%) for the year.
During most of the period, non-agency mortgage-backed securities continued to decline in price. However, the implementation of the Public-Private Investment Program reversed this trend, causing prime and Alt-A mortgage-backed securities to rally in the second half of the year.
Russell Investment Funds
Multi-Style Equity Fund
Portfolio Management Discussion — December 31, 2009 (Unaudited)
| | | |
|
| Multi-Style Equity Fund | |
| | | Total
Return | |
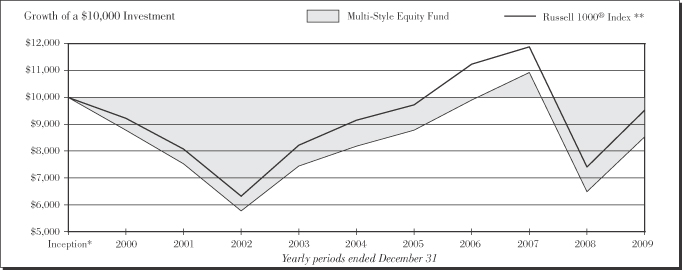
1 Year | | 32.72 | % |
5 Years | | 0.83 | %§ |
10 Years | | -1.58 | %§ |
| | | |
|
| Russell 1000® Index ** | |
| | | Total
Return | |
1 Year | | 28.43 | % |
5 Years | | 0.79 | %§ |
10 Years | | -0.49 | %§ |
| * | | Assumes initial investment on January 1, 2000. |
| ** | | Russell 1000® Index includes the 1,000 largest companies in the Russell 3000® Index. The Russell 1000® Index represents the universe of stocks from which most active money managers typically select. The Russell 1000® Index return reflects adjustments from income dividends and capital gain distributions reinvested as of the ex-dividend dates. |
The performance shown in this section does not reflect any Insurance Company Separate Account or Policy Charges. Performance is historical and assumes reinvestment of all dividends and capital gains. Investment return and principal value will fluctuate so that an investor’s shares, when redeemed, may be worth more or less than when purchased. Past performance is not indicative of future results.
| | |
| 10 | | Multi-Style Equity Fund |
Russell Investment Funds
Multi-Style Equity Fund
Portfolio Management Discussion — December 31, 2009 (Unaudited)
The Multi-Style Equity Fund (the “Fund”) allocates most of its assets among multiple money managers. Russell Investment Management Company (“RIMCo”), as the Fund’s advisor, may change the allocation of the Fund’s assets among money managers at any time. An exemptive order from the Securities and Exchange Commission (SEC) permits RIMCo to engage or terminate a money manager at any time, subject to the approval by the Fund’s Board without a shareholder vote. Pursuant to the terms of the exemptive order, the Fund is required to notify its shareholders within 60 days of when a money manager begins providing services. The Fund currently has eight money managers.
What is the Fund’s investment objective?
The Fund seeks to provide long term capital growth.
How did the Fund perform relative to its benchmark for the fiscal year ended December 31, 2009?
For the fiscal year ended December 31, 2009, the Multi-Style Equity Fund gained 32.72%. This compared to the Russell 1000® Index, which gained 28.43% during the same period. The Fund’s performance includes operating expenses, whereas Index returns are unmanaged and do not include expenses of any kind.
For the year ended December 31, 2009, the Lipper® Large-Cap Core Funds (VIP) Average gained 29.32%. This result serves as a peer comparison and is expressed net of operating expenses.
RIMCo may assign a money manager a specific style or capitalization benchmark other than the Fund’s index. However, the Fund’s primary index remains the benchmark for the Fund and is representative of the aggregate of each money manager’s benchmark index.
How did the market conditions described in the Market Summary report affect the Fund’s performance?
The U.S. equity market began the year with elevated volatility and weakness before rebounding sharply and ultimately delivering a strong positive return for 2009. The period between January and early March 2009 saw extreme volatility and market weakness. Fear and panic pervaded the market and the U.S. government stepped in with numerous stimulus packages to assist banks, auto companies and consumers. There was a pervasive fear that the economy was headed in the direction of a very deep recession, and possibly even depression. This led to a fear driven “flight to quality” in the markets during the first part of the fiscal year where risk was avoided and investments which were deemed to be the safest outperformed those which were considered more economically sensitive or of lesser quality. From March through October, a valuation driven rally buoyed the market, led primarily by the most economically sensitive companies and those stocks that had been priced for a high probability of bankruptcy during the market downturn in 2008. Higher beta (beta is a measure of the volatility of a given security compared to the volatility of the market as a whole) stocks, those with highly variable earnings and those with the highest debt-to-capital ratios, were the best performers during
this period. In November and December, there was a moderation in these trends as investors took profits in the stocks that had led for much of the year. The market shifted toward those companies with more stable business growth and sustainable earnings.
This was a mixed environment for the Fund. The Fund outperformed the Russell 1000 Index by 4.29% for the fiscal year. The risk averse period in the first few months of the year was difficult for the Fund as investors took a very short-term perspective, avoiding risk of any kind and preferring higher dividend stocks and stocks with very stable and moderate earnings growth. In anticipation of an economic recovery, the Fund’s money managers purchased stocks of companies they believed to be undervalued with more earnings variability and above-average forward looking growth prospects. For the majority of the fiscal year, the Fund’s exposure to higher beta stocks and positioning for economic recovery contributed positively to performance. While the Fund’s money managers in general favored companies with higher quality balance sheets that were showing signs of fundamental earnings improvement, other of the Fund’s money managers, particularly within the value segment, were effective at finding companies that were deeply undervalued and, in some cases, priced for potential bankruptcy. These money managers benefited from investor fear and short-term risk aversion by finding deeply valued companies with longer-term fundamental prospects that were stronger than the market believed. These holdings tended to be the stocks that helped the Fund participate more fully in the rally off the market bottom of March 2009.
How did the investment strategies and techniques employed by the Fund and its money managers affect its performance?
Over the fiscal year, the Fund’s money managers in aggregate maintained a tilt toward higher growth, higher beta and lower dividend-yield stocks. Though the Fund had a neutral growth/value split in terms of the allocation of its assets to money managers for most of the period, the market environment created an “organic” growth tilt where many value managers, using their valuation focused approaches saw growth stocks as attractive as their valuations fell to very low levels. As such, there was more growth exposure in the Fund over the period, much of it coming from the value segment. This positioning was beneficial for the year, as growth outpaced value for the year despite the fact that value rebounded more sharply off of the March market lows.
The Fund benefited from an overweight to the technology sector, the top performing sector in the Russell 1000 Index over the fiscal year, and from an underweight to the utilities sector, which lagged during the period. A market weight to the health care sector detracted from returns somewhat as those stocks were affected by the uncertainty surrounding the Obama health care proposal. An overweight to the financial services sector was a negative contributor, as that sector experienced extreme weakness in the first few months of the fiscal year.
| | |
| Multi-Style Equity Fund | | 11 |
Russell Investment Funds
Multi-Style Equity Fund
Portfolio Management Discussion — December 31, 2009 (Unaudited)
Stock selection in the energy sector contributed to the Fund’s outperformance. The Fund benefited from an underweight to large multi-national integrated oil companies which performed poorly over the period. Health care stock selection also added to returns. In this sector, money managers focused on stocks in the drugs and pharmaceutical industry, especially those where the companies had long patent periods and those where no generic drug substitutes were available.
Stock selection in the consumer discretionary sector detracted from returns for the period. In particular, exposure to broadcasters and advertising agencies detracted from performance. Despite strong performance off the market’s early March low, extreme weakness in bank stocks for the first three months of the year led to negative stock selection in the financial services sector.
For the fiscal period, five of the eight money managers outperformed their respective benchmarks and three money managers underperformed their benchmarks. One of the current managers was not in the Fund for the full period. Generally over the fiscal period, managers who were more aggressively positioned performed better than those who were more defensively positioned. Deep value managers performed so well in the post March market recovery that this made up for their weakness in the first and last few months of the fiscal year. Growth managers faced the toughest active management environment over the period as those focusing on earnings momentum were not rewarded by the market during the period.
Growth manager Columbus Circle Investors (CCI) underperformed its Russell 1000 Growth® Index for the fiscal year. This underperformance was expected given the market environment and CCI’s focus on higher earnings momentum and higher growth rate companies. The majority of its underperformance was during the highly defensive market period at the beginning of the fiscal year. CCI’s stock selection, particularly in the health care and producer durables sectors, was the main detractor from returns for the full fiscal period. In the health care sector, CCI’s overweight to medical instrument companies and its underweight to biotech stocks contributed to its underperformance. Overweight positions in airline stocks in the producer durables sector also detracted from returns for the one year period.
The performance of First Eagle Investment Management, LLC (formerly Arnhold and S. Bleichroeder Advisers, LLC), a market-oriented manager, was negatively impacted by stock selection decisions and it underperformed its Russell 1000 Index benchmark. First Eagle’s performance benefited from positive sector allocation over the fiscal period. It was overweight in the top-performing technology sector and significantly underweight to the poorly performing consumer staples and utilities sectors. However, the positive contribution to performance from allocation was outweighed by the negative impact of more defensive holdings and stock selection. In the consumer discretionary sector, First Eagle focused on down
market retailers who struggled over the period. In the materials & processing sector, First Eagle had significant exposure to gold stocks and in the energy sector it was overweight to domestic integrated oil companies. These positions contributed to underperformance. Much of First Eagle’s underperformance came during the period following the March rally when its defensive positioning in gold stocks was not rewarded by a market that favored risk.
Suffolk Capital Management, LLC, a market-oriented manager, outperformed its Russell 1000 Index benchmark for the period on the strength of its stock selection decisions. Suffolk performed particularly well in the early part of the fiscal year when exposure to insurance stocks and health care stocks were both rewarded. Over the fiscal period, Suffolk benefited from an overweight to the top-performing technology sector, but stock selection was the main driver of their returns. Stock selection in the financial services sector added to returns as a result of Suffolk’s exposure to large financial services companies that were gaining market share, as well as insurance companies and credit card companies that performed well over the period. Suffolk’s exposure to chemical, copper and fertilizer companies drove strong results in the materials and processing sector for the year, as those stocks benefited from expanding global growth, particularly in China. Stock selection in the health care sector, particularly in pharmaceutical stocks, also added to returns.
Value manager DePrince, Race & Zollo, Inc. outperformed its Russell 1000 Value® Index benchmark for the fiscal year. It underperformed in the first few months of the fiscal year which was expected given a market environment where investors sought safety. DePrince had strong performance in the second part of the fiscal year as its deeper-value positioning, with investments in out-of-favor companies, outperformed. DePrince’s sector allocation decisions and stock selection were both additive. DePrince benefited from overweights to the materials & processing, technology and consumer discretionary sectors, which were the three best performing sectors in the Russell 1000 Value Index for the year. DePrince had strong performance from stock selection in the consumer discretionary sector through holdings of retailers. Exposure to semiconductor stocks in the technology sector was also a major contributor to returns. DePrince benefited from its positioning in the post March rally, as both an overweight to high beta stocks and a focus on smaller capitalization stocks were rewarded for most of the year.
RIMCo currently employs a “select holdings” strategy for a portion of the Fund’s assets that RIMCo determines not to allocate to the money managers. Pursuant to this strategy, RIMCo analyzes the holdings in the Fund segments assigned to money managers to identify particular stocks that have been selected and are held in overweight positions by multiple money managers. RIMCo uses a proprietary model to rank these stocks. Based on this ranking, RIMCo purchases additional shares of certain stocks for the Fund. RIMCo performs this
| | |
| 12 | | Multi-Style Equity Fund |
Russell Investment Funds
Multi-Style Equity Fund
Portfolio Management Discussion — December 31, 2009 (Unaudited)
analysis and ranking, and purchases or sells stocks based on this analysis and ranking, on a regular, periodic basis. The strategy is designed to increase the Fund’s exposure to stocks that are viewed as attractive by multiple money managers. The select holdings strategy outperformed the Russell 1000 Index benchmark over the fiscal year period, and was additive to the fund’s performance. During this period, the strategy benefited from overweights in the outperforming financial services and technology sectors. Stock selection in health care was also beneficial as managers’ overweights in two acquisition targets in the pharmaceutical industry led to those stocks being held in the select holdings portfolio.
Describe any changes to the Fund’s structure or the money manager line-up.
In August 2009, growth manager, Turner Investment Partners, Inc. was terminated and BlackRock Financial Management was hired with a growth mandate. Manager weights were adjusted throughout the structure.
| | |
| |
Money Managers as of December 31, 2009 | | Styles |
| BlackRock Capital Management, Inc. | | Growth |
| Columbus Circle Investors | | Growth |
| DePrince, Race & Zollo, Inc. | | Value |
| First Eagle Investment Management, LLC | | Market-Oriented |
| Institutional Capital LLC | | Value |
| Jacobs Levy Equity Management, Inc. | | Value |
| Montag & Caldwell, Inc. | | Growth |
| Suffolk Capital Management, LLC | | Market-Oriented |
The views expressed in this report reflect those of the portfolio managers only through the end of the period covered by the report. These views do not necessarily represent the views of RIMCo, or any other person in RIMCo or any other affiliated organization. These views are subject to change at any time based upon market conditions or other events, and RIMCo disclaims any responsibility to update the views contained herein. These views should not be relied on as investment advice and, because investment decisions for Russell Investment Funds (RIF) are based on numerous factors, should not be relied on as an indication of investment decisions of any RIF Fund.
| | |
| Multi-Style Equity Fund | | 13 |
Russell Investment Funds
Multi-Style Equity Fund
Shareholder Expense Example — December 31, 2009 (Unaudited)
Fund Expenses
The following disclosure provides important information regarding each Fund’s Expense Example, which appears on each Fund’s individual page in this Annual Report. Please refer to this information when reviewing the Expense Example for a Fund.
Example
As a shareholder of the Fund, you incur two types of costs: (1) transaction costs, and (2) ongoing costs, including management fees and other Fund expenses. The Example is intended to help you understand your ongoing costs (in dollars) of investing in the Fund and to compare these costs with the ongoing costs of investing in other mutual funds. The Example is based on an investment of $1,000 invested at the beginning of the period and held for the entire period indicated, which for this Fund is from July 1, 2009 to December 31, 2009.
Actual Expenses
The information in the table under the heading “Actual Performance” provides information about actual account values and actual expenses. You may use the information in this column, together with the amount you invested, to estimate the expenses that you paid over the period. Simply divide your account value by $1,000 (for example, an $8,600 account value divided by $1,000 = 8.6), then multiply the result by the number in the first column in the row entitled “Expenses Paid During Period” to estimate the expenses you paid on your account during this period.
Hypothetical Example for Comparison Purposes
The information in the table under the heading “Hypothetical Performance (5% return before expenses)” provides information about hypothetical account values and hypothetical expenses based on the Fund’s actual expense ratio and an assumed rate
of return of 5% per year before expenses, which is not the Fund’s actual return. The hypothetical account values and expenses may not be used to estimate the actual ending account balance or expenses you paid for the period. You may use this information to compare the ongoing costs of investing in the Fund and other funds. To do so, compare this 5% hypothetical example with the 5% hypothetical examples that appear in the shareholder reports of other funds.
Please note that the expenses shown in the table are meant to highlight your ongoing costs only and do not reflect any transactional costs. Therefore, the information under the heading “Hypothetical Performance (5% return before expenses)” is useful in comparing ongoing costs only, and will not help you determine the relative total costs of owning different funds. In addition, if these transactional costs were included, your costs would have been higher. The fee and expenses shown in this section do not reflect any Insurance Company Separate Account or Policy Charges.
| | | | | | |
| | | Actual
Performance | | Hypothetical
Performance
(5% return
before expenses) |
| | | | | | |
Beginning Account Value | | | | | | |
July 1, 2009 | | $ | 1,000.00 | | $ | 1,000.00 |
Ending Account Value | | | | | | |
December 31, 2009 | | $ | 1,236.90 | | $ | 1,020.92 |
Expenses Paid During Period* | | $ | 4.79 | | $ | 4.33 |
| * | Expenses are equal to the Fund’s annualized expense ratio of 0.85% (representing the one-half year period annualized), multiplied by the average account value over the period, multiplied by 184/365 (to reflect the one-half year period). Reflects amounts waived and/or reimbursed. Without the waiver and/or reimbursement, expenses would have been higher. |
| | |
| 14 | | Multi-Style Equity Fund |
Russell Investment Funds
Multi-Style Equity Fund
Schedule of Investments — December 31, 2009
Amounts in thousands (except share amounts)
| | | | |
| | | Principal
Amount ($)
or Shares | | Market
Value
$ |
| | | | |
| Common Stocks - 94.8% | | | | |
| Consumer Discretionary - 13.1% |
Amazon.com, Inc. (Æ) | | 26,072 | | 3,507 |
Apollo Group, Inc. Class A (Æ) | | 7,258 | | 440 |
Avon Products, Inc. | | 12,700 | | 400 |
Bed Bath & Beyond, Inc. (Æ) | | 35,260 | | 1,362 |
Best Buy Co., Inc. | | 21,289 | | 840 |
BJ’s Wholesale Club, Inc. (Æ) | | 1,100 | | 36 |
Bob Evans Farms, Inc. | | 2,500 | | 72 |
CarMax, Inc. (Æ) | | 11,600 | | 281 |
CBS Corp. Class B | | 104,810 | | 1,473 |
Comcast Corp. Class A | | 103,232 | | 1,741 |
Costco Wholesale Corp. | | 23,000 | | 1,361 |
Darden Restaurants, Inc. | | 9,200 | | 323 |
eBay, Inc. (Æ) | | 36,200 | | 852 |
Estee Lauder Cos., Inc. (The) Class A | | 15,662 | | 757 |
Foot Locker, Inc. | | 60,600 | | 675 |
Ford Motor Co. (Æ) | | 229,843 | | 2,299 |
Fortune Brands, Inc. | | 7,600 | | 328 |
Gap, Inc. (The) | | 23,200 | | 486 |
H&R Block, Inc. | | 23,100 | | 523 |
Harman International Industries, Inc. | | 4,900 | | 173 |
Home Depot, Inc. | | 41,341 | | 1,196 |
Hyatt Hotels Corp. (Æ) | | 600 | | 18 |
International Game Technology | | 27,400 | | 514 |
Jarden Corp. | | 5,600 | | 173 |
JC Penney Co., Inc. | | 14,100 | | 375 |
Johnson Controls, Inc. | | 50,250 | | 1,369 |
Kohl’s Corp. (Æ) | | 34,544 | | 1,863 |
Las Vegas Sands Corp. (Æ)(Ñ) | | 44,000 | | 657 |
Lowe’s Cos., Inc. | | 228,765 | | 5,351 |
McDonald’s Corp. | | 25,900 | | 1,617 |
Nike, Inc. Class B | | 13,300 | | 879 |
Phillips-Van Heusen Corp. | | 6,000 | �� | 244 |
priceline.com, Inc. (Æ) | | 4,866 | | 1,063 |
Regal Entertainment Group Class A | | 32,300 | | 466 |
Rent-A-Center, Inc. Class A (Æ) | | 10,700 | | 190 |
Royal Caribbean Cruises, Ltd. (Æ) | | 29,200 | | 738 |
Snap-On, Inc. | | 12,100 | | 511 |
Stanley Works (The) | | 13,913 | | 717 |
Starbucks Corp. (Æ) | | 47,225 | | 1,089 |
Starwood Hotels & Resorts Worldwide, Inc. (ö) | | 9,400 | | 344 |
Target Corp. | | 19,800 | | 958 |
Tech Data Corp. (Æ) | | 2,900 | | 135 |
TJX Cos., Inc. | | 48,561 | | 1,775 |
United Stationers, Inc. (Æ) | | 1,400 | | 80 |
Valassis Communications, Inc. (Æ) | | 6,700 | | 122 |
VF Corp. | | 13,400 | | 981 |
Viacom, Inc. Class B (Æ) | | 69,800 | | 2,075 |
Wal-Mart Stores, Inc. | | 97,053 | | 5,188 |
Walt Disney Co. (The) | | 21,000 | | 677 |
Washington Post Co. (The) Class B | | 300 | | 132 |
| | | | |
| | | | 49,426 |
| | | | |
| | | | |
| | | Principal
Amount ($)
or Shares | | Market
Value
$ |
| Consumer Staples - 7.3% | | | | |
Archer-Daniels-Midland Co. | | 10,600 | | 332 |
Casey’s General Stores, Inc. | | 2,500 | | 80 |
Coca-Cola Co. (The) | | 80,012 | | 4,561 |
Colgate-Palmolive Co. | | 14,700 | | 1,208 |
ConAgra Foods, Inc. | | 22,600 | | 521 |
Corn Products International, Inc. | | 17,500 | | 511 |
CVS Caremark Corp. | | 33,521 | | 1,080 |
Dr Pepper Snapple Group, Inc. | | 15,200 | | 430 |
General Mills, Inc. | | 25,100 | | 1,777 |
Hansen Natural Corp. (Æ) | | 13,842 | | 532 |
JM Smucker Co. (The) | | 424 | | 26 |
Kraft Foods, Inc. Class A | | 32,100 | | 872 |
Kroger Co. (The) | | 12,700 | | 261 |
Lorillard, Inc. | | 6,600 | | 529 |
PepsiCo, Inc. | | 116,543 | | 7,086 |
Philip Morris International, Inc. | | 10,000 | | 482 |
Procter & Gamble Co. (The) | | 75,000 | | 4,547 |
Ralcorp Holdings, Inc. (Æ) | | 7,600 | | 454 |
Safeway, Inc. | | 62,400 | | 1,328 |
Tyson Foods, Inc. Class A | | 19,300 | | 237 |
Whole Foods Market, Inc. (Æ) | | 18,661 | | 512 |
| | | | |
| | | | 27,366 |
| | | | |
| | |
| Energy - 9.6% | | | | |
Anadarko Petroleum Corp. | | 23,600 | | 1,473 |
Apache Corp. | | 5,800 | | 598 |
Arch Coal, Inc. | | 17,700 | | 394 |
Cameron International Corp. (Æ) | | 27,700 | | 1,158 |
Chesapeake Energy Corp. | | 26,456 | | 685 |
Chevron Corp. | | 73,400 | | 5,651 |
ConocoPhillips | | 32,000 | | 1,634 |
ENSCO International PLC - ADR | | 7,100 | | 284 |
EOG Resources, Inc. | | 3,500 | | 341 |
Exxon Mobil Corp. | | 47,100 | | 3,212 |
Halliburton Co. | | 115,013 | | 3,461 |
Helmerich & Payne, Inc. | | 3,700 | | 148 |
Hess Corp. | | 17,100 | | 1,034 |
Marathon Oil Corp. | | 113,045 | | 3,529 |
Murphy Oil Corp. | | 6,400 | | 347 |
Occidental Petroleum Corp. | | 81,195 | | 6,605 |
Petrohawk Energy Corp. (Æ) | | 22,400 | | 537 |
Rowan Cos., Inc. (Æ) | | 9,400 | | 213 |
Schlumberger, Ltd. | | 26,800 | | 1,744 |
Sunoco, Inc. (Ñ) | | 21,400 | | 558 |
Tesoro Corp. (Ñ) | | 14,600 | | 198 |
Transocean, Ltd. (Æ) | | 12,000 | | 994 |
Valero Energy Corp. | | 20,900 | | 350 |
Williams Cos., Inc. (The) | | 45,700 | | 963 |
| | | | |
| | | | 36,111 |
| | | | |
| | |
| Financial Services - 16.6% | | | | |
Allied World Assurance Co. Holdings, Ltd. | | 3,900 | | 180 |
Allstate Corp. (The) | | 41,300 | | 1,241 |
American Express Co. | | 49,911 | | 2,022 |
American Financial Group, Inc. | | 11,400 | | 284 |
AON Corp. | | 33,400 | | 1,281 |
| | |
| Multi-Style Equity Fund | | 15 |
Russell Investment Funds
Multi-Style Equity Fund
Schedule of Investments, continued — December 31, 2009
Amounts in thousands (except share amounts)
| | | | |
| | | Principal
Amount ($)
or Shares | | Market
Value
$ |
| | | | |
Apollo Investment Corp. | | 12,200 | | 116 |
Arch Capital Group, Ltd. (Æ) | | 2,200 | | 157 |
Aspen Insurance Holdings, Ltd. | | 10,600 | | 270 |
Assurant, Inc. | | 10,400 | | 307 |
Axis Capital Holdings, Ltd. | | 10,400 | | 295 |
Bank of America Corp. | | 153,759 | | 2,316 |
Bank of New York Mellon Corp. (The) | | 30,700 | | 859 |
BB&T Corp. | | 72,750 | | 1,846 |
BioMed Realty Trust, Inc. (ö) | | 8,700 | | 137 |
Camden Property Trust (ö) | | 7,800 | | 330 |
Capital One Financial Corp. | | 73,526 | | 2,819 |
Charles Schwab Corp. (The) | | 71,900 | | 1,353 |
CME Group, Inc. Class A | | 800 | | 269 |
Comerica, Inc. | | 10,400 | | 307 |
Cullen/Frost Bankers, Inc. | | 5,300 | | 265 |
DCT Industrial Trust, Inc. (ö)(Ñ) | | 14,100 | | 71 |
DiamondRock Hospitality Co. (ö) | | 5,600 | | 47 |
Discover Financial Services | | 22,400 | | 329 |
EastGroup Properties, Inc. (ö) | | 2,300 | | 88 |
Endurance Specialty Holdings, Ltd. | | 7,000 | | 261 |
Equity Residential (ö) | | 9,500 | | 321 |
Federated Investors, Inc. Class B | | 18,100 | | 498 |
Fifth Third Bancorp | | 32,300 | | 315 |
Goldman Sachs Group, Inc. (The) | | 26,637 | | 4,497 |
HRPT Properties Trust (ö) | | 34,600 | | 224 |
Hudson City Bancorp, Inc. | | 17,700 | | 243 |
JPMorgan Chase & Co. | | 149,508 | | 6,230 |
KeyCorp | | 85,400 | | 474 |
Liberty Property Trust (ö) | | 10,700 | | 342 |
Mack-Cali Realty Corp. (ö) | | 7,600 | | 263 |
Marsh & McLennan Cos., Inc. | | 39,200 | | 866 |
Mastercard, Inc. Class A | | 6,085 | | 1,558 |
Mercury General Corp. | | 18,700 | | 734 |
MetLife, Inc. | | 21,800 | | 771 |
Morgan Stanley | | 154,976 | | 4,587 |
Nasdaq OMX Group, Inc. (The) (Æ) | | 11,300 | | 224 |
New York Community Bancorp, Inc. | | 55,400 | | 804 |
Northern Trust Corp. | | 16,900 | | 886 |
NYSE Euronext | | 7,400 | | 187 |
PartnerRe, Ltd. - ADR | | 4,100 | | 306 |
People’s United Financial, Inc. | | 31,000 | | 518 |
Plum Creek Timber Co., Inc. (ö)(Ñ) | | 18,800 | | 710 |
PNC Financial Services Group, Inc. | | 15,300 | | 808 |
Protective Life Corp. | | 6,400 | | 106 |
Prudential Financial, Inc. | | 27,400 | | 1,363 |
State Street Corp. | | 19,600 | | 853 |
SunTrust Banks, Inc. | | 45,900 | | 931 |
Travelers Cos., Inc. (The) | | 10,300 | | 514 |
Unitrin, Inc. | | 2,400 | | 53 |
US Bancorp | | 123,350 | | 2,777 |
Valley National Bancorp (Ñ) | | 44,300 | | 626 |
Verisk Analytics, Inc. (Æ) | | 322 | | 10 |
Visa, Inc. | | 43,544 | | 3,808 |
Wells Fargo & Co. | | 264,829 | | 7,148 |
Wilmington Trust Corp. (Ñ) | | 24,500 | | 302 |
XL Capital, Ltd. Class A | | 7,500 | | 137 |
| | | | |
| | | | 62,444 |
| | | | |
| | | | |
| | | Principal
Amount ($)
or Shares | | Market
Value
$ |
| Health Care - 10.6% | | | | |
Abbott Laboratories | | 76,795 | | 4,146 |
Aetna, Inc. | | 12,200 | | 387 |
Allergan, Inc. | | 20,200 | | 1,273 |
AmerisourceBergen Corp. Class A | | 3,400 | | 89 |
Amgen, Inc. (Æ) | | 25,875 | | 1,464 |
Boston Scientific Corp. (Æ) | | 38,600 | | 347 |
Cardinal Health, Inc. | | 3,800 | | 123 |
Centene Corp. (Æ) | | 4,500 | | 95 |
Cerner Corp. (Æ) | | 4,600 | | 379 |
Covance, Inc. (Æ) | | 4,300 | | 235 |
Coventry Health Care, Inc. (Æ) | | 12,100 | | 294 |
Covidien PLC | | 38,650 | | 1,851 |
Eli Lilly & Co. | | 11,600 | | 414 |
Express Scripts, Inc. Class A (Æ) | | 7,700 | | 666 |
Forest Laboratories, Inc. (Æ) | | 13,400 | | 430 |
Gilead Sciences, Inc. (Æ) | | 30,000 | | 1,298 |
Hospira, Inc. (Æ) | | 20,300 | | 1,035 |
Humana, Inc. (Æ) | | 8,600 | | 377 |
Intuitive Surgical, Inc. (Æ) | | 3,957 | | 1,200 |
Laboratory Corp. of America Holdings (Æ) | | 5,900 | | 442 |
Life Technologies Corp. (Æ) | | 16,400 | | 857 |
McKesson Corp. | | 21,600 | | 1,350 |
Medco Health Solutions, Inc. (Æ) | | 8,700 | | 556 |
Medtronic, Inc. | | 31,916 | | 1,404 |
Merck & Co., Inc. | | 136,250 | | 4,979 |
Mylan, Inc. (Æ)(Ñ) | | 50,504 | | 931 |
Par Pharmaceutical Cos., Inc. (Æ) | | 5,700 | | 154 |
Pfizer, Inc. | | 311,462 | | 5,666 |
Sanofi-Aventis SA - ADR | | 59,850 | | 2,350 |
Stryker Corp. | | 12,500 | | 630 |
Teleflex, Inc. | | 13,200 | | 711 |
Teva Pharmaceutical Industries, Ltd. - ADR | | 6,600 | | 371 |
Thermo Fisher Scientific, Inc. (Æ) | | 28,603 | | 1,364 |
UnitedHealth Group, Inc. | | 25,700 | | 783 |
Universal Health Services, Inc. Class B | | 4,000 | | 122 |
WellPoint, Inc. (Æ) | | 11,600 | | 676 |
Zimmer Holdings, Inc. (Æ) | | 10,700 | | 632 |
| | | | |
| | | | 40,081 |
| | | | |
|
| Materials and Processing - 4.8% |
Agnico-Eagle Mines, Ltd. | | 2,500 | | 135 |
Air Products & Chemicals, Inc. | | 6,000 | | 486 |
Allegheny Technologies, Inc. | | 14,200 | | 636 |
Ashland, Inc. | | 6,700 | | 265 |
Ball Corp. | | 15,900 | | 822 |
Cabot Corp. | | 20,500 | | 538 |
Cytec Industries, Inc. | | 4,000 | | 146 |
Dow Chemical Co. (The) | | 57,000 | | 1,575 |
Ecolab, Inc. | | 6,100 | | 272 |
EI du Pont de Nemours & Co. | | 56,450 | | 1,901 |
Freeport-McMoRan Copper & Gold, Inc. Class B | | 52,070 | | 4,181 |
International Flavors & Fragrances, Inc. | | 3,500 | | 144 |
Kaiser Aluminum Corp. | | 1,200 | | 50 |
Lubrizol Corp. | | 3,900 | | 284 |
| | |
| 16 | | Multi-Style Equity Fund |
Russell Investment Funds
Multi-Style Equity Fund
Schedule of Investments, continued — December 31, 2009
Amounts in thousands (except share amounts)
| | | | |
| | | Principal
Amount ($)
or Shares | | Market
Value
$ |
| | | | |
Masco Corp. | | 28,600 | | 395 |
Monsanto Co. | | 4,500 | | 368 |
Newmont Mining Corp. | | 51,868 | | 2,454 |
Potash Corp. of Saskatchewan, Inc. | | 4,100 | | 445 |
Reliance Steel & Aluminum Co. | | 7,400 | | 320 |
Rock-Tenn Co. Class A | | 1,800 | | 91 |
Silgan Holdings, Inc. | | 2,500 | | 145 |
Sonoco Products Co. | | 1,600 | | 47 |
Teck Resources, Ltd. Class B (Æ) | | 27,200 | | 951 |
United States Steel Corp. | | 5,200 | | 286 |
Vulcan Materials Co. (Ñ) | | 20,100 | | 1,058 |
| | | | |
| | | | 17,995 |
| | | | |
| | |
| Producer Durables - 12.1% | | | | |
3M Co. | | 45,700 | | 3,778 |
Accenture PLC Class A | | 23,300 | | 967 |
AGCO Corp. (Æ) | | 5,300 | | 171 |
AO Smith Corp. | | 2,500 | | 108 |
Arkansas Best Corp. | | 3,200 | | 94 |
Automatic Data Processing, Inc. | | 19,500 | | 835 |
Boeing Co. (The) | | 12,900 | | 698 |
Burlington Northern Santa Fe Corp. | | 6,200 | | 611 |
Caterpillar, Inc. | | 72,077 | | 4,108 |
CH Robinson Worldwide, Inc. | | 6,300 | | 370 |
Convergys Corp. (Æ) | | 11,400 | | 123 |
CSX Corp. | | 47,200 | | 2,289 |
Cummins, Inc. | | 39,100 | | 1,793 |
Danaher Corp. | | 12,000 | | 902 |
Delta Air Lines, Inc. (Æ) | | 57,300 | | 652 |
Deluxe Corp. | | 5,300 | | 78 |
Electronics for Imaging, Inc. (Æ) | | 647 | | 8 |
EMCOR Group, Inc. (Æ) | | 3,500 | | 94 |
Emerson Electric Co. | | 22,100 | | 941 |
FedEx Corp. | | 10,100 | | 843 |
Fluor Corp. | | 18,600 | | 838 |
General Dynamics Corp. | | 20,077 | | 1,369 |
General Electric Co. | | 156,600 | | 2,369 |
Goodrich Corp. | | 16,900 | | 1,086 |
Honeywell International, Inc. | | 118,398 | | 4,641 |
Illinois Tool Works, Inc. | | 13,800 | | 662 |
KBR, Inc. | | 12,400 | | 236 |
L-3 Communications Holdings, Inc. | | 4,600 | | 400 |
Lexmark International, Inc. Class A (Æ) | | 14,500 | | 377 |
Lockheed Martin Corp. | | 10,800 | | 814 |
Manpower, Inc. | | 11,600 | | 633 |
Norfolk Southern Corp. | | 18,700 | | 980 |
Northrop Grumman Corp. | | 24,500 | | 1,368 |
PACCAR, Inc. | | 13,300 | | 482 |
Parker Hannifin Corp. | | 7,500 | | 404 |
Pitney Bowes, Inc. | | 33,800 | | 769 |
Quanta Services, Inc. (Æ) | | 22,800 | | 475 |
Regal-Beloit Corp. | | 1,900 | | 99 |
Rockwell Automation, Inc. | | 10,100 | | 475 |
Ryder System, Inc. | | 8,200 | | 338 |
SPX Corp. | | 11,400 | | 624 |
Sunpower Corp. (Æ) | | 3,100 | | 65 |
Textron, Inc. | | 23,550 | | 443 |
| | | | |
| | | Principal
Amount ($)
or Shares | | Market
Value
$ |
Tidewater, Inc. | | 12,900 | | 619 |
Tyco International, Ltd. | | 24,400 | | 871 |
Unifirst Corp. | | 800 | | 39 |
Union Pacific Corp. | | 2,200 | | 141 |
United Parcel Service, Inc. Class B | | 27,100 | | 1,555 |
United Technologies Corp. | | 15,700 | | 1,090 |
Waste Management, Inc. | | 27,000 | | 913 |
Watson Wyatt Worldwide, Inc. Class A | | 1,100 | | 52 |
Watts Water Technologies, Inc. Class A | | 2,100 | | 65 |
Werner Enterprises, Inc. | | 8,700 | | 172 |
Xerox Corp. | | 89,300 | | 755 |
| | | | |
| | | | 45,682 |
| | | | |
| | |
| Technology - 17.4% | | | | |
Amphenol Corp. Class A | | 38,994 | | 1,801 |
Apple, Inc. (Æ) | | 34,892 | | 7,357 |
Applied Materials, Inc. | | 81,300 | | 1,133 |
Avnet, Inc. (Æ) | | 11,300 | | 341 |
Baidu, Inc. - ADR (Æ) | | 900 | | 370 |
Broadcom Corp. Class A (Æ) | | 56,459 | | 1,776 |
Check Point Software Technologies (Æ) | | 15,400 | | 522 |
Cisco Systems, Inc. (Æ) | | 155,866 | | 3,731 |
Cognizant Technology Solutions Corp. Class A (Æ) | | 9,800 | | 444 |
Computer Sciences Corp. (Æ) | | 6,000 | | 345 |
Corning, Inc. | | 60,600 | | 1,170 |
Cree, Inc. (Æ) | | 1,900 | | 107 |
CSG Systems International, Inc. (Æ) | | 2,800 | | 53 |
Dell, Inc. (Æ) | | 67,300 | | 966 |
Diebold, Inc. | | 14,800 | | 421 |
EMC Corp. (Æ) | | 59,389 | | 1,038 |
Equinix, Inc. (Æ) | | 1,799 | | 191 |
Google, Inc. Class A (Æ) | | 11,530 | | 7,148 |
Harris Corp. | | 10,900 | | 518 |
Hewlett-Packard Co. | | 146,797 | | 7,562 |
Intel Corp. | | 149,700 | | 3,054 |
International Business Machines Corp. | | 17,996 | | 2,356 |
Jabil Circuit, Inc. | | 7,300 | | 127 |
Juniper Networks, Inc. (Æ) | | 32,900 | | 877 |
Lam Research Corp. (Æ) | | 10,800 | | 423 |
Marvell Technology Group, Ltd. (Æ) | | 64,032 | | 1,329 |
Maxim Integrated Products, Inc. | | 52,100 | | 1,058 |
Mentor Graphics Corp. (Æ) | | 9,300 | | 82 |
Micron Technology, Inc. (Æ) | | 36,000 | | 380 |
Microsoft Corp. | | 52,500 | | 1,601 |
Molex, Inc. | | 14,800 | | 319 |
Motorola, Inc. (Æ) | | 51,200 | | 397 |
National Semiconductor Corp. | | 65,100 | | 1,000 |
NetApp, Inc. (Æ) | | 11,000 | | 378 |
Nokia OYJ - ADR | | 43,000 | | 553 |
Novell, Inc. (Æ) | | 45,200 | | 188 |
NVIDIA Corp. (Æ) | | 61,124 | | 1,142 |
Palm, Inc. (Æ)(Ñ) | | 29,500 | | 296 |
Plexus Corp. (Æ) | | 2,700 | | 77 |
PMC - Sierra, Inc. (Æ) | | 26,300 | | 228 |
QUALCOMM, Inc. | | 100,062 | | 4,629 |
Research In Motion, Ltd. (Æ) | | 19,200 | | 1,297 |
| | |
| Multi-Style Equity Fund | | 17 |
Russell Investment Funds
Multi-Style Equity Fund
Schedule of Investments, continued — December 31, 2009
Amounts in thousands (except share amounts)
| | | | |
| | | Principal
Amount ($)
or Shares | | Market
Value
$ |
| | | | |
SAIC, Inc. (Æ) | | 12,700 | | 241 |
Salesforce.com, Inc. (Æ) | | 8,600 | | 634 |
Seagate Technology | | 36,300 | | 660 |
Synopsys, Inc. (Æ) | | 13,200 | | 294 |
Tellabs, Inc. (Æ) | | 51,100 | | 290 |
Texas Instruments, Inc. | | 181,898 | | 4,740 |
| | | | |
| | | | 65,644 |
| | | | |
| | |
| Utilities - 3.3% | | | | |
Alliant Energy Corp. | | 18,400 | | 557 |
American Electric Power Co., Inc. | | 27,800 | | 967 |
American Water Works Co., Inc. | | 32,000 | | 717 |
AT&T, Inc. | | 50,300 | | 1,410 |
Atmos Energy Corp. | | 5,700 | | 168 |
BCE, Inc. | | 44,900 | | 1,240 |
Edison International | | 6,400 | | 223 |
Exelon Corp. | | 9,300 | | 454 |
Frontier Communications Corp. | | 65,500 | | 511 |
Great Plains Energy, Inc. | | 26,400 | | 512 |
MDU Resources Group, Inc. | | 18,700 | | 441 |
Mirant Corp. (Æ) | | 8,400 | | 128 |
NiSource, Inc. | | 23,500 | | 361 |
NV Energy, Inc. | | 11,400 | | 141 |
Pepco Holdings, Inc. | | 31,200 | | 526 |
PNM Resources, Inc. | | 7,400 | | 94 |
PPL Corp. | | 9,300 | | 300 |
Progress Energy, Inc. - CVO (ß)(Æ) | | 1,300 | | — |
Veolia Environnement - ADR | | 15,200 | | 500 |
Verizon Communications, Inc. | | 30,000 | | 994 |
Vodafone Group PLC - ADR | | 93,500 | | 2,159 |
| | | | |
| | | | 12,403 |
| | | | |
| | |
Total Common Stocks
(cost $309,262) | | | | 357,152 |
| | | | |
| | | | | |
| | | Principal
Amount ($)
or Shares | | Market
Value
$ | |
| Short-Term Investments - 4.7% | |
Russell U.S. Cash Management Fund (£) | | 17,758,627 | | 17,759 | |
| | | | | |
| |
Total Short-Term Investments
(cost $17,759) | | 17,759 | |
| | | | | |
| | |
| Other Securities - 1.0% | | | | | |
State Street Securities Lending Quality Trust (×) | | 3,614,159 | | 3,596 | |
| | | | | |
| | |
Total Other Securities
(cost $3,614) | | | | 3,596 | |
| | | | | |
| | |
Total Investments - 100.5%
(identified cost $330,635) | | | | 378,507 | |
| | |
Other Assets and Liabilities,
Net - (0.5%) | | | | (1,756 | ) |
| | | | | |
| | |
| Net Assets - 100.0% | | | | 376,751 | |
| | | | | |
See accompanying notes which are an integral part of the financial statements.
| | |
| 18 | | Multi-Style Equity Fund |
Russell Investment Funds
Multi-Style Equity Fund
Schedule of Investments, continued — December 31, 2009
Amounts in thousands (except contracts)
| | | | | | | | | | |
| Futures Contracts | | Number of
Contracts | | Notional
Amount | | Expiration
Date | | Unrealized
Appreciation
(Depreciation)
$ |
| | | | | | | | | | |
| | | | | | | | | | |
| Long Positions | | | | | | | | | | |
Russell 1000 Mini Index | | 38 | | USD | | 2,317 | | 03/10 | | 49 |
S&P 500 E-Mini Index (CME) | | 180 | | USD | | 9,996 | | 03/10 | | 159 |
S&P 500 Index (CME) | | 20 | | USD | | 5,554 | | 03/10 | | 96 |
S&P Midcap 400 E-Mini Index (CME) | | 19 | | USD | | 1,377 | | 03/10 | | 59 |
| | | | | | | | | | |
| | | | | |
Total Unrealized Appreciation (Depreciation) on Open Futures Contracts | | | | | | | | | | 363 |
| | | | | | | | | | |
Presentation of Portfolio Holdings — December 31, 2009
| | | | | | | | | | | | | | | |
| | | Market Value | | % of Net Assets | |
| Portfolio Summary | | Level 1 | | Level 2 | | Level 3 | | Total | |
| | | | | | | | | | | | | | | |
| | | | | | | | | | | | | | | |
| | | | | | | | | | | | | | | |
Common Stock | | | | | | | | | | | | | | | |
Consumer Discretionary | | $ | 49,426 | | $ | — | | $ | — | | $ | 49,426 | | 13.1 | |
Consumer Staples | | | 27,366 | | | — | | | — | | | 27,366 | | 7.3 | |
Energy | | | 36,111 | | | — | | | — | | | 36,111 | | 9.6 | |
Financial Services | | | 62,444 | | | — | | | — | | | 62,444 | | 16.6 | |
Health Care | | | 40,081 | | | — | | | — | | | 40,081 | | 10.6 | |
Materials and Processing | | | 17,995 | | | — | | | — | | | 17,995 | | 4.8 | |
Producer Durables | | | 45,682 | | | — | | | — | | | 45,682 | | 12.1 | |
Technology | | | 65,644 | | | — | | | — | | | 65,644 | | 17.4 | |
Utilities | | | 12,403 | | | — | | | — | | | 12,403 | | 3.3 | |
Short-Term Investments | | | — | | | 17,759 | | | — | | | 17,759 | | 4.7 | |
Other Securities | | | — | | | 3,596 | | | — | | | 3,596 | | 1.0 | |
| | | | | | | | | | | | | | | |
| | | | | |
Total Investments | | | 357,152 | | | 21,355 | | | — | | | 378,507 | | 100.5 | |
| | | | | | | | | | | | | | | |
Other Assets and Liabilities, Net | | | | | | | | | | | | | | (0.5 | ) |
| | | | | | | | | | | | | | | |
| | | | | |
| | | | | | | | | | | | | | 100.0 | |
| | | | | | | | | | | | | | | |
| | | | | |
Other Financial Instruments | | | | | | | | | | | | | | | |
Futures Contracts | | | 363 | | | — | | | — | | | 363 | | 0.1 | |
| | | | | | | | | | | | | | | |
Total Other Financial Instruments* | | | 363 | | | — | | | — | | | 363 | | | |
| | | | | | | | | | | | | | | |
| * | Other financial instruments not reflected in the Schedule of Investments, such as futures, forwards, and swap contracts which are valued at the unrealized appreciation/depreciation on the instruments. |
For a description of the levels see note 2 in the Notes to Financial Statements.
See accompanying notes which are an integral part of the financial statements.
| | |
| Multi-Style Equity Fund | | 19 |
Russell Investment Funds
Aggressive Equity Fund
Portfolio Management Discussion — December 31, 2009 (Unaudited)
| | | |
|
| Aggressive Equity Fund | |
| | | Total
Return | |
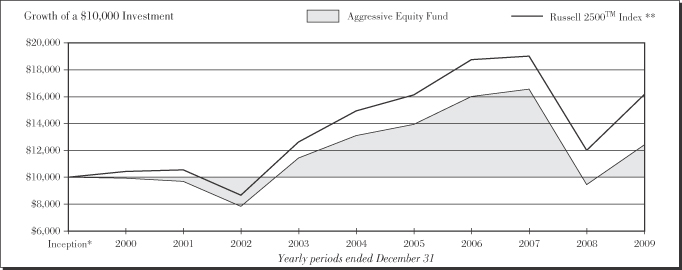
1 Year | | 34.32 | % |
5 Years | | -1.08 | %§ |
10 Years | | 2.19 | %§ |
| | | |
|
| Russell 2500™ Index ** | |
| | | Total
Return | |
1 Year | | 34.39 | % |
5 Years | | 1.58 | %§ |
10 Years | | 4.91 | %§ |
| * | | Assumes initial investment on January 1, 2000. |
| ** | | Russell 2500™ Index is composed of the bottom 500 stocks the Russell 1000® Index and all the stocks in the Russell 2000® Index. The Russell 2500™ Index return reflects adjustments for income dividends and capital gains distributions reinvested as of the ex-dividend dates. |
The performance shown in this section does not reflect any Insurance Company Separate Account or Policy Charges. Performance is historical and assumes reinvestment of all dividends and capital gains. Investment return and principal value will fluctuate so that an investor’s shares, when redeemed, may be worth more or less than when purchased. Past performance is not indicative of future results.
| | |
| 20 | | Aggressive Equity Fund |
Russell Investment Funds
Aggressive Equity Fund
Portfolio Management Discussion — December 31, 2009 (Unaudited)
The Aggressive Equity Fund (the “Fund”) allocates most of its assets among multiple money managers. Russell Investment Management Company (“RIMCo”), as the Fund’s advisor, may change the allocation of the Fund’s assets among money managers at any time. An exemptive order from the Securities and Exchange Commission (SEC) permits RIMCo to engage or terminate a money manager at any time, subject to the approval by the Fund’s Board without a shareholder vote. Pursuant to the terms of the exemptive order, the Fund is required to notify its shareholders within 60 days of when a money manager begins providing services. The Fund currently has six money managers.
What is the Fund’s investment objective?
The Fund seeks to provide long term capital growth.
How did the Fund perform relative to its benchmark for the fiscal year ended December 31, 2009?
For the fiscal year ended December 31, 2009, the Aggressive Equity Fund gained 34.32%. This compared to the Russell 2500™ Index, which gained 34.39% during the same period. The Fund’s performance includes operating expenses, whereas Index returns are unmanaged and do not include expenses of any kind.
For the year ended December 31, 2009, the Lipper® Small-Cap Core Funds (VIP) Average gained 30.57%. This result serves as a peer comparison and is expressed net of operating expenses.
How did the market conditions described in the Market Summary report affect the Fund’s performance?
The U.S. equity market began the year with elevated volatility and weakness before rebounding sharply and ultimately delivering a strong positive return for 2009. The period between January and early March 2009 saw extreme volatility and a precipitous decline. Fear and panic pervaded the market and the U.S. government stepped in with numerous stimulus packages to assist banks, auto companies and consumers. There was a pervasive fear that the economy was headed toward a very deep recession, and possibly even depression. This led to a fear driven “flight to quality” in the markets during the first part of the fiscal year where risk was avoided and investments which were deemed to be the safest outperformed those which were considered more economically sensitive or of lesser quality. From March through late October, a valuation driven rally buoyed the market, led primarily by the most economically sensitive companies and those stocks that had been priced for a high probability of bankruptcy during the market downturn in 2008. Higher beta (beta is a measure of the volatility of a given security compared to the volatility of the market as a whole) stocks, those with highly variable earnings and those with the highest debt-to-capital ratios, were the best performers during this period. This low quality market leadership persisted longer than the historical average in an economic rebound. In late October, concerns over the sustainability of the economic recovery caused a short term reversal and a flight to quality. While risk appetites increased again in November and December, the magnitude was more subdued than had been the
case prior to October. Consequently this resulted in a more favorable stock selection environment for the Fund.
The strength of the post March 9th rally dominated 2009 with smaller, lower price-to-book, lower quality stocks that had declined significantly since 2008, rallying the most. This created a headwind for the Fund, as the Fund’s bias to quality resulted in it being underweight in stocks with these characteristics. The Fund, while positioned for an economic recovery reflected by the positive contribution to performance from sector allocations, struggled with stock selection because of the quality focus of the managers’ stock selection. Stock selection was therefore the primary cause of the Fund’s underperformance. Stock selection in the most economically sensitive sectors detract the most from performance as this was where the disparity of returns was greatest between lower and higher quality stocks.
How did the investment strategies and techniques employed by the Fund and its money managers affect its performance?
The fund employs six managers: two growth, three value and one market-oriented. During the year, three managers outperformed and three underperformed. However, only the value managers outperformed their benchmarks. This disparity in performance was mainly attributed to the large financial sector weight in the Russell 2500 Value Index. The financial sector underperformed because of the issues that regional banks faced from the growing number of loan losses on their retail and commercial loan books. The duration and magnitude of these losses were uncertain, but were expected to be materially large through the year. The Fund’s value managers had an underweight exposure to regional banks. This was a key driver of outperformance for value managers.
Clarivest Asset Management, LLC a market-oriented, quantitative manager underperformed the most in the Fund. Like most other quantitative managers, 2009 was a difficult year for Clarivest. Quantitative processes struggle when factor relationships, such as price-to-book or momentum deviate from historic trends. This typically occurs at market turning points, such as March 2009. As a result, in the subsequent low quality rally Clarivest was not rewarded for its factor exposures, which caused negative stock selection across the majority of sectors. This was the primary cause of Clarivest’s underperformance.
Ranger Investment Management, L.P is a growth manager that focuses on higher quality stocks with sustainable earnings growth. During 2009 the manager was unrewarded for this investment approach, as investors sought out higher risk, more speculative stock in response to an improving economic environment. These unfavorable conditions were reflected in the manager’s negative stock selection, which was the primary cause of the manager’s underperformance.
Tygh Capital Management, Inc. a growth manager struggled in the market environment where smaller, riskier stocks were
| | |
| Aggressive Equity Fund | | 21 |
Russell Investment Funds
Aggressive Equity Fund
Portfolio Management Discussion — December 31, 2009 (Unaudited)
rewarded. Tygh had an overweight exposure to larger market cap stocks relative to their Russell 2500 Growth benchmark and to quality i.e. stocks with low levels of debt and a high Return on Equity, as these factors were heavily penalized during the year. The magnitude of these headwinds caused significant difficulties for Tygh’s stock selection process. Negative stock selection accounted for the majority of the manager’s underperformance.
Jacobs Levy Equity Management, Inc. outperformed during 2009. JLEM’s macro model resulted in investments in smaller cap (relative to the Russell 2500 Value Index) and lower price-to-book stocks that had declined significantly since the credit crisis began in 2008. As a result, when these same stocks rebounded in 2009, JLEM benefited.
DePrince, Race & Zollo, Inc. outperformed significantly during the year. While higher dividend yielding stocks, which its process focuses on were out of favor, DePrince generated strong returns from positive stock selection. Positive stock selection was greatest within the financial sector, where the manager was underweight in regional banks. In addition, DePrince’s overweight exposure to cyclical consumer related stocks was rewarded as the economic outlook improved.
Signia Capital Management, LLC had the largest outperformance in the Fund. Signia exposure to lower price-to-book, smaller market cap stocks (relative to the Russell 2500 Value Index) contributed positively to the performance during the year. In addition, Signia was underweight in regional banks . This was additive to the Signia’s performance.
Describe any changes to the Fund’s structure or the money manager line-up.
Gould Investments Partners LLC and PanAgora Asset Management Company LLC were terminated in June 2009.
| | |
| |
Money Managers as of December 31, 2009 | | Styles |
| ClariVest Asset Management LLC | | Market Oriented |
| DePrince, Race, & Zollo, Inc. | | Value |
| Jacobs Levy Equity Management, Inc. | | Value |
| Ranger Investment Management, L.P. | | Growth |
| Signia Capital Management, LLC | | Value |
| Tygh Capital Management, Inc. | | Growth |
The views expressed in this report reflect those of the portfolio managers only through the end of the period covered by the report. These views do not necessarily represent the views of RIMCo, or any other person in RIMCo or any other affiliated organization. These views are subject to change at any time based upon market conditions or other events, and RIMCo disclaims any responsibility to update the views contained herein. These views should not be relied on as investment advice and, because investment decisions for Russell Investment Funds (RIF) are based on numerous factors, should not be relied on as an indication of investment decisions of any RIF Fund.
| | |
| 22 | | Aggressive Equity Fund |
Russell Investment Funds
Aggressive Equity Fund
Shareholder Expense Example — December 31, 2009 (Unaudited)
Fund Expenses
The following disclosure provides important information regarding each Fund’s Expense Example, which appears on each Fund’s individual page in this Annual Report. Please refer to this information when reviewing the Expense Example for a Fund.
Example
As a shareholder of the Fund, you incur two types of costs: (1) transaction costs, and (2) ongoing costs, including management fees and other Fund expenses. The Example is intended to help you understand your ongoing costs (in dollars) of investing in the Fund and to compare these costs with the ongoing costs of investing in other mutual funds. The Example is based on an investment of $1,000 invested at the beginning of the period and held for the entire period indicated, which for this Fund is from July 1, 2009 to December 31, 2009.
Actual Expenses
The information in the table under the heading “Actual Performance” provides information about actual account values and actual expenses. You may use the information in this column, together with the amount you invested, to estimate the expenses that you paid over the period. Simply divide your account value by $1,000 (for example, an $8,600 account value divided by $1,000 = 8.6), then multiply the result by the number in the first column in the row entitled “Expenses Paid During Period” to estimate the expenses you paid on your account during this period.
Hypothetical Example for Comparison Purposes
The information in the table under the heading “Hypothetical Performance (5% return before expenses)” provides information about hypothetical account values and hypothetical expenses
based on the Fund’s actual expense ratio and an assumed rate of return of 5% per year before expenses, which is not the Fund’s actual return. The hypothetical account values and expenses may not be used to estimate the actual ending account balance or expenses you paid for the period. You may use this information to compare the ongoing costs of investing in the Fund and other funds. To do so, compare this 5% hypothetical example with the 5% hypothetical examples that appear in the shareholder reports of other funds.
Please note that the expenses shown in the table are meant to highlight your ongoing costs only and do not reflect any transactional costs. Therefore, the information under the heading “Hypothetical Performance (5% return before expenses)” is useful in comparing ongoing costs only, and will not help you determine the relative total costs of owning different funds. In addition, if these transactional costs were included, your costs would have been higher. The fee and expenses shown in this section do not reflect any Insurance Company Separate Account or Policy Charges.
| | | | | | |
| | | Actual
Performance | | Hypothetical
Performance
(5% return
before expenses) |
| | | | | | |
Beginning Account Value | | | | | | |
July 1, 2009 | | $ | 1,000.00 | | $ | 1,000.00 |
Ending Account Value | | | | | | |
December 31, 2009 | | $ | 1,258.50 | | $ | 1,020.11 |
Expenses Paid During Period* | | $ | 5.75 | | $ | 5.14 |
| * | Expenses are equal to the Fund’s annualized expense ratio of 1.01% (representing the one-half year period annualized), multiplied by the average account value over the period, multiplied by 184/365 (to reflect the one-half year period). Reflects amounts waived and/or reimbursed. Without the waiver and/or reimbursement, expenses would have been higher. |
| | |
| Aggressive Equity Fund | | 23 |
Russell Investment Funds
Aggressive Equity Fund
Schedule of Investments — December 31, 2009
Amounts in thousands (except share amounts)
| | | | |
| | | Principal
Amount ($)
or Shares | | Market
Value
$ |
| | | | |
| Common Stocks - 94.7% | | | | |
| Consumer Discretionary - 14.4% |
99 Cents Only Stores (Æ) | | 22,800 | | 298 |
Abercrombie & Fitch Co. Class A | | 5,010 | | 175 |
Aeropostale, Inc. (Æ) | | 3,100 | | 106 |
America’s Car-Mart, Inc. (Æ) | | 9,610 | | 253 |
American Greetings Corp. Class A (Ñ) | | 21,300 | | 464 |
Arctic Cat, Inc. (Æ) | | 1,800 | | 16 |
Asbury Automotive Group, Inc. (Æ) | | 24,431 | | 282 |
Bally Technologies, Inc. (Æ) | | 5,074 | | 209 |
Bebe Stores, Inc. | | 39,100 | | 245 |
BJ’s Restaurants, Inc. (Æ)(Ñ) | | 4,878 | | 92 |
Blyth, Inc. | | 1,500 | | 51 |
Bob Evans Farms, Inc. | | 4,900 | | 142 |
Brinker International, Inc. | | 12,100 | | 181 |
Brown Shoe Co., Inc. | | 4,700 | | 46 |
Brunswick Corp. | | 9,700 | | 123 |
Build-A-Bear Workshop, Inc. Class A (Æ) | | 3,900 | | 19 |
Cabela’s, Inc. (Æ)(Ñ) | | 12,600 | | 180 |
Carter’s, Inc. (Æ) | | 13,187 | | 346 |
Central European Distribution Corp. (Æ) | | 8,582 | | 244 |
Chico’s FAS, Inc. (Æ) | | 40,460 | | 568 |
Chipotle Mexican Grill, Inc. Class A (Æ) | | 1,231 | | 108 |
Christopher & Banks Corp. | | 35,272 | | 269 |
Churchill Downs, Inc. | | 4,795 | | 179 |
Cinemark Holdings, Inc. | | 5,900 | | 85 |
CKE Restaurants, Inc. | | 22,200 | | 188 |
Columbia Sportswear Co. | | 8,118 | | 317 |
Core-Mark Holding Co., Inc. (Æ) | | 3,600 | | 119 |
Corinthian Colleges, Inc. (Æ)(Ñ) | | 7,600 | | 105 |
Cracker Barrel Old Country Store, Inc. | | 1,400 | | 53 |
CSS Industries, Inc. | | 300 | | 6 |
Deckers Outdoor Corp. (Æ)(Ñ) | | 2,320 | | 236 |
Dick’s Sporting Goods, Inc. (Æ) | | 16,100 | | 400 |
Dillard’s, Inc. Class A (Ñ) | | 48,000 | | 886 |
Dollar Tree, Inc. (Æ) | | 16,660 | | 805 |
Domino’s Pizza, Inc. (Æ) | | 4,700 | | 39 |
Exide Technologies (Æ) | | 6,000 | | 43 |
Fastenal Co. (Ñ) | | 8,917 | | 371 |
Finish Line, Inc. (The) Class A (Ñ) | | 49,915 | | 626 |
Foot Locker, Inc. | | 34,300 | | 382 |
Fossil, Inc. (Æ) | | 8,900 | | 299 |
Fred’s, Inc. Class A | | 20,100 | | 205 |
GameStop Corp. Class A (Æ) | | 12,061 | | 265 |
Group 1 Automotive, Inc. (Æ)(Ñ) | | 10,900 | | 309 |
Guess?, Inc. | | 7,526 | | 318 |
Gymboree Corp. (Æ) | | 5,060 | | 220 |
Harman International Industries, Inc. | | 3,800 | | 134 |
Haverty Furniture Cos., Inc. (Ñ) | | 1,300 | | 18 |
Hillenbrand, Inc. | | 10,900 | | 205 |
HSN, Inc. (Æ) | | 4,700 | | 95 |
IAC/InterActiveCorp (Æ) | | 9,024 | | 185 |
Insight Enterprises, Inc. (Æ) | | 4,600 | | 53 |
Inter Parfums, Inc. | | 1,200 | | 15 |
Jarden Corp. | | 5,300 | | 164 |
Jo-Ann Stores, Inc. (Æ) | | 4,900 | | 178 |
Jones Apparel Group, Inc. | | 34,600 | | 556 |
KB Home | | 16,100 | | 220 |
| | | | |
| | | Principal
Amount ($)
or Shares | | Market
Value
$ |
Kenneth Cole Productions, Inc. Class A (Æ) | | 22,186 | | 214 |
Leapfrog Enterprises, Inc. Class A (Æ) | | 2,500 | | 10 |
Lithia Motors, Inc. Class A (Æ) | | 38,000 | | 312 |
Liz Claiborne, Inc. (Æ)(Ñ) | | 47,650 | | 268 |
LKQ Corp. (Æ) | | 17,865 | | 350 |
Meredith Corp. (Ñ) | | 10,700 | | 330 |
MSC Industrial Direct Co. Class A | | 4,816 | | 226 |
New York & Co., Inc. (Æ) | | 4,700 | | 20 |
Nu Skin Enterprises, Inc. Class A | | 14,500 | | 390 |
O’Charleys, Inc. (Æ) | | 4,100 | | 27 |
Oxford Industries, Inc. | | 1,200 | | 25 |
Pacific Sunwear of California, Inc. (Æ) | | 65,610 | | 261 |
Papa John’s International, Inc. (Æ) | | 3,400 | | 79 |
PC Connection, Inc. (Æ) | | 2,000 | | 13 |
PEP Boys-Manny Moe & Jack | | 5,000 | | 42 |
Perry Ellis International, Inc. (Æ) | | 7,800 | | 117 |
PF Chang’s China Bistro, Inc. (Æ)(Ñ) | | 5,840 | | 221 |
Phillips-Van Heusen Corp. | | 7,200 | | 293 |
Pricesmart, Inc. | | 6,100 | | 125 |
RadioShack Corp. | | 10,400 | | 203 |
RC2 Corp. (Æ) | | 2,600 | | 38 |
Regal Entertainment Group Class A | | 20,700 | | 299 |
Regis Corp. (Ñ) | | 6,600 | | 103 |
Rent-A-Center, Inc. Class A (Æ) | | 22,800 | | 404 |
Revlon, Inc. (Æ)(Ñ) | | 4,200 | | 71 |
Ross Stores, Inc. | | 3,400 | | 145 |
Service Corp. International | | 20,900 | | 171 |
Shoe Carnival, Inc. (Æ) | | 1,400 | | 29 |
Sinclair Broadcast Group, Inc. Class A (Æ) | | 21,800 | | 88 |
Skechers U.S.A., Inc. Class A (Æ) | | 7,200 | | 212 |
Sotheby’s Class A (Ñ) | | 18,714 | | 421 |
Stage Stores, Inc. | | 30,700 | | 379 |
Standard Motor Products, Inc. (Æ) | | 2,900 | | 25 |
Steven Madden, Ltd. (Æ) | | 19,546 | | 806 |
Stewart Enterprises, Inc. Class A (Ñ) | | 65,100 | | 335 |
Superior Industries International, Inc. (Ñ) | | 13,940 | | 213 |
Tech Data Corp. (Æ) | | 10,400 | | 485 |
Thor Industries, Inc. | | 7,940 | | 249 |
Ticketmaster Entertainment, Inc. (Æ) | | 33,400 | | 408 |
Timberland Co. Class A (Æ) | | 8,200 | | 147 |
United Stationers, Inc. (Æ) | | 4,500 | | 256 |
Urban Outfitters, Inc. (Æ) | | 6,450 | | 226 |
Valassis Communications, Inc. (Æ) | | 6,200 | | 113 |
Warnaco Group, Inc. (The) (Æ) | | 6,442 | | 272 |
Washington Post Co. (The) Class B | | 400 | | 176 |
Wendy’s/Arby’s Group, Inc. | | 83,500 | | 392 |
WESCO International, Inc. (Æ)(Ñ) | | 4,400 | | 119 |
Williams-Sonoma, Inc. | | 3,901 | | 81 |
| | | | |
| | | | 22,885 |
| | | | |
| | |
| Consumer Staples - 2.5% | | | | |
Alliance One International, Inc. (Æ)(Ñ) | | 33,767 | | 165 |
Andersons, Inc. (The) | | 14,368 | | 371 |
Casey’s General Stores, Inc. | | 4,400 | | 140 |
Chiquita Brands International, Inc. (Æ) | | 11,300 | | 204 |
Corn Products International, Inc. | | 3,900 | | 114 |
| | |
| 24 | | Aggressive Equity Fund |
Russell Investment Funds
Aggressive Equity Fund
Schedule of Investments, continued — December 31, 2009
Amounts in thousands (except share amounts)
| | | | |
| | | Principal
Amount ($)
or Shares | | Market
Value
$ |
| | | | |
Del Monte Foods Co. | | 61,900 | | 702 |
Fresh Del Monte Produce, Inc. (Æ) | | 7,900 | | 175 |
Herbalife, Ltd. | | 8,500 | | 345 |
Lancaster Colony Corp. (Ñ) | | 6,300 | | 313 |
Nash Finch Co. | | 3,300 | | 122 |
Pantry, Inc. (The) (Æ) | | 4,400 | | 60 |
Ralcorp Holdings, Inc. (Æ) | | 5,114 | | 305 |
Sanderson Farms, Inc. | | 7,900 | | 333 |
Spartan Stores, Inc. (Ñ) | | 4,600 | | 66 |
SUPERVALU, Inc. | | 5,000 | | 63 |
TreeHouse Foods, Inc. (Æ)(Ñ) | | 11,450 | | 445 |
| | | | |
| | | | 3,923 |
| | | | |
| | |
| Energy - 4.3% | | | | |
Alon USA Energy, Inc. (Ñ) | | 2,800 | | 19 |
Alpha Natural Resources, Inc. (Æ) | | 10,812 | | 469 |
Basic Energy Services, Inc. (Æ) | | 4,500 | | 40 |
Berry Petroleum Co. Class A | | 1,300 | | 38 |
BJ Services Co. | | 12,867 | | 239 |
Cal Dive International, Inc. (Æ) | | 1,200 | | 9 |
Cie Generale de Geophysique-Veritas - ADR (Æ)(Ñ) | | 8,439 | | 179 |
Continental Resources, Inc. (Æ) | | 6,380 | | 274 |
Core Laboratories NV (Ñ) | | 2,628 | | 310 |
Dawson Geophysical Co. (Æ)(Ñ) | | 1,300 | | 30 |
Delek US Holdings, Inc. | | 4,400 | | 30 |
EXCO Resources, Inc. | | 10,490 | | 223 |
Exterran Holdings, Inc. (Æ)(Ñ) | | 9,261 | | 199 |
Frontier Oil Corp. | | 34,900 | | 420 |
Geokinetics, Inc. (Æ) | | 1,200 | | 12 |
Gulf Island Fabrication, Inc. | | 2,200 | | 46 |
Matrix Service Co. (Æ) | | 3,800 | | 40 |
Noble Corp. | | 7,160 | | 291 |
Oceaneering International, Inc. (Æ) | | 3,600 | | 211 |
Oil States International, Inc. (Æ) | | 7,100 | | 279 |
Patterson-UTI Energy, Inc. (Ñ) | | 16,329 | | 251 |
Petroleum Development Corp. (Æ) | | 3,500 | | 64 |
Petroquest Energy, Inc. (Æ) | | 33,245 | | 204 |
Pioneer Drilling Co. (Æ) | | 1,600 | | 13 |
Precision Drilling Trust | | 27,968 | | 203 |
Rosetta Resources, Inc. (Æ) | | 26,617 | | 530 |
Rowan Cos., Inc. (Æ) | | 14,745 | | 334 |
RPC, Inc. (Ñ) | | 26,900 | | 280 |
St. Mary Land & Exploration Co. | | 6,300 | | 216 |
Sunoco, Inc. | | 6,927 | | 181 |
Superior Energy Services, Inc. (Æ) | | 19,389 | | 471 |
Tesoro Corp. (Ñ) | | 14,500 | | 196 |
Union Drilling, Inc. (Æ) | | 1,300 | | 8 |
Unit Corp. (Æ)(Ñ) | | 6,403 | | 272 |
W&T Offshore, Inc. | | 13,200 | | 154 |
Western Refining, Inc. (Æ)(Ñ) | | 9,700 | | 46 |
| | | | |
| | | | 6,781 |
| | | | |
| | |
| Financial Services - 18.0% | | | | |
Advance America Cash Advance Centers, Inc. | | 42,600 | | 237 |
Affiliated Managers Group, Inc. (Æ)(Ñ) | | 18,182 | | 1,225 |
| | | | |
| | | Principal
Amount ($)
or Shares | | Market
Value
$ |
Agree Realty Corp. (ö) | | 600 | | 14 |
Alliance Data Systems Corp. (Æ)(Ñ) | | 3,852 | | 249 |
Allied World Assurance Co. Holdings, Ltd. | | 6,000 | | 276 |
American Capital Agency Corp. (ö) | | 7,400 | | 196 |
American Equity Investment Life Holding Co. | | 37,000 | | 275 |
American Financial Group, Inc. | | 11,400 | | 284 |
Ameriprise Financial, Inc. | | 8,064 | | 313 |
Annaly Capital Management, Inc. (ö) | | 20,667 | | 359 |
Anworth Mortgage Asset Corp. (ö) | | 68,500 | | 479 |
Arch Capital Group, Ltd. (Æ) | | 3,900 | | 279 |
Ares Capital Corp. | | 57,501 | | 716 |
Argo Group International Holdings, Ltd. (Æ) | | 3,800 | | 111 |
Artio Global Investors, Inc. (Æ) | | 11,239 | | 286 |
Aspen Insurance Holdings, Ltd. | | 11,100 | | 282 |
Assurant, Inc. | | 2,200 | | 65 |
Axis Capital Holdings, Ltd. | | 6,200 | | 176 |
Bancfirst Corp. | | 1,000 | | 37 |
Banco Latinoamericano de Comercio Exterior SA Class E | | 4,800 | | 67 |
Bank of the Ozarks, Inc. (Ñ) | | 1,400 | | 41 |
Berkshire Hills Bancorp, Inc. | | 900 | | 19 |
BioMed Realty Trust, Inc. (ö) | | 2,100 | | 33 |
BOK Financial Corp. (Ñ) | | 13,625 | | 647 |
Boston Private Financial Holdings, Inc. | | 45,709 | | 264 |
Brandywine Realty Trust (ö) | | 21,600 | | 246 |
Brookline Bancorp, Inc. (Ñ) | | 14,200 | | 141 |
Calamos Asset Management, Inc. Class A | | 18,800 | | 217 |
CapLease, Inc. (ö)(Ñ) | | 1,100 | | 5 |
Capstead Mortgage Corp. (ö) | | 45,800 | | 625 |
Cardinal Financial Corp. | | 1,900 | | 17 |
Cedar Shopping Centers, Inc. (ö) | | 3,900 | | 26 |
Chimera Investment Corp. (ö) | | 31,300 | | 121 |
Citizens Republic Bancorp, Inc. (Æ) | | 59,200 | | 41 |
City Holding Co. | | 1,400 | | 45 |
Colonial Properties Trust (ö) | | 13,900 | | 163 |
Community Trust Bancorp, Inc. (Ñ) | | 1,000 | | 24 |
CVB Financial Corp. (Ñ) | | 12,700 | | 110 |
Cybersource Corp. (Æ) | | 24,554 | | 494 |
Delphi Financial Group, Inc. Class A | | 9,952 | | 223 |
DiamondRock Hospitality Co. (ö)(Ñ) | | 56,798 | | 481 |
Dime Community Bancshares (Ñ) | | 9,900 | | 116 |
Duff & Phelps Corp. Class A | | 25,100 | | 458 |
DuPont Fabros Technology, Inc. (ö) | | 24,133 | | 434 |
Education Realty Trust, Inc. (ö) | | 8,900 | | 43 |
Endurance Specialty Holdings, Ltd. | | 6,600 | | 246 |
Euronet Worldwide, Inc. (Æ) | | 8,747 | | 192 |
Evercore Partners, Inc. Class A (Ñ) | | 1,700 | | 52 |
FBL Financial Group, Inc. Class A (Ñ) | | 1,800 | | 33 |
Fidelity National Financial, Inc. Class A | | 14,100 | | 190 |
Fidelity National Information Services, Inc. | | 15,000 | | 352 |
First Cash Financial Services, Inc. (Æ) | | 9,000 | | 200 |
First Community Bancshares, Inc. | | 2,300 | | 28 |
First Financial Bancorp | | 11,700 | | 170 |
First Financial Holdings, Inc. | | 1,100 | | 14 |
First Industrial Realty Trust, Inc. (Æ)(ö) | | 1,900 | | 10 |
First Mercury Financial Corp. | | 2,000 | | 27 |
| | |
| Aggressive Equity Fund | | 25 |
Russell Investment Funds
Aggressive Equity Fund
Schedule of Investments, continued — December 31, 2009
Amounts in thousands (except share amounts)
| | | | |
| | | Principal
Amount ($)
or Shares | | Market
Value
$ |
| | | | |
First Niagara Financial Group, Inc. | | 36,300 | | 505 |
First Potomac Realty Trust (ö) | | 4,400 | | 55 |
Flushing Financial Corp. | | 2,500 | | 28 |
FPIC Insurance Group, Inc. (Æ) | | 600 | | 23 |
Franklin Street Properties Corp. (ö) | | 25,214 | | 368 |
Glimcher Realty Trust (ö) | | 2,100 | | 6 |
Global Payments, Inc. | | 5,543 | | 299 |
Hancock Holding Co. (Ñ) | | 8,100 | | 355 |
Hercules Technology Growth Capital, Inc. | | 3,900 | | 40 |
Hersha Hospitality Trust (ö)(Ñ) | | 4,400 | | 14 |
Home Bancshares, Inc. | | 2,500 | | 60 |
Horace Mann Educators Corp. | | 20,300 | | 254 |
Hospitality Properties Trust (ö) | | 21,800 | | 517 |
HRPT Properties Trust (ö) | | 29,600 | | 191 |
IBERIABANK Corp. | | 14,550 | | 783 |
Independent Bank Corp. (Ñ) | | 6,100 | | 127 |
Infinity Property & Casualty Corp. | | 1,100 | | 45 |
Investment Technology Group, Inc. (Æ) | | 1,900 | | 37 |
JER Investors Trust, Inc. (Æ)(Þ) | | 1,771 | | — |
Kite Realty Group Trust (ö) | | 6,700 | | 27 |
Knight Capital Group, Inc. Class A (Æ) | | 18,931 | | 292 |
Lakeland Financial Corp. | | 1,000 | | 17 |
LaSalle Hotel Properties (ö) | | 14,525 | | 308 |
Lazard, Ltd. Class A | | 15,870 | | 603 |
Lexington Realty Trust (ö)(Ñ) | | 2,555 | | 16 |
Mack-Cali Realty Corp. (ö) | | 7,300 | | 252 |
MarketAxess Holdings, Inc. | | 18,608 | | 259 |
Marshall & Ilsley Corp. | | 1,900 | | 10 |
MCG Capital Corp. (Æ) | | 43,200 | | 187 |
Meadowbrook Insurance Group, Inc. | | 5,485 | | 41 |
MFA Financial, Inc. (ö) | | 50,900 | | 374 |
Montpelier Re Holdings, Ltd. | | 7,200 | | 125 |
MSCI, Inc. Class A (Æ) | | 9,092 | | 289 |
MVC Capital, Inc. | | 1,000 | | 12 |
Nara Bancorp, Inc. (Æ) | | 2,000 | | 23 |
Nelnet, Inc. Class A | | 19,900 | | 343 |
NewAlliance Bancshares, Inc. (Ñ) | | 24,800 | | 298 |
OceanFirst Financial Corp. | | 1,700 | | 19 |
Old National Bancorp (Ñ) | | 36,200 | | 450 |
Old Republic International Corp. | | 23,700 | | 238 |
OneBeacon Insurance Group, Ltd. Class A | | 2,800 | | 39 |
Oriental Financial Group, Inc. | | 35,563 | | 384 |
Park National Corp. (Ñ) | | 1,000 | | 59 |
Parkway Properties, Inc. (ö) | | 3,400 | | 71 |
PartnerRe, Ltd. - ADR | | 4,400 | | 328 |
PennantPark Investment Corp. | | 40,881 | | 365 |
Pennsylvania Real Estate Investment Trust (ö)(Ñ) | | 3,900 | | 33 |
Phoenix Cos., Inc. (The) (Æ) | | 14,300 | | 40 |
Pinnacle Financial Partners, Inc. (Æ)(Ñ) | | 18,880 | | 268 |
Piper Jaffray Cos. (Æ) | | 6,256 | | 317 |
Platinum Underwriters Holdings, Ltd. | | 6,300 | | 241 |
PMA Capital Corp. Class A (Æ) | | 1,700 | | 11 |
Prosperity Bancshares, Inc. (Ñ) | | 8,000 | | 324 |
Protective Life Corp. | | 11,400 | | 189 |
Provident Financial Services, Inc. | | 12,900 | | 137 |
Provident New York Bancorp | | 1,800 | | 15 |
Ramco-Gershenson Properties Trust (ö) | | 28,100 | | 268 |
| | | | |
| | | Principal
Amount ($)
or Shares | | Market
Value
$ |
Raymond James Financial, Inc. | | 12,997 | | 309 |
Renasant Corp. (Ñ) | | 1,500 | | 20 |
Resource Capital Corp. (ö) | | 4,200 | | 21 |
Sandy Spring Bancorp, Inc. (Ñ) | | 1,700 | | 15 |
SCBT Financial Corp. | | 400 | | 11 |
SeaBright Insurance Holdings, Inc. (Æ) | | 300 | | 3 |
Selective Insurance Group | | 12,200 | | 201 |
Senior Housing Properties Trust (ö) | | 9,136 | | 200 |
Signature Bank NY (Æ) | | 8,990 | | 287 |
Simmons First National Corp. Class A | | 700 | | 19 |
Southside Bancshares, Inc. | | 700 | | 14 |
Southwest Bancorp, Inc. | | 900 | | 6 |
Sovran Self Storage, Inc. (ö) | | 1,500 | | 54 |
StanCorp Financial Group, Inc. | | 5,700 | | 228 |
StellarOne Corp. (Ñ) | | 25,087 | | 250 |
Sterling Bancorp | | 3,100 | | 22 |
Sterling Bancshares, Inc. | | 55,400 | | 284 |
Sun Bancorp, Inc. (Æ) | | 1,653 | | 6 |
SVB Financial Group (Æ)(Ñ) | | 5,270 | | 220 |
SWS Group, Inc. | | 4,700 | | 57 |
Texas Capital Bancshares, Inc. (Æ) | | 13,712 | | 191 |
TICC Capital Corp. | | 1,700 | | 10 |
Tower Group, Inc. | | 14,523 | | 340 |
Transatlantic Holdings, Inc. | | 2,300 | | 120 |
Trustmark Corp. | | 14,000 | | 316 |
U-Store-It Trust (ö) | | 8,600 | | 63 |
Union Bankshares Corp. | | 1,400 | | 17 |
United America Indemnity, Ltd. Class A (Æ) | | 3,802 | | 30 |
United Community Banks, Inc. (Æ)(Ñ) | | 5,200 | | 18 |
United Financial Bancorp, Inc. | | 1,500 | | 20 |
United Fire & Casualty Co. | | 12,000 | | 219 |
Valley National Bancorp (Ñ) | | 22,800 | | 322 |
Waddell & Reed Financial, Inc. Class A | | 7,257 | | 222 |
Washington Federal, Inc. | | 13,100 | | 253 |
Webster Financial Corp. | | 7,600 | | 90 |
WesBanco, Inc. | | 2,200 | | 27 |
Whitney Holding Corp. | | 22,242 | | 203 |
Wilshire Bancorp, Inc. (Ñ) | | 1,700 | | 14 |
Wintrust Financial Corp. (Ñ) | | 3,000 | | 92 |
WSFS Financial Corp. | | 500 | | 13 |
Zenith National Insurance Corp. (Ñ) | | 9,750 | | 290 |
| | | | |
| | | | 28,550 |
| | | | |
| | |
| Health Care - 10.3% | | | | |
Affymetrix, Inc. (Æ) | | 4,200 | | 25 |
Albany Molecular Research, Inc. (Æ) | | 20,810 | | 189 |
Amedisys, Inc. (Æ)(Ñ) | | 20,045 | | 973 |
Analogic Corp. (Ñ) | | 12,732 | | 490 |
athenahealth, Inc. (Æ)(Ñ) | | 6,990 | | 316 |
Brookdale Senior Living, Inc. (Æ) | | 9,786 | | 178 |
Centene Corp. (Æ) | | 9,900 | | 210 |
Cerner Corp. (Æ) | | 4,150 | | 342 |
Cigna Corp. | | 5,801 | | 205 |
Coventry Health Care, Inc. (Æ) | | 3,400 | | 83 |
Cutera, Inc. (Æ) | | 900 | | 8 |
Cynosure, Inc. Class A (Æ) | | 19,720 | | 227 |
Dentsply International, Inc. (Ñ) | | 10,208 | | 359 |
| | |
| 26 | | Aggressive Equity Fund |
Russell Investment Funds
Aggressive Equity Fund
Schedule of Investments, continued — December 31, 2009
Amounts in thousands (except share amounts)
| | | | |
| | | Principal
Amount ($)
or Shares | | Market
Value
$ |
| | | | |
Edwards Lifesciences Corp. (Æ) | | 3,442 | | 299 |
Emergency Medical Services Corp. Class A (Æ) | | 3,200 | | 173 |
Endo Pharmaceuticals Holdings, Inc. (Æ) | | 7,000 | | 144 |
Gentiva Health Services, Inc. (Æ) | | 8,182 | | 221 |
Harvard Bioscience, Inc. (Æ) | | 49,156 | | 175 |
Health Net, Inc. (Æ) | | 13,900 | | 324 |
Healthsouth Corp. (Æ) | | 10,328 | | 194 |
Healthspring, Inc. (Æ) | | 41,420 | | 729 |
Henry Schein, Inc. (Æ) | | 3,894 | | 205 |
HMS Holdings Corp. (Æ)(Ñ) | | 13,840 | | 674 |
Humana, Inc. (Æ) | | 5,600 | | 246 |
Icon PLC - ADR (Æ) | | 21,046 | | 457 |
IDEXX Laboratories, Inc. (Æ)(Ñ) | | 5,438 | | 291 |
Illumina, Inc. (Æ)(Ñ) | | 7,125 | | 218 |
Invacare Corp. (Ñ) | | 3,800 | | 95 |
Inverness Medical Innovations, Inc. (Æ) | | 6,840 | | 284 |
Kindred Healthcare, Inc. (Æ) | | 18,858 | | 348 |
Kinetic Concepts, Inc. (Æ) | | 2,700 | | 102 |
King Pharmaceuticals, Inc. (Æ)(Ñ) | | 40,625 | | 498 |
Life Technologies Corp. (Æ) | | 6,237 | | 326 |
Magellan Health Services, Inc. (Æ) | | 6,300 | | 257 |
MedAssets, Inc. (Æ)(Ñ) | | 10,410 | | 221 |
Medicines Co. (The) (Æ) | | 3,400 | | 28 |
Mednax, Inc. (Æ) | | 6,618 | | 398 |
Meridian Bioscience, Inc. | | 1,600 | | 34 |
Molina Healthcare, Inc. (Æ)(Ñ) | | 5,200 | | 119 |
Mylan, Inc. (Æ)(Ñ) | | 20,597 | | 380 |
NuVasive, Inc. (Æ)(Ñ) | | 6,250 | | 200 |
Odyssey HealthCare, Inc. (Æ) | | 6,000 | | 93 |
Omnicare, Inc. | | 13,800 | | 334 |
OSI Systems, Inc. (Æ)(Ñ) | | 15,356 | | 419 |
Owens & Minor, Inc. | | 700 | | 30 |
Palomar Medical Technologies, Inc. (Æ) | | 3,000 | | 30 |
Par Pharmaceutical Cos., Inc. (Æ) | | 39,612 | | 1,072 |
Patterson Cos., Inc. (Æ) | | 8,305 | | 232 |
PerkinElmer, Inc. | | 11,098 | | 228 |
Prestige Brands Holdings, Inc. (Æ) | | 400 | | 3 |
Res-Care, Inc. (Æ) | | 2,200 | | 25 |
Skilled Healthcare Group, Inc. Class A (Æ) | | 1,000 | | 7 |
STERIS Corp. (Ñ) | | 10,203 | | 285 |
Sun Healthcare Group, Inc.
Class W (Æ) | | 7,600 | | 70 |
SXC Health Solutions Corp. (Æ) | | 12,756 | | 688 |
Symmetry Medical, Inc. (Æ) | | 4,200 | | 34 |
Techne Corp. | | 4,228 | | 290 |
Teleflex, Inc. | | 3,440 | | 185 |
Universal American Corp. (Æ) | | 7,500 | | 88 |
Universal Health Services, Inc. Class B | | 20,060 | | 612 |
Watson Pharmaceuticals, Inc.
Class B (Æ) | | 11,700 | | 463 |
| | | | |
| | | | 16,433 |
| | | | |
|
| Materials and Processing - 8.5% |
A Schulman, Inc. | | 11,600 | | 234 |
Aceto Corp. | | 1,400 | | 7 |
AEP Industries, Inc. (Æ) | | 500 | | 19 |
Airgas, Inc. | | 9,737 | | 464 |
AK Steel Holding Corp. | | 18,690 | | 399 |
| | | | |
| | | Principal
Amount ($)
or Shares | | Market
Value
$ |
Albemarle Corp. | | 17,275 | | 628 |
Allegheny Technologies, Inc. (Ñ) | | 6,867 | | 307 |
Apogee Enterprises, Inc. (Ñ) | | 3,000 | | 42 |
Ashland, Inc. | | 7,600 | | 301 |
Bway Holding Co. (Æ) | | 10,199 | | 196 |
Cabot Corp. | | 10,638 | | 279 |
Carpenter Technology Corp. | | 5,600 | | 151 |
Clarcor, Inc. | | 12,400 | | 402 |
Clearwater Paper Corp. (Æ) | | 2,900 | | 159 |
Comfort Systems USA, Inc. | | 9,800 | | 121 |
Commercial Metals Co. | | 10,700 | | 167 |
Crown Holdings, Inc. (Æ) | | 2,900 | | 74 |
Cytec Industries, Inc. | | 12,026 | | 438 |
Encore Wire Corp. (Ñ) | | 2,300 | | 49 |
Ferro Corp. | | 5,900 | | 49 |
FMC Corp. | | 5,143 | | 287 |
Gammon Gold, Inc. (Æ) | | 21,511 | | 237 |
General Cable Corp. (Æ)(Ñ) | | 4,400 | | 129 |
Gibraltar Industries, Inc. (Æ) | | 6,000 | | 94 |
Griffon Corp. (Æ) | | 5,000 | | 61 |
HB Fuller Co. | | 6,600 | | 150 |
Huntsman Corp. | | 7,000 | | 79 |
Innophos Holdings, Inc. | | 2,700 | | 62 |
International Flavors & Fragrances, Inc. | | 2,500 | | 103 |
Intrepid Potash, Inc. (Æ) | | 7,859 | | 229 |
Kaydon Corp. (Ñ) | | 9,000 | | 322 |
Koppers Holdings, Inc. | | 900 | | 27 |
LB Foster Co. Class A (Æ) | | 1,100 | | 33 |
Lubrizol Corp. | | 6,344 | | 463 |
Mueller Water Products, Inc. Class A | | 30,800 | | 160 |
Myers Industries, Inc. | | 2,800 | | 26 |
Olin Corp. | | 16,600 | | 291 |
OM Group, Inc. (Æ) | | 14,391 | | 452 |
Owens-Illinois, Inc. (Æ) | | 8,100 | | 266 |
Pactiv Corp. (Æ) | | 5,800 | | 140 |
PolyOne Corp. (Æ) | | 12,800 | | 96 |
Quaker Chemical Corp. | | 1,900 | | 39 |
Quanex Building Products Corp. | | 19,200 | | 326 |
Reliance Steel & Aluminum Co. | | 21,400 | | 925 |
Rock-Tenn Co. Class A | | 10,400 | | 524 |
RPM International, Inc. | | 13,720 | | 279 |
Schnitzer Steel Industries, Inc. Class A | | 800 | | 38 |
Schweitzer-Mauduit International, Inc. | | 12,680 | | 892 |
Silgan Holdings, Inc. | | 4,100 | | 237 |
Simpson Manufacturing Co., Inc. (Ñ) | | 3,300 | | 89 |
Sims Metal Management, Ltd. - ADR | | 11,257 | | 220 |
Sonoco Products Co. | | 7,700 | | 225 |
Spartech Corp. | | 4,300 | | 44 |
Steel Dynamics, Inc. | | 12,761 | | 226 |
Stillwater Mining Co. (Æ) | | 26,965 | | 256 |
Symyx Technologies, Inc. (Æ) | | 2,500 | | 14 |
Thompson Creek Metals Co., Inc. (Æ) | | 17,452 | | 205 |
Timken Co. | | 9,400 | | 223 |
Titanium Metals Corp. (Æ) | | 16,464 | | 206 |
Universal Forest Products, Inc. | | 2,500 | | 92 |
Worthington Industries, Inc. | | 6,000 | | 78 |
Zoltek Cos., Inc. (Æ)(Ñ) | | 15,337 | | 146 |
| | | | |
| | | | 13,477 |
| | | | |
| | |
| Aggressive Equity Fund | | 27 |
Russell Investment Funds
Aggressive Equity Fund
Schedule of Investments, continued — December 31, 2009
Amounts in thousands (except share amounts)
| | | | |
| | | Principal
Amount ($)
or Shares | | Market
Value
$ |
| | | | |
| Producer Durables - 15.4% |
Actuant Corp. Class A | | 12,573 | | 233 |
Administaff, Inc. | | 13,700 | | 323 |
AGCO Corp. (Æ)(Ñ) | | 25,356 | | 820 |
Aircastle, Ltd. | | 6,000 | | 59 |
Alaska Air Group, Inc. (Æ) | | 2,800 | | 97 |
Alexander & Baldwin, Inc. (Ñ) | | 6,565 | | 225 |
American Railcar Industries, Inc. | | 1,900 | | 21 |
AO Smith Corp. | | 5,600 | | 243 |
Applied Industrial Technologies, Inc. | | 10,100 | | 223 |
Arkansas Best Corp. | | 13,800 | | 406 |
Astec Industries, Inc. (Æ) | | 8,293 | | 223 |
Baldor Electric Co. (Ñ) | | 4,500 | | 126 |
Barnes Group, Inc. | | 17,900 | | 302 |
BE Aerospace, Inc. (Æ)(Ñ) | | 22,381 | | 526 |
Brink’s Co. (The) | | 10,500 | | 256 |
Bristow Group, Inc. (Æ) | | 7,113 | | 273 |
Bucyrus International, Inc. Class A | | 15,460 | | 871 |
CDI Corp. | | 2,000 | | 26 |
Celadon Group, Inc. (Æ) | | 1,200 | | 13 |
Ceradyne, Inc. (Æ) | | 16,119 | | 310 |
CIRCOR International, Inc. | | 1,900 | | 48 |
Columbus McKinnon Corp. (Æ) | | 2,600 | | 35 |
Con-way, Inc. | | 5,100 | | 178 |
Consolidated Graphics, Inc. (Æ) | | 1,300 | | 46 |
Convergys Corp. (Æ) | | 15,800 | | 170 |
Copart, Inc. (Æ) | | 7,110 | | 260 |
Corporate Executive Board Co. (The) | | 17,400 | | 397 |
CRA International, Inc. (Æ) | | 900 | | 24 |
Crane Co. | | 7,800 | | 239 |
Cross Country Healthcare, Inc. (Æ) | | 2,800 | | 28 |
Cubic Corp. | | 6,900 | | 257 |
Curtiss-Wright Corp. | | 11,700 | | 366 |
Deluxe Corp. | | 1,700 | | 25 |
DryShips, Inc. (Æ)(Ñ) | | 31,049 | | 181 |
Ducommun, Inc. | | 1,900 | | 36 |
DXP Enterprises, Inc. (Æ)(Ñ) | | 2,100 | | 27 |
Dycom Industries, Inc. (Æ) | | 6,300 | | 51 |
DynCorp International, Inc. Class A (Æ) | | 1,900 | | 27 |
Electro Rent Corp. | | 28,719 | | 331 |
Electronics for Imaging, Inc. (Æ) | | 852 | | 11 |
EMCOR Group, Inc. (Æ) | | 5,300 | | 143 |
EnerSys (Æ) | | 19,306 | | 422 |
Ennis, Inc. | | 1,600 | | 27 |
EnPro Industries, Inc. (Æ)(Ñ) | | 3,000 | | 79 |
Federal Signal Corp. | | 2,800 | | 17 |
Flowserve Corp. | | 2,600 | | 246 |
Foster Wheeler AG (Æ) | | 14,429 | | 425 |
Franklin Electric Co., Inc. | | 5,700 | | 166 |
FreightCar America, Inc. | | 1,800 | | 36 |
FTI Consulting, Inc. (Æ) | | 4,998 | | 236 |
G&K Services, Inc. Class A | | 12,300 | | 309 |
Gardner Denver, Inc. | | 2,600 | | 111 |
General Maritime Corp. | | 13,600 | | 95 |
Genesee & Wyoming, Inc. Class A (Æ) | | 6,559 | | 214 |
Geo Group, Inc. (The) (Æ) | | 24,444 | | 535 |
Global Sources, Ltd. (Æ) | | 1,300 | | 8 |
| | | | |
| | | Principal
Amount ($)
or Shares | | Market
Value
$ |
Granite Construction, Inc. (Ñ) | | 11,500 | | 387 |
Greenbrier Cos., Inc. | | 1,000 | | 10 |
H&E Equipment Services, Inc. (Æ) | | 3,200 | | 34 |
Hewitt Associates, Inc. Class A (Æ) | | 14,200 | | 600 |
Horizon Lines, Inc. Class A | | 2,900 | | 16 |
Hubbell, Inc. Class B | | 5,700 | | 270 |
IDEX Corp. | | 14,660 | | 457 |
Insituform Technologies, Inc. Class A (Æ)(Ñ) | | 13,016 | | 296 |
Joy Global, Inc. | | 5,538 | | 286 |
Kadant, Inc. (Æ) | | 1,000 | | 16 |
Kaman Corp. Class A | | 12,800 | | 296 |
KBR, Inc. | | 29,500 | | 560 |
Kelly Services, Inc. Class A (Æ) | | 1,700 | | 20 |
Kennametal, Inc. | | 10,516 | | 273 |
Kforce, Inc. (Æ) | | 3,300 | | 41 |
Knight Transportation, Inc. (Ñ) | | 14,111 | | 272 |
Knightsbridge Tankers, Ltd. | | 1,800 | | 24 |
Layne Christensen Co. (Æ) | | 9,191 | | 264 |
Lexmark International, Inc. Class A (Æ) | | 13,400 | | 348 |
M&F Worldwide Corp. (Æ) | | 1,800 | | 71 |
McDermott International, Inc. (Æ) | | 19,093 | | 458 |
Modine Manufacturing Co. (Æ) | | 15,200 | | 180 |
Moog, Inc. Class A (Æ) | | 400 | | 12 |
NACCO Industries, Inc. Class A | | 3,446 | | 172 |
Nalco Holding Co. | | 10,864 | | 277 |
Navistar International Corp. (Æ) | | 2,593 | | 100 |
Oshkosh Corp. | | 13,500 | | 500 |
PHI, Inc. (Æ) | | 11,398 | | 236 |
Quanta Services, Inc. (Æ) | | 4,934 | | 103 |
Robbins & Myers, Inc. | | 9,767 | | 230 |
Robert Half International, Inc. | | 10,867 | | 290 |
Roper Industries, Inc. | | 11,446 | | 599 |
RR Donnelley & Sons Co. | | 25,300 | | 563 |
Ryder System, Inc. | | 5,300 | | 218 |
Saia, Inc. (Æ) | | 2,400 | | 36 |
Shaw Group, Inc. (The) (Æ) | | 6,600 | | 190 |
Skywest, Inc. | | 8,200 | | 139 |
Southwest Airlines Co. | | 24,338 | | 278 |
Spherion Corp. (Æ) | | 3,900 | | 22 |
SPX Corp. | | 5,300 | | 290 |
Standard Register Co. (The) | | 500 | | 3 |
Steelcase, Inc. Class A (Ñ) | | 9,100 | | 58 |
Sterling Construction Co., Inc. (Æ) | | 1,900 | | 36 |
Thomas & Betts Corp. (Æ) | | 2,200 | | 79 |
Tidewater, Inc. | | 6,300 | | 302 |
Trinity Industries, Inc. (Ñ) | | 14,600 | | 255 |
Triumph Group, Inc. | | 2,200 | | 106 |
TrueBlue, Inc. (Æ) | | 6,800 | | 101 |
Tutor Perini Corp. (Æ) | | 8,600 | | 155 |
Twin Disc, Inc. | | 900 | | 9 |
URS Corp. (Æ) | | 22,802 | | 1,015 |
Wabtec Corp. (Ñ) | | 13,243 | | 541 |
Waste Connections, Inc. (Æ) | | 9,246 | | 308 |
Werner Enterprises, Inc. | | 4,500 | | 89 |
Woodward Governor Co. (Ñ) | | 20,646 | | 532 |
| | | | |
| | | | 24,405 |
| | | | |
| | |
| 28 | | Aggressive Equity Fund |
Russell Investment Funds
Aggressive Equity Fund
Schedule of Investments, continued — December 31, 2009
Amounts in thousands (except share amounts)
| | | | |
| | | Principal
Amount ($)
or Shares | | Market
Value
$ |
| | | | |
| Technology - 18.1% | | | | |
Acxiom Corp. (Æ) | | 5,122 | | 69 |
Adaptec, Inc. (Æ) | | 66,564 | | 223 |
ADTRAN, Inc. | | 11,012 | | 248 |
Advanced Analogic Technologies, Inc. (Æ) | | 31,900 | | 126 |
Amkor Technology, Inc. (Æ)(Ñ) | | 21,300 | | 153 |
Amphenol Corp. Class A | | 18,212 | | 841 |
Ansys, Inc. (Æ)(Ñ) | | 13,517 | | 587 |
Ariba, Inc. (Æ)(Ñ) | | 46,132 | | 578 |
Arris Group, Inc. (Æ) | | 7,000 | | 80 |
Arrow Electronics, Inc. (Æ) | | 9,200 | | 272 |
Art Technology Group, Inc. (Æ) | | 53,408 | | 241 |
Aruba Networks, Inc. (Æ) | | 24,796 | | 264 |
Atheros Communications, Inc. (Æ) | | 11,100 | | 380 |
Avid Technology, Inc. (Æ) | | 3,900 | | 50 |
Avnet, Inc. (Æ) | | 27,800 | | 838 |
AVX Corp. | | 17,500 | | 222 |
Benchmark Electronics, Inc. (Æ) | | 17,851 | | 338 |
Black Box Corp. | | 3,000 | | 85 |
Bottomline Technologies, Inc. (Æ) | | 11,300 | | 199 |
Brooks Automation, Inc. (Æ) | | 1,700 | | 15 |
Cadence Design Systems, Inc. (Æ) | | 29,029 | | 174 |
Ciber, Inc. (Æ) | | 30,300 | | 105 |
Cirrus Logic, Inc. (Æ) | | 42,500 | | 290 |
Cogent, Inc. (Æ) | | 17,437 | | 181 |
Cognex Corp. | | 22,000 | | 390 |
Cogo Group, Inc. (Æ) | | 12,000 | | 88 |
Cohu, Inc. | | 19,550 | | 273 |
Compuware Corp. (Æ) | | 34,700 | | 251 |
Comverse Technology, Inc. (Æ) | | 32,762 | | 310 |
Concur Technologies, Inc. (Æ) | | 5,376 | | 230 |
Cree, Inc. (Æ) | | 4,127 | | 233 |
CSG Systems International, Inc. (Æ) | | 4,000 | | 76 |
CTS Corp. | | 4,700 | | 45 |
DivX, Inc. (Æ) | | 1,000 | | 6 |
DSP Group, Inc. (Æ) | | 1,700 | | 10 |
Earthlink, Inc. (Ñ) | | 53,600 | | 445 |
Electro Scientific Industries, Inc. (Æ) | | 34,578 | | 374 |
Emulex Corp. (Æ) | | 16,381 | | 179 |
Epicor Software Corp. (Æ) | | 4,900 | | 37 |
Equinix, Inc. (Æ)(Ñ) | | 5,737 | | 609 |
Extreme Networks (Æ) | | 2,400 | | 7 |
F5 Networks, Inc. (Æ) | | 6,021 | | 319 |
Flextronics International, Ltd. (Æ)(Ñ) | | 22,870 | | 167 |
Harris Stratex Networks, Inc. Class A (Æ) | | 10,800 | | 75 |
Hittite Microwave Corp. (Æ) | | 7,175 | | 292 |
Imation Corp. (Æ) | | 4,000 | | 35 |
Informatica Corp. (Æ)(Ñ) | | 13,760 | | 356 |
Infospace, Inc. (Æ) | | 3,700 | | 32 |
Ingram Micro, Inc. Class A (Æ) | | 35,600 | | 621 |
Internap Network Services Corp. (Æ) | | 4,300 | | 20 |
International Rectifier Corp. (Æ) | | 26,272 | | 581 |
Intersil Corp. Class A | | 72,876 | | 1,118 |
Jabil Circuit, Inc. | | 11,600 | | 202 |
Lam Research Corp. (Æ)(Ñ) | | 10,027 | | 393 |
Lattice Semiconductor Corp. (Æ) | | 20,000 | | 54 |
Marvell Technology Group, Ltd. (Æ) | | 16,310 | | 338 |
| | | | |
| | | Principal
Amount ($)
or Shares | | Market
Value
$ |
McAfee, Inc. (Æ) | | 7,148 | | 290 |
Mentor Graphics Corp. (Æ) | | 11,300 | | 100 |
Mercury Computer Systems, Inc. (Æ) | | 900 | | 10 |
Methode Electronics, Inc. | | 1,700 | | 15 |
Micrel, Inc. | | 46,490 | | 381 |
MICROS Systems, Inc. (Æ) | | 14,013 | | 435 |
Molex, Inc. | | 14,300 | | 308 |
Ness Technologies, Inc. (Æ) | | 4,100 | | 20 |
Netlogic Microsystems, Inc. (Æ) | | 7,467 | | 345 |
Newport Corp. (Æ) | | 2,300 | | 21 |
NICE Systems, Ltd. - ADR (Æ) | | 18,173 | | 564 |
Novell, Inc. (Æ) | | 42,200 | | 175 |
Novellus Systems, Inc. (Æ) | | 12,700 | | 296 |
Omnivision Technologies, Inc. (Æ) | | 16,200 | | 235 |
Openwave Systems, Inc. (Æ) | | 18,200 | | 42 |
Oplink Communications, Inc. (Æ) | | 15,400 | | 252 |
Perceptron, Inc. (Æ)(Å) | | 37,376 | | 120 |
Photronics, Inc. (Æ) | | 5,000 | | 22 |
Plexus Corp. (Æ) | | 2,400 | | 68 |
PMC - Sierra, Inc. (Æ) | | 25,430 | | 220 |
Powerwave Technologies, Inc. (Æ)(Ñ) | | 14,600 | | 18 |
QLogic Corp. (Æ) | | 40,702 | | 768 |
RealNetworks, Inc. (Æ) | | 12,700 | | 47 |
Red Hat, Inc. (Æ) | | 3,300 | | 102 |
RF Micro Devices, Inc. (Æ) | | 6,900 | | 33 |
Riverbed Technology, Inc. (Æ) | | 10,287 | | 236 |
Rovi Corp. (Æ)(Ñ) | | 24,780 | | 790 |
SAIC, Inc. (Æ) | | 22,817 | | 432 |
Salesforce.com, Inc. (Æ)(Ñ) | | 6,700 | | 494 |
SBA Communications Corp. Class A (Æ)(Ñ) | | 13,186 | | 450 |
Silicon Image, Inc. (Æ) | | 12,200 | | 32 |
Sina Corp./China (Æ) | | 6,609 | | 299 |
Skyworks Solutions, Inc. (Æ) | | 26,170 | | 371 |
SMART Modular Technologies WWH, Inc. (Æ) | | 4,100 | | 26 |
Smith Micro Software, Inc. (Æ) | | 20,668 | | 189 |
SolarWinds, Inc. (Æ) | | 10,389 | | 239 |
SonicWALL, Inc. (Æ) | | 18,000 | | 137 |
Sonus Networks, Inc. (Æ) | | 31,600 | | 67 |
Standard Microsystems Corp. (Æ) | | 1,000 | | 21 |
Symmetricom, Inc. (Æ) | | 3,000 | | 16 |
SYNNEX Corp. (Æ)(Ñ) | | 13,600 | | 417 |
Taleo Corp. Class A (Æ) | | 15,849 | | 373 |
Tellabs, Inc. (Æ) | | 142,220 | | 808 |
THQ, Inc. (Æ) | | 7,200 | | 36 |
Tier Technologies, Inc. Class B (Æ) | | 30,141 | | 241 |
Trident Microsystems, Inc. (Æ) | | 4,000 | | 7 |
Unisys Corp. (Æ) | | 4,100 | | 158 |
United Online, Inc. | | 66,057 | | 475 |
Varian Semiconductor Equipment Associates, Inc. (Æ) | | 10,655 | | 382 |
Veeco Instruments, Inc. (Æ) | | 586 | | 19 |
VeriFone Holdings, Inc. (Æ) | | 35,940 | | 589 |
Verint Systems, Inc. (Æ) | | 5,209 | | 100 |
Vishay Intertechnology, Inc. (Æ)(Ñ) | | 44,727 | | 373 |
Volterra Semiconductor Corp. (Æ) | | 16,500 | | 316 |
| | |
| Aggressive Equity Fund | | 29 |
Russell Investment Funds
Aggressive Equity Fund
Schedule of Investments, continued — December 31, 2009
Amounts in thousands (except share amounts)
| | | | | |
| | | Principal
Amount ($)
or Shares | | Market
Value
$ | |
| | | | | |
Web.com Group, Inc. (Æ) | | 1,700 | | 11 | |
Western Digital Corp. (Æ) | | 9,200 | | 406 | |
White Electronic Designs Corp. (Æ) | | 55,907 | | 261 | |
Zoran Corp. (Æ) | | 29,013 | | 321 | |
| | | | | |
| | | | 28,704 | |
| | | | | |
| | |
| Utilities - 3.2% | | | | | |
AGL Resources, Inc. | | 400 | | 15 | |
Allete, Inc. | | 10,500 | | 343 | |
Alliant Energy Corp. | | 5,700 | | 173 | |
Atmos Energy Corp. | | 17,800 | | 523 | |
Black Hills Corp. (Ñ) | | 7,300 | | 194 | |
Chesapeake Utilities Corp. (Ñ) | | 500 | | 16 | |
Energen Corp. | | 5,100 | | 239 | |
Hawaiian Electric Industries, Inc. | | 13,600 | | 284 | |
Integrys Energy Group, Inc. (Ñ) | | 3,700 | | 155 | |
Laclede Group, Inc. (The) | | 3,400 | | 115 | |
Millicom International Cellular SA | | 3,869 | | 285 | |
Mirant Corp. (Æ) | | 18,400 | | 281 | |
New Jersey Resources Corp. | | 5,050 | | 189 | |
Northwest Natural Gas Co. | | 2,800 | | 126 | |
NorthWestern Corp. | | 4,300 | | 112 | |
Piedmont Natural Gas Co., Inc. | | 12,800 | | 342 | |
Pinnacle West Capital Corp. | | 500 | | 18 | |
RRI Energy, Inc. (Æ) | | 4,000 | | 23 | |
Southern Union Co. | | 7,400 | | 168 | |
Southwest Gas Corp. (Ñ) | | 16,227 | | 463 | |
UGI Corp. | | 25,700 | | 622 | |
US Cellular Corp. (Æ) | | 2,300 | | 98 | |
Vectren Corp. | | 9,600 | | 237 | |
| | | | | |
| | | | 5,021 | |
| | | | | |
| | |
Total Common Stocks
(cost $129,324) | | | | 150,179 | |
| | | | | |
|
| Short-Term Investments - 5.5% | |
Russell U.S. Cash Management Fund (£) | | 8,768,960 | | 8,769 | |
| | | | | |
| | |
Total Short-Term Investments
(cost $8,769) | | | | 8,769 | |
| | | | | |
| | |
| Other Securities - 9.2% | | | | | |
State Street Securities Lending Quality Trust (×) | | 14,721,539 | | 14,646 | |
| | | | | |
| | |
Total Other Securities
(cost $14,722) | | | | 14,646 | |
| | | | | |
| | |
Total Investments - 109.4%
(identified cost $152,815) | | | | 173,594 | |
| | |
Other Assets and Liabilities,
Net - (9.4%) | | | | (14,923 | ) |
| | | | | |
| | |
| Net Assets - 100.0% | | | | 158,671 | |
| | | | | |
A portion of the portfolio has been fair valued as of period end.
See accompanying notes which are an integral part of the financial statements.
| | |
| 30 | | Aggressive Equity Fund |
Russell Investment Funds
Aggressive Equity Fund
Schedule of Investments, continued — December 31, 2009
Amounts in thousands (except contracts)
| | | | | | | | | | |
| Futures Contracts | | Number of
Contracts | | Notional
Amount | | Expiration
Date | | Unrealized
Appreciation
(Depreciation)
$ |
| | | | | | | | | | |
| | | | | | | | | | |
| Long Positions | | | | | | | | | | |
Russell 2000 Mini Index (CME) | | 142 | | USD | | 8,859 | | 03/10 | | 377 |
| | | | | | | | | | |
| | | | | |
Total Unrealized Appreciation (Depreciation) on Open Futures Contracts | | | | | | | | | | 377 |
| | | | | | | | | | |
Presentation of Portfolio Holdings — December 31, 2009
| | | | | | | | | | | | | | | |
| | | Market Value | | % of Net
Assets | |
| Portfolio Summary | | Level 1 | | Level 2 | | Level 3 | | Total | |
| | | | | | | | | | | | | | | |
| | | | | | | | | | | | | | | |
Common Stock | | | | | | | | | | | | | | | |
Consumer Discretionary | | $ | 22,885 | | $ | — | | $ | — | | $ | 22,885 | | 14.4 | |
Consumer Staples | | | 3,923 | | | — | | | — | | | 3,923 | | 2.5 | |
Energy | | | 6,781 | | | — | | | — | | | 6,781 | | 4.3 | |
Financial Services | | | 28,550 | | | — | | | — | | | 28,550 | | 18.0 | |
Health Care | | | 16,433 | | | — | | | — | | | 16,433 | | 10.3 | |
Materials and Processing | | | 13,477 | | | — | | | — | | | 13,477 | | 8.5 | |
Producer Durables | | | 24,405 | | | — | | | — | | | 24,405 | | 15.4 | |
Technology | | | 28,704 | | | — | | | — | | | 28,704 | | 18.1 | |
Utilities | | | 5,021 | | | — | | | — | | | 5,021 | | 3.2 | |
Short-Term Investments | | | — | | | 8,769 | | | — | | | 8,769 | | 5.5 | |
Other Securities | | | — | | | 14,646 | | | — | | | 14,646 | | 9.2 | |
| | | | | | | | | | | | | | | |
| | | | | |
Total Investments | | | 150,179 | | | 23,415 | | | — | | | 173,594 | | 109.4 | |
| | | | | | | | | | | | | | | |
Other Assets and Liabilities, Net | | | | | | | | | | | | | | (9.4 | ) |
| | | | | | | | | | | | | | | |
| | | | | |
| | | | | | | | | | | | | | 100.0 | |
| | | | | | | | | | | | | | | |
Other Financial Instruments | | | | | | | | | | | | | | | |
Futures Contracts | | | 377 | | | — | | | — | | | 377 | | 0.2 | |
| | | | | | | | | | | | | | | |
Total Other Financial Instruments* | | | 377 | | | — | | | — | | | 377 | | | |
| | | | | | | | | | | | | | | |
| * | Other financial instruments not reflected in the Schedule of Investments, such as futures, forwards, and swap contracts which are valued at the unrealized appreciation/depreciation on the instruments. |
For a description of the levels see note 2 in the Notes to Financial Statements.
See accompanying notes which are an integral part of the financial statements.
| | |
| Aggressive Equity Fund | | 31 |
Russell Investment Funds
Non-U.S. Fund
Portfolio Management Discussion and Analysis — December 31, 2009 (Unaudited)
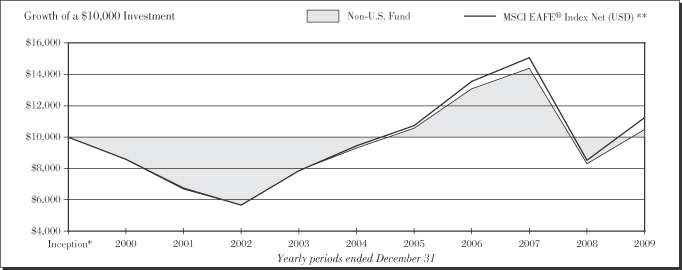
| | | |
|
| Non-U.S. Fund | |
| | | Total
Return | |
1 Year | | 27.33 | % |
5 Years | | 2.43 | %§ |
10 Years | | 0.47 | %§ |
| | | |
|
| MSCI EAFE® Index Net (USD)** | |
| | | Total
Return | |
1 Year | | 31.78 | % |
5 Years | | 3.54 | %§ |
10 Years | | 1.17 | %§ |
| * | | Assumes initial investment on January 1, 2000. |
| ** | | Morgan Stanley Capital International Europe, Australia, Far East (MSCI EAFE®) Index Net (USD) is an index composed of an arithmetic, market value-weighted average of the performance of approximately 1,600 securities listed on the stock exchange of the countries of Europe, Australia, and the Far East. The index is calculated on a total-return basis, which included reinvestment of gross dividends before deduction of withholding taxes. |
The performance shown in this section does not reflect any Insurance Company Separate Account or Policy Charges. Performance is historical and assumes reinvestment of all dividends and capital gains. Investment return and principal value will fluctuate so that an investor’s shares, when redeemed, may be worth more or less than when purchased. Past performance is not indicative of future results.
Russell Investment Funds
Non-U.S. Fund
Portfolio Management Discussion and Analysis — December 31, 2009 (Unaudited)
The Russell Investment Funds Non-U.S. Fund (the “Fund”) allocates most of its assets among multiple money managers. Russell Investment Management Company (“RIMCo”), as the Fund’s advisor, may change the allocation of the Fund’s assets among money managers at any time. An exemptive order from the Securities and Exchange Commission (SEC) permits RIMCo to engage or terminate a money manager at any time, subject to the approval by the Fund’s Board without a shareholder vote. Pursuant to the terms of the exemptive order, the Fund is required to notify its shareholders within 60 days of when a money manager begins providing services. The Fund currently has four money managers.
What is the Fund’s investment objective?
The Fund seeks to provide long-term capital growth.
How did the Fund perform relative to its benchmark for the fiscal year ended December 31, 2009?
For the fiscal year ended December 31, 2009, the Russell Investment Funds Non-U.S. Fund gained 27.33%. This compared to the MSCI EAFE® Index Net (USD), which gained 31.78% during the same period. The Fund’s performance includes operating expenses, whereas Index returns are unmanaged and do not include expenses of any kind.
In accordance with the Fund’s fair value procedures, on December 31, 2008, the day prior to the start of the fiscal year and on December 31, 2009 the last trading day of the fiscal year, a portion of the Fund’s portfolio securities were fair valued as a result of a material decrease of the U.S. securities market. The Fund’s benchmark does not fair value its constituent securities following such an event. As a result, fair valuation had a negative impact on Fund performance relative to its benchmark.
For the year ending December 31, 2009, the Lipper® International Core Funds (VIP) Average gained 30.27%. This result serves as a peer comparison and is expressed net of operating expenses.
How did the market conditions described in the Market Summary report affect the Fund’s performance?
The fiscal year ended December 31, 2009 was a very good year for global equity markets in terms of performance. However, the Fund’s money managers found the volatile market environment challenging. Investors entered the year facing considerable uncertainty and a mostly negative outlook for markets given a deep, global economic recession and ill-functioning credit markets. Opportunities to outperform or even keep pace with the market required focused exposure to a rather narrow segment of the market, including exposure to stocks trading at low price-to-book valuations, smaller capitalization stocks, the materials sector (particularly stocks in the metals & mining industry) and stocks outside the index in Canada and the emerging markets.
The sharp sell off of stocks over 2008 and well into the first quarter of 2009 was followed by a strong rebound. These large shifts in market trends impacted Fund performance negatively
as the money managers struggled to reposition portfolios in response to rapidly changing market conditions. The Fund did not participate effectively in the recovery of deep value (e.g., very low price to book valuation), low quality stocks which recovered as unprecedented government stimulus and its follow-on effects provided assistance to companies previously facing financial crises.
The Fund’s money managers were cautiously positioned entering 2009 to protect against illiquidity in the credit markets. As cyclical sectors and emerging markets recovered in March, the managers questioned the sustainability of the rebound as the underlying economic drivers appeared quite unstable. Managers were particularly concerned about earnings prospects given more subdued forward-looking growth outlook juxtaposed with investors’ high expectations of earnings from prior levels. The money managers preferred companies with strong balance sheets and adequate capital access given tight credit markets.
As the global financial and economic crises showed signs of abating in late March 2009, the Fund underperformed due to this more conservative positioning. Based on concerns for the overall health of the drivers of global economic growth, and particularly the impairment of credit markets in supporting growth, the Fund’s money managers lowered exposure to more financially and economically sensitive stocks and sectors. They put greater emphasis on stocks and sectors they believed capable of sustaining modest levels of growth with lower risk of credit problems against a backdrop of slower growth for the world’s economies. This negatively impacted Fund performance as markets rallied in response to efforts by governments globally to mitigate the financial and economic crises.
How did the investment strategies and techniques employed by the Fund and its money managers affect its performance?
The Fund’s money managers were overweighted to the health care and consumer staples sectors and underweight to the financials and materials sectors. This positioning detracted materially from performance as the materials and financials sectors led the market recovery. More positively, the money managers were overweight to technology stocks believing that they would benefit from stronger, restructured balance sheets and improving economic conditions as corporations globally increased spending on technology after deferring such expenditures for the past several years. The Fund’s technology holdings were materially additive to performance, mainly due to effective security selection. However, this was not sufficient to offset the impact of the financials and materials sector underweightings or the managers’ ineffective stock selection in the financials sector.
The Fund was ineffective in benefiting from return opportunities in what was a very narrowly led market. Smaller capitalization stocks and stocks with low price to book value ratios provided the strongest gains for the year. Exposure to
Russell Investment Funds
Non-U.S. Fund
Portfolio Management Discussion and Analysis — December 31, 2009 (Unaudited)
these stocks was critical to success in the year. For most of the year, the Fund did not have a manager that pursued a low price-to-book value strategy. Pzena Investment Management, LLC which was hired in July with an investment mandate to provide this role.
Wellington Management Company, LLP emphasis on stocks of companies priced for high growth and momentum-driven growth strategies proved ineffective in the period and detracted from performance.
Altrinsic Global Advisors, LLC quality value orientation prevented it from participating in the recovery of many cyclical and financial companies, particularly those which it perceived to have fragile balance sheets and consequently they underperformed for the year.
As the market recovered, deep value strategies emphasizing stocks trading at low price-to-book values and strategies inclined to accepting significant balance sheet risk, i.e., highly leveraged companies, outperformed. The Fund was underweight to these stocks. The Fund did benefit later in the year as higher quality growth stocks outperformed. MFS Institutional Advisors, Inc. and Marsico Capital Management, LLC performed well in this period. Marsico was added to replace Wellington in May. MFS was the best performer as it effectively identified companies capable of producing sustainable growth against the headwinds of weaker economic growth.
The strategies of the Fund’s other money managers were generally ineffective in the period. The managers were focused on either high growth or defensive value opportunities. These managers lagged in the period as the market remained skeptical of strong earnings growth and less interested in the defensive attributes of companies with higher quality balance sheets.
Changes were made to the manager line-up to better balance the Fund’s exposure to key value and growth drivers of performance.
Describe any changes to the Fund’s structure or the money manager line-up.
Three changes were made to the money manager line up during the period. Wellington was replaced by Marsico in May. At the same time, AQR Capital Management, LLC was replaced by Barrow Hanley Mewhinney and Strauss, Inc. In July, Altrinsic was replaced by Pzena Investment Management, LLC.
| | |
| |
Money Managers as of
December 31, 2009 | | Styles |
| Barrow Hanley Mewhinney & Strauss, Inc. | | Value |
| Marsico Capital Management, LLC | | Growth |
| MFS Institutional Advisors, Inc. | | Growth |
| Pzena Investment Management, LLC | | Value |
The views expressed in this report reflect those of the portfolio managers only through the end of the period covered by the report. These views do not necessarily represent the views of Russell Investment Management Company (RIMCo), or any other person in RIMCo or any other affiliated organization. These views are subject to change at any time based upon market conditions or other events, and RIMCo disclaims any responsibility to update the views contained herein. These views should not be relied on as investment advice and, because investment decisions for Russell Investment Funds (RIF) are based on numerous factors, should not be relied on as an indication of investment decisions of any RIF Fund.
Russell Investment Funds
Non-U.S. Fund
Shareholder Expense Example — December 31, 2009 (Unaudited)
Fund Expenses
The following disclosure provides important information regarding each Fund’s Expense Example, which appears on each Fund’s individual page in this Annual Report. Please refer to this information when reviewing the Expense Example for a Fund.
Example
As a shareholder of the Fund, you incur two types of costs: (1) transaction costs, and (2) ongoing costs, including management fees and other Fund expenses. The Example is intended to help you understand your ongoing costs (in dollars) of investing in the Fund and to compare these costs with the ongoing costs of investing in other mutual funds. The Example is based on an investment of $1,000 invested at the beginning of the period and held for the entire period indicated, which for this Fund is from July 1, 2009 to December 31, 2009.
Actual Expenses
The information in the table under the heading “Actual Performance” provides information about actual account values and actual expenses. You may use the information in this column, together with the amount you invested, to estimate the expenses that you paid over the period. Simply divide your account value by $1,000 (for example, an $8,600 account value divided by $1,000 = 8.6), then multiply the result by the number in the first column in the row entitled “Expenses Paid During Period” to estimate the expenses you paid on your account during this period.
Hypothetical Example for Comparison Purposes
The information in the table under the heading “Hypothetical Performance (5% return before expenses)” provides information about hypothetical account values and hypothetical expenses
based on the Fund’s actual expense ratio and an assumed rate of return of 5% per year before expenses, which is not the Fund’s actual return. The hypothetical account values and expenses may not be used to estimate the actual ending account balance or expenses you paid for the period. You may use this information to compare the ongoing costs of investing in the Fund and other funds. To do so, compare this 5% hypothetical example with the 5% hypothetical examples that appear in the shareholder reports of other funds.
Please note that the expenses shown in the table are meant to highlight your ongoing costs only and do not reflect any transactional costs. Therefore, the information under the heading “Hypothetical Performance (5% return before expenses)” is useful in comparing ongoing costs only, and will not help you determine the relative total costs of owning different funds. In addition, if these transactional costs were included, your costs would have been higher. The fee and expenses shown in this section do not reflect any Insurance Company Separate Account or Policy Charges.
| | | | | | |
| | | Actual
Performance | | Hypothetical
Performance
(5% return
before expenses) |
| | | | | | |
Beginning Account Value | | | | | | |
July 1, 2009 | | $ | 1,000.00 | | $ | 1,000.00 |
Ending Account Value | | | | | | |
December 31, 2009 | | $ | 1,206.00 | | $ | 1,020.11 |
Expenses Paid During Period* | | $ | 5.62 | | $ | 5.14 |
| * | Expenses are equal to the Fund’s annualized expense ratio of 1.01% (representing the one-half year period annualized), multiplied by the average account value over the period, multiplied by 184/365 (to reflect the one-half year period). Reflects amounts waived and/or reimbursed. Without the waiver and/or reimbursement, expenses would have been higher. |
Russell Investment Funds
Non-U.S. Fund
Schedule of Investments — December 31, 2009
Amounts in thousands (except share amounts)
| | | | |
| | | Principal
Amount ($)
or Shares | | Market
Value
$ |
| | | | |
| Common Stocks - 91.3% | | | | |
| Australia - 0.8% | | | | |
ABC Learning Centres, Ltd. (Æ) | | 5,058 | | 3 |
Billabong International, Ltd. | | 133,100 | | 1,294 |
CSL, Ltd. | | 39,504 | | 1,149 |
| | | | |
| | | | 2,446 |
| | | | |
| | |
| Austria - 0.1% | | | | |
Erste Group Bank AG | | 11,708 | | 434 |
| | | | |
| | |
| Belgium - 0.9% | | | | |
Anheuser-Busch InBev NV | | 39,485 | | 2,040 |
KBC Groep NV (Æ) | | 17,798 | | 771 |
| | | | |
| | | | 2,811 |
| | | | |
| | |
| Bermuda - 1.6% | | | | |
Esprit Holdings, Ltd. | | 114,833 | | 756 |
Jardine Matheson Holdings, Ltd. | | 67,700 | | 2,036 |
Li & Fung, Ltd. | | 150,000 | | 617 |
Noble Group, Ltd. (Ñ) | | 161,000 | | 369 |
RenaissanceRe Holdings, Ltd. | | 24,600 | | 1,307 |
| | | | |
| | | | 5,085 |
| | | | |
| | |
| Brazil - 2.7% | | | | |
Cyrela Brazil Realty SA | | 76,500 | | 1,077 |
Gafisa SA | | 58,400 | | 947 |
Itau Unibanco Holding SA - ADR (Ñ) | | 33,070 | | 755 |
JBS SA | | 75,900 | | 406 |
OGX Petroleo e Gas Participacoes SA | | 130,000 | | 1,277 |
PDG Realty SA Empreendimentose Participacoes | | 70,200 | | 700 |
Petroleo Brasileiro SA - ADR (Ñ) | | 54,597 | | 2,603 |
Vale SA Class B (Ñ) | | 37,000 | | 1,074 |
| | | | |
| | | | 8,839 |
| | | | |
| | |
| Canada - 1.2% | | | | |
Canadian National Railway Co. | | 43,437 | | 2,361 |
Gildan Activewear, Inc. Class A (Æ) | | 18,200 | | 444 |
Magna International, Inc. Class A | | 15,800 | | 799 |
Research In Motion, Ltd. (Æ) | | 5,292 | | 358 |
| | | | |
| | | | 3,962 |
| | | | |
| | |
| Cayman Islands - 0.2% | | | | |
Ctrip.com International, Ltd. - ADR (Æ) | | 9,400 | | 676 |
| | | | |
| | |
| China - 0.5% | | | | |
Baidu, Inc. - ADR (Æ) | | 1,651 | | 679 |
Longtop Financial Technologies, Ltd. - ADR (Æ) | | 12,600 | | 466 |
Tencent Holdings, Ltd. | | 21,300 | | 459 |
| | | | |
| | | | 1,604 |
| | | | |
| | |
| Czech Republic - 0.2% | | | | |
Komercni Banka AS | | 2,649 | | 565 |
| | | | |
| | | | |
| | | Principal
Amount ($)
or Shares | | Market
Value
$ |
| Denmark - 1.1% | | | | |
Danske Bank A/S (Æ) | | 26,851 | | 611 |
Novo Nordisk A/S Series B | | 23,671 | | 1,515 |
Novozymes A/S Class B (Ñ) | | 3,967 | | 411 |
Vestas Wind Systems A/S (Æ) | | 15,459 | | 946 |
| | | | |
| | | | 3,483 |
| | | | |
| | |
| Finland - 1.1% | | | | |
Fortum OYJ | | 26,700 | | 724 |
Nokia OYJ (Ñ) | | 108,760 | | 1,396 |
Pohjola Bank PLC Class A (Ñ) | | 139,625 | | 1,511 |
| | | | |
| | | | 3,631 |
| | | | |
| | |
| France - 11.8% | | | | |
Accor SA | | 7,636 | | 415 |
Air France-KLM (Æ) | | 47,506 | | 741 |
Air Liquide SA | | 12,568 | | 1,484 |
Alcatel-Lucent (Æ) | | 290,936 | | 974 |
Alstom SA (Ñ) | | 17,810 | | 1,237 |
AXA SA | | 68,148 | | 1,612 |
BNP Paribas | | 8,719 | | 688 |
Capital Gemini SA | | 29,600 | | 1,341 |
CNP Assurances | | 10,516 | | 1,018 |
Credit Agricole SA | | 52,610 | | 917 |
Danone | | 19,678 | | 1,198 |
GDF Suez | | 39,859 | | 1,729 |
Lagardere SCA | | 31,681 | | 1,278 |
Legrand SA | | 25,989 | | 725 |
LVMH Moet Hennessy Louis Vuitton SA | | 28,692 | | 3,222 |
Natixis (Æ) | | 111,558 | | 555 |
Pernod-Ricard SA | | 16,313 | | 1,400 |
Publicis Groupe SA | | 34,253 | | 1,390 |
Rallye SA | | 40,285 | | 1,403 |
Safran SA | | 37,311 | | 726 |
Sanofi-Aventis SA | | 26,282 | | 2,060 |
Schneider Electric SA | | 36,541 | | 4,233 |
SCOR SE | | 38,280 | | 956 |
Societe Generale | | 3,200 | | 222 |
Total SA (Ñ) | | 19,994 | | 1,281 |
UBISOFT Entertainment (Æ) | | 85,845 | | 1,213 |
Vivendi SA | | 134,024 | | 3,957 |
| | | | |
| | | | 37,975 |
| | | | |
| | |
| Germany - 8.3% | | | | |
BASF SE | | 39,643 | | 2,459 |
Bayer AG | | 26,664 | | 2,131 |
Beiersdorf AG | | 14,410 | | 947 |
Commerzbank AG (Æ) | | 34,308 | | 288 |
Daimler AG | | 65,482 | | 3,498 |
Deutsche Boerse AG | | 15,260 | | 1,269 |
Deutsche Telekom AG | | 87,087 | | 1,286 |
E.ON AG (Ñ) | | 53,534 | | 2,235 |
Henkel AG & Co. KGaA | | 21,812 | | 974 |
Infineon Technologies AG (Æ)(Ñ) | | 214,886 | | 1,186 |
Linde AG | | 23,210 | | 2,794 |
MAN SE | | 15,175 | | 1,182 |
Russell Investment Funds
Non-U.S. Fund
Schedule of Investments, continued — December 31, 2009
Amounts in thousands (except share amounts)
| | | | |
| | | Principal
Amount ($)
or Shares | | Market
Value
$ |
| | | | |
Merck KGaA | | 13,040 | | 1,219 |
Metro AG | | 17,266 | | 1,052 |
MTU Aero Engines Holding AG | | 38,371 | | 2,106 |
Muenchener Rueckversicherungs AG | | 4,499 | | 701 |
SAP AG | | 13,460 | | 635 |
ThyssenKrupp AG (Ñ) | | 20,943 | | 789 |
| | | | |
| | | | 26,751 |
| | | | |
| | |
| Guernsey - 0.5% | | | | |
Amdocs, Ltd. (Æ) | | 54,400 | | 1,552 |
| | | | |
| | |
| Hong Kong - 1.5% | | | | |
Chaoda Modern Agriculture Holdings, Ltd. | | 14,000 | | 15 |
Cheung Kong Holdings, Ltd. | | 112,000 | | 1,436 |
China Resources Enterprise, Ltd. (Ñ) | | 34,000 | | 123 |
CNOOC, Ltd. | | 775,000 | | 1,207 |
Hang Lung Properties, Ltd. - ADR | | 93,000 | | 363 |
Industrial & Commercial Bank of China Asia, Ltd. | | 803,000 | | 1,738 |
| | | | |
| | | | 4,882 |
| | | | |
| | |
| India - 1.2% | | | | |
ICICI Bank, Ltd. - ADR | | 37,477 | | 1,413 |
Infosys Technologies, Ltd. - ADR (Ñ) | | 23,220 | | 1,283 |
Reliance Industries, Ltd. - GDR (Þ) | | 23,450 | | 1,091 |
| | | | |
| | | | 3,787 |
| | | | |
| | |
| Indonesia - 0.0% | | | | |
Telekomunikasi Indonesia Tbk PT - ADR | | 1,750 | | 70 |
| | | | |
| | |
| Ireland - 0.4% | | | | |
Accenture PLC Class A | | 2,900 | | 121 |
Cooper Industries PLC | | 9,575 | | 408 |
Covidien PLC | | 15,700 | | 752 |
| | | | |
| | | | 1,281 |
| | | | |
| | |
| Israel - 0.3% | | | | |
Teva Pharmaceutical Industries, Ltd. - ADR | | 16,028 | | 900 |
| | | | |
| | |
| Italy - 4.3% | | | | |
Banca Popolare di Milano Scarl | | 92,535 | | 656 |
ENI SpA | | 59,007 | | 1,502 |
Fiat SpA (Æ) | | 74,694 | | 1,087 |
Finmeccanica SpA | | 176,447 | | 2,814 |
Intesa Sanpaolo SpA (Æ)(Ñ) | | 131,800 | | 591 |
Parmalat SpA | | 714,070 | | 2,001 |
Snam Rete Gas SpA | | 292,525 | | 1,455 |
Telecom Italia SpA (Ñ) | | 458,276 | | 711 |
UniCredit SpA (Æ) | | 606,641 | | 2,018 |
Unione di Banche Italiane SCPA | | 76,620 | | 1,097 |
| | | | |
| | | | 13,932 |
| | | | |
| | |
| Japan - 10.1% | | | | |
Aeon Credit Service Co., Ltd. | | 35,900 | | 345 |
Amada Co., Ltd. | | 146,700 | | 910 |
| | | | |
| | | Principal
Amount ($)
or Shares | | Market
Value
$ |
Canon, Inc. (Ñ) | | 100,900 | | 4,266 |
Daikin Industries, Ltd. | | 17,700 | | 691 |
Daiwa Securities Group, Inc. | | 142,000 | | 712 |
FamilyMart Co., Ltd. | | 22,400 | | 660 |
Fanuc, Ltd. | | 10,600 | | 986 |
Hirose Electric Co., Ltd. | | 4,100 | | 427 |
Honda Motor Co., Ltd. | | 20,700 | | 700 |
Hoya Corp. | | 62,300 | | 1,652 |
Inpex Corp. | | 197 | | 1,479 |
Kao Corp. | | 13,200 | | 308 |
Konica Minolta Holdings, Inc. | | 42,000 | | 431 |
Lawson, Inc. | | 18,700 | | 824 |
Mabuchi Motor Co., Ltd. (Ñ) | | 13,500 | | 664 |
Marubeni Corp. | | 282,000 | | 1,535 |
Mitsubishi Chemical Holdings Corp. | | 221,000 | | 931 |
Mitsubishi UFJ Financial Group, Inc. | | 442,800 | | 2,168 |
Mizuho Financial Group, Inc. (Ñ) | | 422,700 | | 756 |
Mori Seiki Co., Ltd. | | 72,600 | | 648 |
NGK Spark Plug Co., Ltd. (Ñ) | | 6,600 | | 74 |
Nintendo Co., Ltd. | | 4,800 | | 1,138 |
Nippon Telegraph & Telephone Corp. | | 25,500 | | 1,003 |
Omron Corp. | | 76,600 | | 1,366 |
Ricoh Co., Ltd. | | 26,600 | | 375 |
Shin-Etsu Chemical Co., Ltd. (Ñ) | | 19,000 | | 1,071 |
Sumco Corp. (Ñ) | | 20,600 | | 362 |
Takeda Pharmaceutical Co., Ltd. | | 42,100 | | 1,728 |
THK Co., Ltd. | | 56,600 | | 1,000 |
Tokyo Electron, Ltd. | | 18,900 | | 1,209 |
Toshiba TEC Corp. | | 304,379 | | 1,150 |
Toyota Motor Corp. | | 24,100 | | 1,013 |
| | | | |
| | | | 32,582 |
| | | | |
| | |
| Luxembourg - 0.4% | | | | |
ArcelorMittal | | 31,273 | | 1,418 |
| | | | |
| | |
| Mexico - 0.5% | | | | |
America Movil SAB de CV Series L | | 12,450 | | 585 |
Cemex SAB de CV-ADR (Æ)(Ñ) | | 92,578 | | 1,094 |
| | | | |
| | | | 1,679 |
| | | | |
| | |
| Netherlands - 5.6% | | | | |
Aegon NV (Æ) | | 141,682 | | 903 |
Akzo Nobel NV (Ñ) | | 34,606 | | 2,281 |
ASML Holding NV | | 25,663 | | 873 |
Brit Insurance Holdings NV | | 244,236 | | 775 |
European Aeronautic Defence and Space Co. NV (Ñ) | | 50,090 | | 1,001 |
Fugro NV | | 5,750 | | 328 |
Heineken NV | | 50,620 | | 2,399 |
ING Groep NV (Æ) | | 239,851 | | 2,319 |
Koninklijke Philips Electronics NV | | 76,680 | | 2,270 |
Nutreco Holding NV | | 25,848 | | 1,449 |
TNT NV | | 44,872 | | 1,373 |
Unilever NV | | 24,650 | | 803 |
Wolters Kluwer NV | | 61,490 | | 1,348 |
| | | | |
| | | | 18,122 |
| | | | |
Russell Investment Funds
Non-U.S. Fund
Schedule of Investments, continued — December 31, 2009
Amounts in thousands (except share amounts)
| | | | |
| | | Principal
Amount ($)
or Shares | | Market
Value
$ |
| | | | |
| Norway - 2.4% | | | | |
Cermaq ASA (Æ) | | 125,900 | | 1,213 |
DnB NOR ASA (Æ) | | 204,000 | | 2,215 |
Statoil ASA (Ñ) | | 120,400 | | 3,003 |
Telenor ASA (Æ) | | 97,100 | | 1,362 |
| | | | |
| | | | 7,793 |
| | | | |
| | |
| Puerto Rico - 0.1% | | | | |
Popular, Inc. | | 155,500 | | 351 |
| | | | |
| | |
| Russia - 0.5% | | | | |
Gazprom OAO - ADR | | 66,670 | | 1,662 |
| | | | |
| | |
| Singapore - 2.0% | | | | |
CapitaLand, Ltd. | | 483,000 | | 1,431 |
Jardine Cycle & Carriage, Ltd. | | 132,200 | | 2,523 |
Singapore Telecommunications, Ltd. | | 440,000 | | 969 |
United Overseas Bank, Ltd. | | 109,400 | | 1,522 |
| | | | |
| | | | 6,445 |
| | | | |
| | |
| South Africa - 0.2% | | | | |
MTN Group, Ltd. | | 32,450 | | 516 |
| | | | |
| | |
| South Korea - 0.6% | | | | |
Korea Electric Power Corp. | | 25,320 | | 739 |
Samsung Electronics Co., Ltd. | | 1,558 | | 1,064 |
| | | | |
| | | | 1,803 |
| | | | |
| | |
| Spain - 2.1% | | | | |
Banco Bilbao Vizcaya Argentaria SA | | 39,182 | | 710 |
Banco Santander SA | | 177,875 | | 2,922 |
Inditex SA | | 10,971 | | 680 |
Telefonica SA (Ñ) | | 88,499 | | 2,467 |
| | | | |
| | | | 6,779 |
| | | | |
| | |
| Sweden - 0.7% | | | | |
Skandinaviska Enskilda Banken AB Class A (Æ) | | 52,051 | | 320 |
Telefonaktiebolaget LM Ericsson Class B | | 204,946 | | 1,885 |
| | | | |
| | | | 2,205 |
| | | | |
| | |
| Switzerland - 10.0% | | | | |
ABB, Ltd. (Æ) | | 40,812 | | 781 |
ACE, Ltd. | | 6,300 | | 318 |
Actelion, Ltd. (Æ) | | 14,250 | | 761 |
Compagnie Financiere Richemont SA | | 29,059 | | 972 |
Credit Suisse Group AG (Ñ) | | 58,686 | | 2,890 |
GAM Holding, Ltd. | | 19,401 | | 236 |
Georg Fischer AG (Æ) | | 5,303 | | 1,335 |
Givaudan SA (Ñ) | | 1,986 | | 1,581 |
Helvetia Holding AG | | 4,515 | | 1,394 |
Julius Baer Group, Ltd. | | 50,592 | | 1,767 |
Lonza Group AG | | 12,054 | | 845 |
Nestle SA (Ñ) | | 99,859 | | 4,851 |
Novartis AG | | 32,553 | | 1,774 |
Roche Holding AG | | 20,652 | | 3,513 |
| | | | |
| | | Principal
Amount ($)
or Shares | | Market
Value
$ |
Sonova Holding AG | | 3,348 | | 405 |
Swiss Reinsurance Co., Ltd. | | 7,369 | | 353 |
Syngenta AG (Ñ) | | 2,573 | | 721 |
Transocean, Ltd. (Æ)(Ñ) | | 26,214 | | 2,171 |
Tyco Electronics, Ltd. | | 73,700 | | 1,809 |
UBS AG (Æ)(Ñ) | | 163,154 | | 2,506 |
Zurich Financial Services AG | | 4,953 | | 1,077 |
| | | | |
| | | | 32,060 |
| | | | |
| | |
| Taiwan - 0.7% | | | | |
Taiwan Semiconductor Manufacturing Co., Ltd. - ADR | | 188,481 | | 2,156 |
| | | | |
| | |
| United Kingdom - 15.5% | | | | |
Aegis Group PLC | | 553,302 | | 1,058 |
Anglo American PLC (Æ) | | 43,074 | | 1,864 |
Autonomy Corp. PLC (Æ)(Ñ) | | 30,862 | | 752 |
Aviva PLC | | 196,371 | | 1,244 |
BAE Systems PLC | | 129,300 | | 745 |
Barclays PLC | | 215,468 | | 950 |
BHP Billiton PLC | | 16,623 | | 531 |
BP PLC | | 226,847 | | 2,194 |
Bunzl PLC | | 62,900 | | 682 |
Burberry Group PLC | | 75,880 | | 728 |
Compass Group PLC | | 94,887 | | 678 |
Dairy Crest Group PLC | | 160,609 | | 940 |
Diageo PLC | | 105,991 | | 1,848 |
GlaxoSmithKline PLC | | 26,862 | | 569 |
Hays PLC | | 230,230 | | 384 |
Home Retail Group PLC | | 131,403 | | 599 |
HSBC Holdings PLC | | 763,953 | | 8,718 |
Imperial Tobacco Group PLC | | 70,947 | | 2,236 |
International Power PLC | | 310,787 | | 1,538 |
Ladbrokes PLC | | 115,425 | | 254 |
Lloyds Banking Group PLC (Æ)(Ñ) | | 340,512 | | 273 |
Reckitt Benckiser Group PLC | | 68,664 | | 3,720 |
Royal Dutch Shell PLC Class A | | 108,400 | | 3,276 |
Sage Group PLC (The) | | 463,767 | | 1,647 |
Smith & Nephew PLC | | 86,960 | | 893 |
Smiths Group PLC | | 51,457 | | 842 |
Spectris PLC (Ñ) | | 102,113 | | 1,203 |
Standard Chartered PLC | | 83,001 | | 2,079 |
Tesco PLC (Ñ) | | 189,372 | | 1,301 |
Travis Perkins PLC (Æ) | | 55,200 | | 753 |
Vodafone Group PLC | | 1,163,794 | | 2,695 |
William Hill PLC | | 161,497 | | 481 |
Wolseley PLC (Æ) | | 29,416 | | 588 |
WPP PLC | | 170,920 | | 1,669 |
| | | | |
| | | | 49,932 |
| | | | |
| | |
| United States - 1.2% | | | | |
Philip Morris International, Inc. (Ñ) | | 44,000 | | 2,120 |
Synthes, Inc. (Æ) | | 13,446 | | 1,761 |
| | | | |
| | | | 3,881 |
| | | | |
| | |
Total Common Stocks
(cost $271,916) | | | | 294,050 |
| | | | |
Russell Investment Funds
Non-U.S. Fund
Schedule of Investments, continued — December 31, 2009
Amounts in thousands (except share amounts)
| | | | | |
| | | Principal
Amount ($)
or Shares | | Market
Value
$ | |
| | | | | |
| Preferred Stocks - 0.3% | | | | | |
| Brazil - 0.2% | | | | | |
Usinas Siderurgicas de Minas Gerais SA | | 24,000 | | 681 | |
| | |
| Germany - 0.1% | | | | | |
Henkel AG & Co. KGaA | | 4,023 | | 209 | |
| | | | | |
| | |
Total Preferred Stocks
(cost $726) | | | | 890 | |
| | | | | |
| | |
| Warrants & Rights - 0.0% | | | | | |
| Belgium - 0.0% | | | | | |
Fortis (Æ)
2014 Rights | | 10,340 | | — | |
| | |
| Brazil - 0.0% | | | | | |
JBS SA (Æ)
2010 Rights | | 108 | | — | |
| | | | | |
| | |
Total Warrants & Rights
(cost $—) | | | | — | |
| | | | | |
| |
| Short-Term Investments - 7.9% | | | |
| United States - 7.9% | | | | | |
Russell U.S. Cash Management Fund (£) | | 25,445,450 | | 25,445 | |
| | | | | |
| | |
Total Short-Term Investments
(cost $25,445) | | | | 25,445 | |
| | | | | |
| | |
| Other Securities - 6.4% | | | | | |
State Street Securities Lending Quality Trust (×) | | 20,910,745 | | 20,804 | |
| | | | | |
| | |
Total Other Securities
(cost $20,911) | | | | 20,804 | |
| | | | | |
| | |
Total Investments - 105.9%
(identified cost $318,998) | | | | 341,189 | |
| | |
Other Assets and Liabilities,
Net - (5.9%) | | | | (19,044 | ) |
| | | | | |
| | |
| Net Assets - 100.0% | | | | 322,145 | |
| | | | | |
A portion of the portfolio has been fair valued as of period end.
See accompanying notes which are an integral part of the financial statements.
Russell Investment Funds
Non-U.S. Fund
Schedule of Investments, continued — December 31, 2009
Amounts in thousands
| | | | | | |
Industry Diversification
(Unaudited) | | % of Net
Assets | | | Market
Value
$ | |
| | | | | | |
| | | | | | |
Consumer Discretionary | | 12.3 | | | 39,687 | |
Consumer Staples | | 10.2 | | | 32,853 | |
Energy | | 7.1 | | | 22,746 | |
Financial Services | | 20.9 | | | 67,266 | |
Health Care | | 5.5 | | | 17,850 | |
Materials and Processing | | 10.1 | | | 32,541 | |
Other Energy | | 0.1 | | | 328 | |
Producer Durables | | 11.7 | | | 37,528 | |
Technology | | 7.5 | | | 24,057 | |
Utilities | | 6.2 | | | 20,084 | |
Warrants & Rights | | — | | | — | |
Short-Term Investments | | 7.9 | | | 25,445 | |
Other Securities | | 6.4 | | | 20,804 | |
| | | | | | |
| | |
Total Investments | | 105.9 | | | 341,189 | |
Other Assets and Liabilities, Net | | (5.9 | ) | | (19,044 | ) |
| | | | | | |
| | |
| Net Assets | | 100.0 | | | 322,145 | |
| | | | | | |
| | | | | | |
Geographic Diversification
(Unaudited) | | % of
Net
Assets | | | Market
Value
$ | |
| | | | | | |
Africa | | 0.2 | | | 516 | |
Asia | | 7.2 | | | 23,193 | |
Europe | | 50.0 | | | 161,111 | |
Guernsey | | 0.5 | | | 1,552 | |
Japan | | 10.1 | | | 32,582 | |
Latin America | | 5.3 | | | 16,960 | |
Middle East | | 0.3 | | | 900 | |
Other Regions | | 10.4 | | | 33,639 | |
United Kingdom | | 15.5 | | | 49,932 | |
Other Securities | | 6.4 | | | 20,804 | |
| | | | | | |
| | |
Total Investments | | 105.9 | | | 341,189 | |
Other Assets and Liabilities, Net | | (5.9 | ) | | (19,044 | ) |
| | | | | | |
| | |
| Net Assets | | 100.0 | | | 322,145 | |
| | | | | | |
See accompanying notes which are an integral part of the financial statements.
Russell Investment Funds
Non-U.S. Fund
Schedule of Investments, continued — December 31, 2009
Amounts in thousands (except contracts)
| | | | | | | | | | |
| Futures Contracts | | Number of
Contracts | | Notional
Amount | | Expiration
Date | | Unrealized
Appreciation
(Depreciation)
$ |
|
| | | | | | | | | | |
| Long Positions | | | | | | | | | | |
CAC-40 Index (France) | | 62 | | EUR | | 2,444 | | 01/10 | | 65 |
DAX Index (Germany) | | 12 | | EUR | | 1,788 | | 03/10 | | 35 |
EUR STOXX 50 Index (EMU) | | 152 | | EUR | | 4,517 | | 03/10 | | 179 |
FTSE-100 Index (UK) | | 68 | | GBP | | 3,646 | | 03/10 | | 111 |
TOPIX Index (Japan) | | 90 | | JPY | | 814,050 | | 03/10 | | 165 |
| | | | | | | | | | |
| | | | | |
Total Unrealized Appreciation (Depreciation) on Open Futures Contracts | | | | | | | | | | 555 |
| | | | | | | | | | |
| | | | | | | | | | | | | |
| Foreign Currency Exchange Contracts | |
Counterparty | | Amount
Sold | | Amount
Bought | | Settlement
Date | | Unrealized
Appreciation
(Depreciation)
$ | |
| | | | | | | | | | | | | |
Barclays Bank PLC | | USD | | 2,090 | | EUR | | 1,420 | | 03/17/10 | | (54 | ) |
Brown Brothers Harriman Co. | | USD | | 26 | | CHF | | 27 | | 01/04/10 | | — | |
Brown Brothers Harriman Co. | | USD | | 10 | | CHF | | 10 | | 01/06/10 | | — | |
Brown Brothers Harriman Co. | | USD | | 427 | | EUR | | 300 | | 03/17/10 | | 3 | |
Brown Brothers Harriman Co. | | USD | | 160 | | GBP | | 100 | | 03/17/10 | | 2 | |
Brown Brothers Harriman Co. | | USD | | 3 | | JPY | | 314 | | 01/06/10 | | — | |
Brown Brothers Harriman Co. | | EUR | | 151 | | USD | | 217 | | 01/04/10 | | — | |
Brown Brothers Harriman Co. | | EUR | | 8 | | USD | | 11 | | 01/05/10 | | — | |
Brown Brothers Harriman Co. | | EUR | | 314 | | USD | | 449 | | 01/05/10 | | — | |
Brown Brothers Harriman Co. | | JPY | | 17,812 | | USD | | 193 | | 01/06/10 | | 1 | |
Credit Suisse First Boston | | USD | | 40 | | AUD | | 45 | | 01/06/10 | | — | |
Credit Suisse First Boston | | USD | | 956 | | GBP | | 591 | | 03/17/10 | | (3 | ) |
Credit Suisse First Boston | | USD | | 1,520 | | JPY | | 133,333 | | 03/17/10 | | (87 | ) |
Deutsche Bank | | USD | | 2,087 | | EUR | | 1,420 | | 03/17/10 | | (52 | ) |
Deutsche Bank | | USD | | 956 | | GBP | | 591 | | 03/17/10 | | (2 | ) |
Deutsche Bank | | USD | | 1,520 | | JPY | | 133,333 | | 03/17/10 | | (88 | ) |
HSBC | | USD | | 2,089 | | EUR | | 1,420 | | 03/17/10 | | (54 | ) |
HSBC | | USD | | 956 | | GBP | | 591 | | 03/17/10 | | (2 | ) |
HSBC | | USD | | 1,519 | | JPY | | 133,333 | | 03/17/10 | | (86 | ) |
HSBC | | JPY | | 10,000 | | USD | | 114 | | 03/17/10 | | 6 | |
JP Morgan | | USD | | 235 | | EUR | | 164 | | 01/04/10 | | — | |
JP Morgan | | USD | | 165 | | EUR | | 115 | | 01/05/10 | | — | |
JP Morgan | | USD | | 2,090 | | EUR | | 1,420 | | 03/17/10 | | (54 | ) |
JP Morgan | | USD | | 956 | | GBP | | 591 | | 03/17/10 | | (2 | ) |
JP Morgan | | USD | | 1,519 | | JPY | | 133,333 | | 03/17/10 | | (87 | ) |
Mellon Bank | | USD | | 2,090 | | EUR | | 1,420 | | 03/17/10 | | (54 | ) |
Mellon Bank | | USD | | 956 | | GBP | | 591 | | 03/17/10 | | (2 | ) |
Mellon Bank | | USD | | 1,519 | | JPY | | 133,333 | | 03/17/10 | | (87 | ) |
Royal Bank of Scotland | | USD | | 18 | | AUD | | 21 | | 01/04/10 | | — | |
Royal Bank of Scotland | | USD | | 30 | | AUD | | 34 | | 01/05/10 | | — | |
Royal Bank of Scotland | | USD | | 30 | | JPY | | 2,764 | | 01/06/10 | | — | |
Royal Bank of Scotland | | EUR | | 100 | | USD | | 147 | | 03/17/10 | | 4 | |
Royal Bank of Scotland | | JPY | | 20,000 | | USD | | 227 | | 03/17/10 | | 12 | |
State Street Bank and Trust Company | | USD | | 14 | | EUR | | 10 | | 01/06/10 | | — | |
State Street Bank and Trust Company | | DKK | | 195 | | USD | | 38 | | 01/04/10 | | — | |
State Street Bank and Trust Company | | EUR | | 8 | | USD | | 11 | | 01/04/10 | | — | |
State Street Bank and Trust Company | | EUR | | 400 | | USD | | 574 | | 03/17/10 | | — | |
UBS | | USD | | 41 | | CHF | | 42 | | 01/04/10 | | — | |
UBS | | USD | | 9 | | DKK | | 48 | | 01/05/10 | | — | |
See accompanying notes which are an integral part of the financial statements.
Russell Investment Funds
Non-U.S. Fund
Schedule of Investments, continued — December 31, 2009
Amounts in thousands
| | | | | | | | | | | | | |
| Foreign Currency Exchange Contracts | |
Counterparty | | Amount
Sold | | Amount
Bought | | Settlement
Date | | Unrealized
Appreciation
(Depreciation)
$ | |
| | | | | | | | | | | | | |
UBS | | USD | | 151 | | EUR | | 105 | | 01/04/10 | | — | |
UBS | | USD | | 36 | | EUR | | 25 | | 01/05/10 | | — | |
UBS | | USD | | 32 | | GBP | | 20 | | 01/04/10 | | — | |
Westpac Banking Corporation | | USD | | 2,088 | | EUR | | 1,420 | | 03/17/10 | | (53 | ) |
Westpac Banking Corporation | | USD | | 957 | | GBP | | 591 | | 03/17/10 | | (3 | ) |
Westpac Banking Corporation | | USD | | 1,519 | | JPY | | 133,333 | | 03/17/10 | | (87 | ) |
| | | | | | | | | | | | | |
| |
Total Unrealized Appreciation (Depreciation) on Open Foreign Currency Contracts | | (829 | ) |
| | | | | | | | | | | | | |
See accompanying notes which are an integral part of the financial statements.
Russell Investment Funds
Non-U.S. Fund
Presentation of Portfolio Holdings — December 31, 2009
Amounts in thousands
| | | | | | | | | | | | | | | | | |
| | | Market Value | | | % of Net
Assets | |
| Portfolio Summary | | Level 1 | | Level 2 | | | Level 3 | | Total | | |
| | | | | | | | | | | | | | | | | |
Common Stocks | | | | | | | | | | | | | | | | | |
Australia | | $ | — | | $ | 2,443 | | | $ | 3 | | $ | 2,446 | | | 0.8 | |
Austria | | | — | | | 434 | | | | — | | | 434 | | | 0.1 | |
Belgium | | | — | | | 2,811 | | | | — | | | 2,811 | | | 0.9 | |
Bermuda | | | 1,307 | | | 3,778 | | | | — | | | 5,085 | | | 1.6 | |
Brazil | | | 8,839 | | | — | | | | — | | | 8,839 | | | 2.7 | |
Canada | | | 3,962 | | | — | | | | — | | | 3,962 | | | 1.2 | |
Cayman Islands | | | 676 | | | — | | | | — | | | 676 | | | 0.2 | |
China | | | 1,145 | | | 459 | | | | — | | | 1,604 | | | 0.5 | |
Czech Republic | | | — | | | 565 | | | | — | | | 565 | | | 0.2 | |
Denmark | | | — | | | 3,483 | | | | — | | | 3,483 | | | 1.1 | |
Finland | | | — | | | 3,631 | | | | — | | | 3,631 | | | 1.1 | |
France | | | — | | | 37,975 | | | | — | | | 37,975 | | | 11.8 | |
Germany | | | — | | | 26,751 | | | | — | | | 26,751 | | | 8.3 | |
Guernsey | | | 1,552 | | | — | | | | — | | | 1,552 | | | 0.5 | |
Hong Kong | | | — | | | 4,882 | | | | — | | | 4,882 | | | 1.5 | |
India | | | 3,787 | | | — | | | | — | | | 3,787 | | | 1.2 | |
Indonesia | | | 70 | | | — | | | | — | | | 70 | | | — | * |
Ireland | | | 1,281 | | | — | | | | — | | | 1,281 | | | 0.4 | |
Israel | | | 900 | | | — | | | | — | | | 900 | | | 0.3 | |
Italy | | | — | | | 13,932 | | | | — | | | 13,932 | | | 4.3 | |
Japan | | | — | | | 32,582 | | | | — | | | 32,582 | | | 10.1 | |
Luxembourg | | | — | | | 1,418 | | | | — | | | 1,418 | | | 0.4 | |
Mexico | | | 1,679 | | | — | | | | — | | | 1,679 | | | 0.5 | |
Netherlands | | | — | | | 18,122 | | | | — | | | 18,122 | | | 5.6 | |
Norway | | | — | | | 7,793 | | | | — | | | 7,793 | | | 2.4 | |
Puerto Rico | | | 351 | | | — | | | | — | | | 351 | | | 0.1 | |
Russia | | | — | | | 1,662 | | | | — | | | 1,662 | | | 0.5 | |
Singapore | | | — | | | 6,445 | | | | — | | | 6,445 | | | 2.0 | |
South Africa | | | — | | | 516 | | | | — | | | 516 | | | 0.2 | |
South Korea | | | — | | | 1,803 | | | | — | | | 1,803 | | | 0.6 | |
Spain | | | — | | | 6,779 | | | | — | | | 6,779 | | | 2.1 | |
Sweden | | | — | | | 2,205 | | | | — | | | 2,205 | | | 0.7 | |
Switzerland | | | 4,298 | | | 27,762 | | | | — | | | 32,060 | | | 10.0 | |
Taiwan | | | 2,156 | | | — | | | | — | | | 2,156 | | | 0.7 | |
United Kingdom | | | 3,276 | | | 46,656 | | | | — | | | 49,932 | | | 15.5 | |
United States | | | 2,120 | | | 1,761 | | | | — | | | 3,881 | | | 1.2 | |
Preferred Stocks | | | 681 | | | 209 | | | | — | | | 890 | | | 0.3 | |
Warrants & Rights | | | — | | | — | | | | — | | | — | | | — | * |
Short-Term Investments | | | — | | | 25,445 | | | | — | | | 25,445 | | | 7.9 | |
Other Securities | | | — | | | 20,804 | | | | — | | | 20,804 | | | 6.4 | |
| | | | | | | | | | | | | | | | | |
Total Investments | | | 38,080 | | | 303,106 | | | | 3 | | | 341,189 | | | 105.9 | |
| | | | | | | | | | | | | | | | | |
Other Assets and Liabilities, Net | | | | | | | | | | | | | | | | (5.9 | ) |
| | | | | | | | | | | | | | | | | |
| | | | | | | | | | | | | | | | 100.0 | |
| | | | | | | | | | | | | | | | | |
Other Financial Instruments | | | | | | | | | | | | | | | | | |
Futures Contracts | | | 555 | | | — | | | | — | | | 555 | | | 0.2 | |
Foreign Currency Exchange Contracts | | | 2 | | | (831 | ) | | | — | | | (829 | ) | | (0.3 | ) |
| | | | | | | | | | | | | | | | | |
Total Other Financial Instruments** | | | 557 | | | (831 | ) | | | — | | | (274 | ) | | | |
| | | | | | | | | | | | | | | | | |
| * | | Less than .05% of net assets. |
| ** | | Other financial instruments not reflected in the Schedule of Investments, such as futures, forwards, and swap contracts which are valued at the unrealized appreciation/depreciation on the instruments. |
For a description of the levels see note 2 in the Notes to Financial Statements.
Investments in which significant unobservable inputs (Level 3) used in determining a value for the period ended December 31, 2009 were less than 1% of net assets.
See accompanying notes which are an integral part of the financial statements.
Russell Investment Funds
Core Bond Fund
Portfolio Management Discussion — December 31, 2009 (Unaudited)
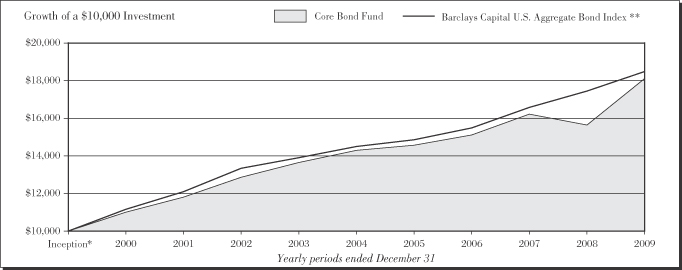
| | | |
|
| Core Bond Fund | |
| | | Total
Return | |
1 Year | | 16.18 | % |
5 Years | | 4.85 | %§ |
10 Years | | 6.11 | %§ |
| | | |
|
| Barclays Capital U.S. Aggregate Bond Index** | |
| | | Total
Return | |
1 Year | | 5.93 | % |
5 Years | | 4.97 | %§ |
10 Years | | 6.33 | %§ |
| * | | Assumes initial investment on January 1, 2000. |
| ** | | The Barclays Capital U.S. Aggregate Bond Index is an index, with income reinvested, generally representative of intermediate-term government bonds, investment-grade corporate debt securities and mortgage-backed securities. |
The performance shown in this section does not reflect any Insurance Company Separate Account or Policy Charges. Performance is historical and assumes reinvestment of all dividends and capital gains. Investment return and principal value will fluctuate so that an investor’s shares, when redeemed, may be worth more or less than when purchased. Past performance is not indicative of future results.
Russell Investment Funds
Core Bond Fund
Portfolio Management Discussion — December 31, 2009 (Unaudited)
The Core Bond Fund (the “Fund”) allocates most of its assets among multiple money managers. Russell Investment Management Company (“RIMCo”), as the Fund’s advisor, may change the allocation of the Fund’s assets among money managers at any time. An exemptive order from the Securities and Exchange Commission (SEC) permits RIMCo to engage or terminate a money manager at any time, subject to the approval by the Fund’s Board without a shareholder vote. Pursuant to the terms of the exemptive order, the Fund is required to notify its shareholders within 60 days of when a money manager begins providing services. The Fund currently has three money managers.
What is the Fund’s investment objective?
The Fund seeks to provide current income, and as a secondary objective, capital appreciation.
How did the Fund perform relative to its benchmark for the fiscal year ended December 31, 2009?
For the fiscal year ended December 31, 2009, the Core Bond Fund gained 16.18%. This compared to its benchmark the Barclays Capital U.S. Aggregate Bond Index, which gained 5.93% during the same period. The Fund’s performance includes operating expenses, whereas Index returns are unmanaged and do not include expenses of any kind.
For the year ended December 31, 2009, the Lipper® BBB Rated Corp Debt Funds (VIP) Average gained 13.33%. This result serves as a peer comparison and is expressed net of operating expenses.
How did the market conditions described in the Market Summary report affect the Fund’s performance?
As investors returned to investments with more risk than the relative safety of U.S. Treasuries, virtually all major benchmark sectors outperformed relatively less risky equivalent-duration U.S. Treasuries. The Fund’s money managers are typically underweight in the Treasury sector and invest in sectors that are not in the benchmark (e.g. high yield bonds). As a result, the Fund outperformed its benchmark.
As a result of the significant U.S. government intervention that carried over from 2008 and new interventions announced throughout 2009, certain types of fixed income securities were in higher demand and subsequently provided higher returns relative to other types of fixed income securities. This disparity in relative returns provided opportunities for money managers to generate excess returns relative to the benchmark through sector allocation decisions and security selection. For example, as a result of the Term Asset-Backed Securities Lending Facility (TALF), certain automobile and credit card asset-backed securities were in higher demand and thus generated a relatively higher rate of return. Later, when the TALF program was expanded to include commercial mortgage-backed securities, demand and returns increased for those securities as well. The implementation of the Public-Private Investment Program (PPIP), that was announced in March 2009, helped stimulate demand for non-agency mortgage and commercial mortgage-backed securities thus increasing their market price.
Therefore, money managers who were able to identify and purchase securities which would benefit from such increased demand, outperformed relative to the benchmark contributing to the excess returns for the Fund.
Interest rates started to increase throughout 2009. The Fund’s money managers have different outlooks on interest rates. As a result, some managers will increase sensitivity to interest rates (also called increased duration) if they believe interest rates will fall. On the other hand, some managers will decrease duration expecting that interest rates will rise. In general, as interest rates decline, bond prices increase and vice versa. While the duration strategies of each manager can sometimes offset each other, the Fund’s level of interest rate sensitivity was generally higher than the benchmark (also called long duration) for the first three quarters of the year and generally lower than the benchmark (also called short duration) during the last quarter of the year. The Fund benefited from its short duration positioning when interest rates increased during the last quarter of the year. However, its long duration positioning for the earlier periods detracted from performance as interests rates increased during that time. Therefore, the Fund’s duration positioning for the year detracted from performance.
As the Federal Reserve Board lowered the federal funds target rate and maintained it at 0 to 0.25%, short-term yields stayed low while yields at the intermediate portion and long end of the yield curve increased throughout 2009. Consequently, a relative shift in yields, otherwise known as yield curve “steepening,” occurred. This yield curve steepening benefited the Fund as several of the Fund’s money managers anticipated the change and varied the maturity of their holdings accordingly.
How did the investment strategies and techniques employed by the Fund and its money managers affect its performance?
The Fund’s money managers tend to invest in non-Treasury sectors and in types of securities that are not in the benchmark (e.g. high yield credit, non-agency mortgage backed securities and emerging market debt). As a result of this strategy, when risk appetite returned to the market during 2009, the Fund’s underweight to U.S. Treasuries and overweight to non-Treasury securities resulted in the Fund generating returns in excess of the benchmark. While sector positions varied throughout the fiscal year, allocations to some of the best performing sectors of the fixed income markets were beneficial to Fund performance. Overweight exposure to investment grade financials, commercial mortgage-backed securities and the rotation from overweight to underweight agency mortgages over the course of the year contributed positively to performance. Exposure to non-agency mortgage-backed securities was a net contributor to performance after strong performance in the last quarter of the year.
The Fund’s money managers rotate in and out of various sectors in order to place more emphasis on sectors or securities that they believe could provide the highest relative value versus
Russell Investment Funds
Core Bond Fund
Portfolio Management Discussion — December 31, 2009 (Unaudited)
other areas of the market. For example, Pacific Investment Management Company LLC (“PIMCO”) put significant emphasis on agency mortgage-backed securities in an attempt to benefit from the Federal Reserve’s Agency Mortgage-Backed Securities Purchase Program. After price appreciation peaked for these securities, PIMCO rotated out of this sector in order to lock in the gains and put emphasis on other areas of the market that it believed were more attractive. Metropolitan West Asset Management, LLC (“MetWest”) maintained an emphasis to commercial mortgage-backed securities throughout the year and benefited from the increased demand for these securities as a result of the government intervention programs. Similarly, Goldman Sachs Asset Management, L.P. (“Goldman”) maintained an emphasis to non-agency mortgages throughout the year and experienced strong performance when demand for these securities increased. Although different money managers place emphasis on different areas of the market at different times, the Fund’s performance over the year generally benefitted from sector rotation by the money managers.
Describe any changes to the Fund’s structure or the money manager line-up.
There were no changes to the Fund’s money manager line-up during the year. Manager weights were adjusted throughout the structure.
| | |
| |
Money Managers as of
December 31, 2009 | | Styles |
| Goldman Sachs Asset Management, L.P. | | Fully Discretionary |
| Metropolitan West Asset Management, LLC | | Sector Rotation |
| Pacific Investment Management Company LLC | | Fully Discretionary |
The views expressed in this report reflect those of the portfolio managers only through the end of the period covered by the report. These views do not necessarily represent the views of RIMCo, or any other person in RIMCo or any other affiliated organization. These views are subject to change at any time based upon market conditions or other events, and RIMCo disclaims any responsibility to update the views contained herein. These views should not be relied on as investment advice and, because investment decisions for Russell Investment Funds (RIF) are based on numerous factors, should not be relied on as an indication of investment decisions of any RIF Fund.
Russell Investment Funds
Core Bond Fund
Shareholder Expense Example — December 31, 2009 (Unaudited)
Fund Expenses
The following disclosure provides important information regarding each Fund’s Expense Example, which appears on each Fund’s individual page in this Annual Report. Please refer to this information when reviewing the Expense Example for a Fund.
Example
As a shareholder of the Fund, you incur two types of costs: (1) transaction costs, and (2) ongoing costs, including management fees and other Fund expenses. The Example is intended to help you understand your ongoing costs (in dollars) of investing in the Fund and to compare these costs with the ongoing costs of investing in other mutual funds. The Example is based on an investment of $1,000 invested at the beginning of the period and held for the entire period indicated, which for this Fund is from July 1, 2009 to December 31, 2009.
Actual Expenses
The information in the table under the heading “Actual Performance” provides information about actual account values and actual expenses. You may use the information in this column, together with the amount you invested, to estimate the expenses that you paid over the period. Simply divide your account value by $1,000 (for example, an $8,600 account value divided by $1,000 = 8.6), then multiply the result by the number in the first column in the row entitled “Expenses Paid During Period” to estimate the expenses you paid on your account during this period.
Hypothetical Example for Comparison Purposes
The information in the table under the heading “Hypothetical Performance (5% return before expenses)” provides information about hypothetical account values and hypothetical expenses based on the Fund’s actual expense ratio and an assumed rate
of return of 5% per year before expenses, which is not the Fund’s actual return. The hypothetical account values and expenses may not be used to estimate the actual ending account balance or expenses you paid for the period. You may use this information to compare the ongoing costs of investing in the Fund and other funds. To do so, compare this 5% hypothetical example with the 5% hypothetical examples that appear in the shareholder reports of other funds.
Please note that the expenses shown in the table are meant to highlight your ongoing costs only and do not reflect any transactional costs. Therefore, the information under the heading “Hypothetical Performance (5% return before expenses)” is useful in comparing ongoing costs only, and will not help you determine the relative total costs of owning different funds. In addition, if these transactional costs were included, your costs would have been higher. The fee and expenses shown in this section do not reflect any Insurance Company Separate Account or Policy Charges.
| | | | | | |
| | | Actual
Performance | | Hypothetical
Performance
(5% return
before expenses) |
| | | | | | |
Beginning Account Value | | | | | | |
July 1, 2009 | | $ | 1,000.00 | | $ | 1,000.00 |
Ending Account Value | | | | | | |
December 31, 2009 | | $ | 1,092.90 | | $ | 1,021.93 |
Expenses Paid During Period* | | $ | 3.43 | | $ | 3.31 |
| * | Expenses are equal to the Fund’s annualized expense ratio of 0.65% (representing the one-half year period annualized), multiplied by the average account value over the period, multiplied by 184/365 (to reflect the one-half year period). Reflects amounts waived and/or reimbursed. Without the waiver and/or reimbursement, expenses would have been higher. |
Russell Investment Funds
Core Bond Fund
Schedule of Investments — December 31, 2009
Amounts in thousands (except share amounts)
| | | | |
| | | Principal
Amount ($)
or Shares | | Market
Value
$ |
| | | | |
| Long-Term Investments - 84.7% |
| Asset-Backed Securities - 5.5% |
Access Group, Inc. (Ê)
Series 2008-1 Class A
1.582% due 10/27/25 | | 854 | | 876 |
Accredited Mortgage Loan Trust (Ê)
Series 2004-2 Class A2
0.531% due 07/25/34 | | 31 | | 15 |
ACE Securities Corp. (Ê)
Series 2003-OP1 Class M2
1.731% due 12/25/33 | | 22 | | 17 |
Series 2005-SD3 Class A
0.631% due 08/25/45 | | 123 | | 102 |
Aegis Asset Backed Securities Trust (Ê)
Series 2003-3 Class M2
2.706% due 01/25/34 | | 104 | | 50 |
Ally Auto Receivables Trust (Þ)
Series 2009-A Class A2
1.320% due 03/15/12 | | 200 | | 200 |
Ameriquest Mortgage Securities, Inc. (Ê)
Series 2002-D Class M1
3.981% due 02/25/33 | | 90 | | 30 |
Series 2004-R10 Class A5
0.621% due 11/25/34 | | — | | — |
ARES CLO Funds (Ê)(Å)
Series 2005-10A Class A3
0.494% due 09/18/17 | | 730 | | 658 |
Armstrong Loan Funding, Ltd. (Ê)(Å)
Series 2008-1A Class A
0.831% due 08/01/16 | | 685 | | 654 |
Bank of America Credit Card Trust (Ê)
Series 2008-A1 Class A1
0.813% due 04/15/13 | | 200 | | 200 |
Bayview Financial Acquisition Trust
Series 2006-A Class 1A3
5.865% due 02/28/41 | | 190 | | 121 |
Centex Home Equity (Ê)
Series 2006-A Class AV4
0.481% due 06/25/36 | | 700 | | 340 |
CIT Mortgage Loan Trust (Ê)(Å)
Series 2007-1 Class 2A1
1.236% due 10/25/37 | | 187 | | 167 |
Series 2007-1 Class 2A2
2.645% due 10/25/37 | | 130 | | 59 |
Series 2007-1 Class 2A3
1.921% due 10/25/37 | | 180 | | 67 |
Citigroup Mortgage Loan Trust, Inc. (Ê)
Series 2003-HE4 Class A (Å)
0.641% due 12/25/33 | | 687 | | 582 |
Series 2006-WFH Class A2
0.331% due 10/25/36 | | 350 | | 333 |
Series 2007-AMC Class A2A
0.291% due 05/25/37 | | 283 | | 249 |
Series 2007-WFH Class A3
0.381% due 01/25/37 | | 1,045 | | 605 |
Series 2007-WFH Class A4
0.431% due 01/25/37 | | 840 | | 312 |
| | | | |
| | | Principal
Amount ($)
or Shares | | Market
Value
$ |
Conseco Financial Corp.
Series 1999-2 Class A5
6.680% due 12/01/30 | | 1,089 | | 1,068 |
Continental Airlines, Inc.
Series 991A
6.545% due 08/02/20 | | 239 | | 235 |
Countrywide Asset-Backed Certificates
Series 2004-AB2 Class M3 (Ê)
0.831% due 05/25/36 | | 95 | | 12 |
Series 2004-BC1 Class M1 (Ê)
0.731% due 02/25/34 | | 91 | | 76 |
Series 2006-11 Class 1AF4
6.300% due 09/25/46 | | 169 | | 63 |
Countrywide Home Equity Loan Trust (Ê)
Series 2006-HW Class 2A1B
0.383% due 11/15/36 | | 421 | | 255 |
Ellington Loan Acquisition Trust (Ê)(Å)
Series 2007-2 Class A2A
1.131% due 05/25/37 | | 579 | | 502 |
First Franklin Mortgage Loan Asset Backed Certificates (Ê)
Series 2006-FF1 Class A3
0.281% due 11/25/36 | | 52 | | 51 |
Series 2007-FF1 Class A2B
0.321% due 01/25/38 | | 1,000 | | 490 |
GMAC Mortgage Corp. Loan Trust
Series 2007-HE3 Class 1A1
7.000% due 09/25/37 | | 58 | | 30 |
Series 2007-HE3 Class 2A1
7.000% due 09/25/37 | | 67 | | 30 |
GSAA Trust (Ê)
Series 2006-2 Class 2A3
0.501% due 12/25/35 | | 320 | | 222 |
Series 2006-4 Class 1A2
5.887% due 03/25/36 | | 198 | | 25 |
Series 2006-4 Class 3A1
6.097% due 03/25/36 | | 1,365 | | 813 |
GSAMP Trust (Ê)
Series 2003-HE2 Class M1
1.206% due 08/25/33 | | 61 | | 37 |
HFC Home Equity Loan Asset Backed Certificates (Ê)
Series 2005-1 Class A
0.523% due 01/20/34 | | 182 | | 154 |
Series 2006-4 Class A3V
0.383% due 03/20/36 | | 800 | | 713 |
Series 2007-1 Class AS
0.433% due 03/20/36 | | 697 | | 599 |
Series 2007-3 Class APT
1.433% due 11/20/36 | | 307 | | 261 |
HSI Asset Securitization Corp. Trust (Ê)
Series 2006-HE2 Class 2A1
0.281% due 12/25/36 | | 17 | | 13 |
Indymac Residential Asset Backed Trust (Ê)
Series 2006-H2 Class A
0.381% due 06/28/36 | | 252 | | 106 |
Russell Investment Funds
Core Bond Fund
Schedule of Investments, continued — December 31, 2009
Amounts in thousands (except share amounts)
| | | | |
| | | Principal
Amount ($)
or Shares | | Market
Value
$ |
| | | | |
IXIS Real Estate Capital Trust (Ê)
Series 2005-HE1 Class M2
0.966% due 06/25/35 | | 629 | | 578 |
JP Morgan Mortgage Acquisition Corp. (Ê)
Series 2007-CH4 Class A4
0.391% due 05/25/37 | | 1,000 | | 384 |
Lehman XS Trust (Ê)
Series 2005-1 Class 2A2
1.731% due 07/25/35 | | 59 | | 36 |
Series 2005-5N Class 3A1A
0.531% due 11/25/35 | | 372 | | 212 |
Series 2005-7N Class 1A1A
0.501% due 12/25/35 | | 401 | | 246 |
Series 2006-2N Class 1A2
0.571% due 02/25/46 | | 182 | | 38 |
Series 2006-16N Class A1A
0.311% due 11/25/46 | | 45 | | 44 |
Series 2006-16N Class A4A
0.421% due 11/25/46 | | 655 | | 314 |
Long Beach Mortgage Loan Trust (Ê)
Series 2004-4 Class 1A1
0.511% due 10/25/34 | | 5 | | 4 |
Master Asset Backed Securities Trust (Ê)
Series 2003-WMC Class M2
2.706% due 08/25/33 | | 57 | | 28 |
Series 2005-WMC Class M1
0.651% due 03/25/35 | | 624 | | 602 |
Morgan Stanley ABS Capital I (Ê)
Series 2003-NC8 Class M3
3.381% due 09/25/33 | | 28 | | 7 |
Series 2006-HE1 Class A4
0.521% due 01/25/36 | | 1,950 | | 733 |
Series 2006-HE7 Class A2A
0.281% due 09/25/36 | | 46 | | 45 |
Series 2007-HE2 Class A2B
0.321% due 01/25/37 | | 1,043 | | 422 |
New Century Home Equity Loan Trust (Ê)
Series 2004-4 Class M2
0.761% due 02/25/35 | | 215 | | 140 |
Option One Mortgage Loan Trust (Ê)
Series 2003-2 Class M2
2.781% due 04/25/33 | | 36 | | 9 |
Series 2003-3 Class M3
3.231% due 06/25/33 | | 27 | | 5 |
Series 2003-4 Class M2
2.706% due 07/25/33 | | 24 | | 6 |
Park Place Securities, Inc. (Ê)
Series 2005-WCW Class M1
0.681% due 09/25/35 | | 210 | | 103 |
Popular ABS Mortgage Pass-Through Trust
Series 2005-6 Class A3
5.680% due 01/25/36 | | 160 | | 148 |
Renaissance Home Equity Loan Trust
Series 2005-1 Class M1
5.357% due 05/25/35 | | 61 | | 22 |
Series 2005-2 Class AF4
4.934% due 08/25/35 | | 85 | | 68 |
| | | | |
| | | Principal
Amount ($)
or Shares | | Market
Value
$ |
Series 2006-1 Class AF6
5.746% due 05/25/36 | | 170 | | 129 |
Residential Asset Mortgage Products, Inc.
Series 2003-RS1 Class AI6A
5.980% due 12/25/33 | | 130 | | 107 |
Series 2003-RS9 Class AI6A
6.110% due 10/25/33 | | 422 | | 325 |
Residential Asset Securities Corp.
Series 2003-KS2 Class MI1
4.800% due 04/25/33 | | 134 | | 51 |
Series 2003-KS2 Class MI3
6.100% due 04/25/33 | | 54 | | 7 |
Series 2003-KS4 Class AIIB (Ê)
0.811% due 06/25/33 | | 36 | | 18 |
Series 2007-KS2 Class AI1 (Ê)
0.301% due 02/25/37 | | 101 | | 96 |
SBI Heloc Trust (Ê)(Þ)
Series 2006-1A Class 1A2A
0.401% due 08/25/36 | | 24 | | 22 |
SG Mortgage Securities Trust (Ê)
Series 2006-OPT Class A3C
0.381% due 10/25/36 | | 1,500 | | 596 |
SLM Student Loan Trust (Ê)
Series 2007-3 Class A1
0.272% due 10/27/14 | | 139 | | 139 |
Series 2008-2 Class A1
0.582% due 01/25/15 | | 65 | | 65 |
Series 2008-7 Class A2
0.782% due 10/25/17 | | 2,800 | | 2,787 |
Small Business Administration
Participation Certificates
Series 2005-20G Class 1
4.750% due 07/01/25 | | 712 | | 744 |
Soundview Home Equity Loan Trust (Ê)
Series 2005-OPT Class A4
0.531% due 11/25/35 | | 727 | | 605 |
Structured Asset Securities Corp. (Ê)
Series 2006-BC3 Class A2
0.281% due 10/25/36 | | 39 | | 37 |
Series 2007-BC3 Class 2A2
0.371% due 05/25/47 | | 1,220 | | 658 |
| | | | |
| | | | 21,972 |
| | | | |
|
| Corporate Bonds and Notes - 21.7% |
Ace Capital Trust II
9.700% due 04/01/30 | | 175 | | 197 |
AES Corp. (The)(Å)
8.750% due 05/15/13 | | 635 | | 651 |
Agilent Technologies, Inc.
5.500% due 09/14/15 | | 300 | | 314 |
Allied Waste North America, Inc. (Ñ)
Series B
7.125% due 05/15/16 | | 90 | | 96 |
Allstate Life Global Funding Trusts
5.375% due 04/30/13 | | 200 | | 213 |
American Airlines Pass Through Trust 2009-1A (Ñ)
10.375% due 07/02/19 | | 500 | | 552 |
Russell Investment Funds
Core Bond Fund
Schedule of Investments, continued — December 31, 2009
Amounts in thousands (except share amounts)
| | | | |
| | | Principal
Amount ($)
or Shares | | Market
Value
$ |
| | | | |
American Express Bank FSB
Series BKNT
5.500% due 04/16/13 | | 300 | | 320 |
6.000% due 09/13/17 | | 400 | | 415 |
American Express Centurion Bank
Series BKN1
6.000% due 09/13/17 | | 400 | | 415 |
American Express Co.
7.000% due 03/19/18 | | 200 | | 220 |
American Express Travel Related
Services Co., Inc. (Ê)
0.435% due 06/01/11 | | 100 | | 98 |
American General Finance Corp.
6.900% due 12/15/17 | | 400 | | 278 |
American International Group, Inc.
5.850% due 01/16/18 | | 900 | | 738 |
Americo Life, Inc. (Å)
7.875% due 05/01/13 | | 75 | | 66 |
Amgen, Inc.(Ñ)
6.900% due 06/01/38 | | 1,000 | | 1,163 |
Anglo American Capital PLC (Ñ)(Å)
9.375% due 04/08/14 | | 100 | | 120 |
Anheuser-Busch InBev Worldwide, Inc. (Þ)
7.200% due 01/15/14 | | 125 | | 142 |
4.125% due 01/15/15 | | 325 | | 330 |
7.750% due 01/15/19 | | 350 | | 410 |
ANZ Capital Trust (ƒ)(Þ)
4.484% due 12/31/49 | | 225 | | 225 |
Appalachian Power Co.
Series O
5.650% due 08/15/12 | | 65 | | 70 |
Arizona Public Service Co.
5.800% due 06/30/14 | | 100 | | 107 |
6.250% due 08/01/16 | | 150 | | 159 |
AT&T, Inc.
4.950% due 01/15/13 | | 200 | | 213 |
5.500% due 02/01/18 (Ñ) | | 200 | | 209 |
6.300% due 01/15/38 | | 900 | | 914 |
6.400% due 05/15/38 | | 175 | | 180 |
BAC Capital Trust XV (Ê)
1.056% due 06/01/56 | | 375 | | 240 |
Bank of America Corp.
5.625% due 10/14/16 (Ñ) | | 115 | | 117 |
6.000% due 09/01/17 | | 335 | | 348 |
5.750% due 12/01/17 | | 290 | | 297 |
7.625% due 06/01/19 (Ñ) | | 375 | | 434 |
Bank of America NA (Ê)
Series BKNT
0.534% due 06/15/16 | | 200 | | 178 |
BankAmerica Capital III (Ê)
Series*
0.854% due 01/15/27 | | 350 | | 243 |
Bear Stearns Cos. LLC (The)
6.950% due 08/10/12 | | 600 | | 670 |
7.250% due 02/01/18 | | 645 | | 740 |
BellSouth Telecommunications, Inc.
7.000% due 12/01/95 | | 245 | | 240 |
| | | | |
| | | Principal
Amount ($)
or Shares | | Market
Value
$ |
BNP Paribas Capital Trust (ƒ)(Å)
9.003% due 12/29/49 | | 450 | | 441 |
Boardwalk Pipelines, LP
5.875% due 11/15/16 | | 225 | | 230 |
Boston Scientific Corp.
4.500% due 01/15/15 | | 125 | | 125 |
6.000% due 01/15/20 | | 100 | | 102 |
7.000% due 11/15/35 | | 63 | | 62 |
Burlington Northern Santa Fe Corp.
6.875% due 12/01/27 | | 25 | | 27 |
6.750% due 03/15/29 | | 10 | | 11 |
Capital One Financial Corp.
7.375% due 05/23/14 | | 448 | | 507 |
CareFusion Corp. (Þ)
6.375% due 08/01/19 | | 300 | | 321 |
Caterpillar Financial Services Corp.
4.850% due 12/07/12 | | 100 | | 108 |
Catlin Insurance Co., Ltd. (ƒ)(Þ)
7.249% due 12/31/49 | | 100 | | 73 |
Cellco Partnership / Verizon Wireless Capital LLC
2.869% due 05/20/11 (Ê) | | 400 | | 414 |
5.250% due 02/01/12 | | 700 | | 742 |
8.500% due 11/15/18 | | 175 | | 217 |
CenterPoint Energy Houston Electric LLC (Ñ)
Series J2
5.700% due 03/15/13 | | 110 | | 117 |
CenterPoint Energy Resources Corp.
6.125% due 11/01/17 | | 50 | | 52 |
Series B
7.875% due 04/01/13 | | 295 | | 332 |
Chase Capital III (Ê)
Series C
0.806% due 03/01/27 | | 295 | | 210 |
Chesapeake Energy Corp.
7.000% due 08/15/14 | | 350 | | 354 |
6.875% due 01/15/16 | | 180 | | 180 |
Chubb Corp.
6.375% due 03/29/67 | | 175 | | 163 |
Series 1
6.500% due 05/15/38 | | 50 | | 55 |
CIT Group, Inc.
7.000% due 05/01/13 (Ñ) | | 56 | | 53 |
7.000% due 05/01/14 (Ñ) | | 85 | | 79 |
7.000% due 05/01/15 | | 285 | | 255 |
7.000% due 05/01/16 | | 141 | | 124 |
7.000% due 05/01/17 (Ñ) | | 198 | | 171 |
Citibank NA
1.875% due 05/07/12 | | 100 | | 101 |
Citigroup Capital XXI
8.300% due 12/21/77 | | 650 | | 626 |
Citigroup Funding, Inc.
1.875% due 10/22/12 | | 3,500 | | 3,487 |
2.250% due 12/10/12 (Ñ) | | 200 | | 202 |
Citigroup, Inc.
2.125% due 04/30/12 | | 800 | | 809 |
5.500% due 08/27/12 | | 200 | | 209 |
Russell Investment Funds
Core Bond Fund
Schedule of Investments, continued — December 31, 2009
Amounts in thousands (except share amounts)
| | | | |
| | | Principal
Amount ($)
or Shares | | Market
Value
$ |
| | | | |
5.625% due 08/27/12 | | 200 | | 206 |
5.500% due 04/11/13 | | 700 | | 726 |
5.850% due 07/02/13 (Ñ) | | 100 | | 104 |
6.375% due 08/12/14 | | 250 | | 262 |
5.000% due 09/15/14 | | 400 | | 386 |
4.700% due 05/29/15 | | 50 | | 49 |
5.850% due 08/02/16 | | 55 | | 54 |
6.000% due 08/15/17 | | 400 | | 400 |
6.125% due 11/21/17 | | 405 | | 408 |
6.125% due 08/25/36 (Ñ) | | 300 | | 257 |
5.875% due 05/29/37 | | 150 | | 132 |
6.875% due 03/05/38 (Ñ) | | 75 | | 75 |
8.125% due 07/15/39 | | 1,215 | | 1,371 |
CNA Financial Corp. (Ñ)
6.500% due 08/15/16 | | 125 | | 123 |
Columbus Southern Power Co.
Series C
5.500% due 03/01/13 | | 10 | | 11 |
Comcast Cable Communications Holdings, Inc.
9.455% due 11/15/22 | | 100 | | 129 |
Comcast Cable Holdings LLC
9.800% due 02/01/12 | | 180 | | 204 |
Comcast Corp.
5.500% due 03/15/11 | | 100 | | 105 |
Comcast Holdings Corp.
10.625% due 07/15/12 | | 125 | | 147 |
Commonwealth Edison Co.
6.950% due 07/15/18 | | 50 | | 54 |
Series 105
5.400% due 12/15/11 | | 125 | | 134 |
Community Health Systems, Inc.
Series WI
8.875% due 07/15/15 | | 235 | | 243 |
Continental Airlines, Inc.
9.000% due 07/08/16 (Ñ) | | 250 | | 265 |
Series 071A
5.983% due 04/19/22 | | 150 | | 145 |
Countrywide Financial Corp.
Series MTN
5.800% due 06/07/12 | | 100 | | 106 |
Countrywide Home Loans, Inc. (Ñ)
Series MTNL
4.000% due 03/22/11 | | 290 | | 296 |
COX Communications, Inc. (Þ)
5.875% due 12/01/16 | | 75 | | 79 |
8.375% due 03/01/39 | | 125 | | 156 |
Credit Suisse USA, Inc. (Ñ)
5.500% due 08/15/13 | | 45 | | 49 |
4.875% due 01/15/15 | | 55 | | 58 |
CSC Holdings LLC
Series WI
6.750% due 04/15/12 | | 12 | | 12 |
DCP Midstream LLC
6.875% due 02/01/11 | | 20 | | 21 |
Dell, Inc. (Ñ)
4.700% due 04/15/13 | | 400 | | 422 |
Delta Air Lines, Inc.
9.500% due 09/15/14 (Þ) | | 480 | | 499 |
| | | | |
| | | Principal
Amount ($)
or Shares | | Market
Value
$ |
Series 00A2 (Ñ) | | | | |
7.570% due 05/18/12 | | 205 | | 208 |
Series 01A2
7.111% due 03/18/13 | | 400 | | 403 |
DirecTV Holdings LLC/Financing Co., Inc. (Ñ)(Þ)
5.875% due 10/01/19 | | 125 | | 127 |
Discover Bank
Series BKNT
8.700% due 11/18/19 | | 250 | | 268 |
DISH DBS Corp.
7.125% due 02/01/16 | | 125 | | 128 |
Dolphin Energy, Ltd. (Þ)
5.888% due 06/15/19 | | 129 | | 130 |
Dow Chemical Co. (The)
7.600% due 05/15/14 | | 300 | | 341 |
5.900% due 02/15/15 | | 100 | | 107 |
DPL, Inc.
6.875% due 09/01/11 | | 193 | | 206 |
Dynegy Roseton/Danskammer Pass Through Trust
Series B
7.670% due 11/08/16 | | 550 | | 531 |
Edison Mission Energy (Ñ)
7.000% due 05/15/17 | | 675 | | 533 |
El Paso Corp. (Ñ)
Series GMTN
8.050% due 10/15/30 | | 200 | | 189 |
El Paso Natural Gas Co.
7.500% due 11/15/26 | | 100 | | 110 |
Energy Transfer Partners, LP (Ñ)
5.950% due 02/01/15 | | 325 | | 344 |
Enterprise Products Operating LLC
6.650% due 04/15/18 | | 250 | | 271 |
Series A
8.375% due 08/01/66 | | 100 | | 98 |
Federal Express Corp.
7.600% due 07/01/97 | | 75 | | 71 |
Fifth Third Bancorp
8.250% due 03/01/38 | | 1,100 | | 1,046 |
FirstEnergy Corp.
Series B
6.450% due 11/15/11 | | 12 | | 13 |
Series C
7.375% due 11/15/31 | | 175 | | 190 |
FPL Energy Wind Funding LLC (Þ)
6.876% due 06/27/17 | | 286 | | 277 |
General Electric Capital Corp.
1.167% due 05/22/13 (Ê) | | 75 | | 74 |
5.900% due 05/13/14 (Ñ) | | 350 | | 378 |
5.625% due 05/01/18 | | 230 | | 236 |
5.875% due 01/14/38 | | 300 | | 278 |
6.375% due 11/15/67 | | 1,900 | | 1,648 |
Series EMTN (Ê)
0.399% due 03/20/14 | | 400 | | 372 |
Series GMTN
5.500% due 04/28/11 (Ñ) | | 220 | | 232 |
Russell Investment Funds
Core Bond Fund
Schedule of Investments, continued — December 31, 2009
Amounts in thousands (except share amounts)
| | | | |
| | | Principal
Amount ($)
or Shares | | Market
Value
$ |
| | | | |
2.000% due 09/28/12 | | 400 | | 401 |
2.625% due 12/28/12 | | 1,000 | | 1,018 |
Series MTNA (Ê)
0.514% due 09/15/14 | | 300 | | 283 |
General Electric Co.
5.250% due 12/06/17 | | 150 | | 153 |
GMAC, Inc.
7.250% due 03/02/11 (Þ) | | 525 | | 520 |
6.875% due 09/15/11 (Ñ) | | 525 | | 519 |
1.750% due 10/30/12 | | 1,700 | | 1,689 |
7.500% due 12/31/13 (Þ) | | 1,400 | | 1,351 |
Goldman Sachs Group, Inc. (The)
1.031% due 12/05/11 (Ê) | | 1,020 | | 1,037 |
4.750% due 07/15/13 | | 350 | | 366 |
6.000% due 05/01/14 (Ñ) | | 150 | | 164 |
6.250% due 09/01/17 | | 600 | | 643 |
6.150% due 04/01/18 | | 150 | | 161 |
7.500% due 02/15/19 (Ñ) | | 550 | | 641 |
6.750% due 10/01/37 (Ñ) | | 800 | | 822 |
Series MTNB (Ê)
0.683% due 07/22/15 | | 100 | | 89 |
HCA, Inc. (Þ)
8.500% due 04/15/19 | | 300 | | 323 |
7.875% due 02/15/20 (Ñ) | | 125 | | 130 |
HCP, Inc.(Ñ)
5.950% due 09/15/11 | | 585 | | 604 |
Healthcare Realty Trust, Inc.
6.500% due 01/17/17 | | 700 | | 693 |
Historic TW, Inc.
8.050% due 01/15/16 | | 195 | | 216 |
Indiantown Cogeneration, LP
Series A-10
9.770% due 12/15/20 | | 275 | | 270 |
International Lease Finance Corp.
4.950% due 02/01/11 | | 100 | | 93 |
International Paper Co. (Ñ)
7.950% due 06/15/18 | | 75 | | 87 |
Jersey Central Power & Light Co.
5.625% due 05/01/16 | | 90 | | 93 |
JPMorgan Chase Capital XIII (Ê)
Series M
1.201% due 09/30/34 | | 480 | | 338 |
JPMorgan Chase & Co.
5.375% due 01/15/14 (Ñ) | | 170 | | 182 |
6.000% due 01/15/18 | | 200 | | 215 |
6.300% due 04/23/19 | | 250 | | 275 |
6.400% due 05/15/38 | | 323 | | 356 |
Series 1 (ƒ)
7.900% due 04/29/49 | | 840 | | 866 |
JPMorgan Chase Bank NA
Series AI (Þ)
5.875% due 06/13/16 | | 70 | | 73 |
Series BKNT
6.000% due 10/01/17 | | 400 | | 428 |
JPMorgan Chase Capital XXI (Ê)
Series U
1.231% due 01/15/87 | | 335 | | 229 |
| | | | |
| | | Principal
Amount ($)
or Shares | | Market
Value
$ |
KCP&L Greater Missouri Operations Co.
11.875% due 07/01/12 | | 640 | | 741 |
Kinder Morgan Energy Partners, LP (Ñ)
5.950% due 02/15/18 | | 700 | | 741 |
Kraft Foods, Inc.
6.125% due 02/01/18 | | 200 | | 210 |
L-3 Communications Corp.
Series B
6.375% due 10/15/15 | | 125 | | 125 |
Lehman Brothers Holdings, Inc. (Ø)
5.625% due 01/24/13 | | 200 | | 41 |
6.200% due 09/26/14 | | 200 | | 39 |
1.000% due 01/23/49 | | 600 | | 117 |
1.000% due 04/03/49 | | 400 | | 78 |
Manufacturers & Traders Trust Co.
5.585% due 12/28/20 | | 84 | | 73 |
Massey Energy Co.
3.250% due 08/01/15 | | 640 | | 559 |
MBNA Capital B (Ê)
Series B
1.081% due 02/01/27 | | 985 | | 672 |
MBNA Corp. (Ñ)
6.125% due 03/01/13 | | 200 | | 212 |
Merrill Lynch & Co., Inc.
6.050% due 08/15/12 | | 100 | | 107 |
5.450% due 02/05/13 (Ñ) | | 200 | | 210 |
6.050% due 05/16/16 | | 300 | | 303 |
6.400% due 08/28/17 | | 325 | | 342 |
6.875% due 04/25/18 | | 625 | | 673 |
MetLife, Inc.
6.125% due 12/01/11 (Ñ) | | 205 | | 220 |
6.400% due 12/15/66 | | 100 | | 88 |
Series A (Ñ)
6.817% due 08/15/18 | | 200 | | 223 |
Metropolitan Life Global Funding I (Å)
5.125% due 06/10/14 | | 200 | | 212 |
Mirant Mid Atlantic Pass Through Trust A
Series A
8.625% due 06/30/12 | | 243 | | 248 |
Morgan Stanley
3.250% due 12/01/11 | | 200 | | 207 |
5.375% due 10/15/15 | | 500 | | 517 |
0.734% due 10/18/16 (Ê) | | 435 | | 403 |
5.450% due 01/09/17 | | 225 | | 227 |
6.250% due 08/28/17 | | 100 | | 104 |
5.950% due 12/28/17 | | 125 | | 129 |
6.625% due 04/01/18 | | 450 | | 487 |
7.300% due 05/13/19 | | 100 | | 112 |
5.625% due 09/23/19 | | 100 | | 101 |
Series GMTN
5.750% due 08/31/12 (Ñ) | | 125 | | 134 |
0.584% due 01/09/14 (Ê) | | 425 | | 406 |
National City Bank (Ê)
Series BKNT
0.625% due 06/07/17 | | 700 | | 621 |
Nevada Power Co.
7.125% due 03/15/19 | | 100 | | 112 |
Russell Investment Funds
Core Bond Fund
Schedule of Investments, continued — December 31, 2009
Amounts in thousands (except share amounts)
| | | | |
| | | Principal
Amount ($)
or Shares | | Market
Value
$ |
| | | | |
Series L
5.875% due 01/15/15 | | 100 | | 107 |
New Cingular Wireless Services, Inc. (Ñ)
7.875% due 03/01/11 | | 150 | | 161 |
News America Holdings, Inc.
7.900% due 12/01/95 | | 90 | | 97 |
8.250% due 10/17/96 | | 20 | | 20 |
NGPL Pipeco LLC (Þ)
6.514% due 12/15/12 | | 200 | | 217 |
Nisource Finance Corp.
10.750% due 03/15/16 | | 100 | | 123 |
6.400% due 03/15/18 | | 145 | | 151 |
6.125% due 03/01/22 | | 335 | | 342 |
Ohio Power Co. (Ñ)
Series F
5.500% due 02/15/13 | | 20 | | 21 |
Oncor Electric Delivery Co. (Ñ)
6.800% due 09/01/18 | | 550 | | 611 |
Panhandle Eastern Pipeline Co., LP
8.125% due 06/01/19 | | 450 | | 520 |
Philip Morris International, Inc.
6.375% due 05/16/38 | | 100 | | 108 |
Phoenix Life Insurance Co. (Å)
7.150% due 12/15/34 | | 150 | | 74 |
PNC Bank NA
Series BKNT
6.875% due 04/01/18 | | 250 | | 265 |
Progress Energy, Inc.
7.100% due 03/01/11 | | 77 | | 81 |
5.625% due 01/15/16 | | 40 | | 42 |
7.050% due 03/15/19 | | 200 | | 224 |
ProLogis
1.875% due 11/15/37 | | 150 | | 133 |
Prudential Holdings LLC (Å)
8.695% due 12/18/23 | | 550 | | 589 |
Public Service Co. of New Mexico
7.950% due 05/15/18 | | 260 | | 272 |
Puget Sound Energy, Inc.
Series A
6.974% due 06/01/67 | | 125 | | 110 |
Pulte Homes, Inc.
5.250% due 01/15/14 | | 1,000 | | 982 |
Qwest Capital Funding, Inc. (Ñ)
7.250% due 02/15/11 | | 150 | | 152 |
Qwest Communications International, Inc.
Series*
7.250% due 02/15/11 | | 384 | | 386 |
Qwest Corp. | | | | |
7.875% due 09/01/11 | | 120 | | 126 |
7.625% due 06/15/15 | | 100 | | 103 |
Reckson Operating Partnership, LP
5.150% due 01/15/11 | | 92 | | 92 |
Reinsurance Group of America, Inc.
6.750% due 12/15/65 | | 75 | | 63 |
Reliant Energy Mid-Atlantic Power Holdings LLC
Series B
9.237% due 07/02/17 | | 318 | | 332 |
| | | | |
| | | Principal
Amount ($)
or Shares | | Market
Value
$ |
Sabine Pass LNG, LP (Ñ)
7.250% due 11/30/13 | | 730 | | 662 |
Simon Property Group, LP | | | | |
5.600% due 09/01/11 | | 200 | | 209 |
5.300% due 05/30/13 (Ñ) | | 395 | | 408 |
6.100% due 05/01/16 | | 130 | | 133 |
SLM Corp. | | | | |
5.400% due 10/25/11 | | 100 | | 100 |
5.125% due 08/27/12 | | 75 | | 70 |
8.450% due 06/15/18 | | 50 | | 49 |
Southern Union Co.
7.200% due 11/01/66 | | 740 | | 633 |
Sprint Capital Corp.
8.375% due 03/15/12 | | 125 | | 129 |
State Street Capital Trust III
8.250% due 03/15/42 | | 200 | | 205 |
Symetra Financial Corp. (Å)
6.125% due 04/01/16 | | 150 | | 134 |
Target Corp. (Ñ)
5.125% due 01/15/13 | | 400 | | 434 |
Tennessee Gas Pipeline Co. | | | | |
8.000% due 02/01/16 | | 200 | | 229 |
7.000% due 10/15/28 | | 50 | | 53 |
8.375% due 06/15/32 | | 100 | | 119 |
Time Warner, Inc. (Ñ)
5.875% due 11/15/16 | | 400 | | 432 |
Transatlantic Holdings, Inc.
8.000% due 11/30/39 | | 150 | | 153 |
Union Electric Co.
6.400% due 06/15/17 | | 205 | | 221 |
Union Pacific Corp. (Ñ)
5.700% due 08/15/18 | | 400 | | 419 |
United Air Lines, Inc.
10.400% due 11/01/16 | | 100 | | 105 |
UnitedHealth Group, Inc. | | | | |
5.250% due 03/15/11 | | 95 | | 98 |
4.875% due 02/15/13 | | 200 | | 209 |
6.000% due 06/15/17 | | 35 | | 37 |
Series WI | | | | |
6.500% due 06/15/37 | | 45 | | 44 |
US Bank National Associtaion
4.375% due 02/28/17 | | 100 | | 138 |
US Central Federal Credit Union | | | | |
1.250% due 10/19/11 | | 400 | | 400 |
1.900% due 10/19/12 | | 300 | | 300 |
Valero Energy Corp.(Ñ)
9.375% due 03/15/19 | | 450 | | 535 |
Wachovia Corp. | | | | |
5.500% due 05/01/13 | | 450 | | 478 |
5.625% due 10/15/16 (Ñ) | | 100 | | 102 |
5.750% due 06/15/17 (Ñ) | | 155 | | 161 |
5.750% due 02/01/18 | | 500 | | 522 |
Series* (Ê) | | | | |
0.621% due 10/28/15 | | 200 | | 177 |
WEA Finance LLC / WT Finance Aust Pty, Ltd. | | | | |
7.500% due 06/02/14 (Å) | | 205 | | 231 |
6.750% due 09/02/19 | | 95 | | 102 |
Russell Investment Funds
Core Bond Fund
Schedule of Investments, continued — December 31, 2009
Amounts in thousands (except share amounts)
| | | | |
| | | Principal
Amount ($)
or Shares | | Market
Value
$ |
| | | | |
Wells Fargo & Co. | | | | |
0.909% due 03/23/16 | | 400 | | 528 |
5.625% due 12/11/17 (Ñ) | | 300 | | 312 |
Series K (ƒ) | | | | |
7.980% due 03/29/49 | | 3,585 | | 3,594 |
Westpac Banking Corp. (Å)
1.900% due 12/14/12 | | 800 | | 794 |
Whirlpool Corp. | | | | |
8.000% due 05/01/12 (Ñ) | | 25 | | 27 |
8.600% due 05/01/14 | | 75 | | 85 |
Williams Cos., Inc. (Ñ)
7.625% due 07/15/19 | | 400 | | 448 |
Williams Cos., Inc. (The) | | | | |
7.875% due 09/01/21 | | 405 | | 465 |
Series WI | | | | |
8.750% due 01/15/20 | | 150 | | 179 |
Windstream Corp. Series WI
8.625% due 08/01/16 | | 125 | | 127 |
XTO Energy, Inc.
6.500% due 12/15/18 | | 175 | | 200 |
ZFS Finance USA Trust I (Þ)
6.150% due 12/15/65 | | 500 | | 455 |
| | | | |
| | | | 87,049 |
| | | | |
|
| International Debt - 8.8% |
Achmea Hypotheekbank NV (Þ)
3.200% due 11/03/14 | | 900 | | 898 |
African Development Bank Series GDIF
1.750% due 10/01/12 | | 1,100 | | 1,093 |
Altria Group, Inc.
9.700% due 11/10/18 | | 150 | | 185 |
Anglo American Capital PLC (Þ)
9.375% due 04/08/19 | | 100 | | 127 |
ANZ National International, Ltd. (Þ)
6.200% due 07/19/13 | | 600 | | 646 |
ArcelorMittal
6.125% due 06/01/18 | | 175 | | 181 |
Argentina Bonos
7.000% due 10/03/15 | | 230 | | 197 |
AstraZeneca PLC (Ñ)
5.900% due 09/15/17 | | 100 | | 111 |
AXA SA (ƒ)(Þ)
6.463% due 12/14/18 | | 100 | | 78 |
Barclays Bank PLC | | | | |
5.450% due 09/12/12 | | 1,300 | | 1,406 |
6.050% due 12/04/17 (Þ) | | 200 | | 204 |
Barrick Gold Corp.
6.950% due 04/01/19 | | 135 | | 152 |
Barrick Gold Financeco LLC
6.125% due 09/15/13 | | 270 | | 297 |
BAT International Finance PLC (Þ)
9.500% due 11/15/18 | | 150 | | 190 |
Black Diamond CLO, Ltd. (Ê)(Å)
Series 2007-1A Class AD
0.531% due 04/29/19 | | 1,000 | | 868 |
BNP Paribas (ƒ)(Þ)
5.186% due 06/29/49 | | 300 | | 247 |
| | | | |
| | | Principal
Amount ($)
or Shares | | Market
Value
$ |
Canadian Natural Resources, Ltd. | | | | |
5.150% due 02/01/13 | | 100 | | 106 |
6.500% due 02/15/37 | | 100 | | 106 |
Chatham Light CLO, Ltd. (Ê)(Å)
Series 2005-2A Class A1
0.531% due 08/03/19 | | 495 | | 446 |
CODELCO, Inc. (Þ)
7.500% due 01/15/19 | | 200 | | 234 |
Credit Agricole SA (ƒ)(Þ)
8.375% due 10/29/49 | | 150 | | 159 |
Credit Suisse NY | | | | |
5.000% due 05/15/13 | | 330 | | 352 |
6.000% due 02/15/18 | | 770 | | 806 |
Danske Bank A/S (Þ)
2.500% due 05/10/12 | | 200 | | 203 |
Deutsche Bank AG (Ñ)
6.000% due 09/01/17 | | 600 | | 654 |
Electricite De France (Þ) | | | | |
5.500% due 01/26/14 | | 200 | | 217 |
6.500% due 01/26/19 | | 200 | | 225 |
6.950% due 01/26/39 | | 200 | | 237 |
Endurance Specialty Holdings, Ltd.
6.150% due 10/15/15 | | 100 | | 104 |
Enel Finance International SA (Þ)
6.250% due 09/15/17 | | 600 | | 660 |
Enel Finance International SA (Þ)
5.125% due 10/07/19 | | 275 | | 277 |
Export-Import Bank of Korea
5.875% due 01/14/15 | | 700 | | 751 |
HBOS PLC (Þ)
6.750% due 05/21/18 | | 825 | | 766 |
HSBC Holdings PLC (Ñ) | | | | |
6.500% due 05/02/36 | | 100 | | 105 |
6.500% due 09/15/37 | | 100 | | 104 |
Israel Government AID Bond
5.500% due 09/18/33 | | 400 | | 395 |
Jackson National Life Fund LLC
0.553% due 08/06/11 | | 2,800 | | 2,579 |
Korea Electric Power Corp. (Þ)
5.125% due 04/23/34 | | 60 | | 64 |
Landwirtschaftliche Rentenbank | | | | |
5.250% due 07/02/12 | | 700 | | 756 |
1.875% due 09/24/12 | | 1,700 | | 1,695 |
4.875% due 01/10/14 | | 1,000 | | 1,077 |
LeasePlan Corp. NV (Þ)
3.000% due 05/07/12 | | 400 | | 410 |
Macquarie Bank, Ltd. (Þ)
3.300% due 07/17/14 | | 1,000 | | 1,002 |
Morgan Stanley | | | | |
1.048% due 03/01/13 (Ê) | | 600 | | 817 |
MUFG Capital Finance 1, Ltd. (ƒ)(Ñ)
6.346% due 07/29/49 | | 200 | | 182 |
National Australia Bank, Ltd. (Þ)
5.350% due 06/12/13 | | 800 | | 861 |
Peruvian Government International Bond
7.125% due 03/30/19 | | 180 | | 207 |
Petro-Canada
6.050% due 05/15/18 | | 100 | | 107 |
Russell Investment Funds
Core Bond Fund
Schedule of Investments, continued — December 31, 2009
Amounts in thousands (except share amounts)
| | | | |
| | | Principal
Amount ($)
or Shares | | Market
Value
$ |
| | | | |
Petrobras International Finance Co. (Ñ)
7.875% due 03/15/19 | | 800 | | 922 |
Petroleos Mexicanos (Ñ)
8.000% due 05/03/19 | | 320 | | 370 |
Province of Ontario Canada
4.100% due 06/16/14 | | 400 | | 417 |
Qatar Govt International Bond (Ñ)(Þ)
5.250% due 01/20/20 | | 520 | | 524 |
Ras Laffan Liquefied Natural Gas Co., Ltd. III (Þ)
5.838% due 09/30/27 | | 250 | | 249 |
Resona Bank, Ltd. (ƒ)(Þ)
5.850% due 09/29/49 | | 100 | | 87 |
Resona Preferred Global Securities Cayman, Ltd. (ƒ)(Þ)
7.191% due 12/29/49 | | 325 | | 266 |
Royal Bank of Scotland Group PLC
1.500% due 03/30/12 (Ñ)(Å) | | 1,200 | | 1,188 |
6.990% due 10/29/49 (ƒ)(Þ) | | 300 | | 167 |
Series 1 (ƒ)(Ñ) | | | | |
9.118% due 03/31/49 | | 300 | | 274 |
Royal Bank of Scotland PLC (The) (Þ) | | | | |
0.673% due 04/08/11 (Ê) | | 800 | | 802 |
3.000% due 12/09/11 | | 200 | | 205 |
4.875% due 08/25/14 (Ñ) | | 100 | | 101 |
Santander Perpetual SA Unipersonal (ƒ)(Þ)
6.671% due 10/29/49 | | 300 | | 270 |
SMFG Preferred Capital USD 1, Ltd. (ƒ)(Þ)
6.078% due 01/29/49 | | 100 | | 86 |
Societe Financement de l’Economie Francaise (Þ)
3.375% due 05/05/14 | | 700 | | 714 |
2.875% due 09/22/14 | | 1,200 | | 1,191 |
State of Qatar
5.150% due 04/09/14 | | 100 | | 105 |
Sumitomo Mitsui Banking Corp. (ƒ)(Þ)
5.625% due 07/29/49 | | 300 | | 286 |
Suncor Energy, Inc.
6.100% due 06/01/18 | | 100 | | 107 |
Svensk Exportkredit AB (Ñ)
3.250% due 09/16/14 | | 200 | | 200 |
Swiss Re Capital I, LP (ƒ)(Þ)
6.854% due 05/29/49 | | 225 | | 182 |
Systems 2001 AT LLC (Þ)
7.156% due 12/15/11 | | 54 | | 56 |
Telecom Italia Capital SA
6.200% due 07/18/11 | | 255 | | 270 |
7.200% due 07/18/36 | | 225 | | 245 |
Thomson Reuters Corp.
6.500% due 07/15/18 | | 225 | | 254 |
TransCanada PipeLines, Ltd.
6.350% due 05/15/67 | | 225 | | 211 |
TransCapitalInvest, Ltd. for OJSC AK Transneft (Þ)
8.700% due 08/07/18 | | 100 | | 115 |
UBS AG
Series DPNT
5.875% due 12/20/17 | | 400 | | 411 |
| | | | |
| | | Principal
Amount ($)
or Shares | | Market
Value
$ |
5.750% due 04/25/18 | | 100 | | 102 |
UBS Luxembourg SA for OJSC Vimpel Communications
Series REGS
8.250% due 05/23/16 | | 100 | | 103 |
Vale Overseas, Ltd. (Ñ)
5.625% due 09/15/19 | | 400 | | 404 |
WCI Finance LLC / WEA Finance LLC (Þ)
5.400% due 10/01/12 | | 125 | | 133 |
Westpac Banking Corp.
4.875% due 11/19/19 | | 650 | | 642 |
WT Finance Aust Pty, Ltd./Westfield
Capital/WEA Finance LLC (Þ)
5.125% due 11/15/14 | | 125 | | 129 |
Xstrata Canada Corp.
7.250% due 07/15/12 | | 50 | | 54 |
6.000% due 10/15/15 | | 45 | | 48 |
| | | | |
| | | | 35,434 |
| | | | |
|
| Loan Agreements - 0.4% |
Adam Aircraft Industries, Term Loan
15.290% due 05/01/12 (Ø)(Å) | | 54 | | 1 |
HCA, Inc., Term Loan A (Ê)
1.750% due 11/18/12 | | 598 | | 572 |
Kelson Holdings, Inc., 1st Lien Term Loan
3.500% due 03/08/13 | | 1,000 | | 976 |
| | | | |
| | | | 1,549 |
| | | | |
|
| Mortgage-Backed Securities - 38.3% |
ABN Amro Mortgage Corp.
Series 2003-13 Class A3
5.500% due 01/25/34 | | 1,807 | | 1,521 |
Adjustable Rate Mortgage Trust
Series 2004-5 Class 2A1
3.394% due 04/25/35 | | 63 | | 52 |
Series 2005-3 Class 8A2 (Ê) | | | | |
0.471% due 07/25/35 | | 92 | | 77 |
American Home Mortgage Assets (Ê)
Series 2007-4 Class A2
0.421% due 08/25/37 | | 1,060 | | 542 |
American Home Mortgage Investment Trust (Ê)
Series 2004-4 Class 4A
2.231% due 02/25/45 | | 84 | | 63 |
Banc of America Alternative Loan Trust
Series 2003-2 Class CB2 (Ê)
0.731% due 04/25/33 | | 54 | | 47 |
Series 2003-10 Class 2A2 (Ê)
0.681% due 12/25/33 | | 146 | | 130 |
Series 2006-5 Class CB17
6.000% due 06/25/46 | | 177 | | 145 |
Banc of America Commercial Mortgage, Inc.
Series 2002-PB2 Class A4
6.186% due 06/11/35 | | 560 | | 587 |
Series 2005-2 Class A4
4.783% due 07/10/43 | | 333 | | 337 |
Russell Investment Funds
Core Bond Fund
Schedule of Investments, continued — December 31, 2009
Amounts in thousands (except share amounts)
| | | | |
| | | Principal
Amount ($)
or Shares | | Market
Value
$ |
| | | | |
Series 2005-3 Class A2
4.501% due 07/10/43 | | 128 | | 129 |
Series 2005-5 Class A4
5.115% due 10/10/45 | | 500 | | 490 |
Series 2006-1 Class A4
5.372% due 09/10/45 | | 280 | | 271 |
Series 2006-2 Class A4 (Ê)
5.738% due 05/10/45 | | 200 | | 197 |
Series 2006-4 Class A4
5.634% due 07/10/46 | | 500 | | 468 |
Banc of America Funding Corp.
Series 2005-D Class A1 (Ê)
3.267% due 05/25/35 | | 101 | | 95 |
Series 2006-3 Class 5A8
5.500% due 03/25/36 | | 475 | | 351 |
Series 2006-A Class 3A2 (Ê)
5.794% due 02/20/36 | | 147 | | 84 |
Series 2006-A Class 4A1 (Ê)
5.533% due 02/20/36 | | 397 | | 271 |
Banc of America Mortgage Securities, Inc.
Series 2003-9 Class 1A12 (Ê)
0.681% due 12/25/33 | | 124 | | 119 |
Series 2004-1 Class 5A1
6.500% due 09/25/33 | | 8 | | 8 |
Series 2004-2 Class 1A9 (Ê)
0.681% due 03/25/34 | | 86 | | 79 |
Series 2004-11 Class 2A1
5.750% due 01/25/35 | | 282 | | 279 |
Series 2005-H Class 2A5 (Ê)
4.787% due 09/25/35 | | 220 | | 173 |
Series 2005-L Class 3A1 (Ê)
5.390% due 01/25/36 | | 183 | | 151 |
Series 2006-2 Class A15
6.000% due 07/25/46 | | 152 | | 137 |
Series 2006-B Class 1A1 (Ê)
4.213% due 10/20/46 | | 94 | | 61 |
Bear Stearns Adjustable Rate Mortgage Trust (Ê)
Series 2003-1 Class 6A1
4.991% due 04/25/33 | | 32 | | 28 |
Series 2003-8 Class 4A1
3.770% due 01/25/34 | | 79 | | 70 |
Series 2004-1 Class 21A1
3.634% due 04/25/34 | | 55 | | 48 |
Series 2004-9 Class 22A1
4.150% due 11/25/34 | | 58 | | 55 |
Series 2005-2 Class A1
2.940% due 03/25/35 | | 961 | | 841 |
Series 2005-3 Class 2A1
5.080% due 06/25/35 | | 239 | | 182 |
Bear Stearns Alt-A Trust (Ê)
Series 2005-4 Class 23A1
5.310% due 05/25/35 | | 183 | | 127 |
Series 2005-7 Class 22A1
5.378% due 09/25/35 | | 88 | | 59 |
Series 2006-4 Class 13A1
0.391% due 08/25/36 | | 642 | | 292 |
| | | | |
| | | Principal
Amount ($)
or Shares | | Market
Value
$ |
Bear Stearns Alt-A Trust II (Ê)
Series 2007-1 Class 1A1
5.985% due 09/25/47 | | 768 | | 426 |
Bear Stearns Commercial Mortgage Securities
Series 2007-PW1 Class AM
6.084% due 06/11/50 | | 90 | | 65 |
Bear Stearns Mortgage Funding Trust (Ê)
Series 2006-AR2 Class 2A1
0.461% due 09/25/46 | | 602 | | 294 |
Chase Mortgage Finance Corp.
Series 2003-S8 Class A1
4.500% due 09/25/18 | | 97 | | 97 |
Series 2006-S4 Class A3
6.000% due 12/25/36 | | 167 | | 140 |
Series 2006-S4 Class A4
6.000% due 12/25/36 | | 70 | | 65 |
Series 2007-A1 Class 1A3 (Ê)
3.899% due 02/25/37 | | 419 | | 387 |
Citigroup Mortgage Loan Trust, Inc.
Series 2005-11 Class A2A
4.700% due 12/25/35 | | 60 | | 53 |
Series 2007-AR8 Class 2A1A (Ê)
5.877% due 07/25/37 | | 942 | | 688 |
Citigroup/Deutsche Bank Commercial Mortgage Trust
Series 2005-CD1 Class A4 (Ê)
5.224% due 07/15/44 | | 1,340 | | 1,338 |
Series 2006-CD3 Class A5
5.617% due 10/15/48 | | 190 | | 181 |
Citimortgage Alternative Loan Trust
Series 2006-A3 Class 1A5
6.000% due 07/25/36 | | 108 | | 79 |
Commercial Mortgage Loan Trust
Series 2008-LS1 Class A4B (Ê)
6.019% due 12/10/49 | | 1,195 | | 1,044 |
Series 2008-LS1 Class AJ
6.019% due 10/10/17 | | 120 | | 54 |
Commercial Mortgage Pass Through Certificates
Series 2006-C8 Class A4
5.306% due 12/10/46 | | 200 | | 171 |
Series 2007-C9 Class A4 (Ê)
5.816% due 12/10/49 | | 360 | | 326 |
Countrywide Alternative Loan Trust
Series 2005-1CB Class 2A1
6.000% due 03/25/35 | | 516 | | 381 |
Series 2005-32T Class A7 (Ê)
0.481% due 08/25/35 | | 80 | | 67 |
Series 2005-J8 Class 1A3
5.500% due 07/25/35 | | 169 | | 137 |
Series 2005-J13 Class 2A3
5.500% due 11/25/35 | | 109 | | 84 |
Series 2006-9T1 Class A7
6.000% due 05/25/36 | | 80 | | 58 |
Series 2006-J2 Class A3
6.000% due 04/25/36 | | 123 | | 102 |
Russell Investment Funds
Core Bond Fund
Schedule of Investments, continued — December 31, 2009
Amounts in thousands (except share amounts)
| | | | |
| | | Principal
Amount ($)
or Shares | | Market
Value
$ |
| | | | |
Series 2006-OA1 Class 2A1 (Ê)
0.443% due 03/20/46 | | 534 | | 261 |
Series 2006-OA1 Class 4A1 (Ê)
0.421% due 08/25/46 | | 580 | | 289 |
Series 2006-OA1 Class A1 (Ê)
0.413% due 02/20/47 | | 719 | | 335 |
Series 2006-OA1 Class A2 (Ê) | | | | |
0.421% due 10/25/46 | | 1,752 | | 932 |
Series 2007-15C Class A5 | | | | |
5.750% due 07/25/37 | | 755 | | 475 |
Series 2007-J2 Class 2A1 | | | | |
6.000% due 07/25/37 | | 219 | | 144 |
Series 2007-OA1 Class A1A (Ê) | | | | |
1.924% due 11/25/47 | | 933 | | 373 |
Countrywide Home Loan Mortgage Pass Through Trust | | | | |
Series 2003-8 Class A2 (Ê) | | | | |
0.731% due 05/25/18 | | 100 | | 84 |
Series 2003-52 Class A1 (Ê) | | | | |
3.436% due 02/19/34 | | 136 | | 119 |
Series 2004-16 Class 1A1 (Ê) | | | | |
0.631% due 09/25/34 | | 133 | | 76 |
Series 2004-22 Class A3 (Ê) | | | | |
3.510% due 11/25/34 | | 173 | | 140 |
Series 2004-HYB Class 1A1 (Ê) | | | | |
3.701% due 02/20/35 | | 294 | | 241 |
Series 2005-1 Class 2A1 (Ê) | | | | |
0.521% due 03/25/35 | | 1,689 | | 883 |
Series 2005-3 Class 1A2 (Ê) | | | | |
0.521% due 04/25/35 | | 25 | | 14 |
Series 2005-HYB Class 3A2A (Ê) | | | | |
5.250% due 02/20/36 | | 57 | | 38 |
Series 2006-OA5 Class 2A1 (Ê) | | | | |
0.431% due 04/25/46 | | 664 | | 322 |
Series 2007-18 Class 2A1 | | | | |
6.500% due 11/25/37 | | 188 | | 154 |
Series 2007-HY1 Class 1A2 (Ê) | | | | |
5.658% due 04/25/37 | | 76 | | 15 |
Credit Suisse First Boston Mortgage Securities Corp.
Series 2005-9 Class 2A1
5.500% due 10/25/35 | | 378 | | 320 |
Credit Suisse Mortgage Capital Certificates | | | | |
Series 2006-8 Class 4A1 (Å) | | | | |
6.500% due 10/25/21 | | 581 | | 414 |
Series 2006-C2 Class A3 | | | | |
5.658% due 03/15/39 | | 100 | | 86 |
Series 2006-C4 Class A3 | | | | |
5.467% due 09/15/39 | | 1,550 | | 1,328 |
Deutsche ALT-A Securities, Inc. Alternate Loan Trust (Ê) | | | | |
Series 2005-AR1 Class 2A3 | | | | |
4.936% due 08/25/35 | | 465 | | 219 |
Series 2007-OA1 Class A1 | | | | |
0.381% due 02/25/47 | | 2,526 | | 1,217 |
Series 2007-OA2 Class A1 | | | | |
1.001% due 04/25/47 | | 1,392 | | 754 |
| | | | |
| | | Principal
Amount ($)
or Shares | | Market
Value
$ |
DLJ Commercial Mortgage Corp. (Ê)
Series 1999-CG1 Class S
Interest Only STRIP
1.390% due 03/10/32 | | 257 | | 8 |
Fannie Mae | | | | |
5.190% due 2012 | | 202 | | 215 |
6.000% due 2016 | | 8 | | 9 |
2.666% due 2017 (Ê) | | 30 | | 31 |
6.000% due 2017 | | 43 | | 46 |
4.000% due 2018 | | 557 | | 571 |
4.500% due 2018 | | 611 | | 636 |
5.000% due 2018 | | 128 | | 135 |
6.000% due 2019 | | 298 | | 319 |
4.500% due 2020 | | 122 | | 127 |
5.500% due 2020 | | 161 | | 171 |
6.000% due 2020 | | 371 | | 398 |
5.500% due 2021 | | 242 | | 257 |
5.500% due 2022 | | 328 | | 348 |
5.000% due 2023 | | 4,226 | | 4,444 |
5.500% due 2023 | | 311 | | 331 |
6.000% due 2026 | | 671 | | 718 |
6.000% due 2027 | | 349 | | 372 |
6.000% due 2028 | | 23 | | 25 |
5.500% due 2029 | | 56 | | 60 |
6.000% due 2032 | | 335 | | 359 |
7.000% due 2032 | | 122 | | 134 |
2.858% due 2033 (Ê) | | 137 | | 141 |
2.942% due 2033 (Ê) | | 60 | | 61 |
5.000% due 2033 | | 429 | | 442 |
5.500% due 2033 | | 2,096 | | 2,203 |
6.000% due 2033 | | 133 | | 142 |
5.000% due 2034 | | 1,169 | | 1,203 |
5.500% due 2034 | | 1,255 | | 1,320 |
5.000% due 2035 | | 123 | | 126 |
5.500% due 2035 | | 1,725 | | 1,812 |
6.000% due 2035 | | 128 | | 137 |
3.731% due 2036 (Ê) | | 321 | | 332 |
5.500% due 2036 | | 3,140 | | 3,296 |
6.000% due 2036 | | 1,495 | | 1,585 |
6.500% due 2036 | | 88 | | 95 |
7.000% due 2036 | | 18 | | 20 |
5.500% due 2037 | | 481 | | 503 |
5.512% due 2037 (Ê) | | 212 | | 225 |
6.000% due 2037 | | 2,522 | | 2,678 |
6.500% due 2037 | | 1,098 | | 1,172 |
5.500% due 2038 | | 2,181 | | 2,283 |
6.000% due 2038 | | 1,043 | | 1,109 |
4.500% due 2039 | | 495 | | 495 |
5.000% due 2039 | | 2,360 | | 2,421 |
5.500% due 2039 | | 4 | | 4 |
6.000% due 2039 | | 1,953 | | 2,071 |
Series 2003-343 Class 6 | | | | |
Interest Only STRIP | | | | |
5.000% due 10/01/33 | | 192 | | 40 |
Series 2003-345 Class 18 | | | | |
Interest Only STRIP | | | | |
4.500% due 12/01/18 | | 494 | | 63 |
Series 2003-345 Class 19 | | | | |
Interest Only STRIP | | | | |
4.500% due 01/01/19 | | 549 | | 70 |
Series 2005-365 Class 12 | | | | |
Interest Only STRIP | | | | |
5.500% due 12/01/35 | | 799 | | 150 |
Russell Investment Funds
Core Bond Fund
Schedule of Investments, continued — December 31, 2009
Amounts in thousands (except share amounts)
| | | | |
| | | Principal
Amount ($)
or Shares | | Market
Value
$ |
| | | | |
Series 2006-369 Class 8 | | | | |
Interest Only STRIP | | | | |
5.500% due 04/01/36 | | 153 | | 28 |
15 Year TBA (Ï) | | | | |
4.000% | | 1,000 | | 1,006 |
30 Year TBA (Ï) | | | | |
4.500% | | 5,515 | | 5,477 |
6.500% | | 1,000 | | 1,318 |
Fannie Mae REMICS | | | | |
Series 1999-56 Class Z | | | | |
7.000% due 12/18/29 | | 77 | | 84 |
Series 2003-32 Class FH (Ê) | | | | |
0.631% due 11/25/22 | | 189 | | 187 |
Series 2003-35 Class FY (Ê) | | | | |
0.631% due 05/25/18 | | 264 | | 262 |
Series 2003-78 Class FI (Ê) | | | | |
0.631% due 01/25/33 | | 184 | | 182 |
Series 2004-21 Class FL (Ê) | | | | |
0.581% due 11/25/32 | | 106 | | 106 |
Series 2005-79 Class FC (Ê) | | | | |
0.531% due 02/25/22 | | 60 | | 60 |
Series 2006-48 Class LG | | | | |
Principal Only STRIP | | | | |
Zero coupon due 06/25/36 | | 45 | | 37 |
Series 2007-4 Class DF (Ê) | | | | |
0.676% due 02/25/37 | | 747 | | 732 |
Series 2008-22 Class FD (Ê) | | | | |
1.071% due 04/25/48 | | 766 | | 764 |
Series 2008-56 Class FD (Ê) | | | | |
1.171% due 07/25/48 | | 815 | | 815 |
Fannie Mae Whole Loan
Series 2003-W1 Class 1A1
6.500% due 12/25/42 | | 32 | | 34 |
Federal Home Loan Mortgage Corp. Structured Pass Through Securities (Ê)
Series 2005-63 Class 1A1
1.832% due 02/25/45 | | 26 | | 24 |
First Horizon Alternative Mortgage Securities | | | | |
Series 2004-AA3 Class A1 (Ê) | | | | |
3.085% due 09/25/34 | | 37 | | 29 |
Series 2006-AA5 Class A2 (Ê) | | | | |
6.471% due 09/25/36 | | 84 | | 2 |
Series 2006-FA3 Class A6 | | | | |
6.000% due 07/25/36 | | 138 | | 112 |
First Horizon Asset Securities, Inc. (Ê) | | | | |
Series 2004-AR6 Class 2A1 | | | | |
3.007% due 12/25/34 | | 29 | | 25 |
Series 2005-AR5 Class 3A1 | | | | |
5.558% due 10/25/35 | | 71 | | 61 |
Freddie Mac | | | | |
6.000% due 2016 | | 15 | | 16 |
5.000% due 2018 | | 292 | | 308 |
5.000% due 2019 | | 473 | | 498 |
5.000% due 2020 | | 861 | | 906 |
5.500% due 2020 | | 495 | | 528 |
3.389% due 2030 (Ê) | | 1 | | 1 |
5.000% due 2033 | | 134 | | 138 |
2.885% due 2034 (Ê) | | 59 | | 61 |
| | | | |
| | | Principal
Amount ($)
or Shares | | Market
Value
$ |
5.000% due 2035 | | 1,535 | | 1,577 |
5.857% due 2036 (Ê) | | 87 | | 91 |
5.899% due 2036 (Ê) | | 137 | | 144 |
5.966% due 2036 (Ê) | | 111 | | 118 |
5.464% due 2037 (Ê) | | 111 | | 118 |
5.500% due 2037 | | 1,633 | | 1,708 |
5.528% due 2037 (Ê) | | 349 | | 369 |
5.685% due 2037 (Ê) | | 464 | | 492 |
5.697% due 2037 (Ê) | | 71 | | 75 |
5.710% due 2037 (Ê) | | 171 | | 181 |
5.748% due 2037 (Ê) | | 137 | | 145 |
5.799% due 2037 (Ê) | | 51 | | 55 |
5.808% due 2037 (Ê) | | 158 | | 168 |
5.884% due 2037 (Ê) | | 70 | | 74 |
6.000% due 2037 | | 1,229 | | 1,307 |
5.000% due 2038 | | 84 | | 87 |
5.500% due 2038 | | 7,227 | | 7,577 |
6.000% due 2038 | | 4,543 | | 4,945 |
4.500% due 2039 | | 3,654 | | 3,648 |
5.000% due 2039 | | 5,288 | | 5,425 |
5.500% due 2039 | | 2 | | 3 |
6.000% due 2039 | | 113 | | 121 |
30 Year TBA (Ï) | | | | |
4.500% | | 1,000 | | 998 |
Freddie Mac REMICS | | | | |
Series 2000-226 Class F (Ê) | | | | |
0.683% due 11/15/30 | | 12 | | 12 |
Series 2003-256 Class FJ (Ê) | | | | |
0.633% due 02/15/33 | | 96 | | 96 |
Series 2003-262 Class AB | | | | |
2.900% due 11/15/14 | | 10 | | 10 |
Series 2004-281 Class DF (Ê) | | | | |
0.683% due 06/15/23 | | 75 | | 74 |
Series 2005-294 Class FA (Ê) | | | | |
0.403% due 03/15/20 | | 142 | | 139 |
Series 2005-299 Class KF (Ê) | | | | |
0.633% due 06/15/35 | | 29 | | 29 |
Series 2005-301 Class IM | | | | |
Interest Only STRIP | | | | |
5.500% due 01/15/31 | | 89 | | 6 |
Series 2006-313 Class FP (Ê)(Å) | | | | |
Principal Only STRIP | | | | |
Zero coupon due 04/15/36 | | 58 | | 53 |
Series 2007-330 Class GL (Ê)(Å) | | | | |
19.714% due 04/15/37 | | 28 | | 34 |
Series 2007-333 Class BF (Ê) | | | | |
0.383% due 07/15/19 | | 212 | | 209 |
Series 2007-333 Class FT (Ê) | | | | |
0.383% due 08/15/19 | | 428 | | 422 |
Ginnie Mae I | | | | |
6.000% due 2029 | | 9 | | 10 |
6.000% due 2038 | | 258 | | 273 |
4.500% due 2039 | | 1,925 | | 1,927 |
5.000% due 2039 | | 787 | | 813 |
5.500% due 2039 | | 849 | | 891 |
30 Year TBA (Ï) | | | | |
5.000% | | 3,180 | | 3,270 |
5.500% | | 2,410 | | 2,524 |
Russell Investment Funds
Core Bond Fund
Schedule of Investments, continued — December 31, 2009
Amounts in thousands (except share amounts)
| | | | |
| | | Principal
Amount ($)
or Shares | | Market
Value
$ |
| | | | |
6.000% | | 1,000 | | 1,057 |
6.500% | | 5,000 | | 5,316 |
Ginnie Mae II (Ê)
4.375% due 2026 | | 131 | | 135 |
3.625% due 2027 | | 9 | | 9 |
3.750% due 2032 | | 53 | | 54 |
GMAC Mortgage Corp. Loan Trust (Ê)
Series 2004-JR1 Class A6
0.681% due 12/25/33 | | 51 | | 41 |
Government National Mortgage Association (Ê)
Series 1999-40 Class FE
0.783% due 11/16/29 | | 75 | | 75 |
Series 2000-29 Class F
0.733% due 09/20/30 | | 15 | | 15 |
Greenwich Capital Commercial Funding Corp.
Series 2003-C2 Class A2
4.022% due 01/05/36 | | 46 | | 46 |
Series 2004-GG1 Class A7
5.317% due 06/10/36 | | 465 | | 472 |
Series 2006-GG7 Class A4 (Ê)
5.918% due 07/10/38 | | 1,105 | | 1,007 |
Series 2007-GG9 Class A4
5.444% due 03/10/39 | | 315 | | 278 |
GS Mortgage Securities Corp. II
Series 2006-GG6 Class A4
5.553% due 04/10/38 | | 320 | | 292 |
Series 2006-GG8 Class AAB
5.535% due 11/10/39 | | 200 | | 197 |
GSR Mortgage Loan Trust
Series 2005-AR7 Class 6A1 (Ê)
5.234% due 11/25/35 | | 209 | | 173 |
Series 2006-3F Class 2A3
5.750% due 03/25/36 | | 517 | | 437 |
Harborview Mortgage Loan Trust
Series 2005-3 Class 2A1A (Ê)
0.473% due 06/19/35 | | 1,504 | | 867 |
Series 2005-4 Class 3A1
5.099% due 07/19/35 | | 136 | | 94 |
Series 2005-14 Class 3A1A
5.316% due 12/19/35 | | 65 | | 49 |
Indymac Index Mortgage Loan Trust (Ê)
Series 2005-AR1 Class A1
5.263% due 09/25/35 | | 569 | | 420 |
Series 2006-AR2 Class A2
0.311% due 11/25/36 | | 46 | | 23 |
Series 2006-AR3 Class 2A1A
0.401% due 01/25/37 | | 629 | | 303 |
Series 2006-AR9 Class 1A1
5.615% due 06/25/36 | | 698 | | 447 |
Series 2007-AR5 Class 1A1
5.591% due 05/25/37 | | 741 | | 366 |
JPMorgan Chase Commercial Mortgage Securities Corp.
Series 2001-CIB Class A2
6.244% due 04/15/35 | | 22 | | 22 |
| | | | |
| | | Principal
Amount ($)
or Shares | | Market
Value
$ |
Series 2004-LN2 Class A1
4.475% due 07/15/41 | | 264 | | 266 |
Series 2005-LDP Class A3A1
4.871% due 10/15/42 | | 210 | | 211 |
Series 2005-LDP Class A4
4.918% due 10/15/42 | | 325 | | 312 |
5.179% due 12/15/44 | | 390 | | 386 |
Series 2006-CB1 Class A4
5.552% due 05/12/45 | | 220 | | 209 |
Series 2006-LDP Class A3B
5.447% due 05/15/45 | | 250 | | 252 |
Series 2006-LDP Class A4
5.875% due 04/15/45 | | 650 | | 626 |
5.399% due 05/15/45 | | 290 | | 269 |
Series 2007-CB1 Class A4
5.440% due 06/12/47 | | 1,200 | | 1,045 |
5.746% due 02/12/49 | | 340 | | 298 |
Series 2007-LD1 Class A4
5.882% due 02/15/51 | | 380 | | 329 |
Series 2007-LD1 Class AM
6.062% due 02/15/51 | | 100 | | 67 |
Series 2007-LDP Class A3
5.420% due 01/15/49 | | 1,525 | | 1,286 |
JPMorgan Mortgage Trust
Series 2005-A1 Class 6T1 (Ê)
5.022% due 02/25/35 | | 86 | | 79 |
Series 2005-A5 Class TA1 (Ê)
5.433% due 08/25/35 | | 800 | | 731 |
Series 2005-S3 Class 1A2
5.750% due 01/25/36 | | 118 | | 98 |
Series 2007-A1 Class 2A2 (Ê)
3.632% due 07/25/35 | | 524 | | 474 |
LB-UBS Commercial Mortgage Trust
Series 2006-C1 Class A4
5.156% due 02/15/31 | | 1,000 | | 968 |
Series 2006-C3 Class A4
5.661% due 03/15/39 | | 210 | | 195 |
Series 2006-C4 Class A4 (Ê)
5.882% due 06/15/38 | | 105 | | 99 |
Series 2006-C7 Class A3
5.347% due 11/15/38 | | 500 | | 458 |
Series 2007-C2 Class AM
5.493% due 02/15/40 | | 110 | | 74 |
Series 2007-C6 Class A4
5.858% due 07/15/40 | | 270 | | 228 |
Lehman Mortgage Trust
Series 2005-3 Class 1A3
5.500% due 01/25/36 | | 426 | | 382 |
Series 2006-8 Class 2A1 (Ê)
0.651% due 12/25/36 | | 736 | | 364 |
Series 2007-8 Class 3A1
7.250% due 09/25/37 | | 857 | | 581 |
Lehman XS Trust (Ê)
Series 2007-7N Class 1A2
0.471% due 06/25/47 | | 868 | | 300 |
MASTR Alternative Loans Trust
Series 2003-4 Class B1 (Ê)
5.707% due 06/25/33 | | 165 | | 106 |
Russell Investment Funds
Core Bond Fund
Schedule of Investments, continued — December 31, 2009
Amounts in thousands (except share amounts)
| | | | |
| | | Principal
Amount ($)
or Shares | | Market
Value
$ |
| | | | |
Series 2004-10 Class 5A6
5.750% due 09/25/34 | | 168 | | 161 |
MASTR Asset Securitization Trust (Ê)
Series 2003-7 Class 4A35
0.631% due 09/25/33 | | 95 | | 89 |
Series 2004-4 Class 2A2
0.681% due 04/25/34 | | 39 | | 36 |
Mellon Residential Funding Corp. (Ê)
Series 2000-TBC Class A1
0.719% due 06/15/30 | | 141 | | 119 |
Merrill Lynch Floating Trust (Ê)(Þ)
Series 2006-1 Class A1
0.303% due 06/15/22 | | 554 | | 500 |
Merrill Lynch Mortgage Investors, Inc. (Ê)
Series 2005-A10 Class A
0.441% due 02/25/36 | | 86 | | 59 |
Merrill Lynch/Countrywide Commercial Mortgage Trust
Series 2007-6 Class A4
5.485% due 03/12/51 | | 100 | | 81 |
Series 2007-7 Class A4
5.749% due 06/12/50 | | 1,160 | | 972 |
Series 2007-9 Class AM
5.856% due 09/12/49 | | 215 | | 154 |
MLCC Mortgage Investors, Inc. (Ê)
Series 2004-HB1 Class A2
1.326% due 04/25/29 | | 29 | | 21 |
Series 2005-3 Class 5A
0.481% due 11/25/35 | | 53 | | 32 |
Morgan Stanley Capital I
Series 2005-HQ6 Class A4A
4.989% due 08/13/42 | | 740 | | 716 |
Series 2005-IQ1 Class AAB
5.178% due 09/15/42 | | 415 | | 423 |
Series 2006-HQ1 Class A4
5.328% due 11/12/41 | | 130 | | 122 |
Series 2006-HQ1 Class AM
5.360% due 11/12/41 | | 215 | | 177 |
Series 2006-HQ9 Class A4
5.731% due 07/12/44 | | 295 | | 289 |
Series 2007-IQ1 Class A4
5.809% due 12/12/49 | | 320 | | 273 |
Prime Mortgage Trust (Ê)
Series 2004-CL1 Class 1A2
0.631% due 02/25/34 | | 24 | | 22 |
Residential Accredit Loans, Inc.
Series 2004-QS5 Class A6 (Ê)
0.831% due 04/25/34 | | 43 | | 32 |
Series 2004-QS8 Class A4 (Ê)
0.631% due 06/25/34 | | 181 | | 155 |
Series 2005-QA8 Class NB3 (Ê)
5.474% due 07/25/35 | | 192 | | 145 |
Series 2005-QO5 Class A1 (Ê)
1.544% due 01/25/46 | | 1,944 | | 1,040 |
Series 2005-QS1 Class 2A3
5.750% due 09/25/35 | | 517 | | 397 |
Series 2006-QS6 Class 1A13
6.000% due 06/25/36 | | 199 | | 153 |
| | | | |
| | | Principal
Amount ($)
or Shares | | Market
Value
$ |
Series 2007-QH9 Class A1 (Ê)
6.506% due 11/25/37 | | 907 | | 422 |
Series 2007-QO4 Class A1 (Ê)
0.431% due 05/25/47 | | 1,577 | | 821 |
Residential Asset Securitization Trust
Series 2003-A15 Class 1A2 (Ê)
0.681% due 02/25/34 | | 220 | | 195 |
Series 2005-A10 Class A3
5.500% due 09/25/35 | | 425 | | 346 |
Series 2007-A5 Class 2A3
6.000% due 05/25/37 | | 100 | | 74 |
Residential Funding Mortgage Securities I (Ê)
Series 2003-S5 Class 1A2
0.681% due 11/25/18 | | 108 | | 107 |
Series 2003-S14 Class A5
0.631% due 07/25/18 | | 120 | | 97 |
Series 2003-S20 Class 1A7
0.731% due 12/25/33 | | 7 | | 7 |
Series 2005-SA4 Class 2A1
5.210% due 09/25/35 | | 526 | | 426 |
Series 2006-SA4 Class 2A1
6.087% due 11/25/36 | | 340 | | 247 |
Sequoia Mortgage Trust (Ê)
Series 2001-5 Class A
0.583% due 10/19/26 | | 52 | | 39 |
Structured Adjustable Rate Mortgage Loan Trust (Ê) Series 2004-5 Class 3A1
2.963% due 05/25/34 | | 115 | | 100 |
Series 2004-12 Class 3A2
3.249% due 09/25/34 | | 52 | | 43 |
Series 2004-16 Class 3A1
3.049% due 11/25/34 | | 201 | | 163 |
Series 2005-21 Class 7A1
6.005% due 11/25/35 | | 1,048 | | 734 |
Series 2006-12 Class 2A1
5.817% due 01/25/37 | | 706 | | 442 |
Structured Asset Mortgage Investments, Inc. (Ê)
Series 2005-AR5 Class A3
0.483% due 07/19/35 | | 146 | | 120 |
Series 2006-AR2 Class A1
0.461% due 02/25/36 | | 499 | | 280 |
Series 2006-AR8 Class A1A
0.431% due 10/25/36 | | 686 | | 360 |
Structured Asset Securities Corp.
Series 2004-21X Class 1A3
4.440% due 12/25/34 | | 39 | | 39 |
Thornburg Mortgage Securities Trust (Ê)
Series 2003-2 Class A1
0.911% due 04/25/43 | | 58 | | 50 |
Series 2006-5 Class A1
0.351% due 10/25/46 | | 695 | | 681 |
Series 2006-6 Class A1
0.341% due 11/25/46 | | 95 | | 92 |
Wachovia Bank Commercial Mortgage Trust (Ê)
Series 2005-C21 Class A4
5.209% due 10/15/44 | | 1,000 | | 995 |
Russell Investment Funds
Core Bond Fund
Schedule of Investments, continued — December 31, 2009
Amounts in thousands (except share amounts)
| | | | |
| | | Principal
Amount ($)
or Shares | | Market
Value
$ |
| | | | |
Washington Mutual Alternative Mortgage Pass-Through Certificates
Series 2005-4 Class CB11
5.500% due 06/25/35 | | 90 | | 67 |
Series 2007-OA1 Class 2A (Ê)
0.951% due 12/25/46 | | 657 | | 277 |
Washington Mutual Mortgage Pass Through Certificates (Ê)
Series 2003-S9 Class A2
0.781% due 10/25/33 | | 169 | | 166 |
Series 2004-AR3 Class A2
3.136% due 06/25/34 | | 112 | | 103 |
Series 2005-AR1 Class 1A1
4.826% due 10/25/35 | | 165 | | 156 |
Series 2005-AR1 Class A1A1
0.521% due 10/25/45 | | 31 | | 22 |
0.491% due 11/25/45 | | 779 | | 558 |
0.501% due 12/25/45 | | 377 | | 255 |
Series 2005-AR6 Class B3 (Å)
0.891% due 04/25/45 | | 194 | | 8 |
Series 2006-AR1 Class 3A1A
1.464% due 09/25/46 | | 674 | | 354 |
Series 2006-AR2 Class 1A1
5.283% due 03/25/37 | | 603 | | 473 |
Series 2007-HY3 Class 4B1
5.314% due 03/25/37 | | 124 | | 11 |
Series 2007-HY4 Class 1A1
5.458% due 04/25/37 | | 128 | | 88 |
Wells Fargo Mortgage Backed Securities Trust
Series 2006-2 Class 2A3
5.500% due 03/25/36 | | 319 | | 277 |
Series 2006-AR2 Class 2A1
4.950% due 03/25/36 | | 243 | | 201 |
Series 2007-8 Class 1A16
6.000% due 07/25/37 | | 282 | | 228 |
Series 2007-10 Class 2A5
6.250% due 07/25/37 | | 125 | | 106 |
| | | | |
| | | | 153,254 |
| | | | |
| | |
| Municipal Bonds - 1.0% | | | | |
Chicago Transit Authority Revenue Bonds
6.899% due 12/01/40 | | 400 | | 424 |
Illinois Municipal Electric Agency Revenue Bonds
6.832% due 02/01/35 | | 100 | | 102 |
Los Angeles Unified School District General Obligation Unlimited (µ)
4.500% due 07/01/22 | | 400 | | 406 |
New York City Municipal Water Finance Authority Revenue Bonds
4.750% due 06/15/37 | | 400 | | 400 |
North Carolina Turnkpike Authority Revenue Bonds
6.700% due 01/01/39 | | 100 | | 103 |
Public Power Generation Agency Revenue Bonds
7.242% due 01/01/41 | | 100 | | 97 |
| | | | | |
| | | Principal
Amount ($)
or Shares | | Market
Value
$ |
State of California General Obligation Unlimited
7.500% due 04/01/34 | | | 425 | | 413 |
5.650% due 04/01/39 (Ê) | | | 100 | | 102 |
7.550% due 04/01/39 | | | 975 | | 945 |
State of Louisiana Revenue Bonds (Ê)
3.000% due 05/01/43 | | | 400 | | 397 |
University of California Revenue Bonds
6.270% due 05/15/31 | | | 400 | | 400 |
| | | | | |
| | | | | 3,789 |
| | | | | |
| | |
| Non-US Bonds - 0.5% | | | | | |
Federative Republic of Brazil
12.500% due 01/05/22 | | BRL | 300 | | 195 |
10.250% due 01/10/28 | | BRL | 1,400 | | 804 |
Fortis Bank Nederland Holding NV
3.000% due 04/17/12 | | EUR | 200 | | 293 |
Hellas Telecommunications Luxembourg V (Ê)
Series REGS
6.715% due 10/15/12 | | EUR | 125 | | 147 |
Impress Holdings BV (Ê)
Series REGS
3.867% due 09/15/13 | | EUR | 125 | | 169 |
Mexico Government International Bond
6.050% due 01/11/40 | | MXN | 260 | | 250 |
Societe Financement de l’Economie Francaise
2.125% due 05/20/12 | | EUR | 100 | | 144 |
UBS AG (Ê)(Å)
5.850% due 12/31/17 | | EUR | 270 | | 71 |
| | | | | |
| | | | | 2,073 |
| | | | | |
|
| United States Government Agencies - 1.6% |
Federal Home Loan Banks
0.500% due 05/10/11 | | | 980 | | 981 |
4.500% due 09/13/19 (Ñ) | | | 1,100 | | 1,121 |
Federal Home Loan Mortgage Corp.
5.300% due 12/01/15 | | | 600 | | 663 |
Freddie Mac
4.500% due 04/02/14 | | | 800 | | 860 |
5.000% due 11/13/14 | | | 2,200 | | 2,406 |
Tennessee Valley Authority
5.500% due 07/18/17 | | | 200 | | 218 |
| | | | | |
| | | | | 6,249 |
| | | | | |
|
| United States Government Treasuries - 6.9% |
United States Treasury Inflation Indexed Bonds
1.625% due 01/15/15 (Ñ) | | | 679 | | 706 |
2.000% due 01/15/16 | | | 1,267 | | 1,338 |
2.500% due 07/15/16 (Ñ) | | | 428 | | 466 |
2.000% due 01/15/26 (Ñ) | | | 109 | | 109 |
1.750% due 01/15/28 (Ñ) | | | 3,181 | | 3,051 |
United States Treasury Principal
Principal Only STRIP
Zero coupon due 05/15/20 (Ñ) | | | 600 | | 387 |
Russell Investment Funds
Core Bond Fund
Schedule of Investments, continued — December 31, 2009
Amounts in thousands (except share amounts)
| | | | |
| | | Principal
Amount ($)
or Shares | | Market
Value
$ |
| | | | |
Zero coupon due 08/15/20 | | 1,400 | | 891 |
Zero coupon due 05/15/21 | | 100 | | 61 |
Zero coupon due 11/15/21 (Ñ) | | 1,938 | | 1,141 |
Zero coupon due 11/15/26 | | 1,100 | | 487 |
Zero coupon due 11/15/27 | | 1,130 | | 475 |
United States Treasury Notes
0.700% due 08/31/11 (Ñ) | | 6,700 | | 6,703 |
2.625% due 06/30/14 (Ñ) | | 4,010 | | 4,039 |
2.375% due 12/31/14 | | 800 | | 798 |
2.750% due 11/30/16 | | 900 | | 867 |
3.750% due 11/15/18 | | 1,290 | | 1,290 |
8.000% due 11/15/21 | | 90 | | 123 |
5.375% due 02/15/31 (Ñ) | | 1,000 | | 1,105 |
4.375% due 02/15/38 (Ñ) | | 500 | | 480 |
3.500% due 02/15/39 (Ñ) | | 400 | | 328 |
4.250% due 05/15/39 (Ñ) | | 400 | | 375 |
4.375% due 11/15/39 (Ñ) | | 2,700 | | 2,584 |
| | | | |
| | | | 27,804 |
| | | | |
| | |
Total Long-Term Investments
(cost $345,624) | | | | 339,173 |
| | | | |
| | |
| Common Stocks - 0.0% | | | | |
| Financial Services - 0.0% | | | | |
CIT Group, Inc. (Æ) | | 2,410 | | 66 |
| | | | |
| | |
Total Common Stocks
(cost $26) | | | | 66 |
| | | | |
| | |
| Preferred Stocks - 0.2% | | | | |
| Consumer Discretionary - 0.1% | | |
Motors Liquidation Co. | | 80,000 | | 456 |
| | | | |
| Financial Services - 0.1% | | | | |
DG Funding Trust (Å)(Æ) | | 49 | | 434 |
| | | | |
| | |
Total Preferred Stocks
(cost $767) | | | | 890 |
| | | | |
| |
| Short-Term Investments - 13.7% | | |
American Electric Power Co., Inc.
Series C
5.375% due 03/15/10 | | 35 | | 35 |
COX Communications, Inc.
4.625% due 01/15/10 | | 350 | | 350 |
Enterprise Products Operating LLC
Series K
4.950% due 06/01/10 | | 125 | | 127 |
Federal Home Loan Bank Discount Notes
0.119% due 01/04/10 (ç)(ž) | | 1,000 | | 1,000 |
0.078% due 01/08/10 (ç)(ž) | | 2,000 | | 2,000 |
0.085% due 01/15/10 (ç)(ž) | | 1,000 | | 1,000 |
Principal Only STRIP
Zero coupon due 02/05/10 (ç)(ž) | | 850 | | 850 |
0.050% due 02/10/10 (ç)(ž) | | 1,455 | | 1,455 |
0.050% due 02/12/10 (ç)(ž) | | 3,545 | | 3,545 |
0.320% due 02/17/10 (ç)(ž) | | 2,000 | | 2,000 |
0.073% due 02/24/10 | | 100 | | 100 |
| | | | |
| | | Principal
Amount ($)
or Shares | | Market
Value
$ |
Federal National Mortgage Association Discount Notes (ç)(ž)
0.105% due 01/13/10 | | 1,000 | | 1,000 |
0.100% due 02/04/10 | | 1,000 | | 1,000 |
Ford Motor Credit Co. LLC
7.875% due 06/15/10 | | 200 | | 203 |
Freddie Mac Discount Notes (ç)(ž)
0.065% due 02/19/10 | | 500 | | 500 |
0.630% due 02/23/10 | | 370 | | 370 |
Goldman Sachs Group, Inc. (The)
4.500% due 06/15/10 | | 125 | | 127 |
HSBC Finance Corp. (Ê)
0.524% due 05/10/10 | | 100 | | 100 |
KeyBank NA (Ê)
Series BKNT
2.507% due 06/02/10 | | 300 | | 302 |
Korea Development Bank (Ê)
0.391% due 04/06/10 | | 900 | | 895 |
Lehman Brothers Holdings, Inc. (Ø)
2.951% due 05/25/10 | | 200 | | 39 |
Metropolitan Life Global Funding I (Ê)(Þ)
0.313% due 05/17/10 | | 400 | | 400 |
Morgan Stanley
2.373% due 05/14/10 (Ê) | | 400 | | 403 |
Series MTN (Ê)
0.374% due 01/15/10 | | 300 | | 300 |
Nationwide Life Global Funding I (Ê)(Þ)
0.470% due 05/19/10 | | 1,300 | | 1,294 |
Nisource Finance Corp.
7.875% due 11/15/10 | | 125 | | 131 |
Rabobank USA Financial Corp.
Zero coupon due 02/04/10 | | 2,305 | | 2,305 |
Russell U.S. Cash Management Fund (£) | | 20,977,661 | | 20,978 |
SLM Corp. (Ê)
0.442% due 07/26/10 | | 50 | | 49 |
Small Business Administration
Series 2000-P10 Class 1
7.449% due 08/10/10 | | 4 | | 4 |
Sprint Nextel Corp. (Ê)(Ñ)
0.651% due 06/28/10 | | 350 | | 344 |
Sun Life Financial Global Funding, LP (Ê)(Þ)
0.501% due 07/06/10 | | 700 | | 697 |
UBS AG (Ê)
1.198% due 05/05/10 | | 700 | | 701 |
United States Treasury Bills (ç)(ž)
0.005% due 01/07/10 (Ñ) | | 2,000 | | 2,000 |
0.020% due 02/11/10 (§)(Ñ) | | 5,000 | | 5,000 |
0.048% due 02/18/10 (§) | | 115 | | 115 |
0.183% due 04/01/10 (§) | | 8 | | 8 |
0.110% due 05/13/10 (§) | | 110 | | 110 |
United States Treasury Inflation Indexed Bonds (Ñ)
4.250% due 01/15/10 | | 1,927 | | 1,930 |
0.875% due 04/15/10 | | 1,141 | | 1,145 |
| | | | |
| | |
Total Short-Term Investments
(cost $55,030) | | | | 54,912 |
| | | | |
Russell Investment Funds
Core Bond Fund
Schedule of Investments, continued — December 31, 2009
Amounts in thousands (except share amounts)
| | | | | |
| | | Principal
Amount ($)
or Shares | | Market
Value
$ | |
| | | | | |
| Repurchase Agreements - 5.2% | |
Agreement with Citigroup Global Markets and State Street Bank & Co. (Tri-Party) of $13,600 dated December 31, 2009, at 0.01% to be repurchased at $13,602 on January 4, 2010 collateralized by: $15,097 par various United States Mortgage Obligations, valued at $15,210 | | 13,600 | | 13,600 | |
Agreement with Credit Suisse First Boston and State Street Bank & Co. (Tri-Party) of $4,600 dated December 31, 2009, at 0.00% to be repurchased at $4,600 on January 4, 2010 collateralized by: $4,711 par various United States Treasury Obligations, valued at $4,707 | | 4,600 | | 4,600 | |
Agreement with Deutsche Bank Securities, Inc. and State Street Bank (Tri-Party) of $1,500 dated December 21, 2009, at 0.08% to be repurchased at $1,501 on January 5, 2010 collateralized by:
$1,521 par various United States Treasury Obligations, valued at $1,514 | | 1,500 | | 1,500 | |
Agreement with Goldman Sachs & Co. and State Street Bank (Tri-party) of $1,000 dated December 3, 2009, at 0.11% to be repurchased at $1,000 on January 5, 2010 collateralized by:
$1,187 par various United States Mortgage Obligations, valued at $1,219 | | 1,000 | | 1,000 | |
| | | | | |
| |
Total Repurchase Agreements
(cost $20,700) | | 20,700 | |
| | | | | |
| | |
| Other Securities - 7.3% | | | | | |
State Street Securities Lending Quality Trust (×) | | 29,452,478 | | 29,302 | |
| | | | | |
| | |
Total Other Securities
(cost $29,452) | | | | 29,302 | |
| | | | | |
| |
Total Investments - 111.1%
(identified cost $451,599) | | 445,043 | |
| |
Other Assets and Liabilities,
Net - (11.1%) | | (44,474 | ) |
| | | | | |
| | |
| Net Assets - 100.0% | | | | 400,569 | |
| | | | | |
See accompanying notes which are an integral part of the financial statements.
Russell Investment Funds
Core Bond Fund
Schedule of Investments, continued — December 31, 2009
Amounts in thousands (except contracts)
| | | | | | | | | | | |
| Futures Contracts | | Number of
Contracts | | Notional
Amount | | Expiration
Date | | Unrealized
Appreciation
(Depreciation)
$ | |
| | | | | | | | | | | |
| | | | | | | | | | | |
| Long Positions | | | | | | | | | | | |
Euribor Futures (Germany) | | 6 | | EUR | | 1,489 | | 03/10 | | 3 | |
Euro-Bobl Futures (Germany) | | 52 | | EUR | | 6,236 | | 03/10 | | (119 | ) |
Eurodollar Futures (CME) | | 39 | | USD | | 9,724 | | 01/10 | | 4 | |
Eurodollar Futures (CME) | | 91 | | USD | | 22,669 | | 03/10 | | 187 | |
Eurodollar Futures (CME) | | 99 | | USD | | 24,582 | | 06/10 | | 56 | |
Eurodollar Futures (CME) | | 4 | | USD | | 989 | | 09/10 | | 12 | |
Eurodollar Futures (CME) | | 18 | | USD | | 4,431 | | 12/10 | | 25 | |
Three Month Short Sterling Interest Rate Futures (UK) | | 2 | | GBP | | 248 | | 03/10 | | 1 | |
Three Month Short Sterling Interest Rate Futures (UK) | | 4 | | GBP | | 495 | | 06/10 | | 3 | |
Three Month Short Sterling Interest Rate Futures (UK) | | 4 | | GBP | | 493 | | 09/10 | | 3 | |
United States Treasury 2 Year Notes | | 126 | | USD | | 27,250 | | 03/10 | | (138 | ) |
United States Treasury 5 Year Notes | | 109 | | USD | | 12,468 | | 03/10 | | (230 | ) |
United States Treasury 10 Year Notes | | 242 | | USD | | 27,940 | | 03/10 | | (768 | ) |
United States Treasury 30 Year Bond | | 22 | | USD | | 2,538 | | 03/10 | | (56 | ) |
| | | | | |
| Short Positions | | | | | | | | | | | |
Euro-Bund Futures (Germany) | | 2 | | EUR | | 1 | | 02/10 | | — | |
Euro-Bobl Futures (Germany) | | 2 | | EUR | | 231 | | 03/10 | | — | |
Long Gilt Bond (UK) | | 31 | | GBP | | 3,548 | | 03/10 | | 91 | |
United States Treasury 5 Year Notes | | 11 | | USD | | 1,258 | | 03/10 | | 12 | |
| | | | | | | | | | | |
| | | | | |
Total Unrealized Appreciation (Depreciation) on Open Futures Contracts | | | | | | | | | | (914 | ) |
| | | | | | | | | | | |
See accompanying notes which are an integral part of the financial statements.
Russell Investment Funds
Core Bond Fund
Schedule of Investments, continued — December 31, 2009
| | | | | | | |
Options Written
(Number of Contracts) | | Notional
Amount | | Market
Value
$ | |
| | | | | | | |
| Swaptions | | | | | | | |
(Fund Receives/Fund Pays)
USD Three Month LIBOR/USD
2.800%
Feb 2010 0.00 Call (1) | | | | 1,100 | | — | |
USD Three Month LIBOR/USD
3.250%
Feb 2010 0.00 Call (3) | | | | 2,500 | | (1 | ) |
USD Three Month LIBOR/USD
2.750%
April 2010 0.00 Call (1) | | | | 100 | | — | |
USD Three Month LIBOR/USD
3.250%
April 2010 0.00 Call (4) | | | | 2,000 | | (4 | ) |
USD 4.000%/USD
Three Month LIBOR
Feb 2010 0.00 Put (3) | | | | 1,500 | | (25 | ) |
USD 4.250%/USD
Three Month LIBOR
Apr 2010 0.00 Put (5) | | | | 4,400 | | (83 | ) |
USD 5.000%/USD
Three Month LIBOR
Apr 2010 0.00 Put (1) | | | | 1,000 | | (5 | ) |
USD 5.000%/USD
Three Month LIBOR
Jul 2010 0.00 Put (2) | | | | 4,000 | | (7 | ) |
USD 5.500%/USD
Three Month LIBOR
Aug 2010 0.00 Put (3) | | | | 17,000 | | (44 | ) |
USD 6.000%/USD
Three Month LIBOR
Aug 2010 0.00 Put (1) | | | | 2,000 | | (11 | ) |
USD 10.000%/USD
Three Month LIBOR
Jul 2012 0.00 Put (2) | | | | 10,200 | | (56 | ) |
| | | |
| United States Treasury Notes | | | | | | | |
10 Year Futures
Jan 2010 119.00 Call (11) | | USD | | 11 | | — | |
Feb 2010 120.00 Call (12) | | USD | | 12 | | (1 | ) |
Feb 2010 121.00 Call (4) | | USD | | 4 | | — | |
Jan 2010 116.00 Put (35) | | USD | | 35 | | (39 | ) |
| | | | | | | |
| | | |
Total Liability for Options Written
(premiums received $484) | | | | | | (276 | ) |
| | | | | | | |
See accompanying notes which are an integral part of the financial statements.
Russell Investment Funds
Core Bond Fund
Schedule of Investments, continued — December 31, 2009
Amounts in thousands
| | | | | | | | | | | | | |
| Foreign Currency Exchange Contracts | |
Counterparty | | Amount
Sold | | Amount
Bought | | Settlement
Date | | Unrealized
Appreciation
(Depreciation)
$ | |
| | | | | | | | | | | | | |
Barclays Bank PLC | | USD | | 2 | | AUD | | 2 | | 01/11/10 | | — | |
Barclays Bank PLC | | USD | | 404 | | JPY | | 36,144 | | 03/17/10 | | (16 | ) |
Barclays Bank PLC | | USD | | 52 | | MYR | | 180 | | 02/12/10 | | — | |
Barclays Bank PLC | | USD | | 637 | | NOK | | 3,671 | | 03/17/10 | | (5 | ) |
Barclays Bank PLC | | CAD | | 620 | | EUR | | 403 | | 03/17/10 | | (15 | ) |
Barclays Bank PLC | | EUR | | 119 | | NZD | | 241 | | 03/17/10 | | 3 | |
BNP Paribas | | JPY | | 11 | | USD | | — | | 01/25/10 | | — | |
Citibank | | USD | | 237 | | AUD | | 256 | | 01/11/10 | | (7 | ) |
Citibank | | USD | | 206 | | CNY | | 1,400 | | 01/12/10 | | (1 | ) |
Citibank | | USD | | 82 | | EUR | | 57 | | 01/26/10 | | — | |
Citibank | | USD | | 371 | | EUR | | 252 | | 03/17/10 | | (10 | ) |
Citibank | | USD | | 42 | | GBP | | 26 | | 01/13/10 | | — | |
Citibank | | USD | | 334 | | KRW | | 393,678 | | 02/11/10 | | 4 | |
Citibank | | EUR | | 294 | | CAD | | 455 | | 03/17/10 | | 14 | |
Citibank | | EUR | | 20 | | USD | | 29 | | 01/26/10 | | — | |
Citibank | | EUR | | 42 | | USD | | 60 | | 01/26/10 | | — | |
Citibank | | EUR | | 806 | | USD | | 1,153 | | 03/17/10 | | (2 | ) |
Citibank | | GBP | | 126 | | USD | | 210 | | 01/13/10 | | 6 | |
Citibank | | JPY | | 27,340 | | CAD | | 317 | | 03/17/10 | | 9 | |
Citibank | | JPY | | 21,906 | | USD | | 239 | | 03/17/10 | | 4 | |
Citibank | | JPY | | 25,922 | | USD | | 289 | | 03/17/10 | | 11 | |
Credit Suisse First Boston | | USD | | 1,075 | | CAD | | 1,130 | | 03/17/10 | | 5 | |
Credit Suisse First Boston | | EUR | | 79 | | AUD | | 128 | | 03/17/10 | | 1 | |
Credit Suisse First Boston | | EUR | | 521 | | USD | | 767 | | 03/17/10 | | 20 | |
Credit Suisse First Boston | | EUR | | 393 | | USD | | 577 | | 03/17/10 | | 13 | |
Credit Suisse First Boston | | JPY | | 17,849 | | CHF | | 208 | | 03/17/10 | | 9 | |
Deutsche Bank | | USD | | 36 | | EUR | | 25 | | 01/26/10 | | — | |
Deutsche Bank | | USD | | 433 | | EUR | | 297 | | 03/17/10 | | (7 | ) |
Deutsche Bank | | USD | | 420 | | JPY | | 37,725 | | 03/17/10 | | (15 | ) |
Deutsche Bank | | USD | | 103 | | KRW | | 122,616 | | 02/11/10 | | 2 | |
Deutsche Bank | | USD | | 53 | | TWD | | 1,701 | | 01/13/10 | | — | |
Deutsche Bank | | EUR | | 192 | | USD | | 287 | | 01/13/10 | | 12 | |
Goldman Sachs | | USD | | 48 | | GBP | | 30 | | 01/13/10 | | — | |
Goldman Sachs | | USD | | 59 | | GBP | | 37 | | 01/13/10 | | 1 | |
HSBC | | USD | | 33 | | BRL | | 57 | | 02/02/10 | | — | |
HSBC | | GBP | | 170 | | USD | | 282 | | 01/20/10 | | 6 | |
JP Morgan | | USD | | 151 | | CAD | | 161 | | 01/21/10 | | 3 | |
JP Morgan | | USD | | 54 | | EUR | | 38 | | 01/26/10 | | — | |
JP Morgan | | USD | | — | | JPY | | — | | 01/04/10 | | — | |
JP Morgan | | USD | | — | | JPY | | 11 | | 01/25/10 | | — | |
JP Morgan | | USD | | 83 | | SGD | | 115 | | 02/11/10 | | (1 | ) |
JP Morgan | | BRL | | 238 | | USD | | 133 | | 02/02/10 | | (3 | ) |
Morgan Stanley | | NZD | | 319 | | EUR | | 157 | | 03/17/10 | | (5 | ) |
Royal Bank of Canada | | USD | | 119 | | AUD | | 134 | | 03/17/10 | | — | |
Royal Bank of Canada | | USD | | 33 | | BRL | | 57 | | 02/02/10 | | — | |
Royal Bank of Canada | | CAD | | 457 | | EUR | | 293 | | 03/17/10 | | (17 | ) |
Royal Bank of Canada | | EUR | | 83 | | USD | | 119 | | 03/17/10 | | — | |
Royal Bank of Scotland | | AUD | | 3 | | USD | | 3 | | 01/11/10 | | — | |
Royal Bank of Scotland | | EUR | | 493 | | USD | | 732 | | 02/18/10 | | 25 | |
Royal Bank of Scotland | | EUR | | 197 | | NZD | | 401 | | 03/17/10 | | 7 | |
Royal Bank of Scotland | | GBP | | 439 | | EUR | | 484 | | 03/17/10 | | (15 | ) |
State Street Bank and Trust Company | | USD | | 1,022 | | NZD | | 1,416 | | 03/17/10 | | 1 | |
State Street Bank and Trust Company | | EUR | | 119 | | CAD | | 183 | | 03/17/10 | | 5 | |
See accompanying notes which are an integral part of the financial statements.
Russell Investment Funds
Core Bond Fund
Schedule of Investments, continued — December 31, 2009
Amounts in thousands
| | | | | | | | | | | | | |
| Foreign Currency Exchange Contracts | |
Counterparty | | Amount
Sold | | Amount
Bought | | Settlement
Date | | Unrealized
Appreciation
(Depreciation)
$ | |
| | | | | | | | | | | | | |
State Street Bank and Trust Company | | EUR | | 199 | | SEK | | 2,075 | | 03/17/10 | | 5 | |
State Street Bank and Trust Company | | NZD | | 426 | | EUR | | 209 | | 03/17/10 | | (8 | ) |
UBS | | USD | | 56 | | MXN | | 754 | | 02/16/10 | | 1 | |
UBS | | AUD | | 328 | | EUR | | 201 | | 03/17/10 | | (5 | ) |
UBS | | BRL | | 82 | | USD | | 44 | | 01/19/10 | | (3 | ) |
UBS | | CHF | | 313 | | EUR | | 209 | | 03/17/10 | | (3 | ) |
UBS | | EUR | | 197 | | CAD | | 304 | | 03/17/10 | | 8 | |
UBS | | EUR | | 861 | | USD | | 1,250 | | 01/26/10 | | 15 | |
UBS | | EUR | | 168 | | USD | | 240 | | 03/17/10 | | (1 | ) |
UBS | | EUR | | 396 | | USD | | 578 | | 03/17/10 | | 11 | |
UBS | | GBP | | 150 | | USD | | 239 | | 03/17/10 | | (3 | ) |
UBS | | JPY | | 8,171 | | EUR | | 63 | | 03/17/10 | | 2 | |
UBS | | NZD | | 280 | | EUR | | 137 | | 03/17/10 | | (5 | ) |
UBS | | NZD | | 280 | | EUR | | 137 | | 03/17/10 | | — | |
Westpac Banking Corporation | | USD | | 1,006 | | AUD | | 1,107 | | 03/17/10 | | (19 | ) |
Westpac Banking Corporation | | EUR | | 395 | | USD | | 575 | | 03/17/10 | | 9 | |
Westpac Banking Corporation | | EUR | | 602 | | USD | | 864 | | 03/17/10 | | 2 | |
Westpac Banking Corporation | | JPY | | 38,196 | | USD | | 433 | | 03/17/10 | | 24 | |
| | | | | | | | | | | | | |
| |
Total Unrealized Appreciation (Depreciation) on Open Foreign Currency Exchange Contracts | | 72 | |
| | | | | | | | | | | | | |
| | | | | | | | | | | | | | | | |
| Credit Default Swap Contracts | | | | | | | | | | | | | | | | |
| Corporate Issues | | | | | | | | | | | | | | | | |
Reference
Entity | | Counterparty | | Implied
Credit
Spread | | Notional
Amount | | Fund (Pays)/
Receives
Fixed Rate | | | Termination
Date | | Market
Value
$ | |
Arrow Electronics, Inc. | | Citigroupglobal Markets, Inc. | | 0.700% | | USD | | 135 | | (0.820% | ) | | 03/20/14 | | (1 | ) |
Centex Corporation | | JP Morgan | | 0.920% | | USD | | 325 | | (4.400% | ) | | 12/20/13 | | (43 | ) |
Darden Restaurants, Inc. | | Deutsche Bank | | 0.870% | | USD | | 400 | | (2.250% | ) | | 03/20/14 | | (22 | ) |
DR Horton, Inc. | | Citibank | | 2.380% | | USD | | 100 | | (1.000% | ) | | 09/20/16 | | 8 | |
DR Horton, Inc. | | Deutsche Bank | | 2.380% | | USD | | 80 | | (1.000% | ) | | 09/20/16 | | 6 | |
DR Horton, Inc. | | Goldman Sachs | | 2.380% | | USD | | 80 | | (1.000% | ) | | 09/20/16 | | 6 | |
Ford Motor Credit Co. | | Barclays Bank PLC | | 3.687% | | USD | | 1,000 | | 6.150% | | | 09/20/12 | | 66 | |
Ford Motor Credit Co. | | Goldman Sachs | | 3.687% | | USD | | 600 | | 5.850% | | | 09/20/12 | | 35 | |
Gaz Capital for Gazprom | | Barclays Bank PLC | | 2.258% | | USD | | 300 | | 1.600% | | | 12/20/12 | | (6 | ) |
Gaz Capital for Gazprom | | Morgan Stanley | | 2.290% | | USD | | 100 | | 2.180% | | | 02/20/13 | | — | |
Gaz Capital for Gazprom | | Morgan Stanley | | 2.290% | | USD | | 1,000 | | 2.480% | | | 02/20/13 | | 14 | |
GE Capital Corp. | | Citibank | | 1.590% | | USD | | 200 | | 4.000% | | | 12/20/13 | | 18 | |
GE Capital Corp. | | Deutsche Bank | | 1.590% | | USD | | 100 | | 4.900% | | | 12/20/13 | | 12 | |
Hewlett-Packard Co. | | Citigroupglobal Markets, Inc. | | 0.270% | | USD | | 135 | | (0.720% | ) | | 03/20/14 | | (2 | ) |
K B Home, Inc. | | Citibank | | 3.300% | | USD | | 100 | | (1.000% | ) | | 09/20/16 | | 12 | |
Kohl’s, Inc. | | Deutsche Bank | | 0.720% | | USD | | 125 | | (1.000% | ) | | 12/20/14 | | (2 | ) |
Kohl’s, Inc. | | JP Morgan | | 0.720% | | USD | | 125 | | (1.000% | ) | | 12/20/14 | | (2 | ) |
Lowe’s Companies, Inc. | | Citigroupglobal Markets, Inc. | | 0.500% | | USD | | 340 | | (1.450% | ) | | 03/20/14 | | (15 | ) |
Mexico Government International Bond | | Morgan Stanley | | 0.851% | | USD | | 100 | | 0.750% | | | 01/20/12 | | — | |
Nordstrom, Inc. | | Deutsche Bank | | 0.790% | | USD | | 215 | | (2.100% | ) | | 03/20/14 | | (12 | ) |
Pulte Homes, Inc. | | Goldman Sachs | | 1.950% | | USD | | 725 | | (1.000% | ) | | 09/20/16 | | 40 | |
Pulte Homes, Inc. | | JP Morgan | | 1.714% | | USD | | 1,000 | | (3.870% | ) | | 03/20/14 | | (86 | ) |
SLM Corp. | | Citibank | | 4.675% | | USD | | 200 | | 4.850% | | | 03/20/13 | | (1 | ) |
Target Corp. | | Credit Suisse First Boston | | 0.520% | | USD | | 125 | | (1.000% | ) | | 12/20/14 | | (2 | ) |
Target Corp. | | Deutsche Bank | | 0.520% | | USD | | 125 | | (1.000% | ) | | 12/20/14 | | (2 | ) |
See accompanying notes which are an integral part of the financial statements.
Russell Investment Funds
Core Bond Fund
Schedule of Investments, continued — December 31, 2009
Amounts in thousands
| | | | | | | | | | | | | | | | |
| Credit Default Swap Contracts | | | | | | | | | | | | | | | | |
| Corporate Issues | | | | | | | | | | | | | | | | |
Reference
Entity | | Counterparty | | Implied
Credit
Spread | | Notional
Amount | | Fund (Pays)/
Receives
Fixed Rate | | | Termination
Date | | Market
Value $ | |
| | | | | | | | | | | | | | | | |
The Home Depot, Inc. | | Citigroupglobal Markets, Inc. | | 0.500% | | USD | | 340 | | (3.250% | ) | | 03/20/14 | | (40 | ) |
Toll Brothers, Inc. | | Credit Suisse First Boston | | 1.590% | | USD | | 255 | | (1.000% | ) | | 09/20/16 | | 9 | |
United Kingdom Gilt | | Deutsche Bank | | 0.765% | | USD | | 300 | | 1.000% | | | 12/20/14 | | 2 | |
United Kingdom Gilt | | Morgan Stanley | | 0.765% | | USD | | 100 | | 1.000% | | | 12/20/14 | | 1 | |
| | | | | | | | | | | | | | | | |
| | | | |
Total Market Value of Open Corporate Issue Credit Default Swap Contracts Premiums Paid (Received) - $46 | | | | | | | | | (7 | ) |
| | | | | | | | | | | | | | | | |
| | | | | | | | | | | | | | |
| Credit Indices | |
Reference
Entity | | Counterparty | | Notional
Amount | | Fund (Pays)/
Receives
Fixed Rate | | | Termination
Date | | Market
Value
$ | |
| | | | | | | | | | | | | | |
ABX - HE Index for Sub-Prime Home Equity Sector | | Barclays Bank PLC | | USD | | 1,300 | | 0.760% | | | 01/25/38 | | (809 | ) |
ABX - HE Index for Sub-Prime Home Equity Sector | | Citibank | | USD | | 611 | | 0.170% | | | 05/25/46 | | (544 | ) |
ABX - HE Index for Sub-Prime Home Equity Sector | | JP Morgan | | USD | | 1,300 | | 0.090% | | | 08/25/37 | | (849 | ) |
CMBX AJ Index | | Bank of America | | USD | | 100 | | (0.840% | ) | | 10/12/52 | | 24 | |
CMBX AJ Index | | Barclays Bank PLC | | USD | | 340 | | (0.840% | ) | | 10/12/52 | | 81 | |
CMBX AJ Index | | Barclays Bank PLC | | USD | | 360 | | (0.840% | ) | | 10/12/52 | | 87 | |
CMBX AJ Index | | Credit Suisse First Boston | | USD | | 2,050 | | (0.840% | ) | | 10/12/52 | | 497 | |
Dow Jones CDX Index | | Bank of America | | USD | | 1,200 | | (1.000% | ) | | 12/20/14 | | (8 | ) |
Dow Jones CDX Index | | Deutsche Bank | | USD | | 772 | | 0.708% | | | 12/20/12 | | 13 | |
Dow Jones CDX Index | | Deutsche Bank | | USD | | 94 | | (5.000% | ) | | 06/20/14 | | — | |
Dow Jones CDX Index | | Deutsche Bank | | USD | | 1,400 | | (1.000% | ) | | 12/20/14 | | (10 | ) |
Dow Jones CDX Index | | Deutsche Bank | | USD | | 1,000 | | (1.000% | ) | | 12/20/14 | | (7 | ) |
Dow Jones CDX Index | | Deutsche Bank | | USD | | 1,000 | | (1.000% | ) | | 12/20/14 | | (7 | ) |
Dow Jones CDX Index | | Deutsche Bank | | USD | | 1,400 | | (1.000% | ) | | 12/20/14 | | (8 | ) |
Dow Jones CDX Index | | Deutsche Bank | | USD | | 1,000 | | (1.000% | ) | | 12/20/14 | | (5 | ) |
Dow Jones CDX Index | | Goldman Sachs | | USD | | 193 | | 0.548% | | | 12/20/17 | | 3 | |
Dow Jones CDX Index | | JP Morgan | | USD | | 386 | | 0.553% | | | 12/20/17 | | 7 | |
| | | | | | | | | | | | | | |
| | | |
Total Market Value of Open Credit Index Credit Default Swap Contracts Premiums Paid (Received) - ($707) | | | | | | | (1,535 | ) |
| | | | | | | | | | | | | | |
| | | |
Total Market Value of Open Credit Default Swap Contracts Premiums Paid (Received) - ($661) | | | | | | | (1,542 | ) |
| | | | | | | | | | | | | | |
| | | | | | | | | | | | | |
| Interest Rate Swaps Contracts | | | | | | | | | | | |
Counterparty | | Notional
Amount | | Fund Receives | | Fund Pays | | Termination
Date | | Market
Value
$ | |
| | | | | | | | | | | | | |
Bank of America | | USD | | 1,200 | | 3.000% | | Three Month LIBOR | | 12/16/10 | | 29 | |
Barclays Bank PLC | | BRL | | 100 | | 11.360% | | Brazil Interbank Deposit Rate | | 01/04/10 | | — | |
Barclays Bank PLC | | USD | | 144 | | Three Month LIBOR | | 4.524% | | 11/15/21 | | (6 | ) |
Barclays Bank PLC | | USD | | 146 | | Three Month LIBOR | | 4.420% | | 11/15/21 | | (2 | ) |
Barclays Bank PLC | | USD | | 266 | | Three Month LIBOR | | 4.540% | | 11/15/21 | | (10 | ) |
Barclays Bank PLC | | USD | | 530 | | Three Month LIBOR | | 4.633% | | 11/15/21 | | (28 | ) |
BNP Paribas | | EUR | | 500 | | 2.090% | | Consumer Price Index (France) | | 10/15/10 | | 25 | |
BNP Paribas | | EUR | | 300 | | 4.500% | | Six Month EURIBOR | | 03/18/14 | | 43 | |
Citibank | | USD | | 7,400 | | Three Month LIBOR | | 3.250% | | 06/16/17 | | 275 | |
Credit Suisse First Boston | | EUR | | 3,200 | | 3.000% | | Six Month EURIBOR | | 06/16/15 | | (20 | ) |
Credit Suisse First Boston | | USD | | 1,570 | | Three Month LIBOR | | 4.250% | | 06/16/40 | | 100 | |
See accompanying notes which are an integral part of the financial statements.
Russell Investment Funds
Core Bond Fund
Schedule of Investments, continued — December 31, 2009
Amounts in thousands
| | | | | | | | | | | | | |
| Interest Rate Swaps Contracts | | | | | | | | | | | |
Counterparty | | Notional
Amount | | Fund Receives | | Fund Pays | | Termination
Date | | Market
Value
$ | |
| | | | | | | | | | | | | |
Deutsche Bank | | KRW | | 416,000 | | 2.820% | | Korean Interbank Offer Rate | | 01/28/11 | | (3 | ) |
Deutsche Bank | | KRW | | 200,000 | | 3.870% | | Korean Interbank Offer Rate | | 06/12/11 | | — | |
Deutsche Bank | | AUD | | 200 | | 4.500% | | Three Month BBSW | | 06/15/11 | | (1 | ) |
Deutsche Bank | | KRW | | 1,120,000 | | 3.690% | | Korean Interbank Offer Rate | | 06/26/11 | | (4 | ) |
Deutsche Bank | | KRW | | 467,700 | | 3.620% | | Korean Interbank Offer Rate | | 07/06/11 | | (1 | ) |
Deutsche Bank | | KRW | | 781,412 | | 3.630% | | Three Month LIBOR | | 07/07/11 | | (2 | ) |
Deutsche Bank | | BRL | | 2,700 | | 11.740% | | Brazil Interbank Deposit Rate | | 01/02/12 | | 1 | |
Deutsche Bank | | BRL | | 1,400 | | 11.760% | | Brazil Interbank Deposit Rate | | 01/02/12 | | 1 | |
Deutsche Bank | | BRL | | 1,100 | | 11.760% | | Brazil Interbank Deposit Rate | | 01/02/12 | | — | |
Deutsche Bank | | BRL | | 2,000 | | 11.800% | | Brazil Interbank Deposit Rate | | 01/02/12 | | 1 | |
Deutsche Bank | | EUR | | 1,400 | | 3.000% | | Six Month EURIBOR | | 06/16/15 | | (9 | ) |
Deutsche Bank | | USD | | 8,500 | | Three Month LIBOR | | 3.250% | | 06/16/17 | | 316 | |
Deutsche Bank | | USD | | 5,500 | | 3.250% | | Three Month LIBOR | | 06/16/17 | | (205 | ) |
Deutsche Bank | | USD | | 4,800 | | 4.570% | | Three Month LIBOR | | 09/04/17 | | (38 | ) |
Deutsche Bank | | USD | | 2,800 | | Three Month LIBOR | | 4.710% | | 09/04/22 | | 70 | |
Deutsche Bank | | EUR | | 1,350 | | 4.000% | | Six Month EURIBOR | | 06/16/40 | | (4 | ) |
Goldman Sachs | | BRL | | 400 | | 10.840% | | Brazil Interbank Deposit Rate | | 01/02/12 | | (4 | ) |
Goldman Sachs | | USD | | 1,010 | | Six Month LIBOR | | Six Month LIBOR | | 05/25/10 | | 5 | |
Goldman Sachs | | EUR | | 2,900 | | 3.000% | | Six Month EURIBOR | | 06/16/15 | | (18 | ) |
JP Morgan | | KRW | | 405,000 | | 2.830% | | Korean Interbank Offer Rate | | 01/28/11 | | (3 | ) |
JP Morgan | | KRW | | 350,000 | | 3.900% | | Korean Interbank Offer Rate | | 06/15/11 | | — | |
JP Morgan | | KRW | | 1,100,000 | | 3.720% | | Korean Interbank Offer Rate | | 06/22/11 | | (3 | ) |
JP Morgan | | KRW | | 371,651 | | 3.660% | | Korean Interbank Offer Rate | | 07/08/11 | | (1 | ) |
Merrill Lynch | | BRL | | 100 | | 14.765% | | Brazil Interbank Deposit Rate | | 01/02/12 | | 4 | |
Merrill Lynch | | BRL | | 200 | | 0.12948 | | Brazil Interbank Deposit Rate | | 01/04/10 | | 5 | |
Merrill Lynch | | BRL | | 700 | | 11.980% | | Brazil Interbank Deposit Rate | | 01/02/12 | | 6 | |
Merrill Lynch | | BRL | | 800 | | 0.1254 | | Brazil Interbank Deposit Rate | | 01/02/12 | | 7 | |
Morgan Stanley | | BRL | | 400 | | 12.670% | | Brazil Interbank Deposit Rate | | 01/04/10 | | — | |
Morgan Stanley | | USD | | 5,400 | | 3.000% | | Three Month LIBOR | | 12/16/10 | | 129 | |
Royal Bank of Scotland | | USD | | 700 | | 4.000% | | Three Month LIBOR | | 12/16/14 | | 35 | |
Royal Bank of Scotland | | CAD | | 1,500 | | 5.700% | | Canadian Dealer Offer Rate | | 12/18/24 | | (12 | ) |
UBS | | BRL | | 400 | | 12.410% | | Brazil Interbank Deposit Rate | | 01/04/10 | | — | |
UBS | | AUD | | 1,900 | | 4.500% | | Three Month LIBOR | | 06/15/11 | | (11 | ) |
UBS | | BRL | | 800 | | 10.575% | | Brazil Interbank Deposit Rate | | 01/02/12 | | (13 | ) |
UBS | | AUD | | 1,600 | | 6.000% | | Six Month LIBOR | | 09/15/12 | | 11 | |
| | | | | | | | | | | | | |
| |
Total Market Value of Open Interest Rate Swap Contracts Premiums Paid (Received) - $156 | | 665 | |
| | | | | | | | | | | | | |
See accompanying notes which are an integral part of the financial statements.
Russell Investment Funds
Core Bond Fund
Presentation of Portfolio Holdings — December 31, 2009
Amounts in thousands
| | | | | | | | | | | | | | | | | | |
| | | Market Value | | | | |
| Portfolio Summary | | Level 1 | | | Level 2 | | | Level 3 | | Total | | | % of Net
Assets | |
| | | | | | | | | | | | | | | | | | |
Long-Term Investments | | | | | | | | | | | | | | | | | | |
Asset-Backed Securities | | $ | — | | | $ | 21,679 | | | $ | 293 | | $ | 21,972 | | | 5.5 | |
Corporate Bonds and Notes | | | — | | | | 87,049 | | | | — | | | 87,049 | | | 21.7 | |
International Debt | | | — | | | | 35,434 | | | | — | | | 35,434 | | | 8.8 | |
Loan Agreements | | | — | | | | 1,548 | | | | 1 | | | 1,549 | | | 0.4 | |
Mortgage-Backed Securities | | | — | | | | 153,254 | | | | — | | | 153,254 | | | 38.3 | |
Municipal Bonds | | | — | | | | 3,789 | | | | — | | | 3,789 | | | 1.0 | |
Non-US Bonds | | | — | | | | 2,002 | | | | 71 | | | 2,073 | | | 0.5 | |
United States Government Agencies | | | — | | | | 6,249 | | | | — | | | 6,249 | | | 1.6 | |
United States Government Treasuries | | | — | | | | 27,804 | | | | — | | | 27,804 | | | 6.9 | |
Common Stocks | | | 66 | | | | — | | | | — | | | 66 | | | — | * |
Preferred Stocks | | | 456 | | | | — | | | | 434 | | | 890 | | | 0.2 | |
Short-Term Investments | | | — | | | | 54,912 | | | | — | | | 54,912 | | | 13.7 | |
Repurchase Agreements | | | — | | | | 20,700 | | | | — | | | 20,700 | | | 5.2 | |
Other Securities | | | — | | | | 29,302 | | | | — | | | 29,302 | | | 7.3 | |
| | | | | | | | | | | | | | | | | | |
Total Investments | | | 522 | | | | 443,722 | | | | 799 | | | 445,043 | | | 111.1 | |
| | | | | | | | | | | | | | | | | | |
Other Assets and Liabilities, Net | | | | | | | | | | | | | | | | | (11.1 | ) |
| | | | | | | | | | | | | | | | | | |
| | | | | | | | | | | | | | | | | 100.0 | |
| | | | | | | | | | | | | | | | | | |
Other Financial Instruments | | | | | | | | | | | | | | | | | | |
Futures Contracts | | | (914 | ) | | | — | | | | — | | | (914 | ) | | (0.2 | ) |
Options Written | | | (40 | ) | | | (236 | ) | | | — | | | (276 | ) | | (0.1 | ) |
Foreign Currency Exchange Contracts | | | — | | | | 72 | | | | — | | | 72 | | | — | * |
Interest Rate Swap Contracts | | | — | | | | 504 | | | | 5 | | | 509 | | | 0.1 | |
Credit Default Swaps | | | — | | | | (881 | ) | | | — | | | (881 | ) | | (0.2 | ) |
| | | | | | | | | | | | | | | | | | |
Total Other Financial Instruments** | | | (954 | ) | | | (541 | ) | | | 5 | | | (1,490 | ) | | | |
| | | | | | | | | | | | | | | | | | |
| * | | Less than .05% of net assets. |
| ** | | Other financial instruments not reflected in the Schedule of Investments, such as futures, forwards, and swap contracts which are valued at the unrealized appreciation/depreciation on the instruments. |
For a description of the levels see note 2 in the Notes to Financial Statements.
Investments in which significant unobservable inputs (Level 3) used in determining a value for the period ended December 31, 2009 were less than 1% of net assets.
See accompanying notes which are an integral part of the financial statements.
Russell Investment Funds
Real Estate Securities Fund
Portfolio Management Discussion — December 31, 2009 (Unaudited)
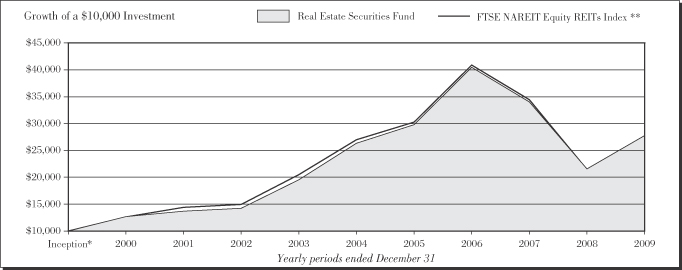
| | | |
|
| Real Estate Securities Fund | |
| | | Total
Return | |
1 Year | | 31.16 | % |
5 Years | | 1.06 | %§ |
10 Years | | 10.76 | %§ |
| | | |
|
| FTSE NAREIT Equity REITs Index** | |
| | | Total
Return | |
1 Year | | 27.99 | % |
5 Years | | 0.36 | %§ |
10 Years | | 10.63 | %§ |
| * | | Assumes initial investment on January 1, 2000. |
| ** | | FTSE National Association of Real Estate Investment Trusts (NAREIT) Equity REITs Index is an index composed of all the data based on the last closing price of the month for all tax-qualified REITs listed on the New York Stock Exchange, American Stock Exchange, and the NASDAQ National Market System. The data is market value-weighted. The total-return calculation is based upon whether it is 1-month, 3-months or 12-months. Only those REITs listed for the entire period are used in the total return calculation. |
The performance shown in this section does not reflect any Insurance Company Separate Account or Policy Charges. Performance is historical and assumes reinvestment of all dividends and capital gains. Investment return and principal value will fluctuate so that an investor’s shares, when redeemed, may be worth more or less than when purchased. Past performance is not indicative of future results.
| | |
| Real Estate Securities Fund | | 71 |
Russell Investment Funds
Real Estate Securities Fund
Portfolio Management Discussion — December 31, 2009 (Unaudited)
The Real Estate Securities Fund (the “Fund”) allocates most of its assets among multiple money managers. Russell Investment Management Company (“RIMCo”), as the Fund’s advisor, may change the allocation of the Fund’s assets among money managers at any time. An exemptive order from the Securities and Exchange Commission (SEC) permits RIMCo to engage or terminate a money manager at any time, subject to the approval by the Fund’s Board without a shareholder vote. Pursuant to the terms of the exemptive order, the Fund is required to notify its shareholders within 60 days of when a money manager begins providing services. The Fund currently has five money managers.
What is the Fund’s investment objective?
The Fund seeks to provide current income and long term capital growth.
How did the Fund perform relative to its benchmark for the fiscal year ended December 31, 2009?
For the fiscal year ended December 31, 2009, the Real Estate Securities Fund gained 31.16%. This compared to the FTSE NAREIT Equity REIT Index, which gained 27.99% during the same period. The Fund’s performance includes operating expenses, whereas Index returns are unmanaged and do not include expenses of any kind.
For the year ending December 31, 2009, the Lipper® Real Estate Funds (VIP) Average gained 32.06%. This result serves as a peer comparison and is expressed net of operating expenses.
How did the market conditions described in the Market Summary report affect the Fund’s performance?
The money managers positioned the Fund somewhat defensively during the fiscal year, with a focus on higher-quality, larger-capitalization REITs with strong balance sheets and more stable earnings prospects. Over the course of the fiscal year, the managers increased the magnitude of their underweight positions in the health care sector based on unfavorable relative valuations and shifted from an overweight to an underweight in the shopping centers sector due to concerns over declining retail sales and tenants’ financial condition. The Fund maintained an overweight position in the regional malls sector as the managers were drawn to the long-term lease structures and limited new supply of high-quality malls. The Fund also maintained underweight positions in the freestanding retail and lodging/resorts sectors. The freestanding retail sector faced difficulty as a result of elevated consumer savings rates and persistently weak retail sales figures. The Fund’s lodging/resorts underweight reflected concerns about reductions in business and leisure travel leading to lower occupancy and room rate growth. The Fund’s underweight position in the lodging/resorts sector was a notable detractor from performance, while the overweight to regional malls and underweights to the shopping centers and health care sectors contributed positively to performance. The underweight position in the freestanding retail sector had a neutral effect on performance. Overall, property sector positioning had a neutral effect on the Fund’s performance during the fiscal year.
The Fund’s international real estate securities holdings contributed positively to performance as the U.S. REIT market underperformed relative to the rest of the globe (27.99% as measured by the FTSE NAREIT Equity REIT Index vs. 44.56% as measured by the international portion of the FTSE EPRA/NAREIT Developed Real Estate Index). Property stocks in Hong Kong and Singapore performed particularly well during this period.
How did the investment strategies and techniques employed by the Fund and its money managers affect its performance?
AEW Capital Management, L.P. pursues a value-oriented style that focuses on identifying companies that it believes are mispriced relative to underlying real estate net asset value. AEW outperformed the benchmark during the fiscal year due primarily to its security selection. The primary contributors to performance were strong stock selection in the specialty, mixed industrial/office and health care sectors. AEW’s sector allocation detracted from performance due to an underweight in the outperforming specialty sector.
INVESCO Advisers, Inc. maintains a broadly diversified portfolio with exposure to all major property sectors. Its investment style incorporates fundamental property market research and bottom-up quantitative securities analysis. INVESCO outperformed the benchmark during the fiscal year as a result of effective stock selection. Stock selection was strongest in the specialty, office and mixed industrial/office sectors. Sector allocation had a neutral effect on performance over the fiscal year.
Heitman Real Estate Securities LLC manages a concentrated portfolio with a bottom-up approach to stock selection focusing on companies that it believes have attractive valuations relative to growth prospects. Heitman outperformed the benchmark during the fiscal year, primarily as a result of effective stock selection. Stock selection was strongest in the lodging/resorts and shopping centers sectors. Sector allocation detracted from performance, driven primarily by underweights to the outperforming lodging/resorts and office sectors.
Cohen & Steers Capital Management Inc. manages a broadly diversified portfolio of global property securities. Cohen & Steers uses a bottom-up approach to portfolio construction, emphasizing the relationship between price and net asset value as the principal valuation metric. Cohen & Steers also evaluates multiple-to-growth ratios as indicators of value. Cohen & Steers outperformed relative to the FTSE EPRA/NAREIT Developed Real Estate Index, and its global portfolio had a positive impact on Fund performance due to the outperformance of international property securities markets relative to the U.S. Investments in Asia, particularly in Hong Kong and Continental Europe, contributed the most to performance.
Cohen & Steers commenced management of a U.S. real estate securities portfolio in September. This portfolio performed in line with the benchmark during the period between its inception
| | |
| 72 | | Real Estate Securities Fund |
Russell Investment Funds
Real Estate Securities Fund
Portfolio Management Discussion — December 31, 2009 (Unaudited)
and the end of the fiscal year. The effect of strong stock selection in the office and regional malls sectors was neutralized by weak stock selection in the shopping centers and health care sectors. Sector allocation also had a neutral effect on performance during this period.
RREEF America L.L.C. emphasizes a top-down approach to property sector weights based on an assessment of property market fundamentals. RREEF performed in line with the benchmark through the fiscal year before being terminated in late-August. Sector allocation detracted from performance due primarily to underweight positions in the outperforming specialty and lodging/resorts sectors. Effective stock selection contributed positively to performance, particularly in the specialty, freestanding retail, and health care sectors.
Describe any changes to the Fund’s structure or the money manager line-up.
RREEF America L.L.C. was terminated in August 2009 and replaced with Cohen & Steers’ diversified U.S. real estate securities strategy.
| | |
| |
Money Managers as of December 31, 2009 | | Styles |
| AEW Capital Management, L.P. | | Value |
| Cohen & Steers Capital Management, Inc. (Global) | | Global Market-Oriented |
| Cohen & Steers Capital Management, Inc. (U.S) | | Market-Oriented |
| Heitman Real Estate Securities LLC | | Growth |
INVESCO Advisers, Inc. which acts as a money manager to the Fund through its INVESCO Real Estate division | | Market-Oriented |
The views expressed in this report reflect those of the portfolio managers only through the end of the period covered by the report. These views do not necessarily represent the views of RIMCo or any other person in RIMCo or any other affiliated organization. These views are subject to change at any time based upon market conditions or other events, and RIMCo disclaims any responsibility to update the views contained herein. These views should not be relied on as investment advice and, because investment decisions for Russell Investment Funds are based on numerous factors, should not be relied on as an indication of investment decisions of any RIF Fund.
| | |
| Real Estate Securities Fund | | 73 |
Russell Investment Funds
Real Estate Securities Fund
Shareholder Expense Example — December 31, 2009 (Unaudited)
Fund Expenses
The following disclosure provides important information regarding each Fund’s Expense Example, which appears on each Fund’s individual page in this Annual Report. Please refer to this information when reviewing the Expense Example for a Fund.
Example
As a shareholder of the Fund, you incur two types of costs: (1) transaction costs, and (2) ongoing costs, including management fees and other Fund expenses. The Example is intended to help you understand your ongoing costs (in dollars) of investing in the Fund and to compare these costs with the ongoing costs of investing in other mutual funds. The Example is based on an investment of $1,000 invested at the beginning of the period and held for the entire period indicated, which for this Fund is from July 1, 2009 to December 31, 2009.
Actual Expenses
The information in the table under the heading “Actual Performance” provides information about actual account values and actual expenses. You may use the information in this column, together with the amount you invested, to estimate the expenses that you paid over the period. Simply divide your account value by $1,000 (for example, an $8,600 account value divided by $1,000 = 8.6), then multiply the result by the number in the first column in the row entitled “Expenses Paid During Period” to estimate the expenses you paid on your account during this period.
Hypothetical Example for Comparison Purposes
The information in the table under the heading “Hypothetical Performance (5% return before expenses)” provides information about hypothetical account values and hypothetical expenses
based on the Fund’s actual expense ratio and an assumed rate of return of 5% per year before expenses, which is not the Fund’s actual return. The hypothetical account values and expenses may not be used to estimate the actual ending account balance or expenses you paid for the period. You may use this information to compare the ongoing costs of investing in the Fund and other funds. To do so, compare this 5% hypothetical example with the 5% hypothetical examples that appear in the shareholder reports of other funds.
Please note that the expenses shown in the table are meant to highlight your ongoing costs only and do not reflect any transactional costs. Therefore, the information under the heading “Hypothetical Performance (5% return before expenses)” is useful in comparing ongoing costs only, and will not help you determine the relative total costs of owning different funds. In addition, if these transactional costs were included, your costs would have been higher. The fee and expenses shown in this section do not reflect any Insurance Company Separate Account or Policy Charges.
| | | | | | |
| | | Actual
Performance | | Hypothetical
Performance
(5% return
before expenses) |
| | | | | | |
Beginning Account Value | | | | | | |
July 1, 2009 | | $ | 1,000.00 | | $ | 1,000.00 |
Ending Account Value | | | | | | |
December 31, 2009 | | $ | 1,415.20 | | $ | 1,020.47 |
Expenses Paid During Period* | | $ | 5.72 | | $ | 4.79 |
| * | Expenses are equal to the Fund’s annualized expense ratio of 0.94% (representing the one-half year period annualized), multiplied by the average account value over the period, multiplied by 184/365 (to reflect the one-half year period). |
| | |
| 74 | | Real Estate Securities Fund |
Russell Investment Funds
Real Estate Securities Fund
Schedule of Investments — December 31, 2009
Amounts in thousands (except share amounts)
| | | | |
| | | Principal
Amount ($)
or Shares | | Market
Value
$ |
| | | | |
| Common Stocks - 96.4% | | | | |
| Diversified - 9.6% | | | | |
Agile Property Holdings, Ltd. | | 266,000 | | 386 |
British Land Co. PLC (ö) | | 36,556 | | 280 |
CapitaLand, Ltd. | | 299,500 | | 887 |
Cousins Properties, Inc. (ö) | | 137,772 | | 1,051 |
Dexus Property Group (ö) | | 637,224 | | 481 |
FKP Property Group (ö) | | 101,939 | | 71 |
Forest City Enterprises, Inc. Class A (Æ)(Ñ) | | 95,073 | | 1,120 |
Glorious Property Holdings, Ltd. (Æ) | | 802,666 | | 360 |
Goldcrest Co., Ltd. | | 12,657 | | 352 |
GPT Group (ö) | | 487,536 | | 262 |
Great Eagle Holdings, Ltd. | | 17,955 | | 46 |
Hang Lung Properties, Ltd. - ADR | | 101,000 | | 395 |
Henderson Land Development Co., Ltd. | | 110,336 | | 822 |
Hysan Development Co., Ltd. | | 115,460 | | 327 |
IVG Immobilien AG (Æ) | | 35,520 | | 272 |
Keppel Land, Ltd. | | 5 | | — |
KWG Property Holding, Ltd. | | 351,172 | | 268 |
Land Securities Group PLC (ö) | | 75,498 | | 827 |
Lexington Realty Trust (ö)(Ñ) | | 61,690 | | 375 |
London & Stamford Property, Ltd. | | 41,589 | | 80 |
Mirvac Group (ö) | | 456,263 | | 635 |
Mitsubishi Estate Co., Ltd. | | 84,000 | | 1,332 |
Mitsui Fudosan Co., Ltd. | | 69,104 | | 1,160 |
New World Development, Ltd. | | 335,000 | | 684 |
Norwegian Property ASA (Æ) | | 97,202 | | 225 |
Sponda OYJ (Æ) | | 49,198 | | 193 |
Stockland (ö) | | 264,510 | | 930 |
Sumitomo Realty & Development Co., Ltd. | | 27,000 | | 506 |
Sun Hung Kai Properties, Ltd. | | 138,606 | | 2,057 |
Tokyo Tatemono Co., Ltd. | | 60,488 | | 230 |
Unibail-Rodamco SE (ö) | | 6,299 | | 1,387 |
Vornado Realty Trust (ö)(Ñ) | | 300,376 | | 21,008 |
Washington Real Estate Investment Trust (ö)(Ñ) | | 10,798 | | 298 |
Wharf Holdings, Ltd. | | 27,000 | | 154 |
| | | | |
| | | | 39,461 |
| | | | |
| | |
| Free Standing Retail - 0.6% | | | | |
National Retail Properties, Inc. (ö)(Ñ) | | 62,200 | | 1,320 |
Realty Income Corp. (ö)(Ñ) | | 49,317 | | 1,278 |
| | | | |
| | | | 2,598 |
| | | | |
| | |
| Health Care - 11.6% | | | | |
Brookdale Senior Living, Inc. (Æ)(Ñ) | | 129,663 | | 2,358 |
HCP, Inc. (ö)(Ñ) | | 454,813 | | 13,890 |
Health Care REIT, Inc. (ö) | | 187,877 | | 8,327 |
Nationwide Health Properties, Inc. (ö)(Ñ) | | 271,762 | | 9,561 |
Omega Healthcare Investors, Inc. (ö)(Ñ) | | 187,526 | | 3,647 |
Senior Housing Properties Trust (ö) | | 136,190 | | 2,978 |
Ventas, Inc. (ö)(Ñ) | | 155,029 | | 6,781 |
| | | | |
| | | | 47,542 |
| | | | |
| | | | |
| | | Principal
Amount ($)
or Shares | | Market
Value
$ |
| Industrial - 5.2% | | | | |
AMB Property Corp. (ö)(Ñ) | | 168,348 | | 4,301 |
DCT Industrial Trust, Inc. (ö)(Ñ) | | 691,375 | | 3,471 |
EastGroup Properties, Inc. (ö)(Ñ) | | 43,887 | | 1,680 |
First Potomac Realty Trust (ö) | | 68,300 | | 859 |
Goodman Group (ö) | | 756,091 | | 425 |
Prologis (ö)(Ñ) | | 763,008 | | 10,446 |
Segro PLC (ö) | | 54,924 | | 303 |
| | | | |
| | | | 21,485 |
| | | | |
| | |
| Lodging/Resorts - 6.1% | | | | |
DiamondRock Hospitality Co. (ö) | | 255,050 | | 2,160 |
Gaylord Entertainment Co. (Æ)(Ñ) | | 51,558 | | 1,018 |
Hospitality Properties Trust (ö) | | 120,519 | | 2,857 |
Host Hotels & Resorts, Inc. (Æ)(ö)(Ñ) | | 1,086,817 | | 12,683 |
Hyatt Hotels Corp. (Æ) | | 2,874 | | 86 |
LaSalle Hotel Properties (ö)(Ñ) | | 15,400 | | 327 |
Orient-Express Hotels, Ltd. Class A (Æ)(Ñ) | | 105,029 | | 1,065 |
Pebblebrook Hotel Trust (Æ)(Ñ) | | 74,400 | | 1,638 |
Shangri-La Asia, Ltd. | | 54,000 | | 101 |
Starwood Hotels & Resorts Worldwide, Inc. (ö)(Ñ) | | 65,152 | | 2,383 |
Sunstone Hotel Investors, Inc. (Æ)(ö)(Ñ) | | 83,206 | | 739 |
| | | | |
| | | | 25,057 |
| | | | |
| | |
| Mixed Industrial/Office - 2.3% | | | | |
Liberty Property Trust (ö) | | 246,386 | | 7,887 |
PS Business Parks, Inc. (ö) | | 30,777 | | 1,540 |
| | | | |
| | | | 9,427 |
| | | | |
| | |
| Office - 12.2% | | | | |
Alexandria Real Estate Equities, Inc. (ö)(Ñ) | | 43,100 | | 2,771 |
BioMed Realty Trust, Inc. (ö) | | 155,032 | | 2,446 |
Boston Properties, Inc. (ö)(Ñ) | | 211,105 | | 14,159 |
Brandywine Realty Trust (ö) | | 239,100 | | 2,726 |
Brookfield Properties Corp. (Ñ) | | 122,457 | | 1,484 |
CapitaCommercial Trust (Æ)(ö) | | 184,000 | | 152 |
Commonwealth Property Office Fund (ö) | | 315,383 | | 273 |
Corporate Office Properties Trust SBI MD (ö) | | 54,300 | | 1,989 |
DA Office Investment Corp. Class A (ö) | | 29 | | 61 |
Derwent London PLC (ö) | | 15,907 | | 336 |
Douglas Emmett, Inc. (ö)(Ñ) | | 30,640 | | 437 |
Fabege AB | | 31,599 | | 200 |
Great Portland Estates PLC (ö) | | 42,164 | | 195 |
Highwoods Properties, Inc. (ö)(Ñ) | | 64,500 | | 2,151 |
Hongkong Land Holdings, Ltd. | | 184,300 | | 907 |
HRPT Properties Trust (ö) | | 30,600 | | 198 |
ICADE (ö) | | 3,006 | | 286 |
ING Office Fund | | 580,600 | | 330 |
Japan Prime Realty Investment Corp. Class A (ö) | | 39 | | 81 |
Japan Real Estate Investment Corp. Class A (ö) | | 21 | | 154 |
| | |
| Real Estate Securities Fund | | 75 |
Russell Investment Funds
Real Estate Securities Fund
Schedule of Investments, continued — December 31, 2009
Amounts in thousands (except share amounts)
| | | | |
| | | Principal
Amount ($)
or Shares | | Market
Value
$ |
| | | | |
Kenedix Realty Investment Corp. Class A (ö) | | 40 | | 109 |
Kilroy Realty Corp. (ö)(Ñ) | | 203,204 | | 6,232 |
Mack-Cali Realty Corp. (ö)(Ñ) | | 123,889 | | 4,283 |
SL Green Realty Corp. (ö)(Ñ) | | 166,476 | | 8,364 |
| | | | |
| | | | 50,324 |
| | | | |
| | |
| Regional Malls - 18.3% | | | | |
Aeon Mall Co., Ltd. | | 10,400 | | 201 |
BR Malls Participacoes SA (Æ) | | 14,283 | | 176 |
CapitaMalls Asia, Ltd. (Æ) | | 104,000 | | 188 |
Macerich Co. (The) (ö)(Ñ) | | 281,719 | | 10,128 |
Public Storage (ö) | | 258,565 | | 21,060 |
Simon Property Group, Inc. (ö) | | 479,037 | | 38,227 |
Taubman Centers, Inc. (ö)(Ñ) | | 99,100 | | 3,559 |
Westfield Group (ö) | | 136,745 | | 1,525 |
| | | | |
| | | | 75,064 |
| | | | |
| | |
| Residential - 14.1% | | | | |
American Campus Communities,
Inc. (ö)(Ñ) | | 136,700 | | 3,841 |
Apartment Investment & Management Co. Class A (ö)(Ñ) | | 80,416 | | 1,280 |
AvalonBay Communities, Inc. (ö)(Ñ) | | 124,813 | | 10,248 |
Boardwalk Real Estate Investment Trust (ö) | | 8,120 | | 288 |
Camden Property Trust (ö)(Ñ) | | 208,165 | | 8,820 |
China Overseas Land & Investment, Ltd. | | 281,200 | | 589 |
China Resources Land, Ltd. | | 115,000 | | 259 |
Colonial Properties Trust (ö)(Ñ) | | 70,799 | | 830 |
Deutsche Wohnen AG (Æ) | | 16,388 | | 157 |
Education Realty Trust, Inc. (ö) | | 89,816 | | 435 |
Equity Lifestyle Properties, Inc. (ö)(Ñ) | | 37,461 | | 1,891 |
Equity Residential (ö)(Ñ) | | 547,148 | | 18,483 |
Essex Property Trust, Inc. (ö)(Ñ) | | 69,645 | | 5,826 |
Home Properties, Inc. (ö)(Ñ) | | 41,584 | | 1,984 |
Mid-America Apartment Communities, Inc. (ö) | | 15,119 | | 730 |
Post Properties, Inc. (ö)(Ñ) | | 53,355 | | 1,046 |
Shimao Property Holdings, Ltd. | | 194,000 | | 364 |
UDR, Inc. (ö)(Ñ) | | 32,719 | | 538 |
Unite Group PLC (Æ) | | 68,978 | | 333 |
| | | | |
| | | | 57,942 |
| | | | |
| | |
| Self Storage - 1.0% | | | | |
Big Yellow Group PLC (Æ)(ö) | | 14,322 | | 82 |
Extra Space Storage, Inc. (ö)(Ñ) | | 209,500 | | 2,420 |
Sovran Self Storage, Inc. (ö) | | 24,324 | | 869 |
U-Store-It Trust (ö)(Ñ) | | 84,337 | | 617 |
| | | | |
| | | | 3,988 |
| | | | |
| | |
| Shopping Centers - 8.5% | | | | |
Acadia Realty Trust (ö)(Ñ) | | 88,229 | | 1,488 |
Alexander’s, Inc. (Æ)(ö)(Ñ) | | 1,080 | | 329 |
| | | | | |
| | | Principal
Amount ($)
or Shares | | Market
Value
$ | |
Atrium European Real Estate, Ltd. | | 28,653 | | 193 | |
Citycon OYJ | | 24,909 | | 105 | |
Corio NV (ö) | | 2,941 | | 201 | |
Developers Diversified Realty Corp. (ö)(Ñ) | | 340,147 | | 3,150 | |
Federal Realty Investment Trust (ö)(Ñ) | | 122,264 | | 8,280 | |
Hammerson PLC (ö) | | 94,225 | | 640 | |
Inland Real Estate Corp. (ö)(Ñ) | | 80,165 | | 653 | |
Kimco Realty Corp. (ö) | | 449,221 | | 6,078 | |
Kite Realty Group Trust (ö) | | 208,000 | | 846 | |
Link REIT (The) (ö) | | 197,128 | | 502 | |
Primaris Retail Real Estate Investment Trust (ö) | | 14,173 | | 219 | |
Regency Centers Corp. (ö)(Ñ) | | 218,778 | | 7,670 | |
Retail Opportunity Investments
Corp. (Æ)(Ñ) | | 127,179 | | 1,286 | |
Tanger Factory Outlet Centers (ö)(Ñ) | | 47,200 | | 1,840 | |
Weingarten Realty Investors (ö)(Ñ) | | 69,627 | | 1,378 | |
| | | | | |
| | | | 34,858 | |
| | | | | |
| | |
| Specialty - 6.9% | | | | | |
Digital Realty Trust, Inc. (ö)(Ñ) | | 244,560 | | 12,297 | |
DuPont Fabros Technology, Inc. (ö) | | 95,000 | | 1,709 | |
Entertainment Properties Trust (ö) | | 86,400 | | 3,047 | |
Plum Creek Timber Co., Inc. (ö)(Ñ) | | 199,130 | | 7,519 | |
Rayonier, Inc. (ö)(Ñ) | | 75,464 | | 3,182 | |
Weyerhaeuser Co. (Ñ) | | 11,020 | | 475 | |
| | | | | |
| | | | 28,229 | |
| | | | | |
| | |
Total Common Stocks
(cost $312,065) | | | | 395,975 | |
| | | | | |
| |
| Short-Term Investments - 3.2% | | | |
Russell U.S. Cash Management Fund (£) | | 13,068,747 | | 13,069 | |
| | | | | |
| | |
Total Short-Term Investments
(cost $13,069) | | | | 13,069 | |
| | | | | |
| | |
| Other Securities - 33.1% | | | | | |
State Street Securities Lending Quality Trust (×) | | 136,855,428 | | 136,155 | |
| | | | | |
| | |
Total Other Securities
(cost $136,855) | | | | 136,155 | |
| | | | | |
| | |
Total Investments - 132.7%
(identified cost $461,989) | | | | 545,199 | |
| | |
Other Assets and Liabilities,
Net - (32.7%) | | | | (134,491 | ) |
| | | | | |
| | |
| Net Assets - 100.0% | | | | 410,708 | |
| | | | | |
A portion of the portfolio has been fair valued as of period end.
See accompanying notes which are an integral part of the financial statements.
| | |
| 76 | | Real Estate Securities Fund |
Russell Investment Funds
Real Estate Securities Fund
Schedule of Investments, continued — December 31, 2009
Amounts in thousands
| | | | | | | | | | | | |
| Foreign Currency Exchange Contracts | | |
Counter
Party | | Amount
Sold | | Amount
Bought | | Settlement
Date | | Unrealized
Appreciation
(Depreciation)
$ |
| | | | | | | | | | | | |
Royal Bank of Scotland | | USD | | 3 | | HKD | | 20 | | 01/05/10 | | — |
Royal Bank of Scotland | | USD | | 11 | | HKD | | 87 | | 01/05/10 | | — |
Royal Bank of Scotland | | USD | | 7 | | JPY | | 686 | | 01/06/10 | | — |
Royal Bank of Scotland | | JPY | | 190 | | USD | | 2 | | 01/06/10 | | — |
State Street Bank and Trust Company | | USD | | 2 | | AUD | | 2 | | 01/04/10 | | — |
State Street Bank and Trust Company | | USD | | 2 | | AUD | | 3 | | 01/06/10 | | — |
State Street Bank and Trust Company | | USD | | 3 | | HKD | | 20 | | 01/04/10 | | — |
State Street Bank and Trust Company | | USD | | 11 | | HKD | | 82 | | 01/04/10 | | — |
State Street Bank and Trust Company | | USD | | 17 | | HKD | | 131 | | 01/04/10 | | — |
State Street Bank and Trust Company | | USD | | 23 | | HKD | | 178 | | 01/04/10 | | — |
State Street Bank and Trust Company | | USD | | 11 | | HKD | | 88 | | 01/05/10 | | — |
State Street Bank and Trust Company | | JPY | | 362 | | USD | | 4 | | 01/04/10 | | — |
State Street Bank and Trust Company | | JPY | | 551 | | USD | | 6 | | 01/05/10 | | — |
| | | | | | | | | | | | |
| |
Total Unrealized Appreciation (Depreciation) on Open Foreign Currency Exchange Contracts | | — |
| | | | | | | | | | | | |
Presentation of Portfolio Holdings — December 31, 2009
| | | | | | | | | | | | | | | |
| | | Market Value | | | |
| Portfolio Summary | | Level 1 | | Level 2 | | Level 3 | | Total | | % of Net Assets | |
| | | | | | | | | | | | | | | |
Common Stocks | | | | | | | | | | | | | | | |
Diversified | | $ | 23,852 | | $ | 15,609 | | $ | — | | $ | 39,461 | | 9.6 | |
Free Standing Retail | | | 2,598 | | | — | | | — | | | 2,598 | | 0.6 | |
Health Care | | | 47,542 | | | — | | | — | | | 47,542 | | 11.6 | |
Industrial | | | 20,757 | | | 728 | | | — | | | 21,485 | | 5.2 | |
Lodging/Resorts | | | 24,956 | | | 101 | | | — | | | 25,057 | | 6.1 | |
Mixed Industrial/Office | | | 9,427 | | | | | | — | | | 9,427 | | 2.3 | |
Office | | | 47,240 | | | 3,084 | | | — | | | 50,324 | | 12.2 | |
Regional Malls | | | 73,338 | | | 1,726 | | | — | | | 75,064 | | 18.3 | |
Residential | | | 56,240 | | | 1,702 | | | — | | | 57,942 | | 14.1 | |
Self Storage | | | 3,906 | | | 82 | | | — | | | 3,988 | | 1.0 | |
Shopping Centers | | | 33,217 | | | 1,641 | | | — | | | 34,858 | | 8.5 | |
Specialty | | | 28,229 | | | — | | | — | | | 28,229 | | 6.9 | |
Short-Term Investments | | | — | | | 13,069 | | | — | | | 13,069 | | 3.2 | |
Other Securities | | | — | | | 136,155 | | | — | | | 136,155 | | 33.1 | |
| | | | | | | | | | | | | | | |
Total Investments | | | 371,302 | | | 173,897 | | | — | | | 545,199 | | 132.7 | |
| | | | | | | | | | | | | | | |
Other Assets and Liabilities, Net | | | | | | | | | | | | | | (32.7 | ) |
| | | | | | | | | | | | | | | |
| | | | | | | | | | | | | | 100.0 | |
| | | | | | | | | | | | | | | |
Other Financial Instruments | | | | | | | | | | | | | | | |
Foreign Currency Exchange Contracts | | | — | | | — | | | — | | | — | | — | * |
| | | | | | | | | | | | | | | |
Total Other Financial Instruments** | | | — | | | — | | | — | | | — | | | |
| | | | | | | | | | | | | | | |
| * | | Less than .05% of net assets. |
| ** | | Other financial instruments not reflected in the Schedule of Investments, such as futures, forwards, and swap contracts which are valued at the unrealized appreciation/depreciation on the instruments. |
For a description of the levels see note 2 in the Notes to Financial Statements.
See accompanying notes which are an integral part of the financial statements.
| | |
| Real Estate Securities Fund | | 77 |
Russell Investment Funds
Notes to Schedules of Investments — December 31, 2009
Footnotes:
| (Æ) | Nonincome-producing security. |
| (ö) | Real Estate Investment Trust (REIT). |
| (§) | All or a portion of the shares of this security are held as collateral in connection with futures contracts purchased (sold), options written, or swaps entered into by the Fund. |
| (ž) | Rate noted is yield-to-maturity from date of acquisition. |
| (ç) | At amortized cost, which approximates market. |
| (Ê) | Adjustable or floating rate security. Rate shown reflects rate in effect at period end. |
| (ƒ) | Perpetual floating rate security. Rate shown reflects rate in effect at period end. |
| (µ) | Bond is insured by a guarantor. |
| (æ) | Pre-refunded: These bonds are collateralized by US Treasury securities, which are held in escrow by a trustee and used to pay principal and interest in the tax-exempt issue and to retire the bonds in full at the earliest refunding date. The rate noted is for descriptive purposes; effective yield may vary. |
| (×) | The security is purchased with the cash collateral from the securities loaned. |
| (Ñ) | All or a portion of the shares of this security are on loan. |
| (Þ) | Restricted security. Security may have contractual restrictions on resale, may have been offered in a private placement transaction, and may not be registered under the Securities Act of 1933. |
| (Å) | Illiquid and restricted security. |
| (å) | Currency balances were held in connection with futures contracts purchased (sold), options written, or swaps entered into by the Fund. See Note 2. |
| (£) | A portion of this asset has been segregated to cover the liability caused by the valuation of SLQT. |
Abbreviations:
144A - Represents private placement security for qualified buyers according to rule 144A of the Securities Act of 1933.
ADR - American Depositary Receipt
ADS - American Depositary Share
BBSW - Australian Bank Bill Short Term Rate
CIBOR - Copenhagen Interbank Offered Rate
CME - Chicago Mercantile Exchange
CMO - Collateralized Mortgage Obligation
CVO - Contingent Value Obligation
EMU - European Economic and Monetary Union
EURIBOR - Euro Interbank Offered Rate
FDIC - Federal Deposit Insurance Company
GDR - Global Depositary Receipt
GDS - Global Depositary Share
LIBOR - London Interbank Offered Rate
NIBOR - Norwegian Interbank Offered Rate
PIK - Payment in Kind
REMIC - Real Estate Mortgage Investment Conduit
STRIP - Separate Trading of Registered Interest and Principal of Securities
TBA - To Be Announced Security
Foreign Currency Abbreviations:
| | | | |
| ARS - Argentine peso | | HKD - Hong Kong dollar | | PLN - Polish zloty |
| AUD - Australian dollar | | HUF - Hungarian forint | | RUB - Russian ruble |
| BRL - Brazilian real | | IDR - Indonesian rupiah | | SEK - Swedish krona |
| CAD - Canadian dollar | | ILS - Israeli shekel | | SGD - Singapore dollar |
| CHF - Swiss franc | | INR - Indian rupee | | SKK - Slovakian koruna |
| CLP - Chilean peso | | JPY - Japanese yen | | THB - Thai baht |
| CNY - Chinese renminbi yuan | | KES - Kenyan schilling | | TRY - Turkish lira |
| COP - Colombian peso | | KRW - South Korean won | | TWD - Taiwanese dollar |
| CRC - Costa Rica colon | | MXN - Mexican peso | | USD - United States dollar |
| CZK - Czech koruna | | MYR - Malaysian ringgit | | VEB - Venezuelan bolivar |
| DKK - Danish krone | | NOK - Norweigian Krone | | VND - Vietnamese dong |
| EGP - Egyptian pound | | NZD - New Zealand dollar | | ZAR - South African rand |
| EUR - Euro | | PEN - Peruvian nouveau sol | | |
| GBP - British pound sterling | | PHP - Philippine peso | | |
| | |
| 78 | | Notes to Schedules of Investments |
Russell Investment Funds
Statements of Assets and Liabilities — December 31, 2009
| | | | | | | | | | | | | | | |
| Amounts in thousands | | Multi-Style
Equity Fund | | Aggressive
Equity Fund | | Non-U.S. Fund | | Core Bond Fund | �� | Real Estate
Securities Fund |
| | | | | | | | | | | | | | | |
Assets | | | | | | | | | | | | | | | |
Investments, at identified cost | | $ | 330,635 | | $ | 152,815 | | $ | 318,998 | | $ | 451,599 | | $ | 461,989 |
Investments, at market*** | | | 378,507 | | | 173,594 | | | 341,189 | | | 445,043 | | | 545,199 |
Cash | | | — | | | — | | | — | | | 67 | | | — |
Cash (restricted) | | | 2,200 | | | 700 | | | 2,800 | | | 1,979 | | | — |
Foreign currency holdings* | | | — | | | — | | | 50 | | | 252 | | | 15 |
Unrealized appreciation on foreign currency exchange contracts | | | — | | | — | | | 28 | | | 238 | | | — |
Receivables: | | | | | | | | | | | | | | | |
Dividends and interest | | | 421 | | | 212 | | | 397 | | | 2,841 | | | 1,561 |
Dividends from affiliated money market funds | | | 1 | | | — | | | 1 | | | 1 | | | — |
Investments sold | | | 2,303 | | | 1,021 | | | 920 | | | 39,340 | | | 1,939 |
Fund shares sold | | | 26 | | | 28 | | | 34 | | | 290 | | | 128 |
Foreign taxes recoverable | | | — | | | — | | | 112 | | | — | | | — |
From Affiliates | | | — | | | — | | | — | | | — | | | — |
Daily variation margin on futures contracts | | | — | | | — | | | 22 | | | 637 | | | — |
Other receivable | | | — | | | — | | | 7 | | | 3 | | | — |
Prepaid expenses | | | — | | | — | | | — | | | — | | | 6 |
Interest rate swap contracts, at market value**** | | | — | | | — | | | — | | | 1,063 | | | — |
Credit default swap contracts, at market value***** | | | — | | | — | | | — | | | 941 | | | — |
| | | | | | | | | | | | | | | |
Total assets | | | 383,458 | | | 175,555 | | | 345,560 | | | 492,695 | | | 548,848 |
| | | | | | | | | | | | | | | |
| | | | | | | | | | | | | | | |
Liabilities | | | | | | | | | | | | | | | |
Payables: | | | | | | | | | | | | | | | |
Due to Custodian | | | — | | | — | | | — | | | — | | | 9 |
Due to Broker | | | — | | | — | | | — | | | 1,510 | | | — |
Investments purchased | | | 2,374 | | | 1,874 | | | 1,262 | | | 55,540 | | | 863 |
Fund shares redeemed | | | 213 | | | 42 | | | 66 | | | 1 | | | 56 |
Accrued fees to affiliates | | | 250 | | | 112 | | | 252 | | | 178 | | | 295 |
Other accrued expenses | | | 54 | | | 39 | | | 66 | | | 73 | | | 62 |
Daily variation margin on futures contracts | | | 202 | | | 95 | | | 1 | | | 276 | | | — |
Other payable | | | — | | | — | | | — | | | 1,773 | | | — |
Unrealized depreciation on foreign currency exchange contracts | | | — | | | — | | | 857 | | | 166 | | | — |
Options written, at market value** | | | — | | | — | | | — | | | 276 | | | — |
Payable upon return of securities loaned | | | 3,614 | | | 14,722 | | | 20,911 | | | 29,452 | | | 136,855 |
Interest rate swap contracts, at market value**** | | | — | | | — | | | — | | | 398 | | | — |
Credit default swap contracts, at market value***** | | | — | | | — | | | — | | | 2,483 | | | — |
| | | | | | | | | | | | | | | |
Total liabilities | | | 6,707 | | | 16,884 | | | 23,415 | | | 92,126 | | | 138,140 |
| | | | | | | | | | | | | | | |
| | | | | | | | | | | | | | | |
Net Assets | | $ | 376,751 | | $ | 158,671 | | $ | 322,145 | | $ | 400,569 | | $ | 410,708 |
| | | | | | | | | | | | | | | |
See accompanying notes which are an integral part of the financial statements.
| | |
| Statements of Assets and Liabilities | | 79 |
Russell Investment Funds
Statements of Assets and Liabilities, continued — December 31, 2009
| | | | | | | | | | | | | | | | | | | | |
| Amounts in thousands | | Multi-Style
Equity Fund | | | Aggressive
Equity Fund | | | Non-U.S. Fund | | | Core Bond Fund | | | Real Estate
Securities Fund | |
| | | | | | | | | | | | | | | | | | | | |
| Net Assets Consist of: | | | | | | | | | | | | | | | | | | | | |
Undistributed (overdistributed) net investment income | | $ | 777 | | | $ | 165 | | | $ | 2,995 | | | $ | 2,066 | | | $ | 103 | |
Accumulated net realized gain (loss) | | | (122,571 | ) | | | (74,164 | ) | | | (106,360 | ) | | | 2,347 | | | | (120,823 | ) |
Unrealized appreciation (depreciation) on: | | | | | | | | | | | | | | | | | | | | |
Investments | | | 47,872 | | | | 20,779 | | | | 22,191 | | | | (6,556 | ) | | | 83,210 | |
Futures contracts | | | 363 | | | | 377 | | | | 555 | | | | (914 | ) | | | — | |
Options written | | | — | | | | — | | | | — | | | | 208 | | | | — | |
Credit default swap contracts | | | — | | | | — | | | | — | | | | (881 | ) | | | — | |
Index swap contracts | | | — | | | | — | | | | — | | | | — | | | | — | |
Interest rate swap contracts | | | — | | | | — | | | | — | | | | 509 | | | | — | |
Foreign currency-related transactions | | | — | | | | — | | | | (823 | ) | | | 75 | | | | (1 | ) |
Other investments | | | — | | | | — | | | | 7 | | | | 4 | | | | — | |
Shares of beneficial interest | | | 320 | | | | 165 | | | | 348 | | | | 393 | | | | 355 | |
Additional paid-in capital | | | 449,990 | | | | 211,349 | | | | 403,232 | | | | 403,318 | | | | 447,864 | |
| | | | | | | | | | | | | | | | | | | | |
Net Assets | | $ | 376,751 | | | $ | 158,671 | | | $ | 322,145 | | | $ | 400,569 | | | $ | 410,708 | |
| | | | | | | | | | | | | | | | | | | | |
Net Asset Value, offering and redemption price per share: | | | | | | | | | | | | | | | | | | | | |
Net asset value per share****** | | $ | 11.77 | | | $ | 9.59 | | | $ | 9.25 | | | $ | 10.20 | | | $ | 11.58 | |
Net assets | | $ | 376,751,274 | | | $ | 158,670,629 | | | $ | 322,145,256 | | | $ | 400,569,491 | | | $ | 410,707,737 | |
Shares outstanding ($.01 par value) | | | 32,015,009 | | | | 16,539,609 | | | | 34,835,922 | | | | 39,258,646 | | | | 35,481,471 | |
Amounts in thousands | | | | | | | | | | | | | | | | | | | | |
* Foreign currency holdings - cost | | $ | — | | | $ | — | | | $ | 50 | | | $ | 250 | | | $ | 14 | |
** Premiums received on options written | | $ | — | | | $ | — | | | $ | — | | | $ | 484 | | | $ | — | |
*** Securities on loan included in investments | | $ | 3,489 | | | $ | 14,156 | | | $ | 19,985 | | | $ | 28,791 | | | $ | 131,806 | |
**** Interest rate swap contracts - premiums paid (received) | | $ | — | | | $ | — | | | $ | — | | | $ | 156 | | | $ | — | |
***** Credit default swap contracts - premiums paid (received) | | $ | — | | | $ | — | | | $ | — | | | $ | (661 | ) | | $ | — | |
****** Net asset value per share equals net assets divided by shares of beneficial interest outstanding. | | | | | | | | | | | | | | | | | | | | |
See accompanying notes which are an integral part of the financial statements.
| | |
| 80 | | Statements of Assets and Liabilities |
Russell Investment Funds
Statements of Operations — For Period Ended December 31, 2009
| | | | | | | | | | | | | | | | | | | | |
| Amounts in thousands | | Multi-Style Equity
Fund | | | Aggressive Equity
Fund | | | Non-U.S. Fund | | | Core Bond
Fund | | | Real Estate
Securities Fund | |
| | | | | | | | | | | | | | | | | | | | |
Investment Income | | | | | | | | | | | | | | | | | | | | |
Dividends | | $ | 5,886 | | | $ | 1,892 | | | $ | 7,512 | | | $ | 30 | | | $ | 13,046 | |
Dividends from affiliated money market funds | | | 1 | | | | 22 | | | | 53 | | | | 38 | | | | 30 | |
Interest | | | — | | | | 1 | | | | 5 | | | | 17,482 | | | | — | |
Securities lending income | | | 227 | | | | 292 | | | | 246 | | | | 86 | | | | 499 | |
Less foreign taxes withheld | | | — | | | | — | | | | (697 | ) | | | — | | | | — | |
| | | | | | | | | | | | | | | | | | | | |
Total investment income | | | 6,114 | | | | 2,207 | | | | 7,119 | | | | 17,636 | | | | 13,575 | |
| | | | | | | | | | | | | | | | | | | | |
| | | | | | | | | | | | | | | | | | | | |
Expenses | | | | | | | | | | | | | | | | | | | | |
Advisory fees | | | 2,333 | | | | 1,184 | | | | 2,468 | | | | 1,883 | | | | 2,509 | |
Administrative fees | | | 160 | | | | 66 | | | | 137 | | | | 171 | | | | 157 | |
Custodian fees | | | 146 | | | | 173 | | | | 357 | | | | 300 | | | | 249 | |
Transfer agent fees | | | 14 | | | | 6 | | | | 12 | | | | 15 | | | | 14 | |
Professional fees | | | 66 | | | | 47 | | | | 75 | | | | 88 | | | | 69 | |
Trustees’ fees | | | 8 | | | | 3 | | | | 7 | | | | 9 | | | | 8 | |
Printing fees | | | 15 | | | | 4 | | | | 13 | | | | 20 | | | | 12 | |
Miscellaneous | | | 22 | | | | 10 | | | | 8 | | | | 26 | | | | 11 | |
| | | | | | | | | | | | | | | | | | | | |
Expenses before reductions | | | 2,764 | | | | 1,493 | | | | 3,077 | | | | 2,512 | | | | 3,029 | |
Expense reductions | | | (34 | ) | | | (146 | ) | | | (231 | ) | | | (238 | ) | | | — | |
| | | | | | | | | | | | | | | | | | | | |
Net expenses | | | 2,730 | | | | 1,347 | | | | 2,846 | | | | 2,274 | | | | 3,029 | |
| | | | | | | | | | | | | | | | | | | | |
Net investment income (loss) | | | 3,384 | | | | 860 | | | | 4,273 | | | | 15,362 | | | | 10,546 | |
| | | | | | | | | | | | | | | | | | | | |
| | | | | | | | | | | | | | | | | | | | |
Net Realized and Unrealized Gain (Loss) | | | | | | | | | | | | | | | | | | | | |
Net realized gain (loss) on: | | | | | | | | | | | | | | | | | | | | |
Investments | | | (42,063 | ) | | | (18,989 | ) | | | (25,692 | ) | | | 2,543 | | | | (39,114 | ) |
Futures contracts | | | 4,673 | | | | 2,039 | | | | 5,389 | | | | 3,900 | | | | — | |
Options written | | | — | | | | — | | | | — | | | | (797 | ) | | | — | |
Credit default swap contracts | | | — | | | | — | | | | — | | | | (2,403 | ) | | | — | |
Interest rate swap contracts | | | — | | | | — | | | | — | | | | 3,598 | | | | — | |
Foreign currency - related transactions | | | 1 | | | | — | | | | 3,679 | | | | (285 | ) | | | 2 | |
| | | | | | | | | | | | | | | | | | | | |
Net realized gain (loss) | | | (37,389 | ) | | | (16,950 | ) | | | (16,624 | ) | | | 6,556 | | | | (39,112 | ) |
| | | | | | | | | | | | | | | | | | | | |
Net change in unrealized appreciation (depreciation) on: | | | | | | | | | | | | | | | | | | | | |
Investments | | | 126,574 | | | | 56,763 | | | | 83,456 | | | | 29,038 | | | | 130,390 | |
Futures contracts | | | (91 | ) | | | (266 | ) | | | 42 | | | | (3,262 | ) | | | — | |
Options written | | | — | | | | — | | | | — | | | | 1,650 | | | | — | |
Credit default swap contracts | | | — | | | | — | | | | — | | | | 840 | | | | — | |
Interest rate swap contracts | | | — | | | | — | | | | — | | | | 456 | | | | — | |
Foreign currency-related transactions | | | — | | | | — | | | | (2,334 | ) | | | 261 | | | | 3 | |
Other investments | | | — | | | | — | | | | 7 | | | | 4 | | | | — | |
| | | | | | | | | | | | | | | | | | | | |
Net change in unrealized appreciation (depreciation) | | | 126,483 | | | | 56,497 | | | | 81,171 | | | | 28,987 | | | | 130,393 | |
| | | | | | | | | | | | | | | | | | | | |
Net realized and unrealized gain (loss) | | | 89,094 | | | | 39,547 | | | | 64,547 | | | | 35,543 | | | | 91,281 | |
| | | | | | | | | | | | | | | | | | | | |
Net Increase (Decrease) in Net Assets from Operations | | $ | 92,478 | | | $ | 40,407 | | | $ | 68,820 | | | $ | 50,905 | | | $ | 101,827 | |
| | | | | | | | | | | | | | | | | | | | |
See accompanying notes which are an integral part of the financial statements.
| | |
| Statements of Operations | | 81 |
Russell Investment Funds
Statements of Changes in Net Assets — For the Periods Ended December 31,
| | | | | | | | | | | | | | | | |
| | | Multi-Style Equity
Fund | | | Aggressive Equity
Fund | |
| Amounts in thousands | | 2009 | | | 2008 | | | 2009 | | | 2008 | |
| | | | | | | | | | | | | | | | |
Increase (Decrease) in Net Assets | | | | | | | | | | | | | | | | |
| | | | |
Operations | | | | | | | | | | | | | | | | |
Net investment income (loss) | | $ | 3,384 | | | $ | 6,074 | | | $ | 860 | | | $ | 1,551 | |
Net realized gain (loss) | | | (37,389 | ) | | | (81,223 | ) | | | (16,950 | ) | | | (55,173 | ) |
Net change in unrealized appreciation (depreciation) | | | 126,483 | | | | (125,100 | ) | | | 56,497 | | | | (45,658 | ) |
| | | | | | | | | | | | | | | | |
Net increase (decrease) in net assets from operations | | | 92,478 | | | | (200,249 | ) | | | 40,407 | | | | (99,280 | ) |
| | | | | | | | | | | | | | | | |
| | | | |
Distributions | | | | | | | | | | | | | | | | |
From net investment income | | | (4,298 | ) | | | (5,806 | ) | | | (695 | ) | | | (1,578 | ) |
From net realized gain | | | — | | | | (3,972 | ) | | | — | | | | (44 | ) |
| | | | | | | | | | | | | | | | |
Net decrease in net assets from distributions | | | (4,298 | ) | | | (9,778 | ) | | | (695 | ) | | | (1,622 | ) |
| | | | | | | | | | | | | | | | |
| | | | |
Share Transactions | | | | | | | | | | | | | | | | |
Net increase (decrease) in net assets from share transactions | | | (9,640 | ) | | | 28,316 | | | | (4,129 | ) | | | (4,937 | ) |
| | | | | | | | | | | | | | | | |
| | | | |
Total Net Increase (Decrease) in Net Assets | | | 78,540 | | | | (181,711 | ) | | | 35,583 | | | | (105,839 | ) |
| | | | |
Net Assets | | | | | | | | | | | | | | | | |
Beginning of period | | | 298,211 | | | | 479,922 | | | | 123,088 | | | | 228,927 | |
| | | | | | | | | | | | | | | | |
End of period | | $ | 376,751 | | | $ | 298,211 | | | $ | 158,671 | | | $ | 123,088 | |
| | | | | | | | | | | | | | | | |
Undistributed (overdistributed) net investment income included in net assets | | $ | 777 | | | $ | 1,690 | | | $ | 165 | | | $ | — | |
See accompanying notes which are an integral part of the financial statements.
| | |
| 82 | | Statements of Changes in Net Assets |
| | | | | | | | | | | | | | | | | | | | | | |
| Non-U.S. Fund | | | Core Bond Fund | | | Real Estate
Securities Fund | |
| 2009 | | | 2008 | | | 2009 | | | 2008 | | | 2009 | | | 2008 | |
| | | | | | | | | | | | | | | | | | | | | | |
| | | | | | | | | | | | | | | | | | | | | | |
| | | | | |
| | | | | | | | | | | | | | | | | | | | | | |
| $ | 4,273 | | | $ | 7,095 | | | $ | 15,362 | | | $ | 16,634 | | | $ | 10,546 | | | $ | 11,970 | |
| | (16,624 | ) | | | (87,637 | ) | | | 6,556 | | | | 8,473 | | | | (39,112 | ) | | | (72,571 | ) |
| | 81,171 | | | | (106,389 | ) | | | 28,987 | | | | (40,513 | ) | | | 130,393 | | | | (115,578 | ) |
| | | | | | | | | | | | | | | | | | | | | | | |
| | 68,820 | | | | (186,931 | ) | | | 50,905 | | | | (15,406 | ) | | | 101,827 | | | | (176,179 | ) |
| | | | | | | | | | | | | | | | | | | | | | | |
| | | | | |
| | | | | | | | | | | | | | | | | | | | | | |
| | (7,901 | ) | | | — | | | | (16,238 | ) | | | (14,176 | ) | | | (14,717 | ) | | | (8,443 | ) |
| | — | | | | (3,345 | ) | | | (4,631 | ) | | | (6,979 | ) | | | — | | | | — | |
| | | | | | | | | | | | | | | | | | | | | | | |
| | (7,901 | ) | | | (3,345 | ) | | | (20,869 | ) | | | (21,155 | ) | | | (14,717 | ) | | | (8,443 | ) |
| | | | | | | | | | | | | | | | | | | | | | | |
| | | | | |
| | | | | | | | | | | | | | | | | | | | | | |
| | 5,476 | | | | 14,340 | | | | 51,424 | | | | 9,603 | | | | 20,182 | | | | (771 | ) |
| | | | | | | | | | | | | | | | | | | | | | | |
| | | | | |
| | 66,395 | | | | (175,936 | ) | | | 81,460 | | | | (26,958 | ) | | | 107,292 | | | | (185,393 | ) |
| | | | | |
| | | | | | | | | | | | | | | | | | | | | | |
| | 255,750 | | | | 431,686 | | | | 319,109 | | | | 346,067 | | | | 303,416 | | | | 488,809 | |
| | | | | | | | | | | | | | | | | | | | | | | |
| $ | 322,145 | | | $ | 255,750 | | | $ | 400,569 | | | $ | 319,109 | | | $ | 410,708 | | | $ | 303,416 | |
| | | | | | | | | | | | | | | | | | | | | | | |
$ |
2,995 |
| | $ | 1,726 | | | $ | 2,066 | | | $ | 2,838 | | | $ | 103 | | | $ | 4,013 | |
See accompanying notes which are an integral part of the financial statements.
| | |
| Statements of Changes in Net Assets | | 83 |
Russell Investment Funds
Financial Highlights — For the Periods Ended
For a Share Outstanding Throughout Each Period.
| | | | | | | | | | | | | | | | | | | |
| | |
$
Net Asset Value,
Beginning of
Period | | $
Net
Investment
Income (Loss)(a) | | $
Net Realized
and Unrealized
Gain (Loss) | | | $
Total from
Investment
Operations | | | $
Distributions
from Net
Investment Income | | | $
Distributions
from Net
Realized Gain | | | $
Total
Distributions | |
Multi-Style Equity Fund | |
December 31, 2009 | | 9.00 | | .10 | | 2.80 | | | 2.90 | | | (.13 | ) | | — | | | (.13 | ) |
December 31, 2008 | | 15.65 | | .19 | | (6.52 | ) | | (6.33 | ) | | (.19 | ) | | (.13 | ) | | (.32 | ) |
December 31, 2007 | | 14.93 | | .16 | | 1.37 | | | 1.53 | | | (.16 | ) | | (.65 | ) | | (.81 | ) |
December 31, 2006 | | 13.37 | | .14 | | 1.55 | | | 1.69 | | | (.13 | ) | | — | | | (.13 | ) |
December 31, 2005 | | 12.60 | | .12 | | .79 | | | .91 | | | (.14 | ) | | — | | | (.14 | ) |
Aggressive Equity Fund | |
December 31, 2009 | | 7.18 | | .05 | | 2.40 | | | 2.45 | | | (.04 | ) | | — | | | (.04 | ) |
December 31, 2008 | | 12.99 | | .09 | | (5.81 | ) | | (5.72 | ) | | (.09 | ) | | — | (c) | | (.09 | ) |
December 31, 2007 | | 14.45 | | .06 | | .40 | | | .46 | | | (.05 | ) | | (1.87 | ) | | (1.92 | ) |
December 31, 2006 | | 14.40 | | .03 | | 2.10 | | | 2.13 | | | (.03 | ) | | (2.05 | ) | | (2.08 | ) |
December 31, 2005 | | 14.90 | | .03 | | .90 | | | .93 | | | (.03 | ) | | (1.40 | ) | | (1.43 | ) |
Non-U.S. Fund | |
December 31, 2009 | | 7.48 | | .12 | | 1.88 | | | 2.00 | | | (.23 | ) | | — | | | (.23 | ) |
December 31, 2008 | | 13.20 | | .21 | | (5.83 | ) | | (5.62 | ) | | — | | | (.10 | ) | | (.10 | ) |
December 31, 2007 | | 15.01 | | .25 | | 1.14 | | | 1.39 | | | (.38 | ) | | (2.82 | ) | | (3.20 | ) |
December 31, 2006 | | 12.68 | | .23 | | 2.75 | | | 2.98 | | | (.35 | ) | | (.30 | ) | | (.65 | ) |
December 31, 2005 | | 11.33 | | .16 | | 1.38 | | | 1.54 | | | (.19 | ) | | — | | | (.19 | ) |
Core Bond Fund | |
December 31, 2009 | | 9.33 | | .44 | | 1.02 | | | 1.46 | | | (.46 | ) | | (.13 | ) | | (.59 | ) |
December 31, 2008 | | 10.32 | | .47 | | (.86 | ) | | (.39 | ) | | (.39 | ) | | (.21 | ) | | (.60 | ) |
December 31, 2007 | | 10.14 | | .51 | | .20 | | | .71 | | | (.53 | ) | | — | | | (.53 | ) |
December 31, 2006 | | 10.23 | | .45 | | (.08 | ) | | .37 | | | (.46 | ) | | — | | | (.46 | ) |
December 31, 2005 | | 10.50 | | .38 | | (.17 | ) | | .21 | | | (.37 | ) | | (.11 | ) | | (.48 | ) |
Real Estate Securities Fund | |
December 31, 2009 | | 9.30 | | .30 | | 2.41 | | | 2.71 | | | (.43 | ) | | — | | | (.43 | ) |
December 31, 2008 | | 15.22 | | .38 | | (6.03 | ) | | (5.65 | ) | | (.27 | ) | | — | | | (.27 | ) |
December 31, 2007 | | 21.34 | | .35 | | (3.68 | ) | | (3.33 | ) | | (.47 | ) | | (2.32 | ) | | (2.79 | ) |
December 31, 2006 | | 17.28 | | .37 | | 5.72 | | | 6.09 | | | (.39 | ) | | (1.64 | ) | | (2.03 | ) |
December 31, 2005 | | 17.09 | | .32 | | 1.82 | | | 2.14 | | | (.37 | ) | | (1.58 | ) | | (1.95 | ) |
See accompanying notes which are an integral part of the financial statements.
| | | | | | | | | | | | | |
$
Net Asset Value,
End of
Period | | %
Total
Return | | | $
Net Assets,
End of Period
(000) | | %
Ratio of Expenses
to Average
Net Assets,
Net(b) | | %
Ratio of Expenses
to Average
Net Assets,
Gross | | %
Ratio of Net
Investment Income
to Average
Net Assets(b) | | %
Portfolio
Turnover Rate |
| | | | | | | | | | | | | |
| 11.77 | | 32.72 | | | 376,751 | | .85 | | .86 | | 1.06 | | 136 |
| 9.00 | | (41.15 | ) | | 298,211 | | .87 | | .89 | | 1.50 | | 135 |
| 15.65 | | 10.36 | | | 479,922 | | .87 | | .87 | | 1.04 | | 136 |
| 14.93 | | 12.75 | | | 417,507 | | .87 | | .87 | | 1.03 | | 128 |
| 13.37 | | 7.27 | | | 349,659 | | .83 | | .87 | | .94 | | 130 |
| | | | | | | | | | | | | |
| 9.59 | | 34.32 | | | 158,671 | | 1.02 | | 1.13 | | .65 | | 161 |
| 7.18 | | (44.16 | ) | | 123,088 | | 1.05 | | 1.18 | | .84 | | 161 |
| 12.99 | | 3.42 | | | 228,927 | | 1.05 | | 1.13 | | .39 | | 180 |
| 14.45 | | 14.79 | | | 223,646 | | 1.05 | | 1.12 | | .16 | | 184 |
| 14.40 | | 6.36 | | | 204,292 | | .99 | | 1.13 | | .21 | | 130 |
| | | | | | | | | | | | | |
| 9.25 | | 27.33 | | | 322,145 | | 1.04 | | 1.12 | | 1.56 | | 133 |
| 7.48 | | (42.79 | ) | | 255,750 | | 1.15 | | 1.21 | | 2.01 | | 123 |
| 13.20 | | 10.12 | | | 431,686 | | 1.15 | | 1.18 | | 1.70 | | 106 |
| 15.01 | | 23.64 | | | 369,884 | | 1.15 | | 1.21 | | 1.64 | | 111 |
| 12.68 | | 13.69 | | | 302,261 | | 1.12 | | 1.26 | | 1.41 | | 88 |
| | | | | | | | | | | | | |
| 10.20 | | 16.18 | | | 400,569 | | .66 | | .73 | | 4.49 | | 151 |
| 9.33 | | (3.87 | ) | | 319,109 | | .70 | | .77 | | 4.70 | | 164 |
| 10.32 | | 7.24 | | | 346,067 | | .70 | | .78 | | 5.04 | | 965 |
| 10.14 | | 3.72 | | | 265,783 | | .70 | | .73 | | 4.40 | | 453 |
| 10.23 | | 2.01 | | | 216,774 | | .70 | | .72 | | 3.70 | | 193 |
| | | | | | | | | | | | | |
| 11.58 | | 31.16 | | | 410,708 | | .97 | | .97 | | 3.36 | | 110 |
| 9.30 | | (37.76 | ) | | 303,416 | | .96 | | .96 | | 2.72 | | 71 |
| 15.22 | | (15.86 | ) | | 488,809 | | .92 | | .92 | | 1.75 | | 77 |
| 21.34 | | 35.84 | | | 625,477 | | .90 | | .91 | | 1.86 | | 53 |
| 17.28 | | 12.96 | | | 443,092 | | .91 | | .91 | | 1.86 | | 64 |
See accompanying notes which are an integral part of the financial statements.
Russell Investment Funds
Notes to Financial Highlights — December 31, 2009
| (a) | Average daily shares outstanding were used for this calculation. |
| (b) | May reflect amounts waived and/or reimbursed by RIMCo, and for certain funds, custody credit arrangements. |
| (c) | Less than $.01 per share. |
See accompanying notes which are an integral part of the financial statements.
| | |
| 86 | | Notes to Financial Highlights |
(This page intentionally left blank)
Russell Investment Funds
Notes to Financial Statements — December 31, 2009
Russell Investment Funds (the “Investment Company” or “RIF”) is a series investment company with nine different investment portfolios referred to as Funds. These financial statements report on five of these Funds (each a “Fund” and collectively the “Funds”). The Investment Company provides the investment base for one or more variable insurance products issued by one or more insurance companies. These Funds are offered at net asset value to qualified insurance company separate accounts offering variable insurance products. The Investment Company is registered under the Investment Company Act of 1940, as amended, as an open-end management investment company. It is organized and operates as a Massachusetts business trust under an Amended and Restated Master Trust Agreement dated October 1, 2008. The Investment Company’s Master Trust Agreement permits the Board of Trustees (the “Board”) to issue an unlimited number of shares of beneficial interest.
| 2. | | Significant Accounting Policies |
The Funds’ financial statements are prepared in accordance with accounting principles generally accepted in the United States of America (“GAAP”) which require the use of management estimates and assumptions at the date of the financial statements. Actual results could differ from those estimates. The following is a summary of the significant accounting policies consistently followed by each Fund in the preparation of its financial statements.
Security Valuation
The Funds value portfolio securities according to Board-approved securities valuation procedures which include market and fair value procedures. Debt obligation securities maturing within 60 days of the time of purchase are priced using the amortized cost method of valuation, unless the Board determines that amortized cost does not represent market value of short-term debt obligations. The Board has delegated the responsibility for administration of the securities valuation procedures to Russell Fund Services Company (“RFSC”).
Ordinarily, the Funds value each portfolio security based on market quotations provided by independent pricing services or alternative pricing services or dealers (when permitted by the market value procedures). Pricing services may utilize evaluated pricing models which apply available market information through the use of benchmark curves, benchmarking of similar securities, sector groupings, spread adjustments and ratings. Generally, Fund portfolio securities are valued at the close of the principal exchange on which they are traded as follows:
| | • | | U.S. listed equities, equity and fixed income options and rights/warrants: Last sale price; last bid price if no last sale price. |
| | • | | U.S. over-the-counter equities: Official closing price; last bid price if no closing price. |
| | • | | Listed ADRs/GDRs: Last sale price; last bid price if no last sale price. |
| | • | | Municipal bonds, U.S. bonds, Eurobonds/foreign bonds: Evaluated bid price; broker quote if no evaluated bid price. |
| | • | | Futures: Settlement price. |
| | • | | Bank loans and forwards: Mean between bid and asking price. |
| | • | | Investments in other mutual funds are valued at their net asset value per share, calculated at 4 p.m. Eastern time or as of the close of the New York Stock Exchange, whichever is earlier. |
| | • | | The value of swap agreements is equal to the Funds’ obligation (or rights) under swap contracts which will generally be equal to the net amounts to be paid or received under the contracts based upon the relative values of the positions held by each party to the contracts. |
| | • | | Equity securities traded on a national foreign securities exchange or a foreign over the counter market are valued on the basis of the official closing price, or lacking the official closing price, at the last sale price of the primary exchange on which the security is traded. |
If market quotations are not readily available for a security or if subsequent events suggest that a market quotation is not reliable, the Funds will use the security’s fair value in accordance with the fair value procedures. The effect of fair value pricing is that securities may not be priced on the basis of quotations from the primary market in which they are traded, but rather may be priced by another method that the Board believes reflects fair value. The fair value procedures may involve subjective judgments (e.g. trade information, news, broker quotes) as to the fair value of securities. The use of fair value pricing by a Fund may cause the net asset value of its shares to differ significantly from the net asset value that would be calculated using normal pricing methods. Fair value pricing could also cause discrepancies between the daily movement of the value of Fund shares and the daily movement of the benchmark index if the index is valued using another pricing method.
This policy is intended to assure that the Funds’ net asset values fairly reflect security values as of the time of pricing. Events or circumstances affecting the values of Fund securities that occur between the closing of the principal markets on which they trade
| | |
| 88 | | Notes to Financial Statements |
Russell Investment Funds
Notes to Financial Statements, continued — December 31, 2009
and the time the net asset value of Fund shares is determined may be reflected in the calculation of net asset values for each applicable Fund when the Funds deem that the particular event or circumstance would materially affect such Fund’s net asset value. Funds that invest primarily in frequently traded exchange-listed securities will use fair value pricing in limited circumstances since reliable market quotations will often be readily available. Funds that invest in foreign securities are likely to use fair value pricing more often since significant events may occur between the close of foreign markets and the time of pricing which would trigger fair value pricing of the foreign securities. Funds that invest in low-rated debt securities are also likely to use fair value pricing more often since the markets in which such securities are traded are generally thinner, more limited and less active than those for higher rated securities. Examples of events that could trigger fair value pricing of one or more securities are: a material market movement of the U.S. securities market (defined in the fair value procedures as the movement by a single major U.S. Index greater than a certain percentage) or other significant event; foreign market holidays if on a daily basis, Fund exposure exceeds 20% in aggregate (all closed markets combined); a company development; a natural disaster; or an armed conflict.
The net asset value of a Fund’s portfolio that includes foreign securities may change on days when shareholders will not be able to purchase or redeem fund shares, since foreign securities can trade on non-business days.
Fair value of securities is defined as the price that the Funds would receive upon selling an investment in a timely transaction to an independent buyer in the principal or most advantageous market of the investment. To increase consistency and comparability in fair value measurement, the fair value hierarchy was established to maximize the use of observable market data and minimize the use of unobservable inputs and to establish classification of fair value measurements for disclosure purposes. Inputs refer broadly to the assumptions that market participants would use in pricing the asset, including assumptions about risk, for example, the risk inherent in a particular valuation technique used to measure fair value including a pricing model and/or risk inherent in the inputs to the valuation technique. Inputs may be observable or unobservable. Observable inputs are inputs that reflect the assumptions market participants would use in pricing the asset or liability developed based on market data obtained from sources independent of the reporting entity. Unobservable inputs are inputs that reflect the reporting entity’s own assumptions about the assumptions market participants would use in pricing the asset or liability developed based on the best information available in the circumstances.
The fair value hierarchy of inputs is summarized in the three broad levels listed below.
| | • | | Level 1 — quoted prices (unadjusted) in active markets for identical investments |
| | • | | Level 2 — other significant observable inputs (including quoted prices for similar investments, interest rates, prepayment speeds, credit risk, etc.) |
| | • | | Level 3 — significant unobservable inputs (including the Fund’s own assumptions in determining the fair value of investments) |
The levels associated with valuing the Funds’ investments for the period ended December 31, 2009 are disclosed in the Presentation of Portfolio Holdings.
Investment Transactions
Investment transactions are recorded on a trade date basis. Realized gains and losses from securities transactions, if any, are recorded on the basis of specific identified cost incurred by each money manager within a particular Fund.
Investment Income
Dividend income is recorded net of applicable withholding taxes on the ex-dividend date, except that certain dividends from foreign securities are recorded as soon thereafter as the Funds are informed of the ex-dividend date. Interest income is recorded daily on the accrual basis. The Core Bond Fund classifies gains and losses realized on prepayments received on mortgage-backed securities as part of interest income. All premiums and discounts, including original issue discounts, are amortized/accreted using the interest method.
Federal Income Taxes
Since the Investment Company is a Massachusetts business trust, each Fund is a separate corporate taxpayer and determines its net investment income and capital gains (or losses) and the amounts to be distributed to each Fund’s shareholders without regard to the income and capital gains (or losses) of the other Funds.
Each Fund qualifies as a regulated investment company under sub-chapter M of the Internal Revenue Code and distributes all of its taxable income and capital gains. Therefore, no federal income tax provision is required for the Funds.
Each Fund files a U. S. tax return. At December 31, 2009, the Funds have recorded no liabilities for net unrecognized tax benefits relating to uncertain income tax positions they have taken or expect to take in future tax returns. While the statute of
| | |
| Notes to Financial Statements | | 89 |
Russell Investment Funds
Notes to Financial Statements, continued — December 31, 2009
limitations remains open to examine the Funds’ U.S. tax returns filed for the fiscal years ending December 31, 2006 through December 31, 2008, no examinations are in progress or anticipated at this time. The Funds are not aware of any tax positions for which it is reasonably possible that the total amounts of unrecognized tax benefits will significantly change in the next twelve months.
Dividends and Distributions to Shareholders
For all Funds, income and capital gain distributions, if any, are recorded on the ex-dividend date. Income distributions are generally declared and paid quarterly, except for the Non-U.S. Fund, which generally declares and pays income distributions annually. Capital gain distributions are generally declared and paid annually. An additional distribution may be paid by the Funds to avoid imposition of federal income and excise tax on any remaining undistributed capital gains and net investment income.
The timing and characterization of certain income and capital gain distributions are determined in accordance with federal tax regulations which may differ from GAAP. As a result, net investment income and net realized gain (or loss) from investment and foreign currency-related transactions for a reporting period may differ significantly from distributions during such period. The differences between tax regulations and GAAP primarily relate to investments in options, futures, forward contracts, swap contracts, passive foreign investment companies, foreign-denominated investments, mortgage-backed securities, certain securities sold at a loss and capital loss carryforwards.
Expenses
The Funds will pay their own expenses other than those expressly assumed by Russell Investment Management Company (“RIMCo”) or RFSC. Most expenses can be directly attributed to the individual Funds. Expenses which cannot be directly attributed to a specific Fund are allocated among all Funds principally based on their relative net assets.
Foreign Currency Translations
The books and records of the Funds are maintained in U.S. dollars. Foreign currency amounts and transactions of the Funds are translated into U.S. dollars on the following basis:
(a) Market value of investment securities, other assets and liabilities at the closing rate of exchange on the valuation date.
(b) Purchases and sales of investment securities and income at the closing rate of exchange prevailing on the respective trade dates of such transactions.
Net realized gains or losses from foreign currency-related transactions arise from: sales and maturities of short-term securities; sales of foreign currencies; currency gains or losses realized between the trade and settlement dates on securities transactions; the difference between the amounts of dividends, interest, and foreign withholding taxes recorded on the Non-U.S. Fund’s books and the U.S. dollar equivalent of the amounts actually received or paid. Net unrealized gains or losses from foreign currency-related transactions arise from changes in the value of assets and liabilities, other than investments in securities, at year-end, as a result of changes in the exchange rates.
The Funds do not isolate that portion of the results of operations of the Funds that arises as a result of changes in exchange rates from that portion that arises from changes in market prices of investments during the year. Such fluctuations are included with the net realized and unrealized gain or loss from investments. However, for federal income tax purposes the Funds do isolate the effects of changes in foreign exchange rates from the fluctuations arising from changes in market prices for realized gain (or loss) on debt obligations.
Capital Gains Taxes
The Non-U.S. Fund may be subject to capital gains taxes and repatriation taxes imposed by certain countries in which it invests. The Non-U.S. Fund may record a deferred tax liability in respect of unrealized appreciation on foreign securities for potential capital gains and repatriation taxes at December 31, 2009. The accrual for capital gains and repatriation taxes is included in net unrealized appreciation (depreciation) on investments in the Statements of Assets and Liabilities for the Fund. The amounts related to capital gains and repatriation taxes are included in net realized gain (loss) on investments in the Statements of Operations for the Fund. The Non-U.S. Fund had no deferred tax liability but incurred $2,691 capital gains taxes for the period ended December 31, 2009.
| | |
| 90 | | Notes to Financial Statements |
Russell Investment Funds
Notes to Financial Statements, continued — December 31, 2009
Derivatives
To the extent permitted by the investment objectives, restrictions and policies set forth in the Funds’ Prospectus and Statement of Additional Information, the Funds may participate in various derivative-based transactions. Derivative securities are instruments or agreements whose value is derived from an underlying security or index. They include options, futures, swaps, forwards, structured notes and stripped securities. These instruments offer unique characteristics and risks that assist the Funds in meeting their investment strategies.
The Funds typically use derivatives in three ways: exposing cash reserves to markets, hedging and return enhancement. In addition, the Non-U.S. and Real Estate Securities Funds may enter into foreign exchange contracts for trade settlement purposes. The Funds, other than the Real Estate Securities Fund, may pursue their strategy to be fully invested by exposing cash reserves to the performance of appropriate markets by purchasing securities and/or derivatives. This is intended to cause the Funds to perform as though cash reserves were actually invested in those markets. Hedging is also used by some Funds to limit or control risks, such as adverse movements in exchange rates and interest rates. Return enhancement can be accomplished through the use of derivatives in a Fund. By purchasing certain instruments, Funds may more effectively achieve the desired portfolio characteristics that assist them in meeting their investment objectives. Depending on how the derivatives are structured and utilized, the risks associated with them may vary widely. These risks are generally categorized as market risk, liquidity risk and counterparty or credit risk.
The Funds’ period end derivatives, as presented in the Schedule of Investments or the tables following, generally are indicative of the volume of their derivative activity during the period ended December 31, 2009.
| | |
| Notes to Financial Statements | | 91 |
Russell Investment Funds
Notes to Financial Statements, continued — December 31, 2009
The fair values of the Fund’s derivative instruments categorized by risk exposure for the period ended December 31, 2009 were as follows:
(Amounts in thousands)
| | | | | | | | | | | | |
| | | Multi-Style Equity Fund |
| Derivatives not accounted for as hedging instruments | | Credit
Contracts | | Equity
Contracts | | Foreign Currency
Contracts | | Interest Rate
Contracts |
| | | | | | | | | | | | |
Location: Statement of Assets and Liabilities - Assets | | | | | | | | | | | | |
Investments, at market value | | $ | — | | $ | — | | $ | — | | $ | — |
Unrealized appreciation on foreign currency exchange contracts | | | — | | | — | | | — | | | — |
Daily variation margin on futures contracts* | | | — | | | 363 | | | — | | | — |
Interest rate swap contracts, at market value | | | — | | | — | | | — | | | — |
Credit default swap contracts, at market value | | | — | | | — | | | — | | | — |
Unrealized appreciation on index swap contracts | | | | | | | | | | | | |
| | | | | | | | | | | | |
Total | | $ | — | | $ | 363 | | $ | — | | $ | — |
| | | | | | | | | | | | |
Location: Statement of Assets and Liabilities - Liabilities | | | | | | | | | | | | |
Unrealized depreciation on foreign currency exchange contracts | | $ | — | | $ | — | | $ | — | | $ | — |
Daily variation margin on futures contracts* | | | — | | | — | | | — | | | — |
Interest rate swap contracts, at market value | | | — | | | — | | | — | | | — |
Credit default swap contracts, at market value | | | — | | | — | | | — | | | — |
Unrealized depreciation on index swap contracts | | | — | | | — | | | — | | | — |
Options written, at market value | | | — | | | — | | | — | | | — |
| | | | | | | | | | | | |
Total | | $ | — | | $ | — | | $ | — | | $ | — |
| | | | | | | | | | | | |
| | | | | | | | | | | | |
| | | Core Bond Fund |
| Derivatives not accounted for as hedging instruments | | Credit
Contracts | | Equity
Contracts | | Foreign Currency
Contracts | | Interest Rate
Contracts |
| | | | | | | | | | | | |
Location: Statement of Assets and Liabilities - Assets | | | | | | | | | | | | |
Investments, at market value | | $ | — | | $ | — | | $ | — | | $ | — |
Unrealized depreciation on foreign currency exchange contracts | | | — | | | — | | | 238 | | | — |
Daily variation margin on futures contracts* | | | — | | | — | | | — | | | 397 |
Interest rate swap contracts, at market value | | | — | | | — | | | — | | | 1,063 |
Credit default swap contracts, at market value | | | 941 | | | — | | | — | | | — |
Unrealized appreciation on index swap contracts | | | — | | | — | | | — | | | — |
| | | | | | | | | | | | |
Total | | $ | 941 | | $ | — | | $ | 238 | | $ | 1,460 |
| | | | | | | | | | | | |
Location: Statement of Assets and Liabilities - Liabilities | | | | | | | | | | | | |
Unrealized depreciation on foreign currency exchange contracts | | $ | — | | $ | — | | $ | 166 | | $ | — |
Daily variation margin on futures contracts* | | | — | | | — | | | — | | | 1,311 |
Interest rate swap contracts, at market value | | | — | | | — | | | — | | | 398 |
Credit default swap contracts, at market value | | | 2,483 | | | — | | | — | | | — |
Unrealized depreciation on index swap contracts | | | — | | | — | | | — | | | — |
Options written, at market value | | | — | | | — | | | — | | | 276 |
| | | | | | | | | | | | |
Total | | $ | 2,483 | | $ | — | | $ | 166 | | $ | 1,985 |
| | | | | | | | | | | | |
| * | | Includes cumulative appreciation/depreciation of futures contracts as reported in Schedule of Investments. Only current day’s variation margin is reported within the statement of assets & liabilities. |
| | |
| 92 | | Notes to Financial Statements |
Russell Investment Funds
Notes to Financial Statements, continued — December 31, 2009
| | | | | | | | | | | | | | | | | | | | | | |
| Aggressive Equity Fund | | Non-U.S. Fund |
Credit
Contracts | | Equity
Contracts | | Foreign Currency
Contracts | | Interest Rate
Contracts | | Credit
Contracts | | Equity
Contracts | | Foreign Currency
Contracts | | Interest Rate
Contracts |
| | | | | | | | | | | | | | | | | | | | | | |
| | | | | | | | | | | | | | | | | | | | | | |
| $ | — | | $ | — | | $ | — | | $ | — | | $ | — | | $ | — | | $ | — | | $ | — |
| | — | | | — | | | — | | | — | | | — | | | — | | | 28 | | | — |
| | — | | | 377 | | | — | | | — | | | — | | | 555 | | | — | | | — |
| | — | | | — | | | — | | | — | | | — | | | — | | | — | | | — |
| | — | | | — | | | — | | | — | | | — | | | — | | | — | | | — |
| | | | | | | | | | | | | | | | | | | | | | |
| | | | | | | | | | | | | | | | | | | | | | | |
| $ | — | | $ | 377 | | $ | — | | $ | — | | $ | — | | $ | 555 | | $ | 28 | | $ | — |
| | | | | | | | | | | | | | | | | | | | | | | |
| | | | | | | | | | | | | | | | | | | | | | |
| $ | — | | $ | — | | $ | — | | $ | — | | $ | — | | $ | — | | $ | 857 | | $ | — |
| | — | | | — | | | — | | | — | | | — | | | — | | | — | | | — |
| | — | | | — | | | — | | | — | | | — | | | — | | | — | | | — |
| | — | | | — | | | — | | | — | | | — | | | — | | | — | | | — |
| | — | | | — | | | — | | | — | | | — | | | — | | | — | | | — |
| | — | | | — | | | — | | | — | | | — | | | — | | | — | | | — |
| | | | | | | | | | | | | | | | | | | | | | | |
| $ | — | | $ | — | | $ | — | | $ | — | | $ | — | | $ | — | | $ | 857 | | $ | — |
| | | | | | | | | | | | | | | | | | | | | | | |
| | | | | | | | | | | |
| Real Estate Securities Fund |
Credit
Contracts | | Equity
Contracts | | Foreign Currency
Contracts | | | Interest Rate
Contracts |
| | | | | | | | | | | |
| | | | | | | | | | | |
| $ | — | | $ | — | | $ | — | | | $ | — |
| | — | | | — | | | — | ** | | | — |
| | — | | | — | | | — | | | | — |
| | — | | | — | | | — | | | | — |
| | — | | | — | | | — | | | | — |
| | — | | | — | | | — | | | | — |
| | | | | | | | | | | | |
| $ | — | | $ | — | | $ | — | | | $ | — |
| | | | | | | | | | | | |
| | | | | | | | | | | |
| $ | — | | $ | — | | $ | — | ** | | $ | — |
| | — | | | — | | | — | | | | — |
| | — | | | — | | | — | | | | — |
| | — | | | — | | | — | | | | — |
| | — | | | — | | | — | | | | — |
| | — | | | — | | | — | | | | — |
| | | | | | | | | | | | |
| $ | — | | $ | — | | $ | — | | | $ | — |
| | | | | | | | | | | | |
| | |
| Notes to Financial Statements | | 93 |
Russell Investment Funds
Notes to Financial Statements, continued — December 31, 2009
The effects of the Funds with derivative instruments on the Statement of Operations for the period ended December 31, 2009 were as follows:
(Amounts in thousands)
| | | | | | | | | | | | | |
| | | Multi-Style Equity Fund |
| Derivatives not accounted for as hedging instruments | | Credit
Contracts | | Equity
Contracts | | | Foreign Currency
Contracts | | Interest Rate
Contracts |
| | | | | | | | | | | | | |
Location: Statement of Operations - Net realized gain (loss) | | | | | | | | | | | | | |
Investments* | | $ | — | | $ | — | | | $ | — | | $ | — |
Futures contracts | | | — | | | 4,673 | | | | — | | | — |
Options Written | | | — | | | — | | | | — | | | — |
Credit default swap contracts | | | — | | | — | | | | — | | | — |
Index swap contracts | | | — | | | — | | | | — | | | — |
Interest rate swap contracts | | | — | | | — | | | | — | | | — |
Foreign currency-related transactions | | | — | | | — | | | | — | | | — |
| | | | | | | | | | | | | |
Total | | $ | — | | $ | 4,673 | | | $ | — | | $ | — |
| | | | | | | | | | | | | |
Location: Statement of Operations - Net change in unrealized appreciation (depreciation) | | | | | | | | | | | | | |
Investments** | | $ | — | | $ | — | | | $ | — | | $ | — |
Futures contracts | | | — | | | (91 | ) | | | — | | | — |
Options Written | | | — | | | — | | | | — | | | — |
Credit default swap contracts | | | — | | | — | | | | — | | | — |
Index swap contracts | | | — | | | — | | | | — | | | — |
Interest rate swap contracts | | | — | | | — | | | | — | | | — |
Foreign currency-related transactions | | | — | | | — | | | | — | | | — |
| | | | | | | | | | | | | |
Total | | $ | — | | $ | (91 | ) | | $ | — | | $ | — |
| | | | | | | | | | | | | |
| | | | | | | | | | | | | | | |
| | | Core Bond Fund | |
| Derivatives not accounted for as hedging instruments | | Credit
Contracts | | | Equity
Contracts | | Foreign Currency
Contracts | | | Interest Rate
Contracts | |
| | | | | | | | | | | | | | | |
Location: Statement of Operations - Net realized gain (loss) | | | | | | | | | | | | | | | |
Investments* | | $ | — | | | $ | — | | $ | — | | | $ | (581 | ) |
Futures contracts | | | — | | | | — | | | — | | | | 3,900 | |
Options Written | | | — | | | | — | | | — | | | | (797 | ) |
Credit default swap contracts | | | (2,403 | ) | | | — | | | — | | | | — | |
Index swap contracts | | | — | | | | — | | | — | | | | — | |
Interest rate swap contracts | | | — | | | | — | | | — | | | | 3,598 | |
Foreign currency-related transactions | | | — | | | | — | | | (283 | ) | | | — | |
| | | | | | | | | | | | | | | |
Total | | $ | (2,403 | ) | | $ | — | | $ | (283 | ) | | $ | 6,120 | |
| | | | | | | | | | | | | | | |
Location: Statement of Operations - Net change in unrealized appreciation (depreciation) | | | | | | | | | | | | | | | |
Investments** | | $ | — | | | $ | — | | $ | — | | | $ | (1,579 | ) |
Futures contracts | | | — | | | | — | | | — | | | | (3,262 | ) |
Options Written | | | — | | | | — | | | — | | | | 1,650 | |
Credit default swap contracts | | | 840 | | | | — | | | — | | | | — | |
Index swap contracts | | | — | | | | — | | | — | | | | — | |
Interest rate swap contracts | | | — | | | | — | | | — | | | | 456 | |
Foreign currency-related transactions | | | — | | | | — | | | 241 | | | | — | |
| | | | | | | | | | | | | | | |
Total | | $ | 840 | | | $ | — | | $ | 241 | | | $ | (2,735 | ) |
| | | | | | | | | | | | | | | |
| * | Includes net realized gain(loss) on purchased options as reported in the Statements of Operations. |
| ** | Includes net change in unrealized appreciation/depreciation on purchased options. |
| | |
| 94 | | Notes to Financial Statements |
Russell Investment Funds
Notes to Financial Statements, continued — December 31, 2009
| | | | | | | | | | | | | | | | | | | | | | | | |
| Aggressive Equity Fund | | Non-U.S. Fund |
Credit
Contracts | | Equity
Contracts | | | Foreign Currency
Contracts | | Interest Rate
Contracts | | Credit
Contracts | | Equity
Contracts | | Foreign Currency
Contracts | | | Interest Rate
Contracts |
| | | | | | | | | | | | | | | | | | | | | | | | |
| | | | | | | | | | | | | | | | | | | | | | | | |
| $ | — | | $ | — | | | $ | — | | $ | — | | $ | — | | $ | — | | $ | — | | | $ | — |
| | — | | | 2,039 | | | | — | | | — | | | — | | | 5,389 | | | — | | | | — |
| | — | | | — | | | | — | | | — | | | — | | | — | | | — | | | | — |
| | — | | | — | | | | — | | | — | | | — | | | — | | | — | | | | — |
| | — | | | — | | | | — | | | — | | | — | | | — | | | — | | | | — |
| | — | | | — | | | | — | | | — | | | — | | | — | | | — | | | | — |
| | — | | | — | | | | — | | | — | | | — | | | — | | | 3,626 | | | | — |
| | | | | | | | | | | | | | | | | | | | | | | | | |
| $ | — | | $ | 2,039 | | | $ | — | | $ | — | | $ | — | | $ | 5,389 | | $ | 3,626 | | | $ | — |
| | | | | | | | | | | | | | | | | | | | | | | | | |
| | | | | | | | | | | | | | | | | | | | | | | | |
| $ | — | | $ | — | | | $ | — | | $ | — | | $ | — | | $ | — | | $ | — | | | $ | — |
| | — | | | (266 | ) | | | — | | | — | | | — | | | 42 | | | — | | | | — |
| | — | | | — | | | | — | | | — | | | — | | | — | | | — | | | | — |
| | — | | | — | | | | — | | | — | | | — | | | — | | | — | | | | — |
| | — | | | — | | | | — | | | — | | | — | | | — | | | — | | | | — |
| | — | | | — | | | | — | | | — | | | — | | | — | | | — | | | | — |
| | — | | | — | | | | — | | | — | | | — | | | — | | | (2,433 | ) | | | — |
| | | | | | | | | | | | | | | | | | | | | | | | | |
| $ | — | | $ | (266 | ) | | $ | — | | $ | — | | $ | — | | $ | 42 | | $ | (2,433 | ) | | $ | — |
| | | | | | | | | | | | | | | | | | | | | | | | | |
| | | | | | | | | | | |
| Real Estate Securities Fund |
Credit
Contracts | | Equity
Contracts | | Foreign Currency
Contracts | | | Interest Rate
Contracts |
| | | | | | | | | | | |
| | | | | | | | | | | |
| $ | — | | $ | — | | $ | — | | | $ | — |
| | — | | | — | | | — | | | | — |
| | — | | | — | | | — | | | | — |
| | — | | | — | | | — | | | | — |
| | — | | | — | | | — | | | | — |
| | — | | | — | | | — | | | | — |
| | — | | | — | | | 26 | | | | — |
| | | | | | | | | | | | |
| $ | — | | $ | — | | $ | 26 | | | $ | — |
| | | | | | | | | | | | |
| | | | | | | | | | | |
| $ | — | | $ | — | | $ | — | | | $ | — |
| | — | | | — | | | — | | | | — |
| | — | | | — | | | — | | | | — |
| | — | | | — | | | — | | | | — |
| | — | | | — | | | — | | | | — |
| | — | | | — | | | — | | | | — |
| | — | | | — | | | (1 | ) | | | — |
| | | | | | | | | | | | |
| $ | — | | $ | — | | $ | (1 | ) | | $ | — |
| | | | | | | | | | | | |
| | |
| Notes to Financial Statements | | 95 |
Russell Investment Funds
Notes to Financial Statements, continued — December 31, 2009
Foreign Currency Exchange Contracts
In connection with investment transactions consistent with the Funds’ investment objective and strategies, certain Funds may enter into foreign currency exchange spot contracts and forward foreign currency exchange contracts (“contracts”). From time to time the Funds may enter into contracts to hedge certain foreign currency-denominated assets. Contracts are recorded at market value. Certain risks may arise upon entering into these contracts from the potential inability of counterparties to meet the terms of their contracts and are generally limited to the amount of unrealized gain on the contracts, if any, that are recognized in the Statements of Assets and Liabilities. Realized gains or losses arising from such transactions are included in net realized gain (or loss) from foreign currency-related transactions.
For the period ended December 31, 2009, the following Funds entered into foreign currency exchange contracts primarily for the strategies listed below:
| | |
| Funds | | Strategies |
Non-U.S. Fund | | Exposing cash reserves and trade settlement |
Core Bond Fund | | Return enhancement and hedging |
Real Estate Securities Fund | | Trade settlement |
Options
The Funds may purchase and sell (write) call and put options on securities and securities indices, provided such options are traded on a national securities exchange or in an over-the-counter market. The Funds may also purchase and sell call and put options on foreign currencies. The domestic equity Funds may utilize options to expose cash reserves to markets.
When a Fund writes a covered call or a put option, an amount equal to the premium received by the Fund is included in the Fund’s Statement of Assets and Liabilities as an asset and as an equivalent liability. The amount of the liability is subsequently marked-to-market to reflect the current market value of the option written. The Fund receives a premium on the sale of a call option but gives up the opportunity to profit from any increase in stock value above the exercise price of the option, and when the Fund writes a put option it is exposed to a decline in the price of the underlying security.
Whether an option which the Fund has written expires on its stipulated expiration date or the Fund enters into a closing purchase transaction, the Fund realizes a gain (or loss, if the cost of a closing purchase transaction exceeds the premium received when the option was sold) without regard to any unrealized gain or loss on the underlying security, and the liability related to such option is extinguished. If a call option which the Fund has written is exercised, the Fund realizes a capital gain or loss from the sale of the underlying security, and the proceeds from such sale are increased by the premium originally received. When a put option which a Fund has written is exercised, the amount of the premium originally received will reduce the cost of the security which a Fund purchases upon exercise of the option. Realized gains (losses) on purchased options are included in net realized gain (loss) from investments on the Statements of Operations.
The Funds’ use of written options involves, to varying degrees, elements of market risk in excess of the amount recognized in the Statements of Assets and Liabilities. The face or contract amounts of these instruments reflect the extent of the Funds’ exposure to market risk. The risks may be caused by an imperfect correlation between movements in the price of the instrument and the price of the underlying securities and interest rates.
A Fund may enter into a swaption (swap option). In a swaption, the buyer gains the right but not the obligation to enter into a specified swap agreement with the issuer on a specified future date. The writer of the contract receives the premium and bears the risk of unfavorable changes in the preset rate on the underlying interest rate swap. Unrealized gains/losses on swaptions are reflected in investment assets and investment liabilities in the Fund’s Statement of Assets and Liabilities.
For the period ended December 31, 2009, the Core Bond Fund purchased/sold options primarily for return enhancement and hedging.
Futures Contracts
The Funds may invest in futures contracts (i.e., interest rate, foreign currency and index futures contracts) to a limited extent. The face or contract amounts of these instruments reflect the extent of the Funds’ exposure to off balance sheet risk. The primary risks associated with the use of futures contracts are an imperfect correlation between the change in market value of the securities held by the Fund and the prices of futures contracts and the possibility of an illiquid market. Upon entering into a futures contract, the Funds are required to deposit with a broker an amount, termed the initial margin, which typically represents 5% of the purchase price indicated in the futures contract. Payments to and from the broker, known as variation margin, are required to be made on a daily basis as the price of the futures contract fluctuates. Changes in initial settlement value are accounted for as unrealized appreciation (depreciation) until the contracts are terminated, at which time realized gains and losses are recognized.
| | |
| 96 | | Notes to Financial Statements |
Russell Investment Funds
Notes to Financial Statements, continued — December 31, 2009
For the period ended December 31, 2009, the following funds entered into future contracts primarily for the strategies listed below:
| | |
| Funds | | Strategies |
Multi Style Equity Fund | | Exposing cash reserves |
Aggressive Equity Fund | | Exposing cash reserves |
Non-U.S. Fund | | Exposing cash reserves |
Core Bond Fund | | Return enhancement, hedging and exposing cash reserves |
As December 31, 2009, the Funds had cash collateral balances in connection with futures contracts purchased (sold) as follows:
| | | |
| | | Cash Collateral |
| | | |
Multi-Style Equity Fund | | $ | 2,200,000 |
Aggressive Equity Fund | | | 700,000 |
Non-U.S. Fund | | | 2,800,000 |
Core Bond Fund | | | 127,250 |
Swap Agreements
The Funds may enter into swap agreements, on either an asset-based or liability-based basis, depending on whether they are hedging their assets or their liabilities, and will usually enter into swaps on a net basis, i.e., the two payment streams are netted out, with the Funds receiving or paying, as the case may be, only the net amount of the two payments. When a Fund engages in a swap, it exchanges its obligations to pay or rights to receive payments for the obligations or rights to receive payments of another party (i.e., an exchange of floating rate payments for fixed rate payments).
Certain Funds may enter into several different types of agreements including interest rate, credit default and currency swaps. The Funds may enter into index swap agreements to expose cash reserves to markets or to effect investment transactions consistent with those Funds’ investment objectives and strategies. Interest rate swaps are a counterparty agreement, can be customized to meet each party’s needs, and involve the exchange of a fixed payment per period for a payment that is not fixed. Currency swaps are an agreement where two parties exchange specified amounts of different currencies which are followed by a series of interest payments that are exchanged based on the principal cash flow. At maturity the principal amounts are exchanged back. Credit default swaps are a counterparty agreement which allows the transfer of third party credit risk (the possibility that an issuer will default on their obligation by failing to pay principal or interest in a timely manner) from one party to another. The lender faces the credit risk from a third party and the counterparty in the swap agrees to insure this risk in exchange for regular periodic payments.
The Funds expect to enter into these transactions primarily to preserve a return or spread on a particular investment or portion of their portfolios or to protect against any increase in the price of securities they anticipate purchasing at a later date. The net amount of the excess, if any, of the Funds’ obligations over their entitlements with respect to each swap will be accrued on a daily basis and an amount of cash or liquid high-grade debt securities having an aggregate net asset value at least equal to the accrued excess will be segregated. To the extent that the Funds enter into swaps on other than a net basis, the amount earmarked on the Funds’ records will be the full amount of the Funds’ obligations, if any, with respect to such interest rate swaps, accrued on a daily basis. If there is a default by the other party to such a transaction, the Funds will have contractual remedies pursuant to the agreement related to the transaction. The swap market has grown substantially in recent years with a large number of banks and investment banking firms acting both as principals and as agents utilizing standardized swap documentation. As a result, the swap market has become more liquid.
A Fund may not receive the expected amount under a swap agreement if the other party to the agreement defaults or becomes bankrupt. The market for swap agreements is largely unregulated. The Funds may enter into swap agreements with counterparties that meet RIMCo’s credit quality limitations. The Funds will not enter into any swap unless the counterparty has a minimum senior unsecured credit rating or long term counterparty credit rating, including reassignments, of A- or better as defined by Standard & Poor’s or an equivalent rating from any nationally recognized statistical rating organization (using highest or split ratings) at the time of entering into such transaction.
Swap agreements generally are entered into by “eligible participants” and in compliance with certain other criteria necessary to render them excluded from regulation under the Commodity Exchange Act (“CEA”) and, therefore not subject to regulation as futures or commodity option transactions under the CEA.
As of December 31, 2009, the Core Bond Fund had cash collateral balances in connection with swaps contracts purchased (sold) as follows:
| | | | | | |
| | | Cash
Collateral for Swaps | | Due to Broker |
| | | | | | |
Core Bond Fund | | $ | 1,852,071 | | $ | 1,490,120 |
| | | | | | |
| | | | | | |
| | | | | | |
| | |
| Notes to Financial Statements | | 97 |
Russell Investment Funds
Notes to Financial Statements, continued — December 31, 2009
Credit Default Swaps
The Core Bond Fund may enter into credit default swaps. A credit default swap can refer to corporate issues, asset-backed securities or an index of assets, each known as the reference entity or underlying asset. The Fund may act as either the buyer or the seller of a credit default swap involving one party making a stream of payments to another party in exchange for the right to receive a specified return in the event of a default or other credit event. Depending upon the terms of the contract, the credit default swap may be closed via physical settlement. However, if there is instability in the market, there is a risk that the Fund may be unable to deliver the underlying debt security to the other party to the agreement. Additionally, the Fund may not receive the expected amount under the swap agreement if the other party to the agreement defaults or becomes bankrupt. In an unhedged credit default swap, the Fund enters into a credit default swap without owning the underlying asset or debt issued by the reference entity. Credit default swaps allow the Fund to acquire or reduce credit exposure to a particular issuer, asset or basket of assets.
As the seller in a credit default swap, the Fund would be required to pay the par or other agreed-upon value (or otherwise perform according to the swap contract) of a reference debt obligation to the counterparty in the event of a default (or other specified credit event); the counterparty would be required to surrender the reference debt obligation. In return, the Fund would receive from the counterparty a periodic stream of payments over the term of the contract provided that no credit event has occurred. If no credit event occurs, the Fund would keep the stream of payments and would have no payment obligations. As a seller, the Fund would effectively add leverage to its portfolio because, in addition to its total net assets, that Fund would be subject to investment exposure on the notional amount of the swap.
The Fund may also purchase credit default swap contracts in order to offset the risk of default of debt securities held in its portfolio, in which case the Fund would function as the counterparty referenced in the preceding paragraph.
If a credit event occurs on a corporate issue and cash settlement is not elected, a variety of other deliverable obligations may be delivered in lieu of the specific referenced obligation. The ability to deliver other obligations may result in a cheapest-to-deliver option (the buyer of protection’s right to choose the deliverable obligation with the lowest value following a credit event). The Fund may use credit default swaps on corporate issues to provide a measure of protection against defaults of the issuers (i.e., to reduce risk where the Fund owns or has exposure to the referenced obligation) or to take an active long or short position with respect to the likelihood (as measured by the credit default swap’s spread) of a particular issuer’s default.
Unlike credit default swaps on corporate issues, deliverable obligations for credit default swaps on asset-backed securities in most instances are limited to the specific referenced obligation as performance for asset-backed securities can vary across deals. Prepayments, principal paydowns, and other write-down or loss events on the underlying mortgage loans will reduce the outstanding principal balance of the referenced obligation. These reductions may be temporary or permanent as defined under the terms of the swap agreement and the notional amount for the swap agreement generally will be adjusted by corresponding amounts. The Fund may use credit default swaps on asset-backed securities to provide a measure of protection against defaults (or other defined credit events) of the referenced obligation or to take an active long or short position with respect to the likelihood of a particular referenced obligation’s default (or other defined credit events).
Credit default swap agreements on credit indices involve one party making a stream of payments to another party in exchange for the right to receive a specified return in the event of a write down, principal shortfall, interest shortfall or default of all or part of the referenced entities comprising the credit index. A credit index is of a basket of credit instruments or exposures designed to be representative of some part of the credit market as a whole. These indices are made up of reference credits that are judged by a poll of dealers to be the most liquid entities in the credit default swap market based on the sector of the index. Components of the indices may include, but are not limited to, investment grade securities, high yield securities, asset backed securities, emerging markets, and/or various credit ratings within each sector. Credit indices are traded using credit default swaps with standardized terms including a fixed spread and standard maturity dates. An index credit default swap references all the names in the index, and if there is a default, the credit event is settled based on that name’s weight in the index. The composition of the indices changes periodically, usually every six months, and for most indices, each name has an equal weight in the index. Traders may use credit-default swaps on indices to speculate on changes in credit quality.
Implied credit spreads, represented in absolute terms, utilized in determining the market value of credit default swap agreements on corporate issues as of period end are disclosed in the Schedule of Investments and generally serve as an indicator of the current status of the payment/performance risk and represent the likelihood or risk of default (or other defined credit event) for the credit derivative. The implied credit spread of a particular referenced entity reflects the cost of entering into a credit default swap and may include upfront payments required to be made to enter into the agreement. For credit default swap agreements on asset-backed securities and credit indices, the quoted market prices and resulting values serve as the indicator of the current status of the payment/performance risk. Wider credit spreads and increasing market values, in absolute terms when compared to the notional amount of the swap, generally represent a deterioration of the referenced entity’s credit soundness and a greater likelihood or risk of default or other credit event occurring as defined under the terms of the agreement. The maximum potential amount of future payments (undiscounted) that a Fund as a seller of protection could be required to make under a credit default
| | |
| 98 | | Notes to Financial Statements |
Russell Investment Funds
Notes to Financial Statements, continued — December 31, 2009
swap agreement would be an amount equal to the notional amount of the agreement. Notional amounts of all credit default swap agreements outstanding as of December 31, 2009 for which a Fund is the seller of protection are disclosed in the Schedules of Investments. These potential amounts would be partially offset by any recovery values of the respective referenced obligations, upfront payments received upon entering into the agreement, or net amounts received from the settlement of buy protection credit default swap agreements entered into by a Fund for the same referenced entity or entities.
Credit default swaps could result in losses if the Fund does not correctly evaluate the creditworthiness of the company or companies on which the credit default swap is based. Credit default swap agreements may involve greater risks than if the Fund had invested in the reference obligation directly since, in addition to risks relating to the reference obligation, credit default swaps are subject to illiquidity risk, counterparty risk and credit risk. The Fund will generally incur a greater degree of risk when it sells a credit default swap than when its purchases a credit default swap. As a buyer of credit default swap, the Fund may lose its investment and recover nothing should a credit event fail to occur and the swap is held to its termination date. As seller of a credit default swap, if a credit event were to occur, the value of any deliverable obligation received by the Fund, coupled with the upfront or periodic payments previously received, may be less than what it pays to the buyer, resulting in a loss of value to the Fund.
If the creditworthiness of the Fund’s swap counterparty declines, the risk that the counterparty may not perform could increase, potentially resulting in a loss to the Fund. To limit the counterparty risk involved in swap agreements, the Funds will only enter into swap agreements with counterparties that meet certain standards of creditworthiness. Although there can be no assurance that the Fund will be able to do so, the Fund may be able to reduce or eliminate its exposure under a swap agreement either by assignment or other disposition, or by entering into an offsetting swap agreement with the same party or another creditworthy party. The Fund may have limited ability to eliminate its exposure under a credit default swap if the credit of the reference entity or underlying asset has declined.
For the period ended December 31, 2009, the Core Bond Fund entered into credit default swaps primarily for return enhancement and hedging.
Interest Rate Swaps
The use of interest rate swaps is a highly specialized activity which involves investment techniques and risks different from those associated with ordinary portfolio securities transactions. If a money manager using this technique is incorrect in its forecast of market values, interest rates and other applicable factors, the investment performance of a Fund would diminish compared to what it would have been if this investment technique were not used.
Interest rate swaps do not involve the delivery of securities or other underlying assets or principal. Accordingly, the risk of loss with respect to interest rate swaps is limited to the net amount of interest payments that the Funds are contractually obligated to make. If the other party to an interest rate swap defaults, the Funds’ risk of loss consists of the net amount of interest payments that the Funds are contractually entitled to receive. Since interest rate swaps are individually negotiated, the Funds expect to achieve an acceptable degree of correlation between their rights to receive interest on their portfolio securities and their rights and obligations to receive and pay interest pursuant to interest rate swaps.
For the period ended December 31, 2009, the Core Bond Fund entered into interest rate swaps primarily for return enhancement and hedging.
Index Swaps
Certain Funds may enter into index swap agreements to expose cash reserves to markets or to effect investment transactions consistent with these Funds’ investment objectives and strategies. Swap agreements are two party contracts entered into primarily by institutional investors for periods ranging from a few weeks to more than one year. In a standard swap transaction, the two parties agree to exchange the returns (or differentials in rates of return) earned or realized on particular investments or instruments. The returns to be exchanged between the parties are calculated with respect to a “notional amount” (i.e. a specified dollar amount that is hypothetically invested in a “basket” of securities representing a particular index).
ISDA Master Agreements
The Funds are parties to International Swaps and Derivatives Association, Inc. Master Agreements (“ISDA Master Agreements”) with counterparties that govern transactions in over-the-counter derivative and foreign exchange contracts entered into by the Funds and those counterparties. The ISDA Master Agreements contain provisions for general obligations, representations, agreements, collateral and events of default or termination. Events of termination include conditions that may entitle counterparties to elect to terminate early and cause settlement of all outstanding transactions under the applicable ISDA Master Agreement. Any election to early terminate could be material to the financial statements.
| | |
| Notes to Financial Statements | | 99 |
Russell Investment Funds
Notes to Financial Statements, continued — December 31, 2009
Loan Agreements
The Core Bond Fund may invest in direct debt instruments which are interests in amounts owed by corporate, governmental, or other borrowers to lenders or lending syndicates. A Fund’s investments in loans may be in the form of participations in loans or assignments of all or a portion of loans from third parties. A loan is often administered by a bank or other financial institution (the “agent”) that acts as agent for all holders. The agent administers the terms of the loan, as specified in the loan agreement. When investing in a loan participation, a Fund has the right to receive payments of principal, interest and any fees to which it is entitled only from the agent selling the loan agreement and only upon receipt by the agent of payments from the borrower. A Fund generally has no right to enforce compliance with the terms of the loan agreement with the borrower. As a result, a Fund may be subject to the credit risk of both the borrower and the lender that is selling the loan agreement. When a Fund purchases assignments from agents it acquires direct rights against the borrower on the loan. For the period ended December 31, 2009, there were no unfunded loan commitments in the Core Bond Fund.
Investments in Emerging Markets
Investing in emerging markets may involve special risks and considerations not typically associated with investing in the United States markets. These risks include revaluation of currencies, high rates of inflation, repatriation, restrictions on income and capital, and future adverse political and economic developments. Moreover, securities issued in these markets may be less liquid, subject to government ownership controls, delayed settlements, and their prices may be more volatile than those of comparable securities in the United States.
Repurchase Agreements
The Core Bond Fund may enter into repurchase agreements. A repurchase agreement is an agreement under which the Fund acquires a fixed income security from a commercial bank, broker or dealer and simultaneously agrees to resell such security to the seller at an agreed upon price and date (normally the next business day). The resale price reflects an agreed upon interest rate effective for the period the security is held by the Fund and is unrelated to the interest rate on the security. The securities acquired by the Fund constitute collateral for the repurchase obligation. In these transactions, the securities acquired by the Fund (including accrued interest earned thereon) must have a total value in excess of the value of the repurchase agreement and must be held by the custodian bank until repurchased. In addition, RIMCo will monitor the Fund’s repurchase agreement transactions generally and will evaluate the credit worthiness of any bank, broker or dealer party to a repurchase agreement with the Fund. The Fund will not invest more than 15% of its net assets (taken at current market value) in repurchase agreements maturing in more than seven days.
Mortgage-Related and Other Asset-Backed Securities
The Core Bond Fund may invest in mortgage or other asset-backed securities. These securities may include mortgage pass-through securities, collateralized mortgage obligations (“CMOs”), commercial mortgage-backed securities, mortgage dollar rolls, CMO residuals, stripped mortgage-backed securities and other securities that directly or indirectly represent a participation in, or are secured by a payable from, mortgage loans on real property. The value of a Fund’s mortgage-backed securities (“MBS”) may be affected by, among other things, changes or perceived changes in interest rates, factors concerning the interests in and structure of the issuer or the originator of the mortgage, or the quality of the underlying assets. The quality and value of the underlying assets may decline, or default. This has become an increasing risk for collateral related to sub-prime, Alt-A and non-conforming mortgage loans, especially in a declining residential real estate market. In addition, regulatory or tax changes may adversely affect the mortgage securities markets as a whole.
MBS often have stated maturities of up to thirty years when they are issued, depending upon the length of the mortgages underlying the securities. In practice however, unscheduled or early payments of principal and interest on the underlying mortgages may make the securities’ effective maturity shorter than this, and the prevailing interest rates may be higher or lower than the current yield of a Fund’s portfolio at the time the Fund receives the payments for reinvestment.
Rising or high interest rates may result in slower than expected principal payments which may tend to extend the duration of MBS, making them more volatile and more sensitive to changes in interest rates. This is known as extension risk.
MBS may have less potential for capital appreciation than comparable fixed income securities due to the likelihood of increased prepayments of mortgages resulting from foreclosures or declining interest rates. These foreclosed or refinanced mortgages are paid off at face value (par) or less, causing a loss, particularly for any investor who may have purchased the security at a premium or a price above par. In such an environment, this risk limits the potential price appreciation of these securities.
Through its investments in MBS, including those that are issued by private issuers, the Fund has exposure to subprime loans, Alt-A loans and non-conforming loans as well as to the mortgage and credit markets generally. Private issuers include commercial banks, savings associations, mortgage companies, investment banking firms, finance companies and special purpose finance
| | |
| 100 | | Notes to Financial Statements |
Russell Investment Funds
Notes to Financial Statements, continued — December 31, 2009
entities (called special purpose vehicles or SPVs) and other entities that acquire and package mortgage loans for resale as MBS. These privately issued non-governmental MBS may offer higher yields than those issued by government entities, but also may be subject to greater price changes than governmental issues. Subprime loans refer to loans made to borrowers with weakened credit histories or with a lower capacity to make timely payments on their loans. Alt-A loans refers to loans extended to borrowers who have incomplete documentation of income, assets, or other variables that are important to the credit underwriting processes. Non-conforming mortgages are loans that do not meet the standards that allow purchase by government-sponsored enterprises. MBS with exposure to subprime loans, Alt-A loans or non-conforming loans have had in many cases higher default rates than those loans that meet government underwriting requirements. The risk of non-payment is greater for MBS that are backed by mortgage pools that contain subprime, Alt-A and non-conforming loans, but a level of risk exists for all loans.
Unlike MBS issued or guaranteed by the U.S. government or a government sponsored entity (e.g., Fannie Mae (the Federal National Mortgage Association) and Freddie Mac (the Federal Home Loan Mortgage Corporation)), MBS issued by private issuers do not have a government or government-sponsored entity guarantee, but may have credit enhancements provided by external entities such as banks or financial institutions or achieved through the structuring of the transaction itself. Examples of such credit support arising out of the structure of the transaction include the issue of senior and subordinated securities (e.g., the issuance of securities by an SPV in multiple classes or “tranches,” with one or more classes being senior to other subordinated classes as to the payment of principal and interest, with the result that defaults on the underlying mortgage loans are borne first by the holders of the subordinated class); creation of “reserve funds” (in which case cash or investments, sometimes funded from a portion of the payments on the underlying mortgage loans, are held in reserve against future losses); and “overcollateralization” (in which case the scheduled payments on, or the principal amount of, the underlying mortgage loans exceeds that required to make payment on the securities and pay any servicing or other fees). However, there can be no guarantee that credit enhancements, if any, will be sufficient to prevent losses in the event of defaults on the underlying mortgages loans. In addition, MBS that are issued by private issuers are not subject to the underwriting requirements for the underlying mortgage that are applicable to those MBS that have a government or government-sponsored entity guarantee. As a result, the mortgage loans underlying private MBS may, and frequently do, have less favorable collateral, credit risk or other underwriting characteristics than government or government-sponsored MBS and have wider variances in a number of terms including interest rate, term, size, purpose and borrower characteristics. Privately issued pools more frequently include second mortgages, high loan-to-value mortgages and manufactured housing loans. The coupon rates and maturities of the underlying mortgage loans in a private-label MBS pool may vary to a greater extent than those included in a government guaranteed pool, and the pool may include subprime mortgage loans.
Privately issued MBS are not traded on an exchange and there may be a limited market for the securities, especially when there is a perceived weakness in the mortgage and real estate market sectors. Without an active trading market, MBS held in a Fund’s portfolio may be particularly difficult to value because of the complexities involved in assessing the value of the underlying mortgage loans.
Asset-backed securities may include MBS, loans, receivables or other assets. The value of the Fund’s asset-backed securities may be affected by, among other things, actual or perceived changes in interest rates, factors concerning the interests in and structure of the issuer or the originator of the receivables, the market’s assessment of the quality of underlying assets or actual or perceived changes in the credit worthiness of the individual borrowers, the originator, the servicing agent or the financial institution providing the credit support.
Payment of principal and interest may be largely dependent upon the cash flows generated by the assets backing the securities. Rising or high interest rates tend to extend the duration of asset-backed securities, making them more volatile and more sensitive to changes in interest rates. The underlying assets are sometimes subject to prepayments which can shorten the security’s weighted average life and may lower its return. Defaults on loans underlying asset-backed securities have become an increasing risk for asset-backed securities that are secured by home-equity loans related to sub-prime, Alt-A or non-conforming mortgage loans, especially in a declining residential real estate market.
Asset-backed securities (other than MBS) present certain risks that are not presented by MBS. Primarily, these securities may not have the benefit of any security interest in the related assets. Credit card receivables are generally unsecured and the debtors are entitled to the protection of a number of state and federal consumer credit laws, many of which give such debtors the right to set off certain amounts owed on the credit cards, thereby reducing the balance due. There is the possibility that recoveries on repossessed collateral may not, in some cases, be available to support payments on these securities. Asset-backed securities are often backed by a pool of assets representing the obligations of a number of different parties. To lessen the effect of failures by obligors on underlying assets to make payments, the securities may contain elements of credit support which fall into two categories: (i) liquidity protection, and (ii) protection against losses resulting from ultimate default by an obligor on the underlying assets. Liquidity protection refers to the provision of advances, generally by the entity administering the pool of assets, to ensure that the receipt of payments on the underlying pool occurs in a timely fashion. Protection against losses results from payment of the insurance obligations on at least a portion of the assets in the pool. This protection may be provided through guarantees, policies or letters of credit obtained by the issuer or sponsor from third parties, through various means of structuring the
| | |
| Notes to Financial Statements | | 101 |
Russell Investment Funds
Notes to Financial Statements, continued — December 31, 2009
transaction or through a combination of such approaches. The Fund will not pay any additional or separate fees for credit support. The degree of credit support provided for each issue is generally based on historical information respecting the level of credit risk associated with the underlying assets. Delinquency or loss in excess of that anticipated or failure of the credit support could adversely affect the return on an investment in such a security. The availability of asset-backed securities may be affected by legislative or regulatory developments. It is possible that such developments may require the Fund to dispose of any then existing holdings of such securities.
Forward Commitments
Certain Funds may contract to purchase securities for a fixed price at a future date beyond customary settlement time consistent with a Fund’s investment strategies. The price of the underlying securities and the date when the securities will be delivered and paid for are fixed at the time the transaction is negotiated. The Funds may dispose of a forward commitment transaction prior to settlement if it is appropriate to do so and realize short-term gains (or losses) upon such sale. When effecting such transactions, cash or liquid high-grade debt obligations of the Fund in a dollar amount sufficient to make payment for the portfolio securities to be purchased will be earmarked on the Fund’s records at the trade date and until the transaction is settled. A forward commitment transaction involves a risk of loss if the value of the security to be purchased declines prior to the settlement date or the other party to the transaction fails to complete the transaction.
To be announced (“TBA”) is a forward mortgage-backed securities trade. The securities are purchased and sold on a forward commitment basis with an approximate principal amount and maturity date. The actual principal amount and maturity date will be determined upon settlement when the specific mortgage pools are assigned. As of December 31, 2009, the Core Bond Fund had cash collateral balances in connection with TBAs as follows:
| | | | | | |
| | | Cash Collateral for TBAs | | Due to Broker |
| | | | | | |
Core Bond Fund | | $ | — | | $ | 20,000 |
Inflation-Indexed Bonds
The Core Bond Fund may invest in inflation-indexed bonds. Inflation-indexed bonds are fixed-income securities whose principal value is periodically adjusted to the rate of inflation. The interest rate on these bonds is generally fixed at issuance at a rate lower than typical bonds. Over the life of an inflation-indexed bond, however, interest will be paid based on a principal value, which is adjusted for inflation. Any increase in the principal amount of an inflation-indexed bond will be included as interest income in the Statement of Operations, even though investors do not receive their principal until maturity.
Guarantees
In the normal course of business the Funds enter into contracts that contain a variety of representations which provide general indemnifications. The Funds’ maximum exposure under these arrangements is unknown as this would involve future claims that may be made against the Funds that have not yet occurred. However, the Funds expect the risk of loss to be remote.
Market and Credit Risk
In the normal course of business the Funds trade financial instruments and enter into financial transactions where risk of potential loss exists due to changes in the market (market risk) or failure of the other party to a transaction to perform (credit risk). Similar to credit risk, the Funds may be exposed to counterparty risk or risk that an institution or other entity with which the Funds have unsettled or open transactions will default. The potential loss could exceed the value of the assets recorded in the financial statements (the “Assets”). Assets which potentially expose the Funds to credit risk consist principally of cash due from counterparties and investments. The extent of the Funds’ exposure to credit and counterparty risks in respect to the Assets approximates their carrying value as recorded in the Funds’ Statements of Assets and Liabilities.
On September 15, 2008, Lehman Brothers Holdings Inc. filed for protection under Chapter 11 of the United States Bankruptcy Code. On September 19, 2008, a proceeding under the Securities Investor Protection Act (SIPA) was commenced with respect to Lehman Brothers Inc., a broker-dealer. A trustee appointed under SIPA is administering the bankruptcy estate of Lehman Brothers Inc. Lehman Brothers International (Europe) was placed in administration under the UK Insolvency Act on September 15, 2008. Lehman Brothers Special Financing Inc., among other Lehman subsidiaries, filed for protection under Chapter 11 of the United States Bankruptcy Code on October 3, 2008. In connection with these filings, the Lehman Brothers group of companies (collectively “Lehman Brothers”) will be reorganized and/or liquidated in an orderly fashion, subject to court approval. Each Lehman Brothers entity is a separate legal entity that is subject to its own bankruptcy proceeding.
The Core Bond Fund and Non-U.S. Fund had direct holdings swap agreements, and securities and derivatives transactions outstanding with Lehman Brothers entities as issuers or counterparties at the time the relevant Lehman Brothers entities filed for protection or were placed in administration. The direct holdings associated with Lehman Brothers have been written down to their
| | |
| 102 | | Notes to Financial Statements |
Russell Investment Funds
Notes to Financial Statements, continued — December 31, 2009
estimated recoverable values and incorporated as components of other receivable and liabilities on the Statements of Assets and Liabilities and net change in realized gain (loss) or unrealized appreciation (depreciation) on the Statement of Operations. The Funds have also utilized certain netting arrangements to offset payables and receivables of Lehman securities.
RIMCo or the Funds’ Money Managers have delivered notices of default and early termination to the relevant Lehman Brothers entities where required. For transactions with Lehman Brothers counterparties, RIMCo or the Funds’ Money Managers have terminated trades, obtained quotations from brokers for replacement trades and, where deemed appropriate, re-opened positions with new counterparties.
The court overseeing all the U.S. Lehman entities’ bankruptcy cases set a filing deadline for all those entities. The Lehman Brothers Inc. claims filing deadline was January 30, 2009 for all customer claims and June 1, 2009 for all general creditor claims related to Lehman Brothers Inc. In the case of all other U.S. Lehman entities, court set filing deadlines of September 22, 2009 and November 2, 2009 (for certain “Program Securities”). To the extent that the Funds held accounts with Lehman Brothers Inc., the Funds filed the appropriate customer claims on January 29, 2009 and filed all other claims related to U.S. Lehman entities on the foregoing deadlines.
| 3. | | Investment Transactions |
Securities
During the period ended December 31, 2009, purchases and sales of investment securities (excluding U.S. Government and Agency obligations, short-term investments, options, futures and repurchase agreements) were as follows:
| | | | | | |
| Funds | | Purchases | | Sales |
| | | | | | |
Multi-Style Equity | | $ | 407,978,595 | | $ | 400,603,283 |
Aggressive Equity | | | 198,175,765 | | | 195,184,372 |
Non-U.S. | | | 343,892,220 | | | 323,319,424 |
Core Bond | | | 163,701,814 | | | 143,278,554 |
Real Estate Securities | | | 349,837,898 | | | 333,881,129 |
Purchases and sales of U.S. Government and Agency obligations (excluding short-term investments, options, futures and repurchase agreements) were as follows:
| | | | | | |
| Fund | | Purchases | | Sales |
| | | | | | |
Core Bond | | $ | 402,506,962 | | $ | 419,145,171 |
Written Options Contracts
Transactions in written options contracts for the period ended December 31, 2009 were as follows:
| | | | | | | |
| | | Core Bond | |
| | | Number of
Contracts | | | Premiums
Received | |
| | | | | | | |
Outstanding December 31, 2008 | | 59 | | | $ | 579,985 | |
Opened | | 184 | | | | 740,183 | |
Closed | | (15 | ) | | | (576,770 | ) |
Expired | | (140 | ) | | | (259,130 | ) |
| | | | | | | |
Outstanding December 31, 2009 | | 88 | | | $ | 484,268 | |
| | | | | | | |
Securities Lending
The Investment Company has a securities lending program whereby each Fund can loan securities with a value up to 33 1/3% of each Fund’s total assets. The Fund receives cash (U.S. currency), U.S. Government or U.S. Government agency obligations as collateral against the loaned securities. To the extent that a loan is collateralized by cash, such collateral is invested by the securities lending agent, State Street Corporation (“State Street”), in short-term instruments, money market mutual funds and other short-term investments that meet certain quality and diversification requirements. The collateral received is recorded on a lending Fund’s Statement of Assets and Liabilities along with the related obligation to return the collateral.
Income generated from the investment of cash collateral, less negotiated rebate fees paid to participating brokers and transaction costs, is divided between the Fund and State Street and is recorded as income for the Fund. To the extent that a loan is secured by non-cash collateral, brokers pay the Fund negotiated lenders’ fees, which are divided between the Fund and State Street and are recorded as securities lending income for the Fund. All collateral received will be in an amount at least equal to 102% (for loans of U.S. securities) or 105% (for Non-U.S. securities) of the market value of the loaned securities at the inception of each loan. The market value of the loaned securities is determined at the close of business of the Funds and any additional required collateral is
| | |
| Notes to Financial Statements | | 103 |
Russell Investment Funds
Notes to Financial Statements, continued — December 31, 2009
delivered to the Fund the next day. Should the borrower of the securities fail financially, there is a risk of delay in recovery of the securities or loss of rights in the collateral. Consequently, loans are made only to borrowers which are deemed to be creditworthy.
The Funds that participate in securities lending have cash collateral invested in the State Street Securities Lending Quality Trust Fund (“SLQT”). The short-term portfolio instruments held by SLQT are valued on the basis of amortized cost. Issuances and redemptions of interests in SLQT are made on each business day (“valuation date”). Currently, interests in SLQT are purchased and redeemed at a constant net asset value of $1.00 per unit for daily operational liquidity purposes, although redemptions for certain other purposes may be in-kind. In the event that a significant disparity develops between the net asset value based on amortized cost and the market based net asset value of SLQT, the Trustee of SLQT may determine that continued redemption at a constant $1.00 net asset value would create inequitable results for the SLQT’s interest holders. In these circumstances, the Trustee of SLQT, in its sole discretion and acting on behalf of the SLQT interest holders, may direct that interests be redeemed at the market-based net asset value until such time as the disparity between the market-based and the constant net asset value per unit is deemed to be insignificant.
At December 31, 2009, the SLQT Fund was transacting at its amortized cost value of $1.00 per unit for daily operational liquidity purposes. The SLQT’s market value per unit is lower than its amortized cost value per unit. Effective February 10, 2009, the Funds began valuing the units of SLQT for purposes of the Funds’ daily valuation calculation at the unit’s market value rather than the unit’s amortized cost value. Each Fund has earmarked liquid assets to cover the difference between SLQT’s market value per unit and its amortized cost value per unit.
As of December 31, 2009, no non-cash collateral was received for the securities on loan in the Funds.
Custodian
The Funds have entered into arrangements with their Custodian whereby custody credits realized as a result of uninvested cash balances are used to reduce a portion of the Funds’ expenses. During the period ended December 31, 2009, the Funds’ custodian fees were reduced by the following amounts under these arrangements which are included in expense reductions on the Statements of Operations:
| | | |
| Funds | | Custody Credit
Amount |
Multi-Style Equity | | $ | 51 |
Aggressive Equity | | | 21 |
Non-U.S. | | | 44 |
Core Bond | | | 15 |
Real Estate Securities | | | 1 |
Brokerage Commissions
The Funds effect certain transactions through Recapture Services, division of BNY ConvergeEX Execution Solutions LLC (“LJR”) and its global network of correspondent brokers. LJR is a registered broker and is not an affiliate of the Funds or RIMCo. Trades placed through LJR and its correspondents are used (i) to obtain research services for RIMCo to assist RIMCo in its investment decision-making process in its capacity as advisor to the Funds or (ii) to generate commission rebates to the Funds on whose behalf the trades were made. For purposes of trading to obtain research services for RIMCo or to generate commission rebates to the Funds, the Funds’ money managers are requested to and RIMCo may, with respect to transactions it places, effect transactions with or through LJR and its correspondents or other brokers only to the extent that the money managers or RIMCo believe that the Funds will receive best execution. In addition, RIMCo recommends targets for the amount of trading that money managers allocate through LJR based upon asset class, investment style and other factors. Research services provided to RIMCo by LJR or other brokers include performance measurements statistics, fund analytic systems and market monitoring systems. Research services will generally be obtained from unaffiliated third parties at market rates. Research provided to RIMCo may benefit the particular Funds generating the trading activity and may also benefit other Funds within RIF and other funds clients managed or advised by RIMCo or its affiliates. Similarly, the Funds may benefit from research provided with respect trading by those other funds and clients. In some cases, research may also be provided by other non-affiliated brokers.
LJR may also rebate to the Funds a portion of commissions earned on certain trading by the Funds through LJR and their correspondents in the form of commission recapture. Commission recapture is paid solely to those Funds generating the applicable trades. Commission recapture is generated on the instructions of the Soft Dollar Committee once RIMCo’s research budget has been met, as determined annually in the Soft Dollar Committee budgeting process.
Additionally, the Fund paid brokerage commissions to non-affiliated brokers who provided brokerage and research services to the Adviser.
| | |
| 104 | | Notes to Financial Statements |
Russell Investment Funds
Notes to Financial Statements, continued — December 31, 2009
| 4. | | Related Party Transactions, Fees and Expenses |
Adviser and Administrator
RIMCo is the Funds’ adviser and RFSC, a wholly-owned subsidiary of RIMCo, is the Funds’ administrator. RIMCo is a wholly-owned subsidiary of Frank Russell Company (a subsidiary of The Northwestern Mutual Life Insurance Company). Frank Russell Company provides ongoing money manager research and trade placement services to RIF and RIMCo.
The Investment Company Funds are permitted to invest their cash reserves (i.e., cash awaiting investment or cash held to meet redemption requests or to pay expenses) in the Russell U.S. Cash Management Fund an unregistered Fund advised by RIMCo. As of December 31, 2009, $86,019,445 represents Investment Company Funds in the Russell U.S. Cash Management Fund.
The advisory and administrative fees are based upon the average daily net assets of each Fund at the rates specified in the table below, are payable monthly and total $10,376,583 and $690,667 respectively, for the period ended December 31, 2009.
| | | | | | |
| | | Annual Rate | |
| Funds | | Advisor | | | Administrator | |
Multi-Style Equity | | 0.73 | % | | 0.05 | % |
Aggressive Equity | | 0.90 | | | 0.05 | |
Non-U.S. | | 0.90 | | | 0.05 | |
Core Bond | | 0.55 | | | 0.05 | |
Real Estate Securities | | 0.80 | | | 0.05 | |
RIMCo agreed to certain waivers of its advisory fees as follows:
For the Multi-Style Equity Fund, RIMCo had contractually agreed to waive, until April 29, 2009, a portion of its 0.73% advisory fee, up to the full amount of that fee, equal to the amount by which the Fund’s total direct Fund-level operating expenses exceeded 0.87% of the Fund’s average daily net assets on an annual basis and then to reimburse the Fund for all remaining expenses, after fee waivers, that exceeded 0.87% of the average daily net assets on an annual basis. Direct Fund-level expenses did not include expenses of other investment companies in which the Fund invested which were borne indirectly by the Fund. The total amount of the waiver for the period ended December 31, 2009 was $33,626. There were no reimbursements during the period.
For the Aggressive Equity Fund, RIMCo had contractually agreed to waive, until April 29, 2009, a portion of its 0.90% advisory fee, up to the full amount of that fee, equal to the amount by which the Fund’s total direct Fund-level operating expenses exceeded 1.05% of the Fund’s average daily net assets on an annual basis and to then reimburse the Fund for all remaining expenses, after fee waivers, that exceeded 1.05% of the average daily net assets on an annual basis. Direct Fund-level expenses did not include expenses of other investment companies in which the Fund invested which were borne indirectly by the Fund.
For the Aggressive Equity Fund, effective May 1, 2009, RIMCo has contractually agreed, until April 30, 2010, to waive 0.06% of its 0.90% advisory fee. The waiver may not be terminated during the relevant period except at the Board’s discretion. The total amount of the waiver for the period ended December 31, 2009 was $146,164. There were no reimbursements during the period.
For the Non-U.S. Fund, RIMCo had contractually agreed to waive, until April 29, 2009, a portion of its 0.90% advisory fee, up to the full amount of that fee, equal to amount by which the Fund’s total direct Fund-level operating expenses exceeded 1.15% of the Fund’s average daily net assets on an annual basis and to then reimburse the Fund for all remaining expenses, after fee waivers, that exceeded 1.15% of the average daily net assets on an annual basis. Direct Fund-level expenses did not include expenses of other investment companies in which the Fund invested which were borne indirectly by the Fund.
For the Non-U.S. Fund, effective May 1, 2009, RIMCo has contractually agreed, until April 30, 2010, to waive 0.06% of its 0.90% advisory fee. The waiver may not be terminated during the relevant period except at the Board’s discretion. The total amount of the waiver for the period ended December 31, 2009 was $230,504. There were no reimbursements during the period.
For the Core Bond Fund RIMCo had contractually agreed to waive, until April 29, 2009, a portion of its 0.55% advisory fee, up to the full amount of that fee, equal to the amount by which the Fund’s total direct Fund-level operating expenses exceeded 0.70% of the Fund’s average daily net assets on an annual basis and to then reimburse the Fund for all remaining expenses, after fee waivers, that exceeded 0.70% of the average daily net assets on an annual basis Direct Fund-level expenses did not include expenses of other investment companies in which the Fund invested which were borne indirectly by the Fund.
For the Core Bond Fund, effective May 1, 2009, RIMCo has contractually agreed, until April 30, 2010, to waive 0.07% of its 0.55% advisory fee. The waiver may not be terminated during the relevant period except at the Board’s discretion. The total amount of the waiver for the period ended December 31, 2009 was $237,846. There were no reimbursements during the period.
For the Real Estate Securities Fund, RIMCo had contractually agreed to waive, until April 29, 2009, a portion of its 0.80% advisory fee, up to the full amount of that fee, equal to the amount by which the Fund’s total direct Fund-level operating expenses
| | |
| Notes to Financial Statements | | 105 |
Russell Investment Funds
Notes to Financial Statements, continued — December 31, 2009
exceeded 1.10% of the Fund’s average daily net assets on an annual basis and then to reimburse the Fund for all remaining expenses, after fee waivers, that exceeded 1.10% of the average daily net assets on an annual basis. Direct Fund-level expenses did not include expenses of other investment companies in which the Fund invested which were borne indirectly by the Fund. There were no amounts waived or reimbursed during the period.
Transfer and Dividend Disbursing Agent
RFSC serves as transfer agent and provides dividend disbursing services to the Funds. For this service, RFSC is paid a fee based upon the average daily net assets of the Funds for transfer agency and dividend disbursing services. RFSC retains a portion of this fee for services provided to the Funds and pays the balance to unaffiliated agents who assist in providing these services. Total fees paid by the Funds presented herein for the period ended December 31, 2009 were $60,779.
Distributor
Russell Financial Services, Inc. (the “Distributor’), a wholly-owned subsidiary of RIMCo, serves as distributor for RIF, pursuant to the Distribution Agreement with the Investment Company. The Distributor receives no compensation from the Investment Company for its services.
Accrued Fees Payable to Affiliates
Accrued fees payable to affiliates for the period ended December 31, 2009 were as follows:
| | | | | | | | | | | | | | | |
| | | Multi-Style Equity
Fund | | Aggressive Equity
Fund | | Non-U.S.
Fund | | Core Bond
Fund | | Real Estate
Securities Fund |
| | | | | | | | | | | | | | | |
Advisory fees | | $ | 230,327 | | $ | 104,080 | | $ | 235,330 | | $ | 157,967 | | $ | 273,344 |
Administration fees | | | 15,903 | | | 6,579 | | | 13,597 | | | 16,902 | | | 17,084 |
Transfer agent fees | | | 1,386 | | | 580 | | | 1,186 | | | 1,434 | | | 1,495 |
Trustee fees | | | 2,392 | | | 1,173 | | | 2,060 | | | 1,817 | | | 3,194 |
| | | | | | | | | | | | | | | |
| | $ | 250,008 | | $ | 112,412 | | $ | 252,173 | | $ | 178,120 | | $ | 295,117 |
| | | | | | | | | | | | | | | |
Affiliated Brokerage Commissions
The Funds will effect certain transactions through Russell Implementation Services Inc. (“RIS”) and its global network of unaffiliated correspondent brokers. RIS is a registered broker and investment adviser and an affiliate of RIMCo. Trades placed through RIS and its correspondents are made (i) to manage trading associated with changes in managers, rebalancing across existing managers, cash flows and other portfolio transitions or (ii) to execute portfolio securities transactions for each Fund’s assets that RIMCo determines not to allocate to money managers and for each Fund’s cash reserves.
Board of Trustees
Through December 31, 2009, the Russell Fund Complex consists of RIC, which has 37 Funds, and RIF, which has nine Funds. Each of the Trustees is a Trustee of both RIC and RIF. During the period, the Russell Fund Complex paid each of its independent Trustees a retainer of $60,000 per year, $6,500 for each regular quarterly meeting attended in person, $2,500 for each special meeting attended in person, and $2,500 for each Audit Committee meeting, Nominating and Governance Committee meeting, Investment Committee meeting or any other committee meeting established and approved by the Board that is attended in person. Each Trustee receives a $1,000 fee for attending the quarterly and special meetings and a $500 fee for attending the committee meeting by phone instead of receiving the full fee had the member attended in person. Trustees’ out of pocket expenses are also paid by the Russell Fund Complex. The Audit Committee Chair and Investment Committee Chair are each paid a fee of $12,000 per year and the Nominating and Governance Committee Chair is paid a fee of $6,000 per year. The chairman of the Board receives additional annual compensation of $52,000.
Effective January 1, 2010, The Russell Fund Complex consists of RIC, which has 37 Funds, and RIF, which has nine Funds. Each of the Trustees is a Trustee of both RIC and RIF. During the period, the Russell Fund Complex paid each of its independent Trustees a retainer of $72,000 per year, $6,500 for each regular quarterly meeting attended in person, $2,500 for each special meeting attended in person, and $2,500 for each Audit Committee meeting, Nominating and Governance Committee meeting, Investment Committee meeting or any other committee meeting established and approved by the Board that is attended in person. Each Trustee receives a $1,000 fee for attending the quarterly and special meetings (except for telephonic meetings called pursuant to the Funds’ valuation and pricing procedures) and a $500 fee for attending the committee meeting by phone instead of receiving the full fee had the member attended in person. Trustees’ out of pocket expenses are also paid by the Russell Fund Complex. The Audit Committee Chair and Investment Committee Chair are each paid a fee of $12,000 per year and the Nominating and Governance Committee Chair is paid a fee of $6,000 per year. The chairman of the Board receives additional annual compensation of $72,000.
| | |
| 106 | | Notes to Financial Statements |
Russell Investment Funds
Notes to Financial Statements, continued — December 31, 2009
At December 31, 2009, the following Funds had net tax basis capital loss carryforwards which may be applied against any realized net taxable gains in each succeeding year or until their respective expiration dates, whichever occurs first. Available capital loss carryforwards and expiration dates are as follows:
| | | | | | | | | |
| Funds | | 12/31/2016 | | 12/31/2017 | | Totals |
| | | | | | | | | |
Multi-Style Equity | | $ | 47,156,528 | | $ | 61,778,100 | | $ | 108,934,628 |
Aggressive Equity | | | 35,184,466 | | | 36,487,757 | | | 71,672,223 |
Non-U.S. | | | 51,009,325 | | | 51,040,032 | | | 102,049,357 |
Real Estate Securities | | | 25,966,146 | | | 54,146,913 | | | 80,113,059 |
At December 31, 2009, the cost of investments and net unrealized appreciation (depreciation), undistributed ordinary income and undistributed long-term capital gains for income tax purposes were as follows:
| | | | | | | | | | | | | | | | | | | | |
| | | Multi-Style
Equity Fund | | | Aggressive
Equity Fund | | | Non-U.S.
Fund | | | Core Bond
Fund | | | Real Estate
Securities Fund | |
| | | | | | | | | | | | | | | | | | | | |
Cost of Investments for Tax Purposes | | $ | 343,688,930 | | | $ | 154,928,952 | | | $ | 323,252,348 | | | $ | 451,668,872 | | | $ | 501,470,076 | |
| | | | | | | | | | | | | | | | | | | | |
Unrealized Appreciation | | $ | 42,250,362 | | | $ | 22,417,129 | | | $ | 28,259,841 | | | $ | 13,407,399 | | | $ | 47,990,453 | |
Unrealized Depreciation | | | (7,432,366 | ) | | | (3,751,715 | ) | | | (10,323,149 | ) | | | (20,033,673 | ) | | | (4,261,127 | ) |
| | | | | | | | | | | | | | | | | | | | |
Net Tax Unrealized Appreciation (Depreciation) | | $ | 34,817,996 | | | $ | 18,665,414 | | | $ | 17,936,692 | | | $ | (6,626,274 | ) | | $ | 43,729,326 | |
| | | | | | | | | | | | | | | | | | | | |
Undistributed Ordinary Income | | $ | 777,005 | | | $ | 165,393 | | | $ | 2,906,236 | | | $ | 3,274,183 | | | $ | 703,480 | |
Undistributed Long-Term Gains (Capital Loss Carryforward) | | $ | (108,934,628 | ) | | $ | (71,672,223 | ) | | $ | (102,049,357 | ) | | $ | — | | | $ | (80,113,059 | ) |
Tax Composition of Distributions: | | | | | | | | | | | | | | | | | | | | |
Ordinary Income | | $ | 4,298,116 | | | $ | 694,575 | | | $ | 7,901,333 | | | $ | 20,455,548 | | | $ | 14,717,388 | |
Long-Term Capital Gains | | $ | — | | | $ | — | | | $ | — | | | $ | 413,106 | | | $ | — | |
| | | | | |
Post October Loss Deferrals | | $ | 219,256 | | | $ | — | | | $ | 797,678 | | | $ | — | | | $ | 1,829,079 | |
| 6. | | Fund Share Transactions (amounts in thousands) |
Share transactions for the periods ended December 31, 2009 and December 31, 2008 were as follows:
| | | | | | | | | | | | | | |
| | | Shares | | | Dollars | |
| | | 2009 | | | 2008 | | | 2009 | | | 2008 | |
| | | | | | | | | | | | | | |
| | | | | | | | | | | | | | |
Multi-Style Equity Fund | | | | | | | | | | | | | | |
Proceeds from shares sold | | 2,436 | | | 4,217 | | | $ | 23,857 | | | $ | 50,056 | |
Proceeds from reinvestment of distributions | | 483 | | | 720 | | | | 4,298 | | | | 9,779 | |
Payments for shares redeemed | | (4,036 | ) | | (2,477 | ) | | | (37,795 | ) | | | (31,519 | ) |
| | | | | | | | | | | | | | |
Total net increase (decrease) | | (1,117 | ) | | 2,460 | | | $ | (9,640 | ) | | $ | 28,316 | |
| | | | | | | | | | | | | | |
| | | | | | | | | | | | | | |
Aggressive Equity Fund | | | | | | | | | | | | | | |
Proceeds from shares sold | | 1,485 | | | 1,687 | | | $ | 11,475 | | | $ | 16,796 | |
Proceeds from reinvestment of distributions | | 95 | | | 176 | | | | 695 | | | | 1,622 | |
Payments for shares redeemed | | (2,176 | ) | | (2,345 | ) | | | (16,299 | ) | | | (23,355 | ) |
| | | | | | | | | | | | | | |
Total net increase (decrease) | | (596 | ) | | (482 | ) | | $ | (4,129 | ) | | $ | (4,937 | ) |
| | | | | | | | | | | | | | |
| | | | | | | | | | | | | | |
Non-U.S. Fund | | | | | | | | | | | | | | |
Proceeds from shares sold | | 2,904 | | | 4,132 | | | $ | 22,918 | | | $ | 41,756 | |
Proceeds from reinvestment of distributions | | 1,010 | | | 286 | | | | 7,901 | | | | 3,345 | |
Payments for shares redeemed | | (3,249 | ) | | (2,955 | ) | | | (25,343 | ) | | | (30,761 | ) |
| | | | | | | | | | | | | | |
Total net increase (decrease) | | 665 | | | 1,463 | | | $ | 5,476 | | | $ | 14,340 | |
| | | | | | | | | | | | | | |
| | | | | | | | | | | | | | |
Core Bond Fund | | | | | | | | | | | | | | |
Proceeds from shares sold | | 7,232 | | | 6,353 | | | $ | 71,125 | | | $ | 64,412 | |
Proceeds from reinvestment of distributions | | 2,152 | | | 2,179 | | | | 20,869 | | | | 21,155 | |
Payments for shares redeemed | | (4,313 | ) | | (7,885 | ) | | | (40,570 | ) | | | (75,964 | ) |
| | | | | | | | | | | | | | |
Total net increase (decrease) | | 5,071 | | | 647 | | | $ | 51,424 | | | $ | 9,603 | |
| | | | | | | | | | | | | | |
| | | | | | | | | | | | | | |
Real Estate Securities Fund | | | | | | | | | | | | | | |
Proceeds from shares sold | | 4,224 | | | 3,828 | | | $ | 34,059 | | | $ | 46,717 | |
Proceeds from reinvestment of distributions | | 1,793 | | | 585 | | | | 14,718 | | | | 8,443 | |
Payments for shares redeemed | | (3,178 | ) | | (3,880 | ) | | | (28,595 | ) | | | (55,931 | ) |
| | | | | | | | | | | | | | |
Total net increase (decrease) | | 2,839 | | | 533 | | | $ | 20,182 | | | $ | (771 | ) |
| | | | | | | | | | | | | | |
| | |
| Notes to Financial Statements | | 107 |
Russell Investment Funds
Notes to Financial Statements, continued — December 31, 2009
| 7. | | Interfund Lending Program |
The Investment Company Funds have been granted permission from the Securities and Exchange Commission to participate in a joint lending and borrowing facility (the “Credit Facility”). Portfolios of the Funds may borrow money from each other for temporary purposes. All such borrowing and lending will be subject to a participating Fund’s fundamental investment limitations. Typically, Funds will borrow from the RIC Russell Money Market Fund. The RIC Russell Money Market Fund will lend through the program only when the returns are higher than those available from an investment in repurchase agreements or short-term reserves and the portfolio manager determines it is in the best interest of the RIC Russell Money Market Fund. The Investment Company Funds will borrow through the program only when the costs are equal to or lower than the cost of bank loans. Interfund loans and borrowings normally extend overnight, but can have a maximum duration of seven days. Loans may be called on one business day’s notice. A participating fund may have to borrow from a bank at a higher interest rate if an interfund loan is called or not renewed. Any delay in repayment to the RIC Russell Money Market Fund could result in a lost investment opportunity or additional borrowing costs. For the period ended December 31, 2009, the Funds presented did not borrow through the interfund lending program.
As of December 31, 2009, the following table includes shareholders of record with greater than 10% of the total outstanding shares of each respective Fund. The Northwestern Mutual Life Insurance Company separate accounts were the largest shareholder in each Fund.
| | | | |
| | | # of Shareholders | | % |
Multi-Style Equity Fund | | 2 | | 81.8 |
Aggressive Equity Fund | | 2 | | 83.6 |
Non-U.S. Fund | | 2 | | 83.6 |
Core Bond Fund | | 3 | | 84.3 |
Real Estate Securities Fund | | 2 | | 92.2 |
Restricted securities are subject to contractual limitations on resale, are often issued in private placement transactions, and are not registered under the Securities Act of 1933 (the “Act”). The most common types of restricted securities are those sold under Rule 144A of the Act and commercial paper sold under Section 4(2) of the Act.
A Fund may invest a portion of its net assets not to exceed 15% in securities that are illiquid. This limitation is applied at the time of purchase. Illiquid securities are securities that may not be readily marketable, and that cannot be sold within seven days in the ordinary course of business at the approximate amount at which the Fund has valued the securities. Restricted securities are generally considered to be illiquid.
The following table lists restricted securities held by a Fund that are illiquid. The following table does not include (1) securities deemed liquid by RIMCo or a money manager pursuant to Board approved policies and procedures or (2) illiquid securities that are not restricted securities as designated on the Fund’s Schedule of Investments.
| | |
| 108 | | Notes to Financial Statements |
Russell Investment Funds
Notes to Financial Statements, continued — December 31, 2009
| | | | | | | | | | |
| Fund - % of Net Assets Securities | | Acquisition
Date | | Principal
Amount ($)
or Shares | | Cost per Unit
$ | | Cost (000) $ | | Market Value (000)
$ |
| | | | | | | | | | |
| | | | | | | | | | |
Aggressive Equity Fund - 0.1% | | | | | | | | | | |
Perceptron Inc. | | 03/10/08 | | 37,376 | | 9.73 | | 394 | | 120 |
| | | | | | | | | | |
Core Bond Fund - 2.4% | | | | | | | | | | |
Adam Aircraft Term Loan | | 02/13/08 | | 54,000 | | 99.05 | | 55 | | 1 |
AES Corp. (The) | | 12/11/09 | | 635,000 | | 102.53 | | 651 | | 651 |
Americo Life, Inc. | | 06/20/06 | | 75,000 | | 101.30 | | 76 | | 66 |
Anglo American Capital PLC | | 12/03/09 | | 100,000 | | 120.00 | | 120 | | 120 |
ARES CLO Funds | | 01/15/09 | | 730,000 | | 74.10 | | 541 | | 658 |
Armstrong Loan Funding, Ltd. | | 05/21/09 | | 685,000 | | 86.27 | | 591 | | 654 |
BNP Paribas Capital Trust | | 06/01/06 | | 450,000 | | 112.12 | | 504 | | 441 |
Black Diamond CLO, Ltd. | | 09/11/08 | | 1,000,000 | | 84.40 | | 844 | | 868 |
CIT Mortgage Loan Trust | | 10/05/07 | | 187,000 | | 100.00 | | 187 | | 167 |
CIT Mortgage Loan Trust | | 10/05/07 | | 130,000 | | 100.00 | | 130 | | 59 |
CIT Mortgage Loan Trust | | 10/05/07 | | 180,000 | | 100.00 | | 180 | | 67 |
Chatham Light CLO, Ltd. | | 11/25/09 | | 495,121 | | 89.87 | | 445 | | 446 |
Citigroup Mortgage Loan Trust, Inc. | | 11/13/09 | | 686,851 | | 94.19 | | 647 | | 582 |
Credit Suisse Mortgage Capital Certificates | | 09/03/08 | | 581,461 | | 68.10 | | 396 | | 414 |
DG Funding Trust | | 11/04/03 | | 49 | | 10,530.61 | | 516 | | 434 |
Ellington Loan Acquisition Trust | | 10/22/09 | | 579,380 | | 84.50 | | 487 | | 502 |
Freddie Mac REMICS | | 07/07/06 | | 57,803 | | 100.34 | | 58 | | 53 |
Freddie Mac REMICS | | 06/28/07 | | 28,169 | | 110.05 | | 31 | | 34 |
Metropolitan Life Global Funding I | | 06/03/09 | | 200,000 | | 99.50 | | 199 | | 212 |
Phoenix Life Insurance Co. | | 06/15/06 | | 150,000 | | 99.33 | | 149 | | 74 |
Prudential Holdings LLC | | 06/29/09 | | 550,000 | | 96.90 | | 533 | | 589 |
Royal Bank of Scotland Group PLC | | 08/18/09 | | 1,200,000 | | 99.91 | | 1,199 | | 1,188 |
Symetra Financial Corp. | | 06/02/06 | | 150,000 | | 98.56 | | 148 | | 134 |
UBS AG | | 01/11/08 | | EUR 270,000 | | 45.55 | | 123 | | 71 |
Washington Mutual Mortgage Pass Through Certificates | | 04/01/05 | | 194,152 | | 100.00 | | 194 | | 8 |
WEA Finance LLC / WT Finance Aust Pty, Ltd. | | 08/26/09 | | 205,000 | | 99.02 | | 203 | | 231 |
Westpac Banking Corp. | | 12/07/09 | | 800,000 | | 100.00 | | 800 | | 794 |
| | | | | | | | | | |
| | | | | | | | | | 9,518 |
| | | | | | | | | | |
Illiquid securities and restricted securities may be priced by the Funds using fair value procedures approved by the Board of Trustees.
Management has evaluated events or transactions that may have occurred since December 31, 2009, that would merit recognition or disclosure in the financial statements. This evaluation was completed through February 16, 2010, the date the financial statements were available to be issued. During the review nothing was discovered which would require further disclosure within the financial statements.
| | |
| Notes to Financial Statements | | 109 |
Report of Independent Registered Public Accounting Firm
To the Board of Trustees and Shareholders
of Russell Investment Funds:
In our opinion, the accompanying statements of assets and liabilities, including the schedules of investments, and the related statements of operations and of changes in net assets and the financial highlights present fairly, in all material respects, the financial position of Multi-Style Equity Fund, Aggressive Equity Fund, Non-U.S. Fund, Real Estate Securities Fund and Core Bond Fund (five of the portfolios constituting the Russell Investment Funds, hereafter referred to as the “Funds”) at December 31, 2009, the results of each of their operations for the year then ended, the changes in each of their net assets and the financial highlights for each of the periods indicated, in conformity with accounting principles generally accepted in the United States of America. These financial statements and financial highlights (hereafter referred to as “financial statements”) are the responsibility of the Funds’ management; our responsibility is to express an opinion on these financial statements based on our audits. We conducted our audits of these financial statements in accordance with the standards of the Public Company Accounting Oversight Board (United States). Those standards require that we plan and perform the audits to obtain reasonable assurance about whether the financial statements are free of material misstatement. An audit includes examining, on a test basis, evidence supporting the amounts and disclosures in the financial statements, assessing the accounting principles used and significant estimates made by management, and evaluating the overall financial statement presentation. We believe that our audits, which included confirmation of securities at December 31, 2009 by correspondence with the custodian, brokers and transfer agent, provide a reasonable basis for our opinion.

Seattle, Washington
February 15, 2010
| | |
| 110 | | Report of Independent Registered Public Accounting Firm |
Russell Investment Funds
Tax Information — December 31, 2009 (Unaudited)
For the tax year ended December 31, 2009, the Funds hereby designate 100% or the maximum amount allowable, of its net taxable income as qualified dividends taxed at individual net capital gain rates.
The Form 1099 you receive in January 2010 will show the tax status of all distributions paid to your account in calendar year 2009.
The Funds designate dividends distributed during the fiscal year as qualifying for the dividends received deduction for corporate shareholders as follows:
| | | |
Multi-Style Equity | | 100.0 | % |
Aggressive Equity | | 100.0 | % |
Non-U.S. | | 0.0 | % |
Real Estate Securities | | 1.2 | % |
Core Bond | | 0.0 | % |
Pursuant to Section 852 of the Internal Revenue Code, the Funds designate the following amounts as long-term capital gain dividends for their taxable year ended December 31, 2009:
| | |
| | | Long-Term
Capital Gains |
| | |
Multi-Style Equity | | 0 |
Aggressive Equity | | 0 |
Non-U.S. | | 0 |
Core Bond | | 413,106 |
Real Estate Securities | | 0 |
Please consult a tax adviser for any questions about federal or state income tax laws.
The Non-U.S Fund paid foreign taxes of $698,749 and recognized $6,470,203 of foreign source income during the taxable year ended December 31, 2009. Pursuant to Section 853 of the Internal Revenue Code, the Fund designates $0.0201 per share of foreign taxes paid and $0.1857 of gross income per share earned from foreign sources in the taxable year ended December 31, 2009.
Russell Investment Funds
Basis for Approval of Investment Advisory Contracts (Unaudited)
Approval of Investment Advisory Agreement
The Board of Trustees, including all of the Independent Trustees, last considered and approved the continuation of the advisory agreement with RIMCo (the “RIMCo Agreement”) and the portfolio management contract with each Money Manager of the Funds (collectively, the “portfolio management contracts”) at a meeting held on April 21, 2009. During the course of a year, the Trustees receive a wide variety of materials regarding the investment performance of the Funds, sales and redemptions of the Funds’ shares, management of the Funds by RIMCo and compliance with applicable regulatory requirements. In preparation for the annual review, the Independent Trustees, with the advice and assistance of their independent counsel, also requested and the Board considered (1) information and reports prepared by RIMCo relating to the services provided by RIMCo (and its affiliates) to the Funds; and (2) information (the “Third-Party Information”) received from an independent, nationally recognized provider of investment company information comparing the performance of each of the Funds and their respective operating expenses over various periods of time with other peer funds (“Comparable Funds”) not managed by RIMCo, believed by the provider to be generally comparable in investment objectives to the Funds. The foregoing information requested by the Trustees or provided by RIMCo is collectively called the “Agreement Renewal Information.” The Trustees’ evaluations also reflected the knowledge and familiarity gained as Board members of the Funds and other funds in the same complex with respect to services provided by RIMCo, RIMCo’s affiliates and each Money Manager. The Trustees received a memorandum from counsel to the Funds discussing the legal standards for their consideration of the continuations of the RIMCo Agreement and the portfolio management contracts and the Independent Trustees separately received a memorandum regarding their responsibilities from their independent counsel.
On April 20, 2009, the Independent Trustees met to review the Agreement Renewal Information in a private session with their independent counsel at which no representatives of RIMCo or the Funds’ management were present. At the April 21 meeting of the Board of Trustees, the Board, including the Independent Trustees, reviewed the proposed continuance of the RIMCo Agreement and the portfolio management contracts with management, counsel to the Funds and independent counsel to the Independent Trustees. Presentations made by RIMCo to the Board as part of this review encompassed the Funds and all other RIMCo-managed funds for which the Board has supervisory responsibility. Following this review, but prior to voting, the Independent Trustees again met in a private session with their independent counsel to evaluate additional information and analyses received from RIMCo and management at the Board meeting. The discussion below reflects all of these reviews.
In evaluating the portfolio management contracts, the Board considered that the Funds, in employing a manager-of-managers method of investment, operate in a manner that is distinctly different from most other investment companies. In the case of most other investment companies, an advisory fee is paid by the investment company to its adviser which, in turn, employs and compensates individual portfolio managers to make specific securities selections consistent with the adviser’s style and investment philosophy. RIMCo has engaged multiple unaffiliated Money Managers for all Funds.
The Board considered that RIMCo (rather than any Money Manager) is responsible under the RIMCo Agreement for determining, implementing and maintaining the investment program for each Fund. Assets of each Fund generally have been allocated among the multiple Money Managers selected by RIMCo, subject to Board approval, for that Fund. RIMCo manages directly a portion of certain Funds’ assets employing a “select holdings strategy,” as described below, and directly manages the investment of each Fund’s cash reserves. RIMCo also may manage directly any portion of each Fund’s assets that RIMCo determines not to allocate to the Money Managers and portions of a Fund during transitions between Money Managers. In all cases, assets are managed directly by RIMCo pursuant to authority provided by the RIMCo Agreement.
RIMCo is responsible for selecting, subject to Board approval, Money Managers for each Fund and for actively managing allocations and reallocations of assets among the Money Managers. The Board has been advised that RIMCo’s goal is to construct and manage diversified portfolios in a risk-aware manner. Each Money Manager for a Fund in effect performs the function of an individual portfolio manager who is responsible for selecting portfolio securities for the portion of the Fund assigned to it by RIMCo (each, a “segment”) in accordance with the Fund’s applicable investment objective, policies and restrictions, any constraints placed by RIMCo upon their selection of portfolio securities and the Money Manager’s specified role in a Fund. RIMCo is responsible for communicating performance expectations to each Money Manager; supervising compliance by each Money Manager with each Fund’s investment objective and policies; authorizing Money Managers to engage in certain investment strategies for a Fund; and recommending annually to the Board whether portfolio management contracts should be renewed, modified or terminated. In addition to its annual recommendation as to the renewal, modification or termination of portfolio management contracts, RIMCo is responsible for recommending to the Board additions of new Money Managers or replacements of existing Money Managers at any time when, based on RIMCo’s research and ongoing review and analysis, such actions are appropriate. RIMCo may impose specific investment constraints from time to time for each Money Manager intended to capitalize on the strengths of that Money Manager or to coordinate the investment activities of Money Managers for the Fund in a complementary manner. Therefore, RIMCo’s selection of Money Managers is made not only on the basis of performance considerations but anticipated compatibility with other Money Managers in the same Fund. In light of the foregoing, the overall performance of each Fund over appropriate periods reflects, in great part, the performance of RIMCo in designing the Fund’s investment program, structuring the Fund, selecting an effective Money
| | |
| 112 | | Basis for Approval of Investment Advisory Contracts |
Russell Investment Funds
Basis for Approval of Investment Advisory Contracts, continued (Unaudited)
Manager with a particular investment style or sub-style for a segment that is complementary to the styles of the Money Managers of other Fund segments, and allocating assets among the Money Managers in a manner designed to achieve the objectives of the Fund.
The Board considered that the prospectuses for the Funds and other public disclosures emphasize to investors RIMCo’s role as the principal investment manager for each Fund, rather than the investment selection role of the Funds’ Money Managers, and describe the manner in which the Funds operate so that investors may take that information into account when deciding to purchase shares of any such Fund.
The Board also considered the demands and complexity of managing the Funds pursuant to the manager-of-managers structure, the special expertise of RIMCo with respect to the manager-of-managers structure of the Funds and the likelihood that, at the current expense ratio of each Fund, there would be no acceptable alternative investment managers to replace RIMCo on comparable terms given the need to continue the manager-of-managers strategy of such Fund selected by shareholders in purchasing their shares.
In addition to these general factors relating to the manager-of-managers structure of the Funds, the Trustees considered, with respect to each Fund, various specific factors in evaluating renewal of the RIMCo Agreement, including the following:
| 1. | The nature, scope and quality of the services provided, and expected to be provided, to the Fund by RIMCo; |
| 2. | The advisory fee paid by the Fund to RIMCo (the “Advisory Fee”) and the fact that it encompasses all investment advisory fees paid by the Fund, including the fees for any Money Managers of such Fund; |
| 3. | Information provided by RIMCo as to other fees and benefits received by RIMCo or its affiliates from the Fund, including any administrative, transfer agent or cash management fees and fees received for management of securities lending cash collateral, soft dollar arrangements and commissions in connection with portfolio securities transactions; |
| 4. | Information provided by RIMCo as to expenses incurred by the Fund; and |
| 5. | Information provided by RIMCo as to the profits that RIMCo derives from its mutual fund operations generally and from the Fund. |
In evaluating the nature, quality and scope of services provided and which are expected to be provided to the Funds, including Fund portfolio management services, the Board considered the possible impact of changes in RIMCo’s senior management during the course of 2008 and 2009 and a restructuring of the Russell organization, which was announced to the Board in January 2009 and detailed to the Board on April 15, 2009 and included a significant reduction in Russell’s workforce. Prior to the Independent Trustees’ private meeting on April 20 and at the April 21 meeting of the Board of Trustees, senior representatives of Russell and RIMCo discussed this organizational restructuring with the Board and assured the Board that the restructuring would not result in a diminution of the nature, quality or scope of the services provided to the Funds. The Board also discussed with these representatives the impact of developments over the past year in the financial services industry upon the financial resources available to the Russell organization.
As noted above, RIMCo, pursuant to the terms of the RIMCo Agreement, directly managed during the past year, and continues to manage, a portion — up to 10% — of the assets of the RIF Multi-Style Equity Fund (the “Participating Fund”) during the past year, utilizing a select holdings strategy, the actual allocation being determined by the Participating Fund’s RIMCo portfolio manager. The select holdings strategy utilized by RIMCo in managing such assets for the Participating Fund is designed to increase the Participating Fund’s exposure to stocks that are viewed as attractive by multiple Money Managers of the Participating Fund. The Board reviewed the results of the select holdings strategy in respect of the Participating Fund during the past year. The Trustees considered that RIMCo is not required to pay investment advisory fees to a Money Manager with respect to assets for which the select holdings strategy is utilized and that the profits derived by RIMCo generally and from the Participating Fund consequently may increase incrementally. The Board, however, also considered RIMCo’s advice that it pays certain Money Managers additional fees for providing information and other services in connection with the select holdings strategy and incurs additional costs in carrying out the select holdings strategy, the limited amount of assets that are managed directly by RIMCo pursuant to the select holdings strategy, and the fact that the aggregate investment advisory fees paid by the Participating Fund are not increased as a result of the select holdings strategy.
In evaluating the reasonableness of the Funds’ Advisory Fees in light of Fund performance, the Board considered that, in the Agreement Renewal Information and at past meetings, RIMCo noted differences between the investment strategies of certain Funds and their respective Comparable Funds in pursuing their investment objectives, including fund strategies which seek to achieve a lower tracking error (i.e., the difference, whether positive or negative, between the return of a fund and its benchmark) and resulting lower return volatility than their Comparable Funds. According to RIMCo, these strategies may be expected to result, and for certain Funds during the periods covered by the Third-Party Information did result, in lower performance than that of some of their Comparable Funds. According to RIMCo, the strategies pursued by the Funds, among other things, are intended to result in less volatile, more moderate returns relative to each Fund’s performance benchmark rather than more volatile, more extreme returns that its Comparable Funds may experience over time.
| | |
| Basis for Approval of Investment Advisory Contracts | | 113 |
Russell Investment Funds
Basis for Approval of Investment Advisory Contracts, continued (Unaudited)
With respect to the Funds’ Advisory Fees, the Third-Party Information showed that the RIF Multi-Style Equity Fund and RIF Core Bond Fund each had an Advisory Fee which on a contractual basis, an actual basis (i.e., giving effect to any voluntary fee waivers implemented by RIMCo and the advisers to such Fund’s Comparable Funds) or on both a contractual and actual basis was ranked more than 5 basis points below the third quintile, in either the fourth or fifth quintile, for the 1-year period ended December 31, 2008. The Board considered RIMCo’s advice as to the reasons for these Funds’ Advisory Fee rankings and its undertaking to continue to monitor those fees against the Funds’ Comparable Funds’ fees. The Board also noted RIMCo’s advice that the total expenses for each of these Funds ranked in the third quintile for the 1-year period ended December 31, 2008.
In discussing the Funds’ Advisory Fees generally, RIMCo noted, among other things, that its Advisory Fees for the Funds encompass services that may not be provided by investment advisers to the Funds’ Comparable Funds, such as cash equitization and management of portfolio transition costs when Money Managers are added, terminated or replaced. RIMCo also explained that its “margins” in providing investment advisory services to the Funds tend to be lower than competitors’ margins because of the demands and complexities of managing the Funds’ manager-of-managers structure, including RIMCo’s payment of a significant portion of the Funds’ Advisory Fees to their Money Managers.
The Board considered for each Fund whether economies of scale have been realized and whether the Advisory Fee for such Fund appropriately reflects or should be revised to reflect any such economies. During 2008, the Board noted that, generally, there was a reduction in the Funds’ assets as a result of market declines and related investor redemptions. The Board determined that, after giving effect to any applicable fee or expense caps, waivers or reimbursements, the Advisory Fee for each Fund appropriately reflect any economies of scale realized by that Fund, based upon any decline in assets during 2008 and such factors as the variability of Money Manager investment advisory fees and other factors associated with the manager-of-managers structure employed by the Funds.
The Board considered, as a general matter, that fees payable to RIMCo by institutional clients with investment objectives similar to those of the Funds and other RIC funds under the Board’s supervision are lower, and may, in some cases, be substantially lower, than the rates paid by RIC funds supervised by the Board, including the Funds. The Trustees considered the differences in the scope of services RIMCo provides to institutional clients and the Funds. In response to the Trustees’ inquiries, RIMCo, as it has in the past, noted, among other things, that institutional clients have fewer administrative needs than the Funds. RIMCo also noted that since the Funds must constantly issue and redeem their shares, they are more difficult to manage than institutional accounts, where assets are relatively stable. In addition, RIMCo noted that the Funds are subject to heightened regulatory requirements relative to institutional clients. Accordingly, the Trustees did not regard these fee differences as relevant to their deliberations.
With respect to the Funds’ total expenses, the Board noted that none of the Funds was ranked more than 5 basis points below the third quintile of its Comparable Funds for the period ended December 31, 2008.
On the basis of the Agreement Renewal Information, and other information previously received by the Board from RIMCo during the course of the current year or prior years, or presented at or in connection with the April 21 Board meeting by RIMCo, the Board, in respect of each Fund, found, after giving effect to any applicable waivers and/or reimbursements (1) the Advisory Fee charged by RIMCo to be reasonable in light of the nature, scope and quality of the services provided, and expected to be provided, to the Funds; (2) the relative expense ratio of the Fund was comparable to those of its Comparable Funds; (3) RIMCo’s methodology of allocating expenses of operating funds in the complex was reasonable; and (4) RIMCo’s profitability with respect to the Fund was not excessive in light of the nature, scope and quality of the services provided by RIMCo.
The Board further concluded that, under the circumstances, the performance of each of the Funds supported continuation of the RIMCo Agreement, except the Board concluded, as discussed herein, that a determination against continuation of the RIMCo Agreement with respect to the RIF Aggressive Equity Fund would not be in the interests of that Fund’s shareholders even though that fund has underperformed based upon the Third-Party Information. The Board, in assessing the Funds’ performance, focused upon each Fund’s performance for the 1-, 3- and 5-year periods as most relevant.
In evaluating the performance of the Funds generally relative to their Comparable Funds, the Board noted RIMCo’s advice that many of the Funds’ Comparable Funds do not “equitize” their cash (i.e., cash awaiting investment or disbursement to satisfy redemptions or other fund obligations) and may hold large positions uninvested in their investment portfolios. By contrast, the Funds generally follow a strategy of equitizing their cash and fully investing their assets in pursuit of their investment objectives (the Funds’ strategy of equitizing cash and fully investing their assets is hereinafter referred to as their “full investment strategy”). In support of the Funds’ full investment strategy, RIMCo advised the Board of its belief that investors manage their own cash positions based upon their personal investment goals, strategies and risk tolerances and generally expect Fund assets to be fully invested. RIMCo noted that the Funds’ full investment strategy generally will detract from relative performance in a declining market, such as 2008, but may enhance the Funds’ relative performance in a rising market.
With respect to the RIF Aggressive Equity Fund, the Third-Party Information showed that the Fund’s performance was ranked in the fifth quintile for the 1-year period ended December 31, 2008 and in the fourth quintile for the 3- and 5-year periods ended
| | |
| 114 | | Basis for Approval of Investment Advisory Contracts |
Russell Investment Funds
Basis for Approval of Investment Advisory Contracts, continued (Unaudited)
December 31, 2008. The Trustees considered management’s explanation of the Fund’s underperformance. According to RIMCo, the financial crisis that unfolded throughout the year, along with certain portfolio positioning decisions by the Money Managers for the RIF Aggressive Equity Fund, detracted from performance. Notwithstanding the Fund’s underperformance relative to its Comparable Funds, RIMCo advised the Board that, although it remains confident in the team of Money Managers for the Fund, RIMCo will continue to research and analyze the team to look for ways to structure, risk profile and/or return potential. RIMCo also expressed its belief that the RIF Aggressive Equity Fund’s full investment strategy was a significant contributor to the Fund’s underperformance relative to its Comparable Funds.
The Board considered that the performance of certain Funds that have loaned portfolio securities has been subject to a negative impact associated with declining values of investments of cash collateral held in respect of such loans. In considering the performance of the affected Funds, the Board, among other things, considered RIMCo’s assessment of the benefits and risks of continuation of the Funds’ securities lending program notwithstanding this negative impact and steps which have been taken by RIMCo to enhance the process for selection and monitoring of investments of cash collateral held in respect of portfolio securities loans.
In evaluating performance, the Board considered each Fund’s absolute performance and performance relative to appropriate benchmarks and indices in addition to such Fund’s performance relative to its Comparable Funds. In assessing the Funds’ performance relative to their Comparable Funds or benchmarks or in absolute terms, the Board also considered RIMCo’s stated investment strategy of managing the Funds in a risk-aware manner and the extraordinary capital market conditions during 2008.
After considering the foregoing and other relevant factors, the Board concluded that continuation of the RIMCo Agreement on its current terms and conditions would be in the best interests of each Fund and its respective shareholders and voted to approve the continuation of the RIMCo Agreement.
At the April 21 Board meeting, with respect to the evaluation of the terms of portfolio management contracts with Money Managers, the Board received and considered information from RIMCo reporting, among other things, for each Money Manager, the Money Manager’s performance over various periods; RIMCo’s assessment of the performance of each Money Manager; any significant business relationships between the Money Manager and RIMCo or Russell Financial Services, Inc., the Funds’ underwriter; and RIMCo’s recommendation to retain the Money Manager at the current fee rate, to retain the Money Manager at a reduced fee rate or to terminate the Money Manager. The Board received reports during the course of the year from the Funds’ Chief Compliance Officer regarding each Money Manager’s compliance program. RIMCo recommended that each Money Manager be retained at its current fee rate. RIMCo has advised the Board that it does not regard Money Manager profitability as relevant to its evaluation of the portfolio management contracts with Money Managers because the willingness of Money Managers to serve in such capacity depends upon arm’s-length negotiations with RIMCo; RIMCo is aware of the fees charged by Money Managers to other clients; and RIMCo believes that the fees agreed upon with Money Managers are reasonable in light of the anticipated quality of investment advisory services to be rendered. The Board accepted RIMCo’s explanation in light of the Board’s findings as to the reasonableness of the Advisory Fee paid by each Fund and the fact that each Money Manager’s fee is paid by RIMCo.
Based substantially upon RIMCo’s recommendations, together with the information received from RIMCo in support of its recommendations at the April 21 Board meeting, the Board concluded that the fees paid to the Money Managers of each Fund are reasonable in light of the quality of the investment advisory services provided and that continuation of the portfolio management contract with each Money Manager of each Fund would be in the best interests of the Fund and its shareholders.
In their deliberations, the Trustees did not identify any particular information as to the RIMCo Agreement or, other than RIMCo’s recommendation, the portfolio management contract with any Money Manager that was all-important or controlling and each Trustee attributed different weights to the various factors considered. The Trustees evaluated all information available to them on a Fund-by-Fund basis and their determinations were made in respect of each Fund.
Subsequently, the Board of Trustees received proposals from RIMCo at a meeting held on August 25, 2009, to effect a money manager change for the Non-U.S. Fund, the Real Estate Securities Fund and the Multi-Style Equity Fund. In the case of each such proposed change, the Trustees approved the terms of the proposed portfolio management contract based substantially upon RIMCo’s recommendation to hire the Money Manager at the proposed fee rate; any significant business relationships between the Money Manager and RIMCo or Russell Financial Services, Inc. the Fund’s underwriter; RIMCo’s explanation as to the lack of relevance of profitability to the evaluation of portfolio management contracts with money managers because the willingness of Money Managers to serve in such capacity depends upon arm’s-length negotiations with RIMCo; RIMCo’s awareness of the fees charged by the Money Manager to other clients; and RIMCo’s belief that the proposed investment advisory fees would be reasonable in light of the anticipated quality of investment advisory services to be rendered. The Trustees also considered their findings at their April 21, 2009 meeting as to the reasonableness of the aggregate investment advisory fees paid by the Fund, and the fact that the aggregate investment advisory fees paid by the Fund would not increase as a result of the implementation of the proposed money manager change because the money managers’ investment advisory fee is paid by RIMCo.
| | |
| Basis for Approval of Investment Advisory Contracts | | 115 |
Russell Investment Funds
Shareholder Requests for Additional Information — December 31, 2009 (Unaudited)
A complete unaudited schedule of investments is made available generally no later than 60 days after the end of the first and third quarters of each year. These reports are available (i) free of charge, upon request, by calling the Fund at (800) 787-7354, (ii) on the Securities and Exchange Commission’s website at www.sec.gov, and (iii) at the Securities and Exchange Commission’s public reference room.
The Board has delegated to RIMCo, as RIF’s investment adviser, the primary responsibility for monitoring, evaluating and voting proxies solicited by or with respect to issuers of securities in which assets of the Funds may be invested. RIMCo has established a proxy voting committee (“Committee”) and has adopted written proxy voting policies and procedures (“P&P”) and proxy voting guidelines (“Guidelines”). The Funds maintain a Portfolio Holdings Disclosure Policy that governs the timing and circumstances of disclosure to shareholders and third parties of information regarding the portfolio investments held by the Fund. A description of the P&P, Guidelines, Portfolio Holdings Disclosure Policy and additional information about Fund Trustees are contained in the Funds’ Statement of Additional Information (“SAI”). The SAI is available (i) free of charge, upon request, by calling the Funds at (800) 787-7354, and (ii) on the Securities and Exchange Commission’s website at www.sec.gov.
If possible, depending on contract owner registration and address information, and unless you have otherwise opted out, only one copy of the RIF prospectus and each annual and semi-annual report will be sent to contract owners at the same address. If you would like to receive a separate copy of these documents, please contact your Insurance Company. If you currently receive multiple copies of the prospectus, annual report and semi-annual report and would like to request to receive a single copy of these documents in the future, please call your Insurance Company.
Some Insurance Companies may offer electronic delivery of the Funds’ prospectus and annual and semiannual reports. Please contact your Insurance Company for further details.
| | |
| 116 | | Shareholder Requests for Additional Information |
Russell Investment Funds
Disclosure of Information about Fund Trustees and Officers — December 31, 2009
(Unaudited)
The following tables provide information for each officer and Trustee of the Russell Fund Complex. The Russell Fund Complex consists of RIC, which has 37 funds, and RIF, which has nine funds. Each of the Trustees is a Trustee of both RIC and RIF. The first table provides information for the interested Trustee. The second table provides information for the independent Trustees. The third table provides information for the Trustees emeritus. The fourth table provides information for the officers.
| | | | | | | | | | |
Name,
Age,
Address | | Position(s) Held
With Fund and
Length of
Time Served | | Term
of
Office* | | Principal Occupation(s)
During the
Past 5 Years | | No. of
Portfolios
in Russell
Fund
Complex
Overseen
by Trustee | | Other
Directorships Held
by Trustee |
INTERESTED TRUSTEE |
# Greg J. Stark Born May 3, 1968 909 A Street Tacoma, Washington 98402-1616 | | President and Chief Executive Officer from 2004–January 22, 2010* Trustee since 2007 | | Appointed until successor is duly elected and qualified Until successor is chosen and qualified by Trustees | | •President and CEO RIC and RIF •Chairman of the Board, President and CEO, RIMCo •Chairman of the Board, President and CEO, Russell Fund Services Company (“RFSC”) •Chairman of the Board, President and CEO, Russell Financial Services, Inc. •Chairman of the Board and President, Russell Insurance Agency, Inc. (insurance agency (“RIA”)) •Until 2004, Managing Director, of Individual Investor Services, FRC •2000 to 2004 Managing Director, Sales and Client Service, RIMCo | | 46 | | None |
| | | | | | | | | | | |
# Sandra Cavanaugh Born May 10, 1954 909 A Street Tacoma, Washington 98402-1616 | | President and Chief Executive Officer since 2010 Trustee since 2010 | | Appointed until successor is duly elected and qualified Until successor is chosen and qualified by Trustees | | •President and CEO RIC and RIF •May 2009 to December 2009, Executive Vice President, Retail Channel, SunTrust Bank •2007 to January 2009, Senior Vice President, National Sales — Retail Distribution, JPMorgan Chase/Washington Mutual, Inc. •1997 to 2007, President — WM Funds Distributor & Shareholder Services/WM Financial Services | | 46 | | None |
| # | Mr. Stark is also an officer and/or director of one or more affiliates of RIC and RIF and is therefore an Interested Trustee. |
| # | Ms. Cavanaugh is also an officer and/or director of one or more affiliates of RIC and RIF and is therefore an Interested Trustee. |
| * | Effective January 22, 2010, Greg J. Stark resigned as President Chief Executive Officer of RIC and RIF. Mr Stark’s successor is Sandra Cavanaugh. |
| | |
| Disclosure of Information about Fund Trustees and Officers | | 117 |
Russell Investment Funds
Disclosure of Information about Fund Trustees and Officers, continued — December 31, 2009 (Unaudited)
| | | | | | | | | | |
Name,
Age,
Address | | Position(s) Held
With Fund and
Length of
Time Served | | Term
of
Office* | | Principal Occupation(s)
During the
Past 5 Years | | No. of
Portfolios
in Russell
Fund
Complex
Overseen
by Trustee | | Other
Directorships Held
by Trustee |
INDEPENDENT TRUSTEES |
Thaddas L. Alston Born April 7, 1945 909 A Street Tacoma, Washington 98402-1616 | | Trustee since 2006 | | Appointed until successor is duly elected and qualified | | •Senior Vice President, Larco Investments, Ltd. (real estate firm) | | 46 | | None |
| | | | | | | | | | | |
Kristianne Blake, Born January 22, 1954 909 A Street Tacoma, Washington 98402-1616 | | Trustee since 2000 Chairman since 2005 | | Appointed until successor is duly elected and qualified Annual | | •Director and Chairman of the Audit Committee, Avista Corp. •Trustee and Chairman of the Operations Committee, Principal Investor Funds and Principal Variable Contracts Funds •Regent, University of Washington •President, Kristianne Gates Blake, P.S. (accounting services) •February 2002 to June 2005, Chairman of the Audit Committee, RIC and RIF •Trustee and Chairman of the Operations and Distribution Committee, WM Group of Funds, 1999–2006 | | 46 | | •Director, Avista Corp (electric utilities) •Trustee, Principal Investor Funds (investment company); •Trustee, Principal Variable Contracts Funds (investment company) |
| | | | | | | | | | | |
Daniel P. Connealy Born June 6, 1946 909 A Street Tacoma, Washington 98402-1616 | | Trustee since 2003 Chairman of the Audit Committee since 2005 | | Appointed until successor is duly elected and qualified Appointed until successor is duly elected and qualified | | •June 2004 to present, Senior Vice President and Chief Financial Officer, Waddell & Reed Financial, Inc. | | 46 | | None |
| | | | | | | | | | | |
Jonathan Fine, Born July 8, 1954 909 A Street Tacoma, Washington 98402-1616 | | Trustee since 2004 | | Appointed until successor is duly elected and qualified | | •President and Chief Executive Officer, United Way of King County, WA | | 46 | | None |
| | | | | | | | | | | |
Raymond P. Tennison, Jr. Born December 21, 1955 909 A Street Tacoma, Washington 98402-1616 | | Trustee since 2000 Chairman of the Nominating and Governance Committee since 2007 | | Appointed until successor is duly elected and qualified Appointed until successor is duly elected and qualified | | •President, Simpson Investment Company and several additional subsidiary companies, including Simpson Timber Company, Simpson Paper Company and Simpson Tacoma Kraft Company | | 46 | | None |
| | |
| 118 | | Disclosure of Information about Fund Trustees and Officers |
Russell Investment Funds
Disclosure of Information about Fund Trustees and Officers, continued — December 31, 2009 (Unaudited)
| | | | | | | | | | |
Name,
Age,
Address | | Position(s) Held
With Fund and
Length of
Time Served | | Term
of
Office* | | Principal Occupation(s)
During the
Past 5 Years | | No. of
Portfolios
in Russell
Fund
Complex
Overseen
by Trustee | | Other
Directorships Held
by Trustee |
INDEPENDENT TRUSTEES (continued) |
Jack R. Thompson, Born March 21, 1949 909 A Street Tacoma, Washington 98402-1616 | | Trustee since 2005 | | Appointed until successor is duly elected and qualified | | •September 2003 to present, Independent Board Chair and Chairman of the Audit Committee, Sparx Asia Funds •September 2007 to present, Director, Board Chairman and Chairman of the Audit Committee, LifeVantage Corporation (health products company) | | 46 | | •Director, Sparx Asia Funds (investment company) •Director, Board Chairman and Chairman of the Audit Committee, LifeVantage Corporation (health products company) |
| | | | | | | | | | | |
Julie W. Weston, Born October 2, 1943 909 A Street Tacoma, Washington 98402-1616 | | Trustee since 2002 Chairperson of the Investment Committee since 2006 | | Appointed until successor is duly elected and qualified Appointed until successor is duly elected and qualified | | Retired | | 46 | | None |
| * | Each Trustee is subject to mandatory retirement at age 72. |
| | |
| Disclosure of Information about Fund Trustees and Officers | | 119 |
Russell Investment Funds
Disclosure of Information about Fund Trustees and Officers, continued — December 31, 2009 (Unaudited)
| | | | | | | | | | |
Name,
Age,
Address | | Position(s) Held
With Fund and
Length of
Time Served | | Term
of
Office | | Principal Occupation(s)
During the
Past 5 Years | | No. of
Portfolios
in Russell
Fund
Complex
Overseen
by Trustee | | Other
Directorships Held
by Trustee |
TRUSTEES EMERITUS | | | | | | | | | | |
* George F. Russell, Jr., Born July 3, 1932 909 A Street Tacoma, Washington 98402-1616 | | Trustee Emeritus and Chairman Emeritus since 1999 | | Until resignation or removal | | •Director Emeritus, Frank Russell Company (investment consultant to institutional investors (“FRC”)) and RIMCo •Chairman Emeritus, RIC and RIF; Russell Implementation Services Inc. (broker-dealer and investment adviser (“RIS”)); Russell 20-20 Association (non-profit corporation); and Russell Trust Company (non-depository trust company (“RTC”)) •Chairman, Sunshine Management Services, LLC (investment adviser) | | 46 | | None |
| | | | | | | | | | | |
Paul E. Anderson, Born October 15, 1931 909 A Street Tacoma, Washington 98402-1616 | | Trustee Emeritus since 2007 | | Five year term | | •President, Anderson Management Group LLC (private investments consulting) •Trustee, RIC and RIF until 2006 •February 2002 to June 2005, Lead Trustee, RIC and RIF •Chairman of the Nominating and Governance Committee, 2006 | | 46 | | None |
| | | | | | | | | | | |
Lee C. Gingrich, Born October 6, 1930 909 A Street Tacoma, Washington 98402-1616 | | Trustee Emeritus since 2006 | | Five year term | | •Retired since 1995 •Trustee of RIC and RIF until 2005 •Chairman of the Nominating and Governance Committee 2001–2005 | | 46 | | None |
| * | Mr. Russell is also a director emeritus of one or more affiliates of RIC and RIF. |
| | |
| 120 | | Disclosure of Information about Fund Trustees and Officers |
Russell Investment Funds
Disclosure of Information about Fund Trustees and Officers, continued — December 31, 2009 (Unaudited)
| | | | | | |
Name,
Age,
Address | | Position(s) Held
With Fund and
Length of
Time Served | | Term
of
Office | | Principal Occupation(s)
During the
Past 5 Years |
OFFICERS | | | | | | |
Cheryl Wichers Born December 16, 1966 909 A Street Tacoma, Washington 98402-1616 | | Chief Compliance Officer since 2005 | | Until removed by Independent Trustees | | •Chief Compliance Officer, RIC •Chief Compliance Officer, RIF •Chief Compliance Officer, RIMCo •Chief Compliance Officer, RFSC •April 2002–May 2005, Manager, Global Regulatory Policy |
| | | | | | | |
Greg J. Stark, Born May 3, 1968 909 A Street Tacoma, Washington 98402-1616 | | President and Chief Executive Officer from 2004–January 22, 2010 | | Until successor is chosen and qualified by Trustees | | •President and CEO, RIC and RIF •Chairman of the Board, President and CEO, RIMCo •Chairman of the Board, President and CEO, Russell Financial Services, Inc. •Chairman of the Board, President and CEO, RFSC •Chairman of the Board and President, Russell Insurance Agency, Inc. (insurance agency (“RIA”)) •Until 2004, Managing Director of Individual Investor Services, FRC •2000 to 2004, Managing Director, Sales and Client Service, RIMCo |
| | | | | | | |
Sandra Cavanaugh Born May 10, 1954 909 A Street Tacoma, Washington 98402-1616 | | President and Chief Executive Officer since 2010 | | Appointed until successor is duly elected and qualified | | •President and CEO RIC and RIF •May 2009 to December 2009, Executive Vice President, Retail Channel, SunTrust Bank •2007 to January 2009, Senior Vice President, National Sales — Retail Distribution, JPMorgan Chase/Washington Mutual, Inc. •1997 to 2007, President — WM Funds Distributor & Shareholder Services/WM Financial Services |
| | | | | | | |
Mark E. Swanson, Born November 26, 1963 909 A Street Tacoma, Washington 98402-1616 | | Treasurer and Chief Accounting Officer since 1998 | | Until successor is chosen and qualified by Trustees | | •Treasurer, Chief Accounting Officer and CFO, RIC and RIF •Director, Funds Administration, RIMCo, RFSC, RTC and Russell Financial Services, Inc. •Treasurer and Principal Accounting Officer, SSgA Funds |
| | | | | | | |
Peter Gunning, Born February 22, 1967 909 A Street Tacoma, Washington 98402-1616 | | Chief Investment Officer since 2008 | | Until removed by Trustees | | •Chief Investment Officer, RIC and RIF •Director, RIMCo and FRC •1996 to 2008 Chief Investment Officer, Russell, Asia Pacific |
| | | | | | | |
Gregory J. Lyons, Born August 24, 1960 909 A Street Tacoma, Washington 98402-1616 | | Secretary since 2007 | | Until successor is chosen and qualified by Trustees | | •U.S. General Counsel and Assistant Secretary, FRC •Director and Assistant Secretary, RIA •Secretary, RIMCo, RFSC and Russell Financial Services, Inc. •Secretary and Chief Legal Counsel, RIC and RIF |
| | |
| Disclosure of Information about Fund Trustees and Officers | | 121 |
Russell Investment Funds
909 A Street, Tacoma, Washington 98402
(800) 787-7354
Interested Trustee
Greg J. Stark
Sandra Cavanaugh
Independent Trustees
Thaddas L. Alston
Kristianne Blake
Daniel P. Connealy
Jonathan Fine
Raymond P. Tennison, Jr.
Jack R. Thompson
Julie W. Weston
Trustees Emeritus
George F. Russell, Jr.
Paul E. Anderson
Lee C. Gingrich
Officers
Greg J. Stark, President and Chief Executive Officer
Sandra Cavanaugh, President and Chief Executive Officer
Cheryl Wichers, Chief Compliance Officer
Peter Gunning, Chief Investment Officer
Mark E. Swanson, Treasurer and Chief Accounting Officer
Gregory J. Lyons, Secretary
Adviser
Russell Investment Management Company
909 A Street
Tacoma, WA 98402
Administrator and Transfer and Dividend Disbursing Agent
Russell Fund Services Company
909 A Street
Tacoma, WA 98402
Custodian
State Street Bank and Trust Company
Josiah Quincy Building
200 Newport Avenue
North Quincy, MA 02171
Office of Shareholder Inquiries
909 A Street
Tacoma, WA 98402
(800) 787-7354
Legal Counsel
Dechert LLP
200 Clarendon Street, 27th Floor
Boston, MA 02116-5021
Distributor
Russell Financial Services, Inc.
909 A Street
Tacoma, WA 98402
Independent Registered Public Accounting Firm
PricewaterhouseCoopers LLP
1420 5th Avenue
Suite 1900
Seattle, WA 98101
Money Managers as of December 31, 2009
Multi-Style Equity Fund
First Eagle Investment Management, LLC, New York, NY
BlackRock Capital Management, Inc., New York, NY
Columbus Circle Investors, Stamford, CT
DePrince, Race & Zollo, Inc., Winter Park, FL
Institutional Capital LLC, Chicago, IL
Jacobs Levy Equity Management, Inc., Florham Park, NJ
Montag & Caldwell, Inc., Atlanta, GA
Suffolk Capital Management, LLC, New York, NY
Aggressive Equity Fund
ClariVest Asset Management LLC, San Diego, CA
DePrince, Race & Zollo, Inc., Winter Park, FL
Jacobs Levy Equity Management, Inc., Florham Park, NJ
Ranger Investment Management, L.P., Dallas, TX
Signia Capital Management, LLC, Spokane, WA
Tygh Capital Management, Inc., Portland, OR
Non-U.S. Fund
Barrow, Hanley, Mewhinney & Strauss, LLC, Dallas, TX
Marsico Capital Management, LLC, Denver, CO
MFS Institutional Advisors, Inc., Boston, MA
Pzena Investment Management, LLC, New York, NY
Real Estate Securities Fund
AEW Capital Management, L.P., Boston, MA
Cohen & Steers Capital Management, Inc., New York, NY
Heitman Real Estate Securities LLC, Chicago, IL
INVESCO Advisers, Inc. which acts as a money manager to the Fund through its INVESCO Real Estate Division, Dallas, TX
Core Bond Fund
Goldman Sachs Asset Management, L.P., New York, NY
Metropolitan West Asset Management, LLC, Los Angeles, CA
Pacific Investment Management Company LLC, Newport Beach, CA
This report is prepared from the books and records of the Funds and is submitted for the general information of shareholders and is not authorized for distribution to prospective investors unless accompanied or preceded by an effective Prospectus. Nothing herein contained is to be considered an offer of sale or a solicitation of an offer to buy shares of Russell Investment Funds. Such offering is made only by Prospectus, which includes details as to offering price and other material information.
| | |
| 122 | | Adviser, Money Managers and Service Providers |
| | | | |
| Russell Investment Funds | | 909 A Street | | 800-787-7354 |
| | Tacoma, Washington 98402 | | Fax: 253-591-3495 |
| | | | www.russell.com |


36-08-023

2009 ANNUAL REPORT
Russell Investment Funds
LifePoints® Funds Variable Target Portfolio Series
DECEMBER 31, 2009
FUND
Moderate Strategy Fund
Balanced Strategy Fund
Growth Strategy Fund
Equity Growth Strategy Fund

Russell Investment Funds
Russell Investment Funds is a series investment company with nine different investment portfolios referred to as Funds. These financial statements report on four of these Funds.
Russell Investment Funds
LifePoints® Funds
Variable Target Portfolio Series
Annual Report
December 31, 2009
Table of Contents
Russell Investment Funds - LifePoints® Funds Variable Target Portfolio Series
Copyright© Russell Investments 2010. All rights reserved.
Russell Investments is a Washington, USA corporation, which operates through subsidiaries worldwide and is a subsidiary of The Northwestern Mutual Life Insurance Company.
Fund objectives, risks, charges and expenses should be carefully considered before investing. A prospectus containing this and other important information must precede or accompany this material. Please read the prospectus carefully before investing.
Securities products and services offered through Russell Financial Services, Inc. member FINRA, part of Russell Investments.
Indices and benchmarks are unmanaged and cannot be invested in directly. Returns represent past performance, are not a guarantee of future performance, and are not indicative of any specific investment. Index return information is provided by vendors and although deemed reliable, is not guaranteed by Russell Investments or its affiliates.
Russell Investments is the owner of the trademarks, service marks, and copyrights related to its respective indexes.
Performance quoted represents past performance and does not guarantee future results. The investment return and principal value of an investment will fluctuate so that shares, when redeemed, may be worth more or less than their original cost. Current performance may be lower or higher than the performance data quoted.
To Our Shareholders
We are pleased to provide you with Russell Investment Funds’ 2009 Annual Report. It includes portfolio management discussions and fund-specific details that will give you an in-depth understanding of fund performance for the fiscal year ending December 31, 2009.
Every day, we strive to improve financial security for people and earn the continued support of our investors. Despite another year of economic uncertainty, the markets have rebounded sharply from the spring. We are sensitive to ongoing investor concerns and recognize the need for investment solutions that help provide the opportunities investors seek.
We continue to believe that investors are well served by remaining focused on long-term disciplined investing in well-diversified, asset allocated portfolios and that they should continue to talk with their financial advisors to ensure their portfolios remain aligned with long term goals.
The Russell Investments team has years of experience in managing people’s money through various market cycles, trends and turnarounds. As always, we are continuously monitoring our investment managers and our funds to ensure adherence to their long-term strategies.
We appreciate your continued support.
Best regards,

Greg Stark
Chief Executive Officer, Chairman and President
Russell Investment Management Company
Russell Investment Funds
Market Summary as of December 31, 2009 (Unaudited)
U.S. Equity Markets
The U.S. equity market began the year with elevated volatility and weakness before rebounding sharply and ultimately delivering a strong positive return for 2009. The broad market Russell 3000® Index rose 28.3% over the year ended December 31, 2009 as the global economy began to emerge from the worst recession and financial crisis in almost a century. The fear and panic which had pervaded the market in 2008 and early 2009 began to dissipate in March 2009 as investors increased their risk appetites.
Even with coordinated actions by central banks across the globe and a variety of highly stimulative governmental policies in place, liquidity remained an issue for many banks, consumers and small businesses at the start of 2009, leading them to cut spending and lay-off employees. With unemployment continuing to rise, expectations of a strong recovery were tempered. Meanwhile, consumer credit was slow to unfreeze and the housing market remained weak. Against this backdrop, anxiety about the health of banks and other financial services companies persisted. These and other factors led the broad U.S equity market to decline during the first two months of the year and to set a new low on March 6, 2009.
Following the March 6, 2009 low, the U.S. equity market, as measured by the Russell 3000® Index, experienced a rally led by the three largest U.S. banks announcing that they would likely earn a profit for the first quarter of 2009. The market continued to rise after the Federal Reserve Board stated that it would purchase “distressed assets” in order to remove them from the balance sheets of banks. The rebound was further extended by the early May announcement of positive results from the stress tests that the U.S. government conducted on 19 U.S. banks. While capital ratios were found not to be sufficient at all the banks at the time, there were no banks which the market deemed to be on the verge of insolvency. Reports that several banks were planning to pay back TARP funds as soon as possible also helped alleviate fears about the health of the financial sector. In addition to positive bank-related news, declining inventories across many sectors led to the expectation that restocking, and the related uptick in demand for manufactured goods, would soon follow. Around the same time, a series of reports showed consumer confidence improving more than expected, further adding to investors’ optimism. The Federal Reserve Board’s decision to keep the Fed Funds rate at an historical low near zero percent was also an important contributor in providing businesses with low cost financing to encourage growth.
Stocks that had been priced for an elevated probability of bankruptcy by investors during the downturn led the rally as the bankruptcy scenario appeared increasingly unlikely. Small capitalization stocks outperformed large capitalization stocks as investors’ risk appetites increased. After significantly underperforming during the downturn, cyclical companies (those more tied to the economic cycle) and large capitalization financial stocks were among the top performers at the outset of the rally. Small capitalization financial stocks continued to underperform as investors remained concerned about the health of smaller regional banks and the rising delinquencies in their commercial real estate loan portfolios. Higher beta (beta is a measure of the volatility of a given security compared to the volatility of the market as a whole) stocks and companies with low price-to-book ratios were among the top performers, as were stocks with higher earnings variability and higher debt-to-capital ratios. These factors were out of favor during the market decline of 2008 and early 2009. Consistent with the market’s sharp reversal, stocks with the lowest price momentum were among the best performers during the rally. Higher quality companies (typically those with more stable earnings growth, less leverage and attractive balance sheets) faced headwinds as investors took on more risk and increased the cyclicality of their portfolios. Defensive sectors, including the health care sector which faced significant uncertainty surrounding the Obama administration’s plan to overhaul healthcare, and factors such as higher yield and lower earning per share variability lagged during this period.
Mid-October 2009 marked a moderation of these trends, with lower risk and higher quality factors performing better as investors took profits in many of the names which had led the rally. The market shifted its focus away from deep cyclical areas and toward companies with more stable and sustainable earnings and business growth which investors believed had become undervalued. November was a more muted factor environment (no strong trends) which marginally extended the shift away from lower quality cyclical stocks. The market finished the year by rewarding earnings growth in
Russell Investment Funds
December and adding to growth stocks’ outperformance relative to value stocks. In the fourth quarter, the trend toward lower quality being rewarded moderated and there was a slight shift toward higher quality factors such as higher profitability (measured by return on assets), stronger balance sheets (including lower debt leverage) and less cyclicality.
For 2009, both gross domestic product and corporate profits rose from their 2008 lows. In addition, reports from the housing sector showed signs of stabilization. Most economic indicators turned from strongly negative, to less negative, to improving over the course of the year. Although the domestic economy began to recover during the year, companies with exports to faster-growing, developing, non-U.S. economies posted stronger performance as they benefited from the weakening of the U.S. dollar for most of the period. During the second half of 2009 in particular, exposure to U.S. companies which generated a portion of their revenues overseas was rewarded.
Despite strong performance off of the market’s early March low, the financial services sector posted the second lowest return of any sector for the year due to its extreme weakness in the first two months of the year. Only the defensive utilities sector finished behind the financials sector. The energy sector experienced a reversal similar to that of the financials sector during the year. The energy sector rebounded only after significant weakness early in the period amid concerns about the magnitude of the global economic slowdown earlier in the year and the related drop in demand. Other sectors which lagged the overall market included the more defensive consumer staples and health care sectors. Producer durables also lagged as it was hit by concerns about a slowdown in government defense spending.
The top-performing sectors in the Russell 3000® Index were the more cyclical ones. The technology sector led on expectations that businesses will increase IT expenditures as part of the equipment and software upgrade cycle after putting spending on hold amid the weak economic environment. Finishing behind technology, but still outperforming, were the materials and processing and consumer discretionary sectors. Materials stocks benefited from higher demand due to increased optimism about the economic recovery, especially as developing countries continue to build out their infrastructure. Improving consumer confidence contributed to the rebound of consumer discretionary stocks.
The recovery in stock prices occurred across investment styles as well as the market capitalization spectrum. While value stocks rebounded more strongly off the March lows, growth stocks led over the entire year. This was true for both the large capitalization and small capitalization market segments. For the year, the Russell 1000® Growth Index returned 37.2% and the Russell 1000® Value Index returned 19.7%, while the Russell 2000® Growth Index returned 34.5% and the Russell 2000® Value Index returned 20.6%. Small capitalization stocks outperformed large capitalization stocks off of the March lows, but lagged slightly over the year due to weakness early in the period. The Russell 2000® Index returned 27.2% and the Russell 1000® Index returned 28.4% for the year. Midcap stocks performed the best over the period, while microcap stocks lagged despite strong performance during the rally. The Russell Midcap® Index returned 40.5% and the Russell Microcap® Index returned 27.5% for the fiscal year.
The challenging active management environment of early 2009 improved during the year as there was more differentiation between stocks (lower correlation) and a substantial reduction in the indiscriminate selling of all riskier assets as the year progressed. Small capitalization managers across the style spectrum outperformed their benchmarks more consistently than their large capitalization counterparts, with small capitalization value managers in particular posting strong relative performance. Growth managers generally had a more difficult time relative to their benchmark as momentum was not in favor during a year which featured multiple sharp reversals in market direction. In addition, growth managers with less valuation sensitivity faced headwinds as stocks with low price to book and price to earnings ratios were rewarded. The Lipper® Small Cap Value Funds Average outperformed the Russell 2000® Value Index by 11.7%, the Lipper® Small Cap Core Funds Average outperformed the Russell 2000® Index by 4.9% and the Lipper® Small Cap Growth Funds Average outperformed the Russell 2000® Growth Index by 1.4%. The Lipper® Large Cap Growth Funds Average underperformed the Russell 1000® Growth Index by 1.9%, the Lipper® Large Cap Core Funds Average underperformed the Russell 1000® Index by 1.2%, and the Lipper® Large Cap Value Funds Average outperformed the Russell 1000® Value Index by 3.4%.
Real Estate Securities Market
For the fiscal year ending December 31, 2009, U.S. real estate investment trusts (“REITs”) generated a 27.99% return as measured by the FTSE NAREIT Equity REIT Index (the “Index”). During this period, U.S. REITs performed in line with the broader U.S. equity market and underperformed the international real estate securities market. Elevated volatility persisted, as evidenced by the double-digit value declines early in the year, while April marked the best month of performance since the inception of the Index in 1972. REIT share prices declined by 42% between the start of the fiscal year and early-March 2009 before sharply reversing course and gaining over 120% during the remainder of the year.
Russell Investment Funds
Early in the fiscal year, REIT share prices declined steeply, as the sector exhibited a high correlation to the broader financial services sector. Investor sentiment toward the sector remained negative on concerns over labor market softness, weak consumer spending, lack of available debt capital and a stagnant housing market. At the property level, the deepening recession continued to undercut demand for commercial space, which lowered both occupancy and asking rents. REIT earnings suffered as a result. This period of rapid decline was characterized by a flight to quality. The market favored REITs with the lowest amounts of leverage, limited near-term refinancing needs and limited development pipelines. Neither dividend yield nor market capitalization appeared to be contributing factors to differences in individual company performance.
Beginning in March, numerous REITs raised capital in the equity market to address financing needs. Despite being generally dilutive to earnings, these equity offerings enabled struggling REITs to pay down debt and improve balance sheets, causing concerns over near-term solvency to subside. Meanwhile, relatively well-capitalized REITs took the opportunity to expand their cash reserves in anticipation of acquisition opportunities that could arise as maturing debt forces sellers to the market. Ongoing equity raising activity reduced leverage and restored confidence in REITs, attracting some non-dedicated REIT investors to the sector. This sparked a recovery in share prices and a relaxation of investors’ aversion to risk in the sector. As the REIT market rebounded from March lows, the most highly leveraged names, which had sustained the largest declines during the downturn, experienced the most extreme rebounds in share price.
A stream of positive economic news further extended this rally. July employment figures beat expectations, credit markets showed signs of recovery, the Federal Reserve Board announced the extension of the Term Asset-Backed Securities Loan Facility (TALF) program through June 2010 and housing sales experienced a modest uptick. Investors also took comfort in the fact that the equity market remained open and the unsecured debt market showed improvement. A total of $20.4 billion of equity and $8 billion of unsecured debt was raised during the fiscal year by REITs. The REIT market rally moderated somewhat in September 2009, first on concerns over the accelerated run-up in share prices over the previous several months, and later in response to news that existing and new home sales came in below expectations. Following the release of additional unfavorable economic data, including employment numbers below expectations, REITs were sold off in October. However, these declines were short-lived, as expectations of an economic recovery drove positive REIT performance from early November through year-end.
The historic levels of volatility in the REIT market during the period were driven by two factors: the high correlation to the financial services sector and a rise in short selling of REIT shares. The elevated correlation between REITs and the financial services sector, which began in 2008 with the heightening of the credit crisis, continued during the fiscal year. Short selling in the REIT sector also began to increase from 2008 due to negative investor sentiment and continued to rise into 2009 amid weakening fundamentals and unfavorable market conditions. In March 2009, concurrent with the REIT market’s lows, short selling reached its peak at nearly 12% of shares outstanding (compared with 3-4% prior to the downturn). As REITs began to issue equity and share prices rallied in the following months, the level of short selling decreased by over 4%. REIT volatility consequently moderated from peak levels, but remained elevated in comparison to historical levels.
During the fiscal year, returns were widely dispersed across the property sectors. Among the poorest performing sectors were shopping centers, self storage, and industrial. Sentiment toward the shopping centers sector was particularly negative due to deteriorating occupancy and income metrics driven by weak consumer spending. Self storage was the only property sector to post a positive return in 2008, sparking investors to take profits and rotate out of this sector during this fiscal year. While struggling industrial REITs addressed concerns over bankruptcy risk through equity issuance, significant development pipelines amid weak leasing market conditions put pressure on earnings forecasts. The two best performing property sectors were lodging/resorts and regional malls. The lodging/resorts sector was among the poorest performing sectors during the period prior to March 2009 and subsequently staged a rally as investors displayed a greater appetite for risk. Numerous lodging/resorts stocks that had been sold off excessively during the downturn multiplied in value as investor sentiment recovered. After performing poorly early in the fiscal year, the regional malls sector rebounded led strongly by sector leader Simon Property Group, which helped to spur the trend of equity issuance with its notable capital raising efforts in March.
The U.S. REIT market underperformed relative to the international real estate securities market by a fairly wide margin during the fiscal year, as measured by the FTSE EPRA/NAREIT Developed Real Estate Index. After experiencing price corrections in the prior year, the REIT markets in both Asia and Continental Europe had large positive returns during the fiscal year. Real estate securities in the UK and Australia also posted meaningful gains during the fiscal year, outperforming relative to U.S. REITs. Hong Kong property stocks recorded particularly strong gains for the fiscal year, while Japan was among the worst performing REIT markets globally, underperforming significantly relative to U.S. REITs.
Russell Investment Funds
Non-U.S. Developed Equity Markets
Non-U.S. equity markets rose more than 30% for the year ended December 31, 2009. The MSCI EAFE (Europe, Australasia, and Far East) Index gained 31.78% for the period. The gain reflects the strong rebound for global equity markets starting in March 2009, with a low to high return of more than 78% as measured by the MSCI EAFE.
For the period, investors in non-U.S. markets benefited from gains in foreign currencies relative to the U.S. dollar. EAFE’s gain, when measured in local currencies, was a more modest 21.00%. The more commodity-intensive economies such as Australia and Canada had very strong gains in their currencies. The Australian dollar gained nearly 28% and the Canadian dollar nearly 16% relative to the US dollar.
Value-driven investment strategies led the market recovery as economic conditions appeared to improve slowly, but steadily, beginning in March 2009. U.S. government-led stimulus helped restore confidence in the viability of global commerce, though not as much in the ability of global businesses to grow as rapidly. The MSCI EAFE Value Index rose 34.23% for the period, while the EAFE Growth Index rose 29.36%.
Regionally, the Pacific ex Japan region had the strongest gains. The region gained 72.81% for the period as measured by MSCI Pacific ex Japan Index led by the 76.43% gain in the Australian market as measured by MSCI Australia Index. European stocks rose 35.83% as measured by MSCI Europe Index. Japan was the notable laggard gaining 6.25% as measured by MSCI Japan Index for the period. While developed markets had strong returns, emerging markets had even stronger gains. The MSCI Emerging Markets Index gained 83.53% led by Brazil’s 128.06% gain as measured by the MSCI Brazil Index.
The strength of emerging markets reflected in large part the strong market for more economically-leveraged areas of the global stock market. Industrial metals producers and the other industrial cyclical companies posted very strong gains as investors grew more optimistic towards global economic recovery. The MSCI EAFE materials sector gained 69.3% for the year, led by the 95.16% gain of the metals and mining sector. The information technology, energy and financial sectors also posted strong gains. Financial stocks recovered as unprecedented economic stimulus and government-led relief programs convinced investors that these companies could survive and eventually possibly thrive.
In contrast to sectors highly levered to the global economy, more staid and predictable sectors lagged. The MSCI utilities sector gained 4.18%. The MSCI telecommunications and health care sectors also lagged with respective gains of 15.67% and 17.52%.
Emerging Markets
During 2009, the MSCI Emerging Markets Index (“Index”) increased 78.5%. The Index had four consecutive quarters of positive performance with the second and third quarter outperforming significantly. The Index gained 34.7% in the second quarter, its best quarterly return since inception of the Index in 1988. Emerging markets outperformed developed markets which gained 30.0% as measured by the MSCI World Index. Emerging markets returns were largely predicated on the belief that these markets would recover soonest given better capitalized, less leveraged financial systems and policymakers (particularly in Asia) that are experienced at navigating periods of economic turbulence. The positive performance in the fourth quarter of 2009 was largely driven by the improving economic situation, particularly in Latin America and a further rebound in commodity prices. The US dollar’s continued weakness helped increase the appeal of hard assets including gold and copper. The price of gold rose above the $1,000 an ounce ceiling and reached an all-time high of $1,227.5 an ounce in December, while copper gained nearly 140% in 2009. Crude oil, Russia’s major export, neared $80 a barrel on the improving economic situation in the US and concerns over unrest in Iran.
Inflows into the emerging markets asset class reached record levels in 2009 as the economic outlook improved for emerging countries’ exporters as stimulus measures from China to Brazil gained traction and US economic data improved. The best-performing markets over the year included Turkey, 97.5% as measured by MSCI Turkey Index, Brazil 128.1% as measured by MSCI Brazil Index and Russia 104.2% as measured by MSCI Russia Index. These markets typically perform strongly when risk appetite is robust. Indonesia, often regarded as the riskiest of emerging markets, gained 126.2% as measured by MSCI Indonesia Index. Resource rich Latin American markets strengthened as investors rotated assets away from developed economies and into countries that supply China with raw materials, such as Chile which gained 85.6% as measured by MSCI Chile Index and Peru which gained 71.9% as measured by MSCI Peru Index. Chinese equities increased 62.3% as measured by MSCI China Index on speculation that its economic strength will lead the world out of recession.
Russell Investment Funds
Several emerging market currencies, notably those closely linked to commodities, significantly outperformed the US dollar over the period. The leader among them was the Brazilian real, which was up over 45% relative to the U.S. dollar. The currency gained the most since its 1993 creation as the country emerged from recession in the second quarter and had its credit rating raised to the lowest investment-grade level in September. The South African rand also rose in 2009, up 38.4% relative to the U.S. dollar as record-low interest rates in developed nations encouraged purchases of high-yield assets and commodity prices rose on signs of a global economic recovery. The Chilean peso 26.6% had a strong start in 2009 as its central bank, the most aggressive monetary policy institution in Latin America, lowered interest rates by 6% between January and March in an effort to stimulate growth. Chile is the world’s biggest copper producer and it obtained the first credit ratings increase among investment-grade nations in 2009.
U.S. Fixed Income Markets
As much as 2008 was characterized by the credit crisis, investor anxiety and a flight to the relative safety of U.S. Treasuries, 2009 was a period of significant government intervention. Government action was crucial to restoring liquidity to the credit markets and investor confidence and served as a driver of the fixed income market rally during the second half of the year.
Following the bankruptcy of Lehman Brothers Holdings Inc. in September 2008, a massive reshuffling of banking institutions ensued. Some banks were compelled into competitor mergers/acquisitions while others sought bank holding status, all causing further unrest in the fixed income market and decreasing liquidity. This disruption was largely the impetus for the Emergency Economic Stabilization Act of 2008, which initially was designed to address weakness in the banking industry by allocating $700 billion for the purchase of distressed assets from banks. The U.S. Treasury used Troubled Asset Relief Program (TARP) funds for direct capital injections into financial institutions while the Federal Deposit Insurance Corporation (FDIC) temporarily increased retail bank deposit insurance to $250,000 per retail bank account.
In mid-November 2008, in a bid to restore liquidity in the asset-backed securities (ABS) market, the Federal Reserve Board announced the creation of the Term Asset-Backed Securities Lending Facility (TALF) under which the Federal Reserve Bank of New York planned to loan up to $200 billion on a non-recourse basis to purchasers of newly issued AAA-rated ABS collateralized primarily by consumer loans (credit card receivables and automobile loans). This program was well received and did much to increase liquidity in the fixed income markets. It was subsequently expanded to include other assets, such as commercial mortgage-backed securities (CMBS).
Numerous other programs were created by various U.S. government agencies and instrumentalities to address issues in the credit markets and broader economy and in doing so, the U.S. government has spent, lent or committed $12.8 trillion to these programs
In December 2008, the Federal Reserve decreased the rate to the historically low range of 0.00% – 0.25%, where it remained at the end of December 2009.
Despite the massive government intervention, the housing market, a key factor underlying the credit and economic crises, remained largely under pressure throughout the period. However, there were positive signs. The U.S. government reached its goal of modifying the mortgage loans of 500,000 troubled homeowners ahead of schedule and the S&P/Case-Shiller 20-City Home Price Index increased every month from April through September when it plateaued. However, a record 2.8 million U.S. properties received foreclosure notices in 2009, up 21% from 2008 and up 120% from 2007, according to the RealtyTrac 2009 Year-End U.S. Foreclosure Market Report.
The increase in foreclosures was exacerbated by unemployment and the recession. While gross domestic product for the third quarter of 2009 grew at an annualized rate of 2.2% (largely due to government stimulus), it remained depressed at -2.6% for the 12 months ending September 2009. From December 2008 to December 2009, unemployment increased from 7% to 10%, its highest level in recent history. Total writedowns at banks from the start of the credit crisis (summer 2007) through end of 2009 have totaled $1.74 trillion.
In April 2009, the U.S. government announced the results of bank stress tests. The capital markets positively received these results, interpreting them to mean that the prospect of financial disaster had become more remote. Against a backdrop of extremely low interest rates and explicit government support, this news started the fixed income rally which lasted throughout the second half of the year. The Barclays Capital U.S. Aggregate Index (BarCap Agg), a broad measure of U.S. investment grade fixed income securities, returned 5.93% (outperforming equivalent-duration Treasuries by 7.46%) for the period, up significantly from its calendar 2008 return of 5.24% (when it underperformed Treasuries by 7.10%).
Russell Investment Funds
In sharp contrast to 2008, all major investment grade and non-investment grade sectors outperformed Treasuries in 2009, as investor anxiety decreased, the credit crisis abated and liquidity returned to the markets. Corporate credit was the most notable outperforming sector during the period, as investors saw confirmation of their beliefs that the high default rates implied by corporate bond prices were unrealistic. The investment grade corporate sector of the BarCap Agg returned 18.68% (outperforming Treasuries by 22.76%) and the Barclays Capital High Yield (corporate) Index returned 58.21% (outperforming Treasuries by 59.55%) for the year.
During most of the period, non-agency mortgage-backed securities continued to decline in price. However, the implementation of the Public-Private Investment Program reversed this trend, causing prime and Alt-A mortgage-backed securities to rally in the second half of the year.
Russell Investment Funds
Moderate Strategy Fund
Portfolio Management Discussion and Analysis — December 31, 2009 (Unaudited)
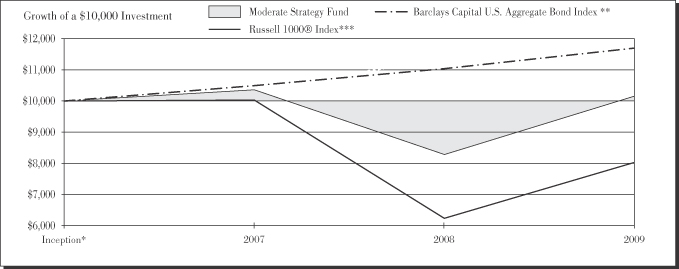
| | | | | |
| |
| Moderate Strategy Fund | | | |
| | | | | Total
Return | |
1 Year | | | | 23.09 | % |
Inception* | | | | 0.54 | %§ |
| | | | | |
|
| Barclays Capital U.S. Aggregate Bond Index** | |
| | | | | Total
Return | |
1 Year | | | | 5.93 | % |
Inception* | | | | 6.00 | %§ |
| | | | | |
|
| Russell 1000® Index*** | |
| | | | | Total
Return | |
1 Year | | | | 28.43 | % |
Inception* | | | | -7.85 | %§ |
| | |
| 10 | | Moderate Strategy Fund |
Russell Investment Funds
Moderate Strategy Fund
Portfolio Management Discussion and Analysis — December 31, 2009 (Unaudited)
The Fund is a fund of funds that invests in other Russell Investment Funds and Russell Investment Company mutual funds (the “Underlying Funds”). The Underlying Funds allocate most of their assets among multiple money managers. Russell Investment Management Company (“RIMCo”), as the Underlying Funds’ advisor, may change the allocation of the Underlying Funds’ assets among money managers at any time. An exemptive order from the Securities and Exchange Commission (SEC) permits RIMCo to engage or terminate a money manager in an Underlying Fund at any time, subject to the approval by the Underlying Fund’s Board without a shareholder vote.
What is the Fund’s investment objective?
The Moderate Strategy Fund (“Fund”) seeks to provide high current income and moderate long term capital appreciation.
How did the Fund perform relative to its benchmark for the fiscal year ended December 31, 2009?
For the fiscal year ended December 31, 2009, the Moderate Strategy Fund gained 23.09%. This compared to the Barclays Capital U.S. Aggregate Bond Index, which gained 5.93% during the same period. The Fund’s performance includes operating expenses, whereas the Index returns are unmanaged and do not include expenses of any kind The Fund’s overperformance relative to the Barclays Capital Aggregate Bond Index was due to the Fund’s exposure to non-U.S. equity securities and non-Treasury fixed income sectors, including securities that are not in the benchmark (e.g. high yield credit, non-agency mortgages backed securities and, emerging market debt) fixed income securities. Non-U.S. equity securities benefited from both early indications of the global economic recovery in the second half of the fiscal year and the weakness of the U.S. dollar. Non-Treasury fixed income securities rebounded strongly as investors sought opportunities in bonds with historically cheap prices once the credit crisis showed signs of easing.
For the year ended December 31, 2009, the Moderate Strategy Lipper Composite gained 21.36% and the Lipper® Mixed Asset Target Allocation Moderate Funds Average (VIP) gained 23.04% These results serve as peer comparisons and are expressed net of operating expenses.
Each Underlying Fund has a benchmark reflective of its respective asset class. These benchmarks may be different than the Fund’s benchmark. The Fund’s benchmark represents the largest asset class of the Underlying Funds in which it invests.
How did the market conditions described in the Market Summary report affect the Fund’s performance?
The Fund is a fund of funds and its performance is based upon the performance of the Underlying Funds in which it invests. The Fund’s performance was negatively impacted by the financial crisis that affected virtually all asset classes from early in the year until March 9, 2009. Fear pervaded the markets, resulting in global government interventions, including the U.S. government’s assistance in the U.S. marketplace
through special programs designed to assist banks, auto companies and consumers. Many investors feared the economy was headed towards a deep recession, possibly even a depression. This led to a “flight to quality” in the markets during the first part of the fiscal year where risk was avoided and only investments deemed the safest maintained value. All of the Underlying Funds added to excess returns, weighted by their percentage held in the Fund, relative to the Fund’s benchmark. Of the broad asset classes, most equity asset classes, notably U.S equity, non U.S. equity and emerging markets, had the strongest outperformance relative to the Fund’s benchmark, the Barclays Capital U.S. Aggregate Bond Index. Yet on the basis of weighted excess returns, due to the Fund’s 60% exposure to fixed income, the fixed income asset class contributed most.
How did the investment strategies and techniques employed by the Fund and its money managers of the Underlying Funds affect the Fund’s performance?
At the Fund level, all Underlying Funds contributed to excess returns relative to the Fund’s benchmark. The 60% fixed income exposure, as represented by the RIF Core Bond Fund, was invested in non-Treasury sectors and securities that are not in that Underlying Fund’s benchmark (e.g. high yield credit, non-agency mortgages backed securities and emerging market debt). As a result, and as the risk appetite returned to the market during 2009, the RIF Core Bond Fund’s underweight to U.S. Treasuries and overweight to out-of-benchmark non-Treasury securities resulted in returns in excess of the benchmark.
The 20% U.S. equity large cap exposure represented by the RIF Multi-Style Equity and the Russell Investment Company Russell U.S. Quantitative Equity Funds, added notably to the Fund’s weighted excess returns relative to the Fund’s benchmark. The fundamental investment strategies of the managers in the RIF Multi-Style Equity Fund who were exposed to higher beta (beta is a measure of the volatility of a given security compared to the volatility of the market as the whole) stocks that were positioned to benefit from an economic recovery contributed positively to performance. Within the large cap U.S. value segment, managers of the RIF Multi-Style Equity and the RIC Russell U.S. Quantitative Equity Funds were effective at finding deeply undervalued companies, some priced for potential bankruptcy, which rose sharply as investors increased their appetites for risk in the later part of the year. The quantitative strategies pursued by the RIC Russell U.S. Quantitative Equity Fund, generally based on discernable trends, did not perform as well as fundamental strategies during the earlier volatile market period. The 3% small cap U.S equity exposure, as represented by the RIF Aggressive Equity Fund, also contributed to weighted excess returns as small cap stocks performed well after their March lows.
Within the 14% exposure to global and non-U.S investment strategies, at a 9% total Fund allocation, the RIF Non U.S. Fund added the most to the Fund’s weighted excess returns.
| | |
| Moderate Strategy Fund | | 11 |
Russell Investment Funds
Moderate Strategy Fund
Portfolio Management Discussion and Analysis — December 31, 2009 (Unaudited)
Emerging markets was the strongest performing asset class during the fiscal period benefiting from investors increased appetite for risk and the highly performing commodities and materials sectors. Global and non-U.S. developed market strategies, as represented by the RIF Non-U.S. and the RIC Russell Global Equity Funds, generally benefited from the market rallies in response to efforts by governments globally to mitigate the financial and economic crises. This resulted in a shift in market leadership to distressed value stocks and industrial cyclicals and generally those more levered to an economic upturn.
The Fund’s 3% exposure to real estate, as represented by the RIF Real Estate Securities Fund, contributed modestly to weighted excess returns. The RIF Real Estate Securities Fund remained positioned somewhat defensively during the fiscal year, with a focus on higher-quality, larger-capitalization REITs with strong balance sheets and more stable earnings prospects.
Describe any changes to the Fund’s structure or allocation to the Underlying Funds.
There were no changes to the Fund’s structure or allocations during the year.
The views expressed in this report reflect those of the portfolio managers only through the end of the period covered by the report. These views do not necessarily represent the views of RIMCo, or any other person in RIMCo or any other affiliated organization. These views are subject to change at any time based upon market conditions or other events, and RIMCo disclaims any responsibility to update the views contained herein. These views should not be relied on as investment advice and, because investment decisions for a Russell Investment Fund (RIF) or Russell Investment Company (RIC) Fund are based on numerous factors, should not be relied on as an indication of investment decisions of any RIF or RIC Fund.
| * | | The Fund commenced operation on April 30, 2007. |
| ** | | The Barclays Capital U.S. Aggregate Bond Index is an index, with income reinvested, generally representative of intermediate-term government bonds, investment-grade corporate debt securities and mortgage-backed securities. |
| *** | | Russell 1000® Index includes the 1,000 largest companies in the Russell 3000® Index. The Russell 1000® Index represents the universe of stocks from which most active money managers typically select. The Russell 1000® Index return reflects adjustments for income dividends and capital gains distributions reinvested as of the ex-dividend dates. |
The performance shown in this section does not reflect any Insurance Company Separate Account or Policy Charges. Performance is historical and assumes reinvestment of all dividends and capital gains. Investment return and principal value will fluctuate so that an investor’s shares, when redeemed, may be worth more or less than when purchased. Past performance is not indicative of future results.
| | |
| 12 | | Moderate Strategy Fund |
Russell Investment Funds
Moderate Strategy Fund
Shareholder Expense Example — December 31, 2009 (Unaudited)
Fund Expenses
The following disclosure provides important information regarding each Fund’s Expense Example, which appears on each Fund’s individual page in this Annual Report. Please refer to this information when reviewing the Expense Example for a Fund.
Example
As a shareholder of the Fund, you incur two types of costs: (1) transaction costs, and (2) ongoing costs, including management fees and other Fund expenses. The Example is intended to help you understand your ongoing costs (in dollars) of investing in the Fund and to compare these costs with the ongoing costs of investing in other mutual funds. The Example is based on an investment of $1,000 invested at the beginning of the period and held for the entire period indicated, which for this Fund is from July 1, 2009 to December 31, 2009.
Actual Expenses
The information in the table under the heading “Actual Performance” provides information about actual account values and actual expenses. You may use the information in this column, together with the amount you invested, to estimate the expenses that you paid over the period. Simply divide your account value by $1,000 (for example, an $8,600 account value divided by $1,000 = 8.6), then multiply the result by the number in the first column in the row entitled “Expenses Paid During Period” to estimate the expenses you paid on your account during this period.
Hypothetical Example for Comparison Purposes
The information in the table under the heading “Hypothetical Performance (5% return before expenses)” provides information about hypothetical account values and hypothetical expenses based on the Fund’s actual expense ratio and an assumed rate
of return of 5% per year before expenses, which is not the Fund’s actual return. The hypothetical account values and expenses may not be used to estimate the actual ending account balance or expenses you paid for the period. You may use this information to compare the ongoing costs of investing in the Fund and other funds. To do so, compare this 5% hypothetical example with the 5% hypothetical examples that appear in the shareholder reports of other funds.
Please note that the expenses shown in the table are meant to highlight your ongoing costs only and do not reflect any transactional costs. Therefore, the information under the heading “Hypothetical Performance (5% return before expenses)” is useful in comparing ongoing costs only, and will not help you determine the relative total costs of owning different funds. In addition, if these transactional costs were included, your costs would have been higher. The fee and expenses shown in this section do not reflect any Insurance Company Separate Account or Policy Charges.
| | | | | | |
| | | Actual
Performance | | Hypothetical
Performance
(5% return
before expenses) |
| | | | | | |
Beginning Account Value | | | | | | |
July 1, 2009 | | $ | 1,000.00 | | $ | 1,000.00 |
Ending Account Value | | | | | | |
December 31, 2009 | | $ | 1,153.30 | | $ | 1,024.70 |
Expenses Paid During Period* | | $ | 0.54 | | $ | 0.51 |
| * | Expenses are equal to the Fund’s annualized expense ratio of 0.10% (representing the one-half year period annualized), multiplied by the average account value over the period, multiplied by 184/365 (to reflect the one-half year period). Reflects amounts waived and/or reimbursed. Without the waiver and/or reimbursement, expenses would have been higher. |
| | |
| Moderate Strategy Fund | | 13 |
Russell Investment Funds
Moderate Strategy Fund
Schedule of Investments — December 31, 2009
Amounts in thousands (except share amounts)
| | | | | |
| | | Shares | | Market
Value
$ | |
| | | | | |
| Investments - 100.0% | | | | | |
Other Russell Investment Funds (“RIF”) and Russell Investment Company (“RIC”) Series Mutual Funds | | | | | |
| | |
| Bonds - 59.9% | | | | | |
RIF Core Bond Fund | | 2,096,510 | | 21,384 | |
| | | | | |
| | |
| Domestic Equities - 26.0% | | | | | |
RIF Aggressive Equity Fund | | 112,073 | | 1,075 | |
RIF Multi-Style Equity Fund | | 302,848 | | 3,565 | |
RIF Real Estate Securities Fund | | 92,591 | | 1,072 | |
RIC Russell U.S. Quantitative Equity Fund | | 138,006 | | 3,562 | |
| | | | | |
| | | | 9,274 | |
| | | | | |
| | |
| International Equities - 14.1% | | | | | |
RIF Non-U.S. Fund | | 348,206 | | 3,221 | |
RIC Russell Emerging Markets Fund | | 41,074 | | 728 | |
RIC Russell Global Equity Fund | | 137,597 | | 1,070 | |
| | | | | |
| | | | 5,019 | |
| | | | | |
| | |
Total Investments - 100.0%
(identified cost $34,207) | | | | 35,677 | |
| | |
Other Assets and Liabilities, Net - (0.0%) | | | | (6 | ) |
| | | | | |
| | |
| Net Assets - 100.0% | | | | 35,671 | |
| | | | | |
See accompanying notes which are an integral part of the financial statements.
| | |
| 14 | | Moderate Strategy Fund |
(This page intentionally left blank)
Russell Investment Funds
Balanced Strategy Fund
Portfolio Management Discussion and Analysis — December 31, 2009 (Unaudited)
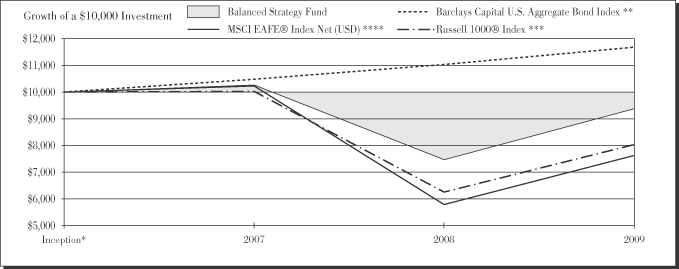
| | | | | |
| |
| Balanced Strategy Fund | | | |
| | | | | Total
Return | |
1 Year | | | | 26.23 | % |
Inception* | | | | -2.38 | %§ |
| | | | | |
|
| Barclays Capital U.S. Aggregate Bond Index** | |
| | | | | Total
Return | |
1 Year | | | | 5.93 | % |
Inception* | | | | 6.00 | %§ |
| | | | | |
|
| Russell 1000® Index*** | |
| | | | | Total
Return | |
1 Year | | | | 28.43 | % |
Inception* | | | | -7.85 | %§ |
| | | | | |
|
| MSCI EAFE® Index Net (USD)**** | |
| | | | | Total
Return | |
1 Year | | | | 31.78 | % |
Inception* | | | | -9.63 | %§ |
| | |
| 16 | | Balanced Strategy Fund |
Russell Investment Funds
Balanced Strategy Fund
Portfolio Management Discussion and Analysis — December 31, 2009 (Unaudited)
The Fund is a fund of funds that invests in other Russell Investment Funds and Russell Investment Company mutual funds (the “Underlying Funds”). The Underlying Funds allocate most of their assets among multiple money managers. Russell Investment Management Company (“RIMCo”), as the Underlying Funds’ advisor, may change the allocation of the Underlying Funds’ assets among money managers at any time. An exemptive order from the Securities and Exchange Commission (SEC) permits RIMCo to engage or terminate a money manager in an Underlying Fund at any time, subject to the approval by the Underlying Fund’s Board without a shareholder vote.
What is the Fund’s investment objective?
The Balanced Strategy Fund (“Fund”) seeks to provide above average capital appreciation and a moderate level of current income.
How did the Fund perform relative to its benchmark for the fiscal year ended December 31, 2009?
For the fiscal year ended December 31, 2009, the Balanced Strategy Fund gained 26.23%. This compared to the Barclays Capital U.S. Aggregate Bond Index, which gained 5.93% during the same period. The Fund’s performance includes operating expenses, whereas the Index returns are unmanaged and do not include expenses of any kind. The Fund’s over performance relative to the Barclays Capital Aggregate Bond Index was due to the Fund’s exposure to non-U.S. equity securities and non-Treasury fixed income sectors, including securities that are not in the benchmark (e.g. high yield credit, non-agency mortgages backed securities and, emerging market debt). Non-U.S. equity securities benefitted from both early indications of the global economic recovery in the second half of the fiscal year and the weakness of the U.S. dollar. Non-Treasury fixed income securities rebounded strongly as investors sought opportunities in bonds with historically cheap prices once the credit crisis showed signs of easing.
For the year ended December 31, 2009, the Balanced Strategy Lipper Composite gained 25.27% and the Lipper Mixed Asset Target Allocation Moderate Funds Average (VIP) gained 23.04%. These result serve as peer comparisons and are expressed net of operating expenses.
Each Underlying Fund has a benchmark reflective of its respective asset class. These benchmarks may be different than the Fund’s benchmark. The Fund’s benchmark represents the largest asset class of the Underlying Funds in which it invests.
How did the market conditions described in the Market Summary report affect the Fund’s performance?
The Fund is a fund of funds and its performance is based upon the performance of the Underlying Funds in which it invests. The Fund’s performance was negatively impacted by the financial crisis that affected virtually all asset classes from early in the year until March 9, 2009. Fear pervaded the markets, resulting in global government interventions, including the U.S. government’s assistance in the U.S. marketplace through special programs designed to assist banks, auto
companies and consumers. Many investors feared the economy was headed towards a deep recession, possibly even a depression. This led to a “flight to quality” in the markets during the first part of the fiscal year where risk was avoided and only investments deemed the safest maintained value. All of the Underlying Funds added to excess returns, weighted by their percentage held in the Fund, relative to the Fund’s benchmark. Of the broad asset classes, most equity asset classes, notably U.S equity, non U.S. equity and emerging markets had the strongest outperformance relative to the Fund’s benchmark, the Barclays Capital U.S. Aggregate Bond Index. Yet on the basis of weighted excess returns, due to the Fund’s 40% exposure to fixed income, the fixed income asset class contributed most.
How did the investment strategies and techniques employed by the Fund and its money managers of the Underlying Funds affect the Fund’s performance?
At the Fund level, all Underlying Funds contributed to excess returns relative to the Fund’s benchmark.
The 40% fixed income exposure, as represented by the RIF Core Bond Fund, was invested in non-Treasury sectors and securities that are not in the that Underlying Fund’s benchmark (e.g. high yield credit, non-agency mortgages backed securities and emerging market debt). As a result and as the risk appetite returned to the market during 2009, the RIF Core Bond Fund’s underweight to U.S. Treasuries and overweight to out- of-benchmark non-Treasury securities resulted in returns in excess of the benchmark.
The 30% U.S. equity large cap exposure represented by the RIF Multi-Style Equity and the Russell Investment Company Russell U.S. Quantitative Equity Funds, added notably to the Fund’s weighted excess returns relative to the Fund’s benchmark. The fundamental investment strategies of the managers in the RIF Multi-Style Equity Fund which were exposed to higher beta (beta is a measure of the volatility of a given security compared to the volatility of the market as the whole) stocks that were positioned to benefit from an economic recovery contributed positively to performance. Within the large cap U.S. value segment, managers of the RIF Multi-Style Equity and the RIC Russell U.S. Quantitative Equity Funds were effective at finding deeply undervalued companies, some priced for potential bankruptcy, which rose sharply as investors increased their appetites for risk in the later part of the year. The quantitative strategies pursued by the RIC Russell U.S. Quantitative Equity Fund, generally based on discernable trends, did not perform as well as fundamental strategies during the earlier volatile market period. The 4% small cap U.S equity exposure, as represented by the RIF Aggressive Equity Fund, also contributed to weighted excess returns as small cap stocks performed well after their March lows.
Within the 21% exposure to global and non-U.S investment strategies, at 14% total Fund allocation, the RIF Non U.S. added the most to the Fund’s weighted excess returns. Emerging
| | |
| Balanced Strategy Fund | | 17 |
Russell Investment Funds
Balanced Strategy Fund
Portfolio Management Discussion and Analysis — December 31, 2009 (Unaudited)
markets was the strongest performing asset class during the fiscal period benefitting from investors increased appetite for risk and the highly performing commodities and materials sectors. Global and non-U.S. developed market strategies, as represented by the RIF Non-U.S. and the RIC Russell Global Equity Funds, generally benefited from the market rallies in response to efforts by governments globally to mitigate the financial and economic crises. This resulted in a shift in market leadership to distressed value stocks and industrial cyclicals and generally those more levered to an economic upturn.
The Fund’s 5% exposure to real estate, as represented by the RIF Real Estate Securities Fund, contributed modestly to weighted excess returns. The RIF Real Estate Securities Fund remained positioned somewhat defensively during the fiscal year, with a focus on higher-quality, larger-capitalization REITs with strong balance sheets and more stable earnings prospects.
Describe any changes to the Fund’s structure or allocation to the Underlying Funds.
There were no changes to the Fund’s structure or allocations during the year.
The views expressed in this report reflect those of the portfolio managers only through the end of the period covered by the report. These views do not necessarily represent the views of RIMCo, or any other person in RIMCo or any other affiliated organization. These views are subject to change at any time based upon market conditions or other events, and RIMCo disclaims any responsibility to update the views contained herein. These views should not be relied on as investment advice and, because investment decisions for a Russell Investment Fund (RIF) or Russell Investment Company (RIC) Fund are based on numerous factors, should not be relied on as an indication of investment decisions of any RIF or RIC Fund.
| * | | The Fund commenced operation on April 30, 2007. |
| ** | | The Barclays Capital U.S. Aggregate Bond Index is an index, with income reinvested, generally representative of intermediate-term government bonds, investment-grade corporate debt securities and mortgage-backed securities. |
| *** | | Russell 1000® Index includes the 1,000 largest companies in the Russell 3000® Index. The Russell 1000® Index represents the universe of stocks from which most active money managers typically select. The Russell 1000® Index return reflects adjustments for income dividends and capital gains distributions reinvested as of the ex-dividend dates. |
| **** | | Morgan Stanley Capital International Europe, Australia, Far East (MSCI EAFE®) Index Net (USD) is an index composed of an arithmetic, market value-weighted average of the performance of approximately 1,600 securities listed on the stock exchange of the countries of Europe, Australia, and the Far East. The index is calculated on a total-return basis, which included reinvestment of gross dividends before deduction of withholding taxes. |
The performance shown in this section does not reflect any Insurance Company Separate Account or Policy Charges. Performance is historical and assumes reinvestment of all dividends and capital gains. Investment return and principal value will fluctuate so that an investor’s shares, when redeemed, may be worth more or less than when purchased. Past performance is not indicative of future results.
| | |
| 18 | | Balanced Strategy Fund |
Russell Investment Funds
Balanced Strategy Fund
Shareholder Expense Example — December 31, 2009 (Unaudited)
Fund Expenses
The following disclosure provides important information regarding each Fund’s Expense Example, which appears on each Fund’s individual page in this Annual Report. Please refer to this information when reviewing the Expense Example for a Fund.
Example
As a shareholder of the Fund, you incur two types of costs: (1) transaction costs, and (2) ongoing costs, including management fees and other Fund expenses. The Example is intended to help you understand your ongoing costs (in dollars) of investing in the Fund and to compare these costs with the ongoing costs of investing in other mutual funds. The Example is based on an investment of $1,000 invested at the beginning of the period and held for the entire period indicated, which for this Fund is from July 1, 2009 to December 31, 2009.
Actual Expenses
The information in the table under the heading “Actual Performance” provides information about actual account values and actual expenses. You may use the information in this column, together with the amount you invested, to estimate the expenses that you paid over the period. Simply divide your account value by $1,000 (for example, an $8,600 account value divided by $1,000 = 8.6), then multiply the result by the number in the first column in the row entitled “Expenses Paid During Period” to estimate the expenses you paid on your account during this period.
Hypothetical Example for Comparison Purposes
The information in the table under the heading “Hypothetical Performance (5% return before expenses)” provides information about hypothetical account values and hypothetical expenses based on the Fund’s actual expense ratio and an assumed rate
of return of 5% per year before expenses, which is not the Fund’s actual return. The hypothetical account values and expenses may not be used to estimate the actual ending account balance or expenses you paid for the period. You may use this information to compare the ongoing costs of investing in the Fund and other funds. To do so, compare this 5% hypothetical example with the 5% hypothetical examples that appear in the shareholder reports of other funds.
Please note that the expenses shown in the table are meant to highlight your ongoing costs only and do not reflect any transactional costs. Therefore, the information under the heading “Hypothetical Performance (5% return before expenses)” is useful in comparing ongoing costs only, and will not help you determine the relative total costs of owning different funds. In addition, if these transactional costs were included, your costs would have been higher. The fee and expenses shown in this section do not reflect any Insurance Company Separate Account or Policy Charges.
| | | | | | |
| | | Actual
Performance | | Hypothetical
Performance
(5% return
before expenses) |
| | | | | | |
Beginning Account Value | | | | | | |
July 1, 2009 | | $ | 1,000.00 | | $ | 1,000.00 |
Ending Account Value | | | | | | |
December 31, 2009 | | $ | 1,184.90 | | $ | 1,024.70 |
Expenses Paid During Period* | | $ | 0.55 | | $ | 0.51 |
| * | Expenses are equal to the Fund’s annualized expense ratio of 0.10% (representing the one-half year period annualized), multiplied by the average account value over the period, multiplied by 184/365 (to reflect the one-half year period). Reflects amounts waived and/or reimbursed. Without the waiver and/or reimbursement, expenses would have been higher. |
| | |
| Balanced Strategy Fund | | 19 |
Russell Investments Funds
Balanced Strategy Fund
Schedule of Investments — December 31, 2009
Amounts in thousands (except share amounts)
| | | | | |
| | | Shares | | Market
Value
$ | |
| | | | | |
| Investments - 100.0% | | | | | |
Other Russell Investment Funds (“RIF”) and Russell Investment Company (“RIC”) Series Mutual Funds | | | | | |
| | |
| Bonds - 40.0% | | | | | |
RIF Core Bond Fund | | 4,123,337 | | 42,058 | |
| | | | | |
| | |
| Domestic Equities - 39.0% | | | | | |
RIF Aggressive Equity Fund | | 445,029 | | 4,268 | |
RIF Multi-Style Equity Fund | | 1,334,114 | | 15,703 | |
RIF Real Estate Securities Fund | | 460,377 | | 5,331 | |
RIC Russell U.S. Quantitative Equity Fund | | 607,704 | | 15,685 | |
| | | | | |
| | | | 40,987 | |
| | | | | |
| | |
| International Equities - 21.0% | | | | | |
RIF Non-U.S. Fund | | 1,593,267 | | 14,738 | |
RIC Russell Emerging Markets Fund | | 181,075 | | 3,208 | |
RIC Russell Global Equity Fund | | 540,227 | | 4,203 | |
| | | | | |
| | | | 22,149 | |
| | | | | |
| | |
Total Investments - 100.0%
(identified cost $107,138) | | | | 105,194 | |
| | |
Other Assets and Liabilities, Net - (0.0%) | | | | (9 | ) |
| | | | | |
| | |
| Net Assets - 100.0% | | | | 105,185 | |
| | | | | |
See accompanying notes which are an integral part of the financial statements.
| | |
| 20 | | Balanced Strategy Fund |
(This page intentionally left blank)
Russell Investment Funds
Growth Strategy Fund
Portfolio Management Discussion and Analysis — December 31, 2009 (Unaudited)
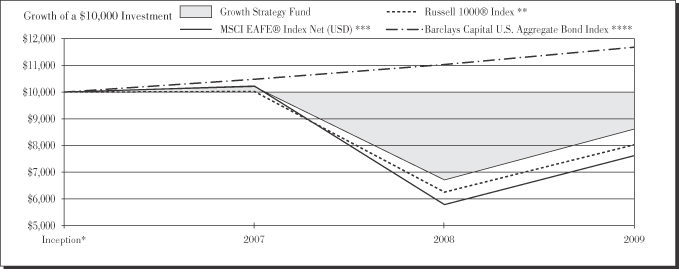
| | | | | |
| |
| Growth Strategy Fund | | | |
| | | | | Total
Return | |
1 Year | | | | 29.43 | % |
Inception* | | | | -5.37 | %§ |
| | | | | |
| |
| Russell 1000® Index** | | | |
| | | | | Total
Return | |
1 Year | | | | 28.43 | % |
Inception* | | | | -7.85 | %§ |
| | | | | |
| |
| MSCI EAFE® Index Net (USD)*** | | | |
| | | | | Total
Return | |
1 Year | | | | 31.78 | % |
Inception* | | | | -9.63 | %§ |
| | | | | |
|
| Barclays Capital U.S. Aggregate Bond Index**** | |
| | | | | Total
Return | |
1 Year | | | | 5.93 | % |
Inception* | | | | 6.00 | %§ |
Russell Investment Funds
Growth Strategy Fund
Portfolio Management Discussion and Analysis — December 31, 2009 (Unaudited)
The Fund is a fund of funds that invests in other Russell Investment Funds and Russell Investment Company mutual funds (the “Underlying Funds”). The Underlying Funds allocate most of their assets among multiple money managers. Russell Investment Management Company (“RIMCo”), as the Underlying Funds’ advisor, may change the allocation of the Underlying Funds’ assets among money managers at any time. An exemptive order from the Securities and Exchange Commission (SEC) permits RIMCo to engage or terminate a money manager in an Underlying Fund at any time, subject to the approval by the Underlying Fund’s Board without a shareholder vote.
What is the Fund’s investment objective?
The Growth Strategy Fund (“Fund”) seeks to provide high long term capital appreciation with low current income.
How did the Fund perform relative to its benchmark for the fiscal year ended December 31, 2009?
For the fiscal year ended December 31, 2009, the Growth Strategy Fund gained 29.43%. This compared to the Russell 1000® Index, which gained 28.43% during the same period. The Fund’s performance includes operating expenses, whereas the Index returns are unmanaged and do not include expenses of any kind. The Fund’s over performance relative to the Russell 1000® Index was due to the Fund’s exposure to non-U.S. equity securities and non-Treasury fixed income sectors, including securities that are not in the benchmark (e.g. high yield credit, non-agency mortgages backed securities and, emerging market debt) . Non-U.S. equity securities benefitted from both early indications of the global economic recovery in the second half of the fiscal year and the weakness of the U.S. dollar. Non-Treasury fixed income securities rebounded strongly as investors sought opportunities in bonds with historically cheap prices once the credit crisis showed signs of easing.
For the year ended December 31, 2009, the Growth Strategy Lipper Composite gained 29.05% and the Lipper® Mixed Asset Target Allocation Growth Funds Average (VIP) gained 24.21% These results serve as peer comparisons and are expressed net of operating expenses.
Each Underlying Fund has a benchmark reflective of its respective asset class. These benchmarks may be different than the Fund’s benchmark. The Fund’s benchmark represents the largest asset class of the Underlying Funds in which it invests.
How did the market conditions described in the Market Summary report affect the Fund’s performance?
The Fund is a fund of funds and its performance is based upon the performance of the Underlying Funds in which it invests. The Fund’s performance was negatively impacted by the financial crisis that affected virtually all asset classes from early in the year until March 9, 2009. Fear pervaded the markets, resulting in global government interventions, including the U.S. government’s assistance in the U.S. marketplace through special programs designed to assist banks, auto
companies and consumers. Many investors feared the economy was headed towards a deep recession, possibly even a depression. This led to a “flight to quality” in the markets during the first part of the fiscal year where risk was avoided and only investments deemed the safest maintained value. Five of the Fund’s eight Underlying Funds added to excess returns, weighted by their percentage held in the Fund, relative to the Fund’s benchmark, the Russell 1000® Index. Of the broad asset classes, most equity asset classes, notably emerging and global equity markets and fundamentally based large cap U.S. equity strategies had the strongest outperformance relative to the Fund’s benchmark. On the basis of weighted excess returns, the Fund’s 20% exposure to fixed income Underlying Funds, detracted from returns.
How did the investment strategies and techniques employed by the Fund and its money managers of the Underlying Funds affect the Fund’s performance?
At the Fund level, five of eight Underlying Funds contributed to excess returns relative to the Fund’s benchmark.
The Fund has a 41% U.S equity large cap exposure represented by the RIF Multi-Style Equity and the Russell Investment Company Russell U.S. Quantitative Equity Funds. These two Underlying Funds were mixed in terms of their contribution to the Fund’s weighted returns relative to the benchmark. Fundamental investment strategies of the managers in the RIF Multi-Style Equity Fund who were exposed to higher beta (beta is a measure of the volatility of a given security compared to the volatility of the market as the whole) stocks that were positioned to benefit from an economic recovery contributed positively to performance. Within the large cap U.S. value segment, managers of the RIF Multi-Style Equity and the RIC Russell U.S. Quantitative Equity Funds were effective at finding deeply undervalued companies, some priced for potential bankruptcy, which rose sharply as investors increased their appetites for risk in the later part of the year. The quantitative strategies pursued by the RIC Russell U.S. Quantitative Equity Fund, generally based on discernable trends, did not perform as well as fundamental strategies as they lagged in the earlier volatile market period. The 6% small cap U.S equity exposure, as represented by the RIF Aggressive Equity Fund, contributed modestly to weighted excess returns as small cap stocks performed well after their March lows.
Within the 27% exposure to global and non-U.S investment strategies, at a 4% total Fund allocation, the RIC Russell Emerging Markets Fund added the most to the Fund’s weighted excess returns. Emerging markets was the strongest performing asset class during the fiscal period benefiting from investors increased appetite for risk and the highly performing commodities and materials sectors. Global and non-U.S. developed market strategies, as represented by the RIF Non-U.S. and the RIC Russell Global Equity Funds, generally benefited from the market rallies in response to efforts by governments globally to mitigate the financial and economic crises. This resulted in a shift in market leadership to distressed
Russell Investment Funds
Growth Strategy Fund
Portfolio Management Discussion and Analysis — December 31, 2009 (Unaudited)
value stocks and industrial cyclicals and generally those more levered to an economic upturn.
The Fund’s 6% exposure to real estate, as represented by the RIF Real Estate Securities Fund, contributed modestly to weighted excess returns. The RIF Real Estate Securities Fund remained positioned somewhat defensively during the fiscal year, with a focus on higher-quality, larger-capitalization REITs with strong balance sheets and more stable earnings prospects.
The 20% fixed income exposure, as represented by the RIF Core Bond Fund, lagged the broad equity markets. The RIF Core Bond Fund was invested in non-Treasury sectors and securities that are not in the Underlying Fund’s benchmark (e.g. high yield credit, non-agency mortgages backed securities and emerging market debt). As a result, and as the risk appetite returned to the market during 2009, the Fund’s underweight to U.S. Treasuries and overweight to out-of-benchmark non-Treasury securities resulted in returns in excess of the benchmark.
Describe any changes to the Fund’s structure or allocation to the Underlying Funds.
There were no changes to the Fund’s structure or allocations during the year.
The views expressed in this report reflect those of the portfolio managers only through the end of the period covered by the report. These views do not necessarily represent the views of RIMCo, or any other person in RIMCo or any other affiliated organization. These views are subject to change at any time based upon market conditions or other events, and RIMCo disclaims any responsibility to update the views contained herein. These views should not be relied on as investment advice and, because investment decisions for a Russell Investment Fund (RIF) or Russell Investment Company (RIC) Fund are based on numerous factors, should not be relied on as an indication of investment decisions of any RIF or RIC Fund.
| * | | The Fund commenced operation on April 30, 2007. |
| ** | | Russell 1000® Index includes the 1,000 largest companies in the Russell 3000® Index. The Russell 1000® Index represents the universe of stocks from which most active money managers typically select. The Russell 1000® Index return reflects adjustments for income dividends and capital gains distributions reinvested as of the ex-dividend dates. |
| *** | | Morgan Stanley Capital International Europe, Australia, Far East (MSCI EAFE®) Index Net (USD) is an index composed of an arithmetic, market value-weighted average of the performance of approximately 1,600 securities listed on the stock exchange of the countries of Europe, Australia, and the Far East. The index is calculated on a total-return basis, which included reinvestment of gross dividends before deduction of withholding taxes. |
| **** | | The Barclays Capital U.S. Aggregate Bond Index is an index, with income reinvested, generally representative of intermediate-term government bonds, investment-grade corporate debt securities and mortgage-backed securities. |
The performance shown in this section does not reflect any Insurance Company Separate Account or Policy Charges. Performance is historical and assumes reinvestment of all dividends and capital gains. Investment return and principal value will fluctuate so that an investor’s shares, when redeemed, may be worth more or less than when purchased. Past performance is not indicative of future results.
Russell Investment Funds
Growth Strategy Fund
Shareholder Expense Example — December 31, 2009 (Unaudited)
Fund Expenses
The following disclosure provides important information regarding each Fund’s Expense Example, which appears on each Fund’s individual page in this Annual Report. Please refer to this information when reviewing the Expense Example for a Fund.
Example
As a shareholder of the Fund, you incur two types of costs: (1) transaction costs, and (2) ongoing costs, including management fees and other Fund expenses. The Example is intended to help you understand your ongoing costs (in dollars) of investing in the Fund and to compare these costs with the ongoing costs of investing in other mutual funds. The Example is based on an investment of $1,000 invested at the beginning of the period and held for the entire period indicated, which for this Fund is from July 1, 2009 to December 31, 2009.
Actual Expenses
The information in the table under the heading “Actual Performance” provides information about actual account values and actual expenses. You may use the information in this column, together with the amount you invested, to estimate the expenses that you paid over the period. Simply divide your account value by $1,000 (for example, an $8,600 account value divided by $1,000 = 8.6), then multiply the result by the number in the first column in the row entitled “Expenses Paid During Period” to estimate the expenses you paid on your account during this period.
Hypothetical Example for Comparison Purposes
The information in the table under the heading “Hypothetical Performance (5% return before expenses)” provides information about hypothetical account values and hypothetical expenses based on the Fund’s actual expense ratio and an assumed rate
of return of 5% per year before expenses, which is not the Fund’s actual return. The hypothetical account values and expenses may not be used to estimate the actual ending account balance or expenses you paid for the period. You may use this information to compare the ongoing costs of investing in the Fund and other funds. To do so, compare this 5% hypothetical example with the 5% hypothetical examples that appear in the shareholder reports of other funds.
Please note that the expenses shown in the table are meant to highlight your ongoing costs only and do not reflect any transactional costs. Therefore, the information under the heading “Hypothetical Performance (5% return before expenses)” is useful in comparing ongoing costs only, and will not help you determine the relative total costs of owning different funds. In addition, if these transactional costs were included, your costs would have been higher. The fee and expenses shown in this section do not reflect any Insurance Company Separate Account or Policy Charges.
| | | | | | |
| | | Actual
Performance | | Hypothetical
Performance
(5% return
before expenses) |
| | | | | | |
Beginning Account Value | | | | | | |
July 1, 2009 | | $ | 1,000.00 | | $ | 1,000.00 |
Ending Account Value | | | | | | |
December 31, 2009 | | $ | 1,213.60 | | $ | 1,024.70 |
Expenses Paid During Period* | | $ | 0.56 | | $ | 0.51 |
| * | Expenses are equal to the Fund’s annualized expense ratio of 0.10% (representing the one-half year period annualized), multiplied by the average account value over the period, multiplied by 184/365 (to reflect the one-half year period). Reflects amounts waived and/or reimbursed. Without the waiver and/or reimbursement, expenses would have been higher. |
Russell Investment Funds
Growth Strategy Fund
Schedule of Investments — December 31, 2009
Amounts in thousands (except share amounts)
| | | | | |
| | | Shares | | Market
Value
$ | |
| | | | | |
| Investments - 100.0% | | | | | |
Other Russell Investment Funds (“RIF”) and Russell Investment Company (“RIC”) Series Mutual Funds | | | | | |
| | |
| Bonds - 19.9% | | | | | |
RIF Core Bond Fund | | 1,199,986 | | 12,240 | |
| | | | | |
| | |
| Domestic Equities - 53.0% | | | | | |
RIF Aggressive Equity Fund | | 392,663 | | 3,766 | |
RIF Multi-Style Equity Fund | | 1,092,063 | | 12,854 | |
RIF Real Estate Securities Fund | | 323,702 | | 3,748 | |
RIC Russell U.S. Quantitative Equity Fund | | 473,753 | | 12,227 | |
| | | | | |
| | | | 32,595 | |
| | | | | |
| | |
| International Equities - 27.1% | | | | | |
RIF Non-U.S. Fund | | 1,132,940 | | 10,480 | |
RIC Russell Emerging Markets Fund | | 141,673 | | 2,510 | |
RIC Russell Global Equity Fund | | 473,999 | | 3,688 | |
| | | | | |
| | | | 16,678 | |
| | | | | |
| | |
Total Investments - 100.0%
(identified cost $66,443) | | | | 61,513 | |
| | |
Other Assets and Liabilities, Net - (0.0%) | | | | (7 | ) |
| | | | | |
| | |
| Net Assets - 100.0% | | | | 61,506 | |
| | | | | |
See accompanying notes which are an integral part of the financial statements.
(This page intentionally left blank)
Russell Investment Funds
Equity Growth Strategy Fund
Portfolio Management Discussion and Analysis — December 31, 2009 (Unaudited)
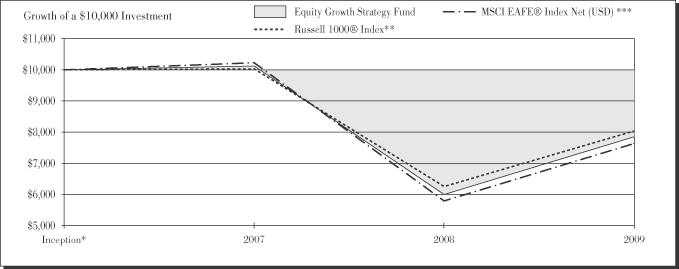
| | | | | |
| |
| Equity Growth Strategy Fund | | | |
| | | | | Total
Return | |
1 Year | | | | 31.79 | % |
Inception* | | | | -8.67 | %§ |
| | | | | |
| |
| Russell 1000® Index** | | | |
| | | | | Total
Return | |
1 Year | | | | 28.43 | % |
Inception* | | | | -7.85 | %§ |
| | | | | |
| |
| MSCI EAFE® Index Net (USD)*** | | | |
| | | | | Total
Return | |
1 Year | | | | 31.78 | % |
Inception* | | | | -9.63 | %§ |
| | |
| 28 | | Equity Growth Strategy Fund |
Russell Investment Funds
Equity Growth Strategy Fund
Portfolio Management Discussion and Analysis — December 31, 2009 (Unaudited)
The Fund is a fund of funds that invests in other Russell Investment Funds and Russell Investment Company mutual funds (the “Underlying Funds”). The Underlying Funds allocate most of their assets among multiple money managers. Russell Investment Management Company (“RIMCo”), as the Underlying Funds’ advisor, may change the allocation of the Underlying Funds’ assets among money managers at any time. An exemptive order from the Securities and Exchange Commission (SEC) permits RIMCo to engage or terminate a money manager in an Underlying Fund at any time, subject to the approval by the Underlying Fund’s Board without a shareholder vote.
What is the Fund’s investment objective?
The Equity Growth Strategy Fund (“Fund”) seeks to provide high long term capital appreciation.
How did the Fund perform relative to its benchmark for the fiscal year ended December 31, 2009?
For the fiscal year ended December 31, 2009, the Equity Growth Strategy Fund gained 31.79%. This compared to the Russell 1000® Index, which gained 28.43% during the same period. The Fund’s performance includes operating expenses, whereas the Index returns are unmanaged and do not include expenses of any kind.
For the year ended December 31, 2009, the Equity Growth Strategy Lipper Composite – gained 32.72% and the Lipper® Global Core Funds Average (VIP) gained 32.80% These results serve as peer comparisons and are expressed net of operating expenses.
Each Underlying Fund has a benchmark reflective of its respective asset class. These benchmarks may be different than the Fund’s benchmark. The Fund’s benchmark represents the largest asset class of the Underlying Funds in which it invests. The Fund’s outperformance relative to the Russell 1000® Index was due primarily to the Fund’s exposure to non-U.S. equity securities. Non-U.S. equity securities benefited from both early indications of the global economic recovery in the second half of the fiscal year and the weakness of the U.S. dollar.
How did the market conditions described in the Market Summary report affect the Fund’s performance?
The Fund is a fund of funds and its performance is based upon the performance of the Underlying Funds in which it invests. The Fund’s performance was negatively impacted by the financial crisis that affected virtually all asset classes from early in the year until March 9, 2009. Fear pervaded the markets, resulting in global government interventions, including the U.S. government’s assistance in the U.S. marketplace through special programs designed to assist banks, auto companies and consumers. Many investors feared the economy was headed towards a deep recession, possibly even a depression. This led to a “flight to quality” in the markets during the first part of the fiscal year where risk was avoided and only investments deemed the safest maintained value.
Five of the seven Underlying Funds added to excess returns, weighted by their percentage held in the Fund, relative to the Fund’s benchmark, the Russell 1000® Index. Of the broad asset classes, the equity asset classes of emerging and global equity markets and fundamentally based large cap U.S equity strategies had the strongest outperformance relative to the Fund’s benchmark. On the basis of weighted excess returns, large cap U.S. quantitatively based investment strategies and investments in developed non-U.S. markets detracted.
The Fund lagged its peers as represented by the Lipper® Global Core Funds Average (VIP) and by the composite of the Lipper Averages corresponding to each Underlying Fund.
How did the investment strategies and techniques employed by the Fund and its money managers of the Underlying Funds affect the Fund’s performance?
At the Fund level, five of seven Underlying Funds contributed to excess returns relative to the Fund’s benchmark.
The 51% U.S equity large cap exposure represented by the RIF Multi-Style Equity and the Russell Investment Company Russell U.S. Quantitative Equity Funds. These two Underlying Fund’s were mixed in terms of their contribution to the Fund’s weighted returns relative to the benchmark. Fundamental investment strategies of the managers in the RIF Multi-Style Equity Fund who were exposed to higher beta (beta is a measure of the volatility of a given security compared to the volatility of the market as the whole) stocks that were positioned to benefit from an economic recovery contributed positively to performance. Within the large cap U.S. value segment, managers of the RIF Multi-Style Equity and the RIC Russell U.S. Quantitative Equity Funds were effective at finding deeply undervalued companies, some priced for potential bankruptcy, which rose sharply as investors increased their appetites for risk in the later part of the year. The quantitative strategies pursued by the RIC Russell U.S. Quantitative Equity Fund generally based on discernable trends, did not perform as well as fundamental strategies, as they lagged in the earlier volatile market period. The 7% small cap U.S equity exposure, as represented by the RIF Aggressive Equity Fund, contributed modestly to weighted excess returns as small cap stocks performed well after their March lows.
Within the 35% exposure to global and non-U.S investment strategies, at 5% total Fund allocation, the RIC Russell Emerging Markets Fund added the most to the Fund’s weighted excess returns. Emerging markets was the strongest performing asset class during the fiscal period benefiting from investors increased appetite for risk and the highly performing commodities and materials sectors. Global and non-U.S. developed market strategies, as represented by the RIF Non-U.S. and the RIC Russell Global Equity Funds, generally benefited from the market rallies in response to efforts by governments globally to mitigate the financial and economic crises. This resulted in a shift in market leadership to distressed
| | |
| Equity Growth Strategy Fund | | 29 |
Russell Investment Funds
Equity Growth Strategy Fund
Portfolio Management Discussion and Analysis — December 31, 2009 (Unaudited)
value stocks and industrial cyclicals and generally those more levered to an economic upturn.
The Fund’s 7% exposure to real estate, as represented by the RIF Real Estate Securities Fund, contributed modestly to weighted excess returns. The RIF Real Estate Securities remained positioned somewhat defensively during the fiscal year, with a focus on higher-quality, larger-capitalization REITs with strong balance sheets and more stable earnings prospects.
Describe any changes to the Fund’s structure or allocation to the Underlying Funds.
There were no changes to the Fund’s structure or allocations during the year.
The views expressed in this report reflect those of the portfolio managers only through the end of the period covered by the report. These views do not necessarily represent the views of RIMCo, or any other person in RIMCo or any other affiliated organization. These views are subject to change at any time based upon market conditions or other events, and RIMCo disclaims any responsibility to update the views contained herein. These views should not be relied on as investment advice and, because investment decisions for a Russell Investment Fund (RIF) or Russell Investment Company (RIC) Fund are based on numerous factors, should not be relied on as an indication of investment decisions of any RIF or RIC Fund.
| * | | The Fund commenced operation on April 30, 2007. |
| ** | | Russell 1000® Index includes the 1,000 largest companies in the Russell 3000® Index. The Russell 1000® Index represents the universe of stocks from which most active money managers typically select. The Russell 1000® Index return reflects adjustments for income dividends and capital gains distributions reinvested as of the ex-dividend dates. |
| *** | | Morgan Stanley Capital International Europe, Australia, Far East (MSCI EAFE®) Index Net (USD) is an index composed of an arithmetic, market value-weighted average of the performance of approximately 1,600 securities listed on the stock exchange of the countries of Europe, Australia, and the Far East. The index is calculated on a total-return basis, which included reinvestment of gross dividends before deduction of withholding taxes. |
The performance shown in this section does not reflect any Insurance Company Separate Account or Policy Charges. Performance is historical and assumes reinvestment of all dividends and capital gains. Investment return and principal value will fluctuate so that an investor’s shares, when redeemed, may be worth more or less than when purchased. Past performance is not indicative of future results.
| | |
| 30 | | Equity Growth Strategy Fund |
Russell Investment Funds
Equity Growth Strategy Fund
Shareholder Expense Example — December 31, 2009 (Unaudited)
Fund Expenses
The following disclosure provides important information regarding each Fund’s Expense Example, which appears on each Fund’s individual page in this Annual Report. Please refer to this information when reviewing the Expense Example for a Fund.
Example
As a shareholder of the Fund, you incur two types of costs: (1) transaction costs, and (2) ongoing costs, including management fees and other Fund expenses. The Example is intended to help you understand your ongoing costs (in dollars) of investing in the Fund and to compare these costs with the ongoing costs of investing in other mutual funds. The Example is based on an investment of $1,000 invested at the beginning of the period and held for the entire period indicated, which for this Fund is from July 1, 2009 to December 31, 2009.
Actual Expenses
The information in the table under the heading “Actual Performance” provides information about actual account values and actual expenses. You may use the information in this column, together with the amount you invested, to estimate the expenses that you paid over the period. Simply divide your account value by $1,000 (for example, an $8,600 account value divided by $1,000 = 8.6), then multiply the result by the number in the first column in the row entitled “Expenses Paid During Period” to estimate the expenses you paid on your account during this period.
Hypothetical Example for Comparison Purposes
The information in the table under the heading “Hypothetical Performance (5% return before expenses)” provides information about hypothetical account values and hypothetical expenses based on the Fund’s actual expense ratio and an assumed rate
of return of 5% per year before expenses, which is not the Fund’s actual return. The hypothetical account values and expenses may not be used to estimate the actual ending account balance or expenses you paid for the period. You may use this information to compare the ongoing costs of investing in the Fund and other funds. To do so, compare this 5% hypothetical example with the 5% hypothetical examples that appear in the shareholder reports of other funds.
Please note that the expenses shown in the table are meant to highlight your ongoing costs only and do not reflect any transactional costs. Therefore, the information under the heading “Hypothetical Performance (5% return before expenses)” is useful in comparing ongoing costs only, and will not help you determine the relative total costs of owning different funds. In addition, if these transactional costs were included, your costs would have been higher. The fee and expenses shown in this section do not reflect any Insurance Company Separate Account or Policy Charges.
| | | | | | |
| | | Actual
Performance | | Hypothetical
Performance
(5% return
before expenses) |
| | | | | | |
Beginning Account Value | | | | | | |
July 1, 2009 | | $ | 1,000.00 | | $ | 1,000.00 |
Ending Account Value | | | | | | |
December 31, 2009 | | $ | 1,243.00 | | $ | 1,024.70 |
Expenses Paid During Period* | | $ | 0.57 | | $ | 0.51 |
| * | Expenses are equal to the Fund’s annualized expense ratio of 0.10% (representing the one-half year period annualized), multiplied by the average account value over the period, multiplied by 184/365 (to reflect the one-half year period). Reflects amounts waived and/or reimbursed. Without the waiver and/or reimbursement, expenses would have been higher. |
| | |
| Equity Growth Strategy Fund | | 31 |
Russell Investment Funds
Equity Growth Strategy Fund
Schedule of Investments — December 31, 2009
Amounts in thousands (except share amounts)
| | | | | |
| | | Shares | | Market
Value
$ | |
| | | | | |
| Investments - 100.0% | | | | | |
Other Russell Investment Funds (“RIF”) and Russell Investment Company (“RIC”) Series Mutual Funds | | | | | |
| | |
| Domestic Equities - 64.8% | | | | | |
RIF Aggressive Equity Fund | | 147,099 | | 1,410 | |
RIF Multi-Style Equity Fund | | 441,630 | | 5,198 | |
RIF Real Estate Securities Fund | | 120,969 | | 1,401 | |
RIC Russell U.S. Quantitative Equity Fund | | 193,450 | | 4,993 | |
| | | | | |
| | | | 13,002 | |
| | | | | |
| | |
| International Equities - 35.2% | | | | | |
RIF Non-U.S. Fund | | 500,954 | | 4,634 | |
RIC Russell Emerging Markets Fund | | 57,829 | | 1,025 | |
RIC Russell Global Equity Fund | | 180,749 | | 1,406 | |
| | | | | |
| | | | 7,065 | |
| | | | | |
| | |
Total Investments - 100.0%
(identified cost $20,799) | | | | 20,067 | |
| | |
Other Assets and Liabilities,
Net - (0.0%) | | | | (10 | ) |
| | | | | |
| | |
| Net Assets - 100.0% | | | | 20,057 | |
| | | | | |
See accompanying notes which are an integral part of the financial statements.
| | |
| 32 | | Equity Growth Strategy Fund |
Russell Investment Funds
LifePoints® Funds Variable Target Portfolio Series
Statements of Assets and Liabilities — December 31, 2009
| | | | | | | | | | | | | | | | |
| Amounts in thousands | | Moderate Strategy
Fund | | | Balanced Strategy
Fund | | | Growth Strategy
Fund | | | Equity Growth
Strategy Fund | |
| | | | | | | | | | | | | | | | |
Assets | | | | | | | | | | | | | | | | |
Investments, at identified cost | | $ | 34,207 | | | $ | 107,138 | | | $ | 66,443 | | | $ | 20,799 | |
Investments, at market | | | 35,677 | | | | 105,194 | | | | 61,513 | | | | 20,067 | |
Receivables: | | | | | | | | | | | | | | | | |
Fund shares sold | | | 42 | | | | 6 | | | | 50 | | | | 8 | |
From Adviser | | | 5 | | | | 7 | | | | 6 | | | | 4 | |
Prepaid expenses | | | 3 | | | | 3 | | | | 3 | | | | — | |
| | | | | | | | | | | | | | | | |
Total assets | | | 35,727 | | | | 105,210 | | | | 61,572 | | | | 20,079 | |
| | | | | | | | | | | | | | | | |
| | | | | | | | | | | | | | | | |
Liabilities | | | | | | | | | | | | | | | | |
Payables: | | | | | | | | | | | | | | | | |
Investments purchased | | | 42 | | | | 6 | | | | 50 | | | | 7 | |
Accrued fees to affiliates | | | 2 | | | | 5 | | | | 3 | | | | 1 | |
Other accrued expenses | | | 12 | | | | 14 | | | | 13 | | | | 14 | |
| | | | | | | | | | | | | | | | |
Total liabilities | | | 56 | | | | 25 | | | | 66 | | | | 22 | |
| | | | | | | | | | | | | | | | |
| | | | | | | | | | | | | | | | |
Net Assets | | $ | 35,671 | | | $ | 105,185 | | | $ | 61,506 | | | $ | 20,057 | |
| | | | | | | | | | | | | | | | |
Net Assets Consist of: | | | | | | | | | | | | | | | | |
Undistributed (overdistributed) net investment income | | $ | 64 | | | $ | 172 | | | $ | 61 | | | $ | 41 | |
Accumulated net realized gain (loss) | | | (2,700 | ) | | | (4,671 | ) | | | (2,102 | ) | | | (3,539 | ) |
Unrealized appreciation (depreciation) on investments | | | 1,470 | | | | (1,944 | ) | | | (4,930 | ) | | | (732 | ) |
Shares of beneficial interest | | | 40 | | | | 128 | | | | 80 | | | | 29 | |
Additional paid-in capital | | | 36,797 | | | | 111,500 | | | | 68,397 | | | | 24,258 | |
| | | | | | | | | | | | | | | | |
Net Assets | | $ | 35,671 | | | $ | 105,185 | | | $ | 61,506 | | | $ | 20,057 | |
| | | | | | | | | | | | | | | | |
| | | | | | | | | | | | | | | | | |
Net Asset Value, offering and redemption price per share: | | | | | | | | | | | | | | | | |
Net asset value per share* | | $ | 8.95 | | | $ | 8.25 | | | $ | 7.66 | | | $ | 6.98 | |
Net assets | | $ | 35,670,864 | | | $ | 105,184,876 | | | $ | 61,506,258 | | | $ | 20,056,569 | |
Shares outstanding ($.01 par value) | | | 3,983,800 | | | | 12,752,917 | | | | 8,030,368 | | | | 2,873,021 | |
| * | Net asset value per share equals net assets divided by shares of beneficial interest outstanding. |
See accompanying notes which are an integral part of the financial statements.
| | |
| Statements of Assets and Liabilities | | 33 |
Russell Investment Funds
LifePoints® Funds Variable Target Portfolio Series
Statements of Operations — For the Period Ended December 31, 2009
| | | | | | | | | | | | | | | | |
| Amounts in thousands | | Moderate Strategy
Fund | | | Balanced Strategy
Fund | | | Growth Strategy
Fund | | | Equity Growth
Strategy Fund | |
| | | | | | | | | | | | | | | | |
Investment Income | | | | | | | | | | | | | | | | |
Income distributions from Underlying Funds | | $ | 1,086 | | | $ | 2,826 | | | $ | 1,275 | | | $ | 320 | |
| | | | | | | | | | | | | | | | |
| | | | | | | | | | | | | | | | |
Expenses | | | | | | | | | | | | | | | | |
Advisory fees | | | 48 | | | | 153 | | | | 88 | | | | 30 | |
Administrative fees | | | 12 | | | | 38 | | | | 22 | | | | 8 | |
Custodian fees | | | 18 | | | | 18 | | | | 20 | | | | 19 | |
Transfer agent fees | | | 1 | | | | 3 | | | | 2 | | | | 1 | |
Professional fees | | | 28 | | | | 33 | | | | 30 | | | | 27 | |
Trustees’ fees | | | 1 | | | | 2 | | | | 1 | | | | — | |
Printing fees | | | 5 | | | | 18 | | | | 10 | | | | 2 | |
Miscellaneous | | | 3 | | | | 3 | | | | 2 | | | | 3 | |
| | | | | | | | | | | | | | | | |
Expenses before reductions | | | 116 | | | | 268 | | | | 175 | | | | 90 | |
Expense reductions | | | (91 | ) | | | (196 | ) | | | (137 | ) | | | (77 | ) |
| | | | | | | | | | | | | | | | |
Net expenses | | | 25 | | | | 72 | | | | 38 | | | | 13 | |
| | | | | | | | | | | | | | | | |
Net investment income (loss) | | | 1,061 | | | | 2,754 | | | | 1,237 | | | | 307 | |
| | | | | | | | | | | | | | | | |
| | | | | | | | | | | | | | | | |
Net Realized and Unrealized Gain (Loss) | | | | | | | | | | | | | | | | |
Net realized gain (loss) on: | | | | | | | | | | | | | | | | |
Investments | | | (1,705 | ) | | | (3,281 | ) | | | (1,448 | ) | | | (2,467 | ) |
Capital gain distributions from Underlying Funds | | | 15 | | | | 30 | | | | 9 | | | | — | |
| | | | | | | | | | | | | | | | |
Net realized gain (loss) | | | (1,690 | ) | | | (3,251 | ) | | | (1,439 | ) | | | (2,467 | ) |
Net change in unrealized appreciation (depreciation) on investments | | | 5,647 | | | | 19,134 | | | | 12,548 | | | | 6,654 | |
| | | | | | | | | | | | | | | | |
Net realized and unrealized gain (loss) | | | 3,957 | | | | 15,883 | | | | 11,109 | | | | 4,187 | |
| | | | | | | | | | | | | | | | |
Net Increase (Decrease) in Net Assets from Operations | | $ | 5,018 | | | $ | 18,637 | | | $ | 12,346 | | | $ | 4,494 | |
| | | | | | | | | | | | | | | | |
See accompanying notes which are an integral part of the financial statements.
| | |
| 34 | | Statements of Operations |
(This page intentionally left blank)
Russell Investment Funds
LifePoints® Funds Variable Target Portfolio Series
Statements of Changes in Net Assets — For the Periods Ended December 31,
| | | | | | | | |
| | | Moderate Strategy
Fund | |
| Amounts in thousands | | 2009 | | | 2008 | |
| | | | | | | | |
Increase (Decrease) in Net Assets | | | | | | | | |
| | |
Operations | | | | | | | | |
Net investment income (loss) | | $ | 1,061 | | | $ | 655 | |
Net realized gain (loss) | | | (1,690 | ) | | | (869 | ) |
Net change in unrealized appreciation (depreciation) | | | 5,647 | | | | (4,012 | ) |
| | | | | | | | |
Net increase (decrease) in net assets from operations | | | 5,018 | | | | (4,226 | ) |
| | | | | | | | |
| | |
Distributions | | | | | | | | |
From net investment income | | | (1,078 | ) | | | (482 | ) |
From net realized gain | | | (120 | ) | | | (160 | ) |
| | | | | | | | |
Net decrease in net assets from distributions | | | (1,198 | ) | | | (642 | ) |
| | | | | | | | |
| | |
Share Transactions | | | | | | | | |
Net increase (decrease) in net assets from share transactions | | | 12,543 | | | | 15,522 | |
| | | | | | | | |
| | |
Total Net Increase (Decrease) in Net Assets | | | 16,363 | | | | 10,654 | |
| | |
Net Assets | | | | | | | | |
Beginning of period | | | 19,308 | | | | 8,654 | |
| | | | | | | | |
End of period | | $ | 35,671 | | | $ | 19,308 | |
| | | | | | | | |
Undistributed (overdistributed) net investment income included in net assets | | $ | 64 | | | $ | 172 | |
See accompanying notes which are an integral part of the financial statements.
| | |
| 36 | | Statements of Changes in Net Assets |
| | | | | | | | | | | | | | | | | | | | | | |
Balanced Strategy
Fund | | | Growth Strategy
Fund | | | Equity Growth
Strategy Fund | |
| 2009 | | | 2008 | | | 2009 | | | 2008 | | | 2009 | | | 2008 | |
| | | | | | | | | | | | | | | | | | | | | | |
| | | | | | | | | | | | | | | | | | | | | | |
| | | | | |
| | | | | | | | | | | | | | | | | | | | | | |
| $ | 2,754 | | | $ | 1,524 | | | $ | 1,237 | | | $ | 655 | | | $ | 307 | | | $ | 122 | |
| | (3,251 | ) | | | (1,118 | ) | | | (1,439 | ) | | | (461 | ) | | | (2,467 | ) | | | (1,015 | ) |
| | 19,134 | | | | (19,597 | ) | | | 12,548 | | | | (15,965 | ) | | | 6,654 | | | | (6,201 | ) |
| | | | | | | | | | | | | | | | | | | | | | | |
| | 18,637 | | | | (19,191 | ) | | | 12,346 | | | | (15,771 | ) | | | 4,494 | | | | (7,094 | ) |
| | | | | | | | | | | | | | | | | | | | | | | |
| | | | | |
| | | | | | | | | | | | | | | | | | | | | | |
| | (2,602 | ) | | | (1,462 | ) | | | (1,156 | ) | | | (647 | ) | | | (220 | ) | | | (89 | ) |
| | (331 | ) | | | (1,120 | ) | | | (213 | ) | | | (1,109 | ) | | | (87 | ) | | | (748 | ) |
| | | | | | | | | | | | | | | | | | | | | | | |
| | (2,933 | ) | | | (2,582 | ) | | | (1,369 | ) | | | (1,756 | ) | | | (307 | ) | | | (837 | ) |
| | | | | | | | | | | | | | | | | | | | | | | |
| | | | | |
| | | | | | | | | | | | | | | | | | | | | | |
| | 29,323 | | | | 46,234 | | | | 15,787 | | | | 24,879 | | | | 3,257 | | | | 7,538 | |
| | | | | | | | | | | | | | | | | | | | | | | |
| | | | | |
| | 45,027 | | | | 24,461 | | | | 26,764 | | | | 7,352 | | | | 7,444 | | | | (393 | ) |
| | | | | |
| | | | | | | | | | | | | | | | | | | | | | |
| | 60,158 | | | | 35,697 | | | | 34,742 | | | | 27,390 | | | | 12,613 | | | | 13,006 | |
| | | | | | | | | | | | | | | | | | | | | | | |
| $ | 105,185 | | | $ | 60,158 | | | $ | 61,506 | | | $ | 34,742 | | | $ | 20,057 | | | $ | 12,613 | |
| | | | | | | | | | | | | | | | | | | | | | | |
| $ | 172 | | | $ | 80 | | | $ | 61 | | | $ | 8 | | | $ | 41 | | | $ | 32 | |
See accompanying notes which are an integral part of the financial statements.
| | |
| Statements of Changes in Net Assets | | 37 |
Russell Investment Funds
LifePoints® Funds Variable Target Portfolio Series
Financial Highlights
For a Share Outstanding Throughout the Period.
| | | | | | | | | | | | | | | | |
| | | $ Net Asset Value,
Beginning of
Period | | $ Net Investment
Income (Loss)(a)(b) | | $ Net Realized
and Unrealized
Gain (Loss) | | | $ Total
Income (loss)
from
Operations | | | $ Distributions from Net
Investment Income | | | $
Distributions
from Net
Realized Gain | |
Moderate Strategy Fund | | | | | | | | | | | | | | |
December 31, 2009 | | 7.67 | | .36 | | 1.34 | | | 1.70 | | | (.37 | ) | | (.05 | ) |
December 31, 2008 | | 9.99 | | .33 | | (2.32 | ) | | (1.99 | ) | | (.23 | ) | | (.10 | ) |
December 31, 2007* | | 10.00 | | .46 | | (.11 | ) | | .35 | | | (.36 | ) | | — | (g) |
Balanced Strategy Fund | | | | | | | | | | | | | | | | |
December 31, 2009 | | 6.80 | | .26 | | 1.47 | | | 1.73 | | | (.24 | ) | | (.04 | ) |
December 31, 2008 | | 9.93 | | .23 | | (2.88 | ) | | (2.65 | ) | | (.21 | ) | | (.27 | ) |
December 31, 2007* | | 10.00 | | .47 | | (.20 | ) | | .27 | | | (.34 | ) | | — | (g) |
Growth Strategy Fund | | | | | | | | | | | | | | | | |
December 31, 2009 | | 6.11 | | .19 | | 1.56 | | | 1.75 | | | (.17 | ) | | (.03 | ) |
December 31, 2008 | | 9.90 | | .15 | | (3.46 | ) | | (3.31 | ) | | (.14 | ) | | (.34 | ) |
December 31, 2007* | | 10.00 | | .45 | | (.24 | ) | | .21 | | | (.31 | ) | | — | |
Equity Growth Strategy Fund | | | | | | | | | | | | | | |
December 31, 2009 | | 5.42 | | .12 | | 1.56 | | | 1.68 | | | (.09 | ) | | (.03 | ) |
December 31, 2008 | | 9.83 | | .07 | | (3.92 | ) | | (3.85 | ) | | (.05 | ) | | (.51 | ) |
December 31, 2007* | | 10.00 | | .50 | | (.38 | ) | | .12 | | | (.29 | ) | | — | |
See accompanying notes which are an integral part of the financial statements.
| | | | | | | | | | | | | | | | |
$ Total
Distributions | | | $
Net Asset Value,
End of
Period | | % Total
Return(c) | | | $
Net Assets,
End of Period
(000) | | %
Ratio of Expenses
to Average
Net Assets,
Net(d)(e)(f) | | %
Ratio of Expenses
to Average
Net Assets,
Gross(d)(e) | | %
Ratio of Net
Investment Income
to Average
Net Assets(c)(f) | | %
Portfolio
Turnover Rate(c) |
| | | | | | | | | | | | | | | | |
| (.42 | ) | | 8.95 | | 23.09 | | | 35,671 | | .10 | | .48 | | 4.40 | | 21 |
| (.33 | ) | | 7.67 | | (20.39 | ) | | 19,308 | | .11 | | .53 | | 3.77 | | 39 |
| (.36 | ) | | 9.99 | | 3.54 | | | 8,654 | | .11 | | 2.01 | | 5.37 | | 24 |
| | | | | | | | | | | | | | | | |
| (.28 | ) | | 8.25 | | 26.23 | | | 105,185 | | .09 | | .35 | | 3.62 | | 8 |
| (.48 | ) | | 6.80 | | (27.70 | ) | | 60,158 | | .08 | | .35 | | 2.75 | | 16 |
| (.34 | ) | | 9.93 | | 2.73 | | | 35,697 | | .08 | | .74 | | 5.37 | | 11 |
| | | | | | | | | | | | | | | | |
| (.20 | ) | | 7.66 | | 29.43 | | | 61,506 | | .09 | | .40 | | 2.80 | | 6 |
| (.48 | ) | | 6.11 | | (34.73 | ) | | 34,742 | | .04 | | .40 | | 1.85 | | 10 |
| (.31 | ) | | 9.90 | | 2.13 | | | 27,390 | | .04 | | .84 | | 5.05 | | 3 |
| | | | | | | | | | | | | | | | |
| (.12 | ) | | 6.98 | | 31.79 | | | 20,057 | | .08 | | .59 | | 2.02 | | 21 |
| (.56 | ) | | 5.42 | | (41.18 | ) | | 12,613 | | .04 | | .58 | | .87 | | 24 |
| (.29 | ) | | 9.83 | | 1.25 | | | 13,006 | | .04 | | 1.36 | | 5.59 | | 6 |
See accompanying notes which are an integral part of the financial statements.
Russell Investment Funds
LifePoints® Funds Variable Target Portfolio Series
Notes to Financial Highlights — December 31, 2009
| * | For the period April 30, 2007 (commencement of operations) to December 31, 2007. |
| (a) | Average daily shares outstanding were used for this calculation. |
| (b) | Recognition of net investment income by the Fund is affected by the timing of the declaration of dividends by the Underlying Funds in which the Fund invests. |
| (c) | Periods less than one year are not annualized. |
| (d) | The ratios for periods less than one year are annualized. |
| (e) | The calculation includes only those expenses charged directly to the Fund and does not include expenses charged to the Underlying Funds in which the Fund invests. |
| (f) | May reflect amounts waived and reimbursed by RIMCo and Russell Fund Services Company (“RFSC”). |
| (g) | Less than $.01 per share. |
See accompanying notes which are an integral part of the financial statements.
| | |
| 40 | | Notes to Financial Highlights |
Russell Investment Funds
LifePoints® Funds Variable Target Portfolio Series
Notes to Financial Statements — December 31, 2009
Russell Investment Funds (the “Investment Company” or “RIF”) is a series investment company with nine different investment portfolios referred to as Funds. These financial statements report on four of these Funds (each a “Fund” and collectively the “Funds”). The Investment Company provides the investment base for one or more variable insurance products issued by one or more insurance companies. These Funds are offered at net asset value to qualified insurance company separate accounts offering variable insurance products. The Investment Company is registered under the Investment Company Act of 1940, as amended, as an open-end management investment company. It is organized and operates as a Massachusetts business trust under an Amended and Restated Master Trust Agreement dated October 1, 2008. The Investment Company’s Master Trust Agreement permits the Board of Trustees (the “Board”) to issue an unlimited number of shares of beneficial interest.
The Funds seek to achieve their objective by investing in a combination of Russell Investment Company (“RIC”) Funds and other of the Investment Company’s Funds (the “Underlying Funds”) as set forth in the table below. Russell Investment Management Company (“RIMCo”) is the Funds’ adviser and may modify the ranges for any Fund and/or the Underlying Funds in which the Funds invest from time to time based on strategic capital markets research or on factors such as RIMCo’s outlook for the economy, financial markets generally and/or relative market valuation of the asset classes represented by each Underlying Fund. In the future, the Fund may also invest in other Underlying Funds. Any modification in the range or changes to the Underlying Funds will be based on strategic long-term allocation decisions and not tactical, short-term positioning and may be made one or more times per year. In the future, the Funds may also invest in other funds which are not currently Underlying Funds.
| | | | | | | | | | | | |
| |
| | | Target Asset Allocation Range as of May 1, 2009 | |
| Asset Class/Underlying Funds | | Moderate
Strategy Fund | | | Balanced
Strategy Fund | | | Growth
Strategy Fund | | | Equity Growth
Strategy Fund | |
Bonds | | | | | | | | | | | | |
RIF Core Bond Fund | | 55-65 | % | | 35-45 | % | | 15-25 | % | | 0 | % |
Domestic Equities | | | | | | | | | | | | |
RIF Aggressive Equity Fund | | 0-8 | | | 0-9 | | | 1-11 | | | 2-12 | |
RIF Multi-Style Equity Fund | | 5-15 | | | 10-20 | | | 16-26 | | | 21-31 | |
RIF Real Estate Securities Fund | | 0-8 | | | 0-10 | | | 1-11 | | | 2-12 | |
RIC Russell U.S. Quantitative Equity Fund | | 5-15 | | | 10-20 | | | 15-25 | | | 20-30 | |
International Equities | | | | | | | | | | | | |
RIF Non-U.S. Fund | | 4-14 | | | 9-19 | | | 12-22 | | | 18-28 | |
RIC Russell Emerging Markets Fund | | 0-7 | | | 0-8 | | | 0-9 | | | 0-10 | |
RIC Russell Global Equity Fund | | 0-8 | | | 0-9 | | | 1-11 | | | 2-12 | |
| 2. | | Significant Accounting Policies |
The Funds’ financial statements are prepared in accordance with accounting principles generally accepted in the United States of America (“GAAP”) which require the use of management estimates and assumptions at the date of the financial statements. Actual results could differ from those estimates. The following is a summary of the significant accounting policies consistently followed by each Fund in the preparation of its financial statements.
Security Valuation
The Funds value their portfolio securities, the shares of the Underlying Funds, at the current net asset value per share of each Underlying Fund. Generally, Underlying Fund portfolio securities are valued at the close of the principal exchange on which they are traded.
Fair value of securities is defined as the price that the Funds would receive upon selling an investment in a timely transaction to an independent buyer in the principal or most advantageous market of the investment. To increase consistency and comparability in fair value measurement, the fair value hierarchy was established to maximize the use of observable market data and minimize the use of unobservable inputs and to establish classification of fair value measurements for disclosure purposes. Inputs refer broadly to the assumptions that market participants would use in pricing the asset, including assumptions about risk, for example, the risk inherent in a particular valuation technique used to measure fair value including a pricing model and/or risk inherent in the inputs to the valuation technique. Inputs may be observable or unobservable. Observable inputs are inputs that reflect the assumptions market participants would use in pricing the asset or liability developed based on market data obtained from sources independent of the reporting entity. Unobservable inputs are inputs that reflect the reporting entity’s own assumptions about the assumptions market participants would use in pricing the asset or liability developed based on the best information available in the circumstances.
| | |
| Notes to Financial Statements | | 41 |
Russell Investment Funds
LifePoints® Funds Variable Target Portfolio Series
Notes to Financial Statements, continued — December 31, 2009
The fair value hierarchy of inputs is summarized in the three broad levels listed below.
| | • | | Level 1 — quoted prices (unadjusted) in active markets for identical investments |
| | • | | Level 2 — other significant observable inputs (including quoted prices for similar investments, interest rates, prepayment speeds, credit risk, etc.) |
| | • | | Level 3 — significant unobservable inputs (including the Fund’s own assumptions in determining the fair value of investments) |
The levels associated with valuing the Funds’ investments for the period ended December 31, 2009 were level one for all Funds.
Investment Transactions
Investment transactions are recorded on a trade date basis. Realized gains and losses from securities transactions, if any, are recorded on the basis of specific identified cost.
Investment Income
Distributions of income and capital gains from the Underlying Funds are recorded on the ex-dividend date.
Federal Income Taxes
Since the Investment Company is a Massachusetts business trust, each Fund is a separate corporate taxpayer and determines its net investment income and capital gains (or losses) and the amounts to be distributed to each Fund’s shareholders without regard to the income and capital gains (or losses) of the other Funds.
Each Fund qualifies as a regulated investment company under sub-chapter M of the Internal Revenue Code and distributes all of its taxable income and capital gains. Therefore, no federal income tax provision is required for the Funds.
Each Fund files a U. S. tax return. At December 31, 2009, the Funds have recorded no liabilities for net unrecognized tax benefits relating to uncertain income tax positions they have taken or expect to take in future tax returns. While the statute of limitations remains open to examine the Funds’ U.S. tax returns filed for the fiscal years ending December 31, 2006, through December 31, 2008, no examinations are in progress or anticipated at this time. The Funds are not aware of any tax positions for which it is reasonably possible that the total amounts of unrecognized tax benefits will significantly change in the next twelve months.
Dividends and Distributions to Shareholders
Income dividends and capital gain distributions, if any, are recorded on the ex-dividend date. Income dividends are generally declared and paid quarterly. Capital gain distributions are generally declared and paid annually. An additional distribution may be paid by the Funds to avoid imposition of federal income and excise tax on any remaining undistributed capital gains and net investment income.
The timing and characterization of certain income and capital gain distributions are determined in accordance with federal tax regulations which may differ from GAAP. As a result, net investment income and net realized gain (or loss) from investment transactions for a reporting period may differ significantly from distributions during such period. The differences between tax regulations and GAAP relate primarily to investments in the Underlying Funds sold at a loss, wash sale deferrals and capital loss carryforwards. Accordingly, the Funds may periodically make reclassifications among certain of their capital accounts without impacting their net asset value.
Expenses
Expenses included in the accompanying financial statements reflect the expenses of each Fund and do not include those expenses incurred by the Underlying Funds. Because the Underlying Funds have varied expense and fee levels and the Funds may own different proportions of the Underlying Funds at different times, the amount of the fees and expenses incurred indirectly by the Funds will vary.
Guarantees
In the normal course of business the Funds enter into contracts that contain a variety of representations which provide general indemnifications. The Funds’ maximum exposure under these arrangements is unknown as this would involve future claims that may be made against the Funds that have not yet occurred. However, the Funds expect the risk of loss to be remote.
| | |
| 42 | | Notes to Financial Statements |
Russell Investment Funds
LifePoints® Funds Variable Target Portfolio Series
Notes to Financial Statements, continued — December 31, 2009
| 3. | | Investment Transactions |
Securities
During the period ended December 31, 2009, purchases and sales of the Underlying Funds (excluding short-term investments) were as follows:
| | | | | | |
| Funds | | Purchases | | Sales |
| | | | | | |
Moderate Strategy | | $ | 17,515,454 | | $ | 5,099,646 |
Balanced Strategy | | | 35,512,427 | | | 6,344,640 |
Growth Strategy | | | 18,207,760 | | | 2,548,922 |
Equity Growth Strategy | | | 6,431,385 | | | 3,174,237 |
| 4. | | Related Party Transactions, Fees and Expenses |
Adviser and Administrator
RIMCo advises the Funds and Russell Fund Services Company (“RFSC”) is the Funds’ administrator. RFSC is a wholly-owned subsidiary of RIMCo. RIMCo is a wholly-owned subsidiary of Frank Russell Company (a subsidiary of The Northwestern Mutual Life Insurance Company). Frank Russell Company provides ongoing money manager research and trade placement services to RIF and RIMCo.
The advisory fee of 0.20% and administrative fee of 0.05% are based upon the average daily net assets of the Funds and are payable monthly totaling $319,215 and $79,804 respectively, for the period ended December 31, 2009.
RIMCo had contractually agreed to waive, through April 29, 2009, its 0.20% advisory fee for each Fund. RIMCo has then contractually agreed to reimburse, through April 29, 2009, each Fund for other direct Fund-level expenses to the extent that direct Fund-level expenses exceeded 0.11%, 0.08%, 0.04% and 0.04% of average daily net assets of the Moderate Strategy, Balanced Strategy, Growth Strategy, and Equity Growth Strategy Funds, respectively, on an annual basis.
Effective April 30, 2009 for each Fund individually, RIMCo has contractually agreed, until April 30, 2010, to waive up to the full amount of its 0.20% advisory fee and then reimburse the Fund for other direct Fund-level expenses to the extent that direct Fund-level expenses exceed 0.10% of the average daily net assets of the Fund on an annual basis. These waivers and reimbursements may not be terminated during the relevant period except at the Board’s discretion.
Direct Fund-level expenses do not include extraordinary expenses or the expenses of other investment companies in which the Funds invest, including the Underlying Funds, which are borne indirectly by the Funds.
For the period ended December 31, 2009, the fees waived and reimbursed by RIMCo amounted to:
| | | |
| Funds | | Amount |
| | | |
Moderate Strategy | | $ | 91,338 |
Balanced Strategy | | | 195,833 |
Growth Strategy | | | 137,477 |
Equity Growth Strategy | | | 76,666 |
RIMCo and RFSC do not have the ability to recover amounts waived or reimbursed from previous periods.
Transfer and Dividend Disbursing Agent
RFSC is the Transfer and Dividend Disbursing Agent for the Investment Company. For this service, RFSC is paid a fee based upon the average daily net assets of the Funds for transfer agency and dividend disbursing services. RFSC retains a portion of this fee for its services provided to the Funds and pays the balance to unaffiliated agents who assisted in providing these services. Total fees paid for the Funds presented herein for the period ended December 31, 2009 were $7,023.
Distributor
Russell Financial Services, Inc. (the “Distributor’), a wholly-owned subsidiary of RIMCo, is the distributor for RIF, pursuant to the Distribution Agreement with the Investment Company. The Distributor receives no compensation from the Investment Company for its services.
| | |
| Notes to Financial Statements | | 43 |
Russell Investment Funds
LifePoints® Funds Variable Target Portfolio Series
Notes to Financial Statements, continued — December 31, 2009
Accrued Fees Payable to Affiliates
Accrued fees payable to affiliates for the period ended December 31, 2009 were as follows:
| | | | | | | | | | | | |
| | | Moderate Strategy
Fund | | Balanced Strategy
Fund | | Growth Strategy
Fund | | Equity Growth
Strategy Fund |
| | | | | | | | | | | | |
Administration fees | | $ | 1,501 | | $ | 4,388 | | $ | 2,550 | | $ | 824 |
Transfer Agent fees | | | 130 | | | 380 | | | 221 | | | 72 |
Trustee fees | | | 84 | | | 317 | | | 269 | | | 110 |
| | | | | | | | | | | | |
| | $ | 1,715 | | $ | 5,085 | | $ | 3,040 | | $ | 1,006 |
| | | | | | | | | | | | |
Board of Trustees
Through December 31, 2009, the Russell Fund Complex consists of RIC, which has 37 Funds, and RIF, which has nine Funds. Each of the Trustees is a Trustee of both RIC and RIF. During the period, the Russell Fund Complex paid each of its independent Trustees a retainer of $60,000 per year, $6,500 for each regular quarterly meeting attended in person, $2,500 for each special meeting attended in person, and $2,500 for each Audit Committee meeting, Nominating and Governance Committee meeting, Investment Committee meeting or any other committee meeting established and approved by the Board that is attended in person. Each Trustee receives a $1,000 fee for attending the quarterly and special meetings and a $500 fee for attending the committee meeting by phone instead of receiving the full fee had the member attended in person. Trustees’ out of pocket expenses are also paid by the Russell Fund Complex. The Audit Committee Chair and Investment Committee Chair are each paid a fee of $12,000 per year and the Nominating and Governance Committee Chair is paid a fee of $6,000 per year. The chairman of the Board receives additional annual compensation of $52,000.
Effective January 1, 2010, The Russell Fund Complex consists of RIC, which has 37 Funds, and RIF, which has nine Funds. Each of the Trustees is a Trustee of both RIC and RIF. During the period, the Russell Fund Complex paid each of its independent Trustees a retainer of $72,000 per year, $6,500 for each regular quarterly meeting attended in person, $2,500 for each special meeting attended in person, and $2,500 for each Audit Committee meeting, Nominating and Governance Committee meeting, Investment Committee meeting or any other committee meeting established and approved by the Board that is attended in person. Each Trustee receives a $1,000 fee for attending the quarterly and special meetings (except for telephonic meetings called pursuant to the Funds’ valuation and pricing procedures) and a $500 fee for attending the committee meeting by phone instead of receiving the full fee had the member attended in person. Trustees’ out of pocket expenses are also paid by the Russell Fund Complex. The Audit Committee Chair and Investment Committee Chair are each paid a fee of $12,000 per year and the Nominating and Governance Committee Chair is paid a fee of $6,000 per year. The chairman of the Board receives additional annual compensation of $72,000.
| | |
| 44 | | Notes to Financial Statements |
Russell Investment Funds
LifePoints® Funds Variable Target Portfolio Series
Notes to Financial Statements, continued — December 31, 2009
Transactions with Affiliated Companies
An affiliated company is a company in which a Fund has ownership of at least 5% of the voting securities or under common control. Transactions during the period ended December 31, 2009, with Underlying Funds which are an affiliated company or under common control are as follows:
| | | | | | | | | | | | | | | | | | | |
| | | | | | |
| Affiliate | | Market Value | | Purchases Cost | | Sales Cost | | Realized Gain
(Loss) | | | Income
Distributions | | Capital Gains
Distributions |
| | | | | | | | | | | | | | | | | | | |
Moderate Strategy Fund | | | | | | | | | | | | | | | | | | | |
RIF Core Bond Fund | | $ | 21,384,405 | | $ | 11,152,592 | | $ | 2,854,101 | | $ | (248,261 | ) | | $ | 874,631 | | $ | 14,500 |
RIF Aggressive Equity Fund | | | 1,074,780 | | | 467,949 | | | 307,586 | | | (105,686 | ) | | | 3,701 | | | — |
RIF Multi-Style Equity Fund | | | 3,564,520 | | | 1,460,797 | | | 811,392 | | | (292,958 | ) | | | 29,950 | | | — |
RIF Real Estate Securities Fund | | | 1,072,202 | | | 640,122 | | | 631,199 | | | (234,275 | ) | | | 35,028 | | | — |
RIC Russell U.S. Quantitative Equity Fund | | | 3,561,931 | | | 1,463,790 | | | 599,996 | | | (209,464 | ) | | | 38,209 | | | — |
RIF Non-U.S. Fund | | | 3,220,903 | | | 1,590,081 | | | 938,295 | | | (357,646 | ) | | | 70,001 | | | — |
RIC Russell Emerging Markets Fund | | | 727,829 | | | 294,498 | | | 375,265 | | | (151,984 | ) | | | 19,541 | | | — |
RIC Russell Global Equity Fund | | | 1,070,507 | | | 445,625 | | | 286,527 | | | (104,441 | ) | | | 14,890 | | | — |
| | | | | | | | | | | | | | | | | | | |
| | $ | 35,677,077 | | $ | 17,515,454 | | $ | 6,804,361 | | $ | (1,704,715 | ) | | $ | 1,085,951 | | $ | 14,500 |
| | | | | | | | | | | | | | | | | | | |
Balanced Strategy Fund | | | | | | | | | | | | | | | | | | | |
RIF Core Bond Fund | | $ | 42,058,039 | | $ | 18,830,946 | | $ | 3,466,122 | | $ | (344,526 | ) | | $ | 1,836,536 | | $ | 29,827 |
RIF Aggressive Equity Fund | | | 4,267,831 | | | 1,069,166 | | | 435,376 | | | (200,810 | ) | | | 15,877 | | | — |
RIF Multi-Style Equity Fund | | | 15,702,525 | | | 3,962,748 | | | 1,224,874 | | | (535,642 | ) | | | 143,745 | | | — |
RIF Real Estate Securities Fund | | | 5,331,166 | | | 1,416,131 | | | 1,016,254 | | | (479,898 | ) | | | 183,855 | | | — |
RIC Russell U.S. Quantitative Equity Fund | | | 15,684,831 | | | 4,482,913 | | | 1,058,904 | | | (473,031 | ) | | | 179,657 | | | — |
RIF Non-U.S. Fund | | | 14,737,716 | | | 4,288,146 | | | 1,085,928 | | | (556,960 | ) | | | 323,196 | | | — |
RIC Russell Emerging Markets Fund | | | 3,208,658 | | | 482,673 | | | 999,553 | | | (534,815 | ) | | | 85,511 | | | — |
RIC Russell Global Equity Fund | | | 4,202,962 | | | 979,704 | | | 338,683 | | | (155,372 | ) | | | 58,115 | | | — |
| | | | | | | | | | | | | | | | | | | |
| | $ | 105,193,728 | | $ | 35,512,427 | | $ | 9,625,694 | | $ | (3,281,054 | ) | | $ | 2,826,492 | | $ | 29,827 |
| | | | | | | | | | | | | | | | | | | |
Growth Strategy Fund | | | | | | | | | | | | | | | | | | | |
RIF Core Bond Fund | | $ | 12,239,857 | | $ | 5,506,143 | | $ | 1,199,809 | | $ | (88,377 | ) | | $ | 536,672 | | $ | 8,814 |
RIF Aggressive Equity Fund | | | 3,765,642 | | | 898,618 | | | 184,967 | | | (91,247 | ) | | | 13,923 | | | — |
RIF Multi-Style Equity Fund | | | 12,853,580 | | | 3,059,992 | | | 175,718 | | | (68,564 | ) | | | 115,408 | | | — |
RIF Real Estate Securities Fund | | | 3,748,468 | | | 1,108,818 | | | 1,052,493 | | | (544,006 | ) | | | 125,339 | | | — |
RIC Russell U.S. Quantitative Equity Fund | | | 12,227,574 | | | 3,339,114 | | | 149,325 | | | (56,083 | ) | | | 139,265 | | | — |
RIF Non-U.S. Fund | | | 10,479,692 | | | 3,067,296 | | | 483,195 | | | (225,413 | ) | | | 226,372 | | | — |
RIC Russell Emerging Markets Fund | | | 2,510,439 | | | 404,307 | | | 643,570 | | | (328,055 | ) | | | 66,709 | | | — |
RIC Russell Global Equity Fund | | | 3,687,709 | | | 823,472 | | | 107,377 | | | (45,787 | ) | | | 50,877 | | | — |
| | | | | | | | | | | | | | | | | | | |
| | $ | 61,512,961 | | $ | 18,207,760 | | $ | 3,996,454 | | $ | (1,447,532 | ) | | $ | 1,274,565 | | $ | 8,814 |
| | | | | | | | | | | | | | | | | | | |
Equity Growth Strategy Fund | | | | | | | | | | | | | | | | | | | |
RIF Aggressive Equity Fund | | $ | 1,410,679 | | $ | 372,298 | | $ | 326,968 | | $ | (146,240 | ) | | $ | 5,604 | | $ | — |
RIF Multi-Style Equity Fund | | | 5,197,985 | | | 1,531,336 | | | 1,197,578 | | | (482,066 | ) | | | 51,418 | | | — |
RIF Real Estate Securities Fund | | | 1,400,823 | | | 572,177 | | | 760,193 | | | (351,907 | ) | | | 51,773 | | | — |
RIC Russell U.S. Quantitative Equity Fund | | | 4,992,943 | | | 1,648,098 | | | 1,115,655 | | | (459,783 | ) | | | 59,033 | | | — |
RIF Non-U.S. Fund | | | 4,633,828 | | | 1,654,361 | | | 1,338,736 | | | (630,337 | ) | | | 105,468 | | | — |
RIC Russell Emerging Markets Fund | | | 1,024,733 | | | 256,200 | | | 555,992 | | | (256,890 | ) | | | 26,984 | | | — |
RIC Russell Global Equity Fund | | | 1,406,230 | | | 396,915 | | | 345,975 | | | (139,637 | ) | | | 19,294 | | | — |
| | | | | | | | | | | | | | | | | | | |
| | $ | 20,067,221 | | $ | 6,431,385 | | $ | 5,641,097 | | $ | (2,466,860 | ) | | $ | 319,574 | | $ | — |
| | | | | | | | | | | | | | | | | | | |
| | |
| Notes to Financial Statements | | 45 |
Russell Investment Funds
LifePoints® Funds Variable Target Portfolio Series
Notes to Financial Statements, continued — December 31, 2009
At December 31, 2009, the following Fund had net tax basis capital loss carryforwards which may be applied against any net realized taxable gains in each succeeding year or until their respective expiration dates, whichever occurs first. Available capital loss carryforwards and expiration dates are as follows:
| | | | | | | | | |
| Funds | | 12/31/2016 | | 12/31/2017 | | Totals |
| | | | | | | | | |
Moderate Strategy | | $ | — | | $ | 257,395 | | $ | 257,395 |
Balanced Strategy | | | — | | | 286,231 | | | 286,231 |
Growth Strategy | | | — | | | 335,288 | | | 335,288 |
Equity Growth Strategy | | | 11,522 | | | 258,785 | | | 270,307 |
At December 31, 2009, the cost of investments and net unrealized appreciation (depreciation), undistributed ordinary income and undistributed long-term capital gains for income tax purposes were as follows:
| | | | | | | | | | | | | | | | |
| | | Moderate
Strategy Fund | | | Balanced
Strategy Fund | | | Growth
Strategy Fund | | | Equity Growth
Strategy Fund | |
| | | | | | | | | | | | | | | | |
Cost of Investments for Tax Purposes | | $ | 36,650,208 | | | $ | 111,523,488 | | | $ | 68,209,504 | | | $ | 24,064,028 | |
| | | | | | | | | | | | | | | | |
Gross Tax Unrealized Appreciation | | $ | — | | | $ | 6,764,140 | | | $ | 1,020,125 | | | $ | 2,318,511 | |
Gross Tax Unrealized Depreciation | | | (973,131 | ) | | | (13,093,900 | ) | | | (7,716,669 | ) | | | (6,315,318 | ) |
| | | | | | | | | | | | | | | | |
Net Tax Unrealized Appreciation (Depreciation) | | $ | (973,131 | ) | | $ | (6,329,760 | ) | | $ | (6,696,544 | ) | | $ | (3,996,807 | ) |
| | | | | | | | | | | | | | | | |
Undistributed Ordinary Income | | $ | 63,906 | | | $ | 172,455 | | | $ | 60,927 | | | $ | 40,560 | |
Undistributed Long-Term Gains (Capital Loss Carryforward) | | $ | (257,395 | ) | | $ | (286,231 | ) | | $ | (335,288 | ) | | $ | (270,307 | ) |
Tax Composition of Distributions: | | | | | | | | | | | | | | | | |
Ordinary Income | | $ | 1,164,275 | | | $ | 2,742,916 | | | $ | 1,229,972 | | | $ | 306,860 | |
Long Term Capital Gains | | $ | 34,051 | | | $ | 189,092 | | | $ | 140,054 | | | $ | — | |
| | | | |
Post October Loss Deferrals | | $ | — | | | $ | — | | | $ | — | | | $ | 3,862 | |
| | |
| 46 | | Notes to Financial Statements |
Russell Investment Funds
LifePoints® Funds Variable Target Portfolio Series
Notes to Financial Statements, continued — December 31, 2009
6. Fund Share Transactions (amounts in thousands)
Share transactions for the periods ended December 31, 2009 and December 31, 2008 were as follows:
| | | | | | | | | | | | | | |
| | | Shares | | | Dollars | |
| | | 2009 | | | 2008 | | | 2009 | | | 2008 | |
| | | | | | | | | | | | | | |
| | | | | | | | | | | | | | |
Moderate Strategy Fund | | | | | | | | | | | | | | |
Proceeds from shares sold | | 2,000 | | | 2,261 | | | $ | 16,613 | | | $ | 21,043 | |
Proceeds from reinvestment of distributions | | 153 | | | 71 | | | | 1,198 | | | | 642 | |
Payments for shares redeemed | | (684 | ) | | (682 | ) | | | (5,268 | ) | | | (6,163 | ) |
| | | | | | | | | | | | | | |
Net increase (decrease) | | 1,469 | | | 1,650 | | | $ | 12,543 | | | $ | 15,522 | |
| | | | | | | | | | | | | | |
| | | | | | | | | | | | | | |
Balanced Strategy Fund | | | | | | | | | | | | | | |
Proceeds from shares sold | | 4,503 | | | 5,802 | | | $ | 33,006 | | | $ | 50,702 | |
Proceeds from reinvestment of distributions | | 410 | | | 306 | | | | 2,932 | | | | 2,582 | |
Payments for shares redeemed | | (1,007 | ) | | (856 | ) | | | (6,615 | ) | | | (7,050 | ) |
| | | | | | | | | | | | | | |
Net increase (decrease) | | 3,906 | | | 5,252 | | | $ | 29,323 | | | $ | 46,234 | |
| | | | | | | | | | | | | | |
| | | | | | | | | | | | | | |
Growth Strategy Fund | | | | | | | | | | | | | | |
Proceeds from shares sold | | 2,492 | | | 3,050 | | | $ | 16,740 | | | $ | 25,915 | |
Proceeds from reinvestment of distributions | | 212 | | | 212 | | | | 1,370 | | | | 1,755 | |
Payments for shares redeemed | | (359 | ) | | (344 | ) | | | (2,323 | ) | | | (2,791 | ) |
| | | | | | | | | | | | | | |
Net increase (decrease) | | 2,345 | | | 2,918 | | | $ | 15,787 | | | $ | 24,879 | |
| | | | | | | | | | | | | | |
| | | | | | | | | | | | | | |
Equity Growth Strategy Fund | | | | | | | | | | | | | | |
Proceeds from shares sold | | 1,048 | | | 1,334 | | | $ | 6,208 | | | $ | 10,149 | |
Proceeds from reinvestment of distributions | | 59 | | | 100 | | | | 306 | | | | 837 | |
Payments for shares redeemed | | (563 | ) | | (428 | ) | | | (3,257 | ) | | | (3,448 | ) |
| | | | | | | | | | | | | | |
Net increase (decrease) | | 544 | | | 1,006 | | | $ | 3,257 | | | $ | 7,538 | |
| | | | | | | | | | | | | | |
| 7. | | Interfund Lending Program |
The Investment Company Funds have been granted permission from the Securities and Exchange Commission to participate in a joint lending and borrowing facility (the “Credit Facility”). Portfolios of the Funds may borrow money from each other for temporary purposes. All such borrowing and lending will be subject to a participating Fund’s fundamental investment limitations. Typically, Funds will borrow from the RIC Russell Money Market Fund. The RIC Russell Money Market Fund will lend through the program only when the returns are higher than those available from an investment in repurchase agreements or short-term reserves and the portfolio manager determines it is in the best interest of the RIC Russell Money Market Fund. The Investment Company Funds will borrow through the program only when the costs are equal to or lower than the cost of bank loans. Interfund loans and borrowings normally extend overnight, but can have a maximum duration of seven days. Loans may be called on one business day’s notice. A participating fund may have to borrow from a bank at a higher interest rate if an interfund loan is called or not renewed. Any delay in repayment to the RIC Russell Money Market Fund could result in a lost investment opportunity or additional borrowing costs. For the period ended December 31, 2009, the Funds presented herein did not borrow through the interfund lending program.
| | |
| Notes to Financial Statements | | 47 |
Russell Investment Funds
LifePoints® Funds Variable Target Portfolio Series
Notes to Financial Statements, continued — December 31, 2009
As of December 31, 2009, the following table includes shareholders of record with greater than 10% of the total outstanding shares of each respective Fund. The Northwestern Mutual Life Insurance Company accounts were the largest shareholders in each Fund.
| | | | |
| Funds | | # of Shareholders | | % |
| | | | |
Moderate Strategy | | 1 | | 97.6 |
Balanced Strategy | | 1 | | 97.4 |
Growth Strategy | | 1 | | 97.7 |
Equity Growth Strategy | | 1 | | 95.0 |
Management has evaluated events or transactions that may have occurred since December 31, 2009, that would merit recognition or disclosure in the financial statements. This evaluation was completed through February 16, 2010, the date the financial statements were available to be issued. During the review nothing was discovered which would require further disclosure within the financial statements.
Effective March 1, 2010, each Fund’s allocation to the Underlying Funds in which it invests will be modified including the addition on the RIC Investment Grade Bond Fund as an Underlying Fund.
| | |
| 48 | | Notes to Financial Statements |
Report of Independent Registered Public Accounting Firm
To the Board of Trustees and Shareholders
of Russell Investment Funds:
In our opinion, the accompanying statements of assets and liabilities, including the schedules of investments, and the related statements of operations and of changes in net assets and the financial highlights present fairly, in all material respects, the financial position of Moderate Strategy Fund, Balanced Strategy Fund, Growth Strategy Fund and Equity Growth Strategy Fund (four of the portfolios constituting the Russell Investment Funds, hereafter referred to as the “Funds”) at December 31, 2009, the results of each of their operations for the year then ended, and the changes in each of their net assets and the financial highlights for the periods indicated, in conformity with accounting principles generally accepted in the United States of America. These financial statements and financial highlights (hereafter referred to as “financial statements”) are the responsibility of the Funds’ management; our responsibility is to express an opinion on these financial statements based on our audits. We conducted our audits of these financial statements in accordance with the standards of the Public Company Accounting Oversight Board (United States). Those standards require that we plan and perform the audits to obtain reasonable assurance about whether the financial statements are free of material misstatement. An audit includes examining, on a test basis, evidence supporting the amounts and disclosures in the financial statements, assessing the accounting principles used and significant estimates made by management, and evaluating the overall financial statement presentation. We believe that our audits, which included confirmation of securities at December 31, 2009 by correspondence with the transfer agent, provide a reasonable basis for our opinion.

Seattle, Washington
February 15, 2010
| | |
| Report of Independent Registered Public Accounting Firm | | 49 |
Russell Investment Company
LifePoints® Funds Variable Target Portfolio Series
Tax Information — December 31, 2009 (Unaudited)
For the tax year ended December 31, 2009, the Funds hereby designate 100% or the maximum amount allowable, of its net taxable income as qualified dividends taxed at individual net capital gain rates.
The Form 1099 you receive in January 2010 will show the tax status of all distributions paid to your account in calendar year 2009.
The Funds designate dividends distributed during the fiscal year as qualifying for the dividends received deduction for corporate shareholders as follows:
| | | |
Moderate Strategy | | 6.7 | % |
Balanced Strategy | | 13.2 | % |
Growth Strategy | | 23.4 | % |
Equity Growth Strategy | | 40.2 | % |
Pursuant to Section 852 of the Internal Revenue Code, the Funds designate the following amounts as long-term capital gain dividends for their taxable year ended December 31, 2009:
| | |
| | | Long-Term
Capital Gains |
| | |
Moderate Strategy | | 34,051 |
Balanced Strategy | | 189,092 |
Growth Strategy | | 140,054 |
Equity Growth Strategy | | 0 |
Please consult a tax adviser for any questions about federal or state income tax laws.
Russell Investment Funds
LifePoints® Variable Target Portfolio Funds
Basis for Approval of Investment Advisory Contracts (Unaudited)
Approval of Investment Advisory Agreement
The Board of Trustees, including all of the Independent Trustees, last considered and approved the continuation of the advisory agreement with RIMCo (the “RIMCo Agreement”) and the portfolio management contract (collectively, the “portfolio management contracts”) with each Money Manager of the funds in which the Funds invest (the “Underlying Funds”) at a meeting held on April 21, 2009. During the course of a year, the Trustees receive a wide variety of materials regarding the investment performance of the Funds, sales and redemptions of the Funds’ and Underlying Funds’ shares, management of the Funds and the Underlying Funds by RIMCo and compliance with applicable regulatory requirements. In preparation for the annual review, the Independent Trustees, with the advice and assistance of their independent counsel, also requested and the Board considered (1) information and reports prepared by RIMCo relating to the services provided by RIMCo (and its affiliates) to the Funds and the Underlying Funds; and (2) information (the “Third-Party Information”) received from an independent, nationally recognized provider of investment company information comparing the performance of each of the Funds and the Underlying Funds and their respective operating expenses over various periods of time with other peer funds (“Comparable Funds”) not managed by RIMCo believed by the provider to be generally comparable in investment objectives to the Funds and the Underlying Funds. The foregoing information requested by the Trustees or provided by RIMCo is collectively called the “Agreement Renewal Information.” The Trustees’ evaluations also reflected the knowledge and familiarity gained as Board members of the Funds and other funds in the same complex with respect to services provided by RIMCo, RIMCo’s affiliates and each Money Manager. The Trustees received a memorandum from counsel to the Funds and Underlying Funds discussing the legal standards for their consideration of the continuations of the RIMCo Agreement and the portfolio management contracts and the Independent Trustees separately received a memorandum regarding their responsibilities from their independent counsel.
On April 20, 2009, the Independent Trustees met to review the Agreement Renewal Information in a private session with their independent counsel at which no representatives of RIMCo or the Funds’ management were present. At the April 21 meeting of the Board of Trustees, the Board, including the Independent Trustees, reviewed the proposed continuance of the RIMCo Agreement and the portfolio management contracts with management, counsel to the Funds and Underlying Funds and independent counsel to the Independent Trustees. Presentations made by RIMCo to the Board as part of this review encompassed the Funds and all other RIMCo-managed funds for which the Board has supervisory responsibility. Following this review, but prior to voting, the Independent Trustees again met in a private session with their independent counsel to evaluate additional information and analyses received from RIMCo and management at the Board meeting. The discussion below reflects all of these reviews.
In evaluating the portfolio management contracts, the Board considered that the Underlying Funds, in employing a manager-of-managers method of investment, operate in a manner that is distinctly different from most other investment companies. In the case of most other investment companies, an advisory fee is paid by the investment company to its adviser which in turn employs and compensates individual portfolio managers to make specific securities selections consistent with the adviser’s style and investment philosophy. RIMCo has engaged multiple unaffiliated Money Managers for all Underlying Funds.
The Board considered that RIMCo (rather than any Money Manager) is responsible under the RIMCo Agreement for allocating assets of each Fund among its Underlying Funds and for determining, implementing and maintaining the investment program for each Underlying Fund. The assets of each Fund are invested in different combinations of the Underlying Funds pursuant to target asset allocations set by RIMCo. RIMCo may modify the target asset allocation for any Fund and/or the Underlying Funds in which the Funds invest. Assets of each Underlying Fund generally have been allocated among the multiple Money Managers selected by RIMCo, subject to Board approval, for that Underlying Fund. RIMCo manages directly a portion of certain Underlying Funds’ assets employing a “select holdings strategy,” as described below, and directly manages the investment of each Underlying Fund’s cash reserves. RIMCo also may manage directly any portion of each Underlying Fund’s assets that RIMCo determines not to allocate to the Money Managers and portions of an Underlying Fund during transitions between Money Managers. In all cases, assets are managed directly by RIMCo pursuant to authority provided by the RIMCo Agreement.
RIMCo is responsible for selecting, subject to Board approval, Money Managers for each Underlying Fund and for actively managing allocations and reallocations of its assets among the Money Managers. The Board has been advised that RIMCo’s goal is to construct and manage diversified portfolios in a risk-aware manner. Each Money Manager for an Underlying Fund in effect performs the function of an individual portfolio manager who is responsible for selecting portfolio securities for the portion of the Underlying Fund assigned to it by RIMCo (each, a “segment”) in accordance with the Underlying Fund’s applicable investment objective, policies and restrictions, any constraints placed by RIMCo upon their selection of portfolio securities and the Money Manager’s specified role in an Underlying Fund. RIMCo is responsible for communicating performance expectations to each Money Manager; supervising compliance by each Money Manager with each Underlying Fund’s investment objective and policies; authorizing Money Managers to engage in certain investment strategies for an Underlying Fund; and recommending annually to the Board whether portfolio management contracts should be renewed, modified or terminated. In addition to its annual recommendation as to the renewal, modification or termination of portfolio management contracts, RIMCo is responsible for recommending to the Board additions of new Money Managers or replacements of existing Money Managers at any time when, based on RIMCo’s research and ongoing review
| | |
| Basis for Approval of Investment Advisory Contracts | | 51 |
Russell Investment Funds
LifePoints® Variable Target Portfolio Funds
Basis for Approval of Investment Advisory Contracts, continued (Unaudited)
and analysis, such actions are appropriate. RIMCo may impose specific investment constraints from time to time for each Money Manager intended to capitalize on the strengths of that Money Manager or to coordinate the investment activities of Money Managers for an Underlying Fund in a complementary manner. Therefore, the performance of individual Money Managers for an Underlying Fund may reflect the roles assigned to them by RIMCo in the Underlying Fund’s investment activities and any constraints placed by RIMCo upon their selection of portfolio securities. In light of the foregoing, the overall performance of each Underlying Fund over appropriate periods reflects, in great part, the performance of RIMCo in designing the Underlying Fund’s investment program, structuring an Underlying Fund, selecting an effective Money Manager with a particular investment style or sub-style for a segment that is complementary to the styles of the Money Managers of other Underlying Fund segments, and allocating assets among the Money Managers in a manner designed to achieve the objectives of the Underlying Fund.
The Board considered that the prospectuses for the Funds and the Underlying Funds and other public disclosures emphasize to investors RIMCo’s role as the principal investment manager for each Underlying Fund, rather than the investment selection role of the Underlying Funds’ Money Managers, and describe the manner in which the Funds or Underlying Funds operate so that investors may take that information into account when deciding to purchase shares of any Fund.
The Board also considered the demands and complexity of managing the Underlying Funds pursuant to the manager-of-managers structure, the special expertise of RIMCo with respect to the manager-of-managers structure of the Underlying Funds and the likelihood that, at the current expense ratio of each Underlying Fund, there would be no acceptable alternative investment managers to replace RIMCo on comparable terms given the need to continue the manager-of-managers strategy of such Underlying Fund selected by shareholders in purchasing their shares of a Fund or Underlying Fund.
In addition to these general factors relating to the manager-of-managers structure of the Underlying Funds, the Trustees considered, with respect to each Fund and Underlying Fund, various specific factors in evaluating renewal of the RIMCo Agreement, including the following:
| 1. | The nature, scope and quality of the services provided, and expected to be provided, to the Fund or the Underlying Fund by RIMCo; |
| 2. | The advisory fee paid by the Fund or the Underlying Fund to RIMCo (the “Advisory Fee”) and the fact that it encompasses all investment advisory fees paid by the Fund or Underlying Fund, including the fees for any Money Managers of such Underlying Fund; |
| 3. | Information provided by RIMCo as to other fees and benefits received by RIMCo or its affiliates from the Fund or Underlying Fund, including any administrative, transfer agent or cash management fees and fees received for management of securities lending cash collateral, soft dollar arrangements and commissions in connection with portfolio securities transactions; |
| 4. | Information provided by RIMCo as to expenses incurred by the Fund or the Underlying Fund; and |
| 5. | Information provided by RIMCo as to the profits that RIMCo derives from its mutual fund operations generally and from the Fund or Underlying Fund. |
In evaluating the nature, quality and scope of services provided and which are expected to be provided to the Funds, including Fund portfolio management services, the Board considered the possible impact of changes in RIMCo’s senior management during the course of 2008 and 2009 and a restructuring of the Russell organization, which was announced to the Board in January 2009 and detailed to the Board on April 15, 2009, and included a significant reduction in Russell’s workforce. Prior to the Independent Trustees’ private meeting on April 20 and at the April 21 meeting of the Board of Trustees, senior representatives of Russell and RIMCo discussed this organizational restructuring with the Board and assured the Board that the restructuring would not result in a diminution of the nature, quality or scope of the services provided to the Funds or Underlying Funds. The Board also discussed with these representatives the impact of developments over the past year in the financial services industry upon the financial resources available to the Russell organization.
As noted above, RIMCo, pursuant to the terms of the RIMCo Agreement, directly managed during the past year, and continues to manage, a portion — up to 10% — of the assets of each of the RIF Multi-Style Equity Fund and the Russell Investment Company Quantitative Equity Fund (each a “Participating Underlying Fund”) during the past year, utilizing a select holdings strategy, the actual allocation being determined by each Participating Underlying Fund’s RIMCo portfolio manager. The select holdings strategy utilized by RIMCo in managing such assets for a Participating Underlying Fund is designed to increase the Participating Underlying Fund’s exposure to stocks that are viewed as attractive by multiple Money Managers of that Participating Underlying Fund. The Board reviewed the results of the select holdings strategy in respect of each Participating Underlying Fund during the past year. With respect to each Participating Underlying Fund, the Trustees considered that RIMCo is not required to pay investment advisory fees to a Money Manager with respect to assets for which the select holdings strategy is utilized and that the profits derived by RIMCo generally and from the Participating Underlying Fund consequently may increase incrementally. The Board, however, also
| | |
| 52 | | Basis for Approval of Investment Advisory Contracts |
Russell Investment Funds
LifePoints® Variable Target Portfolio Funds
Basis for Approval of Investment Advisory Contracts, continued (Unaudited)
considered RIMCo’s advice that it pays certain Money Managers additional fees for providing information and other services in connection with the select holdings strategy and incurs additional costs in carrying out the select holdings strategy, the limited amount of assets that are managed directly by RIMCo pursuant to the select holdings strategy, and the fact that the aggregate investment advisory fees paid by the Participating Underlying Fund are not increased as a result of the select holdings strategy.
In evaluating the reasonableness of the Funds’ and Underlying Funds’ Advisory Fees in light of Fund and Underlying Fund performance, the Board considered that, in the Agreement Renewal Information and at past meetings, RIMCo noted differences between the investment strategies of certain Underlying Funds and their respective Comparable Funds in pursuing their investment objectives, including fund strategies which seek to achieve a lower tracking error (i.e., the difference, whether positive or negative, between the return of a fund and its benchmark) and resulting lower return volatility than their Comparable Funds. According to RIMCo, these strategies may be expected to result, and for certain Underlying Funds during the periods covered by the Third-Party Information did result, in lower performance of the Underlying Funds than that of some of their respective Comparable Funds. According to RIMCo, the strategies pursued by the Underlying Funds, among other things, are intended to result in less volatile, more moderate returns relative to each Underlying Fund’s performance benchmark rather than more volatile, more extreme returns that its Comparable Funds may experience over time.
In discussing the Advisory Fees for the Underlying Funds generally, RIMCo noted, among other things, that its Advisory Fees for Underlying Funds encompass services that may not be provided by investment advisers to the Underlying Funds’ Comparable Funds, such as cash equitization and management of portfolio transition costs when Money Managers are added, terminated or replaced. RIMCo also explained that its “margins” in providing investment advisory services to the Underlying Funds tend to be lower than competitors’ margins because of the demands and complexities of managing the Underlying Funds’ manager-of-managers structure, including RIMCo’s payment of a significant portion of the Underlying Funds’ Advisory Fees to their Money Managers.
The Board considered for each Fund and Underlying Fund whether economies of scale have been realized and whether the Advisory Fees for such Fund or Underlying Fund appropriately reflect or should be revised to reflect any such economies. During 2008, the Board noted that, generally, there was a reduction in the assets of the Funds and Underlying Funds as a result of market declines and related investor redemptions. The Board determined that, after giving effect to any applicable fee or expense caps, waivers or reimbursements, the Advisory Fees for each Fund or Underlying Fund appropriately reflect any economies of scale realized by such Fund, based upon any decline in assets during 2008 and such factors as the variability of Money Manager investment advisory fees and other factors associated with the manager-of-managers structure employed by the Underlying Funds.
The Board considered, as a general matter, that fees payable to RIMCo by institutional clients with investment objectives similar to those of certain Funds and other funds under the Board’s supervision, including the Underlying Funds, are lower, and may, in some cases, be substantially lower, than the rates paid by the funds supervised by the Board, including the Funds and Underlying Funds. The Trustees considered the differences in the scope of services RIMCo provides to institutional clients and the funds under its supervision, including the Funds and Underlying Funds. In response to the Trustees’ inquiries, RIMCo, as it has in the past, noted, among other things, that institutional clients have fewer administrative needs than the Funds. RIMCo also noted that since the Funds must constantly issue and redeem their shares, they are more difficult to manage than institutional accounts, where assets are relatively stable. In addition, RIMCo noted that the Funds and Underlying Funds are subject to heightened regulatory requirements relative to institutional clients. Accordingly, the Trustees did not regard these fee differences as relevant to their deliberations.
On the basis of the Agreement Renewal Information, and other information previously received by the Board from RIMCo during the course of the current year or prior years, or presented at or in connection with the April 21 Board meeting by RIMCo, the Board, in respect of each Fund and Underlying Fund, found, after giving effect to any applicable waivers and/or reimbursements and considering differences in the composition and investment strategies of their respective Comparable Funds (1) the Advisory Fees charged by RIMCo to be reasonable in light of the nature, scope and quality of the services provided, and expected to be provided, to the Funds or Underlying Funds; (2) the relative expense ratio of each Fund and Underlying Fund was comparable to those of its Comparable Funds; (3) RIMCo’s methodology of allocating expenses of operating funds in the complex was reasonable; and (4) RIMCo’s profitability with respect to the Funds and each Underlying Fund was not excessive in light of the nature, scope and quality of the services provided by RIMCo.
In evaluating the performance of the Funds and Underlying Funds generally relative to their Comparable Funds, the Board also noted RIMCo’s advice that many of the Underlying Funds’ Comparable Funds do not “equitize” their cash (i.e., cash awaiting investment or disbursement to satisfy redemptions or other fund obligations) and may hold large positions uninvested in their investment portfolios. By contrast, the Underlying Funds generally follow a strategy of equitizing their cash and fully investing their assets in pursuit of their investment objectives (the Underlying Funds’ strategy of equitizing cash and fully investing their assets is hereinafter referred to as their “full investment strategy”). RIMCo noted that the Underlying Funds’ full investment strategy generally will detract from their relative performance, and therefore the relative performance of the Funds, in a declining market, such as 2008, but may enhance relative performance in a rising market.
| | |
| Basis for Approval of Investment Advisory Contracts | | 53 |
Russell Investment Funds
LifePoints® Variable Target Portfolio Funds
Basis for Approval of Investment Advisory Contracts, continued (Unaudited)
The Board further concluded that, under the circumstances, the performance of each of the Funds supported continuation of the RIMCo Agreement. In evaluating performance, the Board considered each Fund’s and Underlying Fund’s absolute performance and its performance relative to appropriate benchmarks and indices in addition to its performance relative to its Comparable Funds. In assessing performance, the Board also considered RIMCo’s investment strategy of managing the Underlying Funds in a risk-aware manner and the extraordinary capital market conditions during 2008. The Board noted that each of the Funds had been in existence for less than three years.
With respect to the RIF LifePoints Balanced Strategy Fund and the RIF LifePoints Growth Strategy Fund, the Third-Party Information showed that each such Fund’s performance was ranked in the fourth quintile for the 1-year period ended December 31, 2008. The Board considered RIMCo’s advice that certain Funds’ relative performance was driven to an extent by the underperformance of the underlying Core Bond Fund and that funds with the highest allocation to fixed income were impacted most by the Core Bond Fund’s underperformance.
After considering the foregoing and other relevant factors and given the limited performance record of the Funds, including the RIF LifePoints Balanced Strategy and Growth Strategy Funds, the Board concluded for the reasons discussed herein that continuation of the RIMCo Agreement on its current terms and conditions would be in the best interests of the Funds and their respective shareholders and voted to approve the continuation of the RIMCo Agreement.
At the April 21 Board meeting, with respect to the evaluation of the terms of portfolio management contracts with Money Managers for the Underlying Funds, the Board received and considered information from RIMCo reporting, among other things, for each Money Manager, the Money Manager’s performance over various periods; RIMCo’s assessment of the performance of each Money Manager; any significant business relationships between the Money Manager and RIMCo or Russell Financial Services, Inc., the Funds’ and Underlying Funds’ underwriter; and RIMCo’s recommendation to retain the Money Manager at the current fee rate, to retain the Money Manager at a reduced fee rate or to terminate the Money Manager. The Board received reports during the course of the year from the Funds’ Chief Compliance Officer regarding each Money Manager’s compliance program. RIMCo recommended that each Money Manager be retained at its current fee rate. RIMCo has advised the Board that it does not regard Money Manager profitability as relevant to its evaluation of the portfolio management contracts with Money Managers because the willingness of Money Managers to serve in such capacity depends upon arm’s-length negotiations with RIMCo; RIMCo is aware of the fees charged by Money Managers to other clients; and RIMCo believes that the fees agreed upon with Money Managers are reasonable in light of the anticipated quality of investment advisory services to be rendered. The Board accepted RIMCo’s explanation in light of the Board’s findings as to the reasonableness of the Advisory Fee paid by each Fund and Underlying Fund and the fact that each Money Manager’s fee is paid by RIMCo.
Based substantially upon RIMCo’s recommendations, together with the information received from RIMCo in support of its recommendations at the April 21 Board meeting, the Board concluded that the fees paid to the Money Managers of each Underlying Fund are reasonable in light of the quality of the investment advisory services provided and that continuation of the portfolio management contract with each Money Manager of each Underlying Fund would be in the best interests of such Underlying Fund and its shareholders.
In their deliberations, the Trustees did not identify any particular information as to the RIMCo Agreement or, other than RIMCo’s recommendation, the portfolio management contract with any Money Manager for an Underlying Fund that was all-important or controlling and each Trustee attributed different weights to the various factors considered. The Trustees evaluated all information available to them on a Fund-by-Fund basis and their determinations were made in respect of each Fund and Underlying Fund.
Subsequently, the Board of Trustees received the following proposals from RIMCo at a meeting held on August 25, 2009: (1) to effect a money manager change for the Non-U.S. Fund, the Real Estate Securities Fund, the Multi-Style Equity Fund, the Russell U.S. Quantitative Equity Fund and the Russell Global Equity Fund and (2) to effect a money manager change for the Russell Emerging Markets Fund resulting from a change of control of one of the Fund’s Money Managers. In the case of each such proposed change, the Trustees approved the terms of the proposed portfolio management contract based substantially upon RIMCo’s recommendation to hire the Money Manager at the proposed fee rate; any significant business relationships between the Money Manager and RIMCo or Russell Financial Services, Inc. the Fund’s underwriter; RIMCo’s explanation as to the lack of relevance of profitability to the evaluation of portfolio management contracts with money managers because the willingness of Money Managers to serve in such capacity depends upon arm’s-length negotiations with RIMCo; RIMCo’s awareness of the fees charged by the Money Manager to other clients; and RIMCo’s belief that the proposed investment advisory fees would be reasonable in light of the anticipated quality of investment advisory services to be rendered. The Trustees also considered their findings at their April 21, 2009 meeting as to the reasonableness of the aggregate investment advisory fees paid by the Fund, and the fact that the aggregate investment advisory fees paid by the Fund would not increase as a result of the implementation of the proposed money manager change because the money managers’ investment advisory fee is paid by RIMCo.
| | |
| 54 | | Basis for Approval of Investment Advisory Contracts |
Russell Investment Funds
LifePoints® Funds Variable Target Portfolio Series
Shareholder Requests for Additional Information — December 31, 2009 (Unaudited)
A complete unaudited schedule of investments is made available generally no later than 60 days after the end of the first and third quarters of each year. These reports are available (i) free of charge, upon request, by calling the Funds at (800) 787-7354, (ii) on the Securities and Exchange Commission’s website at www.sec.gov, and (iii) at the Securities and Exchange Commission’s public reference room.
The Board has delegated to RIMCo, as RIF’s investment adviser, the primary responsibility for monitoring, evaluating and voting proxies solicited by or with respect to issuers of securities in which assets of the Funds may be invested. RIMCo has established a proxy voting committee (“Committee”) and has adopted written proxy voting policies and procedures (“P&P”) and proxy voting guidelines (“Guidelines”). The Funds maintain a Portfolio Holdings Disclosure Policy that governs the timing and circumstances of disclosure to shareholders and third parties of information regarding the portfolio investments held by the Funds. A description of the P&P, Guidelines, Portfolio Holdings Disclosure Policy and additional information about Fund Trustees are contained in the Funds’ Statement of Additional Information (“SAI”). The SAI is available (i) free of charge, upon request, by calling the Funds at (800) 787-7354, and (ii) on the Securities and Exchange Commission’s website at www.sec.gov.
Financial Statements of the Underlying Funds can be obtained at no charge by calling the Funds at (800) 787-7354.
If possible, depending on contract owner registration and address information, and unless you have otherwise opted out, only one copy of the RIF prospectus and each annual and semi-annual report will be sent to contract owners at the same address. If you would like to receive a separate copy of these documents, please contact your Insurance Company. If you currently receive multiple copies of the prospectus, annual report and semi-annual report and would like to request to receive a single copy of these documents in the future, please call your Insurance Company.
Some Insurance Companies may offer electronic delivery of the Funds’ prospectus and annual and semiannual reports. Please contact your Insurance Company for further details.
| | |
| Shareholder Requests for Additional Information | | 55 |
Russell Investment Funds
LifePoints® Funds Variable Target Portfolio Series
Disclosure of Information about Fund Trustees and Officers — December 31, 2009
(Unaudited)
The following tables provide information for each officer and Trustee of the Russell Fund Complex. The Russell Fund Complex consists of RIC, which has 37 funds, and RIF, which has nine funds. Each of the Trustees is a Trustee of both RIC and RIF. The first table provides information for the interested Trustee. The second table provides information for the independent Trustees. The third table provides information for the Trustees emeritus. The fourth table provides information for the officers.
| | | | | | | | | | |
Name,
Age,
Address | | Position(s) Held
With Fund and
Length of
Time Served | | Term
of
Office* | | Principal Occupation(s)
During the
Past 5 Years | | No. of
Portfolios
in Russell
Fund
Complex
Overseen
by Trustee | | Other
Directorships Held
by Trustee |
INTERESTED TRUSTEE |
# Greg J. Stark Born May 3, 1968 909 A Street Tacoma, Washington 98402-1616 | | President and Chief Executive Officer from 2004–January 22, 2010* Trustee since 2007 | | Appointed until successor is duly elected and qualified Until successor is chosen and qualified by Trustees | | •President and CEO RIC and RIF •Chairman of the Board, President and CEO, RIMCo •Chairman of the Board, President and CEO, Russell Fund Services Company (“RFSC”) •Chairman of the Board, President and CEO, Russell Financial Services, Inc. •Chairman of the Board and President, Russell Insurance Agency, Inc. (insurance agency (“RIA”)) •Until 2004, Managing Director, of Individual Investor Services, FRC •2000 to 2004 Managing Director, Sales and Client Service, RIMCo | | 46 | | None |
| | | | | | | | | | | |
# Sandra Cavanaugh Born May 10, 1954 909 A Street Tacoma, Washington 98402-1616 | | President and Chief Executive Officer since 2010 Trustee since 2010 | | Appointed until successor is duly elected and qualified Until successor is chosen and qualified by Trustees | | •President and CEO RIC and RIF •May 2009 to December 2009, Executive Vice President, Retail Channel, SunTrust Bank •2007 to January 2009, Senior Vice President, National Sales — Retail Distribution, JPMorgan Chase/Washington Mutual, Inc. •1997 to 2007, President — WM Funds Distributor & Shareholder Services/WM Financial Services | | 46 | | None |
| # | Mr. Stark is also an officer and/or director of one or more affiliates of RIC and RIF and is therefore an Interested Trustee. |
| # | Ms. Cavanaugh is also an officer and/or director of one or more affiliates of RIC and RIF and is therefore an Interested Trustee. |
| * | Effective January 22, 2010, Greg J. Stark resigned as President and Chief Executive Officer of RIC and RIF. Mr. Stark’s successor is Sandra Cavanaugh. |
| | |
| 56 | | Disclosure of Information about Fund Trustees and Officers |
Russell Investment Funds
LifePoints® Funds Variable Target Portfolio Series
Disclosure of Information about Fund Trustees and Officers, continued — December 31, 2009 (Unaudited)
| | | | | | | | | | |
Name,
Age,
Address | | Position(s) Held
With Fund and
Length of
Time Served | | Term
of
Office* | | Principal Occupation(s)
During the
Past 5 Years | | No. of
Portfolios
in Russell
Fund
Complex
Overseen
by Trustee | | Other
Directorships Held
by Trustee |
INDEPENDENT TRUSTEES |
Thaddas L. Alston Born April 7, 1945 909 A Street Tacoma, Washington 98402-1616 | | Trustee since 2006 | | Appointed until successor is duly elected and qualified | | •Senior Vice President, Larco Investments, Ltd. (real estate firm) | | 46 | | None |
| | | | | | | | | | | |
Kristianne Blake, Born January 22, 1954 909 A Street Tacoma, Washington 98402-1616 | | Trustee since 2000 Chairman since 2005 | | Appointed until successor is duly elected and qualified Annual | | •Director and Chairman of the Audit Committee, Avista Corp. •Trustee and Chairman of the Operations Committee, Principal Investor Funds and Principal Variable Contracts Funds •Regent, University of Washington •President, Kristianne Gates Blake, P.S. (accounting services) •February 2002 to June 2005, Chairman of the Audit Committee, RIC and RIF •Trustee and Chairman of the Operations and Distribution Committee, WM Group of Funds, 1999–2006 | | 46 | | •Director, Avista Corp (electric utilities) •Trustee, Principal Investor Funds (investment company); •Trustee, Principal Variable Contracts Funds (investment company) |
| | | | | | | | | | |
| | | | | | | | | | | |
Daniel P. Connealy Born June 6, 1946 909 A Street Tacoma, Washington 98402-1616 | | Trustee since 2003 Chairman of the Audit Committee since 2005 | | Appointed until successor is duly elected and qualified Appointed until successor is duly elected and qualified | | •June 2004 to present, Senior Vice President and Chief Financial Officer, Waddell & Reed Financial, Inc. | | 46 | | None |
Jonathan Fine, Born July 8, 1954 909 A Street Tacoma, Washington 98402-1616 | | Trustee since 2004 | | Appointed until successor is duly elected and qualified | | •President and Chief Executive Officer, United Way of King County, WA | | 46 | | None |
Raymond P. Tennison, Jr. Born December 21, 1955 909 A Street Tacoma, Washington 98402-1616 | | Trustee since 2000 Chairman of the Nominating and Governance Committee since 2007 | | Appointed until successor is duly elected and qualified Appointed until successor is duly elected and qualified | | •President, Simpson Investment Company and several additional subsidiary companies, including Simpson Timber Company, Simpson Paper Company and Simpson Tacoma Kraft Company | | 46 | | None |
| | |
| Disclosure of Information about Fund Trustees and Officers | | 57 |
Russell Investment Funds
LifePoints® Funds Variable Target Portfolio Series
Disclosure of Information about Fund Trustees and Officers, continued — December 31, 2009 (Unaudited)
| | | | | | | | | | |
Name,
Age,
Address | | Position(s) Held
With Fund and
Length of
Time Served | | Term
of
Office* | | Principal Occupation(s)
During the
Past 5 Years | | No. of
Portfolios
in Russell
Fund
Complex
Overseen
by Trustee | | Other
Directorships Held
by Trustee |
INDEPENDENT TRUSTEES (continued) |
Jack R. Thompson, Born March 21, 1949 909 A Street Tacoma, Washington 98402-1616 | | Trustee since 2005 | | Appointed until successor is duly elected and qualified | | •September 2003 to present, Independent Board Chair and Chairman of the Audit Committee, Sparx Asia Funds •September 2007 to present, Director, Board Chairman and Chairman of the Audit Committee, LifeVantage Corporation (health products company) | | 46 | | •Director, Sparx Asia Funds (investment company) •Director, Board Chairman and Chairman of the Audit Committee, LifeVantage Corporation (health products company) |
Julie W. Weston, Born October 2, 1943 909 A Street Tacoma, Washington 98402-1616 | | Trustee since 2002 Chairperson of the Investment Committee since 2006 | | Appointed until successor is duly elected and qualified Appointed until successor is duly elected and qualified | | Retired | | 46 | | None |
| * | Each Trustee is subject to mandatory retirement at age 72. |
| | |
| 58 | | Disclosure of Information about Fund Trustees and Officers |
Russell Investment Funds
LifePoints® Funds Variable Target Portfolio Series
Disclosure of Information about Fund Trustees and Officers, continued — December 31, 2009 (Unaudited)
| | | | | | | | | | |
Name,
Age,
Address | | Position(s) Held
With Fund and
Length of
Time Served | | Term
of
Office | | Principal Occupation(s)
During the
Past 5 Years | | No. of
Portfolios
in Russell
Fund
Complex
Overseen
by Trustee | | Other
Directorships Held
by Trustee |
TRUSTEES EMERITUS | | | | | | | | | | |
* George F. Russell, Jr., Born July 3, 1932 909 A Street Tacoma, Washington 98402-1616 | | Trustee Emeritus and Chairman Emeritus since 1999 | | Until resignation or removal | | •Director Emeritus, Frank Russell Company (investment consultant to institutional investors (“FRC”)) and RIMCo •Chairman Emeritus, RIC and RIF; Russell Implementation Services Inc. (broker-dealer and investment adviser (“RIS”)); Russell 20-20 Association (non-profit corporation); and Russell Trust Company (non-depository trust company (“RTC”)) •Chairman, Sunshine Management Services, LLC (investment adviser) | | 46 | | None |
| | | | | | | | | | | |
Paul E. Anderson, Born October 15, 1931 909 A Street Tacoma, Washington 98402-1616 | | Trustee Emeritus since 2007 | | Five year term | | •President, Anderson Management Group LLC (private investments consulting) •Trustee, RIC and RIF until 2006 •February 2002 to June 2005, Lead Trustee, RIC and RIF •Chairman of the Nominating and Governance Committee, 2006 | | 46 | | None |
| | | | | | | | | | | |
Lee C. Gingrich, Born October 6, 1930 909 A Street Tacoma, Washington 98402-1616 | | Trustee Emeritus since 2006 | | Five year term | | •Retired since 1995 •Trustee of RIC and RIF until 2005 •Chairman of the Nominating and Governance Committee 2001–2005 | | 46 | | None |
| * | Mr. Russell is also a director emeritus of one or more affiliates of RIC and RIF. |
| | |
| Disclosure of Information about Fund Trustees and Officers | | 59 |
Russell Investment Funds
LifePoints® Funds Variable Target Portfolio Series
Disclosure of Information about Fund Trustees and Officers, continued — December 31, 2009 (Unaudited)
| | | | | | |
Name,
Age,
Address | | Position(s) Held
With Fund and
Length of
Time Served | | Term
of
Office | | Principal Occupation(s)
During the
Past 5 Years |
OFFICERS | | | | | | |
Cheryl Wichers Born December 16, 1966 909 A Street Tacoma, Washington 98402-1616 | | Chief Compliance Officer since 2005 | | Until removed by Independent Trustees | | •Chief Compliance Officer, RIC •Chief Compliance Officer, RIF •Chief Compliance Officer, RIMCo •Chief Compliance Officer, RFSC •April 2002–May 2005, Manager, Global Regulatory Policy |
| | | | | | | |
Greg J. Stark, Born May 3, 1968 909 A Street Tacoma, Washington 98402-1616 | | President and Chief Executive Officer from 2004–January 22, 2010 | | Until successor is chosen and qualified by Trustees | | •President and CEO, RIC and RIF •Chairman of the Board, President and CEO, RIMCo •Chairman of the Board, President and CEO, Russell Financial Services, Inc. •Chairman of the Board, President and CEO, RFSC •Chairman of the Board and President, Russell Insurance Agency, Inc. (insurance agency (“RIA”)) •Until 2004, Managing Director of Individual Investor Services, FRC •2000 to 2004, Managing Director, Sales and Client Service, RIMCo |
| | | | | | | |
Sandra Cavanaugh Born May 10, 1954 909 A Street Tacoma, Washington 98402-1616 | | President and Chief Executive Officer since 2010 | | Appointed until successor is duly elected and qualified | | •President and CEO RIC and RIF •May 2009 to December 2009, Executive Vice President, Retail Channel, SunTrust Bank •2007 to January 2009, Senior Vice President, National Sales — Retail Distribution, JPMorgan Chase/Washington Mutual, Inc. •1997 to 2007, President — WM Funds Distributor & Shareholder Services/WM Financial Services |
| | | | | | | |
Mark E. Swanson, Born November 26, 1963 909 A Street Tacoma, Washington 98402-1616 | | Treasurer and Chief Accounting Officer since 1998 | | Until successor is chosen and qualified by Trustees | | •Treasurer, Chief Accounting Officer and CFO, RIC and RIF •Director, Funds Administration, RIMCo, RFSC, RTC and Russell Financial Services, Inc. •Treasurer and Principal Accounting Officer, SSgA Funds |
| | | | | | | |
Peter Gunning, Born February 22, 1967 909 A Street Tacoma, Washington 98402-1616 | | Chief Investment Officer since 2008 | | Until removed by Trustees | | •Chief Investment Officer, RIC and RIF •Director, RIMCo and FRC •1996 to 2008 Chief Investment Officer, Russell, Asia Pacific |
| | | | | | | |
Gregory J. Lyons, Born August 24, 1960 909 A Street Tacoma, Washington 98402-1616 | | Secretary since 2007 | | Until successor is chosen and qualified by Trustees | | •U.S. General Counsel and Assistant Secretary, FRC •Director and Assistant Secretary, RIA •Secretary, RIMCo, RFSC and Russell Financial Services, Inc. •Secretary and Chief Legal Counsel, RIC and RIF |
| | |
| 60 | | Disclosure of Information about Fund Trustees and Officers |
Russell Investment Funds
LifePoints® Funds Variable Target Portfolio Series
909 A Street, Tacoma, Washington 98402
(800) 787-7354
Interested Trustee
Greg J. Stark
Sandra Cavanaugh
Independent Trustees
Thaddas L. Alston
Kristianne Blake
Daniel P. Connealy
Jonathan Fine
Raymond P. Tennison, Jr.
Jack R. Thompson
Julie W. Weston
Trustees Emeritus
George F. Russell, Jr.
Paul E. Anderson
Lee C. Gingrich
Officers
Greg J. Stark, President and Chief Executive Officer
Sandra Cavanaugh, President and Chief Executive Officer
Cheryl Wichers, Chief Compliance Officer
Peter Gunning, Chief Investment Officer
Mark E. Swanson, Treasurer and Chief Accounting Officer
Gregory J. Lyons, Secretary
Adviser
Russell Investment Management Company
909 A Street
Tacoma, WA 98402
Administrator and Transfer and Dividend Disbursing Agent
Russell Fund Services Company
909 A Street
Tacoma, WA 98402
Custodian
State Street Bank and Trust Company
Josiah Quincy Building
200 Newport Avenue
North Quincy, MA 02171
Office of Shareholder Inquiries
909 A Street
Tacoma, WA 98402
(800) 787-7354
Legal Counsel
Dechert LLP
200 Clarendon Street, 27th Floor
Boston, MA 02116-5021
Distributor
Russell Financial Services, Inc.
909 A Street
Tacoma, WA 98402
Independent Registered Public Accounting Firm
PricewaterhouseCoopers LLP
1420 5th Avenue
Suite 1900
Seattle, WA 98101
Money Managers of Underlying Funds as of December 31, 2009
RIF Core Bond Fund
Goldman Sachs Asset Management, L.P., New York, NY
Metropolitan West Asset Management, LLC, Los Angeles, CA
Pacific Investment Management Company LLC, Newport Beach, CA
RIF Aggressive Equity Fund
ClariVest Asset Management LLC, San Diego, CA
DePrince, Race & Zollo, Inc., Winter Park, FL
Jacobs Levy Equity Management, Inc., Florham Park, NJ
Ranger Investment Management, L.P., Dallas, TX
Signia Capital Management, LLC, Spokane, WA
Tygh Capital Management, Inc., Portland, OR
RIF Multi-Style Equity Fund
First Eagle Investment Management, LLC, New York, NY
BlackRock Capital Management, Inc., New York, NY
Columbus Circle Investors, Stamford, CT
DePrince, Race & Zollo, Inc., Winter Park, FL
Institutional Capital LLC, Chicago, IL
Jacobs Levy Equity Management, Inc., Florham Park, NJ
Montag & Caldwell, Inc., Atlanta, GA
Suffolk Capital Management, LLC, New York, NY
RIF Real Estate Securities Fund
AEW Capital Management, L.P., Boston, MA
Cohen & Steers Capital Management, Inc., New York, NY
Heitman Real Estate Securities LLC, Chicago, IL
INVESCO Institutional (N.A.), Inc. which acts as a money manager to the Fund through its INVESCO Real Estate Division, Dallas, TX
RIC Russell U.S. Quantitative Equity Fund
Aronson+Johnson+Ortiz, LP, Philadelphia, PA
Goldman Sachs Asset Management, L.P., New York, NY
INTECH Investment Management LLC, West Palm Beach, FL
Jacobs Levy Equity Management, Inc., Florham Park, NJ
Numeric Investors, LLC, Boston, MA
RIF Non-U.S. Fund
Barrow, Hanley, Mewhinney & Strauss, LLC, Dallas, TX
Marsico Capital Management, LLC, Denver, CO
MFS Institutional Advisors, Inc., Boston, MA
Pzena Investment Management, LLC, New York, NY
RIC Russell Emerging Markets Fund
AllianceBernstein L.P., New York, NY
Arrowstreet Capital, Limited Partnership, Boston, MA
Genesis Asset Managers, LLP, London, United Kingdom
Harding Loevner LLC, Somerville, NJ
T. Rowe Price International, Inc., Baltimore, MD
UBS Global Asset Management (Americas) Inc., Chicago, IL
RIC Russell Global Equity Fund
Gartmore Global Partners, London, United Kingdom
Harris Associates, L.P., Chicago, IL
MFS Institutional Advisors, Inc., Boston, MA
Tradewinds Global Investors, LLC, Los Angeles, CA
T. Rowe Price International, Inc., Baltimore, MD
This report is prepared from the books and records of the Funds and is submitted for the general information of shareholders and is not authorized for distribution to prospective investors unless accompanied or preceded by an effective Prospectus. Nothing herein contained is to be considered an offer of sale or a solicitation of an offer to buy shares of Russell Investment Funds. Such offering is made only by Prospectus, which includes details as to offering price and other material information.
| | |
| Adviser, Money Managers and Service Providers | | 61 |
| | | | |
| Russell Investment Funds | | 909 A Street | | 800-787-7354 |
| | Tacoma, Washington 98402 | | Fax: 253-591-3495 |
| | | | www.russell.com |


36-08-195
| (a) | As of the end of the period covered by the report, the registrant has adopted a code of ethics that applies to the registrant’s principal executive officer and principal financial officer (“Code”). |
| (b) | That Code comprises written standards that are reasonably designed to deter wrongdoing and to promote: |
| | 1) | honest and ethical conduct, including the ethical handling of actual or apparent conflicts of interest between personal and professional relationships; |
| | 2) | full, fair, accurate, timely and understandable disclosure in reports and documents that a registrant files with, or submits to, the Securities and Exchange Commission (“SEC”) and in other public communications made by each Mutual Fund; |
| | 3) | compliance with applicable laws and governmental rules and regulations; |
| | 4) | the prompt internal reporting to an appropriate person or persons identified in the Code of violations of the Code; and |
| | 5) | accountability for adherence to the Code. |
| (c) | The Code was restated as of December 6, 2004; the restatement did not involve any material change. |
| (d) | As of the end of the period covered by the report, there have been no waivers granted from a provision of the Code that applies to the registrant’s principal executive officer and principal financial officer. |
| (f) | The registrant has filed with the SEC, pursuant to Item 12(a)(1), a copy of the Code that applies to the registrant’s principal executive officer, principal financial officer, principal accounting officer or controller, or persons performing similar functions, as an exhibit to its annual report on this Form N-CSR. |
| Item 3. | Audit Committee Financial Expert. |
Registrant’s board of trustees has determined at a meeting held on February 23, 2005, that the Registrant has at least one audit committee financial expert serving on its audit committee. Daniel P. Connealy was determined to be the Audit Committee Financial Expert and is also determined to be “independent” for purposes of Item 3, paragraph (a)(2)(i) and (ii) of Form N-CSR.
| Item 4. | Principal Accountant Fees and Services. |
Audit Fees
(a) The aggregate fees billed for each of the last two fiscal years for professional services rendered by the principal accountant for the audit of the registrant’s annual financial statements or services that are normally provided by the accountant in connection with statutory and regulatory filings or engagements for those fiscal years were as follows:
| | | |
2008 | | $ | 236,130 |
2009 | | $ | 176,780 |
Audit-Related Fees
(b) The aggregate fees billed in each of the last two fiscal years for assurance and related services by the principal accountant that are reasonably related to the performance of the audit of the registrant’s financial statements and are not reported under paragraph (a) of this Item and the nature of the services comprising those fees were as follows:
| | |
Fees | | Nature of Services |
| 2008 $2,305 | | Performance of agreed-upon procedures with respect to 06/30/08 semi-annual reports |
| 2009 $63,100 | | Performance of agreed-upon procedures with respect to 06/30/09 semi-annual reports |
Tax Fees
(c) The aggregate fees billed in each of the last two fiscal years for professional services rendered by the principal accountant for tax compliance, tax advice, and tax planning and the nature of the services comprising the fees were as follows:
| | |
Fees | | Nature of Services |
2008 $66,440 | | Tax services |
2009 $66,440 | | Tax services |
All Other Fees
(d) The aggregate fees billed in each of the last two fiscal years for products and services provided by the principal accountant, other than the services reported in paragraphs (a) through (c) of this Item and the nature of the services comprising those fees were as follows:
| | |
Fees | | Nature of Services |
2008 $892 | | Anti-money laundering, overhead/travel |
2009 $878 | | Overhead/travel |
(e) (1) Registrant’s audit committee has adopted the following pre-approval policies and procedures for certain services provided by Registrant’s accountants:
Russell Investment Company
Russell Investment Funds
Audit and Non-Audit Services Pre-Approval Policy
Effective Date: May 19, 2003
As amended through November 14, 2005
I. Statement of Purpose.
This Policy has been adopted by the Audit Committee (the “RIC Audit Committee”) of the Board of Trustees of Russell Investment Company (“RIC”) and the Audit Committee (the “RIF Audit Committee”) of the Russell Investment Funds (“RIF”) to apply to any and all engagements of the independent auditor to RIC and RIF, respectively, for audit, non-audit, tax or other services. In the case of RIC, the term “Audit Committee” as used in this policy shall refer to the RIC Audit Committee and the term “Fund” shall refer to RIC. In the case of RIF, the term “Audit Committee” as used in this Policy shall refer to the RIF Audit Committee and the term “Fund” shall refer to RIF. The term “Investment Adviser” shall refer to Russell Investment Management Company. This Policy does not delegate to management the responsibilities set forth herein for the pre-approval of services performed by the Funds’ independent auditor.
II. Statement of Principles.
Under the Sarbanes-Oxley Act of 2002 (the “Act”), the Audit Committee of the Fund’s Board of Trustees (the “Audit Committee”) is charged with responsibility for the appointment, compensation and oversight of the work of the independent auditor for the Fund. As part of these responsibilities, the Audit Committee is required to pre-approve the audit services and permissible non-audit services (“non-audit services”) performed by the independent auditor for the Fund to assure that the independence of the auditor is not in any way compromised or impaired. In determining whether an auditor is independent, there are three guiding principles under the Act that must be considered. In general, the independence of the auditor to the Fund would be deemed impaired if the auditor provides a service whereby it:
| | • | | Functions in the role of management of the Fund, the adviser of the Fund or any other affiliate* of the Fund; |
| | • | | Is in the position of auditing its own work; or |
| | • | | Serves in an advocacy role for the Fund, the adviser of the Fund or any other affiliate of the Fund. |
Accordingly, it is the policy of the Fund that the independent auditor for the Fund must not be engaged to perform any service that contravenes any of the three guidelines set forth above, or which in any way could be deemed to impair or compromise the independence of the auditor for the Fund. This Policy is designed to accomplish those requirements and will henceforth be applied to all engagements by the Fund of its independent auditor, whether for audit, audit-related, tax, or other non-audit services.
| * | For purposes of this Policy, an affiliate of the Funds is defined as the Funds’ investment adviser (but not a sub-adviser whose role is primarily portfolio management and whose activities are overseen by the principal investment adviser), and any entity controlling, controlled by, or under common control with the investment adviser that provides ongoing services to the Fund. |
Rules adopted by the United States Securities and Exchange Commission (the “SEC”) establish two distinct approaches to the pre-approval of services by the Audit Committee. The proposed services either may receive general pre-approval through adoption by the Audit Committee of a list of authorized services for the Fund, together with a budget of expected costs for those services (“general pre-approval”), or specific pre-approval by the Audit Committee of all services provided to the Fund on a case-by-case basis (“specific pre-approval”). The Audit Committee believes that the combination of these two approaches reflected in this Policy will result in an effective and efficient procedure for the pre-approval of permissible services performed by the Fund’s independent audit. The appendices to this Policy list the audit, audit-related, tax and other services that have the general pre-approval of the Audit Committee. As set forth in this Policy, unless a particular service has received general pre-approval, those services will require specific pre-approval by the Audit Committee before any such services can be provided by the independent auditor. Any proposed service to the Fund that exceeds the pre-approved budget for those services will also require specific pre-approval by the appropriate Audit Committee.
In assessing whether a particular audit or non-audit service should be approved, the Audit Committee will take into account the ratio between the total amounts paid for audit, audit-related, tax and other services, based on historical patterns at the Fund, with a view toward assuring that the level of fees paid for non-audit services as they relate to the fees paid for audit services does not compromise or impair the independence of the auditor. The Audit Committee will review the list of general pre-approved services, including the pre-approved budget for those services, at least annually and more frequently if deemed appropriate by the Audit Committee, and may implement changes thereto from time to time.
III. Delegation.
As provided in the Act and in the SEC’s rules, the Audit Committee from time to time may delegate either general or specific pre-approval authority to one or more of its members. Any member to whom such authority is delegated must report, for informational purposes only, any pre-approval decisions to the Audit Committee at its next scheduled meeting.
IV. Audit Services.
The annual audit services engagement terms and fees for the independent auditor for the Fund require specific pre-approval of the Audit Committee. Audit services include the annual financial statement audit and other procedures required to be performed by the independent auditor in order to be able to form an opinion on the financial statements for the Fund for that year. These other procedures include reviews of information systems, procedural reviews and testing performed in order to understand and rely on the Fund’s systems of internal control, and consultations relating to the audit. Audit services also include the attestation engagement for the independent auditor’s report on the report from management on financial reporting internal controls. The Audit Committee will review the audit services engagement as necessary or appropriate in the sole judgment of the Audit Committee.
In addition to the pre-approval by the Audit Committee of the annual engagement of the independent auditor to perform audit services, the Audit Committee may grant general pre-approval to other audit services, which are those services that only the independent auditor reasonably can provide. These may include statutory audits and services associated with the Fund’s SEC registration statement on Form N-1A, periodic reports and documents filed with the SEC or other documents issued in connection with the Fund’s securities offerings.
The Audit Committee has pre-approved the audit services set forth in Schedule A of the Audit and Non-Audit Pre-Approved Services. All other audit services not listed in Schedule A of the Audit and Non-Audit Pre-Approved Services must be specifically pre-approved by the Audit Committee.
V. Audit-Related Services.
Audit-related services are assurance and related services that are reasonably related to the performance of the audit or review of the financial statements for the Fund, or the separate financial statements for a series of the Fund that are traditionally performed by the independent auditor. Because the Audit Committee believes that the provision of audit-related services does not compromise or impair the independence of the auditor and is consistent with the SEC’s rules on auditor independence, the Audit Committee may grant pre-approval to audit related services. “Audit related services” include, among others, accounting consultations related to accounting, financial reporting or disclosure matters not classified as “audit services;” assistance with understanding and implementing new accounting and financial report or disclosure matters not classified as “audit services;” assistance with understanding and implementing new accounting and financial reporting guidance from rulemaking authorities; agreed upon or expanded audit procedures related to accounting and/or billing records required to respond to or comply with financial, accounting or regulatory reporting matters; and assistance with internal reporting requirements under Form N-SAR and Form N-CSR.
The Audit Committee has pre-approved the audit-related services set forth in Schedule B of the Audit and Non-Audit Pre-Approved Services. All other audit-related services not listed in Schedule B of the Audit and Non-Audit Pre-Approved Services must be specifically pre-approved by the Audit Committee.
VI. Tax Services.
The Audit Committee believes that the independent auditor can provide tax services to the Fund, such as tax compliance, tax planning and tax advice, without impairing the auditor’s independence and the SEC has stated that the independent auditor may provide such services. Consequently, the Audit Committee believes that it may grant general pre-approval to those tax services that have historically been provided by the auditor, that the Audit Committee has reviewed and believes would not impair the independence of the auditor, and that are consistent with the SEC’s rules on auditor independence. However, the Audit Committee will not permit
the retention of the independent auditor to provide tax advice in connection with any transaction recommended by the independent auditor, the sole business purpose of which may be tax avoidance and the tax treatment of which may not be supported by the United States Internal Revenue Code and related regulations or the applicable tax statutes and regulations that apply to the Funds investments outside the United States. The Audit Committees will consult with the Treasurer of the Fund or outside counsel to determine that the Fund’s tax planning and reporting positions are consistent with this policy. The Audit Committee has pre-approved the tax services set forth in Schedule C of the Audit and Non-Audit Pre-Approved Services. All other tax services not listed in Schedule C of the Audit and Non-Audit Pre-Approved Services must be specifically pre-approved by the Audit Committee.
VII. All Other Services.
The Audit Committee believes, based on the SEC’s rules prohibiting the independent auditor from providing specific non-audit services, that other types of non-audit services are permitted. Accordingly, the Audit Committee believes that it may grant general pre-approval to those permissible non-audit services classified as “all other” services that the Audit Committee believes are routine and recurring services, would not impair or compromise the independence of the auditor and are consistent with the SEC’s rules on auditor independence.
The Audit Committee has pre-approved the permissible “all other services” set forth in Schedule D of the Audit and Non-Audit Pre-Approved Services. Permissible “all other services” not listed in Schedule D of the Audit and Non-Audit Pre-Approved Services must be specifically pre-approved by the Audit Committee.
A list of the SEC’s prohibited non-audit services is attached to this Policy as Schedule E of the Audit and Non-Audit Pre-Approved Services. The SEC’s rules and relevant official interpretations and guidance should be consulted to determine the scope of these prohibited services and the applicability of any exceptions to certain of the prohibitions. Under no circumstance may an executive, manager or associate of the Fund, or the Investment Adviser, authorize the independent auditor for the Fund to provide prohibited non-audit services.
VIII. Pre-Approval Fee Levels or Budgeted Amounts.
Pre-Approval fee levels or budgeted amounts for all services to be provided by the independent auditor will be established annually by the Audit Committee and shall be subject to periodic subsequent review during the year if deemed appropriate by the Audit Committee. (Separate amounts may be specified for the Fund and for other affiliates in the investment company complex subject to pre-approval). Any proposed services exceeding these levels or amounts will require specific pre-approval by the Audit Committee. The Audit Committee will be mindful of the overall relationship of fees for audit and non-audit services in determining whether to pre-approve any such services. For each fiscal year, the Audit Committee may determine the appropriateness of the ratio between the total amount of fees for Audit, Audit-related, and Tax services for the Fund (including any Audit-related or Tax services fees for affiliates subject to pre-approval), and the total amount of fees for certain permissible non-audit services classified as “all other services” for the Fund (including any such services for affiliates subject to pre-approval by the Audit Committee).
IX. Procedures.
All requests or applications for services to be provided by the independent auditor that do not require specific pre-approval by the Audit Committee will be submitted to the “RIC/RIF Clearance Committee” (the “Clearance Committee”) (which shall be comprised of not less than three members, including the Treasurer of the Fund who shall serve as its Chairperson) and must include a detailed description of the services to be rendered and the estimated costs of those services. The Clearance Committee will determine whether such services are included within the list of services that have received general pre-approval by the Audit Committee. The Audit Committee will be informed not less frequently than quarterly by the Chairperson of the Clearance Committee of any such services rendered by the independent auditor for the Fund and the fees paid to the independent auditors for such services.
Requests or applications to provide services that require specific pre-approval by the Audit Committee will be submitted to the Audit Committee by both the independent auditor and the Clearance Committee and must include a joint certification by the engagement partner of the independent auditor and the Chairperson of the Clearing Committee that, in their view, the request or application is consistent with the SEC’s rules governing auditor independence.
The Internal Audit Department of Frank Russell Company, the parent company of RFSC, and the officers of RIC and RIF will report to the Chairman of the Audit Committee any breach of this Policy that comes to the attention of the Internal Audit Department of Frank Russell Company or an officer of RIC or RIF.
X. Additional Requirements.
The Audit Committee has determined to take additional measures on an annual basis to meet its responsibility to oversee the work performed by the independent auditor and to assure the internal auditor’s continuing independence from the Fund and its affiliates, including Frank Russell Company. Such efforts will include, but not be limited to, reviewing a written annual statement from the independent auditor delineating all relationships between the independent auditor and RIC, RIF, and Russell and its subsidiaries and affiliates, consistent with Independence Standards Board Standard No. 1, and discussing with the independent auditor its methods and procedures for ensuring its independence.
(e) (2) The percentage of services described in each of paragraphs (b) through (d) of this Item that were approved by the audit committee pursuant to paragraph (c)(7)(i)(C) of Rule 2-01 of Regulation S-X is as follows:
| | | |
Audit Fees | | 100 | % |
Audit-Related Fees | | 100 | % |
Tax Fees | | 100 | % |
All Other Fees | | 100 | % |
(f) For services, 50 percent or more of which were pre-approved, the percentage of hours expended on the principal accountant’s engagement to audit the registrant’s financial statements for the most recent fiscal year that were attributed to work performed by persons other than the principal accountant’s full-time, permanent employees was 0%.
(g) The aggregate non-audit fees billed by registrant’s accountant for services rendered to the registrant, and rendered to the registrant’s investment adviser (not including any sub-adviser whose role is primarily portfolio management and is subcontracted with or overseen by another investment adviser), and any entity controlling, controlled by, or under common control with the adviser that provides ongoing services to the registrant for each of the last two fiscal years of the registrant were as follows:
(h) The registrant’s audit committee of the board of trustees has considered whether the provision of nonaudit services that were rendered to the registrant’s investment adviser (not including any subadviser whose role is primarily portfolio management and is subcontracted with or overseen by another investment adviser), and any entity controlling, controlled by, or under common control with the investment adviser that provides ongoing services to the registrant that were not pre-approved pursuant to paragraph (c)(7)(ii) of Rule 2-01 of Regulation S-X is compatible with maintaining the principal accountant’s independence.
| Item 5. | Audit Committee of Listed Registrants. [Not Applicable] |
| Item 6. | [Schedules of Investments are included as part of the Report to Shareholders filed under Item 1 of this form] |
| Items 7-9. | [Not Applicable] |
| Item 10. | Submission of Matters to a Vote of Security Holders |
There have been no changes to the procedures by which shareholders may recommend nominees to the Registrant’s Board of Trustees that would require disclosure herein.
| Item 11. | Controls and Procedures |
(a) Registrant’s principal executive officer and principal financial officer have concluded that Registrant’s disclosure controls and procedures (as defined in Rule 30a-2(c) under the Investment Company Act of 1940 (the “Act”)) are effective, based on their evaluation of these controls and procedures as of a date within 90 days of the date this report is filed with the Securities and Exchange Commission.
(b) There were no significant changes in Registrant’s internal control over financial reporting that occurred during the period covered by this report that has materially affected or is likely to materially affect Registrant’s internal control over financial reporting.
(a) Registrant’s code of ethics described in Item 2.
(b) Certification for principal executive officer of Registrant as required by Rule 30a-2(a) under the Act and certification for principal financial officer of Registrant as required by Rule 30a-2(a) under the Act.
SIGNATURES
Pursuant to the requirements of the Securities Exchange Act of 1934 and the Investment Company Act of 1940, the Registrant has duly caused this report to be signed on its behalf by the undersigned, thereunto duly authorized.
Russell Investment Funds
| | |
| |
| By: | | /s/ SANDRA CAVANAUGH |
| | Sandra Cavanaugh |
| | Principal Executive Officer and Chief Executive Officer |
Date: March 9, 2010
Pursuant to the requirements of the Securities Exchange Act of 1934 and the Investment Company Act of 1940, this report has been signed below by the following persons on behalf of the Registrant and in the capacities and on the dates indicated.
| | |
| |
| By: | | /s/ SANDRA CAVANAUGH |
| | Sandra Cavanaugh |
| | Principal Executive Officer and Chief Executive Officer |
Date: March 9, 2010
| | |
| |
| By: | | /s/ MARK E. SWANSON |
| | Mark E. Swanson |
| | Principal Financial Officer, Principal Accounting Officer and Treasurer |
Date: March 9, 2010