UNITED STATES
SECURITIES AND EXCHANGE COMMISSION
Washington, DC 20549
FORM N-CSRS
CERTIFIED SHAREHOLDER REPORT OF REGISTERED
MANAGEMENT INVESTMENT COMPANIES
Investment Company Act file number 811-05387
Franklin Mutual Series Funds
(Exact name of registrant as specified in charter)
101 John F. Kennedy Parkway, Short Hills, NJ 07078-2705
(Address of principal executive offices) (Zip code)
Craig S. Tyle, One Franklin Parkway, San Mateo, CA 94403-1906
(Name and address of agent for service)
Registrant’s telephone number, including area code: (210) 912-2100
Date of fiscal year end: 12/31
Date of reporting period: 6/30/17
| Item 1. | Reports to Stockholders. |
 | Semiannual Report and Shareholder Letter June 30, 2017 |
Franklin Mutual Beacon Fund
A SERIES OF FRANKLIN MUTUAL SERIES FUNDS

Sign up for electronic delivery at franklintempleton.com/edelivery
Franklin Templeton Investments
Gain From Our Perspective®
At Franklin Templeton Investments, we’re dedicated to one goal: delivering exceptional asset management for our clients. By bringing together multiple, world-class investment teams in a single firm, we’re able to offer specialized expertise across styles and asset classes, all supported by the strength and resources of one of the world’s largest asset managers. This has helped us to become a trusted partner to individual and institutional investors across the globe.
Dear Franklin Mutual Beacon Fund Shareholder:
The first half of 2017 saw most equity markets continue their long move upwards. The Standard & Poor’s 500® Index (S&P 500®) posted a +9.34% total return and the MSCI World Index delivered a +11.02% total return.1
The political uncertainty and unpredictability of recent years has continued in 2017. In the U.S., President Trump has continued his unconventional governance approach, while Congress has remained relentlessly partisan, leading to significant uncertainty about policies and legislation. The financial markets expected “business friendly” moves, but specific legislative progress on issues such as health care, tax reform and infrastructure did not come to fruition. In the U.K., a surprise election was called in April when the Conservative Party held a huge polling lead, but at the June election the Tories lost their majority in Parliament. Recent elections in France went according to expectations, lending some much appreciated stability there.
Despite these generally unsettling events, the global economy continued its slow expansion since the Great Recession. Unemployment also continued to decline in most developed markets. Wage growth showed signs of acceleration and in the U.S. interest rates began to rise, perhaps signaling the first steps toward monetary normalization.
Equity markets appreciated as economic fundamentals improved. Valuation is, of course, a critical factor in our analysis and we always ask ourselves if current and potential investments represent an attractive balance of risk and reward. As some equity markets reached all-time highs, we maintained our focus on individual investments and the prospects for each
1. Source: Morningstar.
See www.franklintempletondatasources.com for additional data provider information.
business in the context of its valuation and the backdrop of potential political and economic risks.
In many equity markets, growth stocks outperformed value stocks during the period. For example, the S&P 500 Growth Index returned +13.33%, while the S&P 500 Value Index returned +4.85%.1 The difference in performance was driven in part by a significant rally in Internet and software stocks, which dominated the S&P 500 Growth Index. We do not know how long these trends will continue, but historically, periods of strong performance by growth stocks have eventually been followed by relatively weaker performance. In addition, the S&P 500 Value Index has components that we believe are facing disruption from new technology (e.g., the rapid market share shift to online retailing from traditional bricks and mortar dominated retailers that are often labeled as value stocks). Exacerbating the disruption is the reality that many new technology companies are able to innovate without the need to show immediate profits.
Amid dynamic markets and evolving economic conditions, we believe active, professional investment management serves investors well. We also recognize the important role of financial advisors in today’s markets and encourage investors to continue to seek their advice. Amid changing markets and economic conditions, we are confident investors with a well-diversified portfolio and a patient, long-term outlook will be well positioned for the years ahead.
On the following pages, the Fund’s portfolio management team discusses the economic environment during the first six months of 2017 and reviews investment decisions made during this
| Not FDIC Insured | | | May Lose Value | | | No Bank Guarantee |
franklintempleton.com |
Not part of the semiannual report |
|
1 |
|
period. Please remember all securities markets fluctuate, as do mutual fund share prices.
We thank you for investing with Franklin Templeton, welcome your questions and comments, and look forward to continuing to serve your investment needs in the years ahead.
Sincerely,

Peter A. Langerman
Chairman, President and Chief Executive Officer
Franklin Mutual Advisers, LLC
This letter reflects our analysis and opinions as of June 30, 2017, unless otherwise indicated. The information is not a complete analysis of every aspect of any market, country, industry, security or fund. Statements of fact are from sources considered reliable.
Semiannual Report
| Franklin Mutual Beacon Fund | 3 | |||
| Performance Summary | 10 | |||
| Your Fund’s Expenses | 12 | |||
| Financial Highlights and Statement of Investments | 13 | |||
| Financial Statements | 24 | |||
| Notes to Financial Statements | 28 | |||
|
| 40
|
| |
Visit franklintempleton.com for fund updates, to access your account, or to find helpful financial planning tools.
2 |
Not part of the semiannual report |
franklintempleton.com |
Semiannual Report
This semiannual report for Franklin Mutual Beacon Fund covers the period ended June 30, 2017.
Your Fund’s Goal and Main Investments
The Fund seeks capital appreciation, which may occasionally be short term, with income as a secondary goal. The Fund focuses mainly on what the investment manager believes are undervalued mid- and large-cap equity securities with a significant portion of its assets in foreign securities and, to a lesser extent, in the securities of distressed companies and merger arbitrage securities. The Fund may invest a substantial portion, potentially up to 100% of its assets in foreign securities, which may include sovereign debt and participations in foreign government debt.
Performance Overview
The Fund’s Class Z shares delivered a +8.76% cumulative total return for the six months ended June 30, 2017. In comparison, the Fund’s benchmark, the MSCI World Index, which tracks stock performance in global developed markets, generated a +11.02% total return.1 You can find more of the Fund’s performance data in the Performance Summary beginning on page 10.
Performance data represent past performance, which does not guarantee future results. Investment return and principal value will fluctuate, and you may have a gain or loss when you sell your shares. Current performance may differ from figures shown. For most recent month-end performance, go to franklintempleton.com or call (800) 342-5236.
Economic and Market Overview
The global economy generally expanded during the period under review. In this environment, global developed and emerging market stocks, as measured by the MSCI All Country World Index, generated a total return of +11.82%. Global markets were aided by improved industrial commodity prices at certain points during the period, generally upbeat economic data across regions, investor optimism about pro-growth and pro-business policies in the U.S., hopes of tax reforms under
Geographic Composition*
Based on Total Net Assets as of 6/30/17
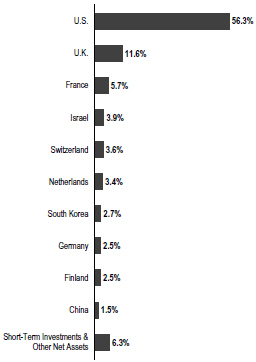
*Figures are stated as a percentage of total and may not equal 100% or may be negative due to rounding, use of any derivatives, unsettled trades or other factors.The Fund held 37.4% of total net assets in foreign securities.
the Trump administration, Emmanuel Macron’s election as France’s president and encouraging corporate earnings reports.
However, global markets reflected investor concerns about the timing and economic effects of the U.K.’s exit from the European Union (also known as “Brexit”). Other headwinds included the health of European banks, concerns about political uncertainty in the U.S. and European Union, geopolitical tensions in certain regions, worries about global oversupply in oil production despite a pact to extend cuts, and comments
1. Source: Morningstar.
The indexes are unmanaged and include reinvestment of any income or distributions. They do not reflect any fees, expenses or sales charges. One cannot invest directly in an index, and an index is not representative of the Fund’s portfolio.
The dollar value, number of shares or principal amount, and names of all portfolio holdings are listed in the Fund’s Statement of Investments (SOI). The SOI begins on page 18.
franklintempleton.com |
Semiannual Report |
|
3 |
|
F R A N K L I N M U T U A L B E A C O N F U N D
toward period-end from key central bankers around the world about potentially raising interest rates.
U.S. economic growth decelerated in 2017’s first quarter, largely due to slower growth in consumer spending and declines in private inventory investment and government spending. However, growth accelerated in the second quarter due to increases in consumer spending, business investment and federal government spending. The unemployment rate decreased from 4.7% in December 2016 to 4.4% at period-end.2 Annual inflation, as measured by the Consumer Price Index, decreased from 2.1% to 1.6% during the period. After increasing its benchmark interest rate in March, the U.S. Federal Reserve (Fed), at its June meeting, made the widely anticipated increase to its target range for the federal funds rate from 0.75%–1.00% to 1.00%–1.25%, amid signs of a growing U.S. economy, a strengthening labor market and an improvement in business spending.
In Europe, the U.K.’s economy grew at a slower rate in 2017’s first quarter over the previous quarter, largely due to slower growth in household spending. The eurozone’s growth increased in the first quarter over the previous quarter. The bloc’s annual inflation rate fluctuated during the reporting period and ended slightly higher from where it began. During the period, the European Central Bank kept its key policy rates unchanged.
In Asia, Japan’s quarterly gross domestic product (GDP) remained unchanged in 2017’s first quarter compared to 2016’s fourth quarter. In April 2017, the Bank of Japan (BOJ) slightly increased its GDP forecasts for the 2017–2018 fiscal year. However, the BOJ lowered its inflation forecast.
In emerging markets, Brazil’s quarterly GDP grew for the first time in two years, as its first-quarter 2017 GDP grew compared to the previous quarter. The country’s central bank cut its benchmark interest rate four times between January and June 2017 to spur economic growth. Russia’s GDP grew in 2017’s first quarter compared to the prior-year period. The Bank of Russia reduced its key interest rate in March, April and June 2017 to try to revive its economy. China’s economy grew faster in the first half of 2017 compared to the first half of 2016, driven by solid growth in industrial production, services, fixed-asset investment, retail sales, and imports and exports. The People’s Bank of China left its benchmark interest rate unchanged during the period. Overall, emerging market stocks,
| Top 10 Sectors/Industries | ||||
| Based on Equity Securities as of 6/30/17 | ||||
| % of Total Net Assets | ||||
| Pharmaceuticals | 12.0% | |||
| Banks | 10.0% | |||
| Software | 8.7% | |||
| Media | 7.7% | |||
| Oil, Gas & Consumable Fuels | 5.7% | |||
| Health Care Equipment & Supplies | 5.1% | |||
| Communications Equipment | 4.3% | |||
| Diversified Telecommunication Services | 3.4% | |||
| Electrical Equipment | 3.2% | |||
| Tobacco | 3.1% | |||
as measured by the MSCI Emerging Markets Index, rose during the period.
Investment Strategy
At Franklin Mutual Series, we are committed to our distinctive value approach to investing, which we believe can generate above-average risk-adjusted returns over time for our shareholders. Our major investment strategy is investing in undervalued stocks. When selecting undervalued equities, we are attracted to what we believe are fundamentally strong companies with healthy balance sheets, high-quality assets, substantial free cash flow and shareholder-oriented management teams and whose stocks are trading at discounts to our assessment of the companies’ intrinsic or business value. We also look for asset-rich companies whose shares may be trading at depressed levels due to concerns over short-term earnings disappointments, litigation, management strategy or other perceived negatives. This strict value approach is not only intended to improve the likelihood of upside potential, but also reduces the risk of substantial declines, in our opinion. While the vast majority of our undervalued equity investments are made in publicly traded companies globally, we may invest occasionally in privately held companies as well.
We complement this more traditional investment strategy with two others. One is distressed investing, a highly specialized field that has proven quite profitable during certain periods over the years. Distressed investing is complex and can take many forms. The most common distressed investment the Fund undertakes is the purchase of financially troubled or bankrupt companies’ debt at a substantial discount to face value. After the financially distressed company is reorganized, often in
2. Source: Bureau of Labor Statistics.
4 |
Semiannual Report |
franklintempleton.com |
F R A N K L I N M U T U A L B E A C O N F U N D
bankruptcy court, the old debt is typically replaced with new securities issued by the financially stronger company.
The other piece of our investment strategy is participating in arbitrage situations, another highly specialized field. When companies announce proposed mergers or takeovers, commonly referred to as “deals,” the target company may trade at a discount to the bid it ultimately accepts. One form of arbitrage involves purchasing the target company’s stock when it is trading below the value we believe it would receive in a deal. In keeping with our commitment to a relatively conservative investment approach, we typically focus our arbitrage efforts on announced deals, and avoid rumored deals or other situations we consider relatively risky.
In addition, it is our practice to hedge the Fund’s currency exposure when we deem it advantageous for our shareholders.
What is meant by “hedge”?
To hedge an investment is to take a position intended to offset potential losses/gains that may be incurred by a companion financial instrument.
Manager’s Discussion
Many equity markets posted meaningful gains in 2017’s first half, across most regions and with minimal volatility. Global markets were aided by generally upbeat economic data, improved corporate earnings in the U.S., Europe and Japan, as well as improved industrial commodity prices at certain points during the period. However, those largely positive headline conditions overshadowed a fair amount of turbulence and uncertainty.
In the U.S., markets began 2017 rallying as investors hoped that a Republican sweep of U.S. elections in November 2016 would lead to a general loosening in regulations and tax reform, including lower corporate tax rates. However, political gridlock took hold. The political drama in Washington, D.C., tempered the rally in U.S. markets overall. Many stocks that led the way in the post-election rally subsequently gave back some or all of their outperformance, particularly value stocks dominated by companies in cyclical sectors most likely to benefit from acceleration in economic growth. In an environment of modest economic growth and low interest rates, investors continued to favor growth stocks. During the period, the Russell 1000® Growth Index generated a total return of +13.99%, while the
Russell 1000® Value Index posted a total return of +4.66%.1 Within the Russell 1000® Growth Index, stocks with the largest weights were technology firms that dominated the headlines: Apple,3 Alphabet (a.k.a. Google),3 Microsoft, Amazon.com3 and Facebook.3
European equity markets started 2017 slowly, but political events combined with upbeat economic news sparked strong performance during the period, with the notable exception of the U.K. Elections in Europe produced generally positive outcomes, with voters in the Netherlands and France rejecting extremist candidates. Political stability in the European Union (EU) helped to support equity markets on the belief that it would help facilitate the ongoing economic recovery. In the U.K., however, a snap election resulting in no party having a majority in Parliament appeared to make a “hard Brexit,” in which the U.K. leaves the EU in March 2019 without a negotiated deal, even more likely than before.
As value investors, we managed to benefit from steady economic growth despite underlying market turbulence. In all market environments, we seek to invest prudently in securities that we believe represent good value, and then we adjust our views as the world around us changes.
The energy sector has been a significant area of investment for the Fund.4 Following an extended period of high prices, crude oil and natural gas prices have been significantly lower during the past few years. The benchmark oil price declined from more than $100 a barrel to below $30, and has more recently stayed between $40 and $60 during the first half of 2017. The impact on the sector, and the securities of companies in the sector, has been unsurprisingly quite dramatic. Although many uncertainties exist, we continue to expect demand for oil and gas to rise for a number of years, which we believe will require continued investment by the sector, not only to meet that growth but also to replace declining production in mature fields around the world. Accordingly, we expect some combination of higher prices or lower costs over time to provide the sufficient returns needed to justify the required investment.
After an initial period of distress, most companies within the energy sector appear to have made considerable progress in resizing their cost structures and strengthening their balance sheets. In aggregate, capital spending has been cut massively, and cash flow breakeven levels suggest an ability to fund a base level of investment activity given crude oil and gas prices as of
3. Not a Fund holding.
4. The energy sector comprises oil, gas and consumable fuels in the SOI.
franklintempleton.com |
Semiannual Report |
|
5 |
|
F R A N K L I N M U T U A L B E A C O N F U N D
period-end. From an investment standpoint, in many cases we are finding securities with reasonable prospects at current commodity prices, and substantively greater upside potential should our longer term price-versus-cost outlook come to pass. We expect continued commodity price volatility, but would look to use that to our advantage when seeking to buy or sell energy sector securities.
Our energy sector investment process has focused on finding situations where commodity price upside is not necessary to generate attractive security returns. One such area is within the infrastructure space. Companies such as Kinder Morgan3 and Williams provide critical pipelines, processing facilities, ports, and other assets used to bring vital commodities to market. Investors shunned these companies due to a combination of counterparty risk related to exploration and production companies, their own balance sheet concerns and dividend levels. As our analysis about the criticality of their assets and the flexibility of their funding options has, in our view, been proven, the securities of infrastructure companies have recovered significantly from their lows. Moreover, if expectations of an oil and gas supply glut from greater North American production hold true, more infrastructure investment should be needed to move this product to export markets.
Royal Dutch Shell, a leading integrated oil and gas company, is another investment held by the Fund for which fears about the impact of low commodity prices were overblown, in our view. The company used the initial phase of the crude oil price downturn to acquire BG Group, a major exploration and production company with significant positions and strength in liquefied natural gas and a great oil asset in the pre-salt Santos Basin in Brazil. The assets were highly complementary to Shell’s existing positions, allowing the post-merger company to prune other areas of its portfolio and still show considerable growth. Management, under the leadership of relatively new chief executive officer Ben van Beurden, has been focused on reducing costs so that the company can still grow, while funding all required capital expenditures and its dividend, at an oil price below $50 per barrel. As Shell shows continued progress in its efforts and demonstrates the resilience of its portfolio and balance sheet, we expect the shares to continue to benefit.
Merger and acquisition activity has remained healthy, with the number of deals remaining high, although the average size of deals fell. Very large deals may have been affected negatively by ongoing political and regulatory uncertainty. Although
many mega-deals were rumored, the largest deal actually announced during the period was Becton, Dickinson and Company’s3 takeover of C.R. Bard.3 Meanwhile, many large deals initiated in 2016 await regulatory approval, including Bayer’s3 acquisition of Monsanto, AT&T’s3 acquisition of Time Warner, and 21st Century Fox’s3 offer for Sky. Several key regulatory agencies remain short of members, including the Federal Communication Commission and the Federal Trade Commission, and these openings may be affecting regulatory approvals.
Credit spreads narrowed in 2016 and continued that trend in the first half of 2017 for higher quality credit, with the exception of a brief period of volatility in March and April. High yield credit spreads have remained at levels seen at the start of 2017. The spread compression provided the Fund with the opportunity to exit many of the opportunities that presented themselves in early 2016, including several “hung deals,” as prices improved, spreads shrank, and the risk-adjusted returns were no longer mispriced. As the year progressed and investors became more willing buyers of credit, mispriced risk became more difficult to find, in our opinion. However, we found what we viewed as value in some unloved industries like specialty pharmaceuticals, hospitals, media/broadcasting and telecommunications5 that faced increasing political or secular challenges. In sorting through these less-favored industries, we sought out securities that we believed could benefit most from liquidity-enhancing events like asset sales, the ability within existing agreements to issue secured debt, and free cash flow that could create a long enough runway to weather the storm and/or provide enough current recovery to create the enterprise at a significant discount to our assessment of its intrinsic value. In times when the credit markets fluctuate and value is difficult to easily identify, we believe our industry specific expertise, deep fundamental analysis with a focus on cash flow, and intensive credit and covenant review combine seamlessly and provide us with unique ways of looking at the same ideas others may disregard.
Turning to Fund performance, top positive contributors included South Korea-based Samsung Electronics, U.S.-based medical device maker Medtronic and Finland-based global communications and information technology company Nokia.
Samsung Electronics is a low cost provider of commodity memory products (e.g., dynamic random-access memory and flash memory), which have seen very strong pricing recently. Samsung also produces smartphones, consumer electronics and
5. The telecommunication services sector comprises diversified telecommunication services and wireless telecommunication services in the SOI.
6 |
Semiannual Report |
franklintempleton.com |
F R A N K L I N M U T U A L B E A C O N F U N D
| Top 10 Equity Holdings | ||||
| 6/30/17 | ||||
Company Sector/Industry, Country | % of Total Net Assets | |||
Medtronic PLC | 3.6% | |||
| Health Care Equipment & Supplies, U.S. | ||||
Novartis AG | 3.6% | |||
| Pharmaceuticals, Switzerland | ||||
Time Warner Inc. | 3.4% | |||
| Media, U.S. | ||||
Koninklijke KPN NV | 3.4% | |||
| Diversified Telecommunication Services, Netherlands | ||||
Sensata Technologies Holding NV | 3.2% | |||
| Electrical Equipment, U.S. | ||||
British American Tobacco PLC | 3.1% | |||
| Tobacco, U.K. | ||||
Societe Generale SA | 3.0% | |||
| Banks, France | ||||
JPMorgan Chase & Co. | 3.0% | |||
| Banks, U.S. | ||||
Vodafone Group PLC | 2.9% | |||
| Wireless Telecommunication Services, U.K. | ||||
KLX Inc. | 2.9% | |||
| Aerospace & Defense, U.S. | ||||
other goods. In February, shares retreated as Samsung chief Jay Y. Lee was arrested for bribery as part of a wider government influence-peddling scandal that led to the impeachment of then president Park Geun-hye. However, the stock price rallied as investors turned their focus to Samsung’s better-than-expected earnings results announced in April. Samsung reported strong sales in its core businesses, including memory chips and OLED (organic light-emitting diode) displays. Despite adverse publicity surrounding its Note 7 smartphone in the fall of 2016, sales of its newest generation of smartphones have been running ahead of market expectations. Management also pleasantly surprised investors in April by announcing a plan to cancel existing treasury shares held by the company.
Investors responded positively to quarterly results issued by Medtronic in February and May. On both occasions, earnings exceeded consensus expectations, driven by solid revenues and successful cost control efforts, which led to better operating profitability. The positive results led to improved investor confidence in Medtronic’s ability to deliver on future growth goals, especially given concerns following tough quarterly results issued in November 2016. Medtronic’s agreement in April to sell its medical supplies business to Cardinal Health3 provided additional support to Medtronic’s stock price. Medtronic obtained the medical supplies business as part of its 2014 acquisition of Covidien. The medical supplies business, in our view, was not core to Medtronic’s operations and had less
attractive profitability and future growth prospects. In addition, Medtronic intends to use the after-tax proceeds for additional share buybacks and to pay down debt.
In April, Nokia reported an upbeat set of quarterly results that included strong margins in its networks business and solid sales in its wireless business. The positive results appear to reflect some improvement in market conditions for wireless network equipment. Nokia also earned more revenue from its patents, while management reaffirmed its earnings guidance for 2017. We believe the trend of declining revenues is on the path to stabilizing and that further synergies from Nokia’s acquisition of Alcatel-Lucent, completed in mid-2016, are likely to support earnings improvement. Shares of Nokia also reacted positively to the announcement in May that the company reached a settlement on unresolved patent litigation and signed a business collaboration agreement with Apple.3 In our view, Nokia likely saved a meaningful amount in litigation costs and gained a potential source of growth for its Internet protocol routing business.
During the period under review, Fund investments that detracted from performance included U.S.-based drugstore chain Rite Aid, U.S.-based oil and gas exploration and production company Marathon Oil and U.S. bank Capital One Financial.
Shares of Rite Aid declined as a deal to be acquired by Walgreens Boots Alliance fell apart. The transaction was mired in antitrust review by the Federal Trade Commission (FTC) during much of the period as the FTC questioned whether Walgreens’ proposed divestitures were sufficient to maintain competition. In late June, Walgreens announced the immediate termination of the merger agreement. Instead, Rite Aid agreed to sell numerous stores and related distribution assets to Walgreens. The new agreement is also subject to antitrust review, but we believe FTC approval is likely.
Shares of Marathon Oil generally followed the path of declining oil prices. During the first half of 2017, oil prices retreated as U.S. crude oil production increased and data showed that worldwide supply had not yet begun to decline. The supply and price trends for crude oil prices overshadowed some moves by Marathon that we believe were positive. As part of its portfolio transformation effort, in March Marathon announced agreements to exit a Canadian oil sands asset, and two transactions to acquire acreage in the northern Delaware basin of New Mexico. Although we regard the price received for the oil sands asset to be merely adequate, we look favorably upon the continuing expansion of the company’s resource portfolio and increasing focus on predictable, higher return
franklintempleton.com |
Semiannual Report |
|
7 |
|
F R A N K L I N M U T U A L B E A C O N F U N D
onshore assets. Additionally, the three transactions led to a further improvement in Marathon’s balance sheet. These favorable changes were nonetheless overshadowed by an oil market which remains both volatile and challenging.
Capital One Financial is the seventh largest bank in the U.S. Financials stocks were negatively impacted in March by a combination of a decline in the 10-year U.S. Treasury yield and increased doubts among investors that the current U.S. administration and Congress would quickly enact their economic agenda.6 Also in March, weaker-than-expected U.S. consumer credit data drove investors to anticipate lower future earnings as a result of higher reserves. Additionally, Capital One withdrew its late 2016 agreement to acquire the credit card portfolio of retailer Cabela’s3 due to complications related to a 2015 consent order with the U.S. Office of the Comptroller of the Currency. The Cabela deal was subsequently revived as Capital One partnered with financial company Synovus.3 In late April, shares of Capital One slipped further after the company announced quarterly results that fell short of consensus expectations. The miss in earnings was largely driven by a higher-than-expected increase in reserves as Capital One raised its expected rate of net charge-offs (the amount of bad debt written off minus any subsequent amount recovered) for 2017. In our view, however, the update was more of a hit to confidence than a meaningful negative for Capital One’s financial performance.
During the period, the Fund held currency forwards and futures seeking to hedge most of the currency risk of the portfolio’s non-U.S. dollar investments. The currency forwards had a negative impact on the Fund’s performance because of the depreciation of the U.S. dollar versus the hedged currencies, while currency futures had a negligible impact.
What is a currency forward?
A currency forward is an agreement between the Fund and a counterparty to buy or sell a foreign currency in exchange for another currency at a specific exchange rate on a future date.
What is a future?
A future is an agreement between the Fund and a counterparty made through a U.S. or foreign futures exchange to buy or sell an underlying instrument or asset at a specific price on a future date.
Thank you for your participation in Franklin Mutual Beacon Fund. We look forward to continuing to serve your investment needs.
 |
Christian Correa, CFA Co-Portfolio Manager | |
 |
Mandana Hormozi Co-Portfolio Manager | |
 |
Aman Gupta, CFA Assistant Portfolio Manager | |


The foregoing information reflects our analysis, opinions and portfolio holdings as of June 30, 2017, the end of the reporting period. The way we implement our main investment strategies and the resulting portfolio holdings may change depending on factors such as market and economic conditions. These opinions may not be relied upon as investment advice or an offer for a particular security. The information is not a complete analysis of every aspect of any market, country, industry, security or the Fund. Statements of fact are from sources considered reliable, but the investment manager makes no representation or warranty as to their completeness or accuracy. Although historical performance is no guarantee of future results, these insights may help you understand our investment management philosophy.
CFA® is a trademark owned by CFA Institute.
6. The financials sector comprises banks, consumer finance and insurance in the SOI.
See www.franklintempletondatasources.com for additional data provider information.
8 |
Semiannual Report |
franklintempleton.com |
F R A N K L I N M U T U A L B E A C O N F U N D
Christian Correa has been portfolio manager for Franklin Mutual Beacon Fund since 2007 and a co-portfolio manager since December 2010. He joined Franklin Templeton Investments in 2003 and serves as Director of Research for Franklin Mutual Advisers. Previously, he covered merger arbitrage and special situations at Lehman Brothers Holdings Inc.
Mandana Hormozi has been a co-portfolio manager for Franklin Mutual Beacon Fund since 2010 and was assistant portfolio manager for the Fund since 2009. Before that, she was assistant portfolio manager for Franklin Mutual Global Discovery Fund since 2007. She has been an analyst for Franklin Mutual Advisers since 2003, when she joined Franklin Templeton Investments. Previously, she was a senior vice president in the equity research department at Lazard Freres. Also, she was an economic research analyst at Mitsubishi Bank.
Aman Gupta has been assistant portfolio manager for Franklin Mutual Beacon Fund since December 2013 and has been an analyst for Franklin Mutual Advisers since 2010. Previously, Mr. Gupta was a senior equity analyst and director at Evergreen Investments, where he covered the health care industry with additional responsibilities in the consumer and industrials sectors.
franklintempleton.com |
Semiannual Report |
|
9 |
|
F R A N K L I N M U T U A L B E A C O N F U N D
Performance Summary as of June 30, 2017
The performance table does not reflect any taxes that a shareholder would pay on Fund dividends, capital gain distributions, if any, or any realized gains on the sale of Fund shares. Total return reflects reinvestment of the Fund’s dividends and capital gain distributions, if any, and any unrealized gains or losses. Your dividend income will vary depending on dividends or interest paid by securities in the Fund’s portfolio, adjusted for operating expenses of each class. Capital gain distributions are net profits realized from the sale of portfolio securities.
Performance as of 6/30/17
Cumulative total return excludes sales charges. Average annual total return includes maximum sales charges. Sales charges will vary depending on the size of the investment and the class of share purchased. The maximum is 5.75% and the minimum is 0%. Class A: 5.75% maximum initial sales charge. For other share classes, visit franklintempleton.com.
| Share Class | | Cumulative Total Return1 | | | Average Annual Total Return2 | | ||
Z | ||||||||
6-Month | +8.76% | +8.76% | ||||||
1-Year | +20.87% | +20.87% | ||||||
5-Year | +81.36% | +12.64% | ||||||
10-Year | +53.77% | +4.40% | ||||||
A | ||||||||
6-Month | +8.63% | +2.36% | ||||||
1-Year | +20.53% | +13.63% | ||||||
5-Year | +78.83% | +11.00% | ||||||
10-Year | +49.33% | +3.48% | ||||||
Performance data represent past performance, which does not guarantee future results. Investment return and principal value will fluctuate, and you may have a gain or loss when you sell your shares. Current performance may differ from figures shown. For most recent month-end performance, go to franklintempleton.com or call (800) 342-5236.
See page 11 for Performance Summary footnotes.
10 |
Semiannual Report |
franklintempleton.com |
F R A N K L I N M U T U A L B E A C O N F U N D
P E R F O R M A N C E S U M M A R Y
Total Annual Operating Expenses3
| Share Class | ||||
Z | 0.80% | |||
A | 1.05% | |||
Each class of shares is available to certain eligible investors and has different annual fees and expenses, as described in the prospectus.
All investments involve risks, including possible loss of principal. Value securities may not increase in price as anticipated or may decline further in value. Special risks are associated with foreign investing, including currency fluctuations, economic instability and political developments. Smaller company stocks have exhibited greater price volatility than larger company stocks, particularly over the short term. The Fund’s investments in companies engaged in mergers, reorganizations or liquidations also involve special risks as pending deals may not be completed on time or on favorable terms. The Fund may invest in lower rated bonds, which entail higher credit risk. The Fund is actively managed but there is no guarantee that the manager’s investment decisions will produce the desired results. The Fund’s prospectus also includes a description of the main investment risks.
1. Cumulative total return represents the change in value of an investment over the periods indicated.
2. Average annual total return represents the average annual change in value of an investment over the periods indicated. Return for less than one year, if any, has not been annualized.
3. Figures are as stated in the Fund’s current prospectus and may differ from the expense ratios disclosed in the Your Fund’s Expenses and Financial Highlights sections in this report. In periods of market volatility, assets may decline significantly, causing total annual Fund operating expenses to become higher than the figures shown.
franklintempleton.com |
Semiannual Report |
11 |
F R A N K L IN M U T U A L B E A C O N F U N D
As a Fund shareholder, you can incur two types of costs: (1) transaction costs, including sales charges (loads) on Fund purchases and redemptions; and (2) ongoing Fund costs, including management fees, distribution and service (12b-1) fees, and other Fund expenses. All mutual funds have ongoing costs, sometimes referred to as operating expenses. The table below shows ongoing costs of investing in the Fund and can help you understand these costs and compare them with those of other mutual funds. The table assumes a $1,000 investment held for the six months indicated.
Actual Fund Expenses
The table below provides information about actual account values and actual expenses in the columns under the heading “Actual.” In these columns the Fund’s actual return, which includes the effect of Fund expenses, is used to calculate the “Ending Account Value” for each class of shares. You can estimate the expenses you paid during the period by following these steps (of course, your account value and expenses will differ from those in this illustration): Divide your account value by $1,000 (if your account had an $8,600 value, then $8,600 ÷ $1,000 = 8.6). Then multiply the result by the number in the row for your class of shares under the headings “Actual” and “Expenses Paid During Period” (if Actual Expenses Paid During Period were $7.50, then 8.6 x $7.50 = $64.50). In this illustration, the actual expenses paid this period are $64.50.
Hypothetical Example for Comparison with Other Funds
Under the heading “Hypothetical” in the table, information is provided about hypothetical account values and hypothetical expenses based on the Fund’s actual expense ratio and an assumed rate of return of 5% per year before expenses, which is not the Fund’s actual return. This information may not be used to estimate the actual ending account balance or expenses you paid for the period, but it can help you compare ongoing costs of investing in the Fund with those of other funds. To do so, compare this 5% hypothetical example for the class of shares you hold with the 5% hypothetical examples that appear in the shareholder reports of other funds.
Please note that expenses shown in the table are meant to highlight ongoing costs and do not reflect any transactional costs. Therefore, information under the heading “Hypothetical” is useful in comparing ongoing costs only, and will not help you compare total costs of owning different funds. In addition, if transactional costs were included, your total costs would have been higher.
Actual (actual return after expenses) | Hypothetical (5% annual return before expenses) | |||||||||||||||||
Share Class | Beginning Account Value 1/1/17 | Ending Account Value 6/30/17 | Expenses Paid During 1/1/17–6/30/171,2 | Ending Value 6/30/17 | Expenses Paid During 1/1/17–6/30/171,2 | Net Annualized Expense Ratio2 | ||||||||||||
| Z | $1,000 | $1,087.60 | $4.04 | $1,020.93 | $3.91 | 0.78% | ||||||||||||
| A | $1,000 | $1,086.30 | $5.33 | $1,019.69 | $5.16 | 1.03% | ||||||||||||
| C | $1,000 | $1,082.30 | $9.19 | $1,015.97 | $8.90 | 1.78% | ||||||||||||
| R | $1,000 | $1,084.60 | $6.62 | $1,018.45 | $6.41 | 1.28% | ||||||||||||
| R6 | $1,000 | $1,088.20 | $3.68 | $1,021.27 | $3.56 | 0.71% | ||||||||||||
1. Expenses are equal to the annualized expense ratio for the six-month period as indicated above–in the far right column–multiplied by the simple average account value over the period indicated, and then multiplied by 181/365 to reflect the one-half year period.
2. Reflects expenses after fee waivers and expense reimbursements. Does not include acquired fund fees and expenses.
12 |
Semiannual Report |
franklintempleton.com |
F R A N K L I N M U T U A L B E A C O N F U N D
Six Months Ended
June 30, 2017 |
Year Ended December 31,
| |||||||||||||||||||||||||
(unaudited)
|
2016
|
2015
|
2014
|
2013
|
2012
| |||||||||||||||||||||
Class Z | ||||||||||||||||||||||||||
| Per share operating performance | ||||||||||||||||||||||||||
(for a share outstanding throughout the period) | ||||||||||||||||||||||||||
Net asset value, beginning of period | $15.30
| $14.30 |
| $16.59
|
|
| $16.91
|
|
| $13.36
|
|
| $11.68
|
| ||||||||||||
Income from investment operationsa: | ||||||||||||||||||||||||||
Net investment incomeb | 0.17
|
| 0.37c
|
|
| 0.29
|
|
| 0.54d
|
|
| 0.31
|
|
| 0.24
|
| ||||||||||
Net realized and unrealized gains (losses) | 1.17
|
| 1.93
|
|
| (0.99)
|
|
| 0.62
|
|
| 3.56
|
|
| 1.68
|
| ||||||||||
Total from investment operations |
1.34
|
| 2.30
|
|
|
(0.70)
|
|
|
1.16
|
|
|
3.87
|
|
|
1.92
|
| ||||||||||
Less distributions from: | ||||||||||||||||||||||||||
Net investment income | —
|
| (0.37)
|
|
| (0.37)
|
|
| (0.69)
|
|
| (0.32)
|
|
| (0.24)
|
| ||||||||||
Net realized gains | —
|
| (0.93)
|
|
| (1.22)
|
|
| (0.79)
|
|
| —
|
|
| —
|
| ||||||||||
Total distributions |
—
|
|
(1.30)
|
|
|
(1.59)
|
|
|
(1.48)
|
|
|
(0.32)
|
|
|
(0.24)
|
| ||||||||||
Net asset value, end of period |
$16.64
|
|
$15.30
|
|
|
$14.30
|
|
|
$16.59
|
|
|
$16.91
|
|
|
$13.36
|
| ||||||||||
Total returne | 8.76%
|
| 16.11%
|
|
| (4.14)%
|
|
| 6.82%
|
|
| 29.11%
|
|
| 16.44%
|
| ||||||||||
Ratios to average net assetsf | ||||||||||||||||||||||||||
Expensesg | 0.78%h
|
| 0.80%h
|
|
| 0.84%h,i
|
|
| 0.83%h
|
|
| 0.80%h
|
|
| 0.84%
|
| ||||||||||
Expenses incurred in connection with securities sold short | —%
|
| 0.01%
|
|
| 0.04%
|
|
| 0.04%
|
|
| —%j
|
|
| 0.01%
|
| ||||||||||
Net investment income | 2.11%
|
| 2.48%c
|
|
| 1.73%
|
|
| 3.14%d
|
|
| 2.02%
|
|
| 1.87%
|
| ||||||||||
| Supplemental data | ||||||||||||||||||||||||||
Net assets, end of period (000’s) | $2,772,594
|
| $2,564,120
|
|
| $2,420,165
|
|
| $2,774,929
|
|
| $2,876,322
|
|
| $2,450,546
|
| ||||||||||
Portfolio turnover rate | 10.39%
|
| 30.94%
|
|
| 35.80%
|
|
| 40.06%
|
|
| 32.95%
|
|
| 43.23%
|
| ||||||||||
aThe amount shown for a share outstanding throughout the period may not correlate with the Statement of Operations for the period due to the timing of sales and repurchases of the Fund’s shares in relation to income earned and/or fluctuating fair value of the investments of the Fund.
bBased on average daily shares outstanding.
cNet investment income per share includes approximately $0.10 per share related to income received in the form of special dividends in connection with certain Fund holdings. Excluding this amount, the ratio of net investment income to average net assets would have been 1.81%.
dNet investment income per share includes approximately $0.24 per share related to income received in the form of a special dividend in connection with certain Fund holdings. Excluding this amount, the ratio of net investment income to average net assets would have been 1.74%.
eTotal return is not annualized for periods less than one year.
fRatios are annualized for periods less than one year.
gIncludes dividend and/or interest expense on securities sold short and security borrowing fees, if any. See below for the ratios of such expenses to average net assets for the periods presented. See Note 1(d).
hBenefit of expense reduction rounds to less than 0.01%.
iBenefit of waiver and payments by affiliates rounds to less than 0.01%.
jRounds to less than 0.01%.
franklintempleton.com |
The accompanying notes are an integral part of these financial statements. |
Semiannual Report |
13 |
F R A N K L I N M U T U A L B E A C O N F U N D
F I N A N C I A L H I G H L I G H T S
Six Months Ended (unaudited) | Year Ended December 31, | |||||||||||||||||||||||
| 2016 | 2015 | 2014 | 2013 | 2012 | ||||||||||||||||||||
| ||||||||||||||||||||||||
| Class A | ||||||||||||||||||||||||
| Per share operating performance | ||||||||||||||||||||||||
(for a share outstanding throughout the period) | ||||||||||||||||||||||||
Net asset value, beginning of period | $15.18 | $14.20 | $16.47 | $16.80 | $13.28 | $11.61 | ||||||||||||||||||
|
| |||||||||||||||||||||||
Income from investment operationsa: | ||||||||||||||||||||||||
Net investment incomeb | 0.15 | 0.33c | 0.24 | 0.49d | 0.26 | 0.20 | ||||||||||||||||||
Net realized and unrealized gains (losses) | 1.16 | 1.91 | (0.97) | 0.60 | 3.54 | 1.67 | ||||||||||||||||||
|
| |||||||||||||||||||||||
Total from investment operations | 1.31 | 2.24 | (0.73) | 1.09 | 3.80 | 1.87 | ||||||||||||||||||
|
| |||||||||||||||||||||||
Less distributions from: | ||||||||||||||||||||||||
Net investment income | — | (0.33) | (0.32) | (0.63) | (0.28) | (0.20) | ||||||||||||||||||
Net realized gains | — | (0.93) | (1.22) | (0.79) | — | — | ||||||||||||||||||
|
| |||||||||||||||||||||||
Total distributions | — | (1.26) | (1.54) | (1.42) | (0.28) | (0.20) | ||||||||||||||||||
|
| |||||||||||||||||||||||
Net asset value, end of period | $16.49 | $15.18 | $14.20 | $16.47 | $16.80 | $13.28 | ||||||||||||||||||
|
| |||||||||||||||||||||||
Total returne | 8.63% | 15.80% | (4.33)% | 6.48% | 28.70% | 16.10% | ||||||||||||||||||
| Ratios to average net assetsf | ||||||||||||||||||||||||
Expensesg | 1.03%h | 1.05%h | 1.12%h,i | 1.13%h | 1.10%h | 1.14% | ||||||||||||||||||
Expenses incurred in connection with securities sold short | —% | 0.01% | 0.04% | 0.04% | —%j | 0.01% | ||||||||||||||||||
Net investment income | 1.86% | 2.23%c | 1.45% | 2.84%d | 1.72% | 1.57% | ||||||||||||||||||
| Supplemental data | ||||||||||||||||||||||||
Net assets, end of period (000’s) | $1,000,642 | $992,306 | $1,019,568 | $1,101,706 | $1,148,409 | $983,981 | ||||||||||||||||||
Portfolio turnover rate | 10.39% | 30.94% | 35.80% | 40.06% | 32.95% | 43.23% | ||||||||||||||||||
aThe amount shown for a share outstanding throughout the period may not correlate with the Statement of Operations for the period due to the timing of sales and repurchases of the Fund’s shares in relation to income earned and/or fluctuating fair value of the investments of the Fund.
bBased on average daily shares outstanding.
cNet investment income per share includes approximately $0.10 per share related to income received in the form of special dividends in connection with certain Fund holdings. Excluding this amount, the ratio of net investment income to average net assets would have been 1.56%.
d Net investment income per share includes approximately $0.24 per share related to income received in the form of a special dividend in connection with certain Fund holdings. Excluding this amount, the ratio of net investment income to average net assets would have been 1.44%.
eTotal return does not reflect sales commissions or contingent deferred sales charges, if applicable, and is not annualized for periods less than one year.
fRatios are annualized for periods less than one year.
gIncludes dividend and/or interest expense on securities sold short and security borrowing fees, if any. See below for the ratios of such expenses to average net assets for the periods presented. See Note 1(d).
hBenefit of expense reduction rounds to less than 0.01%.
iBenefit of waiver and payments by affiliates rounds to less than 0.01%.
jRounds to less than 0.01%.
14 |
Semiannual Report |
The accompanying notes are an integral part of these financial statements. |
franklintempleton.com |
F R A N K L I N M U T U A L B E A C O N F U N D
DF I N A N C I A L H I G H L I G H T S
Six Months Ended
June 30, 2017 | Year Ended December 31, | |||||||||||||||||||||||||||
| (unaudited) | 2016 | 2015 | 2014 | 2013 | 2012 | |||||||||||||||||||||||
Class C | ||||||||||||||||||||||||||||
| Per share operating performance | ||||||||||||||||||||||||||||
(for a share outstanding throughout the period) | ||||||||||||||||||||||||||||
Net asset value, beginning of period | $15.06 | $14.10 | $16.36 | $16.70 | $13.21 | $11.54 | ||||||||||||||||||||||
Income from investment operationsa: | ||||||||||||||||||||||||||||
Net investment incomeb | 0.09 | 0.22c | 0.12 | 0.37d | 0.15 | 0.11 | ||||||||||||||||||||||
Net realized and unrealized gains (losses) | 1.15 | 1.88 | (0.96) | 0.59 | 3.51 | 1.66 | ||||||||||||||||||||||
Total from investment operations | 1.24 | 2.10 | (0.84) | 0.96 | 3.66 | 1.77 | ||||||||||||||||||||||
Less distributions from: | ||||||||||||||||||||||||||||
Net investment income | — | (0.21) | (0.20) | (0.51) | (0.17) | (0.10) | ||||||||||||||||||||||
Net realized gains | — | (0.93) | (1.22) | (0.79) | — | — | ||||||||||||||||||||||
Total distributions | — | (1.14) | (1.42) | (1.30) | (0.17) | (0.10) | ||||||||||||||||||||||
Net asset value, end of period | $16.30 | $15.06 | $14.10 | $16.36 | $16.70 | $13.21 | ||||||||||||||||||||||
Total returne | 8.23% | 14.94% | (5.06)% | 5.78% | 27.79% | 15.29% | ||||||||||||||||||||||
Ratios to average net assetsf | ||||||||||||||||||||||||||||
Expensesg | 1.78%h | 1.80%h | 1.84%h,i | 1.83%h | 1.80%h | 1.84% | ||||||||||||||||||||||
Expenses incurred in connection with securities sold short | —% | 0.01% | 0.04% | 0.04% | —%j | 0.01% | ||||||||||||||||||||||
Net investment income | 1.11% | 1.48%c | 0.73% | 2.14%d | 1.02% | 0.87% | ||||||||||||||||||||||
| Supplemental data | ||||||||||||||||||||||||||||
Net assets, end of period (000’s) | $271,283 | $275,138 | $285,333 | $320,832 | $336,222 | $295,958 | ||||||||||||||||||||||
Portfolio turnover rate | 10.39% | 30.94% | 35.80% | 40.06% | 32.95% | 43.23% | ||||||||||||||||||||||
aThe amount shown for a share outstanding throughout the period may not correlate with the Statement of Operations for the period due to the timing of sales and repurchases of the Fund’s shares in relation to income earned and/or fluctuating fair value of the investments of the Fund.
bBased on average daily shares outstanding.
cNet investment income per share includes approximately $0.10 per share related to income received in the form of special dividends in connection with certain Fund holdings. Excluding this amount, the ratio of net investment income to average net assets would have been 0.81%.
dNet investment income per share includes approximately $0.24 per share related to income received in the form of a special dividend in connection with certain Fund holdings. Excluding this amount, the ratio of net investment income to average net assets would have been 0.74%.
eTotal return does not reflect sales commissions or contingent deferred sales charges, if applicable, and is not annualized for periods less than one year.
fRatios are annualized for periods less than one year.
gIncludes dividend and/or interest expense on securities sold short and security borrowing fees, if any. See below for the ratios of such expenses to average net assets for the periods presented. See Note 1(d).
hBenefit of expense reduction rounds to less than 0.01%.
iBenefit of waiver and payments by affiliates rounds to less than 0.01%.
jRounds to less than 0.01%.
franklintempleton.com |
The accompanying notes are an integral part of these financial statements. | |
Semiannual Report |
15 |
F R A N K L I N M U T U A L B E A C O N F U N D
F I N A N C I A L H I G H L I G H T S
| Six Months Ended June 30, 2017 | Year Ended December 31, | |||||||||||||||||||||||||||
| (unaudited) | 2016 | 2015 | 2014 | 2013 | 2012 | |||||||||||||||||||||||
Class R | ||||||||||||||||||||||||||||
| Per share operating performance | ||||||||||||||||||||||||||||
(for a share outstanding throughout the period) | ||||||||||||||||||||||||||||
Net asset value, beginning of period | $15.01 | $14.05 | $16.33 | $16.68 | $13.19 | $11.52 | ||||||||||||||||||||||
Income from investment operationsa: | ||||||||||||||||||||||||||||
Net investment incomeb | 0.13 | 0.30c | 0.20 | 0.44d | 0.23 | 0.18 | ||||||||||||||||||||||
Net realized and unrealized gains (losses) | 1.14 | 1.89 | (0.97) | 0.61 | 3.50 | 1.66 | ||||||||||||||||||||||
Total from investment operations | 1.27 | 2.19 | (0.77) | 1.05 | 3.73 | 1.84 | ||||||||||||||||||||||
Less distributions from: | ||||||||||||||||||||||||||||
Net investment income | — | (0.30) | (0.29) | (0.61) | (0.24) | (0.17) | ||||||||||||||||||||||
Net realized gains | — | (0.93) | (1.22) | (0.79) | — | — | ||||||||||||||||||||||
Total distributions | — | (1.23) | (1.51) | (1.40) | (0.24) | (0.17) | ||||||||||||||||||||||
Net asset value, end of period | $16.28 | $15.01 | $14.05 | $16.33 | $16.68 | $13.19 | ||||||||||||||||||||||
Total returne | 8.46% | 15.58% | (4.61)% | 6.31% | 28.34% | 15.95% | ||||||||||||||||||||||
Ratios to average net assetsf | ||||||||||||||||||||||||||||
Expensesg | 1.28%h | 1.30%h | 1.34%h,i | 1.33%h | 1.30%h | 1.34% | ||||||||||||||||||||||
Expenses incurred in connection with securities sold short | —% | 0.01% | 0.04% | 0.04% | —%j | 0.01% | ||||||||||||||||||||||
Net investment income | 1.61% | 1.98%c | 1.23% | 2.64%d | 1.52% | 1.37% | ||||||||||||||||||||||
| Supplemental data | ||||||||||||||||||||||||||||
Net assets, end of period (000’s) | $2,162 | $2,035 | $2,343 | $2,246 | $1,956 | $1,905 | ||||||||||||||||||||||
Portfolio turnover rate | 10.39% | 30.94% | 35.80% | 40.06% | 32.95% | 43.23% | ||||||||||||||||||||||
s The amount shown for a share outstanding throughout the period may not correlate with the Statement of Operations for the period due to the timing of sales and repurchases of the Fund’s shares in relation to income earned and/or fluctuating fair value of the investments of the Fund.
b Based on average daily shares outstanding.
c Net investment income per share includes approximately $0.10 per share related to income received in the form of special dividends in connection with certain Fund holdings. Excluding this amount, the ratio of net investment income to average net assets would have been 1.31%.
d Net investment income per share includes approximately $0.24 per share related to income received in the form of a special dividend in connection with certain Fund holdings. Excluding this amount, the ratio of net investment income to average net assets would have been 1.24%.
e Total return is not annualized for periods less than one year.
f Ratios are annualized for periods less than one year.
g Includes dividend and/or interest expense on securities sold short and security borrowing fees, if any. See below for the ratios of such expenses to average net assets for the periods presented. See Note 1(d).
h Benefit of expense reduction rounds to less than 0.01%.
i Benefit of waiver and payments by affiliates rounds to less than 0.01%.
j Rounds to less than 0.01%.
16 |
Semiannual Report |
The accompanying notes are an integral part of these financial statements. |
franklintempleton.com |
F R A N K L I N M U T U A L B E A C O N F U N D
F I N A N C I A L H I G H L I G H T S
| Six Months Ended June 30, 2017 | Year Ended December 31, | |||||||||||||||||||
| (unaudited) | 2016 | 2015 | 2014 | 2013a | ||||||||||||||||
Class R6 | ||||||||||||||||||||
| Per share operating performance | ||||||||||||||||||||
(for a share outstanding throughout the period) | ||||||||||||||||||||
Net asset value, beginning of period | $15.30 | $14.30 | $16.58 | $16.88 | $14.77 | |||||||||||||||
Income from investment operationsb: | ||||||||||||||||||||
Net investment incomec | 0.10 | 0.38d | 0.30 | 0.56e | 0.24 | |||||||||||||||
Net realized and unrealized gains (losses) | 1.25 | 1.93 | (0.98) | 0.63 | 2.21 | |||||||||||||||
Total from investment operations | 1.35 | 2.31 | (0.68) | 1.19 | 2.45 | |||||||||||||||
Less distributions from: | ||||||||||||||||||||
Net investment income | — | (0.38) | (0.38) | (0.70) | (0.34) | |||||||||||||||
Net realized gains | — | (0.93) | (1.22) | (0.79) | — | |||||||||||||||
Total distributions | — | (1.31) | (1.60) | (1.49) | (0.34) | |||||||||||||||
Net asset value, end of period | $16.65 | $15.30 | $14.30 | $16.58 | $16.88 | |||||||||||||||
Total returnf | 8.82% | 16.20% | (3.98)% | 6.91% | 16.83% | |||||||||||||||
Ratios to average net assetsg | ||||||||||||||||||||
Expenses before waiver and payments by affiliates and expense reductionh | 0.73% | 0.71% | 0.74% | 0.74% | 2.10% | |||||||||||||||
Expenses net of waiver and payments by affiliates and expense reductionh,i | 0.71% | 0.71% | 0.74%j | 0.74% | 0.71% | |||||||||||||||
Expenses incurred in connection with securities sold short | —% | 0.01% | 0.04% | 0.04% | —%k | |||||||||||||||
Net investment income | 2.18% | 2.57%d | 1.83% | 3.23%e | 2.11% | |||||||||||||||
Supplemental data | ||||||||||||||||||||
Net assets, end of period (000’s) | $741 | $604 | $48,844 | $50,868 | $6 | |||||||||||||||
Portfolio turnover rate | 10.39% | 30.94% | 35.80% | 40.06% | 32.95% | |||||||||||||||
a For the period May 1, 2013 (effective date) to December 31, 2013.
b The amount shown for a share outstanding throughout the period may not correlate with the Statement of Operations for the period due to the timing of sales and repurchases of the Fund’s shares in relation to income earned and/or fluctuating fair value of the investments of the Fund.
c Based on average daily shares outstanding.
d Net investment income per share includes approximately $0.10 per share related to income received in the form of special dividends in connection with certain Fund holdings. Excluding this amount, the ratio of net investment income to average net assets would have been 1.90%.
e Net investment income per share includes approximately $0.24 per share related to income received in the form of a special dividend in connection with certain Fund holdings. Excluding this amount, the ratio of net investment income to average net assets would have been 1.83%.
f Total return is not annualized for periods less than one year.
g Ratios are annualized for periods less than one year.
h Includes dividend and/or interest expense on securities sold short and security borrowing fees, if any. See below for the ratios of such expenses to average net assets for the periods presented. See Note 1(d).
i Benefit of expense reduction rounds to less than 0.01%.
j Benefit of waiver and payments by affiliates rounds to less than 0.01%.
k Rounds to less than 0.01%.
franklintempleton.com |
The accompanying notes are an integral part of these financial statements. | |
Semiannual Report |
17 |
F R A N K L I N M U T U A L B E A C O N F U N D
Statement of Investments, June 30, 2017 (unaudited)
| Country | Shares | Value | ||||||||||||||
|
| |||||||||||||||
Common Stocks and Other Equity Interests 84.9% | ||||||||||||||||
Aerospace & Defense 2.9% | ||||||||||||||||
| a | KLX Inc. | United States | 2,360,689 | $ | 118,034,450 | |||||||||||
|
| |||||||||||||||
Auto Components 0.4% | ||||||||||||||||
| a,b | International Automotive Components Group Brazil LLC | Brazil | 2,846,329 | 69,618 | ||||||||||||
| a,b,c | International Automotive Components Group North America LLC | United States | 22,836,904 | 14,056,480 | ||||||||||||
|
| |||||||||||||||
| 14,126,098 | ||||||||||||||||
|
| |||||||||||||||
Banks 10.0% | ||||||||||||||||
JPMorgan Chase & Co. | United States | 1,337,400 | 122,238,360 | |||||||||||||
Societe Generale SA | France | 2,284,180 | 122,914,917 | |||||||||||||
| a | Standard Chartered PLC | United Kingdom | 4,695,355 | 47,533,047 | ||||||||||||
Wells Fargo & Co. | United States | 2,016,650 | 111,742,576 | |||||||||||||
|
| |||||||||||||||
| 404,428,900 | ||||||||||||||||
|
| |||||||||||||||
Chemicals 1.2% | ||||||||||||||||
| a, | d,e | Dow Corning Corp., Contingent Distribution | United States | 12,598,548 | — | |||||||||||
Monsanto Co. | United States | 409,620 | 48,482,623 | |||||||||||||
|
| |||||||||||||||
| 48,482,623 | ||||||||||||||||
|
| |||||||||||||||
Communications Equipment 4.3% | ||||||||||||||||
Cisco Systems Inc. | United States | 2,338,442 | 73,193,235 | |||||||||||||
Nokia OYJ, ADR | Finland | 16,607,263 | 102,300,740 | |||||||||||||
|
| |||||||||||||||
| 175,493,975 | ||||||||||||||||
|
| |||||||||||||||
Consumer Finance 2.9% | ||||||||||||||||
Capital One Financial Corp. | United States | 1,419,398 | 117,270,663 | |||||||||||||
|
| |||||||||||||||
Diversified Telecommunication Services 3.4% | ||||||||||||||||
Koninklijke KPN NV | Netherlands | 42,357,350 | 135,519,894 | |||||||||||||
|
| |||||||||||||||
Electrical Equipment 3.2% | ||||||||||||||||
| a | Sensata Technologies Holding NV | United States | 3,037,386 | 129,757,130 | ||||||||||||
|
| |||||||||||||||
Food & Staples Retailing 2.8% | ||||||||||||||||
| a | Rite Aid Corp. | United States | 6,467,611 | 19,079,452 | ||||||||||||
Walgreens Boots Alliance Inc. | United States | 1,177,451 | 92,206,188 | |||||||||||||
|
| |||||||||||||||
| 111,285,640 | ||||||||||||||||
|
| |||||||||||||||
Health Care Equipment & Supplies 5.1% | ||||||||||||||||
Medtronic PLC | United States | 1,649,990 | 146,436,613 | |||||||||||||
Stryker Corp. | United States | 435,540 | 60,444,241 | |||||||||||||
|
| |||||||||||||||
| 206,880,854 | ||||||||||||||||
|
| |||||||||||||||
Hotels, Restaurants & Leisure 2.7% | ||||||||||||||||
Accor SA | France | 2,335,910 | 109,515,989 | |||||||||||||
|
| |||||||||||||||
Independent Power & Renewable Electricity Producers 0.5% | ||||||||||||||||
Vistra Energy Corp. | United States | 1,256,451 | 21,095,812 | |||||||||||||
|
| |||||||||||||||
Insurance 1.4% | ||||||||||||||||
White Mountains Insurance Group Ltd | United States | 65,148 | 56,589,507 | |||||||||||||
|
| |||||||||||||||
Internet Software & Services 1.5% | ||||||||||||||||
| a | Baidu Inc., ADR. | China | 344,487 | 61,614,945 | ||||||||||||
|
| |||||||||||||||
IT Services 2.4% | ||||||||||||||||
Cognizant Technology Solutions Corp., A | United States | 1,437,830 | 95,471,912 | |||||||||||||
|
| |||||||||||||||
Media 7.7% | ||||||||||||||||
| a | Charter Communications Inc., A | United States | 239,187 | 80,570,141 | ||||||||||||
| a | DISH Network Corp., A | United States | 709,941 | 44,555,897 | ||||||||||||
Sky PLC | United Kingdom | 4,052,422 | 52,468,117 | |||||||||||||
18 |
Semiannual Report |
franklintempleton.com |
F R A N K L I N M U T U A L B E A C O N F U N D
S T A T E M E N T O F I N V E S T M E N T S (U N A U D I T E D)
| Country | Shares | Value | ||||||||||||
| ||||||||||||||
Common Stocks and Other Equity Interests (continued) | ||||||||||||||
Media (continued) | ||||||||||||||
Time Warner Inc. | United States | 1,351,872 | $ | 135,741,468 | ||||||||||
|
| |||||||||||||
| 313,335,623 | ||||||||||||||
|
| |||||||||||||
Metals & Mining 0.1% | ||||||||||||||
b,c | Warrior Met Coal Inc. | United States | 301,445 | 4,931,343 | ||||||||||
|
| |||||||||||||
Oil, Gas & Consumable Fuels 5.7% | ||||||||||||||
Marathon Oil Corp. | United States | 5,097,161 | 60,401,358 | |||||||||||
Royal Dutch Shell PLC, B | United Kingdom | 2,384,850 | 64,069,223 | |||||||||||
The Williams Cos. Inc. | United States | 3,549,332 | 107,473,773 | |||||||||||
|
| |||||||||||||
| 231,944,354 | ||||||||||||||
|
| |||||||||||||
Pharmaceuticals 12.0% | ||||||||||||||
Eli Lilly & Co. | United States | 1,203,639 | 99,059,490 | |||||||||||
GlaxoSmithKline PLC | United Kingdom | 2,900,817 | 61,796,704 | |||||||||||
Merck & Co. Inc. | United States | 1,764,077 | 113,059,695 | |||||||||||
Novartis AG, ADR | Switzerland | 1,728,690 | 144,293,754 | |||||||||||
Teva Pharmaceutical Industries Ltd., ADR | Israel | 2,022,480 | 67,186,785 | |||||||||||
|
| |||||||||||||
| 485,396,428 | ||||||||||||||
|
| |||||||||||||
Software 8.7% | ||||||||||||||
CA Inc. | United States | 1,812,066 | 62,461,915 | |||||||||||
a | Check Point Software Technologies Ltd. | Israel | 816,412 | 89,054,221 | ||||||||||
Microsoft Corp. | United States | 1,303,159 | 89,826,750 | |||||||||||
Symantec Corp. | United States | 3,943,254 | 111,396,925 | |||||||||||
|
| |||||||||||||
| 352,739,811 | ||||||||||||||
|
| |||||||||||||
Tobacco 3.1% | ||||||||||||||
British American Tobacco PLC | United Kingdom | 1,808,426 | 123,290,295 | |||||||||||
|
| |||||||||||||
Wireless Telecommunication Services 2.9% | ||||||||||||||
Vodafone Group PLC | United Kingdom | 41,827,469 | 118,635,367 | |||||||||||
|
| |||||||||||||
Total Common Stocks and Other Equity Interests (Cost $2,645,410,135) | 3,435,841,613 | |||||||||||||
|
| |||||||||||||
Preferred Stocks 5.2% | ||||||||||||||
Automobiles 2.5% | ||||||||||||||
f | Porsche Automobil Holding SE, 2.053%, pfd | Germany | 1,831,012 | 102,879,578 | ||||||||||
|
| |||||||||||||
Technology Hardware, Storage & Peripherals 2.7% | ||||||||||||||
f | Samsung Electronics Co. Ltd., 1.909%, pfd | South Korea | 66,285 | 107,799,315 | ||||||||||
|
| |||||||||||||
Total Preferred Stocks (Cost $147,563,120) | 210,678,893 | |||||||||||||
|
| |||||||||||||
| Principal Amount | ||||||||||||||
Corporate Notes and Senior Floating Rate Interests 1.8% | ||||||||||||||
g,h | Cumulus Media Holdings Inc., Term Loans, 4.48%, 12/23/20 | United States | $ | 15,063,918 | 12,182,943 | |||||||||
Frontier Communications Corp., | ||||||||||||||
senior note, 10.50%, 9/15/22 | United States | 2,650,000 | 2,534,062 | |||||||||||
senior note, 11.00%, 9/15/25 | United States | 23,907,000 | 22,143,859 | |||||||||||
iHeartCommunications Inc., | ||||||||||||||
senior secured note, first lien, 9.00%, 12/15/19 | United States | 18,873,000 | 14,886,079 | |||||||||||
g,h Tranche D Term Loan, 7.976%, 1/30/19 | United States | 15,813,483 | 12,967,056 | |||||||||||
g,h Tranche E Term Loan, 8.726%, 7/30/19 | United States | 5,080,935 | 4,166,367 | |||||||||||
franklintempleton.com |
Semiannual Report |
19 |
F R A N K L I N M U T U A L B E A C O N F U N D
S T A T E M E N T O F I N V E S T M E N T S ( U N A U D I T E D )
| Country | Principal Amount | Value | ||||||||||
| ||||||||||||
Corporate Notes and Senior Floating Rate Interests (continued) | ||||||||||||
iVeritas U.S. Inc./Veritas Bermuda Ltd., senior note, 144A, 7.50%, 2/01/23 | United States | $ | 2,112,000 | $ | 2,275,680 | |||||||
|
| |||||||||||
Total Corporate Notes and Senior Floating Rate Interests | 71,156,046 | |||||||||||
|
| |||||||||||
Corporate Notes and Senior Floating Rate Interests in | ||||||||||||
b,jBroadband Ventures III LLC, secured promissory note, 5.00%, 2/01/12 | United States | 10,848 | — | |||||||||
g,h,jCaesars Entertainment Operating Co. Inc., | ||||||||||||
Term B-5-B Loans, 1.50%, 3/01/17 | United States | 7,504,361 | 8,733,200 | |||||||||
Term B-6-B Loans, 1.50%, 3/01/17 | United States | 31,654,839 | 37,708,827 | |||||||||
Term B-7 Loans, 1.50%, 3/01/17 | United States | 10,119,494 | 12,611,420 | |||||||||
|
| |||||||||||
Total Corporate Notes and Senior Floating Rate Interests in | 59,053,447 | |||||||||||
|
| |||||||||||
| Shares | ||||||||||||
Companies in Liquidation 0.1% | ||||||||||||
aAdelphia Recovery Trust | United States | 48,268,724 | 31,375 | |||||||||
a,dAdelphia Recovery Trust, Arahova Contingent Value Vehicle, Contingent Distribution | United States | 6,161,087 | 616 | |||||||||
a,b,c,kCB FIM Coinvestors LLC | United States | 15,831,950 | — | |||||||||
a,d,eCentury Communications Corp., Contingent Distribution | United States | 16,986,000 | — | |||||||||
a,bFIM Coinvestor Holdings I, LLC | United States | 19,805,560 | — | |||||||||
a,lLehman Brothers Holdings Inc., Bankruptcy Claim | United States | 163,140,446 | 3,621,718 | |||||||||
a,d,eTribune Media, Litigation Trust, Contingent Distribution | United States | 497,438 | — | |||||||||
a,eVistra Energy Corp., Litigation Trust | United States | 74,588,735 | 865,230 | |||||||||
aVistra Energy Corp., Litigation Trust, TRA | United States | 1,256,451 | 1,350,684 | |||||||||
|
| |||||||||||
Total Companies in Liquidation (Cost $21,511,636) | 5,869,623 | |||||||||||
|
| |||||||||||
| Principal Amount | ||||||||||||
Municipal Bonds in Reorganization (Cost $14,893,535) 0.2% | ||||||||||||
j Puerto Rico Commonwealth GO, Refunding, Series A, 8.00%, 7/01/35 | United States | $ | 17,038,000 | 10,393,180 | ||||||||
|
| |||||||||||
Total Investments before Short Term Investments | 3,792,992,802 | |||||||||||
|
| |||||||||||
Short Term Investments 6.7% | ||||||||||||
U.S. Government and Agency Securities 6.7% | ||||||||||||
mFHLB, | ||||||||||||
7/03/17 | United States | 66,100,000 | 66,100,000 | |||||||||
7/05/17 | United States | 12,000,000 | 11,999,340 | |||||||||
mU.S. Treasury Bill, | ||||||||||||
n 8/31/17 - 9/07/17 | United States | 30,000,000 | 29,952,590 | |||||||||
7/20/17 - 12/21/17 | United States | 163,000,000 | 162,593,419 | |||||||||
|
| |||||||||||
Total U.S. Government and Agency Securities | 270,645,349 | |||||||||||
|
| |||||||||||
Total Investments (Cost $3,223,731,838) 100.4% | 4,063,638,151 | |||||||||||
Other Assets, less Liabilities (0.4)% | (16,217,571 | ) | ||||||||||
|
| |||||||||||
Net Assets 100.0% | $ | 4,047,420,580 | ||||||||||
|
| |||||||||||
20 |
Semiannual Report |
franklintempleton.com |
F R A N K L I N M U T U A L B E A C O N F U N D
S T A T E M E N T O F I N V E S T M E N T S ( U N A U D I T E D )
aNon-income producing.
bSee Note 10 regarding restricted securities.
cAt June 30, 2017, pursuant to the Fund’s policies and the requirements of applicable securities law, the Fund is restricted from trading these securities at period end.
dContingent distributions represent the right to receive additional distributions, if any, during the reorganization of the underlying company. Shares represent total underlying principal of debt securities.
eSecurity has been deemed illiquid because it may not be able to be sold within seven days. At June 30, 2017, the aggregate value of these securities was $865,230, representing less than 0.1% of net assets.
fVariable rate security. The rate shown represents the yield at period end.
gThe coupon rate shown represents the rate at period end.
hSee Note 1(e) regarding senior floating rate interests.
iSecurity was purchased pursuant to Rule 144A under the Securities Act of 1933 and may be sold in transactions exempt from registration only to qualified institutional buyers or in a public offering registered under the Securities Act of 1933. This security has been deemed liquid under guidelines approved by the Trust’s Board of Trustees. At June 30, 2017, the value of this security was $2,275,680, representing 0.1% of net assets.
jSee Note 8 regarding credit risk and defaulted securities.
kSee Note 12 regarding holdings of 5% voting securities.
lBankruptcy claims represent the right to receive distributions, if any, during the liquidation of the underlying pool of assets. Shares represent amount of allowed unsecured claims.
mThe security was issued on a discount basis with no stated coupon rate.
nA portion or all of the security has been segregated as collateral for open forward contracts. At June 30, 2017, the aggregate value of these securities and/or cash pledged amounted to $25,024,031, representing 0.6% of net assets.
franklintempleton.com |
Semiannual Report |
21 |
F R A N K L I N M U T U A L B E A C O N F U N D
S T A T E M E N T O F I N V E S T M E N T S ( U N A U D I T E D )
At June 30, 2017, the Fund had the following futures contracts outstanding. See Note 1(c).
Futures Contracts
| Description | Type | Number of Contracts | Notional Value | Expiration Date | Unrealized Appreciation | Unrealized Depreciation | ||||||||||||||||||
| ||||||||||||||||||||||||
| Currency Contracts | ||||||||||||||||||||||||
EUR/USD | Short | 1,210 | $ | 173,438,375 | 9/18/17 | $ — | $ | (3,035,891 | ) | |||||||||||||||
GBP/USD | Short | 1,648 | 134,363,500 | 9/18/17 | — | (2,736,471 | ) | |||||||||||||||||
|
| |||||||||||||||||||||||
Total Futures Contracts | $ — | $ | (5,772,362 | ) | ||||||||||||||||||||
|
| |||||||||||||||||||||||
Net unrealized appreciation (depreciation) | $ | (5,772,362 | ) | |||||||||||||||||||||
|
| |||||||||||||||||||||||
At June 30, 2017, the Fund had the following forward exchange contracts outstanding. See Note 1(c).
Forward Exchange Contracts
| Currency | Counterpartya | Type | Quantity | Contract Amount | Settlement Date | Unrealized Appreciation | Unrealized Depreciation | |||||||||||||||||||||
| ||||||||||||||||||||||||||||
| OTC Forward Exchange Contracts | ||||||||||||||||||||||||||||
Euro | BOFA | Buy | 7,336,420 | $ | 8,235,896 | 7/12/17 | $ | 149,773 | $ | — | ||||||||||||||||||
Euro | BONY | Buy | 5,712,218 | 6,433,898 | 7/12/17 | 95,277 | — | |||||||||||||||||||||
Euro | BONY | Sell | 3,150,701 | 3,399,426 | 7/12/17 | — | (201,885 | ) | ||||||||||||||||||||
Euro | FBCO | Sell | 39,614,788 | 42,640,169 | 7/12/17 | — | (2,640,294 | ) | ||||||||||||||||||||
Euro | HSBK | Buy | 6,943,701 | 7,824,382 | 7/12/17 | 112,402 | — | |||||||||||||||||||||
Euro | HSBK | Sell | 1,182,297 | 1,262,272 | 7/12/17 | — | (89,117 | ) | ||||||||||||||||||||
Euro | SSBT | Buy | 5,190,351 | 5,860,513 | 7/12/17 | 72,158 | — | |||||||||||||||||||||
Euro | SSBT | Sell | 40,514,951 | 43,593,755 | 7/12/17 | — | (2,715,612 | ) | ||||||||||||||||||||
Euro | UBSW | Buy | 2,953,891 | 3,370,068 | 7/12/17 | 6,286 | — | |||||||||||||||||||||
Euro | UBSW | Sell | 165,491 | 177,874 | 7/12/17 | — | (11,287 | ) | ||||||||||||||||||||
British Pound | BOFA | Buy | 403,632 | 515,920 | 7/13/17 | 10,067 | — | |||||||||||||||||||||
British Pound | BONY | Sell | 9,050,653 | 11,324,832 | 7/13/17 | — | (469,404 | ) | ||||||||||||||||||||
British Pound | FBCO | Sell | 669,294 | 818,549 | 7/13/17 | — | (53,632 | ) | ||||||||||||||||||||
British Pound | HSBK | Sell | 12,059,069 | 14,671,244 | 7/13/17 | — | (1,043,362 | ) | ||||||||||||||||||||
British Pound | SSBT | Buy | 2,950,000 | 3,825,964 | 7/13/17 | 18,288 | — | |||||||||||||||||||||
British Pound | SSBT | Sell | 14,828,280 | 18,053,189 | 7/13/17 | — | (1,270,083 | ) | ||||||||||||||||||||
British Pound | UBSW | Buy | 402,080 | 514,105 | 7/13/17 | 9,860 | — | |||||||||||||||||||||
British Pound | UBSW | Sell | 560,086 | 691,537 | 7/13/17 | — | (38,333 | ) | ||||||||||||||||||||
Euro | BOFA | Sell | 3,274,989 | 3,538,302 | 7/26/17 | — | (208,016 | ) | ||||||||||||||||||||
Euro | HSBK | Sell | 5,825,495 | 6,259,662 | 7/26/17 | — | (404,228 | ) | ||||||||||||||||||||
Euro | SSBT | Sell | 3,171,676 | 3,417,639 | 7/26/17 | — | (210,498 | ) | ||||||||||||||||||||
Euro | UBSW | Sell | 4,957,444 | 5,333,068 | 7/26/17 | — | (337,840 | ) | ||||||||||||||||||||
South Korean Won | BOFA | Sell | 1,072,174,701 | 939,680 | 8/11/17 | 3,021 | — | |||||||||||||||||||||
South Korean Won | HSBK | Buy | 24,476,285,007 | 21,788,111 | 8/11/17 | — | (405,467 | ) | ||||||||||||||||||||
South Korean Won | HSBK | Sell | 60,978,314,488 | 53,575,099 | 8/11/17 | 304,040 | — | |||||||||||||||||||||
South Korean Won | UBSW | Buy | 14,289,096,521 | 12,642,187 | 8/11/17 | — | (159,138 | ) | ||||||||||||||||||||
South Korean Won | UBSW | Sell | 2,120,236,200 | 1,848,909 | 8/11/17 | — | (3,343 | ) | ||||||||||||||||||||
South Korean Won | UBSW | Sell | 45,404,427,391 | 40,041,050 | 8/11/17 | 375,442 | — | |||||||||||||||||||||
British Pound | BOFA | Sell | 4,188,836 | 5,241,228 | 8/14/17 | — | (222,885 | ) | ||||||||||||||||||||
British Pound | HSBK | Sell | 13,098,411 | 16,455,420 | 8/14/17 | — | (630,761 | ) | ||||||||||||||||||||
British Pound | SSBT | Sell | 5,508,802 | 6,904,313 | 8/14/17 | — | (281,626 | ) | ||||||||||||||||||||
British Pound | UBSW | Sell | 11,790,410 | 14,813,704 | 8/14/17 | — | (566,258 | ) | ||||||||||||||||||||
Euro | BOFA | Sell | 6,579,168 | 7,037,589 | 8/18/17 | — | (497,266 | ) | ||||||||||||||||||||
Euro | BONY | Sell | 3,851,450 | 4,141,559 | 8/18/17 | — | (269,351 | ) | ||||||||||||||||||||
Euro | HSBK | Sell | 5,966,690 | 6,397,568 | 8/18/17 | — | (435,842 | ) | ||||||||||||||||||||
22 |
Semiannual Report |
franklintempleton.com |
F R A N K L I N M U T U A L B E A C O N F U N D
S T A T E M E N T O F I N V E S T M E N T S ( U N A U D I T E D )
Forward Exchange Contracts (continued)
| Currency | Counterpartya | Type | Quantity | Contract Amount | Settlement Date | Unrealized Appreciation | Unrealized Depreciation | |||||||||||||||||
| ||||||||||||||||||||||||
OTC Forward Exchange Contracts (continued) | ||||||||||||||||||||||||
Euro | SSBT | Sell | 15,657,644 | $ | 16,865,538 | 8/18/17 | $ | — | $ | (1,066,527 | ) | |||||||||||||
Euro | UBSW | Sell | 13,579,979 | 14,500,142 | 8/18/17 | — | (1,052,459 | ) | ||||||||||||||||
Euro | BOFA | Sell | 18,837,838 | 20,235,705 | 10/10/17 | — | (1,401,340 | ) | ||||||||||||||||
Euro | BONY | Sell | 808,122 | 893,217 | 10/10/17 | — | (34,988 | ) | ||||||||||||||||
Euro | HSBK | Sell | 12,268,797 | 13,202,453 | 10/10/17 | — | (889,425 | ) | ||||||||||||||||
Euro | SSBT | Sell | 1,548,959 | 1,713,116 | 10/10/17 | — | (66,010 | ) | ||||||||||||||||
Euro | BOFA | Sell | 3,457,296 | 3,811,356 | 10/18/17 | — | (161,498 | ) | ||||||||||||||||
Euro | BONY | Sell | 7,502,763 | 8,244,058 | 10/18/17 | — | (377,529 | ) | ||||||||||||||||
Euro | HSBK | Sell | 25,249,934 | 27,198,320 | 10/18/17 | — | (1,816,927 | ) | ||||||||||||||||
Euro | UBSW | Sell | 21,792,638 | 23,393,962 | 10/18/17 | — | (1,648,431 | ) | ||||||||||||||||
British Pound | BOFA | Sell | 8,982,678 | 11,643,705 | 10/24/17 | — | (99,058 | ) | ||||||||||||||||
British Pound | HSBK | Sell | 1,084,850 | 1,418,594 | 10/24/17 | 404 | — | |||||||||||||||||
British Pound | HSBK | Sell | 4,596,178 | 5,968,034 | 10/24/17 | — | (40,402 | ) | ||||||||||||||||
British Pound | SSBT | Sell | 3,390,078 | 4,385,237 | 10/24/17 | — | (46,502 | ) | ||||||||||||||||
British Pound | SSBT | Sell | 6,216,082 | 8,130,652 | 10/24/17 | 4,568 | — | |||||||||||||||||
British Pound | UBSW | Sell | 449,756 | 580,542 | 10/24/17 | — | (7,409 | ) | ||||||||||||||||
Euro | BOFA | Sell | 32,637,667 | 35,956,428 | 11/06/17 | — | (1,589,122 | ) | ||||||||||||||||
Euro | SSBT | Sell | 6,552,885 | 7,319,770 | 11/06/17 | — | (218,505 | ) | ||||||||||||||||
Euro | UBSW | Sell | 33,317,513 | 36,704,456 | 11/06/17 | — | (1,623,172 | ) | ||||||||||||||||
South Korean Won | HSBK | Sell | 19,097,865,681 | 16,906,581 | 11/10/17 | 194,301 | — | |||||||||||||||||
South Korean Won | UBSW | Sell | 32,332,508,667 | 28,553,529 | 11/10/17 | 259,795 | — | |||||||||||||||||
Euro | BOFA | Sell | 34,734,496 | 38,824,657 | 11/20/17 | — | (1,165,165 | ) | ||||||||||||||||
Euro | SSBT | Sell | 1,494,318 | 1,691,685 | 11/20/17 | — | (28,724 | ) | ||||||||||||||||
Euro | UBSW | Sell | 34,734,496 | 38,823,788 | 11/20/17 | — | (1,166,034 | ) | ||||||||||||||||
British Pound | BOFA | Sell | 2,433,653 | 3,189,069 | 11/24/17 | 4,661 | — | |||||||||||||||||
British Pound | BOFA | Sell | 6,401,514 | 8,296,480 | 11/24/17 | — | (79,831 | ) | ||||||||||||||||
British Pound | BONY | Sell | 769,137 | 992,879 | 11/24/17 | — | (13,528 | ) | ||||||||||||||||
British Pound | BONY | Sell | 17,784,148 | 23,287,488 | 11/24/17 | 17,132 | — | |||||||||||||||||
British Pound | HSBK | Sell | 117,206 | 150,981 | 11/24/17 | — | (2,382 | ) | ||||||||||||||||
British Pound | HSBK | Sell | 2,492,972 | 3,264,074 | 11/24/17 | 2,047 | — | |||||||||||||||||
British Pound | SSBT | Sell | 885,454 | 1,159,850 | 11/24/17 | 1,243 | — | |||||||||||||||||
British Pound | SSBT | Sell | 1,228,348 | 1,592,491 | 11/24/17 | — | (14,789 | ) | ||||||||||||||||
British Pound | UBSW | Sell | 236,761 | 301,105 | 11/24/17 | — | (8,694 | ) | ||||||||||||||||
British Pound | UBSW | Sell | 21,067,094 | 27,583,313 | 11/24/17 | 17,259 | — | |||||||||||||||||
|
| |||||||||||||||||||||||
Total Forward Exchange Contracts | $ | 1,658,024 | $ | (27,783,979 | ) | |||||||||||||||||||
|
| |||||||||||||||||||||||
Net unrealized appreciation (depreciation) | $ | (26,125,955 | ) | |||||||||||||||||||||
|
| |||||||||||||||||||||||
aMay be comprised of multiple contracts with the same counterparty, currency and settlement date.
See Note 11 regarding other derivative information.
See Abbreviations on page 39.
franklintempleton.com |
The accompanying notes are an integral part of these financial statements. |
Semiannual Report |
23 |
F R A N K L I N M U T U A L B E A C O N F U N D
Statement of Assets and Liabilities
June 30, 2017 (unaudited)
Assets: | ||||
Investments in securities: | ||||
Cost - Unaffiliated issuers | $ | 3,223,731,838 | ||
|
| |||
Value - Unaffiliated issuers | $ | 4,063,638,151 | ||
Cash. | 235,459 | |||
Receivables: | ||||
Capital shares sold | 2,434,465 | |||
Dividends and interest | 8,073,268 | |||
European Union tax reclaims | 1,948,273 | |||
Due from brokers | 6,262,830 | |||
Unrealized appreciation on OTC forward exchange contracts | 1,658,024 | |||
Other assets | 2,555 | |||
|
| |||
Total assets | 4,084,253,025 | |||
|
| |||
Liabilities: | ||||
Payables: | ||||
Capital shares redeemed | 4,996,946 | |||
Management fees | 2,258,132 | |||
Distribution fees | 890,394 | |||
Transfer agent fees | 462,182 | |||
Trustees’ fees and expenses | 220,939 | |||
Variation margin | 37,537 | |||
Unrealized depreciation on OTC forward exchange contracts | 27,783,979 | |||
Accrued expenses and other liabilities. | 182,336 | |||
|
| |||
Total liabilities | 36,832,445 | |||
|
| |||
Net assets, at value | $ | 4,047,420,580 | ||
|
| |||
Net assets consist of: | ||||
Paid-in capital | $ | 3,098,461,671 | ||
Undistributed net investment income | 37,572,578 | |||
Net unrealized appreciation (depreciation) | 808,058,340 | |||
Accumulated net realized gain (loss) | 103,327,991 | |||
|
| |||
Net assets, at value | $ | 4,047,420,580 | ||
|
|
24 |
Semiannual Report |
The accompanying notes are an integral part of these financial statements. |
franklintempleton.com |
F R A N K L I N M U T U A L B E A C O N F U N D
F I N A N C I A L S T A T E M E N T S
Statement of Assets and Liabilities (continued)
June 30, 2017 (unaudited)
| Class Z: | ||||
Net assets, at value | $ | 2,772,593,500 | ||
|
| |||
Shares outstanding | 166,577,645 | |||
|
| |||
Net asset value and maximum offering price per share | $16.64 | |||
|
| |||
| Class A: | ||||
Net assets, at value | $ | 1,000,641,925 | ||
|
| |||
Shares outstanding | 60,685,067 | |||
|
| |||
Net asset value per sharea | $16.49 | |||
|
| |||
Maximum offering price per share (net asset value per share ÷ 94.25%) | $17.50 | |||
|
| |||
| Class C: | ||||
Net assets, at value | $ | 271,282,662 | ||
|
| |||
Shares outstanding | 16,640,558 | |||
|
| |||
Net asset value and maximum offering price per sharea | $16.30 | |||
|
| |||
| Class R: | ||||
Net assets, at value | $ | 2,161,941 | ||
|
| |||
Shares outstanding | 132,772 | |||
|
| |||
Net asset value and maximum offering price per share | $16.28 | |||
|
| |||
| Class R6: | ||||
Net assets, at value | $ | 740,552 | ||
|
| |||
Shares outstanding | 44,480 | |||
|
| |||
Net asset value and maximum offering price per share | $16.65 | |||
|
|
aRedemption price is equal to net asset value less contingent deferred sales charges, if applicable.
franklintempleton.com |
The accompanying notes are an integral part of these financial statements. |
Semiannual Report |
25 |
F R A N K L I N M U T U A L B E A C O N F U N D
F I N A N C I A L S T A T E M E N T S
Statement of Operations
for the six months ended June 30, 2017 (unaudited)
Investment income: | ||||
Dividends (net of foreign taxes of $4,168,089) | $ 52,000,923 | |||
Interest | 5,406,844 | |||
|
| |||
Total investment income | 57,407,767 | |||
|
| |||
Expenses: | ||||
Management fees (Note 3a) | 13,424,264 | |||
Distribution fees: (Note 3c) | ||||
Class A | 1,250,358 | |||
Class C | 1,399,071 | |||
Class R | 5,238 | |||
Transfer agent fees: (Note 3e) | ||||
Class Z | 1,090,462 | |||
Class A | 404,864 | |||
Class C | 113,313 | |||
Class R | 849 | |||
Class R6 | 196 | |||
Custodian fees (Note 4) | 70,786 | |||
Reports to shareholders | 108,384 | |||
Registration and filing fees | 64,502 | |||
Professional fees | 123,970 | |||
Trustees’ fees and expenses | 58,234 | |||
Other | 50,690 | |||
|
| |||
Total expenses | 18,165,181 | |||
Expense reductions (Note 4) | (5,051 | ) | ||
Expenses waived/paid by affiliates (Note 3f) | (135 | ) | ||
|
| |||
Net expenses | 18,159,995 | |||
|
| |||
Net investment income | 39,247,772 | |||
|
| |||
Realized and unrealized gains (losses): | ||||
Net realized gain (loss) from: | ||||
Investments | 94,437,714 | |||
Written options | 1,792,806 | |||
Foreign currency transactions | 5,998,852 | |||
Futures contracts | (8,367,161 | ) | ||
Securities sold short | 1,346,585 | |||
|
| |||
Net realized gain (loss) | 95,208,796 | |||
|
| |||
Net change in unrealized appreciation (depreciation) on: | ||||
Investments. | 254,344,546 | |||
Translation of other assets and liabilities denominated in foreign currencies | (48,545,145 | ) | ||
Written options | (542,578 | ) | ||
Futures contracts | (9,201,212 | ) | ||
|
| |||
Net change in unrealized appreciation (depreciation) | 196,055,611 | |||
|
| |||
Net realized and unrealized gain (loss) | 291,264,407 | |||
|
| |||
Net increase (decrease) in net assets resulting from operations | $330,512,179 | |||
|
|
26 |
Semiannual Report |
The accompanying notes are an integral part of these financial statements. |
franklintempleton.com |
F R A N K L I N M U T U A L B E A C O N F U N D
F I N A N C I A L S T A T E M E N T S
Statements of Changes in Net Assets
| Six Months Ended June 30, 2017 (unaudited) | Year Ended December 31, 2016 | |||||||
| ||||||||
Increase (decrease) in net assets: | ||||||||
Operations: | ||||||||
Net investment income | $ | 39,247,772 | $ | 86,695,303 | ||||
Net realized gain (loss) | 95,208,796 | 238,903,177 | ||||||
Net change in unrealized appreciation (depreciation) | 196,055,611 | 224,718,936 | ||||||
|
| |||||||
Net increase (decrease) in net assets resulting from operations | 330,512,179 | 550,317,416 | ||||||
|
| |||||||
Distributions to shareholders from: | ||||||||
Net investment income: | ||||||||
Class Z | — | (58,200,382 | ) | |||||
Class A | — | (20,284,242 | ) | |||||
Class C | — | (3,677,329 | ) | |||||
Class R | — | (37,485 | ) | |||||
Class R6 | — | (1,152,424 | ) | |||||
Net realized gains: | ||||||||
Class Z | — | (146,912,444 | ) | |||||
Class A | — | (57,880,823 | ) | |||||
Class C | — | (16,247,924 | ) | |||||
Class R | — | (118,154 | ) | |||||
Class R6 | — | (2,834,009 | ) | |||||
|
| |||||||
Total distributions to shareholders | — | (307,345,216 | ) | |||||
|
| |||||||
Capital share transactions: (Note 2) | ||||||||
Class Z | (16,029,256 | ) | (13,134,883 | ) | ||||
Class A | (75,096,509 | ) | (92,115,190 | ) | ||||
Class C | (26,205,338 | ) | (27,695,808 | ) | ||||
Class R | (44,561 | ) | (406,764 | ) | ||||
Class R6 | 79,982 | (51,666,995 | ) | |||||
|
| |||||||
Total capital share transactions | (117,295,682 | ) | (185,019,640 | ) | ||||
|
| |||||||
Net increase (decrease) in net assets. | 213,216,497 | 57,952,560 | ||||||
Net assets: | ||||||||
Beginning of period | 3,834,204,083 | 3,776,251,523 | ||||||
|
| |||||||
End of period | $ | 4,047,420,580 | $ | 3,834,204,083 | ||||
|
| |||||||
Undistributed net investment income included in net assets: | ||||||||
End of period | $ | 37,572,578 | $ | — | ||||
|
| |||||||
Distributions in excess of net investment income included in net assets: | ||||||||
End of period | $ | — | $ | (1,675,194) | ||||
|
| |||||||
franklintempleton.com |
The accompanying notes are an integral part of these financial statements. |
Semiannual Report |
27 |
F R A N K L I N M U T U A L B E A C O N F U N D
Notes to Financial Statements (unaudited)
1. Organization and Significant Accounting Policies
Franklin Mutual Series Funds (Trust) is registered under the Investment Company Act of 1940 (1940 Act) as an open-end management investment company, consisting of seven separate funds and applies the specialized accounting and reporting guidance in U.S. Generally Accepted Accounting Principles (U.S. GAAP). Franklin Mutual Beacon Fund (Fund) is included in this report. The Fund offers five classes of shares: Class Z, Class A, Class C, Class R and Class R6. Each class of shares may differ by its initial sales load, contingent deferred sales charges, voting rights on matters affecting a single class, its exchange privilege and fees primarily due to differing arrangements for distribution and transfer agent fees.
The following summarizes the Fund’s significant accounting policies.
a. Financial Instrument Valuation
The Fund’s investments in financial instruments are carried at fair value daily. Fair value is the price that would be received to sell an asset or paid to transfer a liability in an orderly transaction between market participants on the measurement date. The Fund calculates the net asset value (NAV) per share as of 4 p.m. Eastern time each day the New York Stock Exchange (NYSE) is open for trading. Under compliance policies and procedures approved by the Trust’s Board of Trustees (the Board), the Fund’s administrator has responsibility for oversight of valuation, including leading the cross-functional Valuation Committee (VC). The VC provides administration and oversight of the Fund’s valuation policies and procedures, which are approved annually by the Board. Among other things, these procedures allow the Fund to utilize independent pricing services, quotations from securities and financial instrument dealers, and other market sources to determine fair value.
Equity securities and derivative financial instruments listed on an exchange or on the NASDAQ National Market System are valued at the last quoted sale price or the official closing price of the day, respectively. Foreign equity securities are valued as of the close of trading on the foreign stock exchange on which the security is primarily traded, or as of 4 p.m. Eastern time. The value is then converted into its U.S. dollar equivalent at the foreign exchange rate in effect at 4 p.m. Eastern time on the day that the value of the security is determined. Over-the-counter (OTC) securities are valued within the range of the most recent
quoted bid and ask prices. Securities that trade in multiple markets or on multiple exchanges are valued according to the broadest and most representative market. Certain equity securities are valued based upon fundamental characteristics or relationships to similar securities.
Debt securities generally trade in the OTC market rather than on a securities exchange. The Fund’s pricing services use multiple valuation techniques to determine fair value. In instances where sufficient market activity exists, the pricing services may utilize a market-based approach through which quotes from market makers are used to determine fair value. In instances where sufficient market activity may not exist or is limited, the pricing services also utilize proprietary valuation models which may consider market characteristics such as benchmark yield curves, credit spreads, estimated default rates, anticipated market interest rate volatility, coupon rates, anticipated timing of principal repayments, underlying collateral, and other unique security features in order to estimate the relevant cash flows, which are then discounted to calculate the fair value.
Certain derivative financial instruments trade in the OTC market. The Fund’s pricing services use various techniques including industry standard option pricing models and proprietary discounted cash flow models to determine the fair value of those instruments. The Fund’s net benefit or obligation under the derivative contract, as measured by the fair value of the contract, is included in net assets.
The Fund has procedures to determine the fair value of financial instruments for which market prices are not reliable or readily available. Under these procedures, the VC convenes on a regular basis to review such financial instruments and considers a number of factors, including significant unobservable valuation inputs, when arriving at fair value. The VC primarily employs a market-based approach which may use related or comparable assets or liabilities, recent transactions, market multiples, book values, and other relevant information for the investment to determine the fair value of the investment. An income-based valuation approach may also be used in which the anticipated future cash flows of the investment are discounted to calculate fair value. Discounts may also be applied due to the nature or duration of any restrictions on the disposition of the investments. Due to the inherent uncertainty of valuations of such investments, the fair values may differ significantly from the values that would have been used had an active market existed. The VC employs various methods for calibrating these
28 |
Semiannual Report |
franklintempleton.com |
F R A N K L I N M U T U A L B E A C O N F U N D
N O T E S T O F I N A N C I A L S T A T E M E N T S ( U N A U D I T E D )
valuation approaches including a regular review of key inputs and assumptions, transactional back-testing or disposition analysis, and reviews of any related market activity.
Trading in securities on foreign securities stock exchanges and OTC markets may be completed before 4 p.m. Eastern time. In addition, trading in certain foreign markets may not take place on every Fund’s business day. Occasionally, events occur between the time at which trading in a foreign security is completed and 4 p.m. Eastern time that might call into question the reliability of the value of a portfolio security held by the Fund. As a result, differences may arise between the value of the Fund’s portfolio securities as determined at the foreign market close and the latest indications of value at 4 p.m. Eastern time. In order to minimize the potential for these differences, the VC monitors price movements following the close of trading in foreign stock markets through a series of country specific market proxies (such as baskets of American Depositary Receipts, futures contracts and exchange traded funds). These price movements are measured against established trigger thresholds for each specific market proxy to assist in determining if an event has occurred that may call into question the reliability of the values of the foreign securities held by the Fund. If such an event occurs, the securities may be valued using fair value procedures, which may include the use of independent pricing services.
When the last day of the reporting period is a non-business day, certain foreign markets may be open on those days that the Fund’s NAV is not calculated, which could result in differences between the value of the Fund’s portfolio securities on the last business day and the last calendar day of the reporting period. Any significant security valuation changes due to an open foreign market are adjusted and reflected by the Fund for financial reporting purposes.
b. Foreign Currency Translation
Portfolio securities and other assets and liabilities denominated in foreign currencies are translated into U.S. dollars based on the exchange rate of such currencies against U.S. dollars on the date of valuation. The Fund may enter into foreign currency exchange contracts to facilitate transactions denominated in a foreign currency. Purchases and sales of securities, income and expense items denominated in foreign currencies are translated into U.S. dollars at the exchange rate in effect on the transaction date. Portfolio securities and assets and liabilities denominated in foreign currencies contain risks that those currencies will
decline in value relative to the U.S. dollar. Occasionally, events may impact the availability or reliability of foreign exchange rates used to convert the U.S. dollar equivalent value. If such an event occurs, the foreign exchange rate will be valued at fair value using procedures established and approved by the Board.
The Fund does not separately report the effect of changes in foreign exchange rates from changes in market prices on securities held. Such changes are included in net realized and unrealized gain or loss from investments in the Statement of Operations.
Realized foreign exchange gains or losses arise from sales of foreign currencies, currency gains or losses realized between the trade and settlement dates on securities transactions and the difference between the recorded amounts of dividends, interest, and foreign withholding taxes and the U.S. dollar equivalent of the amounts actually received or paid. Net unrealized foreign exchange gains and losses arise from changes in foreign exchange rates on foreign denominated assets and liabilities other than investments in securities held at the end of the reporting period.
c. Derivative Financial Instruments
The Fund invested in derivative financial instruments in order to manage risk or gain exposure to various other investments or markets. Derivatives are financial contracts based on an underlying or notional amount, require no initial investment or an initial net investment that is smaller than would normally be required to have a similar response to changes in market factors, and require or permit net settlement. Derivatives contain various risks including the potential inability of the counterparty to fulfill their obligations under the terms of the contract, the potential for an illiquid secondary market, and/or the potential for market movements which expose the Fund to gains or losses in excess of the amounts shown in the Statement of Assets and Liabilities. Realized gain and loss and unrealized appreciation and depreciation on these contracts for the period are included in the Statement of Operations.
Derivative counterparty credit risk is managed through a formal evaluation of the creditworthiness of all potential counter-parties. The Fund attempts to reduce its exposure to counterparty credit risk on OTC derivatives, whenever possible, by entering into International Swaps and Derivatives Association (ISDA) master agreements with certain counterparties. These agreements contain various provisions,
franklintempleton.com |
Semiannual Report |
29 |
F R A N K L I N M U T U A L B E A C O N F U N D
N O T E S T O F I N A N C I A L S T A T E M E N T S ( U N A U D I T E D )
1. Organization and Significant Accounting Policies (continued)
c. Derivative Financial Instruments (continued)
including but not limited to collateral requirements, events of default, or early termination. Termination events applicable to the counterparty include certain deteriorations in the credit quality of the counterparty. Termination events applicable to the Fund include failure of the Fund to maintain certain net asset levels and/or limit the decline in net assets over various periods of time. In the event of default or early termination, the ISDA master agreement gives the non-defaulting party the right to net and close-out all transactions traded, whether or not arising under the ISDA agreement, to one net amount payable by one counterparty to the other. However, absent an event of default or early termination, OTC derivative assets and liabilities are presented gross and not offset in the Statement of Assets and Liabilities. Early termination by the counterparty may result in an immediate payment by the Fund of any net liability owed to that counterparty under the ISDA agreement. At June 30, 2017, the Fund had OTC derivatives in a net liability position of $26,125,955 and the aggregate value of collateral pledged for such contracts was $25,024,031.
Collateral requirements differ by type of derivative. Collateral or initial margin requirements are set by the broker or exchange clearing house for exchange traded and centrally cleared derivatives. Initial margin deposited is held at the exchange and can be in the form of cash and/or securities. For OTC derivatives traded under an ISDA master agreement, posting of collateral is required by either the Fund or the applicable counterparty if the total net exposure of all OTC derivatives with the applicable counterparty exceeds the minimum transfer amount, which typically ranges from $100,000 to $250,000, and can vary depending on the counterparty and the type of the agreement. Generally, collateral is determined at the close of Fund business each day and any additional collateral required due to changes in derivative values may be delivered by the Fund or the counterparty the next business day, or within a few business days. Collateral pledged and/or received by the Fund for OTC derivatives, if any, is held in segregated accounts with the Fund’s custodian/counterparty broker and can be in the form of cash and/or securities. Unrestricted cash may be invested according to the Fund’s investment objectives. To the extent that the amounts due to the Fund from its counterparties are not subject to collateralization or are not fully collateralized, the Fund bears the risk of loss from counterparty non-performance.
The Fund entered into exchange traded futures contracts primarily to manage exposure to certain foreign currencies. A futures contract is an agreement between the Fund and a counterparty to buy or sell an asset at a specified price on a future date. Required initial margins are pledged by the Fund, and the daily change in fair value is accounted for as a variation margin payable or receivable in the Statement of Assets and Liabilities.
The Fund entered into OTC forward exchange contracts primarily to manage exposure to certain foreign currencies. A forward exchange contract is an agreement between the Fund and a counterparty to buy or sell a foreign currency at a specific exchange rate on a future date.
The Fund purchased or wrote exchange traded option contracts primarily to manage exposure to equity price risk. An option is a contract entitling the holder to purchase or sell a specific amount of shares or units of an asset or notional amount of a swap (swaption), at a specified price. When an option is purchased or written, an amount equal to the premium paid or received is recorded as an asset or liability, respectively. Upon exercise of an option, the acquisition cost or sales proceeds of the underlying investment is adjusted by any premium received or paid. Upon expiration of an option, any premium received or paid is recorded as a realized gain or loss. Upon closing an option other than through expiration or exercise, the difference between the premium received or paid and the cost to close the position is recorded as a realized gain or loss.
See Notes 7 and 11 regarding investment transactions and other derivative information, respectively.
d. Securities Sold Short
The Fund is engaged in selling securities short, which obligates the Fund to replace a borrowed security with the same security at current fair value. The Fund incurs a loss if the price of the security increases between the date of the short sale and the date on which the Fund replaces the borrowed security. The Fund realizes a gain if the price of the security declines between those dates. Gains are limited to the price at which the Fund sold the security short, while losses are potentially unlimited in size.
The Fund is required to establish a margin account with the broker lending the security sold short. While the short sale is outstanding, the broker retains the proceeds of the short sale to the extent necessary to meet margin requirements until the short position is closed out. A deposit must also be maintained with
30 |
Semiannual Report |
franklintempleton.com |
F R A N K L I N M U T U A L B E A C O N F U N D
N O T E S T O F I N A N C I A L S T A T E M E N T S ( U N A U D I T E D )
the Fund’s custodian/counterparty broker consisting of cash and/or securities having a value equal to a specified percentage of the value of the securities sold short. The Fund is obligated to pay fees for borrowing the securities sold short and is required to pay the counterparty any dividends and/or interest due on securities sold short. Such dividends and/or interest and any security borrowing fees are recorded as an expense to the Fund. At June 30, 2017, the Fund had no securities sold short.
e. Senior Floating Rate Interests
The Fund invests in senior secured corporate loans that pay interest at rates which are periodically reset by reference to a base lending rate plus a spread. These base lending rates are generally the prime rate offered by a designated U.S. bank or the London InterBank Offered Rate (LIBOR). Senior secured corporate loans often require prepayment of principal from excess cash flows or at the discretion of the borrower. As a result, actual maturity may be substantially less than the stated maturity. Senior secured corporate loans in which the Fund invests are generally readily marketable, but may be subject to certain restrictions on resale.
f. Income and Deferred Taxes
It is the Fund’s policy to qualify as a regulated investment company under the Internal Revenue Code. The Fund intends to distribute to shareholders substantially all of its taxable income and net realized gains to relieve it from federal income and excise taxes. As a result, no provision for U.S. federal income taxes is required.
The Fund may be subject to foreign taxation related to income received, capital gains on the sale of securities and certain foreign currency transactions in the foreign jurisdictions in which it invests. Foreign taxes, if any, are recorded based on the tax regulations and rates that exist in the foreign markets in which the Fund invests. When a capital gain tax is determined to apply, the Fund records an estimated deferred tax liability in an amount that would be payable if the securities were disposed of on the valuation date. As a result of several court cases, in certain countries across the European Union, the Fund filed additional tax reclaims for previously withheld taxes on dividends earned in those countries (EU reclaims). These additional filings are subject to various administrative proceedings by the local jurisdictions’ tax authorities within the European Union, as well as a number of related judicial proceedings. Income recognized, if any, for EU reclaims is reflected as other income in the Statement of Operations and
any related receivable, if any, is reflected as European Union tax reclaims in the Statement of Assets and Liabilities. When uncertainty exists as to the ultimate resolution of these proceedings, the likelihood of receipt of these EU reclaims, and the potential timing of payment, no amounts are reflected in the financial statements. For U.S. income tax purposes, EU reclaims received by the Fund, if any, reduce the amounts of foreign taxes Fund shareholders can use as tax credits in their individual income tax returns.
The Fund may recognize an income tax liability related to its uncertain tax positions under U.S. GAAP when the uncertain tax position has a less than 50% probability that it will be sustained upon examination by the tax authorities based on its technical merits. As of June 30, 2017, the Fund has determined that no tax liability is required in its financial statements related to uncertain tax positions for any open tax years (or expected to be taken in future tax years). Open tax years are those that remain subject to examination and are based on each tax jurisdiction’s statute of limitation.
g. Security Transactions, Investment Income, Expenses and Distributions
Security transactions are accounted for on trade date. Realized gains and losses on security transactions are determined on a specific identification basis. Interest income and estimated expenses are accrued daily. Amortization of premium and accretion of discount on debt securities are included in interest income. Dividend income is recorded on the ex-dividend date except for certain dividends from securities where the dividend rate is not available. In such cases, the dividend is recorded as soon as the information is received by the Fund. Distributions to shareholders are recorded on the ex-dividend date. Distributable earnings are determined according to income tax regulations (tax basis) and may differ from earnings recorded in accordance with U.S. GAAP. These differences may be permanent or temporary. Permanent differences are reclassified among capital accounts to reflect their tax character. These reclassifications have no impact on net assets or the results of operations. Temporary differences are not reclassified, as they may reverse in subsequent periods.
Common expenses incurred by the Trust are allocated among the Funds based on the ratio of net assets of each Fund to the combined net assets of the Trust. Fund specific expenses are charged directly to the Fund that incurred the expense.
franklintempleton.com |
Semiannual Report |
31 |
F R A N K L I N M U T U A L B E A C O N F U N D
N O T E S T O F I N A N C I A L S T A T E M E N T S ( U N A U D I T E D )
1. Organization and Significant Accounting Policies (continued)
g. Security Transactions, Investment Income, Expenses and Distributions (continued)
Realized and unrealized gains and losses and net investment income, not including class specific expenses, are allocated daily to each class of shares based upon the relative proportion of net assets of each class. Differences in per share distributions, by class, are generally due to differences in class specific expenses.
h. Accounting Estimates
The preparation of financial statements in accordance with U.S. GAAP requires management to make estimates and assumptions that affect the reported amounts of assets and
liabilities at the date of the financial statements and the amounts of income and expenses during the reporting period. Actual results could differ from those estimates.
i. Guarantees and Indemnifications
Under the Trust’s organizational documents, its officers and trustees are indemnified by the Trust against certain liabilities arising out of the performance of their duties to the Trust. Additionally, in the normal course of business, the Trust, on behalf of the Fund, enters into contracts with service providers that contain general indemnification clauses. The Trust’s maximum exposure under these arrangements is unknown as this would involve future claims that may be made against the Trust that have not yet occurred. Currently, the Trust expects the risk of loss to be remote.
2. Shares of Beneficial Interest
At June 30, 2017, there were an unlimited number of shares authorized (without par value). Transactions in the Fund’s shares were as follows:
| Six Months Ended | Year Ended | |||||||||||||||
June 30, 2017
| December 31, 2016
| |||||||||||||||
Shares
| Amount
| Shares
| Amount
| |||||||||||||
| Class Z Shares: | ||||||||||||||||
Shares sold | 7,827,596 | $ | 126,804,796 | 9,149,715 | $ | 140,197,196 | ||||||||||
Shares issued in reinvestment of distributions | — | — | 12,432,394 | 192,053,179 | ||||||||||||
Shares redeemed |
| (8,814,073
| )
|
| (142,834,052
| )
|
| (23,237,873
| )
|
| (345,385,258
| )
| ||||
Net increase (decrease) | (986,477 | ) | $ | (16,029,256 | ) | (1,655,764 | ) | $ | (13,134,883 | ) | ||||||
| Class A Shares: | ||||||||||||||||
Shares sold | 3,722,356 | $ | 60,119,271 | 5,078,134 | $ | 75,827,729 | ||||||||||
Shares issued in reinvestment of distributions | — | — | 4,985,244 | 76,408,846 | ||||||||||||
Shares redeemed | (8,413,459 | ) | (135,215,780 | ) | (16,508,824 | ) | (244,351,765 | ) | ||||||||
Net increase (decrease) | (4,691,103 | ) | $ | (75,096,509 | ) | (6,445,446 | ) | $ | (92,115,190 | ) | ||||||
| Class C Shares: | ||||||||||||||||
Shares sold | 693,851 | $ | 11,035,473 | 884,730 | $ | 13,160,013 | ||||||||||
Shares issued in reinvestment of distributions | — | — | 1,245,164 | 18,929,994 | ||||||||||||
Shares redeemed | (2,319,801 | ) | (37,240,811 | ) | (4,098,752 | ) | (59,785,815 | ) | ||||||||
Net increase (decrease) | (1,625,950 | ) | $ | (26,205,338 | ) | (1,968,858 | ) | $ | (27,695,808 | ) | ||||||
| Class R Shares: | ||||||||||||||||
Shares sold | 19,049 | $ | 304,544 | 29,412 | $ | 419,666 | ||||||||||
Shares issued in reinvestment of distributions | — | — | 10,270 | 155,639 | ||||||||||||
Shares redeemed | (21,899 | ) | (349,105 | ) | (70,761 | ) | (982,069 | ) | ||||||||
Net increase (decrease) | (2,850 | ) | $ | (44,561 | ) | (31,079 | ) | $ | (406,764 | ) | ||||||
32 |
Semiannual Report |
franklintempleton.com |
F R A N K L I N M U T U A L B E A C O N F U N D
N O T E S T O F I N A N C I A L S T A T E M E N T S ( U N A U D I T E D )
| Six Months Ended | Year Ended | |||||||||||||||
| June 30, 2017 | December 31, 2016 | |||||||||||||||
|
| |||||||||||||||
| Shares | Amount | Shares | Amount | |||||||||||||
ClassR6Shares: | ||||||||||||||||
Shares sold | 13,781 | $ | 224,746 | 618,690 | $ | 9,392,683 | ||||||||||
Shares issued in reinvestment of distributions | — | — | 3,324 | 51,412 | ||||||||||||
Shares redeemed | (8,770 | ) | (144,764 | ) | (3,998,311 | ) | (61,111,090 | ) | ||||||||
|
| |||||||||||||||
Net increase (decrease) | 5,011 | $ | 79,982 | (3,376,297 | ) | $ | (51,666,995 | ) | ||||||||
|
| |||||||||||||||
3. Transactions with Affiliates
Franklin Resources, Inc. is the holding company for various subsidiaries that together are referred to as Franklin Templeton Investments. Certain officers and trustees of the Fund are also officers and/or directors of the following subsidiaries:
| Subsidiary | Affiliation | |
| Franklin Mutual Advisers, LLC (Franklin Mutual) | Investment manager | |
| Franklin Templeton Services, LLC (FT Services) | Administrative manager | |
| Franklin Templeton Distributors, Inc. (Distributors) | Principal underwriter | |
| Franklin Templeton Investor Services, LLC (Investor Services) | Transfer agent |
a. Management Fees
The Fund pays an investment management fee to Franklin Mutual based on the average daily net assets of the Fund as follows:
| Annualized Fee Rate | Net Assets | |||
0.675% | Up to and including $5 billion | |||
0.645% | Over $5 billion, up to and including $7 billion | |||
0.625% | Over $7 billion, up to and including $10 billion | |||
0.615% | In excess of $10 billion | |||
For the period ended June 30, 2017, the annualized effective investment management fee rate was 0.675% of the Fund’s average daily net assets.
b. Administrative Fees
Under an agreement with Franklin Mutual, FT Services provides administrative services to the Fund. The fee is paid by Franklin Mutual based on the Fund’s average daily net assets, and is not an additional expense of the Fund.
c. Distribution Fees
The Board has adopted distribution plans for each share class, with the exception of Class Z and Class R6 shares, pursuant to Rule 12b-1 under the 1940 Act. Under the Fund’s Class A reimbursement distribution plan, the Fund reimburses Distributors for costs incurred in connection with the servicing, sale and distribution of the Fund’s shares up to the maximum annual plan rate. Under the Class A reimbursement distribution plan, costs exceeding the maximum for the current plan year cannot be reimbursed in subsequent periods. In addition, under the Fund’s Class C and R compensation distribution plans, the Fund pays Distributors for costs incurred in connection with the servicing, sale and distribution of the Fund’s shares up to the maximum annual plan rate for each class. The plan year, for purposes of monitoring compliance with the maximum annual plan rates, is February 1 through January 31.
franklintempleton.com |
Semiannual Report |
33 |
F R A N K L I N M U T U A L B E A C O N F U N D
N O T E S T O F I N A N C I A L S T A T E M E N T S ( U N A U D I T E D )
3. Transactions with Affiliates (continued)
c. Distribution Fees (continued)
The maximum annual plan rates, based on the average daily net assets, for each class, are as follows:
Class A | 0.35 | % | ||
Class C | 1.00 | % | ||
Class R | 0.50 | % |
The Board has set the current rate at 0.25% per year for Class A shares until further notice and approval by the Board.
d. Sales Charges/Underwriting Agreements
Front-end sales charges and contingent deferred sales charges (CDSC) do not represent expenses of the Fund. These charges are deducted from the proceeds of sales of Fund shares prior to investment or from redemption proceeds prior to remittance, as applicable. Distributors has advised the Fund of the following commission transactions related to the sales and redemptions of the Fund’s shares for the period:
Sales charges retained net of commissions paid to unaffiliated brokers/dealers | $ | 98,901 | ||
CDSC retained | $ | 6,599 |
e. Transfer Agent Fees
Each class of shares, except for Class R6, pays transfer agent fees to Investor Services for its performance of shareholder servicing obligations and reimburses Investor Services for out of pocket expenses incurred, including shareholder servicing fees paid to third parties. These fees are allocated daily based upon their relative proportion of such classes’ aggregate net assets. Class R6 pays Investor Services transfer agent fees specific to that class.
For the period ended June 30, 2017, the Fund paid transfer agent fees of $1,609,684, of which $724,884 was retained by Investor Services.
f. Waiver and Expense Reimbursements
Investor Services has voluntarily agreed in advance to waive or limit its fees so that the Class R6 transfer agent fees do not exceed 0.01%. Investor Services may discontinue this waiver in the future.
4. Expense Offset Arrangement
The Fund has entered into an arrangement with its custodian whereby credits realized as a result of uninvested cash balances are used to reduce a portion of the Fund’s custodian expenses. During the period ended June 30, 2017, the custodian fees were reduced as noted in the Statement of Operations.
5. Independent Trustees’ Retirement Plan
On January 1, 1993, the Trust adopted an Independent Trustees’ Retirement Plan (Plan). The Plan is an unfunded defined benefit plan that provides benefit payments to Trustees whose length of service and retirement age meets the eligibility requirements of the Plan. Benefits under the Plan are based on years of service and fees paid to each trustee at the time of retirement. Effective in December 1996, the Plan was closed to new participants.
34 |
Semiannual Report |
franklintempleton.com |
F R A N K L I N M U T U A L B E A C O N F U N D
N O T E S T O F I N A N C I A L S T A T E M E N T S ( U N A U D I T E D )
During the period ended June 30, 2017, the Fund’s projected benefit obligation and benefit payments under the Plan were as follows:
aProjected benefit obligation at June 30, 2017 | $ | 220,939 | ||
bIncrease in projected benefit obligation | $ | 1,184 | ||
Benefit payments made to retired trustees | $ | (1,945 | ) |
aThe projected benefit obligation is included in trustees’ fees and expenses in the Statement of Assets and Liabilities.
bThe increase in projected benefit obligation is included in trustees’ fees and expenses in the Statement of Operations.
6. Income Taxes
At June 30, 2017, the cost of investments and net unrealized appreciation (depreciation) for income tax purposes were as follows:
Cost of investments. | $ | 3,242,243,181 | ||
|
| |||
Unrealized appreciation | $ | 981,844,130 | ||
Unrealized depreciation | (160,449,160 | ) | ||
|
| |||
Net unrealized appreciation (depreciation) | $ | 821,394,970 | ||
|
|
Differences between income and/or capital gains as determined on a book basis and a tax basis are primarily due to differing treatments of foreign currency transactions and wash sales.
7. Investment Transactions
Purchases and sales of investments (excluding short term securities and securities sold short) for the period ended June 30, 2017, aggregated $390,548,191 and $610,283,179, respectively.
Transactions in options written during the period ended June 30, 2017, were as follows:
| Number of | ||||||||
| Contracts | Premiums | |||||||
Options outstanding at December 31, 2016 | 6,000 | $ | 822,578 | |||||
Options written | 5,000 | 1,115,784 | ||||||
Options expired | (3,500 | ) | (426,988 | ) | ||||
Options exercised | — | — | ||||||
Options closed | (7,500 | ) | (1,511,374 | ) | ||||
|
| |||||||
Options outstanding at June 30, 2017 | — | $ | — | |||||
|
| |||||||
See Notes 1(c) and 11 regarding derivative financial instruments and other derivative information, respectively.
8. Credit Risk and Defaulted Securities
The Fund may purchase the pre-default or defaulted debt of distressed companies. Distressed companies are financially troubled and could be or are already involved in financial restructuring or bankruptcy. Risks associated with purchasing these securities include the possibility that the bankruptcy or other restructuring process takes longer than expected, or that distributions in restructuring are less than anticipated, either or both of which may result in unfavorable consequences to the Fund. If it becomes probable that the income on debt securities, including those of distressed companies, will not be collected, the Fund discontinues accruing income and recognizes an adjustment for uncollectible interest.
At June 30, 2017, the aggregate long value of distressed company securities for which interest recognition has been discontinued was $69,446,627, representing 1.7% of the Fund’s net assets. For information as to specific securities, see the accompanying Statement of Investments.
franklintempleton.com |
Semiannual Report |
35 |
F R A N K L I N M U T U A L B E A C O N F U N D
N O T E S T O F I N A N C I A L S T A T E M E N T S ( U N A U D I T E D )
9. Concentration of Risk
Investing in foreign securities may include certain risks and considerations not typically associated with investing in U.S. securities, such as fluctuating currency values and changing local and regional economic, political and social conditions, which may result in greater market volatility. In addition, certain foreign securities may not be as liquid as U.S. securities.
10. Restricted Securities
The Fund invests in securities that are restricted under the Securities Act of 1933 (1933 Act) or which are subject to legal, contractual, or other agreed upon restrictions on resale. Restricted securities are often purchased in private placement transactions, and cannot be sold without prior registration unless the sale is pursuant to an exemption under the 1933 Act. Disposal of these securities may require greater effort and expense, and prompt sale at an acceptable price may be difficult. The Fund may have registration rights for restricted securities. The issuer generally incurs all registration costs.
At June 30, 2017, investments in restricted securities, excluding certain securities exempt from registration under the 1933 Act deemed to be liquid, were as follows:
Principal Amount/ Shares | Issuer | Acquisition Date | Cost | Value | ||||||||||||
| 10,848 | Broadband Ventures III LLC, secured promissory note, 5.00%, 2/01/12 | 7/01/10 -11/30/12 | $ | 10,848 | $ | — | ||||||||||
| 15,831,950 | CB FIM Coinvestors LLC | 1/15/09 - 6/02/09 | — | — | ||||||||||||
| 19,805,560 | FIM Coinvestor Holdings I, LLC | 11/20/06 - 6/02/09 | — | — | ||||||||||||
| 2,846,329 | International Automotive Components Group Brazil LLC | 4/13/06 - 12/26/08 | 1,890,264 | 69,618 | ||||||||||||
| 22,836,904 | International Automotive Components Group North America LLC | 1/12/06 - 3/18/13 | 18,692,218 | 14,056,480 | ||||||||||||
| 301,445 | Warrior Met Coal Inc. | 3/31/16 - 6/23/16 | 1,729,238 | 4,931,343 | ||||||||||||
|
| |||||||||||||||
Total Restricted Securities (Value is 0.5% of Net Assets) | $ | 22,322,568 | $ | 19,057,441 | ||||||||||||
|
| |||||||||||||||
11. Other Derivative Information
At June 30, 2017, the Fund’s investments in derivative contracts are reflected in the Statement of Assets and Liabilities as follows:
| Asset Derivatives | Liability Derivatives | |||||||||||
Derivative Contracts Not Accounted for as Hedging Instruments |
Statement of Assets and Liabilities Location | Fair Value |
Statement of Assets and Liabilities Location | Fair Value | ||||||||
Foreign exchange contracts | Variation margin | $ | 5,772,362 | a | ||||||||
Unrealized appreciation on OTC forward exchange contracts | $ | 1,658,024 | Unrealized depreciation on OTC forward exchange contracts | 27,783,979 | ||||||||
|
|
|
| |||||||||
Totals | $ | 1,658,024 | $ | 33,556,341 | ||||||||
|
|
|
| |||||||||
aThis amount reflects the cumulative appreciation (depreciation) of futures contracts as reported in the Statement of Investments. Only the variation margin receivable/ payable at period end is separately reported within the Statement of Assets and Liabilities. Prior variation margin movements were recorded to cash upon receipt or payment.
36 |
Semiannual Report |
franklintempleton.com |
F R A N K L I N M U T U A L B E A C O N F U N D
N O T E S T O F I N A N C I A L S T A T E M E N T S ( U N A U D I T E D )
For the period ended June 30, 2017, the effect of derivative contracts in the Fund’s Statement of Operations was as follows:
Derivative Contracts Not Accounted for as Hedging Instruments | Statement of Operations Location | Net Realized Gain (Loss) for the Period | Statement of Operations Location | Net Change in Unrealized Appreciation (Depreciation) for the Period | ||||||||
| Net realized gain (loss) from: | Net change in unrealized | |||||||||||
| appreciation (depreciation) on: | ||||||||||||
Foreign exchange contracts | Foreign currency transactions | $ | 5,490,345 | a | Translation of other | $ | (48,812,404 | )a | ||||
| assets and liabilities denominated | ||||||||||||
| in foreign currencies | ||||||||||||
| Futures contracts | (8,367,161 | ) | Futures contracts | (9,201,212 | ) | |||||||
Equity contracts | Written options | 1,792,806 | Written options | (542,578 | ) | |||||||
|
|
|
| |||||||||
Totals | $ | (1,084,010 | ) | $ | 58,556,194 | |||||||
|
|
|
| |||||||||
aForward exchange contracts are included in net realized gain (loss) from foreign currency transactions and net change in unrealized appreciation (depreciation) on translation of other assets and liabilities denominated in foreign currencies in the Statement of Operations.
For the period ended June 30, 2017, the average month end notional amount of futures contracts and options represented $276,696,013 and $10,909,250, respectively. The average month end contract value of forward exchange contracts was $705,390,279.
See Notes 1(c) and 7 regarding derivative financial instruments and investment transactions, respectively.
12. Holdings of 5% Voting Securities of Portfolio Companies
The 1940 Act defines “affiliated companies” to include investments in portfolio companies in which a fund owns 5% or more of the outstanding voting securities. During the period ended June 30, 2017, investments in “affiliated companies” were as follows:
| Name of Issuer | Number of Shares Held at Beginning of Period | Gross Additions | Gross Reductions | Number of Shares Held at End of Period | Value at End of Period | Investment Income | Realized Gain (Loss) | |||||||||||||||||||||
| Non-Controlled Affiliates | ||||||||||||||||||||||||||||
CB FIM Coinvestors LLC (Value is —% of Net Assets) | 15,831,950 | — | — | 15,831,950 | $ | — | $ | — | $ | — | ||||||||||||||||||
|
| |||||||||||||||||||||||||||
13. Credit Facility
The Fund, together with other U.S. registered and foreign investment funds (collectively, Borrowers), managed by Franklin Templeton Investments, are borrowers in a joint syndicated senior unsecured credit facility totaling $2 billion (Global Credit Facility) which matures on February 9, 2018. This Global Credit Facility provides a source of funds to the Borrowers for temporary and emergency purposes, including the ability to meet future unanticipated or unusually large redemption requests.
Under the terms of the Global Credit Facility, the Fund shall, in addition to interest charged on any borrowings made by the Fund and other costs incurred by the Fund, pay its share of fees and expenses incurred in connection with the implementation and maintenance of the Global Credit Facility, based upon its relative share of the aggregate net assets of all of the Borrowers, including an annual commitment fee of 0.15% based upon the unused portion of the Global Credit Facility. These fees are reflected in other expenses in the Statement of Operations. During the period ended June 30, 2017, the Fund did not use the Global Credit Facility.
14. Fair Value Measurements
The Fund follows a fair value hierarchy that distinguishes between market data obtained from independent sources (observable inputs) and the Fund’s own market assumptions (unobservable inputs). These inputs are used in determining the value of the Fund’s financial instruments and are summarized in the following fair value hierarchy:
• Level 1 – quoted prices in active markets for identical financial instruments
franklintempleton.com |
Semiannual Report |
37 |
F R A N K L I N M U T U A L B E A C O N F U N D
N O T E S T O F I N A N C I A L S T A T E M E N T S ( U N A U D I T E D )
14. Fair Value Measurements (continued)
| • | Level 2 – other significant observable inputs (including quoted prices for similar financial instruments, interest rates, prepayment speed, credit risk, etc.) |
| • | Level 3 – significant unobservable inputs (including the Fund’s own assumptions in determining the fair value of financial instruments) |
The input levels are not necessarily an indication of the risk or liquidity associated with financial instruments at that level.
For movements between the levels within the fair value hierarchy, the Fund has adopted a policy of recognizing the transfers as of the date of the underlying event which caused the movement.
A summary of inputs used as of June 30, 2017, in valuing the Fund’s assets and liabilities carried at fair value, is as follows:
| Level 1 | Level 2 | Level 3 | Total | |||||||||||||
| Assets: | ||||||||||||||||
Investments in Securities: | ||||||||||||||||
Equity Investments:a | ||||||||||||||||
Auto Components | $ | — | $ | — | $ | 14,126,098 | $ | 14,126,098 | ||||||||
Metals & Mining | — | — | 4,931,343 | 4,931,343 | ||||||||||||
All Other Equity Investmentsb | 3,627,463,065 | — | —c | 3,627,463,065 | ||||||||||||
Corporate Notes and Senior Floating Rate Interests. | — | 71,156,046 | — | 71,156,046 | ||||||||||||
Corporate Notes and Senior Floating Rate Interests in Reorganization | — | 59,053,447 | —c | 59,053,447 | ||||||||||||
Companies in Liquidation | — | 5,004,393 | 865,230c | 5,869,623 | ||||||||||||
Municipal Bonds in Reorganization | — | 10,393,180 | — | 10,393,180 | ||||||||||||
Short Term Investments | 192,546,009 | 78,099,340 | — | 270,645,349 | ||||||||||||
|
| |||||||||||||||
Total Investments in Securities | $ | 3,820,009,074 | $ | 223,706,406 | $ | 19,922,671 | $ | 4,063,638,151 | ||||||||
|
| |||||||||||||||
Other Financial Instruments: | ||||||||||||||||
Forward Exchange Contracts | $ | — | $ | 1,658,024 | $ | — | $ | 1,658,024 | ||||||||
|
| |||||||||||||||
| Liabilities: | ||||||||||||||||
Other Financial Instruments: | ||||||||||||||||
Futures Contracts | $ | 5,772,362 | $ | — | $ | — | $ | 5,772,362 | ||||||||
Forward Exchange Contracts | — | 27,783,979 | — | 27,783,979 | ||||||||||||
|
| |||||||||||||||
Total Other Financial Instruments | $ | 5,772,362 | $ | 27,783,979 | $ | — | $ | 33,556,341 | ||||||||
|
| |||||||||||||||
a Includes common and preferred stocks as well as other equity investments.
b For detailed categories, see the accompanying Statement of Investments.
c Includes securities determined to have no value at June 30, 2017.
A reconciliation of assets in which Level 3 inputs are used in determining fair value is presented when there are significant Level 3 financial instruments at the end of the period.
15. New Accounting Pronouncements
In March 2017, the Financial Accounting Standards Board issued Accounting Standards Update (ASU) No. 2017-08, Receivables—Nonrefundable Fees and Other Costs (Subtopic 310-20): Premium Amortization on Purchased Callable Debt Securities. The amendments in the ASU shorten the amortization period for certain callable debt securities, held at a premium, to be amortized to the earliest call date. The ASU does not require an accounting change for securities held at a discount; which continues to be amortized to maturity. The ASU is effective for fiscal years and interim periods within those fiscal years beginning after December 15, 2018. Management is currently evaluating the impact, if any, of applying this provision.
38 |
Semiannual Report |
franklintempleton.com |
F R A N K L I N M U T U A L B E A C O N F U N D
N O T E S T O F I N A N C I A L S T A T E M E N T S ( U N A U D I T E D )
16. Investment Company Reporting Modernization
In October 2016, the U.S. Securities and Exchange Commission adopted new rules and amended existing rules (together, final rules) intended to modernize the reporting and disclosure of information by registered investment companies. In part, the final rules amend Regulation S-X and require standardized, enhanced disclosures about derivatives in investment company financial statements, as well as other amendments. The compliance date for the amendments to Regulation S-X is August 1, 2017. Management has reviewed the requirements and believes the adoption of the amendments to Regulation S-X will not have a material impact on the Fund’s financial statements and related disclosures.
17. Subsequent Events
The Fund has evaluated subsequent events through the issuance of the financial statements and determined that no events have occurred that require disclosure.
Abbreviations
| Counterparty | Currency | Selected Portfolio | ||||||||
BOFA |
Bank of America N.A. |
EUR |
Euro |
ADR |
American Depositary Receipt | |||||
| BONY | The Bank of New York Mellon Corp. | GBP | British Pound | FHLB | Federal Home Loan Bank | |||||
| FBCO | Credit Suisse International | USD | United States Dollar | GO | General Obligation | |||||
| HSBK | HSBC Bank PLC | TRA | Tax Receivable Agreement Right | |||||||
| SSBT | State Street Bank and Trust Co., N.A. | |||||||||
| UBSW | UBS AG | |||||||||
franklintempleton.com |
Semiannual Report |
|
39 |
|
F R A N K L I N M U T U A L S E R I E S F U N D S
F R A N K L I N M U T U A L B E A C O N F U N D
Board Approval of Investment Management Agreements
FRANKLIN MUTUAL SERIES FUNDS
Franklin Mutual Beacon Fund
(“Fund”)
The Board of Trustees (Board), including a majority of trustees that are not “interested persons” as such term is defined in section 2(a)(19) of the Investment Company Act of 1940 (hereinafter referred to as “independent trustees”), at an in-person meeting held on May 22, 2017, unanimously approved the renewal of the Fund’s investment management agreement. Prior to a meeting of all of the trustees for the purpose of considering such renewal, the independent trustees participated in two other meetings held in connection with the renewal process. Throughout the process, the independent trustees received assistance and advice from and met separately with independent counsel. The independent trustees met with and interviewed officers of the investment manager (including portfolio managers), the transfer agent and shareholder services group and the distributor. In approving the renewal of the investment management agreement for the Fund, the Board, including the independent trustees, determined that the investment management fee structure was fair and reasonable and that continuance of the agreement was in the best interests of the Fund and its shareholders.
In reaching their decision on the investment management agreement, the trustees took into account information furnished throughout the year at regular Board meetings, as well as information specifically requested and furnished for the renewal process, which culminated in the meetings referred to above for the specific purpose of considering such agreement. Information furnished throughout the year included, among others, reports on the Fund’s investment performance, expenses, portfolio composition, portfolio brokerage execution, client commission arrangements, derivatives, securities lending, asset segregation, portfolio turnover, Rule 12b-1 plan, distribution, shareholder servicing, legal and compliance matters, pricing of securities, sales and redemptions, and marketing support payments made to financial intermediaries, as well as a third-party survey of transfer agent fees charged to funds within the Franklin Templeton Investments (FTI) complex in comparison with those charged to other fund complexes deemed comparable. Also, related financial statements and other information about the scope and quality of services provided by the investment manager and its affiliates and enhancements to such services over the past year were
provided. In addition, the trustees received periodic reports throughout the year and during the renewal process relating to compliance with the Fund’s investment policies and restrictions. During the renewal process, the independent trustees considered the investment manager’s methods of operation within the Franklin Templeton group and its activities on behalf of other clients. The Board also noted that it received an annual report on all payments made by FTI or the Fund to financial intermediaries engaged in the sale of Fund shares, as well as a memorandum relating to third-party servicing arrangements in response to a Guidance Update from the U.S. Securities and Exchange Commission (SEC) relating to mutual fund distribution and sub-accounting fees.
The information obtained by the trustees during the renewal process also included a special report prepared by Broadridge Financial Solutions, Inc., an independent third-party analyst that utilizes data from Lipper, Inc. (“Lipper”), comparing the Fund’s investment performance and expenses with those of other mutual funds deemed comparable to the Fund as selected by Lipper (Broadridge Section 15(c) Report). The trustees reviewed the Broadridge Section 15(c) Report and its usefulness in the renewal process with respect to matters such as comparative fees, expenses, expense ratios, performance and volatility. They concluded that the report continues to be a reliable resource in the performance of their duties.
In addition, the trustees received a Profitability Study (Profitability Study) prepared by management discussing the profitability to FTI from its overall U.S. fund operations, as well as on an individual fund-by-fund basis. Over the past year, the Board and counsel to the independent trustees continued to receive reports on management’s handling of recent regulatory inquiries and pending legal actions against the investment manager and its affiliates. The independent trustees were satisfied with the actions taken to date by management in response to such regulatory and legal matters.
Particular attention was given to management’s diligent risk management program, including continual monitoring and management of cybersecurity, liquidity and counterparty credit risk, and attention given to derivatives and other complex instruments that are held and expected to be held by the Fund and how such instruments are used to carry out the Fund’s investment goal(s). The Board also took into account, among other things, management’s efforts in establishing a global credit facility for the benefit of the Fund and other accounts managed by FTI to provide a source of cash for temporary and emergency purposes or to meet unusual redemption requests as
40 |
Semiannual Report |
franklintempleton.com |
F R A N K L I N M U T U A L S E R I E S F U N D S
F R A N K L I N M U T U A L B E A C O N F U N D
S H A R E H O L D E R I N F O R M A T I O N
well as the strong financial position of the investment manager’s parent company and its commitment to the mutual fund business. In addition, the Board received updates from management on the SEC’s progress in implementing the rule-making requirements established by the Dodd-Frank Wall Street Reform and Consumer Protection Act (Dodd-Frank Act), which was enacted July 21, 2010, and the investment manager’s compliance with rules and regulations already promulgated by the SEC under such act.
In addition to the above and other matters considered by the trustees throughout the course of the year, the following discussion relates to certain primary factors relevant to the Board’s decision. This discussion of the information and factors considered by the Board (including the information and factors discussed above) is not intended to be exhaustive, but rather summarizes certain factors considered by the Board. In view of the wide variety of factors considered, the Board did not, unless otherwise noted, find it practicable to quantify or otherwise assign relative weights to the foregoing factors. In addition, individual trustees may have assigned different weights to various factors.
NATURE, EXTENT AND QUALITY OF SERVICES. The trustees reviewed the nature, extent and quality of the services provided, and to be provided, by the investment manager. The trustees cited the investment manager’s ability to implement the Fund’s disciplined value investment approach and its long-term relationship with the Fund as reasons that shareholders choose to invest, and remain invested, in the Fund. The trustees reviewed the Fund’s portfolio management team, including its performance, staffing, skills and compensation program. With respect to portfolio manager compensation, management assured the trustees that the Fund’s long-term performance is a significant component of incentive-based compensation and noted that a portion of a portfolio manager’s incentive-based compensation is paid in shares of pre-designated funds from the portfolio manager’s fund management area. The trustees noted that the portfolio manager compensation program aligned the interests of the portfolio managers with that of shareholders of the Fund. The trustees discussed with management various other products, portfolios and entities that are advised by the investment manager and the allocation of assets and expenses among and within them, as well as their relative fees and reasons for differences with respect thereto and any potential conflicts. During regular Board meetings and the aforementioned meetings of the independent trustees, the trustees received reports and presentations on the investment manager’s best execution trading policies. The trustees considered
periodic reports provided to them showing that the investment manager complied with the investment policies and restrictions of the Fund as well as other reports periodically furnished to the Board covering matters such as the compliance of portfolio managers and other management personnel with the code of ethics covering the investment management personnel, the adherence to fair value pricing procedures established by the Board and the accuracy of net asset value calculations. The Board noted the extent of the benefits provided to Fund shareholders from being part of the Franklin Templeton group of funds, including the right to exchange investments between funds (same class) without a sales charge, the ability to reinvest Fund dividends into other funds and the right to combine holdings of other funds to obtain reduced sales charges. The Board considered the investment manager’s significant efforts in developing and implementing compliance procedures established in accordance with SEC and other requirements.
The Board considered the nature, extent and quality of the services to be provided under the Fund’s other service agreements to determine that, on an overall basis, Fund shareholders were well served. In this connection, the Board also took into account transfer agent and shareholder services provided to Fund shareholders by an affiliate of the investment manager, noting continuing expenditures by management to increase and improve the scope of such services and favorable periodic reports on shareholder services conducted by independent third parties. While such considerations directly affected the trustees’ decision in renewing the Fund’s transfer agent and shareholder services agreement, the Board also considered these commitments as incidental benefits to Fund shareholders deriving from the investment management relationship.
Based on their review, the trustees were satisfied with the nature and quality of the overall services provided, and to be provided, by the investment manager and its affiliates to the Fund and its shareholders and were confident in the abilities of the management team to continue the disciplined value investment approach of the Fund and to provide quality services to the Fund and its shareholders.
INVESTMENT PERFORMANCE. The trustees reviewed and placed significant emphasis on the investment performance of the Fund over the one-, three-, five- and 10-year periods ended December 31, 2016. They considered the history of successful performance of the Fund relative to various benchmarks. As part of their review, they inquired of management regarding benchmarks, style drift and restrictions
franklintempleton.com |
Semiannual Report |
41 |
F R A N K L I N M U T U A L S E R I E S F U N D S
F R A N K L I N M U T U A L B E A C O N F U N D
S H A R E H O L D E R I N F O R M A T I O N
on permitted investments. Consideration was also given to performance in the context of available levels of cash during the periods.
The trustees had meetings during the year, including the meetings referred to above held in connection with the renewal process, with the Fund’s portfolio managers to discuss performance and the management of the Fund. In addition, particular attention in assessing performance was given to the Broadridge Section 15(c) Report. That report showed the investment performance of the Fund (Class A shares) in comparison to other funds determined comparable by Lipper.
The comparable funds to the Fund, as chosen by Lipper, included all retail and institutional global multi-cap value funds. The Fund had total returns in the best performing quintile for the one-year period ended December 31, 2016, and had annualized total returns for the three- and five-year periods also in the best performing quintile. The trustees noted that the Fund’s total return on an annualized basis for the 10-year period ended December 31, 2016 was in the middle performing quintile. The trustees were satisfied with such comparative performance.
The trustees also compared Fund performance to other industry benchmarks, including measures of risk-adjusted performance of a fund, as part of their evaluation of investment performance. The trustees concluded that the Fund had continued to perform well in comparison to its various benchmarks and in the context of the Fund’s goals.
COMPARATIVE EXPENSES AND MANAGEMENT PROFITABILITY. The trustees considered the cost of the services provided and to be provided and the profits realized by the investment manager and its affiliates from their respective relationships with the Fund. As part of the renewal process, the trustees explored with management the trends in expense ratios over the past three fiscal years and the reasons for any increases in the Fund’s expense ratios (or components thereof). In considering the appropriateness of the management fee and other expenses charged to the Fund, the Board took into account various factors including investment performance and matters relating to Fund operations, including, but not limited to, the quality and experience of its portfolio managers and research staff. Consideration was also given to a comparative analysis in the Broadridge Section 15(c) Report of the investment management fee and total expense ratio of the Fund in comparison with those of a group of other funds selected by Lipper as its appropriate Lipper expense group. Lipper expense data is based upon information taken from the Fund’s most
recent annual report, which reflects historical asset levels that may be quite different from those currently existing, particularly in a period of market volatility. While recognizing such inherent limitation and the fact that expense ratios generally increase as assets decline and decrease as assets grow, the Board believed the independent analysis conducted by Lipper to be an appropriate measure of comparative expenses.
In reviewing comparative costs, emphasis was given to the Fund’s contractual management fee in comparison with the contractual management fee that would have been charged by other funds within its Lipper expense group assuming they were similar in size to the Fund, as well as the actual total expenses of the Fund in comparison with those of its Lipper expense group. The Lipper contractual management fee analysis includes administrative charges as being part of the management fee, and total expenses, for comparative consistency, are shown by Lipper for Fund Class A shares.
The Fund’s contractual management fee rate was in the second-least expensive quintile of its Lipper expense group and its total expenses were also in the second-least expensive quintile of such group. The Board was satisfied with such comparative fees and expenses.
The trustees also reviewed the Profitability Study addressing profitability of Franklin Resources, Inc., from its overall U.S. fund business, as well as profitability to the Fund’s investment manager and its affiliates, from providing investment management and other services to the Fund during the 12-month period ended September 30, 2016, the most recent fiscal year-end of Franklin Resources, Inc. The trustees reviewed the basis on which such reports are prepared and the cost allocation methodology utilized in the Profitability Study, it being recognized that allocation methodologies may each be reasonable while producing different results. In this respect, the Board noted that the reasonableness of the cost allocation methodologies was reviewed by independent accountants on an every other year basis.
The independent trustees met with management to discuss the Profitability Study. This included, among other things, a comparison of investment management income with investment management expenses of the Fund; comparison of underwriting revenues and expenses; the relative relationship of investment management and underwriting expenses; shareholder servicing profitability; economies of scale; and the relative contribution of the Fund to the profitability of the investment manager and its parent. In discussing the Profitability Study with the Board,
42 |
Semiannual Report |
franklintempleton.com |
F R A N K L I N M U T U A L S E R I E S F U N D S
F R A N K L I N M U T U A L B E A C O N F U N D
S H A R E H O L D E R I N F O R M A T I O N
the investment manager stated its belief that the costs incurred in establishing the infrastructure necessary to operate the type of mutual fund operations conducted by it and its affiliates may not be fully reflected in the expenses allocated to the Fund in determining its profitability.
The Board also took into account management’s expenditures in improving shareholder services provided to the Fund, as well as the need to meet additional regulatory and compliance requirements resulting from the Sarbanes-Oxley Act, the Dodd-Frank Act and recent SEC and other regulatory requirements. The trustees also considered the extent to which the investment manager may derive ancillary benefits from Fund operations, including those derived from economies of scale, discussed below, the allocation of Fund brokerage and the use of commission dollars to pay for research and other similar services.
Based upon their consideration of all these factors, the trustees determined that the level of profits realized by the investment manager and its affiliates in providing services to the Fund was not excessive in view of the nature, quality and extent of services provided.
ECONOMIES OF SCALE. The Board considered economies of scale realized by the investment manager and its affiliates as the Fund grows larger and the extent to which they are shared with Fund shareholders, as for example, in the level of the investment management fee charged, in the quality and efficiency of services rendered and in increased capital commitments benefiting the Fund directly or indirectly. While recognizing that any precise determination is inherently subjective, the trustees noted that, based upon the Profitability Study, as some funds increase in size, at some point economies of scale may result in the investment manager realizing a larger profit margin on investment management services provided to such a fund. The trustees also noted that benefits of economies of scale will be shared with Fund shareholders due to the decline in the effective investment management fee rate as breakpoints are achieved by the Fund.
The trustees noted that breakpoints had been instituted as part of the Fund’s investment management fee and that the Board regularly evaluates whether additional breakpoints are appropriate. The trustees assessed the savings to shareholders resulting from such breakpoints and believed they were, and continue to be, appropriate and they agreed to continue to monitor the appropriateness of the breakpoints. The trustees also considered the effects an increase in assets under management would have on the investment management fee
and expense ratio of the Fund. To the extent further economies of scale may be realized by the investment manager and its affiliates, the Board believed the investment management and administrative fees provide a sharing of benefits with the Fund and its shareholders.
Proxy Voting Policies and Procedures
The Fund’s investment manager has established Proxy Voting Policies and Procedures (Policies) that the Fund uses to determine how to vote proxies relating to portfolio securities. Shareholders may view the Fund’s complete Policies online at franklintempleton.com. Alternatively, shareholders may request copies of the Policies free of charge by calling the Proxy Group collect at (954) 527-7678 or by sending a written request to: Franklin Templeton Companies, LLC, 300 S.E. 2nd Street, Fort Lauderdale, FL 33301, Attention: Proxy Group. Copies of the Fund’s proxy voting records are also made available online at franklintempleton.com and posted on the U.S. Securities and Exchange Commission’s website at sec.gov and reflect the most recent 12-month period ended June 30.
Quarterly Statement of Investments
The Trust, on behalf of the Fund, files a complete statement of investments with the U.S. Securities and Exchange Commission for the first and third quarters for each fiscal year on Form N-Q. Shareholders may view the filed Form N-Q by visiting the Commission’s website at sec.gov. The filed form may also be viewed and copied at the Commission’s Public Reference Room in Washington, DC. Information regarding the operations of the Public Reference Room may be obtained by calling (800) SEC-0330.
franklintempleton.com |
Semiannual Report |
43 |
This page intentionally left blank.
| Semiannual Report and Shareholder Letter Franklin Mutual Beacon Fund
Investment Manager Franklin Mutual Advisers, LLC
Distributor Franklin Templeton Distributors, Inc. (800) DIAL BEN® / 342-5236 franklintempleton.com
Shareholder Services (800) 632-2301 - (Class A, C,R & R6) (800) 448-FUND - (Class Z) |
Authorized for distribution only when accompanied or preceded by a summary prospectus and/or prospectus. Investors should carefully consider a fund’s investment goals, risks, charges and expenses before investing. A prospectus contains this and other information; please read it carefully before investing.
To help ensure we provide you with quality service, all calls to and from our service areas are monitored and/or recorded.
© 2017 Franklin Templeton Investments. All rights reserved. | 476 S 08/17 |
 | Semiannual Report and Shareholder Letter June 30, 2017 |
Franklin Mutual Global Discovery Fund
A SERIES OF FRANKLIN MUTUAL SERIES FUNDS
Sign up for electronic delivery at franklintempleton.com/edelivery
Franklin Templeton Investments
Gain From Our Perspective®
At Franklin Templeton Investments, we’re dedicated to one goal: delivering exceptional asset management for our clients. By bringing together multiple, world-class investment teams in a single firm, we’re able to offer specialized expertise across styles and asset classes, all supported by the strength and resources of one of the world’s largest asset managers. This has helped us to become a trusted partner to individual and institutional investors across the globe.
Dear Franklin Mutual Global Discovery Fund Shareholder:
The first half of 2017 saw most equity markets continue their long move upwards. The Standard & Poor’s 500® Index (S&P 500®) posted a +9.34% total return and the MSCI World Index delivered a +11.02% total return.1
The political uncertainty and unpredictability of recent years has continued in 2017. In the U.S., President Trump has continued his unconventional governance approach, while Congress has remained relentlessly partisan, leading to significant uncertainty about policies and legislation. The financial markets expected “business friendly” moves, but specific legislative progress on issues such as health care, tax reform and infrastructure did not come to fruition. In the U.K., a surprise election was called in April when the Conservative Party held a huge polling lead, but at the June election the Tories lost their majority in Parliament. Recent elections in France went according to expectations, lending some much appreciated stability there.
Despite these generally unsettling events, the global economy continued its slow expansion since the Great Recession. Unemployment also continued to decline in most developed markets. Wage growth showed signs of acceleration and in the U.S. interest rates began to rise, perhaps signaling the first steps toward monetary normalization.
Equity markets appreciated as economic fundamentals improved. Valuation is, of course, a critical factor in our analysis and we always ask ourselves if current and potential investments represent an attractive balance of risk and reward. As some equity markets reached all-time highs, we maintained our focus on individual investments and the prospects for each
business in the context of its valuation and the backdrop of potential political and economic risks.
In many equity markets, growth stocks outperformed value stocks during the period. For example, the S&P 500 Growth Index returned +13.33%, while the S&P 500 Value Index returned +4.85%.1 The difference in performance was driven in part by a significant rally in Internet and software stocks, which dominated the S&P 500 Growth Index. We do not know how long these trends will continue, but historically, periods of strong performance by growth stocks have eventually been followed by relatively weaker performance. In addition, the S&P 500 Value Index has components that we believe are facing disruption from new technology (e.g., the rapid market share shift to online retailing from traditional bricks and mortar dominated retailers that are often labeled as value stocks). Exacerbating the disruption is the reality that many new technology companies are able to innovate without the need to show immediate profits.
Amid dynamic markets and evolving economic conditions, we believe active, professional investment management serves investors well. We also recognize the important role of financial advisors in today’s markets and encourage investors to continue to seek their advice. Amid changing markets and economic conditions, we are confident investors with a well-diversified portfolio and a patient, long-term outlook will be well positioned for the years ahead.
On the following pages, the Fund’s portfolio management team discusses the economic environment during the first six months of 2017 and reviews investment decisions made during this
1. Source: Morningstar.
See www.franklintempletondatasources.com for additional data provider information.
| Not FDIC Insured | | | May Lose Value | | | No Bank Guarantee |
franklintempleton.com |
Not part of the semiannual report |
|
1 |
|
period. Please remember all securities markets fluctuate, as do mutual fund share prices.
We thank you for investing with Franklin Templeton, welcome your questions and comments, and look forward to continuing to serve your investment needs in the years ahead.
Sincerely,
Peter A. Langerman
Chairman, President and Chief Executive Officer
Franklin Mutual Advisers, LLC
This letter reflects our analysis and opinions as of June 30, 2017, unless otherwise indicated. The information is not a complete analysis of every aspect of any market, country, industry, security or fund. Statements of fact are from sources considered reliable.
Semiannual Report
| Franklin Mutual Global Discovery Fund | 3 | |||
| Performance Summary | 10 | |||
| Your Fund’s Expenses | 12 | |||
| Financial Highlights and Statement of Investments | 13 | |||
| Financial Statements | 26 | |||
| Notes to Financial Statements | 30 | |||
|
| 42
|
| |
Visit franklintempleton.com for fund updates, to access your account, or to find helpful financial planning tools.
2 |
Not part of the semiannual report |
franklintempleton.com |
Semiannual Report
Franklin Mutual Global Discovery Fund
This semiannual report for Franklin Mutual Global Discovery Fund covers the period ended June 30, 2017.
Your Fund’s Goal and Main Investments
The Fund seeks capital appreciation. Its strategy is focused mainly on what the investment manager believes are undervalued mid- and large-cap equity securities, with a significant portion of its assets in foreign securities and, to a lesser extent, in the securities of distressed companies and merger arbitrage securities. The Fund may invest a substantial portion, potentially up to 100% of its assets in foreign securities, which may include sovereign debt and participations in foreign government debt.
Performance Overview
The Fund’s Class Z shares delivered a +6.72% cumulative total return for the six months ended June 30, 2017. For comparison, the Fund’s benchmark, the MSCI World Index, which tracks stock performance in global developed markets, posted a +11.02% total return.1 You can find more of the Fund’s performance data in the Performance Summary beginning on page 10.
Performance data represent past performance, which does not guarantee future results. Investment return and principal value will fluctuate, and you may have a gain or loss when you sell your shares. Current performance may differ from figures shown. For most recent month-end performance, go to franklintempleton.com or call (800) 342-5236.
Economic and Market Overview
The global economy generally expanded during the period under review. In this environment, global developed and emerging market stocks, as measured by the MSCI All Country World Index, generated a total return of +11.82%. Global markets were aided by improved industrial commodity prices at certain points during the period, generally upbeat economic data across regions, investor optimism about pro-growth and pro-business policies in the U.S., hopes of tax reforms under
Geographic Composition*
Based on Total Net Assets as of 6/30/17
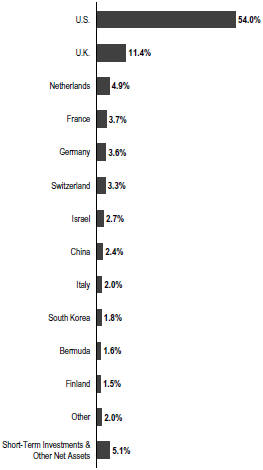
*Figures are stated as a percentage of total and may not equal 100% or may be negative due to rounding, use of any derivatives, unsettled trades or other factors.
the Trump administration, Emmanuel Macron’s election as France’s president and encouraging corporate earnings reports.
1. Source: Morningstar.
The indexes are unmanaged and include reinvestment of any income or distributions. They do not reflect any fees, expenses or sales charges. One cannot invest directly in an index, and an index is not representative of the Fund’s portfolio.
The dollar value, number of shares or principal amount, and names of all portfolio holdings are listed in the Fund’s Statement of Investments (SOI). The SOI begins on page 18.
franklintempleton.com |
Semiannual Report |
|
3 |
|
F R A N K L I N M U T U A L G L O B A L D I S C O VE R Y F U N D
However, global markets reflected investor concerns about the timing and economic effects of the U.K.’s exit from the European Union (also known as “Brexit”). Other headwinds included the health of European banks, concerns about political uncertainty in the U.S. and European Union, geopolitical tensions in certain regions, worries about global oversupply in oil production despite a pact to extend cuts, and comments toward period-end from key central bankers around the world about potentially raising interest rates.
U.S. economic growth decelerated in 2017’s first quarter, largely due to slower growth in consumer spending and declines in private inventory investment and government spending. However, growth accelerated in the second quarter due to increases in consumer spending, business investment and federal government spending. The unemployment rate decreased from 4.7% in December 2016 to 4.4% at period-end.2 Annual inflation, as measured by the Consumer Price Index, decreased from 2.1% to 1.6% during the period. After increasing its benchmark interest rate in March, the U.S. Federal Reserve (Fed), at its June meeting, made the widely anticipated increase to its target range for the federal funds rate from 0.75%–1.00% to 1.00%–1.25%, amid signs of a growing U.S. economy, a strengthening labor market and an improvement in business spending.
In Europe, the U.K.’s economy grew at a slower rate in 2017’s first quarter over the previous quarter, largely due to slower growth in household spending. The eurozone’s growth increased in the first quarter over the previous quarter. The bloc’s annual inflation rate fluctuated during the reporting period and ended slightly higher from where it began. During the period, the European Central Bank kept its key policy rates unchanged.
In Asia, Japan’s quarterly gross domestic product (GDP) remained unchanged in 2017’s first quarter compared to 2016’s fourth quarter. In April 2017, the Bank of Japan (BOJ) slightly increased its GDP forecasts for the 2017–2018 fiscal year. However, the BOJ lowered its inflation forecast.
In emerging markets, Brazil’s quarterly GDP grew for the first time in two years, as its first-quarter 2017 GDP grew compared to the previous quarter. The country’s central bank cut its benchmark interest rate four times between January and June 2017 to spur economic growth. Russia’s GDP grew in 2017’s first quarter compared to the prior-year period. The Bank of Russia reduced its key interest rate in March, April and June
2017 to try to revive its economy. China’s economy grew faster in the first half of 2017 compared to the first half of 2016, driven by solid growth in industrial production, services, fixed-asset investment, retail sales, and imports and exports. The People’s Bank of China left its benchmark interest rate unchanged during the period. Overall, emerging market stocks, as measured by the MSCI Emerging Markets Index, rose during the period.
Investment Strategy
At Franklin Mutual Series, we are committed to our distinctive value approach to investing, which we believe can generate above-average risk-adjusted returns over time for our shareholders. Our major investment strategy is investing in undervalued stocks. When selecting undervalued equities, we are attracted to what we believe are fundamentally strong companies with healthy balance sheets, high-quality assets, substantial free cash flow and shareholder-oriented management teams and whose stocks are trading at discounts to our assessment of the companies’ intrinsic or business value. We also look for asset-rich companies whose shares may be trading at depressed levels due to concerns over short-term earnings disappointments, litigation, management strategy or other perceived negatives. This strict value approach is not only intended to improve the likelihood of upside potential, but also reduces the risk of substantial declines, in our opinion. While the vast majority of our undervalued equity investments are made in publicly traded companies globally, we may invest occasionally in privately held companies as well.
We complement this more traditional investment strategy with two others. One is distressed investing, a highly specialized field that has proven quite profitable during certain periods over the years. Distressed investing is complex and can take many forms. The most common distressed investment the Fund undertakes is the purchase of financially troubled or bankrupt companies’ debt at a substantial discount to face value. After the financially distressed company is reorganized, often in bankruptcy court, the old debt is typically replaced with new securities issued by the financially stronger company.
The other piece of our investment strategy is participating in arbitrage situations, another highly specialized field. When companies announce proposed mergers or takeovers, commonly referred to as “deals,” the target company may trade at a discount to the bid it ultimately accepts. One form of arbitrage involves purchasing the target company’s stock when
2. Source: Bureau of Labor Statistics.
4 |
Semiannual Report |
franklintempleton.com |
F R A N K L I N M U T U A L G L O B A L D I S C O VE R Y F U N D
it is trading below the value we believe it would receive in a deal. In keeping with our commitment to a relatively conservative investment approach, we typically focus our arbitrage efforts on announced deals, and avoid rumored deals or other situations we consider relatively risky.
In addition, it is our practice to hedge the Fund’s currency exposure when we deem it advantageous for our shareholders.
What is meant by “hedge”?
To hedge an investment is to take a position intended to offset potential losses/gains that may be incurred by a companion financial instrument.
Manager’s Discussion
Many equity markets posted meaningful gains in 2017’s first half, across most regions and with minimal volatility. Global markets were aided by generally upbeat economic data, improved corporate earnings in the U.S., Europe and Japan, as well as improved industrial commodity prices at certain points during the period. However, those largely positive headline conditions overshadowed a fair amount of turbulence and uncertainty.
In the U.S., markets began 2017 rallying as investors hoped that a Republican sweep of U.S. elections in November 2016 would lead to a general loosening in regulations and tax reform, including lower corporate tax rates. However, political gridlock took hold. The political drama in Washington, D.C., tempered the rally in U.S. markets overall. Many stocks that led the way in the post-election rally subsequently gave back some or all of their outperformance, particularly value stocks dominated by companies in cyclical sectors most likely to benefit from acceleration in economic growth. In an environment of modest economic growth and low interest rates, investors continued to favor growth stocks. During the period, the Russell 1000® Growth Index generated a total return of +13.99%, while the Russell 1000® Value Index posted a total return of +4.66%.1 Within the Russell 1000® Growth Index, stocks with the largest weights were technology firms that dominated the headlines: Apple,3 Alphabet (a.k.a. Google),3 Microsoft, Amazon.com3 and Facebook.3
European equity markets started 2017 slowly, but political events combined with upbeat economic news sparked strong performance during the period, with the notable exception of
Top 10 Sectors/Industries
Based on Equity Securities as of 6/30/17
| % of Total Net Assets | ||||
| Banks | 11.8% | |||
| Insurance | 10.1% | |||
| Pharmaceuticals | 8.6% | |||
| Oil, Gas & Consumable Fuels | 7.2% | |||
| Media | 5.5% | |||
| Software | 4.9% | |||
| Tobacco | 4.0% | |||
| Health Care Equipment & Supplies | 3.8% | |||
| Diversified Telecommunication Services | 3.6% | |||
| Industrial Conglomerates | 3.3% | |||
the U.K. Elections in Europe produced generally positive outcomes, with voters in the Netherlands and France rejecting extremist candidates. Political stability in the European Union (EU) helped to support equity markets on the belief that it would help facilitate the ongoing economic recovery. In the U.K., however, a snap election resulting in no party having a majority in Parliament appeared to make a “hard Brexit,” in which the U.K. leaves the EU in March 2019 without a negotiated deal, even more likely than before.
As value investors, we managed to benefit from steady economic growth despite underlying market turbulence. In all market environments, we seek to invest prudently in securities that we believe represent good value, and then we adjust our views as the world around us changes.
The energy sector has been a significant area of investment for the Fund.4 Following an extended period of high prices, crude oil and natural gas prices have been significantly lower during the past few years. The benchmark oil price declined from more than $100 a barrel to below $30, and has more recently stayed between $40 and $60 during the first half of 2017. The impact on the sector, and the securities of companies in the sector, has been unsurprisingly quite dramatic. Although many uncertainties exist, we continue to expect demand for oil and gas to rise for a number of years, which we believe will require continued investment by the sector, not only to meet that growth but also to replace declining production in mature fields around the world. Accordingly, we expect some combination of higher prices or lower costs over time to provide the sufficient returns needed to justify the required investment.
3. Not a Fund holding.
4. The energy sector comprises energy equipment and services and oil, gas and consumable fuels in the SOI.
franklintempleton.com |
Semiannual Report |
|
5 |
|
F R A N K L I N M U T U A L G L O B A L D I S C O VE R Y F U N D
After an initial period of distress, most companies within the energy sector appear to have made considerable progress in resizing their cost structures and strengthening their balance sheets. In aggregate, capital spending has been cut massively, and cash flow breakeven levels suggest an ability to fund a base level of investment activity given crude oil and gas prices as of period-end.
From an investment standpoint, in many cases we are finding securities with reasonable prospects at current commodity prices, and substantively greater upside potential should our longer term price-versus-cost outlook come to pass. We expect continued commodity price volatility, but would look to use that to our advantage when seeking to buy or sell energy sector securities.
Our energy sector investment process has focused on finding situations where commodity price upside is not necessary to generate attractive security returns. One such area is within the infrastructure space. Companies such as Kinder Morgan and Williams provide critical pipelines, processing facilities, ports, and other assets used to bring vital commodities to market. Investors shunned these companies due to a combination of counterparty risk related to exploration and production companies, their own balance sheet concerns and dividend levels. As our analysis about the criticality of their assets and the flexibility of their funding options has, in our view, been proven, the securities of infrastructure companies have recovered significantly from their lows. Moreover, if expectations of an oil and gas supply glut from greater North American production hold true, more infrastructure investment should be needed to move this product to export markets.
Royal Dutch Shell, a leading integrated oil and gas company, is another investment held by the Fund for which fears about the impact of low commodity prices were overblown, in our view. The company used the initial phase of the crude oil price downturn to acquire BG Group, a major exploration and production company with significant positions and strength in liquefied natural gas and a great oil asset in the pre-salt Santos Basin in Brazil. The assets were highly complementary to Shell’s existing positions, allowing the post-merger company to prune other areas of its portfolio and still show considerable growth. Management, under the leadership of relatively new chief executive officer Ben van Beurden, has been focused on reducing costs so that the company can still grow, while funding all required capital expenditures and its dividend, at an
oil price below $50 per barrel. As Shell shows continued progress in its efforts and demonstrates the resilience of its portfolio and balance sheet, we expect the shares to continue to benefit.
Merger and acquisition activity has remained healthy, with the number of deals remaining high, although the average size of deals fell. Very large deals may have been affected negatively by ongoing political and regulatory uncertainty. Although many mega-deals were rumored, the largest deal actually announced during the period was Becton, Dickinson and Company’s3 takeover of C.R. Bard.3 Meanwhile, many large deals initiated in 2016 await regulatory approval, including Bayer’s3 acquisition of Monsanto, AT&T’s3 acquisition of Time Warner, and 21st Century Fox’s3 offer for Sky. Several key regulatory agencies remain short of members, including the Federal Communication Commission and the Federal Trade Commission, and these openings may be affecting regulatory approvals.
Credit spreads narrowed in 2016 and continued that trend in the first half of 2017 for higher quality credit, with the exception of a brief period of volatility in March and April. High yield credit spreads have remained at levels seen at the start of 2017. The spread compression provided the Fund with the opportunity to exit many of the opportunities that presented themselves in early 2016, including several “hung deals,” as prices improved, spreads shrank, and the risk-adjusted returns were no longer mispriced. As the year progressed and investors became more willing buyers of credit, mispriced risk became more difficult to find, in our opinion. However, we found what we viewed as value in some unloved industries like specialty pharmaceuticals, hospitals, media/broadcasting and telecommunications5 that faced increasing political or secular challenges. In sorting through these less-favored industries, we sought out securities that we believed could benefit most from liquidity-enhancing events like asset sales, the ability within existing agreements to issue secured debt, and free cash flow that could create a long enough runway to weather the storm and/or provide enough current recovery to create the enterprise at a significant discount to our assessment of its intrinsic value. In times when the credit markets fluctuate and value is difficult to easily identify, we believe our industry specific expertise, deep fundamental analysis with a focus on cash flow, and intensive credit and covenant review combine seamlessly and provide us with unique ways of looking at the same ideas others may disregard.
5. The telecommunication services sector comprises diversified telecommunication services and wireless telecommunication services in the SOI.
See www.franklintempletondatasources.com for additional data
6 |
Semiannual Report |
franklintempleton.com |
F R A N K L I N M U T U A L G L O B A L D I S C O VE R Y F U N D
| Top 10 Equity Holdings | ||||
| 6/30/17 | ||||
Company Sector/Industry, Country | % of Total Net Assets | |||
Medtronic PLC | 2.4% | |||
| Health Care Equipment & Supplies, U.S. | ||||
Novartis AG | 2.4% | |||
| Pharmaceuticals, Switzerland | ||||
Time Warner Inc. | 2.1% | |||
| Media, U.S. | ||||
Merck & Co. Inc. | 2.0% | |||
| Pharmaceuticals, U.S. | ||||
Eli Lilly & Co. | 2.0% | |||
| Pharmaceuticals, U.S. | ||||
Royal Dutch Shell PLC | 1.8% | |||
| Oil, Gas & Consumable Fuels, U.K. | ||||
NN Group NV | 1.8% | |||
| Insurance, Netherlands | ||||
Koninklijke Philips NV | 1.8% | |||
| Industrial Conglomerates, Netherlands | ||||
XL Group Ltd. | 1.6% | |||
| Insurance, Bermuda | ||||
Check Point Software Technologies Ltd. | 1.6% | |||
| Software, Israel | ||||
Turning to Fund performance, top positive contributors included U.S.-based medical device maker Medtronic, South Korea-based Samsung Electronics and Israel-based information technology (IT) security company Check Point Software Technologies.
Investors responded positively to quarterly results issued by Medtronic in February and May. On both occasions, earnings exceeded consensus expectations, driven by solid revenues and successful cost control efforts, which led to better operating profitability. The positive results led to improved investor confidence in Medtronic’s ability to deliver on future growth goals, especially given concerns following tough quarterly results issued in November 2016. Medtronic’s agreement in April to sell its medical supplies business to Cardinal Health3 provided additional support to Medtronic’s stock price. Medtronic obtained the medical supplies business as part of its 2014 acquisition of Covidien. The medical supplies business, in our view, was not core to Medtronic’s operations and had less attractive profitability and future growth prospects. In addition, Medtronic intends to use the after-tax proceeds for additional share buybacks and to pay down debt.
Samsung Electronics is a low cost provider of commodity memory products (e.g., dynamic random-access memory and flash memory), which have seen very strong pricing recently. Samsung also produces smartphones, consumer electronics and
other goods. In February, shares retreated as Samsung chief Jay Y. Lee was arrested for bribery as part of a wider government influence-peddling scandal that led to the impeachment of then president Park Geun-hye. However, the stock price rallied as investors turned their focus to Samsung’s better-than-expected earnings results announced in April. Samsung reported strong sales in its core businesses, including memory chips and OLED (organic light-emitting diode) displays. Despite adverse publicity surrounding its Note 7 smartphone in the fall of 2016, sales of its newest generation of smartphones have been running ahead of market expectations. Management also pleasantly surprised investors in April by announcing a plan to cancel existing treasury shares held by the company.
Check Point’s stock rallied on positive quarterly results in January after the company showed results that exceeded expectations across most metrics. Billings growth reached a five-year high, demand for software licenses and advanced technology subscriptions grew at a strong pace, and discounting had a smaller negative impact. Earnings and revenue guidance for 2017 were also better than expected. In April, further improvement in billings growth that significantly exceeded investor expectations and improved demand from international markets showed the ongoing fundamental strength of the company.
During the period under review, Fund investments that detracted from performance included U.S.-based drugstore chain Rite Aid, U.S.-based oil and gas exploration and production company Marathon Oil, and Canada-based Crescent Point Energy.
Shares of Rite Aid declined as a deal to be acquired by Walgreens Boots Alliance fell apart. The transaction was mired in antitrust review by the Federal Trade Commission (FTC) during much of the period as the FTC questioned whether Walgreens’ proposed divestitures were sufficient to maintain competition. In late June, Walgreens announced the immediate termination of the merger agreement. Instead, Rite Aid agreed to sell numerous stores and related distribution assets to Walgreens. The new agreement is also subject to antitrust review, but we believe FTC approval is likely.
Shares of Marathon Oil generally followed the path of declining oil prices. During the first half of 2017, oil prices retreated as U.S. crude oil production increased and data showed that worldwide supply had not yet begun to decline. The supply and price trends for crude oil prices overshadowed some moves by Marathon that we believe were positive. As part of its portfolio transformation effort, in March Marathon announced agreements to exit a Canadian oil sands asset, and
franklintempleton.com |
Semiannual Report |
|
7 |
|
F R A N K L I N M U T U A L G L O B A L D I S C O VE R Y F U N D
two transactions to acquire acreage in the northern Delaware basin of New Mexico. Although we regard the price received for the oil sands asset to be merely adequate, we look favorably upon the continuing expansion of the company’s resource portfolio and increasing focus on predictable, higher return onshore assets. Additionally, the three transactions led to a further improvement in Marathon’s balance sheet. These favorable changes were nonetheless overshadowed by an oil market which remains both volatile and challenging.
Crescent Point Energy is an exploration and production company with significant exposure to oil production. The stock price generally followed the path of deteriorating crude oil prices during the period. A stronger Canadian dollar, which comprises a significant portion of the company’s cost base, further hurt the stock’s performance. We believe the stock is attractive as it trades at a significant discount to its peers, despite having decent assets, a good track record on operational execution and a healthy balance sheet. As Crescent Point Energy continues to focus on organic growth, we believe the stock’s discounted valuation should improve.
During the period, the Fund held currency forwards and futures seeking to hedge most of the currency risk of the portfolio’s non-U.S. dollar investments. The currency forwards had a negative impact on the Fund’s performance because of the depreciation of the U.S. dollar versus the hedged currencies, while currency futures had a negligible impact.
What is a currency forward?
A currency forward is an agreement between the Fund and a counterparty to buy or sell a foreign currency in exchange for another currency at a specific exchange rate on a future date.
What is a future?
A future is an agreement between the Fund and a counterparty made through a U.S. or foreign futures exchange to buy or sell an underlying instrument or asset at a specific price on a future date.
Thank you for your participation in Franklin Mutual Global Discovery Fund. We look forward to continuing to serve your investment needs.
 |
Peter A. Langerman Co-Portfolio Manager | |
 |
Philippe Brugere-Trelat Co-Portfolio Manager | |
 |
Timothy Rankin, CFA Co-Portfolio Manager | |


The foregoing information reflects our analysis, opinions and portfolio holdings as of June 30, 2017, the end of the reporting period. The way we implement our main investment strategies and the resulting portfolio holdings may change depending on factors such as market and economic conditions. These opinions may not be relied upon as investment advice or an offer for a particular security. The information is not a complete analysis of every aspect of any market, country, industry, security or the Fund. Statements of fact are from sources considered reliable, but the investment manager makes no representation or warranty as to their completeness or accuracy. Although historical performance is no guarantee of future results, these insights may help you understand our investment management philosophy.
CFA® is a trademark owned by CFA Institute.
8 |
Semiannual Report |
franklintempleton.com |
F R A N K L I N M U T U A L G L O B A L D I S C O V E R Y F U N D
Peter Langerman has been portfolio manager for Franklin Mutual Global Discovery Fund since 2009. He has been portfolio manager for Franklin Mutual Shares Fund since 2005. He joined Franklin Templeton Investments in 1996, serving in various capacities, including President and Chief Executive Officer of Franklin Mutual Advisers and member of the management team of the Funds, including Franklin Mutual Shares Fund. From 2002 to 2005, he served as director of New Jersey’s Division of Investment, overseeing employee pension funds. Between 1986 and 1996, Mr. Langerman was employed at Heine Securities Corporation, the Fund’s former manager.
Philippe Brugere-Trelat has been portfolio manager for Franklin Mutual Global Discovery Fund since 2009. He has been lead portfolio manager for Franklin Mutual European Fund since 2005 and co-portfolio manager for Franklin Mutual International Fund since 2009. He has been a member of the management team of the Franklin Mutual Series Funds since 2004, when he rejoined Franklin Templeton Investments. Previously, he was president and portfolio manager of Eurovest. Between 1984 and 1994, Mr. Brugere-Trelat was employed at Heine Securities Corporation, the Fund’s former manager.
Timothy Rankin rejoined the Franklin Mutual Series investment group in 2010 and currently serves as co-portfolio manager for Franklin Mutual Global Discovery Fund, and as a research analyst, responsible for the analysis of the global energy and chemical industries. Mr. Rankin had previously worked at Franklin Mutual Series from 1997 through 2004. Mr. Rankin has over 20 years of experience in the investment management industry, including over 10 years with Franklin Mutual Series as a research analyst and portfolio manager. Most recently, he was managing director of Blue Harbour Group, LLC, a private investment firm focused on small- and mid-cap North American companies. Prior to his original employment with Franklin Mutual Series, Mr. Rankin was an equity analyst at Glickenhaus & Co.
franklintempleton.com |
Semiannual Report |
|
9 |
|
F R A N K L I N M U T U A L G L O B A L D I S C O V E R Y F U N D
Performance Summary as of June 30, 2017
The performance table does not reflect any taxes that a shareholder would pay on Fund dividends, capital gain distributions, if any, or any realized gains on the sale of Fund shares. Total return reflects reinvestment of the Fund’s dividends and capital gain distributions, if any, and any unrealized gains or losses. Your dividend income will vary depending on dividends or interest paid by securities in the Fund’s portfolio, adjusted for operating expenses of each class. Capital gain distributions are net profits realized from the sale of portfolio securities.
Performance as of 6/30/17
Cumulative total return excludes sales charges. Average annual total return includes maximum sales charges. Sales charges will vary depending on the size of the investment and the class of share purchased. The maximum is 5.75% and the minimum is 0%. Class A: 5.75% maximum initial sales charge. For other share classes, visit franklintempleton.com.
| Share Class | | Cumulative Total Return1 |
| | Average Annual Total Return2 |
| ||
Z | ||||||||
6-Month | +6.72% | +6.72% | ||||||
1-Year | +20.03% | +20.03% | ||||||
5-Year | +66.85% | +10.78% | ||||||
10-Year | +66.62% | +5.24% | ||||||
A | ||||||||
6-Month | +6.58% | +0.43% | ||||||
1-Year | +19.75% | +12.88% | ||||||
5-Year | +64.53% | +9.17% | ||||||
10-Year | +61.90% | +4.32% | ||||||
Performance data represent past performance, which does not guarantee future results. Investment return and principal value will fluctuate, and you may have a gain or loss when you sell your shares. Current performance may differ from figures shown. For most recent month-end performance, go to franklintempleton.com or call (800) 342-5236.
See page 11 for Performance Summary footnotes.
10 |
Semiannual Report |
franklintempleton.com |
F R A N K L I N M U T U A L G L O B A L D I S C O V E R Y F U N D
P E R F O R M A N C E S U M M A R Y
Total Annual Operating Expenses3
Share Class | ||||
Z | 0.99 | % | ||
A | 1.24 | % |
Each class of shares is available to certain eligible investors and has different annual fees and expenses, as described in the prospectus.
All investments involve risks, including possible loss of principal. Value securities may not increase in price as anticipated or may decline further in value. Special risks are associated with foreign investing, including currency fluctuations, economic instability and political developments. Smaller company stocks have exhibited greater price volatility than larger company stocks, particularly over the short term. The Fund’s investments in companies engaged in mergers, reorganizations or liquidations also involve special risks as pending deals may not be completed on time or on favorable terms. The Fund may invest in lower rated bonds, which entail higher credit risk. The Fund is actively managed but there is no guarantee that the manager’s investment decisions will produce the desired results. The Fund’s prospectus also includes a description of the main investment risks.
1. Cumulative total return represents the change in value of an investment over the periods indicated.
2. Average annual total return represents the average annual change in value of an investment over the periods indicated. Return for less than one year, if any, has not been annualized.
3. Figures are as stated in the Fund’s current prospectus and may differ from the expense ratios disclosed in the Your Fund’s Expenses and Financial Highlights sections in this report. In periods of market volatility, assets may decline significantly, causing total annual Fund operating expenses to become higher than the figures shown.
franklintempleton.com |
Semiannual Report |
|
11 |
|
F R A N K L I N M U T U A L G L O B A L D I S C O V E R Y F U N D
As a Fund shareholder, you can incur two types of costs: (1) transaction costs, including sales charges (loads) on Fund purchases and redemptions; and (2) ongoing Fund costs, including management fees, distribution and service (12b-1) fees, and other Fund expenses. All mutual funds have ongoing costs, sometimes referred to as operating expenses. The table below shows ongoing costs of investing in the Fund and can help you understand these costs and compare them with those of other mutual funds. The table assumes a $1,000 investment held for the six months indicated.
Actual Fund Expenses
The table below provides information about actual account values and actual expenses in the columns under the heading “Actual.” In these columns the Fund’s actual return, which includes the effect of Fund expenses, is used to calculate the “Ending Account Value” for each class of shares. You can estimate the expenses you paid during the period by following these steps (of course, your account value and expenses will differ from those in this illustration): Divide your account value by $1,000 (if your account had an $8,600 value, then $8,600 ÷ $1,000 = 8.6). Then multiply the result by the number in the row for your class of shares under the headings “Actual” and “Expenses Paid During Period” (if Actual Expenses Paid During Period were $7.50, then 8.6 x $7.50 = $64.50). In this illustration, the actual expenses paid this period are $64.50.
Hypothetical Example for Comparison with Other Funds
Under the heading “Hypothetical” in the table, information is provided about hypothetical account values and hypothetical expenses based on the Fund’s actual expense ratio and an assumed rate of return of 5% per year before expenses, which is not the Fund’s actual return. This information may not be used to estimate the actual ending account balance or expenses you paid for the period, but it can help you compare ongoing costs of investing in the Fund with those of other funds. To do so, compare this 5% hypothetical example for the class of shares you hold with the 5% hypothetical examples that appear in the shareholder reports of other funds.
Please note that expenses shown in the table are meant to highlight ongoing costs and do not reflect any transactional costs. Therefore, information under the heading “Hypothetical” is useful in comparing ongoing costs only, and will not help you compare total costs of owning different funds. In addition, if transactional costs were included, your total costs would have been higher.
Actual (actual return after expenses) | Hypothetical (5% annual return before expenses) | |||||||||||||||||
| Share Class | Beginning Account Value 1/1/17 | Ending Account Value 6/30/17 | Expenses Paid During 1/1/17–6/30/171,2 | Ending Account Value 6/30/17 | Expenses Paid During 1/1/17–6/30/171,2 | Net Annualized Expense Ratio2 | ||||||||||||
| Z | $1,000 | $1,067.20 | $4.92 | $1,020.03 | $4.81 | 0.96% | ||||||||||||
| A | $1,000 | $1,065.80 | $6.20 | $1,018.79 | $6.06 | 1.21% | ||||||||||||
| C | $1,000 | $1,061.90 | $10.02 | $1,015.08 | $9.79 | 1.96% | ||||||||||||
| R | $1,000 | $1,064.30 | $7.47 | $1,017.55 | $7.30 | 1.46% | ||||||||||||
| R6 | $1,000 | $1,067.80 | $4.26 | $1,020.68 | $4.16 | 0.83% | ||||||||||||
1. Expenses are equal to the annualized expense ratio for the six-month period as indicated above—in the far right column—multiplied by the simple average account value over the period indicated, and then multiplied by 181/365 to reflect the one-half year period.
2. Reflects expenses after fee waivers and expense reimbursements. Does not include acquired fund fees and expenses.
12 |
Semiannual Report |
franklintempleton.com |
F R A N K L I N M U T U A L G L O B A L D I S C O V E R Y F U N D
Six Months Ended June 30, 2017 (unaudited) | Year Ended December 31, | |||||||||||||||||||||||
| 2016 | 2015 | 2014 | 2013 | 2012 | ||||||||||||||||||||
Class Z | ||||||||||||||||||||||||
| Per share operating performance | ||||||||||||||||||||||||
(for a share outstanding throughout the period) | ||||||||||||||||||||||||
Net asset value, beginning of period | $31.12 | $29.35 | $33.32 | $33.73 | $28.65 | $27.47 | ||||||||||||||||||
Income from investment operationsa: | ||||||||||||||||||||||||
Net investment incomeb | 0.38 | 0.67c | 0.53 | 0.82d | 0.55 | 0.56 | ||||||||||||||||||
Net realized and unrealized gains (losses) | 1.71 | 3.08 | (1.71 | ) | 0.97 | 6.74 | 3.21 | |||||||||||||||||
Total from investment operations | 2.09 | 3.75 | (1.18 | ) | 1.79 | 7.29 | 3.77 | |||||||||||||||||
Less distributions from: | ||||||||||||||||||||||||
Net investment income | — | (0.69 | ) | (0.55 | ) | (0.82 | ) | (0.57 | ) | (0.57 | ) | |||||||||||||
Net realized gains | — | (1.29 | ) | (2.24 | ) | (1.38 | ) | (1.64 | ) | (2.02 | ) | |||||||||||||
Total distributions | — | (1.98 | ) | (2.79 | ) | (2.20 | ) | (2.21 | ) | (2.59 | ) | |||||||||||||
Net asset value, end of period | $33.21 | $31.12 | $29.35 | $33.32 | $33.73 | $28.65 | ||||||||||||||||||
Total returne | 6.72% | 12.86% | (3.36)% | 5.33% | 25.64% | 13.64% | ||||||||||||||||||
Ratios to average net assetsf | ||||||||||||||||||||||||
Expensesg | 0.96% | h | 0.99%h | ,i | 0.99% | h,i | 0.99% | h | 0.98%h | 1.02% | ||||||||||||||
Expenses incurred in connection with securities sold short | —% | 0.01% | 0.02% | 0.03% | —% | j | —% | j | ||||||||||||||||
Net investment income | 2.36% | 2.27% | c | 1.56% | 2.38% | d | 1.68% | 1.89% | ||||||||||||||||
Supplemental data | ||||||||||||||||||||||||
Net assets, end of period (000’s) | $8,888,172 | $8,354,865 | $9,132,752 | $10,375,518 | $9,529,245 | $7,417,041 | ||||||||||||||||||
Portfolio turnover rate | 10.04% | 17.01% | 21.79% | 23.66% | 23.57% | 24.65% | ||||||||||||||||||
aThe amount shown for a share outstanding throughout the period may not correlate with the Statement of Operations for the period due to the timing of sales and repurchases of the Fund’s shares in relation to income earned and/or fluctuating fair value of the investments of the Fund.
bBased on average daily shares outstanding.
cNet investment income per share includes approximately $0.10 per share related to income received in the form of special dividends in connection with certain Fund holdings. Excluding this amount, the ratio of net investment income to average net assets would have been 1.94%.
dNet investment income per share includes approximately $0.34 per share related to income received in the form of special dividends in connection with certain Fund holdings. Excluding this amount, the ratio of net investment income to average net assets would have been 1.40%.
eTotal return is not annualized for periods less than one year.
fRatios are annualized for periods less than one year.
gIncludes dividend and/or interest expense on securities sold short and security borrowing fees, if any. See below for the ratios of such expenses to average net assets for the periods presented. See Note 1(e).
hBenefit of expense reduction rounds to less than 0.01%.
iBenefit of waiver and payments by affiliates rounds to less than 0.01%.
jRounds to less than 0.01%.
franklintempleton.com |
The accompanying notes are an integral part of these financial statements. |
Semiannual Report |
13 |
F R A N K L I N M U T U A L G L O B A L D I S C O V E R Y F U N D
F I N A N C I A L H I G H L I G H T S
| Six Months Ended | Year Ended December 31, | |||||||||||||||||||||||
| June 30, 2017 | ||||||||||||||||||||||||
| (unaudited) | 2016 | 2015 | 2014 | 2013 | 2012 | |||||||||||||||||||
Class A | ||||||||||||||||||||||||
Per share operating performance | ||||||||||||||||||||||||
(for a share outstanding throughout the period) | ||||||||||||||||||||||||
Net asset value, beginning of period | $30.57 | $28.86 | $32.81 | $33.24 | $28.27 | $27.14 | ||||||||||||||||||
Income from investment operationsa: | ||||||||||||||||||||||||
Net investment incomeb | 0.33 | 0.59 | c | 0.42 | 0.71 | d | 0.44 | 0.46 | ||||||||||||||||
Net realized and unrealized gains (losses) | 1.68 | 3.01 | (1.67 | ) | 0.96 | 6.65 | 3.17 | |||||||||||||||||
Total from investment operations | 2.01 | 3.60 | (1.25 | ) | 1.67 | 7.09 | 3.63 | |||||||||||||||||
Less distributions from: | ||||||||||||||||||||||||
Net investment income | — | (0.60 | ) | (0.46 | ) | (0.72 | ) | (0.48 | ) | (0.48 | ) | |||||||||||||
Net realized gains | — | (1.29 | ) | (2.24 | ) | (1.38 | ) | (1.64 | ) | (2.02 | ) | |||||||||||||
Total distributions | — | (1.89 | ) | (2.70 | ) | (2.10 | ) | (2.12 | ) | (2.50 | ) | |||||||||||||
Net asset value, end of period | $32.58 | $30.57 | $28.86 | $32.81 | $33.24 | $28.27 | ||||||||||||||||||
Total returne | 6.58% | 12.56% | (3.63)% | 5.01% | 25.26% | 13.34% | ||||||||||||||||||
| Ratios to average net assetsf | ||||||||||||||||||||||||
Expensesg | 1.21% | h | 1.24% | h,i | 1.27% | h,i | 1.29% | h | 1.28% | h | 1.32% | |||||||||||||
Expenses incurred in connection with securities sold short | —% | 0.01% | 0.02% | 0.03% | —% | j | —% | j | ||||||||||||||||
Net investment income | 2.11% | 2.02%c | 1.28% | 2.08% | d | 1.38% | 1.59% | |||||||||||||||||
| Supplemental data | ||||||||||||||||||||||||
Net assets, end of period (000’s) | $10,058,729 | $10,498,722 | $11,274,721 | $11,573,196 | $10,785,375 | $7,977,279 | ||||||||||||||||||
Portfolio turnover rate | 10.04% | 17.01% | 21.79% | 23.66% | 23.57% | 24.65% | ||||||||||||||||||
aThe amount shown for a share outstanding throughout the period may not correlate with the Statement of Operations for the period due to the timing of sales and repurchases of the Fund’s shares in relation to income earned and/or fluctuating fair value of the investments of the Fund.
bBased on average daily shares outstanding.
cNet investment income per share includes approximately $0.10 per share related to income received in the form of special dividends in connection with certain Fund holdings. Excluding this amount, the ratio of net investment income to average net assets would have been 1.69%.
dNet investment income per share includes approximately $0.34 per share related to income received in the form of special dividends in connection with certain Fund holdings. Excluding this amount, the ratio of net investment income to average net assets would have been 1.10%.
eTotal return does not reflect sales commissions or contingent deferred sales charges, if applicable, and is not annualized for periods less than one year.
fRatios are annualized for periods less than one year.
gIncludes dividend and/or interest expense on securities sold short and security borrowing fees, if any. See below for the ratios of such expenses to average net assets for the periods presented. See Note 1(e).
hBenefit of expense reduction rounds to less than 0.01%.
iBenefit of waiver and payments by affiliates rounds to less than 0.01%.
jRounds to less than 0.01%.
14 |
Semiannual Report | The accompanying notes are an integral part of these financial statements |
franklintempleton.com |
F R A N K L I N M U T U A L G L O B A L D I S C O V E R Y F U N D
F I N A N C I A L H I G H L I G H T S
| Six Months Ended | Year Ended December 31, | |||||||||||||||||||||||
| June 30, 2017 | ||||||||||||||||||||||||
| (unaudited) | 2016 | 2015 | 2014 | 2013 | 2012 | |||||||||||||||||||
Class C | ||||||||||||||||||||||||
| Per share operating performance | ||||||||||||||||||||||||
(for a share outstanding throughout the period) | ||||||||||||||||||||||||
Net asset value, beginning of period | $30.22 | $28.55 | $32.49 | $32.94 | $28.05 | $26.95 | ||||||||||||||||||
Income from investment operationsa: | ||||||||||||||||||||||||
Net investment incomeb | 0.21 | 0.36 | c | 0.18 | 0.47 | d | 0.22 | 0.25 | ||||||||||||||||
Net realized and unrealized gains (losses) | 1.66 | 2.97 | (1.64 | ) | 0.95 | 6.58 | 3.14 | |||||||||||||||||
Total from investment operations | 1.87 | 3.33 | (1.46 | ) | 1.42 | 6.80 | 3.39 | |||||||||||||||||
Less distributions from: | ||||||||||||||||||||||||
Net investment income | — | (0.37 | ) | (0.24 | ) | (0.49 | ) | (0.27 | ) | (0.27 | ) | |||||||||||||
Net realized gains | — | (1.29 | ) | (2.24 | ) | (1.38 | ) | (1.64 | ) | (2.02 | ) | |||||||||||||
Total distributions | — | (1.66 | ) | (2.48 | ) | (1.87 | ) | (1.91 | ) | (2.29 | ) | |||||||||||||
Net asset value, end of period | $32.09 | $30.22 | $28.55 | $32.49 | $32.94 | $28.05 | ||||||||||||||||||
Total returne | 6.19% | 11.70% | (4.33)% | 4.28% | 24.39% | 12.53% | ||||||||||||||||||
| Ratios to average net assetsf | ||||||||||||||||||||||||
Expensesg | 1.96% | h | 1.99% | h,i | 1.99% | h,i | 1.99% | h | 1.98% | h | 2.02% | |||||||||||||
Expenses incurred in connection with securities sold short | —% | 0.01% | 0.02% | 0.03% | —%j | —% | j | |||||||||||||||||
Net investment income | 1.36% | 1.27%c | 0.56% | 1.38% | d | 0.68% | 0.89% | |||||||||||||||||
| Supplemental data | ||||||||||||||||||||||||
Net assets, end of period (000’s) | $2,616,632 | $2,758,563 | $2,983,216 | $3,077,691 | $2,894,908 | $2,222,484 | ||||||||||||||||||
Portfolio turnover rate | 10.04% | 17.01% | 21.79% | 23.66% | 23.57% | 24.65% | ||||||||||||||||||
aThe amount shown for a share outstanding throughout the period may not correlate with the Statement of Operations for the period due to the timing of sales and repurchases of the Fund’s shares in relation to income earned and/or fluctuating fair value of the investments of the Fund.
bBased on average daily shares outstanding.
cNet investment income per share includes approximately $0.10 per share related to income received in the form of special dividends in connection with certain Fund holdings. Excluding this amount, the ratio of net investment income to average net assets would have been 0.94%.
dNet investment income per share includes approximately $0.34 per share related to income received in the form of special dividends in connection with certain Fund holdings. Excluding this amount, the ratio of net investment income to average net assets would have been 0.40%.
eTotal return does not reflect sales commissions or contingent deferred sales charges, if applicable, and is not annualized for periods less than one year.
fRatios are annualized for periods less than one year.
gIncludes dividend and/or interest expense on securities sold short and security borrowing fees, if any. See below for the ratios of such expenses to average net assets for the periods presented. See Note 1(e).
hBenefit of expense reduction rounds to less than 0.01%.
iBenefit of waiver and payments by affiliates rounds to less than 0.01%.
jRounds to less than 0.01%.
franklintempleton.com |
The accompanying notes are an integral part of these financial statements. | Semiannual Report |
|
15 |
|
F R A N K L I N M U T U A L G L O B A L D I S C O V E R Y F U N D
F I N A N C I A L H I G H L I G H T S
| Six Months Ended | Year Ended December 31, | |||||||||||||||||||||||
| June 30, 2017 | ||||||||||||||||||||||||
| (unaudited) | 2016 | 2015 | 2014 | 2013 | 2012 | |||||||||||||||||||
Class R | ||||||||||||||||||||||||
| Per share operating performance | ||||||||||||||||||||||||
(for a share outstanding throughout the period) | ||||||||||||||||||||||||
Net asset value, beginning of period | $30.17 | $28.51 | $32.43 | $32.88 | $27.98 | $26.89 | ||||||||||||||||||
Income from investment operationsa: | ||||||||||||||||||||||||
Net investment incomeb | 0.29 | 0.50 | c | 0.35 | 0.65 | d | 0.37 | 0.39 | ||||||||||||||||
Net realized and unrealized gains (losses) | 1.65 | 2.98 | (1.64 | ) | 0.93 | 6.58 | 3.14 | |||||||||||||||||
Total from investment operations | 1.94 | 3.48 | (1.29 | ) | 1.58 | 6.95 | 3.53 | |||||||||||||||||
Less distributions from: | ||||||||||||||||||||||||
Net investment income | — | (0.53 | ) | (0.39 | ) | (0.65 | ) | (0.41 | ) | (0.42 | ) | |||||||||||||
Net realized gains | — | (1.29 | ) | (2.24 | ) | (1.38 | ) | (1.64 | ) | (2.02 | ) | |||||||||||||
Total distributions | — | (1.82 | ) | (2.63 | ) | (2.03 | ) | (2.05 | ) | (2.44 | ) | |||||||||||||
Net asset value, end of period | $32.11 | $30.17 | $28.51 | $32.43 | $32.88 | $27.98 | ||||||||||||||||||
Total returne | 6.43% | 12.28% | (3.82)% | 4.77% | 25.02% | 13.09% | ||||||||||||||||||
| Ratios to average net assetsf | ||||||||||||||||||||||||
Expensesg | 1.46% | h | 1.49% | h,i | 1.49% | h,i | 1.49% | h | 1.48% | h | 1.52% | |||||||||||||
Expenses incurred in connection with securities sold short | —% | 0.01% | 0.02% | 0.03% | —% | j | —% | j | ||||||||||||||||
Net investment income | 1.86% | 1.77%c | 1.06% | 1.88% | d | 1.18% | 1.39% | |||||||||||||||||
| Supplemental data | ||||||||||||||||||||||||
Net assets, end of period (000’s) | $425,169 | $444,813 | $468,425 | $528,439 | $539,613 | $458,142 | ||||||||||||||||||
Portfolio turnover rate | 10.04% | 17.01% | 21.79% | 23.66% | 23.57% | 24.65% | ||||||||||||||||||
aThe amount shown for a share outstanding throughout the period may not correlate with the Statement of Operations for the period due to the timing of sales and repurchases of the Fund’s shares in relation to income earned and/or fluctuating fair value of the investments of the Fund.
bBased on average daily shares outstanding.
cNet investment income per share includes approximately $0.10 per share related to income received in the form of special dividends in connection with certain Fund holdings. Excluding this amount, the ratio of net investment income to average net assets would have been 1.44%.
dNet investment income per share includes approximately $0.34 per share related to income received in the form of special dividends in connection with certain Fund holdings. Excluding this amount, the ratio of net investment income to average net assets would have been 0.90%.
eTotal return is not annualized for periods less than one year.
fRatios are annualized for periods less than one year.
gIncludes dividend and/or interest expense on securities sold short and security borrowing fees, if any. See below for the ratios of such expenses to average net assets for the periods presented. See Note 1(e).
hBenefit of expense reduction rounds to less than 0.01%.
iBenefit of waiver and payments by affiliates rounds to less than 0.01%.
jRounds to less than 0.01%.
16 |
Semiannual Report | The accompanying notes are an integral part of these financial statements. |
franklintempleton.com |
F R A N K L I N M U T U A L G L O B A L D I S C O V E R Y F U N D
F I N A N C I A L H I G H L I G H T S
Six Months Ended June 30, 2017 (unaudited) | Year Ended December 31, | |||||||||||||||||||
| 2016 | 2015 | 2014 | 2013a | |||||||||||||||||
Class R6 | ||||||||||||||||||||
| Per share operating performance | ||||||||||||||||||||
(for a share outstanding throughout the period) | ||||||||||||||||||||
Net asset value, beginning of period | $31.13 | $29.35 | $33.33 | $33.73 | $31.42 | |||||||||||||||
Income from investment operationsb: | ||||||||||||||||||||
Net investment incomec | 0.41 | 0.61 | d | 0.55 | 0.85 | e | 0.40 | |||||||||||||
Net realized and unrealized gains (losses) | 1.70 | 3.19 | (1.69 | ) | 1.00 | 4.17 | ||||||||||||||
Total from investment operations. | 2.11 | 3.80 | (1.14 | ) | 1.85 | 4.57 | ||||||||||||||
Less distributions from: | ||||||||||||||||||||
Net investment income | — | (0.73 | ) | (0.60 | ) | (0.87 | ) | (0.62 | ) | |||||||||||
Net realized gains | — | (1.29 | ) | (2.24 | ) | (1.38 | ) | (1.64 | ) | |||||||||||
Total distributions | — | (2.02 | ) | (2.84 | ) | (2.25 | ) | (2.26 | ) | |||||||||||
Net asset value, end of period. | $33.24 | $31.13 | $29.35 | $33.33 | $33.73 | |||||||||||||||
Total returnf | 6.78% | 13.02% | (3.23)% | 5.46% | 14.71% | |||||||||||||||
| Ratios to average net assetsg | ||||||||||||||||||||
Expensesh,i | 0.83% | 0.85% | j | 0.84% | j | 0.85% | 0.84% | |||||||||||||
Expenses incurred in connection with securities sold short | —% | 0.01% | 0.02% | 0.03% | —% | k | ||||||||||||||
Net investment income. | 2.49% | 2.41%d | 1.71% | 2.52%e | 1.83% | |||||||||||||||
| Supplemental data | ||||||||||||||||||||
Net assets, end of period (000’s) | $608,483 | $528,617 | $229,765 | $137,922 | $10,535 | |||||||||||||||
Portfolio turnover rate | 10.04% | 17.01% | 21.79% | 23.66% | 23.57% | |||||||||||||||
aFor the period May 1, 2013 (effective date) to December 31, 2013.
bThe amount shown for a share outstanding throughout the period may not correlate with the Statement of Operations for the period due to the timing of sales and repurchases of the Fund’s shares in relation to income earned and/or fluctuating fair value of the investments of the Fund.
cBased on average daily shares outstanding.
dNet investment income per share includes approximately $0.10 per share related to income received in the form of special dividends in connection with certain Fund holdings. Excluding this amount, the ratio of net investment income to average net assets would have been 2.08%.
eNet investment income per share includes approximately $0.34 per share related to income received in the form of special dividends in connection with certain Fund holdings. Excluding this amount, the ratio of net investment income to average net assets would have been 1.54%.
fTotal return is not annualized for periods less than one year.
gRatios are annualized for periods less than one year.
hIncludes dividend and/or interest expense on securities sold short and security borrowing fees, if any. See below for the ratios of such expenses to average net assets for the periods presented. See Note 1(e).
iBenefit of expense reduction rounds to less than 0.01%.
jBenefit of waiver and payments by affiliates rounds to less than 0.01%.
kRounds to less than 0.01%.
franklintempleton.com |
The accompanying notes are an integral part of these financial statements. | Semiannual Report |
|
17 |
|
F R A N K L I N M U T U A L G L O B A L D I S C O V E R Y F U N D
Statement of Investments, June 30, 2017 (unaudited)
| Country | Shares/ Units | Value | ||||||||||||
| Common Stocks and Other Equity Interests 89.5% | ||||||||||||||
| Aerospace & Defense 0.5% | ||||||||||||||
a | KLX Inc. | United States | 1,011,221 | $ | 50,561,050 | |||||||||
| Rockwell Collins Inc. | United States | 627,159 | 65,901,868 | |||||||||||
|
| |||||||||||||
| 116,462,918 | ||||||||||||||
|
| |||||||||||||
| Auto Components 0.1% | ||||||||||||||
a,b | International Automotive Components Group Brazil LLC | Brazil | 3,819,425 | 93,419 | ||||||||||
a,b,c,d | International Automotive Components Group North America LLC | United States | 35,491,081 | 21,845,328 | ||||||||||
|
| |||||||||||||
| 21,938,747 | ||||||||||||||
|
| |||||||||||||
| Automobiles 1.2% | ||||||||||||||
General Motors Co. | United States | 5,350,852 | 186,905,260 | |||||||||||
Hyundai Motor Co. | South Korea | 554,726 | 77,278,783 | |||||||||||
|
| |||||||||||||
| 264,184,043 | ||||||||||||||
|
| |||||||||||||
| Banks 11.8% | ||||||||||||||
Barclays PLC | United Kingdom | 36,257,633 | 95,753,519 | |||||||||||
BNP Paribas SA | France | 3,690,983 | 265,862,555 | |||||||||||
Capital Bank Financial Corp., A | United States | 866,477 | 33,012,774 | |||||||||||
e | Capital Bank Financial Corp., B, 144A, non-voting | United States | 2,980,444 | 113,554,916 | ||||||||||
CIT Group Inc. | United States | 3,769,060 | 183,553,222 | |||||||||||
Citigroup Inc. | United States | 5,490,140 | 367,180,563 | |||||||||||
Citizens Financial Group Inc. | United States | 9,225,010 | 329,148,357 | |||||||||||
HSBC Holdings PLC | United Kingdom | 16,067,494 | 148,949,669 | |||||||||||
JPMorgan Chase & Co. | United States | 2,948,319 | 269,476,356 | |||||||||||
PNC Financial Services Group Inc. | United States | 1,339,857 | 167,307,943 | |||||||||||
Societe Generale SA | France | 3,827,410 | 205,958,279 | |||||||||||
a | Standard Chartered PLC | United Kingdom | 12,656,750 | 128,129,586 | ||||||||||
a | Unicaja Banco SA | Spain | 37,610,350 | 50,263,694 | ||||||||||
Wells Fargo & Co. | United States | 5,713,404 | 316,579,716 | |||||||||||
|
| |||||||||||||
| 2,674,731,149 | ||||||||||||||
|
| |||||||||||||
| Beverages 0.7% | ||||||||||||||
PepsiCo Inc. | United States | 1,395,272 | 161,139,963 | |||||||||||
|
| |||||||||||||
| Capital Markets 0.4% | ||||||||||||||
a | Guotai Junan Securities Co. Ltd. | China | 41,520,689 | 86,787,825 | ||||||||||
|
| |||||||||||||
| Chemicals 1.1% | ||||||||||||||
a,f,g | Dow Corning Corp., Contingent Distribution | United States | 11,430,153 | — | ||||||||||
Monsanto Co. | United States | 2,149,530 | 254,418,371 | |||||||||||
|
| |||||||||||||
| 254,418,371 | ||||||||||||||
|
| |||||||||||||
| Communications Equipment 2.5% | ||||||||||||||
Cisco Systems Inc. | United States | 7,416,030 | 232,121,739 | |||||||||||
Nokia OYJ, A | Finland | 28,555,604 | 174,667,454 | |||||||||||
Nokia OYJ, ADR | Finland | 25,474,246 | 156,921,355 | |||||||||||
|
| |||||||||||||
| 563,710,548 | ||||||||||||||
|
| |||||||||||||
| Construction Materials 0.9% | ||||||||||||||
LafargeHolcim Ltd., B | Switzerland | 3,691,245 | 211,368,293 | |||||||||||
|
| |||||||||||||
| Consumer Finance 1.2% | ||||||||||||||
Ally Financial Inc. | United States | 4,641,368 | 97,004,591 | |||||||||||
Capital One Financial Corp. | United States | 2,190,465 | 180,976,218 | |||||||||||
|
| |||||||||||||
| 277,980,809 | ||||||||||||||
|
| |||||||||||||
| Containers & Packaging 0.7% | ||||||||||||||
International Paper Co. | United States | 2,848,948 | 161,278,946 | |||||||||||
|
| |||||||||||||
18 |
Semiannual Report |
franklintempleton.com |
F R A N K LI N M U T U A L G L O B A L D I S C O V E R Y F U N D
S T A T E M E N T O F I N V E S T M E N T S ( U N A U D I T E D )
| Country | Shares/ Units | Value | ||||||||||||
Common Stocks and Other Equity Interests (continued) | ||||||||||||||
| Diversified Financial Services 0.6% | ||||||||||||||
a,b | Hightower Holding LLC, B, Series II | United States | 2,491,917 | $ | 7,765,313 | |||||||||
Voya Financial Inc. | United States | 3,426,353 | 126,398,162 | |||||||||||
|
| |||||||||||||
| 134,163,475 | ||||||||||||||
|
| |||||||||||||
| Diversified Telecommunication Services 3.6% | ||||||||||||||
China Telecom Corp. Ltd., H | China | 448,060,220 | 212,904,282 | |||||||||||
Deutsche Telekom AG | Germany | 8,629,475 | 154,952,319 | |||||||||||
Koninklijke KPN NV | Netherlands | 95,635,204 | 305,979,309 | |||||||||||
a | Telecom Italia SpA | Italy | 152,130,941 | 140,407,425 | ||||||||||
|
| |||||||||||||
| 814,243,335 | ||||||||||||||
|
| |||||||||||||
| Electric Utilities 1.4% | ||||||||||||||
Enel SpA | Italy | 57,664,238 | 309,179,581 | |||||||||||
|
| |||||||||||||
| Energy Equipment & Services 1.3% | ||||||||||||||
Baker Hughes Inc. | United States | 5,382,143 | 293,380,615 | |||||||||||
|
| |||||||||||||
| Food & Staples Retailing 2.7% | ||||||||||||||
CVS Health Corp. | United States | 3,061,866 | 246,357,738 | |||||||||||
Metro AG | Germany | 3,249,970 | 109,716,382 | |||||||||||
a | Rite Aid Corp. | United States | 13,959,587 | 41,180,782 | ||||||||||
Walgreens Boots Alliance Inc. | United States | 2,833,972 | 221,928,347 | |||||||||||
|
| |||||||||||||
| 619,183,249 | ||||||||||||||
|
| |||||||||||||
| Health Care Equipment & Supplies 3.8% | ||||||||||||||
Medtronic PLC | United States | 6,209,984 | 551,136,080 | |||||||||||
Stryker Corp. | United States | 2,207,102 | 306,301,616 | |||||||||||
|
| |||||||||||||
| 857,437,696 | ||||||||||||||
|
| |||||||||||||
| Hotels, Restaurants & Leisure 2.0% | ||||||||||||||
Accor SA | France | 7,758,692 | 363,755,806 | |||||||||||
Sands China Ltd. | Hong Kong | 21,300,300 | 97,529,471 | |||||||||||
|
| |||||||||||||
| 461,285,277 | ||||||||||||||
|
| |||||||||||||
| Independent Power & Renewable Electricity Producers 0.3% | ||||||||||||||
Vistra Energy Corp. | United States | 4,396,158 | 73,811,493 | |||||||||||
|
| |||||||||||||
| Industrial Conglomerates 3.3% | ||||||||||||||
General Electric Co. | United States | 12,389,000 | 334,626,890 | |||||||||||
Jardine Strategic Holdings Ltd. | Hong Kong | 342,898 | 14,295,418 | |||||||||||
Koninklijke Philips NV | Netherlands | 11,117,357 | 394,869,214 | |||||||||||
|
| |||||||||||||
| 743,791,522 | ||||||||||||||
|
| |||||||||||||
| Insurance 10.1% | ||||||||||||||
a | Alleghany Corp. | United States | 76,761 | 45,657,443 | ||||||||||
American International Group Inc. | United States | 5,102,618 | 319,013,522 | |||||||||||
China Pacific Insurance Group Co. Ltd., H | China | 44,491,587 | 181,778,570 | |||||||||||
Chubb Ltd. | United States | 1,651,098 | 240,036,627 | |||||||||||
The Hartford Financial Services Group Inc. | United States | 2,283,987 | 120,069,197 | |||||||||||
MetLife Inc. | United States | 3,841,066 | 211,028,166 | |||||||||||
NN Group NV | Netherlands | 11,287,329 | 401,228,648 | |||||||||||
RSA Insurance Group PLC | United Kingdom | 17,857,312 | 143,165,566 | |||||||||||
T&D Holdings Inc. | Japan | 6,611,212 | 100,474,436 | |||||||||||
White Mountains Insurance Group Ltd. | United States | 163,310 | 141,855,965 | |||||||||||
XL Group Ltd. | Bermuda | 8,454,755 | 370,318,269 | |||||||||||
|
| |||||||||||||
| 2,274,626,409 | ||||||||||||||
|
| |||||||||||||
franklintempleton.com |
Semiannual Report |
19 |
F R A N K LI N M U T U A L G L O B A L D I S C O V E R Y F U N D
S T A T E M E N T O F I N V E S T M E N T S ( U N A U D I T E D )
| Country | Shares/ Units | Value | ||||||||||||
Common Stocks and Other Equity Interests (continued) | ||||||||||||||
| IT Services 1.6% | ||||||||||||||
Cognizant Technology Solutions Corp., A | United States | 4,311,090 | $ | 286,256,376 | ||||||||||
DXC Technology Co. | United States | 862,421 | 66,164,939 | |||||||||||
|
| |||||||||||||
| 352,421,315 | ||||||||||||||
|
| |||||||||||||
| Machinery 1.7% | ||||||||||||||
Caterpillar Inc. | United States | 2,079,060 | 223,415,788 | |||||||||||
CNH Industrial NV | United Kingdom | 5,804,196 | 65,734,891 | |||||||||||
CNH Industrial NV, special voting | United Kingdom | 7,338,645 | 83,113,153 | |||||||||||
|
| |||||||||||||
| 372,263,832 | ||||||||||||||
|
| |||||||||||||
| Media 5.5% | ||||||||||||||
a | Charter Communications Inc., A | United States | 840,665 | 283,178,005 | ||||||||||
a | DISH Network Corp., A | United States | 4,143,726 | 260,060,244 | ||||||||||
Sky PLC | United Kingdom | 17,665,468 | 228,720,958 | |||||||||||
Time Warner Inc. | United States | 4,708,466 | 472,777,071 | |||||||||||
|
| |||||||||||||
| 1,244,736,278 | ||||||||||||||
|
| |||||||||||||
| Metals & Mining 1.2% | ||||||||||||||
a | Freeport-McMoRan Inc. | United States | 6,099,862 | 73,259,343 | ||||||||||
thyssenkrupp AG | Germany | 6,240,872 | 177,324,820 | |||||||||||
b,d | Warrior Met Coal Inc. | United States | 1,788,865 | 29,264,067 | ||||||||||
|
| |||||||||||||
| 279,848,230 | ||||||||||||||
|
| |||||||||||||
| Multi-Utilities 0.4% | ||||||||||||||
innogy SE | Germany | 2,114,859 | 83,257,020 | |||||||||||
|
| |||||||||||||
| Oil, Gas & Consumable Fuels 7.2% | ||||||||||||||
Apache Corp. | United States | 2,353,670 | 112,811,403 | |||||||||||
BP PLC | United Kingdom | 30,087,550 | 173,535,714 | |||||||||||
China Shenhua Energy Co. Ltd., H. | China | 24,504,444 | 54,546,731 | |||||||||||
a | CONSOL Energy Inc. | United States | 6,429,499 | 96,056,715 | ||||||||||
Crescent Point Energy Corp. | Canada | 16,701,800 | 127,826,143 | |||||||||||
JXTG Holdings Inc. | Japan | 12,891,743 | 56,238,417 | |||||||||||
Kinder Morgan Inc. | United States | 13,160,358 | 252,152,459 | |||||||||||
Marathon Oil Corp. | United States | 12,762,064 | 151,230,458 | |||||||||||
Royal Dutch Shell PLC, A (EUR Traded) | United Kingdom | 9,226,904 | 244,883,679 | |||||||||||
Royal Dutch Shell PLC, A (GBP Traded) | United Kingdom | 6,164,658 | 163,405,937 | |||||||||||
The Williams Cos. Inc. | United States | 6,364,035 | 192,702,980 | |||||||||||
|
| |||||||||||||
| 1,625,390,636 | ||||||||||||||
|
| |||||||||||||
| Pharmaceuticals 8.6% | ||||||||||||||
Eli Lilly & Co. | United States | 5,532,056 | 455,288,209 | |||||||||||
GlaxoSmithKline PLC | United Kingdom | 10,945,979 | 233,184,452 | |||||||||||
Merck & Co. Inc. | United States | 7,211,928 | 462,212,465 | |||||||||||
Novartis AG, ADR | Switzerland | 6,372,962 | 531,951,138 | |||||||||||
Teva Pharmaceutical Industries Ltd., ADR | Israel | 7,501,303 | 249,193,286 | |||||||||||
|
| |||||||||||||
| 1,931,829,550 | ||||||||||||||
|
| |||||||||||||
| Software 4.9% | ||||||||||||||
a | Check Point Software Technologies Ltd. | Israel | 3,379,372 | 368,621,898 | ||||||||||
a | Dell Technologies Inc., V. | United States | 1,105,751 | 67,572,443 | ||||||||||
Microsoft Corp. | United States | 4,958,875 | 341,815,254 | |||||||||||
Symantec Corp. | United States | 11,812,459 | 333,701,967 | |||||||||||
|
| |||||||||||||
| 1,111,711,562 | ||||||||||||||
|
| |||||||||||||
| Specialty Retail 0.7% | ||||||||||||||
Kingfisher PLC | United Kingdom | 42,834,793 | 167,773,950 | |||||||||||
|
| |||||||||||||
20 |
Semiannual Report |
franklintempleton.com |
F R A N K LI N M U T U A L G L O B A L D I S C O V E R Y F U N D
S T A T E M E N T O F I N V E S T M E N T S ( U N A U D I T E D )
| Country | Shares/ Units | Value | ||||||||||
Common Stocks and Other Equity Interests (continued) | ||||||||||||
| Technology Hardware, Storage & Peripherals 2.4% | ||||||||||||
Hewlett Packard Enterprise Co. | United States | 10,039,360 | $ | 166,552,982 | ||||||||
Lenovo Group Ltd. | China | 41,391,101 | 26,135,331 | |||||||||
Samsung Electronics Co. Ltd. | South Korea | 162,773 | 337,934,565 | |||||||||
|
| |||||||||||
| 530,622,878 | ||||||||||||
|
| |||||||||||
| Tobacco 4.0% | ||||||||||||
Altria Group Inc. | United States | 2,606,727 | 194,122,960 | |||||||||
British American Tobacco PLC | United Kingdom | 5,233,602 | 356,803,283 | |||||||||
Imperial Brands PLC | United Kingdom | 1,937,431 | 87,026,377 | |||||||||
Reynolds American Inc. | United States | 4,142,405 | 269,422,021 | |||||||||
|
| |||||||||||
| 907,374,641 | ||||||||||||
|
| |||||||||||
| Wireless Telecommunication Services 1.1% | ||||||||||||
Vodafone Group PLC | United Kingdom | 89,319,132 | 253,336,104 | |||||||||
|
| |||||||||||
Total Common Stocks and Other Equity Interests (Cost $15,965,690,390) | 20,235,670,260 | |||||||||||
|
| |||||||||||
| Preferred Stocks (Cost $391,187,079) 1.3% | ||||||||||||
| Automobiles 1.3% | ||||||||||||
hVolkswagen AG, 1.545%, pfd | Germany | 1,896,164 | 288,821,872 | |||||||||
|
| |||||||||||
| Principal Amount | ||||||||||||
| Corporate Bonds, Notes and Senior Floating Rate Interests 2.4% | ||||||||||||
i,j Avaya Inc., DIP Facility, 8.617% - 8.716%, 1/23/18 | United States | $ | 29,993,000 | 30,977,160 | ||||||||
i,j Belk Inc., Closing Date Term Loan, 5.905%, 12/12/22 | United States | 33,748,091 | 28,905,240 | |||||||||
CHS/Community Health Systems Inc., senior note, 6.875%, 2/01/22 | United States | 40,326,000 | 35,386,065 | |||||||||
i,j Cumulus Media Holdings Inc., Term Loans, 4.48%, 12/23/20 | United States | 84,755,114 | 68,545,699 | |||||||||
Frontier Communications Corp., senior note, 10.50%, 9/15/22 | United States | 14,600,000 | 13,961,250 | |||||||||
senior note, 11.00%, 9/15/25 | United States | 133,179,000 | 123,357,049 | |||||||||
iHeartCommunications Inc., senior secured note, first lien, 9.00%, 12/15/19 | United States | 95,618,000 | 75,418,697 | |||||||||
i,j Tranche D Term Loan, 7.976%, 1/30/19 | United States | 117,978,997 | 96,742,778 | |||||||||
i,j Tranche E Term Loan, 8.726%, 7/30/19 | United States | 37,921,652 | 31,095,755 | |||||||||
e Valeant Pharmaceuticals International, senior bond, 144A, 6.75%, 8/15/21 | United States | 12,886,000 | 12,306,130 | |||||||||
senior bond, 144A, 7.25%, 7/15/22 | United States | 8,530,000 | 8,050,187 | |||||||||
e Valeant Pharmaceuticals International Inc., senior note, 144A, 7.50%, 7/15/21 | United States | 6,740,000 | 6,554,650 | |||||||||
e Veritas U.S. Inc./Veritas Bermuda Ltd., senior note, 144A, 7.50%, 2/01/23 | United States | 11,929,000 | 12,853,497 | |||||||||
|
| |||||||||||
| Total Corporate Bonds, Notes and Senior Floating Rate Interests (Cost $572,861,878) |
|
544,154,157 |
| |||||||||
|
| |||||||||||
| Corporate Notes and Senior Floating Rate Interests in Reorganization 1.3% | ||||||||||||
k Avaya Inc., e senior note, 144A, 10.50%, 3/01/21 | United States | 98,429,000 | 10,088,973 | |||||||||
e senior secured note, 144A, 7.00%, 4/01/19. | United States | 28,496,000 | 23,010,520 | |||||||||
,j Term B-3 Loan, 7.63%, 10/26/17 | United States | 66,384,103 | 53,051,985 | |||||||||
i,j,l Term B-6 Loan, 4.13%, 3/30/18 | United States | 15,805,476 | 12,618,033 | |||||||||
franklintempleton.com |
Semiannual Report |
21 |
F R A N K LI N M U T U A L G L O B A L D I S C O V E R Y F U N D
S T A T E M E N T O F I N V E S T M E N T S ( U N A U D I T E D )
| Country | Principal Amount | Value | ||||||||||
| Corporate Notes and Senior Floating Rate Interests in | ||||||||||||
Reorganization (continued) | ||||||||||||
k Avaya Inc., (continued) | United States | $ | 83,409,022 | $ | 67,283,305 | |||||||
i,j Term B-7 Loan, 4.13%, 5/29/20 | ||||||||||||
b,k Broadband Ventures III LLC, secured promissory note, 5.00%, 2/01/12 | United States | 8,893 | — | |||||||||
i ,j,k Caesars Entertainment Operating Co. Inc., | ||||||||||||
Term B-5-B Loans, 1.50%, 3/01/17 | United States | 12,561,996 | 14,619,023 | |||||||||
Term B-6-B Loans, 1.50%, 3/01/17 | United States | 59,886,762 | 71,340,105 | |||||||||
Term B-7 Loans, 1.50%, 3/01/17 | United States | 43,747,511 | 54,520,336 | |||||||||
|
| |||||||||||
| Total Corporate Notes and Senior Floating Rate Interests in | ||||||||||||
| Reorganization (Cost $364,141,482) | 306,532,280 | |||||||||||
|
| |||||||||||
| Shares | ||||||||||||
| Companies in Liquidation 0.1% | ||||||||||||
a Adelphia Recovery Trust | United States | 45,477,593 | 29,561 | |||||||||
a,f Adelphia Recovery Trust, Arahova Contingent Value Vehicle, Contingent | ||||||||||||
Distribution | United States | 5,538,790 | 554 | |||||||||
a,f,g Century Communications Corp., Contingent Distribution | United States | 15,282,000 | — | |||||||||
a,b FIM Coinvestor Holdings I, LLC | United States | 30,279,560 | — | |||||||||
a,m Lehman Brothers Holdings Inc., Bankruptcy Claim | United States | 587,363,521 | 13,039,470 | |||||||||
a,f,g NewPage Corp., Litigation Trust, Contingent Distribution | United States | 145,817,000 | — | |||||||||
a,f,g Tribune Media, Litigation Trust, Contingent Distribution | United States | 1,287,601 | — | |||||||||
a,g Vistra Energy Corp., Litigation Trust | United States | 260,457,613 | 3,021,308 | |||||||||
a Vistra Energy Corp., Litigation Trust, TRA | United States | 4,396,159 | 4,725,870 | |||||||||
|
| |||||||||||
Total Companies in Liquidation (Cost $62,539,602) | 20,816,763 | |||||||||||
|
| |||||||||||
| Principal Amount | ||||||||||||
| Municipal Bonds in Reorganization (Cost $85,612,566) 0.3% | ||||||||||||
k Puerto Rico Commonwealth GO, Refunding, Series A, 8.00%, 7/01/35 | United States | $ | 98,292,000 | 59,958,120 | ||||||||
|
| |||||||||||
| Total Investments before Short Term Investments | ||||||||||||
| (Cost $17,442,032,997) | 21,455,953,452 | |||||||||||
|
| |||||||||||
| Short Term Investments 5.0% | ||||||||||||
| U.S. Government and Agency Securities 5.0% | ||||||||||||
n FHLB, 7/03/17 - 7/05/17 | United States | 256,200,000 | 256,197,168 | |||||||||
n U.S. Treasury Bill, o 8/17/17 - 11/09/17 | United States | 326,900,000 | 326,199,175 | |||||||||
7/27/17 - 12/21/17 | United States | 540,000,000 | 538,129,380 | |||||||||
|
| |||||||||||
| Total U.S. Government and Agency Securities | ||||||||||||
(Cost $1,120,524,592) | 1,120,525,723 | |||||||||||
|
| |||||||||||
Total Investments (Cost $18,562,557,589) 99.9% | 22,576,479,175 | |||||||||||
Other Assets, less Liabilities 0.1% | 20,705,992 | |||||||||||
|
| |||||||||||
Net Assets 100.0% | $ | 22,597,185,167 | ||||||||||
|
| |||||||||||
22 |
Semiannual Report |
franklintempleton.com |
F R A N K LI N M U T U A L G L O B A L D I S C O V E R Y F U N D
S T A T E M E N T O F I N V E S T M E N T S ( U N A U D I T E D )
aNon-income producing.
bSee Note 10 regarding restricted securities.
cSee Note 12 regarding holdings of 5% voting securities.
dAt June 30, 2017, pursuant to the Fund’s policies and the requirements of applicable securities law, the Fund is restricted from trading these securities at period end.
eSecurity was purchased pursuant to Rule 144A under the Securities Act of 1933 and may be sold in transactions exempt from registration only to qualified institutional buyers or in a public offering registered under the Securities Act of 1933. These securities have been deemed liquid under guidelines approved by the Trust’s Board of Trustees. At June 30, 2017, the aggregate value of these securities was $186,418,873, representing 0.8% of net assets.
fContingent distributions represent the right to receive additional distributions, if any, during the reorganization of the underlying company. Shares represent total underlying principal of debt securities.
gSecurity has been deemed illiquid because it may not be able to be sold within seven days. At June 30, 2017, the aggregate value of these securities was $3,021,308, representing less than 0.1% of net assets.
hVariable rate security. The rate shown represents the yield at period end.
iThe coupon rate shown represents the rate at period end.
jSee Note 1(g) regarding senior floating rate interests.
kSee Note 8 regarding credit risk and defaulted securities.
lA portion or all of the security purchased on a delayed delivery basis. See Note 1(c).
mBankruptcy claims represent the right to receive distribution, if any, during the liquidation of the underlying pool of assets. Shares represent amount of allowed unsecured claims.
nThe security was issued on a discount basis with no stated coupon rate.
oA portion or all of the security has been segregated as collateral for open forward contracts. At June 30, 2017, the aggregate value of these securities and/or cash pledged amounted to $188,420,023, representing 0.8% of net assets.
franklintempleton.com |
Semiannual Report |
23 |
F R A N K LI N M U T U A L G L O B A L D I S C O V E R Y F U N D
S T A T E M E N T O F I N V E S T M E N T S ( U N A U D I T E D )
At June 30, 2017, the Fund had the following futures contracts outstanding. See Note 1(d).
Futures Contracts
| Description | Type | Number of Contracts | Notional Value | Expiration Date | Unrealized Appreciation | Unrealized Depreciation | ||||||||||||||||||
| Currency Contracts | ||||||||||||||||||||||||
EUR/USD | Short | 9,058 | $ | 1,298,351,075 | 9/18/17 | $ — | $ | (22,795,749 | ) | |||||||||||||||
GBP/USD | Short | 9,564 | 779,764,875 | 9/18/17 | — | (16,026,487 | ) | |||||||||||||||||
|
| |||||||||||||||||||||||
Total Futures Contracts | $ — | $ | (38,822,236 | ) | ||||||||||||||||||||
|
| |||||||||||||||||||||||
Net unrealized appreciation (depreciation) | $ | (38,822,236 | ) | |||||||||||||||||||||
|
| |||||||||||||||||||||||
At June 30, 2017, the Fund had the following forward exchange contracts outstanding. See Note 1(d).
Forward Exchange Contracts
| Currency | Counterpartya | Type | Quantity | Contract Amount | Settlement Date | Unrealized Appreciation | Unrealized Depreciation | |||||||||||||||||||||
| OTC Forward Exchange Contracts | ||||||||||||||||||||||||||||
Euro | BOFA | Buy | 14,095,556 | $ | 15,902,307 | 7/12/17 | $ | 209,183 $ | — | |||||||||||||||||||
Euro | BOFA | Sell | 10,268,880 | 10,985,175 | 7/12/17 | — | (752,352 | ) | ||||||||||||||||||||
Euro | BONY | Sell | 1,178,167 | 1,267,378 | 7/12/17 | — | (79,290 | ) | ||||||||||||||||||||
Euro | FBCO | Sell | 177,653,381 | 191,220,769 | 7/12/17 | — | (11,840,456 | ) | ||||||||||||||||||||
Euro | HSBK | Buy | 10,232,696 | 11,525,177 | 7/12/17 | 170,992 | — | |||||||||||||||||||||
Euro | HSBK | Sell | 16,802,778 | 18,011,793 | 7/12/17 | — | (1,194,105 | ) | ||||||||||||||||||||
Euro | SSBT | Buy | 14,332,215 | 16,018,029 | 7/12/17 | 363,967 | — | |||||||||||||||||||||
Euro | SSBT | Sell | 181,007,842 | 194,761,111 | 7/12/17 | — | (12,134,328 | ) | ||||||||||||||||||||
Euro | UBSW | Buy | 7,559,803 | 8,442,183 | 7/12/17 | 198,817 | — | |||||||||||||||||||||
Euro | UBSW | Sell | 2,341,737 | 2,516,955 | 7/12/17 | — | (159,695 | ) | ||||||||||||||||||||
British Pound | BOFA | Buy | 35,622,207 | 45,483,206 | 7/13/17 | 937,391 | — | |||||||||||||||||||||
British Pound | BONY | Sell | 36,169,442 | 45,483,182 | 7/13/17 | — | (1,650,537 | ) | ||||||||||||||||||||
British Pound | FBCO | Sell | 3,983,543 | 4,871,889 | 7/13/17 | — | (319,211 | ) | ||||||||||||||||||||
British Pound | HSBK | Buy | 3,963,592 | 5,048,110 | 7/13/17 | 116,991 | — | |||||||||||||||||||||
British Pound | HSBK | Sell | 151,732,753 | 184,600,343 | 7/13/17 | — | (13,128,138 | ) | ||||||||||||||||||||
British Pound | SSBT | Buy | 6,122,817 | 7,856,228 | 7/13/17 | 122,639 | — | |||||||||||||||||||||
British Pound | SSBT | Sell | 158,364,305 | 192,607,223 | 7/13/17 | — | (13,763,075 | ) | ||||||||||||||||||||
British Pound | UBSW | Buy | 14,284,787 | 18,312,634 | 7/13/17 | 302,393 | — | |||||||||||||||||||||
British Pound | UBSW | Sell | 3,180,462 | 3,926,907 | 7/13/17 | — | (217,669 | ) | ||||||||||||||||||||
Euro | BOFA | Sell | 15,180,122 | 16,454,086 | 7/26/17 | — | (910,728 | ) | ||||||||||||||||||||
Euro | FBCO | Sell | 7,050,589 | 7,636,035 | 7/26/17 | — | (429,261 | ) | ||||||||||||||||||||
Euro | HSBK | Sell | 143,569,998 | 153,232,552 | 7/26/17 | — | (10,999,742 | ) | ||||||||||||||||||||
Euro | SSBT | Sell | 8,411,729 | 9,067,190 | 7/26/17 | — | (555,138 | ) | ||||||||||||||||||||
Euro | UBSW | Sell | 129,699,781 | 138,245,611 | 7/26/17 | — | (10,120,295 | ) | ||||||||||||||||||||
South Korean Won | BOFA | Sell | 24,431,871,607 | 21,412,683 | 8/11/17 | 68,839 | — | |||||||||||||||||||||
South Korean Won | HSBK | Buy | 93,711,440,300 | 83,281,396 | 8/11/17 | — | (1,414,466 | ) | ||||||||||||||||||||
South Korean Won | HSBK | Sell | 160,117,057,827 | 140,795,664 | 8/11/17 | 916,347 | — | |||||||||||||||||||||
South Korean Won | UBSW | Buy | 22,131,268,720 | 19,621,268 | 8/11/17 | — | (287,245 | ) | ||||||||||||||||||||
South Korean Won | UBSW | Sell | 12,412,224,980 | 10,807,914 | 8/11/17 | — | (35,487 | ) | ||||||||||||||||||||
South Korean Won | UBSW | Sell | 201,018,492,219 | 177,381,887 | 8/11/17 | 1,770,806 | — | |||||||||||||||||||||
British Pound | BOFA | Sell | 6,710,898 | 8,427,972 | 8/14/17 | — | (326,038 | ) | ||||||||||||||||||||
British Pound | HSBK | Sell | 140,920,855 | 177,338,390 | 8/14/17 | — | (6,485,368 | ) | ||||||||||||||||||||
British Pound | SSBT | Sell | 31,379,552 | 39,383,907 | 8/14/17 | — | (1,549,050 | ) | ||||||||||||||||||||
British Pound | UBSW | Sell | 139,755,630 | 175,873,376 | 8/14/17 | — | (6,430,407 | ) | ||||||||||||||||||||
Euro | BOFA | Sell | 31,559,325 | 33,999,581 | 8/18/17 | — | (2,144,037 | ) | ||||||||||||||||||||
24 |
Semiannual Report |
franklintempleton.com |
F R A N K LI N M U T U A L G L O B A L D I S C O V E R Y F U N D
S T A T E M E N T O F I N V E S T M E N T S ( U N A U D I T E D )
Forward Exchange Contracts (continued)
| Currency | Counterpartya | Type | Quantity | Contract Amount | Settlement Date | Unrealized Appreciation | Unrealized Depreciation | |||||||||||||||||||||
OTC Forward Exchange Contracts (continued) |
| |||||||||||||||||||||||||||
Euro | BONY | Sell | 11,764,352 | $ | 12,706,737 | 8/18/17 | $ | — | $ | (766,499 | ) | |||||||||||||||||
Euro | HSBK | Sell | 51,439,934 | 55,412,124 | 8/18/17 | — | (3,499,954 | ) | ||||||||||||||||||||
Euro | SSBT | Sell | 144,150,810 | 154,686,232 | 8/18/17 | — | (10,403,863 | ) | ||||||||||||||||||||
Euro | UBSW | Sell | 37,927,461 | 40,862,130 | 8/18/17 | — | (2,574,656 | ) | ||||||||||||||||||||
Japanese Yen | UBSW | Sell | 10,902,738,452 | 98,273,587 | 8/28/17 | 1,099,451 | — | |||||||||||||||||||||
Euro | BOFA | Sell | 224,021,075 | 240,964,642 | 10/10/17 | — | (16,344,815 | ) | ||||||||||||||||||||
Euro | HSBK | Sell | 170,659,747 | 183,963,167 | 10/10/17 | — | (12,055,744 | ) | ||||||||||||||||||||
Euro | UBSW | Sell | 10,690,825 | 11,812,560 | 10/10/17 | — | (466,867 | ) | ||||||||||||||||||||
Euro | BOFA | Sell | 2,189,586 | 2,401,715 | 10/18/17 | — | (114,385 | ) | ||||||||||||||||||||
Euro | BONY | Sell | 27,326,645 | 30,057,256 | 10/18/17 | — | (1,344,386 | ) | ||||||||||||||||||||
Euro | HSBK | Sell | 186,365,470 | 199,835,520 | 10/18/17 | — | (14,321,083 | ) | ||||||||||||||||||||
Euro | SSBT | Sell | 8,830,480 | 9,724,133 | 10/18/17 | — | (423,163 | ) | ||||||||||||||||||||
Euro | UBSW | Sell | 189,474,172 | 203,273,837 | 10/18/17 | — | (14,455,044 | ) | ||||||||||||||||||||
British Pound | BOFA | Sell | 44,038,441 | 57,087,323 | 10/24/17 | — | (482,709 | ) | ||||||||||||||||||||
British Pound | BONY | Sell | 3,309,931 | 4,294,404 | 10/24/17 | — | (32,562 | ) | ||||||||||||||||||||
British Pound | HSBK | Sell | 2,966,215 | 3,878,741 | 10/24/17 | 1,104 | — | |||||||||||||||||||||
British Pound | HSBK | Sell | 32,845,848 | 42,646,328 | 10/24/17 | — | (291,992 | ) | ||||||||||||||||||||
British Pound | SSBT | Sell | 35,110,466 | 45,925,259 | 10/24/17 | 26,479 | — | |||||||||||||||||||||
British Pound | SSBT | Sell | 99,231,229 | 128,149,009 | 10/24/17 | — | (1,572,775 | ) | ||||||||||||||||||||
British Pound | UBSW | Sell | 15,191,639 | 19,724,257 | 10/24/17 | — | (135,284 | ) | ||||||||||||||||||||
Euro | BOFA | Sell | 164,341,694 | 181,052,779 | 11/06/17 | — | (8,001,765 | ) | ||||||||||||||||||||
Euro | HSBK | Sell | 2,137,888 | 2,356,466 | 11/06/17 | — | (102,907 | ) | ||||||||||||||||||||
Euro | SSBT | Sell | 28,172,482 | 31,469,508 | 11/06/17 | — | (939,406 | ) | ||||||||||||||||||||
Euro | UBSW | Sell | 166,479,584 | 183,410,559 | 11/06/17 | — | (8,103,359 | ) | ||||||||||||||||||||
South Korean Won | HSBK | Sell | 78,881,828,374 | 69,858,124 | 11/10/17 | 829,718 | — | |||||||||||||||||||||
South Korean Won | UBSW | Sell | 115,146,781,513 | 101,564,455 | 11/10/17 | 801,084 | — | |||||||||||||||||||||
Euro | BOFA | Sell | 149,332,222 | 166,916,838 | 11/20/17 | — | (5,009,335 | ) | ||||||||||||||||||||
Euro | UBSW | Sell | 149,332,222 | 166,913,104 | 11/20/17 | — | (5,013,069 | ) | ||||||||||||||||||||
British Pound | BOFA | Sell | 3,293,257 | 4,315,999 | 11/24/17 | 6,809 | — | |||||||||||||||||||||
British Pound | BONY | Sell | 111,002,182 | 145,352,029 | 11/24/17 | 106,926 | — | |||||||||||||||||||||
British Pound | HSBK | Sell | 2,111,464 | 2,764,562 | 11/24/17 | 1,734 | — | |||||||||||||||||||||
British Pound | SSBT | Sell | 1,203,325 | 1,566,753 | 11/24/17 | — | (7,784 | ) | ||||||||||||||||||||
British Pound | SSBT | Sell | 6,945,167 | 9,094,870 | 11/24/17 | 7,197 | — | |||||||||||||||||||||
British Pound | UBSW | Sell | 115,385,533 | 151,069,674 | 11/24/17 | 89,005 | — | |||||||||||||||||||||
|
| |||||||||||||||||||||||||||
Total Forward Exchange Contracts | $ | 8,147,872 | $ | (203,389,524 | ) | |||||||||||||||||||||||
|
| |||||||||||||||||||||||||||
Net unrealized appreciation (depreciation) |
| $ | (195,241,652 | ) | ||||||||||||||||||||||||
|
| |||||||||||||||||||||||||||
aMay be comprised of multiple contracts with the same counterparty, currency and settlement date.
See Note 11 regarding other derivative information.
See Abbreviations on page 41.
franklintempleton.com |
The accompanying notes are an integral part of these financial statements. |
Semiannual Report |
25 |
F R A N K L I N M U T U A L G L O B A L D I S C O V E R Y F U N D
Statement of Assets and Liabilities
June 30, 2017 (unaudited)
Assets: | ||||
Investments in securities: | ||||
Cost - Unaffiliated issuers | $ | 18,533,462,218 | ||
Cost - Non-controlled affiliates (Note 12) | 29,095,371 | |||
|
| |||
Total cost of investments | $ | 18,562,557,589 | ||
|
| |||
Value - Unaffiliated issuers | $ | 22,554,633,847 | ||
Value - Non-controlled affiliates (Note 12) | 21,845,328 | |||
|
| |||
Total value of investments | 22,576,479,175 | |||
Cash | 1,374,633 | |||
Foreign currency, at value (cost $75,289,988) | 75,302,842 | |||
Receivables: | ||||
Investment securities sold | 116,430,458 | |||
Capital shares sold | 31,870,675 | |||
Dividends and interest | 68,513,812 | |||
European Union tax reclaims | 3,741,196 | |||
Due from brokers | 40,777,855 | |||
Variation margin | 100,263 | |||
Unrealized appreciation on OTC forward exchange contracts | 8,147,872 | |||
Other assets | 514,857 | |||
|
| |||
Total assets | 22,923,253,638 | |||
|
| |||
Liabilities: | ||||
Payables: | ||||
Investment securities purchased | 50,966,043 | |||
Capital shares redeemed | 40,614,474 | |||
Management fees | 15,070,452 | |||
Distribution fees | 9,136,496 | |||
Transfer agent fees | 4,394,252 | |||
Trustees’ fees and expenses | 779,244 | |||
Unrealized depreciation on OTC forward exchange contracts | 203,389,524 | |||
Accrued expenses and other liabilities | 1,717,986 | |||
|
| |||
Total liabilities | 326,068,471 | |||
|
| |||
Net assets, at value | $ | 22,597,185,167 | ||
|
| |||
Net assets consist of: | ||||
Paid-in capital | $ | 17,690,872,594 | ||
Undistributed net investment income | 220,755,288 | |||
Net unrealized appreciation (depreciation) | 3,780,149,365 | |||
Accumulated net realized gain (loss) | 905,407,920 | |||
|
| |||
Net assets, at value | $ | 22,597,185,167 | ||
|
|
26 |
Semiannual Report |
The accompanying notes are an integral part of these financial statements. |
franklintempleton.com |
F R A N K L I N M U T U A L G L O B A L D I S C O V E R Y F U N D
F I N A N C I A L S T A T E M E N T S
Statement of Assets and Liabilities (continued)
June 30, 2017 (unaudited)
| Class Z: | ||||
Net assets, at value | $ | 8,888,171,785 | ||
|
| |||
Shares outstanding | 267,614,839 | |||
|
| |||
Net asset value and maximum offering price per share | $33.21 | |||
|
| |||
| Class A: | ||||
Net assets, at value | $ | 10,058,728,962 | ||
|
| |||
Shares outstanding | 308,776,355 | |||
|
| |||
Net asset value per sharea | $32.58 | |||
|
| |||
Maximum offering price per share (net asset value per share ÷ 94.25%) | $34.57 | |||
|
| |||
| Class C: | ||||
Net assets, at value | $ | 2,616,631,784 | ||
|
| |||
Shares outstanding | 81,544,733 | |||
|
| |||
Net asset value and maximum offering price per sharea | $32.09 | |||
|
| |||
| Class R: | ||||
Net assets, at value | $ | 425,169,216 | ||
|
| |||
Shares outstanding | 13,240,790 | |||
|
| |||
Net asset value and maximum offering price per share | $32.11 | |||
|
| |||
| Class R6: | ||||
Net assets, at value | $ | 608,483,420 | ||
|
| |||
Shares outstanding | 18,308,399 | |||
|
| |||
Net asset value and maximum offering price per share | $33.24 | |||
|
|
a Redemption price is equal to net asset value less contingent deferred sales charges, if applicable.
franklintempleton.com |
The accompanying notes are an integral part of these financial statements. |
Semiannual Report |
27 |
F R A N K L I N M U T U A L G L O B A L D I S C O V E R Y F U N D
F I N A N C I A L S T A T E M E N T S
Statement of Operations
for the six months ended June 30, 2017 (unaudited)
Investment income: | ||||
Dividends (net of foreign taxes of $23,312,030) | $ | 335,119,988 | ||
Interest | 40,595,524 | |||
|
| |||
Total investment income. | 375,715,512 | |||
|
| |||
Expenses: | ||||
Management fees (Note 3a) | 91,101,749 | |||
Distribution fees: (Note 3c) | ||||
Class A | 12,768,311 | |||
Class C | 13,567,414 | |||
Class R | 1,101,253 | |||
Transfer agent fees: (Note 3e) | ||||
Class Z | 5,695,893 | |||
Class A | 6,728,352 | |||
Class C | 1,788,181 | |||
Class R | 290,821 | |||
Class R6 | 2,735 | |||
Custodian fees (Note 4) | 610,355 | |||
Reports to shareholders | 1,025,854 | |||
Registration and filing fees | 266,272 | |||
Professional fees | 498,117 | |||
Trustees’ fees and expenses | 354,181 | |||
Other | 241,395 | |||
|
| |||
Total expenses | 136,040,883 | |||
Expense reductions (Note 4) | (54,868 | ) | ||
|
| |||
Net expenses | 135,986,015 | |||
|
| |||
Net investment income | 239,729,497 | |||
|
| |||
Realized and unrealized gains (losses): | ||||
Net realized gain (loss) from: | ||||
Investments | 793,103,103 | |||
Foreign currency transactions | 109,135,158 | |||
Futures contracts | (67,028,808 | ) | ||
Securities sold short | (2,148,391 | ) | ||
|
| |||
Net realized gain (loss) | 833,061,062 | |||
|
| |||
Net change in unrealized appreciation (depreciation) on: Investments | 828,326,108 | |||
Translation of other assets and liabilities denominated in foreign currencies | (388,802,979 | ) | ||
Futures contracts | (59,756,509 | ) | ||
|
| |||
Net change in unrealized appreciation (depreciation) | 379,766,620 | |||
|
| |||
Net realized and unrealized gain (loss) | 1,212,827,682 | |||
|
| |||
Net increase (decrease) in net assets resulting from operations | $ | 1,452,557,179 | ||
|
|
28 |
Semiannual Report |
The accompanying notes are an integral part of these financial statements. |
franklintempleton.com |
F R A N K L I N M U T U A L G L O B A L D I S C O V E R Y F U N D
F I N A N C I A L S T A T E M E N T S
Statements of Changes in Net Assets
| Six Months Ended June 30, 2017 (unaudited) | Year Ended December 31, 2016 | |||||||
Increase (decrease) in net assets: | ||||||||
Operations: | ||||||||
Net investment income | $ | 239,729,497 | $ | 448,677,966 | ||||
Net realized gain (loss) | 833,061,062 | 976,195,241 | ||||||
Net change in unrealized appreciation (depreciation) | 379,766,620 | 1,145,149,281 | ||||||
|
| |||||||
Net increase (decrease) in net assets resulting from operations | 1,452,557,179 | 2,570,022,488 | ||||||
|
| |||||||
Distributions to shareholders from: | ||||||||
Net investment income: | ||||||||
Class Z | — | (176,437,033 | ) | |||||
Class A | — | (200,541,522 | ) | |||||
Class C | — | (33,021,201 | ) | |||||
Class R | — | (7,618,889 | ) | |||||
Class R6 | — | (10,674,922 | ) | |||||
Net realized gains: | ||||||||
Class Z | — | (326,765,440 | ) | |||||
Class A | — | (435,628,779 | ) | |||||
Class C | — | (116,244,017 | ) | |||||
Class R | — | (18,594,896 | ) | |||||
Class R6 | — | (18,722,984 | ) | |||||
|
| |||||||
Total distributions to shareholders | — | (1,344,249,683 | ) | |||||
|
| |||||||
Capital share transactions: (Note 2) | ||||||||
Class Z | (29,082,576 | ) | (1,201,294,226 | ) | ||||
Class A | (1,099,864,549 | ) | (1,372,576,556 | ) | ||||
Class C | (307,647,166 | ) | (376,018,782 | ) | ||||
Class R | (47,520,178 | ) | (47,755,202 | ) | ||||
Class R6 | 43,162,536 | 268,573,248 | ||||||
|
| |||||||
Total capital share transactions | (1,440,951,933 | ) | (2,729,071,518 | ) | ||||
|
| |||||||
Net increase (decrease) in net assets. | 11,605,246 | (1,503,298,713 | ) | |||||
Net assets: | ||||||||
Beginning of period | 22,585,579,921 | 24,088,878,634 | ||||||
|
| |||||||
End of period | $ | 22,597,185,167 | $ | 22,585,579,921 | ||||
|
| |||||||
Undistributed net investment income included in net assets: | ||||||||
End of period | $ | 220,755,288 | $ | — | ||||
|
| |||||||
Distributions in excess of net investment income included in net assets: | ||||||||
End of period | $ | — | $ | (18,974,209 | ) | |||
|
| |||||||
franklintempleton.com |
The accompanying notes are an integral part of these financial statements. |
Semiannual Report |
29 |
F R A N K L I N M U T U A L G L O B A L D I S C O V E R Y F U N D
Notes to Financial Statements (unaudited)
1. Organization and Significant Accounting Policies
Franklin Mutual Series Funds (Trust) is registered under the Investment Company Act of 1940 (1940 Act) as an open-end management investment company, consisting of seven separate funds and applies the specialized accounting and reporting guidance in U.S. Generally Accepted Accounting Principles (U.S. GAAP). Franklin Mutual Global Discovery Fund (Fund) is included in this report. The Fund offers five classes of shares: Class Z, Class A, Class C, Class R and Class R6. Each class of shares may differ by its initial sales load, contingent deferred sales charges, voting rights on matters affecting a single class, its exchange privilege and fees primarily due to differing arrangements for distribution and transfer agent fees.
The following summarizes the Fund’s significant accounting policies.
a. Financial Instrument Valuation
The Fund’s investments in financial instruments are carried at fair value daily. Fair value is the price that would be received to sell an asset or paid to transfer a liability in an orderly transaction between market participants on the measurement date. The Fund calculates the net asset value (NAV) per share as of 4 p.m. Eastern time each day the New York Stock Exchange (NYSE) is open for trading. Under compliance policies and procedures approved by the Trust’s Board of Trustees (the Board), the Fund’s administrator has responsibility for oversight of valuation, including leading the cross-functional Valuation Committee (VC). The VC provides administration and oversight of the Fund’s valuation policies and procedures, which are approved annually by the Board. Among other things, these procedures allow the Fund to utilize independent pricing services, quotations from securities and financial instrument dealers, and other market sources to determine fair value.
Equity securities and derivative financial instruments listed on an exchange or on the NASDAQ National Market System are valued at the last quoted sale price or the official closing price of the day, respectively. Foreign equity securities are valued as of the close of trading on the foreign stock exchange on which the security is primarily traded, or as of 4 p.m. Eastern time. The value is then converted into its U.S. dollar equivalent at the foreign exchange rate in effect at 4 p.m. Eastern time on the day that the value of the security is determined. Over-the-counter (OTC) securities are valued within the range of the most recent
quoted bid and ask prices. Securities that trade in multiple markets or on multiple exchanges are valued according to the broadest and most representative market. Certain equity securities are valued based upon fundamental characteristics or relationships to similar securities.
Debt securities generally trade in the OTC market rather than on a securities exchange. The Fund’s pricing services use multiple valuation techniques to determine fair value. In instances where sufficient market activity exists, the pricing services may utilize a market-based approach through which quotes from market makers are used to determine fair value. In instances where sufficient market activity may not exist or is limited, the pricing services also utilize proprietary valuation models which may consider market characteristics such as benchmark yield curves, credit spreads, estimated default rates, anticipated market interest rate volatility, coupon rates, anticipated timing of principal repayments, underlying collateral, and other unique security features in order to estimate the relevant cash flows, which are then discounted to calculate the fair value.
Certain derivative financial instruments trade in the OTC market. The Fund’s pricing services use various techniques including industry standard option pricing models and proprietary discounted cash flow models to determine the fair value of those instruments. The Fund’s net benefit or obligation under the derivative contract, as measured by the fair value of the contract, is included in net assets.
The Fund has procedures to determine the fair value of financial instruments for which market prices are not reliable or readily available. Under these procedures, the VC convenes on a regular basis to review such financial instruments and considers a number of factors, including significant unobservable valuation inputs, when arriving at fair value. The VC primarily employs a market-based approach which may use related or comparable assets or liabilities, recent transactions, market multiples, book values, and other relevant information for the investment to determine the fair value of the investment. An income-based valuation approach may also be used in which the anticipated future cash flows of the investment are discounted to calculate fair value. Discounts may also be applied due to the nature or duration of any restrictions on the disposition of the investments. Due to the inherent uncertainty of valuations of such investments, the fair values may differ significantly from the values that would have been used had an active market existed. The VC employs various methods for calibrating these
30 |
Semiannual Report |
franklintempleton.com |
F R A N K L I N M U T U A L G L O B A L D I S C O V E R Y F U N D
N O T E S T O F I N A N C I A L S T A T E M E N T S ( U N A U D I T E D )
valuation approaches including a regular review of key inputs and assumptions, transactional back-testing or disposition analysis, and reviews of any related market activity.
Trading in securities on foreign securities stock exchanges and OTC markets may be completed before 4 p.m. Eastern time. In addition, trading in certain foreign markets may not take place on every Fund’s business day. Occasionally, events occur between the time at which trading in a foreign security is completed and 4 p.m. Eastern time that might call into question the reliability of the value of a portfolio security held by the Fund. As a result, differences may arise between the value of the Fund’s portfolio securities as determined at the foreign market close and the latest indications of value at 4 p.m. Eastern time. In order to minimize the potential for these differences, the VC monitors price movements following the close of trading in foreign stock markets through a series of country specific market proxies (such as baskets of American Depositary Receipts, futures contracts and exchange traded funds). These price movements are measured against established trigger thresholds for each specific market proxy to assist in determining if an event has occurred that may call into question the reliability of the values of the foreign securities held by the Fund. If such an event occurs, the securities may be valued using fair value procedures, which may include the use of independent pricing services.
When the last day of the reporting period is a non-business day, certain foreign markets may be open on those days that the Fund’s NAV is not calculated, which could result in differences between the value of the Fund’s portfolio securities on the last business day and the last calendar day of the reporting period. Any significant security valuation changes due to an open foreign market are adjusted and reflected by the Fund for financial reporting purposes.
b. Foreign Currency Translation
Portfolio securities and other assets and liabilities denominated in foreign currencies are translated into U.S. dollars based on the exchange rate of such currencies against U.S. dollars on the date of valuation. The Fund may enter into foreign currency exchange contracts to facilitate transactions denominated in a foreign currency. Purchases and sales of securities, income and expense items denominated in foreign currencies are translated into U.S. dollars at the exchange rate in effect on the transaction date. Portfolio securities and assets and liabilities denominated in foreign currencies contain risks that those currencies will
decline in value relative to the U.S. dollar. Occasionally, events may impact the availability or reliability of foreign exchange rates used to convert the U.S. dollar equivalent value. If such an event occurs, the foreign exchange rate will be valued at fair value using procedures established and approved by the Board.
The Fund does not separately report the effect of changes in foreign exchange rates from changes in market prices on securities held. Such changes are included in net realized and unrealized gain or loss from investments in the Statement of Operations.
Realized foreign exchange gains or losses arise from sales of foreign currencies, currency gains or losses realized between the trade and settlement dates on securities transactions and the difference between the recorded amounts of dividends, interest, and foreign withholding taxes and the U.S. dollar equivalent of the amounts actually received or paid. Net unrealized foreign exchange gains and losses arise from changes in foreign exchange rates on foreign denominated assets and liabilities other than investments in securities held at the end of the reporting period.
c. Securities Purchased on a Delayed Delivery Basis
The Fund purchases securities on a delayed delivery basis, with payment and delivery scheduled for a future date. These transactions are subject to market fluctuations and are subject to the risk that the value at delivery may be more or less than the trade date purchase price. Although the Fund will generally purchase these securities with the intention of holding the securities, it may sell the securities before the settlement date. Sufficient assets have been segregated for these securities.
d. Derivative Financial Instruments
The Fund invested in derivative financial instruments in order to manage risk or gain exposure to various other investments or markets. Derivatives are financial contracts based on an underlying or notional amount, require no initial investment or an initial net investment that is smaller than would normally be required to have a similar response to changes in market factors, and require or permit net settlement. Derivatives contain various risks including the potential inability of the counterparty to fulfill their obligations under the terms of the contract, the potential for an illiquid secondary market, and/or the potential for market movements which expose the Fund to gains or losses in excess of the amounts shown in the Statement of Assets and
franklintempleton.com |
Semiannual Report |
|
31 |
|
F R A N K L I N M U T U A L G L O B A L D I S C O V E R Y F U N D
N O T E S T O F I N A N C I A L S T A T E M E N T S ( U N A U D I T E D )
1. Organization and Significant Accounting Policies (continued)
d. Derivative Financial Instruments (continued)
Liabilities. Realized gain and loss and unrealized appreciation and depreciation on these contracts for the period are included in the Statement of Operations.
Derivative counterparty credit risk is managed through a formal evaluation of the creditworthiness of all potential counter-parties. The Fund attempts to reduce its exposure to counterparty credit risk on OTC derivatives, whenever possible, by entering into International Swaps and Derivatives Association (ISDA) master agreements with certain counterparties. These agreements contain various provisions, including but not limited to collateral requirements, events of default, or early termination. Termination events applicable to the counterparty include certain deteriorations in the credit quality of the counterparty. Termination events applicable to the Fund include failure of the Fund to maintain certain net asset levels and/or limit the decline in net assets over various periods of time. In the event of default or early termination, the ISDA master agreement gives the non-defaulting party the right to net and close-out all transactions traded, whether or not arising under the ISDA agreement, to one net amount payable by one counterparty to the other. However, absent an event of default or early termination, OTC derivative assets and liabilities are presented gross and not offset in the Statement of Assets and Liabilities. Early termination by the counterparty may result in an immediate payment by the Fund of any net liability owed to that counterparty under the ISDA agreement. At June 30, 2017, the Fund had OTC derivatives in a net liability position of $195,241,652 and the aggregate value of collateral pledged for such contracts was $188,420,023.
Collateral requirements differ by type of derivative. Collateral or initial margin requirements are set by the broker or exchange clearing house for exchange traded and centrally cleared derivatives. Initial margin deposited is held at the exchange and can be in the form of cash and/or securities. For OTC derivatives traded under an ISDA master agreement, posting of collateral is required by either the Fund or the applicable counterparty if the total net exposure of all OTC derivatives with the applicable counterparty exceeds the minimum transfer amount, which typically ranges from $100,000 to $250,000, and can vary depending on the counterparty and the type of the agreement. Generally, collateral is determined at the close of
Fund business each day and any additional collateral required due to changes in derivative values may be delivered by the Fund or the counterparty the next business day, or within a few business days. Collateral pledged and/or received by the Fund for OTC derivatives, if any, is held in segregated accounts with the Fund’s custodian/counterparty broker and can be in the form of cash and/or securities. Unrestricted cash may be invested according to the Fund’s investment objectives. To the extent that the amounts due to the Fund from its counterparties are not subject to collateralization or are not fully collateralized, the Fund bears the risk of loss from counterparty non-performance.
The Fund entered into exchange traded futures contracts primarily to manage exposure to certain foreign currencies. A futures contract is an agreement between the Fund and a counterparty to buy or sell an asset at a specified price on a future date. Required initial margins are pledged by the Fund, and the daily change in fair value is accounted for as a variation margin payable or receivable in the Statement of Assets and Liabilities.
The Fund entered into OTC forward exchange contracts primarily to manage exposure to certain foreign currencies. A forward exchange contract is an agreement between the Fund and a counterparty to buy or sell a foreign currency at a specific exchange rate on a future date.
See Note 11 regarding other derivative information.
e. Securities Sold Short
The Fund is engaged in selling securities short, which obligates the Fund to replace a borrowed security with the same security at current fair value. The Fund incurs a loss if the price of the security increases between the date of the short sale and the date on which the Fund replaces the borrowed security. The Fund realizes a gain if the price of the security declines between those dates. Gains are limited to the price at which the Fund sold the security short, while losses are potentially unlimited in size.
The Fund is required to establish a margin account with the broker lending the security sold short. While the short sale is outstanding, the broker retains the proceeds of the short sale to the extent necessary to meet margin requirements until the short position is closed out. A deposit must also be maintained with the Fund’s custodian/counterparty broker consisting of cash and/or securities having a value equal to a specified percentage of the value of the securities sold short. The Fund is obligated to pay fees for borrowing the securities sold short and is required
32 |
Semiannual Report |
franklintempleton.com |
F R A N K L I N M U T U A L G L O B A L D I S C O V E R Y F U N D
N O T E S T O F I N A N C I A L S T A T E M E N T S ( U N A U D I T E D )
to pay the counterparty any dividends and/or interest due on securities sold short. Such dividends and/or interest and any security borrowing fees are recorded as an expense to the Fund. At June 30, 2017, the Fund had no securities sold short.
f. Securities Lending
The Fund participates in an agency based securities lending program to earn additional income. The Fund receives cash collateral against the loaned securities in an amount equal to at least 102% of the fair value of the loaned securities. Collateral is maintained over the life of the loan in an amount not less than 100% of the fair value of loaned securities, as determined at the close of Fund business each day; any additional collateral required due to changes in security values is delivered to the Fund on the next business day. The collateral is deposited into a joint cash account with other funds and is used to invest in a money market fund managed by Franklin Advisers, Inc., an affiliate of the Fund, and/or a joint repurchase agreement. The Fund may receive income from the investment of cash collateral, in addition to lending fees and rebates paid by the borrower. Income from securities loaned, net of fees paid to the securities lending agent and/or third-party vendor, is reported separately in the Statement of Operations, if any. The Fund bears the market risk with respect to the collateral investment, securities loaned, and the risk that the agent may default on its obligations to the Fund. If the borrower defaults on its obligation to return the securities loaned, the Fund has the right to repurchase the securities in the open market using the collateral received. The securities lending agent has agreed to indemnify the Fund in the event of default by a third party borrower. At June 30, 2017, the Fund had no securities on loan.
g. Senior Floating Rate Interests
The Fund invests in senior secured corporate loans that pay interest at rates which are periodically reset by reference to a base lending rate plus a spread. These base lending rates are generally the prime rate offered by a designated U.S. bank or the London InterBank Offered Rate (LIBOR). Senior secured corporate loans often require prepayment of principal from excess cash flows or at the discretion of the borrower. As a result, actual maturity may be substantially less than the stated maturity. Senior secured corporate loans in which the Fund invests are generally readily marketable, but may be subject to certain restrictions on resale.
h. Income and Deferred Taxes
It is the Fund’s policy to qualify as a regulated investment company under the Internal Revenue Code. The Fund intends to distribute to shareholders substantially all of its taxable income and net realized gains to relieve it from federal income and excise taxes. As a result, no provision for U.S. federal income taxes is required.
The Fund may be subject to foreign taxation related to income received, capital gains on the sale of securities and certain foreign currency transactions in the foreign jurisdictions in which it invests. Foreign taxes, if any, are recorded based on the tax regulations and rates that exist in the foreign markets in which the Fund invests. When a capital gain tax is determined to apply, the Fund records an estimated deferred tax liability in an amount that would be payable if the securities were disposed of on the valuation date. As a result of several court cases, in certain countries across the European Union, the Fund filed additional tax reclaims for previously withheld taxes on dividends earned in those countries (EU reclaims). These additional filings are subject to various administrative proceedings by the local jurisdictions’ tax authorities within the European Union, as well as a number of related judicial proceedings. Income recognized, if any, for EU reclaims is reflected as other income in the Statement of Operations and any related receivable, if any, is reflected as European Union tax reclaims in the Statement of Assets and Liabilities. When uncertainty exists as to the ultimate resolution of these proceedings, the likelihood of receipt of these EU reclaims, and the potential timing of payment, no amounts are reflected in the financial statements. For U.S. income tax purposes, EU reclaims received by the Fund, if any, reduce the amounts of foreign taxes Fund shareholders can use as tax credits in their individual income tax returns.
The Fund may recognize an income tax liability related to its uncertain tax positions under U.S. GAAP when the uncertain tax position has a less than 50% probability that it will be sustained upon examination by the tax authorities based on its technical merits. As of June 30, 2017, the Fund has determined that no tax liability is required in its financial statements related to uncertain tax positions for any open tax years (or expected to be taken in future tax years). Open tax years are those that remain subject to examination and are based on each tax jurisdiction’s statute of limitation.
franklintempleton.com |
Semiannual Report |
|
33 |
|
F R A N K L I N M U T U A L G L O B A L D I S C O V E R Y F U N D
N O T E S T O F I N A N C I A L S T A T E M E N T S ( U N A U D I T E D )
1. Organization and Significant Accounting
Policies (continued)
i. Security Transactions, Investment Income, Expenses and Distributions
Security transactions are accounted for on trade date. Realized gains and losses on security transactions are determined on a specific identification basis. Interest income and estimated expenses are accrued daily. Amortization of premium and accretion of discount on debt securities are included in interest income. Dividend income is recorded on the ex-dividend date except for certain dividends from securities where the dividend rate is not available. In such cases, the dividend is recorded as soon as the information is received by the Fund. Distributions to shareholders are recorded on the ex-dividend date. Distributable earnings are determined according to income tax regulations (tax basis) and may differ from earnings recorded in accordance with U.S. GAAP. These differences may be permanent or temporary. Permanent differences are reclassified among capital accounts to reflect their tax character. These reclassifications have no impact on net assets or the results of operations. Temporary differences are not reclassified, as they may reverse in subsequent periods.
Common expenses incurred by the Trust are allocated among the Funds based on the ratio of net assets of each Fund to the combined net assets of the Trust. Fund specific expenses are charged directly to the Fund that incurred the expense.
Realized and unrealized gains and losses and net investment income, not including class specific expenses, are allocated daily to each class of shares based upon the relative proportion of net assets of each class. Differences in per share distributions, by class, are generally due to differences in class specific expenses.
j. Accounting Estimates
The preparation of financial statements in accordance with U.S. GAAP requires management to make estimates and assumptions that affect the reported amounts of assets and liabilities at the date of the financial statements and the amounts of income and expenses during the reporting period. Actual results could differ from those estimates.
k. Guarantees and Indemnifications
Under the Trust’s organizational documents, its officers and trustees are indemnified by the Trust against certain liabilities arising out of the performance of their duties to the Trust. Additionally, in the normal course of business, the Trust, on behalf of the Fund, enters into contracts with service providers that contain general indemnification clauses. The Trust’s maximum exposure under these arrangements is unknown as this would involve future claims that may be made against the Trust that have not yet occurred. Currently, the Trust expects the risk of loss to be remote.
2. Shares of Beneficial Interest
At June 30, 2017, there were an unlimited number of shares authorized (without par value). Transactions in the Fund’s shares were as follows:
Six Months Ended June 30, 2017 | Year Ended December 31, 2016 | |||||||||||||||
| Shares | Amount | Shares | Amount | |||||||||||||
| Class Z Shares: | ||||||||||||||||
Shares sold | 49,070,047 | $ | 1,588,336,904 | 55,397,128 | $ | 1,662,439,998 | ||||||||||
Shares issued in reinvestment of distributions | — | — | 15,044,678 | 468,213,378 | ||||||||||||
Shares redeemed | (49,887,564 | ) | (1,617,419,480 | ) | (113,174,673 | ) | (3,331,947,602) | |||||||||
|
| |||||||||||||||
Net increase (decrease) | (817,517 | ) | $ | (29,082,576 | ) | (42,732,867 | ) | $ | (1,201,294,226) | |||||||
|
| |||||||||||||||
| Class A Shares: | ||||||||||||||||
Shares sold | 19,392,885 | $ | 618,976,974 | 35,127,143 | $ | 1,014,171,059 | ||||||||||
Shares issued in reinvestment of distributions | — | — | 20,440,282 | 624,283,614 | ||||||||||||
Shares redeemed | (54,090,042 | ) | (1,718,841,523 | ) | (102,820,657 | ) | (3,011,031,229) | |||||||||
|
| |||||||||||||||
Net increase (decrease) | (34,697,157 | ) | $ | (1,099,864,549 | ) | (47,253,232 | ) | $ | (1,372,576,556) | |||||||
|
| |||||||||||||||
34 |
Semiannual Report |
franklintempleton.com |
F R A N K L I N M U T U A L G L O B A L D I S C O V E R Y F U N D
N O T E S T O F I N A N C I A L S T A T E M E N T S ( U N A U D I T E D )
Six Months Ended June 30, 2017 | Year Ended December 31, 2016 | |||||||||||||||
| Shares | Amount | Shares | Amount | |||||||||||||
| Class C Shares: | ||||||||||||||||
Shares sold | 3,995,275 | $ | 125,712,923 | 7,120,197 | $ | 203,328,360 | ||||||||||
Shares issued in reinvestment of distributions | — | — | 4,628,208 | 139,510,899 | ||||||||||||
Shares redeemed | (13,731,362 | ) | (433,360,089 | ) | (24,940,702 | ) | (718,858,041) | |||||||||
Net increase (decrease) | (9,736,087 | ) | $ | (307,647,166 | ) | (13,192,297 | ) | $ | (376,018,782) | |||||||
| Class R Shares: | ||||||||||||||||
Shares sold | 1,094,538 | $ | 34,375,885 | 1,951,411 | $ | 55,809,510 | ||||||||||
Shares issued in reinvestment of distributions | — | — | 844,579 | 25,450,207 | ||||||||||||
Shares redeemed | (2,599,011 | ) | (81,896,063 | ) | (4,482,315 | ) | (129,014,919) | |||||||||
Net increase (decrease) | (1,504,473 | ) | $ | (47,520,178 | ) | (1,686,325 | ) | $ | (47,755,202) | |||||||
| Class R6 Shares: | ||||||||||||||||
Shares sold | 2,984,841 | $ | 96,688,816 | 11,717,779 | $ | 343,905,697 | ||||||||||
Shares issued in reinvestment of distributions | — | — | 728,048 | 22,663,432 | ||||||||||||
Shares redeemed | (1,659,654 | ) | (53,526,280 | ) | (3,290,558 | ) | (97,995,881) | |||||||||
Net increase (decrease) | 1,325,187 | $ | 43,162,536 | 9,155,269 | $ | 268,573,248 | ||||||||||
3. Transactions with Affiliates
Franklin Resources, Inc. is the holding company for various subsidiaries that together are referred to as Franklin Templeton Investments. Certain officers and trustees of the Fund are also officers and/or directors of the following subsidiaries:
| Subsidiary | Affiliation | |
Franklin Mutual Advisers, LLC (Franklin Mutual) | Investment manager | |
Franklin Templeton Services, LLC (FT Services) | Administrative manager | |
Franklin Templeton Distributors, Inc. (Distributors) | Principal underwriter | |
Franklin Templeton Investor Services, LLC (Investor Services) | Transfer agent |
a. Management Fees
The Fund pays an investment management fee to Franklin Mutual based on the average daily net assets of the Fund as follows:
| Annualized Fee Rate | Net Assets | |
0.875% | Up to and including $4 billion | |
0.845% | Over $4 billion, up to and including $7 billion | |
0.825% | Over $7 billion, up to and including $10 billion | |
0.805% | Over $10 billion, up to and including $13 billion | |
0.785% | Over $13 billion, up to and including $16 billion | |
0.765% | Over $16 billion, up to and including $19 billion | |
0.745% | Over $19 billion, up to and including $22 billion | |
0.725% | Over $22 billion, up to and including $25 billion | |
0.705% | Over $25 billion, up to and including $28 billion | |
0.685% | In excess of $28 billion |
For the period ended June 30, 2017, the annualized effective investment management fee rate was 0.807% of the Fund’s average daily net assets.
franklintempleton.com |
Semiannual Report |
|
35 |
|
F R A N K L I N M U T U A L G L O B A L D I S C O V E R Y F U N D
N O T E S T O F I N A N C I A L S T A T E M E N T S ( U N A U D I T E D )
3. Transactions with Affiliates (continued)
b. Administrative Fees
Under an agreement with Franklin Mutual, FT Services provides administrative services to the Fund. The fee is paid by Franklin Mutual based on the Fund’s average daily net assets, and is not an additional expense of the Fund.
c. Distribution Fees
The Board has adopted distribution plans for each share class, with the exception of Class Z and Class R6 shares, pursuant to Rule 12b-1 under the 1940 Act. Under the Fund’s Class A reimbursement distribution plan, the Fund reimburses Distributors for costs incurred in connection with the servicing, sale and distribution of the Fund’s shares up to the maximum annual plan rate. Under the Class A reimbursement distribution plan, costs exceeding the maximum for the current plan year cannot be reimbursed in subsequent periods. In addition, under the Fund’s Class C and R compensation distribution plans, the Fund pays Distributors for costs incurred in connection with the servicing, sale and distribution of the Fund’s shares up to the maximum annual plan rate for each class. The plan year, for purposes of monitoring compliance with the maximum annual plan rates, is February 1 through January 31.
The maximum annual plan rates, based on the average daily net assets, for each class, are as follows:
Class A | 0.35 | % | ||
Class C | 1.00 | % | ||
Class R | 0.50 | % |
The Board has set the current rate at 0.25% per year for Class A shares until further notice and approval by the Board.
d. Sales Charges/Underwriting Agreements
Front-end sales charges and contingent deferred sales charges (CDSC) do not represent expenses of the Fund. These charges are deducted from the proceeds of sales of Fund shares prior to investment or from redemption proceeds prior to remittance, as applicable. Distributors has advised the Fund of the following commission transactions related to the sales and redemptions of the Fund’s shares for the period:
Sales charges retained net of commissions paid to unaffiliated brokers/dealers | $ | 1,369,236 | ||
CDSC retained | $ | 81,756 |
e. Transfer Agent Fees
Each class of shares, except for Class R6, pays transfer agent fees to Investor Services for its performance of shareholder servicing obligations and reimburses Investor Services for out of pocket expenses incurred, including shareholder servicing fees paid to third parties. These fees are allocated daily based upon their relative proportion of such classes’ aggregate net assets. Class R6 pays Investor Services transfer agent fees specific to that class.
For the period ended June 30, 2017, the Fund paid transfer agent fees of $14,505,982, of which $5,301,451 was retained by Investor Services.
4. Expense Offset Arrangement
The Fund has entered into an arrangement with its custodian whereby credits realized as a result of uninvested cash balances are used to reduce a portion of the Fund’s custodian expenses. During the period ended June 30, 2017, the custodian fees were reduced as noted in the Statement of Operations.
36 |
Semiannual Report |
franklintempleton.com |
F R A N K L I N M U T U A L G L O B A L D I S C O V E R Y F U N D
N O T E S T O F I N A N C I A L S T A T E M E N T S ( U N A U D I T E D )
5. Independent Trustees’ Retirement Plan
On January 1, 1993, the Trust adopted an Independent Trustees’ Retirement Plan (Plan). The Plan is an unfunded defined benefit plan that provides benefit payments to Trustees whose length of service and retirement age meets the eligibility requirements of the Plan. Benefits under the Plan are based on years of service and fees paid to each trustee at the time of retirement. Effective in December 1996, the Plan was closed to new participants.
During the period ended June 30, 2017, the Fund’s projected benefit obligation and benefit payments under the Plan were as follows:
aProjected benefit obligation at June 30, 2017 | $ | 779,244 | ||
bIncrease in projected benefit obligation | $ | 6,920 | ||
Benefit payments made to retired trustees | $ | (11,139 | ) | |
aThe projected benefit obligation is included in trustees’ fees and expenses in the Statement of Assets and Liabilities.
bThe increase in projected benefit obligation is included in trustees’ fees and expenses in the Statement of Operations.
6. Income Taxes
At June 30, 2017, the cost of investments and net unrealized appreciation (depreciation) for income tax purposes were as follows:
Cost of investments | $ | 18,581,379,017 | ||
Unrealized appreciation | $ | 5,343,020,981 | ||
Unrealized depreciation | (1,347,920,823 | ) | ||
Net unrealized appreciation (depreciation) | $ | 3,995,100,158 | ||
Differences between income and/or capital gains as determined on a book basis and a tax basis are primarily due to differing treatment of foreign currency transactions.
7. Investment Transactions
Purchases and sales of investments (excluding short term securities and securities sold short) for the period ended June 30, 2017, aggregated $2,176,728,739 and $3,398,433,509, respectively.
8. Credit Risk and Defaulted Securities
The Fund may purchase the pre-default or defaulted debt of distressed companies. Distressed companies are financially troubled and could be or are already involved in financial restructuring or bankruptcy. Risks associated with purchasing these securities include the possibility that the bankruptcy or other restructuring process takes longer than expected, or that distributions in restructuring are less than anticipated, either or both of which may result in unfavorable consequences to the Fund. If it becomes probable that the income on debt securities, including those of distressed companies, will not be collected, the Fund discontinues accruing income and recognizes an adjustment for uncollectible interest.
At June 30, 2017, the aggregate long value of distressed company securities for which interest recognition has been discontinued was $366,490,400, representing 1.6% of the Fund’s net assets. For information as to specific securities, see the accompanying Statement of Investments.
franklintempleton.com |
Semiannual Report |
|
37 |
|
F R A N K L I N M U T U A L G L O B A L D I S C O V E R Y F U N D
N O T E S T O F I N A N C I A L S T A T E M E N T S ( U N A U D I T E D )
9. Concentration of Risk
Investing in foreign securities may include certain risks and considerations not typically associated with investing in U.S. securities, such as fluctuating currency values and changing local and regional economic, political and social conditions, which may result in greater market volatility. In addition, certain foreign securities may not be as liquid as U.S. securities.
10. Restricted Securities
The Fund invests in securities that are restricted under the Securities Act of 1933 (1933 Act) or which are subject to legal, contractual, or other agreed upon restrictions on resale. Restricted securities are often purchased in private placement transactions, and cannot be sold without prior registration unless the sale is pursuant to an exemption under the 1933 Act. Disposal of these securities may require greater effort and expense, and prompt sale at an acceptable price may be difficult. The Fund may have registration rights for restricted securities. The issuer generally incurs all registration costs.
At June 30, 2017, investments in restricted securities, excluding certain securities exempt from registration under the 1933 Act deemed to be liquid, were as follows:
| Principal Amount/ Shares/ Units | Issuer | Acquisition Date | Cost | Value | ||||||||||
8,893 | Broadband Ventures III LLC, secured promissory note, 5.00%, 2/01/12 | 7/01/10 - 11/30/12 | $ | 8,893 | $ | — | ||||||||
30,279,560 | FIM Coinvestor Holdings I, LLC | 11/20/06 - 6/02/09 | — | — | ||||||||||
2,491,917 | Hightower Holding LLC, B, Series II | 6/10/10 - 5/10/12 | 7,620,000 | 7,765,313 | ||||||||||
3,819,425 | International Automotive Components Group Brazil LLC | 4/13/06 - 12/26/08 | 2,536,498 | 93,419 | ||||||||||
35,491,081 | International Automotive Components Group North America LLC | 1/12/06 - 3/18/13 | 29,095,371 | 21,845,328 | ||||||||||
1,788,865 | Warrior Met Coal Inc. | 3/31/16 - 6/23/16 | 10,261,771 | $ | 29,264,067 | |||||||||
|
| |||||||||||||
| Total Restricted Securities (Value is 0.3% of Net Assets) | $ | 49,522,533 | $ | 58,968,127 | ||||||||||
|
| |||||||||||||
11. Other Derivative Information
At June 30, 2017, the Fund’s investments in derivative contracts are reflected in the Statement of Assets and Liabilities as follows:
| Asset Derivatives | Liability Derivatives | |||||||||||
Derivative Contracts Not Accounted for as Hedging | Statement of Assets and Liabilities Location | Fair Value | Statement of Assets and Liabilities | Fair Value | ||||||||
Foreign exchange contracts | Variation margin | $ | 38,822,236 | a | ||||||||
Unrealized appreciation on OTC forward exchange contracts | $ | 8,147,872 | Unrealized depreciation on OTC forward exchange contracts | 203,389,524 | ||||||||
|
|
|
| |||||||||
Totals | $ | 8,147,872 | $ | 242,211,760 | ||||||||
|
|
|
| |||||||||
aThis amount reflects the cumulative appreciation (depreciation) of futures contracts as reported in the Statement of Investments. Only the variation margin receivable/ payable at period end is separately reported within the Statement of Assets and Liabilities. Prior variation margin movements were recorded to cash upon receipt or payment.
38 |
Semiannual Report |
franklintempleton.com |
F R A N K L I N M U T U A L G L O B A L D I S C O V E R Y F U N D
N O T E S T O F I N A N C I A L S T A T E M E N T S ( U N A U D I T E D )
For the period ended June 30, 2017, the effect of derivative contracts in the Fund’s Statement of Operations was as follows:
Derivative Contracts Not Accounted for as Hedging | Statement of Operations Location | Net Realized Gain (Loss) for the Period | Statement of Operations Location | Net Change in Unrealized Appreciation (Depreciation) for the Period | ||||||
Net realized gain (loss) from: | Net change in unrealized appreciation (depreciation) on: | |||||||||
Foreign exchange contracts | Foreign currency transactions | $ | 105,804,088 | a | Translation of other assets and liabilities denominated in foreign currencies | $(389,744,623)a | ||||
Futures contracts | (67,028,808 | ) | Futures contracts | (59,756,509) | ||||||
|
|
| ||||||||
Totals | $ | 38,775,280 | $(449,501,132) | |||||||
|
|
| ||||||||
aForward exchange contracts are included in net realized gain (loss) from foreign currency transactions and net change in unrealized appreciation (depreciation) on translation of other assets and liabilities denominated in foreign currencies in the Statement of Operations.
For the period ended June 30, 2017, the average month end notional amount of futures contracts represented $1,990,249,026. The average month end contract value of forward exchange contracts was $4,691,976,274.
See Note 1(d) regarding derivative financial instruments.
12. Holdings of 5% Voting Securities of Portfolio Companies
The 1940 Act defines “affiliated companies” to include investments in portfolio companies in which a fund owns 5% or more of the outstanding voting securities. During the period ended June 30, 2017, investments in “affiliated companies” were as follows:
| Name of Issuer | Number of Shares Held at Beginning of Period | Gross Additions | Gross Reductions | Number of of Period | Value at End of Period | Investment Income | Realized Gain (Loss) | |||||||||||||||||||||
| Non-Controlled Affiliates | ||||||||||||||||||||||||||||
International Automotive Components Group North America LLC (Value is 0.1% of Net Assets) | 35,491,081 | — | — | 35,491,081 | $21,845,328 | $ — | $ — | |||||||||||||||||||||
|
| |||||||||||||||||||||||||||
13. Credit Facility
The Fund, together with other U.S. registered and foreign investment funds (collectively, Borrowers), managed by Franklin Templeton Investments, are borrowers in a joint syndicated senior unsecured credit facility totaling $2 billion (Global Credit Facility) which matures on February 9, 2018. This Global Credit Facility provides a source of funds to the Borrowers for temporary and emergency purposes, including the ability to meet future unanticipated or unusually large redemption requests.
Under the terms of the Global Credit Facility, the Fund shall, in addition to interest charged on any borrowings made by the Fund and other costs incurred by the Fund, pay its share of fees and expenses incurred in connection with the implementation and maintenance of the Global Credit Facility, based upon its relative share of the aggregate net assets of all of the Borrowers, including an annual commitment fee of 0.15% based upon the unused portion of the Global Credit Facility. These fees are reflected in other expenses in the Statement of Operations. During the period ended June 30, 2017, the Fund did not use the Global Credit Facility.
franklintempleton.com |
Semiannual Report |
|
39 |
|
F R A N K L I N M U T U A L G L O B A L D I S C O V E R Y F U N D
N O T E S T O F I N A N C I A L S T A T E M E N T S ( U N A U D I T E D )
14. Fair Value Measurements
The Fund follows a fair value hierarchy that distinguishes between market data obtained from independent sources (observable inputs) and the Fund’s own market assumptions (unobservable inputs). These inputs are used in determining the value of the Fund’s financial instruments and are summarized in the following fair value hierarchy:
| • | Level 1 – quoted prices in active markets for identical financial instruments |
| • | Level 2 – other significant observable inputs (including quoted prices for similar financial instruments, interest rates, prepayment speed, credit risk, etc.) |
| • | Level 3 – significant unobservable inputs (including the Fund’s own assumptions in determining the fair value of financial instruments) |
The input levels are not necessarily an indication of the risk or liquidity associated with financial instruments at that level.
For movements between the levels within the fair value hierarchy, the Fund has adopted a policy of recognizing the transfers as of the date of the underlying event which caused the movement.
A summary of inputs used as of June 30, 2017, in valuing the Fund’s assets and liabilities carried at fair value, is as follows:
| Level 1 | Level 2 | Level 3 | Total | |||||||||||||
| Assets: | ||||||||||||||||
Investments in Securities: | ||||||||||||||||
Equity Investments:a | ||||||||||||||||
Auto Components | $ | — | $ | — | $ | 21,938,747 | $ | 21,938,747 | ||||||||
Diversified Financial Services | 126,398,162 | — | 7,765,313 | 134,163,475 | ||||||||||||
Machinery | 289,150,679 | 83,113,153 | — | 372,263,832 | ||||||||||||
Metals & Mining | 250,584,163 | — | 29,264,067 | 279,848,230 | ||||||||||||
All Other Equity Investmentsb | 19,716,277,848 | — | —c | 19,716,277,848 | ||||||||||||
Corporate Bonds, Notes and Senior Floating | ||||||||||||||||
Rate Interests | — | 544,154,157 | — | 544,154,157 | ||||||||||||
Corporate Notes and Senior Floating Rate | ||||||||||||||||
Interests in Reorganization | — | 306,532,280 | —c | 306,532,280 | ||||||||||||
Companies in Liquidation | — | 17,795,455 | 3,021,308c | 20,816,763 | ||||||||||||
Municipal Bonds in Reorganization | — | 59,958,120 | — | 59,958,120 | ||||||||||||
Short Term Investments | 864,328,555 | 256,197,168 | — | 1,120,525,723 | ||||||||||||
|
| |||||||||||||||
Total Investments in Securities | $ | 21,246,739,407 | $ | 1,267,750,333 | $ | 61,989,435 | $ | 22,576,479,175 | ||||||||
|
| |||||||||||||||
Other Financial Instruments: | ||||||||||||||||
Forward Exchange Contracts | $ | — | $ | 8,147,872 | $ | — | $ | 8,147,872 | ||||||||
|
| |||||||||||||||
| Liabilities: | ||||||||||||||||
Other Financial Instruments: | ||||||||||||||||
Futures Contracts | $ | 38,822,236 | $ | — | $ | — | $ | 38,822,236 | ||||||||
Forward Exchange Contracts | — | 203,389,524 | — | 203,389,524 | ||||||||||||
|
| |||||||||||||||
Total Other Financial Instruments | $ | 38,822,236 | $ | 203,389,524 | $ | — | $ | 242,211,760 | ||||||||
|
| |||||||||||||||
aIncludes common and preferred stocks as well as other equity investments.
bFor detailed categories, see the accompanying Statement of Investments.
cIncludes securities determined to have no value at June 30, 2017.
A reconciliation of assets in which Level 3 inputs are used in determining fair value is presented when there are significant Level 3 financial instruments at the end of the period.
40 |
Semiannual Report |
franklintempleton.com |
F R A N K L I N M U T U A L G L O B A L D I S C O V E R Y F U N D
N O T E S T O F I N A N C I A L S T A T E M E N T S ( U N A U D I T E D )
15. New Accounting Pronouncements
In March 2017, the Financial Accounting Standards Board issued Accounting Standards Update (ASU) No. 2017-08, Receivables—Nonrefundable Fees and Other Costs (Subtopic 310-20): Premium Amortization on Purchased Callable Debt Securities. The amendments in the ASU shorten the amortization period for certain callable debt securities, held at a premium, to be amortized to the earliest call date. The ASU does not require an accounting change for securities held at a discount; which continues to be amortized to maturity. The ASU is effective for fiscal years and interim periods within those fiscal years beginning after December 15, 2018. Management is currently evaluating the impact, if any, of applying this provision.
16. Investment Company Reporting Modernization
In October 2016, the U.S. Securities and Exchange Commission adopted new rules and amended existing rules (together, final rules) intended to modernize the reporting and disclosure of information by registered investment companies. In part, the final rules amend Regulation S-X and require standardized, enhanced disclosures about derivatives in investment company financial statements, as well as other amendments. The compliance date for the amendments to Regulation S-X is August 1, 2017. Management has reviewed the requirements and believes the adoption of the amendments to Regulation S-X will not have a material impact on the Fund’s financial statements and related disclosures.
17. Subsequent Events
The Fund has evaluated subsequent events through the issuance of the financial statements and determined that no events have occurred that require disclosure.
Abbreviations
| Counterparty | Currency | Selected Portfolio | ||||||||
| BOFA | Bank of America N.A. | EUR | Euro | ADR | American Depositary Receipt | |||||
| BONY | The Bank of New York Mellon Corp. | GBP | British Pound | DIP | Debtor-In-Possession | |||||
| FBCO | Credit Suisse International | USD | United States Dollar | FHLB | Federal Home Loan Bank | |||||
| HSBK | HSBC Bank PLC | GO | General Obligation | |||||||
| SSBT | State Street Bank and Trust Co., N.A. | TRA | Tax Receivable Agreement Right | |||||||
| UBSW | UBS AG | |||||||||
franklintempleton.com |
Semiannual Report |
|
41 |
|
F R A N K L I N M U T U A L S E R I E S F U N D S
F R A N K L I N M U T U A L G L O B A L D I S C O V E R Y F U N D
Board Approval of Investment Management Agreements
FRANKLIN MUTUAL SERIES FUNDS
Franklin Mutual Global Discovery Fund
(“Fund”)
The Board of Trustees (Board), including a majority of trustees that are not “interested persons” as such term is defined in section 2(a)(19) of the Investment Company Act of 1940 (hereinafter referred to as “independent trustees”), at an in-person meeting held on May 22, 2017, unanimously approved the renewal of the Fund’s investment management agreement. Prior to a meeting of all of the trustees for the purpose of considering such renewal, the independent trustees participated in two other meetings held in connection with the renewal process. Throughout the process, the independent trustees received assistance and advice from and met separately with independent counsel. The independent trustees met with and interviewed officers of the investment manager (including portfolio managers), the transfer agent and shareholder services group and the distributor. In approving the renewal of the investment management agreement for the Fund, the Board, including the independent trustees, determined that the investment management fee structure was fair and reasonable and that continuance of the agreement was in the best interests of the Fund and its shareholders.
In reaching their decision on the investment management agreement, the trustees took into account information furnished throughout the year at regular Board meetings, as well as information specifically requested and furnished for the renewal process, which culminated in the meetings referred to above for the specific purpose of considering such agreement. Information furnished throughout the year included, among others, reports on the Fund’s investment performance, expenses, portfolio composition, portfolio brokerage execution, client commission arrangements, derivatives, securities lending, asset segregation, portfolio turnover, Rule 12b-1 plan, distribution, shareholder servicing, legal and compliance matters, pricing of securities, sales and redemptions, and marketing support payments made to financial intermediaries, as well as a third-party survey of transfer agent fees charged to funds within the Franklin Templeton Investments (FTI) complex in comparison with those charged to other fund complexes deemed comparable. Also, related financial statements and other information about the scope and quality of services provided by the investment manager and its affiliates and enhancements to such services over the past year were
provided. In addition, the trustees received periodic reports throughout the year and during the renewal process relating to compliance with the Fund’s investment policies and restrictions. During the renewal process, the independent trustees considered the investment manager’s methods of operation within the Franklin Templeton group and its activities on behalf of other clients. The Board also noted that it received an annual report on all payments made by FTI or the Fund to financial intermediaries engaged in the sale of Fund shares, as well as a memorandum relating to third-party servicing arrangements in response to a Guidance Update from the U.S. Securities and Exchange Commission (SEC) relating to mutual fund distribution and sub-accounting fees.
The information obtained by the trustees during the renewal process also included a special report prepared by Broadridge Financial Solutions, Inc., an independent third-party analyst that utilizes data from Lipper, Inc. (“Lipper”), comparing the Fund’s investment performance and expenses with those of other mutual funds deemed comparable to the Fund as selected by Lipper (Broadridge Section 15(c) Report). The trustees reviewed the Broadridge Section 15(c) Report and its usefulness in the renewal process with respect to matters such as comparative fees, expenses, expense ratios, performance and volatility. They concluded that the report continues to be a reliable resource in the performance of their duties.
In addition, the trustees received a Profitability Study (Profitability Study) prepared by management discussing the profitability to FTI from its overall U.S. fund operations, as well as on an individual fund-by-fund basis. Over the past year, the Board and counsel to the independent trustees continued to receive reports on management’s handling of recent regulatory inquiries and pending legal actions against the investment manager and its affiliates. The independent trustees were satisfied with the actions taken to date by management in response to such regulatory and legal matters.
Particular attention was given to management’s diligent risk management program, including continual monitoring and management of cybersecurity, liquidity and counterparty credit risk, and attention given to derivatives and other complex instruments that are held and expected to be held by the Fund and how such instruments are used to carry out the Fund’s investment goal(s). The Board also took into account, among other things, management’s efforts in establishing a global credit facility for the benefit of the Fund and other accounts managed by FTI to provide a source of cash for temporary and emergency purposes or to meet unusual redemption requests as
42 |
Semiannual Report |
franklintempleton.com |
F R A N K L I N M U T U A L S E R I E S F U N D S
F R A N K L I N M U T U A L G L O B A L D I S C O V E R Y F U N D
S H A R E H O L D E R I N F O R M A T I O N
well as the strong financial position of the investment manager’s parent company and its commitment to the mutual fund business. In addition, the Board received updates from management on the SEC’s progress in implementing the rule-making requirements established by the Dodd-Frank Wall Street Reform and Consumer Protection Act (Dodd-Frank Act), which was enacted July 21, 2010, and the investment manager’s compliance with rules and regulations already promulgated by the SEC under such act.
In addition to the above and other matters considered by the trustees throughout the course of the year, the following discussion relates to certain primary factors relevant to the Board’s decision. This discussion of the information and factors considered by the Board (including the information and factors discussed above) is not intended to be exhaustive, but rather summarizes certain factors considered by the Board. In view of the wide variety of factors considered, the Board did not, unless otherwise noted, find it practicable to quantify or otherwise assign relative weights to the foregoing factors. In addition, individual trustees may have assigned different weights to various factors.
NATURE, EXTENT AND QUALITY OF SERVICES. The trustees reviewed the nature, extent and quality of the services provided, and to be provided, by the investment manager. The trustees cited the investment manager’s ability to implement the Fund’s disciplined value investment approach and its long-term relationship with the Fund as reasons that shareholders choose to invest, and remain invested, in the Fund. The trustees reviewed the Fund’s portfolio management team, including its performance, staffing, skills and compensation program. With respect to portfolio manager compensation, management assured the trustees that the Fund’s long-term performance is a significant component of incentive-based compensation and noted that a portion of a portfolio manager’s incentive-based compensation is paid in shares of pre-designated funds from the portfolio manager’s fund management area. The trustees noted that the portfolio manager compensation program aligned the interests of the portfolio managers with that of shareholders of the Fund. The trustees discussed with management various other products, portfolios and entities that are advised by the investment manager and the allocation of assets and expenses among and within them, as well as their relative fees and reasons for differences with respect thereto and any potential conflicts. During regular Board meetings and the aforementioned meetings of the independent trustees, the trustees received reports and presentations on the investment manager’s best execution trading policies. The trustees considered
periodic reports provided to them showing that the investment manager complied with the investment policies and restrictions of the Fund as well as other reports periodically furnished to the Board covering matters such as the compliance of portfolio managers and other management personnel with the code of ethics covering the investment management personnel, the adherence to fair value pricing procedures established by the Board and the accuracy of net asset value calculations. The Board noted the extent of the benefits provided to Fund shareholders from being part of the Franklin Templeton group of funds, including the right to exchange investments between funds (same class) without a sales charge, the ability to reinvest Fund dividends into other funds and the right to combine holdings of other funds to obtain reduced sales charges. The Board considered the investment manager’s significant efforts in developing and implementing compliance procedures established in accordance with SEC and other requirements.
The Board considered the nature, extent and quality of the services to be provided under the Fund’s other service agreements to determine that, on an overall basis, Fund shareholders were well served. In this connection, the Board also took into account transfer agent and shareholder services provided to Fund shareholders by an affiliate of the investment manager, noting continuing expenditures by management to increase and improve the scope of such services and favorable periodic reports on shareholder services conducted by independent third parties. While such considerations directly affected the trustees’ decision in renewing the Fund’s transfer agent and shareholder services agreement, the Board also considered these commitments as incidental benefits to Fund shareholders deriving from the investment management relationship.
Based on their review, the trustees were satisfied with the nature and quality of the overall services provided, and to be provided, by the investment manager and its affiliates to the Fund and its shareholders and were confident in the abilities of the management team to continue the disciplined value investment approach of the Fund and to provide quality services to the Fund and its shareholders.
INVESTMENT PERFORMANCE. The trustees reviewed and placed significant emphasis on the investment performance of the Fund over the one-, three-, five- and 10-year periods ended December 31, 2016. They considered the history of successful performance of the Fund relative to various benchmarks. As part of their review, they inquired of management regarding benchmarks, style drift and restrictions
franklintempleton.com |
Semiannual Report |
|
43 |
|
F R A N K L I N M U T U A L S E R I E S F U N D S
F R A N K L I N M U T U A L G L O B A L D I S C O V E R Y F U N D
S H A R E H O L D E R I N F O R M A T I O N
on permitted investments. Consideration was also given to performance in the context of available levels of cash during the periods.
The trustees had meetings during the year, including the meetings referred to above held in connection with the renewal process, with the Fund’s portfolio managers to discuss performance and the management of the Fund. In addition, particular attention in assessing performance was given to the Broadridge Section 15(c) Report. That report showed the investment performance of the Fund (Class A shares) in comparison to other funds determined comparable by Lipper.
The comparable funds to the Fund, as chosen by Lipper, included all retail and institutional global multi-cap value funds. The Fund had total returns in the best performing quintile for the one-year period ended December 31, 2016, and had annualized total returns for the three- and five-year periods in the second-best performing quintile. The trustees noted that the Fund’s total return on an annualized basis for the 10-year period ended December 31, 2016 was in the best performing quintile. The trustees were satisfied with such comparative performance.
The trustees also compared Fund performance to other industry benchmarks, including measures of risk-adjusted performance of a fund, as part of their evaluation of investment performance. The trustees concluded that the Fund had continued to perform well in comparison to its various benchmarks and in the context of the Fund’s goal.
COMPARATIVE EXPENSES AND MANAGEMENT PROFITABILITY. The trustees considered the cost of the services provided and to be provided and the profits realized by the investment manager and its affiliates from their respective relationships with the Fund. As part of the renewal process, the trustees explored with management the trends in expense ratios over the past three fiscal years and the reasons for any increases in the Fund’s expense ratios (or components thereof). In considering the appropriateness of the management fee and other expenses charged to the Fund, the Board took into account various factors including investment performance and matters relating to Fund operations, including, but not limited to, the quality and experience of its portfolio managers and research staff. Consideration was also given to a comparative analysis in the Broadridge Section 15(c) Report of the investment management fee and total expense ratio of the Fund in comparison with those of a group of other funds selected by Lipper as its appropriate Lipper expense group. Lipper expense data is based upon information taken from the Fund’s most
recent annual report, which reflects historical asset levels that may be quite different from those currently existing, particularly in a period of market volatility. While recognizing such inherent limitation and the fact that expense ratios generally increase as assets decline and decrease as assets grow, the Board believed the independent analysis conducted by Lipper to be an appropriate measure of comparative expenses.
In reviewing comparative costs, emphasis was given to the Fund’s contractual management fee in comparison with the contractual management fee that would have been charged by other funds within its Lipper expense group assuming they were similar in size to the Fund, as well as the actual total expenses of the Fund in comparison with those of its Lipper expense group. The Lipper contractual management fee analysis includes administrative charges as being part of the management fee, and total expenses, for comparative consistency, are shown by Lipper for Fund Class A shares.
The Fund’s contractual management fee rate was in the middle quintile of its Lipper expense group and its total expenses were in the second-least expensive quintile of such group. The Board was satisfied with such comparative fees and expenses.
The trustees also reviewed the Profitability Study addressing profitability of Franklin Resources, Inc., from its overall U.S. fund business, as well as profitability to the Fund’s investment manager and its affiliates, from providing investment management and other services to the Fund during the
12-month period ended September 30, 2016, the most recent fiscal year-end of Franklin Resources, Inc. The trustees reviewed the basis on which such reports are prepared and the cost allocation methodology utilized in the Profitability Study, it being recognized that allocation methodologies may each be reasonable while producing different results. In this respect, the Board noted that the reasonableness of the cost allocation methodologies was reviewed by independent accountants on an every other year basis.
The independent trustees met with management to discuss the Profitability Study. This included, among other things, a comparison of investment management income with investment management expenses of the Fund; comparison of underwriting revenues and expenses; the relative relationship of investment management and underwriting expenses; shareholder servicing profitability; economies of scale; and the relative contribution of the Fund to the profitability of the investment manager and its parent. In discussing the Profitability Study with the Board, the investment manager stated its belief that the costs incurred
44 |
Semiannual Report |
franklintempleton.com |
F R A N K L I N M U T U A L S E R I E S F U N D S
F R A N K L I N M U T U A L G L O B A L D I S C O V E R Y F U N D
S H A R E H O L D E R I N F O R M A T I O N
in establishing the infrastructure necessary to operate the type of mutual fund operations conducted by it and its affiliates may not be fully reflected in the expenses allocated to the Fund in determining its profitability.
The Board also took into account management’s expenditures in improving shareholder services provided to the Fund, as well as the need to meet additional regulatory and compliance requirements resulting from the Sarbanes-Oxley Act, the Dodd-Frank Act and recent SEC and other regulatory requirements. The trustees also considered the extent to which the investment manager may derive ancillary benefits from Fund operations, including those derived from economies of scale, discussed below, the allocation of Fund brokerage and the use of commission dollars to pay for research and other similar services.
Based upon their consideration of all these factors, the trustees determined that the level of profits realized by the investment manager and its affiliates in providing services to the Fund was not excessive in view of the nature, quality and extent of services provided.
ECONOMIES OF SCALE. The Board considered economies of scale realized by the investment manager and its affiliates as the Fund grows larger and the extent to which they are shared with Fund shareholders, as for example, in the level of the investment management fee charged, in the quality and efficiency of services rendered and in increased capital commitments benefiting the Fund directly or indirectly. While recognizing that any precise determination is inherently subjective, the trustees noted that, based upon the Profitability Study, as some funds increase in size, at some point economies of scale may result in the investment manager realizing a larger profit margin on investment management services provided to such a fund. The trustees also noted that benefits of economies of scale will be shared with Fund shareholders due to the decline in the effective investment management fee rate as breakpoints are achieved by the Fund.
The trustees noted that breakpoints had been instituted as part of the Fund’s investment management fee and that the Board regularly evaluates whether additional breakpoints are appropriate. The trustees assessed the savings to shareholders resulting from such breakpoints and believed they were, and continue to be, appropriate and they agreed to continue to monitor the appropriateness of the breakpoints. The trustees also considered the effects an increase in assets under management would have on the investment management fee and expense ratio of the Fund. To the extent further economies
of scale may be realized by the investment manager and its affiliates, the Board believed the investment management and administrative fees provide a sharing of benefits with the Fund and its shareholders.
Proxy Voting Policies and Procedures
The Fund’s investment manager has established Proxy Voting Policies and Procedures (Policies) that the Fund uses to determine how to vote proxies relating to portfolio securities. Shareholders may view the Fund’s complete Policies online at franklintempleton.com. Alternatively, shareholders may request copies of the Policies free of charge by calling the Proxy Group collect at (954) 527-7678 or by sending a written request to: Franklin Templeton Companies, LLC, 300 S.E. 2nd Street, Fort Lauderdale, FL 33301, Attention: Proxy Group. Copies of the Fund’s proxy voting records are also made available online at franklintempleton.com and posted on the U.S. Securities and Exchange Commission’s website at sec.gov and reflect the most recent 12-month period ended June 30.
Quarterly Statement of Investments
The Trust, on behalf of the Fund, files a complete statement of investments with the U.S. Securities and Exchange Commission for the first and third quarters for each fiscal year on Form N-Q. Shareholders may view the filed Form N-Q by visiting the Commission’s website at sec.gov. The filed form may also be viewed and copied at the Commission’s Public Reference Room in Washington, DC. Information regarding the operations of the Public Reference Room may be obtained by calling (800) SEC-0330.
franklintempleton.com |
Semiannual Report |
|
45 |
|
This page intentionally left blank.
This page intentionally left blank.
This page intentionally left blank.
| Semiannual Report and Shareholder Letter Franklin Mutual Global Discovery Fund
Investment Manager Franklin Mutual Advisers, LLC
Distributor Franklin Templeton Distributors, Inc. (800) DIAL BEN® / 342-5236 franklintempleton.com
Shareholder Services (800) 632-2301 - (Class A, C, R & R6) (800) 448-FUND - (Class Z) |
Authorized for distribution only when accompanied or preceded by a summary prospectus and/or prospectus. Investors should carefully consider a fund’s investment goals, risks, charges and expenses before investing. A prospectus contains this and other information; please read it carefully before investing.
To help ensure we provide you with quality service, all calls to and from our service areas are monitored and/or recorded.
© 2017 Franklin Templeton Investments. All rights reserved. | 477 S 08/17 |
| Semiannual Report and Shareholder Letter June 30, 2017
|

Franklin Mutual European Fund
A SERIES OF FRANKLIN MUTUAL SERIES FUNDS
|
|

Sign up for electronic delivery at franklintempleton.com/edelivery
Franklin Templeton Investments
Gain From Our Perspective®
At Franklin Templeton Investments, we’re dedicated to one goal: delivering exceptional asset management for our clients. By bringing together multiple, world-class investment teams in a single firm, we’re able to offer specialized expertise across styles and asset classes, all supported by the strength and resources of one of the world’s largest asset managers. This has helped us to become a trusted partner to individual and institutional investors across the globe.
Dear Franklin Mutual European Fund Shareholder:
The first half of 2017 saw most equity markets continue their long move upwards. European stocks, as measured by the MSCI Europe Index, gained +7.91% in local currency terms and +15.93% in U.S. dollar terms.1 Stocks in global developed markets, as measured by the MSCI World Index delivered a +11.02% total return.1
The political uncertainty and unpredictability of recent years has continued in 2017. In the U.S., President Trump has continued his unconventional governance approach, while Congress has remained relentlessly partisan, leading to significant uncertainty about policies and legislation. The financial markets expected “business friendly” moves, but specific legislative progress on issues such as health care, tax reform and infrastructure did not come to fruition. In the U.K., a surprise election was called in April when the Conservative Party held a huge polling lead, but at the June election the Tories lost their majority in Parliament. Recent elections in France went according to expectations, lending some much appreciated stability there.
Despite these generally unsettling events, the global economy continued its slow expansion since the Great Recession. Unemployment also continued to decline in most developed markets. Wage growth showed signs of acceleration and in the U.S. interest rates began to rise, perhaps signaling the first steps toward monetary normalization.
Equity markets appreciated as economic fundamentals improved. Valuation is, of course, a critical factor in our
analysis and we always ask ourselves if current and potential investments represent an attractive balance of risk and reward. As some equity markets reached all-time highs, we maintained our focus on individual investments and the prospects for each business in the context of its valuation and the backdrop of potential political and economic risks.
In European equity markets, growth stocks outperformed value stocks during the period. The MSCI All Country (AC) Europe Growth Index returned +10.24% in local currency terms and +17.74% in U.S. dollar terms, while the MSCI AC Europe Value Index returned +6.04% in local currency terms and +13.36% in U.S. dollar terms.1
Amid dynamic markets and evolving economic conditions, we believe active, professional investment management serves investors well. We also recognize the important role of financial advisors in today’s markets and encourage investors to continue to seek their advice. Amid changing markets and economic conditions, we are confident investors with a well-diversified portfolio and a patient, long-term outlook will be well positioned for the years ahead.
On the following pages, the Fund’s portfolio management team discusses the economic environment during the first six months of 2017 and reviews investment decisions made during this period. Please remember all securities markets fluctuate, as do mutual fund share prices.
1. Source: Morningstar.
See www.franklintempletondatasources.com for additional data provider information.
| Not FDIC Insured | | | May Lose Value | | | No Bank Guarantee |
| franklintempleton.com | Not part of the semiannual report | 1 |
We thank you for investing with Franklin Templeton, welcome your questions and comments, and look forward to continuing to serve your investment needs in the years ahead.
Sincerely,

Peter A. Langerman
Chairman, President and Chief Executive Officer
Franklin Mutual Advisers, LLC
This letter reflects our analysis and opinions as of June 30, 2017, unless otherwise indicated. The information is not a complete analysis of every aspect of any market, country, industry, security or fund. Statements of fact are from sources considered reliable.
Semiannual Report
| Franklin Mutual European Fund | 3 | |||
| Performance Summary | 9 | |||
| Your Fund’s Expenses | 11 | |||
| Financial Highlights and Statement of Investments | 12 | |||
| Financial Statements | 22 | |||
| Notes to Financial Statements | 26 | |||
|
| 39
|
| |
Visit franklintempleton.com for fund updates, to access your account, or to find helpful financial planning tools.
| 2 | Not part of the semiannual report | franklintempleton.com |
Semiannual Report
This semiannual report for Franklin Mutual European Fund covers the period ended June 30, 2017.
Your Fund’s Goal and Main Investments
The Fund seeks capital appreciation, which may occasionally be short term, with income as a secondary goal, by investing at least 80% of its net assets in securities of European companies. It focuses mainly on what the investment manager believes are undervalued mid- and large cap equity securities and, to a lesser extent, the securities of distressed companies and merger arbitrage securities.
Performance Overview
The Fund’s Class Z shares generated a +7.19% cumulative total return for the six months ended June 30, 2017. For comparison, the Fund’s benchmark, the MSCI Europe Index, which tracks equity performance in Europe’s developed markets, produced a +7.91% total return in local currency terms.1 Also for comparison, the MSCI Europe Index posted a +15.93% total return in U.S. dollar terms.1 You can find more of the Fund’s performance data in the Performance Summary beginning on page 9.
Performance data represent past performance, which does not guarantee future results. Investment return and principal value will fluctuate, and you may have a gain or loss when you sell your shares. Current performance may differ from figures shown. For most recent month-end performance, go to franklintempleton.com or call (800) 342-5236.
Economic and Market Overview
The global economy generally expanded during the period under review. In this environment, global developed and emerging market stocks, as measured by the MSCI All Country World Index, generated a total return of +11.82%. Global markets were aided by improved industrial commodity prices at certain points during the period, generally upbeat economic data across regions, investor optimism about pro-growth and pro-business policies in the U.S., hopes of tax reforms under
Geographic Composition*
Based on Total Net Assets as of 6/30/17
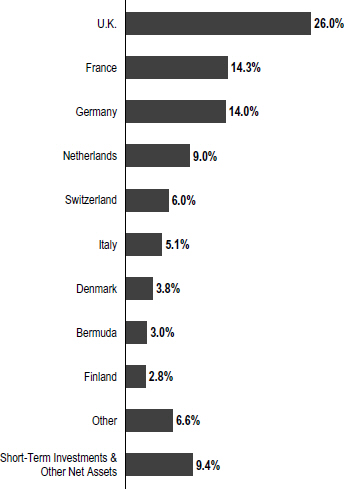
*Figures are stated as a percentage of total and may not equal 100% or may be negative due to rounding, use of any derivatives, unsettled trades or other factors.
the Trump administration, Emmanuel Macron’s election as France’s president and encouraging corporate earnings reports.
However, global markets reflected investor concerns about the timing and economic effects of the U.K.’s exit from the European Union (also known as “Brexit”). Other headwinds included the health of European banks, concerns about political uncertainty in the U.S. and European Union, geopolitical tensions in certain regions, worries about global oversupply in oil production despite a pact to extend cuts, and comments
1. Source: Morningstar.
The indexes are unmanaged and include reinvestment of any income or distributions. They do not reflect any fees, expenses or sales charges. One cannot invest directly in an index, and an index is not representative of the Fund’s portfolio.
The dollar value, number of shares or principal amount, and names of all portfolio holdings are listed in the Fund’s Statement of Investments (SOI). The SOI begins on page 17.
| franklintempleton.com | Semiannual Report | 3 |
FRANKLIN MUTUAL EUROPEAN FUND
toward period-end from key central bankers around the world about potentially raising interest rates.
In Europe, the U.K.’s economy grew at a slower rate in 2017’s first quarter over the previous quarter, largely due to slower growth in household spending. The eurozone’s growth increased in the first quarter over the previous quarter. The bloc’s annual inflation rate fluctuated during the reporting period and ended slightly higher from where it began. During the period, the European Central Bank (ECB), kept its key policy rates unchanged. However, in June, the ECB hinted at an end to rate cuts by omitting a reference to reducing interest rates to “lower levels,” due to an improving economy.
Investment Strategy
We follow a distinctive value investment approach that combines investments in what we believe are undervalued common stocks with distressed debt investing and risk arbitrage. Our style aims to provide our shareholders with superior risk-adjusted results over time. We employ rigorous, fundamental analysis to find compelling situations. In our opinion, successful investing is as much about assessing risk and containing losses as it is about achieving profits. In choosing investments, we look at the market price of an individual company’s securities relative to our evaluation of its intrinsic value based on factors including book value, cash flow generation, long-term earnings potential and earnings multiples. We may invest in bankrupt or distressed companies if we believe the market overreacted to adverse developments or failed to appreciate positive changes.
In addition, it is our practice to hedge the Fund’s currency exposure when we deem it advantageous for our shareholders.
What is meant by “hedge”?
To hedge an investment is to take a position intended to offset potential losses/gains that may be incurred by a companion financial instrument.
Manager’s Discussion
European equity markets started 2017 slowly, but political events combined with upbeat economic news sparked strong performance during the period, with the notable exception of the U.K. In our view, the presidential election victory of Emmanuel Macron in France was significant, as it stemmed the rise of the populist, anti-European Union (EU) National Front
| Top 10 Sectors/Industries | ||||
| Based on Equity Securities as of 6/30/17 | ||||
% of Total Net Assets | ||||
Insurance | 14.1% | |||
Diversified Telecommunication Services | 8.7% | |||
Banks | 7.3% | |||
Pharmaceuticals | 7.0% | |||
Oil, Gas & Consumable Fuels | 6.0% | |||
Automobiles | 4.1% | |||
Electric Utilities | 3.5% | |||
Industrial Conglomerates | 3.5% | |||
Hotels, Restaurants & Leisure | 3.2% | |||
Auto Components | 3.0% | |||
party and raised hopes for the future of the EU. The subsequent success of Macron’s party in France’s legislative elections added to the hope that the new government can implement much-needed economic reforms. In Italy, the poor showing of the populist Eurosceptic Five Star movement in the June local elections reinforced the broader positive political trend in Europe. On the other hand, in the U.K., the surprise loss by the Conservative Party of its parliamentary majority, and the increasingly public split within the Conservative Party between supporters and opponents of a “hard Brexit” added another layer of uncertainty to the upcoming negotiations with the EU.
Although Europe’s economy is still vulnerable to political or financial setbacks, we believe its recovery has broad economic support. Purchasing managers’ indexes and employment data continued to point to solid and widespread economic growth. In addition, for the first time in several years, consensus estimates of corporate earnings were revised upward. The improvement in economic and corporate conditions helped to reduce investor concerns about deflation and spur nascent signs of inflation.
On balance, we hold a positive view of European equities, but selectivity remains crucial. As value investors, we managed to benefit from steady economic growth despite underlying market turbulence. In all market environments, we seek to invest prudently in securities that we believe represent good value, and then we adjust our views as the world around us changes.
One sector in which we have found opportunities is telecommunication services.2 The Fund’s investments in the sector include Deutsche Telekom and Koninklijke KPN, among others. The European telecommunication services sector has
2. The telecommunication services sector comprises diversified telecommunication services and wireless telecommunication services in the SOI.
| 4 | Semiannual Report | franklintempleton.com |
FRANKLIN MUTUAL EUROPEAN FUND
been trading at multi-year lows relative to the market as the potential for mergers and acquisitions was extinguished by EU anti-trust regulators in Brussels, and regulatory headwinds reappeared with the initiative to eliminate roaming charges within the EU. We believe that structural and cultural changes in the sector warrant a more positive view. The drag from the elimination of roaming charges should dissipate after the third calendar quarter of 2017, marking the conclusion of a decade-long sector headwind resulting from a series of regulatory moves, including the unbundling of telecommunication services, mobile termination rate cuts, and spectrum policy favoring new entrants. We believe European telecommunication services companies will likely post positive revenue growth.
In the meantime, the evolution to fourth-generation (4G) wireless services and fiber connections has put pressure on tangential players in each market that were able to undercut pricing due to excess capacity and/or arbitrage the regulated rates on unbundled services to offer no frills products at a fraction of the cost of the incumbent operators. The evolution to 4G services highlights the value of network quality for which the operators who have invested in upgrading their infrastructure are able to charge premium pricing. Similarly, the evolution to fiber connections from traditional DSL connections in homes has had a similar effect. Traditional service arbitragers have had to pay higher wholesale prices, undermining their price-driven propositions. From a cultural standpoint, we believe the sector has never been so cost conscious about capital and operating expenses. In our view, senior management incentive schemes increasingly focus on return on investment rather than market share, leading us to expect an improvement in operating leverage.
We also expect the degree of capital spending to moderate as 4G investments are completed. Fiber deployments could continue to put pressure on overall capital spending, but regulators are taking a somewhat hands-off approach to the pricing of wholesale services, which we believe should allow for better returns on investment in fiber deployment. Although there will likely still be some pressure on the sector from the elimination of roaming charges in the third quarter of 2017, thereafter a period of sustainable, albeit modest, revenue growth, margin improvement and free cash flow generation is likely, in our analysis.
Elsewhere, following an extended period of high prices, crude oil and natural gas prices have been significantly lower during
3. The energy sector comprises oil, gas and consumable fuels in the SOI.
| Top 10 Equity Holdings | ||||
| 6/30/17 | ||||
Company Sector/Industry, Country | % of Total Net Assets | |||
| Enel SpA Electric Utilities, Italy | 3.5% | |||
| Koninklijke Philips NV Industrial Conglomerates, Netherlands | 3.5% | |||
| Accor SA Hotels, Restaurants & Leisure, France | 3.3% | |||
| Novartis AG Pharmaceuticals, Switzerland | 3.2% | |||
| RSA Insurance Group PLC Insurance, U.K. | 3.1% | |||
| XL Group Ltd. Insurance, Bermuda | 3.0% | |||
| Royal Dutch Shell PLC Oil, Gas & Consumable Fuels, U.K. | 2.9% | |||
| NN Group NV Insurance, Netherlands | 2.9% | |||
| Deutsche Telekom AG Diversified Telecommunication Services, Germany | 2.8% | |||
| Vodafone Group PLC Wireless Telecommunication Services, U.K. | 2.8% | |||
the past few years. The benchmark oil price declined from more than $100 per barrel to below $30, and has more recently stayed between $40 and $60 during the first half of 2017. The impact on the energy sector, including the financial securities of companies in the sector, has been quite dramatic.3 Although many uncertainties exist, we continue to expect demand for oil and gas to rise for a number of years, which we believe will require continued investment by the sector, not only to meet that growth but also to replace declining production in mature fields around the world. Accordingly, we expect some combination of higher prices or lower costs over time to provide the sufficient returns needed to justify the required investment.
Royal Dutch Shell, a leading integrated oil and gas company, is an investment held by the Fund for which financial market fears about the impact of low commodity prices were overblown, in our view. The company used the initial phase of the crude oil price downturn to acquire BG Group, a major exploration and production company with significant strength in liquefied natural gas and a great oil asset in the pre-salt Santos Basin in Brazil. The assets were highly complementary to Shell’s existing positions, allowing the post-merger company to prune other areas of its portfolio and still show considerable
| franklintempleton.com | Semiannual Report | 5 |
FRANKLIN MUTUAL EUROPEAN FUND
growth. Management, under the leadership of relatively new chief executive officer Ben van Beurden, has been focused on reducing costs so that the company can still grow, while funding all required capital expenditures and its dividend, at an oil price below $50 per barrel. As Shell shows continued progress in its efforts and demonstrates the resilience of its portfolio and balance sheet, we hold a positive view of the company’s prospects.
Merger and acquisition activity has remained healthy, involving European and U.S. companies. Many large deals initiated in 2016 await regulatory approval, including Bayer’s4 acquisition of Monsanto,4 and 21st Century Fox’s4 offer for Sky. Several key U.S. regulatory agencies remain short of members, including the Federal Communication Commission and the Federal Trade Commission, and these openings may be affecting regulatory approvals.
As we have previously discussed, the Fund continued to have a significantly underweighted position in consumer staples,5 an area of increased intervention by U.S. activist shareholders of large, well-established European corporations, such as the attempted acquisition of Unilever4 by Kraft Heinz4 and an investment in Nestle4 by U.S. hedge fund Third Point.4 Such actions may or may not have ultimately succeeded, but they have led, in some instances, to a welcome re-appraisal of corporate strategy. We continue to find the valuations of most companies in this sector to be expensive, in our view.
Within Europe, distressed debt remained a difficult market in which to find compelling investment opportunities and the Fund has found limited investment opportunities in which to invest.
Turning to Fund performance, top positive contributors included Denmark-based FLSmidth, Finland-based Nokia and France-based Accor.
FLSmidth provides equipment and services to the mining and cement industries. Investors reacted positively to quarterly results that exceeded consensus estimates. In February, FLSmidth reported quarterly sales, earnings, cash flow and new orders that exceeded expectations, while management provided a generally upbeat outlook for 2017. Again in May, results were broadly better than investor expectations. Finally, the company’s share price also appreciated as analysts believed
that the cement market has begun to recover and the mining market has bottomed.
Nokia is a global communications and information technology company. In April, Nokia reported an upbeat set of quarterly results that included strong margins in its networks business and solid sales in its wireless business. The positive results appear to reflect some improvement in market conditions for wireless network equipment. Nokia also earned more revenue from its patents, while management reaffirmed its earnings guidance for 2017. We believe the trend of declining revenues is on the path to stabilizing and that further synergies from Nokia’s acquisition of Alcatel-Lucent, completed in mid-2016, are likely to support earnings improvement. Shares of Nokia also reacted positively to the announcement in May that the company reached a settlement on unresolved patent litigation and signed a business collaboration agreement with Apple. In our view, Nokia likely saved a meaningful amount in litigation costs and gained a potential source of growth for its Internet protocol routing business.
Hotel operator Accor benefited from improving economic conditions in Europe. In April, the company reported stronger demand in France, the rest of Europe and the Asia Pacific region, as well as the strongest increase in two years for revenue per available room, a key performance metric for the industry. Accor’s management also confirmed in April that it is on schedule with its plan to restructure by spinning out its hotel property company from its hotel operating operations. In our view, the hotel operating business is undervalued compared to its peers.
During the period under review, Fund investments that detracted from performance included Germany-based global multi-metal distributor Kloeckner and U.K.-based oil and gas companies Cairn Energy and BP.
In March, investors appeared to focus on Kloeckner’s updated 2017 earnings guidance figures, which did not match the more upbeat views expressed by its management during a prior earnings conference call. The guidance figures struck us as conservative given the positive tailwind from steel price increases in 2016 and the more favorable global economic backdrop. A growing realization that the Trump administration is unlikely to announce an infrastructure stimulus plan as soon as previously expected may have exerted additional downward
4. Not a Fund holding.
5. The consumer staples sector comprises food and staples retailing and tobacco in the SOI.
See www.franklintempletondatasources.com for additional data provider information.
| 6 | Semiannual Report | franklintempleton.com |
FRANKLIN MUTUAL EUROPEAN FUND
pressure on shares of Kloeckner and other companies that would likely benefit from such a program.
Shares of Cairn Energy, an independent oil and gas exploration and development company, fell along with declining crude oil prices. The share price staged a brief rally in mid-May after Cairn announced the results of a successful offshore appraisal well at its oil discovery in Senegal. However, investors reacted negatively in June to the latest development in an arbitration matter regarding a tax dispute in India. Dividends from operations in India previously indicated as payable to Cairn Energy were instead ordered to be paid to the government. The quarter ended on a positive note as first production was achieved at its Kraken oil field in the U.K. North Sea.
Shares of BP, global integrated oil and gas company, generally followed the path of oil prices. During the first half of 2017, oil prices retreated as U.S. crude oil production increased and data showed that worldwide supply had not yet begun to decline. BP’s shares came under further pressure in February when it reported soft quarterly results and increased its capital expenditure guidance for 2017, which meant the level of cash flow needed to break even increased by a modest amount. We view this as a temporary issue.
During the period, the Fund held currency forwards and futures seeking to hedge most of the currency risk of the portfolio’s non-U.S. dollar investments. The currency forwards had a negative impact on the Fund’s performance because of the depreciation of the U.S. dollar versus the hedged currencies, while currency futures had a negligible impact.
What is a currency forward?
A currency forward is an agreement between the Fund and a counterparty to buy or sell a foreign currency in exchange for another currency at a specific exchange rate on a future date.
What is a future?
A future is an agreement between the Fund and a counterparty made through a U.S. or foreign futures exchange to buy or sell an underlying instrument or asset at a specific price on a future date.
Thank you for your participation in Franklin Mutual European Fund. We look forward to continuing to serve your investment needs.

The foregoing information reflects our analysis, opinions and portfolio holdings as of June 30, 2017, the end of the reporting period. The way we implement our main investment strategies and the resulting portfolio holdings may change depending on factors such as market and economic conditions. These opinions may not be relied upon as investment advice or an offer for a particular security. The information is not a complete analysis of every aspect of any market, country, industry, security or the Fund. Statements of fact are from sources considered reliable, but the investment manager makes no representation or warranty as to their completeness or accuracy. Although historical performance is no guarantee of future results, these insights may help you understand our investment management philosophy.
Philippe Brugere-Trelat has been co-portfolio manager for Franklin Mutual European Fund since 2010 and portfolio manager since 2005. He also has been portfolio manager for Franklin Mutual Global Discovery Fund since 2009. He has been a member of the management team of the Franklin Mutual Series Funds since 2004, when he rejoined Franklin Templeton Investments. Previously, he was president and portfolio manager of Eurovest. Between 1984 and 1994, Mr. Brugere-Trelat was employed at Heine Securities Corporation, the Fund’s former manager.
CFA® is a trademark owned by CFA Institute.
| franklintempleton.com | Semiannual Report | 7 |
FRANKLIN MUTUAL EUROPEAN FUND
Katrina Dudley has been co-portfolio manager for Franklin Mutual European Fund since 2010 and was assistant portfolio manager since 2007. She follows industrial companies (foreign and domestic) including transportation, manufacturers, machinery, electrical equipment and general industrial. Prior to joining Franklin Templeton Investments in 2002, Ms. Dudley was an investment analyst at Federated Investors, Inc., responsible for the technology and health care sectors. From 1995 to 2001, Ms. Dudley was a senior manager in the corporate finance division of Ernst & Young LLP, where she specialized in valuation and litigation consulting.
| 8 | Semiannual Report | franklintempleton.com |
FRANKLIN MUTUAL EUROPEAN FUND
Performance Summary as of June 30, 2017
The performance table does not reflect any taxes that a shareholder would pay on Fund dividends, capital gain distributions, if any, or any realized gains on the sale of Fund shares. Total return reflects reinvestment of the Fund’s dividends and capital gain distributions, if any, and any unrealized gains or losses. Your dividend income will vary depending on dividends or interest paid by securities in the Fund’s portfolio, adjusted for operating expenses of each class. Capital gain distributions are net profits realized from the sale of portfolio securities.
Performance as of 6/30/17
Cumulative total return excludes sales charges. Average annual total return includes maximum sales charges. Sales charges will vary depending on the size of the investment and the class of share purchased. The maximum is 5.75% and the minimum is 0%. Class A: 5.75% maximum initial sales charge. For other share classes, visit franklintempleton.com.
| Share Class | Cumulative Total Return1 | Average Annual Total Return2 | ||||||
| Z | ||||||||
6-Month | +7.19% | +7.19% | ||||||
1-Year | +19.52% | +19.52% | ||||||
5-Year | +52.55% | +8.81% | ||||||
10-Year | +31.94% | +2.81% | ||||||
| A | ||||||||
6-Month | +7.02% | +0.86% | ||||||
1-Year | +19.16% | +12.31% | ||||||
5-Year | +50.41% | +7.22% | ||||||
10-Year | +28.13% | +1.90% | ||||||
Performance data represent past performance, which does not guarantee future results. Investment return and principal value will fluctuate, and you may have a gain or loss when you sell your shares. Current performance may differ from figures shown. For most recent month-end performance, go to franklintempleton.com or call (800) 342-5236.
See page 10 for Performance Summary footnotes.
| franklintempleton.com | Semiannual Report | 9 |
FRANKLIN MUTUAL EUROPEAN FUND
PERFORMANCE SUMMARY
Total Annual Operating Expenses3
Share Class | ||
Z |
1.06% | |
A | 1.31% | |
Each class of shares is available to certain eligible investors and has different annual fees and expenses, as described in the prospectus.
All investments involve risks, including possible loss of principal. Value securities may not increase in price as anticipated or may decline further in value. Special risks are associated with foreign investing, including currency fluctuations, economic instability and political developments. Because the Fund invests its assets primarily in companies in a specific region, it is subject to greater risks of adverse developments in that region and/or the surrounding regions than a fund that is more broadly diversified geographically. Political, social or economic disruptions in the region, even in countries in which the Fund is not invested, may adversely affect the value of securities held by the Fund. The Fund’s investments in smaller company stocks carry an increased risk of price fluctuation, especially over the short term. The Fund’s investments in companies engaged in mergers, reorganizations or liquidations also involve special risks as pending deals may not be completed on time or on favorable terms. The Fund is actively managed but there is no guarantee that the manager’s investment decisions will produce the desired results. The Fund’s prospectus also includes a description of the main investment risks.
1. Cumulative total return represents the change in value of an investment over the periods indicated.
2. Average annual total return represents the average annual change in value of an investment over the periods indicated. Return for less than one year, if any, has not been annualized.
3. Figures are as stated in the Fund’s current prospectus and may differ from the expense ratios disclosed in the Your Fund’s Expenses and Financial Highlights sections in this report. In periods of market volatility, assets may decline significantly, causing total annual Fund operating expenses to become higher than the figures shown.
| 10 | Semiannual Report | franklintempleton.com |
FRANKLIN MUTUAL EUROPEAN FUND
As a Fund shareholder, you can incur two types of costs: (1) transaction costs, including sales charges (loads) on Fund purchases and redemptions; and (2) ongoing Fund costs, including management fees, distribution and service (12b-1) fees, and other Fund expenses. All mutual funds have ongoing costs, sometimes referred to as operating expenses. The table below shows ongoing costs of investing in the Fund and can help you understand these costs and compare them with those of other mutual funds. The table assumes a $1,000 investment held for the six months indicated.
Actual Fund Expenses
The table below provides information about actual account values and actual expenses in the columns under the heading “Actual.” In these columns the Fund’s actual return, which includes the effect of Fund expenses, is used to calculate the “Ending Account Value” for each class of shares. You can estimate the expenses you paid during the period by following these steps (of course, your account value and expenses will differ from those in this illustration): Divide your account value by $1,000 (if your account had an $8,600 value, then $8,600 ÷ $1,000 = 8.6). Then multiply the result by the number in the row for your class of shares under the headings “Actual” and “Expenses Paid During Period” (if Actual Expenses Paid During Period were $7.50, then 8.6 x $7.50 = $64.50). In this illustration, the actual expenses paid this period are $64.50.
Hypothetical Example for Comparison with Other Funds
Under the heading “Hypothetical” in the table, information is provided about hypothetical account values and hypothetical expenses based on the Fund’s actual expense ratio and an assumed rate of return of 5% per year before expenses, which is not the Fund’s actual return. This information may not be used to estimate the actual ending account balance or expenses you paid for the period, but it can help you compare ongoing costs of investing in the Fund with those of other funds. To do so, compare this 5% hypothetical example for the class of shares you hold with the 5% hypothetical examples that appear in the shareholder reports of other funds.
Please note that expenses shown in the table are meant to highlight ongoing costs and do not reflect any transactional costs. Therefore, information under the heading “Hypothetical” is useful in comparing ongoing costs only, and will not help you compare total costs of owning different funds. In addition, if transactional costs were included, your total costs would have been higher.
Actual (actual return after expenses) | Hypothetical (5% annual return before expenses) | |||||||||||||||||
| Share Class | Beginning Account Value 1/1/17 | Ending Account Value 6/30/17 | Expenses 1/1/17–6/30/171,2 | Ending Account Value 6/30/17 | Expenses Period 1/1/17–6/30/171,2 | Net Annualized Expense Ratio2 | ||||||||||||
Z | $1,000 | $1,071.90 | $ 5.45 | $1,019.54 | $ 5.31 | 1.06% | ||||||||||||
A | $1,000 | $1,070.20 | $ 6.72 | $1,018.30 | $ 6.56 | 1.31% | ||||||||||||
C | $1,000 | $1,066.80 | $10.56 | $1,014.58 | $10.29 | 2.06% | ||||||||||||
R | $1,000 | $1,069.20 | $ 8.00 | $1,017.06 | $ 7.80 | 1.56% | ||||||||||||
R6 | $1,000 | $1,072.40 | $ 4.57 | $1,020.38 | $ 4.46 | 0.89% | ||||||||||||
1. Expenses are equal to the annualized expense ratio for the six-month period as indicated above—in the far right column—multiplied by the simple average account value over the period indicated, and then multiplied by 181/365 to reflect the one-half year period.
2. Reflects expenses after fee waivers and expense reimbursements. Does not include acquired fund fees and expenses.
| franklintempleton.com | Semiannual Report | 11 |
FRANKLIN MUTUAL EUROPEAN FUND
| Six Months Ended June 30, 2017 (unaudited) | Year Ended December 31, | |||||||||||||||||||||||
| 2016 | 2015 | 2014 | 2013 | 2012 | ||||||||||||||||||||
| Class Z | ||||||||||||||||||||||||
| Per share operating performance (for a share outstanding throughout the period) | ||||||||||||||||||||||||
Net asset value, beginning of period | $19.20 | $19.48 | $20.86 | $24.76 | $21.13 | $18.95 | ||||||||||||||||||
|
| |||||||||||||||||||||||
| Income from investment operationsa: | ||||||||||||||||||||||||
Net investment incomeb | 0.30 | 0.63 | c | 0.42 | 0.73 | d | 0.49 | 0.44 | ||||||||||||||||
Net realized and unrealized gains (losses) | 1.08 | (0.17 | ) | (0.27 | ) | (1.73 | ) | 5.12 | 2.89 | |||||||||||||||
|
| |||||||||||||||||||||||
Total from investment operations | 1.38 | 0.46 | 0.15 | (1.00 | ) | 5.61 | 3.33 | |||||||||||||||||
|
| |||||||||||||||||||||||
Less distributions from: | ||||||||||||||||||||||||
Net investment income | — | (0.47 | ) | (0.46 | ) | (0.67 | ) | (0.46 | ) | (0.68 | ) | |||||||||||||
Net realized gains | — | (0.27 | ) | (1.07 | ) | (2.23 | ) | (1.52 | ) | (0.47 | ) | |||||||||||||
|
| |||||||||||||||||||||||
Total distributions | — | (0.74 | ) | (1.53 | ) | (2.90 | ) | (1.98 | ) | (1.15 | ) | |||||||||||||
|
| |||||||||||||||||||||||
Net asset value, end of period | $20.58 | $19.20 | $19.48 | $20.86 | $24.76 | $21.13 | ||||||||||||||||||
|
| |||||||||||||||||||||||
Total returne | 7.19% | 2.40% | 0.82% | (4.00)% | 26.68% | 17.73% | ||||||||||||||||||
| Ratios to average net assetsf | ||||||||||||||||||||||||
Expensesg | 1.06% | h | 1.06% | h,i | 1.05% | 1.04% | h | 1.07% | h | 1.13% | ||||||||||||||
Expenses incurred in connection with securities sold short | —% | —% | —% | j | 0.01% | —% | j | —% | ||||||||||||||||
Net investment income | 3.04% | 3.42% | c | 1.93% | 2.93% | d | 2.04% | 2.16% | ||||||||||||||||
| Supplemental data | ||||||||||||||||||||||||
Net assets, end of period (000’s) | $1,293,632 | $1,175,972 | $1,355,780 | $1,128,769 | $1,399,294 | $1,101,659 | ||||||||||||||||||
Portfolio turnover rate | 10.50% | 16.43% | 32.59% | 54.05% | 39.05% | 41.69% | ||||||||||||||||||
aThe amount shown for a share outstanding throughout the period may not correlate with the Statement of Operations for the period due to the timing of sales and repurchases of the Fund’s shares in relation to income earned and/or fluctuating fair value of the investments of the Fund.
bBased on average daily shares outstanding.
cNet investment income per share includes approximately $0.17 per share related to a nonrecurring distribution. The amount, although initially recorded as dividend income, is subject to recharacterization once the issuer provides information regarding the actual composition of the distribution. Excluding this amount, the ratio of net investment income to average net assets would have been 2.50%.
dNet investment income per share includes approximately $0.29 per share related to income received in the form of a special dividend in connection with certain Fund holdings. Excluding this amount, the ratio of net investment income to average net assets would have been 1.74%.
eTotal return is not annualized for periods less than one year.
fRatios are annualized for periods less than one year.
gIncludes dividend and/or interest expense on securities sold short and security borrowing fees, if any. See below for the ratios of such expenses to average net assets for the periods presented. See Note 1(d).
hBenefit of expense reduction rounds to less than 0.01%.
iBenefit of waiver and payments by affiliates rounds to less than 0.01%.
jRounds to less than 0.01%.
| 12 | Semiannual Report | The accompanying notes are an integral part of these financial statements. | franklintempleton.com |
FRANKLIN MUTUAL EUROPEAN FUND
FINANCIAL HIGHLIGHTS
| Six Months Ended June 30, 2017 (unaudited) | Year Ended December 31, | |||||||||||||||||||||||
| 2016 | 2015 | 2014 | 2013 | 2012 | ||||||||||||||||||||
| Class A | ||||||||||||||||||||||||
| Per share operating performance (for a share outstanding throughout the period) | ||||||||||||||||||||||||
Net asset value, beginning of period | $18.66 | $18.95 | $20.33 | $24.21 | $20.71 | $18.59 | ||||||||||||||||||
|
| |||||||||||||||||||||||
| Income from investment operationsa: | ||||||||||||||||||||||||
Net investment incomeb | 0.26 | 0.57 | c | 0.35 | 0.61 | d | 0.42 | 0.37 | ||||||||||||||||
Net realized and unrealized gains (losses) | 1.05 | (0.18 | ) | (0.26 | ) | (1.66 | ) | 4.99 | 2.84 | |||||||||||||||
|
| |||||||||||||||||||||||
Total from investment operations | 1.31 | 0.39 | 0.09 | (1.05 | ) | 5.41 | 3.21 | |||||||||||||||||
|
| |||||||||||||||||||||||
Less distributions from: | ||||||||||||||||||||||||
Net investment income | — | (0.41 | ) | (0.40 | ) | (0.60 | ) | (0.39 | ) | (0.62 | ) | |||||||||||||
Net realized gains | — | (0.27 | ) | (1.07 | ) | (2.23 | ) | (1.52 | ) | (0.47 | ) | |||||||||||||
|
| |||||||||||||||||||||||
Total distributions | — | (0.68 | ) | (1.47 | ) | (2.83 | ) | (1.91 | ) | (1.09 | ) | |||||||||||||
|
| |||||||||||||||||||||||
Net asset value, end of period | $19.97 | $18.66 | $18.95 | $20.33 | $24.21 | $20.71 | ||||||||||||||||||
|
| |||||||||||||||||||||||
Total returne | 7.02% | 2.12% | 0.57% | (4.31)% | 26.30% | 17.37% | ||||||||||||||||||
| Ratios to average net assetsf | ||||||||||||||||||||||||
Expensesg | 1.31% | h | 1.31% | h,i | 1.33% | 1.34% | h | 1.37% | h | 1.43% | ||||||||||||||
Expenses incurred in connection with securities sold short | —% | —% | —% | j | 0.01% | —% | j | —% | ||||||||||||||||
Net investment income | 2.79% | 3.17% | c | 1.65% | 2.63% | d | 1.74% | 1.86% | ||||||||||||||||
| Supplemental data | ||||||||||||||||||||||||
Net assets, end of period (000’s) | $759,810 | $769,297 | $1,033,307 | $843,836 | $839,655 | $653,435 | ||||||||||||||||||
Portfolio turnover rate | 10.50% | 16.43% | 32.59% | 54.05% | 39.05% | 41.69% | ||||||||||||||||||
aThe amount shown for a share outstanding throughout the period may not correlate with the Statement of Operations for the period due to the timing of sales and repurchases of the Fund’s shares in relation to income earned and/or fluctuating fair value of the investments of the Fund.
bBased on average daily shares outstanding.
cNet investment income per share includes approximately $0.17 per share related to a nonrecurring distribution. The amount, although initially recorded as dividend income, is subject to recharacterization once the issuer provides information regarding the actual composition of the distribution. Excluding this amount, the ratio of net investment income to average net assets would have been 2.25%.
dNet investment income per share includes approximately $0.29 per share related to income received in the form of a special dividend in connection with certain Fund holdings. Excluding this amount, the ratio of net investment income to average net assets would have been 1.44%.
eTotal return does not reflect sales commissions or contingent deferred sales charges, if applicable, and is not annualized for periods less than one year.
fRatios are annualized for periods less than one year.
gIncludes dividend and/or interest expense on securities sold short and security borrowing fees, if any. See below for the ratios of such expenses to average net assets for the periods presented. See Note 1(d).
hBenefit of expense reduction rounds to less than 0.01%.
iBenefit of waiver and payments by affiliates rounds to less than 0.01%.
jRounds to less than 0.01%.
| franklintempleton.com | The accompanying notes are an integral part of these financial statements. | Semiannual Report | 13 |
FRANKLIN MUTUAL EUROPEAN FUND
FINANCIAL HIGHLIGHTS
| Six Months Ended June 30, 2017 (unaudited) | Year Ended December 31, | |||||||||||||||||||||||
| 2016 | 2015 | 2014 | 2013 | 2012 | ||||||||||||||||||||
| Class C | ||||||||||||||||||||||||
| Per share operating performance (for a share outstanding throughout the period) | ||||||||||||||||||||||||
Net asset value, beginning of period | $18.70 | $18.97 | $20.37 | $24.25 | $20.79 | $18.66 | ||||||||||||||||||
|
| |||||||||||||||||||||||
| Income from investment operationsa: | ||||||||||||||||||||||||
Net investment incomeb | 0.19 | 0.44 | c | 0.19 | 0.43 | d | 0.24 | 0.24 | ||||||||||||||||
Net realized and unrealized gains (losses) | 1.06 | (0.19 | ) | (0.25 | ) | (1.64 | ) | 5.02 | 2.83 | |||||||||||||||
|
| �� | ||||||||||||||||||||||
Total from investment operations | 1.25 | 0.25 | (0.06 | ) | (1.21 | ) | 5.26 | 3.07 | ||||||||||||||||
|
| |||||||||||||||||||||||
Less distributions from: | ||||||||||||||||||||||||
Net investment income | — | (0.25 | ) | (0.27 | ) | (0.44 | ) | (0.28 | ) | (0.47 | ) | |||||||||||||
Net realized gains | — | (0.27 | ) | (1.07 | ) | (2.23 | ) | (1.52 | ) | (0.47 | ) | |||||||||||||
|
| |||||||||||||||||||||||
Total distributions | — | (0.52 | ) | (1.34 | ) | (2.67 | ) | (1.80 | ) | (0.94 | ) | |||||||||||||
|
| |||||||||||||||||||||||
Net asset value, end of period | $19.95 | $18.70 | $18.97 | $20.37 | $24.25 | $20.79 | ||||||||||||||||||
|
| |||||||||||||||||||||||
Total returne | 6.68% | 1.32% | (0.16)% | (4.97)% | 25.44% | 16.54% | ||||||||||||||||||
| Ratios to average net assetsf | ||||||||||||||||||||||||
Expensesg | 2.06% | h | 2.06% | h,i | 2.05% | 2.04% | h | 2.07% | h | 2.13% | ||||||||||||||
Expenses incurred in connection with securities sold short | —% | —% | —% | j | 0.01% | —% | j | —% | ||||||||||||||||
Net investment income | 2.04% | 2.42% | c | 0.93% | 1.93% | d | 1.04% | 1.16% | ||||||||||||||||
| Supplemental data | ||||||||||||||||||||||||
Net assets, end of period (000’s) | $194,935 | $209,196 | $291,752 | $216,258 | $198,491 | $122,438 | ||||||||||||||||||
Portfolio turnover rate | 10.50% | 16.43% | 32.59% | 54.05% | 39.05% | 41.69% | ||||||||||||||||||
aThe amount shown for a share outstanding throughout the period may not correlate with the Statement of Operations for the period due to the timing of sales and repurchases of the Fund’s shares in relation to income earned and/or fluctuating fair value of the investments of the Fund.
bBased on average daily shares outstanding.
cNet investment income per share includes approximately $0.17 per share related to a nonrecurring distribution. The amount, although initially recorded as dividend income, is subject to recharacterization once the issuer provides information regarding the actual composition of the distribution. Excluding this amount, the ratio of net investment income to average net assets would have been 1.50%.
dNet investment income per share includes approximately $0.29 per share related to income received in the form of a special dividend in connection with certain Fund holdings. Excluding this amount, the ratio of net investment income to average net assets would have been 0.74%.
eTotal return does not reflect sales commissions or contingent deferred sales charges, if applicable, and is not annualized for periods less than one year.
fRatios are annualized for periods less than one year.
gIncludes dividend and/or interest expense on securities sold short and security borrowing fees, if any. See below for the ratios of such expenses to average net assets for the periods presented. See Note 1(d).
hBenefit of expense reduction rounds to less than 0.01%.
iBenefit of waiver and payments by affiliates rounds to less than 0.01%.
jRounds to less than 0.01%.
| 14 | Semiannual Report | The accompanying notes are an integral part of these financial statements. | franklintempleton.com |
FRANKLIN MUTUAL EUROPEAN FUND
FINANCIAL HIGHLIGHTS
| Six Months Ended June 30, 2017 (unaudited) | Year Ended December 31, | |||||||||||||||||||||||
| 2016 | 2015 | 2014 | 2013 | 2012 | ||||||||||||||||||||
| Class R | ||||||||||||||||||||||||
| Per share operating performance (for a share outstanding throughout the period) | ||||||||||||||||||||||||
Net asset value, beginning of period | $18.35 | $18.62 | $20.04 | $23.95 | $20.55 | $18.47 | ||||||||||||||||||
|
| |||||||||||||||||||||||
| Income from investment operationsa: | ||||||||||||||||||||||||
Net investment incomeb | 0.24 | 0.52 | c | 0.27 | 0.41 | d | 0.31 | 0.33 | ||||||||||||||||
Net realized and unrealized gains (losses) | 1.03 | (0.18 | ) | (0.23 | ) | (1.49 | ) | 5.02 | 2.81 | |||||||||||||||
|
| |||||||||||||||||||||||
Total from investment operations | 1.27 | 0.34 | 0.04 | (1.08 | ) | 5.33 | 3.14 | |||||||||||||||||
|
| |||||||||||||||||||||||
Less distributions from: | ||||||||||||||||||||||||
Net investment income | — | (0.34 | ) | (0.39 | ) | (0.60 | ) | (0.41 | ) | (0.59 | ) | |||||||||||||
Net realized gains | — | (0.27 | ) | (1.07 | ) | (2.23 | ) | (1.52 | ) | (0.47 | ) | |||||||||||||
|
| |||||||||||||||||||||||
Total distributions | — | (0.61 | ) | (1.46 | ) | (2.83 | ) | (1.93 | ) | (1.06 | ) | |||||||||||||
|
| |||||||||||||||||||||||
Net asset value, end of period | $19.62 | $18.35 | $18.62 | $20.04 | $23.95 | $20.55 | ||||||||||||||||||
|
| |||||||||||||||||||||||
Total returne | 6.92% | 1.86% | 0.37% | (4.52)% | 26.05% | 17.16% | ||||||||||||||||||
| Ratios to average net assetsf | ||||||||||||||||||||||||
Expensesg | 1.56% | h | 1.56% | h,i | 1.55% | 1.54% | h | 1.57% | h | 1.63% | ||||||||||||||
Expenses incurred in connection with securities sold short | —% | —% | —% | j | 0.01% | —% | j | —% | ||||||||||||||||
Net investment income | 2.54% | 2.92% | c | 1.43% | 2.43% | d | 1.54% | 1.66% | ||||||||||||||||
| Supplemental data | ||||||||||||||||||||||||
Net assets, end of period (000’s) | $622 | $626 | $997 | $421 | $133 | $46 | ||||||||||||||||||
Portfolio turnover rate | 10.50% | 16.43% | 32.59% | 54.05% | 39.05% | 41.69% | ||||||||||||||||||
aThe amount shown for a share outstanding throughout the period may not correlate with the Statement of Operations for the period due to the timing of sales and repurchases of the Fund’s shares in relation to income earned and/or fluctuating fair value of the investments of the Fund.
bBased on average daily shares outstanding.
cNet investment income per share includes approximately $0.17 per share related to a nonrecurring distribution. The amount, although initially recorded as dividend income, is subject to recharacterization once the issuer provides information regarding the actual composition of the distribution. Excluding this amount, the ratio of net investment income to average net assets would have been 2.00%.
dNet investment income per share includes approximately $0.29 per share related to income received in the form of a special dividend in connection with certain Fund holdings. Excluding this amount, the ratio of net investment income to average net assets would have been 1.24%.
eTotal return is not annualized for periods less than one year.
fRatios are annualized for periods less than one year.
gIncludes dividend and/or interest expense on securities sold short and security borrowing fees, if any. See below for the ratios of such expenses to average net assets for the periods presented. See Note 1(d).
hBenefit of expense reduction rounds to less than 0.01%.
iBenefit of waiver and payments by affiliates rounds to less than 0.01%.
jRounds to less than 0.01%.
| franklintempleton.com | The accompanying notes are an integral part of these financial statements. | Semiannual Report | 15 |
FRANKLIN MUTUAL EUROPEAN FUND
FINANCIAL HIGHLIGHTS
Six Months Ended (unaudited) | Year Ended December 31, | |||||||||||||||||||
| 2016 | 2015 | 2014 | 2013a | |||||||||||||||||
| Class R6 | ||||||||||||||||||||
Per share operating performance (for a share outstanding throughout the period) | ||||||||||||||||||||
Net asset value, beginning of period | $19.19 | $19.47 | $20.85 | $24.75 | $22.54 | |||||||||||||||
|
| |||||||||||||||||||
| Income from investment operationsb: | ||||||||||||||||||||
Net investment incomec | 0.33 | 0.66 | d | 0.46 | 0.75 | e | 0.28 | |||||||||||||
Net realized and unrealized gains (losses) | 1.06 | (0.17 | ) | (0.28 | ) | (1.71 | ) | 3.95 | ||||||||||||
|
| |||||||||||||||||||
Total from investment operations | 1.39 | 0.49 | 0.18 | (0.96 | ) | 4.23 | ||||||||||||||
|
| |||||||||||||||||||
Less distributions from: | ||||||||||||||||||||
Net investment income | — | (0.50 | ) | (0.49 | ) | (0.71 | ) | (0.50 | ) | |||||||||||
Net realized gains | — | (0.27 | ) | (1.07 | ) | (2.23 | ) | (1.52 | ) | |||||||||||
|
| |||||||||||||||||||
Total distributions | — | (0.77 | ) | (1.56 | ) | (2.94 | ) | (2.02 | ) | |||||||||||
|
| |||||||||||||||||||
Net asset value, end of period | $20.58 | $19.19 | $19.47 | $20.85 | $24.75 | |||||||||||||||
|
| |||||||||||||||||||
Total returnf | 7.24% | 2.53% | 0.98% | (3.88)% | 18.99% | |||||||||||||||
| Ratios to average net assetsg | ||||||||||||||||||||
Expensesh | 0.89% | i | 0.89% | i,j | 0.89% | 0.89% | i | 0.90% | i | |||||||||||
Expenses incurred in connection with securities sold short | —% | —% | —% | k | 0.01% | —% | k | |||||||||||||
Net investment income | 3.21% | 3.59% | d | 2.09% | 3.08%e | 2.21% | ||||||||||||||
| Supplemental data | ||||||||||||||||||||
Net assets, end of period (000’s) | $352,701 | $311,784 | $373,904 | $334,396 | $317,690 | |||||||||||||||
Portfolio turnover rate | 10.50% | 16.43% | 32.59% | 54.05% | 39.05% | |||||||||||||||
aFor the period May 1, 2013 (effective date) to December 31, 2013.
bThe amount shown for a share outstanding throughout the period may not correlate with the Statement of Operations for the period due to the timing of sales and repurchases of the Fund’s shares in relation to income earned and/or fluctuating fair value of the investments of the Fund.
cBased on average daily shares outstanding.
dNet investment income per share includes approximately $0.17 per share related to a nonrecurring distribution. The amount, although initially recorded as dividend income, is subject to recharacterization once the issuer provides information regarding the actual composition of the distribution. Excluding this amount, the ratio of net investment income to average net assets would have been 2.67%.
eNet investment income per share includes approximately $0.29 per share related to income received in the form of a special dividend in connection with certain Fund holdings. Excluding this amount, the ratio of net investment income to average net assets would have been 1.89%.
fTotal return is not annualized for periods less than one year.
gRatios are annualized for periods less than one year.
hIncludes dividend and/or interest expense on securities sold short and security borrowing fees, if any. See below for the ratios of such expenses to average net assets for the periods presented. See Note 1(d).
iBenefit of expense reduction rounds to less than 0.01%.
jBenefit of waiver and payments by affiliates rounds to less than 0.01%.
kRounds to less than 0.01%.
| 16 | Semiannual Report | The accompanying notes are an integral part of these financial statements. | franklintempleton.com |
FRANKLIN MUTUAL EUROPEAN FUND
Statement of Investments, June 30, 2017 (unaudited)
| Country | Shares | Value | ||||||||||||
Common Stocks 86.3% | ||||||||||||||
Auto Components 1.3% | ||||||||||||||
Cie Generale des Etablissements Michelin, B | France | 266,730 | $ | 35,463,860 | ||||||||||
|
| |||||||||||||
Automobiles 1.5% | ||||||||||||||
Peugeot SA | France | 1,908,840 | 38,080,205 | |||||||||||
|
| |||||||||||||
Banks 7.3% | ||||||||||||||
Allied Irish Banks PLC | Ireland | 5,022,410 | 28,397,396 | |||||||||||
BNP Paribas SA | France | 521,020 | 37,529,219 | |||||||||||
HSBC Holdings PLC | United Kingdom | 2,732,076 | 25,327,025 | |||||||||||
Societe Generale SA | France | 749,030 | 40,306,351 | |||||||||||
| a | Standard Chartered PLC | United Kingdom | 5,207,966 | 52,722,423 | ||||||||||
| a | Unicaja Banco SA | Spain | 4,389,140 | 5,865,789 | ||||||||||
|
| |||||||||||||
| 190,148,203 | ||||||||||||||
|
| |||||||||||||
Capital Markets 0.2% | ||||||||||||||
Oslo Bors VPS Holding ASA | Norway | 340,000 | 4,521,547 | |||||||||||
|
| |||||||||||||
Chemicals 0.9% | ||||||||||||||
Lanxess AG | Germany | 315,304 | 23,874,741 | |||||||||||
|
| |||||||||||||
Commercial Services & Supplies 1.7% | ||||||||||||||
G4S PLC | United Kingdom | 10,283,548 | 43,720,746 | |||||||||||
|
| |||||||||||||
Communications Equipment 2.8% | ||||||||||||||
Nokia OYJ, A | Finland | 5,254,934 | 32,143,111 | |||||||||||
Nokia OYJ, ADR | Finland | 6,476,564 | 39,895,634 | |||||||||||
|
| |||||||||||||
| 72,038,745 | ||||||||||||||
|
| |||||||||||||
Construction & Engineering 2.1% | ||||||||||||||
FLSmidth & Co. AS | Denmark | 853,319 | 53,930,123 | |||||||||||
|
| |||||||||||||
Construction Materials 2.7% | ||||||||||||||
LafargeHolcim Ltd., B | Switzerland | 1,216,211 | 69,642,747 | |||||||||||
|
| |||||||||||||
Diversified Telecommunication Services 8.7% | ||||||||||||||
Deutsche Telekom AG | Germany | 4,071,986 | 73,117,272 | |||||||||||
Hellenic Telecommunications Organization SA | Greece | 3,445,216 | 41,478,040 | |||||||||||
Koninklijke KPN NV | Netherlands | 21,300,825 | 68,150,759 | |||||||||||
| a | Telecom Italia SpA | Italy | 46,272,034 | 42,706,218 | ||||||||||
|
| |||||||||||||
| 225,452,289 | ||||||||||||||
|
| |||||||||||||
Electric Utilities 3.5% | ||||||||||||||
Enel SpA | Italy | 17,015,605 | 91,232,934 | |||||||||||
|
| |||||||||||||
Food & Staples Retailing 2.9% | ||||||||||||||
Carrefour SA | France | 1,567,550 | 39,660,327 | |||||||||||
Metro AG | Germany | 1,062,013 | 35,852,708 | |||||||||||
|
| |||||||||||||
| 75,513,035 | ||||||||||||||
|
| |||||||||||||
Hotels, Restaurants & Leisure 3.2% | ||||||||||||||
Accor SA | France | 1,810,220 | 84,869,722 | |||||||||||
|
| |||||||||||||
Industrial Conglomerates 3.5% | ||||||||||||||
Koninklijke Philips NV | Netherlands | 2,568,158 | 91,216,512 | |||||||||||
|
| |||||||||||||
Insurance 14.1% | ||||||||||||||
Ageas | Belgium | 1,192,769 | 48,039,648 | |||||||||||
Direct Line Insurance Group PLC | United Kingdom | 11,324,835 | 52,425,639 | |||||||||||
Lancashire Holdings Ltd | United Kingdom | 3,612,800 | 32,776,266 | |||||||||||
NN Group NV | Netherlands | 2,111,854 | 75,069,693 | |||||||||||
RSA Insurance Group PLC | United Kingdom | 10,023,189 | 80,357,868 | |||||||||||
| franklintempleton.com | Semiannual Report | 17 |
FRANKLIN MUTUAL EUROPEAN FUND
STATEMENT OF INVESTMENTS (UNAUDITED)
| Country | Shares | Value | ||||||||||||
Common Stocks (continued) | ||||||||||||||
Insurance (continued) | ||||||||||||||
XL Group Ltd. | Bermuda | 1,794,560 | $ | 78,601,728 | ||||||||||
|
| |||||||||||||
| 367,270,842 | ||||||||||||||
|
| |||||||||||||
IT Services 0.3% | ||||||||||||||
Capgemini SE | France | 87,396 | 9,032,445 | |||||||||||
|
| |||||||||||||
Machinery 2.4% | ||||||||||||||
CNH Industrial NV | United Kingdom | 2,999,447 | 33,969,963 | |||||||||||
CNH Industrial NV, special voting | United Kingdom | 833,461 | 9,439,286 | |||||||||||
a | Vossloh AG | Germany | 293,290 | 18,854,391 | ||||||||||
|
| |||||||||||||
| 62,263,640 | ||||||||||||||
|
| |||||||||||||
Marine 1.7% | ||||||||||||||
A.P. Moeller-Maersk AS, B | Denmark | 21,741 | 43,719,468 | |||||||||||
|
| |||||||||||||
Media 1.1% | ||||||||||||||
Sky PLC | United Kingdom | 2,284,938 | 29,583,887 | |||||||||||
|
| |||||||||||||
Metals & Mining 2.3% | ||||||||||||||
thyssenkrupp AG | Germany | 859,109 | 24,410,266 | |||||||||||
Voestalpine AG | Austria | 762,829 | 35,550,730 | |||||||||||
|
| |||||||||||||
| 59,960,996 | ||||||||||||||
|
| |||||||||||||
Multi-Utilities 1.0% | ||||||||||||||
innogy SE | Germany | 644,199 | 25,360,598 | |||||||||||
|
| |||||||||||||
Oil, Gas & Consumable Fuels 6.0% | ||||||||||||||
BP PLC | United Kingdom | 8,930,241 | 51,506,877 | |||||||||||
a | Cairn Energy PLC | United Kingdom | 9,565,171 | 21,454,595 | ||||||||||
a | Repsol SA | Spain | 485,520 | 7,431,442 | ||||||||||
Royal Dutch Shell PLC, A (EUR Traded) | United Kingdom | 1,241,414 | 32,947,349 | |||||||||||
Royal Dutch Shell PLC, A (GBP Traded) | United Kingdom | 1,603,748 | 42,510,379 | |||||||||||
|
| |||||||||||||
| 155,850,642 | ||||||||||||||
|
| |||||||||||||
Pharmaceuticals 7.0% | ||||||||||||||
GlaxoSmithKline PLC | United Kingdom | 2,554,947 | 54,428,564 | |||||||||||
Novartis AG | Switzerland | 1,011,384 | 84,180,906 | |||||||||||
Sanofi | France | 450,899 | 43,139,698 | |||||||||||
|
| |||||||||||||
| 181,749,168 | ||||||||||||||
|
| |||||||||||||
Road & Rail 0.0% | ||||||||||||||
a,b,c | Euro Wagon LP | Jersey Islands | 16,127,149 | — | ||||||||||
|
| |||||||||||||
Specialty Retail 2.0% | ||||||||||||||
a | Dufry AG | Switzerland | 14,723 | 2,412,499 | ||||||||||
Hornbach Holding AG & Co. KGaA | Germany | 213,786 | 18,375,829 | |||||||||||
Kingfisher PLC | United Kingdom | 7,902,254 | 30,951,296 | |||||||||||
|
| |||||||||||||
| 51,739,624 | ||||||||||||||
|
| |||||||||||||
Tobacco 0.4% | ||||||||||||||
Imperial Brands PLC | United Kingdom | 241,805 | 10,861,503 | |||||||||||
|
| |||||||||||||
Trading Companies & Distributors 2.9% | ||||||||||||||
Kloeckner & Co. SE | Germany | 3,031,653 | 31,927,990 | |||||||||||
Rexel SA | France | 2,611,972 | 42,738,995 | |||||||||||
|
| |||||||||||||
| 74,666,985 | ||||||||||||||
|
| |||||||||||||
Wireless Telecommunication Services 2.8% | ||||||||||||||
Vodafone Group PLC | United Kingdom | 25,502,548 | 72,332,948 | |||||||||||
|
| |||||||||||||
Total Common Stocks (Cost $2,067,322,396) | 2,244,098,155 | |||||||||||||
|
| |||||||||||||
| 18 | Semiannual Report | franklintempleton.com |
FRANKLIN MUTUAL EUROPEAN FUND
STATEMENT OF INVESTMENTS (UNAUDITED)
| Country | Shares | Value | ||||||||||||
| Preferred Stocks 4.3% | ||||||||||||||
| Auto Components 1.7% | ||||||||||||||
| d | Schaeffler AG, 3.987%, pfd | Germany | 3,156,455 | $ | 45,212,477 | |||||||||
|
| |||||||||||||
| Automobiles 2.6% | ||||||||||||||
| d | Volkswagen AG, 1.545%, pfd | Germany | 446,068 | 67,944,648 | ||||||||||
|
| |||||||||||||
Total Preferred Stocks (Cost $116,912,951) | 113,157,125 | |||||||||||||
|
| |||||||||||||
Total Investments before Short Term Investments | 2,357,255,280 | |||||||||||||
|
| |||||||||||||
| Principal Amount | ||||||||||||||
Short Term Investments 10.7% | ||||||||||||||
U.S. Government and Agency Securities 10.7% | ||||||||||||||
| e | FHLB, | |||||||||||||
7/03/17 | United States | $ | 42,800,000 | 42,800,000 | ||||||||||
7/05/17 | United States | 5,500,000 | 5,499,697 | |||||||||||
| e | U.S. Treasury Bill, | |||||||||||||
8/17/17 | United States | 35,000,000 | 34,961,010 | |||||||||||
f8/24/17 | United States | 40,000,000 | 39,947,720 | |||||||||||
f8/31/17 - 11/16/17 | United States | 30,000,000 | 29,927,660 | |||||||||||
12/14/17 | United States | 30,000,000 | 29,853,240 | |||||||||||
7/20/17 - 12/21/17 | United States | 96,000,000 | 95,777,039 | |||||||||||
|
| |||||||||||||
Total U.S. Government and Agency Securities (Cost $278,782,127) | 278,766,366 | |||||||||||||
|
| |||||||||||||
Total Investments (Cost $2,463,017,474) 101.3% | 2,636,021,646 | |||||||||||||
Other Assets, less Liabilities (1.3)% | (34,320,529 | ) | ||||||||||||
|
| |||||||||||||
Net Assets 100.0% | $ | 2,601,701,117 | ||||||||||||
|
| |||||||||||||
aNon-income producing.
bSee Note 11 regarding holdings of 5% voting securities.
cSee Note 9 regarding restricted securities.
dVariable rate security. The rate shown represents the yield at period end.
eThe security was issued on a discount basis with no stated coupon rate.
fA portion or all of the security has been segregated as collateral for open forward contracts. At June 30, 2017, the aggregate value of these securities and/or cash pledged amounted to $63,137,648, representing 2.4% of net assets.
| franklintempleton.com | Semiannual Report | 19 |
FRANKLIN MUTUAL EUROPEAN FUND
STATEMENT OF INVESTMENTS (UNAUDITED)
At June 30, 2017, the Fund had the following futures contracts outstanding. See Note 1(c).
Futures Contracts
| Description | Type | Number of Contracts | Notional Value | Expiration Date | Unrealized Appreciation | Unrealized Depreciation | ||||||||||||||||||
| Currency Contracts | ||||||||||||||||||||||||
EUR/USD | Short | 3,590 | $ | 514,581,625 | 9/18/17 | $ — | $ | (9,039,056 | ) | |||||||||||||||
GBP/USD | Short | 2,514 | 204,969,563 | 9/18/17 | — | (4,207,049 | ) | |||||||||||||||||
|
| |||||||||||||||||||||||
Total Futures Contracts |
| $ — | $ | (13,246,105 | ) | |||||||||||||||||||
|
| |||||||||||||||||||||||
Net unrealized appreciation (depreciation) |
| $ | (13,246,105 | ) | ||||||||||||||||||||
|
| |||||||||||||||||||||||
At June 30, 2017, the Fund had the following forward exchange contracts outstanding. See Note 1(c).
Forward Exchange Contracts
| Currency | Counterpartya | Type | Quantity | Contract Amount | Settlement Date | Unrealized Appreciation | Unrealized Depreciation | |||||||||||||||||||||
| OTC Forward Exchange Contracts | ||||||||||||||||||||||||||||
Euro | BOFA | Buy | 2,443,192 | $ | 2,793,367 | 7/12/17 | $ | — | $ | (752 | ) | |||||||||||||||||
Euro | BOFA | Buy | 6,964,432 | 7,892,460 | 7/12/17 | 68,019 | — | |||||||||||||||||||||
Euro | BOFA | Sell | 327,686 | 349,203 | 7/12/17 | — | (25,349 | ) | ||||||||||||||||||||
Euro | BONY | Buy | 4,095,101 | 4,659,626 | 7/12/17 | 21,152 | — | |||||||||||||||||||||
Euro | FBCO | Sell | 41,024,258 | 44,157,281 | 7/12/17 | — | (2,734,234 | ) | ||||||||||||||||||||
Euro | HSBK | Buy | 7,451,714 | 8,412,116 | 7/12/17 | 105,336 | — | |||||||||||||||||||||
Euro | SSBT | Buy | 19,650,973 | 22,067,098 | 7/12/17 | 394,340 | — | |||||||||||||||||||||
Euro | SSBT | Sell | 41,024,258 | 44,144,153 | 7/12/17 | — | (2,747,362 | ) | ||||||||||||||||||||
Euro | UBSW | Buy | 7,961,216 | 9,015,858 | 7/12/17 | 83,965 | — | |||||||||||||||||||||
British Pound | BOFA | Buy | 9,768,216 | 12,523,046 | 7/13/17 | 206,273 | — | |||||||||||||||||||||
British Pound | BONY | Sell | 11,544,835 | 14,500,776 | 7/13/17 | — | (543,718 | ) | ||||||||||||||||||||
British Pound | HSBK | Buy | 820,053 | 1,044,436 | 7/13/17 | 24,205 | — | |||||||||||||||||||||
British Pound | HSBK | Sell | 22,417,619 | 27,273,612 | 7/13/17 | — | (1,939,605 | ) | ||||||||||||||||||||
British Pound | SSBT | Buy | 759,893 | 968,013 | 7/13/17 | 22,231 | — | |||||||||||||||||||||
British Pound | SSBT | Sell | 22,417,619 | 27,255,812 | 7/13/17 | — | (1,957,404 | ) | ||||||||||||||||||||
British Pound | UBSW | Buy | 2,470,833 | 3,158,698 | 7/13/17 | 61,135 | — | |||||||||||||||||||||
Norwegian Krone | BONY | Sell | 6,233,095 | 728,689 | 7/25/17 | — | (18,503 | ) | ||||||||||||||||||||
Norwegian Krone | HSBK | Sell | 31,165,526 | 3,604,326 | 7/25/17 | — | (131,642 | ) | ||||||||||||||||||||
Norwegian Krone | UBSW | Buy | 679,000 | 80,646 | 7/25/17 | 750 | — | |||||||||||||||||||||
Euro | BOFA | Sell | 842,962 | 911,819 | 7/26/17 | — | (52,461 | ) | ||||||||||||||||||||
Euro | HSBK | Sell | 63,948,257 | 68,270,757 | 7/26/17 | — | (4,880,802 | ) | ||||||||||||||||||||
Euro | SSBT | Sell | 141,454 | 153,559 | 7/26/17 | — | (8,253 | ) | ||||||||||||||||||||
Euro | UBSW | Sell | 52,904,276 | 56,356,280 | 7/26/17 | — | (4,161,870 | ) | ||||||||||||||||||||
British Pound | BOFA | Sell | 7,070,725 | 8,667,387 | 8/14/17 | — | (555,998 | ) | ||||||||||||||||||||
British Pound | BONY | Sell | 274,276 | 337,241 | 8/14/17 | — | (20,537 | ) | ||||||||||||||||||||
British Pound | HSBK | Sell | 34,398,778 | 43,247,559 | 8/14/17 | — | (1,623,817 | ) | ||||||||||||||||||||
British Pound | SSBT | Sell | 6,464,200 | 8,020,167 | 8/14/17 | — | (412,038 | ) | ||||||||||||||||||||
British Pound | UBSW | Sell | 33,746,848 | 42,455,029 | 8/14/17 | — | (1,565,938 | ) | ||||||||||||||||||||
Euro | BOFA | Sell | 61,018,440 | 65,980,474 | 8/18/17 | — | (3,901,478 | ) | ||||||||||||||||||||
Euro | BONY | Sell | 5,671,469 | 6,195,680 | 8/18/17 | — | (299,625 | ) | ||||||||||||||||||||
Euro | HSBK | Sell | 28,142,625 | 30,512,876 | 8/18/17 | — | (1,717,734 | ) | ||||||||||||||||||||
Euro | SSBT | Sell | 53,397,469 | 57,519,730 | 8/18/17 | — | (3,634,233 | ) | ||||||||||||||||||||
Euro | UBSW | Sell | 16,541,033 | 17,723,389 | 8/18/17 | — | (1,220,386 | ) | ||||||||||||||||||||
Euro | BOFA | Sell | 73,164,287 | 78,692,278 | 10/10/17 | — | (5,343,847 | ) | ||||||||||||||||||||
Euro | BONY | Sell | 1,632,821 | 1,784,381 | 10/10/17 | — | (91,069 | ) | ||||||||||||||||||||
| 20 | Semiannual Report | franklintempleton.com |
FRANKLIN MUTUAL EUROPEAN FUND
STATEMENT OF INVESTMENTS (UNAUDITED)
Forward Exchange Contracts (continued)
| Currency | Counterpartya | Type | Quantity | Contract Amount | Settlement Date | Unrealized Appreciation | Unrealized Depreciation | |||||||||||||||||||||
| OTC Forward Exchange Contracts (continued) | ||||||||||||||||||||||||||||
Euro | HSBK | Sell | 57,956,168 | $ | 62,451,731 | 10/10/17 | $ | — | $ | (4,116,426 | ) | |||||||||||||||||
Euro | SSBT | Sell | 1,827,838 | 2,021,550 | 10/10/17 | — | (77,895 | ) | ||||||||||||||||||||
Euro | UBSW | Sell | 2,882,432 | 3,184,871 | 10/10/17 | — | (125,875 | ) | ||||||||||||||||||||
Euro | BOFA | Sell | 1,192,909 | 1,332,564 | 10/18/17 | — | (38,234 | ) | ||||||||||||||||||||
Euro | BONY | Sell | 9,693,163 | 10,665,174 | 10/18/17 | — | (473,450 | ) | ||||||||||||||||||||
Euro | HSBK | Sell | 57,418,784 | 61,636,313 | 10/18/17 | — | (4,344,857 | ) | ||||||||||||||||||||
Euro | SSBT | Sell | 964,889 | 1,062,537 | 10/18/17 | — | (46,238 | ) | ||||||||||||||||||||
Euro | UBSW | Sell | 56,804,808 | 60,948,463 | 10/18/17 | — | (4,327,173 | ) | ||||||||||||||||||||
British Pound | BOFA | Sell | 2,074,303 | 2,716,460 | 10/24/17 | 4,790 | — | |||||||||||||||||||||
British Pound | BOFA | Sell | 4,652,777 | 6,032,180 | 10/24/17 | — | (50,246 | ) | ||||||||||||||||||||
British Pound | BONY | Sell | 48,089 | 62,392 | 10/24/17 | — | (473 | ) | ||||||||||||||||||||
British Pound | HSBK | Sell | 408,197 | 533,775 | 10/24/17 | 152 | — | |||||||||||||||||||||
British Pound | HSBK | Sell | 5,422,358 | 7,052,889 | 10/24/17 | — | (35,585 | ) | ||||||||||||||||||||
British Pound | SSBT | Sell | 11,787,672 | 15,418,659 | 10/24/17 | 9,016 | — | |||||||||||||||||||||
British Pound | SSBT | Sell | 74,055,175 | 95,537,254 | 10/24/17 | — | (1,272,688 | ) | ||||||||||||||||||||
British Pound | UBSW | Sell | 2,694,007 | 3,497,852 | 10/24/17 | — | (23,935 | ) | ||||||||||||||||||||
Euro | BOFA | Sell | 63,372,204 | 69,816,207 | 11/06/17 | — | (3,085,580 | ) | ||||||||||||||||||||
Euro | HSBK | Sell | 2,855,227 | 3,147,145 | 11/06/17 | — | (137,436 | ) | ||||||||||||||||||||
Euro | SSBT | Sell | 12,386,772 | 13,836,396 | 11/06/17 | — | (413,035 | ) | ||||||||||||||||||||
Euro | UBSW | Sell | 67,116,221 | 73,943,032 | 11/06/17 | — | (3,265,778 | ) | ||||||||||||||||||||
Euro | BOFA | Sell | 76,666,580 | 85,829,531 | 11/20/17 | — | (2,436,696 | ) | ||||||||||||||||||||
Euro | SSBT | Sell | 11,089,855 | 12,531,414 | 11/20/17 | — | (236,335 | ) | ||||||||||||||||||||
Euro | UBSW | Sell | 65,657,830 | 73,387,726 | 11/20/17 | — | (2,204,127 | ) | ||||||||||||||||||||
British Pound | BOFA | Sell | 649,465 | 851,210 | 11/24/17 | 1,393 | — | |||||||||||||||||||||
British Pound | BONY | Sell | 39,228,234 | 51,367,490 | 11/24/17 | 37,788 | — | |||||||||||||||||||||
British Pound | HSBK | Sell | 290,567 | 380,442 | 11/24/17 | 239 | — | |||||||||||||||||||||
British Pound | SSBT | Sell | 165,599 | 215,614 | 11/24/17 | — | (1,071 | ) | ||||||||||||||||||||
British Pound | SSBT | Sell | 1,648,729 | 2,158,916 | 11/24/17 | 1,572 | — | |||||||||||||||||||||
British Pound | UBSW | Sell | 1,245,425 | 1,627,724 | 11/24/17 | — | (1,900 | ) | ||||||||||||||||||||
British Pound | UBSW | Sell | 39,831,454 | 52,149,276 | 11/24/17 | 30,267 | — | |||||||||||||||||||||
|
| |||||||||||||||||||||||||||
Total Forward Exchange Contracts |
| $ | 1,072,623 | $ | (66,303,688 | ) | ||||||||||||||||||||||
|
| |||||||||||||||||||||||||||
Net unrealized appreciation (depreciation) |
| $ | (65,231,065 | ) | ||||||||||||||||||||||||
|
| |||||||||||||||||||||||||||
aMay be comprised of multiple contracts with the same counterparty, currency and settlement date.
See Note 10 regarding other derivative information.
See Abbreviations on page 38.
| franklintempleton.com | The accompanying notes are an integral part of these financial statements. | Semiannual Report | 21 |
FRANKLIN MUTUAL EUROPEAN FUND
Statement of Assets and Liabilities
June 30, 2017 (unaudited)
Assets: | ||||
Investments in securities: | ||||
Cost - Unaffiliated issuers | $ | 2,456,734,965 | ||
Cost - Controlled affiliates (Note 11) | 6,282,509 | |||
|
| |||
Total cost of investments | $ | 2,463,017,474 | ||
|
| |||
Value - Unaffiliated issuers | $ | 2,636,021,646 | ||
Value - Controlled affiliates (Note 11) | — | |||
|
| |||
Total value of investments | 2,636,021,646 | |||
Cash | 61,021 | |||
Foreign currency, at value (cost $9,345,036) | 9,354,042 | |||
Receivables: | ||||
Investment securities sold | 5,511,997 | |||
Capital shares sold | 5,150,459 | |||
Dividends and interest | 10,690,244 | |||
European Union tax reclaims | 2,349,070 | |||
Due from brokers | 13,413,960 | |||
Variation margin | 215,263 | |||
Unrealized appreciation on OTC forward exchange contracts | 1,072,623 | |||
Other assets | 1,611 | |||
|
| |||
Total assets | 2,683,841,936 | |||
|
| |||
Liabilities: | ||||
Payables: | ||||
Investment securities purchased | 5,510,933 | |||
Capital shares redeemed | 6,783,442 | |||
Management fees | 1,857,050 | |||
Distribution fees | 661,547 | |||
Transfer agent fees | 575,732 | |||
Trustees’ fees and expenses | 96,540 | |||
Unrealized depreciation on OTC forward exchange contracts | 66,303,688 | |||
Accrued expenses and other liabilities | 351,887 | |||
|
| |||
Total liabilities | 82,140,819 | |||
|
| |||
Net assets, at value | $ | 2,601,701,117 | ||
|
| |||
Net assets consist of: | ||||
Paid-in capital | $ | 2,600,954,634 | ||
Undistributed net investment income | 70,138,918 | |||
Net unrealized appreciation (depreciation) | 94,636,587 | |||
Accumulated net realized gain (loss) | (164,029,022 | ) | ||
|
| |||
Net assets, at value | $ | 2,601,701,117 | ||
|
|
| 22 | Semiannual Report | The accompanying notes are an integral part of these financial statements. | franklintempleton.com |
FRANKLIN MUTUAL EUROPEAN FUND
FINANCIAL STATEMENTS
Statement of Assets and Liabilities (continued)
June 30, 2017 (unaudited)
| Class Z: | ||||
Net assets, at value | $ | 1,293,632,271 | ||
|
| |||
Shares outstanding | 62,859,062 | |||
|
| |||
Net asset value and maximum offering price per share | $20.58 | |||
|
| |||
| Class A: | ||||
Net assets, at value | $ | 759,810,143 | ||
|
| |||
Shares outstanding | 38,038,938 | |||
|
| |||
Net asset value per sharea | $19.97 | |||
|
| |||
Maximum offering price per share (net asset value per share ÷ 94.25%) | $21.19 | |||
|
| |||
| Class C: | ||||
Net assets, at value | $ | 194,935,353 | ||
|
| |||
Shares outstanding | 9,771,914 | |||
|
| |||
Net asset value and maximum offering price per sharea | $19.95 | |||
|
| |||
| Class R: | ||||
Net assets, at value | $ | 622,431 | ||
|
| |||
Shares outstanding | 31,721 | |||
|
| |||
Net asset value and maximum offering price per share | $19.62 | |||
|
| |||
| Class R6: | ||||
Net assets, at value | $ | 352,700,919 | ||
|
| |||
Shares outstanding | 17,137,532 | |||
|
| |||
Net asset value and maximum offering price per share | $20.58 | |||
|
| |||
aRedemption price is equal to net asset value less contingent deferred sales charges, if applicable.
| franklintempleton.com | The accompanying notes are an integral part of these financial statements. | Semiannual Report | 23 |
FRANKLIN MUTUAL EUROPEAN FUND
FINANCIAL STATEMENTS
Statement of Operations
for the six months ended June 30, 2017 (unaudited)
Investment income: | ||||
Dividends (net of foreign taxes of $5,516,115) | $ 50,930,647 | |||
Interest | 938,949 | |||
|
| |||
Total investment income | 51,869,596 | |||
|
| |||
Expenses: | ||||
Management fees (Note 3a) | 10,774,614 | |||
Distribution fees: (Note 3c) | ||||
Class A | 952,673 | |||
Class C | 1,004,864 | |||
Class R | 1,548 | |||
Transfer agent fees: (Note 3e) | ||||
Class Z | 1,050,248 | |||
Class A | 646,090 | |||
Class C | 170,434 | |||
Class R | 526 | |||
Class R6 | 574 | |||
Custodian fees (Note 4) | 118,350 | |||
Reports to shareholders | 113,779 | |||
Registration and filing fees | 96,523 | |||
Professional fees | 75,116 | |||
Trustees’ fees and expenses | 43,154 | |||
Other | 33,906 | |||
|
| |||
Total expenses | 15,082,399 | |||
Expense reductions (Note 4) | (15,380 | ) | ||
|
| |||
Net expenses | 15,067,019 | |||
|
| |||
Net investment income | 36,802,577 | |||
|
| |||
Realized and unrealized gains (losses): | ||||
Net realized gain (loss) from: | ||||
Investments | 37,931,717 | |||
Foreign currency transactions | 25,323,996 | |||
Futures contracts | (25,859,248 | ) | ||
|
| |||
Net realized gain (loss) | 37,396,465 | |||
|
| |||
Net change in unrealized appreciation (depreciation) on: | ||||
Investments | 232,952,768 | |||
Translation of other assets and liabilities denominated in foreign currencies | (113,916,096 | ) | ||
Futures contracts | (19,395,956 | ) | ||
|
| |||
Net change in unrealized appreciation (depreciation) | 99,640,716 | |||
|
| |||
Net realized and unrealized gain (loss) | 137,037,181 | |||
|
| |||
Net increase (decrease) in net assets resulting from operations | $ | 173,839,758 | ||
|
|
| 24 | Semiannual Report | The accompanying notes are an integral part of these financial statements. | franklintempleton.com |
FRANKLIN MUTUAL EUROPEAN FUND
FINANCIAL STATEMENTS
Statements of Changes in Net Assets
| Six Months Ended June 30, 2017 (unaudited) | Year Ended December 31, 2016 | |||||||
Increase (decrease) in net assets: | ||||||||
Operations: | ||||||||
Net investment income | $ 36,802,577 | $ 86,670,906 | ||||||
Net realized gain (loss) | 37,396,465 | (142,742,912 | ) | |||||
Net change in unrealized appreciation (depreciation) | 99,640,716 | 80,746,396 | ||||||
|
| |||||||
Net increase (decrease) in net assets resulting from operations | 173,839,758 | 24,674,390 | ||||||
|
| |||||||
Distributions to shareholders from: | ||||||||
Net investment income: | ||||||||
Class Z | — | (28,255,499 | ) | |||||
Class A | — | (16,888,293 | ) | |||||
Class C | — | (2,839,954 | ) | |||||
Class R | — | (11,461 | ) | |||||
Class R6 | — | (7,900,715 | ) | |||||
Net realized gains: | ||||||||
Class Z | — | (16,457,536 | ) | |||||
Class A | — | (12,347,412 | ) | |||||
Class C | — | (3,328,152 | ) | |||||
Class R | — | (12,030 | ) | |||||
Class R6 | — | (4,582,657 | ) | |||||
|
| |||||||
Total distributions to shareholders | — | (92,623,709 | ) | |||||
|
| |||||||
Capital share transactions: (Note 2) | ||||||||
Class Z | 31,940,683 | (153,067,905 | ) | |||||
Class A | (61,445,825 | ) | (238,121,733 | ) | ||||
Class C | (27,401,005 | ) | (74,322,720 | ) | ||||
Class R | (45,650 | ) | (342,532 | ) | ||||
Class R6 | 17,937,924 | (55,061,378 | ) | |||||
|
| |||||||
Total capital share transactions | (39,013,873 | ) | (520,916,268 | ) | ||||
|
| |||||||
Net increase (decrease) in net assets | 134,825,885 | (588,865,587 | ) | |||||
Net assets: | ||||||||
Beginning of period | 2,466,875,232 | 3,055,740,819 | ||||||
|
| |||||||
End of period | $2,601,701,117 | $2,466,875,232 | ||||||
|
| |||||||
Undistributed net investment income included in net assets: | ||||||||
End of period | $ 70,138,918 | $ 33,336,341 | ||||||
|
| |||||||
| franklintempleton.com | The accompanying notes are an integral part of these financial statements. | Semiannual Report | 25 |
FRANKLIN MUTUAL EUROPEAN FUND
Notes to Financial Statements (unaudited)
1. Organization and Significant Accounting
Policies
Franklin Mutual Series Funds (Trust) is registered under the Investment Company Act of 1940 (1940 Act) as an open-end management investment company, consisting of seven separate funds and applies the specialized accounting and reporting guidance in U.S. Generally Accepted Accounting Principles (U.S. GAAP). Franklin Mutual European Fund (Fund) is included in this report. The Fund offers five classes of shares: Class Z, Class A, Class C, Class R and Class R6. Each class of shares may differ by its initial sales load, contingent deferred sales charges, voting rights on matters affecting a single class, its exchange privilege and fees primarily due to differing arrangements for distribution and transfer agent fees.
The following summarizes the Fund’s significant accounting policies.
a. Financial Instrument Valuation
The Fund’s investments in financial instruments are carried at fair value daily. Fair value is the price that would be received to sell an asset or paid to transfer a liability in an orderly transaction between market participants on the measurement date. The Fund calculates the net asset value (NAV) per share as of 4 p.m. Eastern time each day the New York Stock Exchange (NYSE) is open for trading. Under compliance policies and procedures approved by the Trust’s Board of Trustees (the Board), the Fund’s administrator has responsibility for oversight of valuation, including leading the cross-functional Valuation Committee (VC). The VC provides administration and oversight of the Fund’s valuation policies and procedures, which are approved annually by the Board. Among other things, these procedures allow the Fund to utilize independent pricing services, quotations from securities and financial instrument dealers, and other market sources to determine fair value.
Equity securities and derivative financial instruments listed on an exchange or on the NASDAQ National Market System are valued at the last quoted sale price or the official closing price of the day, respectively. Foreign equity securities are valued as of the close of trading on the foreign stock exchange on which the security is primarily traded, or as of 4 p.m. Eastern time. The value is then converted into its U.S. dollar equivalent at the foreign exchange rate in effect at 4 p.m. Eastern time on the day that the value of the security is determined. Over-the-counter (OTC) securities are valued within the range of the most recent
quoted bid and ask prices. Securities that trade in multiple markets or on multiple exchanges are valued according to the broadest and most representative market. Certain equity securities are valued based upon fundamental characteristics or relationships to similar securities.
Debt securities generally trade in the OTC market rather than on a securities exchange. The Fund’s pricing services use multiple valuation techniques to determine fair value. In instances where sufficient market activity exists, the pricing services may utilize a market-based approach through which quotes from market makers are used to determine fair value. In instances where sufficient market activity may not exist or is limited, the pricing services also utilize proprietary valuation models which may consider market characteristics such as benchmark yield curves, credit spreads, estimated default rates, anticipated market interest rate volatility, coupon rates, anticipated timing of principal repayments, underlying collateral, and other unique security features in order to estimate the relevant cash flows, which are then discounted to calculate the fair value.
Certain derivative financial instruments trade in the OTC market. The Fund’s pricing services use various techniques including industry standard option pricing models and proprietary discounted cash flow models to determine the fair value of those instruments. The Fund’s net benefit or obligation under the derivative contract, as measured by the fair value of the contract, is included in net assets.
The Fund has procedures to determine the fair value of financial instruments for which market prices are not reliable or readily available. Under these procedures, the VC convenes on a regular basis to review such financial instruments and considers a number of factors, including significant unobservable valuation inputs, when arriving at fair value. The VC primarily employs a market-based approach which may use related or comparable assets or liabilities, recent transactions, market multiples, book values, and other relevant information for the investment to determine the fair value of the investment. An income-based valuation approach may also be used in which the anticipated future cash flows of the investment are discounted to calculate fair value. Discounts may also be applied due to the nature or duration of any restrictions on the disposition of the investments. Due to the inherent uncertainty of valuations of such investments, the fair values may differ significantly from the values that would have been used had an active market existed. The VC employs various methods for calibrating these
| 26 | Semiannual Report | franklintempleton.com | ||
FRANKLIN MUTUAL EUROPEAN FUND
NOTES TO FINANCIAL STATEMENTS (UNAUDITED)
valuation approaches including a regular review of key inputs and assumptions, transactional back-testing or disposition analysis, and reviews of any related market activity.
Trading in securities on foreign securities stock exchanges and OTC markets may be completed before 4 p.m. Eastern time. In addition, trading in certain foreign markets may not take place on every Fund’s business day. Occasionally, events occur between the time at which trading in a foreign security is completed and 4 p.m. Eastern time that might call into question the reliability of the value of a portfolio security held by the Fund. As a result, differences may arise between the value of the Fund’s portfolio securities as determined at the foreign market close and the latest indications of value at 4 p.m. Eastern time. In order to minimize the potential for these differences, the VC monitors price movements following the close of trading in foreign stock markets through a series of country specific market proxies (such as baskets of American Depositary Receipts, futures contracts and exchange traded funds). These price movements are measured against established trigger thresholds for each specific market proxy to assist in determining if an event has occurred that may call into question the reliability of the values of the foreign securities held by the Fund. If such an event occurs, the securities may be valued using fair value procedures, which may include the use of independent pricing services.
When the last day of the reporting period is a non-business day, certain foreign markets may be open on those days that the Fund’s NAV is not calculated, which could result in differences between the value of the Fund’s portfolio securities on the last business day and the last calendar day of the reporting period. Any significant security valuation changes due to an open foreign market are adjusted and reflected by the Fund for financial reporting purposes.
b. Foreign Currency Translation
Portfolio securities and other assets and liabilities denominated in foreign currencies are translated into U.S. dollars based on the exchange rate of such currencies against U.S. dollars on the date of valuation. The Fund may enter into foreign currency exchange contracts to facilitate transactions denominated in a foreign currency. Purchases and sales of securities, income and expense items denominated in foreign currencies are translated into U.S. dollars at the exchange rate in effect on the transaction date. Portfolio securities and assets and liabilities denominated in foreign currencies contain risks that those currencies will
decline in value relative to the U.S. dollar. Occasionally, events may impact the availability or reliability of foreign exchange rates used to convert the U.S. dollar equivalent value. If such an event occurs, the foreign exchange rate will be valued at fair value using procedures established and approved by the Board.
The Fund does not separately report the effect of changes in foreign exchange rates from changes in market prices on securities held. Such changes are included in net realized and unrealized gain or loss from investments in the Statement of Operations.
Realized foreign exchange gains or losses arise from sales of foreign currencies, currency gains or losses realized between the trade and settlement dates on securities transactions and the difference between the recorded amounts of dividends, interest, and foreign withholding taxes and the U.S. dollar equivalent of the amounts actually received or paid. Net unrealized foreign exchange gains and losses arise from changes in foreign exchange rates on foreign denominated assets and liabilities other than investments in securities held at the end of the reporting period.
c. Derivative Financial Instruments
The Fund invested in derivative financial instruments in order to manage risk or gain exposure to various other investments or markets. Derivatives are financial contracts based on an underlying or notional amount, require no initial investment or an initial net investment that is smaller than would normally be required to have a similar response to changes in market factors, and require or permit net settlement. Derivatives contain various risks including the potential inability of the counterparty to fulfill their obligations under the terms of the contract, the potential for an illiquid secondary market, and/or the potential for market movements which expose the Fund to gains or losses in excess of the amounts shown in the Statement of Assets and Liabilities. Realized gain and loss and unrealized appreciation and depreciation on these contracts for the period are included in the Statement of Operations.
Derivative counterparty credit risk is managed through a formal evaluation of the creditworthiness of all potential counterparties. The Fund attempts to reduce its exposure to counterparty credit risk on OTC derivatives, whenever possible, by entering into International Swaps and Derivatives Association (ISDA) master agreements with certain counterparties. These agreements contain various provisions,
| franklintempleton.com | Semiannual Report | 27 | ||||
FRANKLIN MUTUAL EUROPEAN FUND
NOTES TO FINANCIAL STATEMENTS (UNAUDITED)
1. Organization and Significant Accounting
Policies (continued)
c. Derivative Financial Instruments (continued)
including but not limited to collateral requirements, events of default, or early termination. Termination events applicable to the counterparty include certain deteriorations in the credit quality of the counterparty. Termination events applicable to the Fund include failure of the Fund to maintain certain net asset levels and/or limit the decline in net assets over various periods of time. In the event of default or early termination, the ISDA master agreement gives the non-defaulting party the right to net and close-out all transactions traded, whether or not arising under the ISDA agreement, to one net amount payable by one counterparty to the other. However, absent an event of default or early termination, OTC derivative assets and liabilities are presented gross and not offset in the Statement of Assets and Liabilities. Early termination by the counterparty may result in an immediate payment by the Fund of any net liability owed to that counterparty under the ISDA agreement.
Collateral requirements differ by type of derivative. Collateral or initial margin requirements are set by the broker or exchange clearing house for exchange traded and centrally cleared derivatives. Initial margin deposited is held at the exchange and can be in the form of cash and/or securities. For OTC derivatives traded under an ISDA master agreement, posting of collateral is required by either the Fund or the applicable counterparty if the total net exposure of all OTC derivatives with the applicable counterparty exceeds the minimum transfer amount, which typically ranges from $100,000 to $250,000, and can vary depending on the counterparty and the type of the agreement. Generally, collateral is determined at the close of Fund business each day and any additional collateral required due to changes in derivative values may be delivered by the Fund or the counterparty the next business day, or within a few business days. Collateral pledged and/or received by the Fund for OTC derivatives, if any, is held in segregated accounts with the Fund’s custodian/counterparty broker and can be in the form of cash and/or securities. Unrestricted cash may be invested according to the Fund’s investment objectives. To the extent that the amounts due to the Fund from its counterparties are not subject to collateralization or are not fully collateralized, the Fund bears the risk of loss from counterparty non-performance.
The Fund entered into exchange traded futures contracts primarily to manage exposure to certain foreign currencies. A futures contract is an agreement between the Fund and a counterparty to buy or sell an asset at a specified price on a future date. Required initial margins are pledged by the Fund, and the daily change in fair value is accounted for as a variation margin payable or receivable in the Statement of Assets and Liabilities.
The Fund entered into OTC forward exchange contracts primarily to manage exposure to certain foreign currencies. A forward exchange contract is an agreement between the Fund and a counterparty to buy or sell a foreign currency at a specific exchange rate on a future date.
See Note 10 regarding other derivative information.
d. Securities Sold Short
The Fund is engaged in selling securities short, which obligates the Fund to replace a borrowed security with the same security at current fair value. The Fund incurs a loss if the price of the security increases between the date of the short sale and the date on which the Fund replaces the borrowed security. The Fund realizes a gain if the price of the security declines between those dates. Gains are limited to the price at which the Fund sold the security short, while losses are potentially unlimited in size.
The Fund is required to establish a margin account with the broker lending the security sold short. While the short sale is outstanding, the broker retains the proceeds of the short sale to the extent necessary to meet margin requirements until the short position is closed out. A deposit must also be maintained with the Fund’s custodian/counterparty broker consisting of cash and/or securities having a value equal to a specified percentage of the value of the securities sold short. The Fund is obligated to pay fees for borrowing the securities sold short and is required to pay the counterparty any dividends and/or interest due on securities sold short. Such dividends and/or interest and any security borrowing fees are recorded as an expense to the Fund. At June 30, 2017, the Fund had no securities sold short.
e. Securities Lending
The Fund participates in an agency based securities lending program to earn additional income. The Fund receives cash collateral against the loaned securities in an amount equal to at least 102% of the fair value of the loaned securities. Collateral is maintained over the life of the loan in an amount not less than
| 28 | Semiannual Report | franklintempleton.com | ||
FRANKLIN MUTUAL EUROPEAN FUND
NOTES TO FINANCIAL STATEMENTS (UNAUDITED)
100% of the fair value of loaned securities, as determined at the close of Fund business each day; any additional collateral required due to changes in security values is delivered to the Fund on the next business day. The collateral is deposited into a joint cash account with other funds and is used to invest in a money market fund managed by Franklin Advisers, Inc., an affiliate of the Fund, and/or a joint repurchase agreement. The Fund may receive income from the investment of cash collateral, in addition to lending fees and rebates paid by the borrower. Income from securities loaned, net of fees paid to the securities lending agent and/or third-party vendor, is reported separately in the Statement of Operations, if any. The Fund bears the market risk with respect to the collateral investment, securities loaned, and the risk that the agent may default on its obligations to the Fund. If the borrower defaults on its obligation to return the securities loaned, the Fund has the right to repurchase the securities in the open market using the collateral received. The securities lending agent has agreed to indemnify the Fund in the event of default by a third party borrower. At June 30, 2017, the Fund had no securities on loan.
f. Income and Deferred Taxes
It is the Fund’s policy to qualify as a regulated investment company under the Internal Revenue Code. The Fund intends to distribute to shareholders substantially all of its taxable income and net realized gains to relieve it from federal income and excise taxes. As a result, no provision for U.S. federal income taxes is required.
The Fund may be subject to foreign taxation related to income received, capital gains on the sale of securities and certain foreign currency transactions in the foreign jurisdictions in which it invests. Foreign taxes, if any, are recorded based on the tax regulations and rates that exist in the foreign markets in which the Fund invests. When a capital gain tax is determined to apply, the Fund records an estimated deferred tax liability in an amount that would be payable if the securities were disposed of on the valuation date. As a result of several court cases, in certain countries across the European Union, the Fund filed additional tax reclaims for previously withheld taxes on dividends earned in those countries (EU reclaims). These additional filings are subject to various administrative proceedings by the local jurisdictions’ tax authorities within the European Union, as well as a number of related judicial proceedings. Income recognized, if any, for EU reclaims is reflected as other income in the Statement of Operations and any related receivable, if any, is reflected as European Union
tax reclaims in the Statement of Assets and Liabilities. When uncertainty exists as to the ultimate resolution of these proceedings, the likelihood of receipt of these EU reclaims, and the potential timing of payment, no amounts are reflected in the financial statements. For U.S. income tax purposes, EU reclaims received by the Fund, if any, reduce the amounts of foreign taxes Fund shareholders can use as tax credits in their individual income tax returns.
The Fund may recognize an income tax liability related to its uncertain tax positions under U.S. GAAP when the uncertain tax position has a less than 50% probability that it will be sustained upon examination by the tax authorities based on its technical merits. As of June 30, 2017, the Fund has determined that no tax liability is required in its financial statements related to uncertain tax positions for any open tax years (or expected to be taken in future tax years). Open tax years are those that remain subject to examination and are based on each tax jurisdiction’s statute of limitation.
g. Security Transactions, Investment Income, Expenses and Distributions
Security transactions are accounted for on trade date. Realized gains and losses on security transactions are determined on a specific identification basis. Interest income and estimated expenses are accrued daily. Amortization of premium and accretion of discount on debt securities are included in interest income. Dividend income is recorded on the ex-dividend date except for certain dividends from securities where the dividend rate is not available. In such cases, the dividend is recorded as soon as the information is received by the Fund. Distributions to shareholders are recorded on the ex-dividend date. Distributable earnings are determined according to income tax regulations (tax basis) and may differ from earnings recorded in accordance with U.S. GAAP. These differences may be permanent or temporary. Permanent differences are reclassified among capital accounts to reflect their tax character. These reclassifications have no impact on net assets or the results of operations. Temporary differences are not reclassified, as they may reverse in subsequent periods.
Common expenses incurred by the Trust are allocated among the Funds based on the ratio of net assets of each Fund to the combined net assets of the Trust. Fund specific expenses are charged directly to the Fund that incurred the expense.
| franklintempleton.com | Semiannual Report | 29 | ||||
FRANKLIN MUTUAL EUROPEAN FUND
NOTES TO FINANCIAL STATEMENTS (UNAUDITED)
1. Organization and Significant Accounting
Policies (continued)
g. Security Transactions, Investment Income, Expenses and Distributions (continued)
Realized and unrealized gains and losses and net investment income, not including class specific expenses, are allocated daily to each class of shares based upon the relative proportion of net assets of each class. Differences in per share distributions, by class, are generally due to differences in class specific expenses.
h. Accounting Estimates
The preparation of financial statements in accordance with U.S. GAAP requires management to make estimates and assumptions that affect the reported amounts of assets and
liabilities at the date of the financial statements and the amounts of income and expenses during the reporting period. Actual results could differ from those estimates.
i. Guarantees and Indemnifications
Under the Trust’s organizational documents, its officers and trustees are indemnified by the Trust against certain liabilities arising out of the performance of their duties to the Trust. Additionally, in the normal course of business, the Trust, on behalf of the Fund, enters into contracts with service providers that contain general indemnification clauses. The Trust’s maximum exposure under these arrangements is unknown as this would involve future claims that may be made against the Trust that have not yet occurred. Currently, the Trust expects the risk of loss to be remote.
2. Shares of Beneficial Interest
At June 30, 2017, there were an unlimited number of shares authorized (without par value). Transactions in the Fund’s shares were as follows:
| Six Months Ended June 30, 2017 | Year Ended December 31, 2016 | |||||||||||||||||||
| Shares | Amount | Shares | Amount | |||||||||||||||||
| Class Z Shares: | ||||||||||||||||||||
Shares sold | 8,948,874 | $ | 178,225,284 | 15,887,532 | $ | 289,620,406 | ||||||||||||||
Shares issued in reinvestment of distributions | — | — | 2,149,123 | 40,692,946 | ||||||||||||||||
Shares redeemed | (7,334,775 | ) | (146,284,601 | ) | (26,381,377 | ) | (483,381,257 | ) | ||||||||||||
|
| |||||||||||||||||||
Net increase (decrease) | 1,614,099 | $ | 31,940,683 | (8,344,722 | ) | $ | (153,067,905 | ) | ||||||||||||
|
| |||||||||||||||||||
| Class A Shares: | ||||||||||||||||||||
Shares sold | 7,272,796 | $ | 139,852,190 | 8,051,045 | $ | 142,359,812 | ||||||||||||||
Shares issued in reinvestment of distributions | — | — | 1,310,378 | 24,063,648 | ||||||||||||||||
Shares redeemed | (10,461,332 | ) | (201,298,015 | ) | (22,672,948 | ) | (404,545,193 | ) | ||||||||||||
|
| |||||||||||||||||||
Net increase (decrease) | (3,188,536 | ) | $ | (61,445,825 | ) | (13,311,525 | ) | $ | (238,121,733 | ) | ||||||||||
|
| |||||||||||||||||||
| Class C Shares: | ||||||||||||||||||||
Shares sold | 663,610 | $ | 13,044,200 | 1,157,702 | $ | 20,444,715 | ||||||||||||||
Shares issued in reinvestment of distributions | — | — | 316,883 | 5,796,600 | ||||||||||||||||
Shares redeemed | (2,076,019 | ) | (40,445,205 | ) | (5,665,889 | ) | (100,564,035 | ) | ||||||||||||
|
| |||||||||||||||||||
Net increase (decrease) | (1,412,409 | ) | $ | (27,401,005 | ) | (4,191,304 | ) | $ | (74,322,720 | ) | ||||||||||
|
| |||||||||||||||||||
| Class R Shares: | ||||||||||||||||||||
Shares sold | 2,829 | $ | 52,999 | 8,245 | $ | 141,919 | ||||||||||||||
Shares issued in reinvestment of distributions | — | — | 1,306 | 23,491 | ||||||||||||||||
Shares redeemed | (5,225 | ) | (98,649 | ) | (28,993 | ) | (507,942 | ) | ||||||||||||
|
| |||||||||||||||||||
Net increase (decrease) | (2,396 | ) | $ | (45,650 | ) | (19,442 | ) | $ | (342,532 | ) | ||||||||||
|
| |||||||||||||||||||
| 30 | Semiannual Report | franklintempleton.com | ||
FRANKLIN MUTUAL EUROPEAN FUND
NOTES TO FINANCIAL STATEMENTS (UNAUDITED)
| Six Months Ended June 30, 2017 | Year Ended December 31, 2016 | |||||||||||||||||||
| Shares | Amount | Shares | Amount | |||||||||||||||||
| Class R6 Shares: | ||||||||||||||||||||
Shares sold | 2,621,596 | $ | 52,823,776 | 4,455,100 | $ | 81,890,311 | ||||||||||||||
Shares issued in reinvestment of distributions | — | — | 577,663 | 10,934,416 | ||||||||||||||||
Shares redeemed | (1,735,105 | ) | (34,885,852 | ) | (7,987,118 | ) | (147,886,105 | ) | ||||||||||||
|
| |||||||||||||||||||
Net increase (decrease) | 886,491 | $ | 17,937,924 | (2,954,355 | ) | $ | (55,061,378 | ) | ||||||||||||
|
| |||||||||||||||||||
3. Transactions with Affiliates
Franklin Resources, Inc. is the holding company for various subsidiaries that together are referred to as Franklin Templeton Investments. Certain officers and trustees of the Fund are also officers and/or directors of the following subsidiaries:
| Subsidiary | Affiliation | |
Franklin Mutual Advisers, LLC (Franklin Mutual) | Investment manager | |
Franklin Templeton Services, LLC (FT Services) | Administrative manager | |
Franklin Templeton Distributors, Inc. (Distributors) | Principal underwriter | |
Franklin Templeton Investor Services, LLC (Investor Services) | Transfer agent |
a. Management Fees
The Fund pays an investment management fee to Franklin Mutual based on the average daily net assets of the Fund as follows:
| Annualized Fee Rate | Net Assets | |
0.875% | Up to and including $1 billion | |
0.845% | Over $1 billion, up to and including $2 billion | |
0.825% | Over $2 billion, up to and including $5 billion | |
0.805% | In excess of $5 billion |
For the period ended June 30, 2017, the annualized effective investment management fee rate was 0.852% of the Fund’s average daily net assets.
b. Administrative Fees
Under an agreement with Franklin Mutual, FT Services provides administrative services to the Fund. The fee is paid by Franklin Mutual based on the Fund’s average daily net assets, and is not an additional expense of the Fund.
c. Distribution Fees
The Board has adopted distribution plans for each share class, with the exception of Class Z and Class R6 shares, pursuant to Rule 12b-1 under the 1940 Act. Under the Fund’s Class A reimbursement distribution plan, the Fund reimburses Distributors for costs incurred in connection with the servicing, sale and distribution of the Fund’s shares up to the maximum annual plan rate. Under the Class A reimbursement distribution plan, costs exceeding the maximum for the current plan year cannot be reimbursed in subsequent periods. In addition, under the Fund’s Class C and R compensation distribution plans, the Fund pays Distributors for costs incurred in connection with the servicing, sale and distribution of the Fund’s shares up to the maximum annual plan rate for each class. The plan year, for purposes of monitoring compliance with the maximum annual plan rates, is February 1 through January 31.
| franklintempleton.com | Semiannual Report | 31 | ||||
FRANKLIN MUTUAL EUROPEAN FUND
NOTES TO FINANCIAL STATEMENTS (UNAUDITED)
3. Transactions with Affiliates (continued)
c. Distribution Fees (continued)
The maximum annual plan rates, based on the average daily net assets, for each class, are as follows:
Class A | 0.35% | |||
Class C | 1.00% | |||
Class R | 0.50% |
The Board has set the current rate at 0.25% per year for Class A shares until further notice and approval by the Board.
d. Sales Charges/Underwriting Agreements
Front-end sales charges and contingent deferred sales charges (CDSC) do not represent expenses of the Fund. These charges are deducted from the proceeds of sales of Fund shares prior to investment or from redemption proceeds prior to remittance, as applicable. Distributors has advised the Fund of the following commission transactions related to the sales and redemptions of the Fund’s shares for the period:
Sales charges retained net of commissions paid to unaffiliated brokers/dealers | $ | 72,815 | ||
CDSC retained | $ | 84,970 |
e. Transfer Agent Fees
Each class of shares, except for Class R6, pays transfer agent fees to Investor Services for its performance of shareholder servicing obligations and reimburses Investor Services for out of pocket expenses incurred, including shareholder servicing fees paid to third parties. These fees are allocated daily based upon their relative proportion of such classes’ aggregate net assets. Class R6 pays Investor Services transfer agent fees specific to that class.
For the period ended June 30, 2017, the Fund paid transfer agent fees of $1,867,872, of which $923,671 was retained by Investor Services.
f. Other Affiliated Transactions
At June 30, 2017, one or more of the funds in Franklin Fund Allocator Series owned 11.0% of the Fund’s outstanding shares.
4. Expense Offset Arrangement
The Fund has entered into an arrangement with its custodian whereby credits realized as a result of uninvested cash balances are used to reduce a portion of the Fund’s custodian expenses. During the period ended June 30, 2017, the custodian fees were reduced as noted in the Statement of Operations.
5. Independent Trustees’ Retirement Plan
On January 1, 1993, the Trust adopted an Independent Trustees’ Retirement Plan (Plan). The Plan is an unfunded defined benefit plan that provides benefit payments to Trustees whose length of service and retirement age meets the eligibility requirements of the Plan. Benefits under the Plan are based on years of service and fees paid to each trustee at the time of retirement. Effective in December 1996, the Plan was closed to new participants.
| 32 | Semiannual Report | franklintempleton.com | ||
FRANKLIN MUTUAL EUROPEAN FUND
NOTES TO FINANCIAL STATEMENTS (UNAUDITED)
During the period ended June 30, 2017, the Fund’s projected benefit obligation and benefit payments under the Plan were as follows:
aProjected benefit obligation at June 30, 2017 | $ | 94,726 | ||
bIncrease in projected benefit obligation | $ | 787 | ||
Benefit payments made to retired trustees | $ | (1,226 | ) |
aThe projected benefit obligation is included in trustees’ fees and expenses in the Statement of Assets and Liabilities.
bThe increase in projected benefit obligation is included in trustees’ fees and expenses in the Statement of Operations.
6. Income Taxes
For tax purposes, capital losses may be carried over to offset future capital gains, if any.
At December 31, 2016, the capital loss carryforwards were as follows:
| Capital loss carryforwards: | ||||
Short term | $ 8,537,172 | |||
Long term | 130,183,125 | |||
|
| |||
Total capital loss carryforwards | $138,720,297 | |||
|
|
At June 30, 2017, the cost of investments and net unrealized appreciation (depreciation) for income tax purposes were as follows:
Cost of investments | $2,470,998,735 | |||
|
| |||
Unrealized appreciation | $ 277,672,328 | |||
Unrealized depreciation | (112,649,417 | ) | ||
|
| |||
Net unrealized appreciation (depreciation) | $ 165,022,911 | |||
|
| |||
Differences between income and/or capital gains as determined on a book basis and a tax basis are primarily due to differing treatment of foreign currency transactions.
7. Investment Transactions
Purchases and sales of investments (excluding short term securities) for the period ended June 30, 2017, aggregated $239,175,678 and $306,867,571, respectively.
8. Concentration of Risk
Investing in foreign securities may include certain risks and considerations not typically associated with investing in U.S. securities, such as fluctuating currency values and changing local and regional economic, political and social conditions, which may result in greater market volatility. In addition, certain foreign securities may not be as liquid as U.S. securities.
9. Restricted Securities
The Fund invests in securities that are restricted under the Securities Act of 1933 (1933 Act) or which are subject to legal, contractual, or other agreed upon restrictions on resale. Restricted securities are often purchased in private placement transactions, and cannot be sold without prior registration unless the sale is pursuant to an exemption under the 1933 Act. Disposal of these securities may require greater effort and expense, and prompt sale at an acceptable price may be difficult. The Fund may have registration rights for restricted securities. The issuer generally incurs all registration costs.
| franklintempleton.com | Semiannual Report | 33 | ||||
FRANKLIN MUTUAL EUROPEAN FUND
NOTES TO FINANCIAL STATEMENTS (UNAUDITED)
9. Restricted Securities (continued)
At June 30, 2017, investments in restricted securities, excluding certain securities exempt from registration under the 1933 Act
deemed to be liquid, were as follows:
| Shares | Issuer | Acquisition Date | Cost | Value | ||||||||||||
| 16,127,149 | Euro Wagon LP (Value is —% of Net Assets) | 12/08/05 - 1/02/08 | $ | 6,282,509 | $ | — | ||||||||||
|
| |||||||||||||||
10. Other Derivative Information
At June 30, 2017, the Fund’s investments in derivative contracts are reflected in the Statement of Assets and Liabilities as follows:
| Asset Derivatives | Liability Derivatives | |||||||||||
| Derivative Contracts Not Accounted for as Hedging Instruments | Statement of Assets and Liabilities Location | Fair Value | Statement of Assets and Liabilities Location | Fair Value | ||||||||
Foreign exchange contracts | Variation margin | | $13,246,105 | a | ||||||||
Unrealized appreciation on OTC forward exchange contracts | $1,072,623 | Unrealized depreciation on OTC forward exchange contracts | 66,303,688 | |||||||||
|
|
|
| |||||||||
Totals | $1,072,623 | $79,549,793 | ||||||||||
|
|
|
| |||||||||
aThis amount reflects the cumulative appreciation (depreciation) of futures contracts as reported in the Statement of Investments. Only the variation margin receivable/ payable at period end is separately reported within the Statement of Assets and Liabilities. Prior variation margin movements were recorded to cash upon receipt or payment.
For the period ended June 30, 2017, the effect of derivative contracts in the Fund’s Statement of Operations was as follows:
| Derivative Contracts Not Accounted for as Hedging Instruments | Statement of Operations Location | Net Realized Gain (Loss) for the Period | Statement of Operations Location | Net Change in Unrealized Appreciation (Depreciation) for the Period | ||||||||
Net realized gain (loss) from: | Net change in unrealized appreciation (depreciation) on: | |||||||||||
Foreign exchange contracts | Foreign currency transactions | | $24,586,418 | a | Translation of other assets and liabilities denominated in foreign currencies | | $(114,586,273) | a | ||||
Futures contracts | (25,859,248) | Futures contracts | (19,395,956) | |||||||||
|
|
|
| |||||||||
Totals | $(1,272,830) | $(133,982,229) | ||||||||||
|
|
|
| |||||||||
aForward exchange contracts are included in net realized gain (loss) from foreign currency transactions and net change in unrealized appreciation (depreciation) on translation of other assets and liabilities denominated in foreign currencies in the Statement of Operations.
For the period ended June 30, 2017, the average month end notional amount of futures contracts represented $688,078,209. The average month end contract value of forward exchange contracts was $1,322,383,953.
At June 30, 2017, the Fund’s OTC derivative assets and liabilities are as follows:
| Gross Amounts of Assets and Liabilities Presented in the Statement of Assets and Liabilities | ||||||||
| Assetsa | Liabilitiesa | |||||||
| Derivatives | ||||||||
Forward exchange contracts | $1,072,623 | $66,303,688 | ||||||
|
| |||||||
aAbsent an event of default or early termination, OTC derivative assets and liabilities are presented gross and not offset in the Statement of Assets and Liabilities.
| 34 | Semiannual Report | franklintempleton.com | ||
FRANKLIN MUTUAL EUROPEAN FUND
NOTES TO FINANCIAL STATEMENTS (UNAUDITED)
At June 30, 2017, the Fund’s OTC derivative assets, which may be offset against the Fund’s OTC derivative liabilities and collateral received from the counterparty, are as follows:
| Amounts Not Offset in the Statement of Assets and Liabilities | ||||||||||||||||||||
| Gross Amounts of Assets Presented in the Statement of Assets and Liabilities | Financial Instruments Available for Offset | Financial Instruments Collateral Received | Cash Collateral Received | Net Amount (Not less than zero) | ||||||||||||||||
| Counterparty | ||||||||||||||||||||
BOFA | $ 280,475 | $ (280,475 | ) | $ — | $ — | $ — | ||||||||||||||
BONY | 58,940 | (58,940 | ) | — | — | — | ||||||||||||||
FBCO | — | — | — | — | — | |||||||||||||||
HSBK | 129,932 | (129,932 | ) | — | — | — | ||||||||||||||
SSBT | 427,159 | (427,159 | ) | — | — | — | ||||||||||||||
UBSW | 176,117 | (176,117 | ) | — | — | — | ||||||||||||||
|
| |||||||||||||||||||
Total | $1,072,623 | $(1,072,623 | ) | $ — | $ — | $ — | ||||||||||||||
|
| |||||||||||||||||||
At June 30, 2017, the Fund’s OTC derivative liabilities, which may be offset against the Fund’s OTC derivative assets and collateral pledged to the counterparty, are as follows:
| Amounts Not Offset in the Statement of Assets and Liabilities | ||||||||||||||||||||
| Gross Amounts of Liabilities Presented in the Statement of Assets and Liabilities | Financial Instruments Available for Offset | Financial Instruments Collateral Pledgedb,c | Cash Collateral Pledged | Net Amount (Not less than zero) | ||||||||||||||||
| Counterparty | ||||||||||||||||||||
BOFA | $15,490,641 | $ (280,475 | ) | $(15,210,166 | ) | $ — | $ — | |||||||||||||
BONY | 1,447,375 | (58,940 | ) | (838,834 | ) | — | 549,601 | |||||||||||||
FBCO | 2,734,234 | — | (2,734,234 | ) | — | — | ||||||||||||||
HSBK. | 18,927,904 | (129,932 | ) | (18,105,181 | ) | — | 692,791 | |||||||||||||
SSBT | 10,806,552 | (427,159 | ) | (8,973,036 | ) | — | 1,406,357 | |||||||||||||
UBSW | 16,896,982 | (176,117 | ) | (16,720,865 | ) | — | — | |||||||||||||
|
| |||||||||||||||||||
Total | $66,303,688 | $(1,072,623 | ) | $(62,582,316 | ) | $ — | $2,648,749 | |||||||||||||
|
| |||||||||||||||||||
bIn some instances, the collateral amounts disclosed in the table above were adjusted due to the requirement to limit collateral amounts to avoid the effect of overcollateralization. Actual collateral received and/or pledged may be more than the amounts disclosed herein. cSee the accompanying Statement of Investments for securities pledged as collateral for derivatives.
See Note 1(c) regarding derivative financial instruments.
See Abbreviations on page 38.
| franklintempleton.com | Semiannual Report | 35 | ||||
FRANKLIN MUTUAL EUROPEAN FUND
NOTES TO FINANCIAL STATEMENTS (UNAUDITED)
11. Holdings of 5% Voting Securities of Portfolio Companies
The 1940 Act defines “affiliated companies” to include investments in portfolio companies in which a fund owns 5% or more of the outstanding voting securities. During the period ended June 30, 2017, investments in “affiliated companies” were as follows:
| Name of Issuer | Number of Shares Held at Beginning of Period | Gross Additions | Gross Reductions | Number of Shares Held at End of Period | Value at End of Period | Investment Income | Realized Gain (Loss) | |||||||||||||||||||||
| Controlled Affiliatesa | ||||||||||||||||||||||||||||
Euro WagonLP (Value is —% of Net Assets) | 16,127,149 | — | — | 16,127,149 | $ — | $ — | $ — | |||||||||||||||||||||
aIssuer in which the Fund owns 25% or more of the outstanding voting securities.
12. Credit Facility
The Fund, together with other U.S. registered and foreign investment funds (collectively, Borrowers), managed by Franklin Templeton Investments, are borrowers in a joint syndicated senior unsecured credit facility totaling $2 billion (Global Credit Facility) which matures on February 9, 2018. This Global Credit Facility provides a source of funds to the Borrowers for temporary and emergency purposes, including the ability to meet future unanticipated or unusually large redemption requests.
Under the terms of the Global Credit Facility, the Fund shall, in addition to interest charged on any borrowings made by the Fund and other costs incurred by the Fund, pay its share of fees and expenses incurred in connection with the implementation and maintenance of the Global Credit Facility, based upon its relative share of the aggregate net assets of all of the Borrowers, including an annual commitment fee of 0.15% based upon the unused portion of the Global Credit Facility. These fees are reflected in other expenses in the Statement of Operations. During the period ended June 30, 2017, the Fund did not use the Global Credit Facility.
13. Fair Value Measurements
The Fund follows a fair value hierarchy that distinguishes between market data obtained from independent sources (observable inputs) and the Fund’s own market assumptions (unobservable inputs). These inputs are used in determining the value of the Fund’s financial instruments and are summarized in the following fair value hierarchy:
| • | Level 1 – quoted prices in active markets for identical financial instruments |
| • | Level 2 – other significant observable inputs (including quoted prices for similar financial instruments, interest rates, prepayment speed, credit risk, etc.) |
| • | Level 3 – significant unobservable inputs (including the Fund’s own assumptions in determining the fair value of financial instruments) |
The input levels are not necessarily an indication of the risk or liquidity associated with financial instruments at that level.
For movements between the levels within the fair value hierarchy, the Fund has adopted a policy of recognizing the transfers as of the date of the underlying event which caused the movement.
| 36 | Semiannual Report | franklintempleton.com | ||
FRANKLIN MUTUAL EUROPEAN FUND
NOTES TO FINANCIAL STATEMENTS (UNAUDITED)
A summary of inputs used as of June 30, 2017, in valuing the Fund’s assets and liabilities carried at fair value, is as follows:
| Level 1 | Level 2 | Level 3 | Total | |||||||||||||
| Assets: | ||||||||||||||||
Investments in Securities: | ||||||||||||||||
Equity Investments:a | ||||||||||||||||
Machinery | $ | 52,824,354 | $ | 9,439,286 | $ | — | $ | 62,263,640 | ||||||||
All Other Equity Investmentsb | 2,294,991,640 | — | — | c | 2,294,991,640 | |||||||||||
Short Term Investments | 230,466,669 | 48,299,697 | — | 278,766,366 | ||||||||||||
|
| |||||||||||||||
Total Investments in Securities | $ | 2,578,282,663 | $ | 57,738,983 | $ | — | $ | 2,636,021,646 | ||||||||
|
| |||||||||||||||
Other Financial Instruments: | ||||||||||||||||
Forward Exchange Contracts | $ | — | $ | 1,072,623 | $ | — | $ | 1,072,623 | ||||||||
|
| |||||||||||||||
| Liabilities: | ||||||||||||||||
Other Financial Instruments: | ||||||||||||||||
Futures Contracts | $ | 13,246,105 | $ | — | $ | — | $ | 13,246,105 | ||||||||
Forward Exchange Contracts | — | 66,303,688 | — | 66,303,688 | ||||||||||||
|
| |||||||||||||||
Total Other Financial Instruments | $ | 13,246,105 | $ | 66,303,688 | $ | — | $ | 79,549,793 | ||||||||
|
| |||||||||||||||
aIncludes common and preferred stocks.
bFor detailed categories, see the accompanying Statement of Investments.
cIncludes securities determined to have no value at June 30, 2017.
A reconciliation of assets in which Level 3 inputs are used in determining fair value is presented when there are significant Level 3 financial instruments at the end of the period.
14. New Accounting Pronouncements
In March 2017, the Financial Accounting Standards Board issued Accounting Standards Update (ASU) No. 2017-08, Receivables—
Nonrefundable Fees and Other Costs (Subtopic 310-20): Premium Amortization on Purchased Callable Debt Securities. The amendments in the ASU shorten the amortization period for certain callable debt securities, held at a premium, to be amortized to the earliest call date. The ASU does not require an accounting change for securities held at a discount; which continues to be amortized to maturity. The ASU is effective for fiscal years and interim periods within those fiscal years beginning after December 15, 2018. Management is currently evaluating the impact, if any, of applying this provision.
15. Investment Company Reporting Modernization
In October 2016, the U.S. Securities and Exchange Commission adopted new rules and amended existing rules (together, final rules) intended to modernize the reporting and disclosure of information by registered investment companies. In part, the final rules amend Regulation S-X and require standardized, enhanced disclosures about derivatives in investment company financial statements, as well as other amendments. The compliance date for the amendments to Regulation S-X is August 1, 2017. Management has reviewed the requirements and believes the adoption of the amendments to Regulation S-X will not have a material impact on the Fund’s financial statements and related disclosures.
16. Subsequent Events
The Fund has evaluated subsequent events through the issuance of the financial statements and determined that no events have occurred that require disclosure.
| franklintempleton.com | Semiannual Report | 37 | ||||
FRANKLIN MUTUAL EUROPEAN FUND
NOTES TO FINANCIAL STATEMENTS (UNAUDITED)
Abbreviations
| Counterparty | Currency | Selected Portfolio | ||||||||
| BOFA | Bank of America N.A. | EUR | Euro | ADR | American Depositary Receipt | |||||
| BONY | The Bank of New York Mellon Corp. | GBP | British Pound | FHLB | Federal Home Loan Bank | |||||
| FBCO | Credit Suisse International | USD | United States Dollar | |||||||
| HSBK | HSBC Bank PLC | |||||||||
| SSBT | State Street Bank and Trust Co., N.A. | |||||||||
| UBSW | UBS AG | |||||||||
| 38 | Semiannual Report | franklintempleton.com | ||
FRANKLIN MUTUAL SERIES FUNDS
FRANKLIN MUTUAL EUROPEAN FUND
Board Approval of Investment Management Agreements
FRANKLIN MUTUAL SERIES FUNDS
Franklin Mutual European Fund
(“Fund”)
The Board of Trustees (Board), including a majority of trustees that are not “interested persons” as such term is defined in section 2(a)(19) of the Investment Company Act of 1940 (hereinafter referred to as “independent trustees”), at an in-person meeting held on May 22, 2017, unanimously approved the renewal of the Fund’s investment management agreement. Prior to a meeting of all of the trustees for the purpose of considering such renewal, the independent trustees participated in two other meetings held in connection with the renewal process. Throughout the process, the independent trustees received assistance and advice from and met separately with independent counsel. The independent trustees met with and interviewed officers of the investment manager (including portfolio managers), the transfer agent and shareholder services group and the distributor. In approving the renewal of the investment management agreement for the Fund, the Board, including the independent trustees, determined that the investment management fee structure was fair and reasonable and that continuance of the agreement was in the best interests of the Fund and its shareholders.
In reaching their decision on the investment management agreement, the trustees took into account information furnished throughout the year at regular Board meetings, as well as information specifically requested and furnished for the renewal process, which culminated in the meetings referred to above for the specific purpose of considering such agreement. Information furnished throughout the year included, among others, reports on the Fund’s investment performance, expenses, portfolio composition, portfolio brokerage execution, client commission arrangements, derivatives, securities lending, asset segregation, portfolio turnover, Rule 12b-1 plan, distribution, shareholder servicing, legal and compliance matters, pricing of securities, sales and redemptions, and marketing support payments made to financial intermediaries, as well as a third-party survey of transfer agent fees charged to funds within the Franklin Templeton Investments (FTI) complex in comparison with those charged to other fund complexes deemed comparable. Also, related financial statements and other information about the scope and quality of services provided by the investment manager and its affiliates and enhancements to such services over the past year were
provided. In addition, the trustees received periodic reports throughout the year and during the renewal process relating to compliance with the Fund’s investment policies and restrictions. During the renewal process, the independent trustees considered the investment manager’s methods of operation within the Franklin Templeton group and its activities on behalf of other clients. The Board also noted that it received an annual report on all payments made by FTI or the Fund to financial intermediaries engaged in the sale of Fund shares, as well as a memorandum relating to third-party servicing arrangements in response to a Guidance Update from the U.S. Securities and Exchange Commission (SEC) relating to mutual fund distribution and sub-accounting fees.
The information obtained by the trustees during the renewal process also included a special report prepared by Broadridge Financial Solutions, Inc., an independent third-party analyst that utilizes data from Lipper, Inc. (“Lipper”), comparing the Fund’s investment performance and expenses with those of other mutual funds deemed comparable to the Fund as selected by Lipper (Broadridge Section 15(c) Report). The trustees reviewed the Broadridge Section 15(c) Report and its usefulness in the renewal process with respect to matters such as comparative fees, expenses, expense ratios, performance and volatility. They concluded that the report continues to be a reliable resource in the performance of their duties.
In addition, the trustees received a Profitability Study (Profitability Study) prepared by management discussing the profitability to FTI from its overall U.S. fund operations, as well as on an individual fund-by-fund basis. Over the past year, the Board and counsel to the independent trustees continued to receive reports on management’s handling of recent regulatory inquiries and pending legal actions against the investment manager and its affiliates. The independent trustees were satisfied with the actions taken to date by management in response to such regulatory and legal matters.
Particular attention was given to management’s diligent risk management program, including continual monitoring and management of cybersecurity, liquidity and counterparty credit risk, and attention given to derivatives and other complex instruments that are held and expected to be held by the Fund and how such instruments are used to carry out the Fund’s investment goal(s). The Board also took into account, among other things, management’s efforts in establishing a global credit facility for the benefit of the Fund and other accounts managed by FTI to provide a source of cash for temporary and emergency purposes or to meet unusual redemption requests as
| franklintempleton.com | Semiannual Report | 39 | ||||
FRANKLIN MUTUAL SERIES FUNDS
FRANKLIN MUTUAL EUROPEAN FUND
SHAREHOLDER INFORMATION
well as the strong financial position of the investment manager’s parent company and its commitment to the mutual fund business. In addition, the Board received updates from management on the SEC’s progress in implementing the rule-making requirements established by the Dodd-Frank Wall Street Reform and Consumer Protection Act (Dodd-Frank Act), which was enacted July 21, 2010, and the investment manager’s compliance with rules and regulations already promulgated by the SEC under such act.
In addition to the above and other matters considered by the trustees throughout the course of the year, the following discussion relates to certain primary factors relevant to the Board’s decision. This discussion of the information and factors considered by the Board (including the information and factors discussed above) is not intended to be exhaustive, but rather summarizes certain factors considered by the Board. In view of the wide variety of factors considered, the Board did not, unless otherwise noted, find it practicable to quantify or otherwise assign relative weights to the foregoing factors. In addition, individual trustees may have assigned different weights to various factors.
NATURE, EXTENT AND QUALITY OF SERVICES. The trustees reviewed the nature, extent and quality of the services provided, and to be provided, by the investment manager. The trustees cited the investment manager’s ability to implement the Fund’s disciplined value investment approach and its long-term relationship with the Fund as reasons that shareholders choose to invest, and remain invested, in the Fund. The trustees reviewed the Fund’s portfolio management team, including its performance, staffing, skills and compensation program. With respect to portfolio manager compensation, management assured the trustees that the Fund’s long-term performance is a significant component of incentive-based compensation and noted that a portion of a portfolio manager’s incentive-based compensation is paid in shares of pre-designated funds from the portfolio manager’s fund management area. The trustees noted that the portfolio manager compensation program aligned the interests of the portfolio managers with that of shareholders of the Fund. The trustees discussed with management various other products, portfolios and entities that are advised by the investment manager and the allocation of assets and expenses among and within them, as well as their relative fees and reasons for differences with respect thereto and any potential conflicts. During regular Board meetings and the aforementioned meetings of the independent trustees, the trustees received reports and presentations on the investment manager’s best execution trading policies. The trustees considered
periodic reports provided to them showing that the investment manager complied with the investment policies and restrictions of the Fund as well as other reports periodically furnished to the Board covering matters such as the compliance of portfolio managers and other management personnel with the code of ethics covering the investment management personnel, the adherence to fair value pricing procedures established by the Board and the accuracy of net asset value calculations. The Board noted the extent of the benefits provided to Fund shareholders from being part of the Franklin Templeton group of funds, including the right to exchange investments between funds (same class) without a sales charge, the ability to reinvest Fund dividends into other funds and the right to combine holdings of other funds to obtain reduced sales charges. The Board considered the investment manager’s significant efforts in developing and implementing compliance procedures established in accordance with SEC and other requirements.
The Board considered the nature, extent and quality of the services to be provided under the Fund’s other service agreements to determine that, on an overall basis, Fund shareholders were well served. In this connection, the Board also took into account transfer agent and shareholder services provided to Fund shareholders by an affiliate of the investment manager, noting continuing expenditures by management to increase and improve the scope of such services and favorable periodic reports on shareholder services conducted by independent third parties. While such considerations directly affected the trustees’ decision in renewing the Fund’s transfer agent and shareholder services agreement, the Board also considered these commitments as incidental benefits to Fund shareholders deriving from the investment management relationship.
Based on their review, the trustees were satisfied with the nature and quality of the overall services provided, and to be provided, by the investment manager and its affiliates to the Fund and its shareholders and were confident in the abilities of the management team to continue the disciplined value investment approach of the Fund and to provide quality services to the Fund and its shareholders.
INVESTMENT PERFORMANCE. The trustees reviewed and placed significant emphasis on the investment performance of the Fund over the one-, three-, five- and 10-year periods ended December 31, 2016. They considered the history of successful performance of the Fund relative to various benchmarks. As part of their review, they inquired of management regarding benchmarks, style drift and restrictions
| 40 | Semiannual Report | franklintempleton.com | ||
FRANKLIN MUTUAL SERIES FUNDS
FRANKLIN MUTUAL EUROPEAN FUND
SHAREHOLDER INFORMATION
on permitted investments. Consideration was also given to performance in the context of available levels of cash during the periods.
The trustees had meetings during the year, including the meetings referred to above held in connection with the renewal process, with the Fund’s portfolio managers to discuss performance and the management of the Fund. In addition, particular attention in assessing performance was given to the Broadridge Section 15(c) Report. That report showed the investment performance of the Fund (Class A shares) in comparison to other funds determined comparable by Lipper.
The comparable funds to the Fund, as chosen by Lipper, included all retail and institutional European region funds. The Fund had total returns in the second-best performing quintile for the one-year period ended December 31, 2016, and had annualized total returns for the three- and five-year periods also in the second-best performing quintile. The trustees noted that the Fund’s total return on an annualized basis for the 10-year period ended December 31, 2016 was in the best performing quintile. The trustees were satisfied with such comparative performance.
The trustees also compared Fund performance to other industry benchmarks, including measures of risk-adjusted performance of a fund, as part of their evaluation of investment performance. The trustees concluded that the Fund had continued to perform well in comparison to its various benchmarks and in the context of the Fund’s goals.
COMPARATIVE EXPENSES AND MANAGEMENT PROFITABILITY. The trustees considered the cost of the services provided and to be provided and the profits realized by the investment manager and its affiliates from their respective relationships with the Fund. As part of the renewal process, the trustees explored with management the trends in expense ratios over the past three fiscal years and the reasons for any increases in the Fund’s expense ratios (or components thereof). In considering the appropriateness of the management fee and other expenses charged to the Fund, the Board took into account various factors including investment performance and matters relating to Fund operations, including, but not limited to, the quality and experience of its portfolio managers and research staff. Consideration was also given to a comparative analysis in the Broadridge Section 15(c) Report of the investment management fee and total expense ratio of the Fund in comparison with those of a group of other funds selected by Lipper as its appropriate Lipper expense group. Lipper expense
data is based upon information taken from the Fund’s most
recent annual report, which reflects historical asset levels that may be quite different from those currently existing, particularly in a period of market volatility. While recognizing such inherent limitation and the fact that expense ratios generally increase as assets decline and decrease as assets grow, the Board believed the independent analysis conducted by Lipper to be an appropriate measure of comparative expenses.
In reviewing comparative costs, emphasis was given to the Fund’s contractual management fee in comparison with the contractual management fee that would have been charged by other funds within its Lipper expense group assuming they were similar in size to the Fund, as well as the actual total expenses of the Fund in comparison with those of its Lipper expense group. The Lipper contractual management fee analysis includes administrative charges as being part of the management fee, and total expenses, for comparative consistency, are shown by Lipper for Fund Class A shares.
The Fund’s contractual management fee rate was in the second-most expensive quintile of its Lipper expense group and its total expenses were in the second-least expensive quintile of such group. The Board was satisfied with such comparative fees and expenses.
The trustees also reviewed the Profitability Study addressing profitability of Franklin Resources, Inc., from its overall U.S. fund business, as well as profitability to the Fund’s investment manager and its affiliates, from providing investment management and other services to the Fund during the 12-month period ended September 30, 2016, the most recent fiscal year-end of Franklin Resources, Inc. The trustees reviewed the basis on which such reports are prepared and the cost allocation methodology utilized in the Profitability Study, it being recognized that allocation methodologies may each be reasonable while producing different results. In this respect, the Board noted that the reasonableness of the cost allocation methodologies was reviewed by independent accountants on an every other year basis.
The independent trustees met with management to discuss the Profitability Study. This included, among other things, a comparison of investment management income with investment management expenses of the Fund; comparison of underwriting revenues and expenses; the relative relationship of investment management and underwriting expenses; shareholder servicing profitability; economies of scale; and the relative contribution of the Fund to the profitability of the investment manager and its parent. In discussing the Profitability Study with the Board,
| franklintempleton.com | Semiannual Report | 41 | ||||
FRANKLIN MUTUAL SERIES FUNDS
FRANKLIN MUTUAL EUROPEAN FUND
SHAREHOLDER INFORMATION
the investment manager stated its belief that the costs incurred in establishing the infrastructure necessary to operate the type of mutual fund operations conducted by it and its affiliates may not be fully reflected in the expenses allocated to the Fund in determining its profitability.
The Board also took into account management’s expenditures in improving shareholder services provided to the Fund, as well as the need to meet additional regulatory and compliance requirements resulting from the Sarbanes-Oxley Act, the Dodd-Frank Act and recent SEC and other regulatory requirements. The trustees also considered the extent to which the investment manager may derive ancillary benefits from Fund operations, including those derived from economies of scale, discussed below, the allocation of Fund brokerage and the use of commission dollars to pay for research and other similar services.
Based upon their consideration of all these factors, the trustees determined that the level of profits realized by the investment manager and its affiliates in providing services to the Fund was not excessive in view of the nature, quality and extent of services provided.
ECONOMIES OF SCALE. The Board considered economies of scale realized by the investment manager and its affiliates as the Fund grows larger and the extent to which they are shared with Fund shareholders, as for example, in the level of the investment management fee charged, in the quality and efficiency of services rendered and in increased capital commitments benefiting the Fund directly or indirectly. While recognizing that any precise determination is inherently subjective, the trustees noted that, based upon the Profitability Study, as some funds increase in size, at some point economies of scale may result in the investment manager realizing a larger profit margin on investment management services provided to such a fund. The trustees also noted that benefits of economies of scale will be shared with Fund shareholders due to the decline in the effective investment management fee rate as breakpoints are achieved by the Fund.
The trustees noted that breakpoints had been instituted as part of the Fund’s investment management fee and that the Board regularly evaluates whether additional breakpoints are appropriate. The trustees assessed the savings to shareholders resulting from such breakpoints and believed they were, and continue to be, appropriate and they agreed to continue to monitor the appropriateness of the breakpoints. The trustees also considered the effects an increase in assets under management would have on the investment management fee
and expense ratio of the Fund. To the extent further economies of scale may be realized by the investment manager and its affiliates, the Board believed the investment management and administrative fees provide a sharing of benefits with the Fund and its shareholders.
Proxy Voting Policies and Procedures
The Fund’s investment manager has established Proxy Voting Policies and Procedures (Policies) that the Fund uses to determine how to vote proxies relating to portfolio securities. Shareholders may view the Fund’s complete Policies online at franklintempleton.com. Alternatively, shareholders may request copies of the Policies free of charge by calling the Proxy Group collect at (954) 527-7678 or by sending a written request to: Franklin Templeton Companies, LLC, 300 S.E. 2nd Street, Fort Lauderdale, FL 33301, Attention: Proxy Group. Copies of the Fund’s proxy voting records are also made available online at franklintempleton.com and posted on the U.S. Securities and Exchange Commission’s website at sec.gov and reflect the most recent 12-month period ended June 30.
Quarterly Statement of Investments
The Trust, on behalf of the Fund, files a complete statement of investments with the U.S. Securities and Exchange Commission for the first and third quarters for each fiscal year on Form N-Q. Shareholders may view the filed Form N-Q by visiting the Commission’s website at sec.gov. The filed form may also be viewed and copied at the Commission’s Public Reference Room in Washington, DC. Information regarding the operations of the Public Reference Room may be obtained by calling (800) SEC-0330.
| 42 | Semiannual Report | franklintempleton.com | ||
This page intentionally left blank.
This page intentionally left blank.

Semiannual Report and Shareholder Letter
Franklin Mutual European Fund
Investment Manager
Franklin Mutual Advisers, LLC
Distributor
Franklin Templeton Distributors, Inc.
(800) DIAL BEN® / 342-5236
franklintempleton.com
Shareholder Services
(800) 632-2301 - (Class A, C, R & R6)
(800) 448-FUND - (Class Z)
Authorized for distribution only when accompanied or preceded by a summary prospectus and/or prospectus. Investors should carefully consider a fund’s investment goals, risks, charges and expenses before investing. A prospectus contains this and other information; please read it carefully before investing.
To help ensure we provide you with quality service, all calls to and from our service areas are monitored and/or recorded.
| © 2017 Franklin Templeton Investments. All rights reserved. | 478 S 08/17 |
| Semiannual Report and Shareholder Letter
June 30, 2017 |
Franklin Mutual Quest Fund
A SERIES OF FRANKLIN MUTUAL SERIES FUNDS
Sign up for electronic delivery at franklintempleton.com/edelivery
Franklin Templeton Investments
Gain From Our Perspective®
At Franklin Templeton Investments, we’re dedicated to one goal: delivering exceptional asset management for our clients. By bringing together multiple, world-class investment teams in a single firm, we’re able to offer specialized expertise across styles and asset classes, all supported by the strength and resources of one of the world’s largest asset managers. This has helped us to become a trusted partner to individual and institutional investors across the globe.
Dear Franklin Mutual Quest Fund Shareholder:
The first half of 2017 saw most equity markets continue their long move upwards. The Standard & Poor’s 500® Index (S&P 500®) posted a +9.34% total return and the MSCI World Index delivered a +11.02% total return.1
The political uncertainty and unpredictability of recent years has continued in 2017. In the U.S., President Trump has continued his unconventional governance approach, while Congress has remained relentlessly partisan, leading to significant uncertainty about policies and legislation. The financial markets expected “business friendly” moves, but specific legislative progress on issues such as health care, tax reform and infrastructure did not come to fruition. In the U.K., a surprise election was called in April when the Conservative Party held a huge polling lead, but at the June election the Tories lost their majority in Parliament. Recent elections in France went according to expectations, lending some much appreciated stability there.
Despite these generally unsettling events, the global economy continued its slow expansion since the Great Recession. Unemployment also continued to decline in most developed markets. Wage growth showed signs of acceleration and in the U.S. interest rates began to rise, perhaps signaling the first steps toward monetary normalization.
Equity markets appreciated as economic fundamentals improved. Valuation is, of course, a critical factor in our analysis and we always ask ourselves if current and potential investments represent an attractive balance of risk and reward. As some equity markets reached all-time highs, we maintained our focus on individual investments and the prospects for each
business in the context of its valuation and the backdrop of potential political and economic risks.
In many equity markets, growth stocks outperformed value stocks during the period. For example, the S&P 500 Growth Index returned +13.33%, while the S&P 500 Value Index returned +4.85%.1 The difference in performance was driven in part by a significant rally in Internet and software stocks, which dominated the S&P 500 Growth Index. We do not know how long these trends will continue, but historically, periods of strong performance by growth stocks have eventually been followed by relatively weaker performance. In addition, the S&P 500 Value Index has components that we believe are facing disruption from new technology (e.g., the rapid market share shift to online retailing from traditional bricks and mortar dominated retailers that are often labeled as value stocks). Exacerbating the disruption is the reality that many new technology companies are able to innovate without the need to show immediate profits.
Amid dynamic markets and evolving economic conditions, we believe active, professional investment management serves investors well. We also recognize the important role of financial advisors in today’s markets and encourage investors to continue to seek their advice. Amid changing markets and economic conditions, we are confident investors with a well-diversified portfolio and a patient, long-term outlook will be well positioned for the years ahead.
On the following pages, the Fund’s portfolio management team discusses the economic environment during the first six months of 2017 and reviews investment decisions made during this
1. Source: Morningstar.
See www.franklintempletondatasources.com for additional data provider information.
| Not FDIC Insured | | | May Lose Value | | | No Bank Guarantee |
| franklintempleton.com | Not part of the semiannual report | 1 | ||||
period. Please remember all securities markets fluctuate, as do mutual fund share prices.
We thank you for investing with Franklin Templeton, welcome your questions and comments, and look forward to continuing to serve your investment needs in the years ahead.
Sincerely,

Peter A. Langerman
Chairman, President and Chief Executive Officer
Franklin Mutual Advisers, LLC
This letter reflects our analysis and opinions as of June 30, 2017, unless otherwise indicated. The information is not a complete analysis of every aspect of any market, country, industry, security or fund. Statements of fact are from sources considered reliable.
Semiannual Report
Visit franklintempleton.com for fund updates, to access your account, or to find helpful financial planning tools.
| 2 | Not part of the semiannual report | franklintempleton.com | ||||
Semiannual Report
This semiannual report for Franklin Mutual Quest Fund covers the period ended June 30, 2017.
Your Fund’s Goal and Main Investments
The Fund seeks capital appreciation, which may occasionally be short term, with income as a secondary goal. Its strategy is focused mainly on what the investment manager believes are undervalued mid- to large cap equity securities with a significant portion of its assets in foreign securities and, to a lesser extent, in the securities of distressed companies and merger arbitrage securities. The Fund may invest a substantial portion, potentially up to 100% of its assets in foreign securities, which may include sovereign debt and participations in foreign government debt.
Performance Overview
The Fund’s Class Z shares delivered a +2.90% cumulative total return for the six months ended June 30, 2017. In comparison, the Fund’s benchmark, the MSCI World Index, which tracks stock performance in global developed markets, generated a total return of +11.02%.1 Also for comparison, the Fund’s secondary benchmark, the Bloomberg Barclays U.S. Corporate High Yield Index, which measures the U.S. corporate market of non-investment grade, fixed-rate corporate bonds, defined as the middle or lower ratings of Moody’s, Fitch and Standard & Poor’s (Ba1/BB+/BB+), posted a +4.93% total return.1 You can find more of the Fund’s performance data in the Performance Summary beginning on page 10.
Performance data represent past performance, which does not guarantee future results. Investment return and principal value will fluctuate, and you may have a gain or loss when you sell your shares. Current performance may differ from figures shown. For most recent month-end performance, go to franklintempleton.com or call (800) 342-5236.
Economic and Market Overview
The global economy generally expanded during the period under review. In this environment, global developed and emerging market stocks, as measured by the MSCI All Country
Asset Allocation*
Based on Total Net Assets as of 6/30/17
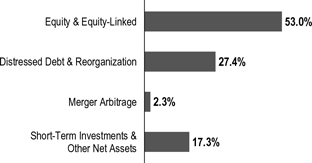
*Figures are stated as a percentage of total and may not equal 100% or may be negative due to rounding, use of any derivatives, unsettled trades or other factors.
World Index, generated a total return of +11.82%. Global markets were aided by improved industrial commodity prices at certain points during the period, generally upbeat economic data across regions, investor optimism about pro-growth and pro-business policies in the U.S., hopes of tax reforms under the Trump administration, Emmanuel Macron’s election as France’s president and encouraging corporate earnings reports.
However, global markets reflected investor concerns about the timing and economic effects of the U.K.’s exit from the European Union (also known as “Brexit”). Other headwinds included the health of European banks, concerns about political uncertainty in the U.S. and European Union, geopolitical tensions in certain regions, worries about global oversupply in oil production despite a pact to extend cuts, and comments toward period-end from key central bankers around the world about potentially raising interest rates.
U.S. economic growth decelerated in 2017’s first quarter, largely due to slower growth in consumer spending and declines in private inventory investment and government spending. However, growth accelerated in the second quarter due to increases in consumer spending, business investment and federal government spending. The unemployment rate decreased from 4.7% in December 2016 to 4.4% at
1. Source: Morningstar.
The indexes are unmanaged and include reinvestment of any income or distributions. They do not reflect any fees, expenses or sales charges. One cannot invest directly in an index, and an index is not representative of the Fund’s portfolio.
The dollar value, number of shares or principal amount, and names of all portfolio holdings are listed in the Fund’s Statement of Investments (SOI). The SOI begins on page 18.
| franklintempleton.com | Semiannual Report | 3 | ||||
FRANKLIN MUTUAL QUEST FUND
period-end.2 Annual inflation, as measured by the Consumer Price Index, decreased from 2.1% to 1.6% during the period. After increasing its benchmark interest rate in March, the U.S. Federal Reserve (Fed), at its June meeting, made the widely anticipated increase to its target range for the federal funds rate from 0.75%–1.00% to 1.00%–1.25%, amid signs of a growing U.S. economy, a strengthening labor market and an improvement in business spending.
In Europe, the U.K.’s economy grew at a slower rate in 2017’s first quarter over the previous quarter, largely due to slower growth in household spending. The eurozone’s growth increased in the first quarter over the previous quarter. The bloc’s annual inflation rate fluctuated during the reporting period and ended slightly higher from where it began. During the period, the European Central Bank kept its key policy rates unchanged.
In Asia, Japan’s quarterly gross domestic product (GDP) remained unchanged in 2017’s first quarter compared to 2016’s fourth quarter. In April 2017, the Bank of Japan (BOJ) slightly increased its GDP forecasts for the 2017–2018 fiscal year. However, the BOJ lowered its inflation forecast.
In emerging markets, Brazil’s quarterly GDP grew for the first time in two years, as its first-quarter 2017 GDP grew compared to the previous quarter. The country’s central bank cut its benchmark interest rate four times between January and June 2017 to spur economic growth. Russia’s GDP grew in 2017’s first quarter compared to the prior-year period. The Bank of Russia reduced its key interest rate in March, April and June 2017 to try to revive its economy. China’s economy grew faster in the first half of 2017 compared to the first half of 2016, driven by solid growth in industrial production, services, fixed-asset investment, retail sales, and imports and exports. The People’s Bank of China left its benchmark interest rate unchanged during the period. Overall, emerging market stocks, as measured by the MSCI Emerging Markets Index, rose during the period.
Investment Strategy
At Franklin Mutual Series, we are committed to our distinctive value approach to investing, which we believe can generate above-average risk-adjusted returns over time for our shareholders. Our major investment strategy is investing in undervalued stocks. When selecting undervalued equities, we are attracted to what we believe are fundamentally strong companies with healthy balance sheets, high-quality assets, substantial free cash flow and shareholder-oriented
Geographic Composition*
Based on Total Net Assets as of 6/30/17
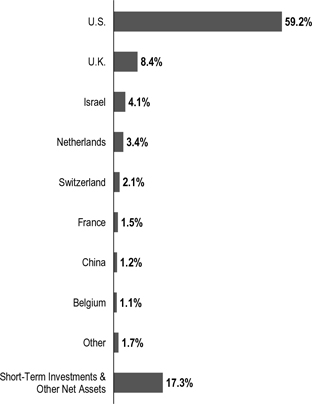
*Figures are stated as a percentage of total and may not equal 100% or may be negative due to rounding, use of any derivatives, unsettled trades or other factors.
management teams and whose stocks are trading at discounts to our assessment of the companies’ intrinsic or business value. We also look for asset-rich companies whose shares may be trading at depressed levels due to concerns over short-term earnings disappointments, litigation, management strategy or other perceived negatives. This strict value approach is not only intended to improve the likelihood of upside potential, but also reduces the risk of substantial declines, in our opinion. While the vast majority of our undervalued equity investments are made in publicly traded companies globally, we may invest occasionally in privately held companies as well.
We complement this more traditional investment strategy with two others. One is distressed investing, a highly specialized field that has proven quite profitable during certain periods over the years. Distressed investing is complex and can take many forms. The most common distressed investment the Fund undertakes is the purchase of financially troubled or bankrupt companies’ debt at a substantial discount to face value. After the financially distressed company is reorganized, often in
2. Source: Bureau of Labor Statistics.
| 4 | Semiannual Report | franklintempleton.com | ||
FRANKLIN MUTUAL QUEST FUND
bankruptcy court, the old debt is typically replaced with new securities issued by the financially stronger company.
The other piece of our investment strategy is participating in arbitrage situations, another highly specialized field. When companies announce proposed mergers or takeovers, commonly referred to as “deals,” the target company may trade at a discount to the bid it ultimately accepts. One form of arbitrage involves purchasing the target company’s stock when it is trading below the value we believe it would receive in a deal. In keeping with our commitment to a relatively conservative investment approach, we typically focus our arbitrage efforts on announced deals, and avoid rumored deals or other situations we consider relatively risky.
In addition, it is our practice to hedge the Fund’s currency exposure when we deem it advantageous for our shareholders.
What is meant by “hedge”?
To hedge an investment is to take a position intended to offset potential losses/gains that may be incurred by a companion financial instrument.
|
Manager’s Discussion
Many equity markets posted meaningful gains in 2017’s first half, across most regions and with minimal volatility. Global markets were aided by generally upbeat economic data, improved corporate earnings in the U.S., Europe and Japan, as well as improved industrial commodity prices at certain points during the period. However, those largely positive headline conditions overshadowed a fair amount of turbulence and uncertainty.
In the U.S., markets began 2017 rallying as investors hoped that a Republican sweep of U.S. elections in November 2016 would lead to a general loosening in regulations and tax reform, including lower corporate tax rates. However, political gridlock took hold. The political drama in Washington, D.C., tempered the rally in U.S. markets overall. Many stocks that led the way in the post-election rally subsequently gave back some or all of their outperformance, particularly value stocks dominated by companies in cyclical sectors most likely to benefit from acceleration in economic growth. In an environment of modest economic growth and low interest rates, investors continued to favor growth stocks. During the period, the Russell 1000® Growth Index generated a total return of +13.99%, while the Russell 1000® Value Index posted a total return of +4.66%.1
| Top 10 Sectors/Industries | ||||
| Based on Equity Securities as of 6/30/17 | ||||
| % of Total Net Assets | ||||
| Pharmaceuticals | 8.4% | |||
| Banks | 6.3% | |||
| Insurance | 6.1% | |||
| Oil, Gas & Consumable Fuels | 4.2% | |||
| Media | 3.7% | |||
| Independent Power & Renewable Electricity Producers | 3.5% | |||
| Communications Equipment | 2.8% | |||
| Software | 2.5% | |||
| Health Care Equipment & Supplies | 2.1% | |||
| Wireless Telecommunication Services | 2.0% | |||
Within the Russell 1000® Growth Index, stocks with the largest weights were technology firms that dominated the headlines: Apple,3 Alphabet (a.k.a. Google),3 Microsoft,3 Amazon.com3 and Facebook.3
European equity markets started 2017 slowly, but political events combined with upbeat economic news sparked strong performance during the period, with the notable exception of the U.K. Elections in Europe produced generally positive outcomes, with voters in the Netherlands and France rejecting extremist candidates. Political stability in the European Union (EU) helped to support equity markets on the belief that it would help facilitate the ongoing economic recovery. In the U.K., however, a snap election resulting in no party having a majority in Parliament appeared to make a “hard Brexit,” in which the U.K. leaves the EU in March 2019 without a negotiated deal, even more likely than before.
As value investors, we managed to benefit from steady economic growth despite underlying market turbulence. In all market environments, we seek to invest prudently in securities that we believe represent good value, and then we adjust our views as the world around us changes. We also believe that the potential to deliver the best risk-adjusted return over a full market cycle requires us to be focused on applying our cross-asset approach: owning debt and equities—in many cases multiple securities across the capital structure of a company—across geographies and sectors with an emphasis on corporate actions as catalysts.
3. Not a Fund holding.
| franklintempleton.com | Semiannual Report | 5 | ||||
FRANKLIN MUTUAL QUEST FUND
The energy sector has been a significant area of investment for the Fund.4 Following an extended period of high prices, crude oil and natural gas prices have been significantly lower during the past few years. The benchmark oil price declined from more than $100 a barrel to below $30, and has more recently stayed between $40 and $60 during the first half of 2017. The impact on the sector, and the securities of companies in the sector, has been unsurprisingly quite dramatic. Although many uncertainties exist, we continue to expect demand for oil and gas to rise for a number of years, which we believe will require continued investment by the sector, not only to meet that growth but also to replace declining production in mature fields around the world. Accordingly, we expect some combination of higher prices or lower costs over time to provide the sufficient returns needed to justify the required investment.
After an initial period of distress, most companies within the energy sector appear to have made considerable progress in resizing their cost structures and strengthening their balance sheets. In aggregate, capital spending has been cut massively, and cash flow break-even levels suggest an ability to fund a base level of investment activity given crude oil and gas prices as of period-end. From an investment standpoint, in many cases we are finding securities with reasonable prospects at current commodity prices, and substantively greater upside potential should our longer term price-versus-cost outlook come to pass. We expect continued commodity price volatility, but would look to use that to our advantage when seeking to buy or sell energy sector securities.
Our energy sector investment process has focused on finding situations where commodity price upside is not necessary to generate attractive security returns. One such area is within the infrastructure space. Companies such as Kinder Morgan provide critical pipelines, processing facilities, ports, and other assets used to bring vital commodities to market. Investors shunned these companies due to a combination of counterparty risk related to exploration and production companies, their own balance sheet concerns and dividend levels. As our analysis about the criticality of their assets and the flexibility of their funding options has, in our view, been proven, the securities of infrastructure companies have recovered significantly from their lows. Moreover, if expectations of an oil and gas supply glut from greater North American production hold true, more infrastructure investment should be needed to move this product to export markets.
Royal Dutch Shell, a leading integrated oil and gas company, is another investment held by the Fund for which fears about the impact of low commodity prices were overblown, in our view. The company used the initial phase of the crude oil price downturn to acquire BG Group, a major exploration and production company with significant positions and strength in liquefied natural gas and a great oil asset in the pre-salt Santos Basin in Brazil. The assets were highly complementary to Shell’s existing positions, allowing the post-merger company to prune other areas of its portfolio and still show considerable growth. Management, under the leadership of relatively new chief executive officer Ben van Beurden, has been focused on reducing costs so that the company can still grow, while funding all required capital expenditures and its dividend, at an oil price below $50 per barrel. As Shell shows continued progress in its efforts and demonstrates the resilience of its portfolio and balance sheet, we expect the shares to continue to benefit.
Merger and acquisition activity has remained healthy, with the number of deals remaining high, although the average size of deals fell. Very large deals may have been affected negatively by ongoing political and regulatory uncertainty. Although many mega-deals were rumored, the largest deal actually announced during the period was Becton, Dickinson and Company’s3 takeover of C.R. Bard.3 Meanwhile, many large deals initiated in 2016 await regulatory approval, including Bayer’s3 acquisition of Monsanto,3 AT&T’s3 acquisition of Time Warner, and 21st Century Fox’s3 offer for Sky. Several key regulatory agencies remain short of members, including the Federal Communication Commission and the Federal Trade Commission, and these openings may be affecting regulatory approvals.
Credit spreads narrowed in 2016 and continued that trend in the first half of 2017 for higher quality credit, with the exception of a brief period of volatility in March and April. High yield credit spreads have remained at levels seen at the start of 2017. The spread compression provided the Fund with the opportunity to exit many of the opportunities that presented themselves in early 2016, including several “hung deals,” as prices improved, spreads shrank, and the risk-adjusted returns were no longer mispriced. As the year progressed and investors became more willing buyers of credit, mispriced risk became more difficult to find, in our opinion. However, we found what we viewed as value in some unloved industries like specialty pharmaceuticals, hospitals, media/broadcasting, power/utilities, and telecommunications that faced increasing political or secular
4. The energy sector comprises energy equipment and services and oil, gas and consumable fuels in the SOI.
See www.franklintempletondatasources.com for additional data provider information.
| 6 | Semiannual Report | franklintempleton.com | ||
FRANKLIN MUTUAL QUEST FUND
challenges. In sorting through these less-favored industries, we sought out securities that we believed could benefit most from liquidity-enhancing events like asset sales, the ability within existing agreements to issue secured debt, and free cash flow that could create a long enough runway to weather the storm or otherwise provide enough current recovery to create the enterprise at a significant discount to our assessment of its intrinsic value.
Another active area for us was situations where companies were engaged in debt refinancing, exchanges or corporate restructuring. Earlier in the period, Affinion Group, a provider of customer engagement and loyalty programs and solutions, took actions to further restructure its balance sheet. The Fund held the company’s secured loans and high yield bonds. Following the corporate actions, our investment across Affinion’s capital structure at period-end included newly-issued secured loans, high yield debt and equity-linked securities.
In times when the credit markets fluctuate and value is difficult to easily identify, we believe our industry specific expertise, deep fundamental analysis with a focus on cash flow, and intensive credit and covenant review combine seamlessly and provide us with unique ways of looking at the same ideas across fixed income and equity that others may disregard.
Turning to Fund performance, top positive contributors included U.S.-based NRG Energy, Netherlands-based ASR Nederland and Israel-based Check Point Software Technologies.
NRG Energy is an integrated wholesale power generation and retail electricity company that includes solar and renewable energy businesses. Shares of NRG surged in January after hedge fund management firm Elliott Associates3 and private equity firm Bluescape Energy Partners3 announced a combined stake in NRG. In a filing with the U.S. Securities and Exchange Commission, the two investors stated their belief that NRG’s stock was “deeply undervalued and that there exists numerous opportunities to significantly increase shareholder value, including operational and financial improvements as well as strategic initiatives.” Shares of NRG gave back some gains in April and early May due to continued uncertainty regarding the direction of the company’s operations and the need to restructure GenOn, a subsidiary company with significant debt borrowings (the Fund owns debt issued by GenOn). In our view, opportunities for operational improvements are significant. We believe that NRG has been fairly successful in its efforts to reduce debt and improve its balance sheet, but that room for further progress also exists.
| Top 10 Equity Holdings | ||||
| 6/30/17 | ||||
Company Sector/Industry, Country | % of Total Net Assets | |||
Sorenson Communications Inc. Communications Equipment, U.S. | 2.8% | |||
NRG Energy Inc. Independent Power & Renewable Electricity Producers, U.S. | 2.7% | |||
Teva Pharmaceutical Industries Ltd. Pharmaceuticals, Israel | 2.4% | |||
Novartis AG Pharmaceuticals, Switzerland | 2.1% | |||
Medtronic PLC Health Care Equipment & Supplies, U.S. | 2.1% | |||
Vodafone Group PLC Wireless Telecommunication Services, U.K. | 2.0% | |||
CIT Group Inc. Banks, U.S. | 1.9% | |||
Forest City Realty Trust Inc. Equity Real Estate Investment Trusts (REITs), U.S. | 1.9% | |||
Royal Dutch Shell PLC Oil, Gas & Consumable Fuels, U.K. | 1.9% | |||
ASR Nederland NV Insurance, Netherlands | 1.8% | |||
Shares of insurer ASR Nederland rose due to a series of positive events. In February, the company announced it would repurchase shares on offer from the Dutch government, shares the government had acquired during the 2008 financial crisis. In our view, the buy-back demonstrated ASR Nederland’s strong capital position. ASR Nederland reported solid quarterly results in February and May, as well as a dividend increase approved by shareholders at the end of May. Operating results were aided by ASR Nederland’s efforts to re-risk its investment portfolio by shifting invested premiums away from traditional fixed income securities to equities and other assets with higher historical returns. We believe the process of re-risking is a sign that management feels more comfortable with its level of capital. The board of ASR Nederland also approved another share buy-back program, which will likely be used to purchase more shares held by the Dutch government.
Check Point Software Technologies is an information technology security company. Check Point’s stock rallied on positive quarterly results in January after the company showed results that exceeded expectations across most metrics. Billings growth reached a five-year high, demand for software licenses and advanced technology subscriptions grew at a strong pace, and discounting had a smaller negative impact. Earnings and revenue guidance for 2017 were also better than expected. In April, further improvement in billings growth that significantly
| franklintempleton.com | Semiannual Report | 7 | ||||
FRANKLIN MUTUAL QUEST FUND
exceeded investor expectations and improved demand from international markets showed the ongoing fundamental strength of the company.
During the period under review, Fund investments that detracted from performance included U.S.-based companies Avaya, Eastman Kodak and Bluestem Group.
Avaya is a communication company that was chiefly a hardware maker but is transitioning into a software and services provider. The company filed for Chapter 11 bankruptcy in January as it attempted to restructure and reduce its debt load.
Shares of Eastman Kodak, a digital commercial imaging company, retreated in March due to weak results, particularly a decline in revenues. Furthermore, earnings guidance for full year 2017 was met with disappointment as was Kodak’s announcement in April that it would not sell its inkjet business. We believe the stock price remained cheap at period-end as the market appeared to have discounted the potential for operating performance improvement and any future sale of assets.
Bluestem Group is a multi-brand, online retailer focused on name-brand and private-label general merchandise. Sales growth remained elusive as recently-acquired brands, including the Orchard Portfolio, underperformed. In addition, it experienced an increase in credit expenses. The decision to exit the PayCheck Direct business contributed to the increase in expenses. To cope with declining revenues and increasing expenses, management has initiated a turnaround plan involving cost reduction initiatives across key functions and operations. We expect realization of the plan’s benefits to occur over the coming quarters.
During the period, the Fund held currency forwards and futures seeking to hedge most of the currency risk of the portfolio’s non-U.S. dollar investments. The currency forwards had a negative impact on the Fund’s performance because of the depreciation of the U.S. dollar versus the hedged currencies, while currency futures had a negligible impact.
What is a currency forward?
A currency forward is an agreement between the Fund and a counterparty to buy or sell a foreign currency in exchange for another currency at a specific exchange rate on a future date.
|
What is a future?
A future is an agreement between the Fund and a counterparty made through a U.S. or foreign futures exchange to buy or sell an underlying instrument or asset at a specific price on a future date.
|
Thank you for your participation in Franklin Mutual Quest Fund. We look forward to continuing to serve your investment needs.
 |
Shawn M. Tumulty Co-Portfolio Manager |

 |
Keith Luh, CFA Co-Portfolio Manager |

The foregoing information reflects our analysis, opinions and portfolio holdings as of June 30, 2017, the end of the reporting period. The way we implement our main investment strategies and the resulting portfolio holdings may change depending on factors such as market and economic conditions. These opinions may not be relied upon as investment advice or an offer for a particular security. The information is not a complete analysis of every aspect of any market, country, industry, security or the Fund. Statements of fact are from sources considered reliable, but the investment manager makes no representation or warranty as to their completeness or accuracy. Although historical performance is no guarantee of future results, these insights may help you understand our investment management philosophy.
CFA® is a trademark owned by CFA Institute.
| 8 | Semiannual Report | franklintempleton.com | ||
FRANKLIN MUTUAL QUEST FUND
Shawn Tumulty has been a portfolio manager for Franklin Mutual Quest Fund since 2003 and a co-portfolio manager since 2010. He joined Franklin Templeton Investments in 2000. Prior to joining Franklin Templeton Investments, Mr. Tumulty was an analyst and portfolio manager at Hamilton Partners Limited.
|
Keith Luh has been a co-portfolio manager for Franklin Mutual Quest Fund since 2010. He is also head of cross asset investing for Franklin Mutual Series with a value and event-driven focus across equity and fixed income investments, globally. Prior to joining in 2005, Mr. Luh was a senior analyst in global investment research at Putnam Investments, where he also helped manage a best-ideas research fund. Previously, he worked in the investment banking group at Volpe Brown Whelan and Co., LLC, and the derivative products trading group at BNP. Mr. Luh is also Adjunct Professor in Finance and Economics at the Graduate School of Business, Columbia University.
|
| franklintempleton.com | Semiannual Report | 9 | ||||
F R A N K L I N M U T U A L Q U E S T F U N D
Performance Summary as of June 30, 2017
The performance table does not reflect any taxes that a shareholder would pay on Fund dividends, capital gain distributions, if any, or any realized gains on the sale of Fund shares. Total return reflects reinvestment of the Fund’s dividends and capital gain distributions, if any, and any unrealized gains or losses. Your dividend income will vary depending on dividends or interest paid by securities in the Fund’s portfolio, adjusted for operating expenses of each class. Capital gain distributions are net profits realized from the sale of portfolio securities.
Performance as of 6/30/17
Cumulative total return excludes sales charges. Average annual total return includes maximum sales charges. Sales charges will vary depending on the size of the investment and the class of share purchased. The maximum is 5.75% and the minimum is 0%. Class A: 5.75% maximum initial sales charge. For other share classes, visit franklintempleton.com.
| Share Class | Cumulative Total Return1 | Average Annual Total Return2 | ||||||
| Z | ||||||||
6-Month | +2.90% | +2.90% | ||||||
1-Year | +12.92% | +12.92% | ||||||
5-Year | +57.49% | +9.51% | ||||||
10-Year | +57.02% | +4.62% | ||||||
| A | ||||||||
6-Month | +2.68% | -3.14% | ||||||
1-Year | +12.61% | +6.15% | ||||||
5-Year | +55.33% | +7.92% | ||||||
10-Year | +52.46% | +3.69% | ||||||
Performance data represent past performance, which does not guarantee future results. Investment return and principal value will fluctuate, and you may have a gain or loss when you sell your shares. Current performance may differ from figures shown. For most recent month-end performance, go to franklintempleton.com or call (800) 342-5236.
See page 11 for Performance Summary footnotes.
| 10 | Semiannual Report | franklintempleton.com | ||
F R A N K L I N M U T U A L Q U E S T F U N D
P E R F O R M A N C E S U M M A R Y
Total Annual Operating Expenses3
| Share Class | ||||
Z | 0.79% | |||
A | 1.04% | |||
Each class of shares is available to certain eligible investors and has different annual fees and expenses, as described in the prospectus.
All investments involve risks, including possible loss of principal. Value securities may not increase in price as anticipated or may decline further in value. Special risks are associated with foreign investing, including currency fluctuations, economic instability and political developments. Smaller company stocks have exhibited greater price volatility than larger company stocks, particularly over the short term. The Fund’s investments in companies engaged in mergers, reorganizations or liquidations also involve special risks as pending deals may not be completed on time or on favorable terms. The Fund may invest in lower rated bonds, which entail higher credit risk. The Fund is actively managed but there is no guarantee that the manager’s investment decisions will produce the desired results. The Fund’s prospectus also includes a description of the main investment risks.
1. Cumulative total return represents the change in value of an investment over the periods indicated.
2. Average annual total return represents the average annual change in value of an investment over the periods indicated. Return for less than one year, if any, has not been annualized.
3. Figures are as stated in the Fund’s current prospectus and may differ from the expense ratios disclosed in the Your Fund’s Expenses and Financial Highlights sections in this report. In periods of market volatility, assets may decline significantly, causing total annual Fund operating expenses to become higher than the figures shown.
| franklintempleton.com | Semiannual Report | 11 |
F R A N K L I N M U T U A L Q U E S T F U N D
As a Fund shareholder, you can incur two types of costs: (1) transaction costs, including sales charges (loads) on Fund purchases and redemptions; and (2) ongoing Fund costs, including management fees, distribution and service (12b-1) fees, and other Fund expenses. All mutual funds have ongoing costs, sometimes referred to as operating expenses. The table below shows ongoing costs of investing in the Fund and can help you understand these costs and compare them with those of other mutual funds. The table assumes a $1,000 investment held for the six months indicated.
Actual Fund Expenses
The table below provides information about actual account values and actual expenses in the columns under the heading “Actual.” In these columns the Fund’s actual return, which includes the effect of Fund expenses, is used to calculate the “Ending Account Value” for each class of shares. You can estimate the expenses you paid during the period by following these steps (of course, your account value and expenses will differ from those in this illustration): Divide your account value by $1,000 (if your account had an $8,600 value, then $8,600 ÷ $1,000 = 8.6). Then multiply the result by the number in the row for your class of shares under the headings “Actual” and “Expenses Paid During Period” (if Actual Expenses Paid During Period were $7.50, then 8.6 x $7.50 =
$64.50). In this illustration, the actual expenses paid this period are $64.50.
Hypothetical Example for Comparison with Other Funds
Under the heading “Hypothetical” in the table, information is provided about hypothetical account values and hypothetical expenses based on the Fund’s actual expense ratio and an assumed rate of return of 5% per year before expenses, which is not the Fund’s actual return. This information may not be used to estimate the actual ending account balance or expenses you paid for the period, but it can help you compare ongoing costs of investing in the Fund with those of other funds. To do so, compare this 5% hypothetical example for the class of shares you hold with the 5% hypothetical examples that appear in the shareholder reports of other funds.
Please note that expenses shown in the table are meant to highlight ongoing costs and do not reflect any transactional costs. Therefore, information under the heading “Hypothetical” is useful in comparing ongoing costs only, and will not help you compare total costs of owning different funds. In addition, if transactional costs were included, your total costs would have been higher.
| Actual (actual return after expenses) | Hypothetical (5% annual return before expenses) | |||||||||||
| Share Class | Beginning Account Value 1/1/17 | Ending Account Value 6/30/17 | Expenses Paid During Period 1/1/17–6/30/171,2 | Ending Account Value 6/30/17 | Expenses Paid During Period 1/1/17–6/30/171,2 | Net Annualized Expense Ratio2 | ||||||
|
|
|
| |||||||||
| Z | $1,000 | $1,029.00 | $3.87 | $1,020.98 | $3.86 | 0.77% | ||||||
| A | $1,000 | $1,026.80 | $5.13 | $1,019.74 | $5.11 | 1.02% | ||||||
| C | $1,000 | $1,024.60 | $8.89 | $1,016.02 | $8.85 | 1.77% | ||||||
| R | $1,000 | $1,026.40 | $6.38 | $1,018.50 | $6.36 | 1.27% | ||||||
| R6 | $1,000 | $1,029.70 | $3.52 | $1,021.32 | $3.51 | 0.70% | ||||||
1. Expenses are equal to the annualized expense ratio for the six-month period as indicated above–in the far right column–multiplied by the simple average account value over the period indicated, and then multiplied by 181/365 to reflect the one-half year period.
2. Reflects expenses after fee waivers and expense reimbursements. Does not include acquired fund fees and expenses.
| 12 | Semiannual Report | franklintempleton.com | ||
FRANKLINMUTUAL QUEST FUND
Six Months Ended | Year Ended December 31, | |||||||||||||||||||||||
| (unaudited) | 2016 | 2015 | 2014 | 2013 | 2012 | |||||||||||||||||||
| Class Z | ||||||||||||||||||||||||
| Per share operating performance (for a share outstanding throughout the period) | ||||||||||||||||||||||||
Net asset value, beginning of period | $15.52 | $14.47 | $16.21 | $18.18 | $16.55 | $16.24 | ||||||||||||||||||
|
| |||||||||||||||||||||||
| Income from investment operationsa: | ||||||||||||||||||||||||
Net investment incomeb | 0.30 | 0.87 | c | 0.54 | 0.78 | d | 0.54 | 0.43 | ||||||||||||||||
Net realized and unrealized gains (losses) | 0.15 | 1.47 | (1.45 | ) | (0.16 | ) | 3.68 | 1.61 | ||||||||||||||||
|
| |||||||||||||||||||||||
Total from investment operations | 0.45 | 2.34 | (0.91 | ) | 0.62 | 4.22 | 2.04 | |||||||||||||||||
|
| |||||||||||||||||||||||
| Less distributions from: | ||||||||||||||||||||||||
Net investment income | — | (1.01 | ) | (0.68 | ) | (0.85 | ) | (0.56 | ) | (0.43 | ) | |||||||||||||
Net realized gains | — | (0.28 | ) | (0.15 | ) | (1.74 | ) | (2.03 | ) | (1.30 | ) | |||||||||||||
|
| |||||||||||||||||||||||
Total distributions | — | (1.29 | ) | (0.83 | ) | (2.59 | ) | (2.59 | ) | (1.73 | ) | |||||||||||||
|
| |||||||||||||||||||||||
Net asset value, end of period | $15.97 | $15.52 | $14.47 | $16.21 | $18.18 | $16.55 | ||||||||||||||||||
|
| |||||||||||||||||||||||
Total returne | 2.90% | 16.26% | (5.55)% | 3.44% | 25.97% | 12.57% | ||||||||||||||||||
| Ratios to average net assetsf | ||||||||||||||||||||||||
Expensesg | 0.77% | h | 0.79% | h,i | 0.82% | h,i | 0.81% | h | 0.84% | h | 0.90% | |||||||||||||
Expenses incurred in connection with securities sold short | —% | 0.01% | 0.03% | 0.04% | 0.07% | 0.11% | ||||||||||||||||||
Net investment income | 3.79% | 5.74% | c | 3.35% | 4.18% | d | 2.93% | 2.48% | ||||||||||||||||
| Supplemental data | �� | |||||||||||||||||||||||
Net assets, end of period (000’s) | $3,798,549 | $3,683,095 | $3,577,696 | $4,116,651 | $4,270,828 | $3,582,856 | ||||||||||||||||||
Portfolio turnover rate | 12.08% | 44.04% | 30.51% | 65.77% | 63.41% | 65.21% | ||||||||||||||||||
aThe amount shown for a share outstanding throughout the period may not correlate with the Statement of Operations for the period due to the timing of sales and repurchases of the Fund’s shares in relation to income earned and/or fluctuating fair value of the investments of the Fund.
bBased on average daily shares outstanding.
cNet investment income per share includes approximately $0.05 per share related to income received in the form of special dividends in connection with certain Fund holdings. Excluding this amount, the ratio of net investment income to average net assets would have been 5.42%.
dNet investment income per share includes approximately $0.27 per share related to income received in the form of special dividends in connection with certain Fund holdings. Excluding this amount, the ratio of net investment income to average net assets would have been 2.73%.
eTotal return is not annualized for periods less than one year.
fRatios are annualized for periods less than one year.
gIncludes dividend and/or interest expense on securities sold short and security borrowing fees, if any. See below for the ratios of such expenses to average net assets for the periods presented. See Note 1(e).
hBenefit of expense reduction rounds to less than 0.01%.
iBenefit of waiver and payments by affiliates rounds to less than 0.01%.
| franklintempleton.com | The accompanying notes are an integral part of these consolidated financial statements. | Semiannual Report | 13 | ||||
FRANKLIN MUTUAL QUEST FUND
FINANCIAL HIGHLIGHTS
Six Months Ended June 30, 2017 | Year Ended December 31, | |||||||||||||||||||||||
| (unaudited) | 2016 | 2015 | 2014 | 2013 | 2012 | |||||||||||||||||||
| Class A | ||||||||||||||||||||||||
| Per share operating performance (for a share outstanding throughout the period) | ||||||||||||||||||||||||
Net asset value, beginning of period | $15.32 | $14.29 | $16.02 | $18.00 | $16.41 | $16.12 | ||||||||||||||||||
|
| |||||||||||||||||||||||
| Income from investment operationsa: | ||||||||||||||||||||||||
Net investment incomeb | 0.27 | 0.83 | c | 0.49 | 0.71 | d | 0.48 | 0.37 | ||||||||||||||||
Net realized and unrealized gains (losses) | 0.14 | 1.45 | (1.43 | ) | (0.15 | ) | 3.65 | 1.60 | ||||||||||||||||
|
| |||||||||||||||||||||||
Total from investment operations | 0.41 | 2.28 | (0.94 | ) | 0.56 | 4.13 | 1.97 | |||||||||||||||||
|
| |||||||||||||||||||||||
| Less distributions from: | ||||||||||||||||||||||||
Net investment income | — | (0.97 | ) | (0.64 | ) | (0.80 | ) | (0.51 | ) | (0.38 | ) | |||||||||||||
Net realized gains | — | (0.28 | ) | (0.15 | ) | (1.74 | ) | (2.03 | ) | (1.30 | ) | |||||||||||||
|
| |||||||||||||||||||||||
Total distributions | — | (1.25 | ) | (0.79 | ) | (2.54 | ) | (2.54 | ) | (1.68 | ) | |||||||||||||
|
| |||||||||||||||||||||||
Net asset value, end of period | $15.73 | $15.32 | $14.29 | $16.02 | $18.00 | $16.41 | ||||||||||||||||||
|
| |||||||||||||||||||||||
Total returne | 2.68% | 16.04% | (5.85)% | 3.11% | 25.61% | 12.21% | ||||||||||||||||||
| Ratios to average net assetsf | ||||||||||||||||||||||||
Expensesg | 1.02%h | 1.04% | h,i | 1.10% | h,i | 1.11% | h | 1.14% | h | 1.20% | ||||||||||||||
Expenses incurred in connection with securities sold short | —% | 0.01% | 0.03% | 0.04% | 0.07% | 0.11% | ||||||||||||||||||
Net investment income | 3.54% | 5.49% | c | 3.07% | 3.88% | d | 2.63% | 2.18% | ||||||||||||||||
| Supplemental data | ||||||||||||||||||||||||
Net assets, end of period (000’s) | $1,200,261 | $1,216,085 | $1,203,508 | $1,394,138 | $1,371,789 | $1,101,808 | ||||||||||||||||||
Portfolio turnover rate | 12.08% | 44.04% | 30.51% | 65.77% | 63.41% | 65.21% | ||||||||||||||||||
aThe amount shown for a share outstanding throughout the period may not correlate with the Statement of Operations for the period due to the timing of sales and repurchases of the Fund’s shares in relation to income earned and/or fluctuating fair value of the investments of the Fund.
bBased on average daily shares outstanding.
cNet investment income per share includes approximately $0.05 per share related to income received in the form of special dividends in connection with certain Fund holdings. Excluding this amount, the ratio of net investment income to average net assets would have been 5.17%.
dNet investment income per share includes approximately $0.27 per share related to income received in the form of special dividends in connection with certain Fund holdings. Excluding this amount, the ratio of net investment income to average net assets would have been 2.43%.
eTotal return does not reflect sales commissions or contingent deferred sales charges, if applicable, and is not annualized for periods less than one year.
fRatios are annualized for periods less than one year.
gIncludes dividend and/or interest expense on securities sold short and security borrowing fees, if any. See below for the ratios of such expenses to average net assets for the periods presented. See Note 1(e).
hBenefit of expense reduction rounds to less than 0.01%.
iBenefit of waiver and payments by affiliates rounds to less than 0.01%.
| 14 | Semiannual Report | The accompanying notes are an integral part of these consolidated financial statements. | franklintempleton.com | ||
FRANKLIN MUTUAL QUEST FUND
FINANCIAL HIGHLIGHTS
| Six Months Ended June 30, 2017 | Year Ended December 31, | |||||||||||||||||||||||
| (unaudited) | 2016 | 2015 | 2014 | 2013 | 2012 | |||||||||||||||||||
| Class C | ||||||||||||||||||||||||
| Per share operating performance (for a share outstanding throughout the period) | ||||||||||||||||||||||||
Net asset value, beginning of period | $15.06 | $14.08 | $15.78 | $17.76 | $16.24 | $15.96 | ||||||||||||||||||
|
| |||||||||||||||||||||||
| Income from investment operationsa: | ||||||||||||||||||||||||
Net investment incomeb | 0.21 | 0.70 | c | 0.36 | 0.57 | d | 0.35 | 0.25 | ||||||||||||||||
Net realized and unrealized gains (losses) | 0.16 | 1.41 | (1.39 | ) | (0.14 | ) | 3.59 | 1.59 | ||||||||||||||||
|
| |||||||||||||||||||||||
Total from investment operations | 0.37 | 2.11 | (1.03 | ) | 0.43 | 3.94 | 1.84 | |||||||||||||||||
|
| |||||||||||||||||||||||
| Less distributions from: | ||||||||||||||||||||||||
Net investment income | — | (0.85 | ) | (0.52 | ) | (0.67 | ) | (0.39 | ) | (0.26 | ) | |||||||||||||
Net realized gains | — | (0.28 | ) | (0.15 | ) | (1.74 | ) | (2.03 | ) | (1.30 | ) | |||||||||||||
|
| |||||||||||||||||||||||
Total distributions | — | (1.13 | ) | (0.67 | ) | (2.41 | ) | (2.42 | ) | (1.56 | ) | |||||||||||||
|
| |||||||||||||||||||||||
Net asset value, end of period | $15.43 | $15.06 | $14.08 | $15.78 | $17.76 | $16.24 | ||||||||||||||||||
|
| |||||||||||||||||||||||
Total returne | 2.46% | 15.10% | (6.49)% | 2.42% | 24.74% | 11.42% | ||||||||||||||||||
| Ratios to average net assetsf | ||||||||||||||||||||||||
Expensesg | 1.77% | h | 1.79% | h,i | 1.82% | h,i | 1.81% | h | 1.84% | h | 1.90% | |||||||||||||
Expenses incurred in connection with securities sold short | —% | 0.01% | 0.03% | 0.04% | 0.07% | 0.11% | ||||||||||||||||||
Net investment income | 2.79% | 4.74% | c | 2.35% | 3.18% | d | 1.93% | 1.48% | ||||||||||||||||
| Supplemental data | ||||||||||||||||||||||||
Net assets, end of period (000’s) | $328,775 | $343,624 | $337,974 | $397,963 | $406,304 | $333,908 | ||||||||||||||||||
Portfolio turnover rate | 12.08% | 44.04% | 30.51% | 65.77% | 63.41% | 65.21% | ||||||||||||||||||
aThe amount shown for a share outstanding throughout the period may not correlate with the Statement of Operations for the period due to the timing of sales and repurchases of the Fund’s shares in relation to income earned and/or fluctuating fair value of the investments of the Fund.
bBased on average daily shares outstanding.
cNet investment income per share includes approximately $0.05 per share related to income received in the form of special dividends in connection with certain Fund holdings. Excluding this amount, the ratio of net investment income to average net assets would have been 4.42%.
dNet investment income per share includes approximately $0.27 per share related to income received in the form of special dividends in connection with certain Fund holdings. Excluding this amount, the ratio of net investment income to average net assets would have been 1.73%.
eTotal return does not reflect sales commissions or contingent deferred sales charges, if applicable, and is not annualized for periods less than one year.
fRatios are annualized for periods less than one year.
gIncludes dividend and/or interest expense on securities sold short and security borrowing fees, if any. See below for the ratios of such expenses to average net assets for the periods presented. See Note 1(e).
hBenefit of expense reduction rounds to less than 0.01%.
iBenefit of waiver and payments by affiliates rounds to less than 0.01%.
| franklintempleton.com | The accompanying notes are an integral part of these consolidated financial statements. | Semiannual Report | 15 | ||||
FRANKLIN MUTUAL QUEST FUND
FINANCIAL HIGHLIGHTS
Six Months Ended | Year Ended December 31, | |||||||||||||||||||||||
| (unaudited) | 2016 | 2015 | 2014 | 2013 | 2012 | |||||||||||||||||||
| Class R | ||||||||||||||||||||||||
| Per share operating performance (for a share outstanding throughout the period) | ||||||||||||||||||||||||
Net asset value, beginning of period | $15.14 | $14.14 | $15.87 | $17.84 | $16.33 | $16.05 | ||||||||||||||||||
|
| |||||||||||||||||||||||
| Income from investment operationsa: | ||||||||||||||||||||||||
Net investment incomeb | 0.26 | 0.78 | c | 0.44 | 0.65 | d | 0.50 | 0.33 | ||||||||||||||||
Net realized and unrealized gains (losses) | 0.14 | 1.43 | (1.40 | ) | (0.13 | ) | 3.56 | 1.60 | ||||||||||||||||
|
| |||||||||||||||||||||||
Total from investment operations | 0.40 | 2.21 | (0.96 | ) | 0.52 | 4.06 | 1.93 | |||||||||||||||||
|
| |||||||||||||||||||||||
| Less distributions from: | ||||||||||||||||||||||||
Net investment income | — | (0.93 | ) | (0.62 | ) | (0.75 | ) | (0.52 | ) | (0.35 | ) | |||||||||||||
Net realized gains | — | (0.28 | ) | (0.15 | ) | (1.74 | ) | (2.03 | ) | (1.30 | ) | |||||||||||||
|
| |||||||||||||||||||||||
Total distributions | — | (1.21 | ) | (0.77 | ) | (2.49 | ) | (2.55 | ) | (1.65 | ) | |||||||||||||
|
| |||||||||||||||||||||||
Net asset value, end of period | $15.54 | $15.14 | $14.14 | $15.87 | $17.84 | $16.33 | ||||||||||||||||||
|
| |||||||||||||||||||||||
Total returne | 2.64% | 15.69% | (6.03)% | 2.94% | 25.34% | 11.99% | ||||||||||||||||||
| Ratios to average net assetsf | ||||||||||||||||||||||||
Expensesg | 1.27% | h | 1.29% | h,i | 1.32% | h,i | 1.31% | h | 1.34% | h | 1.40% | |||||||||||||
Expenses incurred in connection with securities sold short | —% | 0.01% | 0.03% | 0.04% | 0.07% | 0.11% | ||||||||||||||||||
Net investment income | 3.29% | 5.24%c | 2.85% | 3.68%d | 2.43% | 1.98% | ||||||||||||||||||
| Supplemental data | ||||||||||||||||||||||||
Net assets, end of period (000’s) | $1,502 | $880 | $898 | $675 | $853 | $212 | ||||||||||||||||||
Portfolio turnover rate | 12.08% | 44.04% | 30.51% | 65.77% | 63.41% | 65.21% | ||||||||||||||||||
aThe amount shown for a share outstanding throughout the period may not correlate with the Statement of Operations for the period due to the timing of sales and repurchases of the Fund’s shares in relation to income earned and/or fluctuating fair value of the investments of the Fund.
bBased on average daily shares outstanding.
cNet investment income per share includes approximately $0.05 per share related to income received in the form of special dividends in connection with certain Fund holdings. Excluding this amount, the ratio of net investment income to average net assets would have been 4.92%.
dNet investment income per share includes approximately $0.27 per share related to income received in the form of special dividends in connection with certain Fund holdings. Excluding this amount, the ratio of net investment income to average net assets would have been 2.23%.
eTotal return is not annualized for periods less than one year.
fRatios are annualized for periods less than one year.
gIncludes dividend and/or interest expense on securities sold short and security borrowing fees, if any. See below for the ratios of such expenses to average net assets for the periods presented. See Note 1(e).
hBenefit of expense reduction rounds to less than 0.01%.
iBenefit of waiver and payments by affiliates rounds to less than 0.01%.
| 16 | Semiannual Report | The accompanying notes are an integral part of these consolidated financial statements. | franklintempleton.com | ||
FRANKLIN MUTUAL QUEST FUND
FINANCIAL HIGHLIGHTS
| Six Months Ended June 30, 2017 | Year Ended December 31, | |||||||||||||||||||
| (unaudited) | 2016 | 2015 | 2014 | 2013a | ||||||||||||||||
| Class R6 | ||||||||||||||||||||
| Per share operating performance (for a share outstanding throughout the period) | ||||||||||||||||||||
Net asset value, beginning of period | $15.51 | $14.45 | $16.19 | $18.19 | $18.16 | |||||||||||||||
|
| |||||||||||||||||||
| Income from investment operationsb: | ||||||||||||||||||||
Net investment incomec | 0.30 | 0.88 | d | 0.55 | 0.51 | e | 0.36 | |||||||||||||
Net realized and unrealized gains (losses) | 0.16 | 1.48 | (1.44 | ) | 0.10 | 2.28 | ||||||||||||||
|
| |||||||||||||||||||
Total from investment operations | 0.46 | 2.36 | (0.89 | ) | 0.61 | 2.64 | ||||||||||||||
|
| |||||||||||||||||||
| Less distributions from: | ||||||||||||||||||||
Net investment income | — | (1.02 | ) | (0.70 | ) | (0.87 | ) | (0.58 | ) | |||||||||||
Net realized gains | — | (0.28 | ) | (0.15 | ) | (1.74 | ) | (2.03 | ) | |||||||||||
|
| |||||||||||||||||||
Total distributions | — | (1.30 | ) | (0.85 | ) | (2.61 | ) | (2.61 | ) | |||||||||||
|
| |||||||||||||||||||
Net asset value, end of period | $15.97 | $15.51 | $14.45 | $16.19 | $18.19 | |||||||||||||||
|
| |||||||||||||||||||
Total returnf | 2.97% | 16.44% | (5.54)% | 3.53% | 14.83% | |||||||||||||||
| Ratios to average net assetsg | ||||||||||||||||||||
Expenses before waiver and payments by affiliates and expense reductionh | 0.70% | 0.71% | 0.74% | 0.74% | 2.00% | |||||||||||||||
Expenses net of waiver and payments by affiliates and expense reductionh,i | 0.70% | 0.71% | j | 0.74% | j | 0.74% | 0.77% | |||||||||||||
Expenses incurred in connection with securities sold short | —% | 0.01% | 0.03% | 0.04% | 0.07% | |||||||||||||||
Net investment income | 3.86% | 5.82% | d | 3.43% | 4.25% | e | 3.00% | |||||||||||||
| Supplemental data | ||||||||||||||||||||
Net assets, end of period (000’s) | $31,983 | $52,277 | $41,408 | $44,340 | $5 | |||||||||||||||
Portfolio turnover rate | 12.08% | 44.04% | 30.51% | 65.77% | 63.41% | |||||||||||||||
aFor the period May 1, 2013 (effective date) to December 31, 2013.
bThe amount shown for a share outstanding throughout the period may not correlate with the Statement of Operations for the period due to the timing of sales and repurchases of the Fund’s shares in relation to income earned and/or fluctuating fair value of the investments of the Fund.
cBased on average daily shares outstanding.
dNet investment income per share includes approximately $0.05 per share related to income received in the form of special dividends in connection with certain Fund holdings. Excluding this amount, the ratio of net investment income to average net assets would have been 5.50%.
eNet investment income per share includes approximately $0.27 per share related to income received in the form of special dividends in connection with certain Fund holdings. Excluding this amount, the ratio of net investment income to average net assets would have been 2.80%.
fTotal return is not annualized for periods less than one year.
gRatios are annualized for periods less than one year.
hIncludes dividend and/or interest expense on securities sold short and security borrowing fees, if any. See below for the ratios of such expenses to average net assets for the periods presented. See Note 1(e).
iBenefit of expense reduction rounds to less than 0.01%.
jBenefit of waiver and payments by affiliates rounds to less than 0.01%.
| franklintempleton.com | The accompanying notes are an integral part of these financial statements. | Semiannual Report | �� | 17 | |||
FRANKLIN MUTUAL QUEST FUND
Statement of Investments, June 30, 2017 (unaudited)
| Country | Shares/ Warrants | Value | ||||||||||||||
Common Stocks and Other Equity Interests 53.2% | ||||||||||||||||
| Auto Components 1.1% | ||||||||||||||||
The Goodyear Tire & Rubber Co. | United States | 1,291,372 | $ | 45,146,365 | ||||||||||||
| a,b | International Automotive Components Group Brazil LLC | Brazil | 2,548,299 | 62,329 | ||||||||||||
| a,b,c | International Automotive Components Group North America LLC | United States | 19,924,658 | 12,263,946 | ||||||||||||
|
| |||||||||||||||
| 57,472,640 | ||||||||||||||||
|
| |||||||||||||||
| Automobiles 1.5% | ||||||||||||||||
Peugeot SA | France | 4,111,079 | 82,013,563 | |||||||||||||
|
| |||||||||||||||
| Banks 6.3% | ||||||||||||||||
BB&T Corp. | United States | 948,477 | 43,070,341 | |||||||||||||
CIT Group Inc. | United States | 2,118,508 | 103,171,340 | |||||||||||||
Citizens Financial Group Inc | United States | 1,565,650 | 55,862,392 | |||||||||||||
Guaranty Bancorp | United States | 347,127 | 9,441,854 | |||||||||||||
SunTrust Banks Inc. | United States | 1,129,867 | 64,086,056 | |||||||||||||
Wells Fargo & Co. | United States | 1,071,824 | 59,389,768 | |||||||||||||
|
| |||||||||||||||
| 335,021,751 | ||||||||||||||||
|
| |||||||||||||||
| Chemicals 0.3% | ||||||||||||||||
| d | Advanced Emissions Solutions Inc. | United States | 1,724,209 | 15,792,941 | ||||||||||||
| a,e,f | Dow Corning Corp., Contingent Distribution | United States | 12,089,194 | — | ||||||||||||
|
| |||||||||||||||
| 15,792,941 | ||||||||||||||||
|
| |||||||||||||||
| Communications Equipment 2.8% | ||||||||||||||||
| a,b,c | Sorenson Communications Inc., Membership Interests | United States | 224,279 | 150,109,522 | ||||||||||||
|
| |||||||||||||||
| Consumer Finance 1.8% | ||||||||||||||||
Ally Financial Inc. | United States | 3,235,224 | 67,616,182 | |||||||||||||
Capital One Financial Corp. | United States | 337,300 | 27,867,726 | |||||||||||||
|
| |||||||||||||||
| 95,483,908 | ||||||||||||||||
|
| |||||||||||||||
| Diversified Consumer Services 0.1% | ||||||||||||||||
| a | Affinion Group Inc., wts., 11/10/22 | United States | 546,721 | 7,107,373 | ||||||||||||
|
| |||||||||||||||
| Diversified Financial Services 1.4% | ||||||||||||||||
Voya Financial Inc. | United States | 2,043,200 | 75,373,648 | |||||||||||||
|
| |||||||||||||||
| Diversified Telecommunication Services 1.6% | ||||||||||||||||
Koninklijke KPN NV | Netherlands | 27,104,180 | 86,718,258 | |||||||||||||
|
| |||||||||||||||
| Energy Equipment & Services 0.0%† | ||||||||||||||||
| a,b | Gulfmark Offshore Inc. | United States | 58,392 | 12,204 | ||||||||||||
|
| |||||||||||||||
| Equity Real Estate Investment Trusts (REITs) 1.9% | ||||||||||||||||
Forest City Realty Trust Inc., A | United States | 4,212,730 | 101,821,684 | |||||||||||||
|
| |||||||||||||||
| Health Care Equipment & Supplies 2.1% | ||||||||||||||||
Medtronic PLC | United States | 1,245,243 | 110,515,316 | |||||||||||||
|
| |||||||||||||||
| Independent Power & Renewable Electricity Producers 3.5% | ||||||||||||||||
NRG Energy Inc. | United States | 8,524,843 | 146,797,796 | |||||||||||||
Vistra Energy Corp. | United States | 2,433,367 | 40,856,232 | |||||||||||||
|
| |||||||||||||||
| 187,654,028 | ||||||||||||||||
|
| |||||||||||||||
| Industrial Conglomerates 1.2% | ||||||||||||||||
General Electric Co. | United States | 2,439,600 | 65,893,596 | |||||||||||||
|
| |||||||||||||||
| Insurance 6.1% | ||||||||||||||||
Ageas | Belgium | 1,419,150 | 57,157,309 | |||||||||||||
American International Group Inc. | United States | 395,586 | 24,732,037 | |||||||||||||
ASR Nederland NV | Netherlands | 2,800,648 | 94,451,660 | |||||||||||||
The Hartford Financial Services Group Inc. | United States | 772,290 | 40,599,285 | |||||||||||||
RSA Insurance Group PLC | United Kingdom | 5,577,126 | 44,712,911 | |||||||||||||
| 18 | Semiannual Report | franklintempleton.com | ||
FRANKLIN MUTUAL QUEST FUND
STATEMENT OF INVESTMENTS (UNAUDITED)
| Country | Shares/ Warrants | Value | ||||||||||||
Common Stocks and Other Equity Interests (continued) |
| |||||||||||||
| Insurance (continued) | ||||||||||||||
White Mountains Insurance Group Ltd. | United States | 76,565 | $ | 66,506,656 | ||||||||||
|
| |||||||||||||
| 328,159,858 | ||||||||||||||
|
| |||||||||||||
| Internet & Direct Marketing Retail 0.1% | ||||||||||||||
Bluestem Group Inc. | United States | 4,150,000 | 2,946,500 | |||||||||||
|
| |||||||||||||
| Internet Software & Services 1.0% | ||||||||||||||
| a | Baidu Inc., ADR | China | 295,562 | 52,864,219 | ||||||||||
|
| |||||||||||||
| Marine 0.2% | ||||||||||||||
| a | Eagle Bulk Shipping Inc. | United States | 1,969,071 | 9,313,706 | ||||||||||
|
| |||||||||||||
| Media 3.7% | ||||||||||||||
| a,d | Lee Enterprises Inc./IA. | United States | 4,824,268 | 9,166,109 | ||||||||||
| a,b,d | Lee Enterprises Inc., wts., 12/31/22 | United States | 1,110,000 | 1,244,292 | ||||||||||
| d | New Media Investment Group Inc. | United States | 4,932,482 | 66,489,857 | ||||||||||
Sky PLC | United Kingdom | 4,251,818 | 55,049,767 | |||||||||||
Time Warner Inc. | United States | 668,740 | 67,148,184 | |||||||||||
|
| |||||||||||||
| 199,098,209 | ||||||||||||||
|
| |||||||||||||
| Metals & Mining 0.1% | ||||||||||||||
| b,c | Warrior Met Coal Inc. | United States | 431,052 | 7,051,586 | ||||||||||
|
| |||||||||||||
| Oil, Gas & Consumable Fuels 4.2% | ||||||||||||||
BP PLC | United Kingdom | 11,612,587 | 66,977,822 | |||||||||||
China Shenhua Energy Co. Ltd., H | China | 4,821,687 | 10,733,044 | |||||||||||
Kinder Morgan Inc. | United States | 2,458,870 | 47,111,949 | |||||||||||
Royal Dutch Shell PLC, A (EUR Traded) | United Kingdom | 3,801,481 | 100,891,984 | |||||||||||
|
| |||||||||||||
| 225,714,799 | ||||||||||||||
|
| |||||||||||||
| Pharmaceuticals 7.2% | ||||||||||||||
Eli Lilly & Co. | United States | 715,947 | 58,922,438 | |||||||||||
GlaxoSmithKline PLC. | United Kingdom | 3,498,070 | 74,520,108 | |||||||||||
Merck & Co. Inc. | United States | 1,103,270 | 70,708,574 | |||||||||||
Novartis AG, ADR | Switzerland | 1,362,606 | 113,736,723 | |||||||||||
Teva Pharmaceutical Industries Ltd., ADR | Israel | 2,025,380 | 67,283,124 | |||||||||||
|
| |||||||||||||
| 385,170,967 | ||||||||||||||
|
| |||||||||||||
| Software 2.5% | ||||||||||||||
| a | Check Point Software Technologies Ltd. | Israel | 846,738 | 92,362,181 | ||||||||||
Symantec Corp. | United States | 1,506,357 | 42,554,585 | |||||||||||
|
| |||||||||||||
| 134,916,766 | ||||||||||||||
|
| |||||||||||||
| Technology Hardware, Storage & Peripherals 0.5% | ||||||||||||||
| a,d | Eastman Kodak Co. | United States | 3,072,827 | 27,962,726 | ||||||||||
| a,d | Eastman Kodak Co., wts., 9/03/18 | United States | 48,582 | 21,862 | ||||||||||
| a,d | Eastman Kodak Co., wts., 9/03/18 | United States | 48,582 | 15,060 | ||||||||||
|
| |||||||||||||
| 27,999,648 | ||||||||||||||
|
| |||||||||||||
| Wireless Telecommunication Services 2.0% | ||||||||||||||
Vodafone Group PLC | United Kingdom | 38,443,437 | 109,037,228 | |||||||||||
|
| |||||||||||||
Total Common Stocks and Other Equity Interests (Cost $2,497,194,219) | 2,853,263,918 | |||||||||||||
|
| |||||||||||||
| Convertible Preferred Stocks (Cost $86,875,212) 1.2% | ||||||||||||||
| Pharmaceuticals 1.2% | ||||||||||||||
Teva Pharmaceutical Industries Ltd., 7.00%, cvt. pfd | Israel | 104,000 | 61,828,000 | |||||||||||
|
| |||||||||||||
| franklintempleton.com | Semiannual Report | 19 | ||||
FRANKLIN MUTUAL QUEST FUND
STATEMENT OF INVESTMENTS (UNAUDITED)
| Country | Shares | Value | ||||||||||||||
| Preferred Stocks 0.9% | ||||||||||||||||
| Automobiles 0.2% | ||||||||||||||||
| g | Volkswagen AG, 1.545%, pfd | Germany | 74,300 | $ | 11,317,304 | |||||||||||
|
| |||||||||||||||
| Technology Hardware, Storage & Peripherals 0.7% | ||||||||||||||||
| g | Samsung Electronics Co. Ltd., 1.909%, pfd | South Korea | 23,596 | 38,374,182 | ||||||||||||
|
| |||||||||||||||
Total Preferred Stocks (Cost $30,489,200) | 49,691,486 | |||||||||||||||
|
| |||||||||||||||
| Principal Amount* | ||||||||||||||||
| Corporate Bonds, Notes and Senior Floating Rate Interests 21.3% | ||||||||||||||||
Affinion Group Inc., | ||||||||||||||||
h,i,j senior note., 144A, PIK, 14.00%, 11/10/22 | United States | $ | 77,568,990 | 69,155,431 | ||||||||||||
k,l Term Loans, 8.935%, 5/10/22 | United States | 74,812,500 | 76,215,234 | |||||||||||||
| k,l | Avaya Inc., DIP Facility, 8.617% - 8.716%, 1/23/18 | United States | 6,999,000 | 7,228,658 | ||||||||||||
| k,l | Belk Inc., | |||||||||||||||
Closing Date Term Loan, 5.905%, 12/12/22 | United States | 7,226,643 | 6,189,620 | |||||||||||||
second lien Term Loan, 10.50%, 12/12/22 | United States | 25,000,000 | 21,962,500 | |||||||||||||
| k,l | Bluestem Brands Inc., Initial Term Loan, 8.672% - 8.726%, 11/09/20 | United States | 70,689,154 | 49,305,685 | ||||||||||||
CHS/Community Health Systems Inc., senior note, 6.875%, 2/01/22 | United States | 27,929,000 | 24,507,698 | |||||||||||||
| k,l | Cumulus Media Holdings Inc., Term Loans, 4.48%, 12/23/20 | United States | 20,080,856 | 16,240,392 | ||||||||||||
| k,l | Eagle Bulk Shipping Inc., Second Lien Loan, 15.00%, 1/14/20 | United States | 8,432,476 | 8,295,448 | ||||||||||||
| d,k,l | Eastman Kodak Co., Term Loan, 7.422%, 9/03/19 | United States | 37,968,616 | 37,984,449 | ||||||||||||
Frontier Communications Corp., | ||||||||||||||||
senior note, 8.50%, 4/15/20 | United States | 5,125,000 | 5,400,469 | |||||||||||||
senior note, 10.50%, 9/15/22 | United States | 8,213,000 | 7,853,681 | |||||||||||||
senior note, 11.00%, 9/15/25 | United States | 41,812,000 | 38,728,365 | |||||||||||||
iHeartCommunications Inc., | ||||||||||||||||
senior secured note, first lien, 9.00%, 12/15/19. | United States | 37,367,000 | 29,473,221 | |||||||||||||
k,l Tranche D Term Loan, 7.976%, 1/30/19 | United States | 46,662,631 | 38,263,358 | |||||||||||||
k,l Tranche E Term Loan, 8.726%, 7/30/19 | United States | 14,995,598 | 12,296,390 | |||||||||||||
| d | Lee Enterprises Inc., | |||||||||||||||
k,l Second Lien Term Loan, 12.00%, 12/15/22 | United States | 62,702,127 | 65,210,212 | |||||||||||||
h senior secured note, first lien, 144A, 9.50%, 3/15/22 | United States | 99,050,000 | 102,516,750 | |||||||||||||
Navistar International Corp., senior bond, 8.25%, 11/01/21 | United States | 40,000,000 | 40,600,000 | |||||||||||||
| d,k,l | New Media Holdings II LLC, Fourth Amendment Replacement Term Loans, 7.476%, 6/04/20 | United States | 111,563,387 | 111,005,570 | ||||||||||||
| c | Sorenson Communications LLC, | |||||||||||||||
k,l Initial Term Loan, 8.00%, 4/30/20 | United States | 141,356,784 | 142,328,612 | |||||||||||||
h,i secured note, second lien, 144A, PIK, 9.00%, 10/31/20 | United States | 96,671,937 | 96,188,577 | |||||||||||||
| c,h,i | Sorenson Holdings LLC/Finance Corp., senior note, 144A, PIK, 13.85%, 10/31/21 | United States | 56,682,637 | 54,131,918 | ||||||||||||
| k,l | Toys R Us-Delaware Inc., | |||||||||||||||
FILO Loans, 8.422%, 10/24/19 | United States | 9,228,000 | 9,239,535 | |||||||||||||
Term B-4 Loan, 9.952%, 4/24/20 | United States | 73,611,918 | 61,373,936 | |||||||||||||
| h | Valeant Pharmaceuticals International, | |||||||||||||||
senior bond, 144A, 6.75%, 8/15/21 | United States | 2,740,000 | 2,616,700 | |||||||||||||
senior bond, 144A, 7.25%, 7/15/22 | United States | 1,809,000 | 1,707,244 | |||||||||||||
| h | Valeant Pharmaceuticals International Inc., senior note, 144A, 7.50%, 7/15/21 | United States | 1,578,000 | 1,534,605 | ||||||||||||
| h | Veritas U.S. Inc./Veritas Bermuda Ltd., senior note, 144A, 7.50%, 2/01/23 | United States | 2,841,000 | 3,061,178 | ||||||||||||
|
| |||||||||||||||
Total Corporate Bonds, Notes and Senior Floating Rate Interests (Cost $1,155,324,690) | 1,140,615,436 | |||||||||||||||
|
| |||||||||||||||
| 20 | Semiannual Report | franklintempleton.com | ||
FRANKLIN MUTUAL QUEST FUND
STATEMENT OF INVESTMENTS (UNAUDITED)
| Country | Principal Amount* | Value | ||||||||||||||
Corporate Bonds, Notes and Senior Floating Rate Interests in Reorganization 4.6% | ||||||||||||||||
| m | Avaya Inc., | |||||||||||||||
h senior note, 144A, 10.50%, 3/01/21. | United States | $ | 92,902,380 | $ | 9,522,494 | |||||||||||
k,i Term B-3 Loan, 7.63%, 10/26/17 | United States | 17,350,320 | 13,865,803 | |||||||||||||
k,i,n Term B-6 Loan, 4.13%, 3/30/18 | United States | 8,399,638 | 6,705,708 | |||||||||||||
k,i Term B-7 Loan, 4.13%, 5/29/20 | United States | 35,237,649 | 28,425,049 | |||||||||||||
| b,m | Broadband Ventures III LLC, secured promissory note, 5.00%, 2/01/12 | United States | 9,272 | — | ||||||||||||
| k,l,m | Caesars Entertainment Operating Co. Inc., | |||||||||||||||
Term B-5-B Loans, 1.50%, 3/01/17 | United States | 6,915,434 | 8,047,836 | |||||||||||||
Term B-6-B Loans, 1.50%, 3/01/17 | United States | 32,968,325 | 39,273,517 | |||||||||||||
Term B-7 Loans, 1.50%, 3/01/17. | United States | 12,961,669 | 16,153,480 | |||||||||||||
| m | GenOn Americas Generation LLC, | |||||||||||||||
senior bond, 8.50%, 10/01/21 | United States | 28,630,000 | 25,767,000 | |||||||||||||
senior bond, 9.125%, 5/01/31 | United States | 90,639,000 | 81,121,905 | |||||||||||||
| m | Northern Telecom Ltd., 6.875%, 9/01/23 | Canada | 20,912,000 | 8,887,600 | ||||||||||||
| c,h,m | Sunshine Oilsands Ltd., secured note, 144A, 10.00%, 8/01/17 | Canada | 18,000,000 | 9,810,000 | ||||||||||||
|
| |||||||||||||||
Total Corporate Bonds, Notes and Senior Floating Rate Interests in Reorganization (Cost $270,875,693) | 247,580,392 | |||||||||||||||
|
| |||||||||||||||
| Shares | ||||||||||||||||
Companies in Liquidation 0.6% | ||||||||||||||||
| a | Adelphia Recovery Trust | United States | 49,534,842 | 32,198 | ||||||||||||
| a,e | Adelphia Recovery Trust, Arahova Contingent Value Vehicle, Contingent Distribution | United States | 5,918,407 | 592 | ||||||||||||
| a,b,c | CB FIM Coinvestors LLC | United States | 1,439,821 | — | ||||||||||||
| a,e,f | Century Communications Corp., Contingent Distribution | United States | 16,323,000 | — | ||||||||||||
| a,b | FIM Coinvestor Holdings I, LLC | United States | 17,934,688 | — | ||||||||||||
| a,o | Lehman Brothers Holdings Inc., Bankruptcy Claim | United States | 459,471,220 | 10,200,261 | ||||||||||||
| a,e,f | NewPage Corp., Litigation Trust, Contingent Distribution | United States | 723,000 | — | ||||||||||||
| a,e | Nortel Networks Corp., Contingent Distribution | Canada | 31,192,000 | 19,386,221 | ||||||||||||
| a,e,f | Tribune Media, Litigation Trust, Contingent Distribution | United States | 1,519,227 | — | ||||||||||||
| a,e,f | Tropicana, Litigation Trust, Contingent Distribution. | United States | 12,892,000 | — | ||||||||||||
| a,f | Vistra Energy Corp., Litigation Trust | United States | 144,840,133 | 1,680,146 | ||||||||||||
| a | Vistra Energy Corp., Litigation Trust, TRA. | United States | 2,433,367 | 2,615,869 | ||||||||||||
|
| |||||||||||||||
Total Companies in Liquidation (Cost $60,144,256) | 33,915,287 | |||||||||||||||
|
| |||||||||||||||
| Principal Amount* | ||||||||||||||||
Municipal Bonds in Reorganization (Cost $55,122,616) 0.9% | ||||||||||||||||
| m | Puerto Rico Commonwealth GO, Refunding, Series A, 8.00%, 7/01/35 | United States | $ | 74,239,000 | 45,285,790 | |||||||||||
|
| |||||||||||||||
Total Investments before Short Term Investments (Cost $4,156,025,886) | 4,432,180,309 | |||||||||||||||
|
| |||||||||||||||
| franklintempleton.com | Semiannual Report | 21 | ||||
FRANKLIN MUTUAL QUEST FUND
STATEMENT OF INVESTMENTS (UNAUDITED)
| \ | Country | Principal Amount* | Value | |||||||||||||
Short Term Investments 15.5% |
| |||||||||||||||
| U.S. Government and Agency Securities 15.5% | �� | |||||||||||||||
| p | FHLB, 7/03/17 - 7/05/17 | United States | $ | 48,900,000 | $ | 48,899,615 | ||||||||||
| p | U.S. Treasury Bill, | |||||||||||||||
8/17/17 | United States | 70,000,000 | 69,922,020 | |||||||||||||
8/24/17 | United States | 100,000,000 | 99,869,300 | |||||||||||||
7/20/17 - 12/07/17. | United States | 584,900,000 | 583,541,695 | |||||||||||||
q 12/14/17 | United States | 30,000,000 | 29,853,240 | |||||||||||||
|
| |||||||||||||||
Total U.S. Government and Agency Securities (Cost $832,160,778) | 832,085,870 | |||||||||||||||
|
| |||||||||||||||
Total Investments (Cost $4,988,186,664) 98.2% | 5,264,266,179 | |||||||||||||||
Other Assets, less Liabilities 1.8% | 96,802,940 | |||||||||||||||
|
| |||||||||||||||
Net Assets 100.0% | $ | 5,361,069,119 | ||||||||||||||
|
| |||||||||||||||
†Rounds to less than 0.1% of net assets.
*The principal amount is stated in U.S. dollars unless otherwise indicated.
aNon-income producing.
bSee Note 9 regarding restricted securities.
cAt June 30, 2017, pursuant to the Fund’s policies and the requirements of applicable securities law, the Fund is restricted from trading these securities at period end.
dSee Note 13 regarding holdings of 5% voting securities.
eContingent distributions represent the right to receive additional distributions, if any, during the reorganization of the underlying company. Shares represent total underlying principal of debt securities.
fSecurity has been deemed illiquid because it may not be able to be sold within seven days. At June 30, 2017, the aggregate value of these securities was $1,680,146, representing less than 0.1% of net assets.
gVariable rate security. The rate shown represents the yield at period end.
hSecurity was purchased pursuant to Rule 144A under the Securities Act of 1933 and may be sold in transactions exempt from registration only to qualified institutional buyers or in a public offering registered under the Securities Act of 1933. These securities have been deemed liquid under guidelines approved by the Trust’s Board of Trustees. At June 30, 2017, the aggregate value of these securities was $350,244,897, representing 6.5% of net assets.
iIncome may be received in additional securities and/or cash.
jSee Note 10 regarding unfunded loan commitments.
kThe coupon rate shown represents the rate at period end.
lSee Note 1(g) regarding senior floating rate interests.
mSee Note 8 regarding credit risk and defaulted securities.
nA portion or all of the security purchased on a delayed delivery basis. See Note 1(c).
oBankruptcy claims represent the right to receive distributions, if any, during the liquidation of the underlying pool of assets. Shares represent amount of allowed unsecured claims.
pThe security was issued on a discount basis with no stated coupon rate.
qA portion or all of the security has been segregated as collateral for open forward contracts. At June 30, 2017, the value of this security and/or cash pledged amounted to $13,628,004, representing 0.3% of net assets.
| 22 | Semiannual Report | franklintempleton.com | ||
FRANKLIN MUTUAL QUEST FUND
STATEMENT OF INVESTMENTS (UNAUDITED)
At June 30, 2017, the Fund had the following futures contracts outstanding. See Note 1(d).
| Futures Contracts | ||||||||||||||||||||||||
| Description | Type | Number of Contracts | Notional Value | Expiration Date | Unrealized Appreciation | Unrealized Depreciation | ||||||||||||||||||
| Currency Contracts | ||||||||||||||||||||||||
EUR/USD | Short | 814 | $ | 116,676,725 | 9/18/17 | $ — | $(2,035,489 | ) | ||||||||||||||||
GBP/USD | Short | 955 | 77,862,344 | 9/18/17 | — | (1,629,136 | ) | |||||||||||||||||
|
| |||||||||||||||||||||||
Total Futures Contracts | $ — | $(3,664,625 | ) | |||||||||||||||||||||
|
| |||||||||||||||||||||||
Net unrealized appreciation (depreciation) |
| $(3,664,625 | ) | |||||||||||||||||||||
|
| |||||||||||||||||||||||
At June 30, 2017, the Fund had the following forward exchange contracts outstanding. See Note 1(d).
| Forward Exchange Contracts | ||||||||||||||||||||||||||||
| Currency | Counterpartya | Type | Quantity | Contract Amount | Settlement Date | Unrealized Appreciation | Unrealized Depreciation | |||||||||||||||||||||
| OTC Forward Exchange Contracts | ||||||||||||||||||||||||||||
Euro | BOFA | Buy | 556,441 | $ | 633,393 | 7/12/17 | $ | 2,629 | $ | — | ||||||||||||||||||
Euro | BONY | Buy | 447,022 | 510,240 | 7/12/17 | 715 | — | |||||||||||||||||||||
Euro | BONY | Sell | 1,627,510 | 1,750,745 | 7/12/17 | — | (109,530 | ) | ||||||||||||||||||||
Euro | FBCO | Sell | 7,250,666 | 7,804,399 | 7/12/17 | — | (483,251 | ) | ||||||||||||||||||||
Euro | HSBK | Buy | 436,818 | 498,070 | 7/12/17 | 1,221 | — | |||||||||||||||||||||
Euro | SSBT | Buy | 2,802,309 | 3,145,430 | 7/12/17 | 57,663 | — | |||||||||||||||||||||
Euro | SSBT | Sell | 15,379,690 | 16,536,568 | 7/12/17 | — | (1,042,713 | ) | ||||||||||||||||||||
Euro | UBSW | Buy | 1,009,685 | 1,151,465 | 7/12/17 | 2,624 | — | |||||||||||||||||||||
Euro | UBSW | Sell | 3,234,856 | 3,476,901 | 7/12/17 | — | (220,602 | ) | ||||||||||||||||||||
British Pound | BOFA | Buy | 307,712 | 393,316 | 7/13/17 | 7,675 | — | |||||||||||||||||||||
British Pound | BONY | Sell | 974,064 | 1,224,889 | 7/13/17 | — | (44,450 | ) | ||||||||||||||||||||
British Pound | FBCO | Sell | 96,475 | 117,989 | 7/13/17 | — | (7,731 | ) | ||||||||||||||||||||
British Pound | SSBT | Sell | 522,754 | 640,160 | 7/13/17 | — | (41,060 | ) | ||||||||||||||||||||
British Pound | UBSW | Buy | 306,529 | 391,933 | 7/13/17 | 7,517 | — | |||||||||||||||||||||
British Pound | UBSW | Sell | 1,220,038 | 1,506,377 | 7/13/17 | — | (83,499 | ) | ||||||||||||||||||||
Euro | BOFA | Sell | 500,000 | 540,201 | 7/26/17 | — | (31,758 | ) | ||||||||||||||||||||
Euro | HSBK | Sell | 6,073,046 | 6,477,032 | 7/26/17 | — | (470,034 | ) | ||||||||||||||||||||
Euro | UBSW | Sell | 5,573,045 | 5,936,686 | 7/26/17 | — | (438,420 | ) | ||||||||||||||||||||
South Korean Won | HSBK | Buy | 9,864,052,943 | 8,779,439 | 8/11/17 | — | (162,137 | ) | ||||||||||||||||||||
South Korean Won | HSBK | Sell | 24,157,531,855 | 21,221,483 | 8/11/17 | 117,304 | — | |||||||||||||||||||||
South Korean Won | UBSW | Buy | 3,936,735,945 | 3,483,469 | 8/11/17 | — | (44,311 | ) | ||||||||||||||||||||
South Korean Won | UBSW | Sell | 754,773,380 | 658,185 | 8/11/17 | — | (1,190 | ) | ||||||||||||||||||||
South Korean Won | UBSW | Sell | 3,181,962,565 | 2,799,559 | 8/11/17 | 19,776 | — | |||||||||||||||||||||
British Pound | BOFA | Sell | 633,000 | 792,976 | 8/14/17 | — | (32,739 | ) | ||||||||||||||||||||
British Pound | HSBK | Sell | 5,546,804 | 6,975,080 | 8/14/17 | — | (260,431 | ) | ||||||||||||||||||||
British Pound | SSBT | Sell | 882,600 | 1,093,726 | 8/14/17 | — | (57,578 | ) | ||||||||||||||||||||
British Pound | UBSW | Sell | 6,012,471 | 7,536,008 | 8/14/17 | — | (306,941 | ) | ||||||||||||||||||||
Euro | BOFA | Sell | 53,003,153 | 56,743,884 | 8/18/17 | — | (3,958,485 | ) | ||||||||||||||||||||
Euro | BONY | Sell | 3,909,375 | 4,270,940 | 8/18/17 | — | (206,309 | ) | ||||||||||||||||||||
Euro | HSBK | Sell | 2,384,534 | 2,606,487 | 8/18/17 | — | (124,423 | ) | ||||||||||||||||||||
Euro | SSBT | Sell | 8,216,186 | 8,874,991 | 8/18/17 | — | (534,675 | ) | ||||||||||||||||||||
Euro | UBSW | Sell | 18,944,609 | 20,206,874 | 8/18/17 | — | (1,489,621 | ) | ||||||||||||||||||||
Euro | BOFA | Sell | 3,539,609 | 3,814,412 | 10/10/17 | — | (251,165 | ) | ||||||||||||||||||||
Euro | HSBK | Sell | 2,853,864 | 3,086,052 | 10/10/17 | — | (191,882 | ) | ||||||||||||||||||||
Euro | UBSW | Sell | 507,441 | 560,684 | 10/10/17 | — | (22,160 | ) | ||||||||||||||||||||
| franklintempleton.com | Semiannual Report | 23 |
FRANKLIN MUTUAL QUEST FUND
STATEMENT OF INVESTMENTS (UNAUDITED)
| Forward Exchange Contracts (continued) | ||||||||||||||||||||||||||||
| Currency | Counterpartya | Type | Quantity | Contract Amount | Settlement Date | Unrealized Appreciation | Unrealized Depreciation | |||||||||||||||||||||
| OTC Forward Exchange Contracts (continued) | ||||||||||||||||||||||||||||
Euro | BOFA | Sell | 229,835 | $ | 256,742 | 10/18/17 | $ | — | $ | (7,366 | ) | |||||||||||||||||
Euro | BONY | Sell | 1,866,388 | 2,053,545 | 10/18/17 | — | (91,161 | ) | ||||||||||||||||||||
Euro | HSBK | Sell | 3,172,562 | 3,419,503 | 10/18/17 | — | (226,157 | ) | ||||||||||||||||||||
Euro | UBSW | Sell | 2,942,725 | 3,163,559 | 10/18/17 | — | (217,990 | ) | ||||||||||||||||||||
British Pound | BOFA | Sell | 425,697 | 557,483 | 10/24/17 | 983 | — | |||||||||||||||||||||
British Pound | BOFA | Sell | 639,206 | 830,109 | 10/24/17 | — | (5,505 | ) | ||||||||||||||||||||
British Pound | BONY | Sell | 395,235 | 512,790 | 10/24/17 | — | (3,888 | ) | ||||||||||||||||||||
British Pound | HSBK | Sell | 3,425,008 | 4,454,263 | 10/24/17 | — | (23,139 | ) | ||||||||||||||||||||
British Pound | SSBT | Sell | 3,617,894 | 4,684,128 | 10/24/17 | — | (45,428 | ) | ||||||||||||||||||||
British Pound | SSBT | Sell | 3,997,149 | 5,228,431 | 10/24/17 | 3,087 | — | |||||||||||||||||||||
British Pound | UBSW | Sell | 1,199,878 | 1,559,374 | 10/24/17 | — | (9,187 | ) | ||||||||||||||||||||
Euro | BOFA | Sell | 12,202,117 | 13,442,889 | 11/06/17 | — | (594,119 | ) | ||||||||||||||||||||
Euro | SSBT | Sell | 2,895,943 | 3,234,855 | 11/06/17 | — | (96,565 | ) | ||||||||||||||||||||
Euro | UBSW | Sell | 14,679,565 | 16,168,800 | 11/06/17 | — | (718,202 | ) | ||||||||||||||||||||
South Korean Won | HSBK | Sell | 17,015,017,425 | 15,074,835 | 11/10/17 | 185,226 | — | |||||||||||||||||||||
South Korean Won | UBSW | Sell | 12,206,303,023 | 10,778,545 | 11/10/17 | 96,976 | — | |||||||||||||||||||||
Euro | BOFA | Sell | 16,741,542 | 18,718,272 | 11/20/17 | — | (556,264 | ) | ||||||||||||||||||||
Euro | UBSW | Sell | 15,350,354 | 17,157,551 | 11/20/17 | — | (515,310 | ) | ||||||||||||||||||||
British Pound | BOFA | Sell | 75,256 | 98,646 | 11/24/17 | 175 | — | |||||||||||||||||||||
British Pound | BOFA | Sell | 29,471,417 | 37,715,777 | 11/24/17 | — | (847,241 | ) | ||||||||||||||||||||
British Pound | BONY | Sell | 1,200,000 | 1,549,080 | 11/24/17 | — | (21,106 | ) | ||||||||||||||||||||
British Pound | BONY | Sell | 13,764,115 | 18,023,448 | 11/24/17 | 13,259 | — | |||||||||||||||||||||
British Pound | HSBK | Sell | 770,000 | 996,361 | 11/24/17 | — | (11,176 | ) | ||||||||||||||||||||
British Pound | SSBT | Sell | 80,000 | 104,162 | 11/24/17 | — | (517 | ) | ||||||||||||||||||||
British Pound | SSBT | Sell | 920,870 | 1,205,721 | 11/24/17 | 773 | — | |||||||||||||||||||||
British Pound | UBSW | Sell | 11,325,118 | 14,435,835 | 11/24/17 | — | (382,954 | ) | ||||||||||||||||||||
British Pound | UBSW | Sell | 13,764,116 | 18,020,545 | 11/24/17 | 10,354 | — | |||||||||||||||||||||
|
| |||||||||||||||||||||||||||
Total Forward Exchange Contracts |
| $ | 527,957 | $ | (14,990,370 | ) | ||||||||||||||||||||||
|
| |||||||||||||||||||||||||||
Net unrealized appreciation (depreciation) |
| $ | (14,462,413 | ) | ||||||||||||||||||||||||
|
| |||||||||||||||||||||||||||
aMay be comprised of multiple contracts with the same counterparty, currency and settlement date.
See Note 12 regarding other derivative information.
See Abbreviations on page 43.
| 24 | Semiannual Report | The accompanying notes are an integral part of these financial statements. | franklintempleton.com | ||
FRANKLIN MUTUAL QUEST FUND
Statement of Assets and Liabilities
June 30, 2017 (unaudited)
Assets: | ||||
Investments in securities: | ||||
Cost - Unaffiliated issuers | $ | 4,495,266,951 | ||
Cost - Non-controlled affiliates (Note 13) | 492,919,713 | |||
|
| |||
Total cost of investments | $ | 4,988,186,664 | ||
|
| |||
Value - Unaffiliated issuers | $ | 4,826,856,351 | ||
Value - Non-controlled affiliates (Note 13) | 437,409,828 | |||
|
| |||
Total value of investments | 5,264,266,179 | |||
Cash | 1,979,002 | |||
Foreign currency, at value (cost $12,350,766) | 12,351,800 | |||
Receivables: | ||||
Investment securities sold | 96,115,339 | |||
Capital shares sold | 4,461,403 | |||
Dividends and interest | 25,127,291 | |||
European Union tax reclaims | 713,494 | |||
Due from brokers | 3,789,870 | |||
Unrealized appreciation on OTC forward exchange contracts | 527,957 | |||
Unrealized appreciation on unfunded loan commitments (Note 10) | 164,988 | |||
Other assets | 3,484 | |||
|
| |||
Total assets | 5,409,500,807 | |||
|
| |||
Liabilities: | ||||
Payables: | ||||
Investment securities purchased | 888,720 | |||
Capital shares redeemed | 27,306,544 | |||
Management fees | 2,981,087 | |||
Distribution fees | 1,071,276 | |||
Transfer agent fees | 354,097 | |||
Trustees’ fees and expenses | 249,650 | |||
Variation margin | 4,125 | |||
Unrealized depreciation on OTC forward exchange contracts | 14,990,370 | |||
Accrued expenses and other liabilities | 585,819 | |||
|
| |||
Total liabilities | 48,431,688 | |||
|
| |||
Net assets, at value | $ | 5,361,069,119 | ||
|
| |||
Net assets consist of: | ||||
Paid-in capital | $ | 5,191,671,870 | ||
Undistributed net investment income | 47,731,480 | |||
Net unrealized appreciation (depreciation) | 258,127,563 | |||
Accumulated net realized gain (loss) | (136,461,794 | ) | ||
|
| |||
Net assets, at value | $ | 5,361,069,119 | ||
|
|
| franklintempleton.com | The accompanying notes are an integral part of these consolidated financial statements. | Semiannual Report | 25 | ||||
FRANKLIN MUTUAL QUEST FUND
FINANCIAL STATEMENTS
Statement of Assets and Liabilities (continued)
June 30, 2017 (unaudited)
| Class Z: | ||||
Net assets, at value | $ | 3,798,549,072 | ||
|
| |||
Shares outstanding | 237,786,568 | |||
|
| |||
Net asset value and maximum offering price per share | $15.97 | |||
|
| |||
| Class A: | ||||
Net assets, at value | $ | 1,200,260,529 | ||
|
| |||
Shares outstanding | 76,322,612 | |||
|
| |||
Net asset value per sharea | $15.73 | |||
|
| |||
Maximum offering price per share (net asset value per share ÷ 94.25%) | $16.69 | |||
|
| |||
| Class C: | ||||
Net assets, at value | $ | 328,774,831 | ||
|
| |||
Shares outstanding | 21,313,616 | |||
|
| |||
Net asset value and maximum offering price per sharea | $15.43 | |||
|
| |||
| Class R: | ||||
Net assets, at value | $ | 1,502,089 | ||
|
| |||
Shares outstanding | 96,636 | |||
|
| |||
Net asset value and maximum offering price per share | $15.54 | |||
|
| |||
| Class R6: | ||||
Net assets, at value | $ | 31,982,598 | ||
|
| |||
Shares outstanding | 2,003,282 | |||
|
| |||
Net asset value and maximum offering price per share | $15.97 | |||
|
| |||
aRedemption price is equal to net asset value less contingent deferred sales charges, if applicable.
| 26 | Semiannual Report | The accompanying notes are an integral part of these consolidated financial statements. | franklintempleton.com | ||
FRANKLIN MUTUAL QUEST FUND
FINANCIAL STATEMENTS
Statement of Operations
for the six months ended June 30, 2017 (unaudited)
Investment income: | ||||
Dividends: (net of foreign taxes of $4,052,820) | ||||
Unaffiliated issuers | $ | 51,707,288 | ||
Non-controlled affiliates (Note 13) | 3,883,790 | |||
Interest: | ||||
Unaffiliated issuers | 54,239,222 | |||
Non-controlled affiliates (Note 13) | 11,473,918 | |||
|
| |||
Total investment income | 121,304,218 | |||
|
| |||
Expenses: | ||||
Management fees (Note 3a) | 17,895,658 | |||
Distribution fees: (Note 3c) | ||||
Class A | 1,501,526 | |||
Class C | 1,684,797 | |||
Class R | 2,724 | |||
Transfer agent fees: (Note 3e) | ||||
Class Z | 1,377,935 | |||
Class A | 444,341 | |||
Class C | 124,680 | |||
Class R | 403 | |||
Class R6 | 440 | |||
Custodian fees (Note 4) | 52,628 | |||
Reports to shareholders | 141,638 | |||
Registration and filing fees | 70,936 | |||
Professional fees | 253,067 | |||
Trustees’ fees and expenses | 78,692 | |||
Other | 77,503 | |||
|
| |||
Total expenses | 23,706,968 | |||
Expense reductions (Note 4) | (5,381 | ) | ||
|
| |||
Net expenses | 23,701,587 | |||
|
| |||
Net investment income | 97,602,631 | |||
|
| |||
Realized and unrealized gains (losses): | ||||
Net realized gain (loss) from: | ||||
Investments: | ||||
Unaffiliated issuers | (61,230,108 | ) | ||
Non-controlled affiliates (Note 13) | 48,919 | |||
Foreign currency transactions | 42,799 | |||
Futures contracts | (6,126,709 | ) | ||
Securities sold short | 3,216,360 | |||
|
| |||
Net realized gain (loss) | (64,048,739 | ) | ||
|
| |||
Net change in unrealized appreciation (depreciation) on: | ||||
Investments | 142,902,172 | |||
Translation of other assets and liabilities denominated in foreign currencies | (21,422,741 | ) | ||
Futures contracts | (5,640,487 | ) | ||
|
| |||
Net change in unrealized appreciation (depreciation) | 115,838,944 | |||
|
| |||
Net realized and unrealized gain (loss) | 51,790,205 | |||
|
| |||
Net increase (decrease) in net assets resulting from operations | $ | 149,392,836 | ||
|
|
| franklintempleton.com | The accompanying notes are an integral part of these financial statements. | Semiannual Report | 27 | ||||
FRANKLIN MUTUAL QUEST FUND
FINANCIAL STATEMENTS
Statements of Changes in Net Assets
| Six Months Ended June 30, 2017 (unaudited) | Year Ended December 31, 2016 | |||||||
Increase (decrease) in net assets: | ||||||||
Operations: | ||||||||
Net investment income | $ | 97,602,631 | $ | 280,468,001 | ||||
Net realized gain (loss) | (64,048,739 | ) | 221,052,860 | |||||
Net change in unrealized appreciation (depreciation) | 115,838,944 | 243,294,468 | ||||||
|
| |||||||
Net increase (decrease) in net assets resulting from operations | 149,392,836 | 744,815,329 | ||||||
|
| |||||||
Distributions to shareholders from: | ||||||||
Net investment income: | ||||||||
Class Z | — | (222,278,713 | ) | |||||
Class A | — | (72,209,924 | ) | |||||
Class C | — | (18,316,353 | ) | |||||
Class R | — | (51,119 | ) | |||||
Class R6 | — | (3,177,032 | ) | |||||
Net realized gains: | ||||||||
Class Z | — | (61,002,060 | ) | |||||
Class A | — | (20,589,851 | ) | |||||
Class C | — | (5,930,239 | ) | |||||
Class R | — | (15,198 | ) | |||||
Class R6 | — | (865,361 | ) | |||||
|
| |||||||
Total distributions to shareholders | — | (404,435,850 | ) | |||||
|
| |||||||
Capital share transactions: (Note 2) | ||||||||
Class Z | 7,544,228 | (125,329,991 | ) | |||||
Class A | (47,720,277 | ) | (71,220,397 | ) | ||||
Class C | (22,886,709 | ) | (17,124,219 | ) | ||||
Class R | 591,506 | (83,695 | ) | |||||
Class R6 | (21,813,732 | ) | 7,856,691 | |||||
|
| |||||||
Total capital share transactions | (84,284,984 | ) | (205,901,611 | ) | ||||
| �� | |||||||
Net increase (decrease) in net assets | 65,107,852 | 134,477,868 | ||||||
Net assets: | ||||||||
Beginning of period | 5,295,961,267 | 5,161,483,399 | ||||||
|
| |||||||
End of period | $ | 5,361,069,119 | $ | 5,295,961,267 | ||||
|
| |||||||
Undistributed net investment income included in net assets: | ||||||||
End of period | $ | 47,731,480 | $ | — | ||||
|
| |||||||
Distributions in excess of net investment income included in net assets: | ||||||||
End of period | $ | — | $ | (49,871,151 | ) | |||
|
| |||||||
| 28 | Semiannual Report | The accompanying notes are an integral part of these financial statements. | franklintempleton.com | ||
FRANKLIN MUTUAL QUEST FUND
Notes to Financial Statements (unaudited)
1. Organization and Significant Accounting Policies
Franklin Mutual Series Funds (Trust) is registered under the Investment Company Act of 1940 (1940 Act) as an open-end management investment company, consisting of seven separate funds and applies the specialized accounting and reporting guidance in U.S. Generally Accepted Accounting Principles (U.S. GAAP). Franklin Mutual Quest Fund (Fund) is included in this report. The Fund offers five classes of shares: Class Z, Class A, Class C, Class R and Class R6. Each class of shares may differ by its initial sales load, contingent deferred sales charges, voting rights on matters affecting a single class, its exchange privilege and fees primarily due to differing arrangements for distribution and transfer agent fees.
The following summarizes the Fund’s significant accounting policies.
a. Financial Instrument Valuation
The Fund’s investments in financial instruments are carried at fair value daily. Fair value is the price that would be received to sell an asset or paid to transfer a liability in an orderly transaction between market participants on the measurement date. The Fund calculates the net asset value (NAV) per share as of 4 p.m. Eastern time each day the New York Stock Exchange (NYSE) is open for trading. Under compliance policies and procedures approved by the Trust’s Board of Trustees (the Board), the Fund’s administrator has responsibility for oversight of valuation, including leading the cross-functional Valuation Committee (VC). The VC provides administration and oversight of the Fund’s valuation policies and procedures, which are approved annually by the Board. Among other things, these procedures allow the Fund to utilize independent pricing services, quotations from securities and financial instrument dealers, and other market sources to determine fair value.
Equity securities and derivative financial instruments listed on an exchange or on the NASDAQ National Market System are valued at the last quoted sale price or the official closing price of the day, respectively. Foreign equity securities are valued as of the close of trading on the foreign stock exchange on which the security is primarily traded, or as of 4 p.m. Eastern time. The value is then converted into its U.S. dollar equivalent at the foreign exchange rate in effect at 4 p.m. Eastern time on the day that the value of the security is determined. Over-the-counter (OTC) securities are valued within the range of the most recent
quoted bid and ask prices. Securities that trade in multiple markets or on multiple exchanges are valued according to the broadest and most representative market. Certain equity securities are valued based upon fundamental characteristics or relationships to similar securities.
Debt securities generally trade in the OTC market rather than on a securities exchange. The Fund’s pricing services use multiple valuation techniques to determine fair value. In instances where sufficient market activity exists, the pricing services may utilize a market-based approach through which quotes from market makers are used to determine fair value. In instances where sufficient market activity may not exist or is limited, the pricing services also utilize proprietary valuation models which may consider market characteristics such as benchmark yield curves, credit spreads, estimated default rates, anticipated market interest rate volatility, coupon rates, anticipated timing of principal repayments, underlying collateral, and other unique security features in order to estimate the relevant cash flows, which are then discounted to calculate the fair value.
Certain derivative financial instruments trade in the OTC market. The Fund’s pricing services use various techniques including industry standard option pricing models and proprietary discounted cash flow models to determine the fair value of those instruments. The Fund’s net benefit or obligation under the derivative contract, as measured by the fair value of the contract, is included in net assets.
The Fund has procedures to determine the fair value of financial instruments for which market prices are not reliable or readily available. Under these procedures, the VC convenes on a regular basis to review such financial instruments and considers a number of factors, including significant unobservable valuation inputs, when arriving at fair value. The VC primarily employs a market-based approach which may use related or comparable assets or liabilities, recent transactions, market multiples, book values, and other relevant information for the investment to determine the fair value of the investment. An income-based valuation approach may also be used in which the anticipated future cash flows of the investment are discounted to calculate fair value. Discounts may also be applied due to the nature or duration of any restrictions on the disposition of the investments. Due to the inherent uncertainty of valuations of such investments, the fair values may differ significantly from the values that would have been used had an active market existed. The VC employs various methods for calibrating these
| franklintempleton.com | Semiannual Report | 29 | ||||
FRANKLIN MUTUAL QUEST FUND
NOTES TO FINANCIAL STATEMENTS (UNAUDITED)
1. Organization and Significant Accounting
Policies (continued)
a. Financial Instrument Valuation (continued)
valuation approaches including a regular review of key inputs and assumptions, transactional back-testing or disposition analysis, and reviews of any related market activity.
Trading in securities on foreign securities stock exchanges and OTC markets may be completed before 4 p.m. Eastern time. In addition, trading in certain foreign markets may not take place on every Fund’s business day. Occasionally, events occur between the time at which trading in a foreign security is completed and 4 p.m. Eastern time that might call into question the reliability of the value of a portfolio security held by the Fund. As a result, differences may arise between the value of the Fund’s portfolio securities as determined at the foreign market close and the latest indications of value at 4 p.m. Eastern time. In order to minimize the potential for these differences, the VC monitors price movements following the close of trading in foreign stock markets through a series of country specific market proxies (such as baskets of American Depositary Receipts, futures contracts and exchange traded funds). These price movements are measured against established trigger thresholds for each specific market proxy to assist in determining if an event has occurred that may call into question the reliability of the values of the foreign securities held by the Fund. If such an event occurs, the securities may be valued using fair value procedures, which may include the use of independent pricing services.
When the last day of the reporting period is a non-business day, certain foreign markets may be open on those days that the Fund’s NAV is not calculated, which could result in differences between the value of the Fund’s portfolio securities on the last business day and the last calendar day of the reporting period. Any significant security valuation changes due to an open foreign market are adjusted and reflected by the Fund for financial reporting purposes.
b. Foreign Currency Translation
Portfolio securities and other assets and liabilities denominated in foreign currencies are translated into U.S. dollars based on the exchange rate of such currencies against U.S. dollars on the date of valuation. The Fund may enter into foreign currency exchange contracts to facilitate transactions denominated in a foreign currency. Purchases and sales of securities, income and
expense items denominated in foreign currencies are translated into U.S. dollars at the exchange rate in effect on the transaction date. Portfolio securities and assets and liabilities denominated in foreign currencies contain risks that those currencies will decline in value relative to the U.S. dollar. Occasionally, events may impact the availability or reliability of foreign exchange rates used to convert the U.S. dollar equivalent value. If such an event occurs, the foreign exchange rate will be valued at fair value using procedures established and approved by the Board.
The Fund does not separately report the effect of changes in foreign exchange rates from changes in market prices on securities held. Such changes are included in net realized and unrealized gain or loss from investments in the Statement of Operations.
Realized foreign exchange gains or losses arise from sales of foreign currencies, currency gains or losses realized between the trade and settlement dates on securities transactions and the difference between the recorded amounts of dividends, interest, and foreign withholding taxes and the U.S. dollar equivalent of the amounts actually received or paid. Net unrealized foreign exchange gains and losses arise from changes in foreign exchange rates on foreign denominated assets and liabilities other than investments in securities held at the end of the reporting period.
c. Securities Purchased on a Delayed Delivery Basis
The Fund purchases securities on a delayed delivery basis, with payment and delivery scheduled for a future date. These transactions are subject to market fluctuations and are subject to the risk that the value at delivery may be more or less than the trade date purchase price. Although the Fund will generally purchase these securities with the intention of holding the securities, it may sell the securities before the settlement date. Sufficient assets have been segregated for these securities.
d. Derivative Financial Instruments
The Fund invested in derivative financial instruments in order to manage risk or gain exposure to various other investments or markets. Derivatives are financial contracts based on an underlying or notional amount, require no initial investment or an initial net investment that is smaller than would normally be required to have a similar response to changes in market factors, and require or permit net settlement. Derivatives contain various risks including the potential inability of the counterparty to fulfill their obligations under the terms of the contract, the
| 30 | Semiannual Report | franklintempleton.com | ||
FRANKLIN MUTUAL QUEST FUND
NOTES TO FINANCIAL STATEMENTS (UNAUDITED)
potential for an illiquid secondary market, and/or the potential for market movements which expose the Fund to gains or losses in excess of the amounts shown in the Statement of Assets and Liabilities. Realized gain and loss and unrealized appreciation and depreciation on these contracts for the period are included in the Statement of Operations.
Derivative counterparty credit risk is managed through a formal evaluation of the creditworthiness of all potential counterparties. The Fund attempts to reduce its exposure to counterparty credit risk on OTC derivatives, whenever possible, by entering into International Swaps and Derivatives Association (ISDA) master agreements with certain counterparties. These agreements contain various provisions, including but not limited to collateral requirements, events of default, or early termination. Termination events applicable to the counterparty include certain deteriorations in the credit quality of the counterparty. Termination events applicable to the Fund include failure of the Fund to maintain certain net asset levels and/or limit the decline in net assets over various periods of time. In the event of default or early termination, the ISDA master agreement gives the non-defaulting party the right to net and close-out all transactions traded, whether or not arising under the ISDA agreement, to one net amount payable by one counterparty to the other. However, absent an event of default or early termination, OTC derivative assets and liabilities are presented gross and not offset in the Statement of Assets and Liabilities. Early termination by the counterparty may result in an immediate payment by the Fund of any net liability owed to that counterparty under the ISDA agreement. At June 30, 2017, the Fund had OTC derivatives in a net liability position of $14,462,413 and the aggregate value of collateral pledged for such contracts was $13,628,004.
Collateral requirements differ by type of derivative. Collateral or initial margin requirements are set by the broker or exchange clearing house for exchange traded and centrally cleared derivatives. Initial margin deposited is held at the exchange and can be in the form of cash and/or securities. For OTC derivatives traded under an ISDA master agreement, posting of collateral is required by either the Fund or the applicable counterparty if the total net exposure of all OTC derivatives with the applicable counterparty exceeds the minimum transfer amount, which typically ranges from $100,000 to $250,000, and can vary depending on the counterparty and the type of the agreement. Generally, collateral is determined at the close of Fund business each day and any additional collateral required
due to changes in derivative values may be delivered by the Fund or the counterparty the next business day, or within a few business days. Collateral pledged and/or received by the Fund for OTC derivatives, if any, is held in segregated accounts with the Fund’s custodian/counterparty broker and can be in the form of cash and/or securities. Unrestricted cash may be invested according to the Fund’s investment objectives. To the extent that the amounts due to the Fund from its counterparties are not subject to collateralization or are not fully collateralized, the Fund bears the risk of loss from counterparty non-performance.
The Fund entered into exchange traded futures contracts primarily to manage exposure to certain foreign currencies. A futures contract is an agreement between the Fund and a counterparty to buy or sell an asset at a specified price on a future date. Required initial margins are pledged by the Fund, and the daily change in fair value is accounted for as a variation margin payable or receivable in the Statement of Assets and Liabilities.
The Fund entered into OTC forward exchange contracts primarily to manage exposure to certain foreign currencies. A forward exchange contract is an agreement between the Fund and a counterparty to buy or sell a foreign currency at a specific exchange rate on a future date.
See Note 12 regarding other derivative information.
e. Securities Sold Short
The Fund is engaged in selling securities short, which obligates the Fund to replace a borrowed security with the same security at current fair value. The Fund incurs a loss if the price of the security increases between the date of the short sale and the date on which the Fund replaces the borrowed security. The Fund realizes a gain if the price of the security declines between those dates. Gains are limited to the price at which the Fund sold the security short, while losses are potentially unlimited in size.
The Fund is required to establish a margin account with the broker lending the security sold short. While the short sale is outstanding, the broker retains the proceeds of the short sale to the extent necessary to meet margin requirements until the short position is closed out. A deposit must also be maintained with the Fund’s custodian/counterparty broker consisting of cash and/or securities having a value equal to a specified percentage of the value of the securities sold short. The Fund is obligated to pay fees for borrowing the securities sold short and is required to pay the counterparty any dividends and/or interest due on
| franklintempleton.com | Semiannual Report | 31 | ||||
FRANKLIN MUTUAL QUEST FUND
NOTES TO FINANCIAL STATEMENTS (UNAUDITED)
1. Organization and Significant Accounting
Policies (continued)
e. Securities Sold Short (continued)
securities sold short. Such dividends and/or interest and any security borrowing fees are recorded as an expense to the Fund. At June 30, 2017, the Fund had no securities sold short.
f. Securities Lending
The Fund participates in an agency based securities lending program to earn additional income. The Fund receives cash collateral against the loaned securities in an amount equal to at least 102% of the fair value of the loaned securities. Collateral is maintained over the life of the loan in an amount not less than 100% of the fair value of loaned securities, as determined at the close of Fund business each day; any additional collateral required due to changes in security values is delivered to the Fund on the next business day. The collateral is deposited into a joint cash account with other funds and is used to invest in a money market fund managed by Franklin Advisers, Inc., an affiliate of the Fund, and/or a joint repurchase agreement. The Fund may receive income from the investment of cash collateral, in addition to lending fees and rebates paid by the borrower. Income from securities loaned, net of fees paid to the securities lending agent and/or third-party vendor, is reported separately in the Statement of Operations, if any. The Fund bears the market risk with respect to the collateral investment, securities loaned, and the risk that the agent may default on its obligations to the Fund. If the borrower defaults on its obligation to return the securities loaned, the Fund has the right to repurchase the securities in the open market using the collateral received. The securities lending agent has agreed to indemnify the Fund in the event of default by a third party borrower. At June 30, 2017, the Fund had no securities on loan.
g. Senior Floating Rate Interests
The Fund invests in senior secured corporate loans that pay interest at rates which are periodically reset by reference to a base lending rate plus a spread. These base lending rates are generally the prime rate offered by a designated U.S. bank or the London InterBank Offered Rate (LIBOR). Senior secured corporate loans often require prepayment of principal from excess cash flows or at the discretion of the borrower. As a result, actual maturity may be substantially less than the stated
maturity. Senior secured corporate loans in which the Fund invests are generally readily marketable, but may be subject to certain restrictions on resale.
h. Income and Deferred Taxes
It is the Fund’s policy to qualify as a regulated investment company under the Internal Revenue Code. The Fund intends to distribute to shareholders substantially all of its taxable income and net realized gains to relieve it from federal income and excise taxes. As a result, no provision for U.S. federal income taxes is required.
The Fund may be subject to foreign taxation related to income received, capital gains on the sale of securities and certain foreign currency transactions in the foreign jurisdictions in which it invests. Foreign taxes, if any, are recorded based on the tax regulations and rates that exist in the foreign markets in which the Fund invests. When a capital gain tax is determined to apply, the Fund records an estimated deferred tax liability in an amount that would be payable if the securities were disposed of on the valuation date. As a result of several court cases, in certain countries across the European Union, the Fund filed additional tax reclaims for previously withheld taxes on dividends earned in those countries (EU reclaims). These additional filings are subject to various administrative proceedings by the local jurisdictions’ tax authorities within the European Union, as well as a number of related judicial proceedings. Income recognized, if any, for EU reclaims is reflected as other income in the Statement of Operations and any related receivable, if any, is reflected as European Union tax reclaims in the Statement of Assets and Liabilities. When uncertainty exists as to the ultimate resolution of these proceedings, the likelihood of receipt of these EU reclaims, and the potential timing of payment, no amounts are reflected in the financial statements. For U.S. income tax purposes, EU reclaims received by the Fund, if any, reduce the amounts of foreign taxes Fund shareholders can use as tax credits in their individual income tax returns.
The Fund may recognize an income tax liability related to its uncertain tax positions under U.S. GAAP when the uncertain tax position has a less than 50% probability that it will be sustained upon examination by the tax authorities based on its technical merits. As of June 30, 2017, the Fund has determined that no tax liability is required in its financial statements related to uncertain tax positions for any open tax years (or expected to
| 32 | Semiannual Report | franklintempleton.com | ||
FR A N K L I N MUTUAL QUEST FUND
NOTES TO FINANCIAL STATEMENTS (UNAUDITED)
be taken in future tax years). Open tax years are those that remain subject to examination and are based on each tax jurisdiction’s statute of limitation.
i. Security Transactions, Investment Income, Expenses and Distributions
Security transactions are accounted for on trade date. Realized gains and losses on security transactions are determined on a specific identification basis. Interest income and estimated expenses are accrued daily. Amortization of premium and accretion of discount on debt securities are included in interest income. Dividend income is recorded on the ex-dividend date except for certain dividends from securities where the dividend rate is not available. In such cases, the dividend is recorded as soon as the information is received by the Fund. Distributions to shareholders are recorded on the ex-dividend date. Distributable earnings are determined according to income tax regulations (tax basis) and may differ from earnings recorded in accordance with U.S. GAAP. These differences may be permanent or temporary. Permanent differences are reclassified among capital accounts to reflect their tax character. These reclassifications have no impact on net assets or the results of operations. Temporary differences are not reclassified, as they may reverse in subsequent periods.
Common expenses incurred by the Trust are allocated among the Funds based on the ratio of net assets of each Fund to the combined net assets of the Trust. Fund specific expenses are charged directly to the Fund that incurred the expense.
Realized and unrealized gains and losses and net investment income, not including class specific expenses, are allocated daily to each class of shares based upon the relative proportion
of net assets of each class. Differences in per share distributions, by class, are generally due to differences in class specific expenses.
Distributions received by the Fund from certain securities may be a return of capital (ROC). Such distributions reduce the cost basis of the securities, and any distributions in excess of the cost basis are recognized as capital gains.
j. Accounting Estimates
The preparation of financial statements in accordance with U.S. GAAP requires management to make estimates and assumptions that affect the reported amounts of assets and liabilities at the date of the financial statements and the amounts of income and expenses during the reporting period. Actual results could differ from those estimates.
k. Guarantees and Indemnifications
Under the Trust’s organizational documents, its officers and trustees are indemnified by the Trust against certain liabilities arising out of the performance of their duties to the Trust. Additionally, in the normal course of business, the Trust, on behalf of the Fund enters into contracts with service providers that contain general indemnification clauses. The Trust’s maximum exposure under these arrangements is unknown as this would involve future claims that may be made against the Trust that have not yet occurred. Currently, the Trust expects the risk of loss to be remote.
2. Shares of Beneficial Interest
At June 30, 2017, there were an unlimited number of shares authorized (without par value). Transactions in the Fund’s shares were as follows:
| Six Months Ended June 30, 2017 | Year Ended December 31, 2016 | |||||||||||||||||||
| Shares | Amount | Shares | Amount | |||||||||||||||||
| Class Z Shares: | ||||||||||||||||||||
Shares sold | 18,098,253 | $ | 284,439,855 | 19,828,497 | $ | 304,660,334 | ||||||||||||||
Shares issued in reinvestment of distributions | — | — | 17,429,676 | 268,009,103 | ||||||||||||||||
Shares redeemed | (17,592,739 | ) | (276,895,627 | ) | (47,272,331 | ) | (697,999,428 | ) | ||||||||||||
|
| |||||||||||||||||||
Net increase (decrease) | 505,514 | $ | 7,544,228 | (10,014,158 | ) | $ | (125,329,991 | ) | ||||||||||||
|
| |||||||||||||||||||
| franklintempleton.com | Semiannual Report | 33 | ||||
FRANKLIN MUTUAL QUEST FUND
NOTES TO FINANCIAL STATEMENTS (UNAUDITED)
2. Shares of Beneficial Interest (continued)
| Six Months Ended June 30, 2017 | Year Ended December 31, 2016 | |||||||||||||||||||
| Shares | Amount | Shares | Amount | |||||||||||||||||
| Class A Shares: | ||||||||||||||||||||
Shares sold | 8,745,053 | $ | 135,548,652 | 10,500,328 | $ | 158,786,624 | ||||||||||||||
Shares issued in reinvestment of distributions | — | — | 6,003,992 | 91,123,764 | ||||||||||||||||
Shares redeemed | (11,806,372 | ) | (183,268,929 | ) | (21,323,796 | ) | (321,130,785 | ) | ||||||||||||
|
| |||||||||||||||||||
Net increase (decrease) | (3,061,319 | ) | $ | (47,720,277 | ) | (4,819,476 | ) | $ | (71,220,397 | ) | ||||||||||
|
| |||||||||||||||||||
| Class C Shares: | ||||||||||||||||||||
Shares sold | 2,003,441 | $ | 30,524,849 | 2,376,846 | $ | 35,487,953 | ||||||||||||||
Shares issued in reinvestment of distributions | — | — | 1,572,193 | 23,466,576 | ||||||||||||||||
Shares redeemed | (3,502,131 | ) | (53,411,558 | ) | (5,145,604 | ) | (76,078,748 | ) | ||||||||||||
|
| |||||||||||||||||||
Net increase (decrease) | (1,498,690 | ) | $ | (22,886,709 | ) | (1,196,565 | ) | $ | (17,124,219 | ) | ||||||||||
|
| |||||||||||||||||||
| Class R Shares: | ||||||||||||||||||||
Shares sold | 66,561 | $ | 1,023,507 | 17,052 | $ | 252,213 | ||||||||||||||
Shares issued in reinvestment of distributions | — | — | 4,419 | 66,317 | ||||||||||||||||
Shares redeemed | (28,067 | ) | (432,001 | ) | (26,855 | ) | (402,225 | ) | ||||||||||||
|
| |||||||||||||||||||
Net increase (decrease) | 38,494 | $ | 591,506 | (5,384 | ) | $ | (83,695 | ) | ||||||||||||
|
| |||||||||||||||||||
| Class R6 Shares: | ||||||||||||||||||||
Shares sold | 429,427 | $ | 6,756,952 | 745,561 | $ | 11,522,145 | ||||||||||||||
Shares issued in reinvestment of distributions | — | — | 250,829 | 3,854,293 | ||||||||||||||||
Shares redeemed | (1,797,379 | ) | (28,570,684 | ) | (490,186 | ) | (7,519,747 | ) | ||||||||||||
|
| |||||||||||||||||||
Net increase (decrease) | (1,367,952 | ) | $ | (21,813,732 | ) | 506,204 | $ | 7,856,691 | ||||||||||||
|
| |||||||||||||||||||
3. Transactions with Affiliates
Franklin Resources, Inc. is the holding company for various subsidiaries that together are referred to as Franklin Templeton Investments. Certain officers and trustees of the Fund are also officers and/or directors of the following subsidiaries:
| Subsidiary | Affiliation | |
Franklin Mutual Advisers, LLC (Franklin Mutual) | Investment manager | |
Franklin Templeton Services, LLC (FT Services) | Administrative manager | |
Franklin Templeton Distributors, Inc. (Distributors) | Principal underwriter | |
Franklin Templeton Investor Services, LLC (Investor Services) | Transfer agent |
a. Management Fees
The Fund pays an investment management fee to Franklin Mutual based on the average daily net assets of the Fund as follows:
| Annualized Fee Rate | Net Assets | |
0.675% | Up to and including $5 billion | |
0.645% | Over $5 billion, up to and including $7 billion | |
0.625% | Over $7 billion, up to and including $10 billion | |
0.615% | In excess of $10 billion |
For the period ended June 30, 2017, the annualized effective investment management fee rate was 0.673% of the Fund’s average daily net assets.
| 34 | Semiannual Report | franklintempleton.com | ||
FRANKLIN MUTUAL QUEST FUND
NOTES TO FINANCIAL STATEMENTS (UNAUDITED)
b. Administrative Fees
Under an agreement with Franklin Mutual, FT Services provides administrative services to the Fund. The fee is paid by Franklin Mutual based on the Fund’s average daily net assets, and is not an additional expense of the Fund.
c. Distribution Fees
The Board has adopted distribution plans for each share class, with the exception of Class Z and Class R6 shares, pursuant to Rule 12b-1 under the 1940 Act. Under the Fund’s Class A reimbursement distribution plan, the Fund reimburses Distributors for costs incurred in connection with the servicing, sale and distribution of the Fund’s shares up to the maximum annual plan rate. Under the Class A reimbursement distribution plan, costs exceeding the maximum for the current plan year cannot be reimbursed in subsequent periods. In addition, under the Fund’s Class C and R compensation distribution plans, the Fund pays Distributors for costs incurred in connection with the servicing, sale and distribution of the Fund’s shares up to the maximum annual plan rate for each class. The plan year, for purposes of monitoring compliance with the maximum annual plan rates, is February 1 through January 31.
The maximum annual plan rates, based on the average daily net assets, for each class, are as follows:
Class A | 0.35% | |||
Class C | 1.00% | |||
Class R | 0.50% |
The Board has set the current rate at 0.25% per year for Class A shares until further notice and approval by the Board.
d. Sales Charges/Underwriting Agreements
Front-end sales charges and contingent deferred sales charges (CDSC) do not represent expenses of the Fund. These charges are deducted from the proceeds of sales of Fund shares prior to investment or from redemption proceeds prior to remittance, as applicable. Distributors has advised the Fund of the following commission transactions related to the sales and redemptions of the Fund’s shares for the period:
Sales charges retained net of commissions paid to | $ | 254,062 | ||
CDSC retained | $ | 13,917 |
e. Transfer Agent Fees
Each class of shares, except for Class R6, pays transfer agent fees to Investor Services for its performance of shareholder servicing obligations and reimburses Investor Services for out of pocket expenses incurred, including shareholder servicing fees paid to third parties. These fees are allocated daily based upon their relative proportion of such classes’ aggregate net assets. Class R6 pays Investor Services transfer agent fees specific to that class.
For the period ended June 30, 2017, the Fund paid transfer agent fees of $1,947,799, of which $1,083,060 was retained by Investor Services.
4. Expense Offset Arrangement
The Fund has entered into an arrangement with its custodian whereby credits realized as a result of uninvested cash balances are used to reduce a portion of the Fund’s custodian expenses. During the period ended June 30, 2017, the custodian fees were reduced as noted in the Statement of Operations.
| franklintempleton.com | Semiannual Report | 35 | ||||
FRANKLIN MUTUAL QUEST FUND
NOTES TO FINANCIAL STATEMENTS (UNAUDITED)
5. Independent Trustees’ Retirement Plan
On January 1, 1993, the Trust adopted an Independent Trustees’ Retirement Plan (Plan). The Plan is an unfunded defined benefit plan that provides benefit payments to Trustees whose length of service and retirement age meets the eligibility requirements of the Plan. Benefits under the Plan are based on years of service and fees paid to each trustee at the time of retirement. Effective in December 1996, the Plan was closed to new participants.
During the period ended June 30, 2017, the Fund’s projected benefit obligation and benefit payments under the Plan were as follows:
aProjected benefit obligation at June 30, 2017 | $ | 249,650 | ||
bIncrease in projected benefit obligation | $ | 1,615 | ||
Benefit payments made to retired trustees | $ | (2,618 | ) |
aThe projected benefit obligation is included in trustees’ fees and expenses in the Statement of Assets and Liabilities.
bThe increase in projected benefit obligation is included in trustees’ fees and expenses in the Statement of Operations.
6. Income Taxes
For tax purposes, capital losses may be carried over to offset future capital gains. Capital loss carryforwards with no expiration, if any, must be fully utilized before those losses with expiration dates.
At December 31, 2016, capital loss carryforwards were as follows:
Capital loss carryforwards subject to expiration: | ||||
2017 | $ | 73,758,943 | ||
2018 | 18,751,585 | |||
Capital loss carryforwards not subject to expiration: | ||||
Short term | 91,349 | |||
Long term | 6,862,231 | |||
|
| |||
Total capital loss carryforwards | $ | 99,464,108a | ||
|
|
aIncludes $95,138,601 from the merged Franklin Mutual Recovery Fund, which may be carried over to offset future capital gains, subject to certain limitations.
At June 30, 2017, the cost of investments and net unrealized appreciation (depreciation) for income tax purposes were as follows:
Cost of investments | $ | 5,031,626,820 | ||
|
| |||
Unrealized appreciation | $ | 632,190,831 | ||
Unrealized depreciation | (399,551,472 | ) | ||
|
| |||
Net unrealized appreciation (depreciation) | $ | 232,639,359 | ||
|
|
Differences between income and/or capital gains as determined on a book basis and a tax basis are primarily due to differing treatments of foreign currency transactions, bond discounts and premiums, corporate actions and wash sales.
7. Investment Transactions
Purchases and sales of investments (excluding short term securities and securities sold short) for the period ended June 30, 2017, aggregated $744,092,730 and $518,356,775, respectively.
| 36 | Semiannual Report | franklintempleton.com | ||
FRANKLIN MUTUAL QUEST FUND
NOTES TO FINANCIAL STATEMENTS (UNAUDITED)
8. Credit Risk and Defaulted Securities
The Fund may purchase the pre-default or defaulted debt of distressed companies. Distressed companies are financially troubled and could be or are already involved in financial restructuring or bankruptcy. Risks associated with purchasing these securities include the possibility that the bankruptcy or other restructuring process takes longer than expected, or that distributions in restructuring are less than anticipated, either or both of which may result in unfavorable consequences to the Fund. If it becomes probable that the income on debt securities, including those of distressed companies, will not be collected, the Fund discontinues accruing income and recognizes an adjustment for uncollectible interest.
At June 30, 2017, the aggregate long value of distressed company securities for which interest recognition has been discontinued was $292,866,182, representing 5.5% of the Fund’s net assets. For information as to specific securities, see the accompanying Statement of Investments.
9. Restricted Securities
The Fund invests in securities that are restricted under the Securities Act of 1933 (1933 Act) or which are subject to legal, contractual, or other agreed upon restrictions on resale. Restricted securities are often purchased in private placement transactions, and cannot be sold without prior registration unless the sale is pursuant to an exemption under the 1933 Act. Disposal of these securities may require greater effort and expense, and prompt sale at an acceptable price may be difficult. The Fund may have registration rights for restricted securities. The issuer generally incurs all registration costs.
At June 30, 2017, investments in restricted securities, excluding certain securities exempt from registration under the 1933 Act deemed to be liquid, were as follows:
| Principal Amount/ Shares/ Warrants | Issuer | Acquisition Date | Cost | Value | ||||||||||||
| 9,272 | Broadband Ventures III LLC, secured promissory note, 5.00%, | |||||||||||||||
2/01/12 | 7/01/10 - 11/30/12 | $ | 9,272 | $ | — | |||||||||||
| 1,439,821 | CB FIM Coinvestors LLC | 1/15/09 - 6/02/09 | — | — | ||||||||||||
| 17,934,688 | FIM Coinvestor Holdings I, LLC | 11/20/06 - 6/02/09 | — | — | ||||||||||||
| 58,392 | Gulfmark Offshore Inc | 1/06/17 | 105,100 | 12,204 | ||||||||||||
| 2,548,299 | International Automotive Components Group Brazil LLC | 4/13/06 - 12/26/08 | 1,692,334 | 62,329 | ||||||||||||
| 19,924,658 | International Automotive Components Group North America LLC | 1/02/06 - 3/18/13 | 16,305,945 | 12,263,946 | ||||||||||||
| 1,110,000 | a Lee Enterprises Inc., wts., 12/31/22 | 3/31/14 | 1,490,026 | 1,244,292 | ||||||||||||
| 224,279 | b Sorenson Communications Inc., Membership Interests | 4/30/14 | — | 150,109,522 | ||||||||||||
| 431,052 | Warrior Met Coal Inc | 3/31/16 - 6/23/16 | 2,472,737 | 7,051,586 | ||||||||||||
|
| |||||||||||||||
Total Restricted Securities (Value is 3.2% of Net Assets) | $ | 22,075,414 | $ | 170,743,879 | ||||||||||||
|
| |||||||||||||||
aThe Fund also invests in unrestricted securities or other investments in the issuer, valued at $ 176,893,071 as of June 30, 2017.
bThe Fund also invests in unrestricted securities or other investments in the issuer, valued at $ 292,649,107 as of June 30, 2017.
10. Unfunded Loan Commitments
The Fund enters into certain credit agreements, all or a portion of which may be unfunded. The Fund is obligated to fund these loan commitments at the borrowers’ discretion. Unfunded loan commitments and funded portions of credit agreements are marked to market daily and any unrealized appreciation or depreciation is included in the Statement of Assets and Liabilities and the Statement of Operations. Funded portions of credit agreements are presented in the Statement of Investments.
| franklintempleton.com | Semiannual Report | 37 | ||||
FRANKLIN MUTUAL QUEST FUND
NOTES TO FINANCIAL STATEMENTS (UNAUDITED)
10. Unfunded Loan Commitments (continued)
At June 30, 2017, unfunded commitments were as follows:
| Borrower | Unfunded Commitment | |||
Affinion Group Inc., senior note., 144A, PIK, 14.00%, 11/10/22 | $ | 2,481,338 | ||
|
| |||
11. Unfunded Capital Commitments
The Fund enters into certain capital commitments and may be obligated to perform on such agreements at a future date. The Fund monitors these commitments and assesses the probability of required performance. For any agreements whose probability of performance is determined to be greater than remote, the Fund assesses the fair value of the commitment. In instances where the probability of performance is greater than remote and the performance under the commitment would result in an unrealized loss, the Fund recognizes such losses in the Statement of Assets and Liabilities and the Statement of Operations.
At June 30, 2017, the Fund had an unfunded capital commitment of $94,541,000, for which no depreciation has been recognized.
12. Other Derivative Information
At June 30, 2017, the Fund’s investments in derivative contracts are reflected in the Statement of Assets and Liabilities as follows:
| Asset Derivatives | Liability Derivatives | |||||||||||
| Derivative Contracts Not Accounted for as Hedging Instruments | Statement of Assets and Liabilities Location | Fair Value | Statement of Assets and Liabilities Location | Fair Value | ||||||||
Foreign exchange contracts | Variation margin | $ | 3,664,625 | a | ||||||||
Unrealized appreciation on OTC forward exchange contracts | $527,957 | Unrealized depreciation on OTC forward exchange contracts | 14,990,370 | |||||||||
|
|
|
| |||||||||
Totals | $527,957 | $ | 18,654,995 | |||||||||
|
|
|
| |||||||||
aThis amount reflects the cumulative appreciation (depreciation) of futures contracts as reported in the Statement of Investments. Only the variation margin receivable/ payable at period end is separately reported within the Statement of Assets and Liabilities. Prior variation margin movements were recorded to cash upon receipt or payment.
For the period ended June 30, 2017, the effect of derivative contracts in the Fund’s Statement of Operations was as follows:
| Derivative Contracts Not Accounted for as Hedging Instruments | Statement of Operations Location | Net Realized Gain (Loss) for the Period | Statement of Operations Location | Net Change in Unrealized Appreciation (Depreciation) for the Period | ||||||||
Net realized gain (loss) from: | Net change in unrealized appreciation (depreciation) on: | |||||||||||
Foreign exchange contracts | Foreign currency transactions | | $ (589,577 | )a | Translation of other assets and liabilities denominated in foreign currencies | | $(21,646,398 | )a | ||||
Futures contracts | (6,126,709 | ) | Futures contracts | (5,640,487 | ) | |||||||
|
|
|
| |||||||||
Totals | $(6,716,286 | ) | $(27,286,885 | ) | ||||||||
|
|
|
| |||||||||
aForward exchange contracts are included in net realized gain (loss) from foreign currency transactions and net change in unrealized appreciation (depreciation) on translation of other assets and liabilities denominated in foreign currencies in the Statement of Operations.
For the period ended June 30, 2017, the average month end notional amount of futures contracts represented $186,726,592. The average month end contract value of forward exchange contracts was $305,912,916.
See Note 1(d) regarding derivative financial instruments.
| 38 | Semiannual Report | franklintempleton.com | ||
FRANKLIN MUTUAL QUEST FUND
NOTES TO FINANCIAL STATEMENTS (UNAUDITED)
13. Holdings of 5% Voting Securities of Portfolio Companies
The 1940 Act defines “affiliated companies” to include investments in portfolio companies in which a fund owns 5% or more of the outstanding voting securities. During the period ended June 30, 2017, investments in “affiliated companies” were as follows:
| Name of Issuer | Number of Shares/ Warrants/ Principal Amount Held at Beginning of Period | Gross Additions | Gross Reductions | Number of Shares/ Warrants/ Principal Amount Held at End of Period | Value at End of Period | Investment Income | Realized Gain (Loss) | |||||||||||||||||||||
| Non-Controlled Affiliates | ||||||||||||||||||||||||||||
Advanced Emissions Solutions Inc. | 1,724,209 | — | — | 1,724,209 | $ | 15,792,941 | $ | 431,052 | $ — | |||||||||||||||||||
Eastman Kodak Co. | 3,072,827 | — | — | 3,072,827 | 27,962,726 | — | — | |||||||||||||||||||||
Eastman Kodak Co., Term Loan, 7.422%, 9/03/19 | 37,968,616 | — | — | 37,968,616 | 37,984,449 | 1,206,558 | — | |||||||||||||||||||||
Eastman Kodak Co., wts., 9/03/18 | 48,582 | — | — | 48,582 | 15,060 | — | — | |||||||||||||||||||||
Eastman Kodak Co., wts., 9/03/18 | 48,582 | — | — | 48,582 | 21,862 | — | — | |||||||||||||||||||||
Lee Enterprises Inc./IA | 4,824,268 | — | — | 4,824,268 | 9,166,109 | — | — | |||||||||||||||||||||
Lee Enterprises Inc., Second Lien Term Loan, 12.00%, 12/15/22 | 65,604,374 | — | (2,902,247 | ) | 62,702,127 | 65,210,212 | 1,990,962 | 42,410 | ||||||||||||||||||||
Lee Enterprises Inc., senior secured note, first lien, 144A, 9.50%, 3/15/22 | 99,050,000 | — | — | 99,050,000 | 102,516,750 | 4,678,737 | — | |||||||||||||||||||||
Lee Enterprises Inc., wts., 12/31/22 | 1,110,000 | — | — | 1,110,000 | 1,244,292 | — | — | |||||||||||||||||||||
New Media Investment Group Inc. | 4,660,772 | 271,710 | — | 4,932,482 | 66,489,857 | 3,452,738 | — | |||||||||||||||||||||
New Media Holdings II LLC, Fourth Amendment Replacement Term Loans, 7.476%, 6/04/20 | 112,135,512 | — | (572,125 | ) | 111,563,387 | 111,005,570 | 3,597,661 | 6,509 | ||||||||||||||||||||
|
| |||||||||||||||||||||||||||
Total Affiliated Securities (Value is 8.2% of Net Assets) |
| $ | 437,409,828 | $ | 15,357,708 | $48,919 | ||||||||||||||||||||||
|
| |||||||||||||||||||||||||||
14. Credit Facility
The Fund, together with other U.S. registered and foreign investment funds (collectively, Borrowers), managed by Franklin Templeton Investments, are borrowers in a joint syndicated senior unsecured credit facility totaling $2 billion (Global Credit Facility) which matures on February 9, 2018. This Global Credit Facility provides a source of funds to the Borrowers for temporary and emergency purposes, including the ability to meet future unanticipated or unusually large redemption requests.
Under the terms of the Global Credit Facility, the Fund shall, in addition to interest charged on any borrowings made by the Fund and other costs incurred by the Fund, pay its share of fees and expenses incurred in connection with the implementation and maintenance of the Global Credit Facility, based upon its relative share of the aggregate net assets of all of the Borrowers, including an annual commitment fee of 0.15% based upon the unused portion of the Global Credit Facility. These fees are reflected in other expenses in the Statement of Operations. During the period ended June 30, 2017, the Fund did not use the Global Credit Facility.
| franklintempleton.com | Semiannual Report | 39 | ||||
FRANKLIN MUTUAL QUEST FUND
NOTES TO FINANCIAL STATEMENTS (UNAUDITED)
15. Fair Value Measurements
The Fund follows a fair value hierarchy that distinguishes between market data obtained from independent sources (observable inputs) and the Fund’s own market assumptions (unobservable inputs). These inputs are used in determining the value of the Fund’s financial instruments and are summarized in the following fair value hierarchy:
| • | Level 1 – quoted prices in active markets for identical financial instruments |
| • | Level 2 – other significant observable inputs (including quoted prices for similar financial instruments, interest rates, prepayment speed, credit risk, etc.) |
| • | Level 3 – significant unobservable inputs (including the Fund’s own assumptions in determining the fair value of financial instruments) |
The input levels are not necessarily an indication of the risk or liquidity associated with financial instruments at that level.
For movements between the levels within the fair value hierarchy, the Fund has adopted a policy of recognizing the transfers as of the date of the underlying event which caused the movement.
A summary of inputs used as of June 30, 2017, in valuing the Fund’s assets and liabilities carried at fair value, is as follows:
| Level 1 | Level 2 | Level 3 | Total | |||||||||||||
| Assets: | ||||||||||||||||
Investments in Securities: | ||||||||||||||||
Equity Investments:a | ||||||||||||||||
Auto Components | $ | 45,146,365 | $ | — | $ | 12,326,275 | $ | 57,472,640 | ||||||||
Communications Equipment | — | — | 150,109,522 | 150,109,522 | ||||||||||||
Diversified Consumer Services | — | 7,107,373 | — | 7,107,373 | ||||||||||||
Energy Equipment & Services | — | — | 12,204 | 12,204 | ||||||||||||
Media | 197,853,917 | — | 1,244,292 | 199,098,209 | ||||||||||||
Metals & Mining | — | — | 7,051,586 | 7,051,586 | ||||||||||||
All Other Equity Investmentsb | 2,543,931,870 | — | — | c | 2,543,931,870 | |||||||||||
Corporate Bonds, Notes and Senior Floating Rate Interests | — | 1,140,615,436 | — | 1,140,615,436 | ||||||||||||
Corporate Bonds, Notes and Senior Floating Rate Interests in Reorganization | — | 247,580,392 | — | c | 247,580,392 | |||||||||||
Companies in Liquidation | — | 32,235,141 | 1,680,146 | c | 33,915,287 | |||||||||||
Municipal Bonds in Reorganization | — | 45,285,790 | — | 45,285,790 | ||||||||||||
Short Term Investments | 783,186,255 | 48,899,615 | — | 832,085,870 | ||||||||||||
|
| |||||||||||||||
Total Investments in Securities | $ | 3,570,118,407 | $ | 1,521,723,747 | $ | 172,424,025 | $ | 5,264,266,179 | ||||||||
|
| |||||||||||||||
Other Financial Instruments: | ||||||||||||||||
Forward Exchange Contracts | $ | — | $ | 527,957 | $ | — | $ | 527,957 | ||||||||
Unfunded Loan Commitments | — | 164,988 | — | 164,988 | ||||||||||||
|
| |||||||||||||||
Total Other Financial Instruments | $ | — | $ | 692,945 | $ | — | $ | 692,945 | ||||||||
|
| |||||||||||||||
| Liabilities: | ||||||||||||||||
Other Financial Instruments: | ||||||||||||||||
Futures Contracts | $ | 3,664,625 | $ | — | $ | — | $ | 3,664,625 | ||||||||
Forward Exchange Contracts | — | 14,990,370 | — | 14,990,370 | ||||||||||||
|
| |||||||||||||||
Total Other Financial Instruments | $ | 3,664,625 | $ | 14,990,370 | $ | — | $ | 18,654,995 | ||||||||
|
| |||||||||||||||
aIncludes common, convertible preferred and preferred stocks as well as other equity investments.
bFor detailed categories, see the accompanying Statement of Investments.
cIncludes securities determined to have no value at June 30, 2017.
| 40 | Semiannual Report | franklintempleton.com | ||
FRANKLIN MUTUAL QUEST FUND
NOTES TO FINANCIAL STATEMENTS (UNAUDITED)
A reconciliation of assets in which Level 3 inputs are used in determining fair value is presented when there are significant Level 3 financial instruments at the end of the period. At June 30, 2017, the reconciliation of assets, is as follows:
| Balance at Beginning of Period | Purchases | Sales | Transfer Into Level 3a | Transfer Out of Level 3b | Cost Basis Adjustments | Net Realized Gain (Loss) | Net Unrealized Appreciation (Depreciation) | Balance at End of Period | Net Change in Unrealized Appreciation (Depreciation) on Assets Held at Period End | |||||||||||||||||||||||||||||||
| Assets: | ||||||||||||||||||||||||||||||||||||||||
Investments in Securities: | ||||||||||||||||||||||||||||||||||||||||
Equity Investments:c | ||||||||||||||||||||||||||||||||||||||||
Auto Components | $ | 14,884,656 | $ — | $ | — | $ | — | $ | — | $— | $ | — | $(2,558,381) | $ | 12,326,275 | $(2,558,381 | ) | |||||||||||||||||||||||
Communications Equipment | 150,861,922 | — | — | — | — | — | — | (752,400 | ) | 150,109,522 | (752,400 | ) | ||||||||||||||||||||||||||||
Energy Equipment & Services | — | 105,100 | — | — | — | — | — | (92,896 | ) | 12,204 | (92,896 | ) | ||||||||||||||||||||||||||||
Media | 1,835,838 | — | — | — | — | — | — | (591,546 | ) | 1,244,292 | (591,546 | ) | ||||||||||||||||||||||||||||
Metals & Mining | — | — | (4,505,458 | ) | 11,696,239 | — | — | (15,063,579 | ) | 14,924,384 | 7,051,586 | (319,410 | ) | |||||||||||||||||||||||||||
Oil, Gas & Consumable Fuels | 15,939,950 | — | — | — | (14,713,800 | ) | — | — | (1,226,150 | ) | — | — | ||||||||||||||||||||||||||||
Companies in Liquidation | 1,680,146 | d | — | — | — | — | — | — | — | 1,680,146 | d | — | ||||||||||||||||||||||||||||
|
| |||||||||||||||||||||||||||||||||||||||
Total | $ | 185,202,512 | $105,100 | $ | (4,505,458 | ) | $ | 11,696,239 | $ | (14,713,800 | ) | $— | $ | (15,063,579 | ) | $ 9,703,011 | $ | 172,424,025 | $(4,314,633 | ) | ||||||||||||||||||||
|
| |||||||||||||||||||||||||||||||||||||||
aThe investments were transferred into Level 3 as a result of their value being determined using a significant unobservable valuation input. May include amounts related to a corporate action.
bThe investments were transferred out of Level 3 as a result of the removal of a significant unobservable valuation input.
cIncludes common stocks as well as other equity investments.
dIncludes securities determined to have no value.
| franklintempleton.com | Semiannual Report | 41 | ||||
FRANKLIN MUTUAL QUEST FUND
NOTES TO FINANCIAL STATEMENTS (UNAUDITED)
15. Fair Value Measurements (continued)
Significant unobservable valuation inputs for material Level 3 financial instruments and impact to fair value as a result of changes in unobservable valuation inputs as of June 30, 2017, are as follows:
| Description | Fair Value at End of Period | Valuation Technique | Unobservable Inputs | Amount/Weighting | Impact to Fair Value if Input Increasesa | |||||||||||||||
| Assets: | ||||||||||||||||||||
Investments in | ||||||||||||||||||||
Securities: | ||||||||||||||||||||
Equity | ||||||||||||||||||||
Investments: | $ | 12,263,946 | Market comparables | EV /EBITDA multiple | 3.7x | Increase | ||||||||||||||
|
| |||||||||||||||||||
|
| Discounted cash flow
|
|
| 3 Yr Forward EBITDA Growth rate
|
|
| 1.01x
|
|
| Increase
|
| |||||||||
| ||||||||||||||||||||
| Discount rate | 10% | Decreaseb | ||||||||||||||||||
Communications | 150,109,522 | Market transaction | Transaction pricec | 50% | Increased | |||||||||||||||
Equipment | ||||||||||||||||||||
|
| Market comparables
|
|
| EV / EBITDA multiple
|
|
| 8.3x
|
|
| Increased
|
| |||||||||
| ||||||||||||||||||||
Metals & Mining | 7,051,586 | Market comparables | | Discount for lack of marketability | | 4.5% | Decrease | |||||||||||||
| ||||||||||||||||||||
All Other Investmentse | 2,998,971 | |||||||||||||||||||
| ||||||||||||||||||||
Total | $ | 172,424,025 | ||||||||||||||||||
| ||||||||||||||||||||
aRepresents the directional change in the fair value of the Level 3 financial instruments that would result from a significant and reasonable increase in the corresponding input. A significant and reasonable decrease in the input would have the opposite effect. Significant impacts, if any, to fair value and/or net assets have been indicated.
bRepresents a significant impact to fair value but not net assets.
cInput weighting provided in lieu of amount due to the confidential nature of this information.
dRepresents a significant impact to fair value and net assets.
eIncludes fair value of immaterial financial instruments developed using various valuation techniques and unobservable inputs. May also include financial instruments with values derived using prior transaction prices or third party pricing information without adjustment for which such inputs are unobservable.
Abbreviations List
| EBITDA | Earnings before interest, taxes, depreciation and amortization | |
| EV | Enterprise value |
16. New Accounting Pronouncements
In March 2017, the Financial Accounting Standards Board issued Accounting Standards Update (ASU) No. 2017-08, Receivables—Nonrefundable Fees and Other Costs (Subtopic 310-20): Premium Amortization on Purchased Callable Debt Securities. The amendments in the ASU shorten the amortization period for certain callable debt securities, held at a premium, to be amortized to the earliest call date. The ASU does not require an accounting change for securities held at a discount; which continues to be amortized to maturity. The ASU is effective for fiscal years and interim periods within those fiscal years beginning after December 15, 2018. Management is currently evaluating the impact, if any, of applying this provision.
| 42 | Semiannual Report | franklintempleton.com | ||
FRANKLIN MUTUAL QUEST FUND
NOTES TO FINANCIAL STATEMENTS (UNAUDITED)
17. Investment Company Reporting Modernization
In October 2016, the U.S. Securities and Exchange Commission adopted new rules and amended existing rules (together, final rules) intended to modernize the reporting and disclosure of information by registered investment companies. In part, the final rules amend Regulation S-X and require standardized, enhanced disclosures about derivatives in investment company financial statements, as well as other amendments. The compliance date for the amendments to Regulation S-X is August 1, 2017. Management has reviewed the requirements and believes the adoption of the amendments to Regulation S-X will not have a material impact on the Fund’s financial statements and related disclosures.
18. Subsequent Events
The Fund has evaluated subsequent events through the issuance of the financial statements and determined that no events have occurred that require disclosure.
Abbreviations
| Counterparty | Currency | Selected Portfolio | ||||||||
| BOFA | Bank of America N.A. | EUR | Euro | ADR | American Depositary Receipt | |||||
| BONY | The Bank of New York Mellon Corp. | GBP | British Pound | DIP | Debtor-In-Possession | |||||
| FBCO | Credit Suisse International | USD | United States Dollar | FHLB | Federal Home Loan Bank | |||||
| HSBK | HSBC Bank PLC | GO | General Obligation | |||||||
| SSBT | State Street Bank and Trust Co., N.A. | PIK | Payment-In-Kind | |||||||
| UBSW | UBS AG | TRA | Tax Receivable Agreement Right | |||||||
| franklintempleton.com | Semiannual Report | 43 | ||||
FRANKLIN MUTUAL SERIES FUNDS
FRANKLIN MUTUAL QUEST FUND
Board Approval of Investment Management Agreements
FRANKLIN MUTUAL SERIES FUNDS
Franklin Mutual Quest Fund
(“Fund”)
The Board of Trustees (Board), including a majority of trustees that are not “interested persons” as such term is defined in section 2(a)(19) of the Investment Company Act of 1940 (hereinafter referred to as “independent trustees”), at an in-person meeting held on May 22, 2017, unanimously approved the renewal of the Fund’s investment management agreement. Prior to a meeting of all of the trustees for the purpose of considering such renewal, the independent trustees participated in two other meetings held in connection with the renewal process. Throughout the process, the independent trustees received assistance and advice from and met separately with independent counsel. The independent trustees met with and interviewed officers of the investment manager (including portfolio managers), the transfer agent and shareholder services group and the distributor. In approving the renewal of the investment management agreement for the Fund, the Board, including the independent trustees, determined that the investment management fee structure was fair and reasonable and that continuance of the agreement was in the best interests of the Fund and its shareholders.
In reaching their decision on the investment management agreement, the trustees took into account information furnished throughout the year at regular Board meetings, as well as information specifically requested and furnished for the renewal process, which culminated in the meetings referred to above for the specific purpose of considering such agreement. Information furnished throughout the year included, among others, reports on the Fund’s investment performance, expenses, portfolio composition, portfolio brokerage execution, client commission arrangements, derivatives, securities lending, asset segregation, portfolio turnover, Rule 12b-1 plan, distribution, shareholder servicing, legal and compliance matters, pricing of securities, sales and redemptions, and marketing support payments made to financial intermediaries, as well as a third-party survey of transfer agent fees charged to funds within the Franklin Templeton Investments (FTI) complex in comparison with those charged to other fund complexes deemed comparable. Also, related financial statements and other information about the scope and quality of services provided by the investment manager and its affiliates and enhancements to such services over the past year were
provided. In addition, the trustees received periodic reports throughout the year and during the renewal process relating to compliance with the Fund’s investment policies and restrictions. During the renewal process, the independent trustees considered the investment manager’s methods of operation within the Franklin Templeton group and its activities on behalf of other clients. The Board also noted that it received an annual report on all payments made by FTI or the Fund to financial intermediaries engaged in the sale of Fund shares, as well as a memorandum relating to third-party servicing arrangements in response to a Guidance Update from the U.S. Securities and Exchange Commission (SEC) relating to mutual fund distribution and sub-accounting fees.
The information obtained by the trustees during the renewal process also included a special report prepared by Broadridge Financial Solutions, Inc., an independent third-party analyst that utilizes data from Lipper, Inc. (“Lipper”), comparing the Fund’s investment performance and expenses with those of other mutual funds deemed comparable to the Fund as selected by Lipper (Broadridge Section 15(c) Report). The trustees reviewed the Broadridge Section 15(c) Report and its usefulness in the renewal process with respect to matters such as comparative fees, expenses, expense ratios, performance and volatility. They concluded that the report continues to be a reliable resource in the performance of their duties.
In addition, the trustees received a Profitability Study (Profitability Study) prepared by management discussing the profitability to FTI from its overall U.S. fund operations, as well as on an individual fund-by-fund basis. Over the past year, the Board and counsel to the independent trustees continued to receive reports on management’s handling of recent regulatory inquiries and pending legal actions against the investment manager and its affiliates. The independent trustees were satisfied with the actions taken to date by management in response to such regulatory and legal matters.
Particular attention was given to management’s diligent risk management program, including continual monitoring and management of cybersecurity, liquidity and counterparty credit risk, and attention given to derivatives and other complex instruments that are held and expected to be held by the Fund and how such instruments are used to carry out the Fund’s investment goal(s). The Board also took into account, among other things, management’s efforts in establishing a global credit facility for the benefit of the Fund and other accounts managed by FTI to provide a source of cash for temporary and emergency purposes or to meet unusual redemption requests as
| 44 | Semiannual Report | franklintempleton.com | ||
FRANKLIN MUTUAL SERIES FUNDS
FRANKLIN MUTUAL QUEST FUND
SHAREHOLDER INFORMATION
well as the strong financial position of the investment manager’s parent company and its commitment to the mutual fund business. In addition, the Board received updates from management on the SEC’s progress in implementing the rule-making requirements established by the Dodd-Frank Wall Street Reform and Consumer Protection Act (Dodd-Frank Act), which was enacted July 21, 2010, and the investment manager’s compliance with rules and regulations already promulgated by the SEC under such act.
In addition to the above and other matters considered by the trustees throughout the course of the year, the following discussion relates to certain primary factors relevant to the Board’s decision. This discussion of the information and factors considered by the Board (including the information and factors discussed above) is not intended to be exhaustive, but rather summarizes certain factors considered by the Board. In view of the wide variety of factors considered, the Board did not, unless otherwise noted, find it practicable to quantify or otherwise assign relative weights to the foregoing factors. In addition, individual trustees may have assigned different weights to various factors.
NATURE, EXTENT AND QUALITY OF SERVICES. The trustees reviewed the nature, extent and quality of the services provided, and to be provided, by the investment manager. The trustees cited the investment manager’s ability to implement the Fund’s disciplined value investment approach and its long-term relationship with the Fund as reasons that shareholders choose to invest, and remain invested, in the Fund. The trustees reviewed the Fund’s portfolio management team, including its performance, staffing, skills and compensation program. With respect to portfolio manager compensation, management assured the trustees that the Fund’s long-term performance is a significant component of incentive-based compensation and noted that a portion of a portfolio manager’s incentive-based compensation is paid in shares of pre-designated funds from the portfolio manager’s fund management area. The trustees noted that the portfolio manager compensation program aligned the interests of the portfolio managers with that of shareholders of the Fund. The trustees discussed with management various other products, portfolios and entities that are advised by the investment manager and the allocation of assets and expenses among and within them, as well as their relative fees and reasons for differences with respect thereto and any potential conflicts. During regular Board meetings and the aforementioned meetings of the independent trustees, the trustees received reports and presentations on the investment manager’s best execution trading policies. The trustees considered
periodic reports provided to them showing that the investment manager complied with the investment policies and restrictions of the Fund as well as other reports periodically furnished to the Board covering matters such as the compliance of portfolio managers and other management personnel with the code of ethics covering the investment management personnel, the adherence to fair value pricing procedures established by the Board and the accuracy of net asset value calculations. The Board noted the extent of the benefits provided to Fund shareholders from being part of the Franklin Templeton group of funds, including the right to exchange investments between funds (same class) without a sales charge, the ability to reinvest Fund dividends into other funds and the right to combine holdings of other funds to obtain reduced sales charges. The Board considered the investment manager’s significant efforts in developing and implementing compliance procedures established in accordance with SEC and other requirements.
The Board considered the nature, extent and quality of the services to be provided under the Fund’s other service agreements to determine that, on an overall basis, Fund shareholders were well served. In this connection, the Board also took into account transfer agent and shareholder services provided to Fund shareholders by an affiliate of the investment manager, noting continuing expenditures by management to increase and improve the scope of such services and favorable periodic reports on shareholder services conducted by independent third parties. While such considerations directly affected the trustees’ decision in renewing the Fund’s transfer agent and shareholder services agreement, the Board also considered these commitments as incidental benefits to Fund shareholders deriving from the investment management relationship.
Based on their review, the trustees were satisfied with the nature and quality of the overall services provided, and to be provided, by the investment manager and its affiliates to the Fund and its shareholders and were confident in the abilities of the management team to continue the disciplined value investment approach of the Fund and to provide quality services to the Fund and its shareholders.
INVESTMENT PERFORMANCE. The trustees reviewed and placed significant emphasis on the investment performance of the Fund over the one-, three-, five- and 10-year periods ended December 31, 2016. They considered the history of successful performance of the Fund relative to various benchmarks. As part of their review, they inquired of management regarding benchmarks, style drift and restrictions
| franklintempleton.com | Semiannual Report | 45 | ||||
FRANKLIN MUTUAL SERIES FUNDS
FRANKLIN MUTUAL QUEST FUND
SHAREHOLDER INFORMATION
on permitted investments. Consideration was also given to performance in the context of available levels of cash during the periods.
The trustees had meetings during the year, including the meetings referred to above held in connection with the renewal process, with the Fund’s portfolio managers to discuss performance and the management of the Fund. In addition, particular attention in assessing performance was given to the Broadridge Section 15(c) Report. That report showed the investment performance of the Fund (Class A shares) in comparison to other funds determined comparable by Lipper.
The comparable funds to the Fund, as chosen by Lipper, included all retail and institutional flexible portfolio funds. The Fund had total returns in the best performing quintile for the one-year period ended December 31, 2016, and had annualized total returns for the three- and five-year periods also in the best performing quintile. The trustees noted that the Fund’s total return on an annualized basis for the 10-year period ended December 31, 2016 was also in the best performing quintile. The trustees were satisfied with such comparative performance.
The trustees also compared Fund performance to other industry benchmarks, including measures of risk-adjusted performance of a fund, as part of their evaluation of investment performance. The trustees concluded that the Fund had continued to perform well in comparison to its various benchmarks and in the context of the Fund’s goals.
COMPARATIVE EXPENSES AND MANAGEMENT PROFITABILITY. The trustees considered the cost of the services provided and to be provided and the profits realized by the investment manager and its affiliates from their respective relationships with the Fund. As part of the renewal process, the trustees explored with management the trends in expense ratios over the past three fiscal years and the reasons for any increases in the Fund’s expense ratios (or components thereof). In considering the appropriateness of the management fee and other expenses charged to the Fund, the Board took into account various factors including investment performance and matters relating to Fund operations, including, but not limited to, the quality and experience of its portfolio managers and research staff. Consideration was also given to a comparative analysis in the Broadridge Section 15(c) Report of the investment management fee and total expense ratio of the Fund in comparison with those of a group of other funds selected by Lipper as its appropriate Lipper expense group. Lipper expense data is based upon information taken from the Fund’s most recent annual report, which reflects historical asset levels that
may be quite different from those currently existing, particularly in a period of market volatility. While recognizing such inherent limitation and the fact that expense ratios generally increase as assets decline and decrease as assets grow, the Board believed the independent analysis conducted by Lipper to be an appropriate measure of comparative expenses.
In reviewing comparative costs, emphasis was given to the Fund’s contractual management fee in comparison with the contractual management fee that would have been charged by other funds within its Lipper expense group assuming they were similar in size to the Fund, as well as the actual total expenses of the Fund in comparison with those of its Lipper expense group. The Lipper contractual management fee analysis includes administrative charges as being part of the management fee, and total expenses, for comparative consistency, are shown by Lipper for Fund Class A shares.
The Fund’s contractual management fee rate was in the second-most expensive quintile of its Lipper expense group and its total expenses were in the middle quintile of such group. The Board noted that the Fund’s contractual management fee rate was within 5 basis points of its Lipper expense group median. The Board found such comparative fees and expenses to be acceptable in view of factors relating to the Fund’s operations, such as the quality and experience of its portfolio managers.
The trustees also reviewed the Profitability Study addressing profitability of Franklin Resources, Inc., from its overall U.S. fund business, as well as profitability to the Fund’s investment manager and its affiliates, from providing investment management and other services to the Fund during the 12-month period ended September 30, 2016, the most recent fiscal year-end of Franklin Resources, Inc. The trustees reviewed the basis on which such reports are prepared and the cost allocation methodology utilized in the Profitability Study, it being recognized that allocation methodologies may each be reasonable while producing different results. In this respect, the Board noted that the reasonableness of the cost allocation methodologies was reviewed by independent accountants on an every other year basis.
The independent trustees met with management to discuss the Profitability Study. This included, among other things, a comparison of investment management income with investment management expenses of the Fund; comparison of underwriting revenues and expenses; the relative relationship of investment management and underwriting expenses; shareholder servicing
| 46 | Semiannual Report | franklintempleton.com | ||
FRANKLIN MUTUAL SERIES FUNDS
FRANKLIN MUTUAL QUEST FUND
SHAREHOLDER INFORMATION
profitability; economies of scale; and the relative contribution of the Fund to the profitability of the investment manager and its parent. In discussing the Profitability Study with the Board, the investment manager stated its belief that the costs incurred in establishing the infrastructure necessary to operate the type of mutual fund operations conducted by it and its affiliates may not be fully reflected in the expenses allocated to the Fund in determining its profitability.
The Board also took into account management’s expenditures in improving shareholder services provided to the Fund, as well as the need to meet additional regulatory and compliance requirements resulting from the Sarbanes-Oxley Act, the Dodd-Frank Act and recent SEC and other regulatory requirements. The trustees also considered the extent to which the investment manager may derive ancillary benefits from Fund operations, including those derived from economies of scale, discussed below, the allocation of Fund brokerage and the use of commission dollars to pay for research and other similar services.
Based upon their consideration of all these factors, the trustees determined that the level of profits realized by the investment manager and its affiliates in providing services to the Fund was not excessive in view of the nature, quality and extent of services provided.
ECONOMIES OF SCALE. The Board considered economies of scale realized by the investment manager and its affiliates as the Fund grows larger and the extent to which they are shared with Fund shareholders, as for example, in the level of the investment management fee charged, in the quality and efficiency of services rendered and in increased capital commitments benefiting the Fund directly or indirectly. While recognizing that any precise determination is inherently subjective, the trustees noted that, based upon the Profitability Study, as some funds increase in size, at some point economies of scale may result in the investment manager realizing a larger profit margin on investment management services provided to such a fund. The trustees also noted that benefits of economies of scale will be shared with Fund shareholders due to the decline in the effective investment management fee rate as breakpoints are achieved by the Fund.
The trustees noted that breakpoints had been instituted as part of the Fund’s investment management fee and that the Board regularly evaluates whether additional breakpoints are appropriate. The trustees assessed the savings to shareholders resulting from such breakpoints and believed they were, and continue to be, appropriate and they agreed to continue to
monitor the appropriateness of the breakpoints. The trustees also considered the effects an increase in assets under management would have on the investment management fee and expense ratio of the Fund. To the extent further economies of scale may be realized by the investment manager and its affiliates, the Board believed the investment management and administrative fees provide a sharing of benefits with the Fund and its shareholders.
Proxy Voting Policies and Procedures
The Fund’s investment manager has established Proxy Voting Policies and Procedures (Policies) that the Fund uses to determine how to vote proxies relating to portfolio securities. Shareholders may view the Fund’s complete Policies online at franklintempleton.com. Alternatively, shareholders may request copies of the Policies free of charge by calling the Proxy Group collect at (954) 527-7678 or by sending a written request to: Franklin Templeton Companies, LLC, 300 S.E. 2nd Street, Fort Lauderdale, FL 33301, Attention: Proxy Group. Copies of the Fund’s proxy voting records are also made available online at franklintempleton.com and posted on the U.S. Securities and Exchange Commission’s website at sec.gov and reflect the most recent 12-month period ended June 30.
Quarterly Statement of Investments
The Trust, on behalf of the Fund, files a complete statement of investments with the U.S. Securities and Exchange Commission for the first and third quarters for each fiscal year on Form N-Q. Shareholders may view the filed Form N-Q by visiting the Commission’s website at sec.gov. The filed form may also be viewed and copied at the Commission’s Public Reference Room in Washington, DC. Information regarding the operations of the Public Reference Room may be obtained by calling (800) SEC-0330.
| franklintempleton.com | Semiannual Report | 47 | ||||
This page intentionally left blank.
| Semiannual Report and Shareholder Letter Franklin Mutual Quest Fund | |||
| Investment Manager | ||||
| Franklin Mutual Advisers, LLC | ||||
| Distributor | ||||
Franklin Templeton Distributors, Inc. (800) DIAL BEN® / 342-5236 franklintempleton.com | ||||
| Shareholder Services | ||||
| (800) 632-2301 - (Class A, C, R & R6) | ||||
| (800) 448-FUND - (Class Z) | ||||
Authorized for distribution only when accompanied or preceded by a summary prospectus and/or prospectus. Investors should carefully consider a fund’s investment goals, risks, charges and expenses before investing. A prospectus contains this and other information; please read it carefully before investing. | ||||
To help ensure we provide you with quality service, all calls to and from our service areas are monitored and/or recorded. | ||||
| © 2017 Franklin Templeton Investments. All rights reserved. | 475 S 08/17 |
| Semiannual Report and Shareholder Letter June 30, 2017 |
Franklin Mutual Shares Fund
A SERIES OF FRANKLIN MUTUAL SERIES FUNDS | ||||
| ||||
| ||||
Sign up for electronic delivery at franklintempleton.com/edelivery
Franklin Templeton Investments
Gain From Our Perspective®
At Franklin Templeton Investments, we’re dedicated to one goal: delivering exceptional asset management for our clients. By bringing together multiple, world-class investment teams in a single firm, we’re able to offer specialized expertise across styles and asset classes, all supported by the strength and resources of one of the world’s largest asset managers. This has helped us to become a trusted partner to individual and institutional investors across the globe.
Dear Franklin Mutual Shares Fund Shareholder:
The first half of 2017 saw most equity markets continue their long move upwards. The Standard & Poor’s 500® Index (S&P 500®) posted a +9.34% total return and the MSCI World Index delivered a +11.02% total return.1
The political uncertainty and unpredictability of recent years has continued in 2017. In the U.S., President Trump has continued his unconventional governance approach, while Congress has remained relentlessly partisan, leading to significant uncertainty about policies and legislation. The financial markets expected “business friendly” moves, but specific legislative progress on issues such as health care, tax reform and infrastructure did not come to fruition. In the U.K., a surprise election was called in April when the Conservative Party held a huge polling lead, but at the June election the Tories lost their majority in Parliament. Recent elections in France went according to expectations, lending some much appreciated stability there.
Despite these generally unsettling events, the global economy continued its slow expansion since the Great Recession. Unemployment also continued to decline in most developed markets. Wage growth showed signs of acceleration and in the U.S. interest rates began to rise, perhaps signaling the first steps toward monetary normalization.
Equity markets appreciated as economic fundamentals improved. Valuation is, of course, a critical factor in our analysis and we always ask ourselves if current and potential investments represent an attractive balance of risk and reward. As some equity markets reached all-time highs, we maintained our focus on individual investments and the prospects for each
business in the context of its valuation and the backdrop of potential political and economic risks.
In many equity markets, growth stocks outperformed value stocks during the period. For example, the S&P 500 Growth Index returned +13.33%, while the S&P 500 Value Index returned +4.85%.1 The difference in performance was driven in part by a significant rally in Internet and software stocks, which dominated the S&P 500 Growth Index. We do not know how long these trends will continue, but historically, periods of strong performance by growth stocks have eventually been followed by relatively weaker performance. In addition, the S&P 500 Value Index has components that we believe are facing disruption from new technology (e.g., the rapid market share shift to online retailing from traditional bricks and mortar dominated retailers that are often labeled as value stocks). Exacerbating the disruption is the reality that many new technology companies are able to innovate without the need to show immediate profits.
Amid dynamic markets and evolving economic conditions, we believe active, professional investment management serves investors well. We also recognize the important role of financial advisors in today’s markets and encourage investors to continue to seek their advice. Amid changing markets and economic conditions, we are confident investors with a well-diversified portfolio and a patient, long-term outlook will be well positioned for the years ahead.
On the following pages, the Fund’s portfolio management team discusses the economic environment during the first six months of 2017 and reviews investment decisions made during this
1. Source: Morningstar.
See www.franklintempletondatasources.com for additional data provider information.
| Not FDIC Insured |
|
| May Lose Value |
|
| No Bank Guarantee |
| franklintempleton.com | Not part of the semiannual report | 1 |
period. Please remember all securities markets fluctuate, as do mutual fund share prices.
We thank you for investing with Franklin Templeton, welcome your questions and comments, and look forward to continuing to serve your investment needs in the years ahead.
Sincerely,
Peter A. Langerman
Chairman, President and Chief Executive Officer
Franklin Mutual Advisers, LLC
This letter reflects our analysis and opinions as of June 30, 2017, unless otherwise indicated. The information is not a complete analysis of every aspect of any market, country, industry, security or fund. Statements of fact are from sources considered reliable.
Contents
Semiannual Report
| Franklin Mutual Shares Fund | 3 | |||
| Performance Summary | 10 | |||
| Your Fund’s Expenses | 12 | |||
| Financial Highlights and Statement of Investments | 13 | |||
| Financial Statements | 25 | |||
| Notes to Financial Statements | 29 | |||
|
| 42
|
|
Visit franklintempleton.com for fund updates, to access your account, or to find helpful financial planning tools.
| 2 | Not part of the semiannual report | franklintempleton.com |
Semiannual Report
This semiannual report for Franklin Mutual Shares Fund covers the period ended June 30, 2017.
Your Fund’s Goal and Main Investments
The Fund seeks capital appreciation, which may occasionally be short term, with income as a secondary goal. Its strategy is focused mainly on what the investment manager believes are undervalued mid- and large cap equity securities, which may include foreign securities and, to a lesser extent, the securities of distressed companies and merger arbitrage securities. The Fund may invest up to 35% of its assets in foreign securities.
Performance Overview
The Fund’s Class Z shares delivered a cumulative total return of +5.46% for the six months ended June 30, 2017. For comparison, the Fund’s benchmark, the Standard & Poor’s 500 Index (S&P 500®), which is a broad measure of U.S. stock performance, generated a total return of +9.34%.1 You can find more of the Fund’s performance data in the Performance Summary beginning on page 10.
Performance data represent past performance, which does not guarantee future results. Investment return and principal value will fluctuate, and you may have a gain or loss when you sell your shares. Current performance may differ from figures shown. For most recent month-end performance, go to franklintempleton.com or call (800) 342-5236.
Economic and Market Overview
The global economy generally expanded during the period under review. In this environment, global developed and emerging market stocks, as measured by the MSCI All Country World Index, generated a total return of +11.82%. Global markets were aided by improved industrial commodity prices at certain points during the period, generally upbeat economic data across regions, investor optimism about pro-growth and pro-business policies in the U.S., hopes of tax reforms under the Trump administration, Emmanuel Macron’s election as France’s president and encouraging corporate earnings reports.
Geographic Composition*
Based on Total Net Assets as of 6/30/17
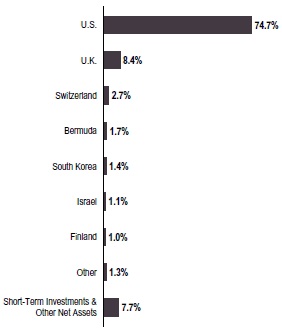
*Figures are stated as a percentage of total and may not equal 100% or may be negative due to rounding, use of any derivatives, unsettled trades or other factors.
However, global markets reflected investor concerns about the timing and economic effects of the U.K.’s exit from the European Union (also known as “Brexit”). Other headwinds included the health of European banks, concerns about political uncertainty in the U.S. and European Union, geopolitical tensions in certain regions, worries about global oversupply in oil production despite a pact to extend cuts, and comments toward period-end from key central bankers around the world about potentially raising interest rates.
U.S. economic growth decelerated in 2017’s first quarter, largely due to slower growth in consumer spending and declines in private inventory investment and government spending. However, growth accelerated in the second quarter due to increases in consumer spending, business investment
1. Source: Morningstar.
The index is unmanaged and includes reinvestment of any income or distributions. It does not reflect any fees, expenses or sales charges. One cannot invest directly in an index, and an index is not representative of the Fund’s portfolio.
The dollar value, number of shares or principal amount, and names of all portfolio holdings are listed in the Fund’s Statement of Investments (SOI). The SOI begins on page 18.
| franklintempleton.com | Semiannual Report | 3 |
F R A N K L I N M U T U A L S H A R E S F U N D
and federal government spending. The unemployment rate decreased from 4.7% in December 2016 to 4.4% at period-end.2 Annual inflation, as measured by the Consumer Price Index, decreased from 2.1% to 1.6% during the period. After increasing its benchmark interest rate in March, the U.S. Federal Reserve (Fed), at its June meeting, made the widely anticipated increase to its target range for the federal funds rate from 0.75%–1.00% to 1.00%–1.25%, amid signs of a growing U.S. economy, a strengthening labor market and an improvement in business spending.
In Europe, the U.K.’s economy grew at a slower rate in 2017’s first quarter over the previous quarter, largely due to slower growth in household spending. The eurozone’s growth increased in the first quarter over the previous quarter. The bloc’s annual inflation rate fluctuated during the reporting period and ended slightly higher from where it began. During the period, the European Central Bank kept its key policy rates unchanged.
In Asia, Japan’s quarterly gross domestic product (GDP) remained unchanged in 2017’s first quarter compared to 2016’s fourth quarter. In April 2017, the Bank of Japan (BOJ) slightly increased its GDP forecasts for the 2017–2018 fiscal year. However, the BOJ lowered its inflation forecast.
In emerging markets, Brazil’s quarterly GDP grew for the first time in two years, as its first-quarter 2017 GDP grew compared to the previous quarter. The country’s central bank cut its benchmark interest rate four times between January and June 2017 to spur economic growth. Russia’s GDP grew in 2017’s first quarter compared to the prior-year period. The Bank of Russia reduced its key interest rate in March, April and June 2017 to try to revive its economy. China’s economy grew faster in the first half of 2017 compared to the first half of 2016, driven by solid growth in industrial production, services, fixed-asset investment, retail sales, and imports and exports. The People’s Bank of China left its benchmark interest rate unchanged during the period. Overall, emerging market stocks, as measured by the MSCI Emerging Markets Index, rose during the period.
Investment Strategy
At Franklin Mutual Series, we are committed to our distinctive value approach to investing, which we believe can generate above-average risk-adjusted returns over time for our shareholders. Our major investment strategy is investing in undervalued stocks. When selecting undervalued equities, we
| Top 10 Sectors/Industries | ||||
| Based on Equity Securities as of 6/30/17 | ||||
| % of Total Net Assets | ||||
| Insurance | 9.6% | |||
| Banks | 9.5% | |||
| Pharmaceuticals | 8.3% | |||
| Oil, Gas & Consumable Fuels | 7.5% | |||
| Media | 6.1% | |||
| Software | 5.6% | |||
| Health Care Equipment & Supplies | 5.1% | |||
| Tobacco | 4.8% | |||
| Food & Staples Retailing | 4.0% | |||
| Communications Equipment | 2.6% | |||
are attracted to what we believe are fundamentally strong companies with healthy balance sheets, high-quality assets, substantial free cash flow and shareholder-oriented management teams and whose stocks are trading at discounts to our assessment of the companies’ intrinsic or business value. We also look for asset-rich companies whose shares may be trading at depressed levels due to concerns over short-term earnings disappointments, litigation, management strategy or other perceived negatives. This strict value approach is not only intended to improve the likelihood of upside potential, but also reduces the risk of substantial declines, in our opinion. While the vast majority of our undervalued equity investments are made in publicly traded companies globally, we may invest occasionally in privately held companies as well.
We complement this more traditional investment strategy with two others. One is distressed investing, a highly specialized field that has proven quite profitable during certain periods over the years. Distressed investing is complex and can take many forms. The most common distressed investment the Fund undertakes is the purchase of financially troubled or bankrupt companies’ debt at a substantial discount to face value. After the financially distressed company is reorganized, often in bankruptcy court, the old debt is typically replaced with new securities issued by the financially stronger company.
The other piece of our investment strategy is participating in arbitrage situations, another highly specialized field. When companies announce proposed mergers or takeovers, commonly referred to as “deals,” the target company may trade at a discount to the bid it ultimately accepts. One form of arbitrage involves purchasing the target company’s stock when it is trading below the value we believe it would receive in a
2. Source: Bureau of Labor Statistics.
| 4 | Semiannual Report | franklintempleton.com |
F R A N K L I N M U T U A L S H A R E S F U N D
deal. In keeping with our commitment to a relatively conservative investment approach, we typically focus our arbitrage efforts on announced deals, and avoid rumored deals or other situations we consider relatively risky.
In addition, it is our practice to hedge the Fund’s currency exposure when we deem it advantageous for our shareholders.
What is meant by “hedge”?
To hedge an investment is to take a position intended to offset potential losses/gains that may be incurred by a companion financial instrument.
Manager’s Discussion
Many equity markets posted meaningful gains in 2017’s first half, across most regions and with minimal volatility. Global markets were aided by generally upbeat economic data, improved corporate earnings in the U.S., Europe and Japan, as well as improved industrial commodity prices at certain points during the period. However, those largely positive headline conditions overshadowed a fair amount of turbulence and uncertainty.
In the U.S., markets began 2017 rallying as investors hoped that a Republican sweep of U.S. elections in November 2016 would lead to a general loosening in regulations and tax reform, including lower corporate tax rates. However, political gridlock took hold. The political drama in Washington, D.C., tempered the rally in U.S. markets overall. Many stocks that led the way in the post-election rally subsequently gave back some or all of their outperformance, particularly value stocks dominated by companies in cyclical sectors most likely to benefit from acceleration in economic growth. In an environment of modest economic growth and low interest rates, investors continued to favor growth stocks. During the period, the Russell 1000® Growth Index generated a total return of +13.99%, while the Russell 1000® Value Index posted a total return of +4.66%.1 Within the Russell 1000® Growth Index, stocks with the largest weights were technology firms that dominated the headlines: Apple,3 Alphabet (a.k.a. Google),3 Microsoft, Amazon.com3 and Facebook.3
European equity markets started 2017 slowly, but political events combined with upbeat economic news sparked strong performance during the period, with the notable exception of the U.K. Elections in Europe produced generally positive
outcomes, with voters in the Netherlands and France rejecting extremist candidates. Political stability in the European Union (EU) helped to support equity markets on the belief that it would help facilitate the ongoing economic recovery. In the U.K., however, a snap election resulting in no party having a majority in Parliament appeared to make a “hard Brexit,” in which the U.K. leaves the EU in March 2019 without a negotiated deal, even more likely than before.
As value investors, we managed to benefit from steady economic growth despite underlying market turbulence. In all market environments, we seek to invest prudently in securities that we believe represent good value, and then we adjust our views as the world around us changes.
The energy sector has been a significant area of investment for the Fund.4 Following an extended period of high prices, crude oil and natural gas prices have been significantly lower during the past few years. The benchmark oil price declined from more than $100 a barrel to below $30, and has more recently stayed between $40 and $60 during the first half of 2017. The impact on the sector, and the securities of companies in the sector, has been unsurprisingly quite dramatic. Although many uncertainties exist, we continue to expect demand for oil and gas to rise for a number of years, which we believe will require continued investment by the sector, not only to meet that growth but also to replace declining production in mature fields around the world. Accordingly, we expect some combination of higher prices or lower costs over time to provide the sufficient returns needed to justify the required investment.
After an initial period of distress, most companies within the energy sector appear to have made considerable progress in resizing their cost structures and strengthening their balance sheets. In aggregate, capital spending has been cut massively, and cash flow breakeven levels suggest an ability to fund a base level of investment activity given crude oil and gas prices as of period-end. From an investment standpoint, in many cases we are finding securities with reasonable prospects at current commodity prices, and substantively greater upside potential should our longer term price-versus-cost outlook come to pass. We expect continued commodity price volatility, but would look to use that to our advantage when seeking to buy or sell energy sector securities.
Our energy sector investment process has focused on finding situations where commodity price upside is not necessary to
3. Not a Fund holding.
4. The energy sector comprises energy equipment and services and oil, gas and consumable fuels in the SOI.
| franklintempleton.com | Semiannual Report | 5 |
F R A N K L I N M U T U A L S H A R E S F U N D
| Top 10 Equity Holdings | ||||
| 6/30/17 | ||||
Company Sector/Industry, Country | % of Total Net Assets | |||
Medtronic PLC Health Care Equipment & Supplies, U.S. | 3.6% | |||
Merck & Co. Inc. Pharmaceuticals, U.S. | 2.8% | |||
Eli Lilly & Co. Pharmaceuticals, U.S. | 2.4% | |||
Time Warner Inc. Media, U.S. | 2.1% | |||
Microsoft Corp. Software, U.S. | 2.1% | |||
Symantec Corp. Software, U.S. | 2.1% | |||
American International Group Inc. Insurance, U.S. | 2.0% | |||
Novartis AG Pharmaceuticals, Switzerland | 2.0% | |||
British American Tobacco PLC Tobacco, U.K. | 1.9% | |||
Charter Communications Inc. Media, U.S. | 1.8% | |||
generate attractive security returns. One such area is within the infrastructure space. Companies such as Kinder Morgan and Williams provide critical pipelines, processing facilities, ports, and other assets used to bring vital commodities to market. Investors shunned these companies due to a combination of counterparty risk related to exploration and production companies, their own balance sheet concerns and dividend levels. As our analysis about the criticality of their assets and the flexibility of their funding options has, in our view, been proven, the securities of infrastructure companies have recovered significantly from their lows. Moreover, if expectations of an oil and gas supply glut from greater North American production hold true, more infrastructure investment should be needed to move this product to export markets.
Royal Dutch Shell, a leading integrated oil and gas company, is another investment held by the Fund for which fears about the impact of low commodity prices were overblown, in our view. The company used the initial phase of the crude oil price downturn to acquire BG Group, a major exploration and production company with significant positions and strength in liquefied natural gas and a great oil asset in the pre-salt Santos Basin in Brazil. The assets were highly complementary to
Shell’s existing positions, allowing the post-merger company to prune other areas of its portfolio and still show considerable growth. Management, under the leadership of relatively new chief executive officer Ben van Beurden, has been focused on reducing costs so that the company can still grow, while funding all required capital expenditures and its dividend, at an oil price below $50 per barrel. As Shell shows continued progress in its efforts and demonstrates the resilience of its portfolio and balance sheet, we expect the shares to continue to benefit.
Merger and acquisition activity has remained healthy, with the number of deals remaining high, although the average size of deals fell. Very large deals may have been affected negatively by ongoing political and regulatory uncertainty. Although many mega-deals were rumored, the largest deal actually announced during the period was Becton, Dickinson and Company’s3 takeover of C.R. Bard.3 Meanwhile, many large deals initiated in 2016 await regulatory approval, including Bayer’s3 acquisition of Monsanto, AT&T’s3 acquisition of Time Warner, and 21st Century Fox’s3 offer for Sky. Several key regulatory agencies remain short of members, including the Federal Communication Commission and the Federal Trade Commission, and these openings may be affecting regulatory approvals.
Credit spreads narrowed in 2016 and continued that trend in the first half of 2017 for higher quality credit, with the exception of a brief period of volatility in March and April. High yield credit spreads have remained at levels seen at the start of 2017. The spread compression provided the Fund with the opportunity to exit many of the opportunities that presented themselves in early 2016, including several “hung deals,” as prices improved, spreads shrank, and the risk-adjusted returns were no longer mispriced. As the year progressed and investors became more willing buyers of credit, mispriced risk became more difficult to find, in our opinion. However, we found what we viewed as value in some unloved industries like specialty pharmaceuticals, hospitals, media/broadcasting and telecommunications5 that faced increasing political or secular challenges. In sorting through these less-favored industries, we sought out securities that we believed could benefit most from liquidity-enhancing events like asset sales, the ability within existing agreements to issue secured debt, and free cash flow that could create a long enough runway to weather the storm and/or provide enough current recovery to create the enterprise at a significant discount to our assessment of its intrinsic value. In times when
5. The telecommunication services sector comprises diversified telecommunication services and wireless telecommunication services in the SOI. See www.franklintempletondatasources.com for additional data provider information.
| 6 | Semiannual Report | franklintempleton.com |
F R A N K L I N M U T U A L S H A R E S F U N D
the credit markets fluctuate and value is difficult to easily identify, we believe our industry specific expertise, deep fundamental analysis with a focus on cash flow, and intensive credit and covenant review combine seamlessly and provide us with unique ways of looking at the same ideas others may disregard.
Turning to Fund performance, top positive contributors included U.S.-based medical device maker Medtronic, South Korea-based Samsung Electronics, and Switzerland-based health care company Novartis.
Investors responded positively to quarterly results issued by Medtronic in February and May. On both occasions, earnings exceeded consensus expectations, driven by solid revenues and successful cost control efforts, which led to better operating profitability. The positive results led to improved investor confidence in Medtronic’s ability to deliver on future growth goals, especially given concerns following tough quarterly results issued in November 2016. Medtronic’s agreement in April to sell its medical supplies business to Cardinal Health3 provided additional support to Medtronic’s stock price. Medtronic obtained the medical supplies business as part of its 2014 acquisition of Covidien. The medical supplies business, in our view, was not core to Medtronic’s operations and had less attractive profitability and future growth prospects. In addition, Medtronic intends to use the after-tax proceeds for additional share buybacks and to pay down debt.
Samsung Electronics is a low cost provider of commodity memory products (e.g., dynamic random-access memory and flash memory), which have seen very strong pricing recently. Samsung also produces smartphones, consumer electronics and other goods. In February, shares retreated as Samsung chief Jay Y. Lee was arrested for bribery as part of a wider government influence-peddling scandal that led to the impeachment of then president Park Geun-hye. However, the stock price rallied as investors turned their focus to Samsung’s better-than-expected earnings results announced in April. Samsung reported strong sales in its core businesses, including memory chips and OLED (organic light-emitting diode) displays. Despite adverse publicity surrounding its Note 7 smartphone in the fall of 2016, sales of its newest generation of smartphones have been running ahead of market expectations. Management also pleasantly surprised investors in April by announcing a plan to cancel existing treasury shares held by the company.
Novartis has meaningful market positions in biopharmaceuticals, especially oncology, generic pharmaceuticals through its Sandoz division, and eye care through its Alcon division. Investors reacted positively to decent quarterly results in
January and April when Novartis beat consensus expectations. Investors also reacted positively to news reports in April that the process of reviewing strategic options for its Alcon division may be moving along. Novartis has made substantial investments to turn around Alcon, but the process has taken longer than expected. We believe a sale or spin-off of Alcon may make sense at the right price. In June, Novartis made good progress on its pipeline with two positive late-stage trials, one for a drug to treating neovascular age-related macular degeneration and second for a cardiovascular treatment for heart attack patients.
During the period under review, Fund investments that detracted from performance included Cincinnati-based grocery retailer Kroger, U.S.-based oil and gas exploration and production company Marathon Oil and U.S.-based drugstore chain Rite Aid.
Kroger operates over 2,400 grocery and multi-department stores in 31 states. Kroger’s stock price declined as investors remained focused on the industry-wide impact of food price deflation, which is pressuring the revenue growth of grocery retailers. Quarterly results released in early March reflected the pressure of food price deflation on Kroger’s revenues. The stock price further declined in mid-June due to Kroger’s negative full-year earnings guidance update and the announced acquisition of Whole Foods3 by Amazon.com.3 Kroger reduced its full-year 2017 earnings range due to a combination of higher costs and lower margins. The company selectively increased starting wages to lower employee turnover and improve productivity. In addition, Kroger decided to match major promotions by some competitors. Kroger’s management believes promotion activity will likely persist through 2017 as other grocery chains fight to maintain market share. In our view, the Whole Foods acquisition by Amazon was another sign of encroaching competition from non-traditional grocery retailers and hard discounters. Overall, we believe Kroger is still among the strongest grocery retailers, including a sharp management team, and it has the capability to successfully adjust to the shifting competitive landscape.
Shares of Marathon Oil generally followed the path of declining oil prices. During the first half of 2017, oil prices retreated as U.S. crude oil production increased and data showed that worldwide supply had not yet begun to decline. The supply and price trends for crude oil prices overshadowed some moves by Marathon that we believe were positive. As part of its portfolio transformation effort, in March Marathon announced agreements to exit a Canadian oil sands asset, and two transactions to acquire acreage in the northern Delaware basin of New Mexico. Although we regard the price received
| franklintempleton.com | Semiannual Report | 7 |
F R A N K L I N M U T U A L S H A R E S F U N D
for the oil sands asset to be merely adequate, we look favorably upon the continuing expansion of the company’s resource portfolio and increasing focus on predictable, higher return onshore assets. Additionally, the three transactions led to a further improvement in Marathon’s balance sheet. These favorable changes were nonetheless overshadowed by an oil market which remains both volatile and challenging.
Shares of Rite Aid declined as a deal to be acquired by Walgreens Boots Alliance fell apart. The transaction was mired in antitrust review by the Federal Trade Commission (FTC) during much of the period as the FTC questioned whether Walgreens’ proposed divestitures were sufficient to maintain competition. In late June, Walgreens announced the immediate termination of the merger agreement. Instead, Rite Aid agreed to sell numerous stores and related distribution assets to Walgreens. The new agreement is also subject to antitrust review, but we believe FTC approval is likely.
During the period, the Fund held currency forwards and futures seeking to hedge most of the currency risk of the portfolio’s non-U.S. dollar investments. The currency forwards had a negative impact on the Fund’s performance because of the depreciation of the U.S. dollar versus the hedged currencies, while currency futures had a negligible impact.
What is a currency forward?
A currency forward is an agreement between the Fund and a counterparty to buy or sell a foreign currency in exchange for another currency at a specific exchange rate on a future date.
What is a future?
A future is an agreement between the Fund and a counterparty made through a U.S. or foreign futures exchange to buy or sell an underlying instrument or asset at a specific price on a future date.
CFA® is a trademark owned by CFA Institute.
Thank you for your participation in Franklin Mutual Shares Fund. We look forward to continuing to serve your investment needs.

The foregoing information reflects our analysis, opinions and portfolio holdings as of June 30, 2017, the end of the reporting period. The way we implement our main investment strategies and the resulting portfolio holdings may change depending on factors such as market and economic conditions. These opinions may not be relied upon as investment advice or an offer for a particular security. The information is not a complete analysis of every aspect of any market, country, industry, security or the Fund. Statements of fact are from sources considered reliable, but the investment manager makes no representation or warranty as to their completeness or accuracy. Although historical performance is no guarantee of future results, these insights may help you understand our investment management philosophy.
| 8 | Semiannual Report | franklintempleton.com |
F R A N K L I N M U T U A L S H A R E S F U N D
Peter Langerman has been portfolio manager for Franklin Mutual Shares Fund since 2005. He has been portfolio manager of Franklin Mutual Global Discovery Fund since 2009. He joined Franklin Templeton Investments in 1996, serving in various capacities, including President and Chief Executive Officer of Franklin Mutual Advisers and member of the management team of the Funds, including Franklin Mutual Shares Fund. From 2002 to 2005, he served as director of New Jersey’s Division of Investment, overseeing employee pension funds. Between 1986 and 1996, Mr. Langerman was employed at Heine Securities Corporation, the Fund’s former manager.
F. David Segal has been portfolio manager for Franklin Mutual Shares Fund since 2005. He joined Franklin Templeton Investments in 2002. Previously, he was an analyst in the Structured Finance Group of MetLife for the period 1999 to 2002.
Debbie Turner has been assistant portfolio manager for Franklin Mutual Shares Fund since 2001. She joined Franklin Templeton Investments in 1996. Between 1993 and 1996, Ms. Turner was employed at Heine Securities Corporation, the Fund’s former manager.
| franklintempleton.com | Semiannual Report | 9 |
F R A N K L I N M U T U A L S H A R E S F U N D
Performance Summary as of June 30, 2017
The performance table does not reflect any taxes that a shareholder would pay on Fund dividends, capital gain distributions, if any, or any realized gains on the sale of Fund shares. Total return reflects reinvestment of the Fund’s dividends and capital gain distributions, if any, and any unrealized gains or losses. Your dividend income will vary depending on dividends or interest paid by securities in the Fund’s portfolio, adjusted for operating expenses of each class. Capital gain distributions are net profits realized from the sale of portfolio securities.
Performance as of 6/30/17
Cumulative total return excludes sales charges. Average annual total return includes maximum sales charges. Sales charges will vary depending on the size of the investment and the class of share purchased. The maximum is 5.75% and the minimum is 0%. Class A: 5.75% maximum initial sales charge. For other share classes, visit franklintempleton.com.
| Share Class | Cumulative Total Return1 | Average Annual Total Return2 | ||||||
| Z | ||||||||
6-Month | +5.46% | +5.46% | ||||||
1-Year | +17.25% | +17.25% | ||||||
5-Year | +74.81% | +11.82% | ||||||
10-Year | +54.18% | +4.42% | ||||||
| A | ||||||||
6-Month | +5.33% | -0.74% | ||||||
1-Year | +16.96% | +10.23% | ||||||
5-Year | +72.36% | +10.19% | ||||||
10-Year | +49.81% | +3.51% | ||||||
Performance data represent past performance, which does not guarantee future results. Investment return and principal value will fluctuate, and you may have a gain or loss when you sell your shares. Current performance may differ from figures shown. For most recent month-end performance, go to franklintempleton.com or call (800) 342-5236.
See page 11 for Performance Summary footnotes.
| 10 | Semiannual Report | franklintempleton.com |
F R A N K L I N M U T U A L S H A R E S F U N D
P E R F O R M A N C E S U M M A R Y
| Total Annual Operating Expenses3 | ||||
| Share Class | ||||
Z | 0.80% | |||
A | 1.05% | |||
Each class of shares is available to certain eligible investors and has different annual fees and expenses, as described in the prospectus.
All investments involve risks, including possible loss of principal. Value securities may not increase in price as anticipated or may decline further in value. Special risks are associated with foreign investing, including currency fluctuations, economic instability and political developments. The Fund’s investments in companies engaged in mergers, reorganizations or liquidations also involve special risks as pending deals may not be completed on time or on favorable terms. The Fund may invest in lower rated bonds, which entail higher credit risk. The Fund is actively managed but there is no guarantee that the manager’s investment decisions will produce the desired results. The Fund’s prospectus also includes a description of the main investment risks.
1. Cumulative total return represents the change in value of an investment over the periods indicated.
2. Average annual total return represents the average annual change in value of an investment over the periods indicated. Return for less than one year, if any, has not been annualized.
3. Figures are as stated in the Fund’s current prospectus and may differ from the expense ratios disclosed in the Your Fund’s Expenses and Financial Highlights sections in this report. In periods of market volatility, assets may decline significantly, causing total annual Fund operating expenses to become higher than the figures shown.
| franklintempleton.com | Semiannual Report | 11 |
F R A N K L I N M U T U A L S H A R E S F U N D
Your Fund’s Expenses
As a Fund shareholder, you can incur two types of costs: (1) transaction costs, including sales charges (loads) on Fund purchases and redemptions; and (2) ongoing Fund costs, including management fees, distribution and service (12b-1) fees, and other Fund expenses. All mutual funds have ongoing costs, sometimes referred to as operating expenses. The table below shows ongoing costs of investing in the Fund and can help you understand these costs and compare them with those of other mutual funds. The table assumes a $1,000 investment held for the six months indicated.
Actual Fund Expenses
The table below provides information about actual account values and actual expenses in the columns under the heading “Actual.” In these columns the Fund’s actual return, which includes the effect of Fund expenses, is used to calculate the “Ending Account Value” for each class of shares. You can estimate the expenses you paid during the period by following these steps (of course, your account value and expenses will differ from those in this illustration): Divide your account value by $1,000 (if your account had an $8,600 value, then $8,600 ÷ $1,000 = 8.6). Then multiply the result by the number in the row for your class of shares under the headings “Actual” and “Expenses Paid During Period” (if Actual Expenses Paid During Period were $7.50, then 8.6 x $7.50 = $64.50). In this illustration, the actual expenses paid this period are $64.50.
Hypothetical Example for Comparison with Other Funds
Under the heading “Hypothetical” in the table, information is provided about hypothetical account values and hypothetical expenses based on the Fund’s actual expense ratio and an assumed rate of return of 5% per year before expenses, which is not the Fund’s actual return. This information may not be used to estimate the actual ending account balance or expenses you paid for the period, but it can help you compare ongoing costs of investing in the Fund with those of other funds. To do so, compare this 5% hypothetical example for the class of shares you hold with the 5% hypothetical examples that appear in the shareholder reports of other funds.
Please note that expenses shown in the table are meant to highlight ongoing costs and do not reflect any transactional costs. Therefore, information under the heading “Hypothetical” is useful in comparing ongoing costs only, and will not help you compare total costs of owning different funds. In addition, if transactional costs were included, your total costs would have been higher.
Actual (actual return after expenses) | Hypothetical (5% annual return before expenses) | |||||||||||||||||
Share Class | Beginning Account Value 1/1/17 | Ending Account Value 6/30/17 | Expenses Paid During Period 1/1/17–6/30/171,2 | Ending Account Value 6/30/17 | Expenses Paid During Period 1/1/17–6/30/171,2 | Net Annualized Expense Ratio2 | ||||||||||||
| Z | $1,000 | $1,054.60 | $3.92 | $1,020.98 | $3.86 | 0.77% | ||||||||||||
| A | $1,000 | $1,053.30 | $5.19 | $1,019.74 | $5.11 | 1.02% | ||||||||||||
| C | $1,000 | $1,049.10 | $8.99 | $1,016.02 | $8.85 | 1.77% | ||||||||||||
| R | $1,000 | $1,052.10 | $6.46 | $1,018.50 | $6.36 | 1.27% | ||||||||||||
| R6 | $1,000 | $1,055.30 | $3.36 | $1,021.52 | $3.31 | 0.66% | ||||||||||||
1. Expenses are equal to the annualized expense ratio for the six-month period as indicated above—in the far right column—multiplied by the simple average account value over the period indicated, and then multiplied by 181/365 to reflect the one-half year period.
2. Reflects expenses after fee waivers and expense reimbursements. Does not include acquired fund fees and expenses.
| 12 | Semiannual Report | franklintempleton.com |
F R A N K L I N M U T U A L S H A R E S F U N D
Financial Highlights
Six Months Ended June 30, 2017 (unaudited) | Year Ended December 31, | |||||||||||||||||||||||
| 2016 | 2015 | 2014 | 2013 | 2012 | ||||||||||||||||||||
Class Z | ||||||||||||||||||||||||
| Per share operating performance | ||||||||||||||||||||||||
(for a share outstanding throughout the period) | ||||||||||||||||||||||||
Net asset value, beginning of period | $28.22 | $26.00 | $29.52 | $28.34 | $22.48 | $19.96 | ||||||||||||||||||
|
| |||||||||||||||||||||||
Income from investment operationsa: | ||||||||||||||||||||||||
Net investment incomeb | 0.27 | 0.63 | c | 0.54 | 0.78 | d | 0.47 | 0.39 | ||||||||||||||||
Net realized and unrealized gains (losses) | 1.27 | 3.48 | (1.71 | ) | 1.38 | 5.83 | 2.62 | |||||||||||||||||
|
| |||||||||||||||||||||||
Total from investment operations | 1.54 | 4.11 | (1.17 | ) | 2.16 | 6.30 | 3.01 | |||||||||||||||||
|
| |||||||||||||||||||||||
Less distributions from: | ||||||||||||||||||||||||
Net investment income | — | (0.64 | ) | (0.59 | ) | (0.98 | ) | (0.44 | ) | (0.49 | ) | |||||||||||||
Net realized gains | — | (1.25 | ) | (1.76 | ) | — | — | — | ||||||||||||||||
|
| |||||||||||||||||||||||
Total distributions | — | (1.89 | ) | (2.35 | ) | (0.98 | ) | (0.44 | ) | (0.49 | ) | |||||||||||||
|
| |||||||||||||||||||||||
Net asset value, end of period | $29.76 | $28.22 | $26.00 | $29.52 | $28.34 | $22.48 | ||||||||||||||||||
|
| |||||||||||||||||||||||
Total returne | 5.46% | 15.88% | (3.81)% | 7.60% | 28.10% | 15.14% | ||||||||||||||||||
| Ratios to average net assetsf | ||||||||||||||||||||||||
Expensesg | 0.77% | h | 0.80% | h,i | 0.81% | h,i | 0.80% | h | 0.79% | h | 0.82% | |||||||||||||
Expenses incurred in connection with | —% | 0.01% | 0.02% | 0.03% | —%j | —% | j | |||||||||||||||||
Net investment income | 1.86% | 2.33% | c | 1.82% | 2.67% | d | 1.85% | 1.82% | ||||||||||||||||
| Supplemental data | ||||||||||||||||||||||||
Net assets, end of period (000’s) | $8,075,721 | $7,681,881 | $6,770,056 | $7,363,765 | $7,025,908 | $7,575,308 | ||||||||||||||||||
Portfolio turnover rate | 8.77% | 20.56% | 19.99% | 19.24% | 24.29% | 21.57% | ||||||||||||||||||
aThe amount shown for a share outstanding throughout the period may not correlate with the Statement of Operations for the period due to the timing of sales and repurchases of the Fund’s shares in relation to income earned and/or fluctuating fair value of the investments of the Fund.
bBased on average daily shares outstanding.
cNet investment income per share includes approximately $0.10 per share related to income received in the form of special dividends in connection with certain Fund holdings. Excluding this amount, the ratio of net investment income to average net assets would have been 1.96%.
dNet investment income per share includes approximately $0.29 per share related to income received in the form of a special dividend in connection with certain Fund holdings. Excluding this amount, the ratio of net investment income to average net assets would have been 1.66%.
eTotal return is not annualized for periods less than one year.
fRatios are annualized for periods less than one year.
gIncludes dividend and/or interest expense on securities sold short and security borrowing fees, if any. See below for the ratios of such expenses to average net assets for the periods presented. See Note 1(e).
hBenefit of expense reduction rounds to less than 0.01%.
iBenefit of waiver and payments by affiliates rounds to less than 0.01%.
jRounds to less than 0.01%.
| franklintempleton.com | The accompanying notes are an integral part of these financial statements. | Semiannual Report | 13 |
F R A N K L I N M U T U A L S H A R E S F U N D
F I N A N C I A L H I G H L I G H T S
Six Months Ended (unaudited) | Year Ended December 31, | |||||||||||||||||||||||
| 2016 | 2015 | 2014 | 2013 | 2012 | ||||||||||||||||||||
Class A | ||||||||||||||||||||||||
| Per share operating performance | ||||||||||||||||||||||||
(for a share outstanding throughout the period) | ||||||||||||||||||||||||
Net asset value, beginning of period | $27.97 | $25.78 | $29.29 | $28.12 | $22.32 | $19.81 | ||||||||||||||||||
|
| |||||||||||||||||||||||
| Income from investment operationsa: | ||||||||||||||||||||||||
Net investment incomeb | 0.23 | 0.56 | c | 0.45 | 0.69 | d | 0.40 | 0.33 | ||||||||||||||||
Net realized and unrealized gains (losses) | 1.26 | 3.45 | (1.69 | ) | 1.37 | 5.76 | 2.60 | |||||||||||||||||
|
| |||||||||||||||||||||||
Total from investment operations | 1.49 | 4.01 | (1.24 | ) | 2.06 | 6.16 | 2.93 | |||||||||||||||||
|
| |||||||||||||||||||||||
| Less distributions from: | ||||||||||||||||||||||||
Net investment income | — | (0.57 | ) | (0.51 | ) | (0.89 | ) | (0.36 | ) | (0.42 | ) | |||||||||||||
Net realized gains | — | (1.25 | ) | (1.76 | ) | — | — | — | ||||||||||||||||
|
| |||||||||||||||||||||||
Total distributions | — | (1.82 | ) | (2.27 | ) | (0.89 | ) | (0.36 | ) | (0.42 | ) | |||||||||||||
|
| |||||||||||||||||||||||
Net asset value, end of period | $29.46 | $27.97 | $25.78 | $29.29 | $28.12 | $22.32 | ||||||||||||||||||
|
| |||||||||||||||||||||||
Total returne | 5.33% | 15.61% | (4.10)% | 7.30% | 27.74% | 14.75% | ||||||||||||||||||
| Ratios to average net assetsf | ||||||||||||||||||||||||
Expensesg | 1.02% | h | 1.05% | h,i | 1.09% | h,i | 1.10% | h | 1.09% | h | 1.12% | |||||||||||||
Expenses incurred in connection with | —% | 0.01% | 0.02% | 0.03% | —% | j | —% | j | ||||||||||||||||
Net investment income | 1.61% | 2.08%c | 1.54% | 2.37% | d | 1.55% | 1.52% | |||||||||||||||||
| Supplemental data | ||||||||||||||||||||||||
Net assets, end of period (000’s) | $4,626,896 | $4,737,576 | $4,819,868 | $5,392,130 | $5,477,733 | $4,633,895 | ||||||||||||||||||
Portfolio turnover rate | 8.77% | 20.56% | 19.99% | 19.24% | 24.29% | 21.57% | ||||||||||||||||||
aThe amount shown for a share outstanding throughout the period may not correlate with the Statement of Operations for the period due to the timing of sales and repurchases of the Fund’s shares in relation to income earned and/or fluctuating fair value of the investments of the Fund.
bBased on average daily shares outstanding.
cNet investment income per share includes approximately $0.10 per share related to income received in the form of special dividends in connection with certain Fund holdings. Excluding this amount, the ratio of net investment income to average net assets would have been 1.71%.
dNet investment income per share includes approximately $0.29 per share related to income received in the form of special dividends in connection with certain Fund holdings. Excluding this amount, the ratio of net investment income to average net assets would have been 1.36%.
eTotal return does not reflect sales commissions or contingent deferred sales charges, if applicable, and is not annualized for periods less than one year.
fRatios are annualized for periods less than one year.
gIncludes dividend and/or interest expense on securities sold short and security borrowing fees, if any. See below for the ratios of such expenses to average net assets for the periods presented. See Note 1(e).
hBenefit of expense reduction rounds to less than 0.01%.
iBenefit of waiver and payments by affiliates rounds to less than 0.01%.
jRounds to less than 0.01%.
| 14 | Semiannual Report | The accompanying notes are an integral part of these financial statements. | franklintempleton.com |
F R A N K L I N M U T U A L S H A R E S F U N D
F I N A N C I A L H I G H L I G H T S
Six Months Ended (unaudited) | Year Ended December 31, | |||||||||||||||||||||||
| 2016 | 2015 | 2014 | 2013 | 2012 | ||||||||||||||||||||
Class C | ||||||||||||||||||||||||
| Per share operating performance | ||||||||||||||||||||||||
(for a share outstanding throughout the period) | ||||||||||||||||||||||||
Net asset value, beginning of period | $27.68 | $25.54 | $29.02 | $27.88 | $22.13 | $19.65 | ||||||||||||||||||
|
| |||||||||||||||||||||||
| Income from investment operationsa: | ||||||||||||||||||||||||
Net investment incomeb | 0.12 | 0.35c | 0.24 | 0.48d | 0.22 | 0.17 | ||||||||||||||||||
Net realized and unrealized gains (losses) | 1.24 | 3.40 | (1.67 | ) | 1.34 | 5.71 | 2.57 | |||||||||||||||||
|
| |||||||||||||||||||||||
Total from investment operations | 1.36 | 3.75 | (1.43 | ) | 1.82 | 5.93 | 2.74 | |||||||||||||||||
|
| |||||||||||||||||||||||
| Less distributions from: | ||||||||||||||||||||||||
Net investment income | — | (0.36 | ) | (0.29 | ) | (0.68 | ) | (0.18 | ) | (0.26 | ) | |||||||||||||
Net realized gains | — | (1.25 | ) | (1.76 | ) | — | — | — | ||||||||||||||||
|
| |||||||||||||||||||||||
Total distributions | — | (1.61 | ) | (2.05 | ) | (0.68 | ) | (0.18 | ) | (0.26 | ) | |||||||||||||
|
| |||||||||||||||||||||||
Net asset value, end of period | $29.04 | $27.68 | $25.54 | $29.02 | $27.88 | $22.13 | ||||||||||||||||||
|
| |||||||||||||||||||||||
Total returne | 4.91% | 14.77% | (4.79)% | 6.56% | 26.82% | 13.97% | ||||||||||||||||||
| Ratios to average net assetsf | ||||||||||||||||||||||||
Expensesg | 1.77% | h | 1.80% | h,i | 1.81% | h,i | 1.80% | h | 1.79% | h | 1.82% | |||||||||||||
Expenses incurred in connection with securities sold short | —% | 0.01% | 0.02% | 0.03% | —% | j | —% | j | ||||||||||||||||
Net investment income | 0.86% | 1.33% | c | 0.82% | 1.67% | d | 0.85% | 0.82% | ||||||||||||||||
| Supplemental data | ||||||||||||||||||||||||
Net assets, end of period (000’s) | $1,059,217 | $1,114,760 | $1,101,302 | $1,240,845 | $1,236,603 | $1,043,695 | ||||||||||||||||||
Portfolio turnover rate | 8.77% | 20.56% | 19.99% | 19.24% | 24.29% | 21.57% | ||||||||||||||||||
aThe amount shown for a share outstanding throughout the period may not correlate with the Statement of Operations for the period due to the timing of sales and repurchases of the Fund’s shares in relation to income earned and/or fluctuating fair value of the investments of the Fund.
bBased on average daily shares outstanding.
cNet investment income per share includes approximately $0.10 per share related to income received in the form of special dividends in connection with certain Fund holdings. Excluding this amount, the ratio of net investment income to average net assets would have been 0.96%.
dNet investment income per share includes approximately $0.29 per share related to income received in the form of a special dividend in connection with certain Fund holdings. Excluding this amount, the ratio of net investment income to average net assets would have been 0.66%.
eTotal return does not reflect sales commissions or contingent deferred sales charges, if applicable, and is not annualized for periods less than one year.
fRatios are annualized for periods less than one year.
gIncludes dividend and/or interest expense on securities sold short and security borrowing fees, if any. See below for the ratios of such expenses to average net assets for the periods presented. See Note 1(e).
hBenefit of expense reduction rounds to less than 0.01%.
iBenefit of waiver and payments by affiliates rounds to less than 0.01%.
jRounds to less than 0.01%.
| franklintempleton.com | The accompanying notes are an integral part of these financial statements. | Semiannual Report | 15 |
F R A N K L I N M U T U A L S H A R E S F U N D
F I N A N C I A L H I G H L I G H T S
Six Months Ended (unaudited) | Year Ended December 31, | |||||||||||||||||||||||
| 2016 | 2015 | 2014 | 2013 | 2012 | ||||||||||||||||||||
Class R | ||||||||||||||||||||||||
Per share operating performance | ||||||||||||||||||||||||
Net asset value, beginning of period | $27.83 | $25.66 | $29.14 | $27.98 | $22.20 | $19.70 | ||||||||||||||||||
|
| |||||||||||||||||||||||
| Income from investment operationsa: | ||||||||||||||||||||||||
Net investment incomeb | 0.19 | 0.49 | c | 0.38 | 0.64 | d | 0.34 | 0.28 | ||||||||||||||||
Net realized and unrealized gains (losses) | 1.26 | 3.42 | (1.67 | ) | 1.34 | 5.73 | 2.59 | |||||||||||||||||
|
| |||||||||||||||||||||||
Total from investment operations | 1.45 | 3.91 | (1.29 | ) | 1.98 | 6.07 | 2.87 | |||||||||||||||||
|
| |||||||||||||||||||||||
| Less distributions from: | ||||||||||||||||||||||||
Net investment income | — | (0.49 | ) | (0.43 | ) | (0.82 | ) | (0.29 | ) | (0.37 | ) | |||||||||||||
Net realized gains | — | (1.25 | ) | (1.76 | ) | — | — | — | ||||||||||||||||
|
| |||||||||||||||||||||||
Total distributions | — | (1.74 | ) | (2.19 | ) | (0.82 | ) | (0.29 | ) | (0.37 | ) | |||||||||||||
|
| |||||||||||||||||||||||
Net asset value, end of period | $29.28 | $27.83 | $25.66 | $29.14 | $27.98 | $22.20 | ||||||||||||||||||
|
| |||||||||||||||||||||||
Total returne | 5.21% | 15.31% | (4.32)% | 7.10% | 27.47% | 14.52% | ||||||||||||||||||
| Ratios to average net assetsf | ||||||||||||||||||||||||
Expensesg | 1.27% | h | 1.30% | h,i | 1.31% | h,i | 1.30% | h | 1.29% | h | 1.32% | |||||||||||||
Expenses incurred in connection with | —% | 0.01% | 0.02% | 0.03% | —% | j | —% | j | ||||||||||||||||
Net investment income | 1.36% | 1.83% | c | 1.32% | 2.17%d | 1.35% | 1.32% | |||||||||||||||||
| Supplemental data | ||||||||||||||||||||||||
Net assets, end of period (000’s) | $115,142 | $123,013 | $134,050 | $172,938 | $192,658 | $191,304 | ||||||||||||||||||
Portfolio turnover rate | 8.77% | 20.56% | 19.99% | 19.24% | 24.29% | 21.57% | ||||||||||||||||||
aThe amount shown for a share outstanding throughout the period may not correlate with the Statement of Operations for the period due to the timing of sales and repurchases of the Fund’s shares in relation to income earned and/or fluctuating fair value of the investments of the Fund.
bBased on average daily shares outstanding.
cNet investment income per share includes approximately $0.10 per share related to income received in the form of special dividends in connection with certain Fund holdings. Excluding this amount, the ratio of net investment income to average net assets would have been 1.46%.
dNet investment income per share includes approximately $0.29 per share related to income received in the form of a special dividend in connection with certain Fund holdings. Excluding this amount, the ratio of net investment income to average net assets would have been 1.16%.
eTotal return is not annualized for periods less than one year.
fRatios are annualized for periods less than one year.
gIncludes dividend and/or interest expense on securities sold short and security borrowing fees, if any. See below for the ratios of such expenses to average net assets for the periods presented. See Note 1(e).
hBenefit of expense reduction rounds to less than 0.01%.
i Benefit of waiver and payments by affiliates rounds to less than 0.01%.
j Rounds to less than 0.01%.
| 16 | Semiannual Report | The accompanying notes are an integral part of these financial statements. | franklintempleton.com |
F R A N K L I N M U T U A L S H A R E S F U N D
F I N A N C I A L H I G H L I G H T S
Six Months Ended (unaudited) | Year Ended December 31, | |||||||||||||||||||
| 2016 | 2015 | 2014 | 2013a | |||||||||||||||||
Class R6 | ||||||||||||||||||||
Per share operating performance | ||||||||||||||||||||
Net asset value, beginning of period | $28.21 | $25.98 | $29.51 | $28.33 | $24.91 | |||||||||||||||
|
| |||||||||||||||||||
| Income from investment operationsb: | ||||||||||||||||||||
Net investment incomec | 0.29 | 0.66 | d | 0.57 | 0.82 | e | 0.38 | |||||||||||||
Net realized and unrealized gains (losses) | 1.27 | 3.49 | (1.71 | ) | 1.37 | 3.51 | ||||||||||||||
|
| |||||||||||||||||||
Total from investment operations. | 1.56 | 4.15 | (1.14 | ) | 2.19 | 3.89 | ||||||||||||||
|
| |||||||||||||||||||
| Less distributions from: | ||||||||||||||||||||
Net investment income | — | (0.67 | ) | (0.63 | ) | (1.01 | ) | (0.47 | ) | |||||||||||
Net realized gains | — | (1.25 | ) | (1.76 | ) | — | — | |||||||||||||
|
| |||||||||||||||||||
Total distributions | — | (1.92 | ) | (2.39 | ) | (1.01 | ) | (0.47 | ) | |||||||||||
|
| |||||||||||||||||||
Net asset value, end of period | $29.77 | $28.21 | $25.98 | $29.51 | $28.33 | |||||||||||||||
|
| |||||||||||||||||||
Total returnf | 5.53% | 16.05% | (3.71)% | 7.72% | 15.70% | |||||||||||||||
| Ratios to average net assetsg | ||||||||||||||||||||
Expensesh,i | 0.66% | 0.68%j | 0.69%j | 0.69% | 0.67% | |||||||||||||||
Expenses incurred in connection with securities sold short | —% | 0.01% | 0.02% | 0.03% | —% | k | ||||||||||||||
Net investment income | 1.97% | 2.45%d | 1.94% | 2.78% | e | 1.97% | ||||||||||||||
| Supplemental data | ||||||||||||||||||||
Net assets, end of period (000’s) | $1,911,754 | $1,896,497 | $1,923,466 | $2,249,991 | $2,221,889 | |||||||||||||||
Portfolio turnover rate | 8.77% | 20.56% | 19.99% | 19.24% | 24.29% | |||||||||||||||
aFor the period May 1, 2013 (effective date) to December 31, 2013.
bThe amount shown for a share outstanding throughout the period may not correlate with the Statement of Operations for the period due to the timing of sales and repurchases of the Fund’s shares in relation to income earned and/or fluctuating fair value of the investments of the Fund.
cBased on average daily shares outstanding.
dNet investment income per share includes approximately $0.10 per share related to income received in the form of special dividends in connection with certain Fund holdings. Excluding this amount, the ratio of net investment income to average net assets would have been 2.08%.
eNet investment income per share includes approximately $0.29 per share related to income received in the form of a special dividend in connection with certain Fund holdings. Excluding this amount, the ratio of net investment income to average net assets would have been 1.77%.
fTotal return is not annualized for periods less than one year.
gRatios are annualized for periods less than one year.
hIncludes dividend and/or interest expense on securities sold short and security borrowing fees, if any. See below for the ratios of such expenses to average net assets for the periods presented. See Note 1(e).
iBenefit of expense reduction rounds to less than 0.01%.
jBenefit of waiver and payments by affiliates rounds to less than 0.01%.
kRounds to less than 0.01%.
| franklintempleton.com | The accompanying notes are an integral part of these financial statements. | Semiannual Report | 17 |
F R A N K L I N M U T U A L S H A R E S F U N D
Statement of Investments, June 30, 2017 (unaudited)
| Country | Shares | Value | ||||||||||||||
Common Stocks and Other Equity Interests 87.6% | ||||||||||||||||
Aerospace & Defense 0.5% | ||||||||||||||||
| a | KLX Inc. | United States | 706,035 | $ | 35,301,750 | |||||||||||
Rockwell Collins Inc. | United States | 437,882 | 46,012,641 | |||||||||||||
|
| |||||||||||||||
| 81,314,391 | ||||||||||||||||
|
| |||||||||||||||
Auto Components 0.8% | ||||||||||||||||
The Goodyear Tire & Rubber Co. | United States | 2,382,274 | 83,284,299 | |||||||||||||
| a,b,c | International Automotive Components Group Brazil LLC | Brazil | 7,234,813 | 176,956 | ||||||||||||
| a,b,c,d | International Automotive Components Group North America LLC | United States | 63,079,866 | 38,826,667 | ||||||||||||
|
| |||||||||||||||
| 122,287,922 | ||||||||||||||||
|
| |||||||||||||||
Automobiles 1.2% | ||||||||||||||||
General Motors Co. | United States | 5,564,770 | 194,377,416 | |||||||||||||
|
| |||||||||||||||
Banks 9.5% | ||||||||||||||||
Barclays PLC | United Kingdom | 38,190,870 | 100,859,044 | |||||||||||||
CIT Group Inc. | United States | 2,759,673 | 134,396,075 | |||||||||||||
Citigroup Inc. | United States | 3,362,406 | 224,877,713 | |||||||||||||
Citizens Financial Group Inc. | United States | 6,757,671 | 241,113,701 | |||||||||||||
Columbia Banking System Inc. | United States | 88,096 | 3,510,626 | |||||||||||||
| a | FCB Financial Holdings Inc., A | United States | 1,647,570 | 78,671,468 | ||||||||||||
Guaranty Bancorp | United States | 1,146,366 | 31,181,155 | |||||||||||||
JPMorgan Chase & Co. | United States | 2,748,790 | 251,239,406 | |||||||||||||
PNC Financial Services Group Inc. | United States | 2,044,922 | 255,349,410 | |||||||||||||
State Bank Financial Corp. | United States | 1,467,000 | 39,785,040 | |||||||||||||
Wells Fargo & Co. | United States | 2,531,930 | 140,294,241 | |||||||||||||
|
| |||||||||||||||
| 1,501,277,879 | ||||||||||||||||
|
| |||||||||||||||
Beverages 0.9% | ||||||||||||||||
PepsiCo Inc. | United States | 1,185,449 | 136,907,505 | |||||||||||||
|
| |||||||||||||||
Chemicals 1.1% | ||||||||||||||||
| a,e,f | Dow Corning Corp., Contingent Distribution | United States | 12,630,547 | — | ||||||||||||
Monsanto Co. | United States | 1,483,490 | 175,585,876 | |||||||||||||
|
| |||||||||||||||
| 175,585,876 | ||||||||||||||||
|
| |||||||||||||||
Communications Equipment 2.6% | ||||||||||||||||
Cisco Systems Inc. | United States | 8,126,460 | 254,358,198 | |||||||||||||
Nokia OYJ, A | Finland | 13,670,039 | 83,616,193 | |||||||||||||
Nokia OYJ, ADR | Finland | 10,897,776 | 67,130,300 | |||||||||||||
|
| |||||||||||||||
| 405,104,691 | ||||||||||||||||
|
| |||||||||||||||
Construction Materials 0.7% | ||||||||||||||||
LafargeHolcim Ltd., B | Switzerland | 1,946,175 | 111,441,990 | |||||||||||||
|
| |||||||||||||||
Consumer Finance 1.3% | ||||||||||||||||
Ally Financial Inc. | United States | 3,254,500 | 68,019,050 | |||||||||||||
Capital One Financial Corp. | United States | 1,609,205 | 132,952,517 | |||||||||||||
|
| |||||||||||||||
| 200,971,567 | ||||||||||||||||
|
| |||||||||||||||
Containers & Packaging 2.2% | ||||||||||||||||
International Paper Co. | United States | 3,640,737 | 206,102,121 | |||||||||||||
WestRock Co. | United States | 2,383,939 | 135,073,984 | |||||||||||||
|
| |||||||||||||||
| 341,176,105 | ||||||||||||||||
|
| |||||||||||||||
Diversified Financial Services 0.8% | ||||||||||||||||
Voya Financial Inc. | United States | 3,413,030 | 125,906,677 | |||||||||||||
|
| |||||||||||||||
Diversified Telecommunication Services 0.6% | ||||||||||||||||
Koninklijke KPN NV | Netherlands | 30,410,640 | 97,297,086 | |||||||||||||
|
| |||||||||||||||
| 18 | Semiannual Report | franklintempleton.com |
F R A N K L I N M U T U A L S H A R E S F U N D
S T A T E M E N T O F I N V E S T M E N T S (U N A U D I T E D)
| Country | Shares | Value | ||||||||||||||
Common Stocks and Other Equity Interests (continued) | ||||||||||||||||
Electrical Equipment 1.1% | ||||||||||||||||
| a | Sensata Technologies Holding NV | United States | 4,067,870 | $ | 173,779,406 | |||||||||||
|
| |||||||||||||||
Energy Equipment & Services 1.3% | ||||||||||||||||
Baker Hughes Inc. | United States | 3,663,252 | 199,683,867 | |||||||||||||
| a,c | Gulfmark Offshore Inc. | United States | 171,232 | 35,787 | ||||||||||||
|
| |||||||||||||||
| 199,719,654 | ||||||||||||||||
|
| |||||||||||||||
Equity Real Estate Investment Trusts (REITs) 1.7% | ||||||||||||||||
| b | Alexander’s Inc. | United States | 326,675 | 137,680,445 | ||||||||||||
Vornado Realty Trust | United States | 1,320,942 | 124,036,454 | |||||||||||||
|
| |||||||||||||||
| 261,716,899 | ||||||||||||||||
|
| |||||||||||||||
Food & Staples Retailing 4.0% | ||||||||||||||||
CVS Health Corp. | United States | 3,015,915 | 242,660,521 | |||||||||||||
The Kroger Co. | United States | 8,225,486 | 191,818,333 | |||||||||||||
| a | Rite Aid Corp. | United States | 8,729,840 | 25,753,028 | ||||||||||||
Walgreens Boots Alliance Inc. | United States | 2,283,129 | 178,791,832 | |||||||||||||
|
| |||||||||||||||
| 639,023,714 | ||||||||||||||||
|
| |||||||||||||||
Health Care Equipment & Supplies 5.1% | ||||||||||||||||
Medtronic PLC | United States | 6,332,094 | 561,973,342 | |||||||||||||
Stryker Corp. | United States | 1,813,052 | 251,615,357 | |||||||||||||
|
| |||||||||||||||
| 813,588,699 | ||||||||||||||||
|
| |||||||||||||||
Household Products 0.2% | ||||||||||||||||
Energizer Holdings Inc. | United States | 635,933 | 30,537,503 | |||||||||||||
|
| |||||||||||||||
Independent Power & Renewable Electricity Producers 0.5% | ||||||||||||||||
Vistra Energy Corp. | United States | 4,927,428 | 82,731,516 | |||||||||||||
|
| |||||||||||||||
Industrial Conglomerates 1.5% | ||||||||||||||||
General Electric Co. | United States | 8,651,100 | 233,666,211 | |||||||||||||
|
| |||||||||||||||
Insurance 9.6% | ||||||||||||||||
| a | Alleghany Corp. | United States | 377,389 | 224,470,977 | ||||||||||||
American International Group Inc. | United States | 5,079,039 | 317,540,020 | |||||||||||||
Chubb Ltd. | United States | 1,169,358 | 170,001,266 | |||||||||||||
The Hartford Financial Services Group Inc. | United States | 1,577,199 | 82,913,351 | |||||||||||||
MetLife Inc. | United States | 3,551,930 | 195,143,034 | |||||||||||||
| b | White Mountains Insurance Group Ltd. | United States | 291,961 | 253,606,084 | ||||||||||||
XL Group Ltd. | Bermuda | 6,076,710 | 266,159,898 | |||||||||||||
|
| |||||||||||||||
| 1,509,834,630 | ||||||||||||||||
|
| |||||||||||||||
IT Services 1.6% | ||||||||||||||||
Cognizant Technology Solutions Corp., A | United States | 2,992,250 | 198,685,400 | |||||||||||||
DXC Technology Co. | United States | 643,537 | 49,372,159 | |||||||||||||
|
| |||||||||||||||
| 248,057,559 | ||||||||||||||||
|
| |||||||||||||||
Machinery 2.1% | ||||||||||||||||
Caterpillar Inc. | United States | 1,654,601 | 177,803,423 | |||||||||||||
CNH Industrial NV | United Kingdom | 4,351,332 | 49,280,613 | |||||||||||||
CNH Industrial NV, special voting | United Kingdom | 5,296,616 | 59,986,341 | |||||||||||||
Federal Signal Corp. | United States | 2,920,397 | 50,698,092 | |||||||||||||
|
| |||||||||||||||
| 337,768,469 | ||||||||||||||||
|
| |||||||||||||||
Media 6.1% | ||||||||||||||||
| a | Charter Communications Inc., A | United States | 865,529 | 291,553,444 | ||||||||||||
| a | DISH Network Corp., A | United States | 2,879,437 | 180,713,466 | ||||||||||||
Sky PLC | United Kingdom | 12,335,183 | 159,707,904 | |||||||||||||
| franklintempleton.com | Semiannual Report | 19 |
F R A N K L I N M U T U A L S H A R E S F U N D
S T A T E M E N T O F I N V E S T M E N T S (U N A U D I T E D)
| Country | Shares | Value | ||||||||||||||
Common Stocks and Other Equity Interests (continued) | ||||||||||||||||
Media (continued) | ||||||||||||||||
Time Warner Inc. | United States | 3,353,558 | $ | 336,730,759 | ||||||||||||
|
| |||||||||||||||
| 968,705,573 | ||||||||||||||||
|
| |||||||||||||||
Metals & Mining 0.8% | ||||||||||||||||
thyssenkrupp AG | Germany | 3,973,743 | 112,907,822 | |||||||||||||
| c,d | Warrior Met Coal Inc. | United States | 1,156,279 | 18,915,584 | ||||||||||||
|
| |||||||||||||||
| 131,823,406 | ||||||||||||||||
|
| |||||||||||||||
Oil, Gas & Consumable Fuels 7.5% | ||||||||||||||||
Anadarko Petroleum Corp. | United States | 1,851,580 | 83,950,637 | |||||||||||||
Apache Corp. | United States | 2,375,473 | 113,856,421 | |||||||||||||
BP PLC | United Kingdom | 15,851,497 | 91,426,549 | |||||||||||||
| a | CONSOL Energy Inc. | United States | 4,672,924 | 69,813,485 | ||||||||||||
Kinder Morgan Inc. | United States | 11,533,040 | 220,973,046 | |||||||||||||
Marathon Oil Corp. | United States | 10,934,539 | 129,574,287 | |||||||||||||
Royal Dutch Shell PLC, A (EUR Traded) | United Kingdom | 6,685,312 | 177,429,374 | |||||||||||||
Royal Dutch Shell PLC, A (GBP Traded) | United Kingdom | 3,716,893 | 98,523,289 | |||||||||||||
The Williams Cos. Inc. | United States | 6,351,184 | 192,313,851 | |||||||||||||
|
| |||||||||||||||
| 1,177,860,939 | ||||||||||||||||
|
| |||||||||||||||
Pharmaceuticals 8.3% | ||||||||||||||||
Eli Lilly & Co. | United States | 4,632,255 | 381,234,586 | |||||||||||||
Merck & Co. Inc. | United States | 6,908,010 | 442,734,361 | |||||||||||||
Novartis AG, ADR | Switzerland | 3,798,680 | 317,075,820 | |||||||||||||
Teva Pharmaceutical Industries Ltd., ADR | Israel | 5,217,297 | 173,318,606 | |||||||||||||
|
| |||||||||||||||
| 1,314,363,373 | ||||||||||||||||
|
| |||||||||||||||
Professional Services 0.9% | ||||||||||||||||
RELX PLC | United Kingdom | 6,306,172 | 136,354,141 | |||||||||||||
|
| |||||||||||||||
Software 5.6% | ||||||||||||||||
CA Inc. | United States | 5,174,940 | 178,380,182 | |||||||||||||
| a | Dell Technologies Inc., V. | United States | 720,878 | 44,052,854 | ||||||||||||
Microsoft Corp. | United States | 4,857,885 | 334,854,013 | |||||||||||||
Symantec Corp. | United States | 11,660,851 | 329,419,041 | |||||||||||||
|
| |||||||||||||||
| 886,706,090 | ||||||||||||||||
|
| |||||||||||||||
Technology Hardware, Storage & Peripherals 2.2% | ||||||||||||||||
Hewlett Packard Enterprise Co. | United States | 7,491,354 | 124,281,563 | |||||||||||||
Samsung Electronics Co. Ltd. | South Korea | 110,421 | 229,246,082 | |||||||||||||
|
| |||||||||||||||
| 353,527,645 | ||||||||||||||||
|
| |||||||||||||||
Tobacco 4.8% | ||||||||||||||||
Altria Group Inc. | United States | 2,351,460 | 175,113,226 | |||||||||||||
British American Tobacco PLC | United Kingdom | 4,377,848 | 298,461,850 | |||||||||||||
Imperial Brands PLC | United Kingdom | 1,751,865 | 78,691,042 | |||||||||||||
Reynolds American Inc. | United States | 3,147,696 | 204,726,148 | |||||||||||||
|
| |||||||||||||||
| 756,992,266 | ||||||||||||||||
|
| |||||||||||||||
Wireless Telecommunication Services 0.5% | ||||||||||||||||
Vodafone Group PLC | United Kingdom | 29,287,025 | 83,066,871 | |||||||||||||
|
| |||||||||||||||
Total Common Stocks and Other Equity Interests | 13,833,473,669 | |||||||||||||||
|
| |||||||||||||||
| 20 | Semiannual Report | franklintempleton.com |
F R A N K L I N M U T U A L S H A R E S F U N D
S T A T E M E N T O F I N V E S T M E N T S (U N A U D I T E D)
| Country | Principal Amount | Value | ||||||||||||
Corporate Bonds, Notes and Senior Floating Rate Interests 3.0% |
| |||||||||||||
| g,h | Avaya Inc., DIP Facility, 8.617% - 8.716%, 1/23/18 | United States | $ | 20,613,000 | $ | 21,289,374 | ||||||||
| g,h | Belk Inc., Closing Date Term Loan, 5.905%, 12/12/22 | United States | 20,708,171 | 17,736,549 | ||||||||||
CHS/Community Health Systems Inc., senior note, 6.875%, 2/01/22 | United States | 27,672,000 | 24,282,180 | |||||||||||
| g,h | Cumulus Media Holdings Inc., Term Loans, 4.48%, 12/23/20 | United States | 59,478,293 | 48,103,069 | ||||||||||
Frontier Communications Corp., | ||||||||||||||
senior note, 10.50%, 9/15/22 | United States | 10,209,000 | 9,762,356 | |||||||||||
senior note, 11.00%, 9/15/25 | United States | 93,006,000 | 86,146,807 | |||||||||||
iHeartCommunications Inc., | ||||||||||||||
senior secured note, first lien, 9.00%, 12/15/19 | United States | 74,295,000 | 58,600,181 | |||||||||||
g,h Tranche D Term Loan, 7.976%, 1/30/19 | United States | 94,620,527 | 77,588,832 | |||||||||||
g,h Tranche E Term Loan, 8.726%, 7/30/19 | United States | 30,412,812 | 24,938,506 | |||||||||||
| g,h | Toys R Us-Delaware Inc., | |||||||||||||
FILO Loans, 8.422%, 10/24/19 | United States | 8,171,000 | 8,181,214 | |||||||||||
Term B-4 Loan, 9.952%, 4/24/20 | United States | 77,391,543 | 64,525,199 | |||||||||||
| i | Valeant Pharmaceuticals International, | |||||||||||||
senior bond, 144A, 6.75%, 8/15/21 | United States | 8,072,000 | 7,708,760 | |||||||||||
senior bond, 144A, 7.25%, 7/15/22 | United States | 5,337,000 | 5,036,794 | |||||||||||
| i | Valeant Pharmaceuticals International Inc., senior note, 144A, 7.50%, 7/15/21 | United States | 4,687,000 | 4,558,108 | ||||||||||
| i | Veritas U.S. Inc./Veritas Bermuda Ltd., senior note, 144A, 7.50%, 2/01/23 | United States | 8,401,000 | 9,052,077 | ||||||||||
|
| |||||||||||||
Total Corporate Bonds, Notes and Senior Floating Rate | 467,510,006 | |||||||||||||
|
| |||||||||||||
Corporate Notes and Senior Floating Rate Interests in | ||||||||||||||
| j | Avaya Inc., | |||||||||||||
i senior note, 144A, 10.50%, 3/01/21 | United States | 67,859,000 | 6,955,547 | |||||||||||
i senior secured note, 144A, 7.00%, 4/01/19 | United States | 21,117,000 | 17,051,977 | |||||||||||
g,h Term B-3 Loan, 7.63%, 10/26/17 | United States | 46,944,834 | 37,516,762 | |||||||||||
g,h,k Term B-6 Loan, 4.13%, 3/30/18 | United States | 9,106,294 | 7,269,855 | |||||||||||
g,h Term B-7 Loan, 4.13%, 5/29/20 | United States | 54,323,250 | 43,820,774 | |||||||||||
| c,j | Broadband Ventures III LLC, secured promissory note, 5.00%, 2/01/12 | United States | 19,594 | — | ||||||||||
| g,h,j | Caesars Entertainment Operating Co. Inc., | |||||||||||||
Term B-5-B Loans, 1.50%, 3/01/17 | United States | 9,007,017 | 10,481,917 | |||||||||||
Term B-6-B Loans, 1.50%, 3/01/17 | United States | 42,941,719 | 51,154,323 | |||||||||||
Term B-7 Loans, 1.50%, 3/01/17 | United States | 28,981,541 | 36,118,245 | |||||||||||
|
| |||||||||||||
Total Corporate Notes and Senior Floating Rate Interests in Reorganization (Cost $250,491,551) | 210,369,400 | |||||||||||||
|
| |||||||||||||
| Shares | ||||||||||||||
Companies in Liquidation 0.1% | ||||||||||||||
| a | Adelphia Recovery Trust | United States | 99,967,609 | 64,979 | ||||||||||
| a,e | Adelphia Recovery Trust, Arahova Contingent Value Vehicle, Contingent Distribution | United States | 12,005,115 | 1,200 | ||||||||||
| a,b,c,d | CB FIM Coinvestors LLC | United States | 43,105,703 | — | ||||||||||
| a,e,f | Century Communications Corp., Contingent Distribution | United States | 33,138,000 | — | ||||||||||
| a,c | FIM Coinvestor Holdings I, LLC | United States | 53,924,666 | — | ||||||||||
| a,l | Lehman Brothers Holdings Inc., Bankruptcy Claim | United States | 420,480,670 | 9,334,671 | ||||||||||
| a,e,f | Tribune Media, Litigation Trust, Contingent Distribution | United States | 996,999 | — | ||||||||||
| a,e,f | Tropicana, Litigation Trust, Contingent Distribution | United States | 76,355,000 | — | ||||||||||
| a,f | Vistra Energy Corp., Litigation Trust | United States | 292,849,556 | 3,397,055 | ||||||||||
| franklintempleton.com | Semiannual Report | 21 |
F R A N K L I N M U T U A L S H A R E S F U N D
S T A T E M E N T O F I N V E S T M E N T S (U N A U D I T E D)
| Country | Shares | Value | ||||||||||||||
Companies in Liquidation (continued) | ||||||||||||||||
| a | Vistra Energy Corp., Litigation Trust, TRA | United States | 4,927,428 | $ | 5,296,985 | |||||||||||
|
| |||||||||||||||
Total Companies in Liquidation (Cost $62,905,545) | 18,094,890 | |||||||||||||||
|
| |||||||||||||||
| Principal Amount | ||||||||||||||||
Municipal Bonds in Reorganization (Cost $56,143,385) 0.3% | ||||||||||||||||
| j | Puerto Rico Commonwealth GO, Refunding, Series A, 8.00%, 7/01/35 | United States | $ | 64,157,000 | 39,135,770 | |||||||||||
|
| |||||||||||||||
Total Investments before Short Term Investments | 14,568,583,735 | |||||||||||||||
|
| |||||||||||||||
Short Term Investments 7.2% | ||||||||||||||||
U.S. Government and Agency Securities 7.2% | ||||||||||||||||
| m | FHLB, | |||||||||||||||
7/03/17 | United States | 190,000,000 | 190,000,000 | |||||||||||||
7/05/17 | United States | 69,500,000 | 69,496,178 | |||||||||||||
| m | U.S. Treasury Bill, | United States | 118,900,000 | 118,597,350 | ||||||||||||
7/27/17 - 12/21/17 | United States | 767,000,000 | 765,219,759 | |||||||||||||
|
| |||||||||||||||
Total U.S. Government and Agency Securities | 1,143,313,287 | |||||||||||||||
|
| |||||||||||||||
Total Investments (Cost $11,985,702,124) 99.5% | 15,711,897,022 | |||||||||||||||
Other Assets, less Liabilities 0.5% | 76,832,802 | |||||||||||||||
|
| |||||||||||||||
Net Assets 100.0% | $ | 15,788,729,824 | ||||||||||||||
|
| |||||||||||||||
aNon-income producing.
bSee Note 11 regarding holdings of 5% voting securities.
cSee Note 9 regarding restricted securities.
dAt June 30, 2017, pursuant to the Fund’s policies and the requirements of applicable securities law, the Fund is restricted from trading these securities at period end.
eContingent distributions represent the right to receive additional distributions, if any, during the reorganization of the underlying company. Shares represent total underlying principal of debt securities.
fSecurity has been deemed illiquid because it may not be able to be sold within seven days. At June 30, 2017, the aggregate value of these securities was $3,397,055, representing less than 0.1% of net assets.
gThe coupon rate shown represents the rate at period end.
hSee Note 1(g) regarding senior floating rate interests.
iSecurity was purchased pursuant to Rule 144A under the Securities Act of 1933 and may be sold in transactions exempt from registration only to qualified institutional buyers or in a public offering registered under the Securities Act of 1933. These securities have been deemed liquid under guidelines approved by the Trust’s Board of Trustees. At June 30, 2017, the aggregate value of these securities was $50,363,263, representing 0.3% of net assets.
jSee Note 8 regarding credit risk and defaulted securities.
kA portion or all of the security purchased on a delayed delivery basis. See Note 1(c).
lBankruptcy Claim represent the right to receive distributions, if any, during the liquidation of the underlying pool of assets. Shares represent the amount of allowed unsecured claims.
mThe security was issued on a discount basis with no stated coupon rate.
nA portion or all of the security has been segregated as collateral for open forward contracts. At June 30, 2017, the aggregate value of these securities and/or cash pledged amounted to $27,717,958, representing 0.2% of net assets.
| 22 | Semiannual Report | franklintempleton.com |
F R A N K L I N M U T U A L S H A R E S F U N D
S T A T E M E N T O F I N V E S T M E N T S ( U N A U D I T E D )
At June 30, 2017, the Fund had the following futures contracts outstanding. See Note 1(d).
Futures Contracts
| Description | Type | Number of Contracts | Notional Value | Expiration Date | Unrealized Appreciation | Unrealized Depreciation | ||||||||||||||||
| ||||||||||||||||||||||
| Currency Contracts | ||||||||||||||||||||||
EUR/USD | Short | 1,549 | $ | 222,029,787 | 9/18/17 | $ — | $ | (3,898,968 | ) | |||||||||||||
GBP/USD | Short | 3,891 | 317,238,094 | 9/18/17 | — | (6,463,151 | ) | |||||||||||||||
| ||||||||||||||||||||||
| Total Futures Contracts | $ — | $ | (10,362,119 | ) | ||||||||||||||||||
| ||||||||||||||||||||||
| Net unrealized appreciation (depreciation) | $ | (10,362,119 | ) | |||||||||||||||||||
|
| |||||||||||||||||||||
At June 30, 2017, the Fund had the following forward exchange contracts outstanding. See Note 1(d).
Forward Exchange Contracts
| Currency | Counterparty | a | Type | Quantity | | Contract Amount | | | Settlement Date | | | Unrealized Appreciation | | | Unrealized Depreciation | | ||||||||||||
| ||||||||||||||||||||||||||||
| OTC Forward Exchange Contracts | ||||||||||||||||||||||||||||
Euro | BOFA | Buy | 1,454,241 | $ | 1,659,165 | 7/12/17 | $ 3,060 | $ | — | |||||||||||||||||||
Euro | BONY | Buy | 1,488,212 | 1,698,675 | 7/12/17 | 2,380 | — | |||||||||||||||||||||
Euro | BONY | Sell | 127,103 | 136,727 | 7/12/17 | — | (8,554 | ) | ||||||||||||||||||||
Euro | FBCO | Sell | 30,831,585 | 33,186,194 | 7/12/17 | — | (2,054,901 | ) | ||||||||||||||||||||
Euro | HSBK | Buy | 1,454,241 | 1,658,159 | 7/12/17 | 4,066 | — | |||||||||||||||||||||
Euro | SSBT | Buy | 1,454,240 | 1,659,888 | 7/12/17 | 2,336 | — | |||||||||||||||||||||
Euro | SSBT | Sell | 30,831,586 | 33,176,328 | 7/12/17 | — | (2,064,767 | ) | ||||||||||||||||||||
Euro | UBSW | Buy | 2,320,375 | 2,646,913 | 7/12/17 | 5,320 | — | |||||||||||||||||||||
Euro | UBSW | Sell | 252,631 | 271,534 | 7/12/17 | — | (17,228 | ) | ||||||||||||||||||||
British Pound | BOFA | Buy | 28,184,833 | 36,058,450 | 7/13/17 | 670,232 | — | |||||||||||||||||||||
British Pound | BONY | Sell | 7,496,498 | 9,426,869 | 7/13/17 | — | (342,091 | ) | ||||||||||||||||||||
British Pound | FBCO | Sell | 83,724 | 102,395 | 7/13/17 | — | (6,709 | ) | ||||||||||||||||||||
British Pound | HSBK | Buy | 3,577,483 | 4,556,354 | 7/13/17 | 105,595 | — | |||||||||||||||||||||
British Pound | HSBK | Sell | 24,673,201 | 30,145,357 | 7/13/17 | — | (2,007,191 | ) | ||||||||||||||||||||
British Pound | SSBT | Buy | 3,315,034 | 4,222,959 | 7/13/17 | 96,983 | — | |||||||||||||||||||||
British Pound | SSBT | Sell | 28,030,182 | 34,246,275 | 7/13/17 | — | (2,280,875 | ) | ||||||||||||||||||||
British Pound | UBSW | Buy | 13,106,828 | 16,819,155 | 7/13/17 | 260,831 | — | |||||||||||||||||||||
Euro | BOFA | Sell | 3,201,921 | 3,483,844 | 7/26/17 | — | (178,891 | ) | ||||||||||||||||||||
Euro | HSBK | Sell | 34,813,946 | 37,143,690 | 7/26/17 | — | (2,680,608 | ) | ||||||||||||||||||||
Euro | SSBT | Sell | 5,004,186 | 5,410,929 | 7/26/17 | — | (313,449 | ) | ||||||||||||||||||||
Euro | UBSW | Sell | 30,681,996 | 32,699,689 | 7/26/17 | — | (2,397,996 | ) | ||||||||||||||||||||
South Korean Won | BOFA | Sell | 20,823,233,122 | 18,249,985 | 8/11/17 | 58,671 | — | |||||||||||||||||||||
South Korean Won | HSBK | Buy | 60,739,711,157 | 54,043,401 | 8/11/17 | — | (980,787 | ) | ||||||||||||||||||||
South Korean Won | HSBK | Sell | 1,947,826,440 | 1,694,499 | 8/11/17 | — | (7,135 | ) | ||||||||||||||||||||
South Korean Won | HSBK | Sell | 103,790,475,854 | 91,186,252 | 8/11/17 | 514,208 | — | |||||||||||||||||||||
South Korean Won | UBSW | Buy | 17,983,100,443 | 15,931,506 | 8/11/17 | — | (221,351 | ) | ||||||||||||||||||||
South Korean Won | UBSW | Sell | 5,521,050,000 | 4,807,949 | 8/11/17 | — | (15,277 | ) | ||||||||||||||||||||
South Korean Won | UBSW | Sell | 49,272,658,568 | 43,433,841 | 8/11/17 | 388,922 | — | |||||||||||||||||||||
British Pound | BOFA | Sell | 5,596,015 | 6,989,520 | 8/14/17 | — | (310,184 | ) | ||||||||||||||||||||
British Pound | HSBK | Sell | 38,505,700 | 48,355,572 | 8/14/17 | — | (1,873,065 | ) | ||||||||||||||||||||
British Pound | SSBT | Sell | 8,403,518 | 10,446,711 | 8/14/17 | — | (515,230 | ) | ||||||||||||||||||||
British Pound | UBSW | Sell | 35,170,888 | 44,146,325 | 8/14/17 | — | (1,732,228 | ) | ||||||||||||||||||||
Euro | BOFA | Sell | 7,549,201 | 8,133,055 | 8/18/17 | — | (512,741 | ) | ||||||||||||||||||||
Euro | BONY | Sell | 2,236,127 | 2,450,208 | 8/18/17 | — | (110,739 | ) | ||||||||||||||||||||
Euro | HSBK | Sell | 6,864,301 | 7,420,264 | 8/18/17 | — | (441,143 | ) | ||||||||||||||||||||
| franklintempleton.com | Semiannual Report | 23 | ||||
F R A N K L I N M U T U A L S H A R E S F U N D
S T A T E M E N T O F I N V E S T M E N T S ( U N A U D I T E D )
Forward Exchange Contracts (continued)
| Currency | Counterparty | a | Type | Quantity | | Contract Amount | | | Settlement Date | | | Unrealized Appreciation | | | Unrealized Depreciation | | ||||||||||||
| ||||||||||||||||||||||||||||
| OTC Forward Exchange Contracts (continued) | ||||||||||||||||||||||||||||
Euro | SSBT | Sell | 18,520,143 | $ | 19,874,682 | 8/18/17 | $ — | $ | (1,335,689 | ) | ||||||||||||||||||
Euro | UBSW | Sell | 3,476,586 | 3,767,262 | 8/18/17 | — | (214,332 | ) | ||||||||||||||||||||
Euro | BOFA | Sell | 24,425,596 | 26,274,155 | 10/10/17 | — | (1,780,959 | ) | ||||||||||||||||||||
Euro | BONY | Sell | 719,633 | 795,410 | 10/10/17 | — | (31,156 | ) | ||||||||||||||||||||
Euro | HSBK | Sell | 20,885,096 | 22,493,236 | 10/10/17 | — | (1,495,279 | ) | ||||||||||||||||||||
Euro | SSBT | Sell | 1,379,348 | 1,525,530 | 10/10/17 | — | (58,782 | ) | ||||||||||||||||||||
Euro | UBSW | Sell | 635,062 | 701,696 | 10/10/17 | — | (27,733 | ) | ||||||||||||||||||||
Euro | BOFA | Sell | 969,328 | 1,082,808 | 10/18/17 | — | (31,068 | ) | ||||||||||||||||||||
Euro | BONY | Sell | 3,233,280 | 3,557,507 | 10/18/17 | — | (157,925 | ) | ||||||||||||||||||||
Euro | HSBK | Sell | 13,845,726 | 14,920,428 | 10/18/17 | — | (989,997 | ) | ||||||||||||||||||||
Euro | UBSW | Sell | 12,876,397 | 13,841,054 | 10/18/17 | — | (955,493 | ) | ||||||||||||||||||||
British Pound | BOFA | Sell | 20,386,942 | 26,505,299 | 10/24/17 | — | (145,891 | ) | ||||||||||||||||||||
British Pound | BONY | Sell | 1,039,379 | 1,348,522 | 10/24/17 | — | (10,225 | ) | ||||||||||||||||||||
British Pound | HSBK | Sell | 6,360,138 | 8,316,771 | 10/24/17 | 2,368 | — | |||||||||||||||||||||
British Pound | HSBK | Sell | 19,404,589 | 25,176,445 | 10/24/17 | — | (190,548 | ) | ||||||||||||||||||||
British Pound | SSBT | Sell | 18,885,324 | 24,701,397 | 10/24/17 | 13,222 | — | |||||||||||||||||||||
British Pound | SSBT | Sell | 111,665,234 | 144,068,618 | 10/24/17 | — | (1,907,739 | ) | ||||||||||||||||||||
British Pound | UBSW | Sell | 4,634,294 | 6,005,864 | 10/24/17 | — | (52,401 | ) | ||||||||||||||||||||
Euro | BOFA | Sell | 21,138,619 | 23,288,099 | 11/06/17 | — | (1,029,235 | ) | ||||||||||||||||||||
Euro | SSBT | Sell | 4,739,837 | 5,294,540 | 11/06/17 | — | (158,049 | ) | ||||||||||||||||||||
Euro | UBSW | Sell | 21,846,534 | 24,067,012 | 11/06/17 | — | (1,064,691 | ) | ||||||||||||||||||||
South Korean Won | HSBK | Sell | 83,607,397,389 | 74,071,763 | 11/10/17 | 908,077 | — | |||||||||||||||||||||
South Korean Won | UBSW | Sell | 68,912,183,347 | 60,770,720 | 11/10/17 | 466,613 | — | |||||||||||||||||||||
Euro | BOFA | Sell | 28,419,564 | 31,784,713 | 11/20/17 | — | (934,727 | ) | ||||||||||||||||||||
Euro | HSBK | Sell | 7,161,715 | 8,126,442 | 11/20/17 | — | (118,839 | ) | ||||||||||||||||||||
Euro | SSBT | Sell | 5,398,226 | 6,111,213 | 11/20/17 | — | (103,764 | ) | ||||||||||||||||||||
Euro | UBSW | Sell | 25,124,174 | 28,082,043 | 11/20/17 | — | (843,416 | ) | ||||||||||||||||||||
British Pound | BOFA | Sell | 4,946,776 | 6,482,490 | 11/24/17 | 9,687 | — | |||||||||||||||||||||
British Pound | BONY | Sell | 43,803,547 | 57,358,642 | 11/24/17 | 42,195 | — | |||||||||||||||||||||
British Pound | HSBK | Sell | 687,160 | 885,174 | 11/24/17 | — | (13,968 | ) | ||||||||||||||||||||
British Pound | HSBK | Sell | 4,527,378 | 5,927,741 | 11/24/17 | 3,718 | — | |||||||||||||||||||||
British Pound | SSBT | Sell | 2,580,152 | 3,359,410 | 11/24/17 | — | (16,690 | ) | ||||||||||||||||||||
British Pound | SSBT | Sell | 7,279,996 | 9,534,835 | 11/24/17 | 9,043 | — | |||||||||||||||||||||
British Pound | UBSW | Sell | 2,030,225 | 2,653,429 | 11/24/17 | — | (3,098 | ) | ||||||||||||||||||||
British Pound | UBSW | Sell | 53,202,297 | 69,659,352 | 11/24/17 | 44,747 | — | |||||||||||||||||||||
|
| |||||||||||||||||||||||||||
Total Forward Exchange Contracts |
| $ 3,612,274 | $ | (34,744,834 | ) | |||||||||||||||||||||||
|
| |||||||||||||||||||||||||||
Net unrealized appreciation (depreciation) |
| $ | (31,132,560 | ) | ||||||||||||||||||||||||
|
| |||||||||||||||||||||||||||
aMay be comprised of multiple contracts with the same counterparty, currency and settlement date.
See Note 10 regarding other derivative information.
See Abbreviations on page 41.
| 24 | Semiannual Report | The accompanying notes are an integral part of these financial statements. | franklintempleton.com | ||
F R A N K L I N M U T U A L S H A R E S F U N D
Financial Statements
Statement of Assets and Liabilities
June 30, 2017 (unaudited)
Assets: | ||||
Investments in securities: | ||||
Cost - Unaffiliated issuers | $ | 11,899,260,605 | ||
Cost - Non-controlled affiliates (Note 11) | 86,441,519 | |||
|
| |||
Total cost of investments | $ | 11,985,702,124 | ||
|
| |||
Value - Unaffiliated issuers | $ | 15,281,606,870 | ||
Value - Non-controlled affiliates (Note 11) | 430,290,152 | |||
|
| |||
Total value of investments | 15,711,897,022 | |||
Cash | 1,079,065 | |||
Foreign currency, at value (cost $8,964,059) | 8,986,396 | |||
Receivables: | ||||
Investment securities sold | 82,423,156 | |||
Capital shares sold | 10,925,255 | |||
Dividends and interest | 24,434,175 | |||
European Union tax reclaims | 4,374,960 | |||
Due from brokers | 11,955,930 | |||
Unrealized appreciation on OTC forward exchange contracts | 3,612,274 | |||
Other assets | 10,207 | |||
|
| |||
Total assets | 15,859,698,440 | |||
�� |
| |||
Liabilities: | ||||
Payables: | ||||
Investment securities purchased | 4,356,428 | |||
Capital shares redeemed | 16,026,131 | |||
Management fees | 8,409,028 | |||
Distribution fees | 3,867,960 | |||
Transfer agent fees | 1,832,616 | |||
Trustees’ fees and expenses | 739,731 | |||
Variation margin | 292,981 | |||
Unrealized depreciation on OTC forward exchange contracts | 34,744,834 | |||
Accrued expenses and other liabilities | 698,907 | |||
|
| |||
Total liabilities | 70,968,616 | |||
|
| |||
Net assets, at value | $ | 15,788,729,824 | ||
|
| |||
Net assets consist of: | ||||
Paid-in capital | $ | 11,367,272,914 | ||
Undistributed net investment income | 120,377,680 | |||
Net unrealized appreciation (depreciation) | 3,684,734,799 | |||
Accumulated net realized gain (loss) | 616,344,431 | |||
|
| |||
Net assets, at value | $ | 15,788,729,824 | ||
|
|
franklintempleton.com |
The accompanying notes are an integral part of these financial statements. | Semiannual Report |
25 |
F R A N K L I N M U T U A L S H A R E S F U N D
F I N A N C I A L S T A T E M E N T S
Statement of Assets and Liabilities (continued)
June 30, 2017 (unaudited)
| Class Z: | ||||
Net assets, at value | $8,075,720,958 | |||
|
| |||
Shares outstanding | 271,334,611 | |||
|
| |||
Net asset value and maximum offering price per share | $29.76 | |||
|
| |||
| Class A: | ||||
Net assets, at value | $4,626,895,874 | |||
|
| |||
Shares outstanding | 157,061,305 | |||
|
| |||
Net asset value per sharea | $29.46 | |||
|
| |||
Maximum offering price per share (net asset value per share ÷ 94.25%) | $31.26 | |||
|
| |||
| Class C: | ||||
Net assets, at value | $1,059,217,218 | |||
|
| |||
Shares outstanding | 36,471,599 | |||
|
| |||
Net asset value and maximum offering price per sharea | $29.04 | |||
|
| |||
| Class R: | ||||
Net assets, at value | $115,141,712 | |||
|
| |||
Shares outstanding | 3,932,393 | |||
|
| |||
Net asset value and maximum offering price per share | $29.28 | |||
|
| |||
| Class R6: | ||||
Net assets, at value | $1,911,754,062 | |||
|
| |||
Shares outstanding | 64,223,252 | |||
|
| |||
Net asset value and maximum offering price per share | $29.77 | |||
|
|
aRedemption price is equal to net asset value less contingent deferred sales charges, if applicable.
| 26 | Semiannual Report | The accompanying notes are an integral part of these financial statements. | franklintempleton.com | ||
F R A N K L I N M U T U A L S H A R E S F U N D
F I N A N C I A L S T A T E M E N T S
Statement of Operations
for the six months ended June 30, 2017 (unaudited)
Investment income: | ||||
Dividends: | ||||
Unaffiliated issuers | $ | 168,485,313 | ||
Non-controlled affiliates (Note 11) | 3,514,183 | |||
Interest | 34,723,947 | |||
|
| |||
Total investment income | 206,723,443 | |||
|
| |||
Expenses: | ||||
Management fees (Note 3a) | 50,701,412 | |||
Distribution fees: (Note 3c) | ||||
Class A | 5,851,848 | |||
Class C | 5,520,757 | |||
Class R | 300,503 | |||
Transfer agent fees: (Note 3e) | ||||
Class Z | 4,282,879 | |||
Class A | 2,541,411 | |||
Class C | 599,771 | |||
Class R | 65,448 | |||
Class R6 | 926 | |||
Custodian fees (Note 4) | 191,845 | |||
Reports to shareholders | 443,461 | |||
Registration and filing fees | 156,986 | |||
Professional fees | 320,993 | |||
Trustees’ fees and expenses | 231,642 | |||
Other | 189,526 | |||
|
| |||
Total expenses | 71,399,408 | |||
Expense reductions (Note 4) | (14,954 | ) | ||
|
| |||
Net expenses | 71,384,454 | |||
|
| |||
Net investment income | 135,338,989 | |||
|
| |||
Realized and unrealized gains (losses): | ||||
Net realized gain (loss) from: | ||||
Investments: | ||||
Unaffiliated issuers | 446,599,884 | |||
Non-controlled affiliates (Note 11) | 4,432,689 | |||
Foreign currency transactions | 10,136,671 | |||
Futures contracts | (12,385,927 | ) | ||
Securities sold short | (1,375,732 | ) | ||
|
| |||
Net realized gain (loss) | 447,407,585 | |||
|
| |||
Net change in unrealized appreciation (depreciation) on: | ||||
Investments | 335,560,748 | |||
Translation of other assets and liabilities denominated in foreign currencies | (71,475,839 | ) | ||
Futures contracts | (18,080,490 | ) | ||
|
| |||
Net change in unrealized appreciation (depreciation) | 246,004,419 | |||
|
| |||
Net realized and unrealized gain (loss) | 693,412,004 | |||
|
| |||
Net increase (decrease) in net assets resulting from operations | $ | 828,750,993 | ||
|
|
| franklintempleton.com | The accompanying notes are an integral part of these financial statements. | Semiannual Report | 27 | ||||
F R A N K L I N M U T U A L S H A R E S F U N D
F I N A N C I A L S T A T E M E N T S
Statements of Changes in Net Assets
| Six Months Ended June 30, 2017 (unaudited) | Year Ended December 31, 2016 | |||||||||||
| ||||||||||||
Increase (decrease) in net assets: | ||||||||||||
Operations: | ||||||||||||
Net investment income | $ 135,338,989 | $ 323,716,322 | ||||||||||
Net realized gain (loss) | 447,407,585 | 721,946,200 | ||||||||||
Net change in unrealized appreciation (depreciation) | 246,004,419 | 1,146,276,539 | ||||||||||
|
| |||||||||||
Net increase (decrease) in net assets resulting from operations | 828,750,993 | 2,191,939,061 | ||||||||||
|
| |||||||||||
Distributions to shareholders from: | ||||||||||||
Net investment income: | ||||||||||||
Class Z | — | (167,480,237 | ) | |||||||||
Class A | — | (92,382,149 | ) | |||||||||
Class C | — | (14,151,029 | ) | |||||||||
Class R | — | (2,106,830 | ) | |||||||||
Class R6 | — | (43,103,381 | ) | |||||||||
Net realized gains: | ||||||||||||
Class Z | — | (326,344,607 | ) | |||||||||
Class A | — | (206,689,642 | ) | |||||||||
Class C | — | (48,998,625 | ) | |||||||||
Class R | — | (5,470,579 | ) | |||||||||
Class R6 | — | (81,063,435 | ) | |||||||||
|
| |||||||||||
Total distributions to shareholders | — | (987,790,514 | ) | |||||||||
|
| |||||||||||
Capital share transactions: (Note 2) | ||||||||||||
Class Z | (24,827,464 | ) | 336,119,152 | |||||||||
Class A | (357,024,880 | ) | (462,728,047 | ) | ||||||||
Class C | (109,621,114 | ) | (71,596,143 | ) | ||||||||
Class R | (14,051,447 | ) | (21,431,476 | ) | ||||||||
Class R6 | (88,222,730 | ) | (179,527,859 | ) | ||||||||
|
| |||||||||||
Total capital share transactions | (593,747,635 | ) | (399,164,373 | ) | ||||||||
|
| |||||||||||
Net increase (decrease) in net assets | 235,003,358 | 804,984,174 | ||||||||||
Net assets: | ||||||||||||
Beginning of period | 15,553,726,466 | 14,748,742,292 | ||||||||||
|
| |||||||||||
End of period | $15,788,729,824 | $15,553,726,466 | ||||||||||
|
| |||||||||||
Undistributed net investment income included in net assets: | ||||||||||||
End of period | $ 120,377,680 | $ — | ||||||||||
|
| |||||||||||
Distributions in excess of net investment income included in net assets: | ||||||||||||
End of period | $ — | $ (14,961,309 | ) | |||||||||
|
| |||||||||||
| 28 | Semiannual Report | The accompanying notes are an integral part of these financial statements. | franklintempleton.com | ||
F R A N K L I N M U T U A L S H A R E S F U N D
Notes to Financial Statements (unaudited)
1. Organization and Significant Accounting Policies
Franklin Mutual Series Funds (Trust) is registered under the Investment Company Act of 1940 (1940 Act) as an open-end management investment company, consisting of seven separate funds and applies the specialized accounting and reporting guidance in U.S. Generally Accepted Accounting Principles (U.S. GAAP). Franklin Mutual Shares Fund (Fund) is included in this report. The Fund offers five classes of shares: Class Z, Class A, Class C, Class R and Class R6. Each class of shares may differ by its initial sales load, contingent deferred sales charges, voting rights on matters affecting a single class, its exchange privilege and fees primarily due to differing arrangements for distribution and transfer agent fees.
The following summarizes the Fund’s significant accounting policies.
a. Financial Instrument Valuation
The Fund’s investments in financial instruments are carried at fair value daily. Fair value is the price that would be received to sell an asset or paid to transfer a liability in an orderly transaction between market participants on the measurement date. The Fund calculates the net asset value (NAV) per share as of 4 p.m. Eastern time each day the New York Stock Exchange (NYSE) is open for trading. Under compliance policies and procedures approved by the Trust’s Board of Trustees (the Board), the Fund’s administrator has responsibility for oversight of valuation, including leading the cross-functional Valuation Committee (VC). The VC provides administration and oversight of the Fund’s valuation policies and procedures, which are approved annually by the Board. Among other things, these procedures allow the Fund to utilize independent pricing services, quotations from securities and financial instrument dealers, and other market sources to determine fair value.
Equity securities and derivative financial instruments listed on an exchange or on the NASDAQ National Market System are valued at the last quoted sale price or the official closing price of the day, respectively. Foreign equity securities are valued as of the close of trading on the foreign stock exchange on which the security is primarily traded or as of 4 p.m. Eastern time. The value is then converted into its U.S. dollar equivalent at the foreign exchange rate in effect at 4 p.m. Eastern time on the day that the value of the security is determined. Over-the-counter (OTC) securities are valued within the range of the most recent
quoted bid and ask prices. Securities that trade in multiple markets or on multiple exchanges are valued according to the broadest and most representative market. Certain equity securities are valued based upon fundamental characteristics or relationships to similar securities.
Debt securities generally trade in the OTC market rather than on a securities exchange. The Fund’s pricing services use multiple valuation techniques to determine fair value. In instances where sufficient market activity exists, the pricing services may utilize a market-based approach through which quotes from market makers are used to determine fair value. In instances where sufficient market activity may not exist or is limited, the pricing services also utilize proprietary valuation models which may consider market characteristics such as benchmark yield curves, credit spreads, estimated default rates, anticipated market interest rate volatility, coupon rates, anticipated timing of principal repayments, underlying collateral, and other unique security features in order to estimate the relevant cash flows, which are then discounted to calculate the fair value.
Certain derivative financial instruments trade in the OTC market. The Fund’s pricing services use various techniques including industry standard option pricing models and proprietary discounted cash flow models to determine the fair value of those instruments. The Fund’s net benefit or obligation under the derivative contract, as measured by the fair value of the contract, is included in net assets.
The Fund has procedures to determine the fair value of financial instruments for which market prices are not reliable or readily available. Under these procedures, the VC convenes on a regular basis to review such financial instruments and considers a number of factors, including significant unobservable valuation inputs, when arriving at fair value. The VC primarily employs a market-based approach which may use related or comparable assets or liabilities, recent transactions, market multiples, book values, and other relevant information for the investment to determine the fair value of the investment. An income-based valuation approach may also be used in which the anticipated future cash flows of the investment are discounted to calculate fair value. Discounts may also be applied due to the nature or duration of any restrictions on the disposition of the investments. Due to the inherent uncertainty of valuations of such investments, the fair values may differ significantly from the values that would have been used had an active market existed. The VC employs various methods for calibrating these
| franklintempleton.com | Semiannual Report | 29 | ||||
F R A N K L I N M U T U A L S H A R E S F U N D
N O T E S T O F I N A N C I A L S T A T E M E N T S ( U N A U D I T E D )
1. Organization and Significant Accounting Policies (continued)
a. Financial Instrument Valuation (continued)
valuation approaches including a regular review of key inputs and assumptions, transactional back-testing or disposition analysis, and reviews of any related market activity.
Trading in securities on foreign securities stock exchanges and OTC markets may be completed before 4 p.m. Eastern time. In addition, trading in certain foreign markets may not take place on every Fund’s business day. Occasionally, events occur between the time at which trading in a foreign security is completed and 4 p.m. Eastern time that might call into question the reliability of the value of a portfolio security held by the Fund. As a result, differences may arise between the value of the Fund’s portfolio securities as determined at the foreign market close and the latest indications of value at 4 p.m. Eastern time. In order to minimize the potential for these differences, the VC monitors price movements following the close of trading in foreign stock markets through a series of country specific market proxies (such as baskets of American Depositary Receipts, futures contracts and exchange traded funds). These price movements are measured against established trigger thresholds for each specific market proxy to assist in determining if an event has occurred that may call into question the reliability of the values of the foreign securities held by the Fund. If such an event occurs, the securities may be valued using fair value procedures, which may include the use of independent pricing services.
When the last day of the reporting period is a non-business day, certain foreign markets may be open on those days that the Fund’s NAV is not calculated, which could result in differences between the value of the Fund’s portfolio securities on the last business day and the last calendar day of the reporting period. Any significant security valuation changes due to an open foreign market are adjusted and reflected by the Fund for financial reporting purposes.
b. Foreign Currency Translation
Portfolio securities and other assets and liabilities denominated in foreign currencies are translated into U.S. dollars based on the exchange rate of such currencies against U.S. dollars on the date of valuation. The Fund may enter into foreign currency exchange contracts to facilitate transactions denominated in a foreign currency. Purchases and sales of securities, income and
expense items denominated in foreign currencies are translated into U.S. dollars at the exchange rate in effect on the transaction date. Portfolio securities and assets and liabilities denominated in foreign currencies contain risks that those currencies will decline in value relative to the U.S. dollar. Occasionally, events may impact the availability or reliability of foreign exchange rates used to convert the U.S. dollar equivalent value. If such an event occurs, the foreign exchange rate will be valued at fair value using procedures established and approved by the Board.
The Fund does not separately report the effect of changes in foreign exchange rates from changes in market prices on securities held. Such changes are included in net realized and unrealized gain or loss from investments in the Statement of Operations.
Realized foreign exchange gains or losses arise from sales of foreign currencies, currency gains or losses realized between the trade and settlement dates on securities transactions and the difference between the recorded amounts of dividends, interest, and foreign withholding taxes and the U.S. dollar equivalent of the amounts actually received or paid. Net unrealized foreign exchange gains and losses arise from changes in foreign exchange rates on foreign denominated assets and liabilities other than investments in securities held at the end of the reporting period.
c. Securities Purchased on a Delayed Delivery Basis
The Fund purchases securities on a delayed delivery basis, with payment and delivery scheduled for a future date. These transactions are subject to market fluctuations and are subject to the risk that the value at delivery may be more or less than the trade date purchase price. Although the Fund will generally purchase these securities with the intention of holding the securities, it may sell the securities before the settlement date. Sufficient assets have been segregated for these securities.
d. Derivative Financial Instruments
The Fund invested in derivative financial instruments in order to manage risk or gain exposure to various other investments or markets. Derivatives are financial contracts based on an underlying or notional amount, require no initial investment or an initial net investment that is smaller than would normally be required to have a similar response to changes in market factors, and require or permit net settlement. Derivatives contain various risks including the potential inability of the counterparty to fulfill their obligations under the terms of the contract, the
| 30 | Semiannual Report | franklintempleton.com | ||
F R A N K L I N M U T U A L S H A R E S F U N D
N O T E S T O F I N A N C I A L S T A T E M E N T S ( U N A U D I T E D )
potential for an illiquid secondary market, and/or the potential for market movements which expose the Fund to gains or losses in excess of the amounts shown in the Statement of Assets and Liabilities. Realized gain and loss and unrealized appreciation and depreciation on these contracts for the period are included in the Statement of Operations.
Derivative counterparty credit risk is managed through a formal evaluation of the creditworthiness of all potential counterparties. The Fund attempts to reduce its exposure to counterparty credit risk on OTC derivatives, whenever possible, by entering into International Swaps and Derivatives Association (ISDA) master agreements with certain counterparties. These agreements contain various provisions, including but not limited to collateral requirements, events of default, or early termination. Termination events applicable to the counterparty include certain deteriorations in the credit quality of the counterparty. Termination events applicable to the Fund include failure of the Fund to maintain certain net asset levels and/or limit the decline in net assets over various periods of time. In the event of default or early termination, the ISDA master agreement gives the non-defaulting party the right to net and close-out all transactions traded, whether or not arising under the ISDA agreement, to one net amount payable by one counterparty to the other. However, absent an event of default or early termination, OTC derivative assets and liabilities are presented gross and not offset in the Statement of Assets and Liabilities. Early termination by the counterparty may result in an immediate payment by the Fund of any net liability owed to that counterparty under the ISDA agreement. At June 30, 2017, the Fund had OTC derivatives in a net liability position of $30,516,445 and the aggregate value of collateral pledged for such contracts was $27,717,958.
Collateral requirements differ by type of derivative. Collateral or initial margin requirements are set by the broker or exchange clearing house for exchange traded and centrally cleared derivatives. Initial margin deposited is held at the exchange and can be in the form of cash and/or securities. For OTC derivatives traded under an ISDA master agreement, posting of collateral is required by either the Fund or the applicable counterparty if the total net exposure of all OTC derivatives with the applicable counterparty exceeds the minimum transfer amount, which typically ranges from $100,000 to $250,000, and can vary depending on the counterparty and the type of the agreement. Generally, collateral is determined at the close of Fund business each day and any additional collateral required
due to changes in derivative values may be delivered by the Fund or the counterparty the next business day, or within a few business days. Collateral pledged and/or received by the Fund for OTC derivatives, if any, is held in segregated accounts with the Fund’s custodian/counterparty broker and can be in the form of cash and/or securities. Unrestricted cash may be invested according to the Fund’s investment objectives. To the extent that the amounts due to the Fund from its counterparties are not subject to collateralization or are not fully collateralized, the Fund bears the risk of loss from counterparty non-performance.
The Fund entered into exchange traded futures contracts primarily to manage exposure to certain foreign currencies. A futures contract is an agreement between the Fund and a counterparty to buy or sell an asset at a specified price on a future date. Required initial margins are pledged by the Fund, and the daily change in fair value is accounted for as a variation margin payable or receivable in the Statement of Assets and Liabilities.
The Fund entered into OTC forward exchange contracts primarily to manage exposure to certain foreign currencies. A forward exchange contract is an agreement between the Fund and a counterparty to buy or sell a foreign currency at a specific exchange rate on a future date.
See Note 10 regarding other derivative information.
e. Securities Sold Short
The Fund is engaged in selling securities short, which obligates the Fund to replace a borrowed security with the same security at current fair value. The Fund incurs a loss if the price of the security increases between the date of the short sale and the date on which the Fund replaces the borrowed security. The Fund realizes a gain if the price of the security declines between those dates. Gains are limited to the price at which the Fund sold the security short, while losses are potentially unlimited in size.
The Fund is required to establish a margin account with the broker lending the security sold short. While the short sale is outstanding, the broker retains the proceeds of the short sale to the extent necessary to meet margin requirements until the short position is closed out. A deposit must also be maintained with the Fund’s custodian/counterparty broker consisting of cash and/or securities having a value equal to a specified percentage of the value of the securities sold short. The Fund is obligated to pay fees for borrowing the securities sold short and is required to pay the counterparty any dividends and/or interest due on
| franklintempleton.com | Semiannual Report | 31 | ||
F R A N K L I N M U T U A L S H A R E S F U N D
N O T E S T O F I N A N C I A L S T A T E M E N T S ( U N A U D I T E D )
1. Organization and Significant Accounting Policies (continued)
e. Securities Sold Short (continued)
securities sold short. Such dividends and/or interest and any security borrowing fees are recorded as an expense to the Fund. At June 30, 2017, the Fund had no securities sold short.
f. Securities Lending
The Fund participates in an agency based securities lending program to earn additional income. The Fund receives cash collateral against the loaned securities in an amount equal to at least 102% of the fair value of the loaned securities. Collateral is maintained over the life of the loan in an amount not less than 100% of the fair value of loaned securities, as determined at the close of Fund business each day; any additional collateral required due to changes in security values is delivered to the Fund on the next business day. The collateral is deposited into a joint cash account with other funds and is used to invest in a money market fund managed by Franklin Advisers, Inc., an affiliate of the Fund, and/or a joint repurchase agreement. The Fund may receive income from the investment of cash collateral, in addition to lending fees and rebates paid by the borrower. Income from securities loaned, net of fees paid to the securities lending agent and/or third-party vendor, is reported separately in the Statement of Operations, if any. The Fund bears the market risk with respect to the collateral investment, securities loaned, and the risk that the agent may default on its obligations to the Fund. If the borrower defaults on its obligation to return the securities loaned, the Fund has the right to repurchase the securities in the open market using the collateral received. The securities lending agent has agreed to indemnify the Fund in the event of default by a third party borrower. At June 30, 2017, the Fund had no securities on loan.
g. Senior Floating Rate Interests
The Fund invests in senior secured corporate loans that pay interest at rates which are periodically reset by reference to a base lending rate plus a spread. These base lending rates are generally the prime rate offered by a designated U.S. bank or the London InterBank Offered Rate (LIBOR). Senior secured corporate loans often require prepayment of principal from excess cash flows or at the discretion of the borrower. As a result, actual maturity may be substantially less than the stated
maturity. Senior secured corporate loans in which the Fund invests are generally readily marketable, but may be subject to certain restrictions on resale.
h.�� Income and Deferred Taxes
It is the Fund’s policy to qualify as a regulated investment company under the Internal Revenue Code. The Fund intends to distribute to shareholders substantially all of its taxable income and net realized gains to relieve it from federal income and excise taxes. As a result, no provision for U.S. federal income taxes is required.
The Fund may be subject to foreign taxation related to income received, capital gains on the sale of securities and certain foreign currency transactions in the foreign jurisdictions in which it invests. Foreign taxes, if any, are recorded based on the tax regulations and rates that exist in the foreign markets in which the Fund invests. When a capital gain tax is determined to apply, the Fund records an estimated deferred tax liability in an amount that would be payable if the securities were disposed of on the valuation date. As a result of several court cases, in certain countries across the European Union, the Fund filed additional tax reclaims for previously withheld taxes on dividends earned in those countries (EU reclaims). These additional filings are subject to various administrative proceedings by the local jurisdictions’ tax authorities within the European Union, as well as a number of related judicial proceedings. Income recognized, if any, for EU reclaims is reflected as other income in the Statement of Operations and any related receivable, if any, is reflected as European Union tax reclaims in the Statement of Assets and Liabilities. When uncertainty exists as to the ultimate resolution of these proceedings, the likelihood of receipt of these EU reclaims, and the potential timing of payment, no amounts are reflected in the financial statements. For U.S. income tax purposes, EU reclaims received by the Fund, if any, reduce the amounts of foreign taxes Fund shareholders can use as tax credits in their individual income tax returns.
The Fund may recognize an income tax liability related to its uncertain tax positions under U.S. GAAP when the uncertain tax position has a less than 50% probability that it will be sustained upon examination by the tax authorities based on its technical merits. As of June 30, 2017, the Fund has determined that no tax liability is required in its financial statements related to uncertain tax positions for any open tax years (or expected to
32 |
Semiannual Report |
franklintempleton.com |
F R A N K L I N M U T U A L S H A R E S F U N D
N O T E S T O F I N A N C I A L S T A T E M E N T S ( U N A U D I T E D )
be taken in future tax years). Open tax years are those that remain subject to examination and are based on each tax jurisdiction’s statute of limitation.
i. Security Transactions, Investment Income, Expenses and Distributions
Security transactions are accounted for on trade date. Realized gains and losses on security transactions are determined on a specific identification basis. Interest income and estimated expenses are accrued daily. Amortization of premium and accretion of discount on debt securities are included in interest income. Dividend income is recorded on the ex-dividend date except for certain dividends from securities where the dividend rate is not available. In such cases, the dividend is recorded as soon as the information is received by the Fund. Distributions to shareholders are recorded on the ex-dividend date. Distributable earnings are determined according to income tax regulations (tax basis) and may differ from earnings recorded in accordance with U.S. GAAP. These differences may be permanent or temporary. Permanent differences are reclassified among capital accounts to reflect their tax character. These reclassifications have no impact on net assets or the results of operations. Temporary differences are not reclassified, as they may reverse in subsequent periods.
Common expenses incurred by the Trust are allocated among the Funds based on the ratio of net assets of each Fund to the combined net assets of the Trust. Fund specific expenses are charged directly to the Fund that incurred the expense.
Realized and unrealized gains and losses and net investment income, not including class specific expenses, are allocated daily to each class of shares based upon the relative proportion of net assets of each class. Differences in per share distributions, by class, are generally due to differences in class specific expenses.
j. Accounting Estimates
The preparation of financial statements in accordance with U.S. GAAP requires management to make estimates and assumptions that affect the reported amounts of assets and liabilities at the date of the financial statements and the amounts of income and expenses during the reporting period. Actual results could differ from those estimates.
k. Guarantees and Indemnifications
Under the Trust’s organizational documents, its officers and trustees are indemnified by the Trust against certain liabilities arising out of the performance of their duties to the Trust. Additionally, in the normal course of business, the Trust, on behalf of the Fund, enters into contracts with service providers that contain general indemnification clauses. The Trust’s maximum exposure under these arrangements is unknown as this would involve future claims that may be made against the Trust that have not yet occurred. Currently, the Trust expects the risk of loss to be remote.
2. Shares of Beneficial Interest
At June 30, 2017, there were an unlimited number of shares authorized (without par value). Transactions in the Fund’s shares were as follows:
| Six Months Ended | Year Ended | |||||||||||||||
| June 30, 2017 | December 31, 2016 | |||||||||||||||
| Shares | Amount | Shares | Amount | |||||||||||||
| Class Z Shares: | ||||||||||||||||
Shares sold | 14,621,333 | $ | 428,300,991 | 32,376,662 | $ | 873,776,950 | ||||||||||
Shares issued in reinvestment of distributions | — | — | 15,952,237 | 451,923,049 | ||||||||||||
Shares redeemed | (15,479,726 | ) | (453,128,455 | ) | (36,561,397 | ) | (989,580,847 | ) | ||||||||
|
|
| ||||||||||||||
Net increase (decrease) | (858,393 | ) | $ | (24,827,464 | ) | 11,767,502 | $ | 336,119,152 | ||||||||
|
|
| ||||||||||||||
| Class A Shares: | ||||||||||||||||
Shares sold | 9,571,213 | $ | 277,950,402 | 11,507,397 | $ | 308,371,612 | ||||||||||
Shares issued in reinvestment of distributions | — | — | 9,838,985 | 276,122,225 | ||||||||||||
Shares redeemed | (21,897,578 | ) | (634,975,282 | ) | (38,936,274 | ) | (1,047,221,884 | ) | ||||||||
|
|
| ||||||||||||||
Net increase (decrease) | (12,326,365 | ) | $ | (357,024,880 | ) | (17,589,892 | ) | $ | (462,728,047 | ) | ||||||
|
|
| ||||||||||||||
franklintempleton.com |
Semiannual Report |
33 |
F R A N K L I N M U T U A L S H A R E S F U N D
N O T E S T O F I N A N C I A L S T A T E M E N T S ( U N A U D I T E D )
2. Shares of Beneficial Interest (continued)
| Six Months Ended | Year Ended | |||||||||||||||
| June 30, 2017 | December 31, 2016 | |||||||||||||||
|
|
| ||||||||||||||
| Shares | Amount | Shares | Amount | |||||||||||||
Class C Shares: | ||||||||||||||||
Shares sold | 1,538,446 | $ | 43,940,120 | 2,625,989 | $ | 69,812,879 | ||||||||||
Shares issued in reinvestment of distributions | — | — | 2,168,641 | 60,145,452 | ||||||||||||
Shares redeemed | (5,346,244 | ) | (153,561,234 | ) | (7,636,941 | ) | (201,554,474 | ) | ||||||||
|
|
| ||||||||||||||
Net increase (decrease) | (3,807,798 | ) | $ | (109,621,114 | ) | (2,842,311 | ) | $ | (71,596,143 | ) | ||||||
|
|
| ||||||||||||||
Class R Shares: | ||||||||||||||||
Shares sold | 352,518 | $ | 10,151,962 | 580,804 | $ | 15,418,202 | ||||||||||
Shares issued in reinvestment of distributions | — | — | 270,055 | 7,536,986 | ||||||||||||
Shares redeemed | (839,766 | ) | (24,203,409 | ) | (1,655,748 | ) | (44,386,664 | ) | ||||||||
|
|
| ||||||||||||||
Net increase (decrease) | (487,248 | ) | $ | (14,051,447 | ) | (804,889 | ) | $ | (21,431,476 | ) | ||||||
|
|
| ||||||||||||||
Class R6 Shares: | ||||||||||||||||
Shares sold | 281,044 | $ | 8,231,404 | 430,006 | $ | 11,589,179 | ||||||||||
Shares issued in reinvestment of distributions | — | — | 4,383,823 | 124,166,816 | ||||||||||||
Shares redeemed | (3,282,832 | ) | (96,454,134 | ) | (11,616,080 | ) | (315,283,854 | ) | ||||||||
|
|
| ||||||||||||||
Net increase (decrease) | (3,001,788 | ) | $ | (88,222,730 | ) | (6,802,251 | ) | $ | (179,527,859 | ) | ||||||
|
|
| ||||||||||||||
3. Transactions with Affiliates
Franklin Resources, Inc. is the holding company for various subsidiaries that together are referred to as Franklin Templeton Investments. Certain officers and trustees of the Fund are also officers and/or directors of the following subsidiaries:
| Subsidiary | Affiliation | |
Franklin Mutual Advisers, LLC (Franklin Mutual) | Investment manager | |
Franklin Templeton Services, LLC (FT Services) | Administrative manager | |
Franklin Templeton Distributors, Inc. (Distributors) | Principal underwriter | |
Franklin Templeton Investor Services, LLC (Investor Services) | Transfer agent |
a. Management Fees
The Fund pays an investment management fee to Franklin Mutual based on the average daily net assets of the Fund as follows:
| Annualized Fee Rate | Net Assets | |
0.675% | Up to and including $5 billion | |
0.645% | Over $5 billion, up to and including $10 billion | |
0.625% | Over $10 billion, up to and including $15 billion | |
0.595% | Over $15 billion, up to and including $20 billion | |
0.585% | Over $20 billion, up to and including $25 billion | |
0.565% | Over $25 billion, up to and including $30 billion | |
0.555% | Over $30 billion, up to and including $35 billion | |
0.545% | In excess of $35 billion |
For the period ended June 30, 2017, the annualized effective investment management fee rate was 0.645% of the Fund’s average daily net assets.
| 34 | Semiannual Report | franklintempleton.com | ||
F R A N K L I N M U T U A L S H A R E S F U N D
N O T E S T O F I N A N C I A L S T A T E M E N T S ( U N A U D I T E D )
b. Administrative Fees
Under an agreement with Franklin Mutual, FT Services provides administrative services to the Fund. The fee is paid by Franklin Mutual based on the Fund’s average daily net assets, and is not an additional expense of the Fund.
c. Distribution Fees
The Board has adopted distribution plans for each share class, with the exception of Class Z and Class R6 shares, pursuant to Rule 12b-1 under the 1940 Act. Under the Fund’s Class A reimbursement distribution plan, the Fund reimburses Distributors for costs incurred in connection with the servicing, sale and distribution of the Fund’s shares up to the maximum annual plan rate. Under the Class A reimbursement distribution plan, costs exceeding the maximum for the current plan year cannot be reimbursed in subsequent periods. In addition, under the Fund’s Class C and R compensation distribution plans, the Fund pays Distributors for costs incurred in connection with the servicing, sale and distribution of the Fund’s shares up to the maximum annual plan rate for each class. The plan year, for purposes of monitoring compliance with the maximum annual plan rates, is February 1 through January 31.
The maximum annual plan rates, based on the average daily net assets, for each class, are as follows:
Class A | 0.35 | % | ||
Class C | 1.00 | % | ||
Class R | 0.50 | % |
The Board has set the current rate at 0.25% per year for Class A shares until further notice and approval by the Board.
d. Sales Charges/Underwriting Agreements
Front-end sales charges and contingent deferred sales charges (CDSC) do not represent expenses of the Fund. These charges are deducted from the proceeds of sales of Fund shares prior to investment or from redemption proceeds prior to remittance, as applicable. Distributors has advised the Fund of the following commission transactions related to the sales and redemptions of the Fund’s shares for the period:
Sales charges retained net of commissions paid to unaffiliated brokers/dealers | $ | 383,685 | ||
CDSC retained | $ | 18,471 |
e. Transfer Agent Fees
Each class of shares, except for Class R6, pays transfer agent fees to Investor Services for its performance of shareholder servicing obligations and reimburses Investor Services for out of pocket expenses incurred, including shareholder servicing fees paid to third parties. These fees are allocated daily based upon their relative proportion of such classes’ aggregate net assets. Class R6 pays Investor Services transfer agent fees specific to that class.
For the period ended June 30, 2017, the Fund paid transfer agent fees of $7,490,435, of which $3,481,708 was retained by Investor Services.
f. Other Affiliated Transactions
At June 30, 2017, one or more of the funds in Franklin Fund Allocator Series owned 11.3% of the Fund’s outstanding shares.
| franklintempleton.com | Semiannual Report | 35 | ||
F R A N K L I N M U T U A L S H A R E S F U N D
N O T E S T O F I N A N C I A L S T A T E M E N T S ( U N A U D I T E D )
4. Expense Offset Arrangement
The Fund has entered into an arrangement with its custodian whereby credits realized as a result of uninvested cash balances are used to reduce a portion of the Fund’s custodian expenses. During the period ended June 30, 2017, the custodian fees were reduced as noted in the Statement of Operations.
5. Independent Trustees’ Retirement Plan
On January 1, 1993, the Trust adopted an Independent Trustees’ Retirement Plan (Plan). The Plan is an unfunded defined benefit plan that provides benefit payments to Trustees whose length of service and retirement age meets the eligibility requirements of the Plan. Benefits under the Plan are based on years of service and fees paid to each trustee at the time of retirement. Effective in December 1996, the Plan was closed to new participants.
During the period ended June 30, 2017, the Fund’s projected benefit obligation and benefit payments under the Plan were as follows:
aProjected benefit obligation at June 30, 2017 | $ | 739,731 | ||
bIncrease in projected benefit obligation | $ | 4,746 | ||
Benefit payments made to retired trustees | $ | (7,743 | ) |
aThe projected benefit obligation is included in trustees’ fees and expenses in the Statement of Assets and Liabilities.
bThe increase in projected benefit obligation is included in trustees’ fees and expenses in the Statement of Operations.
6. Income Taxes
At June 30, 2017, the cost of investments and net unrealized appreciation (depreciation) for income tax purposes were as follows:
Cost of investments | $ | 12,004,716,536 | ||
|
|
| ||
Unrealized appreciation | $ | 4,595,675,690 | ||
Unrealized depreciation | (888,495,204 | ) | ||
|
|
| ||
Net unrealized appreciation (depreciation) | $ | 3,707,180,486 | ||
|
|
| ||
Differences between income and/or capital gains as determined on a book basis and a tax basis are primarily due to differing treatment of foreign currency transactions.
7. Investment Transactions
Purchases and sales of investments (excluding short term securities and securities sold short) for the period ended June 30, 2017, aggregated $1,278,547,821 and $1,578,318,564, respectively.
8. Credit Risk and Defaulted Securities
The Fund may purchase the pre-default or defaulted debt of distressed companies. Distressed companies are financially troubled and could be or are already involved in financial restructuring or bankruptcy. Risks associated with purchasing these securities include the possibility that the bankruptcy or other restructuring process takes longer than expected, or that distributions in restructuring are less than anticipated, either or both of which may result in unfavorable consequences to the Fund. If it becomes probable that the income on debt securities, including those of distressed companies, will not be collected, the Fund discontinues accruing income and recognizes an adjustment for uncollectible interest.
| 36 | Semiannual Report | franklintempleton.com | ||
F R A N K L I N M U T U A L S H A R E S F U N D
N O T E S T O F I N A N C I A L S T A T E M E N T S ( U N A U D I T E D )
At June 30, 2017, the aggregate long value of distressed company securities for which interest recognition has been discontinued was $249,505,170, representing 1.6% of the Fund’s net assets. For information as to specific securities, see the accompanying Statement of Investments.
9. Restricted Securities
The Fund invests in securities that are restricted under the Securities Act of 1933 (1933 Act) or which are subject to legal, contractual, or other agreed upon restrictions on resale. Restricted securities are often purchased in private placement transactions, and cannot be sold without prior registration unless the sale is pursuant to an exemption under the 1933 Act. Disposal of these securities may require greater effort and expense, and prompt sale at an acceptable price may be difficult. The Fund may have registration rights for restricted securities. The issuer generally incurs all registration costs.
At June 30, 2017, investments in restricted securities, excluding certain securities exempt from registration under the 1933 Act deemed to be liquid, were as follows:
| Principal Amount/ Shares | Issuer | Acquisition Date | Cost | Value | ||||||||||
| 19,594 | Broadband Ventures III LLC, secured promissory note, 5.00%, 2/01/12 | 7/01/10 - 11/30/12 | $ | 19,594 | $ | — | ||||||||
| 43,105,703 | CB FIM Coinvestors LLC | 1/15/09 - 6/02/09 | — | — | ||||||||||
| 53,924,666 | FIM Coinvestor Holdings I, LLC | 11/20/06 - 6/02/09 | — | — | ||||||||||
| 171,232 | Gulfmark Offshore Inc. | 1/06/17 | 308,200 | 35,787 | ||||||||||
| 7,234,813 | International Automotive Components Group Brazil LLC | 4/13/06 - 12/26/08 | 4,804,678 | 176,956 | ||||||||||
| 63,079,866 | International Automotive Components Group North America LLC | 1/12/06 - 3/18/13 | 51,662,536 | 38,826,667 | ||||||||||
| 1,156,279 | Warrior Met Coal Inc. | 3/31/16 - 6/23/16 | 6,632,958 | 18,915,584 | ||||||||||
|
|
| ||||||||||||
| Total Restricted Securities (Value is 0.4% of Net Assets) | $ | 63,427,966 | $ | 57,954,994 | ||||||||||
|
|
| ||||||||||||
10. Other Derivative Information
At June 30, 2017, the Fund’s investments in derivative contracts are reflected in the Statement of Assets and Liabilities as follows:
| Asset Derivatives | Liability Derivatives | |||||||||||
| ||||||||||||
Derivative Contracts Not Accounted for as Hedging Instruments | Statement of Assets and Liabilities Location | Fair Value | Statement of Assets and Liabilities Location | Fair Value | ||||||||
| ||||||||||||
Foreign exchange contracts | Variation margin | $ | 10,362,119 | a | ||||||||
Unrealized appreciation on OTC forward exchange contracts | $ | 3,612,274 | Unrealized depreciation on OTC forward exchange contracts | 34,744,834 | ||||||||
|
|
|
| |||||||||
Totals | $ | 3,612,274 | $ | 45,106,953 | ||||||||
|
|
|
| |||||||||
aThis amount reflects the cumulative appreciation (depreciation) of futures contracts as reported in the Statement of Investments. Only the variation margin receivable/ payable at period end is separately reported within the Statement of Assets and Liabilities. Prior variation margin movements were recorded to cash upon receipt or payment.
| franklintempleton.com | Semiannual Report | 37 | ||||
F R A N K L I N M U T U A L S H A R E S F U N D
N O T E S T O F I N A N C I A L S T A T E M E N T S ( U N A U D I T E D )
10. Other Derivative Information (continued)
For the period ended June 30, 2017, the effect of derivative contracts in the Fund’s Statement of Operations was as follows:
| Net Change in | ||||||||||||
| Unrealized | ||||||||||||
| Derivative Contracts | Net Realized | Appreciation | ||||||||||
| Not Accounted for as | Statement of | Gain (Loss) for | Statement of | (Depreciation) | ||||||||
| Hedging Instruments | Operations Location | the Period | Operations Location | for the Period | ||||||||
| ||||||||||||
| Net realized gain (loss) from: | Net change in unrealized appreciation (depreciation) on: | $ | (71,982,916)a | |||||||||
Foreign exchange contracts | Foreign currency transactions | $ | 8,298,162 | a | Translation of other assets and liabilities denominated in foreign currencies | |||||||
| Futures contracts | (12,385,927 | ) | Futures contracts | (18,080,490) | ||||||||
|
|
|
|
| ||||||||
Totals | $ | (4,087,765 | ) | $ | (90,063,406) | |||||||
|
|
|
|
| ||||||||
aForward exchange contracts are included in net realized gain (loss) from foreign currency transactions and net change in unrealized appreciation (depreciation) on translation of other assets and liabilities denominated in foreign currencies in the Statement of Operations.
For the period ended June 30, 2017, the average month end notional amount of futures contracts represented $519,779,788. The average month end contract value of forward exchange contracts was $1,136,695,318.
See Note 1(d) regarding derivative financial instruments.
11. Holdings of 5% Voting Securities of Portfolio Companies
The 1940 Act defines “affiliated companies” to include investments in portfolio companies in which a fund owns 5% or more of the outstanding voting securities. During the period ended June 30, 2017, investments in “affiliated companies” were as follows:
| Number of | Number of | |||||||||||||||||||||||||||
| Shares Held | Shares Held | Value | Realized | |||||||||||||||||||||||||
| at Beginning | Gross | Gross | at End | at End | Investment | Gain | ||||||||||||||||||||||
| Name of Issuer | of Period | Additions | Reductions | of Period | of Period | Income | (Loss) | |||||||||||||||||||||
| ||||||||||||||||||||||||||||
Controlled Affiliatesa | ||||||||||||||||||||||||||||
CB FIM Coinvestors LLC | 43,105,703 | — | — | 43,105,703 | $ | — | $ | — | $ | — | ||||||||||||||||||
|
| |||||||||||||||||||||||||||
Non-Controlled Affiliates | ||||||||||||||||||||||||||||
Alexander’s Inc. | 326,675 | — | — | 326,675 | $ | 137,680,445 | $ | 2,776,738 | $ | 122,830 | b | |||||||||||||||||
Federal Signal Corp. | 3,288,138 | — | (367,741 | ) | 2,920,397 | — | c | 445,484 | (808,303 | ) | ||||||||||||||||||
International Automotive | ||||||||||||||||||||||||||||
Components Group Brazil LLC | 7,234,813 | — | — | 7,234,813 | 176,956 | — | — | |||||||||||||||||||||
International Automotive | ||||||||||||||||||||||||||||
Components Group North | ||||||||||||||||||||||||||||
America LLC | 63,079,866 | — | — | 63,079,866 | 38,826,667 | — | — | |||||||||||||||||||||
White Mountains Insurance Group Ltd. | 297,806 | — | (5,845 | ) | 291,961 | 253,606,084 | 291,961 | 5,118,162 | ||||||||||||||||||||
|
| |||||||||||||||||||||||||||
Total Non-Controlled Affiliates |
| $ | 430,290,152 | $ | 3,514,183 | $ | 4,432,689 | |||||||||||||||||||||
|
| |||||||||||||||||||||||||||
Total Affiliated Securities (Value is 2.7% of Net Assets) |
| $ | 430,290,152 | $ | 3,514,183 | $ | 4,432,689 | |||||||||||||||||||||
|
| |||||||||||||||||||||||||||
aIssuer in which the Fund owns 25% or more of the outstanding voting securities.
bRealized gain distributions from REITs.
cAs of June 30, 2017, no longer an affiliate.
| 38 | Semiannual Report | franklintempleton.com | ||
F R A N K L I N M U T U A L S H A R E S F U N D
N O T E S T O F I N A N C I A L S T A T E M E N T S ( U N A U D I T E D )
12. Credit Facility
The Fund, together with other U.S. registered and foreign investment funds (collectively, Borrowers), managed by Franklin Templeton Investments, are borrowers in a joint syndicated senior unsecured credit facility totaling $2 billion (Global Credit Facility) which matures on February 9, 2018. This Global Credit Facility provides a source of funds to the Borrowers for temporary and emergency purposes, including the ability to meet future unanticipated or unusually large redemption requests.
Under the terms of the Global Credit Facility, the Fund shall, in addition to interest charged on any borrowings made by the Fund and other costs incurred by the Fund, pay its share of fees and expenses incurred in connection with the implementation and maintenance of the Global Credit Facility, based upon its relative share of the aggregate net assets of all of the Borrowers, including an annual commitment fee of 0.15% based upon the unused portion of the Global Credit Facility. These fees are reflected in other expenses in the Statement of Operations. During the period ended June 30, 2017, the Fund did not use the Global Credit Facility.
13. Fair Value Measurements
The Fund follows a fair value hierarchy that distinguishes between market data obtained from independent sources (observable inputs) and the Fund’s own market assumptions (unobservable inputs). These inputs are used in determining the value of the Fund’s financial instruments and are summarized in the following fair value hierarchy:
| • | Level 1 – quoted prices in active markets for identical financial instruments |
| • | Level 2 – other significant observable inputs (including quoted prices for similar financial instruments, interest rates, prepayment speed, credit risk, etc.) |
| • | Level 3 – significant unobservable inputs (including the Fund’s own assumptions in determining the fair value of financial instruments) |
The input levels are not necessarily an indication of the risk or liquidity associated with financial instruments at that level.
For movements between the levels within the fair value hierarchy, the Fund has adopted a policy of recognizing the transfers as of the date of the underlying event which caused the movement.
| franklintempleton.com | Semiannual Report | 39 | ||||
F R A N K L I N M U T U A L S H A R E S F U N D
N O T E S T O F I N A N C I A L S T A T E M E N T S ( U N A U D I T E D )
13. Fair Value Measurements (continued)
A summary of inputs used as of June 30, 2017, in valuing the Fund’s assets and liabilities carried at fair value, is as follows:
| Level 1 | Level 2 | Level 3 | Total | |||||||||||||
| Assets: | ||||||||||||||||
Investments in Securities: | ||||||||||||||||
Equity Investments:a | ||||||||||||||||
Auto Components | $ | 83,284,299 | $ | — | $ | 39,003,623 | $ | 122,287,922 | ||||||||
Energy Equipment & Services | 199,683,867 | — | 35,787 | 199,719,654 | ||||||||||||
Machinery | 277,782,128 | 59,986,341 | — | 337,768,469 | ||||||||||||
Metals & Mining | 112,907,822 | — | 18,915,584 | 131,823,406 | ||||||||||||
All Other Equity Investmentsb | 13,041,874,218 | — | —c | 13,041,874,218 | ||||||||||||
Corporate Bonds, Notes and Senior Floating Rate Interests | — | 467,510,006 | — | 467,510,006 | ||||||||||||
Corporate Notes and Senior Floating Rate Interests in Reorganization | — | 210,369,400 | —c | 210,369,400 | ||||||||||||
Companies in Liquidation | — | 14,697,835 | 3,397,055c | 18,094,890 | ||||||||||||
Municipal Bonds in Reorganization | — | 39,135,770 | — | 39,135,770 | ||||||||||||
Short Term Investments | 883,817,109 | 259,496,178 | — | 1,143,313,287 | ||||||||||||
|
| |||||||||||||||
Total Investments in Securities | $ | 14,599,349,443 | $ | 1,051,195,530 | $ | 61,352,049 | $ | 15,711,897,022 | ||||||||
|
| |||||||||||||||
Other Financial Instruments: | ||||||||||||||||
Forward Exchange Contracts | $ | — | $ | 3,612,274 | $ | — | $ | 3,612,274 | ||||||||
|
| |||||||||||||||
| Liabilities: | ||||||||||||||||
Other Financial Instruments: | ||||||||||||||||
Futures Contracts | $ | 10,362,119 | $ | — | $ | — | $ | 10,362,119 | ||||||||
Forward Exchange Contracts | — |
| 34,744,834 |
| — | 34,744,834 | ||||||||||
|
| |||||||||||||||
Total Other Financial Instruments | $ | 10,362,119 | $ | 34,744,834 | $ | — | $ | 45,106,953 | ||||||||
|
| |||||||||||||||
aIncludes common stocks as well as other equity investments.
bFor detailed categories, see the accompanying Statement of Investments.
cIncludes securities determined to have no value at June 30, 2017.
A reconciliation of assets in which Level 3 inputs are used in determining fair value is presented when there are significant Level 3 financial instruments at the end of the period.
14. New Accounting Pronouncements
In March 2017, the Financial Accounting Standards Board issued Accounting Standards Update (ASU) No. 2017-08, Receivables—Nonrefundable Fees and Other Costs (Subtopic 310-20): Premium Amortization on Purchased Callable Debt Securities. The amendments in the ASU shorten the amortization period for certain callable debt securities, held at a premium, to be amortized to the earliest call date. The ASU does not require an accounting change for securities held at a discount; which continues to be amortized to maturity. The ASU is effective for fiscal years and interim periods within those fiscal years beginning after December 15, 2018. Management is currently evaluating the impact, if any, of applying this provision.
15. Investment Company Reporting Modernization
In October 2016, the U.S. Securities and Exchange Commission adopted new rules and amended existing rules (together, final rules) intended to modernize the reporting and disclosure of information by registered investment companies. In part, the final rules amend Regulation S-X and require standardized, enhanced disclosures about derivatives in investment company financial statements, as
| 40 | Semiannual Report | franklintempleton.com | ||
F R A N K L I N M U T U A L S H A R E S F U N D
N O T E S T O F I N A N C I A L S T A T E M E N T S ( U N A U D I T E D )
well as other amendments. The compliance date for the amendments to Regulation S-X is August 1, 2017. Management has reviewed the requirements and believes the adoption of the amendments to Regulation S-X will not have a material impact on the Fund’s financial statements and related disclosures.
16. Subsequent Events
The Fund has evaluated subsequent events through the issuance of the financial statements and determined that no events have occurred that require disclosure.
Abbreviations
| Counterparty | Currency | Selected Portfolio | ||||||||
| BOFA | Bank of America N.A. | EUR | Euro | ADR | American Depositary Receipt | |||||
| BONY | The Bank of New York Mellon Corp. | GBP | British Pound | DIP | Debtor-In-Possession | |||||
| FBCO | Credit Suisse International | USD | United States Dollar | FHLB | Federal Home Loan Bank | |||||
| HSBK | HSBC Bank PLC | GO | General Obligation | |||||||
| SSBT | State Street Bank and Trust Co., N.A. | TRA | Tax Receivable Agreement Right | |||||||
| UBSW | UBS AG | |||||||||
| franklintempleton.com | Semiannual Report | 41 | ||||
F R A N K L I N M U T U A L S E R I E S F U N D S
F R A N K L I N M U T U A L S H A R E S F U N D
Shareholder Information
Board Approval of Investment Management Agreements
FRANKLIN MUTUAL SERIES FUNDS
Franklin Mutual Shares Fund
(“Fund”)
The Board of Trustees (Board), including a majority of trustees that are not “interested persons” as such term is defined in section 2(a)(19) of the Investment Company Act of 1940 (hereinafter referred to as “independent trustees”), at an in-person meeting held on May 22, 2017, unanimously approved the renewal of the Fund’s investment management agreement. Prior to a meeting of all of the trustees for the purpose of considering such renewal, the independent trustees participated in two other meetings held in connection with the renewal process. Throughout the process, the independent trustees received assistance and advice from and met separately with independent counsel. The independent trustees met with and interviewed officers of the investment manager (including portfolio managers), the transfer agent and shareholder services group and the distributor. In approving the renewal of the investment management agreement for the Fund, the Board, including the independent trustees, determined that the investment management fee structure was fair and reasonable and that continuance of the agreement was in the best interests of the Fund and its shareholders.
In reaching their decision on the investment management agreement, the trustees took into account information furnished throughout the year at regular Board meetings, as well as information specifically requested and furnished for the renewal process, which culminated in the meetings referred to above for the specific purpose of considering such agreement. Information furnished throughout the year included, among others, reports on the Fund’s investment performance, expenses, portfolio composition, portfolio brokerage execution, client commission arrangements, derivatives, securities lending, asset segregation, portfolio turnover, Rule 12b-1 plan, distribution, shareholder servicing, legal and compliance matters, pricing of securities, sales and redemptions, and marketing support payments made to financial intermediaries, as well as a third-party survey of transfer agent fees charged to funds within the Franklin Templeton Investments (FTI) complex in comparison with those charged to other fund complexes deemed comparable. Also, related financial statements and other information about the scope and quality of services provided by the investment manager and its affiliates and enhancements to such services over the past year were
provided. In addition, the trustees received periodic reports throughout the year and during the renewal process relating to compliance with the Fund’s investment policies and restrictions. During the renewal process, the independent trustees considered the investment manager’s methods of operation within the Franklin Templeton group and its activities on behalf of other clients. The Board also noted that it received an annual report on all payments made by FTI or the Fund to financial intermediaries engaged in the sale of Fund shares, as well as a memorandum relating to third-party servicing arrangements in response to a Guidance Update from the U.S. Securities and Exchange Commission (SEC) relating to mutual fund distribution and sub-accounting fees.
The information obtained by the trustees during the renewal process also included a special report prepared by Broadridge Financial Solutions, Inc., an independent third-party analyst that utilizes data from Lipper, Inc. (“Lipper”), comparing the Fund’s investment performance and expenses with those of other mutual funds deemed comparable to the Fund as selected by Lipper (Broadridge Section 15(c) Report). The trustees reviewed the Broadridge Section 15(c) Report and its usefulness in the renewal process with respect to matters such as comparative fees, expenses, expense ratios, performance and volatility. They concluded that the report continues to be a reliable resource in the performance of their duties.
In addition, the trustees received a Profitability Study (Profitability Study) prepared by management discussing the profitability to FTI from its overall U.S. fund operations, as well as on an individual fund-by-fund basis. Over the past year, the Board and counsel to the independent trustees continued to receive reports on management’s handling of recent regulatory inquiries and pending legal actions against the investment manager and its affiliates. The independent trustees were satisfied with the actions taken to date by management in response to such regulatory and legal matters.
Particular attention was given to management’s diligent risk management program, including continual monitoring and management of cybersecurity, liquidity and counterparty credit risk, and attention given to derivatives and other complex instruments that are held and expected to be held by the Fund and how such instruments are used to carry out the Fund’s investment goal(s). The Board also took into account, among other things, management’s efforts in establishing a global credit facility for the benefit of the Fund and other accounts managed by FTI to provide a source of cash for temporary and emergency purposes or to meet unusual redemption requests as
| 42 | Semiannual Report | franklintempleton.com | ||
F R A N K L I N M U T U A L S E R I E S F U N D S
F R A N K L I N M U T U A L S H A R E S F U N D
S H A R E H O L D E R I N F O R M A T I O N
well as the strong financial position of the investment manager’s parent company and its commitment to the mutual fund business. In addition, the Board received updates from management on the SEC’s progress in implementing the rule-making requirements established by the Dodd-Frank Wall Street Reform and Consumer Protection Act (Dodd-Frank Act), which was enacted July 21, 2010, and the investment manager’s compliance with rules and regulations already promulgated by the SEC under such act.
In addition to the above and other matters considered by the trustees throughout the course of the year, the following discussion relates to certain primary factors relevant to the Board’s decision. This discussion of the information and factors considered by the Board (including the information and factors discussed above) is not intended to be exhaustive, but rather summarizes certain factors considered by the Board. In view of the wide variety of factors considered, the Board did not, unless otherwise noted, find it practicable to quantify or otherwise assign relative weights to the foregoing factors. In addition, individual trustees may have assigned different weights to various factors.
NATURE, EXTENT AND QUALITY OF SERVICES. The trustees reviewed the nature, extent and quality of the services provided, and to be provided, by the investment manager. The trustees cited the investment manager’s ability to implement the Fund’s disciplined value investment approach and its long-term relationship with the Fund as reasons that shareholders choose to invest, and remain invested, in the Fund. The trustees reviewed the Fund’s portfolio management team, including its performance, staffing, skills and compensation program. With respect to portfolio manager compensation, management assured the trustees that the Fund’s long-term performance is a significant component of incentive-based compensation and noted that a portion of a portfolio manager’s incentive-based compensation is paid in shares of pre-designated funds from the portfolio manager’s fund management area. The trustees noted that the portfolio manager compensation program aligned the interests of the portfolio managers with that of shareholders of the Fund. The trustees discussed with management various other products, portfolios and entities that are advised by the investment manager and the allocation of assets and expenses among and within them, as well as their relative fees and reasons for differences with respect thereto and any potential conflicts. During regular Board meetings and the aforementioned meetings of the independent trustees, the trustees received reports and presentations on the investment manager’s best execution trading policies. The trustees considered
periodic reports provided to them showing that the investment manager complied with the investment policies and restrictions of the Fund as well as other reports periodically furnished to the Board covering matters such as the compliance of portfolio managers and other management personnel with the code of ethics covering the investment management personnel, the adherence to fair value pricing procedures established by the Board and the accuracy of net asset value calculations. The Board noted the extent of the benefits provided to Fund shareholders from being part of the Franklin Templeton group of funds, including the right to exchange investments between funds (same class) without a sales charge, the ability to reinvest Fund dividends into other funds and the right to combine holdings of other funds to obtain reduced sales charges. The Board considered the investment manager’s significant efforts in developing and implementing compliance procedures established in accordance with SEC and other requirements.
The Board considered the nature, extent and quality of the services to be provided under the Fund’s other service agreements to determine that, on an overall basis, Fund shareholders were well served. In this connection, the Board also took into account transfer agent and shareholder services provided to Fund shareholders by an affiliate of the investment manager, noting continuing expenditures by management to increase and improve the scope of such services and favorable periodic reports on shareholder services conducted by independent third parties. While such considerations directly affected the trustees’ decision in renewing the Fund’s transfer agent and shareholder services agreement, the Board also considered these commitments as incidental benefits to Fund shareholders deriving from the investment management relationship.
Based on their review, the trustees were satisfied with the nature and quality of the overall services provided, and to be provided, by the investment manager and its affiliates to the Fund and its shareholders and were confident in the abilities of the management team to continue the disciplined value investment approach of the Fund and to provide quality services to the Fund and its shareholders.
INVESTMENT PERFORMANCE. The trustees reviewed and placed significant emphasis on the investment performance of the Fund over the one-, three-, five- and 10-year periods ended December 31, 2016. They considered the history of successful performance of the Fund relative to various benchmarks. As part of their review, they inquired of management regarding benchmarks, style drift and restrictions
| franklintempleton.com | Semiannual Report | 43 | ||
F R A N K L I N M U T U A L S E R I E S F U N D S
F R A N K L I N M U T U A L S H A R E S F U N D
S H A R E H O L D E R I N F O R M A T I O N
on permitted investments. Consideration was also given to performance in the context of available levels of cash during the periods.
The trustees had meetings during the year, including the meetings referred to above held in connection with the renewal process, with the Fund’s portfolio managers to discuss performance and the management of the Fund. In addition, particular attention in assessing performance was given to the Broadridge Section 15(c) Report. That report showed the investment performance of the Fund (Class A shares) in comparison to other funds determined comparable by Lipper.
The comparable funds to the Fund, as chosen by Lipper, included all retail and institutional multi-cap value funds. The Fund had total returns in the middle performing quintile for the one-year period ended December 31, 2016, and had annualized total returns for the three- and five-year periods in the second-lowest and lowest performing quintiles, respectively. The trustees noted that the Fund’s total return on an annualized basis for the 10-year period ended December 31, 2016 was in the second-lowest performing quintile. The trustees also compared Fund performance to other industry benchmarks, including measures of risk-adjusted performance of a fund, as part of their evaluation of investment performance. The trustees discussed with management the reasons for the relative underperformance for the three-, five-, and ten-year periods ended December 31, 2016. Taking into account such discussions and intending to continue to monitor future performance, the Board did not believe such comparative performance warranted any change in portfolio management, and concluded that the Fund had performed in an acceptable manner in the context of the Fund’s goals.
COMPARATIVE EXPENSES AND MANAGEMENT PROFITABILITY. The trustees considered the cost of the services provided and to be provided and the profits realized by the investment manager and its affiliates from their respective relationships with the Fund. As part of the renewal process, the trustees explored with management the trends in expense ratios over the past three fiscal years and the reasons for any increases in the Fund’s expense ratios (or components thereof). In considering the appropriateness of the management fee and other expenses charged to the Fund, the Board took into account various factors including investment performance and matters relating to Fund operations, including, but not limited to, the quality and experience of its portfolio managers and research staff. Consideration was also given to a comparative analysis in the Broadridge Section 15(c) Report of the
investment management fee and total expense ratio of the Fund in comparison with those of a group of other funds selected by Lipper as its appropriate Lipper expense group. Lipper expense data is based upon information taken from the Fund’s most recent annual report, which reflects historical asset levels that may be quite different from those currently existing, particularly in a period of market volatility. While recognizing such inherent limitation and the fact that expense ratios generally increase as assets decline and decrease as assets grow, the Board believed the independent analysis conducted by Lipper to be an appropriate measure of comparative expenses.
In reviewing comparative costs, emphasis was given to the Fund’s contractual management fee in comparison with the contractual management fee that would have been charged by other funds within its Lipper expense group assuming they were similar in size to the Fund, as well as the actual total expenses of the Fund in comparison with those of its Lipper expense group. The Lipper contractual management fee analysis includes administrative charges as being part of the management fee, and total expenses, for comparative consistency, are shown by Lipper for Fund Class A shares.
The Fund’s contractual management fee rate was in the second-most expensive quintile of its Lipper expense group and its total expenses were in the second-least expensive quintile of such group. The Board was satisfied with such comparative fees and expenses.
The trustees also reviewed the Profitability Study addressing profitability of Franklin Resources, Inc., from its overall U.S. fund business, as well as profitability to the Fund’s investment manager and its affiliates, from providing investment management and other services to the Fund during the 12-month period ended September 30, 2016, the most recent fiscal year-end of Franklin Resources, Inc. The trustees reviewed the basis on which such reports are prepared and the cost allocation methodology utilized in the Profitability Study, it being recognized that allocation methodologies may each be reasonable while producing different results. In this respect, the Board noted that the reasonableness of the cost allocation methodologies was reviewed by independent accountants on an every other year basis.
The independent trustees met with management to discuss the Profitability Study. This included, among other things, a comparison of investment management income with investment management expenses of the Fund; comparison of underwriting revenues and expenses; the relative relationship of investment
| 44 | Semiannual Report | franklintempleton.com | ||
F R A N K L I N M U T U A L S E R I E S F U N D S
F R A N K L I N M U T U A L S H A R E S F U N D
S H A R E H O L D E R I N F O R M A T I O N
management and underwriting expenses; shareholder servicing profitability; economies of scale; and the relative contribution of the Fund to the profitability of the investment manager and its parent. In discussing the Profitability Study with the Board, the investment manager stated its belief that the costs incurred in establishing the infrastructure necessary to operate the type of mutual fund operations conducted by it and its affiliates may not be fully reflected in the expenses allocated to the Fund in determining its profitability.
The Board also took into account management’s expenditures in improving shareholder services provided to the Fund, as well as the need to meet additional regulatory and compliance requirements resulting from the Sarbanes-Oxley Act, the Dodd-Frank Act and recent SEC and other regulatory requirements. The trustees also considered the extent to which the investment manager may derive ancillary benefits from Fund operations, including those derived from economies of scale, discussed below, the allocation of Fund brokerage and the use of commission dollars to pay for research and other similar services.
Based upon their consideration of all these factors, the trustees determined that the level of profits realized by the investment manager and its affiliates in providing services to the Fund was not excessive in view of the nature, quality and extent of services provided.
ECONOMIES OF SCALE. The Board considered economies of scale realized by the investment manager and its affiliates as the Fund grows larger and the extent to which they are shared with Fund shareholders, as for example, in the level of the investment management fee charged, in the quality and efficiency of services rendered and in increased capital commitments benefiting the Fund directly or indirectly. While recognizing that any precise determination is inherently subjective, the trustees noted that, based upon the Profitability Study, as some funds increase in size, at some point economies of scale may result in the investment manager realizing a larger profit margin on investment management services provided to such a fund. The trustees also noted that benefits of economies of scale will be shared with Fund shareholders due to the decline in the effective investment management fee rate as breakpoints are achieved by the Fund.
The trustees noted that breakpoints had been instituted as part of the Fund’s investment management fee and that the Board regularly evaluates whether additional breakpoints are appropriate. The trustees assessed the savings to shareholders resulting from such breakpoints and believed they were, and
continue to be, appropriate and they agreed to continue to monitor the appropriateness of the breakpoints. The trustees also considered the effects an increase in assets under management would have on the investment management fee and expense ratio of the Fund. To the extent further economies of scale may be realized by the investment manager and its affiliates, the Board believed the investment management and administrative fees provide a sharing of benefits with the Fund and its shareholders.
Proxy Voting Policies and Procedures
The Fund’s investment manager has established Proxy Voting Policies and Procedures (Policies) that the Fund uses to determine how to vote proxies relating to portfolio securities. Shareholders may view the Fund’s complete Policies online at franklintempleton.com. Alternatively, shareholders may request copies of the Policies free of charge by calling the Proxy Group collect at (954) 527-7678 or by sending a written request to: Franklin Templeton Companies, LLC, 300 S.E. 2nd Street, Fort Lauderdale, FL 33301, Attention: Proxy Group. Copies of the Fund’s proxy voting records are also made available online at franklintempleton.com and posted on the U.S. Securities and Exchange Commission’s website at sec.gov and reflect the most recent 12-month period ended June 30.
Quarterly Statement of Investments
The Trust, on behalf of the Fund, files a complete statement of investments with the U.S. Securities and Exchange Commission for the first and third quarters for each fiscal year on Form N-Q. Shareholders may view the filed Form N-Q by visiting the Commission’s website at sec.gov. The filed form may also be viewed and copied at the Commission’s Public Reference Room in Washington, DC. Information regarding the operations of the Public Reference Room may be obtained by calling (800) SEC-0330.
| franklintempleton.com | Semiannual Report | 45 | ||
This page intentionally left blank.
This page intentionally left blank.
This page intentionally left blank.
| Semiannual Report and Shareholder Letter | |||
| Franklin Mutual Shares Fund | ||||
| Investment Manager | ||||
Franklin Mutual Advisers, LLC
| ||||
| Distributor | ||||
| Franklin Templeton Distributors, Inc. | ||||
| (800) DIAL BEN® / 342-5236 | ||||
franklintempleton.com
| ||||
| Shareholder Services | ||||
| (800) 632-2301 - (Class A, C, R & R6) | ||||
| (800) 448-FUND - (Class Z) |
Authorized for distribution only when accompanied or preceded by a summary prospectus and/or prospectus. Investors should carefully consider a fund’s investment goals, risks, charges and expenses before investing. A prospectus contains this and other information; please read it carefully before investing.
To help ensure we provide you with quality service, all calls to and from our service areas are monitored and/or recorded.
| © 2017 Franklin Templeton Investments. All rights reserved. | 474 S 08/17 |
| Semiannual Report and Shareholder Letter
June 30, 2017 |

Franklin Mutual Financial Services Fund
A SERIES OF FRANKLIN MUTUAL SERIES FUNDS
Sign up for electronic delivery at franklintempleton.com/edelivery
Franklin Templeton Investments
Gain From Our Perspective®
At Franklin Templeton Investments, we’re dedicated to one goal: delivering exceptional asset management for our clients. By bringing together multiple, world-class investment teams in a single firm, we’re able to offer specialized expertise across styles and asset classes, all supported by the strength and resources of one of the world’s largest asset managers. This has helped us to become a trusted partner to individual and institutional investors across the globe.
Dear Franklin Mutual Financial Services Fund Shareholder:
The first half of 2017 saw most equity markets continue their long move upwards. The Standard & Poor’s 500® Index (S&P 500®) posted a +9.34% total return and the MSCI World Index delivered a +11.02% total return.1
The political uncertainty and unpredictability of recent years has continued in 2017. In the U.S., President Trump has continued his unconventional governance approach, while Congress has remained relentlessly partisan, leading to significant uncertainty about policies and legislation. The financial markets expected “business friendly” moves, but specific legislative progress on issues such as health care, tax reform and infrastructure did not come to fruition. In the U.K., a surprise election was called in April when the Conservative Party held a huge polling lead, but at the June election the Tories lost their majority in Parliament. Recent elections in France went according to expectations, lending some much appreciated stability there.
Despite these generally unsettling events, the global economy continued its slow expansion since the Great Recession. Unemployment also continued to decline in most developed markets. Wage growth showed signs of acceleration and in the U.S. interest rates began to rise, perhaps signaling the first steps toward monetary normalization.
Equity markets appreciated as economic fundamentals improved. Valuation is, of course, a critical factor in our analysis and we always ask ourselves if current and potential investments represent an attractive balance of risk and reward. As some equity markets reached all-time highs, we maintained our focus on individual investments and the prospects for each
business in the context of its valuation and the backdrop of potential political and economic risks.
In many equity markets, growth stocks outperformed value stocks during the period. For example, the S&P 500 Growth Index returned +13.33%, while the S&P 500 Value Index returned +4.85%.1 The difference in performance was driven in part by a significant rally in Internet and software stocks, which dominated the S&P 500 Growth Index. We do not know how long these trends will continue, but historically, periods of strong performance by growth stocks have eventually been followed by relatively weaker performance. In addition, the S&P 500 Value Index has components that we believe are facing disruption from new technology (e.g., the rapid market share shift to online retailing from traditional bricks and mortar dominated retailers that are often labeled as value stocks). Exacerbating the disruption is the reality that many new technology companies are able to innovate without the need to show immediate profits.
Amid dynamic markets and evolving economic conditions, we believe active, professional investment management serves investors well. We also recognize the important role of financial advisors in today’s markets and encourage investors to continue to seek their advice. Amid changing markets and economic conditions, we are confident investors with a well-diversified portfolio and a patient, long-term outlook will be well positioned for the years ahead.
On the following pages, the Fund’s portfolio management team discusses the economic environment during the first six months of 2017 and reviews investment decisions made during this
1. Source: Morningstar.
See www.franklintempletondatasources.com for additional data provider information.
Not FDIC Insured | May Lose Value | No Bank Guarantee
|
franklintempleton.com |
Not part of the semiannual report |
1 |
period. Please remember all securities markets fluctuate, as do mutual fund share prices.
We thank you for investing with Franklin Templeton, welcome your questions and comments, and look forward to continuing to serve your investment needs in the years ahead.
Sincerely,

| Peter A. Langerman |
| Chairman, President and Chief Executive Officer |
| Franklin Mutual Advisers, LLC |
This letter reflects our analysis and opinions as of June 30, 2017, unless otherwise indicated. The information is not a complete analysis of every aspect of any market, country, industry, security or fund. Statements of fact are from sources considered reliable.
Contents
Semiannual Report
| ||||
Franklin Mutual Financial Services Fund
| 4 | |||
| 10 | |||
| 12 | |||
Financial Highlights and Statement of Investments
| 13 | |||
| 22 | |||
| 26 | |||
| 40 |
Visit franklintempleton.com for fund updates, to access your account, or to find helpful financial planning tools.
2 |
Not part of the semiannual report |
franklintempleton.com |
Semiannual Report
Franklin Mutual Financial Services Fund
This semiannual report for Franklin Mutual Financial Services Fund covers the period ended June 30, 2017.
Your Fund’s Goal and Main Investments
The Fund seeks capital appreciation, which may occasionally be short term, with income as a secondary goal, by investing at least 80% of its net assets in securities of financial services companies. It focuses mainly on what the investment manager believes are undervalued mid- and large-cap equity securities and, to a lesser extent, the securities of distressed companies and merger arbitrage securities. The Fund may invest in foreign securities without limit.
Performance Overview
The Fund’s Class Z shares delivered a cumulative total return of +5.68% for the six months ended June 30, 2017. For comparison, the Fund’s new primary benchmark (and old narrow benchmark), the MSCI World Financials Index, which captures large and midcap representation across 23 developed markets countries, generated a +10.61% total return, while its secondary benchmark (and old broad benchmark), the Standard & Poor’s 500 (S&P 500®) Financials Index, which tracks financials stocks in the S&P 500 Index, posted a +6.88% total return.1 As the investment manager believes the composition of the MSCI World Financials Index more accurately reflects the Fund’s holdings, it has become the Fund’s primary benchmark. You can find more of the Fund’s performance data in the Performance Summary beginning on page 9.
Performance data represent past performance, which does not guarantee future results. Investment return and principal value will fluctuate, and you may have a gain or loss when you sell your shares. Current performance may differ from figures shown. For most recent month-end performance, go to franklintempleton.com or call (800) 342-5236.
Economic and Market Overview
The global economy generally expanded during the period under review. In this environment, global developed and emerging market stocks, as measured by the MSCI All Country
Geographic Composition*
Based on Total Net Assets as of 6/30/17
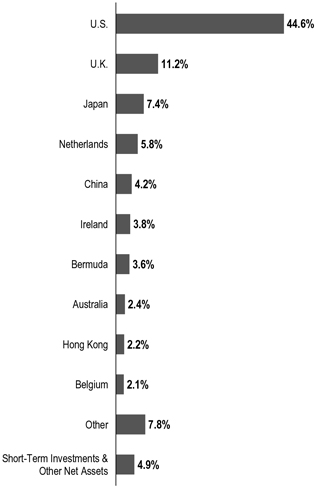
*Figures are stated as a percentage of total and may not equal 100% or may be negative due to rounding, use of any derivatives, unsettled trades or other factors.
World Index, generated a total return of +11.82%. Global markets were aided by improved industrial commodity prices at certain points during the period, generally upbeat economic data across regions, investor optimism about pro-growth and pro-business policies in the U.S., hopes of tax reforms under the Trump administration, Emmanuel Macron’s election as France’s president and encouraging corporate earnings reports.
1. Source: Morningstar.
The indexes are unmanaged and include reinvestment of any income or distributions. They do not reflect any fees, expenses or sales charges. One cannot invest directly in an index, and an index is not representative of the Fund’s portfolio.
The dollar value, number of shares or principal amount, and names of all portfolio holdings are listed in the Fund’s Statement of Investments (SOI). The SOI begins on page 16.
franklintempleton.com |
Semiannual Report |
3 |
F R A N K L I N M U T U A L F I N A N C I A L S E R V I C E S F U N D
However, global markets reflected investor concerns about the timing and economic effects of the U.K.’s exit from the European Union (also known as “Brexit”). Other headwinds included the health of European banks, concerns about political uncertainty in the U.S. and European Union, geopolitical tensions in certain regions, worries about global oversupply in oil production despite a pact to extend cuts, and comments toward period-end from key central bankers around the world about potentially raising interest rates.
U.S. economic growth decelerated in 2017’s first quarter, largely due to slower growth in consumer spending and declines in private inventory investment and government spending. However, growth accelerated in the second quarter due to increases in consumer spending, business investment and federal government spending. The unemployment rate decreased from 4.7% in December 2016 to 4.4% at period-end.2 Annual inflation, as measured by the Consumer Price Index, decreased from 2.1% to 1.6% during the period. After increasing its benchmark interest rate in March, the U.S. Federal Reserve (Fed), at its June meeting, made the widely anticipated increase to its target range for the federal funds rate from 0.75%–1.00% to 1.00%–1.25%, amid signs of a growing U.S. economy, a strengthening labor market and an improvement in business spending.
In Europe, the U.K.’s economy grew at a slower rate in 2017’s first quarter over the previous quarter, largely due to slower growth in household spending. The eurozone’s growth increased in the first quarter over the previous quarter. The bloc’s annual inflation rate fluctuated during the reporting period and ended slightly higher from where it began. During the period, the European Central Bank kept its key policy rates unchanged.
In Asia, Japan’s quarterly gross domestic product (GDP) remained unchanged in 2017’s first quarter compared to 2016’s fourth quarter. In April 2017, the Bank of Japan (BOJ) slightly increased its GDP forecasts for the 2017–2018 fiscal year. However, the BOJ lowered its inflation forecast.
In emerging markets, Brazil’s quarterly GDP grew for the first time in two years, as its first-quarter 2017 GDP grew compared to the previous quarter. The country’s central bank cut its benchmark interest rate four times between January and June 2017 to spur economic growth. Russia’s GDP grew in 2017’s first quarter compared to the prior-year period. The Bank of Russia reduced its key interest rate in March, April and June
Portfolio Composition*
Based on Total Net Assets as of 6/30/17
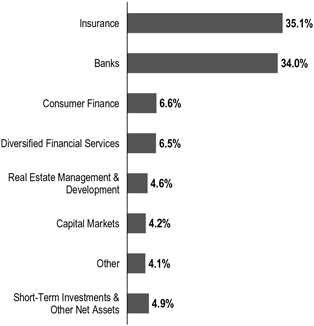
*Figures are stated as a percentage of total and may not equal 100% or may be negative due to rounding, use of any derivatives, unsettled trades or other factors.
2017 to try to revive its economy. China’s economy grew faster in the first half of 2017 compared to the first half of 2016, driven by solid growth in industrial production, services, fixed-asset investment, retail sales, and imports and exports. The People’s Bank of China left its benchmark interest rate unchanged during the period. Overall, emerging market stocks, as measured by the MSCI Emerging Markets Index, rose during the period.
Investment Strategy
We strive to provide investors with superior risk-adjusted returns over time through our distinctive, value investment style, which includes investments in undervalued common stocks, distressed debt and merger arbitrage. Rigorous fundamental analysis drives our investment process. We attempt to determine each investment’s intrinsic value as well as the price at which we would be willing to commit shareholder funds. While valuation remains our key consideration, we utilize numerous fundamental factors such as return on equity, financial leverage and long-term earnings power. We also consider factors such as management quality and competitive position. As always, our approach to investing is as much about assessing risk and containing losses as it is about achieving profits.
2. Source: Bureau of Labor Statistics.
4 |
Semiannual Report |
franklintempleton.com |
F R A N K L I N M U T U A L F I N A N C I A L S E R V I C E S F U N D
What is return on equity?
Return on equity is an amount, expressed as a percentage, earned on a company’s common stock investment for a given period. Return on equity tells common shareholders how effectually their money is being employed. Comparing percentages for current and prior periods also reveals trends, and comparison with industry composites reveals how well a company is holding its own against its competitors.
What is meant by “hedge”?
To hedge an investment is to take a position intended to offset potential losses/gains that may be incurred by a companion financial instrument.
In addition, it is our practice to hedge the Fund’s currency exposure when we deem it advantageous for our shareholders.
Manager’s Discussion
Many equity markets posted meaningful gains in 2017’s first half, across most regions and with minimal volatility. Global markets were aided by generally upbeat economic data, improved corporate earnings in the U.S., Europe and Japan, as well as improved industrial commodity prices at certain points during the period. However, those largely positive headline conditions overshadowed a fair amount of turbulence and uncertainty.
In the U.S., markets began 2017 rallying as investors hoped that a Republican sweep of U.S. elections in November 2016 would lead to a general loosening in regulations and tax reform, including lower corporate tax rates. However, political gridlock took hold. The political drama in Washington, D.C., tempered the rally in U.S. markets overall. Many stocks that led the way in the post-election rally subsequently gave back some or all of their outperformance, particularly value stocks dominated by companies in cyclical sectors most likely to benefit from acceleration in economic growth, including financials sector firms. In an environment of modest economic growth and low interest rates, investors continued to favor growth stocks, particularly major technology firms.
European equity markets started 2017 slowly, but political events combined with upbeat economic news sparked strong performance during the period, with the notable exception of the U.K. In our view, France’s presidential election was significant as it stemmed the rise of the populist, anti-European Union (EU) National Front party and raised hopes for the future of the EU. The subsequent success of Macron’s party in France’s legislative elections added to the hope that the new government can implement much-needed economic reforms. In
Italy, the poor showing of the populist Eurosceptic Five Star movement in the June local elections reinforced the broader positive political trend in Europe. On the other hand, in the U.K., the surprise loss by the Conservative Party of its parliamentary majority, and the increasingly public split within the Conservative Party between supporters and opponents of a “hard Brexit” added another layer of uncertainty to the upcoming negotiations with the EU.
Although Europe’s economy is still vulnerable to political or financial setbacks, we believe its recovery has broad economic support. Purchasing managers’ indices and employment data continued to point to solid and widespread economic growth. In addition, for the first time in several years, consensus estimates of corporate earnings were revised upward. The improvement in economic and corporate conditions helped to reduce investor concerns about deflation and spur nascent signs of inflation. On balance, we hold a positive view of European equities, but selectivity remains crucial.
Asian equity markets have seen mixed performance year to date. Markets in mainland China have been quite weak, while Hong Kong’s market has been strong, possibly driven by flows from mainland investors through the Stock Connect channel. We remain concerned about the sharp rise of leveraged debt instruments used by smaller banks in China to bolster earnings. However, we take some comfort from the fact that China’s regulators are moving to deflate that bubble. Although China’s economic growth remained constant in the first half of the year, it could likely moderate during the remainder of the year, in our view, as tightening measures begin to impact industries such as real estate and construction.
Japan’s economy remains challenged by an aging population that may impact other geographies in the near future. However, despite its declining population, Japan has policies in place to target gross domestic product growth of 2%. The Bank of Japan continued its quantitative easing program, which extended beyond Japanese government bonds to equity exchange traded funds. We believe this buying created distortions in equity valuations to an extent beyond possible distortions in other markets. Conversely, the Corporate Governance Code, which has been implemented by the Abe administration and directly addresses shareholder returns, has resulted in some improvement in shareholder responsiveness by Japanese corporate management. There is more room for improvement but, as a result, we have recently seen more investment opportunities emerging in Japan.
Many of the aforementioned economic factors have played into the performance of the financials sector in the first half of the
franklintempleton.com |
Semiannual Report |
5 |
F R A N K L I N M U T U A L F I N A N C I A L S E R V I C E S F U N D
year. The positive economic conditions, despite the political gridlock, should allow for further actions by the U.S. Federal Reserve to raise interest rates, giving the financials sector a tailwind. We continue to believe that a slow and steady rise in interest rates across all maturities should likely have the most positive impact on the Fund’s larger holdings in the bank and life insurance industries. The relatively higher inflation in the U.S. may be transmitted overseas through a stronger U.S. dollar, alleviating the need for foreign central banks to maintain accommodative monetary policy, which would in turn benefit the financials sector outside the U.S.
As value investors, we managed to benefit from steady economic growth despite underlying market turbulence. In all market environments, we seek to invest prudently in securities that we believe represent good value, and then we adjust our views as the world around us changes.
Turning to Fund performance, top positive contributors included India-based mortgage company Indiabulls Housing Finance, Netherlands-based insurer ASR Nederland and Dublin-based insurance company XL Group.
Indiabulls Housing Finance is India’s third largest mortgage financing company. During the period, Indiabulls reported positive quarterly results that showed it successfully followed through on its goal of expanding its home loan book. In our view, the results reported in February were particularly noteworthy given the economic disruption caused by the Indian government’s surprise demonetization announcement in November 2016. The government recalled all existing 500 and 1000 rupee notes, totaling approximately 86% of India’s currency in circulation, which led to cash shortages. The April results were significant as Indiabulls was able to hold spreads steady, despite lower interest rates in India, by lowering its cost of funds.
Shares of ASR Nederland rose due to a series of positive events. In February, the company announced it would repurchase shares on offer from the Dutch government, shares the government had acquired during the 2008 financial crisis. In our view, the buyback demonstrated ASR Nederland’s strong capital position. ASR Nederland reported solid quarterly results in February and May, as well as a dividend increase approved by shareholders at the end of May. Operating results were aided by ASR Nederland’s efforts to re-risk its investment portfolio by shifting invested premiums away from traditional fixed income securities to equities and other assets with higher historical returns. We believe the process of re-risking is a sign that management feels more comfortable with its level of capital. The board of ASR Nederland also approved another
Top 10 Equity Holdings
6/30/17
Company Sector/Industry, Country | % of Total Net Assets | |||
XL Group Ltd. | 3.6% | |||
Insurance, Bermuda | ||||
American International Group Inc. | 3.5% | |||
Insurance, U.S. | ||||
NN Group NV | 3.4% | |||
Insurance, Netherlands | ||||
Capital One Financial Corp. | 3.2% | |||
Consumer Finance, U.S. | ||||
Citizens Financial Group Inc. | 3.2% | |||
Banks, U.S. | ||||
CIT Group Inc. | 3.0% | |||
Banks, U.S. | ||||
Shinsei Bank Ltd. | 2.9% | |||
Banks, Japan | ||||
HSBC Holdings PLC | 2.8% | |||
Banks, U.K. | ||||
Direct Line Insurance Group PLC | 2.5% | |||
Insurance, U.K. | ||||
Voya Financial Inc. | 2.5% | |||
Diversified Financial Services, U.S. | ||||
share buyback program, which will likely be used to purchase more shares held by the Dutch government.
Shares of XL Group received a boost in February from quarterly results that showed lower expenses and improved investment income, as well as from an announced share buy-back program. Further support came in April from another set of solid quarterly numbers. The positive string of results showed XL Group’s success in improving underwriting, cutting costs and finding pockets of growth. In addition, the final charges related to XL Group’s purchase of insurer Catlin in 2015 occurred in the second quarter of 2017. In our view, the company is in a positive position to improve margins and return on equity, despite some softening in the insurance market.
During the period under review, Fund investments that detracted from performance included Japan-based residential developer Takara Leben, U.S-based life insurer Voya Financial and U.S.-based Bank Capital One Financial.
Takara Leben is a midsized condominium developer in Japan that is also rapidly expanding its solar farm capacity. In March, Takara Leben made small downward adjustments to its fiscal year revenue guidance due to a delay in the sales of solar power plants. We believe Takara may not be fully exploiting its cost advantage in the residential real estate market. Takara failed to accelerate completion of units when price differentials were
6 |
Semiannual Report |
franklintempleton.com |
F R A N K L I N M U T U A L F I N A N C I A L S E R V I C E S F U N D
significantly in its favor. Moreover, we do not believe it is selling solar assets at full value. We will shortly address these issues with management.
Shares of Voya were negatively impacted by a combination of a decline in the 10-year U.S. Treasury yield and increased doubts among investors that the Trump administration and the Republican-controlled Congress will quickly enact their economic agenda. In early May, Voya announced a mixed set of earnings results. Although the figures were in line with those of the prior quarter, investor expectations were more upbeat.
Capital One Financial, one of our 10 largest investments, is the seventh largest bank in the U.S. Financials stocks were negatively impacted in March by a combination of a decline in the 10-year U.S. Treasury yield and increased doubts among investors that the current U.S. administration and Congress would quickly enact their economic agenda.3 Also in March, weaker-than-expected U.S. consumer credit data drove investors to anticipate lower future earnings as a result of higher reserves. Additionally, Capital One withdrew its late 2016 agreement to acquire the credit card portfolio of retailer Cabela’s4 due to complications related to a 2015 consent order with the U.S. Office of the Comptroller of the Currency. The Cabela’s deal was subsequently revived as Capital One partnered with financial company Synovus.4 In late April, shares of Capital One slipped further after the company announced quarterly results that fell short of consensus expectations. The miss in earnings was largely driven by a higher-than-expected increase in reserves as Capital One raised its expected rate of net charge-offs (the amount of bad debt written off minus any subsequent amount recovered) for 2017. In our view, however, the update was more of a hit to confidence than a meaningful negative for Capital One’s financial performance.
During the period, the Fund held currency forwards and futures seeking to hedge most of the currency risk of the portfolio’s non-U.S. dollar investments. The currency forwards had a negative impact on the Fund’s performance because of the depreciation of the U.S. dollar versus the hedged currencies, while currency futures had a negligible impact.
What is a currency forward?
A currency forward is an agreement between the Fund and a counterparty to buy or sell a foreign currency in exchange for another currency at a specific exchange rate on a future date.
What is a future?
A future is an agreement between the Fund and a counterparty made through a U.S. or foreign futures exchange to buy or sell an underlying instrument or asset at a specific price on a future date.
Thank you for your participation in Franklin Mutual Financial Services Fund. We look forward to continuing to serve your investment needs.
 |
Andrew Sleeman, CFA Portfolio Manager | |
 |
Andrew B. Dinnhaupt, CFA Assistant Portfolio Manager | |
 |
Richard Cetlin Assistant Portfolio Manager | |


CFA® is a trademark owned by CFA Institute.
3. The financials sector comprises banks, capital markets, consumer finance, diversified financial services, insurance, and thrifts and mortgage finance in the SOI.
4. Not a Fund holding.
See www.franklintempletondatasources.com for additional data provider information.
franklintempleton.com |
Semiannual Report |
7 |
F R A N K L I N M U T U A L F I N A N C I A L S E R V I C E S F U N D
The foregoing information reflects our analysis, opinions and portfolio holdings as of June 30, 2017, the end of the reporting period. The way we implement our main investment strategies and the resulting portfolio holdings may change depending on factors such as market and economic conditions. These opinions may not be relied upon as investment advice or an offer for a particular security. The information is not a complete analysis of every aspect of any market, country, industry, security or the Fund. Statements of fact are from sources considered reliable, but the investment manager makes no representation or warranty as to their completeness or accuracy. Although historical performance is no guarantee of future results, these insights may help you understand our investment management philosophy.
Andrew Sleeman has been portfolio manager for Franklin Mutual Financial Services Fund since 2009. He has also been a co-portfolio manager for Franklin Mutual International Fund since 2009. Mr. Sleeman joined Franklin Templeton Investments in 2007. Previously, he was with Fox-Pitt, Kelton, a financials specialist firm, where he focused on international financial equities. Prior to that, he worked in international equities at BNP Paribas. Mr. Sleeman also worked in Australia in the fixed income division of JP Morgan Investment Management.
Richard Cetlin has been assistant portfolio manager for Franklin Mutual Financial Services Fund since 2010 with primary coverage of European banks. Prior to joining Franklin Templeton Investments in 2010, Mr. Cetlin was a consultant for Asian Century Quest, a hedge fund focused on the Asia-Pacific region. In this role, he focused on the analysis of banking, insurance and real estate stocks in China and banking stocks in Hong Kong and Korea. Prior to that, Mr. Cetlin worked for 14 years at AllianceBernstein where he was a senior vice president and senior analyst for U.S. banking and specialty finance.
Andrew Dinnhaupt has been assistant portfolio manager for Franklin Mutual Financial Services Fund since December 2013 and has been an analyst for Franklin Mutual Advisers since 2011, specializing in the global insurance industry. Previously, Mr. Dinnhaupt was a portfolio manager and senior analyst covering the global financial services sector for RBC Capital Markets. Prior to RBC, Mr. Dinnhaupt worked at several hedge funds where he was responsible for analyzing and managing portfolios in the financial services sector. Before that, he worked at Mitchell Hutchins Asset Management where he covered the financial services industry.
8 |
Semiannual Report |
franklintempleton.com |
F R A N K L I N M U T U A L F I N A N C I A L S E R V I C E S F U N D
Performance Summary as of June 30, 2017
The performance table does not reflect any taxes that a shareholder would pay on Fund dividends, capital gain distributions, if any, or any realized gains on the sale of Fund shares. Total return reflects reinvestment of the Fund’s dividends and capital gain distributions, if any, and any unrealized gains or losses. Your dividend income will vary depending on dividends or interest paid by securities in the Fund’s portfolio, adjusted for operating expenses of each class. Capital gain distributions are net profits realized from the sale of portfolio securities.
Performance as of 6/30/17
Cumulative total return excludes sales charges. Average annual total return includes maximum sales charges. Sales charges will vary depending on the size of the investment and the class of share purchased. The maximum is 5.75% and the minimum is 0%. Class A: 5.75% maximum initial sales charge. For other share classes, visit franklintempleton.com.
| Share Class | Cumulative Total Return1 | Average Annual Total Return2 | ||||||
| ||||||||
Z
| ||||||||
6-Month
|
| +5.54%3
|
|
| +5.54%3
|
| ||
1-Year
|
| +27.70%
|
|
| +27.70%
|
| ||
5-Year
|
| +99.63%
|
|
| +14.83%
|
| ||
10-Year
|
| +30.49%
|
|
| +2.70%
|
| ||
A
| ||||||||
6-Month
|
| +5.43%3
|
|
| -0.65%
|
| ||
1-Year
|
| +27.38%
|
|
| +20.05%
|
| ||
5-Year
|
| +96.77%
|
|
| +13.14%
|
| ||
10-Year
|
| +26.73%
|
|
| +1.79%
|
| ||
Performance data represent past performance, which does not guarantee future results. Investment return and principal value will fluctuate, and you may have a gain or loss when you sell your shares. Current performance may differ from figures shown. For most recent month-end performance, go to franklintempleton.com or call (800) 342-5236.
See page 10 for Performance Summary footnotes.
franklintempleton.com |
Semiannual Report |
9 |
F R A N K L I N M U T U A L F I N A N C I A L S E R V I C E S F U N D
P E R F O R M A N C E S U M M A R Y
Total Annual Operating Expenses4
| Share Class | ||||
| ||||
Z
|
|
1.13%
|
| |
A
|
|
1.38%
|
| |
Each class of shares is available to certain eligible investors and has different annual fees and expenses, as described in the prospectus.
All investments involve risks, including possible loss of principal. Value securities may not increase in price as anticipated or may decline further in value. Special risks are associated with foreign investing, including currency fluctuations, economic instability and political developments. Investing in a single-sector fund involves special risks, including greater sensitivity to economic, political or regulatory developments impacting the sector. Smaller company stocks have exhibited greater price volatility than larger company stocks, particularly over the short term. The Fund’s investments in companies engaged in mergers, reorganizations or liquidations also involve special risks as pending deals may not be completed on time or on favorable terms. The Fund may invest in lower rated bonds, which entail higher credit risk. The Fund is actively managed but there is no guarantee that the manager’s investment decisions will produce the desired results. The Fund’s prospectus also includes a description of the main investment risks.
1. Cumulative total return represents the change in value of an investment over the periods indicated.
2. Average annual total return represents the average annual change in value of an investment over the periods indicated. Return for less than one year, if any, has not been annualized.
3. Total return information is based on net asset values calculated for shareholder transactions. Certain adjustments were made to the net assets of the Fund at 12/31/16 for financial reporting purposes, and as a result, the total returns based on those net asset values differ from the adjusted total returns reported in the Financial Highlights.
4. Figures are as stated in the Fund’s current prospectus and may differ from the expense ratios disclosed in the Your Fund’s Expenses and Financial Highlights sections in this report. In periods of market volatility, assets may decline significantly, causing total annual Fund operating expenses to become higher than the figures shown.
10 |
Semiannual Report |
franklintempleton.com |
F R A N K L I N M U T U A L F I N A N C I A L S E R V I C E S F U N D
As a Fund shareholder, you can incur two types of costs: (1) transaction costs, including sales charges (loads) on Fund purchases and redemptions; and (2) ongoing Fund costs, including management fees, distribution and service (12b-1) fees, and other Fund expenses. All mutual funds have ongoing costs, sometimes referred to as operating expenses. The table below shows ongoing costs of investing in the Fund and can help you understand these costs and compare them with those of other mutual funds. The table assumes a $1,000 investment held for the six months indicated.
Actual Fund Expenses
The table below provides information about actual account values and actual expenses in the columns under the heading “Actual.” In these columns the Fund’s actual return, which includes the effect of Fund expenses, is used to calculate the “Ending Account Value” for each class of shares. You can estimate the expenses you paid during the period by following these steps (of course, your account value and expenses will differ from those in this illustration): Divide your account value by $1,000 (if your account had an $8,600 value, then $8,600 ÷ $1,000 = 8.6). Then multiply the result by the number in the row for your class of shares under the headings “Actual” and “Expenses Paid During Period” (if Actual Expenses Paid During Period were $7.50, then 8.6 x $7.50 = $64.50). In this illustration, the actual expenses paid this period are $64.50.
Hypothetical Example for Comparison with Other Funds
Under the heading “Hypothetical” in the table, information is provided about hypothetical account values and hypothetical expenses based on the Fund’s actual expense ratio and an assumed rate of return of 5% per year before expenses, which is not the Fund’s actual return. This information may not be used to estimate the actual ending account balance or expenses you paid for the period, but it can help you compare ongoing costs of investing in the Fund with those of other funds. To do so, compare this 5% hypothetical example for the class of shares you hold with the 5% hypothetical examples that appear in the shareholder reports of other funds.
Please note that expenses shown in the table are meant to highlight ongoing costs and do not reflect any transactional costs. Therefore, information under the heading “Hypothetical” is useful in comparing ongoing costs only, and will not help you compare total costs of owning different funds. In addition, if transactional costs were included, your total costs would have been higher.
Actual (actual return after expenses) | Hypothetical (5% annual return before expenses) | Net | ||||||||||||||||||||||||||||||||||
Share Class | Beginning Value 1/1/17 | Ending Account Value 6/30/17 | Expenses Paid During Period 1/1/17–6/30/171,2 | Ending Account Value 6/30/17 | Expenses Paid During Period 1/1/17–6/30/171,2 | |||||||||||||||||||||||||||||||
Z | $1,000 | $1,056.80 | $ | 5.56 | $1,019.39 | $ | 5.46 | 1.09% | ||||||||||||||||||||||||||||
A | $1,000 | $1,055.80 | $ | 6.83 | $1,018.15 | $ | 6.71 | 1.34% | ||||||||||||||||||||||||||||
C | $1,000 | $1,051.90 | $ | 10.63 | $1,014.43 | $ | 10.44 | 2.09% | ||||||||||||||||||||||||||||
R6 | $1,000 | $1,057.40 | $ | 4.85 | $1,020.08 | $ | 4.76 | 0.95% | ||||||||||||||||||||||||||||
1. Expenses are equal to the annualized expense ratio for the six-month period as indicated above–in the far right column–multiplied by the simple average account value over the period indicated, and then multiplied by 181/365 to reflect the one-half year period.
2. Reflects expenses after fee waivers and expense reimbursements. Does not include acquired fund fees and expenses.
franklintempleton.com |
Semiannual Report |
11 |
F R A N K L I N M U T U A L F I N A N C I A L S E R V I C E S F U N D
Six Months Ended (unaudited) | Year Ended December 31, | |||||||||||||||||||||||
| 2016 | 2015 | 2014 | 2013 | 2012 | ||||||||||||||||||||
| ||||||||||||||||||||||||
Class Z | ||||||||||||||||||||||||
Per share operating performance | ||||||||||||||||||||||||
(for a share outstanding throughout the period) | ||||||||||||||||||||||||
Net asset value, beginning of period | $21.65 | $19.63 | $18.40 | $16.90 | $13.59 | $11.53 | ||||||||||||||||||
|
| |||||||||||||||||||||||
Income from investment operationsa: | ||||||||||||||||||||||||
Net investment incomeb | 0.17 | 0.31 | c | 0.30 | d | 0.25 | 0.24 | 0.20 | ||||||||||||||||
Net realized and unrealized gains (losses) | 1.06 | 2.00 | 1.23 | 1.62 | 3.24 | 2.09 | ||||||||||||||||||
|
| |||||||||||||||||||||||
Total from investment operations | 1.23 | 2.31 | 1.53 | 1.87 | 3.48 | 2.29 | ||||||||||||||||||
|
| |||||||||||||||||||||||
Less distributions from net investment income . | — | (0.29 | ) | (0.30 | ) | (0.37 | ) | (0.17 | ) | (0.23) | ||||||||||||||
|
| |||||||||||||||||||||||
Net asset value, end of period | $22.88 | $21.65 | $19.63 | $18.40 | $16.90 | $13.59 | ||||||||||||||||||
|
| |||||||||||||||||||||||
| Total returne | 5.68% | 11.79% | 8.34% | 11.07% | 25.67% | 19.98% | ||||||||||||||||||
| Ratios to average net assetsf | ||||||||||||||||||||||||
Expenses. | 1.09% | g | 1.13% | g,h | 1.13% | g | 1.14% | g | 1.16% | g | 1.24% | |||||||||||||
Net investment income | 1.48% | 1.64% | c | 1.53% | d | 1.44% | 1.51% | 1.56% | ||||||||||||||||
| Supplemental data | ||||||||||||||||||||||||
Net assets, end of period (000’s) | $193,629 | $162,687 | $178,157 | $112,156 | $105,279 | $86,519 | ||||||||||||||||||
Portfolio turnover rate | 27.20% | 34.58% | 25.43% | 33.69% | 25.73% | 12.65% | ||||||||||||||||||
aThe amount shown for a share outstanding throughout the period may not correlate with the Statement of Operations for the period due to the timing of sales and repurchases of the Fund’s shares in relation to income earned and/or fluctuating fair value of the investments of the Fund.
bBased on average daily shares outstanding.
cNet investment income per share includes approximately $0.05 per share related to income received in the form of special dividends in connection with certain Fund holdings. Excluding this amount, the ratio of net investment income to average net assets would have been 1.38%.
dNet investment income per share includes approximately $0.14 per share related to income received in the form of special dividends in connection with certain Fund holdings. Excluding this amount, the ratio of net investment income to average net assets would have been 0.81%.
eTotal return is not annualized for periods less than one year.
fRatios are annualized for periods less than one year.
gBenefit of expense reduction rounds to less than 0.01%.
hBenefit of waiver and payments by affiliates rounds to less than 0.01%.
12 |
Semiannual Report |
| The accompanying notes are an integral part of these financial statements. |
franklintempleton.com |
F R A N K L I N M U T U A L F I N A N C I A L S E R V I C E S F U N D
F I N A N C I A L H I G H L I G H T S
| Six Months Ended June 30, 2017 (unaudited) | Year Ended December 31, | |||||||||||||||||||||||
| 2016 | 2015 | 2014 | 2013 | 2012 | ||||||||||||||||||||
| ||||||||||||||||||||||||
Class A | ||||||||||||||||||||||||
Per share operating performance | ||||||||||||||||||||||||
(for a share outstanding throughout the period) | ||||||||||||||||||||||||
Net asset value, beginning of period | $21.70 | $19.69 | $18.46 | $16.96 | $13.64 | $11.57 | ||||||||||||||||||
|
| |||||||||||||||||||||||
Income from investment operationsa: | ||||||||||||||||||||||||
Net investment incomeb | 0.13 | 0.26 | c | 0.25 | d | 0.20 | 0.19 | 0.16 | ||||||||||||||||
Net realized and unrealized gains (losses) | 1.08 | 1.99 | 1.23 | 1.61 | 3.26 | 2.10 | ||||||||||||||||||
|
| |||||||||||||||||||||||
Total from investment operations | 1.21 | 2.25 | 1.48 | 1.81 | 3.45 | 2.26 | ||||||||||||||||||
|
| |||||||||||||||||||||||
Less distributions from net investment income . | — | (0.24 | ) | (0.25 | ) | (0.31 | ) | (0.13 | ) | (0.19) | ||||||||||||||
|
| |||||||||||||||||||||||
Net asset value, end of period | $22.91 | $21.70 | $19.69 | $18.46 | $16.96 | $13.64 | ||||||||||||||||||
|
| |||||||||||||||||||||||
| Total returne | 5.58% | 11.46% | 8.05% | 10.71% | 25.32% | 19.55% | ||||||||||||||||||
| Ratios to average net assetsf | ||||||||||||||||||||||||
Expenses. | 1.34% | g | 1.38% | g,h | 1.41% | g | 1.44% | g | 1.46% | g | 1.54% | |||||||||||||
Net investment income | 1.23% | 1.39% | c | 1.25% | d | 1.14% | 1.21% | 1.26% | ||||||||||||||||
| Supplemental data | ||||||||||||||||||||||||
Net assets, end of period (000’s) | $348,182 | $346,008 | $360,278 | $255,242 | $240,529 | $184,681 | ||||||||||||||||||
Portfolio turnover rate | 27.20% | 34.58% | 25.43% | 33.69% | 25.73% | 12.65% | ||||||||||||||||||
aThe amount shown for a share outstanding throughout the period may not correlate with the Statement of Operations for the period due to the timing of sales and repurchases of the Fund’s shares in relation to income earned and/or fluctuating fair value of the investments of the Fund.
bBased on average daily shares outstanding.
cNet investment income per share includes approximately $0.05 per share related to income received in the form of special dividends in connection with certain Fund holdings. Excluding this amount, the ratio of net investment income to average net assets would have been 1.13%.
dNet investment income per share includes approximately $0.14 per share related to income received in the form of special dividends in connection with certain Fund holdings. Excluding this amount, the ratio of net investment income to average net assets would have been 0.53%.
eTotal return does not reflect sales commissions or contingent deferred sales charges, if applicable, and is not annualized for periods less than one year.
fRatios are annualized for periods less than one year.
gBenefit of expense reduction rounds to less than 0.01%.
hBenefit of waiver and payments by affiliates rounds to less than 0.01%.
franklintempleton.com |
The accompanying notes are an integral part of these financial statements. | |
Semiannual Report |
13 |
F R A N K L I N M U T U A L F I N A N C I A L S E R V I C E S F U N D
F I N A N C I A L H I G H L I G H T S
Six Months Ended June 30, 2017 (unaudited) | Year Ended December 31, | |||||||||||||||||||||||
| 2016 | 2015 | 2014 | 2013 | 2012 | ||||||||||||||||||||
| ||||||||||||||||||||||||
Class C | ||||||||||||||||||||||||
| Per share operating performance | ||||||||||||||||||||||||
(for a share outstanding throughout the period) | ||||||||||||||||||||||||
Net asset value, beginning of period | $21.60 | $19.61 | $18.41 | $16.92 | $13.61 | $11.55 | ||||||||||||||||||
|
| |||||||||||||||||||||||
Income from investment operationsa: | ||||||||||||||||||||||||
Net investment incomeb | 0.05 | 0.12 | c | 0.10 | d | 0.08 | 0.08 | 0.07 | ||||||||||||||||
Net realized and unrealized gains (losses) | 1.07 | 1.96 | 1.24 | 1.60 | 3.25 | 2.08 | ||||||||||||||||||
|
| |||||||||||||||||||||||
Total from investment operations | 1.12 | 2.08 | 1.34 | 1.68 | 3.33 | 2.15 | ||||||||||||||||||
|
| |||||||||||||||||||||||
Less distributions from net investment income | — | (0.09 | ) | (0.14 | ) | (0.19 | ) | (0.02 | ) | (0.09) | ||||||||||||||
|
| |||||||||||||||||||||||
Net asset value, end of period | $22.72 | $21.60 | $19.61 | $18.41 | $16.92 | $13.61 | ||||||||||||||||||
|
| |||||||||||||||||||||||
Total returne | 5.19% | 10.64% | 7.30% | 9.93% | 24.50% | 18.67% | ||||||||||||||||||
Ratios to average net assetsf | ||||||||||||||||||||||||
Expenses | 2.09% | g | 2.13% | g,h | 2.13% | g | 2.14% | g | 2.16% | g | 2.24% | |||||||||||||
Net investment income | 0.48% | 0.64% | c | 0.53% | d | 0.44% | 0.51% | 0.56% | ||||||||||||||||
Supplemental data | ||||||||||||||||||||||||
Net assets, end of period (000’s) | $129,109 | $128,766 | $132,975 | $89,341 | $86,370 | $69,046 | ||||||||||||||||||
Portfolio turnover rate | 27.20% | 34.58% | 25.43% | 33.69% | 25.73% | 12.65% | ||||||||||||||||||
aThe amount shown for a share outstanding throughout the period may not correlate with the Statement of Operations for the period due to the timing of sales and repurchases of the Fund’s shares in relation to income earned and/or fluctuating fair value of the investments of the Fund.
bBased on average daily shares outstanding.
cNet investment income per share includes approximately $0.05 per share related to income received in the form of special dividends in connection with certain Fund holdings. Excluding this amount, the ratio of net investment income to average net assets would have been 0.38%.
dNet investment income per share includes approximately $0.14 per share related to income received in the form of special dividends in connection with certain Fund holdings. Excluding this amount, the ratio of net investment income to average net assets would have been (0.19)%.
eTotal return does not reflect sales commissions or contingent deferred sales charges, if applicable, and is not annualized for periods less than one year.
fRatios are annualized for periods less than one year.
gBenefit of expense reduction rounds to less than 0.01%.
hBenefit of waiver and payments by affiliates rounds to less than 0.01%.
14 |
Semiannual Report |
| The accompanying notes are an integral part of these financial statements. |
franklintempleton.com |
F R A N K L I N M U T U A L F I N A N C I A L S E R V I C E S F U N D
F I N A N C I A L H I G H L I G H T S
Six Months Ended June 30, 2017 (unaudited) | Year Ended December 31, | |||||||||||||||||||
| 2016 | 2015 | 2014 | 2013a | |||||||||||||||||
| ||||||||||||||||||||
Class R6 | ||||||||||||||||||||
| Per share operating performance | ||||||||||||||||||||
(for a share outstanding throughout the period) | ||||||||||||||||||||
Net asset value, beginning of period | $21.79 | $19.76 | $18.52 | $16.88 | $14.89 | |||||||||||||||
|
| |||||||||||||||||||
Income from investment operationsb: | ||||||||||||||||||||
Net investment incomec | 0.19 | 0.32 | d | 0.07 | e | 0.25 | 0.13 | |||||||||||||
Net realized and unrealized gains (losses) | 1.06 | 2.03 | 1.49 | 1.66 | 2.07 | |||||||||||||||
|
| |||||||||||||||||||
Total from investment operations | 1.25 | 2.35 | 1.56 | 1.91 | 2.20 | |||||||||||||||
|
| |||||||||||||||||||
Less distributions from net investment income | — | (0.32 | ) | (0.32 | ) | (0.27 | ) | (0.21) | ||||||||||||
|
| |||||||||||||||||||
Net asset value, end of period | $23.04 | $21.79 | $19.76 | $18.52 | $16.88 | |||||||||||||||
|
| |||||||||||||||||||
Total returnf | 5.74% | 11.93% | 8.55% | 11.23% | 14.86% | |||||||||||||||
Ratios to average net assetsg | ||||||||||||||||||||
Expenses before waiver and payments by affiliates | 0.96% | 0.99% | 1.16% | 2.61% | 2.18% | |||||||||||||||
Expenses net of waiver and payments by affiliatesh | 0.95% | 0.96% | 0.96% | 0.97% | 0.97% | |||||||||||||||
Net investment income | 1.62% | 1.81% | d | 1.70% | e | 1.61% | 1.70% | |||||||||||||
Supplemental data | ||||||||||||||||||||
Net assets, end of period (000’s) | $3,707 | $2,601 | $1,421 | $12 | $6 | |||||||||||||||
Portfolio turnover rate | 27.20% | 34.58% | 25.43% | 33.69% | 25.73% | |||||||||||||||
aFor the period May 1, 2013 (effective date) to December 31, 2013.
bThe amount shown for a share outstanding throughout the period may not correlate with the Statement of Operations for the period due to the timing of sales and repurchases of the Fund’s shares in relation to income earned and/or fluctuating fair value of the investments of the Fund.
cBased on average daily shares outstanding.
dNet investment income per share includes approximately $0.05 per share related to income received in the form of special dividends in connection with certain Fund holdings. Excluding this amount, the ratio of net investment income to average net assets would have been 1.55%.
eNet investment income per share includes approximately $0.14 per share related to income received in the form of special dividends in connection with certain Fund holdings. Excluding this amount, the ratio of net investment income to average net assets would have been 0.98%.
fTotal return is not annualized for periods less than one year.
gRatios are annualized for periods less than one year.
hBenefit of expense reduction rounds to less than 0.01%.
franklintempleton.com |
The accompanying notes are an integral part of these financial statements. | |
Semiannual Report |
15 |
F R A N K L I N M U T U A L F I N A N C I A L S E R V I C E S F U N D
Statement of Investments, June 30, 2017 (unaudited)
| Country | Shares/ Units | Value | ||||||||||||
| ||||||||||||||
Common Stocks and Other Equity Interests 95.1% | ||||||||||||||
Banks 34.0% | ||||||||||||||
a,b AB&T Financial Corp | United States | 226,100 | $ | 192,185 | ||||||||||
Allied Irish Banks PLC | Ireland | 1,254,659 | 7,094,014 | |||||||||||
Barclays PLC | United Kingdom | 4,275,515 | 11,291,294 | |||||||||||
BB&T Corp. | United States | 317,900 | 14,435,839 | |||||||||||
BNP Paribas SA | France | 134,020 | 9,653,499 | |||||||||||
Capital Bank Financial Corp., A | United States | 42,649 | 1,624,927 | |||||||||||
c Capital Bank Financial Corp., B, 144A, non-voting | United States | 153,021 | 5,830,100 | |||||||||||
CIT Group Inc. | United States | 419,311 | 20,420,446 | |||||||||||
Citigroup Inc. | United States | 218,510 | 14,613,949 | |||||||||||
Citizens Financial Group Inc. | United States | 600,000 | 21,408,000 | |||||||||||
a FCB Financial Holdings Inc., A | United States | 249,489 | 11,913,100 | |||||||||||
Guaranty Bancorp | United States | 266,761 | 7,255,899 | |||||||||||
HSBC Holdings PLC | United Kingdom | 2,018,314 | 18,710,273 | |||||||||||
JPMorgan Chase & Co. | United States | 154,080 | 14,082,912 | |||||||||||
PNC Financial Services Group Inc. | United States | 10,595 | 1,322,998 | |||||||||||
Shinsei Bank Ltd. | Japan | 11,340,000 | 19,759,435 | |||||||||||
Southern National Bancorp of Virginia Inc. | United States | 547,560 | 9,637,056 | |||||||||||
a Standard Chartered PLC | United Kingdom | 684,019 | 6,924,611 | |||||||||||
State Bank Financial Corp. | United States | 416,160 | 11,286,259 | |||||||||||
SunTrust Banks Inc. | United States | 271,320 | 15,389,270 | |||||||||||
Wells Fargo & Co. | United States | 120,570 | 6,680,784 | |||||||||||
|
| |||||||||||||
| 229,526,850 | ||||||||||||||
|
| |||||||||||||
Capital Markets 4.2% | ||||||||||||||
China International Capital Corp. Ltd., H | China | 6,575,401 | 9,701,722 | |||||||||||
a Guotai Junan Securities Co. Ltd. | China | 3,217,063 | 6,724,404 | |||||||||||
Oslo Bors VPS Holding ASA | Norway | 911,000 | 12,115,088 | |||||||||||
|
| |||||||||||||
| 28,541,214 | ||||||||||||||
|
| |||||||||||||
Consumer Finance 6.6% | ||||||||||||||
Ally Financial Inc. | United States | 252,500 | 5,277,250 | |||||||||||
Capital One Financial Corp. | United States | 262,010 | 21,647,266 | |||||||||||
c Hoist Finance AB, 144A | Sweden | 850,396 | 8,709,452 | |||||||||||
Sun Hung Kai & Co. Ltd. | Hong Kong | 14,145,704 | 9,113,111 | |||||||||||
|
| |||||||||||||
| 44,747,079 | ||||||||||||||
|
| |||||||||||||
Diversified Financial Services 6.5% | ||||||||||||||
AMP Ltd. | Australia | 4,036,415 | 16,105,587 | |||||||||||
First Pacific Co. Ltd. | Hong Kong | 7,786,902 | 5,744,620 | |||||||||||
a,d Hightower Holding LLC, B, Series I | United States | 1,815,233 | 3,175,206 | |||||||||||
a,d Hightower Holding LLC, B, Series II | United States | 791,396 | 2,466,149 | |||||||||||
Voya Financial Inc. | United States | 449,050 | 16,565,454 | |||||||||||
|
| |||||||||||||
| 44,057,016 | ||||||||||||||
|
| |||||||||||||
Equity Real Estate Investment Trusts (REITs) 1.5% | ||||||||||||||
Hibernia REIT PLC | Ireland | 6,309,142 | 9,909,099 | |||||||||||
|
| |||||||||||||
Household Durables 1.3% | ||||||||||||||
a Cairn Homes PLC | Ireland | 5,040,625 | 8,665,269 | |||||||||||
|
| |||||||||||||
Insurance 35.1% | ||||||||||||||
Ageas | Belgium | 347,049 | 13,977,653 | |||||||||||
a Alleghany Corp. | United States | 18,637 | 11,085,288 | |||||||||||
American International Group Inc. | United States | 375,458 | 23,473,634 | |||||||||||
Argo Group International Holdings Ltd. | United States | 98,275 | 5,955,465 | |||||||||||
ASR Nederland NV | Netherlands | 480,940 | 16,219,668 | |||||||||||
16 |
Semiannual Report |
franklintempleton.com |
F R A N K L I N M U T U A L F I N A N C I A L S E R V I C E S F U N D
S T A T E M E N T O F I N V E S T M E N T S ( U N A U D I T E D )
| Country | Shares/ Units | Value | ||||||||||||
| ||||||||||||||
Common Stocks and Other Equity Interests (continued) | ||||||||||||||
Insurance (continued) | ||||||||||||||
China Pacific Insurance Group Co. Ltd., H | China | 2,979,740 | $ | 12,174,276 | ||||||||||
Chubb Ltd. | United States | 64,950 | 9,442,431 | |||||||||||
Direct Line Insurance Group PLC | United Kingdom | 3,677,124 | 17,022,374 | |||||||||||
The Hartford Financial Services Group Inc. | United States | 280,072 | 14,723,385 | |||||||||||
Korean Reinsurance Co. | South Korea | 474,730 | 5,017,104 | |||||||||||
Lancashire Holdings Ltd. | United Kingdom | 781,589 | 7,090,780 | |||||||||||
MetLife Inc. | United States | 197,670 | 10,859,990 | |||||||||||
NN Group NV | Netherlands | 643,498 | 22,874,307 | |||||||||||
RSA Insurance Group PLC | United Kingdom | 1,851,271 | 14,842,002 | |||||||||||
State National Cos. Inc. | United States | 373,757 | 6,869,654 | |||||||||||
c State National Cos. Inc.144A | United States | 350,000 | 6,433,000 | |||||||||||
T&D Holdings Inc. | Japan | 504,169 | 7,662,150 | |||||||||||
White Mountains Insurance Group Ltd. | United States | 7,484 | 6,500,827 | |||||||||||
XL Group Ltd. | Bermuda | 554,492 | 24,286,750 | |||||||||||
|
| |||||||||||||
| 236,510,738 | ||||||||||||||
|
| |||||||||||||
Real Estate Management & Development 4.6% | ||||||||||||||
a Dolphin Capital Investors Ltd. | Greece | 3,979,650 | 311,022 | |||||||||||
Kenedix Inc. | Japan | 2,470,726 | 11,641,417 | |||||||||||
a,e Neinor Homes SLU, Reg S | Spain | 380,000 | 8,047,380 | |||||||||||
Takara Leben Co. Ltd. | Japan | 2,419,600 | 10,841,253 | |||||||||||
|
| |||||||||||||
| 30,841,072 | ||||||||||||||
|
| |||||||||||||
Thrifts & Mortgage Finance 1.3% | ||||||||||||||
Indiabulls Housing Finance Ltd. | India | 515,498 | 8,584,852 | |||||||||||
|
| |||||||||||||
Total Common Stocks and Other Equity Interests | 641,383,189 | |||||||||||||
|
| |||||||||||||
Companies in Liquidation 0.0%† | ||||||||||||||
a,d FIM Coinvestor Holdings I, LLC | United States | 4,357,178 | — | |||||||||||
a,f Lehman Brothers Holdings Inc., Bankruptcy Claim | United States | 7,766,103 | 172,407 | |||||||||||
|
| |||||||||||||
Total Companies in Liquidation (Cost $455,021) | 172,407 | |||||||||||||
|
| |||||||||||||
| Counterparty | Notional Amount* | |||||||||||||||
|
|
|
| |||||||||||||
Options Purchased (Cost $85,868) 0.0%† | ||||||||||||||||
Puts - Over-the-Counter | ||||||||||||||||
Currency Options 0.0%† | ||||||||||||||||
INR/USD, July Strike Price 71.75 INR, Expires 7/03/17 | HSBK | 580,744,500 | INR | 8 | ||||||||||||
|
| |||||||||||||||
Total Investments before Short Term Investments | 641,555,604 | |||||||||||||||
|
| |||||||||||||||
franklintempleton.com |
Semiannual Report |
17 |
F R A N K L I N M U T U A L F I N A N C I A L S E R V I C E S F U N D
S T A T E M E N T O F I N V E S T M E N T S ( U N A U D I T E D )
| Country | Principal Amount* | Value | ||||||||||||
| ||||||||||||||
Short Term Investments 5.3% | ||||||||||||||
U.S. Government and Agency Securities 5.3% | ||||||||||||||
g FHLB, 7/03/17 | United States | $ | 6,500,000 | $ | 6,500,000 | |||||||||
g U.S. Treasury Bill, | ||||||||||||||
h 8/17/17 - 11/16/17 | United States | 6,000,000 | 5,987,550 | |||||||||||
|
| |||||||||||||
7/20/17 - 12/21/17 | United States | 23,600,000 | 23,554,729 | |||||||||||
Total U.S. Government and Agency Securities | 36,042,279 | |||||||||||||
|
| |||||||||||||
Total Investments (Cost $590,734,811) 100.4% | 677,597,883 | |||||||||||||
Other Assets, less Liabilities (0.4)% | (2,970,600 | ) | ||||||||||||
|
| |||||||||||||
Net Assets 100.0% | $ | 674,627,283 | ||||||||||||
|
| |||||||||||||
†Rounds to less than 0.1% of net assets.
*The principal/notional amount is stated in U.S. dollars unless otherwise indicated.
aNon-income producing.
bSee Note 11 regarding holdings of 5% voting securities.
cSecurity was purchased pursuant to Rule 144A under the Securities Act of 1933 and may be sold in transactions exempt from registration only to qualified institutional buyers or in a public offering registered under the Securities Act of 1933. These securities have been deemed liquid under guidelines approved by the Trust’s Board of Trustees. At June 30, 2017, the aggregate value of these securities was $20,972,552, representing 3.1% of net assets.
dSee Note 9 regarding restricted securities.
eSecurity was purchased pursuant to Regulation S under the Securities Act of 1933, which exempts from registration securities offered and sold outside of the United States. Such a security cannot be sold in the United States without either an effective registration statement filed pursuant to the Securities Act of 1933, or pursuant to an exemption from registration. This security has been deemed liquid under guidelines approved by the Trust’s Board of Trustees. At June 30, 2017, the value of this security was $8,047,380, representing 1.2% of net assets.
fBankruptcy claims represent the right to receive distributions, if any, during the liquidation of the underlying pool of assets. Shares represent amount of allowed unsecured claims.
gThe security was issued on a discount basis with no stated coupon rate.
hA portion or all of the security has been segregated as collateral for open forward contracts. At June 30, 2017, the aggregate value of these securities and/or cash pledged amounted to $4,860,471, representing 0.7% of net assets.
18 |
Semiannual Report |
franklintempleton.com |
F R A N K L I N M U T U A L F I N A N C I A L S E R V I C E S F U N D
S T A T E M E N T O F I N V E S T M E N T S ( U N A U D I T E D )
At June 30, 2017, the Fund had the following futures contracts outstanding. See Note 1(c).
Futures Contracts
| Description | Type | Number of Contracts | Notional Value | Expiration Date | Unrealized Appreciation | Unrealized Depreciation | ||||||||||||||||||
| ||||||||||||||||||||||||
| Currency Contracts | ||||||||||||||||||||||||
EUR/USD | Short | 163 | $23,364,012 | 9/18/17 | $ — | $(408,642 | ) | |||||||||||||||||
GBP/USD | Short | 166 | 13,534,188 | 9/18/17 | — | (277,587 | ) | |||||||||||||||||
|
| |||||||||||||||||||||||
Total Futures Contracts | $ — | $(686,229 | ) | |||||||||||||||||||||
|
| |||||||||||||||||||||||
Net unrealized appreciation (depreciation) | $(686,229 | ) | ||||||||||||||||||||||
|
| |||||||||||||||||||||||
At June 30, 2017, the Fund had the following forward exchange contracts outstanding. See Note 1(c).
Forward Exchange Contracts
| Currency | Counterpartya | Type | Quantity | Contract Amount | Settlement Date | Unrealized Appreciation | Unrealized Depreciation | |||||||||||||||||||||
| ||||||||||||||||||||||||||||
| OTC Forward Exchange Contracts | ||||||||||||||||||||||||||||
Euro | BOFA | Buy | 519,625 | $ | 586,512 | 7/12/17 | $ | 7,429 | $ | — | ||||||||||||||||||
Euro | BONY | Buy | 600,000 | 673,107 | 7/12/17 | 12,705 | — | |||||||||||||||||||||
Euro | BONY | Sell | 218,469 | 235,011 | 7/12/17 | — | (14,703 | ) | ||||||||||||||||||||
Euro | FBCO | Sell | 4,424,407 | 4,762,299 | 7/12/17 | — | (294,883 | ) | ||||||||||||||||||||
Euro | SSBT | Buy | 826,437 | 931,856 | 7/12/17 | 12,778 | — | |||||||||||||||||||||
Euro | SSBT | Sell | 4,424,405 | 4,760,881 | 7/12/17 | — | (296,299 | ) | ||||||||||||||||||||
Euro | UBSW | Sell | 434,231 | 466,722 | 7/12/17 | — | (29,612 | ) | ||||||||||||||||||||
British Pound | BONY | Sell | 816,677 | 1,026,973 | 7/13/17 | — | (37,268 | ) | ||||||||||||||||||||
British Pound | HSBK | Sell | 2,259,908 | 2,749,438 | 7/13/17 | — | (195,530 | ) | ||||||||||||||||||||
British Pound | SSBT | Sell | 2,509,908 | 3,061,574 | 7/13/17 | — | (209,179 | ) | ||||||||||||||||||||
Norwegian Krone | BONY | Sell | 16,700,905 | 1,952,445 | 7/25/17 | — | (49,576 | ) | ||||||||||||||||||||
Norwegian Krone | HSBK | Sell | 83,505,869 | 9,657,542 | 7/25/17 | — | (352,725 | ) | ||||||||||||||||||||
Norwegian Krone | UBSW | Buy | 1,819,000 | 216,045 | 7/25/17 | 2,008 | — | |||||||||||||||||||||
Euro | HSBK | Sell | 3,918,742 | 4,174,440 | 7/26/17 | — | (308,279 | ) | ||||||||||||||||||||
Euro | UBSW | Sell | 3,918,743 | 4,174,441 | 7/26/17 | — | (308,279 | ) | ||||||||||||||||||||
Australian Dollar | HSBK | Buy | 870,125 | 645,956 | 7/27/17 | 22,732 | — | |||||||||||||||||||||
Australian Dollar | HSBK | Sell | 21,617,022 | 16,327,455 | 7/27/17 | — | (285,176 | ) | ||||||||||||||||||||
Swedish Krona | BONY | Sell | 73,345,668 | 8,353,551 | 7/27/17 | — | (370,123 | ) | ||||||||||||||||||||
South Korean Won | BOFA | Sell | 1,998,400,742 | 1,751,447 | 8/11/17 | 5,631 | — | |||||||||||||||||||||
South Korean Won | HSBK | Buy | 19,468,849 | 17,301 | 8/11/17 | — | (292 | ) | ||||||||||||||||||||
South Korean Won | HSBK | Sell | 2,287,462,667 | 2,009,351 | 8/11/17 | 11,008 | — | |||||||||||||||||||||
South Korean Won | UBSW | Buy | 28,004,151 | 24,771 | 8/11/17 | — | (307 | ) | ||||||||||||||||||||
South Korean Won | UBSW | Sell | 69,073,215 | 60,234 | 8/11/17 | — | (109 | ) | ||||||||||||||||||||
South Korean Won | UBSW | Sell | 162,516,540 | 143,290 | 8/11/17 | 1,315 | — | |||||||||||||||||||||
British Pound | BOFA | Sell | 1,830,688 | 2,280,748 | 8/14/17 | — | (107,287 | ) | ||||||||||||||||||||
British Pound | BONY | Sell | 5,774,113 | 7,104,172 | 8/14/17 | — | (427,851 | ) | ||||||||||||||||||||
British Pound | HSBK | Sell | 3,155,567 | 3,971,123 | 8/14/17 | — | (145,146 | ) | ||||||||||||||||||||
British Pound | SSBT | Sell | 3,826,001 | 4,698,256 | 8/14/17 | — | (292,559 | ) | ||||||||||||||||||||
British Pound | UBSW | Sell | 3,155,567 | 3,971,076 | 8/14/17 | — | (145,193 | ) | ||||||||||||||||||||
Euro | BOFA | Sell | 9,554,273 | 10,315,043 | 8/18/17 | — | (627,080 | ) | ||||||||||||||||||||
Euro | HSBK | Sell | 727,865 | 777,667 | 8/18/17 | — | (55,928 | ) | ||||||||||||||||||||
Euro | SSBT | Sell | 3,954,715 | 4,283,933 | 8/18/17 | — | (245,243 | ) | ||||||||||||||||||||
Euro | UBSW | Sell | 962,821 | 1,035,202 | 8/18/17 | — | (67,477 | ) | ||||||||||||||||||||
Japanese Yen | UBSW | Sell | 5,515,954,244 | 49,720,157 | 8/28/17 | 557,455 | — | |||||||||||||||||||||
Euro | BOFA | Sell | 2,101,861 | 2,255,673 | 10/10/17 | — | (158,514 | ) | ||||||||||||||||||||
franklintempleton.com |
Semiannual Report |
19 |
F R A N K L I N M U T U A L F I N A N C I A L S E R V I C E S F U N D
S T A T E M E N T O F I N V E S T M E N T S ( U N A U D I T E D )
Forward Exchange Contracts (continued)
| Currency | Counterpartya | Type | Quantity | Contract Amount | Settlement Date | Unrealized Appreciation | Unrealized Depreciation | |||||||||||||||||||||
| ||||||||||||||||||||||||||||
| OTC Forward Exchange Contracts (continued) | ||||||||||||||||||||||||||||
Euro | HSBK | Sell | 925,110 | $ | 995,511 | 10/10/17 | $ | — | $ | (67,066 | ) | |||||||||||||||||
Euro | BOFA | Sell | 45,534 | 49,945 | 10/18/17 | — | (2,379 | ) | ||||||||||||||||||||
Euro | BONY | Sell | 589,035 | 647,901 | 10/18/17 | — | (28,972 | ) | ||||||||||||||||||||
Euro | HSBK | Sell | 3,779,793 | 4,050,756 | 10/18/17 | — | (292,686 | ) | ||||||||||||||||||||
Euro | UBSW | Sell | 3,734,258 | 4,001,332 | 10/18/17 | — | (289,785 | ) | ||||||||||||||||||||
British Pound | HSBK | Sell | 526,174 | 678,417 | 10/24/17 | — | (9,433 | ) | ||||||||||||||||||||
British Pound | SSBT | Sell | 1,796,153 | 2,349,440 | 10/24/17 | 1,387 | — | |||||||||||||||||||||
British Pound | SSBT | Sell | 2,830,660 | 3,652,614 | 10/24/17 | — | (47,817 | ) | ||||||||||||||||||||
British Pound | UBSW | Sell | 131,042 | 169,148 | 10/24/17 | — | (2,159 | ) | ||||||||||||||||||||
Euro | BOFA | Sell | 3,553,317 | 3,914,636 | 11/06/17 | — | (173,010 | ) | ||||||||||||||||||||
Euro | SSBT | Sell | 771,309 | 861,575 | 11/06/17 | — | (25,719 | ) | ||||||||||||||||||||
Euro | UBSW | Sell | 3,553,317 | 3,914,636 | 11/06/17 | — | (173,010 | ) | ||||||||||||||||||||
South Korean Won | HSBK | Sell | 367,749,221 | 325,990 | 11/10/17 | 4,178 | — | |||||||||||||||||||||
South Korean Won | UBSW | Sell | 688,127,815 | 606,612 | 11/10/17 | 4,440 | — | |||||||||||||||||||||
Euro | BOFA | Sell | 6,768,660 | 7,598,590 | 11/20/17 | — | (194,168 | ) | ||||||||||||||||||||
Euro | BONY | Sell | 12,189 | 13,853 | 11/20/17 | — | (180 | ) | ||||||||||||||||||||
Euro | SSBT | Sell | 2,699,972 | 3,050,939 | 11/20/17 | — | (57,539 | ) | ||||||||||||||||||||
Euro | UBSW | Sell | 4,088,434 | 4,569,765 | 11/20/17 | — | (137,248 | ) | ||||||||||||||||||||
British Pound | BOFA | Sell | 41,057 | 53,818 | 11/24/17 | 95 | — | |||||||||||||||||||||
British Pound | BONY | Sell | 6,185,021 | 8,098,988 | 11/24/17 | 5,958 | — | |||||||||||||||||||||
British Pound | SSBT | Sell | 132,466 | 173,441 | 11/24/17 | 111 | — | |||||||||||||||||||||
British Pound | UBSW | Sell | 6,185,020 | 8,097,682 | 11/24/17 | 4,653 | — | |||||||||||||||||||||
|
| |||||||||||||||||||||||||||
Total Forward Exchange Contracts | $ | 653,883 | $ | (6,525,789 | ) | |||||||||||||||||||||||
|
| |||||||||||||||||||||||||||
Net unrealized appreciation (depreciation) | $ | (5,871,906 | ) | |||||||||||||||||||||||||
|
| |||||||||||||||||||||||||||
aMay be comprised of multiple contracts with the same counterparty, currency and settlement date.
See Note 10 regarding other derivative information.
See Abbreviations on page 38.
20 |
Semiannual Report | The accompanying notes are an integral part of these financial statements. |
franklintempleton.com |
F R A N K L I N M U T U A L F I N A N C I A L S E R V I C E S F U N D
Statement of Assets and Liabilities
June 30, 2017 (unaudited)
Assets: | ||||
Investments in securities: | ||||
Cost - Unaffiliated issuers | $588,507,726 | |||
Cost - Non-controlled affiliates (Note 11) | 2,227,085 | |||
|
| |||
Total cost of investments | $590,734,811 | |||
|
| |||
Value - Unaffiliated issuers | $677,405,698 | |||
Value - Non-controlled affiliates (Note 11) | 192,185 | |||
|
| |||
Total value of investments | 677,597,883 | |||
Cash | 94,606 | |||
Foreign currency, at value (cost $951,676) | 952,523 | |||
Receivables: | ||||
Investment securities sold | 1,085,651 | |||
Capital shares sold | 1,147,840 | |||
Dividends and interest | 1,046,466 | |||
European Union tax reclaims | 922,367 | |||
Due from brokers | 717,570 | |||
Variation margin | 2,643 | |||
Unrealized appreciation on OTC forward exchange contracts | 653,883 | |||
Other assets | 92,445 | |||
|
| |||
Total assets | 684,313,877 | |||
|
| |||
Liabilities: | ||||
Payables: | ||||
Capital shares redeemed | 1,532,094 | |||
Management fees | 479,840 | |||
Distribution fees | 360,629 | |||
Transfer agent fees | 133,508 | |||
Trustees’ fees and expenses | 23,863 | |||
Unrealized depreciation on OTC forward exchange contracts | 6,525,789 | |||
Deferred tax | 490,556 | |||
Accrued expenses and other liabilities | 140,315 | |||
|
| |||
Total liabilities | 9,686,594 | |||
|
| |||
Net assets, at value | $674,627,283 | |||
|
| |||
Net assets consist of: | ||||
Paid-in capital | $660,914,346 | |||
Undistributed net investment income | 3,560,690 | |||
Net unrealized appreciation (depreciation) | 79,818,638 | |||
Accumulated net realized gain (loss) | (69,666,391 | ) | ||
|
| |||
Net assets, at value | $674,627,283 | |||
|
|
franklintempleton.com |
The accompanying notes are an integral part of these financial statements. | Semiannual Report |
21 |
F R A N K L I N M U T U A L F I N A N C I A L S E R V I C E S F U N D
F I N A N C I A L S T A T E M E N T S
Statement of Assets and Liabilities (continued)
June 30, 2017 (unaudited)
| Class Z: | ||||
Net assets, at value | $193,628,918 | |||
|
| |||
Shares outstanding | 8,462,655 | |||
|
| |||
Net asset value and maximum offering price per share | $22.88 | |||
|
| |||
| Class A: | ||||
Net assets, at value | $348,182,482 | |||
|
| |||
Shares outstanding | 15,196,458 | |||
|
| |||
Net asset value per sharea | $22.91 | |||
|
| |||
Maximum offering price per share (net asset value per share ÷ 94.25%) | $24.31 | |||
|
| |||
| Class C: | ||||
Net assets, at value | $129,108,812 | |||
|
| |||
Shares outstanding | 5,683,283 | |||
|
| |||
Net asset value and maximum offering price per sharea | $22.72 | |||
|
| |||
| Class R6: | ||||
Net assets, at value | $ 3,707,071 | |||
|
| |||
Shares outstanding | 160,873 | |||
|
| |||
Net asset value and maximum offering price per share | $23.04 | |||
|
|
aRedemption price is equal to net asset value less contingent deferred sales charges, if applicable.
22 |
Semiannual Report | The accompanying notes are an integral part of these financial statements. |
franklintempleton.com |
F R A N K L I N M U T U A L F I N A N C I A L S E R V I C E S F U N D
F I N A N C I A L S T A T E M E N T S
Statement of Operations
for the six months ended June 30, 2017 (unaudited)
Investment income: | ||||
Dividends (net of foreign taxes of $614,708) | $ | 8,275,968 | ||
Interest | 147,537 | |||
|
| |||
Total investment income | 8,423,505 | |||
|
| |||
Expenses: | ||||
Management fees (Note 3a) | 2,871,832 | |||
Distribution fees: (Note 3c) | ||||
Class A | 430,462 | |||
Class C | 646,200 | |||
Transfer agent fees: (Note 3e) | ||||
Class Z | 137,497 | |||
Class A | 263,905 | |||
Class C | 99,059 | |||
Class R6 | 341 | |||
Custodian fees (Note 4) | 17,115 | |||
Reports to shareholders | 47,873 | |||
Registration and filing fees | 53,720 | |||
Professional fees | 63,888 | |||
Trustees’ fees and expenses | 9,490 | |||
Other | 23,588 | |||
|
| |||
Total expenses | 4,664,970 | |||
Expense reductions (Note 4) | (714 | ) | ||
Expenses waived/paid by affiliates (Note 3f) | (173 | ) | ||
|
| |||
Net expenses | 4,664,083 | |||
|
| |||
Net investment income | 3,759,422 | |||
|
| |||
Realized and unrealized gains (losses): | ||||
Net realized gain (loss) from: | ||||
Investments | 24,699,853 | |||
Foreign currency transactions | 2,119,493 | |||
Futures contracts | (1,076,059 | ) | ||
|
| |||
Net realized gain (loss) | 25,743,287 | |||
|
| |||
Net change in unrealized appreciation (depreciation) on: | ||||
Investments | 19,947,514 | |||
Translation of other assets and liabilities | (12,533,263 | ) | ||
Futures contracts | (1,010,993 | ) | ||
Change in deferred taxes on unrealized appreciation | (490,556 | ) | ||
|
| |||
Net change in unrealized appreciation (depreciation) | 5,912,702 | |||
|
| |||
Net realized and unrealized gain (loss) | 31,655,989 | |||
|
| |||
Net increase (decrease) in net assets resulting from operations | $ | 35,415,411 | ||
|
|
franklintempleton.com |
The accompanying notes are an integral part of these financial statements. | |
Semiannual Report |
23 |
F R A N K L I N M U T U A L F I N A N C I A L S E R V I C E S F U N D
F I N A N C I A L S T A T E M E N T S
Statements of Changes in Net Assets
| Six Months Ended June 30, 2017 (unaudited) | Year Ended December 31, 2016 | |||||||
| ||||||||
Increase (decrease) in net assets: | ||||||||
Operations: | ||||||||
Net investment income | $ | 3,759,422 | $ | 7,432,945 | ||||
Net realized gain (loss) | 25,743,287 | 31,236,601 | ||||||
Net change in unrealized appreciation (depreciation) | 5,912,702 | 13,082,760 | ||||||
|
| |||||||
Net increase (decrease) in net assets resulting from operations | 35,415,411 | 51,752,306 | ||||||
|
| |||||||
Distributions to shareholders from: | ||||||||
Net investment income: | ||||||||
Class Z | — | (2,125,014 | ) | |||||
Class A | — | (3,742,491 | ) | |||||
Class C | — | (542,259 | ) | |||||
Class R6 | — | (37,208 | ) | |||||
|
| |||||||
Total distributions to shareholders | — | (6,446,972 | ) | |||||
|
| |||||||
Capital share transactions: (Note 2) | ||||||||
Class Z | 20,933,205 | (26,302,473 | ) | |||||
Class A | (16,557,454 | ) | (38,310,153 | ) | ||||
Class C | (6,151,438 | ) | (14,415,335 | ) | ||||
Class R6 | 925,920 | 953,365 | ||||||
|
| |||||||
Total capital share transactions | (849,767 | ) | (78,074,596 | ) | ||||
|
| |||||||
Net increase (decrease) in net assets | 34,565,644 | (32,769,262 | ) | |||||
Net assets: | ||||||||
Beginning of period | 640,061,639 | 672,830,901 | ||||||
|
| |||||||
End of period | $ | 674,627,283 | $ | 640,061,639 | ||||
|
| |||||||
Undistributed net investment income included in net assets: | ||||||||
End of period | $ | 3,560,690 | $ | — | ||||
|
| |||||||
Distributions in excess of net investment income included in net assets: | ||||||||
End of period | $ | — | $ | (198,732 | ) | |||
|
| |||||||
24 |
Semiannual Report |
| The accompanying notes are an integral part of these financial statements. |
franklintempleton.com |
F R A N K L I N M U T U A L F I N A N C I A L S E R V I C E S F U N D
Notes to Financial Statements (unaudited)
1. Organization and Significant Accounting Policies
Franklin Mutual Series Funds (Trust) is registered under the Investment Company Act of 1940 (1940 Act) as an open-end management investment company, consisting of seven separate funds and applies the specialized accounting and reporting guidance in U.S. Generally Accepted Accounting Principles (U.S. GAAP). Franklin Mutual Financial Services Fund (Fund) is included in this report. The Fund offers four classes of shares: Class Z, Class A, Class C and Class R6. Each class of shares may differ by its initial sales load, contingent deferred sales charges, voting rights on matters affecting a single class, its exchange privilege and fees primarily due to differing arrangements for distribution and transfer agent fees.
The following summarizes the Fund’s significant accounting policies.
a. Financial Instrument Valuation
The Fund’s investments in financial instruments are carried at fair value daily. Fair value is the price that would be received to sell an asset or paid to transfer a liability in an orderly transaction between market participants on the measurement date. The Fund calculates the net asset value (NAV) per share as of 4 p.m. Eastern time each day the New York Stock Exchange (NYSE) is open for trading. Under compliance policies and procedures approved by the Trust’s Board of Trustees (the Board), the Fund’s administrator has responsibility for oversight of valuation, including leading the cross-functional Valuation Committee (VC). The VC provides administration and oversight of the Fund’s valuation policies and procedures, which are approved annually by the Board. Among other things, these procedures allow the Fund to utilize independent pricing services, quotations from securities and financial instrument dealers, and other market sources to determine fair value.
Equity securities, and derivative financial instruments listed on an exchange or on the NASDAQ National Market System are valued at the last quoted sale price or the official closing price of the day, respectively. Foreign equity securities are valued as of the close of trading on the foreign stock exchange on which the security is primarily traded, or as of 4 p.m. Eastern time. The value is then converted into its U.S. dollar equivalent at the foreign exchange rate in effect at 4 p.m. Eastern time on the day that the value of the security is determined. Over-the-counter (OTC) securities are valued within the range of the most recent quoted bid and ask prices.
Securities that trade in multiple markets or on multiple exchanges are valued according to the broadest and most representative market. Certain equity securities are valued based upon fundamental characteristics or relationships to similar securities.
Debt securities generally trade in the OTC market rather than on a securities exchange. The Fund’s pricing services use multiple valuation techniques to determine fair value. In instances where sufficient market activity exists, the pricing services may utilize a market-based approach through which quotes from market makers are used to determine fair value. In instances where sufficient market activity may not exist or is limited, the pricing services also utilize proprietary valuation models which may consider market characteristics such as benchmark yield curves, credit spreads, estimated default rates, anticipated market interest rate volatility, coupon rates, anticipated timing of principal repayments, underlying collateral, and other unique security features in order to estimate the relevant cash flows, which are then discounted to calculate the fair value.
Certain derivative financial instruments trade in the OTC market. The Fund’s pricing services use various techniques including industry standard option pricing models and proprietary discounted cash flow models to determine the fair value of those instruments. The Fund’s net benefit or obligation under the derivative contract, as measured by the fair value of the contract, is included in net assets.
The Fund has procedures to determine the fair value of financial instruments for which market prices are not reliable or readily available. Under these procedures, the VC convenes on a regular basis to review such financial instruments and considers a number of factors, including significant unobservable valuation inputs, when arriving at fair value. The VC primarily employs a market-based approach which may use related or comparable assets or liabilities, recent transactions, market multiples, book values, and other relevant information for the investment to determine the fair value of the investment. An income-based valuation approach may also be used in which the anticipated future cash flows of the investment are discounted to calculate fair value. Discounts may also be applied due to the nature or duration of any restrictions on the disposition of the investments. Due to the inherent uncertainty of valuations of such investments, the fair values may differ significantly from the values that would have been used had an active market existed. The VC employs various methods for calibrating these
franklintempleton.com |
Semiannual Report |
25 |
F R A N K L I N M U T U A L F I N A N C I A L S E R V I C E S F U N D
N O T E S T O F I N A N C I A L S T A T E M E N T S ( U N A U D I T E D )
1. Organization and Significant Accounting Policies (continued)
a. Financial Instrument Valuation (continued)
valuation approaches including a regular review of key inputs and assumptions, transactional back-testing or disposition analysis, and reviews of any related market activity.
Trading in securities on foreign securities stock exchanges and OTC markets may be completed before 4 p.m. Eastern time. In addition, trading in certain foreign markets may not take place on every Fund’s business day. Occasionally, events occur between the time at which trading in a foreign security is completed and 4 p.m. Eastern time that might call into question the reliability of the value of a portfolio security held by the Fund. As a result, differences may arise between the value of the Fund’s portfolio securities as determined at the foreign market close and the latest indications of value at 4 p.m. Eastern time. In order to minimize the potential for these differences, the VC monitors price movements following the close of trading in foreign stock markets through a series of country specific market proxies (such as baskets of American Depositary Receipts, futures contracts and exchange traded funds). These price movements are measured against established trigger thresholds for each specific market proxy to assist in determining if an event has occurred that may call into question the reliability of the values of the foreign securities held by the Fund. If such an event occurs, the securities may be valued using fair value procedures, which may include the use of independent pricing services.
When the last day of the reporting period is a non-business day, certain foreign markets may be open on those days that the Fund’s NAV is not calculated, which could result in differences between the value of the Fund’s portfolio securities on the last business day and the last calendar day of the reporting period. Any significant security valuation changes due to an open foreign market are adjusted and reflected by the Fund for financial reporting purposes.
b. Foreign Currency Translation
Portfolio securities and other assets and liabilities denominated in foreign currencies are translated into U.S. dollars based on the exchange rate of such currencies against U.S. dollars on the date of valuation. The Fund may enter into foreign currency exchange contracts to facilitate transactions denominated in a foreign currency. Purchases and sales of securities, income and expense
items denominated in foreign currencies are translated into U.S. dollars at the exchange rate in effect on the transaction date. Portfolio securities and assets and liabilities denominated in foreign currencies contain risks that those currencies will decline in value relative to the U.S. dollar. Occasionally, events may impact the availability or reliability of foreign exchange rates used to convert the U.S. dollar equivalent value. If such an event occurs, the foreign exchange rate will be valued at fair value using procedures established and approved by the Board.
The Fund does not separately report the effect of changes in foreign exchange rates from changes in market prices on securities held. Such changes are included in net realized and unrealized gain or loss from investments in the Statement of Operations.
Realized foreign exchange gains or losses arise from sales of foreign currencies, currency gains or losses realized between the trade and settlement dates on securities transactions and the difference between the recorded amounts of dividends, interest, and foreign withholding taxes and the U.S. dollar equivalent of the amounts actually received or paid. Net unrealized foreign exchange gains and losses arise from changes in foreign exchange rates on foreign denominated assets and liabilities other than investments in securities held at the end of the reporting period.
c. Derivative Financial Instruments
The Fund invested in derivative financial instruments in order to manage risk or gain exposure to various other investments or markets. Derivatives are financial contracts based on an underlying or notional amount, require no initial investment or an initial net investment that is smaller than would normally be required to have a similar response to changes in market factors, and require or permit net settlement. Derivatives contain various risks including the potential inability of the counterparty to fulfill their obligations under the terms of the contract, the potential for an illiquid secondary market, and/or the potential for market movements which expose the Fund to gains or losses in excess of the amounts shown in the Statement of Assets and Liabilities. Realized gain and loss and unrealized appreciation and depreciation on these contracts for the period are included in the Statement of Operations.
Derivative counterparty credit risk is managed through a formal evaluation of the creditworthiness of all potential counter-parties. The Fund attempts to reduce its exposure to
26 |
Semiannual Report |
franklintempleton.com |
F R A N K L I N M U T U A L F I N A N C I A L S E R V I C E S F U N D
N O T E S T O F I N A N C I A L S T A T E M E N T S ( U N A U D I T E D )
counterparty credit risk on OTC derivatives, whenever possible, by entering into International Swaps and Derivatives Association (ISDA) master agreements with certain counterparties. These agreements contain various provisions, including but not limited to collateral requirements, events of default, or early termination. Termination events applicable to the counterparty include certain deteriorations in the credit quality of the counterparty. Termination events applicable to the Fund include failure of the Fund to maintain certain net asset levels and/or limit the decline in net assets over various periods of time. In the event of default or early termination, the ISDA master agreement gives the non-defaulting party the right to net and close-out all transactions traded, whether or not arising under the ISDA agreement, to one net amount payable by one counterparty to the other. However, absent an event of default or early termination, OTC derivative assets and liabilities are presented gross and not offset in the Statement of Assets and Liabilities. Early termination by the counterparty may result in an immediate payment by the Fund of any net liability owed to that counterparty under the ISDA agreement.
Collateral requirements differ by type of derivative. Collateral or initial margin requirements are set by the broker or exchange clearing house for exchange traded and centrally cleared derivatives. Initial margin deposited is held at the exchange and can be in the form of cash and/or securities. For OTC derivatives traded under an ISDA master agreement, posting of collateral is required by either the Fund or the applicable counterparty if the total net exposure of all OTC derivatives with the applicable counterparty exceeds the minimum transfer amount, which typically ranges from $100,000 to $250,000, and can vary depending on the counterparty and the type of the agreement. Generally, collateral is determined at the close of Fund business each day and any additional collateral required due to changes in derivative values may be delivered by the Fund or the counterparty the next business day, or within a few business days. Collateral pledged and/or received by the Fund for OTC derivatives, if any, is held in segregated accounts with the Fund’s custodian/counterparty broker and can be in the form of cash and/or securities. Unrestricted cash may be invested according to the Fund’s investment objectives. To the extent that the amounts due to the Fund from its counterparties are not subject to collateralization or are not fully collateralized, the Fund bears the risk of loss from counterparty non-performance.
The Fund entered into exchange traded futures contracts primarily to manage exposure to certain foreign currencies. A futures contract is an agreement between the Fund and a counterparty to buy or sell an asset at a specified price on a future date. Required initial margins are pledged by the Fund, and the daily change in fair value is accounted for as a variation margin payable or receivable in the Statement of Assets and Liabilities.
The Fund entered into OTC forward exchange contracts primarily to manage exposure to certain foreign currencies. A forward exchange contract is an agreement between the Fund and a counterparty to buy or sell a foreign currency at a specific exchange rate on a future date.
The Fund purchased or wrote OTC option contracts primarily to manage exposure to foreign exchange rate risk. An option is a contract entitling the holder to purchase or sell a specific amount of shares or units of an asset or notional amount of a swap (swaption), at a specified price. When an option is purchased or written, an amount equal to the premium paid or received is recorded as an asset or liability, respectively. Upon exercise of an option, the acquisition cost or sales proceeds of the underlying investment is adjusted by any premium received or paid. Upon expiration of an option, any premium received or paid is recorded as a realized gain or loss. Upon closing an option other than through expiration or exercise, the difference between the premium received or paid and the cost to close the position is recorded as a realized gain or loss.
See Note 10 regarding other derivative information.
d. Securities Lending
The Fund participates in an agency based securities lending program to earn additional income. The Fund receives cash collateral against the loaned securities in an amount equal to at least 102% of the fair value of the loaned securities. Collateral is maintained over the life of the loan in an amount not less than 100% of the fair value of loaned securities, as determined at the close of Fund business each day; any additional collateral required due to changes in security values is delivered to the Fund on the next business day. The collateral is deposited into a joint cash account with other funds and is used to invest in a money market fund managed by Franklin Advisers, Inc., an affiliate of the Fund, and/or a joint repurchase agreement. The Fund may receive income from the investment of cash collateral, in addition to lending fees and rebates paid by the
franklintempleton.com |
Semiannual Report |
27 |
F R A N K L I N M U T U A L F I N A N C I A L S E R V I C E S F U N D
N O T E S T O F I N A N C I A L S T A T E M E N T S ( U N A U D I T E D )
1. Organization and Significant Accounting Policies (continued)
d. Securities Lending (continued)
borrower. Income from securities loaned, net of fees paid to the securities lending agent and/or third-party vendor, is reported separately in the Statement of Operations, if any. The Fund bears the market risk with respect to the collateral investment, securities loaned, and the risk that the agent may default on its obligations to the Fund. If the borrower defaults on its obligation to return the securities loaned, the Fund has the right to repurchase the securities in the open market using the collateral received. The securities lending agent has agreed to indemnify the Fund in the event of default by a third party borrower. At June 30, 2017, the Fund had no securities on loan.
e. Income and Deferred Taxes
It is the Fund’s policy to qualify as a regulated investment company under the Internal Revenue Code. The Fund intends to distribute to shareholders substantially all of its taxable income and net realized gains to relieve it from federal income and excise taxes. As a result, no provision for U.S. federal income taxes is required.
The Fund may be subject to foreign taxation related to income received, capital gains on the sale of securities and certain foreign currency transactions in the foreign jurisdictions in which it invests. Foreign taxes, if any, are recorded based on the tax regulations and rates that exist in the foreign markets in which the Fund invests. When a capital gain tax is determined to apply, the Fund records an estimated deferred tax liability in an amount that would be payable if the securities were disposed of on the valuation date. As a result of several court cases, in certain countries across the European Union, the Fund filed additional tax reclaims for previously withheld taxes on dividends earned in those countries (EU reclaims). These additional filings are subject to various administrative proceedings by the local jurisdictions’ tax authorities within the European Union, as well as a number of related judicial proceedings. Income recognized, if any, for EU reclaims is reflected as other income in the Statement of Operations and any related receivable, if any, is reflected as European Union tax reclaims in the Statement of Assets and Liabilities. When uncertainty exists as to the ultimate resolution of these proceedings, the likelihood of receipt of these EU reclaims, and the potential timing of payment, no amounts are reflected in the financial statements. For U.S. income tax purposes, EU reclaims received by the Fund, if any, reduce the
amounts of foreign taxes Fund shareholders can use as tax credits in their individual income tax returns.
The Fund may recognize an income tax liability related to its uncertain tax positions under U.S. GAAP when the uncertain tax position has a less than 50% probability that it will be sustained upon examination by the tax authorities based on its technical merits. As of June 30, 2017, the Fund has determined that no tax liability is required in its financial statements related to uncertain tax positions for any open tax years (or expected to be taken in future tax years). Open tax years are those that remain subject to examination and are based on each tax jurisdiction’s statute of limitation.
f. Security Transactions, Investment Income, Expenses and Distributions
Security transactions are accounted for on trade date. Realized gains and losses on security transactions are determined on a specific identification basis. Interest income and estimated expenses are accrued daily. Amortization of premium and accretion of discount on debt securities are included in interest income. Dividend income is recorded on the ex-dividend date except for certain dividends from securities where the dividend rate is not available. In such cases, the dividend is recorded as soon as the information is received by the Fund. Distributions to shareholders are recorded on the ex-dividend date. Distributable earnings are determined according to income tax regulations (tax basis) and may differ from earnings recorded in accordance with U.S. GAAP. These differences may be permanent or temporary. Permanent differences are reclassified among capital accounts to reflect their tax character. These reclassifications have no impact on net assets or the results of operations. Temporary differences are not reclassified, as they may reverse in subsequent periods.
Common expenses incurred by the Trust are allocated among the Funds based on the ratio of net assets of each Fund to the combined net assets of the Trust. Fund specific expenses are charged directly to the Fund that incurred the expense.
Realized and unrealized gains and losses and net investment income, not including class specific expenses, are allocated daily to each class of shares based upon the relative proportion of net assets of each class. Differences in per share distributions, by class, are generally due to differences in class specific expenses.
28 |
Semiannual Report |
franklintempleton.com |
F R A N K L I N M U T U A L F I N A N C I A L S E R V I C E S F U N D
N O T E S T O F I N A N C I A L S T A T E M E N T S ( U N A U D I T E D )
g. Accounting Estimates
The preparation of financial statements in accordance with U.S. GAAP requires management to make estimates and assumptions that affect the reported amounts of assets and liabilities at the date of the financial statements and the amounts of income and expenses during the reporting period. Actual results could differ from those estimates.
h. Guarantees and Indemnifications
Under the Trust’s organizational documents, its officers and trustees are indemnified by the Trust against certain liabilities arising out of the performance of their duties to the Trust.
Additionally, in the normal course of business, the Trust, on behalf of the Fund, enters into contracts with service providers that contain general indemnification clauses. The Trust’s maximum exposure under these arrangements is unknown as this would involve future claims that may be made against the Trust that have not yet occurred. Currently, the Trust expects the risk of loss to be remote.
2. Shares of Beneficial Interest
At June 30, 2017, there were an unlimited number of shares authorized (without par value). Transactions in the Fund’s shares were as follows:
Six Months Ended June 30, 2017 | Year Ended December 31, 2016 | |||||||||||||||
|
| |||||||||||||||
Shares |
Amount |
Shares |
Amount | |||||||||||||
| ||||||||||||||||
Class Z Shares: | ||||||||||||||||
Shares sold | 1,668,545 | $ | 36,831,975 | 1,862,217 | $ | 35,847,321 | ||||||||||
Shares issued in reinvestment of distributions | — | — | 90,302 | 1,927,186 | ||||||||||||
Shares redeemed | (721,752 | ) | (15,898,770 | ) | (3,510,389 | ) | (64,076,980) | |||||||||
|
| |||||||||||||||
Net increase (decrease) |
|
946,793 |
|
$ |
20,933,205 |
|
|
(1,557,870 |
) |
$ |
(26,302,473) |
| ||||
|
| |||||||||||||||
Class A Shares: | ||||||||||||||||
Shares sold | 2,216,570 | $ | 49,019,253 | 5,020,628 | $ | 98,395,643 | ||||||||||
Shares issued in reinvestment of distributions | — | — | 170,054 | 3,626,102 | ||||||||||||
Shares redeemed | (2,963,025 | ) | (65,576,707 | ) | (7,543,324 | ) | (140,331,898) | |||||||||
|
| |||||||||||||||
Net increase (decrease) |
|
(746,455 |
) |
$ |
(16,557,454 |
) |
|
(2,352,642 |
) |
$ |
(38,310,153) |
| ||||
|
| |||||||||||||||
Class C Shares: | ||||||||||||||||
Shares sold | 627,159 | $ | 13,769,958 | 1,138,253 | $ | 22,312,026 | ||||||||||
Shares issued in reinvestment of distributions | — | — | 25,584 | 520,576 | ||||||||||||
Shares redeemed | (905,668 | ) | (19,921,396 | ) | (1,982,746 | ) | (37,247,937) | |||||||||
|
| |||||||||||||||
Net increase (decrease) |
|
(278,509 |
) |
$ |
(6,151,438 |
) |
|
(818,909 |
) |
$ |
(14,415,335) |
| ||||
|
| |||||||||||||||
Class R6 Shares: | ||||||||||||||||
Shares sold | 63,631 | $ | 1,419,599 | 72,872 | $ | 1,425,313 | ||||||||||
Shares issued in reinvestment of distributions | — | — | 1,726 | 37,208 | ||||||||||||
Shares redeemed | (22,116 | ) | (493,679 | ) | (27,167 | ) | (509,156) | |||||||||
|
| |||||||||||||||
Net increase (decrease) |
|
41,515 |
|
$ |
925,920 |
|
|
47,431 |
|
$ |
953,365 |
| ||||
|
| |||||||||||||||
franklintempleton.com |
Semiannual Report |
29 |
F R A N K L I N M U T U A L F I N A N C I A L S E R V I C E S F U N D
N O T E S T O F I N A N C I A L S T A T E M E N T S ( U N A U D I T E D )
3. Transactions with Affiliates
Franklin Resources, Inc. is the holding company for various subsidiaries that together are referred to as Franklin Templeton Investments. Certain officers and trustees of the Fund are also officers and/or directors of the following subsidiaries:
| Subsidiary | Affiliation | |
| ||
Franklin Mutual Advisers, LLC (Franklin Mutual) |
Investment manager | |
Franklin Templeton Services, LLC (FT Services) |
Administrative manager | |
Franklin Templeton Distributors, Inc. (Distributors) |
Principal underwriter | |
Franklin Templeton Investor Services, LLC (Investor Services) |
Transfer agent | |
a. Management Fees
The Fund pays an investment management fee to Franklin Mutual based on the average daily net assets of the Fund as follows:
| Annualized Fee Rate | Net Assets | |
| ||
0.875% |
Up to and including $1 billion | |
0.845% |
Over $1 billion, up to and including $2 billion | |
0.825% |
Over $2 billion, up to and including $5 billion | |
0.805% |
In excess of $5 billion | |
For the period ended June 30, 2017, the annualized effective investment management fee rate was 0.875% of the Fund’s average daily net assets.
b. Administrative Fees
Under an agreement with Franklin Mutual, FT Services provides administrative services to the Fund. The fee is paid by Franklin Mutual based on the Fund’s average daily net assets, and is not an additional expense of the Fund.
c. Distribution Fees
The Board has adopted distribution plans for each share class, with the exception of Class Z and Class R6 shares, pursuant to Rule 12b-1 under the 1940 Act. Under the Fund’s Class A reimbursement distribution plan, the Fund reimburses Distributors for costs incurred in connection with the servicing, sale and distribution of the Fund’s shares up to the maximum annual plan rate. Under the Class A reimbursement distribution plan, costs exceeding the maximum for the current plan year cannot be reimbursed in subsequent periods. In addition, under the Fund’s Class C compensation distribution plan, the Fund pays Distributors for costs incurred in connection with the servicing, sale and distribution of the Fund’s shares up to the maximum annual plan rate. The plan year, for purposes of monitoring compliance with the maximum annual plan rates, is February 1 through January 31.
The maximum annual plan rates, based on the average daily net assets, for each class, are as follows:
Class A | 0.35 | % | ||
Class C | 1.00 | % |
The Board has set the current rate at 0.25% per year for Class A shares until further notice and approval by the Board.
30 |
Semiannual Report |
franklintempleton.com |
F R A N K L I N M U T U A L F I N A N C I A L S E R V I C E S F U N D
N O T E S T O F I N A N C I A L S T A T E M E N T S ( U N A U D I T E D )
d. Sales Charges/Underwriting Agreements
Front-end sales charges and contingent deferred sales charges (CDSC) do not represent expenses of the Fund. These charges are deducted from the proceeds of sales of Fund shares prior to investment or from redemption proceeds prior to remittance, as applicable. Distributors has advised the Fund of the following commission transactions related to the sales and redemptions of the Fund’s shares for the period:
Sales charges retained net of commissions paid to | $ | 90,488 | ||
CDSC retained | $ | 9,366 | ||
e. Transfer Agent Fees
Each class of shares, except for Class R6, pays transfer agent fees to Investor Services for its performance of shareholder servicing obligations and reimburses Investor Services for out of pocket expenses incurred, including shareholder servicing fees paid to third parties. These fees are allocated daily based upon their relative proportion of such classes’ aggregate net assets. Class R6 pays Investor Services transfer agent fees specific to that class.
For the period ended June 30, 2017, the Fund paid transfer agent fees of $500,802, of which $233,787 was retained by Investor Services.
f. Waiver and Expense Reimbursements
Investor Services has voluntarily agreed in advance to waive or limit its fees so that the Class R6 transfer agent fees do not exceed 0.01%. Investor Services may discontinue this waiver in the future.
4. Expense Offset Arrangement
The Fund has entered into an arrangement with its custodian whereby credits realized as a result of uninvested cash balances are used to reduce a portion of the Fund’s custodian expenses. During the period ended June 30, 2017, the custodian fees were reduced as noted in the Statement of Operations.
5. Independent Trustees’ Retirement Plan
On January 1, 1993, the Trust adopted an Independent Trustees’ Retirement Plan (Plan). The Plan is an unfunded defined benefit plan that provides benefit payments to Trustees whose length of service and retirement age meets the eligibility requirements of the Plan. Benefits under the Plan are based on years of service and fees paid to each trustee at the time of retirement. Effective in December 1996, the Plan was closed to new participants.
During the period ended June 30, 2017, the Fund’s projected benefit obligation and benefit payments under the Plan were as follows:
aProjected benefit obligation at June 30, 2017 | $ | 23,863 | ||
bIncrease in projected benefit obligation | $ | 172 | ||
Benefit payments made to retired trustees | $ | (318 | ) | |
aThe projected benefit obligation is included in trustees’ fees and expenses in the Statement of Assets and Liabilities.
bThe increase in projected benefit obligation is included in trustees’ fees and expenses in the Statement of Operations.
franklintempleton.com |
Semiannual Report |
31 |
F R A N K L I N M U T U A L F I N A N C I A L S E R V I C E S F U N D
N O T E S T O F I N A N C I A L S T A T E M E N T S ( U N A U D I T E D )
6. Income Taxes
For tax purposes, capital losses may be carried over to offset future capital gains. Capital loss carryforwards with no expiration, if any, must be fully utilized before those losses with expiration dates.
At December 31, 2016, capital loss carryforwards were as follows:
Capital loss carryforwards subject to expiration: | ||||
2017 | $57,846,857 | |||
2018 | 31,091,133 | |||
|
| |||
Total capital loss carryforwards |
|
$88,937,990 |
| |
|
|
At June 30, 2017, the cost of investments and net unrealized appreciation (depreciation) for income tax purposes were as follows:
Cost of investments | $592,662,497 | |||
|
| |||
Unrealized appreciation | $122,466,166 | |||
Unrealized depreciation | (37,530,780) | |||
|
| |||
Net unrealized appreciation (depreciation) | $ 84,935,386 | |||
|
| |||
Differences between income and/or capital gains as determined on a book basis and a tax basis are primarily due to differing treatment of foreign currency transactions.
7. Investment Transactions
Purchases and sales of investments (excluding short term securities) for the period ended June 30, 2017, aggregated $203,885,328 and $165,554,804, respectively.
8. Concentration of Risk
Investing in foreign securities may include certain risks and considerations not typically associated with investing in U.S. securities, such as fluctuating currency values and changing local and regional economic, political and social conditions, which may result in greater market volatility. In addition, certain foreign securities may not be as liquid as U.S. securities.
9. Restricted Securities
The Fund invests in securities that are restricted under the Securities Act of 1933 (1933 Act) or which are subject to legal, contractual, or other agreed upon restrictions on resale. Restricted securities are often purchased in private placement transactions, and cannot be sold without prior registration unless the sale is pursuant to an exemption under the 1933 Act. Disposal of these securities may require greater effort and expense, and prompt sale at an acceptable price may be difficult. The Fund may have registration rights for restricted securities. The issuer generally incurs all registration costs.
At June 30, 2017, investments in restricted securities, excluding certain securities exempt from registration under the 1933 Act deemed to be liquid, were as follows:
32 |
Semiannual Report |
franklintempleton.com |
F R A N K L I N M U T U A L F I N A N C I A L S E R V I C E S F U N D
N O T E S T O F I N A N C I A L S T A T E M E N T S ( U N A U D I T E D )
| Shares/ Units | Issuer | Acquisition Date | Cost | Value | ||||||||||||
|
| |||||||||||||||
| 4,357,178 | FIM Coinvestor Holdings I, LLC | 11/20/06 - 6/02/09 | $ | — | $ | — | ||||||||||
| 1,815,233 | Hightower Holding LLC, B, Series I | 3/31/08 - 1/05/10 | 2,362,324 | 3,175,206 | ||||||||||||
| 791,396 | Hightower Holding LLC, B, Series II | 6/10/10 - 5/10/12 | 2,420,000 | 2,466,149 | ||||||||||||
|
| |||||||||||||||
Total Restricted Securities (Value is 0.8% of Net Assets) |
$ |
4,782,324 |
|
$ |
5,641,355 |
| ||||||||||
|
| |||||||||||||||
10. Other Derivative Information
At June 30, 2017, the Fund’s investments in derivative contracts are reflected in the Statement of Assets and Liabilities as follows:
| Asset Derivatives | Liability Derivatives | |||||||||||
| ||||||||||||
Derivative Contracts Not Accounted for as Hedging Instruments | Statement of Assets and Liabilities Location | Fair Value | Statement of Assets and Liabilities Location | Fair Value | ||||||||
| ||||||||||||
Foreign exchange contracts | Investments in securities, at value | $ 8 | a | |||||||||
| Variation margin | $ 686,229 | b | ||||||||||
Unrealized appreciation on OTC forward exchange contracts | 653,883 | Unrealized depreciation on OTC forward exchange contracts | 6,525,789 | |||||||||
|
|
|
| |||||||||
Totals |
|
$653,891 |
|
|
$7,212,018 |
| ||||||
|
|
|
| |||||||||
aPurchased option contracts are included in investments in securities, at value in the Statement of Assets and Liabilities.
bThis amount reflects the cumulative appreciation (depreciation) of futures contracts as reported in the Statement of Investments. Only the variation margin receivable/ payable at period end is separately reported within the Statement of Assets and Liabilities. Prior variation margin movements were recorded to cash upon receipt or payment.
For the period ended June 30, 2017, the effect of derivative contracts in the Fund’s Statement of Operations was as follows:
Derivative Contracts Not Accounted for as Hedging Instruments | Statement of Operations Location | Net Realized Gain (Loss) for the Period | Statement of Operations Location | Net Change in Unrealized Appreciation (Depreciation) for the Period | ||||||||
| ||||||||||||
Foreign exchange contracts | Net realized gain (loss) from: | Net change in unrealized appreciation (depreciation) on: Investments | $ | (85,860) | a | |||||||
| Foreign currency transactions | $ | 2,177,393b | Translation of other assets and liabilities denominated in foreign currencies | (12,619,687) | b | |||||||
| Futures contracts | (1,076,059) | Futures contracts | (1,010,993) | |||||||||
|
|
|
| |||||||||
Totals |
$ |
1,101,334 |
|
$ |
(13,716,540) |
| ||||||
|
|
|
| |||||||||
aPurchased option contracts are included in net change in unrealized appreciation (depreciation) on investments in the Statement of Operations.
bForward exchange contracts are included in net realized gain (loss) from foreign currency transactions and net change in unrealized appreciation (depreciation) on translation of other assets and liabilities denominated in foreign currencies in the Statement of Operations.
For the period ended June 30, 2017, the average month end notional amount of futures contracts and options represented $32,088,171 and $8,094,000, respectively. The average month end contract value of forward exchange contracts was $197,253,976.
franklintempleton.com |
Semiannual Report |
33 |
F R A N K L I N M U T U A L F I N A N C I A L S E R V I C E S F U N D
N O T E S T O F I N A N C I A L S T A T E M E N T S ( U N A U D I T E D )
10. Other Derivative Information (continued)
At June 30, 2017, the Fund’s OTC derivative assets and liabilities are as follows:
Gross Amounts of Assets and Liabilities Presented | ||||||||
|
| |||||||
Assetsa |
Liabilitiesa | |||||||
| ||||||||
Derivatives | ||||||||
Forward exchange contracts | $653,883 | $6,525,789 | ||||||
Options purchased | 8 | — | ||||||
|
| |||||||
Total |
|
$653,891 |
|
|
$6,525,789 |
| ||
|
| |||||||
aAbsent an event of default or early termination, OTC derivative assets and liabilities are presented gross and not offset in the Statement of Assets and Liabilities.
At June 30, 2017, the Fund’s OTC derivative assets, which may be offset against the Fund’s OTC derivative liabilities and collateral received from the counterparty, are as follows:
Amounts Not Offset in the Statement of Assets and Liabilities | ||||||||||||||||||||
|
| |||||||||||||||||||
Gross Amounts of | Financial Instruments Available for Offset | Financial Instruments Collateral Received | Cash Collateral Received | Net Amount (Not less than zero) | ||||||||||||||||
| ||||||||||||||||||||
Counterparty | ||||||||||||||||||||
BOFA | $ 13,155 | $ (13,155 | ) | $ — | $ — | $ — | ||||||||||||||
BONY | 18,663 | (18,663 | ) | — | — | — | ||||||||||||||
FBCO | — | — | — | — | — | |||||||||||||||
HSBK | 37,926 | (37,926 | ) | — | — | — | ||||||||||||||
SSBT | 14,276 | (14,276 | ) | — | — | — | ||||||||||||||
UBSW | 569,871 | (569,871 | ) | — | — | — | ||||||||||||||
|
| |||||||||||||||||||
Total |
|
$653,891 |
|
|
$(653,891 |
) |
|
$ — |
|
|
$ — |
|
|
$ — |
| |||||
|
| |||||||||||||||||||
At June 30, 2017, the Fund’s OTC derivative liabilities, which may be offset against the Fund’s OTC derivative assets and collateral pledged to the counterparty, are as follows:
Amounts Not Offset in the Statement of Assets and Liabilities | ||||||||||||||||||||
|
| |||||||||||||||||||
| Gross Amounts of Liabilities Presented in the Statement of Assets and Liabilities | Financial Instruments Available for Offset | Financial Instruments Collateral Pledgedb,c | Cash Collateral Pledged | Net Amount (Not less than zero) | ||||||||||||||||
| ||||||||||||||||||||
Counterparty | ||||||||||||||||||||
BOFA | $1,262,438 | $ (13,155 | ) | $(1,249,283 | ) | $ — | $ — | |||||||||||||
BONY | 928,673 | (18,663 | ) | (648,007 | ) | — | 262,003 | |||||||||||||
FBCO | 294,883 | — | (229,744 | ) | — | 65,139 | ||||||||||||||
HSBK | 1,712,261 | (37,926 | ) | (1,315,834 | ) | — | 358,501 | |||||||||||||
SSBT | 1,174,355 | (14,276 | ) | (845,058 | ) | — | 315,021 | |||||||||||||
UBSW | 1,153,179 | (569,871 | ) | (548,388 | ) | — | 34,920 | |||||||||||||
|
| |||||||||||||||||||
Total |
|
$6,525,789 |
|
|
$(653,891 |
) |
|
$(4,836,314 |
) |
|
$ — |
|
|
$1,035,584 |
| |||||
|
| |||||||||||||||||||
bIn some instances, the collateral amounts disclosed in the table above were adjusted due to the requirement to limit collateral amounts to avoid the effect of overcollateralization. Actual collateral received and/or pledged may be more than the amounts disclosed herein.
cSee the accompanying Statement of Investments for securities pledged as collateral for derivatives.
See Note 1(c) regarding derivative financial instruments.
34 |
Semiannual Report |
franklintempleton.com |
F R A N K L I N M U T U A L F I N A N C I A L S E R V I C E S F U N D
N O T E S T O F I N A N C I A L S T A T E M E N T S ( U N A U D I T E D )
See Abbreviations on page 38.
11. Holdings of 5% Voting Securities of Portfolio Companies
The 1940 Act defines “affiliated companies” to include investments in portfolio companies in which a fund owns 5% or more of the outstanding voting securities. During the period ended June 30, 2017, investments in “affiliated companies” were as follows:
| Name of Issuer | Number of Shares Held at Beginning of Period | Gross Additions | Gross Reductions | Number of Shares Held at End of Period | Value at End of Period | Investment Income | Realized Gain (Loss) | |||||||||||||||||||||
| ||||||||||||||||||||||||||||
Non-Controlled Affiliates | ||||||||||||||||||||||||||||
AB&T Financial Corp. (Value is —%a of Net Assets) | 226,100 | — | — | 226,100 | $192,185 | $ — | $ — | |||||||||||||||||||||
|
| |||||||||||||||||||||||||||
aRounds to less than 0.1% of net assets.
12. Credit Facility
The Fund, together with other U.S. registered and foreign investment funds (collectively, Borrowers), managed by Franklin Templeton Investments, are borrowers in a joint syndicated senior unsecured credit facility totaling $2 billion (Global Credit Facility) which matures on February 9, 2018. This Global Credit Facility provides a source of funds to the Borrowers for temporary and emergency purposes, including the ability to meet future unanticipated or unusually large redemption requests.
Under the terms of the Global Credit Facility, the Fund shall, in addition to interest charged on any borrowings made by the Fund and other costs incurred by the Fund, pay its share of fees and expenses incurred in connection with the implementation and maintenance of the Global Credit Facility, based upon its relative share of the aggregate net assets of all of the Borrowers, including an annual commitment fee of 0.15% based upon the unused portion of the Global Credit Facility. These fees are reflected in other expenses in the Statement of Operations. During the period ended June 30, 2017, the Fund did not use the Global Credit Facility.
13. Fair Value Measurements
The Fund follows a fair value hierarchy that distinguishes between market data obtained from independent sources (observable inputs) and the Fund’s own market assumptions (unobservable inputs). These inputs are used in determining the value of the Fund’s financial instruments and are summarized in the following fair value hierarchy:
| • | Level 1 – quoted prices in active markets for identical financial instruments |
| • | Level 2 – other significant observable inputs (including quoted prices for similar financial instruments, interest rates, prepayment speed, credit risk, etc.) |
| • | Level 3 – significant unobservable inputs (including the Fund’s own assumptions in determining the fair value of financial instruments) |
The input levels are not necessarily an indication of the risk or liquidity associated with financial instruments at that level.
For movements between the levels within the fair value hierarchy, the Fund has adopted a policy of recognizing the transfers as of the date of the underlying event which caused the movement.
franklintempleton.com |
Semiannual Report |
35 |
F R A N K L I N M U T U A L F I N A N C I A L S E R V I C E S F U N D
N O T E S T O F I N A N C I A L S T A T E M E N T S ( U N A U D I T E D )
13. Fair Value Measurements (continued)
A summary of inputs used as of June 30, 2017, in valuing the Fund’s assets and liabilities carried at fair value, is as follows:
| Level 1 | Level 2 | Level 3 | Total | |||||||||||||
| ||||||||||||||||
Assets: | ||||||||||||||||
Investments in Securities: | ||||||||||||||||
Equity Investments:a | ||||||||||||||||
Diversified Financial Services | $ | 38,415,661 | $ | — | $ | 5,641,355 | $ | 44,057,016 | ||||||||
All Other Equity Investmentsb | 597,326,173 | — | — | 597,326,173 | ||||||||||||
Companies in Liquidation | — | 172,407 | —c | 172,407 | ||||||||||||
Options Purchased | — | 8 | — | 8 | ||||||||||||
Short Term Investments | 29,542,279 | 6,500,000 | — | 36,042,279 | ||||||||||||
|
| |||||||||||||||
Total Investments in Securities | $ | 665,284,113 | $ | 6,672,415 | $ | 5,641,355 | $ | 677,597,883 | ||||||||
|
| |||||||||||||||
Other Financial Instruments: | ||||||||||||||||
Forward Exchange Contracts | $ | — | $ | 653,883 | $ | — | $ | 653,883 | ||||||||
|
| |||||||||||||||
Liabilities: | ||||||||||||||||
Other Financial Instruments: | ||||||||||||||||
Futures Contracts | $ | 686,229 | $ | — | $ | — | $ | 686,229 | ||||||||
Forward Exchange Contracts | — | 6,525,789 | — | 6,525,789 | ||||||||||||
|
| |||||||||||||||
Total Other Financial Instruments | $ | 686,229 | $ | 6,525,789 | $ | — | $ | 7,212,018 | ||||||||
|
| |||||||||||||||
aIncludes common stocks as well as other equity investments.
bFor detailed categories, see the accompanying Statement of Investments.
cIncludes securities determined to have no value at June 30, 2017.
A reconciliation of assets in which Level 3 inputs are used in determining fair value is presented when there are significant Level 3 financial instruments at the end of the period. At June 30, 2017, the reconciliation of assets, is as follows:
| Balance at Beginning of Period | Purchases (Sales) | Transfer Into (Out of) Level 3 | Cost Basis Adjustments | Net Realized Gain (Loss) | Net Unrealized Appreciation (Depreciation) | Balance at End of Period | Net Change in Unrealized Appreciation (Depreciation) on Assets Held at Period End | |||||||||||||||||||||||||
| ||||||||||||||||||||||||||||||||
Assets: | ||||||||||||||||||||||||||||||||
Investments in Securities: | ||||||||||||||||||||||||||||||||
Equity Investments: | ||||||||||||||||||||||||||||||||
Diversified Financial Services | $5,615,411 | $— | $— | $— | $— | $25,944 | $5,641,355 | $25,944 | ||||||||||||||||||||||||
|
| |||||||||||||||||||||||||||||||
36 |
Semiannual Report |
franklintempleton.com |
F R A N K L I N M U T U A L F I N A N C I A L S E R V I C E S F U N D
N O T E S T O F I N A N C I A L S T A T E M E N T S ( U N A U D I T E D )
Significant unobservable valuation inputs for material Level 3 financial instruments and impact to fair value as a result of changes in unobservable valuation inputs as of June 30, 2017, are as follows:
| Description | Fair Value at End of Period | Valuation Technique | Unobservable Inputs | Amount | Impact to Fair Value if Input Increasesa | |||||||||||||||
| ||||||||||||||||||||
| Assets: | ||||||||||||||||||||
Investments in Securities: | ||||||||||||||||||||
Equity Investments: | ||||||||||||||||||||
Diversified Financial Services | $5,641,355 | Market comparables | EV / Last 12 Months | 2.1x | Increaseb | |||||||||||||||
| Revenue multiple | ||||||||||||||||||||
| EV / Last 12 Months | 11.3x | Increaseb | ||||||||||||||||||
| EBITDA multiple | ||||||||||||||||||||
| EV / Forward 12 Months | 9.1x | Increaseb | ||||||||||||||||||
| EBITDA multiple | ||||||||||||||||||||
|
Discount for lack of |
| 7.9% | Decrease | ||||||||||||||||
|
| marketability
|
| ||||||||||||||||||
| ||||||||||||||||||||
aRepresents the directional change in the fair value of the Level 3 financial instruments that would result from a significant and reasonable increase in the corresponding input. A significant and reasonable decrease in the input would have the opposite effect. Significant impacts, if any, to fair value and/or net assets have been indicated.
bRepresents a significant impact to fair value but not net assets.
Abbreviations List
| EBITDA | Earnings before interest, taxes, depreciation and amortization | |
| EV | Enterprise value |
14. New Accounting Pronouncements
In March 2017, the Financial Accounting Standards Board issued Accounting Standards Update (ASU) No. 2017-08, Receivables—Nonrefundable Fees and Other Costs (Subtopic 310-20): Premium Amortization on Purchased Callable Debt Securities. The amendments in the ASU shorten the amortization period for certain callable debt securities, held at a premium, to be amortized to the earliest call date. The ASU does not require an accounting change for securities held at a discount; which continues to be amortized to maturity. The ASU is effective for fiscal years and interim periods within those fiscal years beginning after December 15, 2018. Management is currently evaluating the impact, if any, of applying this provision.
15. Investment Company Reporting Modernization
In October 2016, the U.S. Securities and Exchange Commission adopted new rules and amended existing rules (together, final rules) intended to modernize the reporting and disclosure of information by registered investment companies. In part, the final rules amend Regulation S-X and require standardized, enhanced disclosures about derivatives in investment company financial statements, as well as other amendments. The compliance date for the amendments to Regulation S-X is August 1, 2017. Management has reviewed the requirements and believes the adoption of the amendments to Regulation S-X will not have a material impact on the Fund’s financial statements and related disclosures.
16. Subsequent Events
The Fund has evaluated subsequent events through the issuance of the financial statements and determined that no events have occurred that require disclosure.
franklintempleton.com |
Semiannual Report |
37 |
F R A N K L I N M U T U A L F I N A N C I A L S E R V I C E S F U N D
N O T E S T O F I N A N C I A L S T A T E M E N T S ( U N A U D I T E D )
Abbreviations
| Counterparty | Currency | Selected Portfolio | ||||||
| ||||||||
| BOFA | Bank of America N.A. | EUR | Euro | FHLB Federal Home Loan Bank | ||||
| BONY | The Bank of New York Mellon Corp. | GBP | British Pound | |||||
| FBCO | Credit Suisse International | INR | Indian Rupee | |||||
| HSBK | HSBC Bank PLC | USD | United States Dollar | |||||
| SSBT | State Street Bank and Trust Co., N.A. | |||||||
| UBSW | UBS AG | |||||||
38 |
Semiannual Report |
franklintempleton.com |
F R A N K L I N M U T U A L S E R I E S F U N D S
F R A N K L I N M U T U A L F I N A N C I A L S E R V I C E S F U N D
Board Approval of Investment Management Agreements
FRANKLIN MUTUAL SERIES FUNDS
Franklin Mutual Financial Services Fund
(“Fund”)
The Board of Trustees (Board), including a majority of trustees that are not “interested persons” as such term is defined in section 2(a)(19) of the Investment Company Act of 1940 (hereinafter referred to as “independent trustees”), at an in-person meeting held on May 22, 2017, unanimously approved the renewal of the Fund’s investment management agreement. Prior to a meeting of all of the trustees for the purpose of considering such renewal, the independent trustees participated in two other meetings held in connection with the renewal process. Throughout the process, the independent trustees received assistance and advice from and met separately with independent counsel. The independent trustees met with and interviewed officers of the investment manager (including portfolio managers), the transfer agent and shareholder services group and the distributor. In approving the renewal of the investment management agreement for the Fund, the Board, including the independent trustees, determined that the investment management fee structure was fair and reasonable and that continuance of the agreement was in the best interests of the Fund and its shareholders.
In reaching their decision on the investment management agreement, the trustees took into account information furnished throughout the year at regular Board meetings, as well as information specifically requested and furnished for the renewal process, which culminated in the meetings referred to above for the specific purpose of considering such agreement. Information furnished throughout the year included, among others, reports on the Fund’s investment performance, expenses, portfolio composition, portfolio brokerage execution, client commission arrangements, derivatives, securities lending, asset segregation, portfolio turnover, Rule 12b-1 plan, distribution, shareholder servicing, legal and compliance matters, pricing of securities, sales and redemptions, and marketing support payments made to financial intermediaries, as well as a third-party survey of transfer agent fees charged to funds within the Franklin Templeton Investments (FTI) complex in comparison with those charged to other fund complexes deemed comparable. Also, related financial statements and other information about the scope and quality of services provided by the investment manager and its affiliates and enhancements to such services over the past year were
provided. In addition, the trustees received periodic reports throughout the year and during the renewal process relating to compliance with the Fund’s investment policies and restrictions. During the renewal process, the independent trustees considered the investment manager’s methods of operation within the Franklin Templeton group and its activities on behalf of other clients. The Board also noted that it received an annual report on all payments made by FTI or the Fund to financial intermediaries engaged in the sale of Fund shares, as well as a memorandum relating to third-party servicing arrangements in response to a Guidance Update from the U.S. Securities and Exchange Commission (SEC) relating to mutual fund distribution and sub-accounting fees.
The information obtained by the trustees during the renewal process also included a special report prepared by Broadridge Financial Solutions, Inc., an independent third-party analyst that utilizes data from Lipper, Inc. (“Lipper”), comparing the Fund’s investment performance and expenses with those of other mutual funds deemed comparable to the Fund as selected by Lipper (Broadridge Section 15(c) Report). The trustees reviewed the Broadridge Section 15(c) Report and its usefulness in the renewal process with respect to matters such as comparative fees, expenses, expense ratios, performance and volatility. They concluded that the report continues to be a reliable resource in the performance of their duties.
In addition, the trustees received a Profitability Study (Profitability Study) prepared by management discussing the profitability to FTI from its overall U.S. fund operations, as well as on an individual fund-by-fund basis. Over the past year, the Board and counsel to the independent trustees continued to receive reports on management’s handling of recent regulatory inquiries and pending legal actions against the investment manager and its affiliates. The independent trustees were satisfied with the actions taken to date by management in response to such regulatory and legal matters.
Particular attention was given to management’s diligent risk management program, including continual monitoring and management of cybersecurity, liquidity and counterparty credit risk, and attention given to derivatives and other complex instruments that are held and expected to be held by the Fund and how such instruments are used to carry out the Fund’s investment goal(s). The Board also took into account, among other things, management’s efforts in establishing a global credit facility for the benefit of the Fund and other accounts managed by FTI to provide a source of cash for temporary and emergency purposes or to meet unusual redemption requests as
franklintempleton.com |
Semiannual Report |
39 |
F R A N K L I N M U T U A L S E R I E S F U N D S
F R A N K L I N M U T U A L F I N A N C I A L S E R V I C E S F U N D
S H A R E H O L D E R I N F O R M A T I O N
well as the strong financial position of the investment manager’s parent company and its commitment to the mutual fund business. In addition, the Board received updates from management on the SEC’s progress in implementing the rule-making requirements established by the Dodd-Frank Wall Street Reform and Consumer Protection Act (Dodd-Frank Act), which was enacted July 21, 2010, and the investment manager’s compliance with rules and regulations already promulgated by the SEC under such act.
In addition to the above and other matters considered by the trustees throughout the course of the year, the following discussion relates to certain primary factors relevant to the Board’s decision. This discussion of the information and factors considered by the Board (including the information and factors discussed above) is not intended to be exhaustive, but rather summarizes certain factors considered by the Board. In view of the wide variety of factors considered, the Board did not, unless otherwise noted, find it practicable to quantify or otherwise assign relative weights to the foregoing factors. In addition, individual trustees may have assigned different weights to various factors.
NATURE, EXTENT AND QUALITY OF SERVICES. The trustees reviewed the nature, extent and quality of the services provided, and to be provided, by the investment manager. The trustees cited the investment manager’s ability to implement the Fund’s disciplined value investment approach and its long-term relationship with the Fund as reasons that shareholders choose to invest, and remain invested, in the Fund. The trustees reviewed the Fund’s portfolio management team, including its performance, staffing, skills and compensation program. With respect to portfolio manager compensation, management assured the trustees that the Fund’s long-term performance is a significant component of incentive-based compensation and noted that a portion of a portfolio manager’s incentive-based compensation is paid in shares of pre-designated funds from the portfolio manager’s fund management area. The trustees noted that the portfolio manager compensation program aligned the interests of the portfolio managers with that of shareholders of the Fund. The trustees discussed with management various other products, portfolios and entities that are advised by the investment manager and the allocation of assets and expenses among and within them, as well as their relative fees and reasons for differences with respect thereto and any potential conflicts. During regular Board meetings and the aforementioned meetings of the independent trustees, the trustees received reports and presentations on the investment manager’s best execution trading policies. The trustees considered periodic reports
provided to them showing that the investment manager complied with the investment policies and restrictions of the Fund as well as other reports periodically furnished to the Board covering matters such as the compliance of portfolio managers and other management personnel with the code of ethics covering the investment management personnel, the adherence to fair value pricing procedures established by the Board and the accuracy of net asset value calculations. The Board noted the extent of the benefits provided to Fund shareholders from being part of the Franklin Templeton group of funds, including the right to exchange investments between funds (same class) without a sales charge, the ability to reinvest Fund dividends into other funds and the right to combine holdings of other funds to obtain reduced sales charges. The Board considered the investment manager’s significant efforts in developing and implementing compliance procedures established in accordance with SEC and other requirements.
The Board considered the nature, extent and quality of the services to be provided under the Fund’s other service agreements to determine that, on an overall basis, Fund shareholders were well served. In this connection, the Board also took into account transfer agent and shareholder services provided to Fund shareholders by an affiliate of the investment manager, noting continuing expenditures by management to increase and improve the scope of such services and favorable periodic reports on shareholder services conducted by independent third parties. While such considerations directly affected the trustees’ decision in renewing the Fund’s transfer agent and shareholder services agreement, the Board also considered these commitments as incidental benefits to Fund shareholders deriving from the investment management relationship.
Based on their review, the trustees were satisfied with the nature and quality of the overall services provided, and to be provided, by the investment manager and its affiliates to the Fund and its shareholders and were confident in the abilities of the management team to continue the disciplined value investment approach of the Fund and to provide quality services to the Fund and its shareholders.
INVESTMENT PERFORMANCE. The trustees reviewed and placed significant emphasis on the investment performance of the Fund over the one-, three-, five- and 10-year periods ended December 31, 2016. They considered the history of successful performance of the Fund relative to various benchmarks. As part of their review, they inquired of management regarding benchmarks, style drift and restrictions
40 |
Semiannual Report |
franklintempleton.com |
F R A N K L I N M U T U A L S E R I E S F U N D S
F R A N K L I N M U T U A L F I N A N C I A L S E R V I C E S F U N D
S H A R E H O L D E R I N F O R M A T I O N
on permitted investments. Consideration was also given to performance in the context of available levels of cash during the periods.
The trustees had meetings during the year, including the meetings referred to above held in connection with the renewal process, with the Fund’s portfolio managers to discuss performance and the management of the Fund. In addition, particular attention in assessing performance was given to the Broadridge Section 15(c) Report. That report showed the investment performance of the Fund (Class A shares) in comparison to other funds determined comparable by Lipper.
The comparable funds to the Fund, as chosen by Lipper, included all retail and institutional global financial services funds. The Fund had total returns in the best performing quintile for the one-year period ended December 31, 2016, and had annualized total returns for the three- and five-year periods also in the best performing quintile. The trustees noted that the Fund’s total return on an annualized basis for the 10-year period ended December 31, 2016 was in the second-lowest performing quintile. The trustees discussed with management the reasons for the relative underperformance for the 10-year period ended December 31, 2016. While noting such discussions, overall, the trustees were satisfied with such comparative performance.
The trustees also compared Fund performance to other industry benchmarks, including measures of risk-adjusted performance of a fund, as part of their evaluation of investment performance. The trustees concluded that the Fund had continued to perform well in comparison to its various benchmarks and in the context of the Fund’s goals.
COMPARATIVE EXPENSES AND MANAGEMENT PROFITABILITY. The trustees considered the cost of the services provided and to be provided and the profits realized by the investment manager and its affiliates from their respective relationships with the Fund. As part of the renewal process, the trustees explored with management the trends in expense ratios over the past three fiscal years and the reasons for any increases in the Fund’s expense ratios (or components thereof). In considering the appropriateness of the management fee and other expenses charged to the Fund, the Board took into account various factors including investment performance and matters relating to Fund operations, including, but not limited to, the quality and experience of its portfolio managers and research staff. Consideration was also given to a comparative analysis in the Broadridge Section 15(c) Report of the investment management fee and total expense ratio of the Fund
in comparison with those of a group of other funds selected by Lipper as its appropriate Lipper expense group. Lipper expense data is based upon information taken from the Fund’s most recent annual report, which reflects historical asset levels that may be quite different from those currently existing, particularly in a period of market volatility. While recognizing such inherent limitation and the fact that expense ratios generally increase as assets decline and decrease as assets grow, the Board believed the independent analysis conducted by Lipper to be an appropriate measure of comparative expenses.
In reviewing comparative costs, emphasis was given to the Fund’s contractual management fee in comparison with the contractual management fee that would have been charged by other funds within its Lipper expense group assuming they were similar in size to the Fund, as well as the actual total expenses of the Fund in comparison with those of its Lipper expense group. The Lipper contractual management fee analysis includes administrative charges as being part of the management fee, and total expenses, for comparative consistency, are shown by Lipper for Fund Class A shares.
The Fund’s contractual management fee rate was in the second-most expensive quintile of its Lipper expense group and its total expenses were in the second-least expensive quintile of such group. The Board noted that the Fund’s contractual management fee rate was within 3 basis points of its Lipper expense group median. The Board was satisfied with such comparative fees and expenses.
The trustees also reviewed the Profitability Study addressing profitability of Franklin Resources, Inc., from its overall U.S. fund business, as well as profitability to the Fund’s investment manager and its affiliates, from providing investment management and other services to the Fund during the 12-month period ended September 30, 2016, the most recent fiscal year-end of Franklin Resources, Inc. The trustees reviewed the basis on which such reports are prepared and the cost allocation methodology utilized in the Profitability Study, it being recognized that allocation methodologies may each be reasonable while producing different results. In this respect, the Board noted that the reasonableness of the cost allocation methodologies was reviewed by independent accountants on an every other year basis.
The independent trustees met with management to discuss the Profitability Study. This included, among other things, a comparison of investment management income with investment management expenses of the Fund; comparison of underwriting
franklintempleton.com |
Semiannual Report |
41 |
F R A N K L I N M U T U A L S E R I E S F U N D S
F R A N K L I N M U T U A L F I N A N C I A L S E R V I C E S F U N D
S H A R E H O L D E R I N F O R M A T I O N
revenues and expenses; the relative relationship of investment management and underwriting expenses; shareholder servicing profitability; economies of scale; and the relative contribution of the Fund to the profitability of the investment manager and its parent. In discussing the Profitability Study with the Board, the investment manager stated its belief that the costs incurred in establishing the infrastructure necessary to operate the type of mutual fund operations conducted by it and its affiliates may not be fully reflected in the expenses allocated to the Fund in determining its profitability.
The Board also took into account management’s expenditures in improving shareholder services provided to the Fund, as well as the need to meet additional regulatory and compliance requirements resulting from the Sarbanes-Oxley Act, the Dodd-Frank Act and recent SEC and other regulatory requirements. The trustees also considered the extent to which the investment manager may derive ancillary benefits from Fund operations, including those derived from economies of scale, discussed below, the allocation of Fund brokerage and the use of commission dollars to pay for research and other similar services.
Based upon their consideration of all these factors, the trustees determined that the level of profits realized by the investment manager and its affiliates in providing services to the Fund was not excessive in view of the nature, quality and extent of services provided.
ECONOMIES OF SCALE. The Board considered economies of scale realized by the investment manager and its affiliates as the Fund grows larger and the extent to which they are shared with Fund shareholders, as for example, in the level of the investment management fee charged, in the quality and efficiency of services rendered and in increased capital commitments benefiting the Fund directly or indirectly. While recognizing that any precise determination is inherently subjective, the trustees noted that, based upon the Profitability Study, as some funds increase in size, at some point economies of scale may result in the investment manager realizing a larger profit margin on investment management services provided to such a fund. The trustees also noted that benefits of economies of scale will be shared with Fund shareholders due to the decline in the effective investment management fee rate as breakpoints are achieved by the Fund.
The trustees noted that breakpoints had been instituted as part of the Fund’s investment management fee and that the Board regularly evaluates whether additional breakpoints are appropriate. The trustees assessed the savings to shareholders resulting from
such breakpoints and believed they were, and continue to be, appropriate and they agreed to continue to monitor the appropriateness of the breakpoints. The trustees also considered the effects an increase in assets under management would have on the investment management fee and expense ratio of the Fund. To the extent further economies of scale may be realized by the investment manager and its affiliates, the Board believed the investment management and administrative fees provide a sharing of benefits with the Fund and its shareholders.
Proxy Voting Policies and Procedures
The Fund’s investment manager has established Proxy Voting Policies and Procedures (Policies) that the Fund uses to determine how to vote proxies relating to portfolio securities. Shareholders may view the Fund’s complete Policies online at franklintempleton.com. Alternatively, shareholders may request copies of the Policies free of charge by calling the Proxy Group collect at (954) 527-7678 or by sending a written request to: Franklin Templeton Companies, LLC, 300 S.E. 2nd Street, Fort Lauderdale, FL 33301, Attention: Proxy Group. Copies of the Fund’s proxy voting records are also made available online at franklintempleton.com and posted on the U.S. Securities and Exchange Commission’s website at sec.gov and reflect the most recent 12-month period ended June 30.
Quarterly Statement of Investments
The Trust, on behalf of the Fund, files a complete statement of investments with the U.S. Securities and Exchange Commission for the first and third quarters for each fiscal year on Form N-Q. Shareholders may view the filed Form N-Q by visiting the Commission’s website at sec.gov. The filed form may also be viewed and copied at the Commission’s Public Reference Room in Washington, DC. Information regarding the operations of the Public Reference Room may be obtained by calling (800) SEC-0330.
42 |
Semiannual Report |
franklintempleton.com |
This page intentionally left blank.
This page intentionally left blank.
 | Semiannual Report and Shareholder Letter Franklin Mutual Financial Services Fund
Investment Manager Franklin Mutual Advisers, LLC
Distributor Franklin Templeton Distributors, Inc. (800) DIAL BEN® / 342-5236 franklintempleton.com
Shareholder Services (800) 632-2301 - (Class A, C & R6) (800) 448-FUND - (Class Z) |
Authorized for distribution only when accompanied or preceded by a summary prospectus and/or prospectus. Investors should carefully consider a fund’s investment goals, risks, charges and expenses before investing. A prospectus contains this and other information; please read it carefully before investing.
To help ensure we provide you with quality service, all calls to and from our service areas are monitored and/or recorded.
© 2017 Franklin Templeton Investments. All rights reserved. | 479 S 08/17 |
| Semiannual Report and Shareholder Letter
June 30, 2017 |

Franklin Mutual International Fund
A SERIES OF FRANKLIN MUTUAL SERIES FUNDS

Sign up for electronic delivery at franklintempleton.com/edelivery
Franklin Templeton Investments
Gain From Our Perspective®
At Franklin Templeton Investments, we’re dedicated to one goal: delivering exceptional asset management for our clients. By bringing together multiple, world-class investment teams in a single firm, we’re able to offer specialized expertise across styles and asset classes, all supported by the strength and resources of one of the world’s largest asset managers. This has helped us to become a trusted partner to individual and institutional investors across the globe.
Dear Franklin Mutual International Fund Shareholder:
The first half of 2017 saw most equity markets continue their long move upwards. The Standard & Poor’s 500® Index (S&P 500®) posted a +9.34% total return and the MSCI World Index delivered a +11.02% total return.1
The political uncertainty and unpredictability of recent years has continued in 2017. In the U.S., President Trump has continued his unconventional governance approach, while Congress has remained relentlessly partisan, leading to significant uncertainty about policies and legislation. The financial markets expected “business friendly” moves, but specific legislative progress on issues such as health care, tax reform and infrastructure did not come to fruition. In the U.K., a surprise election was called in April when the Conservative Party held a huge polling lead, but at the June election the Tories lost their majority in Parliament. Recent elections in France went according to expectations, lending some much appreciated stability there.
Despite these generally unsettling events, the global economy continued its slow expansion since the Great Recession. Unemployment also continued to decline in most developed markets. Wage growth showed signs of acceleration and in the U.S. interest rates began to rise, perhaps signaling the first steps toward monetary normalization.
Equity markets appreciated as economic fundamentals improved. Valuation is, of course, a critical factor in our analysis and we always ask ourselves if current and potential investments represent an attractive balance of risk and reward. As some equity markets reached all-time highs, we maintained our focus on individual
investments and the prospects for each business in the context of its valuation and the backdrop of potential political and economic risks.
In many equity markets, growth stocks outperformed value stocks during the period. For example, the S&P 500 Growth Index returned +13.33%, while the S&P 500 Value Index returned +4.85%.1 The difference in performance was driven in part by a significant rally in Internet and software stocks, which dominated the S&P 500 Growth Index. We do not know how long these trends will continue, but historically, periods of strong performance by growth stocks have eventually been followed by relatively weaker performance. In addition, the S&P 500 Value Index has components that we believe are facing disruption from new technology (e.g., the rapid market share shift to online retailing from traditional bricks and mortar dominated retailers that are often labeled as value stocks). Exacerbating the disruption is the reality that many new technology companies are able to innovate without the need to show immediate profits.
Amid dynamic markets and evolving economic conditions, we believe active, professional investment management serves investors well. We also recognize the important role of financial advisors in today’s markets and encourage investors to continue to seek their advice. Amid changing markets and economic conditions, we are confident investors with a well-diversified portfolio and a patient, long-term outlook will be well positioned for the years ahead.
On the following pages, the Fund’s portfolio management team discusses the economic environment during the first six months of 2017 and reviews investment decisions made during this
1. Source: Morningstar.
See www.franklintempletondatasources.com for additional data provider information.
Not FDIC Insured | May Lose Value | No Bank Guarantee
|
franklintempleton.com |
Not part of the Semiannual Report |
1 |
period. Please remember all securities markets fluctuate, as do mutual fund share prices.
We thank you for investing with Franklin Templeton, welcome your questions and comments, and look forward to continuing to serve your investment needs in the years ahead.
Sincerely,

Peter A. Langerman
Chairman, President and Chief Executive Officer
Franklin Mutual Advisers, LLC
This letter reflects our analysis and opinions as of June 30, 2017, unless otherwise indicated. The information is not a complete analysis of every aspect of any market, country, industry, security or fund. Statements of fact are from sources considered reliable.
Visit franklintempleton.com for fund updates, to access your account, or to find helpful financial planning tools.
2 |
Not part of the Semiannual Report |
franklintempleton.com |
Franklin Mutual International Fund
This semiannual report for Franklin Mutual International Fund covers the period ended June 30, 2017.
Your Fund’s Goal and Main Investments
The Fund seeks capital appreciation, which may occasionally be short term, with income as a secondary goal, by investing, under normal market conditions, at least 80% of its assets in securities of companies located outside the U.S. Its strategy is focused mainly on what the investment manager believes are undervalued mid- and large cap equity securities and, to a lesser extent, the securities of distressed companies and merger arbitrage securities.
Performance Overview
The Fund’s Class Z shares delivered a +8.87% cumulative total return for the six months ended June 30, 2017. In comparison, the Fund’s benchmark, the MSCI All Country World Index (ACWI) ex USA Net Return (Local Currency), which is a free float-adjusted,1 market capitalization-weighted index designed to measure equity market performance in global developed and emerging markets, generated a +8.67% total return.2. Also for comparison, the Fund’s secondary benchmark, the MSCI ACWI ex USA Net Return (U.S. dollar) posted a +14.45% total return.2 You can find more of the Fund’s performance data in the Performance Summary beginning on page 9.
Performance data represent past performance, which does not guarantee future results. Investment return and principal value will fluctuate, and you may have a gain or loss when you sell your shares. Current performance may differ from figures shown. For most recent month-end performance, go to franklintempleton.com or call (800) 342-5236.
Economic and Market Overview
The global economy generally expanded during the period under review. In this environment, global developed and emerging market stocks, as measured by the MSCI All Country World Index,
generated a total return of +11.82%. Global markets were aided by improved industrial commodity prices at certain points during the period, generally upbeat economic data across regions, investor optimism about pro-growth and pro-business policies in the U.S., hopes of tax reforms under the Trump administration, Emmanuel Macron’s election as France’s president and encouraging corporate earnings reports.
However, global markets reflected investor concerns about the timing and economic effects of the U.K.’s exit from the European Union (also known as “Brexit”). Other headwinds included the health of European banks, concerns about political uncertainty in the U.S. and European Union, geopolitical tensions in certain regions, worries about global oversupply in oil production despite a pact to extend cuts, and comments toward period-end from key central bankers around the world about potentially raising interest rates.
U.S. economic growth decelerated in 2017’s first quarter, largely due to slower growth in consumer spending and declines in private inventory investment and government spending. However, growth accelerated in the second quarter due to increases in consumer spending, business investment and federal government spending. The unemployment rate decreased from 4.7% in December 2016 to 4.4% at period-end.3 Annual inflation, as measured by the Consumer Price Index, decreased from 2.1% to 1.6% during the period. After increasing its benchmark interest rate in March, the U.S. Federal Reserve (Fed), at its June meeting, made the widely anticipated increase to its target range for the federal funds rate from 0.75%–1.00% to 1.00%–1.25%, amid signs of a growing U.S. economy, a strengthening labor market and an improvement in business spending.
In Europe, the U.K.’s economy grew at a slower rate in 2017’s first quarter over the previous quarter, largely due to slower growth in household spending. The eurozone’s growth increased in the first quarter over the previous quarter. The bloc’s annual inflation rate fluctuated during the reporting
1. A “free float-adjusted” index means that companies with larger proportions of their shares being actively traded, rather than being held by company insiders, governments or cross held by other companies, receive higher weightings within the index.
2. Source: Morningstar.
The indexes are unmanaged and include reinvestment of any income or distributions. They do not reflect any fees, expenses or sales charges. One cannot invest directly in an index, and an index is not representative of the Fund’s portfolio.
3. Source: Bureau of Labor Statistics.
The dollar value, number of shares or principal amount, and names of all portfolio holdings are listed in the Fund’s Statement of Investments (SOI). The SOI begins on page 17.
franklintempleton.com |
Semiannual Report |
3 |
F R A N K L I N M U T U A L I N T E R N A T I O N A L F U N D
period and ended slightly higher from where it began. During the period, the European Central Bank kept its key policy rates unchanged.
In Asia, Japan’s quarterly gross domestic product (GDP) remained unchanged in 2017’s first quarter compared to 2016’s fourth quarter. In April 2017, the Bank of Japan (BOJ) slightly increased its GDP forecasts for the 2017–2018 fiscal year. However, the BOJ lowered its inflation forecast.
In emerging markets, Brazil’s quarterly GDP grew for the first time in two years, as its first-quarter 2017 GDP grew compared to the previous quarter. The country’s central bank cut its benchmark interest rate four times between January and June 2017 to spur economic growth. Russia’s GDP grew in 2017’s first quarter compared to the prior-year period. The Bank of Russia reduced its key interest rate in March, April and June 2017 to try to revive its economy. China’s economy grew faster in the first half of 2017 compared to the first half of 2016, driven by solid growth in industrial production, services, fixed-asset investment, retail sales, and imports and exports. The People’s Bank of China left its benchmark interest rate unchanged during the period. Overall, emerging market stocks, as measured by the MSCI Emerging Markets Index, rose during the period.
Investment Strategy
At Franklin Mutual Series, we are committed to our distinctive value approach to investing, which we believe can generate above-average risk-adjusted returns over time for our shareholders. Our major investment strategy is investing in undervalued stocks in Asia and Europe. We have the ability to invest in emerging markets, although this is unlikely to be a significant focus of our strategy. When selecting undervalued equities, we are attracted to what we believe are fundamentally strong companies with healthy balance sheets, high-quality assets, substantial free cash flow and shareholder-oriented management teams and whose stocks are trading at discounts to our assessment of the companies’ intrinsic or business value. We also look for asset-rich companies whose shares may be trading at depressed levels due to concerns over short-term earnings disappointments, litigation, management strategy or other perceived negatives. This strict value approach is not only intended to improve the likelihood of upside potential, but also reduces the risk of substantial declines, in our opinion. While the vast majority of our undervalued equity investments are made in publicly traded companies internationally, we may invest occasionally in privately held companies as well.
We complement this more traditional investment strategy with two others. One is distressed investing, a highly specialized
Geographic Composition*
Based on Total Net Assets as of 6/30/17
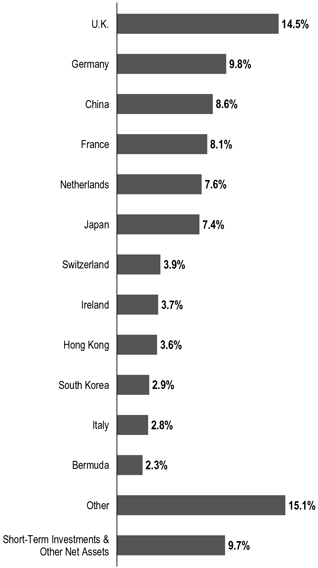
*Figures are stated as a percentage of total and may not equal 100% or may be negative due to rounding, use of any derivatives, unsettled trades or other factors.
field that has proven quite profitable during certain periods over the years. Distressed investing is complex and can take many forms. The most common distressed investment the Fund undertakes is the purchase of financially troubled or bankrupt companies’ debt at a substantial discount to face value. After the financially distressed company is reorganized, the old debt is typically replaced with new securities issued by the financially stronger company.
The other piece of our investment strategy is participating in arbitrage situations, another highly specialized field. When companies announce proposed mergers or takeovers, commonly referred to as “deals,” the target company may trade at a discount to the bid it ultimately accepts. One form of
4 |
Semiannual Report |
franklintempleton.com |
F R A N K L I N M U T U A L I N T E R N A T I O N A L F U N D
arbitrage involves purchasing the target company’s stock when it is trading below the value we believe it would receive in a deal. In keeping with our commitment to a relatively conservative investment approach, we typically focus our arbitrage efforts on announced deals, and avoid rumored deals or other situations we consider relatively risky.
In addition, it is our practice to hedge the Fund’s currency exposure when we deem it advantageous for our shareholders.
What is meant by “hedge”?
To hedge an investment is to take a position intended to offset potential losses/gains that may be incurred by a companion financial instrument.
Top 10 Sectors/Industries
Based on Equity Securities as of 6/30/17
| % of Total Net Assets | ||||
| ||||
Insurance | 13.3% | |||
Banks | 7.3% | |||
Diversified Telecommunication Services | 6.6% | |||
Pharmaceuticals | 6.5% | |||
Oil, Gas & Consumable Fuels | 4.1% | |||
Real Estate Management & Development | 4.0% | |||
Hotels, Restaurants & Leisure | 3.6% | |||
Diversified Financial Services | 2.7% | |||
Industrial Conglomerates | 2.6% | |||
Capital Markets | 2.5% | |||
Manager’s Discussion
Many equity markets posted meaningful gains in 2017’s first half, across most regions and with minimal volatility. Global markets were aided by generally upbeat economic data, improved corporate earnings in the U.S., Europe and Japan, as well as improved industrial commodity prices at certain points during the period. However, those largely positive headline conditions overshadowed a fair amount of turbulence and uncertainty.
In the U.S., markets began the year rallying as investors hoped that a Republican sweep of U.S. elections in November 2016 would lead to a general loosening in regulations and tax reform, including lower corporate tax rates. However, political gridlock took hold. The political drama in Washington D.C., tempered the rally in U.S. markets overall. Many stocks which led the way in the post-election rally subsequently gave back some or all of their outperformance, particularly value stocks dominated by companies in cyclical sectors most likely to benefit from acceleration in economic growth. In an environment of modest economic growth and low interest rates, investors continued to favor growth stocks. During the period, the Russell 1000® Growth Index generated a total return of +13.99%, while the Russell 1000® Value Index posted a total return of +4.66%.2 Within the Russell 1000® Growth Index, stocks with the largest weightings are technology firms that dominated the headlines: Apple,4 Alphabet (a.k.a. Google),4 Microsoft,4 Amazon.com4 and Facebook.4
European equity markets started 2017 slowly, but political events combined with upbeat economic news sparked strong performance
during the period, with the notable exception of the U.K. In our view, France’s presidential election was significant, as it stemmed the rise of the populist, anti-European Union (EU) National Front party and raised hopes for the future of the EU. The subsequent success of Macron’s party in France’s legislative elections added to hopes that the new government can implement much-needed economic reforms. In Italy, the poor showing of the populist Eurosceptic Five Star movement in the June local elections reinforced the broader positive political trend in Europe. On the other hand, in the U.K., the surprise loss by the Conservative Party of its parliamentary majority, and the increasingly public split within the Conservative Party between supporters and opponents of a “hard Brexit” added another layer of uncertainty to the upcoming negotiations with the EU.
Although Europe’s economy is still vulnerable to political or financial setbacks, we believe its recovery has broad economic support. Purchasing managers’ indices and employment data continued to point to solid and widespread growth. In addition, for the first time in several years, corporate earnings consensus estimates were revised upward. The improvement in economic and corporate conditions helped reduce investor concerns about deflation and spur nascent signs of inflation. On balance, we hold a positive view of European equities, but selectivity remains crucial.
Asian equity markets have seen mixed performance year to date. Markets in mainland China have been quite weak, while Hong Kong’s market has been strong, possibly driven by flows from mainland investors through the Stock Connect channel. We remain concerned about the sharp rise of leveraged debt
4. Not a Fund holding.
See www.franklintempletondatasources.com for additional data provider information.
franklintempleton.com |
Semiannual Report |
5 |
F R A N K L I N M U T U A L I N T E R N A T I O N A L F U N D
instruments used by smaller banks in China to bolster earnings. However, we take some comfort from the fact that China’s regulators are moving to deflate that bubble. Although China’s economic growth remained constant in the first half of the year, it could likely moderate during the remainder of the year, in our view, as tightening measures begin to impact industries such as real estate and construction.
Japan’s economy remains challenged by an aging population that may impact other geographies in the near future. However, despite its declining population, Japan has policies in place to target gross domestic product growth of 2%. The Bank of Japan continued its quantitative easing program, which extended beyond Japanese government bonds to equity exchange traded funds. We believe this buying created distortions in equity valuations to an extent beyond possible distortions in other markets. Conversely, the Corporate Governance Code, which has been implemented by the Abe administration and directly addresses shareholder returns, has resulted in some improvement in shareholder responsiveness by Japanese corporate management. There is more room for improvement but, as a result, we have recently seen more investment opportunities emerging in Japan.
The Coca Cola bottling system in Japan has consolidated from 17 to five local bottlers, although one dominates now with 90% share of the system. We invested in Coca Cola East Japan in 2015 before it merged with Coca Cola West at the beginning of 2017 to form Coca Cola Bottlers Japan. Coca Cola East’s management presented a coherent strategy to invest in a business that had been neglected for decades and to triple its operating margins, although still resulting in the lowest margins among Coca Cola bottlers anywhere outside of Japan. The operating margin of Coca Cola East rose by 80% before the two bottlers merged. The stated corporate strategy is to be expanded in what was Coca Cola West, which was already having a positive impact on Coca Cola East’s results. Beyond that, there should be opportunities for this platform to use its balance sheet to expand across Southeast Asia as The Coca Cola Company4 disposes of its stakes across the region.
Kenedix is the largest independent real estate asset management organization in Japan. We believe the company is well placed to grow assets under management as more investors seek yield in Japan, where interest rates are negative. We met with the company’s management for the first time in 2016 and were impressed with its disciplined approach to capital management. After we initiated a position in the company, Kenedix announced a share stock buyback program for a second straight year. This is the sort of behavior we hope to see more of as a result of the Corporate Governance Code.
Top 10 Equity Holdings
6/30/17
Company Sector/Industry, Country | % of Total Net Assets | |||
| ||||
Koninklijke Philips NV | 2.6% | |||
Industrial Conglomerates, Netherlands | ||||
Volkswagen AG | 2.4% | |||
Automobiles, Germany | ||||
Enel SpA | 2.4% | |||
Electric Utilities, Italy | ||||
Accor SA | 2.3% | |||
Hotels, Restaurants & Leisure, France | ||||
Novartis AG | 2.3% | |||
Pharmaceuticals, Switzerland | ||||
XL Group Ltd. | 2.3% | |||
Insurance, Bermuda | ||||
ASR Nederland NV | 2.2% | |||
Insurance, Netherlands | ||||
Deutsche Telekom AG | 2.1% | |||
Diversified Telecommunication Services, Germany | ||||
China Longyuan Power Group Corp. | 2.0% | |||
Independent Power & Renewable Electricity Producers, China | ||||
Nokia OYJ | 1.8% | |||
Communications Equipment, Finland | ||||
As value investors, we managed to benefit from steady economic growth despite underlying market turbulence. In all market environments, we seek to invest prudently in securities that we believe represent good value, and then we adjust our views as the world around us changes.
Turning to Fund performance, top positive contributors included India-based mortgage company Indiabulls Housing Finance, Netherlands-based insurer ASR Nederland and South Korean computer electronics manufacturer Samsung Electronics.
Indiabulls Housing Finance is India’s third largest mortgage financing company. During the period, Indiabulls reported positive quarterly results that showed it successfully followed through on its goal of expanding its home loan book. In our view, the results reported in February were particularly noteworthy given the economic disruption caused by the Indian government’s surprise demonetization announcement in November 2016. The government recalled all existing 500 and 1000 rupee notes, totaling approximately 86% of India’s currency in circulation, which led to cash shortages. The April results were significant as Indiabulls was able to hold spreads steady, despite lower interest rates in India, by lowering its cost of funds.
6 |
Semiannual Report |
franklintempleton.com |
F R A N K L I N M U T U A L I N T E R N A T I O N A L F U N D
Shares of ASR Nederland rose due to a series of positive events. In February, the company announced it would repurchase shares on offer from the Dutch government, shares the government had acquired during the 2008 financial crisis. In our view, the buyback demonstrated ASR Nederland’s strong capital position. ASR Nederland reported solid quarterly results in February and May, as well as a dividend increase approved by shareholders at the end of May. Operating results were aided by ASR Nederland’s efforts to re-risk its investment portfolio by shifting invested premiums away from traditional fixed income securities to equities and other assets with higher historical returns. We believe the process of re-risking is a sign that management feels more comfortable with its level of capital. The board of ASR Nederland also approved another share buyback program, which will likely be used to purchase more shares held by the Dutch government.
Samsung Electronics is a low cost provider of commodity memory products (e.g., dynamic random-access memory and flash memory), which have seen very strong pricing recently. Samsung also produces smartphones, consumer electronics and other goods. In February, shares retreated as Samsung chief Jay Y. Lee was arrested for bribery as part of a wider government influence-peddling scandal that led to the impeachment of then president Park Geun-hye. However, the stock price rallied as investors turned their focus to Samsung’s better-than-expected earnings results announced in April. Samsung reported strong sales in its core businesses, including memory chips and OLED (organic light-emitting diode) displays. Despite adverse publicity surrounding its Note 7 smartphone in the fall of 2016, sales of its newest generation of smartphones have been running ahead of market expectations. Management also pleasantly surprised investors in April by announcing a plan to cancel existing treasury shares held by the company.
During the period under review, Fund investments that detracted from performance included Japan-based Takara Leben, Canada-based Crescent Point Energy and U.K.-based global integrated oil and gas company BP.
Takara Leben is a midsized condominium developer in Japan that is also rapidly expanding its solar farm capacity. In March, Takara Leben made small downward adjustments to its fiscal year revenue guidance due to a delay in the sales of solar power plants. We believe Takara may not be fully exploiting its cost advantage in the residential real estate market. Takara failed to accelerate completion of units when price differentials were significantly in its favor. Moreover, we do not believe it is selling solar assets at full value. We will shortly address these issues with management.
Crescent Point Energy is an exploration and production company with significant exposure to oil production. The stock price generally followed the path of deteriorating crude oil prices during the period. A stronger Canadian dollar, which comprises a significant portion of the company’s cost base, further hurt the stock’s performance. We believe the stock is attractive as it trades at a significant discount to its peers, despite having decent assets, a good track record on operational execution and a healthy balance sheet. As Crescent Point Energy focuses on organic growth, we believe the stock’s discounted valuation should improve.
Shares of BP also generally followed the path of declining oil prices. During the first half of 2017, oil prices retreated as U.S. crude oil production increased and data showed that worldwide supply had not yet begun to decline. BP’s shares came under further pressure in February when it reported soft quarterly results and increased its capital expenditure guidance for 2017, which meant the level of cash flow needed to break even increased by a modest amount. We view this as a temporary issue.
During the period, the Fund held currency forwards and futures seeking to hedge most of the currency risk of the portfolio’s non-U.S. dollar investments. The currency forwards had a negative impact on the Fund’s performance because of the depreciation of the U.S. dollar versus the hedged currencies, while currency futures had a negligible impact.
What is a currency forward?
A currency forward is an agreement between the Fund and a counterparty to buy or sell a foreign currency in exchange for another currency at a specific exchange rate on a future date.
What is a future?
A future is an agreement between the Fund and a counterparty made through a U.S. or foreign futures exchange to buy or sell an underlying instrument or asset at a specific price on a future date.
franklintempleton.com |
Semiannual Report |
7 |
F R A N K L I N M U T U A L I N T E R N A T I O N A L F U N D
Thank you for your participation in Franklin Mutual International Fund. We look forward to continuing to serve your investment needs.
 |
Philippe Brugere-Trelat Co-Portfolio Manager | |
 |
Andrew Sleeman, CFA Co-Portfolio Manager | |


The foregoing information reflects our analysis, opinions and portfolio holdings as of June 30, 2017, the end of the reporting period. The way we implement our main investment strategies and the resulting portfolio holdings may change depending on factors such as market and economic conditions. These opinions may not be relied upon as investment advice or an offer for a particular security. The information is not a complete analysis of every aspect of any market, country, industry, security or the Fund. Statements of fact are from sources considered reliable, but the investment manager makes no representation or warranty as to their completeness or accuracy. Although historical performance is no guarantee of future results, these insights may help you understand our investment management philosophy.
Philippe Brugere-Trelat has been a co-portfolio manager for Franklin Mutual International Fund since 2009. Mr. Brugere-Trelat has also served as lead portfolio manager for Franklin Mutual European Fund since 2005 and as portfolio manager for Franklin Mutual Global Discovery Fund since 2009. He has been a member of the management team of the Franklin Mutual Series Funds since 2004, when he rejoined Franklin Templeton Investments. Previously, he was president and portfolio manager of Eurovest. Between 1984 and 1994, Mr. Brugere-Trelat was employed at Heine Securities Corporation, the Fund’s former manager.
|
Andrew Sleeman has been a co-portfolio manager for Franklin Mutual International Fund since 2009. He has also served as lead portfolio manager for Franklin Mutual Financial Services Fund since 2009. Mr. Sleeman joined Franklin Templeton Investments in 2007. Previously, he was with Fox-Pitt, Kelton, a financials specialist firm, where he focused on international financial equities. Prior to that, he worked in international equities at BNP Paribas. Mr. Sleeman also worked in Australia in the fixed income division of JP Morgan Investment Management.
|
CFA® is a trademark owned by CFA Institute.
8 |
Semiannual Report |
franklintempleton.com |
F R A N K L I N M U T U A L I N T E R N A T I O N A L F U N D
Performance Summary as of June 30, 2017
The performance table does not reflect any taxes that a shareholder would pay on Fund dividends, capital gain distributions, if any, or any realized gains on the sale of Fund shares. Total return reflects reinvestment of the Fund’s dividends and capital gain distributions, if any, and any unrealized gains or losses. Your dividend income will vary depending on dividends or interest paid by securities in the Fund’s portfolio, adjusted for operating expenses of each class. Capital gain distributions are net profits realized from the sale of portfolio securities.
Performance as of 6/30/171
Cumulative total return excludes sales charges. Average annual total return includes maximum sales charges. Sales charges will vary depending on the size of the investment and the class of share purchased. The maximum is 5.75% and the minimum is 0%. Class A: 5.75% maximum initial sales charge. For other share classes, visit franklintempleton.com.
| Share Class | Cumulative Total Return2 | Average Annual Total Return3 | ||
| ||||
Z | ||||
6-Month | +8.87% | +8.87% | ||
1-Year | +20.05% | +20.05% | ||
5-Year | +47.81% | +8.13% | ||
Since Inception (5/1/09) | +102.77% | +9.04% | ||
A | ||||
6-Month | +8.77% | +2.51% | ||
1-Year | +19.84% | +12.91% | ||
5-Year | +45.78% | +6.56% | ||
Since Inception (5/1/09) | +98.18% | +7.95% | ||
Performance data represent past performance, which does not guarantee future results. Investment return and principal value will fluctuate, and you may have a gain or loss when you sell your shares. Current performance may differ from figures shown. For most recent month-end performance, go to franklintempleton.com or call (800) 342-5236.
See page 10 for Performance Summary footnotes.
franklintempleton.com |
Semiannual Report |
9 |
F R A N K L I N M U T U A L I N T E R N A T I O N A L F U N D
P E R F O R M A N C E S U M M A R Y
Total Annual Operating Expenses4
| Share Class | With Waiver | Without Waiver | ||||
Z | 1.17% | 1.22% | ||||
A | 1.42% | 1.47% | ||||
Each class of shares is available to certain eligible investors and has different annual fees and expenses, as described in the prospectus.
All investments involve risks, including possible loss of principal. Value securities may not increase in price as anticipated or may decline further in value. Special risks are associated with foreign investing, including currency fluctuations, economic instability and political developments; investments in emerging markets involve heightened risks related to the same factors. Because the Fund invests its assets primarily in companies in a specific region, it is subject to greater risks of adverse developments in that region and/or surrounding regions than a fund that is more broadly diversified geographically. Political, social or economic disruptions in the region, even in countries in which the Fund is not invested, may adversely affect the value of securities held by the Fund. Smaller company stocks have exhibited greater price volatility than larger company stocks, particularly over the short term. The Fund’s investments in companies engaged in mergers, reorganizations or liquidations also involve special risks as pending deals may not be completed on time or on favorable terms. The Fund may invest in lower rated bonds, which entail higher credit risk. The Fund is actively managed but there is no guarantee that the manager’s investment decisions will produce the desired results. The Fund’s prospectus also includes a description of the main investment risks.
1. The Fund has an expense reduction contractually guaranteed through 4/30/18. Fund investment results reflect the expense reduction; without this reduction, the results would have been lower.
2. Cumulative total return represents the change in value of an investment over the periods indicated.
3. Average annual total return represents the average annual change in value of an investment over the periods indicated. Return for less than one year, if any, has not been annualized.
4. Figures are as stated in the Fund’s current prospectus and may differ from the expense ratios disclosed in the Your Fund’s Expenses and Financial Highlights sections in this report. In periods of market volatility, assets may decline significantly, causing total annual Fund operating expenses to become higher than the figures shown.
10 |
Semiannual Report |
franklintempleton.com |
F R A N K L I N M U T U A L I N T E R N A T I O N A L F U N D
As a Fund shareholder, you can incur two types of costs: (1) transaction costs, including sales charges (loads) on Fund purchases and redemptions; and (2) ongoing Fund costs, including management fees, distribution and service (12b-1) fees, and other Fund expenses. All mutual funds have ongoing costs, sometimes referred to as operating expenses. The table below shows ongoing costs of investing in the Fund and can help you understand these costs and compare them with those of other mutual funds. The table assumes a $1,000 investment held for the six months indicated.
Actual Fund Expenses
The table below provides information about actual account values and actual expenses in the columns under the heading “Actual.” In these columns the Fund’s actual return, which includes the effect of Fund expenses, is used to calculate the “Ending Account Value” for each class of shares. You can estimate the expenses you paid during the period by following these steps (of course, your account value and expenses will differ from those in this illustration): Divide your account value by $1,000 (if your account had an $8,600 value, then $8,600 ÷ $1,000 = 8.6). Then multiply the result by the number in the row for your class of shares under the headings “Actual” and “Expenses Paid During Period” (if Actual Expenses Paid During Period were $7.50, then 8.6 x $7.50 = $64.50). In this illustration, the actual expenses paid this period are $64.50.
Hypothetical Example for Comparison with Other Funds
Under the heading “Hypothetical” in the table, information is provided about hypothetical account values and hypothetical expenses based on the Fund’s actual expense ratio and an assumed rate of return of 5% per year before expenses, which is not the Fund’s actual return. This information may not be used to estimate the actual ending account balance or expenses you paid for the period, but it can help you compare ongoing costs of investing in the Fund with those of other funds. To do so, compare this 5% hypothetical example for the class of shares you hold with the 5% hypothetical examples that appear in the shareholder reports of other funds.
Please note that expenses shown in the table are meant to highlight ongoing costs and do not reflect any transactional costs. Therefore, information under the heading “Hypothetical” is useful in comparing ongoing costs only, and will not help you compare total costs of owning different funds. In addition, if transactional costs were included, your total costs would have been higher.
Actual (actual return after expenses) | Hypothetical (5% annual return before expenses) | |||||||||||||||||
Share Class | Beginning Account Value 1/1/17 | Ending Account Value 6/30/17 | Expenses Paid During 1/1/17–6/30/171,2 | Ending Account Value 6/30/17 | Expenses Paid During 1/1/17–6/30/171,2 | Net Annualized Expense Ratio2 | ||||||||||||
| Z | $1,000 | $1,088.70 | $ 6.06 | $1,018.99 | $ 5.86 | 1.17% | ||||||||||||
| A | $1,000 | $1,087.70 | $ 7.35 | $1,017.75 | $ 7.10 | 1.42% | ||||||||||||
| C | $1,000 | $1,083.10 | $11.21 | $1,014.03 | $10.84 | 2.17% | ||||||||||||
| R | $1,000 | $1,086.00 | $ 8.59 | $1,016.56 | $ 8.30 | 1.66% | ||||||||||||
| R6 | $1,000 | $1,089.40 | $ 5.23 | $1,019.79 | $ 5.06 | 1.01% | ||||||||||||
1. Expenses are equal to the annualized expense ratio for the six-month period as indicated above—in the far right column—multiplied by the simple average account value over the period indicated, and then multiplied by 181/365 to reflect the one-half year period.
2. Reflects expenses after fee waivers and expense reimbursements. Does not include acquired fund fees and expenses.
franklintempleton.com |
Semiannual Report |
11 |
F R A N K L I N M U T U A L I N T E R N A T I O N A L F U N D
Six Months Ended
June 30, 2017 | Year Ended December 31,
| |||||||||||||||||||||||||||
(unaudited)
|
2016
|
2015
|
2014
|
2013
|
2012
| |||||||||||||||||||||||
Class Z | ||||||||||||||||||||||||||||
| Per share operating performance | ||||||||||||||||||||||||||||
(for a share outstanding throughout the period) | ||||||||||||||||||||||||||||
Net asset value, beginning of period |
| $14.32
|
|
| $14.17
|
|
| $14.59
|
|
| $15.90
|
|
| $13.58
|
|
| $11.83
|
| ||||||||||
Income from investment operationsa: | ||||||||||||||||||||||||||||
Net investment incomeb |
| 0.23
|
|
| 0.27
| c
|
| 0.18
| d
|
| 0.30
| e
|
| 0.24
|
|
| 0.24
|
| ||||||||||
Net realized and unrealized gains (losses) |
| 1.04
|
|
| 0.20
|
|
| (0.17
| )
|
| (0.57
| )
|
| 2.42
|
|
| 1.68
|
| ||||||||||
Total from investment operations |
|
1.27
|
|
|
0.47
|
|
|
0.01
|
|
|
(0.27
|
)
|
|
2.66
|
|
|
1.92
|
| ||||||||||
Less distributions from: | ||||||||||||||||||||||||||||
Net investment income |
| —
|
|
| (0.27
| )
|
| (0.16
| )
|
| (0.43
| )
|
| (0.24
| )
|
| (0.15
| )
| ||||||||||
Net realized gains |
| —
|
|
| (0.05
| )
|
| (0.27
| )
|
| (0.61
| )
|
| (0.10
| )
|
| (0.02
| )
| ||||||||||
Total distributions |
|
—
|
|
|
(0.32
|
)
|
|
(0.43
|
)
|
|
(1.04
|
)
|
|
(0.34
|
)
|
|
(0.17
|
)
| ||||||||||
Net asset value, end of period |
|
$15.59
|
|
|
$14.32
|
|
|
$14.17
|
|
|
$14.59
|
|
|
$15.90
|
|
|
$13.58
|
| ||||||||||
Total returnf |
| 8.87%
|
|
| 3.34%
|
|
| 0.15%
|
|
| (1.63)%
|
|
| 19.71%
|
|
| 16.30%
|
| ||||||||||
Ratios to average net assetsg | ||||||||||||||||||||||||||||
Expenses before waiver and payments by affiliates and expense reductionh |
| 1.21%
|
|
| 1.22%
|
|
| 1.24%
|
|
| 1.39%
|
|
| 1.49%
|
|
| 1.75%
|
| ||||||||||
Expenses net of waiver and payments by affiliates and expense reductionh |
| 1.17%i
|
|
| 1.17%i
|
|
| 1.15%i
|
|
| 1.16%i
|
|
| 1.17%i
|
|
| 1.17%
|
| ||||||||||
Expenses incurred in connection with securities sold short |
| —%
|
|
| —%
|
|
| —%
|
|
| —%j
|
|
| —%
|
|
| —%
|
| ||||||||||
Net investment income |
| 2.94%
|
|
| 2.07%c
|
|
| 1.26%d
|
|
| 1.78%e
|
|
| 1.64%
|
|
| 1.70%
|
| ||||||||||
| Supplemental data | ||||||||||||||||||||||||||||
Net assets, end of period (000’s) |
| $66,032
|
|
| $40,875
|
|
| $49,963
|
|
| $19,940
|
|
| $14,732
|
|
| $10,354
|
| ||||||||||
Portfolio turnover rate |
| 14.94%
|
|
| 24.87%
|
|
| 28.64%
|
|
| 54.78%
|
|
| 41.47%
|
|
| 27.97%
|
| ||||||||||
aThe amount shown for a share outstanding throughout the period may not correlate with the Statement of Operations for the period due to the timing of sales and repurchases of the Fund’s shares in relation to income earned and/or fluctuating fair value of the investments of the Fund.
bBased on average daily shares outstanding.
cNet investment income per share includes approximately $0.06 per share related to income received in the form of special dividends in connection with certain Fund holdings. Excluding this amount, the ratio of net investment income to average net assets would have been 1.63%.
dNet investment income per share includes approximately $0.08 per share related to income received in the form of special dividends in connection with certain Fund holdings. Excluding this amount, the ratio of net investment income to average net assets would have been 0.71%.
eNet investment income per share includes approximately $0.08 per share related to income received in the form of special dividends in connection with certain Fund holdings. Excluding this amount, the ratio of net investment income to average net assets would have been 1.27%.
fTotal return is not annualized for periods less than one year.
gRatios are annualized for periods less than one year.
hIncludes dividend and/or interest expense on securities sold short and security borrowing fees, if any. See below for the ratios of such expenses to average net assets for the periods presented. See Note 1(d).
iBenefit of expense reduction rounds to less than 0.01%.
jRounds to less than 0.01%.
12 |
Semiannual Report |
| The accompanying notes are an integral part of these financial statements. |
franklintempleton.com |
F R A N K L I N M U T U A L I N T E R N A T I O N A L F U N D
F I N A N C I A L H I G H L I G H T S
Six Months Ended (unaudited) | Year Ended December 31, | |||||||||||||||||||||||
| 2016 | 2015 | 2014 | 2013 | 2012 | ||||||||||||||||||||
| ||||||||||||||||||||||||
| Class A | ||||||||||||||||||||||||
| Per share operating performance | ||||||||||||||||||||||||
(for a share outstanding throughout the period) | ||||||||||||||||||||||||
Net asset value, beginning of period | $14.25 | $14.10 | $14.54 | $15.84 | $13.54 | $11.81 | ||||||||||||||||||
|
| |||||||||||||||||||||||
Income from investment operationsa: | ||||||||||||||||||||||||
Net investment incomeb | 0.19 | 0.24 | c | 0.15 | d | 0.26 | e | 0.20 | 0.18 | |||||||||||||||
Net realized and unrealized gains (losses) | 1.06 | 0.19 | (0.19 | ) | (0.57 | ) | 2.41 | 1.70 | ||||||||||||||||
|
| |||||||||||||||||||||||
Total from investment operations | 1.25 | 0.43 | (0.04 | ) | (0.31 | ) | 2.61 | 1.88 | ||||||||||||||||
|
| |||||||||||||||||||||||
Less distributions from: | ||||||||||||||||||||||||
Net investment income | — | (0.23 | ) | (0.13 | ) | (0.38 | ) | (0.21 | ) | (0.13) | ||||||||||||||
Net realized gains | — | (0.05 | ) | (0.27 | ) | (0.61 | ) | (0.10 | ) | (0.02) | ||||||||||||||
|
| |||||||||||||||||||||||
Total distributions | — | (0.28 | ) | (0.40 | ) | (0.99 | ) | (0.31 | ) | (0.15) | ||||||||||||||
|
| |||||||||||||||||||||||
Net asset value, end of period | $15.50 | $14.25 | $14.10 | $14.54 | $15.84 | $13.54 | ||||||||||||||||||
|
| |||||||||||||||||||||||
Total returnf | 8.77% | 3.14% | (0.20)% | (1.89)% | 19.34% | 16.01% | ||||||||||||||||||
| Ratios to average net assetsg | ||||||||||||||||||||||||
Expenses before waiver and payments by affiliates and expense reductionh | 1.46% | 1.47% | 1.52% | 1.69% | 1.79% | 2.05% | ||||||||||||||||||
Expenses net of waiver and payments by affiliates and expense reductionh | 1.42% | i | 1.42% | i | 1.43% | i | 1.46% | i | 1.47% | i | 1.47% | |||||||||||||
Expenses incurred in connection with securities sold short | —% | —% | —% | —%j | —% | —% | ||||||||||||||||||
Net investment income | 2.69% | 1.82% | c | 0.98% | d | 1.48% | e | 1.34% | 1.40% | |||||||||||||||
| Supplemental data | ||||||||||||||||||||||||
Net assets, end of period (000’s) | $78,250 | $82,626 | $110,591 | $39,810 | $35,319 | $18,221 | ||||||||||||||||||
Portfolio turnover rate | 14.94% | 24.87% | 28.64% | 54.78% | 41.47% | 27.97% | ||||||||||||||||||
aThe amount shown for a share outstanding throughout the period may not correlate with the Statement of Operations for the period due to the timing of sales and repurchases of the Fund’s shares in relation to income earned and/or fluctuating fair value of the investments of the Fund.
bBased on average daily shares outstanding.
cNet investment income per share includes approximately $0.06 per share related to income received in the form of special dividends in connection with certain Fund holdings. Excluding this amount, the ratio of net investment income to average net assets would have been 1.38%.
dNet investment income per share includes approximately $0.08 per share related to income received in the form of special dividends in connection with certain Fund holdings. Excluding this amount, the ratio of net investment income to average net assets would have been 0.43%.
eNet investment income per share includes approximately $0.08 per share related to income received in the form of special dividends in connection with certain Fund holdings. Excluding this amount, the ratio of net investment income to average net assets would have been 0.97%.
fTotal return does not reflect sales commissions or contingent deferred sales charges, if applicable, and is not annualized for periods less than one year.
gRatios are annualized for periods less than one year.
hIncludes dividend and/or interest expense on securities sold short and security borrowing fees, if any. See below for the ratios of such expenses to average net assets for the periods presented. See Note 1(d).
iBenefit of expense reduction rounds to less than 0.01%.
jRounds to less than 0.01%.
franklintempleton.com |
The accompanying notes are an integral part of these financial statements. | |
Semiannual Report |
13 |
F R A N K L I N M U T U A L I N T E R N A T I O N A L F U N D
F I N A N C I A L H I G H L I G H T S
Six Months Ended (unaudited) | Year Ended December 31, | |||||||||||||||||||||||
| 2016 | 2015 | 2014 | 2013 | 2012 | ||||||||||||||||||||
| ||||||||||||||||||||||||
| Class C | ||||||||||||||||||||||||
| Per share operating performance | ||||||||||||||||||||||||
(for a share outstanding throughout the period) | ||||||||||||||||||||||||
Net asset value, beginning of period | $14.08 | $13.92 | $14.38 | $15.68 | $13.41 | $11.74 | ||||||||||||||||||
|
| |||||||||||||||||||||||
Income from investment operationsa: | ||||||||||||||||||||||||
Net investment incomeb | 0.14 | 0.15 | c | 0.04 | d | 0.15 | e | 0.10 | 0.05 | |||||||||||||||
Net realized and unrealized gains (losses) | 1.03 | 0.18 | (0.18 | ) | (0.56 | ) | 2.38 | 1.72 | ||||||||||||||||
|
| |||||||||||||||||||||||
Total from investment operations | 1.17 | 0.33 | (0.14 | ) | (0.41 | ) | 2.48 | 1.77 | ||||||||||||||||
|
| |||||||||||||||||||||||
Less distributions from: | ||||||||||||||||||||||||
Net investment income | — | (0.12 | ) | (0.05 | ) | (0.28 | ) | (0.11 | ) | (0.08) | ||||||||||||||
Net realized gains | — | (0.05 | ) | (0.27 | ) | (0.61 | ) | (0.10 | ) | (0.02) | ||||||||||||||
|
| |||||||||||||||||||||||
Total distributions | — | (0.17 | ) | (0.32 | ) | (0.89 | ) | (0.21 | ) | (0.10) | ||||||||||||||
|
| |||||||||||||||||||||||
Net asset value, end of period | $15.25 | $14.08 | $13.92 | $14.38 | $15.68 | $13.41 | ||||||||||||||||||
|
| |||||||||||||||||||||||
Total returnf | 8.31% | 2.44% | (0.93)% | (2.58)% | 18.54% | 15.14% | ||||||||||||||||||
| Ratios to average net assetsg | ||||||||||||||||||||||||
Expenses before waiver and payments by affiliates and expense reductionh | 2.21% | 2.22% | 2.24% | 2.39% | 2.49% | 2.75% | ||||||||||||||||||
Expenses net of waiver and payments by affiliates and expense reductionh | 2.17% | i | 2.17% | i | 2.15% | i | 2.16% | i | 2.17% | i | 2.17% | |||||||||||||
Expenses incurred in connection with securities sold short | —% | —% | —% | —% | j | —% | —% | |||||||||||||||||
Net investment income | 1.94% | 1.07% | c | 0.26% | d | 0.78% | e | 0.64% | 0.70% | |||||||||||||||
| Supplemental data | ||||||||||||||||||||||||
Net assets, end of period (000’s) | $29,193 | $25,860 | $34,611 | $14,794 | $14,198 | $10,503 | ||||||||||||||||||
Portfolio turnover rate | 14.94% | 24.87% | 28.64% | 54.78% | 41.47% | 27.97% | ||||||||||||||||||
aThe amount shown for a share outstanding throughout the period may not correlate with the Statement of Operations for the period due to the timing of sales and repurchases of the Fund’s shares in relation to income earned and/or fluctuating fair value of the investments of the Fund.
bBased on average daily shares outstanding.
cNet investment income per share includes approximately $0.06 per share related to income received in the form of special dividends in connection with certain Fund holdings. Excluding this amount, the ratio of net investment income to average net assets would have been 0.63%.
dNet investment income per share includes approximately $0.08 per share related to income received in the form of special dividends in connection with certain Fund holdings. Excluding this amount, the ratio of net investment income to average net assets would have been (0.29)%.
eNet investment income per share includes approximately $0.08 per share related to income received in the form of special dividends in connection with certain Fund holdings. Excluding this amount, the ratio of net investment income to average net assets would have been 0.27%.
fTotal return does not reflect sales commissions or contingent deferred sales charges, if applicable, and is not annualized for periods less than one year.
gRatios are annualized for periods less than one year.
hIncludes dividend and/or interest expense on securities sold short and security borrowing fees, if any. See below for the ratios of such expenses to average net assets for the periods presented. See Note 1(d).
iBenefit of expense reduction rounds to less than 0.01%.
jRounds to less than 0.01%.
14 |
Semiannual Report |
| The accompanying notes are an integral part of these financial statements. |
franklintempleton.com |
F R A N K L I N M U T U A L I N T E R N A T I O N A L F U N D
F I N A N C I A L H I G H L I G H T S
Six Months Ended (unaudited) |
Year Ended December 31, | |||||||||||||||||||||||
| 2016 | 2015 | 2014 | 2013 | 2012 | ||||||||||||||||||||
| ||||||||||||||||||||||||
| Class R | ||||||||||||||||||||||||
Per share operating performance | ||||||||||||||||||||||||
(for a share outstanding throughout the period) | ||||||||||||||||||||||||
Net asset value, beginning of period | $14.19 | $14.05 | $14.51 | $15.83 | $13.54 | $11.82 | ||||||||||||||||||
|
| |||||||||||||||||||||||
Income from investment operationsa: | ||||||||||||||||||||||||
Net investment incomeb | 0.20 | 0.20 | c | 0.04 | d | 0.18 | e | 0.15 | 0.11 | |||||||||||||||
Net realized and unrealized gains (losses) | 1.02 | 0.20 | (0.10 | ) | (0.52 | ) | 2.43 | 1.73 | ||||||||||||||||
|
| |||||||||||||||||||||||
Total from investment operations | 1.22 | 0.40 | (0.06 | ) | (0.34 | ) | 2.58 | 1.84 | ||||||||||||||||
|
| |||||||||||||||||||||||
Less distributions from: | ||||||||||||||||||||||||
Net investment income | — | (0.21 | ) | (0.13 | ) | (0.37 | ) | (0.19 | ) | (0.10) | ||||||||||||||
Net realized gains | — | (0.05 | ) | (0.27 | ) | (0.61 | ) | (0.10 | ) | (0.02) | ||||||||||||||
|
| |||||||||||||||||||||||
Total distributions | — | (0.26 | ) | (0.40 | ) | (0.98 | ) | (0.29 | ) | (0.12) | ||||||||||||||
|
| |||||||||||||||||||||||
Net asset value, end of period | $15.41 | $14.19 | $14.05 | $14.51 | $15.83 | $13.54 | ||||||||||||||||||
|
| |||||||||||||||||||||||
Total returnf | 8.60% | 2.90% | (0.38)% | (2.13)% | 19.13% | 15.70% | ||||||||||||||||||
Ratios to average net assetsg | ||||||||||||||||||||||||
Expenses before waiver and payments by | 1.70% | 1.72% | 1.74% | 1.89% | 1.99% | 2.25% | ||||||||||||||||||
Expenses net of waiver and payments by | 1.66% | i | 1.67% | i | 1.65% | i | 1.66% | i | 1.67% | i | 1.67% | |||||||||||||
Expenses incurred in connection with | —% | —% | —% | —% | j | —% | —% | |||||||||||||||||
Net investment income | 2.45% | 1.57% | c | 0.76% | d | 1.28% | e | 1.14% | 1.20% | |||||||||||||||
Supplemental data | ||||||||||||||||||||||||
Net assets, end of period (000’s) | $1,307 | $694 | $662 | $112 | $90 | $42 | ||||||||||||||||||
Portfolio turnover rate | 14.94% | 24.87% | 28.64% | 54.78% | 41.47% | 27.97% | ||||||||||||||||||
aThe amount shown for a share outstanding throughout the period may not correlate with the Statement of Operations for the period due to the timing of sales and repurchases of the Fund’s shares in relation to income earned and/or fluctuating fair value of the investments of the Fund.
bBased on average daily shares outstanding.
cNet investment income per share includes approximately $0.06 per share related to income received in the form of special dividends in connection with certain Fund holdings. Excluding this amount, the ratio of net investment income to average net assets would have been 1.13%.
dNet investment income per share includes approximately $0.08 per share related to income received in the form of special dividends. in connection with certain Fund holdings. Excluding this amount, the ratio of net investment income to average net assets would have been 0.21%.
eNet investment income per share includes approximately $0.08 per share related to income received in the form of special dividends. in connection with certain Fund holdings. Excluding this amount, the ratio of net investment income to average net assets would have been 0.77%.
fTotal return is not annualized for periods less than one year.
gRatios are annualized for periods less than one year.
hIncludes dividend and/or interest expense on securities sold short and security borrowing fees, if any. See below for the ratios of such expenses to average net assets for the periods presented. See Note 1(d).
iBenefit of expense reduction rounds to less than 0.01%.
jRounds to less than 0.01%.
franklintempleton.com |
The accompanying notes are an integral part of these financial statements. | |
Semiannual Report |
15 |
F R A N K L I N M U T U A L I N T E R N A T I O N A L F U N D
F I N A N C I A L H I G H L I G H T S
Six Months Ended (unaudited) |
Year Ended December 31, | |||||||||||||||||||
| 2016 | 2015 | 2014 | 2013a | |||||||||||||||||
| ||||||||||||||||||||
| Class R6 | ||||||||||||||||||||
Per share operating performance | ||||||||||||||||||||
(for a share outstanding throughout the period) | ||||||||||||||||||||
Net asset value, beginning of period | $14.32 | $14.17 | $14.59 | $15.87 | $14.26 | |||||||||||||||
|
| |||||||||||||||||||
Income from investment operationsb: | ||||||||||||||||||||
Net investment incomec | 0.23 | 0.33 | d | 0.22 | e | — | f,g | 0.15 | ||||||||||||
Net realized and unrealized gains (losses) | 1.05 | 0.17 | (0.20 | ) | (0.22 | ) | 1.83 | |||||||||||||
|
| |||||||||||||||||||
Total from investment operations | 1.28 | 0.50 | 0.02 | (0.22 | ) | 1.98 | ||||||||||||||
|
| |||||||||||||||||||
Less distributions from: | ||||||||||||||||||||
Net investment income | — | (0.30 | ) | (0.17 | ) | (0.45 | ) | (0.27) | ||||||||||||
Net realized gains | — | (0.05 | ) | (0.27 | ) | (0.61 | ) | (0.10) | ||||||||||||
|
| |||||||||||||||||||
Total distributions | — | (0.35 | ) | (0.44 | ) | (1.06 | ) | (0.37) | ||||||||||||
|
| |||||||||||||||||||
Net asset value, end of period | $15.60 | $14.32 | $14.17 | $14.59 | $15.87 | |||||||||||||||
|
| |||||||||||||||||||
Total returnh | 8.94% | 3.58% | 0.23% | (1.46)% | 14.09% | |||||||||||||||
Ratios to average net assetsi | ||||||||||||||||||||
Expenses before waiver and payments by | 1.05% | 1.06% | 1.06% | 1.24% | 2.89% | |||||||||||||||
Expenses net of waiver and payments by | 1.01% | 1.00% | 1.02% | 1.00% | 1.00% | |||||||||||||||
Expenses incurred in connection with | —% | —% | —% | —% | l | —% | ||||||||||||||
Net investment income | 3.10% | 2.24% | d | 1.39% | e | 1.94% | f | 1.81% | ||||||||||||
Supplemental data | ||||||||||||||||||||
Net assets, end of period (000’s) | $19,767 | $16,687 | $23,793 | $19,398 | $6 | |||||||||||||||
Portfolio turnover rate | 14.94% | 24.87% | 28.64% | 54.78% | 41.47% | |||||||||||||||
aFor the period May 1, 2013 (commencement of operations) to December 31, 2013.
bThe amount shown for a share outstanding throughout the period may not correlate with the Statement of Operations for the period due to the timing of sales and repurchases of the Fund’s shares in relation to income earned and/or fluctuating fair value of the investments of the Fund.
cBased on average daily shares outstanding.
dNet investment income per share includes approximately $0.06 per share related to income received in the form of special dividends in connection with certain Fund holdings. Excluding this amount, the ratio of net investment income to average net assets would have been 1.80%.
eNet investment income per share includes approximately $0.08 per share related to income received in the form of special dividends in connection with certain Fund holdings. Excluding this amount, the ratio of net investment income to average net assets would have been 0.84%.
fNet investment income per share includes approximately $0.08 per share related to income received in the form of special dividends in connection with certain Fund holdings. Excluding this amount, the ratio of net investment income to average net assets would have been 1.42%.
gAmount rounds to less than $0.01 per share.
hTotal return is not annualized for periods less than one year.
i Ratios are annualized for periods less than one year.
j Includes dividend and/or interest expense on securities sold short and security borrowing fees, if any. See below for the ratios of such expenses to average net assets for the periods presented. See Note 1(d).
k Benefit of expense reduction rounds to less than 0.01%.
l Rounds to less than 0.01%.
16 |
Semiannual Report |
| The accompanying notes are an integral part of these financial statements. |
franklintempleton.com |
F R A N K L I N M U T U A L I N T E R N A T I O N A L F U N D
Statement of Investments, June 30, 2017 (unaudited)
Country
| Shares
| Value
| ||||||||
| ||||||||||
Common Stocks 86.9% | ||||||||||
Auto Components 1.2% | ||||||||||
Cie Generale des Etablissements Michelin, B | France | 16,870 | $ | 2,243,000 | ||||||
|
| |||||||||
Banks 7.3% | ||||||||||
Allied Irish Banks PLC | Ireland | 370,005 | 2,092,059 | |||||||
Barclays PLC | United Kingdom | 711,261 | 1,878,384 | |||||||
BNP Paribas SA | France | 32,930 | 2,371,957 | |||||||
HSBC Holdings PLC | United Kingdom | 274,285 | 2,542,690 | |||||||
Shinsei Bank Ltd. | Japan | 1,917,000 | 3,340,286 | |||||||
a Standard Chartered PLC | United Kingdom | 200,456 | 2,029,300 | |||||||
|
| |||||||||
| 14,254,676 | ||||||||||
|
| |||||||||
Beverages 1.3% | ||||||||||
Coca-Cola Bottlers Japan Inc. | Japan | 90,275 | 2,608,292 | |||||||
|
| |||||||||
Capital Markets 2.5% | ||||||||||
China International Capital Corp. Ltd., H | China | 2,034,999 | 3,002,554 | |||||||
a Guotai Junan Securities Co. Ltd. | China | 852,864 | 1,782,682 | |||||||
|
| |||||||||
| 4,785,236 | ||||||||||
|
| |||||||||
Chemicals 0.4% | ||||||||||
Lanxess AG | Germany | 11,239 | 851,014 | |||||||
|
| |||||||||
Communications Equipment 1.8% | ||||||||||
Nokia OYJ, A | Finland | 356,803 | 2,182,474 | |||||||
Nokia OYJ, ADR | Finland | 227,640 | 1,402,263 | |||||||
|
| |||||||||
| 3,584,737 | ||||||||||
|
| |||||||||
Construction & Engineering 0.6% | ||||||||||
FLSmidth & Co. AS | Denmark | 18,710 | 1,182,480 | |||||||
|
| |||||||||
Construction Materials 1.6% | ||||||||||
LafargeHolcim Ltd., B | Switzerland | 53,550 | 3,066,383 | |||||||
|
| |||||||||
Consumer Finance 2.1% | ||||||||||
b Hoist Finance AB, 144A | Sweden | 218,441 | 2,237,195 | |||||||
Sun Hung Kai & Co. Ltd. | Hong Kong | 2,877,748 | 1,853,936 | |||||||
|
| |||||||||
| 4,091,131 | ||||||||||
|
| |||||||||
Diversified Financial Services 2.7% | ||||||||||
AMP Ltd. | Australia | 712,151 | 2,841,534 | |||||||
Metro Pacific Investments Corp. | Philippines | 19,598,100 | 2,483,749 | |||||||
|
| |||||||||
| 5,325,283 | ||||||||||
|
| |||||||||
Diversified Telecommunication Services 6.6% | ||||||||||
China Telecom Corp. Ltd., H | China | 5,447,468 | 2,588,467 | |||||||
Deutsche Telekom AG | Germany | 222,361 | 3,992,752 | |||||||
Hellenic Telecommunications Organization SA | Greece | 252,478 | 3,039,662 | |||||||
Koninklijke KPN NV | Netherlands | 744,790 | 2,382,913 | |||||||
a Telecom Italia SpA | Italy | 931,596 | 859,805 | |||||||
|
| |||||||||
| 12,863,599 | ||||||||||
|
| |||||||||
Electric Utilities 2.4% | ||||||||||
Enel SpA | Italy | 856,234 | 4,590,888 | |||||||
|
| |||||||||
Equity Real Estate Investment Trusts (REITs) 1.4% | ||||||||||
Hibernia REIT PLC | Ireland | 1,741,347 | 2,734,949 | |||||||
|
| |||||||||
Food & Staples Retailing 1.5% | ||||||||||
Carrefour SA | France | 51,600 | 1,305,523 | |||||||
Metro AG | Germany | 48,695 | 1,643,904 | |||||||
|
| |||||||||
| 2,949,427 | ||||||||||
|
| |||||||||
franklintempleton.com |
Semiannual Report |
17 |
F R A N K L I N M U T U A L I N T E R N A T I O N A L F U N D
S T A T E M E N T O F I N V E S T M E N T S ( U N A U D I T E D )
Country
| Shares
| Value
| ||||||||
| ||||||||||
Common Stocks (continued) | ||||||||||
Hotels, Restaurants & Leisure 3.6% | ||||||||||
Accor SA | France | 97,274 | $ | 4,560,560 | ||||||
Sands China Ltd. | Hong Kong | 546,000 | 2,500,016 | |||||||
|
| |||||||||
| 7,060,576 | ||||||||||
|
| |||||||||
Household Durables 1.2% | ||||||||||
a Cairn Homes PLC | Ireland | 1,355,564 | 2,330,331 | |||||||
|
| |||||||||
Independent Power & Renewable Electricity Producers 2.0% | ||||||||||
China Longyuan Power Group Corp. | China | 5,376,000 | 3,910,945 | |||||||
|
| |||||||||
Industrial Conglomerates 2.6% | ||||||||||
Koninklijke Philips NV | Netherlands | 144,669 | 5,138,392 | |||||||
|
| |||||||||
Insurance 13.3% | ||||||||||
Ageas | Belgium | 51,414 | 2,070,737 | |||||||
ASR Nederland NV | Netherlands | 125,840 | 4,243,945 | |||||||
China Pacific Insurance Group Co. Ltd., H | China | 709,045 | 2,896,934 | |||||||
Direct Line Insurance Group PLC | United Kingdom | 495,559 | 2,294,073 | |||||||
Lancashire Holdings Ltd. | United Kingdom | 181,386 | 1,645,581 | |||||||
NN Group NV | Netherlands | 86,742 | 3,083,402 | |||||||
RSA Insurance Group PLC | United Kingdom | 389,405 | 3,121,936 | |||||||
T&D Holdings Inc. | Japan | 126,833 | 1,927,555 | |||||||
XL Group Ltd. | Bermuda | 102,729 | 4,499,530 | |||||||
|
| |||||||||
| 25,783,693 | ||||||||||
|
| |||||||||
Internet Software & Services 1.0% | ||||||||||
a Baidu Inc., ADR | China | 11,031 | 1,973,005 | |||||||
|
| |||||||||
IT Services 1.3% | ||||||||||
Cognizant Technology Solutions Corp., A | United States | 38,480 | 2,555,072 | |||||||
|
| |||||||||
Marine 0.8% | ||||||||||
A.P. Moeller-Maersk AS, B | Denmark | 741 | 1,490,094 | |||||||
|
| |||||||||
Media 2.2% | ||||||||||
Clear Media Ltd. | Hong Kong | 2,283,000 | 2,695,945 | |||||||
Sky PLC | United Kingdom | 117,011 | 1,514,982 | |||||||
|
| |||||||||
| 4,210,927 | ||||||||||
|
| |||||||||
Metals & Mining 0.9% | ||||||||||
thyssenkrupp AG | Germany | 58,392 | 1,659,119 | |||||||
|
| |||||||||
Multiline Retail 1.5% | ||||||||||
Hyundai Department Store Co. Ltd. | South Korea | 30,536 | 2,947,104 | |||||||
|
| |||||||||
Multi-Utilities 0.9% | ||||||||||
innogy SE | Germany | 43,342 | 1,706,273 | |||||||
|
| |||||||||
Oil, Gas & Consumable Fuels 4.1% | ||||||||||
BP PLC | United Kingdom | 368,488 | 2,125,325 | |||||||
China Shenhua Energy Co. Ltd., H | China | 272,213 | 605,944 | |||||||
Crescent Point Energy Corp. | Canada | 142,900 | 1,093,676 | |||||||
JXTG Holdings Inc. | Japan | 146,884 | 640,761 | |||||||
a Repsol SA | Spain | 25,850 | 395,664 | |||||||
Royal Dutch Shell PLC, A (EUR Traded) | United Kingdom | 34,447 | 914,230 | |||||||
Royal Dutch Shell PLC, A (GBP Traded) | United Kingdom | 85,525 | 2,267,002 | |||||||
|
| |||||||||
| 8,042,602 | ||||||||||
|
| |||||||||
Pharmaceuticals 6.5% | ||||||||||
GlaxoSmithKline PLC | United Kingdom | 160,200 | 3,412,774 | |||||||
Novartis AG | Switzerland | 54,449 | 4,531,974 | |||||||
Sanofi | France | 29,672 | 2,838,864 | |||||||
18 |
Semiannual Report |
franklintempleton.com |
F R A N K L I N M U T U A L I N T E R N A T I O N A L F U N D
S T A T E M E N T O F I N V E S T M E N T S ( U N A U D I T E D )
Country
| Shares
| Value
| ||||||||
| ||||||||||
Common Stocks (continued) | ||||||||||
Pharmaceuticals (continued) | ||||||||||
Teva Pharmaceutical Industries Ltd., ADR | Israel | 53,446 | $ | 1,775,476 | ||||||
|
| |||||||||
| 12,559,088 | ||||||||||
|
| |||||||||
Real Estate Management & Development 4.0% | ||||||||||
Kenedix Inc. | Japan | 607,274 | 2,861,317 | |||||||
a,c Neinor Homes SLU, Reg S | Spain | 95,000 | 2,011,845 | |||||||
Takara Leben Co. Ltd. | Japan | 654,400 | 2,932,103 | |||||||
|
| |||||||||
| 7,805,265 | ||||||||||
|
| |||||||||
Specialty Retail 2.0% | ||||||||||
a Dufry AG | Switzerland | 525 | 86,026 | |||||||
Hornbach Holding AG & Co. KGaA | Germany | 31,290 | 2,689,511 | |||||||
Kingfisher PLC | United Kingdom | 298,612 | 1,169,594 | |||||||
|
| |||||||||
| 3,945,131 | ||||||||||
|
| |||||||||
Technology Hardware, Storage & Peripherals 1.4% | ||||||||||
Samsung Electronics Co. Ltd. | South Korea | 1,324 | 2,748,769 | |||||||
|
| |||||||||
Thrifts & Mortgage Finance 1.2% | ||||||||||
Indiabulls Housing Finance Ltd. | India | 139,156 | 2,317,436 | |||||||
|
| |||||||||
Trading Companies & Distributors 1.3% | ||||||||||
Rexel SA | France | 147,760 | 2,417,757 | |||||||
|
| |||||||||
Wireless Telecommunication Services 1.7% | ||||||||||
Vodafone Group PLC | United Kingdom | 1,173,530 | 3,328,486 | |||||||
|
| |||||||||
Total Common Stocks (Cost $155,744,206) | 169,061,160 | |||||||||
|
| |||||||||
Preferred Stocks 3.4% | ||||||||||
Auto Components 1.0% | ||||||||||
d Schaeffler AG, 3.987%, pfd. | Germany | 137,281 | 1,966,387 | |||||||
|
| |||||||||
Automobiles 2.4% | ||||||||||
d Volkswagen AG, 1.545%, pfd. | Germany | 30,491 | 4,644,360 | |||||||
|
| |||||||||
Total Preferred Stocks (Cost $7,191,857) | 6,610,747 | |||||||||
|
| |||||||||
Counterparty | Notional Amount* | |||||||||
Options Purchased (Cost $22,342) 0.0%† | ||||||||||
Puts - Over-the-Counter | ||||||||||
Currency Options 0.0%† | ||||||||||
INR/USD, July Strike Price 71.75 INR, Expires 7/03/17 | HSBK | 151,105,500 | INR | 2 | ||||||
|
| |||||||||
Total Investments before Short Term Investments | 175,671,909 | |||||||||
|
| |||||||||
Country | Principal Amount* | |||||||||
Short Term Investments 10.3% | ||||||||||
U.S. Government and Agency Securities 10.3% | ||||||||||
e FHLB, | ||||||||||
7/03/17 | United States | $ | 12,000,000 | 12,000,000 | ||||||
7/05/17 | United States | 3,000,000 | 2,999,835 | |||||||
franklintempleton.com |
Semiannual Report |
19 |
F R A N K L I N M U T U A L I N T E R N A T I O N A L F U N D
S T A T E M E N T O F I N V E S T M E N T S ( U N A U D I T E D )
| Country | Principal Amount* | Value | ||||||||
| ||||||||||
Short Term Investments (continued) | ||||||||||
U.S. Government and Agency Securities (continued) | ||||||||||
e U.S. Treasury Bill, | ||||||||||
12/07/17 | United States | $ | 1,000,000 | $ | 995,355 | |||||
f 9/21/17 - 12/21/17 | United States | 4,000,000 | 3,985,070 | |||||||
|
| |||||||||
Total U.S. Government and Agency Securities | 19,980,260 | |||||||||
|
| |||||||||
Total Investments (Cost $182,937,478) 100.6% | 195,652,169 | |||||||||
Other Assets, less Liabilities (0.6)% | (1,103,856 | ) | ||||||||
|
| |||||||||
Net Assets 100.0% | $ | 194,548,313 | ||||||||
|
| |||||||||
†Rounds to less than 0.1% of net assets.
*The principal/notional amount is stated in U.S. dollars unless otherwise indicated.
aNon-income producing.
bSecurity was purchased pursuant to Rule 144A under the Securities Act of 1933 and may be sold in transactions exempt from registration only to qualified institutional buyers or in a public offering registered under the Securities Act of 1933. This security has been deemed liquid under guidelines approved by the Trust’s Board of Trustees. At June 30, 2017, the value of this security was $2,237,195, representing 1.1% of net assets.
cSecurity was purchased pursuant to Regulation S under the Securities Act of 1933, which exempts from registration securities offered and sold outside of the United States. Such a security cannot be sold in the United States without either an effective registration statement filed pursuant to the Securities Act of 1933, or pursuant to an exemption from registration. This security has been deemed liquid under guidelines approved by the Trust’s Board of Trustees. At June 30, 2017, the value of this security was $2,011,845, representing 1.0% of net assets.
dVariable rate security. The rate shown represents the yield at period end.
eThe security was issued on a discount basis with no stated coupon rate.
fA portion or all of the security has been segregated as collateral for open forward contracts. At June 30, 2017, the aggregate value of these securities and/or cash pledged amounted to $2,952,318, representing 1.5% of net assets.
20 |
Semiannual Report |
franklintempleton.com |
F R A N K L I N M U T U A L I N T E R N A T I O N A L F U N D
S T A T E M E N T O F I N V E S T M E N T S ( U N A U D I T E D )
At June 30, 2017, the Fund had the following futures contracts outstanding. See Note 1(c).
Futures Contracts
| Description | Type | Number of Contracts | Notional Value | Expiration Date | Unrealized Appreciation | Unrealized Depreciation | ||||||||||||||||||
| ||||||||||||||||||||||||
| Currency Contracts | ||||||||||||||||||||||||
EUR/USD | Short | 137 | $ | 19,637,238 | 9/18/17 | $ — | $(341,971 | ) | ||||||||||||||||
GBP/USD | Short | 68 | 5,544,125 | 9/18/17 | — | (115,692 | ) | |||||||||||||||||
|
| |||||||||||||||||||||||
Total Futures Contracts | $ — | $(457,663 | ) | |||||||||||||||||||||
|
| |||||||||||||||||||||||
Net unrealized appreciation (depreciation) | $(457,663 | ) | ||||||||||||||||||||||
|
| |||||||||||||||||||||||
At June 30, 2017, the Fund had the following forward exchange contracts outstanding. See Note 1(c).
Forward Exchange Contracts
| Currency | Counterpartya | Type | Quantity | Contract Amount | Settlement Date | Unrealized Appreciation | Unrealized Depreciation | |||||||||||||||||||||
| ||||||||||||||||||||||||||||
| OTC Forward Exchange Contracts | ||||||||||||||||||||||||||||
Euro | BOFA | Buy | 133,417 | $ | 152,539 | 7/12/17 | $ | — | $ | (41 | ) | |||||||||||||||||
Euro | BOFA | Buy | 236,836 | 269,411 | 7/12/17 | 1,298 | — | |||||||||||||||||||||
Euro | BOFA | Sell | 18,649 | 19,874 | 7/12/17 | — | (1,443 | ) | ||||||||||||||||||||
Euro | BONY | Buy | 506,473 | 572,786 | 7/12/17 | 6,124 | — | |||||||||||||||||||||
Euro | FBCO | Sell | 12,624,276 | 13,588,392 | 7/12/17 | — | (841,398 | ) | ||||||||||||||||||||
Euro | HSBK | Buy | 399,829 | 451,256 | 7/12/17 | 5,756 | — | |||||||||||||||||||||
Euro | SSBT | Buy | 1,105,833 | 1,243,520 | 7/12/17 | 20,467 | — | |||||||||||||||||||||
Euro | SSBT | Sell | 12,624,276 | 13,584,352 | 7/12/17 | — | (845,438 | ) | ||||||||||||||||||||
Euro | UBSW | Buy | 368,738 | 417,465 | 7/12/17 | 4,009 | — | |||||||||||||||||||||
Philippine Peso | BONY | Buy | 5,168,158 | 103,473 | 7/12/17 | — | (1,134 | ) | ||||||||||||||||||||
Philippine Peso | BONY | Sell | 126,872,365 | 2,543,146 | 7/12/17 | 30,837 | — | |||||||||||||||||||||
British Pound | BONY | Sell | 174,827 | 219,846 | 7/13/17 | — | (7,978 | ) | ||||||||||||||||||||
British Pound | HSBK | Sell | 1,132,201 | 1,377,453 | 7/13/17 | — | (97,959 | ) | ||||||||||||||||||||
British Pound | SSBT | Sell | 1,132,202 | 1,376,555 | 7/13/17 | — | (98,859 | ) | ||||||||||||||||||||
South Korean Won | HSBK | Buy | 538,618,860 | 479,389 | 7/14/17 | — | (8,965 | ) | ||||||||||||||||||||
South Korean Won | HSBK | Sell | 4,560,051,792 | 4,034,318 | 7/14/17 | 51,609 | — | |||||||||||||||||||||
South Korean Won | UBSW | Buy | 184,546,190 | 163,821 | 7/14/17 | — | (2,640 | ) | ||||||||||||||||||||
South Korean Won | UBSW | Sell | 2,616,513,258 | 2,302,964 | 7/14/17 | 17,725 | — | |||||||||||||||||||||
Euro | BOFA | Sell | 39,575 | 42,810 | 7/26/17 | — | (2,461 | ) | ||||||||||||||||||||
Euro | HSBK | Sell | 1,248,114 | 1,330,939 | 7/26/17 | — | (96,802 | ) | ||||||||||||||||||||
Euro | SSBT | Sell | 6,956 | 7,551 | 7/26/17 | — | (406 | ) | ||||||||||||||||||||
Euro | UBSW | Sell | 1,034,269 | 1,101,755 | 7/26/17 | — | (81,364 | ) | ||||||||||||||||||||
Australian Dollar | HSBK | Buy | 153,505 | 113,958 | 7/27/17 | 4,010 | — | |||||||||||||||||||||
Australian Dollar | HSBK | Sell | 3,813,868 | 2,880,631 | 7/27/17 | — | (50,319 | ) | ||||||||||||||||||||
Swedish Krona | BONY | Sell | 18,840,468 | 2,145,795 | 7/27/17 | — | (95,075 | ) | ||||||||||||||||||||
British Pound | BOFA | Sell | 45,207 | 55,805 | 8/14/17 | — | (3,165 | ) | ||||||||||||||||||||
British Pound | BONY | Sell | 734,857 | 903,559 | 8/14/17 | — | (55,024 | ) | ||||||||||||||||||||
British Pound | HSBK | Sell | 733,819 | 921,629 | 8/14/17 | — | (35,599 | ) | ||||||||||||||||||||
British Pound | SSBT | Sell | 294,633 | 367,653 | 8/14/17 | — | (16,680 | ) | ||||||||||||||||||||
British Pound | UBSW | Sell | 715,519 | 899,637 | 8/14/17 | — | (33,720 | ) | ||||||||||||||||||||
Euro | BOFA | Sell | 2,088,060 | 2,257,243 | 8/18/17 | — | (134,126 | ) | ||||||||||||||||||||
Euro | BONY | Sell | 25,532 | 27,576 | 8/18/17 | — | (1,665 | ) | ||||||||||||||||||||
Euro | HSBK | Sell | 890,117 | 958,279 | 8/18/17 | — | (61,139 | ) | ||||||||||||||||||||
Euro | SSBT | Sell | 860,995 | 928,478 | 8/18/17 | — | (57,585 | ) | ||||||||||||||||||||
Euro | UBSW | Sell | 460,428 | 496,938 | 8/18/17 | — | (30,370 | ) | ||||||||||||||||||||
franklintempleton.com |
Semiannual Report |
21 |
F R A N K L I N M U T U A L I N T E R N A T I O N A L F U N D
S T A T E M E N T O F I N V E S T M E N T S ( U N A U D I T E D )
Forward Exchange Contracts (continued)
| Currency | Counterpartya | Type | Quantity | Contract Amount | Settlement Date | Unrealized Appreciation | Unrealized Depreciation | |||||||||||||||||||||
| ||||||||||||||||||||||||||||
OTC Forward Exchange Contracts (continued) |
| |||||||||||||||||||||||||||
Japanese Yen | UBSW | Sell | 1,524,265,290 | $ | 13,739,547 | 8/28/17 | $ 154,046 | $ | — | |||||||||||||||||||
Euro | BOFA | Sell | 378,993 | 406,979 | 10/10/17 | — | (28,330 | ) | ||||||||||||||||||||
Euro | BONY | Sell | 26,514 | 28,511 | 10/10/17 | — | (1,943 | ) | ||||||||||||||||||||
Euro | HSBK | Sell | 270,493 | 291,070 | 10/10/17 | — | (19,617 | ) | ||||||||||||||||||||
Euro | BONY | Sell | 421,301 | 463,548 | 10/18/17 | — | (20,578 | ) | ||||||||||||||||||||
Euro | HSBK | Sell | 509,101 | 545,447 | 10/18/17 | — | (39,572 | ) | ||||||||||||||||||||
Euro | UBSW | Sell | 509,104 | 545,515 | 10/18/17 | — | (39,507 | ) | ||||||||||||||||||||
British Pound | BOFA | Sell | 389,019 | 504,483 | 10/24/17 | — | (4,070 | ) | ||||||||||||||||||||
British Pound | BONY | Sell | 23,301 | 30,231 | 10/24/17 | — | (229 | ) | ||||||||||||||||||||
British Pound | HSBK | Sell | 28,463 | 37,219 | 10/24/17 | 11 | — | |||||||||||||||||||||
British Pound | HSBK | Sell | 391,521 | 508,551 | 10/24/17 | — | (3,269 | ) | ||||||||||||||||||||
British Pound | SSBT | Sell | 966,391 | 1,264,071 | 10/24/17 | 740 | — | |||||||||||||||||||||
British Pound | SSBT | Sell | 1,604,056 | 2,071,070 | 10/24/17 | — | (25,860 | ) | ||||||||||||||||||||
British Pound | UBSW | Sell | 103,429 | 134,436 | 10/24/17 | — | (773 | ) | ||||||||||||||||||||
Euro | BOFA | Sell | 2,754,382 | 3,034,461 | 11/06/17 | — | (134,110 | ) | ||||||||||||||||||||
Euro | SSBT | Sell | 1,077,697 | 1,203,820 | 11/06/17 | — | (35,936 | ) | ||||||||||||||||||||
Euro | UBSW | Sell | 2,754,383 | 3,034,462 | 11/06/17 | — | (134,110 | ) | ||||||||||||||||||||
Euro | BOFA | Sell | 6,523,513 | 7,301,640 | 11/20/17 | — | (208,879 | ) | ||||||||||||||||||||
Euro | SSBT | Sell | 816,999 | 923,200 | 11/20/17 | — | (17,411 | ) | ||||||||||||||||||||
Euro | UBSW | Sell | 5,712,490 | 6,385,021 | 11/20/17 | — | (191,768 | ) | ||||||||||||||||||||
British Pound | BOFA | Sell | 33,908 | 44,439 | 11/24/17 | 71 | — | |||||||||||||||||||||
British Pound | BOFA | Sell | 1,487,230 | 1,904,611 | 11/24/17 | — | (41,413 | ) | ||||||||||||||||||||
British Pound | BONY | Sell | 3,232,753 | 4,233,135 | 11/24/17 | 3,114 | — | |||||||||||||||||||||
British Pound | HSBK | Sell | 20,259 | 26,525 | 11/24/17 | 17 | — | |||||||||||||||||||||
British Pound | SSBT | Sell | 11,549 | 15,037 | 11/24/17 | — | (75 | ) | ||||||||||||||||||||
British Pound | SSBT | Sell | 71,848 | 94,086 | 11/24/17 | 74 | — | |||||||||||||||||||||
British Pound | UBSW | Sell | 3,274,813 | 4,287,541 | 11/24/17 | 2,485 | — | |||||||||||||||||||||
|
| |||||||||||||||||||||||||||
Total Forward Exchange Contracts |
| $ 302,393 | $ | (3,608,805 | ) | |||||||||||||||||||||||
|
| |||||||||||||||||||||||||||
Net unrealized appreciation (depreciation) |
| $ | (3,306,412 | ) | ||||||||||||||||||||||||
|
| |||||||||||||||||||||||||||
aMay be comprised of multiple contracts with the same counterparty, currency and settlement date.
See Note 9 regarding other derivative information.
See Abbreviations on page 38.
22 |
Semiannual Report |
| The accompanying notes are an integral part of these financial statements. |
franklintempleton.com |
F R A N K L I N M U T U A L I N T E R N A T I O N A L F U N D
Statement of Assets and Liabilities
June 30, 2017 (unaudited)
Assets: | ||||
Investments in securities: | ||||
Cost - Unaffiliated issuers | $182,937,478 | |||
|
| |||
Value - Unaffiliated issuers | $195,652,169 | |||
Cash | 95,490 | |||
Foreign currency, at value (cost $813,341) | 812,981 | |||
Receivables: | ||||
Investment securities sold | 190,426 | |||
Capital shares sold | 426,670 | |||
Dividends and interest | 942,542 | |||
Due from brokers | 437,430 | |||
Variation margin | 12,056 | |||
Unrealized appreciation on OTC forward exchange contracts | 302,393 | |||
Other assets | 110 | |||
|
| |||
Total assets | 198,872,267 | |||
|
| |||
Liabilities: | ||||
Payables: | ||||
Capital shares redeemed | 284,934 | |||
Management fees | 138,475 | |||
Distribution fees | 81,929 | |||
Transfer agent fees | 37,046 | |||
Trustees’ fees and expenses | 437 | |||
Unrealized depreciation on OTC forward exchange contracts | 3,608,805 | |||
Deferred tax | 131,790 | |||
Accrued expenses and other liabilities | 40,538 | |||
|
| |||
Total liabilities | 4,323,954 | |||
|
| |||
Net assets, at value | $194,548,313 | |||
|
| |||
Net assets consist of: | ||||
Paid-in capital | $191,078,328 | |||
Undistributed net investment income | 2,067,875 | |||
Net unrealized appreciation (depreciation) | 8,827,353 | |||
Accumulated net realized gain (loss) | (7,425,243 | ) | ||
|
| |||
Net assets, at value | $194,548,313 | |||
|
|
franklintempleton.com |
The accompanying notes are an integral part of these financial statements. | |
Semiannual Report |
23 |
F R A N K L I N M U T U A L I N T E R N A T I O N A L F U N D
F I N A N C I A L S T A T E M E N T S
Statement of Assets and Liabilities (continued)
June 30, 2017 (unaudited)
| Class Z: | ||||
Net assets, at value | $66,031,712 | |||
|
| |||
Shares outstanding | 4,236,855 | |||
|
| |||
Net asset value and maximum offering price per share | $15.59 | |||
|
| |||
| Class A: | ||||
Net assets, at value | $78,250,238 | |||
|
| |||
Shares outstanding | 5,048,782 | |||
|
| |||
Net asset value per sharea | $15.50 | |||
|
| |||
Maximum offering price per share (net asset value per share ÷ 94.25%) | $16.45 | |||
|
| |||
| Class C: | ||||
Net assets, at value | $29,192,862 | |||
|
| |||
Shares outstanding | 1,914,471 | |||
|
| |||
Net asset value and maximum offering price per sharea | $15.25 | |||
|
| |||
| Class R: | ||||
Net assets, at value | $1,306,654 | |||
|
| |||
Shares outstanding | 84,800 | |||
|
| |||
Net asset value and maximum offering price per share | $15.41 | |||
|
| |||
| Class R6: | ||||
Net assets, at value | $19,766,847 | |||
|
| |||
Shares outstanding | 1,267,069 | |||
|
| |||
Net asset value and maximum offering price per share | $15.60 | |||
|
|
aRedemption price is equal to net asset value less contingent deferred sales charges, if applicable.
24 |
Semiannual Report |
| The accompanying notes are an integral part of these financial statements. |
franklintempleton.com |
F R A N K L I N M U T U A L I N T E R N A T I O N A L F U N D
F I N A N C I A L S T A T E M E N T S
Statement of Operations
for the six months ended June 30, 2017 (unaudited)
Investment income: | ||||
Dividends (net of foreign taxes of $358,197) | $ 3,579,526 | |||
Interest | 41,925 | |||
|
| |||
Total investment income | 3,621,451 | |||
|
| |||
Expenses: | ||||
Management fees (Note 3a) | 769,316 | |||
Distribution fees: (Note 3c) | ||||
Class A | 94,200 | |||
Class C | 135,775 | |||
Class R | 2,296 | |||
Transfer agent fees: (Note 3e) | ||||
Class Z | 45,422 | |||
Class A | 62,820 | |||
Class C | 22,631 | |||
Class R | 779 | |||
Class R6 | 500 | |||
Custodian fees (Note 4) | 11,555 | |||
Reports to shareholders | 23,475 | |||
Registration and filing fees | 44,282 | |||
Professional fees | 42,749 | |||
Trustees’ fees and expenses | 2,939 | |||
Other | 16,581 | |||
|
| |||
Total expenses | 1,275,320 | |||
Expense reductions (Note 4) | (209 | ) | ||
Expenses waived/paid by affiliates (Note 3f) | (36,555 | ) | ||
|
| |||
Net expenses | 1,238,556 | |||
|
| |||
Net investment income | 2,382,895 | |||
|
| |||
Realized and unrealized gains (losses): | ||||
Net realized gain (loss) from: | ||||
Investments | 1,462,144 | |||
Foreign currency transactions | 1,409,214 | |||
Futures contracts | (933,449 | ) | ||
|
| |||
Net realized gain (loss) | 1,937,909 | |||
|
| |||
Net change in unrealized appreciation (depreciation) on: | ||||
Investments | 18,384,699 | |||
Translation of other assets and liabilities denominated in foreign currencies | (7,385,648 | ) | ||
Futures contracts | (629,597 | ) | ||
Change in deferred taxes on unrealized appreciation | (131,790 | ) | ||
|
| |||
Net change in unrealized appreciation (depreciation) | 10,237,664 | |||
|
| |||
Net realized and unrealized gain (loss) | 12,175,573 | |||
|
| |||
Net increase (decrease) in net assets resulting from operations | $ 14,558,468 | |||
|
|
franklintempleton.com |
The accompanying notes are an integral part of these financial statements. | |
Semiannual Report |
25 |
F R A N K L I N M U T U A L I N T E R N A T I O N A L F U N D
F I N A N C I A L S T A T E M E N T S
Statements of Changes in Net Assets
Six Months Ended June 30, 2017 (unaudited) | Year Ended December 31, 2016 | |||||||
| ||||||||
Increase (decrease) in net assets: | ||||||||
Operations: | ||||||||
Net investment income | $ 2,382,895 | $ 3,170,309 | ||||||
Net realized gain (loss) | 1,937,909 | (7,943,873 | ) | |||||
Net change in unrealized appreciation (depreciation) | 10,237,664 | 6,339,210 | ||||||
|
| |||||||
Net increase (decrease) in net assets resulting from operations |
|
14,558,468 |
|
|
1,565,646 |
| ||
|
| |||||||
Distributions to shareholders from: | ||||||||
Net investment income: | ||||||||
Class Z | — | (752,123 | ) | |||||
Class A | — | (1,359,676 | ) | |||||
Class C | — | (229,216 | ) | |||||
Class R | — | (10,051 | ) | |||||
Class R6 | — | (334,768 | ) | |||||
Net realized gains: | ||||||||
Class Z | — | (154,704 | ) | |||||
Class A | — | (335,389 | ) | |||||
Class C | — | (106,625 | ) | |||||
Class R | — | (2,628 | ) | |||||
Class R6 | — | (63,007 | ) | |||||
|
| |||||||
Total distributions to shareholders |
|
— |
|
|
(3,348,187 |
) | ||
|
| |||||||
Capital share transactions: (Note 2) | ||||||||
Class Z | 20,620,825 | (8,767,720 | ) | |||||
Class A | (10,603,729 | ) | (27,056,442 | ) | ||||
Class C | 1,166,714 | (8,521,550 | ) | |||||
Class R | 535,531 | 24,758 | ||||||
Class R6 | 1,528,086 | (6,772,837 | ) | |||||
|
| |||||||
Total capital share transactions |
|
13,247,427 |
|
|
(51,093,791 |
) | ||
|
| |||||||
Net increase (decrease) in net assets | 27,805,895 | (52,876,332 | ) | |||||
Net assets: | ||||||||
Beginning of period | 166,742,418 | 219,618,750 | ||||||
|
| |||||||
End of period |
|
$194,548,313 |
|
|
$166,742,418 |
| ||
|
| |||||||
Undistributed net investment income included in net assets: | ||||||||
End of period | $ 2,067,875 | $ — | ||||||
|
| |||||||
Distributions in excess of net investment income included in net assets: | ||||||||
End of period | $ — | $ (315,020 | ) | |||||
|
| |||||||
26 |
Semiannual Report | The accompanying notes are an integral part of these financial statements. |
franklintempleton.com |
F R A N K L I N M U T U A L I N T E R N A T I O N A L F U N D
Notes to Financial Statements (unaudited)
1. Organization and Significant Accounting Policies
Franklin Mutual Series Funds (Trust) is registered under the Investment Company Act of 1940 (1940 Act) as an open-end management investment company, consisting of seven separate funds and applies the specialized accounting and reporting guidance in U.S. Generally Accepted Accounting Principles (U.S. GAAP). Franklin Mutual International Fund (Fund) is included in this report. The Fund offers five classes of shares: Class Z, Class A, Class C, Class R and Class R6. Each class of shares may differ by its initial sales load, contingent deferred sales charges, voting rights on matters affecting a single class, its exchange privilege and fees primarily due to differing arrangements for distribution and transfer agent fees.
The following summarizes the Fund’s significant accounting policies.
a. Financial Instrument Valuation
The Fund’s investments in financial instruments are carried at fair value daily. Fair value is the price that would be received to sell an asset or paid to transfer a liability in an orderly transaction between market participants on the measurement date. The Fund calculates the net asset value (NAV) per share as of 4 p.m. Eastern time each day the New York Stock Exchange (NYSE) is open for trading. Under compliance policies and procedures approved by the Trust’s Board of Trustees (the Board), the Fund’s administrator has responsibility for oversight of valuation, including leading the cross-functional Valuation Committee (VC). The VC provides administration and oversight of the Fund’s valuation policies and procedures, which are approved annually by the Board. Among other things, these procedures allow the Fund to utilize independent pricing services, quotations from securities and financial instrument dealers, and other market sources to determine fair value.
Equity securities and derivative financial instruments listed on an exchange or on the NASDAQ National Market System are valued at the last quoted sale price or the official closing price of the day, respectively. Foreign equity securities are valued as of the close of trading on the foreign stock exchange on which the security is primarily traded, or as of 4 p.m. Eastern time. The value is then converted into its U.S. dollar equivalent at the foreign exchange rate in effect at 4 p.m. Eastern time on the day that the value of the security is determined. Over-the-counter (OTC) securities are valued within the range of the most recent quoted bid and ask prices.
Securities that trade in multiple markets or on multiple exchanges are valued according to the broadest and most representative market. Certain equity securities are valued based upon fundamental characteristics or relationships to similar securities.
Debt securities generally trade in the OTC market rather than on a securities exchange. The Fund’s pricing services use multiple valuation techniques to determine fair value. In instances where sufficient market activity exists, the pricing services may utilize a market-based approach through which quotes from market makers are used to determine fair value. In instances where sufficient market activity may not exist or is limited, the pricing services also utilize proprietary valuation models which may consider market characteristics such as benchmark yield curves, credit spreads, estimated default rates, anticipated market interest rate volatility, coupon rates, anticipated timing of principal repayments, underlying collateral, and other unique security features in order to estimate the relevant cash flows, which are then discounted to calculate the fair value.
Certain derivative financial instruments trade in the OTC market. The Fund’s pricing services use various techniques including industry standard option pricing models and proprietary discounted cash flow models to determine the fair value of those instruments. The Fund’s net benefit or obligation under the derivative contract, as measured by the fair value of the contract, is included in net assets.
The Fund has procedures to determine the fair value of financial instruments for which market prices are not reliable or readily available. Under these procedures, the VC convenes on a regular basis to review such financial instruments and considers a number of factors, including significant unobservable valuation inputs, when arriving at fair value. The VC primarily employs a market-based approach which may use related or comparable assets or liabilities, recent transactions, market multiples, book values, and other relevant information for the investment to determine the fair value of the investment. An income-based valuation approach may also be used in which the anticipated future cash flows of the investment are discounted to calculate fair value. Discounts may also be applied due to the nature or duration of any restrictions on the disposition of the investments. Due to the inherent uncertainty of valuations of such investments, the fair values may differ significantly from the values that would have been used had an active market existed. The VC employs various methods for calibrating these
franklintempleton.com |
Semiannual Report |
27 |
F R A N K L I N M U T U A L I N T E R N A T I O N A L F U N D
N O T E S T O F I N A N C I A L S T A T E M E N T S ( U N A U D I T E D )
1. Organization and Significant Accounting Policies (continued)
a. Financial Instrument Valuation (continued)
valuation approaches including a regular review of key inputs and assumptions, transactional back-testing or disposition analysis, and reviews of any related market activity.
Trading in securities on foreign securities stock exchanges and OTC markets may be completed before 4 p.m. Eastern time. In addition, trading in certain foreign markets may not take place on every Fund’s business day. Occasionally, events occur between the time at which trading in a foreign security is completed and 4 p.m. Eastern time that might call into question the reliability of the value of a portfolio security held by the Fund. As a result, differences may arise between the value of the Fund’s portfolio securities as determined at the foreign market close and the latest indications of value at 4 p.m. Eastern time. In order to minimize the potential for these differences, the VC monitors price movements following the close of trading in foreign stock markets through a series of country specific market proxies (such as baskets of American Depositary Receipts, futures contracts and exchange traded funds). These price movements are measured against established trigger thresholds for each specific market proxy to assist in determining if an event has occurred that may call into question the reliability of the values of the foreign securities held by the Fund. If such an event occurs, the securities may be valued using fair value procedures, which may include the use of independent pricing services.
When the last day of the reporting period is a non-business day, certain foreign markets may be open on those days that the Fund’s NAV is not calculated, which could result in differences between the value of the Fund’s portfolio securities on the last business day and the last calendar day of the reporting period. Any significant security valuation changes due to an open foreign market are adjusted and reflected by the Fund for financial reporting purposes.
b. Foreign Currency Translation
Portfolio securities and other assets and liabilities denominated in foreign currencies are translated into U.S. dollars based on the exchange rate of such currencies against U.S. dollars on the date of valuation. The Fund may enter into foreign currency exchange contracts to facilitate transactions denominated in a foreign currency. Purchases and sales of securities, income and expense
items denominated in foreign currencies are translated into U.S. dollars at the exchange rate in effect on the transaction date. Portfolio securities and assets and liabilities denominated in foreign currencies contain risks that those currencies will decline in value relative to the U.S. dollar. Occasionally, events may impact the availability or reliability of foreign exchange rates used to convert the U.S. dollar equivalent value. If such an event occurs, the foreign exchange rate will be valued at fair value using procedures established and approved by the Board.
The Fund does not separately report the effect of changes in foreign exchange rates from changes in market prices on securities held. Such changes are included in net realized and unrealized gain or loss from investments in the Statement of Operations.
Realized foreign exchange gains or losses arise from sales of foreign currencies, currency gains or losses realized between the trade and settlement dates on securities transactions and the difference between the recorded amounts of dividends, interest, and foreign withholding taxes and the U.S. dollar equivalent of the amounts actually received or paid. Net unrealized foreign exchange gains and losses arise from changes in foreign exchange rates on foreign denominated assets and liabilities other than investments in securities held at the end of the reporting period.
c. Derivative Financial Instruments
The Fund invested in derivative financial instruments in order to manage risk or gain exposure to various other investments or markets. Derivatives are financial contracts based on an underlying or notional amount, require no initial investment or an initial net investment that is smaller than would normally be required to have a similar response to changes in market factors, and require or permit net settlement. Derivatives contain various risks including the potential inability of the counterparty to fulfill their obligations under the terms of the contract, the potential for an illiquid secondary market, and/or the potential for market movements which expose the Fund to gains or losses in excess of the amounts shown in the Statement of Assets and Liabilities. Realized gain and loss and unrealized appreciation and depreciation on these contracts for the period are included in the Statement of Operations.
Derivative counterparty credit risk is managed through a formal evaluation of the creditworthiness of all potential counter-parties. The Fund attempts to reduce its exposure to
28 |
Semiannual Report |
franklintempleton.com |
F R A N K L I N M U T U A L I N T E R N A T I O N A L F U N D
N O T E S T O F I N A N C I A L S T A T E M E N T S ( U N A U D I T E D )
counterparty credit risk on OTC derivatives, whenever possible, by entering into International Swaps and Derivatives Association (ISDA) master agreements with certain counterparties. These agreements contain various provisions, including but not limited to collateral requirements, events of default, or early termination. Termination events applicable to the counterparty include certain deteriorations in the credit quality of the counterparty. Termination events applicable to the Fund include failure of the Fund to maintain certain net asset levels and/or limit the decline in net assets over various periods of time. In the event of default or early termination, the ISDA master agreement gives the non-defaulting party the right to net and close-out all transactions traded, whether or not arising under the ISDA agreement, to one net amount payable by one counterparty to the other. However, absent an event of default or early termination, OTC derivative assets and liabilities are presented gross and not offset in the Statement of Assets and Liabilities. Early termination by the counterparty may result in an immediate payment by the Fund of any net liability owed to that counterparty under the ISDA agreement.
Collateral requirements differ by type of derivative. Collateral or initial margin requirements are set by the broker or exchange clearing house for exchange traded and centrally cleared derivatives. Initial margin deposited is held at the exchange and can be in the form of cash and/or securities. For OTC derivatives traded under an ISDA master agreement, posting of collateral is required by either the Fund or the applicable counterparty if the total net exposure of all OTC derivatives with the applicable counterparty exceeds the minimum transfer amount, which typically ranges from $100,000 to $250,000, and can vary depending on the counterparty and the type of the agreement. Generally, collateral is determined at the close of Fund business each day and any additional collateral required due to changes in derivative values may be delivered by the Fund or the counterparty the next business day, or within a few business days. Collateral pledged and/or received by the Fund for OTC derivatives, if any, is held in segregated accounts with the Fund’s custodian/counterparty broker and can be in the form of cash and/or securities. Unrestricted cash may be invested according to the Fund’s investment objectives. To the extent that the amounts due to the Fund from its counterparties are not subject to collateralization or are not fully collateralized, the Fund bears the risk of loss from counterparty non-performance.
The Fund entered into exchange traded futures contracts primarily to manage exposure to certain foreign currencies. A futures contract is an agreement between the Fund and a counterparty to buy or sell an asset at a specified price on a future date. Required initial margins are pledged by the Fund, and the daily change in fair value is accounted for as a variation margin payable or receivable in the Statement of Assets and Liabilities.
The Fund entered into OTC forward exchange contracts primarily to manage exposure to certain foreign currencies. A forward exchange contract is an agreement between the Fund and a counterparty to buy or sell a foreign currency at a specific exchange rate on a future date.
The Fund purchased or wrote OTC option contracts primarily to manage exposure to foreign exchange rate risk. An option is a contract entitling the holder to purchase or sell a specific amount of shares or units of an asset or notional amount of a swap (swaption), at a specified price. When an option is purchased or written, an amount equal to the premium paid or received is recorded as an asset or liability, respectively. Upon exercise of an option, the acquisition cost or sales proceeds of the underlying investment is adjusted by any premium received or paid. Upon expiration of an option, any premium received or paid is recorded as a realized gain or loss. Upon closing an option other than through expiration or exercise, the difference between the premium received or paid and the cost to close the position is recorded as a realized gain or loss.
See Note 9 regarding other derivative information.
d. Securities Sold Short
The Fund is engaged in selling securities short, which obligates the Fund to replace a borrowed security with the same security at current fair value. The Fund incurs a loss if the price of the security increases between the date of the short sale and the date on which the Fund replaces the borrowed security. The Fund realizes a gain if the price of the security declines between those dates. Gains are limited to the price at which the Fund sold the security short, while losses are potentially unlimited in size.
The Fund is required to establish a margin account with the broker lending the security sold short. While the short sale is outstanding, the broker retains the proceeds of the short sale to the extent necessary to meet margin requirements until the short position is closed out. A deposit must also be maintained with the Fund’s custodian/counterparty broker consisting of cash
franklintempleton.com |
Semiannual Report |
29 |
F R A N K L I N M U T U A L I N T E R N A T I O N A L F U N D
N O T E S T O F I N A N C I A L S T A T E M E N T S ( U N A U D I T E D )
1. Organization and Significant Accounting Policies (continued)
d. Securities Sold Short (continued)
and/or securities having a value equal to a specified percentage of the value of the securities sold short. The Fund is obligated to pay fees for borrowing the securities sold short and is required to pay the counterparty any dividends and/or interest due on securities sold short. Such dividends and/or interest and any security borrowing fees are recorded as an expense to the Fund. At June 30, 2017, the Fund had no securities sold short.
e. Securities Lending
The Fund participates in an agency based securities lending program to earn additional income. The Fund receives cash collateral against the loaned securities in an amount equal to at least 102% of the fair value of the loaned securities. Collateral is maintained over the life of the loan in an amount not less than 100% of the fair value of loaned securities, as determined at the close of Fund business each day; any additional collateral required due to changes in security values is delivered to the Fund on the next business day. The collateral is deposited into a joint cash account with other funds and is used to invest in a money market fund managed by Franklin Advisers, Inc., an affiliate of the Fund, and/or a joint repurchase agreement. The Fund may receive income from the investment of cash collateral, in addition to lending fees and rebates paid by the borrower. Income from securities loaned, net of fees paid to the securities lending agent and/or third-party vendor, is reported separately in the Statement of Operations, if any. The Fund bears the market risk with respect to the collateral investment, securities loaned, and the risk that the agent may default on its obligations to the Fund. If the borrower defaults on its obligation to return the securities loaned, the Fund has the right to repurchase the securities in the open market using the collateral received. The securities lending agent has agreed to indemnify the Fund in the event of default by a third party borrower. At June 30, 2017, the Fund had no securities on loan.
f. Income and Deferred Taxes
It is the Fund’s policy to qualify as a regulated investment company under the Internal Revenue Code. The Fund intends to distribute to shareholders substantially all of its taxable income and net realized gains to relieve it from federal income and excise taxes. As a result, no provision for U.S. federal income taxes is required.
The Fund may be subject to foreign taxation related to income received, capital gains on the sale of securities and certain foreign currency transactions in the foreign jurisdictions in which it invests. Foreign taxes, if any, are recorded based on the tax regulations and rates that exist in the foreign markets in which the Fund invests. When a capital gain tax is determined to apply, the Fund records an estimated deferred tax liability in an amount that would be payable if the securities were disposed of on the valuation date.
The Fund may recognize an income tax liability related to its uncertain tax positions under U.S. GAAP when the uncertain tax position has a less than 50% probability that it will be sustained upon examination by the tax authorities based on its technical merits. As of June 30, 2017, the Fund has determined that no tax liability is required in its financial statements related to uncertain tax positions for any open tax years (or expected to be taken in future tax years). Open tax years are those that remain subject to examination and are based on each tax jurisdiction’s statute of limitation.
g. Security Transactions, Investment Income, Expenses and Distributions
Security transactions are accounted for on trade date. Realized gains and losses on security transactions are determined on a specific identification basis. Interest income and estimated expenses are accrued daily. Amortization of premium and accretion of discount on debt securities are included in interest income. Dividend income is recorded on the ex-dividend date except for certain dividends from securities where the dividend rate is not available. In such cases, the dividend is recorded as soon as the information is received by the Fund. Distributions to shareholders are recorded on the ex-dividend date. Distributable earnings are determined according to income tax regulations (tax basis) and may differ from earnings recorded in accordance with U.S. GAAP. These differences may be permanent or temporary. Permanent differences are reclassified among capital accounts to reflect their tax character. These reclassifications have no impact on net assets or the results of operations. Temporary differences are not reclassified, as they may reverse in subsequent periods.
Common expenses incurred by the Trust are allocated among the Funds based on the ratio of net assets of each Fund to the combined net assets of the Trust. Fund specific expenses are charged directly to the Fund that incurred the expense.
30 |
Semiannual Report |
franklintempleton.com |
F R A N K L I N M U T U A L I N T E R N A T I O N A L F U N D
N O T E S T O F I N A N C I A L S T A T E M E N T S ( U N A U D I T E D )
Realized and unrealized gains and losses and net investment income, not including class specific expenses, are allocated daily to each class of shares based upon the relative proportion of net assets of each class. Differences in per share distributions, by class, are generally due to differences in class specific expenses.
h. Accounting Estimates
The preparation of financial statements in accordance with U.S. GAAP requires management to make estimates and assumptions that affect the reported amounts of assets and liabilities at the date of the financial statements and the amounts of income and expenses during the reporting period. Actual results could differ from those estimates.
i. Guarantees and Indemnifications
Under the Trust’s organizational documents, its officers and trustees are indemnified by the Trust against certain liabilities arising out of the performance of their duties to the Trust. Additionally, in the normal course of business, the Trust, on behalf of the Fund, enters into contracts with service providers that contain general indemnification clauses. The Trust’s maximum exposure under these arrangements is unknown as this would involve future claims that may be made against the Trust that have not yet occurred. Currently, the Trust expects the risk of loss to be remote.
2. Shares of Beneficial Interest
At June 30, 2017, there were an unlimited number of shares authorized (without par value). Transactions in the Fund’s shares were as follows:
Six Months Ended June 30, 2017 | Year Ended December 31, 2016 | |||||||||||||||
|
| |||||||||||||||
| Shares | Amount | Shares | Amount | |||||||||||||
| ||||||||||||||||
Class Z Shares: | ||||||||||||||||
Shares sold | 1,723,815 | $ | 25,734,945 | 1,418,415 | $ | 19,343,369 | ||||||||||
Shares issued in reinvestment of distributions | — | — | 60,850 | 863,079 | ||||||||||||
Shares redeemed | (342,359 | ) | (5,114,120 | ) | (2,150,864 | ) | (28,974,168 | ) | ||||||||
|
| |||||||||||||||
Net increase (decrease) | 1,381,456 | $ | 20,620,825 | (671,599 | ) | $ | (8,767,720 | ) | ||||||||
|
| |||||||||||||||
| Class A Shares: | ||||||||||||||||
Shares sold | 790,989 | $ | 11,908,582 | 1,936,625 | $ | 26,120,034 | ||||||||||
Shares issued in reinvestment of distributions | — | — | 118,659 | 1,674,269 | ||||||||||||
Shares redeemed | (1,539,539 | ) | (22,512,311 | ) | (4,099,974 | ) | (54,850,745 | ) | ||||||||
|
| |||||||||||||||
Net increase (decrease) | (748,550 | ) | $ | (10,603,729 | ) | (2,044,690 | ) | $ | (27,056,442 | ) | ||||||
|
| |||||||||||||||
| Class C Shares: | ||||||||||||||||
Shares sold | 360,164 | $ | 5,330,765 | 363,847 | $ | 4,831,729 | ||||||||||
Shares issued in reinvestment of distributions | — | — | 24,173 | 335,241 | ||||||||||||
Shares redeemed | (282,947 | ) | (4,164,051 | ) | (1,036,433 | ) | (13,688,520 | ) | ||||||||
|
| |||||||||||||||
Net increase (decrease) | 77,217 | $ | 1,166,714 | (648,413 | ) | $ | (8,521,550 | ) | ||||||||
|
| |||||||||||||||
| Class R Shares: | ||||||||||||||||
Shares sold | 42,410 | $ | 631,989 | 28,370 | $ | 379,915 | ||||||||||
Shares issued in reinvestment of distributions | — | — | 903 | 12,679 | ||||||||||||
Shares redeemed | (6,530 | ) | (96,458 | ) | (27,458 | ) | (367,836 | ) | ||||||||
|
| |||||||||||||||
Net increase (decrease) | 35,880 | $ | 535,531 | 1,815 | $ | 24,758 | ||||||||||
|
| |||||||||||||||
| Class R6 Shares: | ||||||||||||||||
Shares sold | 210,582 | $ | 3,163,900 | 371,903 | $ | 5,022,728 | ||||||||||
Shares issued in reinvestment of distributions | — | — | 28,018 | 397,775 | ||||||||||||
Shares redeemed | (109,042 | ) | (1,635,814 | ) | (913,622 | ) | (12,193,340 | ) | ||||||||
|
| |||||||||||||||
Net increase (decrease) | 101,540 | $ | 1,528,086 | (513,701 | ) | $ | (6,772,837 | ) | ||||||||
|
| |||||||||||||||
franklintempleton.com |
Semiannual Report |
31 |
F R A N K L I N M U T U A L I N T E R N A T I O N A L F U N D
N O T E S T O F I N A N C I A L S T A T E M E N T S ( U N A U D I T E D )
3. Transactions with Affiliates
Franklin Resources, Inc. is the holding company for various subsidiaries that together are referred to as Franklin Templeton Investments. Certain officers and trustees of the Fund are also officers and/or directors of the following subsidiaries:
| Subsidiary | Affiliation | |
| ||
Franklin Mutual Advisers, LLC (Franklin Mutual) | Investment manager | |
Franklin Templeton Services, LLC (FT Services) | Administrative manager | |
Franklin Templeton Distributors, Inc. (Distributors) | Principal underwriter | |
Franklin Templeton Investor Services, LLC (Investor Services) | Transfer agent | |
a. Management Fees
The Fund pays an investment management fee to Franklin Mutual of 0.875% per year of the average daily net assets of the Fund.
b. Administrative Fees
Under an agreement with Franklin Mutual, FT Services provides administrative services to the Fund. The fee is paid by Franklin Mutual based on the Fund’s average daily net assets, and is not an additional expense of the Fund.
c. Distribution Fees
The Board has adopted distribution plans for each share class, with the exception of Class Z and Class R6 shares, pursuant to Rule 12b-1 under the 1940 Act. Under the Fund’s Class A reimbursement distribution plan, the Fund reimburses Distributors for costs incurred in connection with the servicing, sale and distribution of the Fund’s shares up to the maximum annual plan rate. Under the Class A reimbursement distribution plan, costs exceeding the maximum for the current plan year cannot be reimbursed in subsequent periods. In addition, under the Fund’s Class C and R compensation distribution plans, the Fund pays Distributors for costs incurred in connection with the servicing, sale and distribution of the Fund’s shares up to the maximum annual plan rate for each class. The plan year, for purposes of monitoring compliance with the maximum annual plan rates, is February 1 through January 31.
The maximum annual plan rates, based on the average daily net assets, for each class, are as follows:
Class A | 0.35 | % | ||
Class C | 1.00 | % | ||
Class R | 0.50 | % |
The Board has set the current rate at 0.25% per year for Class A shares until further notice and approval by the Board.
d. Sales Charges/Underwriting Agreements
Front-end sales charges and contingent deferred sales charges (CDSC) do not represent expenses of the Fund. These charges are deducted from the proceeds of sales of Fund shares prior to investment or from redemption proceeds prior to remittance, as applicable. Distributors has advised the Fund of the following commission transactions related to the sales and redemptions of the Fund’s shares for the period:
Sales charges retained net of commissions paid to | $ | 16,925 | ||
CDSC retained |
$ |
21,072 |
|
32 |
Semiannual Report |
franklintempleton.com |
F R A N K L I N M U T U A L I N T E R N A T I O N A L F U N D
N O T E S T O F I N A N C I A L S T A T E M E N T S ( U N A U D I T E D )
e. Transfer Agent Fees
Each class of shares, except for Class R6, pays transfer agent fees to Investor Services for its performance of shareholder servicing obligations and reimburses Investor Services for out of pocket expenses incurred, including shareholder servicing fees paid to third parties. These fees are allocated daily based upon their relative proportion of such classes’ aggregate net assets. Class R6 pays Investor Services transfer agent fees specific to that class.
For the period ended June 30, 2017, the Fund paid transfer agent fees of $132,152, of which $60,157 was retained by Investor Services.
f. Waiver and Expense Reimbursements
Franklin Mutual and Investor Services have contractually agreed in advance to waive or limit their respective fees and to assume as their own expense certain expenses otherwise payable by the Fund so that the expenses (excluding distribution fees, acquired fund fees and expenses) for each class of the Fund do not exceed 1.17% and Class R6 does not exceed 1.01% based on the average net assets of each class (other than certain non-routine expenses or costs, including those relating to litigation, indemnification, reorganizations, and liquidations) until April 30, 2018. Total expenses waived or paid are not subject to recapture subsequent to the Fund’s fiscal year end. Prior to May 1, 2017, expenses for Class R6 were limited to 0.99%.
g. Other Affiliated Transactions
At June 30, 2017, one or more of the funds in Franklin Fund Allocator Series owned 8.4% of the Fund’s outstanding shares.
4. Expense Offset Arrangement
The Fund has entered into an arrangement with its custodian whereby credits realized as a result of uninvested cash balances are used to reduce a portion of the Fund’s custodian expenses. During the period ended June 30, 2017, the custodian fees were reduced as noted in the Statement of Operations.
5. Independent Trustees’ Retirement Plan
On January 1, 1993, the Trust adopted an Independent Trustees’ Retirement Plan (Plan). The Plan is an unfunded defined benefit plan that provides benefit payments to Trustees whose length of service and retirement age meets the eligibility requirements of the Plan. Benefits under the Plan are based on years of service and fees paid to each trustee at the time of retirement. Effective in December 1996, the Plan was closed to new participants.
During the period ended June 30, 2017, the Fund’s projected benefit obligation and benefit payments under the Plan were as follows:
aProjected benefit obligation at June 30, 2017 | $ | 292 | ||
bIncrease in projected benefit obligation |
$ |
54 |
| |
Benefit payments made to retired trustees |
$ |
(84 |
) |
aThe projected benefit obligation is included in trustees’ fees and expenses in the Statement of Assets and Liabilities.
bThe increase in projected benefit obligation is included in trustees’ fees and expenses in the Statement of Operations.
6. Income Taxes
For tax purposes, capital losses may be carried over to offset future capital gains, if any.
franklintempleton.com |
Semiannual Report |
33 |
F R A N K L I N M U T U A L I N T E R N A T I O N A L F U N D
N O T E S T O F I N A N C I A L S T A T E M E N T S ( U N A U D I T E D )
6. Income Taxes (continued)
At December 31, 2016, the capital loss carryforwards were as follows:
Capital loss carryforwards: | ||||
Short term | $ | 2,534,405 | ||
Long term | 2,494,574 | |||
|
| |||
Total capital loss carryforwards | $ | 5,028,979 | ||
|
|
At June 30, 2017, the cost of investments and net unrealized appreciation (depreciation) for income tax purposes were as follows:
Cost of investments | $ | 183,674,547 | ||
|
| |||
Unrealized appreciation | $ | 19,961,455 | ||
Unrealized depreciation | (7,983,833 | ) | ||
|
| |||
Net unrealized appreciation (depreciation) | $ | 11,977,622 | ||
|
|
Differences between income and/or capital gains as determined on a book basis and a tax basis are primarily due to differing treatment of foreign currency transactions.
7. Investment Transactions
Purchases and sales of investments (excluding short term securities) for the period ended June 30, 2017, aggregated $27,260,624 and $24,470,619, respectively.
8. Concentration of Risk
Investing in foreign securities may include certain risks and considerations not typically associated with investing in U.S. securities, such as fluctuating currency values and changing local and regional economic, political and social conditions, which may result in greater market volatility. In addition, certain foreign securities may not be as liquid as U.S. securities.
9. Other Derivative Information
At June 30, 2017, the Fund’s investments in derivative contracts are reflected in the Statement of Assets and Liabilities as follows:
| Asset Derivatives | Liability Derivatives | |||||||||||
Derivative Contracts Not Accounted for as Hedging Instruments | Statement of Assets and Liabilities Location | Fair Value | Statement of Assets and Liabilities Location | Fair Value | ||||||||
| ||||||||||||
Foreign exchange contracts | Investments in securities, at value | $ 2 | a | |||||||||
Variation margin | $ | 457,663 | b | |||||||||
Unrealized appreciation on OTC forward exchange contracts |
|
302,393 |
| Unrealized depreciation on OTC forward exchange contracts | 3,608,805 | |||||||
|
|
|
| |||||||||
Totals | $302,395 | $ | 4,066,468 | |||||||||
|
|
|
| |||||||||
aPurchased option contracts are included in investments in securities, at value in the Statement of Assets and Liabilities.
bThis amount reflects the cumulative appreciation (depreciation) of futures contracts as reported in the Statement of Investments. Only the variation margin receivable/ payable at period end is separately reported within the Statement of Assets and Liabilities. Prior variation margin movements were recorded to cash upon receipt or payment.
34 |
Semiannual Report |
franklintempleton.com |
F R A N K L I N M U T U A L I N T E R N A T I O N A L F U N D
N O T E S T O F I N A N C I A L S T A T E M E N T S ( U N A U D I T E D )
For the period ended June 30, 2017, the effect of derivative contracts in the Fund’s Statement of Operations was as follows:
Derivative Contracts Not Accounted for as Hedging Instruments | Statement of Operations Location | Net Realized the Period | Statement of Operations Location | Net Change in Appreciation (Depreciation) for the Period | ||||||
| ||||||||||
Foreign exchange contracts | Net realized gain (loss) from: | Net change in unrealized appreciation (depreciation) on: Investments
| $ (22,340)a
| |||||||
| Foreign currency transactions | | $1,381,752 | b | Translation of other assets and liabilities denominated in foreign currencies
| (7,404,138)b | |||||
| Futures contracts | (933,449 | ) | Futures contracts | (629,597) | ||||||
|
|
| ||||||||
Totals | $ 448,303 | $(8,056,075) | ||||||||
|
|
| ||||||||
aPurchased option contracts are included in net change in unrealized appreciation (depreciation) on investments in the Statement of Operations.
bForward exchange contracts are included in net realized gain (loss) from foreign currency transactions and net change in unrealized appreciation (depreciation) on translation of other assets and liabilities denominated in foreign currencies in the Statement of Operations.
For the period ended June 30, 2017, the average month end notional amount of futures contracts and options represented $22,831,132 and $2,106,000, respectively. The average month end contract value of forward exchange contracts was $101,837,745.
At June 30, 2017, the Fund’s OTC derivative assets and liabilities are as follows:
| Gross Amounts of Assets and Liabilities Presented in the Statement of Assets and Liabilities | ||||||||
| Assetsa | Liabilitiesa | |||||||
| ||||||||
| Derivatives | ||||||||
Forward exchange contracts | $302,393 | $3,608,805 | ||||||
Options purchased | 2 | - | ||||||
Total | $302,395 | $3,608,805 | ||||||
aAbsent an event of default or early termination, OTC derivative assets and liabilities are presented gross and not offset in the Statement of Assets and Liabilities.
At June 30, 2017, the Fund’s OTC derivative assets, which may be offset against the Fund’s OTC derivative liabilities and collateral received from the counterparty, are as follows:
| Amounts Not Offset in the Statement of Assets and Liabilities | ||||||||||||||||||||
Gross Amounts of Assets Presented in the Statement of Assets and Liabilities | Financial Instruments Available for Offset | Financial Instruments Collateral Received | Cash Collateral Received | Net Amount (Not less than zero) | ||||||||||||||||
| ||||||||||||||||||||
Counterparty | ||||||||||||||||||||
BOFA | $ 1,369 | $ (1,369 | ) | $ — | $ — | $ — | ||||||||||||||
BONY | 40,075 | (40,075 | ) | — | — | — | ||||||||||||||
FBCO | — | — | — | — | — | |||||||||||||||
HSBK | 61,405 | (61,405 | ) | — | — | — | ||||||||||||||
SSBT | 21,281 | (21,281 | ) | — | — | — | ||||||||||||||
UBSW | 178,265 | (178,265 | ) | — | — | — | ||||||||||||||
Total | $302,395 | $(302,395 | ) | $ — | $ — | $ — | ||||||||||||||
franklintempleton.com |
Semiannual Report |
35 |
F R A N K L I N M U T U A L I N T E R N A T I O N A L �� F U N D
N O T E S T O F I N A N C I A L S T A T E M E N T S ( U N A U D I T E D )
9. Other Derivative Information (continued)
At June 30, 2017, the Fund’s OTC derivative liabilities, which may be offset against the Fund’s OTC derivative assets and collateral pledged to the counterparty, are as follows:
| Amounts Not Offset in the Statement of Assets and Liabilities | ||||||||||||||||||||
Gross Amounts of | Financial Instruments Available for Offset | Financial Instruments Collateral Pledgedb,c | Cash Collateral Pledged | Net Amount (Not less than zero) | ||||||||||||||||
| ||||||||||||||||||||
Counterparty | ||||||||||||||||||||
BOFA | $ 558,038 | $ (1,369 | ) | $ (556,222 | ) | $ — | $ 447 | |||||||||||||
BONY | 183,626 | (40,075 | ) | — | — | 143,551 | ||||||||||||||
FBCO | 841,398 | — | (799,539 | ) | — | 41,859 | ||||||||||||||
HSBK | 413,241 | (61,405 | ) | (303,940 | ) | — | 47,896 | |||||||||||||
SSBT | 1,098,250 | (21,281 | ) | (894,094 | ) | — | 182,875 | |||||||||||||
UBSW | 514,252 | (178,265 | ) | (335,987 | ) | — | — | |||||||||||||
Total | $3,608,805 | $(302,395 | ) | $(2,889,782 | ) | $ — | $416,628 | |||||||||||||
bIn some instances, the collateral amounts disclosed in the table above were adjusted due to the requirement to limit collateral amounts to avoid the effect of overcollateralization. Actual collateral received and/or pledged may be more than the amounts disclosed herein.
cSee the accompanying Statement of Investments for securities pledged as collateral for derivatives.
See Note 1(c) regarding derivative financial instruments.
See Abbreviations on page 38.
10. Credit Facility
The Fund, together with other U.S. registered and foreign investment funds (collectively, Borrowers), managed by Franklin Templeton Investments, are borrowers in a joint syndicated senior unsecured credit facility totaling $2 billion (Global Credit Facility) which matures on February 9, 2018. This Global Credit Facility provides a source of funds to the Borrowers for temporary and emergency purposes, including the ability to meet future unanticipated or unusually large redemption requests.
Under the terms of the Global Credit Facility, the Fund shall, in addition to interest charged on any borrowings made by the Fund and other costs incurred by the Fund, pay its share of fees and expenses incurred in connection with the implementation and maintenance of the Global Credit Facility, based upon its relative share of the aggregate net assets of all of the Borrowers, including an annual commitment fee of 0.15% based upon the unused portion of the Global Credit Facility. These fees are reflected in other expenses in the Statement of Operations. During the period ended June 30, 2017, the Fund did not use the Global Credit Facility.
11. Fair Value Measurements
The Fund follows a fair value hierarchy that distinguishes between market data obtained from independent sources (observable inputs) and the Fund’s own market assumptions (unobservable inputs). These inputs are used in determining the value of the Fund’s financial instruments and are summarized in the following fair value hierarchy:
| • | Level 1 – quoted prices in active markets for identical financial instruments |
| • | Level 2 – other significant observable inputs (including quoted prices for similar financial instruments, interest rates, prepayment speed, credit risk, etc.) |
36 |
Semiannual Report |
franklintempleton.com |
F R A N K L I N M U T U A L I N T E R N A T I O N A L F U N D
N O T E S T O F I N A N C I A L S T A T E M E N T S ( U N A U D I T E D )
| • | Level 3 – significant unobservable inputs (including the Fund’s own assumptions in determining the fair value of financial instruments) |
The input levels are not necessarily an indication of the risk or liquidity associated with financial instruments at that level.
For movements between the levels within the fair value hierarchy, the Fund has adopted a policy of recognizing the transfers as of the date of the underlying event which caused the movement.
A summary of inputs used as of June 30, 2017, in valuing the Fund’s assets and liabilities carried at fair value, is as follows:
| Level 1 | Level 2 | Level 3 | Total | |||||||||||||
| ||||||||||||||||
| Assets: | ||||||||||||||||
Investments in Securities: | ||||||||||||||||
Equity Investmentsa,b | $ | 175,671,907 | $ | — | $ | — | $ | 175,671,907 | ||||||||
Options Purchased | — | 2 | — | 2 | ||||||||||||
Short Term Investments | 4,980,425 | 14,999,835 | — | 19,980,260 | ||||||||||||
|
| |||||||||||||||
Total Investments in Securities | $ | 180,652,332 | $ | 14,999,837 | $ | — | $ | 195,652,169 | ||||||||
|
| |||||||||||||||
Other Financial Instruments: | ||||||||||||||||
Forward Exchange Contracts | $ | �� | $ | 302,393 | $ | — | $ | 302,393 | ||||||||
|
| |||||||||||||||
| Liabilities: | ||||||||||||||||
Other Financial Instruments: | ||||||||||||||||
Futures Contracts | $ | 457,663 | $ | — | $ | — | $ | 457,663 | ||||||||
Forward Exchange Contracts | — | 3,608,805 | — | 3,608,805 | ||||||||||||
|
| |||||||||||||||
Total Other Financial Instruments | $ | 457,663 | $ | 3,608,805 | $ | — | $ | 4,066,468 | ||||||||
|
| |||||||||||||||
aIncludes common and preferred stocks.
bFor detailed categories, see the accompanying Statement of Investments.
A reconciliation of assets in which Level 3 inputs are used in determining fair value is presented when there are significant Level 3 financial instruments at the end of the period.
12. New Accounting Pronouncements
In March 2017, the Financial Accounting Standards Board issued Accounting Standards Update (ASU) No. 2017-08, Receivables—Nonrefundable Fees and Other Costs (Subtopic 310-20): Premium Amortization on Purchased Callable Debt Securities. The amendments in the ASU shorten the amortization period for certain callable debt securities, held at a premium, to be amortized to the earliest call date. The ASU does not require an accounting change for securities held at a discount; which continues to be amortized to maturity. The ASU is effective for fiscal years and interim periods within those fiscal years beginning after December 15, 2018. Management is currently evaluating the impact, if any, of applying this provision.
13. Investment Company Reporting Modernization
In October 2016, the U.S. Securities and Exchange Commission adopted new rules and amended existing rules (together, final rules) intended to modernize the reporting and disclosure of information by registered investment companies. In part, the final rules amend Regulation S-X and require standardized, enhanced disclosures about derivatives in investment company financial statements, as well as other amendments. The compliance date for the amendments to Regulation S-X is August 1, 2017. Management has reviewed the requirements and believes the adoption of the amendments to Regulation S-X will not have a material impact on the Fund’s financial statements and related disclosures.
franklintempleton.com |
Semiannual Report |
37 |
F R A N K L I N M U T U A L I N T E R N A T I O N A L F U N D
N O T E S T O F I N A N C I A L S T A T E M E N T S ( U N A U D I T E D )
14. Subsequent Events
The Fund has evaluated subsequent events through the issuance of the financial statements and determined that no events have occurred that require disclosure.
Abbreviations
| Counterparty | Currency | Selected Portfolio | ||||||||
| ||||||||||
| BOFA | Bank of America N.A. | EUR | Euro | ADR | American Depositary Receipt | |||||
| BONY | The Bank of New York Mellon Corp. | GBP | British Pound | FHLB | Federal Home Loan Bank | |||||
| FBCO | Credit Suisse International | INR | Indian Rupee | |||||||
| HSBK | HSBC Bank PLC | USD | United States Dollar | |||||||
| SSBT | State Street Bank and Trust Co., N.A. | |||||||||
| UBSW | UBS AG | |||||||||
38 |
Semiannual Report |
franklintempleton.com |
F R A N K L I N M U T U A L S E R I E S F U N D S
F R A N K L I N M U T U A L I N T E R N A T I O N A L F U N D
Board Approval of Investment Management
Agreements
FRANKLIN MUTUAL SERIES FUNDS
Franklin Mutual International Fund
(“Fund”)
The Board of Trustees (Board), including a majority of trustees that are not “interested persons” as such term is defined in section 2(a)(19) of the Investment Company Act of 1940 (hereinafter referred to as “independent trustees”), at an in-person meeting held on May 22, 2017, unanimously approved the renewal of the Fund’s investment management agreement. Prior to a meeting of all of the trustees for the purpose of considering such renewal, the independent trustees participated in two other meetings held in connection with the renewal process. Throughout the process, the independent trustees received assistance and advice from and met separately with independent counsel. The independent trustees met with and interviewed officers of the investment manager (including portfolio managers), the transfer agent and shareholder services group and the distributor. In approving the renewal of the investment management agreement for the Fund, the Board, including the independent trustees, determined that the investment management fee structure was fair and reasonable and that continuance of the agreement was in the best interests of the Fund and its shareholders.
In reaching their decision on the investment management agreement, the trustees took into account information furnished throughout the year at regular Board meetings, as well as information specifically requested and furnished for the renewal process, which culminated in the meetings referred to above for the specific purpose of considering such agreement. Information furnished throughout the year included, among others, reports on the Fund’s investment performance, expenses, portfolio composition, portfolio brokerage execution, client commission arrangements, derivatives, securities lending, asset segregation, portfolio turnover, Rule 12b-1 plan, distribution, shareholder servicing, legal and compliance matters, pricing of securities, sales and redemptions, and marketing support payments made to financial intermediaries, as well as a third-party survey of transfer agent fees charged to funds within the Franklin Templeton Investments (FTI) complex in comparison with those charged to other fund complexes deemed comparable. Also, related financial statements and other information about the scope and quality of services provided by the investment manager and its affiliates and enhancements to such services over the past year were
provided. In addition, the trustees received periodic reports throughout the year and during the renewal process relating to compliance with the Fund’s investment policies and restrictions. During the renewal process, the independent trustees considered the investment manager’s methods of operation within the Franklin Templeton group and its activities on behalf of other clients. The Board also noted that it received an annual report on all payments made by FTI or the Fund to financial intermediaries engaged in the sale of Fund shares, as well as a memorandum relating to third-party servicing arrangements in response to a Guidance Update from the U.S. Securities and Exchange Commission (SEC) relating to mutual fund distribution and sub-accounting fees.
The information obtained by the trustees during the renewal process also included a special report prepared by Broadridge Financial Solutions, Inc., an independent third-party analyst that utilizes data from Lipper, Inc. (“Lipper”), comparing the Fund’s investment performance and expenses with those of other mutual funds deemed comparable to the Fund as selected by Lipper (Broadridge Section 15(c) Report). The trustees reviewed the Broadridge Section 15(c) Report and its usefulness in the renewal process with respect to matters such as comparative fees, expenses, expense ratios, performance and volatility. They concluded that the report continues to be a reliable resource in the performance of their duties.
In addition, the trustees received a Profitability Study (Profitability Study) prepared by management discussing the profitability to FTI from its overall U.S. fund operations, as well as on an individual fund-by-fund basis. Over the past year, the Board and counsel to the independent trustees continued to receive reports on management’s handling of recent regulatory inquiries and pending legal actions against the investment manager and its affiliates. The independent trustees were satisfied with the actions taken to date by management in response to such regulatory and legal matters.
Particular attention was given to management’s diligent risk management program, including continual monitoring and management of cybersecurity, liquidity and counterparty credit risk, and attention given to derivatives and other complex instruments that are held and expected to be held by the Fund and how such instruments are used to carry out the Fund’s investment goal(s). The Board also took into account, among other things, management’s efforts in establishing a global credit facility for the benefit of the Fund and other accounts managed by FTI to provide a source of cash for temporary and emergency purposes or to meet unusual redemption requests as
franklintempleton.com |
Semiannual Report |
39 |
F R A N K L I N M U T U A L S E R I E S F U N D S
F R A N K L I N M U T U A L I N T E R N A T I O N A L F U N D
S H A R E H O L D E R I N F O R M A T I O N
well as the strong financial position of the investment manager’s parent company and its commitment to the mutual fund business. In addition, the Board received updates from management on the SEC’s progress in implementing the rule-making requirements established by the Dodd-Frank Wall Street Reform and Consumer Protection Act (Dodd-Frank Act), which was enacted July 21, 2010, and the investment manager’s compliance with rules and regulations already promulgated by the SEC under such act.
In addition to the above and other matters considered by the trustees throughout the course of the year, the following discussion relates to certain primary factors relevant to the Board’s decision. This discussion of the information and factors considered by the Board (including the information and factors discussed above) is not intended to be exhaustive, but rather summarizes certain factors considered by the Board. In view of the wide variety of factors considered, the Board did not, unless otherwise noted, find it practicable to quantify or otherwise assign relative weights to the foregoing factors. In addition, individual trustees may have assigned different weights to various factors.
NATURE, EXTENT AND QUALITY OF SERVICES. The trustees reviewed the nature, extent and quality of the services provided, and to be provided, by the investment manager. The trustees cited the investment manager’s ability to implement the Fund’s disciplined value investment approach and its long-term relationship with the Fund as reasons that shareholders choose to invest, and remain invested, in the Fund. The trustees reviewed the Fund’s portfolio management team, including its performance, staffing, skills and compensation program. With respect to portfolio manager compensation, management assured the trustees that the Fund’s long-term performance is a significant component of incentive-based compensation and noted that a portion of a portfolio manager’s incentive-based compensation is paid in shares of pre-designated funds from the portfolio manager’s fund management area. The trustees noted that the portfolio manager compensation program aligned the interests of the portfolio managers with that of shareholders of the Fund. The trustees discussed with management various other products, portfolios and entities that are advised by the investment manager and the allocation of assets and expenses among and within them, as well as their relative fees and reasons for differences with respect thereto and any potential conflicts. During regular Board meetings and the aforementioned meetings of the independent trustees, the trustees received reports and presentations on the investment manager’s best execution trading policies. The trustees considered
periodic reports provided to them showing that the investment manager complied with the investment policies and restrictions of the Fund as well as other reports periodically furnished to the Board covering matters such as the compliance of portfolio managers and other management personnel with the code of ethics covering the investment management personnel, the adherence to fair value pricing procedures established by the Board and the accuracy of net asset value calculations. The Board noted the extent of the benefits provided to Fund shareholders from being part of the Franklin Templeton group of funds, including the right to exchange investments between funds (same class) without a sales charge, the ability to reinvest Fund dividends into other funds and the right to combine holdings of other funds to obtain reduced sales charges. The Board considered the investment manager’s significant efforts in developing and implementing compliance procedures established in accordance with SEC and other requirements.
The Board considered the nature, extent and quality of the services to be provided under the Fund’s other service agreements to determine that, on an overall basis, Fund shareholders were well served. In this connection, the Board also took into account transfer agent and shareholder services provided to Fund shareholders by an affiliate of the investment manager, noting continuing expenditures by management to increase and improve the scope of such services and favorable periodic reports on shareholder services conducted by independent third parties. While such considerations directly affected the trustees’ decision in renewing the Fund’s transfer agent and shareholder services agreement, the Board also considered these commitments as incidental benefits to Fund shareholders deriving from the investment management relationship.
Based on their review, the trustees were satisfied with the nature and quality of the overall services provided, and to be provided, by the investment manager and its affiliates to the Fund and its shareholders and were confident in the abilities of the management team to continue the disciplined value investment approach of the Fund and to provide quality services to the Fund and its shareholders.
INVESTMENT PERFORMANCE. As the Fund commenced operations on May 31, 2009, the trustees reviewed the investment performance of the Fund for the one-, three- and five-year periods ended December 31, 2016. They considered the history of successful performance of the Fund relative to various benchmarks. As part of their review, they inquired of management regarding benchmarks, style drift and restrictions
40 |
Semiannual Report |
franklintempleton.com |
F R A N K L I N M U T U A L S E R I E S F U N D S
F R A N K L I N M U T U A L I N T E R N A T I O N A L F U N D
S H A R E H O L D E R I N F O R M A T I O N
on permitted investments. Consideration was also given to performance in the context of available levels of cash during the periods.
The trustees had meetings during the year, including the meetings referred to above held in connection with the renewal process, with the Fund’s portfolio managers to discuss performance and the management of the Fund. In addition, particular attention in assessing performance was given to the Broadridge Section 15(c) Report. That report showed the investment performance of the Fund (Class A shares) in comparison to other funds determined comparable by Lipper.
The comparable funds to the Fund, as chosen by Lipper, included all retail and institutional international multi-cap value funds. The Fund had total returns in the second-best performing quintile for the one-year period ended December 31, 2016, and had annualized total returns for the three- and five-year periods in the best and second-best performing quintiles, respectively. The trustees were satisfied with such comparative performance.
The trustees also compared Fund performance to other industry benchmarks, including measures of risk-adjusted performance of a fund, as part of their evaluation of investment performance. The trustees concluded that the Fund had continued to perform well in comparison to its various benchmarks and in the context of the Fund’s goals.
COMPARATIVE EXPENSES AND MANAGEMENT PROFITABILITY. The trustees considered the cost of the services provided and to be provided and the losses incurred by the investment manager and its affiliates from their respective relationships with the Fund. In considering the appropriateness of the management fee and other expenses charged to the Fund, the Board took into account various factors including investment performance and matters relating to Fund operations, including, but not limited to, the quality and experience of its portfolio managers and research staff. As part of this discussion, the Board took into account the extension for an additional year of the fee waiver and expense limitation arrangement. Consideration was also given to a comparative analysis in the Broadridge Section 15(c) Report of the investment management fee and total expense ratio of the Fund in comparison with those of a group of other funds selected by Lipper as its appropriate Lipper expense group. Lipper expense data is based upon information taken from the Fund’s most recent annual report, which reflects historical asset levels that may be quite different from those currently existing, particularly in a period of market volatility. While recognizing such inherent limitation and the fact that expense ratios
generally increase as assets decline and decrease as assets grow, the Board believed the independent analysis conducted by Lipper to be an appropriate measure of comparative expenses.
In reviewing comparative costs, emphasis was given to the Fund’s contractual management fee in comparison with the contractual management fee that would have been charged by other funds within its Lipper expense group assuming they were similar in size to the Fund, as well as the actual total expenses of the Fund in comparison with those of its Lipper expense group. The Lipper contractual management fee analysis includes administrative charges as being part of the management fee, and total expenses, for comparative consistency, are shown by Lipper for Fund Class A shares.
The Fund’s contractual management fee rate was in the middle quintile of its Lipper expense group and its total expenses were in the second-most expensive quintile of such group. The Board noted that the Fund’s total expenses were within 6 basis points of its expense group median. The Board found such comparative fees and expenses to be acceptable in view of factors relating to the Fund’s operations, such as the quality and experience of its portfolio managers.
The trustees also reviewed the Profitability Study addressing profitability of Franklin Resources, Inc., from its overall U.S. fund business, as well as profitability to the Fund’s investment manager and its affiliates, from providing investment management and other services to the Fund during the 12-month period ended September 30, 2016, the most recent fiscal year-end of Franklin Resources, Inc. The trustees reviewed the basis on which such reports are prepared and the cost allocation methodology utilized in the Profitability Study, it being recognized that allocation methodologies may each be reasonable while producing different results. In this respect, the Board noted that the reasonableness of the cost allocation methodologies was reviewed by independent accountants on an every other year basis.
The independent trustees met with management to discuss the Profitability Study. This included, among other things, a comparison of investment management income with investment management expenses of the Fund; comparison of underwriting revenues and expenses; the relative relationship of investment management and underwriting expenses; shareholder servicing profitability; economies of scale; and the relative contribution of the Fund to the profitability of the investment manager and its parent. In discussing the Profitability Study with the Board, the investment manager stated its belief that the costs incurred
franklintempleton.com |
Semiannual Report |
41 |
F R A N K L I N M U T U A L S E R I E S F U N D S
F R A N K L I N M U T U A L I N T E R N A T I O N A L F U N D
S H A R E H O L D E R I N F O R M A T I O N
in establishing the infrastructure necessary to operate the type of mutual fund operations conducted by it and its affiliates may not be fully reflected in the expenses allocated to the Fund in determining its profitability.
The Board also took into account management’s expenditures in improving shareholder services provided to the Fund, as well as the need to meet additional regulatory and compliance requirements resulting from the Sarbanes-Oxley Act, the Dodd-Frank Act and recent SEC and other regulatory requirements. The trustees also considered the extent to which the investment manager may derive ancillary benefits from Fund operations, including those derived from economies of scale, discussed below, the allocation of Fund brokerage and the use of commission dollars to pay for research and other similar services.
Based upon their consideration of all these factors, the trustees determined that the level of profits realized by the investment manager and its affiliates in providing services to the Fund was not excessive in view of the nature, quality and extent of services provided.
ECONOMIES OF SCALE. The Board considered economies of scale realized by the investment manager and its affiliates as the Fund grows larger and the extent to which they are shared with Fund shareholders, as for example, in the level of the investment management fee charged, in the quality and efficiency of services rendered and in increased capital commitments benefiting the Fund directly or indirectly. The Board also considered the fee waiver and expense limitation arrangement in effect, and the amount of Fund expenses that were absorbed since inception of the Fund by the investment manager through such waiver and arrangement. The Board concluded that economies of scale were deemed not to be a significant factor at that time in light of, among other matters, the fee waiver and expense limitation arrangement in effect and the limited size of assets under management.
Proxy Voting Policies and Procedures
The Fund’s investment manager has established Proxy Voting Policies and Procedures (Policies) that the Fund uses to determine how to vote proxies relating to portfolio securities. Shareholders may view the Fund’s complete Policies online at franklintempleton.com. Alternatively, shareholders may request copies of the Policies free of charge by calling the Proxy Group collect at (954) 527-7678 or by sending a written request to: Franklin Templeton Companies, LLC, 300 S.E. 2nd Street, Fort Lauderdale, FL 33301, Attention: Proxy Group. Copies of
the Fund’s proxy voting records are also made available online at franklintempleton.com and posted on the U.S. Securities and Exchange Commission’s website at sec.gov and reflect the most recent 12-month period ended June 30.
Quarterly Statement of Investments
The Trust, on behalf of the Fund, files a complete statement of investments with the U.S. Securities and Exchange Commission for the first and third quarters for each fiscal year on Form N-Q. Shareholders may view the filed Form N-Q by visiting the Commission’s website at sec.gov. The filed form may also be viewed and copied at the Commission’s Public Reference Room in Washington, DC. Information regarding the operations of the Public Reference Room may be obtained by calling (800) SEC-0330.
42 |
Semiannual Report |
franklintempleton.com |
This page intentionally left blank.
This page intentionally left blank.
| Semiannual Report and Shareholder Letter Franklin Mutual International Fund
Investment Manager Franklin Mutual Advisers, LLC
Distributor Franklin Templeton Distributors, Inc. (800) DIAL BEN® / 342-5236 franklintempleton.com
Shareholder Services (800) 632-2301 - (Class A, C, R & R6) (800) 448-FUND - (Class Z) |
Authorized for distribution only when accompanied or preceded by a summary prospectus and/or prospectus. Investors should carefully consider a fund’s investment goals, risks, charges and expenses before investing. A prospectus contains this and other information; please read it carefully before investing.
To help ensure we provide you with quality service, all calls to and from our service areas are monitored and/or recorded.
© 2017 Franklin Templeton Investments. All rights reserved. | 373 S 08/17 |
| Item 2. | Code of Ethics. |
(a) The Registrant has adopted a code of ethics that applies to its principal executive officers and principal financial and accounting officer.
(c) N/A
(d) N/A
(f) Pursuant to Item 12(a)(1), the Registrant is attaching as an exhibit a copy of its code of ethics that applies to its principal executive officers and principal financial and accounting officer.
| Item 3. | Audit Committee Financial Expert. |
(a)(1) The Registrant has an audit committee financial expert serving on its audit committee.
(2) The audit committee financial expert is Ann Torre Bates, and she is “independent” as defined under the relevant Securities and Exchange Commission Rules and Releases.
| Item 4. | Principal Accountant Fees and Services. N/A |
| Item 5. | Audit Committee of Listed Registrants. N/A |
| Item 6. | Schedule of Investments. N/A |
| Item 7. | Disclosure of Proxy Voting Policies and Procedures for Closed-End Management Investment Companies. N/A |
| Item 8. | Portfolio Managers of Closed-End Management Investment Companies. N/A |
| Item 9. | Purchases of Equity Securities by Closed-End Management Investment Company and Affiliated Purchasers. N/A |
| Item 10. | Submission of Matters to a Vote of Security Holders. |
There have been no changes to the procedures by which shareholders may recommend nominees to the Registrant’s Board of Trustees that would require disclosure herein.
| Item 11. | Controls and Procedures. |
(a) Evaluation of Disclosure Controls and Procedures. The Registrant maintains disclosure controls and procedures that are designed to ensure that information required to be disclosed in the Registrant’s filings under the Securities Exchange Act of 1934 and the Investment
Company Act of 1940 is recorded, processed, summarized and reported within the periods specified in the rules and forms of the Securities and Exchange Commission. Such information is accumulated and communicated to the Registrant’s management, including its principal executive officer and principal financial officer, as appropriate, to allow timely decisions regarding required disclosure. The Registrant’s management, including the principal executive officer and the principal financial officer, recognizes that any set of controls and procedures, no matter how well designed and operated, can provide only reasonable assurance of achieving the desired control objectives.
Within 90 days prior to the filing date of this Shareholder Report on Form N-CSR, the Registrant had carried out an evaluation, under the supervision and with the participation of the Registrant’s management, including the Registrant’s principal executive officer and the Registrant’s principal financial officer, of the effectiveness of the design and operation of the Registrant’s disclosure controls and procedures. Based on such evaluation, the Registrant’s principal executive officer and principal financial officer concluded that the Registrant’s disclosure controls and procedures are effective.
(b) Changes in Internal Controls. There have been no changes in the Registrant’s internal controls or in other factors that could materially affect the internal controls over financial reporting subsequent to the date of their evaluation in connection with the preparation of this Shareholder Report on Form N-CSR.
| Item 12. | Exhibits. |
(a)(1) Code of Ethics
(a)(2) Certifications pursuant to Section 302 of the Sarbanes-Oxley Act of 2002 of Matthew T. Hinkle, Chief Executive Officer - Finance and Administration, and Robert G. Kubilis, Chief Financial Officer and Chief Accounting Officer
(b) Certifications pursuant to Section 906 of the Sarbanes-Oxley Act of 2002 of Matthew T. Hinkle, Chief Executive Officer - Finance and Administration, and Robert G. Kubilis, Chief Financial Officer and Chief Accounting Officer
SIGNATURES
Pursuant to the requirements of the Securities Exchange Act of 1934 and the Investment Company Act of 1940, the registrant has duly caused this report to be signed on its behalf by the undersigned, thereunto duly authorized.
FRANKLIN MUTUAL SERIES FUNDS
| By | /s/ Matthew T. Hinkle | |
| Matthew T. Hinkle | ||
| Chief Executive Officer - Finance and Administration | ||
| Date | August 25, 2017 |
Pursuant to the requirements of the Securities Exchange Act of 1934 and the Investment Company Act of 1940, this report has been signed below by the following persons on behalf of the registrant and in the capacities and on the dates indicated.
| By | /s/ Matthew T. Hinkle | |
| Matthew T. Hinkle | ||
| Chief Executive Officer - Finance and Administration | ||
| Date | August 25, 2017 |
| By | /s/ Robert G. Kubilis | |
Robert G. Kubilis Chief Financial Officer and Chief Accounting Officer | ||
| Date: | August 25, 2017 |