UNITED STATES
SECURITIES AND EXCHANGE COMMISSION
Washington, DC 20549
FORM N-CSRS
CERTIFIED SHAREHOLDER REPORT OF REGISTERED MANAGEMENT INVESTMENT COMPANIES
Investment Company Act file number 811–05387
Franklin Mutual Series Funds
(Exact name of registrant as specified in charter)
101 John F. Kennedy Parkway, Short Hills, NJ 07078–2705
(Address of principal executive offices) (Zip code)
Craig S. Tyle, One Franklin Parkway, San Mateo, CA 94403–1906
(Name and address of agent for service)
Registrant’s telephone number, including area code: (210) 912–2100
Date of fiscal year end: 12/31
Date of reporting period: 6/30/18
Item 1. Reports to Stockholders.
Franklin Templeton Investments
Why choose Franklin Templeton Investments?
Successful investing begins with ambition. And achievement only comes when you reach for it. That’s why we continually strive to deliver better outcomes for investors. No matter what your goals are, our deep, global investment expertise allows us to offer solutions that can help.
During our more than 70 years of experience, we’ve managed through all kinds of markets—up, down and those in between. We’re always preparing for what may come next. It’s because of this, combined with our strength as one of the world’s largest asset managers that we’ve earned the trust of millions of investors around the world.
Dear Franklin Mutual Beacon Fund Shareholder:
Securities markets started 2018 with positive momentum. Investors began the year focused on global economic growth, strong corporate profits across most developed markets and the potential benefits of US corporate and personal tax cuts. However, volatility and market downturns emerged due to political risks and trade tariffs, a temporary deceleration in developed market economic activity during the first quarter, and higher bond yields amid potential signs of increasing inflation pressures and likely interest rate hikes. Although some risks faded, such as the first-quarter deceleration in economic growth, the potential for an escalating trade war between the US and its trading partners remained a meaningful uncertainty for investors. For the period ended June 30, 2018, US stocks, as measured by the Standard & Poor’s® 500 Index (S&P 500®), produced a +2.65% total return.1 Stocks in global developed markets, as measured by the MSCI World Index, returned +0.76%, while investment-grade bonds, as measured by the Bloomberg Barclays US Aggregate Bond Index, had a -1.62% total return.1
Market performance was rather uneven during the period. Although the S&P 500 performed positively, most of the gains could be accounted for by a small number of companies. The list of those leading performers showed a concentration in information technology and internet-focused companies, or businesses that directly benefit from increased online commerce. It is no surprise, therefore, that growth stocks managed to outpace value stocks during the period. The Russell
1000® Growth Index returned +7.25%, while the Russell 1000® Value Index had a -1.69% total return.1
We do not know how long growth will continue to outpace value, but historically, periods of solid and steady economic growth have been a positive backdrop for value stocks. Low unemployment rates, increased business investment and solid consumer spending are all constructive signs for such a pace of economic growth. The US Federal Reserve’s efforts to gradually raise interest rates may be favorable for financial equities.
Value investing often requires an investor to be contrarian in nature. We continue to maintain a bottom-up stock-picking process that is disciplined, driven by rigorous fundamental analysis and attempts to limit downside risk. In our view, investing in underappreciated and misunderstood companies with identifiable catalysts for unlocking shareholder value can offer meaningful upside potential and a degree of downside protection in periods of financial market turbulence.
Although economic and investment fundamentals still appear to be favorable, the return of volatility is another reminder that securities markets are dynamic. As we enter into the second half of 2018, market sentiment may easily turn again given the uncertainty regarding an escalation in trade tensions, the upcoming US midterm elections, Brexit, the ability of US tax cuts to prolong the current economic expansion, and the pace of
1. Source: Morningstar. Frank Russell Company is the source and owner of the trademarks, service marks and copyrights related to the Russell Indexes. Russell® is a trademark of Frank Russell Company.
See www.franklintempletondatasources.com for additional data provider information.
| Not FDIC Insured | | | May Lose Value | | | No Bank Guarantee |
| franklintempleton.com | Not part of the semiannual report | 1 |
inflation. Therefore, we believe active, professional investment management serves investors well.
We also recognize the important role of financial advisors in today’s markets and encourage investors to continue to seek their advice. Amid changing markets and economic conditions, we are confident investors with a well-diversified portfolio and a patient, long-term outlook should be well positioned for the years ahead.
On the following pages, the Fund’s portfolio management team reviews investment decisions that pertain to performance during the past six months in light of the economic environment and other factors. Please remember all securities markets fluctuate, as do mutual fund share prices.
We thank you for investing with Franklin Templeton, welcome your questions and comments, and look forward to continuing to serve your investment needs in the years ahead.
Sincerely,

Peter A. Langerman
Chairman, President and Chief Executive Officer
Franklin Mutual Advisers, LLC
This letter reflects our analysis and opinions as of June 30, 2018, unless otherwise indicated. The information is not a complete analysis of every aspect of any market, country, industry, security or fund. Statements of fact are from sources considered reliable.
Contents
Semiannual Report
| Franklin Mutual Beacon Fund | 3 | |||
| Performance Summary | 9 | |||
| Your Fund’s Expenses | 11 | |||
| Financial Highlights and Statement of Investments | 12 | |||
| Financial Statements | 23 | |||
| Notes to Financial Statements | 27 | |||
Shareholder Information
|
| 39
|
| |
Visit franklintempleton.com for fund updates, to access your account, or to find helpful financial planning tools.
| 2 | Not part of the semiannual report | franklintempleton.com |
Semiannual Report
Franklin Mutual Beacon Fund
This semiannual report for Franklin Mutual Beacon Fund covers the period ended June 30, 2018.
Your Fund’s Goal and Main Investments
The Fund seeks capital appreciation, which may occasionally be short term, with income as a secondary goal. Under normal market conditions, the Fund invests primarily in equity securities of US and foreign companies that the investment manager believes are available at market prices less than their intrinsic value. The equity securities in which the Fund invests are primarily common stock, with a current focus on mid- and large-cap companies. To a lesser extent, the Fund also invests in merger arbitrage securities and the debt and equity of distressed companies. The Fund may invest a substantial portion, potentially up to 100% of its assets, in foreign securities, which may include sovereign debt and participations in foreign government debt. The Geographic Composition bar chart on this page lists the leading countries where the Fund invests.
Performance Overview
The Fund’s Class Z shares had a -1.87% cumulative total return for the six months ended June 30, 2018. In comparison, the Fund’s benchmark, the MSCI World Index (USD), which tracks stock performance in global developed markets, posted a +0.76% total return.1 You can find more of the Fund’s performance data in the Performance Summary beginning on page 9.
Performance data represent past performance, which does not guarantee future results. Investment return and principal value will fluctuate, and you may have a gain or loss when you sell your shares. Current performance may differ from figures shown. For most recent month-end performance, go to franklintempleton.com or call (800) 342-5236.
Economic and Market Overview
The global economy expanded during the six-month period under review amid generally upbeat economic data across regions. In this environment, global developed and emerging
Geographic Composition*
Based on Total Net Assets as of 6/30/18
*Figures are stated as a percentage of total and may not equal 100% or may be negative due to rounding, use of any derivatives, unsettled trades or other factors. The Fund held 37.0% of total net assets in foreign securities.
market stocks reached a new all-time high in January 2018, as measured by the MSCI All Country World Index (ACWI). During the period, global markets were aided by price gains in oil and other commodities, encouraging corporate earnings reports and investor optimism about global economic growth. However, global stocks had a -0.13% total return for the six-month period, as measured by the MSCI ACWI, largely due to an overall decline in emerging market stocks.1
Global markets reflected investor concerns about tensions in the Korean peninsula and political uncertainties in the US and the European Union, as well as worries that strong economic growth and rising inflation in some parts of the world, particularly in the US, would lead central banks to increase
1. Source: Morningstar.
The index is unmanaged and includes reinvestment of any income or distributions. It does not reflect any fees, expenses or sales charges. One cannot invest directly in an index, and an index is not representative of the Fund’s portfolio.
The dollar value, number of shares or principal amount, and names of all portfolio holdings are listed in the Fund’s Statement of Investments (SOI). The SOI begins on page 17.
| franklintempleton.com | Semiannual Report | 3 |
FRANKLIN MUTUAL BEACON FUND
interest rates sooner than expected. Markets were further pressured by the Trump administration’s protectionist trade policies, uncertainty surrounding the US-China trade relationship, and a broad sell-off in information technology stocks in March due to a potential for tighter regulation in the sector arising from concerns about consumer data privacy. Near period-end, an overall easing of tensions in the Korean peninsula relieved investors, but ongoing US trade disputes with its allies and China hindered global markets.
The US economy continued to grow during the six months under review. After moderating for three consecutive quarters, the economy grew faster in 2018’s second quarter, driven by consumer spending, exports, business investment and government spending. The unemployment rate declined from 4.1% in December 2017, as reported at the beginning of the six-month period, to 4.0% at period-end.2 Annual inflation, as measured by the Consumer Price Index, increased from 2.1% in December 2017, as reported at the beginning of the period, to 2.9% at period-end.2 The US Federal Reserve raised its target range for the federal funds rate in March and June 2018 and continued reducing its balance sheet as part of its ongoing plan to normalize monetary policy.
In Europe, the UK’s quarterly economic growth moderated in 2018’s first quarter amid a decline in construction output. The Bank of England kept its key policy rate unchanged during the period. The eurozone’s quarterly growth moderated in 2018’s first quarter due to a decline in external demand. The bloc’s annual inflation rate ended the period higher than in December 2017. The European Central Bank (ECB) kept its benchmark interest rate unchanged during the period. However, at its June meeting, the ECB announced it would further reduce its monthly bond purchases beginning in October 2018 and indicated it would conclude the program at the end of 2018 while continuing to keep interest rates unchanged through at least the summer of 2019.
In Asia, Japan’s quarterly gross domestic product (GDP) growth in 2018’s first quarter was negative, the country’s first contraction since 2015’s fourth quarter, mainly due to a decline in private residential investment and household consumption. The Bank of Japan left its benchmark interest rate unchanged during the period and continued its monetary stimulus measures.
In emerging markets, Brazil’s quarterly GDP accelerated in 2018’s first quarter compared to the previous quarter. The
2. Source: Bureau of Labor Statistics.
country’s central bank cut its benchmark interest rate twice during the period to spur economic growth. Russia’s annual GDP grew in 2018’s first quarter compared to the prior-year period, amid the Bank of Russia’s continued policy support. China’s annual GDP moderated in 2018’s first quarter compared to the prior-year period. The People’s Bank of China left its benchmark interest rate unchanged during the period. Overall, emerging market stocks, as measured by the MSCI Emerging Markets Index, declined during the period.
Investment Strategy
At Franklin Mutual Series, we are committed to our distinctive value approach to investing, which we believe can generate above-average risk-adjusted returns over time for our shareholders. Our major investment strategy is investing in undervalued stocks. When selecting undervalued equities, we are attracted to what we believe are fundamentally strong companies with healthy balance sheets, high-quality assets, substantial free cash flow and shareholder-oriented management teams and whose stocks are trading at discounts to our assessment of the companies’ intrinsic or business value. We also look for asset-rich companies whose shares may be trading at depressed levels due to concerns over short-term earnings disappointments, litigation, management strategy or other perceived negatives. This strict value approach is not only intended to improve the likelihood of upside potential, but also reduces the risk of substantial declines, in our opinion. While the vast majority of our undervalued equity investments are made in publicly traded companies globally, we may invest occasionally in privately held companies as well.
We complement this more traditional investment strategy with two others. One is distressed investing, a highly specialized field that has proven quite profitable during certain periods over the years. Distressed investing is complex and can take many forms. The most common distressed investment the Fund undertakes is the purchase of financially troubled or bankrupt companies’ debt at a substantial discount to face value. After the financially distressed company is reorganized, often in bankruptcy court, the old debt is typically replaced with new securities issued by the financially stronger company.
The other piece of our investment strategy is participating in arbitrage situations, another highly specialized field. When companies announce proposed mergers or takeovers, commonly referred to as “deals,” the target company may trade at a discount to the bid it ultimately accepts. One form of
| 4 | Semiannual Report | franklintempleton.com |
FRANKLIN MUTUAL BEACON FUND
arbitrage involves purchasing the target company’s stock when it is trading below the value we believe it would receive in a deal. In keeping with our commitment to a relatively conservative investment approach, we typically focus our arbitrage efforts on announced deals, and avoid rumored deals or other situations we consider relatively risky. In addition, it is our practice to hedge the Fund’s currency exposure when we deem it advantageous for our shareholders.
What is meant by “hedge”?
To hedge an investment is to take a position intended to offset potential losses/gains that may be incurred by a companion financial instrument.
|
Manager’s Discussion
In the first half of 2018, positive corporate fundamentals were overshadowed by political and economic concerns. Corporate profits in the US and other developed markets continued their impressive year-over-year pace of growth. In the US and other developed markets, economic activity moderated during the first quarter, but appeared to have recovered during the second quarter. Financial markets were also aided by improved industrial commodity prices, most notably crude oil. Nonetheless, investor sentiment became less upbeat and volatility returned to financial markets, after an historically calm 2017.
As investors entered 2018, overall US equity market valuations (e.g., price-to-earnings, price-to-book or price-to-sales) were elevated relative to most historical benchmarks. The uneven equity market performance during the period and the strong pace of corporate earnings growth helped to reduce valuations somewhat. At the same time, the rise in volatility provided us with select opportunities to initiate or add to positions in companies that we believed were trading at undeservedly discounted prices.
A further escalation of trade-related rhetoric and tariffs, in our view, could have important consequences for the US and abroad. We have already begun to see disruptions to global supply chains and added pressure on China’s financial and credit markets. Additional tariffs imposed by the US and its trading partners could rattle business confidence, curb corporate earnings growth, undermine favorable fundamentals in specific industries, provoke further financial market volatility and raise uncertainty regarding the solid pace of global growth.
Europe’s equity market overall was still trading at an attractively lower price-to-earnings multiple and higher
| Top 10 Sectors/Industries | ||||
| Based on Equity Securities as of 6/30/18 | ||||
| % of Total Net Assets | ||||
| Pharmaceuticals | 13.3% | |||
| Media | 11.5% | |||
| Banks | 9.6% | |||
| Oil, Gas & Consumable Fuels | 6.8% | |||
| Software | 5.4% | |||
| Wireless Telecommunication Services | 4.0% | |||
| Insurance | 3.9% | |||
| Diversified Telecommunication Services | 3.6% | |||
| Health Care Equipment & Supplies | 3.6% | |||
| Electrical Equipment | 3.1% | |||
dividend yield than the US equity market at period-end. However, in addition to trade tensions, we are paying close attention to Brexit negotiations, Italy’s new populist government, a potentially fraying relationship between Germany’s two conservative parties and the future of the international nuclear deal with Iran. As of period-end, we still believe Europe’s economic recovery is fairly resilient, but any of the aforementioned challenges has the potential to fuel volatility and even slow economic growth. In such an environment, we believe domestically oriented companies may fare relatively better.
In Asia, we have said for some time that China needs to address the high level of corporate leverage, and the People’s Bank of China has recently mandated that much of the debt residing in the shadow banking market be brought back onto bank balance sheets. The resulting burden may impair bank earnings in the short term, which, in our view, is underappreciated by many investors and could create some investment opportunities. Meanwhile, Japan’s government has proposed further amendments to its Corporate Governance Code. We believe the proposals have the potential to drive further improvements in capital allocation and operating discipline, which have long been a concern of investors. We have become more interested in finding opportunities to take advantage of this emerging trend.
Mergers and acquisitions (M&A) have remained active. In the first half of 2018, the market received some clarity regarding the regulatory environment when a federal judge ruled in favor
| franklintempleton.com | Semiannual Report | 5 |
FRANKLIN MUTUAL BEACON FUND
of AT&T and Time Warner3, and against the US Department of Justice (DOJ) in its antitrust lawsuit. The judge decided the DOJ had failed to show the merger would be anti-competitive, and the deal closed promptly after the opinion was released. In response, the shares of companies involved in several other pending deals traded higher, indicating a higher expected probability of closing. The market also saw the development of a bidding war between Walt Disney and Comcast for control of Twenty-First Century Fox and Sky. As the year began, Disney had a deal to buy Fox and Fox had an offer pending to acquire the 61% of Sky it did not own. Comcast subsequently launched bids for both companies, and when Fox raised its bid for Sky, Comcast promptly raised its bid to a higher level. Comcast has indicated it will not bid further for Fox and, while Fox could raise its bid for Sky, it appears most likely that Comcast will purchase Sky. This bidding war showed the ongoing uncertainty in media, in which major media firms believe they need even more scale to compete with internet rivals that are experiencing significant growth. The Top 10 Sectors/Industries table on page 5 lists media and also other leading industries in which the Fund currently invests. We expect ongoing activity in M&A markets and, with the increased regulatory clarity provided by the Time Warner decision, further opportunities in merger arbitrage.
Finding mispriced risk in credit markets remains difficult due in part to the decline in debt covenants, which include terms that restrict financial activities by the borrower or set parameters for specific financial metrics. The search is also complicated by private equity firms involved in leveraged buyout transactions using increasingly liberal interpretations of credit agreements and bond indentures to potentially shift valuable assets beyond the reach of creditors. We have directed much of our focus on out-of-favor industries in pursuit of securities with the potential to benefit most from liquidity-enhancing events, such as asset sales, the ability to issue secured debt within existing agreements, and free-cash flow that could buy time for a company to weather its financial storm.
Fund Performance
Turning to Fund performance, top positive contributors included UK-based pharmaceutical company GlaxoSmithKline, UK-based global integrated oil and gas company Royal Dutch Shell and multinational software company Microsoft.
3. Not a Fund holding.
See www.franklintempletondatasources.com for additional data provider information.
| Top 10 Equity Holdings | ||||
| 6/30/18 | ||||
Company Sector/Industry, Country | % of Total Net Assets | |||
Medtronic PLC Health Care Equipment & Supplies, U.S. | 3.6% | |||
Novartis AG Pharmaceuticals, Switzerland | 3.6% | |||
Eli Lilly & Co. Pharmaceuticals, U.S. | 3.5% | |||
Wells Fargo & Co. Banks, U.S. | 3.1% | |||
Merck & Co. Inc. Pharmaceuticals, U.S. | 3.1% | |||
GlaxoSmithKline PLC Pharmaceuticals, U.K. | 3.1% | |||
Sensata Technologies Holding PLC Electrical Equipment, U.S. | 3.1% | |||
Cognizant Technology Solutions Corp. IT Services, U.S. | 3.0% | |||
British American Tobacco PLC Tobacco, U.K. | 2.9% | |||
Capital One Financial Corp. Consumer Finance, U.S. | 2.9% | |||
GlaxoSmithKline is listed among the Fund’s largest positions in the Top 10 Equity Holdings table on this page.
Investors reacted positively to GlaxoSmithKline’s March announcements that it had pulled out of the auction for Pfizer’s3 consumer health business and agreed to buy Novartis out of its consumer health care joint venture for $13 billion. In our view, not purchasing the Pfizer consumer business at a high price demonstrated capital discipline and the ability to exercise restraint by not overpaying for strategically desirable assets, thus enhancing management credibility. In addition, not consummating the Pfizer consumer-asset deal eliminated concerns around a potential cut to the dividend to finance the deal, which had been a serious concern for investors. Also, investors have become more willing to give Glaxo some credit for research and development returns improving under the new management team.
Shares of Royal Dutch Shell were supported by rising crude oil prices and strong operational performance. Crude oil prices rose due to the continuing trend of strengthening demand but only a gradual rise in supply, reinforced by the Organization of the Petroleum Exporting Countries and non-member country Russia agreeing to a modest increase in crude oil production in
| 6 | Semiannual Report | franklintempleton.com |
FRANKLIN MUTUAL BEACON FUND
June 2018. In addition, Shell has continued to be disciplined with its capital spending, and has stated its intention to buy back $25 billion in stock by 2020, but has been reluctant to commit to a start date. We believe the recent stream of closed and announced asset sales, including a placement of more assets into its master limited partnership, coupled with the strength of crude oil prices during the period, position the company for a near-term commencement of the buyback program.
Microsoft continued to reap the rewards of its rapidly growing cloud computing business and its effort to move Microsoft Office software clients to its subscription-based services. In February and April 2018, Microsoft reported solid quarterly growth in revenues and earnings per share. The company also increased its operating margin estimate for 2018. We believe Microsoft’s cloud computing and subscription-based services can continue to grow at a strong pace, which may further lift its operating margin.
During the period under review, Fund investments that detracted from performance included British American Tobacco, UK-based global mobile telecommunications company Vodafone Group and US-based digital security and storage provider Symantec.
British American Tobacco’s stock price faced downward pressure due to the potential for additional regulation in the US and concerns regarding next generation products. In March 2018, the US Food and Drug Administration issued an Advance Notice of Proposed Rulemaking, which started the process of examining the possibility of regulating nicotine levels in combustible cigarettes. The process may not result in regulation, but if it does, many experts believe the review could take seven to 10 years before a rule is adopted in the marketplace. Meanwhile, JUUL, produced by JUUL Labs3 has emerged as a popular e-cigarette in the US. JUUL’s growth rate is high and its product is popular with young consumers. It is unclear to what degree JUUL is cannibalizing the combustible market, but it has hurt investor sentiment toward the industry.
Vodafone Group reported better-than-expected fiscal year-end results in May 2018, but the outlook for fiscal year 2019 was below expectations with much of the growth forecast to come in the latter part of the year. In addition, Vodafone chief executive officer (CEO) Vittorio Colao announced his intention to retire in October 2018. The CEO’s decision was not a total surprise given his decade long tenure, but the timing was unexpected given Vodafone’s purchase of certain Liberty Global3 assets that is still being reviewed by government regulators. We believe that Vodafone will receive regulatory
approval. In addition, the naming of Nick Read, the current chief financial officer (CFO), as the new CEO, and promoting the deputy CFO, signal the board’s focus on operating performance after a period of addressing the major strategic issues facing the company.
Shares of Symantec tumbled in May 2018 when the company disclosed an internal investigation resulting from concerns raised by a former employee that could result in a restatement of prior financials, as well as lowered earnings guidance. The stock partially recovered when Symantec’s management provided more information regarding the investigation and reassured investors that financial statements would likely not need to be restated.
During the period, the Fund held currency forwards and futures seeking to hedge most of the currency risk of the portfolio’s non-US dollar investments. The hedges had a positive overall impact on the Fund’s performance because of the appreciation of the US dollar versus the hedged currencies.
What is a currency forward?
A currency forward is a direct agreement between the Fund and a counterparty to buy or sell a foreign currency in exchange for another currency at a specific exchange rate on a future date.
|
What is a future?
A future is an agreement between the Fund and a counterparty made through a US or foreign futures exchange to buy or sell an underlying instrument or asset at a specific price on a future date.
|
As fellow shareholders, we found recent relative and absolute performance disappointing, but it is not uncommon for our strategy to lag the equity markets at times. We remain committed to our disciplined, value investment approach as we seek to generate attractive, long-term, risk-adjusted returns for shareholders.
| franklintempleton.com | Semiannual Report | 7 |
FRANKLIN MUTUAL BEACON FUND
Thank you for your participation in Franklin Mutual Beacon Fund. We look forward to continuing to serve your investment needs.
 |  | |
| Christian Correa, CFA | ||
| Co-Portfolio Manager | ||
 |  | |
| Mandana Hormozi | ||
| Co-Portfolio Manager | ||
 |  | |
| Aman Gupta, CFA | ||
| Co-Portfolio Manager | ||
The foregoing information reflects our analysis, opinions and portfolio holdings as of June 30, 2018, the end of the reporting period. The way we implement our main investment strategies and the resulting portfolio holdings may change depending on factors such as market and economic conditions. These opinions may not be relied upon as investment advice or an offer for a particular security. The information is not a complete analysis of every aspect of any market, country, industry, security or the Fund. Statements of fact are from sources considered reliable, but the investment manager makes no representation or warranty as to their completeness or accuracy. Although historical performance is no guarantee of future results, these insights may help you understand our investment management philosophy.
CFA® is a trademark owned by CFA Institute.
Christian Correa has been portfolio manager for Franklin Mutual Beacon Fund since 2007 and a co-portfolio manager since December 2010. He joined Franklin Templeton Investments in 2003 and serves as Director of Research for Franklin Mutual Advisers. Previously, he covered merger arbitrage and special situations at Lehman Brothers Holdings Inc.
|
Mandana Hormozi has been a co-portfolio manager for Franklin Mutual Beacon Fund since 2010 and was assistant portfolio manager for the Fund since 2009. She has been an analyst for Franklin Mutual Advisers since 2003, when she joined Franklin Templeton Investments. Previously, she was a senior vice president in the equity research department at Lazard Freres. Also, she was an economic research analyst at Mitsubishi Bank.
|
Aman Gupta has been a co-portfolio manager for Franklin Mutual Beacon Fund since January 2018 and was assistant portfolio manager for the Fund since 2013. He has been an analyst for Franklin Mutual Advisers since 2010. Previously, Mr. Gupta was a senior equity analyst and director at Evergreen Investments, where he covered the health care industry with additional responsibilities in the consumer and industrials sectors.
|
| 8 | Semiannual Report | franklintempleton.com |
FRANKLIN MUTUAL BEACON FUND
Performance Summary as of June 30, 2018
The performance table does not reflect any taxes that a shareholder would pay on Fund dividends, capital gain distributions, if any, or any realized gains on the sale of Fund shares. Total return reflects reinvestment of the Fund’s dividends and capital gain distributions, if any, and any unrealized gains or losses. Your dividend income will vary depending on dividends or interest paid by securities in the Fund’s portfolio, adjusted for operating expenses of each class. Capital gain distributions are net profits realized from the sale of portfolio securities.
Performance as of 6/30/18
Cumulative total return excludes sales charges. Average annual total return includes maximum sales charges. Sales charges will vary depending on the size of the investment and the class of share purchased. The maximum is 5.75% and the minimum is 0%. Class A: 5.75% maximum initial sales charge. For other share classes, visit franklintempleton.com.
| Share Class | Cumulative Total Return1 | Average Annual Total Return2 | ||||||
Z | ||||||||
6-Month | -1.87% | -1.87% | ||||||
1-Year | +3.22% | +3.22% | ||||||
5-Year | +52.16% | +8.76% | ||||||
10-Year | +98.04% | +7.07% | ||||||
A | ||||||||
6-Month | -2.00% | -7.61% | ||||||
1-Year | +2.92% | -3.02% | ||||||
5-Year | +50.17% | +7.19% | ||||||
10-Year | +92.43% | +6.14% | ||||||
Performance data represent past performance, which does not guarantee future results. Investment return and principal value will fluctuate, and you may have a gain or loss when you sell your shares. Current performance may differ from figures shown. For most recent month-end performance, go to franklintempleton.com or call (800) 342-5236.
See page 10 for Performance Summary footnotes.
| franklintempleton.com | Semiannual Report | 9 |
FRANKLIN MUTUAL BEACON FUND
PERFORMANCE SUMMARY
Total Annual Operating Expenses3
Share Class
| ||||
Z | 0.78% | |||
A | 1.03% | |||
Each class of shares is available to certain eligible investors and has different annual fees and expenses, as described in the prospectus.
All investments involve risks, including possible loss of principal. Value securities may not increase in price as anticipated or may decline further in value. Special risks are associated with foreign investing, including currency fluctuations, economic instability and political developments. Because the Fund may invest its assets in companies in a specific region, including Europe, it is subject to greater risks of adverse developments in that region and/or the surrounding regions than a fund that is more broadly diversified geographically. Current political and financial uncertainty surrounding the European Union may increase market volatility and the economic risk of investing in companies in Europe. Smaller company stocks have exhibited greater price volatility than larger company stocks, particularly over the short term. The Fund’s investments in companies engaged in mergers, reorganizations or liquidations also involve special risks as pending deals may not be completed on time or on favorable terms. The Fund may invest in lower rated bonds, which entail higher credit risk. The Fund is actively managed but there is no guarantee that the manager’s investment decisions will produce the desired results. The Fund’s prospectus also includes a description of the main investment risks.
1. Cumulative total return represents the change in value of an investment over the periods indicated.
2. Average annual total return represents the average annual change in value of an investment over the periods indicated. Return for less than one year, if any, has not been annualized.
3. Figures are as stated in the Fund’s current prospectus and may differ from the expense ratios disclosed in the Your Fund’s Expenses and Financial Highlights sections in this report. In periods of market volatility, assets may decline significantly, causing total annual Fund operating expenses to become higher than the figures shown.
| 10 | Semiannual Report | franklintempleton.com |
FRANKLIN MUTUAL BEACON FUND
Your Fund’s Expenses
As a Fund shareholder, you can incur two types of costs: (1) transaction costs, including sales charges (loads) on Fund purchases and redemptions; and (2) ongoing Fund costs, including management fees, distribution and service (12b-1) fees, and other Fund expenses. All mutual funds have ongoing costs, sometimes referred to as operating expenses. The table below shows ongoing costs of investing in the Fund and can help you understand these costs and compare them with those of other mutual funds. The table assumes a $1,000 investment held for the six months indicated.
Actual Fund Expenses
The table below provides information about actual account values and actual expenses in the columns under the heading “Actual.” In these columns the Fund’s actual return, which includes the effect of Fund expenses, is used to calculate the “Ending Account Value” for each class of shares. You can estimate the expenses you paid during the period by following these steps (of course, your account value and expenses will differ from those in this illustration): Divide your account value by $1,000 (if your account had an $8,600 value, then $8,600 ÷ $1,000 = 8.6). Then multiply the result by the number in the row for your class of shares under the headings “Actual” and “Expenses Paid During Period” (if Actual Expenses Paid During Period were $7.50, then 8.6 x $7.50 = $64.50). In this illustration, the actual expenses paid this period are $64.50.
Hypothetical Example for Comparison with Other Funds
Under the heading “Hypothetical” in the table, information is provided about hypothetical account values and hypothetical expenses based on the Fund’s actual expense ratio and an assumed rate of return of 5% per year before expenses, which is not the Fund’s actual return. This information may not be used to estimate the actual ending account balance or expenses you paid for the period, but it can help you compare ongoing costs of investing in the Fund with those of other funds. To do so, compare this 5% hypothetical example for the class of shares you hold with the 5% hypothetical examples that appear in the shareholder reports of other funds.
Please note that expenses shown in the table are meant to highlight ongoing costs and do not reflect any transactional costs. Therefore, information under the heading “Hypothetical” is useful in comparing ongoing costs only, and will not help you compare total costs of owning different funds. In addition, if transactional costs were included, your total costs would have been higher.
| Actual (actual return after expenses) | Hypothetical (5% annual return before expenses) | |||||||||||||||||
Share Class | Beginning Account Value 1/1/18 | Ending Account Value 6/30/18 | Expenses Paid During Period 1/1/18–6/30/181,2 | Ending Account Value 6/30/18 | Expenses Paid During | Net Annualized Expense Ratio2 | ||||||||||||
Z | $1,000 | $981.30 | $3.93 | $1,020.83 | $4.01 | 0.80% | ||||||||||||
A | $1,000 | $980.00 | $5.15 | $1,019.59 | $5.26 | 1.05% | ||||||||||||
C | $1,000 | $976.10 | $8.82 | $1,015.87 | $9.00 | 1.80% | ||||||||||||
R | $1,000 | $979.10 | $6.38 | $1,018.35 | $6.51 | 1.30% | ||||||||||||
R6 | $1,000 | $981.90 | $3.59 | $1,021.17 | $3.66 | 0.73% | ||||||||||||
1. Expenses are equal to the annualized expense ratio for the six-month period as indicated above—in the far right column—multiplied by the simple average account value over the period indicated, and then multiplied by 181/365 to reflect the one-half year period.
2. Reflects expenses after fee waivers and expense reimbursements. Does not include acquired fund fees and expenses.
| franklintempleton.com | Semiannual Report | 11 |
FRANKLIN MUTUAL BEACON FUND
Financial Highlights
Six Months Ended June 30, 2018 (unaudited) | Year Ended December 31, | |||||||||||||||||||||||
| 2017 | 2016 | 2015 | 2014 | 2013 | ||||||||||||||||||||
Class Z | ||||||||||||||||||||||||
| Per share operating performance | ||||||||||||||||||||||||
(for a share outstanding throughout the period) | ||||||||||||||||||||||||
Net asset value, beginning of period | $16.61 | $15.30 | $14.30 | $16.59 | $16.91 | $13.36 | ||||||||||||||||||
|
| |||||||||||||||||||||||
| Income from investment operationsa: | ||||||||||||||||||||||||
Net investment incomeb | 0.19 | 0.29 | 0.37 | c | 0.29 | 0.54 | d | 0.31 | ||||||||||||||||
Net realized and unrealized gains (losses) | (0.50 | ) | 1.90 | 1.93 | (0.99 | ) | 0.62 | 3.56 | ||||||||||||||||
|
| |||||||||||||||||||||||
Total from investment operations | (0.31 | ) | 2.19 | 2.30 | (0.70 | ) | 1.16 | 3.87 | ||||||||||||||||
|
| |||||||||||||||||||||||
| Less distributions from: | ||||||||||||||||||||||||
Net investment income | — | (0.31 | ) | (0.37 | ) | (0.37 | ) | (0.69 | ) | (0.32) | ||||||||||||||
Net realized gains | — | (0.57 | ) | (0.93 | ) | (1.22 | ) | (0.79 | ) | — | ||||||||||||||
|
| |||||||||||||||||||||||
Total distributions | — | (0.88 | ) | (1.30 | ) | (1.59 | ) | (1.48 | ) | (0.32) | ||||||||||||||
|
| |||||||||||||||||||||||
| Net asset value, end of period | $16.30 | $16.61 | $15.30 | $14.30 | $16.59 | $16.91 | ||||||||||||||||||
|
| |||||||||||||||||||||||
Total returne | (1.87)% | 14.39% | 16.11% | (4.14)% | 6.82% | 29.11% | ||||||||||||||||||
| Ratios to average net assetsf | ||||||||||||||||||||||||
Expensesg,h | 0.80% | 0.78% | 0.80% | 0.84% | i | 0.83% | 0.80% | |||||||||||||||||
Expenses incurred in connection with securities sold short | 0.01% | —% | 0.01% | 0.04% | 0.04% | —% | j | |||||||||||||||||
Net investment income | 2.26% | 1.78% | 2.48% | c | 1.73% | 3.14% | d | 2.02% | ||||||||||||||||
| Supplemental data | ||||||||||||||||||||||||
Net assets, end of period (000’s) | $2,542,199 | $2,700,327 | $2,564,120 | $2,420,165 | $2,774,929 | $2,876,322 | ||||||||||||||||||
Portfolio turnover rate | 19.63% | 24.80% | 30.94% | 35.80% | 40.06% | 32.95% | ||||||||||||||||||
aThe amount shown for a share outstanding throughout the period may not correlate with the Statement of Operations for the period due to the timing of sales and repurchases of the Fund’s shares in relation to income earned and/or fluctuating fair value of the investments of the Fund.
bBased on average daily shares outstanding.
cNet investment income per share includes approximately $0.10 per share related to income received in the form of special dividends in connection with certain Fund holdings. Excluding this amount, the ratio of net investment income to average net assets would have been 1.81%.
dNet investment income per share includes approximately $0.24 per share related to income received in the form of a special dividend in connection with certain Fund holdings. Excluding this amount, the ratio of net investment income to average net assets would have been 1.74%.
eTotal return is not annualized for periods less than one year.
fRatios are annualized for periods less than one year.
gBenefit of expense reduction rounds to less than 0.01%.
hIncludes dividend and/or interest expense on securities sold short and security borrowing fees, if any. See below for the ratios of such expenses to average net assets for the periods presented. See Note 1(d).
iBenefit of waiver and payments by affiliates rounds to less than 0.01%.
jRounds to less than 0.01%.
| 12 | Semiannual Report | The accompanying notes are an integral part of these financial statements. | franklintempleton.com |
FRANKLIN MUTUAL BEACON FUND
FINANCIAL HIGHLIGHTS
Six Months Ended (unaudited) | Year Ended December 31, | |||||||||||||||||||||||
| 2017 | 2016 | 2015 | 2014 | 2013 | ||||||||||||||||||||
Class A | ||||||||||||||||||||||||
| Per share operating performance | ||||||||||||||||||||||||
(for a share outstanding throughout the period) | ||||||||||||||||||||||||
Net asset value, beginning of period | $16.47 | $15.18 | $14.20 | $16.47 | $16.80 | $13.28 | ||||||||||||||||||
|
| |||||||||||||||||||||||
| Income from investment operationsa: | ||||||||||||||||||||||||
Net investment incomeb | 0.16 | 0.25 | 0.33 | c | 0.24 | 0.49 | d | 0.26 | ||||||||||||||||
Net realized and unrealized gains (losses) | (0.49 | ) | 1.87 | 1.91 | (0.97 | ) | 0.60 | 3.54 | ||||||||||||||||
|
| |||||||||||||||||||||||
Total from investment operations | (0.33 | ) | 2.12 | 2.24 | (0.73 | ) | 1.09 | 3.80 | ||||||||||||||||
|
| |||||||||||||||||||||||
| Less distributions from: | ||||||||||||||||||||||||
Net investment income | — | (0.26 | ) | (0.33 | ) | (0.32 | ) | (0.63 | ) | (0.28) | ||||||||||||||
Net realized gains | — | (0.57 | ) | (0.93 | ) | (1.22 | ) | (0.79 | ) | — | ||||||||||||||
|
| |||||||||||||||||||||||
Total distributions | — | (0.83 | ) | (1.26 | ) | (1.54 | ) | (1.42 | ) | (0.28) | ||||||||||||||
|
| |||||||||||||||||||||||
| Net asset value, end of period | $16.14 | $16.47 | $15.18 | $14.20 | $16.47 | $16.80 | ||||||||||||||||||
|
| |||||||||||||||||||||||
Total returne | (2.00)% | 14.09% | 15.80% | (4.33)% | 6.48% | 28.70% | ||||||||||||||||||
| Ratios to average net assetsf | ||||||||||||||||||||||||
Expensesg,h | 1.05% | 1.03% | 1.05% | 1.12% | i | 1.13% | 1.10% | |||||||||||||||||
Expenses incurred in connection with securities sold short | 0.01% | —% | 0.01% | 0.04% | 0.04% | —% | j | |||||||||||||||||
Net investment income | 2.01% | 1.53% | 2.23% | c | 1.45% | 2.84% | d | 1.72% | ||||||||||||||||
| Supplemental data | ||||||||||||||||||||||||
Net assets, end of period (000’s) | $904,932 | $983,048 | $992,306 | $1,019,568 | $1,101,706 | $1,148,409 | ||||||||||||||||||
Portfolio turnover rate | 19.63% | 24.80% | 30.94% | 35.80% | 40.06% | 32.95% | ||||||||||||||||||
aThe amount shown for a share outstanding throughout the period may not correlate with the Statement of Operations for the period due to the timing of sales and repurchases of the Fund’s shares in relation to income earned and/or fluctuating fair value of the investments of the Fund.
bBased on average daily shares outstanding.
cNet investment income per share includes approximately $0.10 per share related to income received in the form of special dividends in connection with certain Fund holdings. Excluding this amount, the ratio of net investment income to average net assets would have been 1.56%.
dNet investment income per share includes approximately $0.24 per share related to income received in the form of a special dividend in connection with certain Fund holdings. Excluding this amount, the ratio of net investment income to average net assets would have been 1.44%.
eTotal return does not reflect sales commissions or contingent deferred sales charges, if applicable, and is not annualized for periods less than one year.
fRatios are annualized for periods less than one year.
gBenefit of expense reduction rounds to less than 0.01%.
hIncludes dividend and/or interest expense on securities sold short and security borrowing fees, if any. See below for the ratios of such expenses to average net assets for the periods presented. See Note 1(d).
iBenefit of waiver and payments by affiliates rounds to less than 0.01%.
jRounds to less than 0.01%.
| franklintempleton.com | The accompanying notes are an integral part of these financial statements. | Semiannual Report | 13 |
FRANKLIN MUTUAL BEACON FUND
FINANCIAL HIGHLIGHTS
Six Months Ended (unaudited) | Year Ended December 31, | |||||||||||||||||||||||
| 2017 | 2016 | 2015 | 2014 | 2013 | ||||||||||||||||||||
Class C | ||||||||||||||||||||||||
| Per share operating performance | ||||||||||||||||||||||||
(for a share outstanding throughout the period) | ||||||||||||||||||||||||
Net asset value, beginning of period | $16.34 | $15.06 | $14.10 | $16.36 | $16.70 | $13.21 | ||||||||||||||||||
|
| |||||||||||||||||||||||
| Income from investment operationsa: | ||||||||||||||||||||||||
Net investment incomeb | 0.10 | 0.12 | 0.22 | c | 0.12 | 0.37 | d | 0.15 | ||||||||||||||||
Net realized and unrealized gains (losses) | (0.49 | ) | 1.86 | 1.88 | (0.96 | ) | 0.59 | 3.51 | ||||||||||||||||
|
| |||||||||||||||||||||||
Total from investment operations | (0.39 | ) | 1.98 | 2.10 | (0.84 | ) | 0.96 | 3.66 | ||||||||||||||||
|
| |||||||||||||||||||||||
| Less distributions from: | ||||||||||||||||||||||||
Net investment income | — | (0.13 | ) | (0.21 | ) | (0.20 | ) | (0.51 | ) | (0.17) | ||||||||||||||
Net realized gains | — | (0.57 | ) | (0.93 | ) | (1.22 | ) | (0.79 | ) | — | ||||||||||||||
|
| |||||||||||||||||||||||
Total distributions | — | (0.70 | ) | (1.14 | ) | (1.42 | ) | (1.30 | ) | (0.17) | ||||||||||||||
|
| |||||||||||||||||||||||
| Net asset value, end of period | $15.95 | $16.34 | $15.06 | $14.10 | $16.36 | $16.70 | ||||||||||||||||||
|
| |||||||||||||||||||||||
Total returne | (2.39)% | 13.25% | 14.94% | (5.06)% | 5.78% | 27.79% | ||||||||||||||||||
| Ratios to average net assetsf | ||||||||||||||||||||||||
Expensesg,h | 1.80% | 1.78% | 1.80% | 1.84% | i | 1.83% | 1.80% | |||||||||||||||||
Expenses incurred in connection with securities sold short | 0.01% | —% | 0.01% | 0.04% | 0.04% | —% | j | |||||||||||||||||
Net investment income | 1.26% | 0.78% | 1.48% | c | 0.73% | 2.14% | d | 1.02% | ||||||||||||||||
| Supplemental data | ||||||||||||||||||||||||
Net assets, end of period (000’s) | $223,680 | $260,113 | $275,138 | $285,333 | $320,832 | $336,222 | ||||||||||||||||||
Portfolio turnover rate | 19.63% | 24.80% | 30.94% | 35.80% | 40.06% | 32.95% | ||||||||||||||||||
aThe amount shown for a share outstanding throughout the period may not correlate with the Statement of Operations for the period due to the timing of sales and repurchases of the Fund’s shares in relation to income earned and/or fluctuating fair value of the investments of the Fund.
bBased on average daily shares outstanding.
cNet investment income per share includes approximately $0.10 per share related to income received in the form of special dividends in connection with certain Fund holdings. Excluding this amount, the ratio of net investment income to average net assets would have been 0.81%.
dNet investment income per share includes approximately $0.24 per share related to income received in the form of a special dividend in connection with certain Fund holdings. Excluding this amount, the ratio of net investment income to average net assets would have been 0.74%.
eTotal return does not reflect sales commissions or contingent deferred sales charges, if applicable, and is not annualized for periods less than one year.
fRatios are annualized for periods less than one year.
gBenefit of expense reduction rounds to less than 0.01%.
hIncludes dividend and/or interest expense on securities sold short and security borrowing fees, if any. See below for the ratios of such expenses to average net assets for the periods presented. See Note 1(d).
iBenefit of waiver and payments by affiliates rounds to less than 0.01%.
jRounds to less than 0.01%.
| 14 | Semiannual Report | The accompanying notes are an integral part of these financial statements. | franklintempleton.com |
FRANKLIN MUTUAL BEACON FUND
FINANCIAL HIGHLIGHTS
Six Months Ended (unaudited) | Year Ended December 31, | |||||||||||||||||||||||
| 2017 | 2016 | 2015 | 2014 | 2013 | ||||||||||||||||||||
Class R | ||||||||||||||||||||||||
| Per share operating performance | ||||||||||||||||||||||||
(for a share outstanding throughout the period) | ||||||||||||||||||||||||
Net asset value, beginning of period | $16.28 | $15.01 | $14.05 | $16.33 | $16.68 | $13.19 | ||||||||||||||||||
|
| |||||||||||||||||||||||
| Income from investment operationsa: | ||||||||||||||||||||||||
Net investment incomeb | 0.14 | 0.21 | 0.30 | c | 0.20 | 0.44 | d | 0.23 | ||||||||||||||||
Net realized and unrealized gains (losses) | (0.48 | ) | 1.84 | 1.89 | (0.97 | ) | 0.61 | 3.50 | ||||||||||||||||
|
| |||||||||||||||||||||||
Total from investment operations | (0.34 | ) | 2.05 | 2.19 | (0.77 | ) | 1.05 | 3.73 | ||||||||||||||||
|
| |||||||||||||||||||||||
| Less distributions from: | ||||||||||||||||||||||||
Net investment income | — | (0.21 | ) | (0.30 | ) | (0.29 | ) | (0.61 | ) | (0.24) | ||||||||||||||
Net realized gains | — | (0.57 | ) | (0.93 | ) | (1.22 | ) | (0.79 | ) | — | ||||||||||||||
|
| |||||||||||||||||||||||
Total distributions | — | (0.78 | ) | (1.23 | ) | (1.51 | ) | (1.40 | ) | (0.24) | ||||||||||||||
|
| |||||||||||||||||||||||
| Net asset value, end of period | $15.94 | $16.28 | $15.01 | $14.05 | $16.33 | $16.68 | ||||||||||||||||||
|
| |||||||||||||||||||||||
Total returne | (2.09)% | 13.76% | 15.58% | (4.61)% | 6.31% | 28.34% | ||||||||||||||||||
| Ratios to average net assetsf | ||||||||||||||||||||||||
Expensesg,h | 1.30% | 1.28% | 1.30% | 1.34% | i | 1.33% | 1.30% | |||||||||||||||||
Expenses incurred in connection with securities sold short | 0.01% | —% | 0.01% | 0.04% | 0.04% | —% | j | |||||||||||||||||
Net investment income | 1.76% | 1.28% | 1.98% | c | 1.23% | 2.64% | d | 1.52% | ||||||||||||||||
| Supplemental data | ||||||||||||||||||||||||
Net assets, end of period (000’s) | $1,785 | $1,601 | $2,035 | $2,343 | $2,246 | $1,956 | ||||||||||||||||||
Portfolio turnover rate | 19.63% | 24.80% | 30.94% | 35.80% | 40.06% | 32.95% | ||||||||||||||||||
aThe amount shown for a share outstanding throughout the period may not correlate with the Statement of Operations for the period due to the timing of sales and repurchases of the Fund’s shares in relation to income earned and/or fluctuating fair value of the investments of the Fund.
bBased on average daily shares outstanding.
cNet investment income per share includes approximately $0.10 per share related to income received in the form of special dividends in connection with certain Fund holdings. Excluding this amount, the ratio of net investment income to average net assets would have been 1.31%.
dNet investment income per share includes approximately $0.24 per share related to income received in the form of a special dividend in connection with certain Fund holdings. Excluding this amount, the ratio of net investment income to average net assets would have been 1.24%.
eTotal return is not annualized for periods less than one year.
fRatios are annualized for periods less than one year.
gBenefit of expense reduction rounds to less than 0.01%.
hIncludes dividend and/or interest expense on securities sold short and security borrowing fees, if any. See below for the ratios of such expenses to average net assets for the periods presented. See Note 1(d).
iBenefit of waiver and payments by affiliates rounds to less than 0.01%.
jRounds to less than 0.01%.
| franklintempleton.com | The accompanying notes are an integral part of these financial statements. | Semiannual Report | 15 |
FRANKLIN MUTUAL BEACON FUND
FINANCIAL HIGHLIGHTS
| Six Months Ended June 30, 2018 (unaudited) | Year Ended December 31, | |||||||||||||||||||||||
| 2017 | 2016 | 2015 | 2014 | 2013a | ||||||||||||||||||||
Class R6 | ||||||||||||||||||||||||
| Per share operating performance | ||||||||||||||||||||||||
(for a share outstanding throughout the period) | ||||||||||||||||||||||||
Net asset value, beginning of period | $16.60 | $15.30 | $14.30 | $16.58 | $16.88 | $14.77 | ||||||||||||||||||
|
| |||||||||||||||||||||||
| Income from investment operationsb: | ||||||||||||||||||||||||
Net investment incomec | 0.19 | 0.37 | 0.38 | d | 0.30 | 0.56 | e | 0.24 | ||||||||||||||||
Net realized and unrealized gains (losses) | (0.49 | ) | 1.82 | 1.93 | (0.98 | ) | 0.63 | 2.21 | ||||||||||||||||
|
| |||||||||||||||||||||||
Total from investment operations | (0.30 | ) | 2.19 | 2.31 | (0.68 | ) | 1.19 | 2.45 | ||||||||||||||||
|
| |||||||||||||||||||||||
| Less distributions from: | ||||||||||||||||||||||||
Net investment income | — | (0.32 | ) | (0.38 | ) | (0.38 | ) | (0.70 | ) | (0.34) | ||||||||||||||
Net realized gains | — | (0.57 | ) | (0.93 | ) | (1.22 | ) | (0.79 | ) | — | ||||||||||||||
|
| |||||||||||||||||||||||
Total distributions | — | (0.89 | ) | (1.31 | ) | (1.60 | ) | (1.49 | ) | (0.34) | ||||||||||||||
|
| |||||||||||||||||||||||
| Net asset value, end of period | $16.30 | $16.60 | $15.30 | $14.30 | $16.58 | $16.88 | ||||||||||||||||||
|
| |||||||||||||||||||||||
Total returnf | (1.81)% | 14.42% | 16.20% | (3.98)% | 6.91% | 16.83% | ||||||||||||||||||
| Ratios to average net assetsg | ||||||||||||||||||||||||
Expenses before waiver and payments by affiliatesh | 0.75% | 0.72% | 0.71% | 0.74% | 0.74% | 2.10% | ||||||||||||||||||
Expenses net of waiver and payments by affiliatesh,i | 0.73% | 0.71% | 0.71% | 0.74% | j | 0.74% | 0.71% | |||||||||||||||||
Expenses incurred in connection with securities sold short | 0.01% | —% | 0.01% | 0.04% | 0.04% | —% | k | |||||||||||||||||
Net investment income | 2.33% | 1.85% | 2.57% | d | 1.83% | 3.23% | e | 2.11% | ||||||||||||||||
| Supplemental data | ||||||||||||||||||||||||
Net assets, end of period (000’s) | $94,956 | $106,845 | $604 | $48,844 | $50,868 | $6 | ||||||||||||||||||
Portfolio turnover rate | 19.63% | 24.80% | 30.94% | 35.80% | 40.06% | 32.95% | ||||||||||||||||||
aFor the period May 1, 2013 (effective date) to December 31, 2013.
bThe amount shown for a share outstanding throughout the period may not correlate with the Statement of Operations for the period due to the timing of sales and repurchases of the Fund’s shares in relation to income earned and/or fluctuating fair value of the investments of the Fund.
cBased on average daily shares outstanding.
dNet investment income per share includes approximately $0.10 per share related to income received in the form of special dividends in connection with certain Fund holdings. Excluding this amount, the ratio of net investment income to average net assets would have been 1.90%.
eNet investment income per share includes approximately $0.24 per share related to income received in the form of a special dividend in connection with certain Fund holdings. Excluding this amount, the ratio of net investment income to average net assets would have been 1.83%.
fTotal return is not annualized for periods less than one year.
gRatios are annualized for periods less than one year.
hIncludes dividend and/or interest expense on securities sold short and security borrowing fees, if any. See below for the ratios of such expenses to average net assets for the periods presented. See Note 1(d).
iBenefit of expense reduction rounds to less than 0.01%.
jBenefit of waiver and payments by affiliates rounds to less than 0.01%.
kRounds to less than 0.01%.
| 16 | Semiannual Report | The accompanying notes are an integral part of these financial statements. | franklintempleton.com |
FRANKLIN MUTUAL BEACON FUND
Statement of Investments, June 30, 2018 (unaudited)
| Country | Shares/ Warrants | Value | ||||||||||||
Common Stocks and Other Equity Interests 87.7% | ||||||||||||||
| Aerospace & Defense 2.2% | ||||||||||||||
BAE Systems PLC | United Kingdom | 9,660,380 | $ | 82,515,492 | ||||||||||
|
| |||||||||||||
| Auto Components 0.2% | ||||||||||||||
| a,b,c | International Automotive Components Group Brazil LLC | Brazil | 2,846,329 | 64,720 | ||||||||||
| a,b,c | International Automotive Components Group North America LLC | United States | 22,836,904 | 6,837,118 | ||||||||||
|
| |||||||||||||
| 6,901,838 | ||||||||||||||
|
| |||||||||||||
| Banks 9.6% | ||||||||||||||
JPMorgan Chase & Co. | United States | 890,830 | 92,824,486 | |||||||||||
Societe Generale SA | France | 2,347,322 | 99,045,159 | |||||||||||
Standard Chartered PLC | United Kingdom | 5,639,077 | 51,577,677 | |||||||||||
Wells Fargo & Co. | United States | 2,124,250 | 117,768,420 | |||||||||||
|
| |||||||||||||
| 361,215,742 | ||||||||||||||
|
| |||||||||||||
| Chemicals 0.0% | ||||||||||||||
| a,b,d | Dow Corning Corp., Contingent Distribution | United States | 12,598,548 | — | ||||||||||
|
| |||||||||||||
| Communications Equipment 2.1% | ||||||||||||||
Cisco Systems Inc. | United States | 1,892,542 | 81,436,082 | |||||||||||
|
| |||||||||||||
| Consumer Finance 2.9% | ||||||||||||||
Capital One Financial Corp. | United States | 1,177,898 | 108,248,826 | |||||||||||
|
| |||||||||||||
| Diversified Telecommunication Services 3.6% | ||||||||||||||
AT&T Inc. | United States | 1,624,759 | 52,171,012 | |||||||||||
Koninklijke KPN NV | Netherlands | 31,514,874 | 85,791,539 | |||||||||||
|
| |||||||||||||
| 137,962,551 | ||||||||||||||
|
| |||||||||||||
| Electric Utilities 1.3% | ||||||||||||||
PG&E Corp. | United States | 1,150,400 | 48,961,024 | |||||||||||
|
| |||||||||||||
| Electrical Equipment 3.1% | ||||||||||||||
| a | Sensata Technologies Holding PLC | United States | 2,429,802 | 115,609,979 | ||||||||||
|
| |||||||||||||
| Food & Staples Retailing 0.4% | ||||||||||||||
| a | Rite Aid Corp. | United States | 8,457,611 | 14,631,667 | ||||||||||
|
| |||||||||||||
| Health Care Equipment & Supplies 3.6% | ||||||||||||||
Medtronic PLC | United States | 1,576,090 | 134,929,065 | |||||||||||
|
| |||||||||||||
| Hotels, Restaurants & Leisure 2.6% | ||||||||||||||
Accor SA | France | 1,986,209 | 97,511,078 | |||||||||||
|
| |||||||||||||
| Industrial Conglomerates 1.8% | ||||||||||||||
General Electric Co. | United States | 5,029,200 | 68,447,412 | |||||||||||
|
| |||||||||||||
| Insurance 3.9% | ||||||||||||||
American International Group Inc. | United States | 1,865,900 | 98,930,018 | |||||||||||
The Hartford Financial Services Group Inc. | United States | 922,900 | 47,187,877 | |||||||||||
|
| |||||||||||||
| 146,117,895 | ||||||||||||||
|
| |||||||||||||
| Internet Software & Services 1.3% | ||||||||||||||
| a | Baidu Inc., ADR | China | 203,847 | 49,534,821 | ||||||||||
|
| |||||||||||||
| IT Services 3.0% | ||||||||||||||
Cognizant Technology Solutions Corp., A | United States | 1,437,830 | 113,574,192 | |||||||||||
|
| |||||||||||||
| Media 11.5% | ||||||||||||||
| a | Charter Communications Inc., A | United States | 312,587 | 91,653,635 | ||||||||||
Comcast Corp., A | United States | 2,366,700 | 77,651,427 | |||||||||||
| a | Cumulus Media Inc., A | United States | 38,388 | 575,820 | ||||||||||
| a | Cumulus Media Inc., B | United States | 57,236 | 901,467 | ||||||||||
| a | Cumulus Media Inc., wts., 6/04/38 | United States | 43,343 | 682,652 | ||||||||||
| franklintempleton.com | Semiannual Report | 17 |
FRANKLIN MUTUAL BEACON FUND
STATEMENT OF INVESTMENTS (UNAUDITED)
| Country | Shares/ Warrants | Value | ||||||||||||
| Common Stocks and Other Equity Interests (continued) | ||||||||||||||
| Media (continued) | ||||||||||||||
| a | DISH Network Corp., A | United States | 920,041 | $ | 30,922,578 | |||||||||
Sky PLC | United Kingdom | 3,293,149 | 63,559,646 | |||||||||||
Twenty-First Century Fox Inc., B | United States | 1,321,800 | 65,125,086 | |||||||||||
The Walt Disney Co. | United States | 994,700 | 104,254,507 | |||||||||||
|
| |||||||||||||
| 435,326,818 | ||||||||||||||
|
| |||||||||||||
| Metals & Mining 0.1% | ||||||||||||||
Warrior Met Coal Inc. | United States | 207,416 | 5,718,459 | |||||||||||
|
| |||||||||||||
| Oil, Gas & Consumable Fuels 6.8% | ||||||||||||||
Kinder Morgan Inc. | United States | 3,867,500 | 68,338,725 | |||||||||||
Royal Dutch Shell PLC, B. | United Kingdom | 3,013,217 | 107,977,062 | |||||||||||
The Williams Cos. Inc. | United States | 2,906,532 | 78,796,082 | |||||||||||
|
| |||||||||||||
| 255,111,869 | ||||||||||||||
|
| |||||||||||||
| Pharmaceuticals 13.3% | ||||||||||||||
Eli Lilly & Co. | United States | 1,537,339 | 131,181,137 | |||||||||||
GlaxoSmithKline PLC | United Kingdom | 5,783,258 | 116,836,488 | |||||||||||
Merck & Co. Inc. | United States | 1,938,577 | 117,671,624 | |||||||||||
Novartis AG, ADR | Switzerland | 1,774,190 | 134,022,313 | |||||||||||
|
| |||||||||||||
| 499,711,562 | ||||||||||||||
|
| |||||||||||||
| Software 6.5% | ||||||||||||||
| a | Check Point Software Technologies Ltd. | Israel | 816,412 | 79,747,124 | ||||||||||
| a | Dell Technologies Inc., V | United States | 502,400 | 42,492,992 | ||||||||||
Microsoft Corp. | United States | 613,844 | 60,531,157 | |||||||||||
Symantec Corp. | United States | 2,955,337 | 61,027,709 | |||||||||||
|
| |||||||||||||
| 243,798,982 | ||||||||||||||
|
| |||||||||||||
| Specialty Retail 1.0% | ||||||||||||||
Dufry AG | Switzerland | 287,527 | 36,695,691 | |||||||||||
|
| |||||||||||||
| Tobacco 2.9% | ||||||||||||||
British American Tobacco PLC | United Kingdom | 2,179,619 | 110,242,900 | |||||||||||
|
| |||||||||||||
| Wireless Telecommunication Services 4.0% | ||||||||||||||
| a | T-Mobile U.S. Inc. | United States | 791,700 | 47,304,075 | ||||||||||
Vodafone Group PLC | United Kingdom | 42,709,235 | 103,677,813 | |||||||||||
|
| |||||||||||||
| 150,981,888 | ||||||||||||||
|
| |||||||||||||
Total Common Stocks and Other Equity Interests | 3,305,185,833 | |||||||||||||
|
| |||||||||||||
| Management Investment Companies (Cost $40,343,454) 1.2% | ||||||||||||||
| Diversified Financial Services 1.2% | ||||||||||||||
| a | Altaba Inc. | United States | 615,600 | 45,068,076 | ||||||||||
|
| |||||||||||||
| Preferred Stocks 4.7% | ||||||||||||||
| Automobiles 1.8% | ||||||||||||||
| e | Porsche Automobil Holding SE, 3.226%, pfd | Germany | 1,075,600 | 68,564,312 | ||||||||||
|
| |||||||||||||
| Technology Hardware, Storage & Peripherals 2.9% | ||||||||||||||
| e | Samsung Electronics Co. Ltd., 3.397%, pfd | South Korea | 3,148,550 | 106,278,382 | ||||||||||
|
| |||||||||||||
Total Preferred Stocks (Cost $103,867,873) | 174,842,694 | |||||||||||||
|
| |||||||||||||
| 18 | Semiannual Report | franklintempleton.com |
FRANKLIN MUTUAL BEACON FUND
STATEMENT OF INVESTMENTS (UNAUDITED)
| Country | Principal Amount | Value | ||||||||||||
| Corporate Notes and Senior Floating Rate Interests 1.2% | ||||||||||||||
| f,g | Cumulus Media New Holdings Inc., Term Loan, 6.60%, (1-month USD LIBOR + 4.50%), 5/13/22 | United States | $ | 10,817,798 | $ | 10,770,470 | ||||||||
Frontier Communications Corp., | ||||||||||||||
senior note, 10.50%, 9/15/22 | United States | 16,691,000 | 15,230,538 | |||||||||||
senior note, 11.00%, 9/15/25 | United States | 23,907,000 | 19,237,963 | |||||||||||
|
| |||||||||||||
Total Corporate Notes and Senior Floating Rate Interests | 45,238,971 | |||||||||||||
|
| |||||||||||||
Corporate Notes and Senior Floating Rate Interests in | ||||||||||||||
| b,c,h | Broadband Ventures III LLC, secured promissory note, 5.00%, 2/01/12 | United States | 10,848 | — | ||||||||||
| h | iHeartCommunications Inc., | |||||||||||||
senior secured note, first lien, 9.00%, 12/15/19 | United States | 18,873,000 | 14,390,662 | |||||||||||
f,gTranche D Term Loan, 8.443%, (3-month USD LIBOR + 6.75%), 1/30/19 | United States | 15,813,483 | 12,103,244 | |||||||||||
f,gTranche E Term Loan, 9.193%, (3-month USD LIBOR + 7.50%), 7/30/19 | United States | 5,080,935 | 3,887,500 | |||||||||||
|
| |||||||||||||
Total Corporate Notes and Senior Floating Rate Interests in | 30,381,406 | |||||||||||||
|
| |||||||||||||
| Shares | ||||||||||||||
| Companies in Liquidation 0.0%† | ||||||||||||||
| a,b,d | Tribune Media, Litigation Trust, Contingent Distribution | United States | 502,320 | — | ||||||||||
| a,d | Vistra Energy Corp., Litigation Trust, Contingent Distribution | United States | 74,588,735 | 606,034 | ||||||||||
| a | Vistra Energy Corp., Litigation Trust, TRA | United States | 1,256,451 | 816,693 | ||||||||||
|
| |||||||||||||
| Total Companies in Liquidation (Cost $7,652,096) | 1,422,727 | |||||||||||||
|
| |||||||||||||
Total Investments before Short Term Investments | 3,602,139,707 | |||||||||||||
|
| |||||||||||||
| Principal Amount | ||||||||||||||
| Short Term Investments 3.0% | ||||||||||||||
| U.S. Government and Agency Securities 3.0% | ||||||||||||||
| i | FHLB, 7/02/18 | United States | $ | 23,800,000 | 23,800,000 | |||||||||
| i | U.S. Treasury Bill, | |||||||||||||
j 7/26/18 - 11/15/18 | United States | 45,000,000 | 44,759,293 | |||||||||||
7/05/18 - 12/20/18 | United States | 46,000,000 | 45,921,572 | |||||||||||
|
| |||||||||||||
Total U.S. Government and Agency Securities | 114,480,865 | |||||||||||||
|
| |||||||||||||
| Total Investments (Cost $3,160,037,094) 98.6% | 3,716,620,572 | |||||||||||||
| Securities Sold Short (2.2)% | (82,694,229) | |||||||||||||
| Other Assets, less Liabilities 3.6% | 133,624,696 | |||||||||||||
|
| |||||||||||||
| Net Assets 100.0% | $3,767,551,039 | |||||||||||||
|
| |||||||||||||
| franklintempleton.com | Semiannual Report | 19 |
FRANKLIN MUTUAL BEACON FUND
STATEMENT OF INVESTMENTS (UNAUDITED)
| Country | Shares | Value | ||||||||||||
| k | Securities Sold Short (2.2)% | |||||||||||||
| Common Stocks (2.2)% | ||||||||||||||
| Internet Software & Services (1.1)% | ||||||||||||||
Alibaba Group Holding Ltd., ADR | China | 221,616 | $ | (41,116,416 | ) | |||||||||
|
| |||||||||||||
| Software (1.1)% | ||||||||||||||
VMware Inc., A | United States | 282,900 | (41,577,813 | ) | ||||||||||
|
| |||||||||||||
Total Securities Sold Short (Proceeds $ 78,294,579) | $ | (82,694,229 | ) | |||||||||||
|
| |||||||||||||
†Rounds to less than 0.1% of net assets.
aNon-income producing.
bFair valued using significant unobservable inputs. See Note 14 regarding fair value measurements.
cSee Note 10 regarding restricted securities.
dContingent distributions represent the right to receive additional distributions, if any, during the reorganization of the underlying company. Shares represent total underlying principal of debt securities.
eVariable rate security. The rate shown represents the yield at period end.
fThe coupon rate shown represents the rate at period end.
gSee Note 1(e) regarding senior floating rate interests.
hSee Note 8 regarding credit risk and defaulted securities.
iThe security was issued on a discount basis with no stated coupon rate.
jA portion or all of the security has been segregated as collateral for securities sold short. At June 30, 2018, the aggregate value of these securities pledged amounted to $40,604,071, representing 1.1% of net assets.
kSee Note 1(d) regarding securities sold short.
At June 30, 2018, the Fund had the following futures contracts outstanding. See Note 1(c).
| Futures Contracts | ||||||||||||||||||||
| Description | Type | Number of Contracts | Notional Amount* | Expiration Date | Value/ Unrealized | |||||||||||||||
| Currency Contracts | ||||||||||||||||||||
EUR/USD | Short | 1,194 | $ | 175,167,263 | 9/17/18 | $ | 1,727,202 | |||||||||||||
GBP/USD | Short | 1,648 | 136,330,800 | 9/17/18 | 2,076,221 | |||||||||||||||
|
| |||||||||||||||||||
Total Futures Contracts | $ | 3,803,423 | ||||||||||||||||||
|
| |||||||||||||||||||
*As of period end.
| 20 | Semiannual Report | franklintempleton.com |
FRANKLIN MUTUAL BEACON FUND
STATEMENT OF INVESTMENTS (UNAUDITED)
At June 30, 2018, the Fund had the following forward exchange contracts outstanding. See Note 1(c).
| Forward Exchange Contracts | ||||||||||||||||||||||||||||
| Currency | Counterpartya | Type | Quantity | Contract Amount | Settlement Date | Unrealized Appreciation | Unrealized Depreciation | |||||||||||||||||||||
| OTC Forward Exchange Contracts |
| |||||||||||||||||||||||||||
Euro | BOFA | Buy | 3,610,164 | $ | 4,187,235 | 7/12/18 | $ | 34,795 | $ | — | ||||||||||||||||||
Euro | BOFA | Buy | 12,431,274 | 14,591,639 | 7/12/18 | — | (53,462 | ) | ||||||||||||||||||||
Euro | BOFA | Sell | 2,240,375 | 2,736,401 | 7/12/18 | 116,319 | — | |||||||||||||||||||||
Euro | BONY | Buy | 7,059 | 8,195 | 7/12/18 | 60 | — | |||||||||||||||||||||
Euro | BONY | Buy | 1,924,641 | 2,267,499 | 7/12/18 | — | (16,661 | ) | ||||||||||||||||||||
Euro | HSBK | Buy | 2,284,417 | 2,687,103 | 7/12/18 | — | (15,513 | ) | ||||||||||||||||||||
Euro | HSBK | Buy | 6,318,230 | 7,340,516 | 7/12/18 | 48,554 | — | |||||||||||||||||||||
Euro | HSBK | Sell | 15,335,639 | 18,620,641 | 7/12/18 | 685,856 | — | |||||||||||||||||||||
Euro | SSBT | Buy | 2,436,450 | 2,849,940 | 7/12/18 | — | (550 | ) | ||||||||||||||||||||
Euro | SSBT | Sell | 1,687,030 | 2,063,395 | 7/12/18 | 90,441 | — | |||||||||||||||||||||
Euro | UBSW | Buy | 530,879 | 621,359 | 7/12/18 | — | (504 | ) | ||||||||||||||||||||
Euro | UBSW | Buy | 3,404,732 | 3,947,213 | 7/12/18 | 34,567 | — | |||||||||||||||||||||
Euro | UBSW | Sell | 13,684,803 | 16,605,065 | 7/12/18 | 600,905 | — | |||||||||||||||||||||
British Pound | BOFA | Buy | 3,336,276 | 4,400,105 | 7/16/18 | 9,289 | — | |||||||||||||||||||||
British Pound | BOFA | Buy | 5,026,466 | 6,745,471 | 7/16/18 | — | (102,234 | ) | ||||||||||||||||||||
British Pound | BOFA | Sell | 3,257,748 | 4,591,145 | 7/16/18 | 285,536 | — | |||||||||||||||||||||
British Pound | BONY | Buy | 2,956,952 | 3,899,362 | 7/16/18 | 8,698 | — | |||||||||||||||||||||
British Pound | BONY | Sell | 1,430,287 | 2,058,111 | 7/16/18 | 167,770 | — | |||||||||||||||||||||
British Pound | HSBK | Buy | 5,098,524 | 6,765,094 | 7/16/18 | — | (26,622 | ) | ||||||||||||||||||||
British Pound | HSBK | Sell | 21,571,334 | 29,491,253 | 7/16/18 | 981,466 | — | |||||||||||||||||||||
British Pound | SSBT | Buy | 1,202,424 | 1,585,438 | 7/16/18 | 3,747 | — | |||||||||||||||||||||
British Pound | UBSW | Buy | 1,202,423 | 1,586,085 | 7/16/18 | 3,099 | — | |||||||||||||||||||||
British Pound | UBSW | Sell | 20,427,406 | 27,863,208 | 7/16/18 | 865,294 | — | |||||||||||||||||||||
Euro | BOFA | Buy | 1,945,863 | 2,253,928 | 7/26/18 | 24,108 | — | |||||||||||||||||||||
Euro | BONY | Buy | 1,027,570 | 1,188,797 | 7/26/18 | 14,188 | — | |||||||||||||||||||||
Euro | BONY | Sell | 5,706,879 | 7,158,481 | 7/26/18 | 477,392 | — | |||||||||||||||||||||
Euro | HSBK | Buy | 1,171,994 | 1,358,962 | 7/26/18 | 13,100 | — | |||||||||||||||||||||
Euro | HSBK | Sell | 5,706,879 | 7,157,910 | 7/26/18 | 476,822 | — | |||||||||||||||||||||
Euro | SSBT | Buy | 500,000 | 581,083 | 7/26/18 | 4,271 | — | |||||||||||||||||||||
South Korean Won | HSBK | Buy | 7,997,317,000 | 7,329,786 | 8/10/18 | — | (150,994 | ) | ||||||||||||||||||||
South Korean Won | HSBK | Sell | 53,721,143,842 | 49,934,108 | 8/10/18 | 1,711,326 | — | |||||||||||||||||||||
South Korean Won | UBSW | Buy | 11,484,777,899 | 10,656,056 | 8/10/18 | — | (346,746 | ) | ||||||||||||||||||||
South Korean Won | UBSW | Sell | 29,876,626,347 | 27,999,724 | 8/10/18 | 1,180,973 | — | |||||||||||||||||||||
British Pound | BOFA | Sell | 22,630,095 | 31,893,399 | 8/14/18 | 1,944,341 | — | |||||||||||||||||||||
British Pound | BONY | Sell | 17,060,640 | 23,874,858 | 8/14/18 | 1,296,515 | — | |||||||||||||||||||||
British Pound | HSBK | Sell | 3,956,109 | 5,547,103 | 8/14/18 | 311,521 | — | |||||||||||||||||||||
British Pound | UBSW | Sell | 8,410,083 | 11,723,539 | 8/14/18 | 593,492 | — | |||||||||||||||||||||
Euro | BOFA | Buy | 1,419,043 | 1,661,279 | 8/20/18 | 3,293 | — | |||||||||||||||||||||
Euro | BONY | Buy | 1,475,374 | 1,727,235 | 8/20/18 | 3,415 | — | |||||||||||||||||||||
Euro | BONY | Sell | 10,201,699 | 12,906,343 | 8/20/18 | 939,498 | — | |||||||||||||||||||||
Euro | HSBK | Buy | 1,419,043 | 1,658,176 | 8/20/18 | 6,397 | — | |||||||||||||||||||||
Euro | SSBT | Buy | 1,475,374 | 1,725,470 | 8/20/18 | 5,180 | — | |||||||||||||||||||||
Euro | SSBT | Sell | 10,201,699 | 12,902,344 | 8/20/18 | 935,498 | — | |||||||||||||||||||||
Euro | UBSW | Buy | 1,475,374 | 1,725,459 | 8/20/18 | 5,191 | — | |||||||||||||||||||||
Euro | BOFA | Sell | 213,455 | 268,060 | 10/10/18 | 16,658 | — | |||||||||||||||||||||
Euro | HSBK | Sell | 2,000,000 | 2,467,734 | 10/18/18 | 110,575 | — | |||||||||||||||||||||
Euro | SSBT | Sell | 4,564,995 | 5,593,735 | 10/18/18 | 213,525 | — | |||||||||||||||||||||
Euro | UBSW | Sell | 188,996 | 237,480 | 10/18/18 | 14,733 | — | |||||||||||||||||||||
British Pound | BOFA | Sell | 1,006,635 | 1,418,337 | 10/24/18 | 81,760 | — | |||||||||||||||||||||
| franklintempleton.com | Semiannual Report | 21 |
FRANKLIN MUTUAL BEACON FUND
STATEMENT OF INVESTMENTS (UNAUDITED)
| Forward Exchange Contracts (continued) | ||||||||||||||||||||||||||||
| Currency | Counterpartya | Type | Quantity | Contract Amount | Settlement Date | Unrealized Appreciation | Unrealized Depreciation | |||||||||||||||||||||
| OTC Forward Exchange Contracts (continued) |
| |||||||||||||||||||||||||||
British Pound | HSBK | Sell | 1,697,955 | $ | 2,355,790 | 10/24/18 | $ | 101,302 | $ | — | ||||||||||||||||||
British Pound | SSBT | Sell | 17,635,339 | 24,936,899 | 10/24/18 | 1,521,284 | — | |||||||||||||||||||||
British Pound | UBSW | Sell | 5,209,766 | 7,322,865 | 10/24/18 | 405,511 | — | |||||||||||||||||||||
Euro | SSBT | Sell | 28,048,405 | 34,059,178 | 11/07/18 | 945,461 | — | |||||||||||||||||||||
Euro | UBSW | Sell | 28,048,405 | 34,052,446 | 11/07/18 | 938,729 | — | |||||||||||||||||||||
South Korean Won | HSBK | Sell | 17,664,627,206 | 16,494,574 | 11/09/18 | 575,787 | — | |||||||||||||||||||||
South Korean Won | UBSW | Sell | 34,716,047,504 | 32,428,235 | 11/09/18 | 1,143,263 | — | |||||||||||||||||||||
Euro | HSBK | Sell | 35,539,536 | 42,503,579 | 11/21/18 | 495,693 | — | |||||||||||||||||||||
Euro | SSBT | Sell | 35,539,535 | 42,512,392 | 11/21/18 | 504,507 | — | |||||||||||||||||||||
British Pound | BONY | Sell | 25,801,887 | 34,978,457 | 11/26/18 | 662,950 | — | |||||||||||||||||||||
British Pound | UBSW | Sell | 25,801,888 | 34,975,956 | 11/26/18 | 660,447 | — | |||||||||||||||||||||
|
| |||||||||||||||||||||||||||
Total Forward Exchange Contracts |
| $ | 22,275,102 | $ | (713,286 | ) | ||||||||||||||||||||||
|
| |||||||||||||||||||||||||||
Net unrealized appreciation (depreciation) |
| $ | 21,561,816 | |||||||||||||||||||||||||
|
| |||||||||||||||||||||||||||
aMay be comprised of multiple contracts with the same counterparty, currency and settlement date.
See Note 11 regarding other derivative information.
See Abbreviations on page 38.
| 22 | Semiannual Report | The accompanying notes are an integral part of these financial statements. | franklintempleton.com |
FRANKLIN MUTUAL BEACON FUND
Financial Statements
Statement of Assets and Liabilities
June 30, 2018 (unaudited)
Assets: | ||||
Investments in securities: | ||||
Cost - Unaffiliated issuers | $ | 3,160,037,094 | ||
|
| |||
Value - Unaffiliated issuers | $ | 3,716,620,572 | ||
Cash | 823,437 | |||
Foreign currency, at value (cost $921,651) | 930,814 | |||
Receivables: | ||||
Investment securities sold | 33,683,284 | |||
Capital shares sold | 949,596 | |||
Dividends and interest | 12,151,474 | |||
European Union tax reclaims | 2,489,148 | |||
Deposits with brokers for: | ||||
Securities sold short | 84,850,217 | |||
Futures contracts | 5,961,840 | |||
Unrealized appreciation on OTC forward exchange contracts | 22,275,102 | |||
Other assets | 2,682 | |||
|
| |||
Total assets | 3,880,738,166 | |||
|
| |||
Liabilities: | ||||
Payables: | ||||
Investment securities purchased | 18,935,126 | |||
Capital shares redeemed | 3,840,196 | |||
Management fees | 2,123,169 | |||
Distribution fees | 779,205 | |||
Transfer agent fees | 589,897 | |||
Trustees’ fees and expenses | 220,463 | |||
Variation margin on futures contracts | 2,953,425 | |||
Securities sold short, at value (proceeds $78,294,579) | 82,694,229 | |||
Unrealized depreciation on OTC forward exchange contracts | 713,286 | |||
Accrued expenses and other liabilities | 338,131 | |||
|
| |||
Total liabilities | 113,187,127 | |||
|
| |||
Net assets, at value | $ | 3,767,551,039 | ||
|
| |||
Net assets consist of: | ||||
Paid-in capital | $ | 2,909,132,306 | ||
Undistributed net investment income | 42,974,350 | |||
Net unrealized appreciation (depreciation) | 577,337,443 | |||
Accumulated net realized gain (loss) | 238,106,940 | |||
|
| |||
Net assets, at value | $ | 3,767,551,039 | ||
|
|
| franklintempleton.com | The accompanying notes are an integral part of these financial statements. | Semiannual Report | 23 |
FRANKLIN MUTUAL BEACON FUND
FINANCIAL STATEMENTS
Statement of Assets and Liabilities (continued)
June 30, 2018 (unaudited)
| Class Z: | ||||
Net assets, at value | $ | 2,542,198,886 | ||
|
| |||
Shares outstanding | 156,000,782 | |||
|
| |||
Net asset value and maximum offering price per share | $ | 16.30 | ||
|
| |||
| Class A: | ||||
Net assets, at value | $ | 904,931,981 | ||
|
| |||
Shares outstanding | 56,078,107 | |||
|
| |||
Net asset value per sharea | $ | 16.14 | ||
|
| |||
Maximum offering price per share (net asset value per share ÷ 94.25%) | $ | 17.12 | ||
|
| |||
| Class C: | ||||
Net assets, at value | $ | 223,679,830 | ||
|
| |||
Shares outstanding | 14,020,928 | |||
|
| |||
Net asset value and maximum offering price per sharea | $ | 15.95 | ||
|
| |||
| Class R: | ||||
Net assets, at value | $ | 1,784,778 | ||
|
| |||
Shares outstanding | 111,992 | |||
|
| |||
Net asset value and maximum offering price per share | $ | 15.94 | ||
|
| |||
| Class R6: | ||||
Net assets, at value | $ | 94,955,564 | ||
|
| |||
Shares outstanding | 5,826,697 | |||
|
| |||
Net asset value and maximum offering price per share | $ | 16.30 | ||
|
| |||
aRedemption price is equal to net asset value less contingent deferred sales charges, if applicable.
| 24 | Semiannual Report | The accompanying notes are an integral part of these financial statements. | franklintempleton.com |
FRANKLIN MUTUAL BEACON FUND
FINANCIAL STATEMENTS
Statement of Operations
for the six months ended June 30, 2018 (unaudited)
Investment income: | ||||
Dividends: (net of foreign taxes)* | ||||
Unaffiliated issuers | $ | 55,380,841 | ||
Interest: | ||||
Unaffiliated issuers | 4,431,940 | |||
|
| |||
Total investment income | 59,812,781 | |||
|
| |||
Expenses: | ||||
Management fees (Note 3a) | 13,227,309 | |||
Distribution fees: (Note 3c) | ||||
Class A | 1,181,557 | |||
Class C | 1,224,330 | |||
Class R | 4,451 | |||
Transfer agent fees: (Note 3e) | ||||
Class Z | 1,203,003 | |||
Class A | 433,582 | |||
Class C | 112,336 | |||
Class R | 817 | |||
Class R6 | 18,183 | |||
Custodian fees (Note 4) | 98,960 | |||
Reports to shareholders | 100,997 | |||
Registration and filing fees | 68,296 | |||
Professional fees | 85,182 | |||
Trustees’ fees and expenses | 69,397 | |||
Dividends on securities sold short | 162,085 | |||
Other | 36,177 | |||
|
| |||
Total expenses | 18,026,662 | |||
Expense reductions (Note 4) | (8,643 | ) | ||
Expenses waived/paid by affiliates (Note 3f) | (7,964 | ) | ||
|
| |||
Net expenses | 18,010,055 | |||
|
| |||
Net investment income | 41,802,726 | |||
|
| |||
Realized and unrealized gains (losses): | ||||
Net realized gain (loss) from: | ||||
Investments:# | ||||
Unaffiliated issuers | 213,448,963 | |||
Non-controlled affiliates (Note 12) | 10,196 | |||
Foreign currency transactions | (407,532 | ) | ||
Forward exchange contracts | (18,607,912 | ) | ||
Futures contracts | 4,087,410 | |||
Securities sold short | 907,182 | |||
|
| |||
Net realized gain (loss) | 199,438,307 | |||
|
| |||
Net change in unrealized appreciation (depreciation) on: | ||||
Investments: | ||||
Unaffiliated issuers | (359,348,367 | ) | ||
Translation of other assets and liabilities denominated in foreign currencies | (412,671 | ) | ||
Forward exchange contracts | 40,216,324 | |||
Futures contracts | 8,043,020 | |||
Securities sold short | (4,972,083 | ) | ||
Change in deferred taxes on unrealized appreciation | 672,158 | |||
|
| |||
Net change in unrealized appreciation (depreciation) | (315,801,619 | ) | ||
|
| |||
Net realized and unrealized gain (loss) | (116,363,312 | ) | ||
|
| |||
Net increase (decrease) in net assets resulting from operations | $ | (74,560,586 | ) | |
|
| |||
*Foreign taxes withheld on dividends | $ | 3,021,619 | ||
#Net of foreign taxes. | $ | 155,569 | ||
| franklintempleton.com | The accompanying notes are an integral part of these financial statements. | Semiannual Report | 25 |
FRANKLIN MUTUAL BEACON FUND
FINANCIAL STATEMENTS
Statements of Changes in Net Assets
| Six Months Ended June 30, 2018 (unaudited) | Year Ended December 31, 2017 | |||||||
| ||||||||
Increase (decrease) in net assets: | ||||||||
Operations: | ||||||||
Net investment income | $ | 41,802,726 | $ | 65,956,895 | ||||
Net realized gain (loss) | 199,438,307 | 183,147,634 | ||||||
Net change in unrealized appreciation (depreciation) | (315,801,619 | ) | 281,136,333 | |||||
|
| |||||||
Net increase (decrease) in net assets resulting from operations | (74,560,586 | ) | 530,240,862 | |||||
|
| |||||||
Distributions to shareholders from: | ||||||||
Net investment income: | ||||||||
Class Z | — | (48,496,718 | ) | |||||
Class A | — | (15,320,414 | ) | |||||
Class C | — | (2,055,677 | ) | |||||
Class R | — | (23,201 | ) | |||||
Class R6 | — | (1,872,829 | ) | |||||
Net realized gains: | ||||||||
Class Z | — | (91,365,841 | ) | |||||
Class A | — | (33,271,239 | ) | |||||
Class C | — | (8,974,316 | ) | |||||
Class R | — | (65,148 | ) | |||||
Class R6 | — | (2,256,073 | ) | |||||
|
| |||||||
Total distributions to shareholders | — | (203,701,456 | ) | |||||
|
| |||||||
Capital share transactions: (Note 2) | ||||||||
Class Z | (109,569,241 | ) | (86,429,444 | ) | ||||
Class A | (59,486,861 | ) | (92,158,566 | ) | ||||
Class C | (30,920,066 | ) | (38,165,096 | ) | ||||
Class R | 231,596 | (607,336 | ) | |||||
Class R6 | (10,078,351 | ) | 108,551,501 | |||||
|
| |||||||
Total capital share transactions | (209,822,923 | ) | (108,808,941 | ) | ||||
|
| |||||||
Net increase (decrease) in net assets | (284,383,509 | ) | 217,730,465 | |||||
Net assets: | ||||||||
Beginning of period | 4,051,934,548 | 3,834,204,083 | ||||||
|
| |||||||
End of period | $ | 3,767,551,039 | $ | 4,051,934,548 | ||||
|
| |||||||
Undistributed net investment income included in net assets: | ||||||||
End of period | $ | 42,974,350 | $ | 1,171,624 | ||||
|
| |||||||
| 26 | Semiannual Report | The accompanying notes are an integral part of these financial statements. | franklintempleton.com |
FRANKLIN MUTUAL BEACON FUND
Notes to Financial Statements (unaudited)
1. Organization and Significant Accounting Policies
Franklin Mutual Series Funds (Trust) is registered under the Investment Company Act of 1940 (1940 Act) as an open-end management investment company, consisting of seven separate funds and applies the specialized accounting and reporting guidance in U.S. Generally Accepted Accounting Principles (U.S. GAAP). Franklin Mutual Beacon Fund (Fund) is included in this report. The Fund offers five classes of shares: Class Z, Class A, Class C, Class R and Class R6. Each class of shares may differ by its initial sales load, contingent deferred sales charges, voting rights on matters affecting a single class, its exchange privilege and fees due to differing arrangements for distribution and transfer agent fees.
The following summarizes the Fund’s significant accounting policies.
a. Financial Instrument Valuation
The Fund’s investments in financial instruments are carried at fair value daily. Fair value is the price that would be received to sell an asset or paid to transfer a liability in an orderly transaction between market participants on the measurement date. The Fund calculates the net asset value (NAV) per share each business day as of 4 p.m. Eastern time or the regularly scheduled close of the New York Stock Exchange (NYSE), whichever is earlier. Under compliance policies and procedures approved by the Trust’s Board of Trustees (the Board), the Fund’s administrator has responsibility for oversight of valuation, including leading the cross-functional Valuation Committee (VC). The VC provides administration and oversight of the Fund’s valuation policies and procedures, which are approved annually by the Board. Among other things, these procedures allow the Fund to utilize independent pricing services, quotations from securities and financial instrument dealers, and other market sources to determine fair value.
Equity securities and derivative financial instruments listed on an exchange or on the NASDAQ National Market System are valued at the last quoted sale price or the official closing price of the day, respectively. Foreign equity securities are valued as of the close of trading on the foreign stock exchange on which the security is primarily traded, or as of 4 p.m. Eastern time. The value is then converted into its U.S. dollar equivalent at the foreign exchange rate in effect at 4 p.m. Eastern time on the day that the value of the security is determined. Over-the-counter (OTC) securities are valued within the range of the most recent
quoted bid and ask prices. Securities that trade in multiple markets or on multiple exchanges are valued according to the broadest and most representative market. Certain equity securities are valued based upon fundamental characteristics or relationships to similar securities.
Debt securities generally trade in the OTC market rather than on a securities exchange. The Fund’s pricing services use multiple valuation techniques to determine fair value. In instances where sufficient market activity exists, the pricing services may utilize a market-based approach through which quotes from market makers are used to determine fair value. In instances where sufficient market activity may not exist or is limited, the pricing services also utilize proprietary valuation models which may consider market characteristics such as benchmark yield curves, credit spreads, estimated default rates, anticipated market interest rate volatility, coupon rates, anticipated timing of principal repayments, underlying collateral, and other unique security features in order to estimate the relevant cash flows, which are then discounted to calculate the fair value.
Certain derivative financial instruments trade in the OTC market. The Fund’s pricing services use various techniques including industry standard option pricing models and proprietary discounted cash flow models to determine the fair value of those instruments. The Fund’s net benefit or obligation under the derivative contract, as measured by the fair value of the contract, is included in net assets.
The Fund has procedures to determine the fair value of financial instruments for which market prices are not reliable or readily available. Under these procedures, the VC convenes on a regular basis to review such financial instruments and considers a number of factors, including significant unobservable valuation inputs, when arriving at fair value. The VC primarily employs a market-based approach which may use related or comparable assets or liabilities, recent transactions, market multiples, book values, and other relevant information for the investment to determine the fair value of the investment. An income-based valuation approach may also be used in which the anticipated future cash flows of the investment are discounted to calculate fair value. Discounts may also be applied due to the nature or duration of any restrictions on the disposition of the investments. Due to the inherent uncertainty of valuations of such investments, the fair values may differ significantly from the values that would have been used had an active market existed. The VC employs various methods for calibrating these
| franklintempleton.com | Semiannual Report | 27 |
FRANKLIN MUTUAL BEACON FUND
NOTES TO FINANCIAL STATEMENTS (UNAUDITED)
1. Organization and Significant Accounting
Policies (continued)
a. Financial Instrument Valuation (continued)
valuation approaches including a regular review of key inputs and assumptions, transactional back-testing or disposition analysis, and reviews of any related market activity.
Trading in securities on foreign securities stock exchanges and OTC markets may be completed before 4 p.m. Eastern time. In addition, trading in certain foreign markets may not take place on every Fund’s business day. Occasionally, events occur between the time at which trading in a foreign security is completed and 4 p.m. Eastern time that might call into question the reliability of the value of a portfolio security held by the Fund. As a result, differences may arise between the value of the Fund’s portfolio securities as determined at the foreign market close and the latest indications of value at 4 p.m. Eastern time. In order to minimize the potential for these differences, the VC monitors price movements following the close of trading in foreign stock markets through a series of country specific market proxies (such as baskets of American Depositary Receipts, futures contracts and exchange traded funds). These price movements are measured against established trigger thresholds for each specific market proxy to assist in determining if an event has occurred that may call into question the reliability of the values of the foreign securities held by the Fund. If such an event occurs, the securities may be valued using fair value procedures, which may include the use of independent pricing services.
When the last day of the reporting period is a non-business day, certain foreign markets may be open on those days that the Fund’s NAV is not calculated, which could result in differences between the value of the Fund’s portfolio securities on the last business day and the last calendar day of the reporting period. Any significant security valuation changes due to an open foreign market are adjusted and reflected by the Fund for financial reporting purposes.
b. Foreign Currency Translation
Portfolio securities and other assets and liabilities denominated in foreign currencies are translated into U.S. dollars based on the exchange rate of such currencies against U.S. dollars on the date of valuation. The Fund may enter into foreign currency exchange contracts to facilitate transactions denominated in a foreign currency. Purchases and sales of securities, income and
expense items denominated in foreign currencies are translated into U.S. dollars at the exchange rate in effect on the transaction date. Portfolio securities and assets and liabilities denominated in foreign currencies contain risks that those currencies will decline in value relative to the U.S. dollar. Occasionally, events may impact the availability or reliability of foreign exchange rates used to convert the U.S. dollar equivalent value. If such an event occurs, the foreign exchange rate will be valued at fair value using procedures established and approved by the Board.
The Fund does not separately report the effect of changes in foreign exchange rates from changes in market prices on securities held. Such changes are included in net realized and unrealized gain or loss from investments in the Statement of Operations.
Realized foreign exchange gains or losses arise from sales of foreign currencies, currency gains or losses realized between the trade and settlement dates on securities transactions and the difference between the recorded amounts of dividends, interest, and foreign withholding taxes and the U.S. dollar equivalent of the amounts actually received or paid. Net unrealized foreign exchange gains and losses arise from changes in foreign exchange rates on foreign denominated assets and liabilities other than investments in securities held at the end of the reporting period.
c. Derivative Financial Instruments
The Fund invested in derivative financial instruments in order to manage risk or gain exposure to various other investments or markets. Derivatives are financial contracts based on an underlying or notional amount, require no initial investment or an initial net investment that is smaller than would normally be required to have a similar response to changes in market factors, and require or permit net settlement. Derivatives contain various risks including the potential inability of the counterparty to fulfill their obligations under the terms of the contract, the potential for an illiquid secondary market, and/or the potential for market movements which expose the Fund to gains or losses in excess of the amounts shown in the Statement of Assets and Liabilities. Realized gain and loss and unrealized appreciation and depreciation on these contracts for the period are included in the Statement of Operations.
Derivative counterparty credit risk is managed through a formal evaluation of the creditworthiness of all potential counter-parties. The Fund attempts to reduce its exposure to
| 28 | Semiannual Report | franklintempleton.com |
FRANKLIN MUTUAL BEACON FUND
NOTES TO FINANCIAL STATEMENTS (UNAUDITED)
counterparty credit risk on OTC derivatives, whenever possible, by entering into International Swaps and Derivatives Association (ISDA) master agreements with certain counterparties. These agreements contain various provisions, including but not limited to collateral requirements, events of default, or early termination. Termination events applicable to the counterparty include certain deteriorations in the credit quality of the counterparty. Termination events applicable to the Fund include failure of the Fund to maintain certain net asset levels and/or limit the decline in net assets over various periods of time. In the event of default or early termination, the ISDA master agreement gives the non-defaulting party the right to net and close-out all transactions traded, whether or not arising under the ISDA agreement, to one net amount payable by one counterparty to the other. However, absent an event of default or early termination, OTC derivative assets and liabilities are presented gross and not offset in the Statement of Assets and Liabilities. Early termination by the counterparty may result in an immediate payment by the Fund of any net liability owed to that counterparty under the ISDA agreement. At June 30, 2018, the Fund had no OTC derivatives in a net liability position for such contracts.
Collateral requirements differ by type of derivative. Collateral or initial margin requirements are set by the broker or exchange clearing house for exchange traded and centrally cleared derivatives. Initial margin deposited is held at the exchange and can be in the form of cash and/or securities. For OTC derivatives traded under an ISDA master agreement, posting of collateral is required by either the Fund or the applicable counterparty if the total net exposure of all OTC derivatives with the applicable counterparty exceeds the minimum transfer amount, which typically ranges from $100,000 to $250,000, and can vary depending on the counterparty and the type of the agreement. Generally, collateral is determined at the close of Fund business each day and any additional collateral required due to changes in derivative values may be delivered by the Fund or the counterparty the next business day, or within a few business days. Collateral pledged and/or received by the Fund for OTC derivatives, if any, is held in segregated accounts with the Fund’s custodian/counterparty broker and can be in the form of cash and/or securities. Unrestricted cash may be invested according to the Fund’s investment objectives. To the extent that the amounts due to the Fund from its counterparties are not subject to collateralization or are not fully collateralized, the Fund bears the risk of loss from counterparty non-performance.
At June 30, 2018, the Fund received $25,499,160 in U.K. Treasury Bonds and U.S. Treasury Bills, Bonds and Notes as collateral for derivatives.
The Fund entered into exchange traded futures contracts primarily to manage exposure to certain foreign currencies. A futures contract is an agreement between the Fund and a counterparty to buy or sell an asset at a specified price on a future date. Required initial margins are pledged by the Fund, and the daily change in fair value is accounted for as a variation margin payable or receivable in the Statement of Assets and Liabilities.
The Fund entered into OTC forward exchange contracts primarily to manage exposure to certain foreign currencies. A forward exchange contract is an agreement between the Fund and a counterparty to buy or sell a foreign currency at a specific exchange rate on a future date.
See Note 11 regarding other derivative information.
d. Securities Sold Short
The Fund is engaged in selling securities short, which obligates the Fund to replace a borrowed security with the same security at current fair value. The Fund incurs a loss if the price of the security increases between the date of the short sale and the date on which the Fund replaces the borrowed security. The Fund realizes a gain if the price of the security declines between those dates. Gains are limited to the price at which the Fund sold the security short, while losses are potentially unlimited in size.
The Fund is required to establish a margin account with the broker lending the security sold short. While the short sale is outstanding, the broker retains the proceeds of the short sale to the extent necessary to meet margin requirements until the short position is closed out. A deposit must also be maintained with the Fund’s custodian/counterparty broker consisting of cash and/or securities having a value equal to a specified percentage of the value of the securities sold short. The Fund is obligated to pay fees for borrowing the securities sold short and is required to pay the counterparty any dividends and/or interest due on securities sold short. Such dividends and/or interest and any security borrowing fees are recorded as an expense to the Fund.
e. Senior Floating Rate Interests
The Fund invests in senior secured corporate loans that pay interest at rates which are periodically reset by reference to a base lending rate plus a spread. These base lending rates are
| franklintempleton.com | Semiannual Report | 29 |
FRANKLIN MUTUAL BEACON FUND
NOTES TO FINANCIAL STATEMENTS (UNAUDITED)
1. Organization and Significant Accounting
Policies (continued)
e. Senior Floating Rate Interests (continued)
generally the prime rate offered by a designated U.S. bank or the London InterBank Offered Rate (LIBOR). Senior secured corporate loans often require prepayment of principal from excess cash flows or at the discretion of the borrower. As a result, actual maturity may be substantially less than the stated maturity. Senior secured corporate loans in which the Fund invests are generally readily marketable, but may be subject to certain restrictions on resale.
f. Income and Deferred Taxes
It is the Fund’s policy to qualify as a regulated investment company under the Internal Revenue Code. The Fund intends to distribute to shareholders substantially all of its taxable income and net realized gains to relieve it from federal income and excise taxes. As a result, no provision for U.S. federal income taxes is required.
The Fund may be subject to foreign taxation related to income received, capital gains on the sale of securities and certain foreign currency transactions in the foreign jurisdictions in which it invests. Foreign taxes, if any, are recorded based on the tax regulations and rates that exist in the foreign markets in which the Fund invests. When a capital gain tax is determined to apply, the Fund records an estimated deferred tax liability in an amount that would be payable if the securities were disposed of on the valuation date.
As a result of several court cases, in certain countries across the European Union, the Fund filed additional tax reclaims for previously withheld taxes on dividends earned in those countries (EU reclaims). These additional filings are subject to various administrative proceedings by the local jurisdictions’ tax authorities within the European Union, as well as a number of related judicial proceedings. Income recognized, if any, for EU reclaims is reflected as other income in the Statement of Operations and any related receivable, if any, is reflected as European Union tax reclaims in the Statement of Assets and Liabilities. When uncertainty exists as to the ultimate resolution of these proceedings, the likelihood of receipt of these EU reclaims, and the potential timing of payment, no amounts are reflected in the financial statements. For U.S. income tax
purposes, EU reclaims received by the Fund, if any, reduce the amounts of foreign taxes Fund shareholders can use as tax credits in their individual income tax returns.
The Fund may recognize an income tax liability related to its uncertain tax positions under U.S. GAAP when the uncertain tax position has a less than 50% probability that it will be sustained upon examination by the tax authorities based on its technical merits. As of June 30, 2018, the Fund has determined that no tax liability is required in its financial statements related to uncertain tax positions for any open tax years (or expected to be taken in future tax years). Open tax years are those that remain subject to examination and are based on the statute of limitations in each jurisdiction in which the Fund invests.
g. Security Transactions, Investment Income, Expenses and Distributions
Security transactions are accounted for on trade date. Realized gains and losses on security transactions are determined on a specific identification basis. Interest income and estimated expenses are accrued daily. Amortization of premium and accretion of discount on debt securities are included in interest income. Dividend income and dividends declared on securities sold short are recorded on the ex-dividend date except for certain dividends from securities where the dividend rate is not available. In such cases, the dividend is recorded as soon as the information is received by the Fund. Distributions to shareholders are recorded on the ex-dividend date. Distributable earnings are determined according to income tax regulations (tax basis) and may differ from earnings recorded in accordance with U.S. GAAP. These differences may be permanent or temporary. Permanent differences are reclassified among capital accounts to reflect their tax character. These reclassifications have no impact on net assets or the results of operations. Temporary differences are not reclassified, as they may reverse in subsequent periods.
Common expenses incurred by the Trust are allocated among the Funds based on the ratio of net assets of each Fund to the combined net assets of the Trust or based on the ratio of number of shareholders of each Fund to the combined number of shareholders of the Trust. Fund specific expenses are charged directly to the Fund that incurred the expense.
| 30 | Semiannual Report | franklintempleton.com |
FRANKLIN MUTUAL BEACON FUND
NOTES TO FINANCIAL STATEMENTS (UNAUDITED)
Realized and unrealized gains and losses and net investment income, excluding class specific expenses, are allocated daily to each class of shares based upon the relative proportion of net assets of each class. Differences in per share distributions by class are generally due to differences in class specific expenses.
h. Accounting Estimates
The preparation of financial statements in accordance with U.S. GAAP requires management to make estimates and assumptions that affect the reported amounts of assets and liabilities at the date of the financial statements and the amounts of income and expenses during the reporting period. Actual results could differ from those estimates.
i. Guarantees and Indemnifications
Under the Trust’s organizational documents, its officers and trustees are indemnified by the Trust against certain liabilities arising out of the performance of their duties to the Trust. Additionally, in the normal course of business, the Trust, on behalf of the Fund, enters into contracts with service providers that contain general indemnification clauses. The Trust’s maximum exposure under these arrangements is unknown as this would involve future claims that may be made against the Trust that have not yet occurred. Currently, the Trust expects the risk of loss to be remote.
2. Shares of Beneficial Interest
At June 30, 2018, there were an unlimited number of shares authorized (without par value). Transactions in the Fund’s shares were as follows:
Six Months Ended June 30, 2018 | Year Ended December 31, 2017 | |||||||||||||||
| Shares | Amount | Shares | Amount | |||||||||||||
| Class Z Shares: | ||||||||||||||||
| Shares sold | 2,700,738 | $ | 44,876,995 | 12,158,938 | $ | 199,279,041 | ||||||||||
| Shares issued in reinvestment of distributions | — | — | 7,927,106 | 130,651,385 | ||||||||||||
| Shares redeemed | (9,285,461 | ) | (154,446,236 | ) | (25,064,661 | ) | (416,359,870 | ) | ||||||||
|
| |||||||||||||||
| Net increase (decrease) | (6,584,723 | ) | $ | (109,569,241 | ) | (4,978,617 | ) | $ | (86,429,444 | ) | ||||||
|
| |||||||||||||||
| Class A Shares: | ||||||||||||||||
| Shares sold | 2,279,480 | $ | 37,698,470 | 5,808,494 | $ | 94,712,185 | ||||||||||
| Shares issued in reinvestment of distributions | — | — | 2,889,127 | 47,191,652 | ||||||||||||
| Shares redeemed | (5,899,855 | ) | (97,185,331 | ) | (14,375,309 | ) | (234,062,403 | ) | ||||||||
|
| |||||||||||||||
| Net increase (decrease) | (3,620,375 | ) | $ | (59,486,861 | ) | (5,677,688 | ) | $ | (92,158,566 | ) | ||||||
|
| |||||||||||||||
| Class C Shares: | ||||||||||||||||
| Shares sold | 333,736 | $ | 5,450,003 | 1,150,062 | $ | 18,503,214 | ||||||||||
| Shares issued in reinvestment of distributions | — | — | 672,846 | 10,882,501 | ||||||||||||
| Shares redeemed | (2,231,577 | ) | (36,370,069 | ) | (4,170,647 | ) | (67,550,811 | ) | ||||||||
|
| |||||||||||||||
| Net increase (decrease) | (1,897,841 | ) | $ | (30,920,066 | ) | (2,347,739 | ) | $ | (38,165,096 | ) | ||||||
|
| |||||||||||||||
| Class R Shares: | ||||||||||||||||
| Shares sold | 20,243 | $ | 338,568 | 32,014 | $ | 516,552 | ||||||||||
| Shares issued in reinvestment of distributions | — | — | 5,476 | 88,349 | ||||||||||||
| Shares redeemed | (6,588 | ) | (106,972 | ) | (74,775 | ) | (1,212,237 | ) | ||||||||
|
| |||||||||||||||
| Net increase (decrease) | 13,655 | $ | 231,596 | (37,285 | ) | $ | (607,336 | ) | ||||||||
|
| |||||||||||||||
| Class R6 Shares: | ||||||||||||||||
| Shares sold | 673,795 | $ | 11,234,727 | 6,649,392 | $ | 112,866,490 | ||||||||||
| Shares issued in reinvestment of distributions | — | — | 249,808 | 4,128,902 | ||||||||||||
| Shares redeemed | (1,282,252 | ) | (21,313,078 | ) | (503,515 | ) | (8,443,891 | ) | ||||||||
|
| |||||||||||||||
| Net increase (decrease) | (608,457 | ) | $ | (10,078,351 | ) | 6,395,685 | $ | 108,551,501 | ||||||||
|
| |||||||||||||||
| franklintempleton.com | Semiannual Report | 31 |
FRANKLIN MUTUAL BEACON FUND
NOTES TO FINANCIAL STATEMENTS (UNAUDITED)
3. Transactions with Affiliates
Franklin Resources, Inc. is the holding company for various subsidiaries that together are referred to as Franklin Templeton Investments. Certain officers and trustees of the Fund are also officers and/or directors of the following subsidiaries:
| Subsidiary | Affiliation | |
Franklin Mutual Advisers, LLC (Franklin Mutual) | Investment manager | |
Franklin Templeton Services, LLC (FT Services) | Administrative manager | |
Franklin Templeton Distributors, Inc. (Distributors) | Principal underwriter | |
Franklin Templeton Investor Services, LLC (Investor Services) | Transfer agent |
a. Management Fees
The Fund pays an investment management fee to Franklin Mutual based on the average daily net assets of the Fund as follows:
| Annualized Fee Rate | Net Assets | |
0.675% | Up to and including $5 billion | |
0.645% | Over $5 billion, up to and including $7 billion | |
0.625% | Over $7 billion, up to and including $10 billion | |
0.615% | In excess of $10 billion |
For the period ended June 30, 2018, the annualized gross effective investment management fee rate was 0.675% of the Fund’s average daily net assets.
b. Administrative Fees
Under an agreement with Franklin Mutual, FT Services provides administrative services to the Fund. The fee is paid by Franklin Mutual based on the Fund’s average daily net assets, and is not an additional expense of the Fund.
c. Distribution Fees
The Board has adopted distribution plans for each share class, with the exception of Class Z and Class R6 shares, pursuant to Rule 12b-1 under the 1940 Act. Under the Fund’s Class A reimbursement distribution plan, the Fund reimburses Distributors for costs incurred in connection with the servicing, sale and distribution of the Fund’s shares up to the maximum annual plan rate. Under the Class A reimbursement distribution plan, costs exceeding the maximum for the current plan year cannot be reimbursed in subsequent periods. In addition, under the Fund’s Class C and R compensation distribution plans, the Fund pays Distributors for costs incurred in connection with the servicing, sale and distribution of the Fund’s shares up to the maximum annual plan rate for each class. The plan year, for purposes of monitoring compliance with the maximum annual plan rates, is February 1 through January 31.
The maximum annual plan rates, based on the average daily net assets, for each class, are as follows:
Class A | 0.35% | |||
Class C | 1.00% | |||
Class R | 0.50% |
The Board has set the current rate at 0.25% per year for Class A shares until further notice and approval by the Board.
| 32 | Semiannual Report | franklintempleton.com |
FRANKLIN MUTUAL BEACON FUND
NOTES TO FINANCIAL STATEMENTS (UNAUDITED)
d. Sales Charges/Underwriting Agreements
Front-end sales charges and contingent deferred sales charges (CDSC) do not represent expenses of the Fund. These charges are deducted from the proceeds of sales of Fund shares prior to investment or from redemption proceeds prior to remittance, as applicable. Distributors has advised the Fund of the following commission transactions related to the sales and redemptions of the Fund’s shares for the period:
Sales charges retained net of commissions paid to unaffiliated brokers/dealers | $ | 45,223 | ||
CDSC retained | $ | 5,709 |
e. Transfer Agent Fees
Each class of shares pays transfer agent fees to Investor Services for its performance of shareholder servicing obligations. Effective November 1, 2017, the fees are based on an annualized asset based fee of 0.02% plus a transaction based fee. Prior to November 1, 2017, the fees were account based fees that varied based on fund or account type. In addition, each class reimburses Investor Services for out of pocket expenses incurred and, except for Class R6, reimburses shareholder servicing fees paid to third parties. These fees are allocated daily based upon their relative proportion of such classes’ aggregate net assets. Class R6 pays Investor Services transfer agent fees specific to that class.
For the period ended June 30, 2018, the Fund paid transfer agent fees of $1,767,921, of which $799,989 was retained by Investor Services.
f. Waiver and Expense Reimbursements
Investor Services has voluntarily agreed in advance to waive or limit its fees so that the Class R6 transfer agent fees do not exceed 0.02% based on the average net assets of the class. Investor Services may discontinue this waiver in the future.
4. Expense Offset Arrangement
The Fund has entered into an arrangement with its custodian whereby credits realized as a result of uninvested cash balances are used to reduce a portion of the Fund’s custodian expenses. During the period ended June 30, 2018, the custodian fees were reduced as noted in the Statement of Operations.
5. Independent Trustees’ Retirement Plan
On January 1, 1993, the Trust adopted an Independent Trustees’ Retirement Plan (Plan). The Plan is an unfunded defined benefit plan that provides benefit payments to Trustees whose length of service and retirement age meets the eligibility requirements of the Plan. Benefits under the Plan are based on years of service and fees paid to each trustee at the time of retirement. Effective in December 1996, the Plan was closed to new participants.
During the period ended June 30, 2018, the Fund’s projected benefit obligation and benefit payments under the Plan were as follows:
aProjected benefit obligation at June 30, 2018 | $ | 220,463 | ||
bIncrease in projected benefit obligation | $ | 1,577 | ||
Benefit payments made to retired trustees | $ | (2,037 | ) |
aThe projected benefit obligation is included in trustees’ fees and expenses in the Statement of Assets and Liabilities.
bThe increase in projected benefit obligation is included in trustees’ fees and expenses in the Statement of Operations.
| franklintempleton.com | Semiannual Report | 33 |
FRANKLIN MUTUAL BEACON FUND
NOTES TO FINANCIAL STATEMENTS (UNAUDITED)
6. Income Taxes
For tax purposes, the Fund may elect to defer any portion of a post-October capital loss to the first day of the following fiscal year. At December 31, 2017, the Fund deferred post-October capital losses of $2,417,876.
At June 30, 2018, the cost of investments and net unrealized appreciation (depreciation) for income tax purposes were as follows:
Cost of investments | $ | 3,061,428,746 | ||
|
| |||
Unrealized appreciation | $ | 813,752,244 | ||
Unrealized depreciation | (215,879,418 | ) | ||
|
| |||
Net unrealized appreciation (depreciation) | $ | 597,872,826 | ||
|
|
Differences between income and/or capital gains as determined on a book basis and a tax basis are primarily due to differing treatment of foreign currency transactions.
7. Investment Transactions
Purchases and sales of investments (excluding short term securities and securities sold short) for the period ended June 30, 2018, aggregated $744,680,754 and $870,695,796, respectively.
8. Credit Risk and Defaulted Securities
The Fund may purchase the pre-default or defaulted debt of distressed companies. Distressed companies are financially troubled and could be or are already involved in financial restructuring or bankruptcy. Risks associated with purchasing these securities include the possibility that the bankruptcy or other restructuring process takes longer than expected, or that distributions in restructuring are less than anticipated, either or both of which may result in unfavorable consequences to the Fund. If it becomes probable that the income on debt securities, including those of distressed companies, will not be collected, the Fund discontinues accruing income and recognizes an adjustment for uncollectible interest.
At June 30, 2018, the aggregate long value of distressed company securities for which interest recognition has been discontinued was $30,381,406, representing 0.8% of the Fund’s net assets. For information as to specific securities, see the accompanying Statement of Investments.
9. Concentration of Risk
Investing in foreign securities may include certain risks and considerations not typically associated with investing in U.S. securities, such as fluctuating currency values and changing local and regional economic, political and social conditions, which may result in greater market volatility. In addition, certain foreign securities may not be as liquid as U.S. securities.
10. Restricted Securities
The Fund invests in securities that are restricted under the Securities Act of 1933 (1933 Act). Restricted securities are often purchased in private placement transactions, and cannot be sold without prior registration unless the sale is pursuant to an exemption under the 1933 Act. Disposal of these securities may require greater effort and expense, and prompt sale at an acceptable price may be difficult. The Fund may have registration rights for restricted securities. The issuer generally incurs all registration costs.
| 34 | Semiannual Report | franklintempleton.com |
FRANKLIN MUTUAL BEACON FUND
NOTES TO FINANCIAL STATEMENTS (UNAUDITED)
At June 30, 2018, investments in restricted securities, excluding securities exempt from registration under the 1933 Act deemed to be liquid, were as follows:
| Principal Amount/ Shares | Issuer | Acquisition Date | Cost | Value | ||||||||||||
| 10,848 | Broadband Ventures III LLC, secured promissory note, 5.00%, 2/01/12 | 7/01/10 - 11/30/12 | $ | 10,848 | $ | — | ||||||||||
| 2,846,329 | International Automotive Components Group Brazil LLC | 4/13/06 - 12/26/08 | 1,890,264 | 64,720 | ||||||||||||
| 22,836,904 | International Automotive Components Group North America LLC | 1/12/06 - 3/18/13 | 18,692,218 | 6,837,118 | ||||||||||||
|
| |||||||||||||||
Total Restricted Securities (Value is 0.2% of Net Assets) | $ | 20,593,330 | $ | 6,901,838 | ||||||||||||
|
| |||||||||||||||
11. Other Derivative Information
At June 30, 2018, the Fund’s investments in derivative contracts are reflected in the Statement of Assets and Liabilities as follows:
Asset Derivatives | Liability Derivatives | |||||||||||
Derivative Contracts Not Accounted for as Hedging Instruments | Statement of Assets and Liabilities Location | Fair Value | Statement of Assets and Liabilities Location | Fair Value | ||||||||
| Foreign exchange contracts | Variation margin on futures contracts | $ | 3,803,423 | a | Variation margin on futures contracts | $ | — | |||||
Unrealized appreciation on OTC forward exchange contracts | 22,275,102 | Unrealized depreciation on OTC forward exchange contracts | 713,286 | |||||||||
|
|
|
| |||||||||
Totals | $ | 26,078,525 | $ | 713,286 | ||||||||
|
|
|
| |||||||||
aThis amount reflects the cumulative appreciation (depreciation) of futures contracts as reported in the Statement of Investments. Only the variation margin receivable/ payable at period end is separately reported within the Statement of Assets and Liabilities. Prior variation margin movements were recorded to cash upon receipt or payment.
For the period ended June 30, 2018, the effect of derivative contracts in the Fund’s Statement of Operations was as follows:
Derivative Contracts Not Accounted for as Hedging Instruments | Statement of Operations Location | Net Realized Gain (Loss) for the Period | Statement of Operations Location | Net Change in Unrealized Appreciation (Depreciation) for the Period | ||||||||
Net realized gain (loss) from: | Net change in unrealized appreciation (depreciation) on: | |||||||||||
Foreign exchange contracts | Forward exchange contracts | $(18,607,912 | ) | Forward exchange contracts | $40,216,324 | |||||||
Futures contracts | 4,087,410 | Futures contracts | 8,043,020 | |||||||||
|
|
|
| |||||||||
Totals | $(14,520,502 | ) | $48,259,344 | |||||||||
|
|
|
| |||||||||
For the period ended June 30, 2018, the average month end notional amount of futures contracts represented $323,703,388. The average month end contract value of forward exchange contracts was $718,230,087.
See Note 1(c) regarding derivative financial instruments.
| franklintempleton.com | Semiannual Report | 35 |
FRANKLIN MUTUAL BEACON FUND
NOTES TO FINANCIAL STATEMENTS (UNAUDITED)
12. Holdings of 5% Voting Securities of Portfolio Companies
The 1940 Act defines “affiliated companies” to include investments in portfolio companies in which a fund owns 5% or more of the outstanding voting securities. During the period ended June 30, 2018, investments in “affiliated companies” were as follows:
| Name of Issuer | Number of Shares Held at Beginning of Period | Gross Additions | Gross Reductions | Number of Shares Held at End of Period | Value at End of Period | Dividend Income | Realized Gain (Loss) | Net Change in Unrealized Appreciation (Depreciation) | ||||||||||||||||||||||||
| Non-Controlled Affiliates | ||||||||||||||||||||||||||||||||
CB FIM Coinvestors LLC | 15,831,950 | — | (15,831,950 | )a | — | $— | $— | $10,196 | $— | |||||||||||||||||||||||
|
| |||||||||||||||||||||||||||||||
aGross reduction was the result of a corporate action.
13. Credit Facility
The Fund, together with other U.S. registered and foreign investment funds (collectively, Borrowers), managed by Franklin Templeton Investments, are borrowers in a joint syndicated senior unsecured credit facility totaling $2 billion (Global Credit Facility) which matures on February 8, 2019. This Global Credit Facility provides a source of funds to the Borrowers for temporary and emergency purposes, including the ability to meet future unanticipated or unusually large redemption requests.
Under the terms of the Global Credit Facility, the Fund shall, in addition to interest charged on any borrowings made by the Fund and other costs incurred by the Fund, pay its share of fees and expenses incurred in connection with the implementation and maintenance of the Global Credit Facility, based upon its relative share of the aggregate net assets of all of the Borrowers, including an annual commitment fee of 0.15% based upon the unused portion of the Global Credit Facility. These fees are reflected in other expenses in the Statement of Operations. During the period ended June 30, 2018, the Fund did not use the Global Credit Facility.
14. Fair Value Measurements
The Fund follows a fair value hierarchy that distinguishes between market data obtained from independent sources (observable inputs) and the Fund’s own market assumptions (unobservable inputs). These inputs are used in determining the value of the Fund’s financial instruments and are summarized in the following fair value hierarchy:
| • | Level 1 – quoted prices in active markets for identical financial instruments |
| • | Level 2 – other significant observable inputs (including quoted prices for similar financial instruments, interest rates, prepayment speed, credit risk, etc.) |
| • | Level 3 – significant unobservable inputs (including the Fund’s own assumptions in determining the fair value of financial instruments) |
The input levels are not necessarily an indication of the risk or liquidity associated with financial instruments at that level.
For movements between the levels within the fair value hierarchy, the Fund has adopted a policy of recognizing the transfers as of the date of the underlying event which caused the movement.
| 36 | Semiannual Report | franklintempleton.com |
FRANKLIN MUTUAL BEACON FUND
NOTES TO FINANCIAL STATEMENTS (UNAUDITED)
A summary of inputs used as of June 30, 2018, in valuing the Fund’s assets and liabilities carried at fair value, is as follows:
| Level 1 | Level 2 | Level 3 | Total | |||||||||||||
| Assets: | ||||||||||||||||
Investments in Securities:a | ||||||||||||||||
Equity Investments:b | ||||||||||||||||
Auto Components | $ | — | $ | — | $ | 6,901,838 | $ | 6,901,838 | ||||||||
Media | 433,742,699 | 1,584,119 | — | 435,326,818 | ||||||||||||
All Other Equity Investments | 3,082,867,947 | — | — | c | 3,082,867,947 | |||||||||||
Corporate Notes and Senior Floating Rate Interests | — | 45,238,971 | — | 45,238,971 | ||||||||||||
Corporate Notes and Senior Floating Rate Interests in Reorganization | — | 30,381,406 | — | c | 30,381,406 | |||||||||||
Companies in Liquidation | — | 1,422,727 | — | c | 1,422,727 | |||||||||||
Short Term Investments | 90,680,865 | 23,800,000 | — | 114,480,865 | ||||||||||||
|
| |||||||||||||||
Total Investments in Securities | $ | 3,607,291,511 | $ | 102,427,223 | $ | 6,901,838 | $ | 3,716,620,572 | ||||||||
|
| |||||||||||||||
Other Financial Instruments: | ||||||||||||||||
Futures Contracts | $ | 3,803,423 | $ | — | $ | — | $ | 3,803,423 | ||||||||
Forward Exchange Contracts | — | 22,275,102 | — | 22,275,102 | ||||||||||||
|
| |||||||||||||||
Total Other Financial Instruments | $ | 3,803,423 | $ | 22,275,102 | $ | — | $ | 26,078,525 | ||||||||
|
| |||||||||||||||
| Liabilities: | ||||||||||||||||
Other Financial Instruments: | ||||||||||||||||
Securities Sold Shorta | $ | 82,694,229 | $ | — | $ | — | $ | 82,694,229 | ||||||||
Forward Exchange Contracts | — | 713,286 | — | 713,286 | ||||||||||||
|
| |||||||||||||||
Total Other Financial Instruments | $ | 82,694,229 | $ | 713,286 | $ | — | $ | 83,407,515 | ||||||||
|
| |||||||||||||||
aFor detailed categories, see the accompanying Statement of Investments.
bIncludes common, preferred stocks and management investment companies as well as other equity investments.
cIncludes securities determined to have no value at June 30, 2018.
A reconciliation of assets in which Level 3 inputs are used in determining fair value is presented when there are significant Level 3 financial instruments at the beginning and/or end of the period.
15. Subsequent Events
The Fund has evaluated subsequent events through the issuance of the financial statements and determined that no events have occurred that require disclosure, except for the following:
On February 27, 2018, the Board approved an automatic conversion feature for Class C that will convert shareholders’ Class C shares into Class A shares after they have been held for 10 years. The conversion feature will become effective on a future date prior to the calendar year end of 2018. Further details are disclosed in the Fund’s Prospectus.
On May 17, 2018, the Board approved changes to certain front-end sales charges and dealer commissions on Class A shares. The changes will become effective on or about September 10, 2018. Further details are disclosed in the Fund’s Prospectus.
| franklintempleton.com | Semiannual Report | 37 |
FRANKLIN MUTUAL BEACON FUND
NOTES TO FINANCIAL STATEMENTS (UNAUDITED)
Abbreviations
| Counterparty | Currency | Selected Portfolio | ||||||||
| BOFA | Bank of America Corp. | EUR | Euro | ADR | American Depositary Receipt | |||||
| BONY | The Bank of New York Mellon Corp. | GBP | British Pound | FHLB | Federal Home Loan Bank | |||||
| HSBK | HSBC Bank PLC | USD | United States Dollar | LIBOR | London InterBank Offered Rate | |||||
| SSBT | State Street Bank and Trust Co., N.A. | TRA | Tax Receivable Agreement Right | |||||||
| UBSW | UBS AG | |||||||||
| 38 | Semiannual Report | franklintempleton.com |
FRANKLIN MUTUAL SERIES FUNDS
FRANKLIN MUTUAL BEACON FUND
Shareholder Information
Board Approval of Investment Management Agreements
FRANKLIN MUTUAL SERIES FUNDS
Franklin Mutual Beacon Fund
(Fund)
The Board of Trustees (Board), including a majority of trustees that are not “interested persons” as such term is defined in section 2(a)(19) of the Investment Company Act of 1940 (hereinafter referred to as “independent trustees”), at an in-person meeting held on May 17, 2018, unanimously approved the renewal of the Fund’s investment management agreement. Prior to a meeting of all of the trustees for the purpose of considering such renewal, the independent trustees participated in two other meetings held in connection with the renewal process. Throughout the process, the independent trustees received assistance and advice from and met separately with independent counsel. The independent trustees met with and interviewed officers of the investment manager (including portfolio managers), the transfer agent and shareholder services group and the distributor. In approving the renewal of the investment management agreement for the Fund, the Board, including the independent trustees, determined that the investment management fee structure was fair and reasonable and that continuance of the agreement was in the best interests of the Fund and its shareholders.
In reaching their decision on the investment management agreement, the trustees took into account information furnished throughout the year at regular Board meetings, as well as information specifically requested and furnished for the renewal process, which culminated in the meetings referred to above for the specific purpose of considering such agreement. Information furnished throughout the year included, among others, reports on the Fund’s investment performance, expenses, portfolio composition, portfolio brokerage execution, client commission arrangements, derivatives, securities lending, asset segregation, portfolio turnover, Rule 12b-1 plan, distribution, shareholder servicing, legal and compliance matters, pricing of securities, sales and redemptions, and marketing support payments made to financial intermediaries, as well as a third-party survey of transfer agent fees charged to funds within the Franklin Templeton Investments (FTI) complex in comparison with those charged to other fund complexes deemed comparable. Also, related financial statements and other information about the scope and quality of services provided by the investment manager and its affiliates and enhancements to such services over the past year were
provided. In addition, the trustees received periodic reports throughout the year and during the renewal process relating to compliance with the Fund’s investment policies and restrictions. During the renewal process, the independent trustees considered the investment manager’s methods of operation within the Franklin Templeton group and its activities on behalf of other clients. The Board also noted that it received an annual report on all payments made by FTI or the Fund to financial intermediaries engaged in the sale of Fund shares, as well as a memorandum relating to third-party servicing arrangements in response to a Guidance Update from the U.S. Securities and Exchange Commission (SEC) relating to mutual fund distribution and sub-accounting fees.
The information obtained by the trustees during the renewal process also included a special report prepared by Broadridge Financial Solutions, Inc., an independent third-party analyst that utilizes data from Lipper, Inc. (“Lipper”), comparing the Fund’s investment performance and expenses with those of other mutual funds deemed comparable to the Fund as selected by Lipper (Broadridge Section 15(c) Report). The trustees reviewed the Broadridge Section 15(c) Report and its usefulness in the renewal process with respect to matters such as comparative fees, expenses, expense ratios, performance and volatility. They concluded that the report continues to be a reliable resource in the performance of their duties.
In addition, the trustees received a Profitability Study (Profitability Study) prepared by management discussing the profitability to FTI from its overall U.S. fund operations, as well as on an individual fund-by-fund basis. Over the past year, the Board and counsel to the independent trustees continued to receive reports on management’s handling of recent regulatory inquiries and pending legal actions against the investment manager and its affiliates. The independent trustees were satisfied with the actions taken to date by management in response to such regulatory and legal matters.
The trustees reviewed the personnel, operations, financial condition, and investment management capabilities, methodologies and resources of the investment manager. As part of this review, particular attention was given to management’s diligent risk management program, including continual monitoring and management of cybersecurity, liquidity and counterparty credit risk, and attention given to derivatives and other complex instruments that are held and expected to be held by the Fund and how such instruments are used to carry out the Fund’s investment goal(s). The Board also took into account, among other things, management’s efforts in
| franklintempleton.com | Semiannual Report | 39 |
FRANKLIN MUTUAL SERIES FUNDS
FRANKLIN MUTUAL BEACON FUND
SHAREHOLDER INFORMATION
establishing a global credit facility for the benefit of the Fund and other accounts managed by FTI to provide a source of cash for temporary and emergency purposes or to meet unusual redemption requests as well as the strong financial position of the investment manager’s parent company and its commitment to the mutual fund business. The Board noted management’s continuing efforts and expenditures in establishing effective business continuity plans and developing strategies to address areas of heightened concern in the mutual fund industry, such as cybersecurity and liquidity risk management. The Board also recognized management’s commitment to facilitating Board oversight of particular areas, including derivatives and payments to intermediaries, by enhanced reporting.
In addition to the above and other matters considered by the trustees throughout the course of the year, the following discussion relates to certain primary factors relevant to the Board’s decision. This discussion of the information and factors considered by the Board (including the information and factors discussed above) is not intended to be exhaustive, but rather summarizes certain factors considered by the Board. In view of the wide variety of factors considered, the Board did not, unless otherwise noted, find it practicable to quantify or otherwise assign relative weights to the foregoing factors. In addition, individual trustees may have assigned different weights to various factors.
NATURE, EXTENT AND QUALITY OF SERVICES. The trustees reviewed the nature, extent and quality of the services provided, and to be provided, by the investment manager. The trustees cited the investment manager’s ability to implement the Fund’s disciplined value investment approach and its long-term relationship with the Fund as reasons that shareholders choose to invest, and remain invested, in the Fund. The trustees reviewed the Fund’s portfolio management team, including its performance, staffing, skills and compensation program. With respect to portfolio manager compensation, management assured the trustees that the Fund’s long-term performance is a significant component of incentive-based compensation and noted that a portion of a portfolio manager’s incentive-based compensation is paid in shares of pre-designated funds from the portfolio manager’s fund management area. The trustees noted that the portfolio manager compensation program aligned the interests of the portfolio managers with that of shareholders of the Fund. The trustees discussed with management various other products, portfolios and entities that are advised by the investment manager and the allocation of assets and expenses among and within them, as well as their relative fees and reasons for differences with respect thereto and any potential
conflicts. During regular Board meetings and the aforementioned meetings of the independent trustees, the trustees received reports and presentations on the investment manager’s best execution trading policies. The trustees considered periodic reports provided to them showing that the investment manager complied with the investment policies and restrictions of the Fund as well as other reports periodically furnished to the Board covering matters such as the compliance of portfolio managers and other management personnel with the code of ethics covering the investment management personnel, the adherence to fair value pricing procedures established by the Board and the accuracy of net asset value calculations. The Board noted the extent of the benefits provided to Fund shareholders from being part of the Franklin Templeton group of funds, including the right to exchange investments between funds (same class) without a sales charge, the ability to reinvest Fund dividends into other funds and the right to combine holdings of other funds to obtain reduced sales charges. The Board considered the investment manager’s significant efforts in developing and implementing compliance procedures established in accordance with SEC and other requirements.
The Board considered the nature, extent and quality of the services to be provided under the Fund’s other service agreements to determine that, on an overall basis, Fund shareholders were well served. In this connection, the Board also took into account transfer agent and shareholder services provided to Fund shareholders by an affiliate of the investment manager, noting continuing expenditures by management to increase and improve the scope of such services and favorable periodic reports on shareholder services conducted by independent third parties. While such considerations directly affected the trustees’ decision in renewing the Fund’s transfer agent and shareholder services agreement, the Board also considered these commitments as incidental benefits to Fund shareholders deriving from the investment management relationship.
Based on their review, the trustees were satisfied with the nature and quality of the overall services provided, and to be provided, by the investment manager and its affiliates to the Fund and its shareholders and were confident in the abilities of the management team to continue the disciplined value investment approach of the Fund and to provide quality services to the Fund and its shareholders.
INVESTMENT PERFORMANCE. The trustees reviewed and placed significant emphasis on the investment performance of the Fund over the one-, three-, five- and 10-year periods
| 40 | Semiannual Report | franklintempleton.com |
FRANKLIN MUTUAL SERIES FUNDS
FRANKLIN MUTUAL BEACON FUND
SHAREHOLDER INFORMATION
ended December 31, 2017. They considered the history of successful performance of the Fund relative to various benchmarks. As part of their review, they inquired of management regarding benchmarks, style drift and restrictions on permitted investments. Consideration was also given to performance in the context of available levels of cash during the periods.
The trustees had meetings during the year, including the meetings referred to above held in connection with the renewal process, with the Fund’s portfolio managers to discuss performance and the management of the Fund. In addition to the materials provided by management in connection with the renewal process, the independent trustees requested supplemental information and additional presentations from the investment manager and senior management of FTI regarding the performance of the investment manager and the Fund. As part of these presentations, it was noted that senior management of FTI is conducting a review of the investment manager and the Fund and will report the results thereof to the independent trustees when completed. In addition, particular attention in assessing performance was given to the Broadridge Section 15(c) Report. That report showed the investment performance of the Fund (Class A shares) in comparison to other funds determined comparable by Lipper.
The comparable funds to the Fund, as chosen by Lipper, included all retail and institutional global multi-cap value funds. The Fund had total returns in the lowest performing quintile for the one-year period ended December 31, 2017, and had annualized total returns for the three- and five-year periods in the second-best performing quintile. The trustees noted that the Fund’s total return on an annualized basis for the 10-year period ended December 31, 2017 was in the second-best performing quintile. The trustees discussed with management the reasons for the relative underperformance for the one-year period ended December 31, 2017. While noting such discussions, overall, the trustees were satisfied with such comparative performance.
The trustees also compared Fund performance to other industry benchmarks, including measures of risk-adjusted performance of a fund, as part of their evaluation of investment performance. The trustees concluded that the Fund had continued to perform well in comparison to its various benchmarks and in the context of the Fund’s goals.
COMPARATIVE EXPENSES AND MANAGEMENT PROFITABILITY. The trustees considered the cost of the services provided and to be provided and the profits realized by
the investment manager and its affiliates from their respective relationships with the Fund. As part of the renewal process, the trustees explored with management the trends in expense ratios over the past three fiscal years and the reasons for any increases in the Fund’s expense ratios (or components thereof). In considering the appropriateness of the management fee and other expenses charged to the Fund, the Board took into account various factors including investment performance and matters relating to Fund operations, including, but not limited to, the quality and experience of its portfolio managers and research staff. Consideration was also given to a comparative analysis in the Broadridge Section 15(c) Report of the investment management fee and total expense ratio of the Fund in comparison with those of a group of other funds selected by Lipper as its appropriate Lipper expense group. Lipper expense data is based upon information taken from each fund’s most recent annual report, which reflects historical asset levels that may be quite different from those currently existing, particularly in a period of market volatility. While recognizing such inherent limitation and the fact that expense ratios generally increase as assets decline and decrease as assets grow, the Board believed the independent analysis conducted by Lipper to be an appropriate measure of comparative expenses.
In reviewing comparative costs, emphasis was given to the Fund’s contractual management fee in comparison with the contractual management fee that would have been charged by other funds within its Lipper expense group assuming they were similar in size to the Fund, as well as the actual total expenses of the Fund in comparison with those of its Lipper expense group. The Lipper contractual management fee analysis includes administrative charges as being part of the management fee, and total expenses, for comparative consistency, are shown by Lipper for Fund Class A shares.
The Fund’s contractual management fee rate was in the second-least expensive quintile of its Lipper expense group and its total expenses were in the least expensive quintile of such group. The Board was satisfied with such comparative fees and expenses.
The trustees also reviewed the Profitability Study addressing profitability of Franklin Resources, Inc., from its overall U.S. fund business, as well as profitability to the Fund’s investment manager and its affiliates, from providing investment management and other services to the Fund during the 12-month period ended September 30, 2017, the most recent fiscal year-end of Franklin Resources, Inc. The trustees
| franklintempleton.com | Semiannual Report | 41 |
FRANKLIN MUTUAL SERIES FUNDS
FRANKLIN MUTUAL BEACON FUND
SHAREHOLDER INFORMATION
reviewed the basis on which such reports are prepared and the cost allocation methodology utilized in the Profitability Study, it being recognized that allocation methodologies may each be reasonable while producing different results. In this respect, the Board noted that the reasonableness of the cost allocation methodologies was reviewed by independent accountants on an every other year basis.
The independent trustees met with management to discuss the Profitability Study. This included, among other things, a comparison of investment management income with investment management expenses of the Fund; comparison of underwriting revenues and expenses; the relative relationship of investment management and underwriting expenses; shareholder servicing profitability; economies of scale; and the relative contribution of the Fund to the profitability of the investment manager and its parent. In discussing the Profitability Study with the Board, the investment manager stated its belief that the costs incurred in establishing the infrastructure necessary to operate the type of mutual fund operations conducted by it and its affiliates may not be fully reflected in the expenses allocated to the Fund in determining its profitability.
The Board also took into account management’s expenditures in improving shareholder services provided to the Fund, as well as the need to meet additional regulatory and compliance requirements. The trustees also considered the extent to which the investment manager may derive ancillary benefits from Fund operations, including those derived from economies of scale, discussed below, the allocation of Fund brokerage and the use of commission dollars to pay for research and other similar services.
Based upon their consideration of all these factors, the trustees determined that the level of profits realized by the investment manager and its affiliates in providing services to the Fund was not excessive in view of the nature, quality and extent of services provided.
ECONOMIES OF SCALE. The Board considered economies of scale realized by the investment manager and its affiliates as the Fund grows larger and the extent to which they are shared with Fund shareholders, as for example, in the level of the investment management fee charged, in the quality and efficiency of services rendered and in increased capital commitments benefiting the Fund directly or indirectly. While recognizing that any precise determination is inherently subjective, the trustees noted that, based upon the Profitability Study, as some funds increase in size, at some point economies of scale may result in the investment manager realizing a larger
profit margin on investment management services provided to such a fund. The trustees also noted that benefits of economies of scale will be shared with Fund shareholders due to the decline in the effective investment management fee rate as breakpoints are achieved by the Fund.
The trustees noted that breakpoints had been instituted as part of the Fund’s investment management fee and that the Board regularly evaluates whether additional breakpoints are appropriate. The trustees assessed the savings to shareholders resulting from such breakpoints and believed they were, and continue to be, appropriate and they agreed to continue to monitor the appropriateness of the breakpoints. The trustees also considered the effects an increase in assets under management would have on the investment management fee and expense ratio of the Fund. To the extent further economies of scale may be realized by the investment manager and its affiliates, the Board believed the investment management and administrative fees provide a sharing of benefits with the Fund and its shareholders.
Proxy Voting Policies and Procedures
The Fund’s investment manager has established Proxy Voting Policies and Procedures (Policies) that the Fund uses to determine how to vote proxies relating to portfolio securities. Shareholders may view the Fund’s complete Policies online at franklintempleton.com. Alternatively, shareholders may request copies of the Policies free of charge by calling the Proxy Group collect at (954) 527-7678 or by sending a written request to: Franklin Templeton Companies, LLC, 300 S.E. 2nd Street, Fort Lauderdale, FL 33301, Attention: Proxy Group. Copies of the Fund’s proxy voting records are also made available online at franklintempleton.com and posted on the US Securities and Exchange Commission’s website at sec.gov and reflect the most recent 12-month period ended June 30.
Quarterly Statement of Investments
The Trust, on behalf of the Fund, files a complete statement of investments with the US Securities and Exchange Commission for the first and third quarters for each fiscal year on Form N-Q. Shareholders may view the filed Form N-Q by visiting the Commission’s website at sec.gov. The filed form may also be viewed and copied at the Commission’s Public Reference Room in Washington, DC. Information regarding the operations of the Public Reference Room may be obtained by calling (800) SEC-0330.
| 42 | Semiannual Report | franklintempleton.com |
This page intentionally left blank.
This page intentionally left blank.
 | Semiannual Report and Shareholder Letter Franklin Mutual Beacon Fund
| |||
Investment Manager Franklin Mutual Advisers, LLC
| ||||
| Distributor | ||||
Franklin Templeton Distributors, Inc. (800) DIAL BEN® / 342-5236 franklintempleton.com
| ||||
Shareholder Services (800) 632-2301 - (Class A, C, R & R6) (800) 448-FUND - (Class Z) |
Authorized for distribution only when accompanied or preceded by a summary prospectus and/or prospectus. Investors should carefully consider a fund’s investment goals, risks, charges and expenses before investing. A prospectus contains this and other information; please read it carefully before investing.
To help ensure we provide you with quality service, all calls to and from our service areas are monitored and/or recorded.
| © 2018 Franklin Templeton Investments. All rights reserved. | 476 S 08/18 |
Franklin Templeton Investments
Why choose Franklin Templeton Investments?
Successful investing begins with ambition. And achievement only comes when you reach for it. That’s why we continually strive to deliver better outcomes for investors. No matter what your goals are, our deep, global investment expertise allows us to offer solutions that can help.
During our more than 70 years of experience, we’ve managed through all kinds of markets—up, down and those in between. We’re always preparing for what may come next. It’s because of this, combined with our strength as one of the world’s largest asset managers that we’ve earned the trust of millions of investors around the world.
Dear Franklin Mutual Global Discovery Fund Shareholder:
Securities markets started 2018 with positive momentum. Investors began the year focused on global economic growth, strong corporate profits across most developed markets and the potential benefits of US corporate and personal tax cuts. However, volatility and market downturns emerged due to political risks and trade tariffs, a temporary deceleration in developed market economic activity during the first quarter, and higher bond yields amid potential signs of increasing inflation pressures and likely interest rate hikes. Although some risks faded, such as the first-quarter deceleration in economic growth, the potential for an escalating trade war between the US and its trading partners remained a meaningful uncertainty for investors. For the period ended June 30, 2018, US stocks, as measured by the Standard & Poor’s® 500 Index (S&P 500®), produced a +2.65% total return.1 Stocks in global developed markets, as measured by the MSCI World Index, returned +0.76%, while investment-grade bonds, as measured by the Bloomberg Barclays US Aggregate Bond Index, had a -1.62% total return.1
Market performance was rather uneven during the period. Although the S&P 500 performed positively, most of the gains could be accounted for by a small number of companies. The list of those leading performers showed a concentration in information technology and internet-focused companies, or businesses that directly benefit from increased online commerce. It is no surprise, therefore, that growth stocks managed to outpace value stocks during the period. The Russell
1000® Growth Index returned +7.25%, while the Russell 1000® Value Index had a -1.69% total return.1
We do not know how long growth will continue to outpace value, but historically, periods of solid and steady economic growth have been a positive backdrop for value stocks. Low unemployment rates, increased business investment and solid consumer spending are all constructive signs for such a pace of economic growth. The US Federal Reserve’s efforts to gradually raise interest rates may be favorable for financial equities.
Value investing often requires an investor to be contrarian in nature. We continue to maintain a bottom-up stock-picking process that is disciplined, driven by rigorous fundamental analysis and attempts to limit downside risk. In our view, investing in underappreciated and misunderstood companies with identifiable catalysts for unlocking shareholder value can offer meaningful upside potential and a degree of downside protection in periods of financial market turbulence.
Although economic and investment fundamentals still appear to be favorable, the return of volatility is another reminder that securities markets are dynamic. As we enter into the second half of 2018, market sentiment may easily turn again given the uncertainty regarding an escalation in trade tensions, the upcoming US midterm elections, Brexit, the ability of US tax cuts to prolong the current economic expansion, and the pace of
1. Source: Morningstar. Frank Russell Company is the source and owner of the trademarks, service marks and copyrights related to the Russell Indexes. Russell® is a trademark of Frank Russell Company.
See www.franklintempletondatasources.com for additional data provider information.
| Not FDIC Insured | | | May Lose Value | | | No Bank Guarantee |
| franklintempleton.com | Not part of the semiannual report | 1 |
inflation. Therefore, we believe active, professional investment management serves investors well.
We also recognize the important role of financial advisors in today’s markets and encourage investors to continue to seek their advice. Amid changing markets and economic conditions, we are confident investors with a well-diversified portfolio and a patient, long-term outlook should be well positioned for the years ahead.
On the following pages, the Fund’s portfolio management team reviews investment decisions that pertain to performance during the past six months in light of the economic environment and other factors. Please remember all securities markets fluctuate, as do mutual fund share prices.
We thank you for investing with Franklin Templeton, welcome your questions and comments, and look forward to continuing to serve your investment needs in the years ahead.
Sincerely,

Peter A. Langerman
Chairman, President and Chief Executive Officer
Franklin Mutual Advisers, LLC
This letter reflects our analysis and opinions as of June 30, 2018, unless otherwise indicated. The information is not a complete analysis of every aspect of any market, country, industry, security or fund. Statements of fact are from sources considered reliable.
Contents
Semiannual Report
| Franklin Mutual Global Discovery Fund | 3 | |||
| Performance Summary | 9 | |||
| Your Fund’s Expenses | 11 | |||
| Financial Highlights and Statement of Investments | 12 | |||
| Financial Statements | 24 | |||
| Notes to Financial Statements | 29 | |||
| Shareholder Information | 41 | |||
Visit franklintempleton.com for fund updates, to access your account, or to find helpful financial planning tools.
| 2 | Not part of the semiannual report | franklintempleton.com |
Semiannual Report
Franklin Mutual Global Discovery Fund
This semiannual report for Franklin Mutual Global Discovery Fund covers the period ended June 30, 2018.
Your Fund’s Goal and Main Investments
The Fund seeks capital appreciation. Under normal market conditions, the Fund invests primarily in equity securities of US and foreign companies that the investment manager believes are available at market prices less than their intrinsic value. The equity securities in which the Fund invests are primarily common stock, with a current focus on mid- and large cap companies. To a lesser extent, the Fund also invests in merger arbitrage securities and the debt and equity of distressed companies. The Fund may invest a substantial portion, potentially up to 100% of its assets, in foreign securities, which may include sovereign debt and participations in foreign government debt. The Geographic Composition bar chart on this page lists the leading countries where the Fund invests.
Performance Overview
The Fund’s Class Z shares had a -1.48% cumulative total return for the six months ended June 30, 2018. For comparison, the Fund’s benchmark, the MSCI World Index (USD), which tracks stock performance in global developed markets, posted a +0.76% total return.1 You can find more of the Fund’s performance data in the Performance Summary beginning on page 9.
Performance data represent past performance, which does not guarantee future results. Investment return and principal value will fluctuate, and you may have a gain or loss when you sell your shares. Current performance may differ from figures shown. For most recent month-end performance, go to franklintempleton.com or call (800) 342-5236.
Economic and Market Overview
The global economy expanded during the six-month period under review amid generally upbeat economic data across regions. In this environment, global developed and emerging market stocks reached a new all-time high in January 2018, as
Geographic Composition*
Based on Total Net Assets as of 6/30/18
*Figures are stated as a percentage of total and may not equal 100% or may be negative due to rounding, use of any derivatives, unsettled trades or other factors.
measured by the MSCI All Country World Index (ACWI). During the period, global markets were aided by price gains in oil and other commodities, encouraging corporate earnings
1. Source: Morningstar.
The index is unmanaged and includes reinvestment of any income or distributions. It does not reflect any fees, expenses or sales charges. One cannot invest directly in an index, and an index is not representative of the Fund’s portfolio.
The dollar value, number of shares or principal amount, and names of all portfolio holdings are listed in the Fund’s Statement of Investments (SOI). The SOI begins on page 17.
| franklintempleton.com | Semiannual Report | 3 |
FRANKLIN MUTUAL GLOBAL DISCOVERY FUND
reports and investor optimism about global economic growth. However, global stocks had a -0.13% total return for the six-month period, as measured by the MSCI ACWI, largely due to an overall decline in emerging market stocks.1
Global markets reflected investor concerns about tensions in the Korean peninsula and political uncertainties in the US and the European Union, as well as worries that strong economic growth and rising inflation in some parts of the world, particularly in the US, would lead central banks to increase interest rates sooner than expected. Markets were further pressured by the Trump administration’s protectionist trade policies, uncertainty surrounding the US-China trade relationship, and a broad sell-off in information technology stocks in March due to a potential for tighter regulation in the sector arising from concerns about consumer data privacy. Near period-end, an overall easing of tensions in the Korean peninsula relieved investors, but ongoing US trade disputes with its allies and China hindered global markets.
The US economy continued to grow during the six months under review. After moderating for three consecutive quarters, the economy grew faster in 2018’s second quarter, driven by consumer spending, exports, business investment and government spending. The unemployment rate declined from 4.1% in December 2017, as reported at the beginning of the six-month period, to 4.0% at period-end.2 Annual inflation, as measured by the Consumer Price Index, increased from 2.1% in December 2017, as reported at the beginning of the period, to 2.9% at period-end.2 The US Federal Reserve raised its target range for the federal funds rate in March and June 2018 and continued reducing its balance sheet as part of its ongoing plan to normalize monetary policy.
In Europe, the UK’s quarterly economic growth moderated in 2018’s first quarter amid a decline in construction output. The Bank of England kept its key policy rate unchanged during the period. The eurozone’s quarterly growth moderated in 2018’s first quarter due to a decline in external demand. The bloc’s annual inflation rate ended the period higher than in December 2017. The European Central Bank (ECB) kept its benchmark interest rate unchanged during the period. However, at its June meeting, the ECB announced it would further reduce its monthly bond purchases beginning in October 2018 and indicated it would conclude the program at the end of 2018 while continuing to keep interest rates unchanged through at least the summer of 2019.
In Asia, Japan’s quarterly gross domestic product (GDP) growth in 2018’s first quarter was negative, the country’s first contraction since 2015’s fourth quarter, mainly due to a decline in private residential investment and household consumption. The Bank of Japan left its benchmark interest rate unchanged during the period and continued its monetary stimulus measures.
In emerging markets, Brazil’s quarterly GDP accelerated in 2018’s first quarter compared to the previous quarter. The country’s central bank cut its benchmark interest rate twice during the period to spur economic growth. Russia’s annual GDP grew in 2018’s first quarter compared to the prior-year period, amid the Bank of Russia’s continued policy support. China’s annual GDP moderated in 2018’s first quarter compared to the prior-year period. The People’s Bank of China left its benchmark interest rate unchanged during the period. Overall, emerging market stocks, as measured by the MSCI Emerging Markets Index, declined during the period.
Investment Strategy
At Franklin Mutual Series, we are committed to our distinctive value approach to investing, which we believe can generate above-average risk-adjusted returns over time for our shareholders. Our major investment strategy is investing in undervalued stocks. When selecting undervalued equities, we are attracted to what we believe are fundamentally strong companies with healthy balance sheets, high-quality assets, substantial free cash flow and shareholder-oriented management teams and whose stocks are trading at discounts to our assessment of the companies’ intrinsic or business value. We also look for asset-rich companies whose shares may be trading at depressed levels due to concerns over short-term earnings disappointments, litigation, management strategy or other perceived negatives. This strict value approach is not only intended to improve the likelihood of upside potential, but also reduces the risk of substantial declines, in our opinion. While the vast majority of our undervalued equity investments are made in publicly traded companies globally, we may invest occasionally in privately held companies as well.
We complement this more traditional investment strategy with two others. One is distressed investing, a highly specialized field that has proven quite profitable during certain periods over the years. Distressed investing is complex and can take many forms. The most common distressed investment the Fund undertakes is the purchase of financially troubled or bankrupt
2. Source: Bureau of Labor Statistics.
| 4 | Semiannual Report | franklintempleton.com |
FRANKLIN MUTUAL GLOBAL DISCOVERY FUND
companies’ debt at a substantial discount to face value. After the financially distressed company is reorganized, often in bankruptcy court, the old debt is typically replaced with new securities issued by the financially stronger company.
The other piece of our investment strategy is participating in arbitrage situations, another highly specialized field. When companies announce proposed mergers or takeovers, commonly referred to as “deals,” the target company may trade at a discount to the bid it ultimately accepts. One form of arbitrage involves purchasing the target company’s stock when it is trading below the value we believe it would receive in a deal. In keeping with our commitment to a relatively conservative investment approach, we typically focus our arbitrage efforts on announced deals, and avoid rumored deals or other situations we consider relatively risky. In addition, it is our practice to hedge the Fund’s currency exposure when we deem it advantageous for our shareholders.
What is meant by” hedge”?
To hedge an investment is to take a position intended to offset potential losses/gains that may be incurred by a companion financial instrument.
|
Manager’s Discussion
In the first half of 2018, positive corporate fundamentals were overshadowed by political and economic concerns. Corporate profits in the US and other developed markets continued their impressive year-over-year pace of growth. In the US and other developed markets, economic activity moderated during the first quarter, but appeared to have recovered during the second quarter. Financial markets were also aided by improved industrial commodity prices, most notably crude oil. Nonetheless, investor sentiment became less upbeat and volatility returned to financial markets, after an historically calm 2017.
As investors entered 2018, overall US equity market valuations (e.g., price-to-earnings, price-to-book or price-to-sales) were elevated relative to most historical benchmarks. The uneven equity market performance during the period and the strong pace of corporate earnings growth helped to reduce valuations somewhat. At the same time, the rise in volatility provided us with select opportunities to initiate or add to positions in companies that we believed were trading at undeservedly discounted prices.
A further escalation of trade-related rhetoric and tariffs, in our view, could have important consequences for the US and abroad. We have already begun to see disruptions to global
| Top 10 Sectors/Industries | ||||
| Based on Equity Securities as of 6/30/18 | ||||
| % of Total Net Assets | ||||
Banks | 11.9% | |||
Pharmaceuticals | 9.2% | |||
Oil, Gas & Consumable Fuels | 9.1% | |||
Insurance | 8.4% | |||
Media | 5.5% | |||
Software | 4.7% | |||
Health Care Equipment & Supplies | 4.5% | |||
Tobacco | 3.1% | |||
Communications Equipment | 2.8% | |||
Automobiles | 2.7% | |||
supply chains and added pressure on China’s financial and credit markets. Additional tariffs imposed by the US and its trading partners could rattle business confidence, curb corporate earnings growth, undermine favorable fundamentals in specific industries, provoke further financial market volatility and raise uncertainty regarding the solid pace of global growth.
Europe’s equity market overall was still trading at an attractively lower price-to-earnings multiple and higher dividend yield than the US equity market at period-end. However, in addition to trade tensions, we are paying close attention to Brexit negotiations, Italy’s new populist government, a potentially fraying relationship between Germany’s two conservative parties and the future of the international nuclear deal with Iran. As of period-end, we still believe Europe’s economic recovery is fairly resilient, but any of the aforementioned challenges has the potential to fuel volatility and even slow economic growth. In such an environment, we believe domestically oriented companies may fare relatively better.
In Asia, we have said for some time that China needs to address the high level of corporate leverage, and the People’s Bank of China has recently mandated that much of the debt residing in the shadow banking market be brought back onto bank balance sheets. The resulting burden may impair bank earnings in the short term, which, in our view, is underappreciated by many investors and could create some investment opportunities. Meanwhile, Japan’s government has proposed further amendments to its Corporate Governance Code. We believe the proposals have the potential to drive further improvements in capital allocation and operating discipline, which have long been a concern of investors. We have become more interested in finding opportunities to take advantage of this emerging trend.
| franklintempleton.com | Semiannual Report | 5 |
FRANKLIN MUTUAL GLOBAL DISCOVERY FUND
Mergers and acquisitions (M&A) have remained active. In the first half of 2018, the market received some clarity regarding the regulatory environment when a federal judge ruled in favor of AT&T and Time Warner3, and against the US Department of Justice (DOJ) in its antitrust lawsuit. The judge decided the DOJ had failed to show the merger would be anti-competitive, and the deal closed promptly after the opinion was released. In response, the shares of companies involved in several other pending deals traded higher, indicating a higher expected probability of closing. The market also saw the development of a bidding war between Walt Disney and Comcast4 for control of Twenty-First Century Fox4 and Sky. As the year began, Disney had a deal to buy Fox and Fox had an offer pending to acquire the 61% of Sky it did not own. Comcast subsequently launched bids for both companies, and when Fox raised its bid for Sky, Comcast promptly raised its bid to a higher level. Comcast has indicated it will not bid further for Fox and, while Fox could raise its bid for Sky, it appears most likely that Comcast will purchase Sky. This bidding war showed the ongoing uncertainty in media, in which major media firms believe they need even more scale to compete with internet rivals that are experiencing significant growth. The Top 10 Sectors/Industries table on page 5 lists media and also other leading industries in which the Fund currently invests. We expect ongoing activity in M&A markets and, with the increased regulatory clarity provided by the Time Warner decision, further opportunities in merger arbitrage.
Finding mispriced risk in credit markets remains difficult due in part to the decline in debt covenants, which include terms that restrict financial activities by the borrower or set parameters for specific financial metrics. The search is also complicated by private equity firms involved in leveraged buyout transactions using increasingly liberal interpretations of credit agreements and bond indentures to potentially shift valuable assets beyond the reach of creditors. We have directed much of our focus on out-of-favor industries in pursuit of securities with the potential to benefit most from liquidity-enhancing events, such as asset sales, the ability to issue secured debt within existing agreements, and free-cash flow that could buy time for a company to weather its financial storm.
Fund Performance
Turning to Fund performance, top contributors included Netherlands-based Koninklijke Philips, Finland-based global
| Top 10 Equity Holdings | ||||
| 6/30/18 | ||||
Company Sector/Industry, Country | % of Total Net Assets | |||
Medtronic PLC Health Care Equipment & Supplies, U.S. | 2.8% | |||
Eli Lilly & Co. Pharmaceuticals, U.S. | 2.4% | |||
Novartis AG Pharmaceuticals, Switzerland | 2.4% | |||
Merck & Co. Inc. Pharmaceuticals, U.S. | 2.2% | |||
Royal Dutch Shell PLC Oil, Gas & Consumable Fuels, U.K. | 2.2% | |||
The Walt Disney Co. Media, U.S. | 2.1% | |||
GlaxoSmithKline PLC Pharmaceuticals, U.K. | 2.1% | |||
British American Tobacco PLC Tobacco, U.K. | 1.9% | |||
Accor SA Hotels, Restaurants & Leisure, France | 1.9% | |||
NN Group NV Insurance, Netherlands | 1.9% | |||
communications and information technology company Nokia and UK-based pharmaceutical company GlaxoSmithKline, which is listed among the Fund’s largest positions in the Top 10 Equity Holdings table on this page.
Koninklijke Philips is near the end of its restructuring efforts. In line with our initial investment thesis, the company has almost fully pivoted its business model from being an industrial conglomerate to becoming a focused health care technology company. In April, Philips reported better-than-expected results, particularly strong order growth overall and sales growth within its diagnostics and treatment business. Recent positive results have increased our confidence in management’s ability to deliver on its long-term strategy and targets.
Nokia announced solid fourth-quarter and full-year 2017 results in February 2018, particularly better-than-expected profits for 2017 and significant improvement in cash flow. Management also issued a new earnings target for 2020 that was higher than many investors had anticipated. Subsequent quarterly results issued in April 2018 were weaker than expected, but management emphasized the company’s strong levels of new and existing orders and indicated that sales for full-year 2018
3. Not held at period-end.
4. Not a Fund holding.
See www.franklintempletondatasources.com for additional data provider information.
| 6 | Semiannual Report | franklintempleton.com |
FRANKLIN MUTUAL GLOBAL DISCOVERY FUND
could exceed its previous guidance. We believe Nokia is serious about cutting costs and improving cash flow following its acquisition of Alcatel in 2016 to increase its dividend in 2018 and stay on course to reach its 2020 earnings target.
Investors reacted positively to GlaxoSmithKline’s March announcements that it had pulled out of the auction for Pfizer’s4 consumer health business and agreed to buy Novartis out of its consumer health care joint venture for $13 billion. In our view, not purchasing the Pfizer consumer business at a high price demonstrated capital discipline and the ability to exercise restraint by not overpaying for strategically desirable assets, thus enhancing management credibility. In addition, not consummating the Pfizer consumer-asset deal eliminated concerns around a potential cut to the dividend to finance the deal, which had been a serious concern for investors. Also, investors have become more willing to give Glaxo some credit for research and development returns improving under the new management team.
During the period under review, Fund investments that detracted from performance included British American Tobacco, US-based industrials company General Electric and US-based digital security and storage provider Symantec.
British American Tobacco’s stock price faced downward pressure due to the potential for additional regulation in the US and concerns regarding next generation products. In March 2018, the US Food and Drug Administration issued an Advance Notice of Proposed Rulemaking, which started the process of examining the possibility of regulating nicotine levels in combustible cigarettes. The process may not result in regulation, but if it does, many experts believe the review could take seven to 10 years before a rule is adopted in the marketplace. Meanwhile, JUUL, produced by JUUL Labs4 has emerged as a popular e-cigarette in the US. JUUL’s growth rate is high and its product is popular with young consumers. It is unclear to what degree JUUL is cannibalizing the combustible market, but it has hurt investor sentiment toward the industry.
In January 2018, General Electric (GE) announced a greater-than-expected $6.2 billion after-tax charge related to its insurance subsidiary at GE Capital, a greater-than-expected amount. Management also moved ahead with what amounts to a breakup of GE. In May 2018, the company announced the merger of its transportation operations into Wabtec,4 and in June 2018 it announced a plan to spin off its health care division and divest its stake in oil-services firm Baker Hughes. Once completed, we believe the moves will streamline GE and enable the company to reduce debt and build up a cash buffer,
as well as help management better focus on its key aviation, power and renewable energy divisions.
Shares of Symantec tumbled in May 2018 when the company disclosed an internal investigation resulting from concerns raised by a former employee that could result in a restatement of prior financials, as well as lowered earnings guidance. The stock partially recovered when Symantec’s management provided more information regarding the investigation and reassured investors that financial statements would likely not need to be restated.
During the period, the Fund held currency forwards and futures seeking to hedge most of the currency risk of the portfolio’s non-US dollar investments. The hedges had a positive overall impact on the Fund’s performance because of the appreciation of the US dollar versus the hedged currencies.
What is a currency forward?
A currency forward is a direct agreement between the Fund and a counterparty to buy or sell a foreign currency in exchange for another currency at a specific exchange rate on a future date.
|
What is a future?
A future is an agreement between the Fund and a counterparty made through a US or foreign futures exchange to buy or sell an underlying instrument or asset at a specific price on a future date.
|
As fellow shareholders, we found recent relative and absolute performance disappointing, but it is not uncommon for our strategy to lag the equity markets at times. We remain committed to our disciplined, value investment approach as we seek to generate attractive, long-term, risk-adjusted returns for shareholders.
| franklintempleton.com | Semiannual Report | 7 |
FRANKLIN MUTUAL GLOBAL DISCOVERY FUND
Thank you for your participation in Franklin Mutual Global Discovery Fund. We look forward to continuing to serve your investment needs.
 |  | |
| Peter A. Langerman | ||
| Co-Portfolio Manager | ||
 |  | |
| Timothy Rankin, CFA | ||
| Co-Portfolio Manager | ||
 |  | |
| Christian Correa, CFA | ||
| Co-Portfolio Manager | ||
The foregoing information reflects our analysis, opinions and portfolio holdings as of June 30, 2018, the end of the reporting period. The way we implement our main investment strategies and the resulting portfolio holdings may change depending on factors such as market and economic conditions. These opinions may not be relied upon as investment advice or an offer for a particular security. The information is not a complete analysis of every aspect of any market, country, industry, security or the Fund. Statements of fact are from sources considered reliable, but the investment manager makes no representation or warranty as to their completeness or accuracy. Although historical performance is no guarantee of future results, these insights may help you understand our investment management philosophy.
CFA® is a trademark owned by CFA Institute.
Peter Langerman has been portfolio manager for Franklin Mutual Global Discovery Fund since 2009. He joined Franklin Templeton Investments in 1996, serving in various capacities, including President and Chief Executive Officer of Franklin Mutual Advisers and member of the management team of the Funds. From 2002 to 2005, he served as director of New Jersey’s Division of Investment, overseeing employee pension funds. Between 1986 and 1996, Mr. Langerman was employed at Heine Securities Corporation, the Fund’s former manager.
|
Timothy Rankin rejoined the Franklin Mutual Series investment group in 2010 and currently serves as co-portfolio manager for Franklin Mutual Global Discovery Fund, and as a research analyst, responsible for the analysis of the global energy and chemical industries. Mr. Rankin had previously worked at Franklin Mutual Series from 1997 through 2004. Mr. Rankin has over 20 years of experience in the investment management industry, including over 10 years with Franklin Mutual Series as a research analyst and portfolio manager. Before his most recent employment with Franklin Mutual Series, he was managing director of Blue Harbour Group, LLC, a private investment firm focused on small- and mid-cap North American companies. Prior to his original employment with Franklin Mutual Series, Mr. Rankin was an equity analyst at Glickenhaus & Co.
|
Christian Correa has been portfolio manager for Franklin Mutual Global Discovery Fund since January 2018. He joined Franklin Templeton Investments in 2003 and serves as Director of Research for Franklin Mutual Advisers. Previously, he covered merger arbitrage and special situations at Lehman Brothers Holdings Inc.
|
| 8 | Semiannual Report | franklintempleton.com |
FRANKLIN MUTUAL GLOBAL DISCOVERY FUND
Performance Summary as of June 30, 2018
The performance table does not reflect any taxes that a shareholder would pay on Fund dividends, capital gain distributions, if any, or any realized gains on the sale of Fund shares. Total return reflects reinvestment of the Fund’s dividends and capital gain distributions, if any, and any unrealized gains or losses. Your dividend income will vary depending on dividends or interest paid by securities in the Fund’s portfolio, adjusted for operating expenses of each class. Capital gain distributions are net profits realized from the sale of portfolio securities.
Performance as of 6/30/18
Cumulative total return excludes sales charges. Average annual total return includes maximum sales charges. Sales charges will vary depending on the size of the investment and the class of share purchased. The maximum is 5.75% and the minimum is 0%. Class A: 5.75% maximum initial sales charge. For other share classes, visit franklintempleton.com.
| Share Class | Cumulative Total Return1 | Average Annual Total Return2 | ||||||
| Z | ||||||||
6-Month | -1.48% | -1.48% | ||||||
1-Year | +1.44% | +1.44% | ||||||
5-Year | +41.42% | +7.18% | ||||||
10-Year | +90.15% | +6.64% | ||||||
| A | ||||||||
6-Month | -1.60% | -7.26% | ||||||
1-Year | +1.16% | -4.67% | ||||||
5-Year | +39.51% | +5.63% | ||||||
10-Year | +84.83% | +5.71% | ||||||
Performance data represent past performance, which does not guarantee future results. Investment return and principal value will fluctuate, and you may have a gain or loss when you sell your shares. Current performance may differ from figures shown. For most recent month-end performance, go to franklintempleton.com or call (800) 342-5236.
See page 10 for Performance Summary footnotes.
| franklintempleton.com | Semiannual Report | 9 |
FRANKLIN MUTUAL GLOBAL DISCOVERY FUND
PERFORMANCE SUMMARY
Total Annual Operating Expenses3
| Share Class | ||||
Z | 0.96% | |||
A | 1.21% | |||
Each class of shares is available to certain eligible investors and has different annual fees and expenses, as described in the prospectus.
All investments involve risks, including possible loss of principal. Value securities may not increase in price as anticipated or may decline further in value. Special risks are associated with foreign investing, including currency fluctuations, economic instability and political developments. Because the Fund may invest its assets in companies in a specific region, including Europe, it is subject to greater risks of adverse developments in that region and/or the surrounding regions than a fund that is more broadly diversified geographically. Current political and financial uncertainty surrounding the European Union may increase market volatility and the economic risk of investing in companies in Europe. Smaller company stocks have exhibited greater price volatility than larger company stocks, particularly over the short term. The Fund’s investments in companies engaged in mergers, reorganizations or liquidations also involve special risks as pending deals may not be completed on time or on favorable terms. The Fund may invest in lower rated bonds, which entail higher credit risk. The Fund is actively managed but there is no guarantee that the manager’s investment decisions will produce the desired results. The Fund’s prospectus also includes a description of the main investment risks.
1. Cumulative total return represents the change in value of an investment over the periods indicated.
2. Average annual total return represents the average annual change in value of an investment over the periods indicated. Return for less than one year, if any, has not been annualized.
3. Figures are as stated in the Fund’s current prospectus and may differ from the expense ratios disclosed in the Your Fund’s Expenses and Financial Highlights sections in this report. In periods of market volatility, assets may decline significantly, causing total annual Fund operating expenses to become higher than the figures shown.
| 10 | Semiannual Report | franklintempleton.com |
FRANKLIN MUTUAL GLOBAL DISCOVERY FUND
Your Fund’s Expenses
As a Fund shareholder, you can incur two types of costs: (1) transaction costs, including sales charges (loads) on Fund purchases and redemptions; and (2) ongoing Fund costs, including management fees, distribution and service (12b-1) fees, and other Fund expenses. All mutual funds have ongoing costs, sometimes referred to as operating expenses. The table below shows ongoing costs of investing in the Fund and can help you understand these costs and compare them with those of other mutual funds. The table assumes a $1,000 investment held for the six months indicated.
Actual Fund Expenses
The table below provides information about actual account values and actual expenses in the columns under the heading “Actual.” In these columns the Fund’s actual return, which includes the effect of Fund expenses, is used to calculate the “Ending Account Value” for each class of shares. You can estimate the expenses you paid during the period by following these steps (of course, your account value and expenses will differ from those in this illustration): Divide your account value by $1,000 (if your account had an $8,600 value, then $8,600 ÷ $1,000 = 8.6). Then multiply the result by the number in the row for your class of shares under the headings “Actual” and “Expenses Paid During Period” (if Actual Expenses Paid During Period were $7.50, then 8.6 x $7.50 = $64.50). In this illustration, the actual expenses paid this period are $64.50.
Hypothetical Example for Comparison with Other Funds
Under the heading “Hypothetical” in the table, information is provided about hypothetical account values and hypothetical expenses based on the Fund’s actual expense ratio and an assumed rate of return of 5% per year before expenses, which is not the Fund’s actual return. This information may not be used to estimate the actual ending account balance or expenses you paid for the period, but it can help you compare ongoing costs of investing in the Fund with those of other funds. To do so, compare this 5% hypothetical example for the class of shares you hold with the 5% hypothetical examples that appear in the shareholder reports of other funds.
Please note that expenses shown in the table are meant to highlight ongoing costs and do not reflect any transactional costs. Therefore, information under the heading “Hypothetical” is useful in comparing ongoing costs only, and will not help you compare total costs of owning different funds. In addition, if transactional costs were included, your total costs would have been higher.
| Actual (actual return after expenses) | Hypothetical (5% annual return before expenses) | |||||||||||||||||
Share Class | Beginning Account Value 1/1/18 | Ending Account Value 6/30/18 | Expenses Paid During Period 1/1/18–6/30/181,2 | Ending Account Value 6/30/18 | Expenses Paid During Period 1/1/18–6/30/181,2 | Net Annualized Expense Ratio2 | ||||||||||||
| Z | $1,000 | $985.20 | $4.77 | $1,019.98 | $4.86 | 0.97% | ||||||||||||
| A | $1,000 | $984.00 | $6.00 | $1,018.74 | $6.11 | 1.22% | ||||||||||||
| C | $1,000 | $980.30 | $9.67 | $1,015.03 | $9.84 | 1.97% | ||||||||||||
| R | $1,000 | $982.80 | $7.23 | $1,017.50 | $7.35 | 1.47% | ||||||||||||
| R6 | $1,000 | $985.80 | $4.23 | $1,020.53 | $4.31 | 0.86% | ||||||||||||
1. Expenses are equal to the annualized expense ratio for the six-month period as indicated above—in the far right column—multiplied by the simple average account value over the period indicated, and then multiplied by 181/365 to reflect the one-half year period.
2. Reflects expenses after fee waivers and expense reimbursements. Does not include acquired fund fees and expenses.
| franklintempleton.com | Semiannual Report | 11 |
FRANKLIN MUTUAL GLOBAL DISCOVERY FUND
Financial Highlights
Six Months Ended June 30, 2018 (unaudited) | Year Ended December 31, | |||||||||||||||||||||||
| 2017 | 2016 | 2015 | 2014 | 2013 | ||||||||||||||||||||
| Class Z | ||||||||||||||||||||||||
Per share operating performance (for a share outstanding throughout the period) | ||||||||||||||||||||||||
Net asset value, beginning of period | $32.42 | $31.12 | $29.35 | $33.32 | $33.73 | $28.65 | ||||||||||||||||||
Income from investment operationsa: | ||||||||||||||||||||||||
Net investment incomeb | 0.37 | 0.76 | c | 0.67 | d | 0.53 | 0.82 | e | 0.55 | |||||||||||||||
Net realized and unrealized gains (losses) | (0.85 | ) | 2.29 | 3.08 | (1.71 | ) | 0.97 | 6.74 | ||||||||||||||||
|
| |||||||||||||||||||||||
Total from investment operations | (0.48 | ) | 3.05 | 3.75 | (1.18 | ) | 1.79 | 7.29 | ||||||||||||||||
|
| |||||||||||||||||||||||
Less distributions from: | ||||||||||||||||||||||||
Net investment income | — | (0.79 | ) | (0.69 | ) | (0.55 | ) | (0.82 | ) | (0.57 | ) | |||||||||||||
Net realized gains | — | (0.96 | ) | (1.29 | ) | (2.24 | ) | (1.38 | ) | (1.64 | ) | |||||||||||||
|
| |||||||||||||||||||||||
Total distributions | — | (1.75 | ) | (1.98 | ) | (2.79 | ) | (2.20 | ) | (2.21 | ) | |||||||||||||
|
| |||||||||||||||||||||||
Net asset value, end of period | $31.94 | $32.42 | $31.12 | $29.35 | $33.32 | $33.73 | ||||||||||||||||||
|
| |||||||||||||||||||||||
Total returnf | (1.48 | )% | 9.84% | 12.86% | (3.36 | )% | 5.33% | 25.64% | ||||||||||||||||
| Ratios to average net assetsg | ||||||||||||||||||||||||
Expensesh,i | 0.97% | 0.96% | 0.99% | j | 0.99% | j | 0.99% | 0.98% | ||||||||||||||||
Expenses incurred in connection with securities sold short | 0.01% | —% | 0.01% | 0.02% | 0.03% | —% | k | |||||||||||||||||
Net investment income | 2.31% | 2.30% | c | 2.27% | d | 1.56% | 2.38% | e | 1.68% | |||||||||||||||
| Supplemental data | ||||||||||||||||||||||||
Net assets, end of period (000’s) | $6,432,207 | $7,175,981 | $8,354,865 | $9,132,752 | $10,375,518 | $9,529,245 | ||||||||||||||||||
Portfolio turnover rate | 5.88% | 17.50% | 17.01% | 21.79% | 23.66% | 23.57% | ||||||||||||||||||
aThe amount shown for a share outstanding throughout the period may not correlate with the Statement of Operations for the period due to the timing of sales and repurchases of the Fund’s shares in relation to income earned and/or fluctuating fair value of the investments of the Fund.
bBased on average daily shares outstanding.
cNet investment income per share includes approximately $0.20 per share related to income received in the form of special dividends in connection with certain Fund holdings. Excluding this amount, the ratio of net investment income to average net assets would have been 1.68%.
dNet investment income per share includes approximately $0.10 per share related to income received in the form of special dividends in connection with certain Fund holdings. Excluding this amount, the ratio of net investment income to average net assets would have been 1.94%.
eNet investment income per share includes approximately $0.34 per share related to income received in the form of special dividends in connection with certain Fund holdings. Excluding this amount, the ratio of net investment income to average net assets would have been 1.40%.
fTotal return is not annualized for periods less than one year.
gRatios are annualized for periods less than one year.
hIncludes dividend and/or interest expense on securities sold short and security borrowing fees, if any. See below for the ratios of such expenses to average net assets for the periods presented. See Note 1(d).
iBenefit of expense reduction rounds to less than 0.01%.
jBenefit of waiver and payments by affiliates rounds to less than 0.01%.
kRounds to less than 0.01%.
| 12 | Semiannual Report | The accompanying notes are an integral part of these financial statements. | franklintempleton.com |
FRANKLIN MUTUAL GLOBAL DISCOVERY FUND
FINANCIAL HIGHLIGHTS
Six Months Ended (unaudited) | Year Ended December 31, | |||||||||||||||||||||||
| 2017 | 2016 | 2015 | 2014 | 2013 | ||||||||||||||||||||
| Class A | ||||||||||||||||||||||||
Per share operating performance (for a share outstanding throughout the period) | ||||||||||||||||||||||||
Net asset value, beginning of period | $31.80 | $30.57 | $28.86 | $32.81 | $33.24 | $28.27 | ||||||||||||||||||
|
| |||||||||||||||||||||||
| Income from investment operationsa: | ||||||||||||||||||||||||
Net investment incomeb | 0.33 | 0.66 | c | 0.59 | d | 0.42 | 0.71 | e | 0.44 | |||||||||||||||
Net realized and unrealized gains (losses) | (0.84 | ) | 2.25 | 3.01 | (1.67 | ) | 0.96 | 6.65 | ||||||||||||||||
|
| |||||||||||||||||||||||
Total from investment operations | (0.51 | ) | 2.91 | 3.60 | (1.25 | ) | 1.67 | 7.09 | ||||||||||||||||
|
| |||||||||||||||||||||||
Less distributions from: | ||||||||||||||||||||||||
Net investment income | — | (0.72 | ) | (0.60 | ) | (0.46 | ) | (0.72 | ) | (0.48 | ) | |||||||||||||
Net realized gains | — | (0.96 | ) | (1.29 | ) | (2.24 | ) | (1.38 | ) | (1.64 | ) | |||||||||||||
|
| |||||||||||||||||||||||
Total distributions | — | (1.68 | ) | (1.89 | ) | (2.70 | ) | (2.10 | ) | (2.12 | ) | |||||||||||||
|
| |||||||||||||||||||||||
Net asset value, end of period | $31.29 | $31.80 | $30.57 | $28.86 | $32.81 | $33.24 | ||||||||||||||||||
|
| |||||||||||||||||||||||
Total returnf | (1.60)% | 9.57% | 12.56% | (3.63)% | 5.01% | 25.26% | ||||||||||||||||||
| Ratios to average net assetsg | ||||||||||||||||||||||||
Expensesh,i | 1.22% | 1.21% | 1.24% | j | 1.27% | j | 1.29% | 1.28% | ||||||||||||||||
Expenses incurred in connection with securities sold short | 0.01% | —% | 0.01% | 0.02% | 0.03% | —% | k | |||||||||||||||||
Net investment income | 2.06% | 2.05% | c | 2.02% | d | 1.28% | 2.08% | e | 1.38% | |||||||||||||||
| Supplemental data | ||||||||||||||||||||||||
Net assets, end of period (000’s) | $8,635,893 | $9,589,033 | $10,498,722 | $11,274,721 | $11,573,196 | $10,785,375 | ||||||||||||||||||
Portfolio turnover rate | 5.88% | 17.50% | 17.01% | 21.79% | 23.66% | 23.57% | ||||||||||||||||||
aThe amount shown for a share outstanding throughout the period may not correlate with the Statement of Operations for the period due to the timing of sales and repurchases of the Fund’s shares in relation to income earned and/or fluctuating fair value of the investments of the Fund.
bBased on average daily shares outstanding.
cNet investment income per share includes approximately $0.20 per share related to income received in the form of special dividends in connection with certain Fund holdings. Excluding this amount, the ratio of net investment income to average net assets would have been 1.43%.
dNet investment income per share includes approximately $0.10 per share related to income received in the form of special dividends in connection with certain Fund holdings. Excluding this amount, the ratio of net investment income to average net assets would have been 1.69%.
eNet investment income per share includes approximately $0.34 per share related to income received in the form of special dividends in connection with certain Fund holdings. Excluding this amount, the ratio of net investment income to average net assets would have been 1.10%.
fTotal return does not reflect sales commissions or contingent deferred sales charges, if applicable, and is not annualized for periods less than one year.
gRatios are annualized for periods less than one year.
hIncludes dividend and/or interest expense on securities sold short and security borrowing fees, if any. See below for the ratios of such expenses to average net assets for the periods presented. See Note 1(d).
iBenefit of expense reduction rounds to less than 0.01%.
jBenefit of waiver and payments by affiliates rounds to less than 0.01%.
kRounds to less than 0.01%.
| franklintempleton.com | The accompanying notes are an integral part of these financial statements. | Semiannual Report | 13 |
FRANKLIN MUTUAL GLOBAL DISCOVERY FUND
FINANCIAL HIGHLIGHTS
Six Months Ended (unaudited) | Year Ended December 31, | |||||||||||||||||||||||
| 2017 | 2016 | 2015 | 2014 | 2013 | ||||||||||||||||||||
| Class C | ||||||||||||||||||||||||
Per share operating performance (for a share outstanding throughout the period) | ||||||||||||||||||||||||
Net asset value, beginning of period | $31.44 | $30.22 | $28.55 | $32.49 | $32.94 | $28.05 | ||||||||||||||||||
|
| |||||||||||||||||||||||
| Income from investment operationsa: | ||||||||||||||||||||||||
Net investment incomeb | 0.20 | 0.41 | c | 0.36d | 0.18 | 0.47 | e | 0.22 | ||||||||||||||||
Net realized and unrealized gains (losses) | (0.82 | ) | 2.23 | 2.97 | (1.64 | ) | 0.95 | 6.58 | ||||||||||||||||
|
| |||||||||||||||||||||||
Total from investment operations | (0.62 | ) | 2.64 | 3.33 | (1.46 | ) | 1.42 | 6.80 | ||||||||||||||||
|
| |||||||||||||||||||||||
| Less distributions from: | ||||||||||||||||||||||||
Net investment income | — | (0.46 | ) | (0.37 | ) | (0.24 | ) | (0.49 | ) | (0.27 | ) | |||||||||||||
Net realized gains | — | (0.96 | ) | (1.29 | ) | (2.24 | ) | (1.38 | ) | (1.64 | ) | |||||||||||||
|
| |||||||||||||||||||||||
Total distributions | — | (1.42 | ) | (1.66 | ) | (2.48 | ) | (1.87 | ) | (1.91 | ) | |||||||||||||
|
| |||||||||||||||||||||||
Net asset value, end of period | $30.82 | $31.44 | $30.22 | $28.55 | $32.49 | $32.94 | ||||||||||||||||||
|
| |||||||||||||||||||||||
Total returnf | (1.97)% | 8.78% | 11.70% | (4.33)% | 4.28% | 24.39% | ||||||||||||||||||
| Ratios to average net assetsg | ||||||||||||||||||||||||
Expensesh,i | 1.97% | 1.96% | 1.99% | j | 1.99% | j | 1.99% | 1.98% | ||||||||||||||||
Expenses incurred in connection with securities sold short | 0.01% | —% | 0.01% | 0.02% | 0.03% | —% | k | |||||||||||||||||
Net investment income | 1.31% | 1.30% | c | 1.27% | d | 0.56% | 1.38% | e | 0.68% | |||||||||||||||
| Supplemental data | ||||||||||||||||||||||||
Net assets, end of period (000’s) | $2,108,235 | $2,438,507 | $2,758,563 | $2,983,216 | $3,077,691 | $2,894,908 | ||||||||||||||||||
Portfolio turnover rate | 5.88% | 17.50% | 17.01% | 21.79% | 23.66% | 23.57% | ||||||||||||||||||
aThe amount shown for a share outstanding throughout the period may not correlate with the Statement of Operations for the period due to the timing of sales and repurchases of the Fund’s shares in relation to income earned and/or fluctuating fair value of the investments of the Fund.
bBased on average daily shares outstanding.
cNet investment income per share includes approximately $0.20 per share related to income received in the form of special dividends in connection with certain Fund holdings. Excluding this amount, the ratio of net investment income to average net assets would have been 0.68%.
dNet investment income per share includes approximately $0.10 per share related to income received in the form of special dividends in connection with certain Fund holdings. Excluding this amount, the ratio of net investment income to average net assets would have been 0.94%.
eNet investment income per share includes approximately $0.34 per share related to income received in the form of special dividends in connection with certain Fund holdings. Excluding this amount, the ratio of net investment income to average net assets would have been 0.40%.
fTotal return does not reflect sales commissions or contingent deferred sales charges, if applicable, and is not annualized for periods less than one year.
gRatios are annualized for periods less than one year.
hIncludes dividend and/or interest expense on securities sold short and security borrowing fees, if any. See below for the ratios of such expenses to average net assets for the periods presented. See Note 1(d).
iBenefit of expense reduction rounds to less than 0.01%.
jBenefit of waiver and payments by affiliates rounds to less than 0.01%.
kRounds to less than 0.01%.
| 14 | Semiannual Report | The accompanying notes are an integral part of these financial statements. | franklintempleton.com |
FRANKLIN MUTUAL GLOBAL DISCOVERY FUND
FINANCIAL HIGHLIGHTS
Six Months Ended June 30, 2018 (unaudited) | Year Ended December 31, | |||||||||||||||||||||||
| 2017 | 2016 | 2015 | 2014 | 2013 | ||||||||||||||||||||
| Class R | ||||||||||||||||||||||||
Per share operating performance (for a share outstanding throughout the period) | ||||||||||||||||||||||||
Net asset value, beginning of period | $31.37 | $30.17 | $28.51 | $32.43 | $32.88 | $27.98 | ||||||||||||||||||
|
| |||||||||||||||||||||||
| Income from investment operationsa: | ||||||||||||||||||||||||
Net investment incomeb | 0.28 | 0.57 | c | 0.50 | d | 0.35 | 0.65 | e | 0.37 | |||||||||||||||
Net realized and unrealized gains (losses) | (0.82 | ) | 2.22 | 2.98 | (1.64 | ) | 0.93 | 6.58 | ||||||||||||||||
|
| |||||||||||||||||||||||
Total from investment operations | (0.54 | ) | 2.79 | 3.48 | (1.29 | ) | 1.58 | 6.95 | ||||||||||||||||
|
| |||||||||||||||||||||||
| Less distributions from: | ||||||||||||||||||||||||
Net investment income | — | (0.63 | ) | (0.53 | ) | (0.39 | ) | (0.65 | ) | (0.41 | ) | |||||||||||||
Net realized gains | — | (0.96 | ) | (1.29 | ) | (2.24 | ) | (1.38 | ) | (1.64 | ) | |||||||||||||
|
| |||||||||||||||||||||||
Total distributions | — | (1.59 | ) | (1.82 | ) | (2.63 | ) | (2.03 | ) | (2.05 | ) | |||||||||||||
|
| |||||||||||||||||||||||
Net asset value, end of period | $30.83 | $31.37 | $30.17 | $28.51 | $32.43 | $32.88 | ||||||||||||||||||
|
| |||||||||||||||||||||||
Total returnf | (1.72)% | 9.31% | 12.28% | (3.82)% | 4.77% | 25.02% | ||||||||||||||||||
| Ratios to average net assetsg | ||||||||||||||||||||||||
Expensesh,i | 1.47% | 1.46% | 1.49% | j | 1.49% | j | 1.49% | 1.48% | ||||||||||||||||
Expenses incurred in connection with securities sold short | 0.01% | —% | 0.01% | 0.02% | 0.03% | —% | k | |||||||||||||||||
Net investment income | 1.81% | 1.80% | c | 1.77% | d | 1.06% | 1.88% | e | 1.18% | |||||||||||||||
| Supplemental data | ||||||||||||||||||||||||
Net assets, end of period (000’s) | $348,066 | $398,692 | $444,813 | $468,425 | $528,439 | $539,613 | ||||||||||||||||||
Portfolio turnover rate | 5.88% | 17.50% | 17.01% | 21.79% | 23.66% | 23.57% | ||||||||||||||||||
aThe amount shown for a share outstanding throughout the period may not correlate with the Statement of Operations for the period due to the timing of sales and repurchases of the Fund’s shares in relation to income earned and/or fluctuating fair value of the investments of the Fund.
bBased on average daily shares outstanding.
cNet investment income per share includes approximately $0.20 per share related to income received in the form of special dividends in connection with certain Fund holdings. Excluding this amount, the ratio of net investment income to average net assets would have been 1.18%.
dNet investment income per share includes approximately $0.10 per share related to income received in the form of special dividends in connection with certain Fund holdings. Excluding this amount, the ratio of net investment income to average net assets would have been 1.44%.
eNet investment income per share includes approximately $0.34 per share related to income received in the form of special dividends in connection with certain Fund holdings. Excluding this amount, the ratio of net investment income to average net assets would have been 0.90%.
fTotal return is not annualized for periods less than one year.
gRatios are annualized for periods less than one year.
hIncludes dividend and/or interest expense on securities sold short and security borrowing fees, if any. See below for the ratios of such expenses to average net assets for the periods presented. See Note 1(d).
iBenefit of expense reduction rounds to less than 0.01%.
jBenefit of waiver and payments by affiliates rounds to less than 0.01%.
kRounds to less than 0.01%.
| franklintempleton.com | The accompanying notes are an integral part of these financial statements. | Semiannual Report | 15 |
FRANKLIN MUTUAL GLOBAL DISCOVERY FUND
FINANCIAL HIGHLIGHTS
Six Months Ended (unaudited) | Year Ended December 31, | |||||||||||||||||||||||
| 2017 | 2016 | 2015 | 2014 | 2013a | ||||||||||||||||||||
| Class R6 | ||||||||||||||||||||||||
Per share operating performance (for a share outstanding throughout the period) | ||||||||||||||||||||||||
Net asset value, beginning of period | $32.41 | $31.13 | $29.35 | $33.33 | $33.73 | $31.42 | ||||||||||||||||||
|
| |||||||||||||||||||||||
| Income from investment operationsb: | ||||||||||||||||||||||||
Net investment incomec | 0.39 | 0.75 | d | 0.61 | e | 0.55 | 0.85 | f | 0.40 | |||||||||||||||
Net realized and unrealized gains (losses) | (0.85 | ) | 2.34 | 3.19 | (1.69 | ) | 1.00 | 4.17 | ||||||||||||||||
|
| |||||||||||||||||||||||
Total from investment operations | (0.46 | ) | 3.09 | 3.80 | (1.14 | ) | 1.85 | 4.57 | ||||||||||||||||
|
| |||||||||||||||||||||||
| Less distributions from: | ||||||||||||||||||||||||
Net investment income | — | (0.85 | ) | (0.73 | ) | (0.60 | ) | (0.87 | ) | (0.62 | ) | |||||||||||||
Net realized gains | — | (0.96 | ) | (1.29 | ) | (2.24 | ) | (1.38 | ) | (1.64 | ) | |||||||||||||
|
| |||||||||||||||||||||||
Total distributions | — | (1.81 | ) | (2.02 | ) | (2.84 | ) | (2.25 | ) | (2.26 | ) | |||||||||||||
|
| |||||||||||||||||||||||
Net asset value, end of period | $31.95 | $32.41 | $31.13 | $29.35 | $33.33 | $33.73 | ||||||||||||||||||
|
| |||||||||||||||||||||||
Total returng | (1.42)% | 9.98% | 13.02% | (3.23)% | 5.46% | 14.71% | ||||||||||||||||||
| Ratios to average net assetsh | ||||||||||||||||||||||||
Expenses before waiver and payments by affiliatesi | 0.87% | 0.84% | 0.85% | 0.84% | 0.85% | 0.84% | ||||||||||||||||||
Expenses net of waiver and payments by affiliatesi,j | 0.86% | 0.84% | 0.85% | k | 0.84% | k | 0.85% | 0.84% | ||||||||||||||||
Expenses incurred in connection with securities sold short | 0.01% | —% | 0.01% | 0.02% | 0.03% | —% | l | |||||||||||||||||
Net investment income | 2.42% | 2.42% | d | 2.41% | e | 1.71% | 2.52% | f | 1.83% | |||||||||||||||
| Supplemental data | ||||||||||||||||||||||||
Net assets, end of period (000’s) | $1,799,935 | $2,221,338 | $528,617 | $229,765 | $137,922 | $10,535 | ||||||||||||||||||
Portfolio turnover rate | 5.88% | 17.50% | 17.01% | 21.79% | 23.66% | 23.57% | ||||||||||||||||||
aFor the period May 1, 2013 (effective date) to December 31, 2013.
bThe amount shown for a share outstanding throughout the period may not correlate with the Statement of Operations for the period due to the timing of sales and repurchases of the Fund’s shares in relation to income earned and/or fluctuating fair value of the investments of the Fund.
cBased on average daily shares outstanding.
dNet investment income per share includes approximately $0.20 per share related to income received in the form of special dividends in connection with certain Fund holdings. Excluding this amount, the ratio of net investment income to average net assets would have been 1.80%.
eNet investment income per share includes approximately $0.10 per share related to income received in the form of special dividends in connection with certain Fund holdings. Excluding this amount, the ratio of net investment income to average net assets would have been 2.08%.
fNet investment income per share includes approximately $0.34 per share related to income received in the form of special dividends in connection with certain Fund holdings. Excluding this amount, the ratio of net investment income to average net assets would have been 1.54%.
gTotal return is not annualized for periods less than one year.
hRatios are annualized for periods less than one year.
iIncludes dividend and/or interest expense on securities sold short and security borrowing fees, if any. See below for the ratios of such expenses to average net assets for the periods presented. See Note 1(d).
jBenefit of expense reduction rounds to less than 0.01%.
kBenefit of waiver and payments by affiliates rounds to less than 0.01%.
lRounds to less than 0.01%.
| 16 | Semiannual Report | The accompanying notes are an integral part of these financial statements. | franklintempleton.com |
FRANKLIN MUTUAL GLOBAL DISCOVERY FUND
Statement of Investments, June 30, 2018 (unaudited)
| Country | Shares/ Units/ Warrants | Value | ||||||||||||
| Common Stocks and Other Equity Interests 88.5% | ||||||||||||||
| Aerospace & Defense 1.0% | ||||||||||||||
BAE Systems PLC | United Kingdom | 21,584,405 | $ | 184,366,225 | ||||||||||
|
| |||||||||||||
| Auto Components 0.4% | ||||||||||||||
| a,b,c | International Automotive Components Group Brazil LLC | Brazil | 3,819,425 | 86,846 | ||||||||||
| a,b,c,d | International Automotive Components Group North America LLC | United States | 35,491,081 | 10,625,639 | ||||||||||
Toyo Tire & Rubber Co. Ltd. | Japan | 4,394,600 | 64,353,825 | |||||||||||
|
| |||||||||||||
| 75,066,310 | ||||||||||||||
|
| |||||||||||||
| Automobiles 1.1% | ||||||||||||||
General Motors Co. | United States | 5,350,852 | 210,823,569 | |||||||||||
|
| |||||||||||||
| Banks 11.9% | ||||||||||||||
Barclays PLC | United Kingdom | 36,257,633 | 90,496,654 | |||||||||||
BNP Paribas SA | France | 3,079,597 | 191,380,129 | |||||||||||
CIT Group Inc. | United States | 3,769,060 | 189,998,315 | |||||||||||
Citigroup Inc. | United States | 4,720,240 | 315,878,461 | |||||||||||
Citizens Financial Group Inc. | United States | 9,225,010 | 358,852,889 | |||||||||||
First Horizon National Corp. | United States | 7,743,203 | 138,138,741 | |||||||||||
HSBC Holdings PLC | United Kingdom | 16,067,494 | 150,801,525 | |||||||||||
JPMorgan Chase & Co. | United States | 1,959,756 | 204,206,575 | |||||||||||
Societe Generale SA | France | 5,157,188 | 217,607,344 | |||||||||||
Standard Chartered PLC | United Kingdom | 12,656,750 | 115,764,649 | |||||||||||
Wells Fargo & Co. | United States | 5,713,404 | 316,751,118 | |||||||||||
|
| |||||||||||||
| 2,289,876,400 | ||||||||||||||
|
| |||||||||||||
| Building Products 0.8% | ||||||||||||||
Johnson Controls International PLC | United States | 4,765,000 | 159,389,250 | |||||||||||
|
| |||||||||||||
| Capital Markets 1.3% | ||||||||||||||
Credit Suisse Group AG | Switzerland | 6,243,791 | 94,249,471 | |||||||||||
Deutsche Bank AG | Germany | 6,644,039 | 71,586,356 | |||||||||||
Guotai Junan Securities Co. Ltd. | China | 41,520,689 | 88,269,268 | |||||||||||
|
| |||||||||||||
| 254,105,095 | ||||||||||||||
|
| |||||||||||||
| Chemicals 0.0% | ||||||||||||||
| a,b,e | Dow Corning Corp., Contingent Distribution | United States | 11,430,153 | — | ||||||||||
|
| |||||||||||||
| Communications Equipment 2.8% | ||||||||||||||
Cisco Systems Inc. | United States | 5,552,130 | 238,908,154 | |||||||||||
Nokia OYJ, A | Finland | 28,555,604 | 164,479,295 | |||||||||||
Nokia OYJ, ADR | Finland | 25,474,246 | 146,476,914 | |||||||||||
|
| |||||||||||||
| 549,864,363 | ||||||||||||||
|
| |||||||||||||
| Construction Materials 0.9% | ||||||||||||||
LafargeHolcim Ltd., B | Switzerland | 3,691,245 | 180,313,442 | |||||||||||
|
| |||||||||||||
| Consumer Finance 1.6% | ||||||||||||||
Ally Financial Inc. | United States | 4,094,210 | 107,554,897 | |||||||||||
Capital One Financial Corp. | United States | 2,190,465 | 201,303,733 | |||||||||||
|
| |||||||||||||
| 308,858,630 | ||||||||||||||
|
| |||||||||||||
| Containers & Packaging 0.8% | ||||||||||||||
International Paper Co. | United States | 2,848,948 | 148,373,212 | |||||||||||
|
| |||||||||||||
| Diversified Financial Services 0.8% | ||||||||||||||
Voya Financial Inc. | United States | 3,426,353 | 161,038,591 | |||||||||||
|
| |||||||||||||
| franklintempleton.com | Semiannual Report | 17 |
FRANKLIN MUTUAL GLOBAL DISCOVERY FUND
STATEMENT OF INVESTMENTS (UNAUDITED)
| Country | Shares/ Units/ Warrants | Value | ||||||||||||
| Common Stocks and Other Equity Interests (continued) | ||||||||||||||
| Diversified Telecommunication Services 2.5% | ||||||||||||||
AT&T Inc. | United States | 6,668,657 | $ | 214,130,576 | ||||||||||
Koninklijke KPN NV | Netherlands | 95,635,204 | 260,343,461 | |||||||||||
|
| |||||||||||||
| 474,474,037 | ||||||||||||||
|
| |||||||||||||
| Electric Utilities 2.2% | ||||||||||||||
Enel SpA | Italy | 57,664,238 | 320,488,665 | |||||||||||
PG&E Corp. | United States | 2,580,200 | 109,813,312 | |||||||||||
|
| |||||||||||||
| 430,301,977 | ||||||||||||||
|
| |||||||||||||
| Energy Equipment & Services 0.9% | ||||||||||||||
Baker Hughes a GE Co., A | United States | 5,382,143 | 177,772,183 | |||||||||||
|
| |||||||||||||
| Food & Staples Retailing 1.0% | ||||||||||||||
| a | Rite Aid Corp. | United States | 13,959,587 | 24,150,085 | ||||||||||
Walgreens Boots Alliance Inc. | United States | 2,833,972 | 170,080,830 | |||||||||||
|
| |||||||||||||
| 194,230,915 | ||||||||||||||
|
| |||||||||||||
| Health Care Equipment & Supplies 4.5% | ||||||||||||||
Koninklijke Philips NV | Netherlands | 7,782,150 | 331,186,117 | |||||||||||
Medtronic PLC | United States | 6,236,184 | 533,879,712 | |||||||||||
|
| |||||||||||||
| 865,065,829 | ||||||||||||||
|
| |||||||||||||
| Health Care Providers & Services 1.0% | ||||||||||||||
CVS Health Corp. | United States | 3,061,866 | 197,031,077 | |||||||||||
|
| |||||||||||||
| Hotels, Restaurants & Leisure 2.5% | ||||||||||||||
Accor SA | France | 7,410,217 | 363,797,692 | |||||||||||
Sands China Ltd. | Hong Kong | 21,300,300 | 113,885,023 | |||||||||||
|
| |||||||||||||
| 477,682,715 | ||||||||||||||
|
| |||||||||||||
| Independent Power & Renewable Electricity Producers 0.5% | ||||||||||||||
| a | Vistra Energy Corp. | United States | 4,396,158 | 104,013,098 | ||||||||||
|
| |||||||||||||
| Industrial Conglomerates 1.8% | ||||||||||||||
General Electric Co. | United States | 25,464,700 | 346,574,567 | |||||||||||
|
| |||||||||||||
| Insurance 8.4% | ||||||||||||||
Alleghany Corp. | United States | 76,761 | 44,135,272 | |||||||||||
American International Group Inc. | United States | 5,102,618 | 270,540,806 | |||||||||||
China Pacific Insurance Group Co. Ltd., H | China | 44,491,587 | 172,101,843 | |||||||||||
Chubb Ltd. | United States | 1,651,098 | 209,722,468 | |||||||||||
The Hartford Financial Services Group Inc. | United States | 4,897,487 | 250,408,510 | |||||||||||
MetLife Inc. | United States | 2,126,666 | 92,722,638 | |||||||||||
NN Group NV | Netherlands | 8,886,859 | 361,742,388 | |||||||||||
RSA Insurance Group PLC | United Kingdom | 13,308,282 | 119,403,981 | |||||||||||
T&D Holdings Inc. | Japan | 6,611,212 | 99,411,558 | |||||||||||
|
| |||||||||||||
| 1,620,189,464 | ||||||||||||||
|
| |||||||||||||
| IT Services 1.6% | ||||||||||||||
Cognizant Technology Solutions Corp., A | United States | 3,800,390 | 300,192,806 | |||||||||||
|
| |||||||||||||
| Machinery 0.7% | ||||||||||||||
CNH Industrial NV | United Kingdom | 5,804,196 | 61,683,000 | |||||||||||
CNH Industrial NV, special voting | United Kingdom | 7,338,645 | 77,990,067 | |||||||||||
|
| |||||||||||||
| 139,673,067 | ||||||||||||||
|
| |||||||||||||
| 18 | Semiannual Report | franklintempleton.com |
FRANKLIN MUTUAL GLOBAL DISCOVERY FUND
STATEMENT OF INVESTMENTS (UNAUDITED)
| Country | Shares/ Units/ Warrants | Value | ||||||||||||
| Common Stocks and Other Equity Interests (continued) | ||||||||||||||
| Media 5.5% | ||||||||||||||
| a | Charter Communications Inc., A | United States | 840,665 | $ | 246,491,385 | |||||||||
| a | Cumulus Media Inc., A | United States | 215,987 | 3,239,805 | ||||||||||
| a | Cumulus Media Inc., B | United States | 322,030 | 5,071,972 | ||||||||||
| a | Cumulus Media Inc., wts., 6/04/38 | United States | 243,863 | 3,840,842 | ||||||||||
| a | DISH Network Corp., A | United States | 4,143,726 | 139,270,631 | ||||||||||
Sky PLC | United Kingdom | 13,249,101 | 255,715,175 | |||||||||||
The Walt Disney Co. | United States | 3,912,400 | 410,058,644 | |||||||||||
|
| |||||||||||||
| 1,063,688,454 | ||||||||||||||
|
| |||||||||||||
| Metals & Mining 1.2% | ||||||||||||||
Freeport-McMoRan Inc. | United States | 5,340,455 | 92,176,253 | |||||||||||
thyssenkrupp AG | Germany | 4,205,590 | 102,301,175 | |||||||||||
Warrior Met Coal Inc. | United States | 1,230,858 | 33,934,755 | |||||||||||
|
| |||||||||||||
| 228,412,183 | ||||||||||||||
|
| |||||||||||||
| Oil, Gas & Consumable Fuels 9.1% | ||||||||||||||
Anadarko Petroleum Corp. | United States | 2,017,980 | 147,817,035 | |||||||||||
BP PLC | United Kingdom | 24,503,699 | 187,135,470 | |||||||||||
Crescent Point Energy Corp. | Canada | 19,234,400 | 141,382,061 | |||||||||||
JXTG Holdings Inc. | Japan | 20,061,342 | 139,583,952 | |||||||||||
Kinder Morgan Inc. | United States | 13,160,358 | 232,543,526 | |||||||||||
Marathon Oil Corp. | United States | 8,154,873 | 170,110,651 | |||||||||||
Plains All American Pipeline LP | United States | 5,573,200 | 131,750,448 | |||||||||||
Royal Dutch Shell PLC, A (EUR Traded) | United Kingdom | 6,246,107 | 217,250,717 | |||||||||||
Royal Dutch Shell PLC, A (GBP Traded) | United Kingdom | 6,164,658 | 214,028,124 | |||||||||||
The Williams Cos. Inc. | United States | 6,364,035 | 172,528,989 | |||||||||||
|
| |||||||||||||
| 1,754,130,973 | ||||||||||||||
|
| |||||||||||||
| Pharmaceuticals 9.2% | ||||||||||||||
Eli Lilly & Co. | United States | 5,532,056 | 472,050,339 | |||||||||||
GlaxoSmithKline PLC | United Kingdom | 19,892,359 | 401,876,134 | |||||||||||
Merck & Co. Inc. | United States | 7,108,228 | 431,469,440 | |||||||||||
Novartis AG, ADR | Switzerland | 6,246,162 | 471,835,077 | |||||||||||
|
| |||||||||||||
| 1,777,230,990 | ||||||||||||||
|
| |||||||||||||
| Semiconductors & Semiconductor Equipment 0.6% | ||||||||||||||
| a | Renesas Electronics Corp. | Japan | 12,232,261 | 120,007,547 | ||||||||||
|
| |||||||||||||
| Software 4.7% | ||||||||||||||
| a | Avaya Holdings Corp., wts., 12/15/22 | United States | 401,411 | 1,856,526 | ||||||||||
| a | Check Point Software Technologies Ltd. | Israel | 3,379,372 | 330,097,057 | ||||||||||
| a | Dell Technologies Inc., V | United States | 1,105,751 | 93,524,420 | ||||||||||
Microsoft Corp. | United States | 2,947,975 | 290,699,815 | |||||||||||
Symantec Corp. | United States | 9,568,159 | 197,582,483 | |||||||||||
|
| |||||||||||||
| 913,760,301 | ||||||||||||||
|
| |||||||||||||
| Specialty Retail 0.5% | ||||||||||||||
Dufry AG | Switzerland | 744,545 | 95,022,706 | |||||||||||
|
| |||||||||||||
| Technology Hardware, Storage & Peripherals 2.5% | ||||||||||||||
Hewlett Packard Enterprise Co. | United States | 10,039,360 | 146,675,050 | |||||||||||
Samsung Electronics Co. Ltd. | South Korea | 8,138,650 | 340,387,325 | |||||||||||
|
| |||||||||||||
| 487,062,375 | ||||||||||||||
|
| |||||||||||||
| franklintempleton.com | Semiannual Report | 19 |
FRANKLIN MUTUAL GLOBAL DISCOVERY FUND
STATEMENT OF INVESTMENTS (UNAUDITED)
| Country | Shares/ Units/ Warrants | Value | ||||||||||||
| Common Stocks and Other Equity Interests (continued) | ||||||||||||||
| Tobacco 3.1% | ||||||||||||||
Altria Group Inc. | United States | 2,606,727 | $ | 148,036,026 | ||||||||||
British American Tobacco PLC | United Kingdom | 5,233,602 | 264,710,238 | |||||||||||
British American Tobacco PLC, ADR | United Kingdom | 2,178,905 | 109,925,757 | |||||||||||
Imperial Brands PLC | United Kingdom | 1,937,431 | 72,202,881 | |||||||||||
|
| |||||||||||||
| 594,874,902 | ||||||||||||||
|
| |||||||||||||
| Wireless Telecommunication Services 1.1% | ||||||||||||||
Vodafone Group PLC | United Kingdom | 89,319,132 | 216,824,587 | |||||||||||
|
| |||||||||||||
Total Common Stocks and Other Equity Interests (Cost $14,067,972,453) | 17,100,291,840 | |||||||||||||
|
| |||||||||||||
| Management Investment Companies (Cost $112,851,576) 0.7% | ||||||||||||||
| Diversified Financial Services 0.7% | ||||||||||||||
| a | Altaba Inc. | United States | 1,722,000 | 126,067,620 | ||||||||||
|
| |||||||||||||
| Preferred Stocks (Cost $391,187,079) 1.6% | ||||||||||||||
| Automobiles 1.6% | ||||||||||||||
| f | Volkswagen AG, 2.784%, pfd | Germany | 1,896,164 | 315,071,802 | ||||||||||
|
| |||||||||||||
| Principal Amount | ||||||||||||||
| Corporate Notes and Senior Floating Rate Interests 1.4% | ||||||||||||||
| g,h | Cumulus Media New Holdings Inc., Term Loan, 6.60%, (1-month USD LIBOR + 4.50%), 5/13/22 | United States | $ | 60,864,891 | 60,598,607 | |||||||||
Frontier Communications Corp., | ||||||||||||||
senior note, 10.50%, 9/15/22 | United States | 117,895,000 | 107,579,188 | |||||||||||
senior note, 11.00%, 9/15/25 | United States | 133,179,000 | 107,169,141 | |||||||||||
|
| |||||||||||||
Total Corporate Notes and Senior Floating Rate Interests | 275,346,936 | |||||||||||||
|
| |||||||||||||
Corporate Notes and Senior Floating Rate Interests in | ||||||||||||||
| b,c,i | Broadband Ventures III LLC, secured promissory note, 5.00%, 2/01/12 | United States | 8,893 | — | ||||||||||
| i | iHeartCommunications Inc., | |||||||||||||
senior secured note, first lien, 9.00%, 12/15/19 | United States | 95,618,000 | 72,908,725 | |||||||||||
g,h Tranche D Term Loan, 8.443%, (3-month USD LIBOR + 6.75%), 1/30/19 | United States | 117,978,997 | 90,298,175 | |||||||||||
g,h Tranche E Term Loan, 9.193%, (3-month USD LIBOR + 7.50%), 7/30/19 | United States | 37,921,652 | 29,014,424 | |||||||||||
|
| |||||||||||||
Total Corporate Notes and Senior Floating Rate Interests in Reorganization (Cost $245,871,832) | 192,221,324 | |||||||||||||
|
| |||||||||||||
| Shares | ||||||||||||||
| Companies in Liquidation 0.0%† | ||||||||||||||
| a,b,e | Avaya Holdings Corp., Contingent Distribution | United States | 123,916,000 | — | ||||||||||
| a,b,e | Avaya Inc., Contingent Distribution | United States | 168,607,600 | — | ||||||||||
| a,b,e | NewPage Corp., Litigation Trust, Contingent Distribution | United States | 145,817,000 | — | ||||||||||
| a,b,e | Tribune Media, Litigation Trust, Contingent Distribution | United States | 1,300,238 | — | ||||||||||
| a,e | Vistra Energy Corp., Litigation Trust, Contingent Distribution | United States | 260,457,613 | 2,116,218 | ||||||||||
| 20 | Semiannual Report | franklintempleton.com |
FRANKLIN MUTUAL GLOBAL DISCOVERY FUND
STATEMENT OF INVESTMENTS (UNAUDITED)
| Country | Shares | Value | ||||||||||||
| Companies in Liquidation (continued) | ||||||||||||||
| a | Vistra Energy Corp., Litigation Trust, TRA | United States | 4,396,159 | $ | 2,857,503 | |||||||||
|
| |||||||||||||
Total Companies in Liquidation | 4,973,721 | |||||||||||||
|
| |||||||||||||
Total Investments before Short Term Investments | 18,013,973,243 | |||||||||||||
|
| |||||||||||||
| Principal Amount | ||||||||||||||
| Short Term Investments 5.7% | ||||||||||||||
| U.S. Government and Agency Securities 5.7% | ||||||||||||||
| j | FHLB, 7/02/18 | United States | $ | 260,200,000 | 260,200,000 | |||||||||
| j | U.S. Treasury Bill, | |||||||||||||
k 11/15/18 - 11/23/18 | United States | 80,000,000 | 79,382,566 | |||||||||||
7/05/18 - 12/27/18 | United States | 751,800,000 | 748,926,342 | |||||||||||
|
| |||||||||||||
Total U.S. Government and Agency Securities | 1,088,508,908 | |||||||||||||
|
| |||||||||||||
Total Investments (Cost $16,221,760,688) 98.9% | 19,102,482,151 | |||||||||||||
| Securities Sold Short (0.6)% | (115,013,758) | |||||||||||||
Other Assets, less Liabilities 1.7% | 336,867,294 | |||||||||||||
|
| |||||||||||||
Net Assets 100.0% | $ | 19,324,335,687 | ||||||||||||
|
| |||||||||||||
| Shares | ||||||||||||||
| l | Securities Sold Short (Proceeds $108,806,505) (0.6)% | |||||||||||||
| Common Stocks (0.6)% | ||||||||||||||
| Internet Software & Services (0.6)% | ||||||||||||||
Alibaba Group Holding Ltd., ADR | China | 619,920 | (115,013,758 | ) | ||||||||||
|
| |||||||||||||
†Rounds to less than 0.1% of net assets.
aNon-income producing.
bFair valued using significant unobservable inputs. See Note 14 regarding fair value measurements.
cSee Note 10 regarding restricted securities.
dSee Note 12 regarding holdings of 5% voting securities.
eContingent distributions represent the right to receive additional distributions, if any, during the reorganization of the underlying company. Shares represent total underlying principal of debt securities.
fVariable rate security. The rate shown represents the yield at period end.
gThe coupon rate shown represents the rate at period end.
hSee Note 1(e) regarding senior floating rate interests.
iSee Note 8 regarding credit risk and defaulted securities.
jThe security was issued on a discount basis with no stated coupon rate.
kA portion or all of the security has been segregated as collateral for securities sold short. At June 30, 2018, the aggregate value of these securities pledged amounted to $56,952,983, representing 0.3% of net assets.
lSee Note 1(d) regarding securities sold short.
| franklintempleton.com | Semiannual Report | 21 |
FRANKLIN MUTUAL GLOBAL DISCOVERY FUND
STATEMENT OF INVESTMENTS (UNAUDITED)
At June 30, 2018, the Fund had the following futures contracts outstanding. See Note 1(c).
| Futures Contracts | ||||||||||||||||||||
| Description | Type | | Number of Contracts |
| | Notional Amount | * | | Expiration Date |
| | Value/ Unrealized Appreciation (Depreciation) |
| |||||||
| Currency Contracts | ||||||||||||||||||||
EUR/USD | Short | 8,804 | $1,291,601,825 | 9/17/18 | $13,230,509 | |||||||||||||||
GBP/USD | Short | 7,828 | 647,571,300 | 9/17/18 | 9,874,147 | |||||||||||||||
|
| |||||||||||||||||||
Total Futures Contracts | $23,104,656 | |||||||||||||||||||
|
| |||||||||||||||||||
*As of period end.
At June 30, 2018, the Fund had the following forward exchange contracts outstanding. See Note 1(c).
| Forward Exchange Contracts | ||||||||||||||||||||||||||||
| Currency | Counterparty | a | Type | Quantity | | Contract Amount |
| | Settlement Date |
| | Unrealized Appreciation |
| | Unrealized Depreciation |
| ||||||||||||
| OTC Forward Exchange Contracts |
| |||||||||||||||||||||||||||
Swiss Franc | BONY | Buy | 1,318,549 | $ | 1,327,202 | 7/09/18 | $ | 5,278 | $ | — | ||||||||||||||||||
Swiss Franc | UBSW | Buy | 3,765,143 | 3,832,931 | 7/09/18 | — | (28,008 | ) | ||||||||||||||||||||
Swiss Franc | UBSW | Buy | 4,076,403 | 4,112,686 | 7/09/18 | 6,786 | — | |||||||||||||||||||||
Swiss Franc | UBSW | Sell | 102,297,573 | 102,891,256 | 7/09/18 | — | (487,139 | ) | ||||||||||||||||||||
Euro | BOFA | Buy | 44,394,070 | 52,130,476 | 7/12/18 | — | (212,315 | ) | ||||||||||||||||||||
Euro | BOFA | Buy | 71,848,071 | 83,465,450 | 7/12/18 | 559,726 | — | |||||||||||||||||||||
Euro | BOFA | Sell | 12,098,913 | 14,788,567 | 7/12/18 | 639,080 | — | |||||||||||||||||||||
Euro | BONY | Buy | 8,720,431 | 10,148,073 | 7/12/18 | 50,333 | — | |||||||||||||||||||||
Euro | BONY | Buy | 12,584,135 | 14,733,241 | 7/12/18 | — | (16,295 | ) | ||||||||||||||||||||
Euro | HSBK | Buy | 10,270,267 | 12,142,485 | 7/12/18 | — | (131,571 | ) | ||||||||||||||||||||
Euro | HSBK | Buy | 89,696,117 | 104,288,505 | 7/12/18 | 609,678 | — | |||||||||||||||||||||
Euro | HSBK | Sell | 162,077,939 | 196,724,433 | 7/12/18 | 7,176,861 | — | |||||||||||||||||||||
Euro | SSBT | Buy | 22,314,479 | 25,954,523 | 7/12/18 | 141,906 | — | |||||||||||||||||||||
Euro | SSBT | Sell | 7,980,539 | 9,789,500 | 7/12/18 | 456,386 | — | |||||||||||||||||||||
Euro | UBSW | Buy | 8,483,545 | 9,874,906 | 7/12/18 | 46,466 | — | |||||||||||||||||||||
Euro | UBSW | Buy | 12,584,135 | 14,728,887 | 7/12/18 | — | (11,941 | ) | ||||||||||||||||||||
Euro | UBSW | Sell | 154,282,615 | 187,201,355 | 7/12/18 | 6,770,291 | — | |||||||||||||||||||||
British Pound | BOFA | Buy | 12,198,304 | 16,087,731 | 7/16/18 | 34,175 | — | |||||||||||||||||||||
British Pound | BOFA | Buy | 40,158,208 | 54,961,120 | 7/16/18 | — | (1,885,961 | ) | ||||||||||||||||||||
British Pound | BOFA | Sell | 31,074,225 | 43,420,952 | 7/16/18 | 2,351,653 | — | |||||||||||||||||||||
British Pound | BONY | Buy | 9,592,693 | 12,649,980 | 7/16/18 | 28,218 | — | |||||||||||||||||||||
British Pound | BONY | Sell | 6,919,704 | 9,957,108 | 7/16/18 | 811,670 | — | |||||||||||||||||||||
British Pound | HSBK | Buy | 4,875,956 | 6,438,602 | 7/16/18 | 5,713 | — | |||||||||||||||||||||
British Pound | HSBK | Buy | 64,484,310 | 87,816,910 | 7/16/18 | — | (2,591,119 | ) | ||||||||||||||||||||
British Pound | HSBK | Sell | 165,435,471 | 226,076,554 | 7/16/18 | 7,428,501 | — | |||||||||||||||||||||
British Pound | SSBT | Buy | 4,100,004 | 5,405,999 | 7/16/18 | 12,778 | — | |||||||||||||||||||||
British Pound | SSBT | Sell | 3,842,619 | 5,395,280 | 7/16/18 | 316,677 | — | |||||||||||||||||||||
British Pound | UBSW | Buy | 4,100,004 | 5,408,209 | 7/16/18 | 10,568 | — | |||||||||||||||||||||
British Pound | UBSW | Buy | 40,586,942 | 55,896,541 | 7/16/18 | — | (2,254,745 | ) | ||||||||||||||||||||
British Pound | UBSW | Sell | 159,304,242 | 217,355,166 | 7/16/18 | 6,810,462 | — | |||||||||||||||||||||
Euro | BONY | Sell | 164,851,655 | 206,783,322 | 7/26/18 | 13,790,188 | — | |||||||||||||||||||||
Euro | HSBK | Sell | 164,851,656 | 206,766,838 | 7/26/18 | 13,773,703 | — | |||||||||||||||||||||
| 22 | Semiannual Report | franklintempleton.com |
FRANKLIN MUTUAL GLOBAL DISCOVERY FUND
STATEMENT OF INVESTMENTS (UNAUDITED)
| Forward Exchange Contracts (continued) | ||||||||||||||||||||||||||||
| Currency | Counterparty | a | Type | Quantity | | Contract Amount |
| | Settlement Date |
| | Unrealized Appreciation |
| | Unrealized Depreciation |
| ||||||||||||
| OTC Forward Exchange Contracts (continued) |
| |||||||||||||||||||||||||||
South Korean Won | HSBK | Buy | 11,866,151,700 | $ | 10,812,909 | 8/10/18 | $ | — | $ | (161,258 | ) | |||||||||||||||||
South Korean Won | HSBK | Sell | 85,106,676,227 | 79,563,538 | 8/10/18 | 3,167,535 | — | |||||||||||||||||||||
South Korean Won | UBSW | Buy | 36,527,417,858 | 33,864,668 | 8/10/18 | — | (1,075,833 | ) | ||||||||||||||||||||
South Korean Won | UBSW | Sell | 197,040,112,866 | 184,786,168 | 8/10/18 | 7,913,120 | — | |||||||||||||||||||||
British Pound | BOFA | Sell | 5,203,242 | 7,363,854 | 8/14/18 | 477,796 | — | |||||||||||||||||||||
British Pound | BONY | Sell | 96,489,241 | 134,256,558 | 8/14/18 | 6,561,043 | — | |||||||||||||||||||||
British Pound | UBSW | Sell | 95,575,578 | 132,948,752 | 8/14/18 | 6,462,394 | — | |||||||||||||||||||||
Euro | BONY | Sell | 77,940,911 | 98,604,371 | 8/20/18 | 7,177,755 | — | |||||||||||||||||||||
Euro | SSBT | Sell | 77,940,911 | 98,573,819 | 8/20/18 | 7,147,202 | — | |||||||||||||||||||||
Japanese Yen | HSBK | Sell | 11,341,534,186 | 103,119,387 | 8/20/18 | 286,520 | — | |||||||||||||||||||||
Japanese Yen | UBSW | Buy | 76,028,938 | 688,831 | 8/20/18 | 517 | — | |||||||||||||||||||||
Japanese Yen | UBSW | Buy | 261,142,874 | 2,387,427 | 8/20/18 | — | (19,663 | ) | ||||||||||||||||||||
Euro | BOFA | Sell | 278,101,505 | 347,797,062 | 10/10/18 | 20,255,547 | — | |||||||||||||||||||||
Euro | UBSW | Sell | 128,620,411 | 160,081,607 | 10/10/18 | 8,595,464 | — | |||||||||||||||||||||
Euro | BOFA | Sell | 13,096,917 | 16,243,590 | 10/18/18 | 807,829 | — | |||||||||||||||||||||
Euro | BONY | Sell | 6,456,955 | 7,918,325 | 10/18/18 | 308,289 | — | |||||||||||||||||||||
Euro | HSBK | Sell | 7,422,999 | 9,093,020 | 10/18/18 | 344,423 | — | |||||||||||||||||||||
Euro | SSBT | Sell | 133,600,803 | 167,822,407 | 10/18/18 | 10,363,206 | — | |||||||||||||||||||||
Euro | UBSW | Sell | 137,414,949 | 172,486,219 | 10/18/18 | 10,531,741 | — | |||||||||||||||||||||
British Pound | HSBK | Sell | 6,447,688 | 8,945,703 | 10/24/18 | 384,678 | — | |||||||||||||||||||||
British Pound | SSBT | Sell | 2,738,305 | 3,872,045 | 10/24/18 | 236,215 | — | |||||||||||||||||||||
British Pound | UBSW | Sell | 6,736,904 | 9,423,817 | 10/24/18 | 478,780 | — | |||||||||||||||||||||
Euro | SSBT | Sell | 122,952,210 | 149,300,869 | 11/07/18 | 4,144,496 | — | |||||||||||||||||||||
Euro | UBSW | Sell | 122,952,209 | 149,271,359 | 11/07/18 | 4,114,987 | — | |||||||||||||||||||||
South Korean Won | HSBK | Sell | 54,293,728,432 | 50,696,017 | 11/09/18 | 1,768,276 | — | |||||||||||||||||||||
South Korean Won | UBSW | Sell | 94,469,602,033 | 88,243,989 | 11/09/18 | 3,111,057 | — | |||||||||||||||||||||
Euro | HSBK | Sell | 74,582,217 | 89,196,752 | 11/21/18 | 1,040,247 | — | |||||||||||||||||||||
Euro | SSBT | Sell | 74,582,218 | 89,215,249 | 11/21/18 | 1,058,743 | — | |||||||||||||||||||||
British Pound | BONY | Sell | 62,320,541 | 84,485,153 | 11/26/18 | 1,601,255 | — | |||||||||||||||||||||
British Pound | UBSW | Sell | 62,320,540 | 84,479,107 | 11/26/18 | 1,595,210 | — | |||||||||||||||||||||
|
| |||||||||||||||||||||||||||
Total Forward Exchange Contracts |
| $ | 171,771,422 | $ | (8,875,848 | ) | ||||||||||||||||||||||
|
| |||||||||||||||||||||||||||
Net unrealized appreciation (depreciation) |
| $ | 162,895,574 | |||||||||||||||||||||||||
|
| |||||||||||||||||||||||||||
aMay be comprised of multiple contracts with the same counterparty, currency and settlement date.
See Note 11 regarding other derivative information.
See Abbreviations on page 40.
| franklintempleton.com | The accompanying notes are an integral part of these financial statements. | Semiannual Report | 23 |
FRANKLIN MUTUAL GLOBAL DISCOVERY FUND
Financial Statements
Statement of Assets and Liabilities
June 30, 2018 (unaudited)
Assets: | ||||
Investments in securities: | ||||
Cost - Unaffiliated issuers | $ | 16,192,665,317 | ||
Cost - Non-controlled affiliates (Note 12) | 29,095,371 | |||
|
| |||
Value - Unaffiliated issuers | $ | 19,091,856,512 | ||
Value - Non-controlled affiliates (Note 12) | 10,625,639 | |||
Cash | 4,246,254 | |||
Foreign currency, at value (cost $13,455,911) | 13,529,675 | |||
Receivables: | ||||
Investment securities sold | 64,122,426 | |||
Capital shares sold | 11,477,060 | |||
Dividends and interest | 64,274,763 | |||
European Union tax reclaims | 6,185,143 | |||
Deposits with brokers for: | ||||
Securities sold short | 119,288,841 | |||
Futures contracts | 36,028,268 | |||
Unrealized appreciation on OTC forward exchange contracts | 171,771,422 | |||
Other assets | 514,304 | |||
|
| |||
Total assets | 19,593,920,307 | |||
|
| |||
Liabilities: | ||||
Payables: | ||||
Investment securities purchased | 53,073,824 | |||
Capital shares redeemed | 45,222,978 | |||
Management fees | 13,301,359 | |||
Distribution fees | 7,722,713 | |||
Transfer agent fees | 5,269,729 | |||
Trustees’ fees and expenses | 776,399 | |||
Variation margin on futures contracts | 18,789,452 | |||
Securities sold short, at value (proceeds $108,806,505) | 115,013,758 | |||
Unrealized depreciation on OTC forward exchange contracts | 8,875,848 | |||
Accrued expenses and other liabilities | 1,538,560 | |||
|
| |||
Total liabilities | 269,584,620 | |||
|
| |||
Net assets, at value | $ | 19,324,335,687 | ||
|
| |||
Net assets consist of: | ||||
Paid-in capital | $ | 15,331,105,855 | ||
Undistributed net investment income | 223,773,459 | |||
Net unrealized appreciation (depreciation) | 3,060,305,430 | |||
Accumulated net realized gain (loss) | 709,150,943 | |||
|
| |||
Net assets, at value | $ | 19,324,335,687 | ||
|
|
| 24 | Semiannual Report | The accompanying notes are an integral part of these financial statements. | franklintempleton.com |
FRANKLIN MUTUAL GLOBAL DISCOVERY FUND
FINANCIAL STATEMENTS
Statement of Assets and Liabilities (continued)
June 30, 2018 (unaudited)
| Class Z: | ||||
Net assets, at value | $ | 6,432,207,489 | ||
|
| |||
Shares outstanding | 201,382,885 | |||
|
| |||
Net asset value and maximum offering price per share | $ | 31.94 | ||
|
| |||
| Class A: | ||||
Net assets, at value | $ | 8,635,892,873 | ||
|
| |||
Shares outstanding | 275,976,445 | |||
|
| |||
Net asset value per sharea | $ | 31.29 | ||
|
| |||
Maximum offering price per share (net asset value per share ÷ 94.25%) | $ | 33.20 | ||
|
| |||
| Class C: | ||||
Net assets, at value | $ | 2,108,235,077 | ||
|
| |||
Shares outstanding | 68,408,429 | |||
|
| |||
Net asset value and maximum offering price per sharea | $ | 30.82 | ||
|
| |||
| Class R: | ||||
Net assets, at value | $ | 348,065,578 | ||
|
| |||
Shares outstanding | 11,290,669 | |||
|
| |||
Net asset value and maximum offering price per share | $ | 30.83 | ||
|
| |||
| Class R6: | ||||
Net assets, at value | $ | 1,799,934,670 | ||
|
| |||
Shares outstanding | 56,329,384 | |||
|
| |||
Net asset value and maximum offering price per share | $ | 31.95 | ||
|
| |||
aRedemption price is equal to net asset value less contingent deferred sales charges, if applicable.
| franklintempleton.com | The accompanying notes are an integral part of these financial statements. | Semiannual Report | 25 |
FRANKLIN MUTUAL GLOBAL DISCOVERY FUND
FINANCIAL STATEMENTS
Statement of Operations
for the six months ended June 30, 2018 (unaudited)
Investment income: | ||||
Dividends: (net of foreign taxes)* | ||||
Unaffiliated issuers | $ | 314,103,354 | ||
Interest: | ||||
Unaffiliated issuers | 26,197,720 | |||
|
| |||
Total investment income | 340,301,074 | |||
|
| |||
Expenses: | ||||
Management fees (Note 3a) | 84,282,960 | |||
Distribution fees: (Note 3c) | ||||
Class A | 11,395,071 | |||
Class C | 11,455,897 | |||
Class R | 929,682 | |||
Transfer agent fees: (Note 3e) | ||||
Class Z | 4,489,958 | |||
Class A | 5,984,940 | |||
Class C | 1,504,226 | |||
Class R | 245,031 | |||
Class R6 | 268,327 | |||
Custodian fees (Note 4) | 520,567 | |||
Reports to shareholders | 786,426 | |||
Registration and filing fees | 208,438 | |||
Professional fees | 298,384 | |||
Trustees’ fees and expenses | 388,022 | |||
Dividends on securities sold short | 773,086 | |||
Other | 196,539 | |||
|
| |||
Total expenses | 123,727,554 | |||
Expense reductions (Note 4) | (54,118 | ) | ||
Expenses waived/paid by affiliates (Note 3f) | (58,420 | ) | ||
|
| |||
Net expenses | 123,615,016 | |||
|
| |||
Net investment income | 216,686,058 | |||
|
| |||
Realized and unrealized gains (losses): | ||||
Net realized gain (loss) from: | ||||
Investments: | ||||
Unaffiliated issuers | 885,464,816 | |||
Foreign currency transactions | (2,282,042 | ) | ||
Forward exchange contracts | (148,638,337 | ) | ||
Futures contracts | 23,421,093 | |||
Securities sold short | 4,326,934 | |||
|
| |||
Net realized gain (loss) | 762,292,464 | |||
|
| |||
Net change in unrealized appreciation (depreciation) on: | ||||
Investments: | ||||
Unaffiliated issuers | (1,583,945,263 | ) | ||
Non-controlled affiliates (Note 12) | (12,754,998 | ) | ||
Translation of other assets and liabilities denominated in foreign currencies | (940,245 | ) | ||
Forward exchange contracts | 272,310,911 | |||
Futures contracts | 52,033,698 | |||
Securities sold short | (7,608,368 | ) | ||
|
| |||
Net change in unrealized appreciation (depreciation) | (1,280,904,265 | ) | ||
|
| |||
Net realized and unrealized gain (loss) | (518,611,801 | ) | ||
|
|
| 26 | Semiannual Report | The accompanying notes are an integral part of these financial statements. | franklintempleton.com |
FRANKLIN MUTUAL GLOBAL DISCOVERY FUND
FINANCIAL STATEMENTS
Statement of Operations (continued)
for the six months ended June 30, 2018 (unaudited)
Net increase (decrease) in net assets resulting from operations | $ | (301,925,743 | ) | |
|
|
*Foreign taxes withheld on dividends | $21,609,346 | |||
| franklintempleton.com | The accompanying notes are an integral part of these financial statements. | Semiannual Report | 27 |
FRANKLIN MUTUAL GLOBAL DISCOVERY FUND
FINANCIAL STATEMENTS
Statements of Changes in Net Assets
Six Months Ended June 30, 2018 (unaudited) | Year Ended December 31, 2017 | |||||||
Increase (decrease) in net assets: | ||||||||
Operations: | ||||||||
Net investment income | $ 216,686,058 | $ 464,583,587 | ||||||
Net realized gain (loss) | 762,292,464 | 665,444,446 | ||||||
Net change in unrealized appreciation (depreciation) | (1,280,904,265 | ) | 940,826,950 | |||||
|
| |||||||
Net increase (decrease) in net assets resulting from operations | (301,925,743 | ) | 2,070,854,983 | |||||
|
| |||||||
Distributions to shareholders from: | ||||||||
Net investment income: | ||||||||
Class Z | — | (172,580,188 | ) | |||||
Class A | — | (209,942,027 | ) | |||||
Class C | — | (34,634,111 | ) | |||||
Class R | — | (7,828,860 | ) | |||||
Class R6 | — | (54,145,296 | ) | |||||
Net realized gains: | ||||||||
Class Z | — | (233,398,813 | ) | |||||
Class A | — | (286,608,599 | ) | |||||
Class C | — | (74,606,964 | ) | |||||
Class R | — | (12,124,955 | ) | |||||
Class R6 | — | (40,494,896 | ) | |||||
|
| |||||||
Total distributions to shareholders | — | (1,126,364,709 | ) | |||||
|
| |||||||
Capital share transactions: (Note 2) | ||||||||
Class Z | (649,032,697 | ) | (1,590,803,172 | ) | ||||
Class A | (816,860,631 | ) | (1,344,720,248 | ) | ||||
Class C | (288,442,954 | ) | (436,509,197 | ) | ||||
Class R | (44,711,197 | ) | (64,928,952 | ) | ||||
Class R6 | (398,242,162 | ) | 1,730,442,445 | |||||
|
| |||||||
Total capital share transactions | (2,197,289,641 | ) | (1,706,519,124 | ) | ||||
|
| |||||||
Net increase (decrease) in net assets | (2,499,215,384 | ) | (762,028,850 | ) | ||||
Net assets: | ||||||||
Beginning of period | 21,823,551,071 | 22,585,579,921 | ||||||
|
| |||||||
End of period | $19,324,335,687 | $21,823,551,071 | ||||||
|
| |||||||
Undistributed net investment income included in net assets: | ||||||||
End of period | $ 223,773,459 | $ 7,087,401 | ||||||
|
| |||||||
| 28 | Semiannual Report | The accompanying notes are an integral part of these financial statements. | franklintempleton.com |
FRANKLIN MUTUAL GLOBAL DISCOVERY FUND
Notes to Financial Statements (unaudited)
1. Organization and Significant Accounting Policies
Franklin Mutual Series Funds (Trust) is registered under the Investment Company Act of 1940 (1940 Act) as an open-end management investment company, consisting of seven separate funds and applies the specialized accounting and reporting guidance in U.S. Generally Accepted Accounting Principles (U.S. GAAP). Franklin Mutual Global Discovery Fund (Fund) is included in this report. The Fund offers five classes of shares: Class Z, Class A, Class C, Class R and Class R6. Each class of shares may differ by its initial sales load, contingent deferred sales charges, voting rights on matters affecting a single class, its exchange privilege and fees due to differing arrangements for distribution and transfer agent fees.
The following summarizes the Fund’s significant accounting policies.
a. Financial Instrument Valuation
The Fund’s investments in financial instruments are carried at fair value daily. Fair value is the price that would be received to sell an asset or paid to transfer a liability in an orderly transaction between market participants on the measurement date. The Fund calculates the net asset value (NAV) per share each business day as of 4 p.m. Eastern time or the regularly scheduled close of the New York Stock Exchange (NYSE), whichever is earlier. Under compliance policies and procedures approved by the Trust’s Board of Trustees (the Board), the Fund’s administrator has responsibility for oversight of valuation, including leading the cross-functional Valuation Committee (VC). The VC provides administration and oversight of the Fund’s valuation policies and procedures, which are approved annually by the Board. Among other things, these procedures allow the Fund to utilize independent pricing services, quotations from securities and financial instrument dealers, and other market sources to determine fair value.
Equity securities and derivative financial instruments listed on an exchange or on the NASDAQ National Market System are valued at the last quoted sale price or the official closing price of the day, respectively. Foreign equity securities are valued as of the close of trading on the foreign stock exchange on which the security is primarily traded, or as of 4 p.m. Eastern time. The value is then converted into its U.S. dollar equivalent at the foreign exchange rate in effect at 4 p.m. Eastern time on the day that the value of the security is determined. Over-the-counter
(OTC) securities are valued within the range of the most recent quoted bid and ask prices. Securities that trade in multiple markets or on multiple exchanges are valued according to the broadest and most representative market. Certain equity securities are valued based upon fundamental characteristics or relationships to similar securities.
Debt securities generally trade in the OTC market rather than on a securities exchange. The Fund’s pricing services use multiple valuation techniques to determine fair value. In instances where sufficient market activity exists, the pricing services may utilize a market-based approach through which quotes from market makers are used to determine fair value. In instances where sufficient market activity may not exist or is limited, the pricing services also utilize proprietary valuation models which may consider market characteristics such as benchmark yield curves, credit spreads, estimated default rates, anticipated market interest rate volatility, coupon rates, anticipated timing of principal repayments, underlying collateral, and other unique security features in order to estimate the relevant cash flows, which are then discounted to calculate the fair value.
Certain derivative financial instruments trade in the OTC market. The Fund’s pricing services use various techniques including industry standard option pricing models and proprietary discounted cash flow models to determine the fair value of those instruments. The Fund’s net benefit or obligation under the derivative contract, as measured by the fair value of the contract, is included in net assets.
The Fund has procedures to determine the fair value of financial instruments for which market prices are not reliable or readily available. Under these procedures, the VC convenes on a regular basis to review such financial instruments and considers a number of factors, including significant unobservable valuation inputs, when arriving at fair value. The VC primarily employs a market-based approach which may use related or comparable assets or liabilities, recent transactions, market multiples, book values, and other relevant information for the investment to determine the fair value of the investment. An income-based valuation approach may also be used in which the anticipated future cash flows of the investment are discounted to calculate fair value. Discounts may also be applied due to the nature or duration of any restrictions on the disposition of the investments. Due to the inherent uncertainty of valuations of such investments, the fair values may differ significantly from the values that would have been used had an active market existed. The VC employs various methods for calibrating these
| franklintempleton.com | Semiannual Report | 29 |
FRANKLIN MUTUAL GLOBAL DISCOVERY FUND
NOTES TO FINANCIAL STATEMENTS (UNAUDITED)
1. Organization and Significant Accounting
Policies (continued)
a. Financial Instrument Valuation (continued)
valuation approaches including a regular review of key inputs and assumptions, transactional back-testing or disposition analysis, and reviews of any related market activity.
Trading in securities on foreign securities stock exchanges and OTC markets may be completed before 4 p.m. Eastern time. In addition, trading in certain foreign markets may not take place on every Fund’s business day. Occasionally, events occur between the time at which trading in a foreign security is completed and 4 p.m. Eastern time that might call into question the reliability of the value of a portfolio security held by the Fund. As a result, differences may arise between the value of the Fund’s portfolio securities as determined at the foreign market close and the latest indications of value at 4 p.m. Eastern time. In order to minimize the potential for these differences, the VC monitors price movements following the close of trading in foreign stock markets through a series of country specific market proxies (such as baskets of American Depositary Receipts, futures contracts and exchange traded funds). These price movements are measured against established trigger thresholds for each specific market proxy to assist in determining if an event has occurred that may call into question the reliability of the values of the foreign securities held by the Fund. If such an event occurs, the securities may be valued using fair value procedures, which may include the use of independent pricing services.
When the last day of the reporting period is a non-business day, certain foreign markets may be open on those days that the Fund’s NAV is not calculated, which could result in differences between the value of the Fund’s portfolio securities on the last business day and the last calendar day of the reporting period. Any significant security valuation changes due to an open foreign market are adjusted and reflected by the Fund for financial reporting purposes.
b. Foreign Currency Translation
Portfolio securities and other assets and liabilities denominated in foreign currencies are translated into U.S. dollars based on the exchange rate of such currencies against U.S. dollars on the date of valuation. The Fund may enter into foreign currency exchange contracts to facilitate transactions denominated in a foreign currency. Purchases and sales of securities, income and
expense items denominated in foreign currencies are translated into U.S. dollars at the exchange rate in effect on the transaction date. Portfolio securities and assets and liabilities denominated in foreign currencies contain risks that those currencies will decline in value relative to the U.S. dollar. Occasionally, events may impact the availability or reliability of foreign exchange rates used to convert the U.S. dollar equivalent value. If such an event occurs, the foreign exchange rate will be valued at fair value using procedures established and approved by the Board.
The Fund does not separately report the effect of changes in foreign exchange rates from changes in market prices on securities held. Such changes are included in net realized and unrealized gain or loss from investments in the Statement of Operations.
Realized foreign exchange gains or losses arise from sales of foreign currencies, currency gains or losses realized between the trade and settlement dates on securities transactions and the difference between the recorded amounts of dividends, interest, and foreign withholding taxes and the U.S. dollar equivalent of the amounts actually received or paid. Net unrealized foreign exchange gains and losses arise from changes in foreign exchange rates on foreign denominated assets and liabilities other than investments in securities held at the end of the reporting period.
c. Derivative Financial Instruments
The Fund invested in derivative financial instruments in order to manage risk or gain exposure to various other investments or markets. Derivatives are financial contracts based on an underlying or notional amount, require no initial investment or an initial net investment that is smaller than would normally be required to have a similar response to changes in market factors, and require or permit net settlement. Derivatives contain various risks including the potential inability of the counterparty to fulfill their obligations under the terms of the contract, the potential for an illiquid secondary market, and/or the potential for market movements which expose the Fund to gains or losses in excess of the amounts shown in the Statement of Assets and Liabilities. Realized gain and loss and unrealized appreciation and depreciation on these contracts for the period are included in the Statement of Operations.
Derivative counterparty credit risk is managed through a formal evaluation of the creditworthiness of all potential counter-parties. The Fund attempts to reduce its exposure to
| 30 | Semiannual Report | franklintempleton.com |
FRANKLIN MUTUAL GLOBAL DISCOVERY FUND
NOTES TO FINANCIAL STATEMENTS (UNAUDITED)
counterparty credit risk on OTC derivatives, whenever possible, by entering into International Swaps and Derivatives Association (ISDA) master agreements with certain counterparties. These agreements contain various provisions, including but not limited to collateral requirements, events of default, or early termination. Termination events applicable to the counterparty include certain deteriorations in the credit quality of the counterparty. Termination events applicable to the Fund include failure of the Fund to maintain certain net asset levels and/or limit the decline in net assets over various periods of time. In the event of default or early termination, the ISDA master agreement gives the non-defaulting party the right to net and close-out all transactions traded, whether or not arising under the ISDA agreement, to one net amount payable by one counterparty to the other. However, absent an event of default or early termination, OTC derivative assets and liabilities are presented gross and not offset in the Statement of Assets and Liabilities. Early termination by the counterparty may result in an immediate payment by the Fund of any net liability owed to that counterparty under the ISDA agreement. At June 30, 2018, the Fund had no OTC derivatives in a net liability position for such contracts.
Collateral requirements differ by type of derivative. Collateral or initial margin requirements are set by the broker or exchange clearing house for exchange traded and centrally cleared derivatives. Initial margin deposited is held at the exchange and can be in the form of cash and/or securities. For OTC derivatives traded under an ISDA master agreement, posting of collateral is required by either the Fund or the applicable counterparty if the total net exposure of all OTC derivatives with the applicable counterparty exceeds the minimum transfer amount, which typically ranges from $100,000 to $250,000, and can vary depending on the counterparty and the type of the agreement. Generally, collateral is determined at the close of Fund business each day and any additional collateral required due to changes in derivative values may be delivered by the Fund or the counterparty the next business day, or within a few business days. Collateral pledged and/or received by the Fund for OTC derivatives, if any, is held in segregated accounts with the Fund’s custodian/counterparty broker and can be in the form of cash and/or securities. Unrestricted cash may be invested according to the Fund’s investment objectives. To the extent that the amounts due to the Fund from its counterparties are not subject to collateralization or are not fully collateralized, the Fund bears the risk of loss from counterparty non-performance.
At June 30, 2018, the Fund received $191,052,008 in U.K. Treasury Bonds and U.S. Treasury Bills, Bonds and Notes as collateral for derivatives.
The Fund entered into exchange traded futures contracts primarily to manage exposure to certain foreign currencies. A futures contract is an agreement between the Fund and a counterparty to buy or sell an asset at a specified price on a future date. Required initial margins are pledged by the Fund, and the daily change in fair value is accounted for as a variation margin payable or receivable in the Statement of Assets and Liabilities.
The Fund entered into OTC forward exchange contracts primarily to manage exposure to certain foreign currencies. A forward exchange contract is an agreement between the Fund and a counterparty to buy or sell a foreign currency at a specific exchange rate on a future date.
See Note 11 regarding other derivative information.
d. Securities Sold Short
The Fund is engaged in selling securities short, which obligates the Fund to replace a borrowed security with the same security at current fair value. The Fund incurs a loss if the price of the security increases between the date of the short sale and the date on which the Fund replaces the borrowed security. The Fund realizes a gain if the price of the security declines between those dates. Gains are limited to the price at which the Fund sold the security short, while losses are potentially unlimited in size.
The Fund is required to establish a margin account with the broker lending the security sold short. While the short sale is outstanding, the broker retains the proceeds of the short sale to the extent necessary to meet margin requirements until the short position is closed out. A deposit must also be maintained with the Fund’s custodian/counterparty broker consisting of cash and/or securities having a value equal to a specified percentage of the value of the securities sold short. The Fund is obligated to pay fees for borrowing the securities sold short and is required to pay the counterparty any dividends and/or interest due on securities sold short. Such dividends and/or interest and any security borrowing fees are recorded as an expense to the Fund.
e. Senior Floating Rate Interests
The Fund invests in senior secured corporate loans that pay interest at rates which are periodically reset by reference to a base lending rate plus a spread. These base lending rates are
| franklintempleton.com | Semiannual Report | 31 |
FRANKLIN MUTUAL GLOBAL DISCOVERY FUND
NOTES TO FINANCIAL STATEMENTS (UNAUDITED)
1. Organization and Significant Accounting Policies (continued)
e. Senior Floating Rate Interests (continued)
generally the prime rate offered by a designated U.S. bank or the London InterBank Offered Rate (LIBOR). Senior secured corporate loans often require prepayment of principal from excess cash flows or at the discretion of the borrower. As a result, actual maturity may be substantially less than the stated maturity. Senior secured corporate loans in which the Fund invests are generally readily marketable, but may be subject to certain restrictions on resale.
f. Income and Deferred Taxes
It is the Fund’s policy to qualify as a regulated investment company under the Internal Revenue Code. The Fund intends to distribute to shareholders substantially all of its taxable income and net realized gains to relieve it from federal income and excise taxes. As a result, no provision for U.S. federal income taxes is required.
The Fund may be subject to foreign taxation related to income received, capital gains on the sale of securities and certain foreign currency transactions in the foreign jurisdictions in which it invests. Foreign taxes, if any, are recorded based on the tax regulations and rates that exist in the foreign markets in which the Fund invests. When a capital gain tax is determined to apply, the Fund records an estimated deferred tax liability in an amount that would be payable if the securities were disposed of on the valuation date.
As a result of several court cases, in certain countries across the European Union, the Fund filed additional tax reclaims for previously withheld taxes on dividends earned in those countries (EU reclaims). These additional filings are subject to various administrative proceedings by the local jurisdictions’ tax authorities within the European Union, as well as a number of related judicial proceedings. Income recognized, if any, for EU reclaims is reflected as other income in the Statement of Operations and any related receivable, if any, is reflected as European Union tax reclaims in the Statement of Assets and Liabilities. When uncertainty exists as to the ultimate resolution of these proceedings, the likelihood of receipt of these EU reclaims, and the potential timing of payment, no amounts are reflected in the financial statements. For U.S. income tax
purposes, EU reclaims received by the Fund, if any, reduce the amounts of foreign taxes Fund shareholders can use as tax credits in their individual income tax returns.
The Fund may recognize an income tax liability related to its uncertain tax positions under U.S. GAAP when the uncertain tax position has a less than 50% probability that it will be sustained upon examination by the tax authorities based on its technical merits. As of June 30, 2018, the Fund has determined that no tax liability is required in its financial statements related to uncertain tax positions for any open tax years (or expected to be taken in future tax years). Open tax years are those that remain subject to examination and are based on the statute of limitations in each jurisdiction in which the Fund invests.
g. Security Transactions, Investment Income, Expenses and Distributions
Security transactions are accounted for on trade date. Realized gains and losses on security transactions are determined on a specific identification basis. Interest income and estimated expenses are accrued daily. Amortization of premium and accretion of discount on debt securities are included in interest income. Dividend income and dividends declared on securities sold short are recorded on the ex-dividend date except for certain dividends from securities where the dividend rate is not available. In such cases, the dividend is recorded as soon as the information is received by the Fund. Distributions to shareholders are recorded on the ex-dividend date. Distributable earnings are determined according to income tax regulations (tax basis) and may differ from earnings recorded in accordance with U.S. GAAP. These differences may be permanent or temporary. Permanent differences are reclassified among capital accounts to reflect their tax character. These reclassifications have no impact on net assets or the results of operations. Temporary differences are not reclassified, as they may reverse in subsequent periods.
Common expenses incurred by the Trust are allocated among the Funds based on the ratio of net assets of each Fund to the combined net assets of the Trust or based on the ratio of number of shareholders of each Fund to the combined number of shareholders of the Trust. Fund specific expenses are charged directly to the Fund that incurred the expense.
| 32 | Semiannual Report | franklintempleton.com |
FRANKLIN MUTUAL GLOBAL DISCOVERY FUND
NOTES TO FINANCIAL STATEMENTS (UNAUDITED)
Realized and unrealized gains and losses and net investment income, excluding class specific expenses, are allocated daily to each class of shares based upon the relative proportion of net assets of each class. Differences in per share distributions by class are generally due to differences in class specific expenses.
h. Accounting Estimates
The preparation of financial statements in accordance with U.S. GAAP requires management to make estimates and assumptions that affect the reported amounts of assets and liabilities at the date of the financial statements and the amounts of income and expenses during the reporting period. Actual results could differ from those estimates.
i. Guarantees and Indemnifications
Under the Trust’s organizational documents, its officers and trustees are indemnified by the Trust against certain liabilities arising out of the performance of their duties to the Trust. Additionally, in the normal course of business, the Trust, on behalf of the Fund, enters into contracts with service providers that contain general indemnification clauses. The Trust’s maximum exposure under these arrangements is unknown as this would involve future claims that may be made against the Trust that have not yet occurred. Currently, the Trust expects the risk of loss to be remote.
2. Shares of Beneficial Interest
At June 30, 2018, there were an unlimited number of shares authorized (without par value). Transactions in the Fund’s shares were as follows:
Six Months Ended June 30, 2018 | Year Ended December 31, 2017 | |||||||||||||||
| Shares | Amount | Shares | Amount | |||||||||||||
| Class Z Shares: | ||||||||||||||||
| Shares sold | 11,855,610 | $ | 386,430,842 | 68,835,996 | $ | 2,244,877,670 | ||||||||||
| Shares issued in reinvestment of distributions | — | — | 11,449,535 | 372,018,771 | ||||||||||||
| Shares redeemed | (31,823,997 | ) | (1,035,463,539 | ) | (127,366,615 | ) | (4,207,699,613 | ) | ||||||||
|
| |||||||||||||||
| Net increase (decrease) | (19,968,387 | ) | $ | (649,032,697 | ) | (47,081,084 | ) | $ | (1,590,803,172 | ) | ||||||
|
| |||||||||||||||
| Class A Shares: | ||||||||||||||||
| Shares sold | 10,407,291 | $ | 332,693,303 | 31,207,860 | $ | 1,003,437,365 | ||||||||||
| Shares issued in reinvestment of distributions | — | — | 15,223,548 | 484,999,519 | ||||||||||||
| Shares redeemed | (35,966,374 | ) | (1,149,553,934 | ) | (88,369,392 | ) | (2,833,157,132 | ) | ||||||||
|
| |||||||||||||||
| Net increase (decrease) | (25,559,083 | ) | $ | (816,860,631 | ) | (41,937,984 | ) | $ | (1,344,720,248 | ) | ||||||
|
| |||||||||||||||
| Class C Shares: | ||||||||||||||||
| Shares sold | 2,069,196 | $ | 65,281,502 | 6,673,104 | $ | 211,439,458 | ||||||||||
| Shares issued in reinvestment of distributions | — | — | 3,370,430 | 105,965,772 | ||||||||||||
| Shares redeemed | (11,231,417 | ) | (353,724,456 | ) | (23,753,704 | ) | (753,914,427 | ) | ||||||||
|
| |||||||||||||||
| Net increase (decrease) | (9,162,221 | ) | $ | (288,442,954 | ) | (13,710,170 | ) | $ | (436,509,197 | ) | ||||||
|
| |||||||||||||||
| Class R Shares: | ||||||||||||||||
| Shares sold | 571,905 | $ | 17,960,211 | 1,801,733 | $ | 57,024,664 | ||||||||||
| Shares issued in reinvestment of distributions | — | — | 615,390 | 19,331,426 | ||||||||||||
| Shares redeemed | (1,991,713 | ) | (62,671,408 | ) | (4,451,909 | ) | (141,285,042 | ) | ||||||||
|
| |||||||||||||||
| Net increase (decrease) | (1,419,808 | ) | $ | (44,711,197 | ) | (2,034,786 | ) | $ | (64,928,952 | ) | ||||||
|
| |||||||||||||||
| Class R6 Shares: | ||||||||||||||||
| Shares sold | 7,839,640 | $ | 254,861,662 | 54,624,980 | $ | 1,832,959,818 | ||||||||||
| Shares issued in reinvestment of distributions | — | — | 2,637,145 | 85,609,397 | ||||||||||||
| Shares redeemed | (20,038,977 | ) | (653,103,824 | ) | (5,716,616 | ) | (188,126,770 | ) | ||||||||
|
| |||||||||||||||
| Net increase (decrease) | (12,199,337 | ) | $ | (398,242,162 | ) | 51,545,509 | $ | 1,730,442,445 | ||||||||
|
| |||||||||||||||
| franklintempleton.com | Semiannual Report | 33 |
FRANKLIN MUTUAL GLOBAL DISCOVERY FUND
NOTES TO FINANCIAL STATEMENTS (UNAUDITED)
3. Transactions with Affiliates
Franklin Resources, Inc. is the holding company for various subsidiaries that together are referred to as Franklin Templeton Investments. Certain officers and trustees of the Fund are also officers and/or directors of the following subsidiaries:
| Subsidiary | Affiliation | |
Franklin Mutual Advisers, LLC (Franklin Mutual) | Investment manager | |
Franklin Templeton Services, LLC (FT Services) | Administrative manager | |
Franklin Templeton Distributors, Inc. (Distributors) | Principal underwriter | |
Franklin Templeton Investor Services, LLC (Investor Services) | Transfer agent |
a. Management Fees
The Fund pays an investment management fee to Franklin Mutual based on the average daily net assets of the Fund as follows:
| Annualized Fee Rate | Net Assets | |
0.875% | Up to and including $4 billion | |
0.845% | Over $4 billion, up to and including $7 billion | |
0.825% | Over $7 billion, up to and including $10 billion | |
0.805% | Over $10 billion, up to and including $13 billion | |
0.785% | Over $13 billion, up to and including $16 billion | |
0.765% | Over $16 billion, up to and including $19 billion | |
0.745% | Over $19 billion, up to and including $22 billion | |
0.725% | Over $22 billion, up to and including $25 billion | |
0.705% | Over $25 billion, up to and including $28 billion | |
0.685% | In excess of $28 billion |
For the period ended June 30, 2018, the annualized gross effective investment management fee rate was 0.813% of the Fund’s average daily net assets.
b. Administrative Fees
Under an agreement with Franklin Mutual, FT Services provides administrative services to the Fund. The fee is paid by Franklin Mutual based on the Fund’s average daily net assets, and is not an additional expense of the Fund.
c. Distribution Fees
The Board has adopted distribution plans for each share class, with the exception of Class Z and Class R6 shares, pursuant to Rule 12b-1 under the 1940 Act. Under the Fund’s Class A reimbursement distribution plan, the Fund reimburses Distributors for costs incurred in connection with the servicing, sale and distribution of the Fund’s shares up to the maximum annual plan rate. Under the Class A reimbursement distribution plan, costs exceeding the maximum for the current plan year cannot be reimbursed in subsequent periods. In addition, under the Fund’s Class C and R compensation distribution plans, the Fund pays Distributors for costs incurred in connection with the servicing, sale and distribution of the Fund’s shares up to the maximum annual plan rate for each class. The plan year, for purposes of monitoring compliance with the maximum annual plan rates, is February 1 through January 31.
| 34 | Semiannual Report | franklintempleton.com |
FRANKLIN MUTUAL GLOBAL DISCOVERY FUND
NOTES TO FINANCIAL STATEMENTS (UNAUDITED)
The maximum annual plan rates, based on the average daily net assets, for each class, are as follows:
Class A | 0.35% | |||
Class C | 1.00% | |||
Class R | 0.50% |
The Board has set the current rate at 0.25% per year for Class A shares until further notice and approval by the Board.
d. Sales Charges/Underwriting Agreements
Front-end sales charges and contingent deferred sales charges (CDSC) do not represent expenses of the Fund. These charges are deducted from the proceeds of sales of Fund shares prior to investment or from redemption proceeds prior to remittance, as applicable. Distributors has advised the Fund of the following commission transactions related to the sales and redemptions of the Fund’s shares for the period:
Sales charges retained net of commissions paid to unaffiliated brokers/dealers | $ | 777,092 | ||
CDSC retained | $ | 62,418 |
e. Transfer Agent Fees
Each class of shares pays transfer agent fees to Investor Services for its performance of shareholder servicing obligations. Effective November 1, 2017, the fees are based on an annualized asset based fee of 0.02% plus a transaction based fee. Prior to November 1, 2017, the fees were account based fees that varied based on fund or account type. In addition, each class reimburses Investor Services for out of pocket expenses incurred and, except for Class R6 reimburses shareholder servicing fees paid to third parties. These fees are allocated daily based upon their relative proportion of such classes’ aggregate net assets. Class R6 pays Investor Services transfer agent fees specific to that class.
For the period ended June 30, 2018, the Fund paid transfer agent fees of $12,492,482, of which $4,521,596 was retained by Investor Services.
f. Waiver and Expense Reimbursements
Investor Services has voluntarily agreed in advance to waive or limit its fees so that the Class R6 transfer agent fees do not exceed 0.02% based on the average net assets of the class. Investor Services may discontinue this waiver in the future.
4. Expense Offset Arrangement
The Fund has entered into an arrangement with its custodian whereby credits realized as a result of uninvested cash balances are used to reduce a portion of the Fund’s custodian expenses. During the period ended June 30, 2018, the custodian fees were reduced as noted in the Statement of Operations.
5. Independent Trustees’ Retirement Plan
On January 1, 1993, the Trust adopted an Independent Trustees’ Retirement Plan (Plan). The Plan is an unfunded defined benefit plan that provides benefit payments to Trustees whose length of service and retirement age meets the eligibility requirements of the Plan. Benefits under the Plan are based on years of service and fees paid to each trustee at the time of retirement. Effective in December 1996, the Plan was closed to new participants.
| franklintempleton.com | Semiannual Report | 35 |
FRANKLIN MUTUAL GLOBAL DISCOVERY FUND
NOTES TO FINANCIAL STATEMENTS (UNAUDITED)
5. Independent Trustees’ Retirement Plan (continued)
During the period ended June 30, 2018, the Fund’s projected benefit obligation and benefit payments under the Plan were as follows:
aProjected benefit obligation at June 30, 2018 | $ | 776,399 | ||
bIncrease in projected benefit obligation | $ | 8,659 | ||
Benefit payments made to retired trustees | $ | (10,870 | ) |
aThe projected benefit obligation is included in trustees’ fees and expenses in the Statement of Assets and Liabilities.
bThe increase in projected benefit obligation is included in trustees’ fees and expenses in the Statement of Operations.
6. Income Taxes
For tax purposes, the Fund may elect to defer any portion of a post-October capital loss to the first day of the following fiscal year. At December 31, 2017, the Fund deferred post-October capital losses of $145,031,524.
At June 30, 2018, the cost of investments and net unrealized appreciation (depreciation) for income tax purposes were as follows:
Cost of investments | $ | 16,027,729,868 | ||
|
| |||
Unrealized appreciation | $ | 4,700,657,306 | ||
Unrealized depreciation | (1,554,860,143 | ) | ||
|
| |||
Net unrealized appreciation (depreciation) | $ | 3,145,797,163 | ||
|
| |||
Differences between income and/or capital gains as determined on a book basis and a tax basis are primarily due to differing treatment of foreign currency transactions.
7. Investment Transactions
Purchases and sales of investments (excluding short term securities and securities sold short) for the period ended June 30, 2018, aggregated $1,174,552,273 and $3,487,102,183, respectively.
8. Credit Risk and Defaulted Securities
The Fund may purchase the pre-default or defaulted debt of distressed companies. Distressed companies are financially troubled and could be or are already involved in financial restructuring or bankruptcy. Risks associated with purchasing these securities include the possibility that the bankruptcy or other restructuring process takes longer than expected, or that distributions in restructuring are less than anticipated, either or both of which may result in unfavorable consequences to the Fund. If it becomes probable that the income on debt securities, including those of distressed companies, will not be collected, the Fund discontinues accruing income and recognizes an adjustment for uncollectible interest.
At June 30, 2018, the aggregate long value of distressed company securities for which interest recognition has been discontinued was $192,221,324, representing 1.0% of the Fund’s net assets. For information as to specific securities, see the accompanying Statement of Investments.
9. Concentration of Risk
Investing in foreign securities may include certain risks and considerations not typically associated with investing in U.S. securities, such as fluctuating currency values and changing local and regional economic, political and social conditions, which may result in greater market volatility. In addition, certain foreign securities may not be as liquid as U.S. securities.
| 36 | Semiannual Report | franklintempleton.com |
FRANKLIN MUTUAL GLOBAL DISCOVERY FUND
NOTES TO FINANCIAL STATEMENTS (UNAUDITED)
10. Restricted Securities
The Fund invests in securities that are restricted under the Securities Act of 1933 (1933 Act). Restricted securities are often purchased in private placement transactions, and cannot be sold without prior registration unless the sale is pursuant to an exemption under the 1933 Act. Disposal of these securities may require greater effort and expense, and prompt sale at an acceptable price may be difficult. The Fund may have registration rights for restricted securities. The issuer generally incurs all registration costs.
At June 30, 2018, investments in restricted securities, excluding securities exempt from registration under the 1933 Act deemed to be liquid, were as follows:
Principal Amount/ Shares | Issuer | Acquisition Date | Cost | Value | ||||||||||||
| 8,893 | Broadband Ventures III LLC, secured promissory note, 5.00%, 2/01/12 | 7/01/10 - 11/30/12 | $ | 8,893 | $ | — | ||||||||||
| 3,819,425 | International Automotive Components Group Brazil LLC | 4/13/06 - 12/26/08 | 2,536,498 | 86,846 | ||||||||||||
| 35,491,081 | International Automotive Components Group North America LLC | 1/12/06 - 3/18/13 | 29,095,371 | 10,625,639 | ||||||||||||
|
| |||||||||||||||
Total Restricted Securities (Value is 0.1% of Net Assets) | $ | 31,640,762 | $ | 10,712,485 | ||||||||||||
|
| |||||||||||||||
11. Other Derivative Information
At June 30, 2018, the Fund’s investments in derivative contracts are reflected in the Statement of Assets and Liabilities as follows:
Asset Derivatives | Liability Derivatives | |||||||||||
Derivative Contracts Not Accounted for as Hedging Instruments | Statement of Assets and Liabilities Location | Fair Value | Statement of Assets and Liabilities Location | Fair Value | ||||||||
| Foreign exchange contracts | Variation margin on futures contracts | $ | 23,104,656 | a | Variation margin on futures | $ | — | |||||
Unrealized appreciation on OTC forward exchange contracts | 171,771,422 | Unrealized depreciation on OTC forward exchange contracts | 8,875,848 | |||||||||
|
|
|
| |||||||||
Totals | $ | 194,876,078 | $ | 8,875,848 | ||||||||
|
|
|
| |||||||||
aThis amount reflects the cumulative appreciation (depreciation) of futures contracts as reported in the Statement of Investments. Only the variation margin receivable/ payable at period end is separately reported within the Statement of Assets and Liabilities. Prior variation margin movements were recorded to cash upon receipt or payment.
For the period ended June 30, 2018, the effect of derivative contracts in the Fund’s Statement of Operations was as follows:
Derivative Contracts Not Accounted for as Hedging Instruments | Statement of Operations Location | Net Realized Gain (Loss) for the Period | Statement of Operations Location | Net Change in Unrealized Appreciation (Depreciation) for the Period | ||||||||
Net realized gain (loss) from: | Net change in unrealized appreciation (depreciation) on: | |||||||||||
Foreign exchange contracts | Forward exchange contracts | $ | (148,638,337 | ) | Forward exchange contracts | $ | 272,310,911 | |||||
Futures contracts | 23,421,093 | Futures contracts | 52,033,698 | |||||||||
|
|
|
| |||||||||
Totals | $ | (125,217,244 | ) | $ | 324,344,609 | |||||||
|
|
|
| |||||||||
For the period ended June 30, 2018, the average month end notional amount of futures contracts represented $2,052,745,346. The average month end contract value of forward exchange contracts was $4,510,712,514.
See Note 1(c) regarding derivative financial instruments.
| franklintempleton.com | Semiannual Report | 37 |
FRANKLIN MUTUAL GLOBAL DISCOVERY FUND
NOTES TO FINANCIAL STATEMENTS (UNAUDITED)
12. Holdings of 5% Voting Securities of Portfolio Companies
The 1940 Act defines “affiliated companies” to include investments in portfolio companies in which a fund owns 5% or more of the outstanding voting securities. During the period ended June 30, 2018, investments in “affiliated companies” were as follows:
| Name of Issuer | Number of Held of Period | Gross Additions | Gross Reductions | Number of Held at End of Period | Value at End of Period | Dividend Income | Realized Gain (Loss) | Net Change in Unrealized | ||||||||||||||||||||||||
| Non-Controlled Affiliates | ||||||||||||||||||||||||||||||||
International Automotive Components Group North America LLC (Value is 0.0%a of Net Assets) | 35,491,081 | — | — | 35,491,081 | $10,625,639 | $— | $— | $(12,754,998 | ) | |||||||||||||||||||||||
|
| |||||||||||||||||||||||||||||||
aRounds to less than 0.1% of net assets.
13. Credit Facility
The Fund, together with other U.S. registered and foreign investment funds (collectively, Borrowers), managed by Franklin Templeton Investments, are borrowers in a joint syndicated senior unsecured credit facility totaling $2 billion (Global Credit Facility) which matures on February 8, 2019. This Global Credit Facility provides a source of funds to the Borrowers for temporary and emergency purposes, including the ability to meet future unanticipated or unusually large redemption requests.
Under the terms of the Global Credit Facility, the Fund shall, in addition to interest charged on any borrowings made by the Fund and other costs incurred by the Fund, pay its share of fees and expenses incurred in connection with the implementation and maintenance of the Global Credit Facility, based upon its relative share of the aggregate net assets of all of the Borrowers, including an annual commitment fee of 0.15% based upon the unused portion of the Global Credit Facility. These fees are reflected in other expenses in the Statement of Operations. During the period ended June 30, 2018, the Fund did not use the Global Credit Facility.
14. Fair Value Measurements
The Fund follows a fair value hierarchy that distinguishes between market data obtained from independent sources (observable inputs) and the Fund’s own market assumptions (unobservable inputs). These inputs are used in determining the value of the Fund’s financial instruments and are summarized in the following fair value hierarchy:
| • | Level 1 – quoted prices in active markets for identical financial instruments |
| • | Level 2 – other significant observable inputs (including quoted prices for similar financial instruments, interest rates, prepayment speed, credit risk, etc.) |
| • | Level 3 – significant unobservable inputs (including the Fund’s own assumptions in determining the fair value of financial instruments) |
The input levels are not necessarily an indication of the risk or liquidity associated with financial instruments at that level.
For movements between the levels within the fair value hierarchy, the Fund has adopted a policy of recognizing the transfers as of the date of the underlying event which caused the movement.
| 38 | Semiannual Report | franklintempleton.com |
FRANKLIN MUTUAL GLOBAL DISCOVERY FUND
NOTES TO FINANCIAL STATEMENTS (UNAUDITED)
A summary of inputs used as of June 30, 2018, in valuing the Fund’s assets and liabilities carried at fair value, is as follows:
| Level 1 | Level 2 | Level 3 | Total | |||||||||||||
| Assets: | ||||||||||||||||
Investments in Securities:a | ||||||||||||||||
Equity Investments:b | ||||||||||||||||
Auto Components | $ | 64,353,825 | $ | — | $ | 10,712,485 | $ | 75,066,310 | ||||||||
Machinery | 61,683,000 | 77,990,067 | — | 139,673,067 | ||||||||||||
Media | 1,054,775,640 | 8,912,814 | — | 1,063,688,454 | ||||||||||||
Software | 911,903,775 | 1,856,526 | — | 913,760,301 | ||||||||||||
All Other Equity Investments | 15,349,243,130 | — | — | c | 15,349,243,130 | |||||||||||
Corporate Notes and Senior Floating Rate Interests | — | 275,346,936 | — | 275,346,936 | ||||||||||||
Corporate Notes and Senior Floating Rate Interests in Reorganization | — | 192,221,324 | — | c | 192,221,324 | |||||||||||
Companies in Liquidation | — | 4,973,721 | — | c | 4,973,721 | |||||||||||
Short Term Investments | 828,308,908 | 260,200,000 | — | 1,088,508,908 | ||||||||||||
|
| |||||||||||||||
Total Investments in Securities | $ | 18,270,268,278 | $ | 821,501,388 | $ | 10,712,485 | $ | 19,102,482,151 | ||||||||
|
| |||||||||||||||
Other Financial Instruments: | ||||||||||||||||
Futures Contracts | $ | 23,104,656 | $ | — | $ | — | $ | 23,104,656 | ||||||||
Forward Exchange Contracts | — | 171,771,422 | — | 171,771,422 | ||||||||||||
|
| |||||||||||||||
Total Other Financial Instruments | $ | 23,104,656 | $ | 171,771,422 | $ | — | $ | 194,876,078 | ||||||||
|
| |||||||||||||||
| Liabilities: | ||||||||||||||||
Other Financial Instruments: | ||||||||||||||||
Securities Sold Shorta | $ | 115,013,758 | $ | — | $ | — | $ | 115,013,758 | ||||||||
Forward Exchange Contracts | — | 8,875,848 | — | 8,875,848 | ||||||||||||
|
| |||||||||||||||
Total Other Financial Instruments | $ | 115,013,758 | $ | 8,875,848 | $ | — | $ | 123,889,606 | ||||||||
|
| |||||||||||||||
aFor detailed categories, see the accompanying Statement of Investments.
bIncludes common, preferred stocks and management investment companies as well as other equity investments.
cIncludes securities determined to have no value at June 30, 2018.
A reconciliation of assets in which Level 3 inputs are used in determining fair value is presented when there are significant Level 3 financial instruments at the beginning and/or end of the period.
15. Subsequent Events
The Fund has evaluated subsequent events through the issuance of the financial statements and determined that no events have occurred that require disclosure, except for the following:
On February 27, 2018, the Board approved an automatic conversion feature for Class C that will convert shareholders’ Class C shares into Class A shares after they have been held for 10 years. The conversion feature will become effective on a future date prior to the calendar year end of 2018. Further details are disclosed in the Fund’s Prospectus.
On May 17, 2018, the Board approved changes to certain front-end sales charges and dealer commissions on Class A shares. The changes will become effective on or about September 10, 2018. Further details are disclosed in the Fund’s Prospectus.
| franklintempleton.com | Semiannual Report | 39 |
FRANKLIN MUTUAL GLOBAL DISCOVERY FUND
NOTES TO FINANCIAL STATEMENTS (UNAUDITED)
Abbreviations
| Counterparty | Currency | Selected Portfolio | ||||||||
| BOFA | Bank of America Corp. | EUR | Euro | ADR | American Depositary Receipt | |||||
| BONY | The Bank of New York Mellon Corp. | GBP | British Pound | FHLB | Federal Home Loan Bank | |||||
| HSBK | HSBC Bank PLC | USD | United States Dollar | LIBOR | London InterBank Offered Rate | |||||
| SSBT | State Street Bank and Trust Co., N.A. | TRA | Tax Receivable Agreement Right | |||||||
| UBSW | UBS AG | |||||||||
| 40 | Semiannual Report | franklintempleton.com |
FRANKLIN MUTUAL SERIES FUNDS
FRANKLIN MUTUAL GLOBAL DISCOVERY FUND
Shareholder Information
Board Approval of Investment Management Agreements
FRANKLIN MUTUAL SERIES FUNDS
Franklin Mutual Global Discovery Fund
(Fund)
The Board of Trustees (Board), including a majority of trustees that are not “interested persons” as such term is defined in section 2(a)(19) of the Investment Company Act of 1940 (hereinafter referred to as “independent trustees”), at an in-person meeting held on May 17, 2018, unanimously approved the renewal of the Fund’s investment management agreement. Prior to a meeting of all of the trustees for the purpose of considering such renewal, the independent trustees participated in two other meetings held in connection with the renewal process. Throughout the process, the independent trustees received assistance and advice from and met separately with independent counsel. The independent trustees met with and interviewed officers of the investment manager (including portfolio managers), the transfer agent and shareholder services group and the distributor. In approving the renewal of the investment management agreement for the Fund, the Board, including the independent trustees, determined that the investment management fee structure was fair and reasonable and that continuance of the agreement was in the best interests of the Fund and its shareholders.
In reaching their decision on the investment management agreement, the trustees took into account information furnished throughout the year at regular Board meetings, as well as information specifically requested and furnished for the renewal process, which culminated in the meetings referred to above for the specific purpose of considering such agreement. Information furnished throughout the year included, among others, reports on the Fund’s investment performance, expenses, portfolio composition, portfolio brokerage execution, client commission arrangements, derivatives, securities lending, asset segregation, portfolio turnover, Rule 12b-1 plan, distribution, shareholder servicing, legal and compliance matters, pricing of securities, sales and redemptions, and marketing support payments made to financial intermediaries, as well as a third-party survey of transfer agent fees charged to funds within the Franklin Templeton Investments (FTI) complex in comparison with those charged to other fund complexes deemed comparable. Also, related financial statements and other information about the scope and quality of services provided by the investment manager and its affiliates and enhancements to such services over the past year were
provided. In addition, the trustees received periodic reports throughout the year and during the renewal process relating to compliance with the Fund’s investment policies and restrictions. During the renewal process, the independent trustees considered the investment manager’s methods of operation within the Franklin Templeton group and its activities on behalf of other clients. The Board also noted that it received an annual report on all payments made by FTI or the Fund to financial intermediaries engaged in the sale of Fund shares, as well as a memorandum relating to third-party servicing arrangements in response to a Guidance Update from the U.S. Securities and Exchange Commission (SEC) relating to mutual fund distribution and sub-accounting fees.
The information obtained by the trustees during the renewal process also included a special report prepared by Broadridge Financial Solutions, Inc., an independent third-party analyst that utilizes data from Lipper, Inc. (“Lipper”), comparing the Fund’s investment performance and expenses with those of other mutual funds deemed comparable to the Fund as selected by Lipper (Broadridge Section 15(c) Report). The trustees reviewed the Broadridge Section 15(c) Report and its usefulness in the renewal process with respect to matters such as comparative fees, expenses, expense ratios, performance and volatility. They concluded that the report continues to be a reliable resource in the performance of their duties.
In addition, the trustees received a Profitability Study (Profitability Study) prepared by management discussing the profitability to FTI from its overall U.S. fund operations, as well as on an individual fund-by-fund basis. Over the past year, the Board and counsel to the independent trustees continued to receive reports on management’s handling of recent regulatory inquiries and pending legal actions against the investment manager and its affiliates. The independent trustees were satisfied with the actions taken to date by management in response to such regulatory and legal matters.
The trustees reviewed the personnel, operations, financial condition, and investment management capabilities, methodologies and resources of the investment manager. As part of this review, particular attention was given to management’s diligent risk management program, including continual monitoring and management of cybersecurity, liquidity and counterparty credit risk, and attention given to derivatives and other complex instruments that are held and expected to be held by the Fund and how such instruments are used to carry out the Fund’s investment goal(s). The Board also took into account, among other things, management’s efforts in
| franklintempleton.com | Semiannual Report | 41 |
FRANKLIN MUTUAL SERIES FUNDS
FRANKLIN MUTUAL GLOBAL DISCOVERY FUND
SHAREHOLDER INFORMATION
establishing a global credit facility for the benefit of the Fund and other accounts managed by FTI to provide a source of cash for temporary and emergency purposes or to meet unusual redemption requests as well as the strong financial position of the investment manager’s parent company and its commitment to the mutual fund business. The Board noted management’s continuing efforts and expenditures in establishing effective business continuity plans and developing strategies to address areas of heightened concern in the mutual fund industry, such as cybersecurity and liquidity risk management. The Board also recognized management’s commitment to facilitating Board oversight of particular areas, including derivatives and payments to intermediaries, by enhanced reporting.
In addition to the above and other matters considered by the trustees throughout the course of the year, the following discussion relates to certain primary factors relevant to the Board’s decision. This discussion of the information and factors considered by the Board (including the information and factors discussed above) is not intended to be exhaustive, but rather summarizes certain factors considered by the Board. In view of the wide variety of factors considered, the Board did not, unless otherwise noted, find it practicable to quantify or otherwise assign relative weights to the foregoing factors. In addition, individual trustees may have assigned different weights to various factors.
NATURE, EXTENT AND QUALITY OF SERVICES. The trustees reviewed the nature, extent and quality of the services provided, and to be provided, by the investment manager. The trustees cited the investment manager’s ability to implement the Fund’s disciplined value investment approach and its long-term relationship with the Fund as reasons that shareholders choose to invest, and remain invested, in the Fund. The trustees reviewed the Fund’s portfolio management team, including its performance, staffing, skills and compensation program. With respect to portfolio manager compensation, management assured the trustees that the Fund’s long-term performance is a significant component of incentive-based compensation and noted that a portion of a portfolio manager’s incentive-based compensation is paid in shares of pre-designated funds from the portfolio manager’s fund management area. The trustees noted that the portfolio manager compensation program aligned the interests of the portfolio managers with that of shareholders of the Fund. The trustees discussed with management various other products, portfolios and entities that are advised by the investment manager and the allocation of assets and expenses among and within them, as well as their relative fees and reasons for differences with respect thereto and any potential
conflicts. During regular Board meetings and the aforementioned meetings of the independent trustees, the trustees received reports and presentations on the investment manager’s best execution trading policies. The trustees considered periodic reports provided to them showing that the investment manager complied with the investment policies and restrictions of the Fund as well as other reports periodically furnished to the Board covering matters such as the compliance of portfolio managers and other management personnel with the code of ethics covering the investment management personnel, the adherence to fair value pricing procedures established by the Board and the accuracy of net asset value calculations. The Board noted the extent of the benefits provided to Fund shareholders from being part of the Franklin Templeton group of funds, including the right to exchange investments between funds (same class) without a sales charge, the ability to reinvest Fund dividends into other funds and the right to combine holdings of other funds to obtain reduced sales charges. The Board considered the investment manager’s significant efforts in developing and implementing compliance procedures established in accordance with SEC and other requirements.
The Board considered the nature, extent and quality of the services to be provided under the Fund’s other service agreements to determine that, on an overall basis, Fund shareholders were well served. In this connection, the Board also took into account transfer agent and shareholder services provided to Fund shareholders by an affiliate of the investment manager, noting continuing expenditures by management to increase and improve the scope of such services and favorable periodic reports on shareholder services conducted by independent third parties. While such considerations directly affected the trustees’ decision in renewing the Fund’s transfer agent and shareholder services agreement, the Board also considered these commitments as incidental benefits to Fund shareholders deriving from the investment management relationship.
Based on their review, the trustees were satisfied with the nature and quality of the overall services provided, and to be provided, by the investment manager and its affiliates to the Fund and its shareholders and were confident in the abilities of the management team to continue the disciplined value investment approach of the Fund and to provide quality services to the Fund and its shareholders.
INVESTMENT PERFORMANCE. The trustees reviewed and placed significant emphasis on the investment performance of the Fund over the one-, three-, five- and 10-year periods
| 42 | Semiannual Report | franklintempleton.com |
FRANKLIN MUTUAL SERIES FUNDS
FRANKLIN MUTUAL GLOBAL DISCOVERY FUND
SHAREHOLDER INFORMATION
ended December 31, 2017. They considered the history of successful performance of the Fund relative to various benchmarks. As part of their review, they inquired of management regarding benchmarks, style drift and restrictions on permitted investments. Consideration was also given to performance in the context of available levels of cash during the periods.
The trustees had meetings during the year, including the meetings referred to above held in connection with the renewal process, with the Fund’s portfolio managers to discuss performance and the management of the Fund. In addition to the materials provided by management in connection with the renewal process, the independent trustees requested supplemental information and additional presentations from the investment manager and senior management of FTI regarding the performance of the investment manager and the Fund. As part of these presentations, it was noted that senior management of FTI is conducting a review of the investment manager and the Fund and will report the results thereof to the independent trustees when completed. In addition, particular attention in assessing performance was given to the Broadridge Section 15(c) Report. That report showed the investment performance of the Fund (Class A shares) in comparison to other funds determined comparable by Lipper.
The comparable funds to the Fund, as chosen by Lipper, included all retail and institutional global multi-cap value funds. The Fund had total returns in the lowest performing quintile for the one-year period ended December 31, 2017, and had annualized total returns for the three- and five-year periods in the lowest and middle performing quintiles, respectively. The trustees noted that the Fund’s total return on an annualized basis for the 10-year period ended December 31, 2017 was in the second-best performing quintile. The trustees discussed with management the reasons for the relative underperformance for the one- and three-year periods ended December 31, 2017. Taking into account such discussions and intending to continue to monitor future performance, the Board did not believe such comparative performance warranted any change in portfolio management, and concluded that the Fund had performed in an acceptable manner in the context of the Fund’s goal.
The trustees also compared Fund performance to other industry benchmarks, including measures of risk-adjusted performance of a fund, as part of their evaluation of investment performance. The trustees concluded that the Fund had continued to perform well in comparison to its various benchmarks and in the context of the Fund’s goal.
COMPARATIVE EXPENSES AND MANAGEMENT PROFITABILITY. The trustees considered the cost of the services provided and to be provided and the profits realized by the investment manager and its affiliates from their respective relationships with the Fund. As part of the renewal process, the trustees explored with management the trends in expense ratios over the past three fiscal years and the reasons for any increases in the Fund’s expense ratios (or components thereof). In considering the appropriateness of the management fee and other expenses charged to the Fund, the Board took into account various factors including investment performance and matters relating to Fund operations, including, but not limited to, the quality and experience of its portfolio managers and research staff. Consideration was also given to a comparative analysis in the Broadridge Section 15(c) Report of the investment management fee and total expense ratio of the Fund in comparison with those of a group of other funds selected by Lipper as its appropriate Lipper expense group. Lipper expense data is based upon information taken from each fund’s most recent annual report, which reflects historical asset levels that may be quite different from those currently existing, particularly in a period of market volatility. While recognizing such inherent limitation and the fact that expense ratios generally increase as assets decline and decrease as assets grow, the Board believed the independent analysis conducted by Lipper to be an appropriate measure of comparative expenses.
In reviewing comparative costs, emphasis was given to the Fund’s contractual management fee in comparison with the contractual management fee that would have been charged by other funds within its Lipper expense group assuming they were similar in size to the Fund, as well as the actual total expenses of the Fund in comparison with those of its Lipper expense group. The Lipper contractual management fee analysis includes administrative charges as being part of the management fee, and total expenses, for comparative consistency, are shown by Lipper for Fund Class A shares.
The Fund’s contractual management fee rate was in the second-most expensive quintile of its Lipper expense group and its total expenses were in the second-least expensive quintile of such group. The Board was satisfied with such comparative fees and expenses.
The trustees also reviewed the Profitability Study addressing profitability of Franklin Resources, Inc., from its overall U.S. fund business, as well as profitability to the Fund’s investment manager and its affiliates, from providing investment
| franklintempleton.com | Semiannual Report | 43 |
FRANKLIN MUTUAL SERIES FUNDS
FRANKLIN MUTUAL GLOBAL DISCOVERY FUND
SHAREHOLDER INFORMATION
management and other services to the Fund during the 12-month period ended September 30, 2017, the most recent fiscal year-end of Franklin Resources, Inc. The trustees reviewed the basis on which such reports are prepared and the cost allocation methodology utilized in the Profitability Study, it being recognized that allocation methodologies may each be reasonable while producing different results. In this respect, the Board noted that the reasonableness of the cost allocation methodologies was reviewed by independent accountants on an every other year basis.
The independent trustees met with management to discuss the Profitability Study. This included, among other things, a comparison of investment management income with investment management expenses of the Fund; comparison of underwriting revenues and expenses; the relative relationship of investment management and underwriting expenses; shareholder servicing profitability; economies of scale; and the relative contribution of the Fund to the profitability of the investment manager and its parent. In discussing the Profitability Study with the Board, the investment manager stated its belief that the costs incurred in establishing the infrastructure necessary to operate the type of mutual fund operations conducted by it and its affiliates may not be fully reflected in the expenses allocated to the Fund in determining its profitability.
The Board also took into account management’s expenditures in improving shareholder services provided to the Fund, as well as the need to meet additional regulatory and compliance requirements. The trustees also considered the extent to which the investment manager may derive ancillary benefits from Fund operations, including those derived from economies of scale, discussed below, the allocation of Fund brokerage and the use of commission dollars to pay for research and other similar services.
Based upon their consideration of all these factors, the trustees determined that the level of profits realized by the investment manager and its affiliates in providing services to the Fund was not excessive in view of the nature, quality and extent of services provided.
ECONOMIES OF SCALE. The Board considered economies of scale realized by the investment manager and its affiliates as the Fund grows larger and the extent to which they are shared with Fund shareholders, as for example, in the level of the investment management fee charged, in the quality and efficiency of services rendered and in increased capital commitments benefiting the Fund directly or indirectly. While recognizing that any precise determination is inherently
subjective, the trustees noted that, based upon the Profitability Study, as some funds increase in size, at some point economies of scale may result in the investment manager realizing a larger profit margin on investment management services provided to such a fund. The trustees also noted that benefits of economies of scale will be shared with Fund shareholders due to the decline in the effective investment management fee rate as breakpoints are achieved by the Fund.
The trustees noted that breakpoints had been instituted as part of the Fund’s investment management fee and that the Board regularly evaluates whether additional breakpoints are appropriate. The trustees assessed the savings to shareholders resulting from such breakpoints and believed they were, and continue to be, appropriate and they agreed to continue to monitor the appropriateness of the breakpoints. The trustees also considered the effects an increase in assets under management would have on the investment management fee and expense ratio of the Fund. To the extent further economies of scale may be realized by the investment manager and its affiliates, the Board believed the investment management and administrative fees provide a sharing of benefits with the Fund and its shareholders.
Proxy Voting Policies and Procedures
The Fund’s investment manager has established Proxy Voting Policies and Procedures (Policies) that the Fund uses to determine how to vote proxies relating to portfolio securities. Shareholders may view the Fund’s complete Policies online at franklintempleton.com. Alternatively, shareholders may request copies of the Policies free of charge by calling the Proxy Group collect at (954) 527-7678 or by sending a written request to: Franklin Templeton Companies, LLC, 300 S.E. 2nd Street, Fort Lauderdale, FL 33301, Attention: Proxy Group. Copies of the Fund’s proxy voting records are also made available online at franklintempleton.com and posted on the US Securities and Exchange Commission’s website at sec.gov and reflect the most recent 12-month period ended June 30.
Quarterly Statement of Investments
The Trust, on behalf of the Fund, files a complete statement of investments with the US Securities and Exchange Commission for the first and third quarters for each fiscal year on Form N-Q. Shareholders may view the filed Form N-Q by visiting the Commission’s website at sec.gov. The filed form may also be viewed and copied at the Commission’s Public Reference Room in Washington, DC. Information regarding the
| 44 | Semiannual Report | franklintempleton.com |
FRANKLIN MUTUAL SERIES FUNDS
FRANKLIN MUTUAL GLOBAL DISCOVERY FUND
SHAREHOLDER INFORMATION
operations of the Public Reference Room may be obtained by calling (800) SEC-0330.
| franklintempleton.com | Semiannual Report | 45 |
This page intentionally left blank.
This page intentionally left blank.
This page intentionally left blank.
| Semiannual Report and Shareholder Letter Franklin Mutual Global Discovery Fund
| |||
Investment Manager Franklin Mutual Advisers, LLC
| ||||
| Distributor | ||||
Franklin Templeton Distributors, Inc. (800) DIAL BEN® / 342-5236 franklintempleton.com
| ||||
Shareholder Services (800) 632-2301 - (Class A, C, R & R6) (800) 448-FUND - (Class Z) |
Authorized for distribution only when accompanied or preceded by a summary prospectus and/or prospectus. Investors should carefully consider a fund’s investment goals, risks, charges and expenses before investing. A prospectus contains this and other information; please read it carefully before investing.
To help ensure we provide you with quality service, all calls to and from our service areas are monitored and/or recorded.
| © 2018 Franklin Templeton Investments. All rights reserved. | 477 S 08/18 |
Franklin Templeton Investments
Why choose Franklin Templeton Investments?
Successful investing begins with ambition. And achievement only comes when you reach for it. That’s why we continually strive to deliver better outcomes for investors. No matter what your goals are, our deep, global investment expertise allows us to offer solutions that can help.
During our more than 70 years of experience, we’ve managed through all kinds of markets—up, down and those in between. We’re always preparing for what may come next. It’s because of this, combined with our strength as one of the world’s largest asset managers that we’ve earned the trust of millions of investors around the world.
Dear Franklin Mutual European Fund Shareholder:
Securities markets started 2018 with positive momentum. Investors began the year focused on global economic growth, strong corporate profits across most developed markets and the potential benefits of US corporate and personal tax cuts. However, volatility and market downturns emerged due to political risks and trade tariffs, a temporary deceleration in developed market economic activity during the first quarter, and higher bond yields amid potential signs of increasing inflation pressures and likely interest rate hikes. Although some risks faded, such as the first-quarter deceleration in economic growth, the potential for an escalating trade war between the US and its trading partners remained a meaningful uncertainty for investors. For the period ended June 30, 2018, European stocks, as measured by the MSCI Europe Index (EURO), were flat with a -0.48% return for the six-month period.1 Similarly, other developed markets globally, as measured by the MSCI World Index (USD), returned +0.76%, and investment-grade bonds, as measured by the Bloomberg Barclays Global Aggregate Bond Index, had a -1.46% total return.1
During the period, European growth stocks, as measured by the MSCI Europe Growth Index, returned +1.30% and European value stocks, as measured by the MSCI Europe Value Index, declined 1.48%.1 We do not know how long growth will continue to outpace value, but historically, periods of solid and steady economic growth have been a positive backdrop for value stocks. Low unemployment rates, increased business investment and solid consumer spending are all constructive
signs for such a pace of economic growth. The European Central Bank’s efforts to gradually reduce its bond buying program should eventually, in our view, lead to rising interest rates.
Value investing often requires an investor to be contrarian in nature. We continue to maintain a bottom-up stock-picking process that is disciplined, driven by rigorous fundamental analysis and attempts to limit downside risk. In our view, investing in underappreciated and misunderstood companies with identifiable catalysts for unlocking shareholder value can offer meaningful upside potential and a degree of downside protection in periods of financial market turbulence.
Although economic and investment fundamentals still appear to be favorable, the return of volatility is another reminder that securities markets are dynamic. As we enter into the second half of 2018, market sentiment may easily turn again given the uncertainty regarding an escalation in trade tensions, the upcoming US midterm elections, Brexit, the ability of US tax cuts to prolong the current economic expansion, and the pace of inflation. Therefore, we believe active, professional investment management serves investors well.
We also recognize the important role of financial advisors in today’s markets and encourage investors to continue to seek their advice. Amid changing markets and economic conditions, we are confident investors with a well-diversified portfolio and
1. Source: Morningstar.
See www.franklintempletondatasources.com for additional data provider information.
| Not FDIC Insured | | | May Lose Value | | | No Bank Guarantee |
| franklintempleton.com | Not part of the semiannual report | 1 |
a patient, long-term outlook should be well positioned for the years ahead.
On the following pages, the Fund’s portfolio management team reviews investment decisions that pertain to performance during the past six months in light of the economic environment and other factors. Please remember all securities markets fluctuate, as do mutual fund share prices.
We thank you for investing with Franklin Templeton, welcome your questions and comments, and look forward to continuing to serve your investment needs in the years ahead.
Sincerely,

Peter A. Langerman
Chairman, President and Chief Executive Officer
Franklin Mutual Advisers, LLC
This letter reflects our analysis and opinions as of June 30, 2018, unless otherwise indicated. The information is not a complete analysis of every aspect of any market, country, industry, security or fund. Statements of fact are from sources considered reliable.
Contents
Semiannual Report
| Franklin Mutual European Fund | 3 | |||
| Performance Summary | 8 | |||
| Your Fund’s Expenses | �� | 10 | ||
| Financial Highlights and Statement of Investments | 11 | |||
| Financial Statements | 21 | |||
| Notes to Financial Statements | 25 | |||
Shareholder Information
|
| 37
|
| |
Visit franklintempleton.com for fund updates, to access your account, or to find helpful financial planning tools.
| 2 | Not part of the semiannual report | franklintempleton.com |
Semiannual Report
Franklin Mutual European Fund
This semiannual report for Franklin Mutual European Fund covers the period ended June 30, 2018.
Your Fund’s Goal and Main Investments
The Fund seeks capital appreciation, which may occasionally be short term, with income as a secondary goal, by investing at least 80% of its net assets in securities of European companies that the investment manager believes are available at market prices less than their intrinsic value. The equity securities in which the Fund invests are primarily common stock, with a focus on mid- and large cap companies. To a lesser extent, the Fund also invests in merger arbitrage securities and the debt and equity of distressed companies. The Geographic Composition bar chart on this page lists the leading European countries where the Fund invests.
Performance Overview
The Fund’s Class Z shares had a -1.67% cumulative total return for the six months ended June 30, 2018. For comparison, the Fund’s benchmark, the MSCI Europe Index, which tracks equity performance in Europe’s developed markets, had a -0.45% total return in local currency terms.1 Also for comparison, the MSCI Europe Index had a -2.71% total return in US dollar terms.1 You can find more of the Fund’s performance data in the Performance Summary beginning on page 8.
Performance data represent past performance, which does not guarantee future results. Investment return and principal value will fluctuate, and you may have a gain or loss when you sell your shares. Current performance may differ from figures shown. For most recent month-end performance, go to franklintempleton.com or call (800) 342-5236.
Economic and Market Overview
The global economy expanded during the six-month period under review amid generally upbeat economic data across regions. In this environment, global developed and emerging market stocks reached a new all-time high in January 2018, as measured by the MSCI All Country World Index (ACWI).
Geographic Composition*
Based on Total Net Assets as of 6/30/18
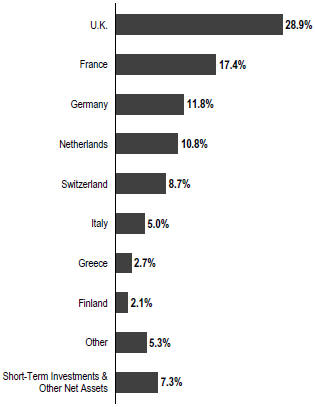
*Figures are stated as a percentage of total and may not equal 100% or may be negative due to rounding, use of any derivatives, unsettled trades or other factors.
During the period, global markets were aided by price gains in oil and other commodities, encouraging corporate earnings reports and investor optimism about global economic growth. However, global stocks had a -0.13% total return for the six-month period, as measured by the MSCI ACWI, largely due to an overall decline in emerging market stocks.1
Global markets reflected investor concerns about tensions in the Korean peninsula and political uncertainties in the US and the European Union, as well as worries that strong economic growth and rising inflation in some parts of the world, particularly in the US, would lead central banks to increase interest rates sooner than expected. Markets were further
1. Source: Morningstar.
The index is unmanaged and includes reinvestment of any income or distributions. It does not reflect any fees, expenses or sales charges. One cannot invest directly in an index, and an index is not representative of the Fund’s portfolio.
The dollar value, number of shares or principal amount, and names of all portfolio holdings are listed in the Fund’s Statement of Investments (SOI). The SOI begins on page 16.
| franklintempleton.com | Semiannual Report | 3 |
FRANKLIN MUTUAL EUROPEAN FUND
pressured by the Trump administration’s protectionist trade policies, uncertainty surrounding the US-China trade relationship, and a broad sell-off in information technology stocks in March due to a potential for tighter regulation in the sector arising from concerns about consumer data privacy. Near period-end, an overall easing of tensions in the Korean peninsula relieved investors, but ongoing US trade disputes with its allies and China hindered global markets.
In Europe, the UK’s quarterly economic growth moderated in 2018’s first quarter amid a decline in construction output. The Bank of England kept its key policy rate unchanged during the period. The eurozone’s quarterly growth moderated in 2018’s first quarter due to a decline in external demand. The bloc’s annual inflation rate ended the period higher than in December 2017. The European Central Bank (ECB) kept its benchmark interest rate unchanged during the period. However, at its June meeting, the ECB announced it would further reduce its monthly bond purchases beginning in October 2018 and indicated it would conclude the program at the end of 2018 while continuing to keep interest rates unchanged through at least the summer of 2019.
Investment Strategy
We follow a distinctive value investment approach that combines investments in what we believe are undervalued common stocks with distressed debt investing and risk arbitrage. Our style aims to provide our shareholders with superior risk-adjusted results over time. We employ rigorous, fundamental analysis to find compelling situations. In our opinion, successful investing is as much about assessing risk and containing losses as it is about achieving profits. In choosing investments, we look at the market price of an individual company’s securities relative to our evaluation of its intrinsic value based on factors including book value, cash flow generation, long-term earnings potential and earnings multiples. We may invest in bankrupt or distressed companies if we believe the market overreacted to adverse developments or failed to appreciate positive changes. In addition, it is our practice to hedge the Fund’s currency exposure when we deem it advantageous for our shareholders.
What is meant by “hedge”?
To hedge an investment is to take a position intended to offset potential losses/gains that may be incurred by a companion financial instrument. |
| Top 10 Sectors/Industries | ||||
| Based on Equity Securities as of 6/30/18 | ||||
| % of Total Net Assets | ||||
| Insurance | 13.1% | |||
| Oil, Gas & Consumable Fuels | 10.0% | |||
| Banks | 9.6% | |||
| Pharmaceuticals | 7.0% | |||
| Automobiles | 5.8% | |||
| Diversified Telecommunication Services | 5.2% | |||
| Construction Materials | 4.4% | |||
| Trading Companies & Distributors | 4.0% | |||
| Health Care Equipment & Supplies | 3.8% | |||
| Electric Utilities | 3.4% | |||
Manager’s Discussion
In the first half of 2018, positive corporate fundamentals were overshadowed by political and economic concerns. Corporate profits in European and other developed markets continued their impressive year-over-year pace of growth. In Europe and other developed markets, economic activity moderated during the first quarter, but appeared to have recovered during the second quarter. Financial markets were also aided by improved industrial commodity prices, most notably crude oil. Nonetheless, investor sentiment became less upbeat and volatility returned to financial markets, after an historically calm 2017. The Top 10 Sectors/Industries table on this page lists insurance; oil, gas and consumable fuels; and also other leading industries in which the Fund currently invests.
As investors entered 2018, European equity markets continued to trade at a discount to US equity markets on many metrics, including price-to-earnings and price-to-cash flow, while continuing to offer dividend yields in excess of both the US stock market dividend yields and bond yields generally. The rise in volatility provided us with select opportunities to initiate or add to positions in companies that we believed were trading at undeservedly discounted prices.
A further escalation of trade-related rhetoric and tariffs, in our view, could have important consequences for European companies. We have already begun to see disruptions to global supply chains and added pressure on China’s financial and credit markets. Additional tariffs imposed by the US and its trading partners could rattle business confidence, curb corporate earnings growth, undermine favorable fundamentals in specific industries, provoke further financial market volatility and raise uncertainty regarding the solid pace of global growth.
| 4 | Semiannual Report | franklintempleton.com |
FRANKLIN MUTUAL EUROPEAN FUND
In addition to trade tensions, we are paying close attention to Brexit negotiations, Italy’s new populist government, and a potentially fraying relationship between Germany’s two conservative parties. As of period-end, we still believe Europe’s economic recovery is fairly resilient, but any of the aforementioned challenges has the potential to fuel volatility and even slow economic growth.
In May 2019 Europe is expected to hold elections for the European Parliament. Historically the elections have had little impact on equity markets. However, with the rise in populist rhetoric in Europe, we believe these elections could be more significant, as they occur fairly close to March 30, 2019, the UK’s departure date from the European Union.
Mergers and acquisitions (M&A) have remained active. The market also saw the development of a bidding war between Walt Disney2 and Comcast2 for control of Twenty-First Century Fox2 and Sky2. As the year began, Disney had a deal to buy Fox and Fox had an offer pending to acquire the 61% of Sky it did not own. Comcast subsequently launched bids for both companies, and when Fox raised its bid for Sky, Comcast promptly raised its bid to a higher level. Comcast has indicated it will not bid further for Fox and, while Fox could raise its bid for Sky, it appears most likely that Comcast will purchase Sky. This bidding war showed the ongoing uncertainty in media, in which major media firms believe they need even more scale to compete with internet rivals that are experiencing significant growth. We expect ongoing activity in M&A markets and, with the increased regulatory clarity provided by the recent US court ruling in favor of AT&T’s2 acquisition of Time Warner2, further opportunities in merger arbitrage.
Finding mispriced risk in credit markets remains difficult as we have seen few large corporate bankruptcies in Europe and with the continued low interest rate environment, we do not anticipate this will change in the near future.
Fund Performance
Turning to Fund performance, top contributors included Netherlands-based Koninklijke Philips, Finland-based global communications and information technology company Nokia and UK-based oil and gas exploration and production company BP. Koninklijke Philips and BP are listed among the Fund’s largest positions in the Top 10 Equity Holdings table on this page.
| Top 10 Equity Holdings | ||||
6/30/18
| ||||
Company Sector/Industry, Country | % of Total Net Assets | |||
| Koninklijke Philips NV Health Care Equipment & Supplies, Netherlands | 3.8% | |||
| Royal Dutch Shell PLC Oil, Gas & Consumable Fuels, U.K. | 3.8% | |||
| Enel SpA Electric Utilities, Italy | 3.4% | |||
| BP PLC Oil, Gas & Consumable Fuels, U.K. | 3.3% | |||
| Novartis AG Pharmaceuticals, Switzerland | 3.3% | |||
| Accor SA Hotels, Restaurants & Leisure, France | 3.3% | |||
| RSA Insurance Group PLC Insurance, U.K. | 3.0% | |||
| Volkswagen AG Automobiles, Germany | 2.9% | |||
| LafargeHolcim Ltd. Construction Materials, Switzerland | 2.9% | |||
| Vodafone Group PLC Wireless Telecommunication Services, U.K. | 2.9% | |||
Koninklijke Philips is near the end of its restructuring efforts. In line with our initial investment thesis, the company has almost fully pivoted its business model from being an industrial conglomerate to becoming a focused health care technology company. In April, Philips reported better-than-expected results, particularly strong order growth overall and sales growth within its diagnostics and treatment business. Recent positive results have increased our confidence in management’s ability to deliver on its long-term strategy and targets.
Nokia announced solid fourth-quarter and full-year 2017 results in February 2018, particularly better-than-expected profits for 2017 and significant improvement in cash flow. Management also issued a new earnings target for 2020 that was higher than many investors had anticipated. Subsequent quarterly results issued in April 2018 were weaker than expected, but management emphasized the company’s strong levels of new and existing orders and indicated that sales for full-year 2018 could exceed its previous guidance. We believe Nokia is serious about cutting costs and improving cash flow following its acquisition of Alcatel in 2016 to increase its dividend in 2018 and stay on course to reach its 2020 earnings target.
2. Not a Fund holding.
See www.franklintempletondatasources.com for additional data provider information.
| franklintempleton.com | Semiannual Report | 5 |
FRANKLIN MUTUAL EUROPEAN FUND
Shares of BP were supported by rising crude oil prices and continued solid operating results. BP’s results have been positive across the board, reflecting strong cost control and very strong operational and project delivery performance, resulting in increased oil and gas production and further improvements to its balance sheet. BP also stated that a dividend hike will be discussed by the company’s board later this year.
During the period under review, Fund investments that detracted from performance included UK-based global mobile telecommunications company Vodafone Group, Netherlands-based cable operator KPN and France-based electrical equipment distributor Rexel.
In May 2018, Vodafone Group reported better-than-expected fiscal year-end results, but the outlook for fiscal year 2019 was below expectations with much of the growth forecast to come in the latter part of the year. In addition, Vodafone chief executive officer (CEO) Vittorio Colao announced his intention to retire in October 2018. The CEO’s decision was not a total surprise given his decade long tenure, but the timing was unexpected given Vodafone’s purchase of certain Liberty Global2 assets that is still being reviewed by government regulators. We believe that Vodafone will receive regulatory approval. In addition, the naming of Nick Read, the current chief financial officer (CFO), as the new CEO, and promoting the deputy CFO, signal the board’s focus on operating performance after a period of addressing the major strategic issues facing the company.
Multiple factors hurt shares of KPN during the period. Quarterly earnings reported in January were in line with expectations, but the outlook for another year of flat earnings in 2018 was disappointing. In February, the Authority of Consumers and Markets (ACM), a Dutch regulator, proposed new rules for cable operators. The proposal would not change KPN’s current regulatory framework, but could reduce its wholesale revenues. Although the ACM’s proposal is disappointing and the EU has recently softened its opposition to cable regulation, the impact of the proposals would likely be modest as cable’s wholesale access rates are unlikely to be more attractive than KPN’s existing rates. We continue to hold a favorable view of KPN. Free cash flow growth has been strong, and we have begun to see a recovery in the business-to-business segment, which had been a drag on revenues and earnings.
Rexel is a distributor of low voltage electrical equipment headquartered in Paris. In April, shares of Rexel dropped in response to slightly weaker-than-expected quarterly revenue
and earnings results, although free cash flow showed significant improvement. In our view, the results were negatively affected by investments in digital technology and workers, unfavorable weather and fewer working days, and a change in how the company accounts for bonus payments. We believe the positive catalysts for Rexel remain in place as its reorganization efforts and branch openings in the US are starting to produce positive results and the market environment in Europe continues to improve.
During the period, the Fund held currency forwards and futures seeking to hedge most of the currency risk of the portfolio’s non-US dollar investments. The hedges had a positive overall impact on the Fund’s performance because of the appreciation of the US dollar versus the hedged currencies.
What is a currency forward?
A currency forward is a direct agreement between the Fund and a counterparty to buy or sell a foreign currency in exchange for another currency at a specific exchange rate on a future date.
|
What is a future?
A future is an agreement between the Fund and a counterparty made through a US or foreign futures exchange to buy or sell an underlying instrument or asset at a specific price on a future date.
|
As fellow shareholders, we found recent relative and absolute performance disappointing, but it is not uncommon for our strategy to lag the equity markets at times. We remain committed to our disciplined, value investment approach as we seek to generate attractive, long-term, risk-adjusted returns for shareholders.
Thank you for your participation in Franklin Mutual European Fund. We look forward to continuing to serve your investment needs.
| 6 | Semiannual Report | franklintempleton.com |
FRANKLIN MUTUAL EUROPEAN FUND
 |
Katrina Dudley, CFA Co-Portfolio Manager | |
 |
Mandana Hormozi Co-Portfolio Manager |


The foregoing information reflects our analysis, opinions and portfolio holdings as of June 30, 2018, the end of the reporting period. The way we implement our main investment strategies and the resulting portfolio holdings may change depending on factors such as market and economic conditions. These opinions may not be relied upon as investment advice or an offer for a particular security. The information is not a complete analysis of every aspect of any market, country, industry, security or the Fund. Statements of fact are from sources considered reliable, but the investment manager makes no representation or warranty as to their completeness or accuracy. Although historical performance is no guarantee of future results, these insights may help you understand our investment management philosophy.
CFA® is a trademark owned by CFA Institute.
Katrina Dudley has been co-portfolio manager for Franklin Mutual European Fund since 2010 and was assistant portfolio manager since 2007. She follows industrial companies (foreign and domestic) including transportation, manufacturers, machinery, electrical equipment and general industrial. Prior to joining Franklin Templeton Investments in 2002, Ms. Dudley was an investment analyst at Federated Investors, Inc., responsible for the technology and health care sectors. From 1995 to 2001, Ms. Dudley was a senior manager in the corporate finance division of Ernst & Young LLP, where she specialized in valuation and litigation consulting.
Mandana Hormozi has been a co-portfolio manager for Franklin Mutual European Fund since January 2018. She has been an analyst for Franklin Mutual Advisers since 2003, when she joined Franklin Templeton Investments. Previously, she was a senior vice president in the equity research department at Lazard Freres. Also, she was an economic research analyst at Mitsubishi Bank.
| franklintempleton.com | Semiannual Report | 7 |
FRANKLIN MUTUAL EUROPEAN FUND
Performance Summary as of June 30, 2018
The performance table does not reflect any taxes that a shareholder would pay on Fund dividends, capital gain distributions, if any, or any realized gains on the sale of Fund shares. Total return reflects reinvestment of the Fund’s dividends and capital gain distributions, if any, and any unrealized gains or losses. Your dividend income will vary depending on dividends or interest paid by securities in the Fund’s portfolio, adjusted for operating expenses of each class. Capital gain distributions are net profits realized from the sale of portfolio securities.
Performance as of 6/30/18
Cumulative total return excludes sales charges. Average annual total return includes maximum sales charges. Sales charges will vary depending on the size of the investment and the class of share purchased. The maximum is 5.75% and the minimum is 0%. Class A: 5.75% maximum initial sales charge. For other share classes, visit franklintempleton.com.
| Share Class | | Cumulative Total Return | 1 | | Average Annual Total Return | 2 | ||
Z | ||||||||
6-Month | -1.67% | -1.67% | ||||||
1-Year | +1.32% | +1.32% | ||||||
5-Year | +28.23% | +5.10% | ||||||
10-Year | +54.33% | +4.43% | ||||||
A | ||||||||
6-Month | -1.77% | -7.42% | ||||||
1-Year | +1.09% | -4.73% | ||||||
5-Year | +26.48% | +3.58% | ||||||
10-Year | +49.96% | +3.52% | ||||||
Performance data represent past performance, which does not guarantee future results. Investment return and principal value will fluctuate, and you may have a gain or loss when you sell your shares. Current performance may differ from figures shown. For most recent month-end performance, go to franklintempleton.com or call (800) 342-5236.
See page 9 for Performance Summary footnotes.
| 8 | Semiannual Report | franklintempleton.com |
FRANKLIN MUTUAL EUROPEAN FUND
PERFORMANCE SUMMARY
| Total Annual Operating Expenses3 | ||||
| Share Class | ||||
Z | 1.04% | |||
A | 1.29% | |||
Each class of shares is available to certain eligible investors and has different annual fees and expenses, as described in the prospectus.
All investments involve risks, including possible loss of principal. Value securities may not increase in price as anticipated or may decline further in value. Special risks are associated with foreign investing, including currency fluctuations, economic instability and political developments. Because the Fund may invest its assets in companies in a specific region, including Europe, it is subject to greater risks of adverse developments in that region and/or the surrounding regions than a fund that is more broadly diversified geographically. Current political and financial uncertainty surrounding the European Union may increase market volatility and the economic risk of investing in companies in Europe. The Fund’s investments in smaller company stocks carry an increased risk of price fluctuation, especially over the short term. The Fund’s investments in companies engaged in mergers, reorganizations or liquidations also involve special risks as pending deals may not be completed on time or on favorable terms. The Fund is actively managed but there is no guarantee that the manager’s investment decisions will produce the desired results. The Fund’s prospectus also includes a description of the main investment risks.
1. Cumulative total return represents the change in value of an investment over the periods indicated.
2. Average annual total return represents the average annual change in value of an investment over the periods indicated. Return for less than one year, if any, has not been annualized.
3. Figures are as stated in the Fund’s current prospectus and may differ from the expense ratios disclosed in the Your Fund’s Expenses and Financial Highlights sections in this report. In periods of market volatility, assets may decline significantly, causing total annual Fund operating expenses to become higher than the figures shown.
| franklintempleton.com | Semiannual Report | 9 |
FRANKLIN MUTUAL EUROPEAN FUND
Your Fund’s Expenses
As a Fund shareholder, you can incur two types of costs: (1) transaction costs, including sales charges (loads) on Fund purchases and redemptions; and (2) ongoing Fund costs, including management fees, distribution and service (12b-1) fees, and other Fund expenses. All mutual funds have ongoing costs, sometimes referred to as operating expenses. The table below shows ongoing costs of investing in the Fund and can help you understand these costs and compare them with those of other mutual funds. The table assumes a $1,000 investment held for the six months indicated.
Actual Fund Expenses
The table below provides information about actual account values and actual expenses in the columns under the heading “Actual.” In these columns the Fund’s actual return, which includes the effect of Fund expenses, is used to calculate the “Ending Account Value” for each class of shares. You can estimate the expenses you paid during the period by following these steps (of course, your account value and expenses will differ from those in this illustration): Divide your account value by $1,000 (if your account had an $8,600 value, then $8,600 ÷ $1,000 = 8.6). Then multiply the result by the number in the row for your class of shares under the headings “Actual” and “Expenses Paid During Period” (if Actual Expenses Paid During Period were $7.50, then 8.6 x $7.50 = $64.50). In this illustration, the actual expenses paid this period are $64.50.
Hypothetical Example for Comparison with Other Funds
Under the heading “Hypothetical” in the table, information is provided about hypothetical account values and hypothetical expenses based on the Fund’s actual expense ratio and an assumed rate of return of 5% per year before expenses, which is not the Fund’s actual return. This information may not be used to estimate the actual ending account balance or expenses you paid for the period, but it can help you compare ongoing costs of investing in the Fund with those of other funds. To do so, compare this 5% hypothetical example for the class of shares you hold with the 5% hypothetical examples that appear in the shareholder reports of other funds.
Please note that expenses shown in the table are meant to highlight ongoing costs and do not reflect any transactional costs. Therefore, information under the heading “Hypothetical” is useful in comparing ongoing costs only, and will not help you compare total costs of owning different funds. In addition, if transactional costs were included, your total costs would have been higher.
Actual (actual return after expenses) | Hypothetical (5% annual return before expenses) | |||||||||||||||||
Share Class | Beginning Account Value 1/1/18 | Ending Account Value 6/30/18 | Expenses 1/1/18–6/30/181,2 | Ending Account Value 6/30/18 | Expenses Paid During 1/1/18–6/30/181,2 | Net Annualized Expense Ratio2 | ||||||||||||
Z | $1,000 | $983.30 | $5.07 | $1,019.69 | $5.16 | 1.03% | ||||||||||||
A | $1,000 | $982.30 | $6.29 | $1,018.45 | $6.41 | 1.28% | ||||||||||||
C | $1,000 | $978.40 | $9.96 | $1,014.73 | $10.14 | 2.03% | ||||||||||||
R | $1,000 | $981.00 | $7.52 | $1,017.21 | $7.65 | 1.53% | ||||||||||||
R6 | $1,000 | $984.20 | $4.48 | $1,020.28 | $4.56 | 0.91% | ||||||||||||
1. Expenses are equal to the annualized expense ratio for the six-month period as indicated above—in the far right column—multiplied by the simple average account value over the period indicated, and then multiplied by 181/365 to reflect the one-half year period.
2. Reflects expenses after fee waivers and expense reimbursements. Does not include acquired fund fees and expenses.
| 10 | Semiannual Report | franklintempleton.com |
FRANKLIN MUTUAL EUROPEAN FUND
Financial Highlights
Six Months Ended (unaudited) | Year Ended December 31, | |||||||||||||||||||||||
| 2017 | 2016 | 2015 | 2014 | 2013 | ||||||||||||||||||||
| Class Z | ||||||||||||||||||||||||
| Per share operating performance (for a share outstanding throughout the period) | ||||||||||||||||||||||||
Net asset value, beginning of period | $20.93 | $19.20 | $19.48 | $20.86 | $24.76 | $21.13 | ||||||||||||||||||
|
| |||||||||||||||||||||||
| Income from investment operationsa: | ||||||||||||||||||||||||
Net investment incomeb | 0.40 | 0.35 | 0.63 | c | 0.42 | 0.73 | d | 0.49 | ||||||||||||||||
Net realized and unrealized gains (losses) | (0.75 | ) | 1.65 | (0.17 | ) | (0.27 | ) | (1.73 | ) | 5.12 | ||||||||||||||
|
| |||||||||||||||||||||||
Total from investment operations | (0.35 | ) | 2.00 | 0.46 | 0.15 | (1.00 | ) | 5.61 | ||||||||||||||||
|
| |||||||||||||||||||||||
| Less distributions from: | ||||||||||||||||||||||||
Net investment income | — | (0.27 | ) | (0.47 | ) | (0.46 | ) | (0.67 | ) | (0.46 | ) | |||||||||||||
Net realized gains | — | — | (0.27 | ) | (1.07 | ) | (2.23 | ) | (1.52 | ) | ||||||||||||||
|
| |||||||||||||||||||||||
Total distributions | — | (0.27 | ) | (0.74 | ) | (1.53 | ) | (2.90 | ) | (1.98 | ) | |||||||||||||
|
| |||||||||||||||||||||||
Net asset value, end of period | $20.58 | $20.93 | $19.20 | $19.48 | $20.86 | $24.76 | ||||||||||||||||||
|
| |||||||||||||||||||||||
Total returne | (1.67)% | 10.45% | 2.40% | 0.82% | (4.00)% | 26.68% | ||||||||||||||||||
| Ratios to average net assetsf | ||||||||||||||||||||||||
Expensesg | 1.03% | h | 1.04% | h | 1.06% | h,i | 1.05% | 1.04% | h | 1.07% | h | |||||||||||||
Expenses incurred in connection with securities sold short | —% | —% | —% | —% | j | 0.01% | —% | j | ||||||||||||||||
Net investment income | 3.77% | k | 1.75% | 3.42% | c | 1.93% | 2.93% | d | 2.04% | |||||||||||||||
| Supplemental data | ||||||||||||||||||||||||
Net assets, end of period (000’s) | $1,222,875 | $1,328,622 | $1,175,972 | $1,355,780 | $1,128,769 | $1,399,294 | ||||||||||||||||||
Portfolio turnover rate | 15.90% | 17.33% | 16.43% | 32.59% | 54.05% | 39.05% | ||||||||||||||||||
aThe amount shown for a share outstanding throughout the period may not correlate with the Statement of Operations for the period due to the timing of sales and repurchases of the Fund’s shares in relation to income earned and/or fluctuating fair value of the investments of the Fund.
bBased on average daily shares outstanding.
cNet investment income per share includes approximately $0.17 per share related to a nonrecurring distribution. The amount, although initially recorded as dividend income, is subject to recharacterization once the issuer provides information regarding the actual composition of the distribution. Excluding this amount, the ratio of net investment income to average net assets would have been 2.50%.
dNet investment income per share includes approximately $0.29 per share related to income received in the form of a special dividend in connection with certain Fund holdings. Excluding this amount, the ratio of net investment income to average net assets would have been 1.74%.
eTotal return is not annualized for periods less than one year.
fRatios are annualized for periods less than one year.
gIncludes dividend and/or interest expense on securities sold short and security borrowing fees, if any. See below for the ratios of such expenses to average net assets for the periods presented. See Note 1(d).
hBenefit of expense reduction rounds to less than 0.01%.
iBenefit of waiver and payments by affiliates rounds to less than 0.01%.
jRounds to less than 0.01%.
kThe net investment income ratio is annualized and may not be indicative of operating results for a full year.
| franklintempleton.com | The accompanying notes are an integral part of these financial statements. | Semiannual Report | 11 |
FRANKLIN MUTUAL EUROPEAN FUND
FINANCIAL HIGHLIGHTS
Six Months Ended (unaudited) | Year Ended December 31, | |||||||||||||||||||||||
| 2017 | 2016 | 2015 | 2014 | 2013 | ||||||||||||||||||||
| Class A | ||||||||||||||||||||||||
| Per share operating performance (for a share outstanding throughout the period) | ||||||||||||||||||||||||
Net asset value, beginning of period | $20.33 | $18.66 | $18.95 | $20.33 | $24.21 | $20.71 | ||||||||||||||||||
|
| |||||||||||||||||||||||
| Income from investment operationsa: | ||||||||||||||||||||||||
Net investment incomeb | 0.36 | 0.31 | 0.57 | c | 0.35 | 0.61 | d | 0.42 | ||||||||||||||||
Net realized and unrealized gains (losses) | (0.72 | ) | 1.58 | (0.18 | ) | (0.26 | ) | (1.66 | ) | 4.99 | ||||||||||||||
|
| |||||||||||||||||||||||
Total from investment operations | (0.36 | ) | 1.89 | 0.39 | 0.09 | (1.05 | ) | 5.41 | ||||||||||||||||
|
| |||||||||||||||||||||||
| Less distributions from: | ||||||||||||||||||||||||
Net investment income | — | (0.22 | ) | (0.41 | ) | (0.40 | ) | (0.60 | ) | (0.39 | ) | |||||||||||||
Net realized gains | — | — | (0.27 | ) | (1.07 | ) | (2.23 | ) | (1.52 | ) | ||||||||||||||
|
| |||||||||||||||||||||||
Total distributions | — | (0.22 | ) | (0.68 | ) | (1.47 | ) | (2.83 | ) | (1.91 | ) | |||||||||||||
|
| |||||||||||||||||||||||
Net asset value, end of period | $19.97 | $20.33 | $18.66 | $18.95 | $20.33 | $24.21 | ||||||||||||||||||
|
| |||||||||||||||||||||||
Total returne | (1.77)% | 10.14% | 2.12% | 0.57% | (4.31)% | 26.30% | ||||||||||||||||||
| Ratios to average net assetsf | ||||||||||||||||||||||||
Expensesg | 1.28% | h | 1.29% | h | 1.31% | h,i | 1.33% | 1.34% | h | 1.37% | h | |||||||||||||
Expenses incurred in connection with securities sold short | —% | —% | —% | —% | j | 0.01% | —% | j | ||||||||||||||||
Net investment income | 3.52% | k | 1.50% | 3.17% | c | 1.65% | 2.63% | d | 1.74% | |||||||||||||||
| Supplemental data | ||||||||||||||||||||||||
Net assets, end of period (000’s) | $659,965 | $714,915 | $769,297 | $1,033,307 | $843,836 | $839,655 | ||||||||||||||||||
Portfolio turnover rate | 15.90% | 17.33% | 16.43% | 32.59% | 54.05% | 39.05% | ||||||||||||||||||
aThe amount shown for a share outstanding throughout the period may not correlate with the Statement of Operations for the period due to the timing of sales and repurchases of the Fund’s shares in relation to income earned and/or fluctuating fair value of the investments of the Fund.
bBased on average daily shares outstanding.
cNet investment income per share includes approximately $0.17 per share related to a nonrecurring distribution. The amount, although initially recorded as dividend income, is subject to recharacterization once the issuer provides information regarding the actual composition of the distribution. Excluding this amount, the ratio of net investment income to average net assets would have been 2.25%.
dNet investment income per share includes approximately $0.29 per share related to income received in the form of a special dividend in connection with certain Fund holdings. Excluding this amount, the ratio of net investment income to average net assets would have been 1.44%.
eTotal return does not reflect sales commissions or contingent deferred sales charges, if applicable, and is not annualized for periods less than one year.
fRatios are annualized for periods less than one year.
gIncludes dividend and/or interest expense on securities sold short and security borrowing fees, if any. See below for the ratios of such expenses to average net assets for the periods presented. See Note 1(d).
hBenefit of expense reduction rounds to less than 0.01%.
iBenefit of waiver and payments by affiliates rounds to less than 0.01%.
jRounds to less than 0.01%.
kThe net investment income ratio is annualized and may not be indicative of operating results for a full year.
| 12 | Semiannual Report | The accompanying notes are an integral part of these financial statements. | franklintempleton.com |
FRANKLIN MUTUAL EUROPEAN FUND
FINANCIAL HIGHLIGHTS
Six Months Ended (unaudited) | Year Ended December 31, | |||||||||||||||||||||||
| 2017 | 2016 | 2015 | 2014 | 2013 | ||||||||||||||||||||
| Class C | ||||||||||||||||||||||||
| Per share operating performance (for a share outstanding throughout the period) | ||||||||||||||||||||||||
Net asset value, beginning of period | $20.38 | $18.70 | $18.97 | $20.37 | $24.25 | $20.79 | ||||||||||||||||||
|
| |||||||||||||||||||||||
| Income from investment operationsa: | ||||||||||||||||||||||||
Net investment incomeb | 0.28 | 0.15 | 0.44 | c | 0.19 | 0.43 | d | 0.24 | ||||||||||||||||
Net realized and unrealized gains (losses) | (0.72 | ) | 1.60 | (0.19 | ) | (0.25 | ) | (1.64 | ) | 5.02 | ||||||||||||||
|
| |||||||||||||||||||||||
Total from investment operations | (0.44 | ) | 1.75 | 0.25 | (0.06 | ) | (1.21 | ) | 5.26 | |||||||||||||||
|
| |||||||||||||||||||||||
| Less distributions from: | ||||||||||||||||||||||||
Net investment income | — | (0.07 | ) | (0.25 | ) | (0.27 | ) | (0.44 | ) | (0.28 | ) | |||||||||||||
Net realized gains | — | — | (0.27 | ) | (1.07 | ) | (2.23 | ) | (1.52 | ) | ||||||||||||||
|
| |||||||||||||||||||||||
Total distributions | — | (0.07 | ) | (0.52 | ) | (1.34 | ) | (2.67 | ) | (1.80 | ) | |||||||||||||
|
| |||||||||||||||||||||||
Net asset value, end of period | $19.94 | $20.38 | $18.70 | $18.97 | $20.37 | $24.25 | ||||||||||||||||||
|
| |||||||||||||||||||||||
Total returne | (2.16)% | 9.37% | 1.32% | (0.16)% | (4.97)% | 25.44% | ||||||||||||||||||
| Ratios to average net assetsf | ||||||||||||||||||||||||
Expensesg | 2.03% | h | 2.04%h | 2.06% | h,i | 2.05% | 2.04% | h | 2.07% | h | ||||||||||||||
Expenses incurred in connection with securities sold short | —% | —% | —% | —%j | 0.01% | —%j | ||||||||||||||||||
Net investment income | 2.77% | k | 0.75% | 2.42%c | 0.93% | 1.93% | d | 1.04% | ||||||||||||||||
| Supplemental data | ||||||||||||||||||||||||
Net assets, end of period (000’s) | $154,288 | $179,123 | $209,196 | $291,752 | $216,258 | $198,491 | ||||||||||||||||||
Portfolio turnover rate | 15.90% | 17.33% | 16.43% | 32.59% | 54.05% | 39.05% | ||||||||||||||||||
aThe amount shown for a share outstanding throughout the period may not correlate with the Statement of Operations for the period due to the timing of sales and repurchases of the Fund’s shares in relation to income earned and/or fluctuating fair value of the investments of the Fund.
bBased on average daily shares outstanding.
cNet investment income per share includes approximately $0.17 per share related to a nonrecurring distribution. The amount, although initially recorded as dividend income, is subject to recharacterization once the issuer provides information regarding the actual composition of the distribution. Excluding this amount, the ratio of net investment income to average net assets would have been 1.50%.
dNet investment income per share includes approximately $0.29 per share related to income received in the form of a special dividend in connection with certain Fund holdings. Excluding this amount, the ratio of net investment income to average net assets would have been 0.74%.
eTotal return does not reflect sales commissions or contingent deferred sales charges, if applicable, and is not annualized for periods less than one year.
fRatios are annualized for periods less than one year.
gIncludes dividend and/or interest expense on securities sold short and security borrowing fees, if any. See below for the ratios of such expenses to average net assets for the periods presented. See Note 1(d).
hBenefit of expense reduction rounds to less than 0.01%.
iBenefit of waiver and payments by affiliates rounds to less than 0.01%.
jRounds to less than 0.01%.
kThe net investment income ratio is annualized and may not be indicative of operating results for a full year.
| franklintempleton.com | The accompanying notes are an integral part of these financial statements. | Semiannual Report | 13 |
FRANKLIN MUTUAL EUROPEAN FUND
FINANCIAL HIGHLIGHTS
Six Months Ended (unaudited) | Year Ended December 31, | |||||||||||||||||||||||
| 2017 | 2016 | 2015 | 2014 | 2013 | ||||||||||||||||||||
| Class R | ||||||||||||||||||||||||
| Per share operating performance (for a share outstanding throughout the period) | ||||||||||||||||||||||||
Net asset value, beginning of period | $19.97 | $18.35 | $18.62 | $20.04 | $23.95 | $20.55 | ||||||||||||||||||
|
| |||||||||||||||||||||||
| Income from investment operationsa: | ||||||||||||||||||||||||
Net investment incomeb | 0.33 | 0.22 | 0.52 | c | 0.27 | 0.41 | d | 0.31 | ||||||||||||||||
Net realized and unrealized gains (losses) | (0.71 | ) | 1.60 | (0.18 | ) | (0.23 | ) | (1.49 | ) | 5.02 | ||||||||||||||
|
| |||||||||||||||||||||||
Total from investment operations | (0.38 | ) | 1.82 | 0.34 | 0.04 | (1.08 | ) | 5.33 | ||||||||||||||||
|
| |||||||||||||||||||||||
| Less distributions from: | ||||||||||||||||||||||||
Net investment income | — | (0.20 | ) | (0.34 | ) | (0.39 | ) | (0.60 | ) | (0.41 | ) | |||||||||||||
Net realized gains | — | — | (0.27 | ) | (1.07 | ) | (2.23 | ) | (1.52 | ) | ||||||||||||||
|
| |||||||||||||||||||||||
Total distributions | — | (0.20 | ) | (0.61 | ) | (1.46 | ) | (2.83 | ) | (1.93 | ) | |||||||||||||
|
| |||||||||||||||||||||||
Net asset value, end of period | $19.59 | $19.97 | $18.35 | $18.62 | $20.04 | $23.95 | ||||||||||||||||||
|
| |||||||||||||||||||||||
Total returne | (1.90)% | 9.92% | 1.86% | 0.37% | (4.52)% | 26.05% | ||||||||||||||||||
| Ratios to average net assetsf | ||||||||||||||||||||||||
Expensesg | 1.53% | h | 1.54% | h | 1.56% | h,i | 1.55% | 1.54% | h | 1.57% | h | |||||||||||||
Expenses incurred in connection with securities sold short | —% | —% | —% | —% | j | 0.01% | —%j | |||||||||||||||||
Net investment income | 3.27% | k | 1.25% | 2.92% | c | 1.43% | 2.43% | d | 1.54% | |||||||||||||||
| Supplemental data | ||||||||||||||||||||||||
Net assets, end of period (000’s) | $877 | $821 | $626 | $997 | $421 | $133 | ||||||||||||||||||
Portfolio turnover rate | 15.90% | 17.33% | 16.43% | 32.59% | 54.05% | 39.05% | ||||||||||||||||||
aThe amount shown for a share outstanding throughout the period may not correlate with the Statement of Operations for the period due to the timing of sales and repurchases of the Fund’s shares in relation to income earned and/or fluctuating fair value of the investments of the Fund.
bBased on average daily shares outstanding.
cNet investment income per share includes approximately $0.17 per share related to a nonrecurring distribution. The amount, although initially recorded as dividend income, is subject to recharacterization once the issuer provides information regarding the actual composition of the distribution. Excluding this amount, the ratio of net investment income to average net assets would have been 2.00%.
dNet investment income per share includes approximately $0.29 per share related to income received in the form of a special dividend in connection with certain Fund holdings. Excluding this amount, the ratio of net investment income to average net assets would have been 1.24%.
eTotal return is not annualized for periods less than one year.
fRatios are annualized for periods less than one year.
gIncludes dividend and/or interest expense on securities sold short and security borrowing fees, if any. See below for the ratios of such expenses to average net assets for the periods presented. See Note 1(d).
hBenefit of expense reduction rounds to less than 0.01%.
iBenefit of waiver and payments by affiliates rounds to less than 0.01%.
jRounds to less than 0.01%.
kThe net investment income ratio is annualized and may not be indicative of operating results for a full year.
| 14 | Semiannual Report | The accompanying notes are an integral part of these financial statements. | franklintempleton.com |
FRANKLIN MUTUAL EUROPEAN FUND
FINANCIAL HIGHLIGHTS
Six Months Ended (unaudited) | Year Ended December 31, | |||||||||||||||||||||||
| 2017 | 2016 | 2015 | 2014 | 2013a | ||||||||||||||||||||
| Class R6 | ||||||||||||||||||||||||
| Per share operating performance (for a share outstanding throughout the period) | ||||||||||||||||||||||||
Net asset value, beginning of period | $20.91 | $19.19 | $19.47 | $20.85 | $24.75 | $22.54 | ||||||||||||||||||
|
| |||||||||||||||||||||||
| Income from investment operationsb: | ||||||||||||||||||||||||
Net investment incomec | 0.41 | 0.41 | 0.66 | d | 0.46 | 0.75 | e | 0.28 | ||||||||||||||||
Net realized and unrealized gains (losses) | (0.74 | ) | 1.62 | (0.17 | ) | (0.28 | ) | (1.71 | ) | 3.95 | ||||||||||||||
|
| |||||||||||||||||||||||
Total from investment operations | (0.33 | ) | 2.03 | 0.49 | 0.18 | (0.96 | ) | 4.23 | ||||||||||||||||
|
| |||||||||||||||||||||||
| Less distributions from: | ||||||||||||||||||||||||
Net investment income | — | (0.31 | ) | (0.50 | ) | (0.49 | ) | (0.71 | ) | (0.50 | ) | |||||||||||||
Net realized gains | — | — | (0.27 | ) | (1.07 | ) | (2.23 | ) | (1.52 | ) | ||||||||||||||
|
| |||||||||||||||||||||||
Total distributions | — | (0.31 | ) | (0.77 | ) | (1.56 | ) | (2.94 | ) | (2.02 | ) | |||||||||||||
|
| |||||||||||||||||||||||
Net asset value, end of period | $20.58 | $20.91 | $19.19 | $19.47 | $20.85 | $24.75 | ||||||||||||||||||
|
| |||||||||||||||||||||||
Total returnf | (1.58)% | 10.63% | 2.53% | 0.98% | (3.88)% | 18.99% | ||||||||||||||||||
| Ratios to average net assetsg | ||||||||||||||||||||||||
Expensesh | 0.91% | i,j | 0.88% | i | 0.89% | i,j | 0.89% | 0.89% | i | 0.90% | i | |||||||||||||
Expenses incurred in connection with securities sold short | —% | —% | —% | —% | k | 0.01% | —% | k | ||||||||||||||||
Net investment income | 3.89% | l | 1.91% | 3.59% | d | 2.09% | 3.08% | e | 2.21% | |||||||||||||||
| Supplemental data | ||||||||||||||||||||||||
Net assets, end of period (000’s) | $274,194 | $294,660 | $311,784 | $373,904 | $334,396 | $317,690 | ||||||||||||||||||
Portfolio turnover rate | 15.90% | 17.33% | 16.43% | 32.59% | 54.05% | 39.05% | ||||||||||||||||||
aFor the period May 1, 2013 (effective date) to December 31, 2013.
bThe amount shown for a share outstanding throughout the period may not correlate with the Statement of Operations for the period due to the timing of sales and repurchases of the Fund’s shares in relation to income earned and/or fluctuating fair value of the investments of the Fund.
cBased on average daily shares outstanding.
dNet investment income per share includes approximately $0.17 per share related to a nonrecurring distribution. The amount, although initially recorded as dividend income, is subject to recharacterization once the issuer provides information regarding the actual composition of the distribution. Excluding this amount, the ratio of net investment income to average net assets would have been 2.67%.
eNet investment income per share includes approximately $0.29 per share related to income received in the form of a special dividend in connection with certain Fund holdings. Excluding this amount, the ratio of net investment income to average net assets would have been 1.89%.
fTotal return is not annualized for periods less than one year.
gRatios are annualized for periods less than one year.
hIncludes dividend and/or interest expense on securities sold short and security borrowing fees, if any. See below for the ratios of such expenses to average net assets for the periods presented. See Note 1(d).
iBenefit of expense reduction rounds to less than 0.01%.
jBenefit of waiver and payments by affiliates rounds to less than 0.01%.
kRounds to less than 0.01%.
lThe net investment income ratio is annualized and may not be indicative of operating results for a full year.
| franklintempleton.com | The accompanying notes are an integral part of these financial statements. | Semiannual Report | 15 |
FRANKLIN MUTUAL EUROPEAN FUND
Statement of Investments, June 30, 2018 (unaudited)
| Country | Shares | Value | ||||||||||||
| ||||||||||||||
| Common Stocks 88.0% | ||||||||||||||
| Auto Components 1.1% | ||||||||||||||
Cie Generale des Etablissements Michelin SCA | France | 204,460 | $ | 24,915,272 | ||||||||||
|
| |||||||||||||
| Automobiles 2.9% | ||||||||||||||
Peugeot SA | France | 2,585,578 | 59,088,023 | |||||||||||
Renault SA | France | 108,240 | 9,210,242 | |||||||||||
|
| |||||||||||||
| 68,298,265 | ||||||||||||||
|
| |||||||||||||
| Banks 9.6% | ||||||||||||||
AIB Group PLC | Ireland | 5,022,410 | 27,285,887 | |||||||||||
BNP Paribas SA | France | 569,346 | 35,381,743 | |||||||||||
HSBC Holdings PLC | United Kingdom | 2,732,076 | 25,641,909 | |||||||||||
Societe Generale SA | France | 1,164,312 | 49,128,099 | |||||||||||
Standard Chartered PLC | United Kingdom | 5,207,966 | 47,634,532 | |||||||||||
UniCredit SpA | Italy | 2,178,188 | 36,381,690 | |||||||||||
|
| |||||||||||||
| 221,453,860 | ||||||||||||||
|
| |||||||||||||
| Capital Markets 2.6% | ||||||||||||||
Credit Suisse Group AG | Switzerland | 2,572,571 | 38,832,731 | |||||||||||
Deutsche Bank AG | Germany | 1,535,000 | 16,538,894 | |||||||||||
Oslo Bors VPS Holding ASA | Norway | 340,000 | 4,800,491 | |||||||||||
|
| |||||||||||||
| 60,172,116 | ||||||||||||||
|
| |||||||||||||
| Commercial Services & Supplies 1.2% | ||||||||||||||
G4S PLC | United Kingdom | 8,137,683 | 28,768,712 | |||||||||||
|
| |||||||||||||
| Communications Equipment 2.1% | ||||||||||||||
Nokia OYJ, A | Finland | 2,250,636 | 12,963,586 | |||||||||||
Nokia OYJ, ADR | Finland | 6,042,452 | 34,744,099 | |||||||||||
|
| |||||||||||||
| 47,707,685 | ||||||||||||||
|
| |||||||||||||
| Construction Materials 4.4% | ||||||||||||||
HeidelbergCement AG | Germany | 427,796 | 36,026,698 | |||||||||||
LafargeHolcim Ltd., B | Switzerland | 1,372,438 | 67,042,155 | |||||||||||
|
| |||||||||||||
| 103,068,853 | ||||||||||||||
|
| |||||||||||||
| Diversified Telecommunication Services 5.2% | ||||||||||||||
Hellenic Telecommunications Organization SA | Greece | 4,953,472 | 61,346,324 | |||||||||||
Koninklijke KPN NV | Netherlands | 21,300,825 | 57,986,288 | |||||||||||
|
| |||||||||||||
| 119,332,612 | ||||||||||||||
|
| |||||||||||||
| Electric Utilities 3.4% | ||||||||||||||
Enel SpA | Italy | 14,345,900 | 79,732,231 | |||||||||||
|
| |||||||||||||
| Electrical Equipment 0.6% | ||||||||||||||
Osram Licht AG | Germany | 345,360 | 14,122,548 | |||||||||||
|
| |||||||||||||
| Food & Staples Retailing 1.4% | ||||||||||||||
Carrefour SA | France | 1,944,049 | 31,503,342 | |||||||||||
|
| |||||||||||||
| Health Care Equipment & Supplies 3.8% | ||||||||||||||
Koninklijke Philips NV | Netherlands | 2,051,716 | 87,315,184 | |||||||||||
|
| |||||||||||||
| Hotels, Restaurants & Leisure 3.3% | ||||||||||||||
Accor SA | France | 1,549,777 | 76,084,856 | |||||||||||
|
| |||||||||||||
| Household Durables 0.5% | ||||||||||||||
JM AB | Sweden | 277,660 | 4,962,590 | |||||||||||
| a,b | Neinor Homes SA, 144A | Spain | 334,815 | 6,274,545 | ||||||||||
|
| |||||||||||||
| 11,237,135 | ||||||||||||||
|
| |||||||||||||
| 16 | Semiannual Report | franklintempleton.com |
FRANKLIN MUTUAL EUROPEAN FUND
STATEMENT OF INVESTMENTS (UNAUDITED)
| Country | Shares | Value | ||||||||||||
| Common Stocks(continued) | ||||||||||||||
| Insurance 13.1% | ||||||||||||||
Ageas | Belgium | 699,732 | $ | 35,325,553 | ||||||||||
ASR Nederland NV | Netherlands | 962,392 | 39,331,886 | |||||||||||
Direct Line Insurance Group PLC | United Kingdom | 12,522,431 | 56,705,790 | |||||||||||
Lancashire Holdings Ltd. | United Kingdom | 4,178,619 | 31,288,670 | |||||||||||
NN Group NV | Netherlands | 1,576,954 | 64,190,408 | |||||||||||
RSA Insurance Group PLC | United Kingdom | 7,667,176 | 68,791,098 | |||||||||||
XL Group Ltd. | Bermuda | 129,405 | 7,240,210 | |||||||||||
|
| |||||||||||||
| 302,873,615 | ||||||||||||||
|
| |||||||||||||
| Machinery 2.7% | ||||||||||||||
CNH Industrial NV | United Kingdom | 2,999,447 | 31,876,058 | |||||||||||
CNH Industrial NV, special voting | United Kingdom | 833,461 | 8,857,450 | |||||||||||
Vossloh AG | Germany | 471,303 | 22,961,974 | |||||||||||
|
| |||||||||||||
| 63,695,482 | ||||||||||||||
|
| |||||||||||||
| Marine 1.0% | ||||||||||||||
A.P. Moeller-Maersk AS, B | Denmark | 19,498 | 24,301,793 | |||||||||||
|
| |||||||||||||
| Metals & Mining 1.2% | ||||||||||||||
thyssenkrupp AG | Germany | 1,110,929 | 27,023,400 | |||||||||||
|
| |||||||||||||
| Oil, Gas & Consumable Fuels 10.0% | ||||||||||||||
BP PLC | United Kingdom | 10,074,119 | 76,936,343 | |||||||||||
| a | Cairn Energy PLC | United Kingdom | 9,565,171 | 31,579,410 | ||||||||||
Royal Dutch Shell PLC, A (EUR Traded) | United Kingdom | 1,241,414 | 43,178,588 | |||||||||||
Royal Dutch Shell PLC, A (GBP Traded) | United Kingdom | 1,265,829 | 43,947,776 | |||||||||||
Total SA | France | 574,983 | 35,073,707 | |||||||||||
|
| |||||||||||||
| 230,715,824 | ||||||||||||||
|
| |||||||||||||
| Pharmaceuticals 7.0% | ||||||||||||||
GlaxoSmithKline PLC | United Kingdom | 3,012,192 | 60,853,923 | |||||||||||
Novartis AG | Switzerland | 1,011,384 | 76,874,987 | |||||||||||
Sanofi | France | 295,407 | 23,693,777 | |||||||||||
|
| |||||||||||||
| 161,422,687 | ||||||||||||||
|
| |||||||||||||
| Road & Rail 0.0% | ||||||||||||||
| a,c,d,e | Euro Wagon LP | Jersey Islands | 16,127,149 | — | ||||||||||
|
| |||||||||||||
| Specialty Retail 1.5% | ||||||||||||||
Dufry AG | Switzerland | 154,661 | 19,738,641 | |||||||||||
Hornbach Holding AG & Co. KGaA | Germany | 213,786 | 15,436,211 | |||||||||||
|
| |||||||||||||
| 35,174,852 | ||||||||||||||
|
| |||||||||||||
| Textiles, Apparel & Luxury Goods 0.6% | ||||||||||||||
Pandora AS | Denmark | 200,000 | 13,981,715 | |||||||||||
|
| |||||||||||||
| Tobacco 1.9% | ||||||||||||||
British American Tobacco PLC | United Kingdom | 881,269 | 44,573,685 | |||||||||||
|
| |||||||||||||
| Trading Companies & Distributors 4.0% | ||||||||||||||
Kloeckner & Co. SE | Germany | 3,031,653 | 31,984,547 | |||||||||||
Rexel SA | France | 4,154,655 | 59,778,133 | |||||||||||
|
| |||||||||||||
| 91,762,680 | ||||||||||||||
|
| |||||||||||||
| Wireless Telecommunication Services 2.9% | ||||||||||||||
Vodafone Group PLC | United Kingdom | 27,273,376 | 66,206,851 | |||||||||||
|
| |||||||||||||
Total Common Stocks (Cost $1,982,494,718) | 2,035,445,255 | |||||||||||||
|
| |||||||||||||
| franklintempleton.com | Semiannual Report | 17 |
FRANKLIN MUTUAL EUROPEAN FUND
STATEMENT OF INVESTMENTS (UNAUDITED)
| Country | Shares | Value | ||||||||||||
| Preferred Stocks 4.7% | ||||||||||||||
| Auto Components 1.8% | ||||||||||||||
f Schaeffler AG, 4.933%, pfd. | �� | Germany | 3,156,455 | $ | 41,119,463 | |||||||||
|
| |||||||||||||
| Automobiles 2.9% | ||||||||||||||
f Volkswagen AG, 2.784%, pfd. | Germany | 408,818 | 67,930,318 | |||||||||||
|
| |||||||||||||
Total Preferred Stocks (Cost $108,381,951) | 109,049,781 | |||||||||||||
|
| |||||||||||||
Total Investments before Short Term Investments | 2,144,495,036 | |||||||||||||
|
| |||||||||||||
| Principal Amount | ||||||||||||||
Short Term Investments 6.3% | ||||||||||||||
U.S. Government and Agency Securities 6.3% | ||||||||||||||
| g | FHLB, 7/02/18 | United States | $ | 7,100,000 | 7,100,000 | |||||||||
| g | U.S. Treasury Bill, | |||||||||||||
11/08/18 | United States | 30,000,000 | 29,786,613 | |||||||||||
11/15/18 | United States | 30,000,000 | 29,773,900 | |||||||||||
7/05/18 - 12/06/18 | United States | 79,000,000 | 78,501,036 | |||||||||||
|
| |||||||||||||
| Total U.S. Government and Agency Securities (Cost $145,130,198) | 145,161,549 | |||||||||||||
|
| |||||||||||||
| Total Investments (Cost $2,236,006,867) 99.0% | 2,289,656,585 | |||||||||||||
| Other Assets, less Liabilities 1.0% | 22,541,568 | |||||||||||||
|
| |||||||||||||
| Net Assets 100.0% | $ | 2,312,198,153 | ||||||||||||
|
| |||||||||||||
aNon-income producing.
bSecurity was purchased pursuant to Rule 144A under the Securities Act of 1933 and may be sold in transactions exempt from registration only to qualified institutional buyers or in a public offering registered under the Securities Act of 1933. This security has been deemed liquid under guidelines approved by the Trust’s Board of Trustees. At June 30, 2018, the value of this security was $6,274,545, representing 0.3% of net assets.
cSee Note 11 regarding holdings of 5% voting securities.
dFair valued using significant unobservable inputs. See Note 13 regarding fair value measurements.
eSee Note 9 regarding restricted securities.
fVariable rate security. The rate shown represents the yield at period end.
gThe security was issued on a discount basis with no stated coupon rate.
| 18 | Semiannual Report | franklintempleton.com |
FRANKLIN MUTUAL EUROPEAN FUND
STATEMENT OF INVESTMENTS (UNAUDITED)
At June 30, 2018, the Fund had the following futures contracts outstanding. See Note 1(c).
| Futures Contracts | ||||||||||||||||||||
| Description | Type | Number of Contracts | Notional Amount* | Expiration Date | Value/ Unrealized Appreciation (Depreciation) | |||||||||||||||
| Currency Contracts | ||||||||||||||||||||
EUR/USD | Short | 3,528 | $517,579,650 | 9/17/18 | $5,320,212 | |||||||||||||||
GBP/USD | Short | 2,194 | 181,498,650 | 9/17/18 | 2,767,444 | |||||||||||||||
|
| |||||||||||||||||||
Total Futures Contracts | $8,087,656 | |||||||||||||||||||
|
| |||||||||||||||||||
*As of period end.
At June 30, 2018, the Fund had the following forward exchange contracts outstanding. See Note 1(c).
| Forward Exchange Contracts | ||||||||||||||||||||||||||||
| Currency | Counterpartya | Type | Quantity | Contract Amount | Settlement Date | Unrealized Appreciation | Unrealized Depreciation | |||||||||||||||||||||
| OTC Forward Exchange Contracts |
| |||||||||||||||||||||||||||
Swiss Franc | BONY | Sell | 642,546 | $ | 651,511 | 7/09/18 | $ | 2,176 | $ | — | ||||||||||||||||||
Swiss Franc | HSBK | Sell | 3,175,918 | 3,207,123 | 7/09/18 | — | (2,350 | ) | ||||||||||||||||||||
Swiss Franc | UBSW | Buy | 2,156,713 | 2,173,937 | 7/09/18 | 5,562 | — | |||||||||||||||||||||
Swiss Franc | UBSW | Sell | 5,142,879 | 5,206,002 | 7/09/18 | 8,786 | — | |||||||||||||||||||||
Swiss Franc | UBSW | Sell | 105,630,435 | 106,243,460 | 7/09/18 | — | (503,010 | ) | ||||||||||||||||||||
Euro | BOFA | Buy | 2,852,765 | 3,310,360 | 7/12/18 | 25,904 | — | |||||||||||||||||||||
Euro | BOFA | Buy | 5,529,062 | 6,500,943 | 7/12/18 | — | (34,793 | ) | ||||||||||||||||||||
Euro | BONY | Buy | 1,228,279 | 1,419,435 | 7/12/18 | 17,018 | — | |||||||||||||||||||||
Euro | BONY | Buy | 2,748,376 | 3,244,261 | 7/12/18 | — | (30,079 | ) | ||||||||||||||||||||
Euro | HSBK | Buy | 3,868,122 | 4,502,883 | 7/12/18 | 20,825 | — | |||||||||||||||||||||
Euro | HSBK | Sell | 13,763,661 | 16,698,968 | 7/12/18 | 602,586 | — | |||||||||||||||||||||
Euro | SSBT | Buy | 3,027,755 | 3,515,090 | 7/12/18 | 25,821 | — | |||||||||||||||||||||
Euro | UBSW | Buy | 1,052,323 | 1,219,471 | 7/12/18 | 11,204 | — | |||||||||||||||||||||
Euro | UBSW | Sell | 13,763,661 | 16,699,656 | 7/12/18 | 603,274 | — | |||||||||||||||||||||
British Pound | BOFA | Buy | 152,536 | 204,839 | 7/16/18 | — | (3,240 | ) | ||||||||||||||||||||
British Pound | BOFA | Sell | 2,141,902 | 3,043,604 | 7/16/18 | 212,756 | — | |||||||||||||||||||||
British Pound | BONY | Buy | 850,000 | 1,120,903 | 7/16/18 | 2,500 | — | |||||||||||||||||||||
British Pound | BONY | Sell | 1,108,344 | 1,594,852 | 7/16/18 | 130,007 | — | |||||||||||||||||||||
British Pound | HSBK | Buy | 2,700,000 | 3,588,970 | 7/16/18 | — | (20,510 | ) | ||||||||||||||||||||
British Pound | HSBK | Sell | 19,714,108 | 26,924,960 | 7/16/18 | 869,777 | — | |||||||||||||||||||||
British Pound | UBSW | Sell | 18,933,606 | 25,806,921 | 7/16/18 | 783,291 | — | |||||||||||||||||||||
Norwegian Krone | BONY | Buy | 1,275,000 | 158,681 | 7/25/18 | — | (1,976 | ) | ||||||||||||||||||||
Norwegian Krone | BONY | Buy | 2,380,000 | 292,304 | 7/25/18 | 212 | — | |||||||||||||||||||||
Norwegian Krone | BONY | Sell | 42,619,254 | 5,423,176 | 7/25/18 | 185,015 | — | |||||||||||||||||||||
Euro | BOFA | Buy | 4,352,857 | 5,086,592 | 7/26/18 | 9,332 | — | |||||||||||||||||||||
Euro | BONY | Buy | 4,525,651 | 5,288,336 | 7/26/18 | 9,879 | — | |||||||||||||||||||||
Euro | BONY | Sell | 76,332,879 | 95,748,910 | 7/26/18 | 6,385,406 | — | |||||||||||||||||||||
Euro | HSBK | Buy | 4,352,857 | 5,076,898 | 7/26/18 | 19,026 | — | |||||||||||||||||||||
Euro | HSBK | Sell | 76,332,879 | 95,741,277 | 7/26/18 | 6,377,773 | — | |||||||||||||||||||||
Euro | SSBT | Buy | 4,525,651 | 5,282,901 | 7/26/18 | 15,314 | — | |||||||||||||||||||||
Euro | UBSW | Buy | 4,525,651 | 5,282,865 | 7/26/18 | 15,351 | — | |||||||||||||||||||||
Swedish Krona | BONY | Sell | 17,395,659 | 1,943,072 | 7/31/18 | — | (4,883 | ) | ||||||||||||||||||||
| franklintempleton.com | Semiannual Report | 19 |
FRANKLIN MUTUAL EUROPEAN FUND
STATEMENT OF INVESTMENTS (UNAUDITED)
| Forward Exchange Contracts (continued) | ||||||||||||||||||||||||||||
| Currency | Counterpartya | Type | Quantity | Contract Amount | Settlement Date | Unrealized Appreciation | Unrealized Depreciation | |||||||||||||||||||||
| OTC Forward Exchange Contracts (continued) |
| |||||||||||||||||||||||||||
Swedish Krona | SSBT | Sell | 400,000 | $ | 44,782 | 7/31/18 | $ | — | $ | (10 | ) | |||||||||||||||||
British Pound | BOFA | Sell | 4,878,723 | 6,961,255 | 8/14/18 | 504,669 | — | |||||||||||||||||||||
British Pound | BONY | Sell | 37,409,989 | 52,140,905 | 8/14/18 | 2,631,885 | — | |||||||||||||||||||||
British Pound | UBSW | Sell | 34,779,874 | 48,369,415 | 8/14/18 | 2,341,133 | — | |||||||||||||||||||||
Euro | BONY | Sell | 72,209,328 | 91,353,248 | 8/20/18 | 6,649,920 | — | |||||||||||||||||||||
Euro | SSBT | Sell | 72,209,327 | 91,324,942 | 8/20/18 | 6,621,614 | — | |||||||||||||||||||||
Euro | BOFA | Sell | 60,930,190 | 76,223,802 | 10/10/18 | 4,461,635 | — | |||||||||||||||||||||
Euro | BONY | Sell | 3,408,389 | 4,254,624 | 10/10/18 | 240,302 | — | |||||||||||||||||||||
Euro | UBSW | Sell | 26,066,144 | 32,442,053 | 10/10/18 | 1,741,952 | — | |||||||||||||||||||||
Euro | BOFA | Sell | 18,252,960 | 22,157,174 | 10/18/18 | 644,606 | — | |||||||||||||||||||||
Euro | SSBT | Sell | 30,869,110 | 38,787,962 | 10/18/18 | 2,406,255 | — | |||||||||||||||||||||
Euro | UBSW | Sell | 43,885,443 | 54,340,568 | 10/18/18 | 2,618,073 | — | |||||||||||||||||||||
British Pound | BOFA | Sell | 13,073,855 | 17,849,847 | 10/24/18 | 490,819 | — | |||||||||||||||||||||
British Pound | BONY | Sell | 12,203,079 | 16,356,078 | 10/24/18 | 153,238 | — | |||||||||||||||||||||
British Pound | HSBK | Sell | 234,880 | 325,879 | 10/24/18 | 14,013 | — | |||||||||||||||||||||
British Pound | SSBT | Sell | 50,141,866 | 70,456,746 | 10/24/18 | 3,880,051 | — | |||||||||||||||||||||
British Pound | UBSW | Sell | 344,599 | 456,029 | 10/24/18 | — | (1,518 | ) | ||||||||||||||||||||
British Pound | UBSW | Sell | 5,883,027 | 8,103,300 | 10/24/18 | 292,012 | — | |||||||||||||||||||||
Euro | BOFA | Sell | 6,572,342 | 7,833,837 | 11/07/18 | 74,584 | — | |||||||||||||||||||||
Euro | HSBK | Sell | 62,450 | 74,653 | 11/07/18 | 925 | — | |||||||||||||||||||||
Euro | SSBT | Sell | 36,501,941 | 44,324,307 | 11/07/18 | 1,230,414 | — | |||||||||||||||||||||
Euro | UBSW | Sell | 36,501,942 | 44,315,547 | 11/07/18 | 1,221,654 | — | |||||||||||||||||||||
Euro | HSBK | Sell | 62,711,729 | 75,000,218 | 11/21/18 | 874,681 | — | |||||||||||||||||||||
Euro | SSBT | Sell | 62,711,729 | 75,015,770 | 11/21/18 | 890,234 | — | |||||||||||||||||||||
British Pound | BONY | Sell | 6,289,772 | 8,526,760 | 11/26/18 | 161,609 | — | |||||||||||||||||||||
British Pound | UBSW | Sell | 6,289,772 | 8,526,151 | 11/26/18 | 160,998 | — | |||||||||||||||||||||
|
| |||||||||||||||||||||||||||
Total Forward Exchange Contracts |
| $ | 56,646,071 | $ | (602,369 | ) | ||||||||||||||||||||||
|
| |||||||||||||||||||||||||||
Net unrealized appreciation (depreciation) |
| $ | 56,043,702 | |||||||||||||||||||||||||
|
| |||||||||||||||||||||||||||
aMay be comprised of multiple contracts with the same counterparty, currency and settlement date.
See Note 10 regarding other derivative information.
See Abbreviations on page 36.
| 20 | Semiannual Report | The accompanying notes are an integral part of these financial statements. | franklintempleton.com |
FRANKLIN MUTUAL EUROPEAN FUND
Financial Statements
Statement of Assets and Liabilities
June 30, 2018 (unaudited)
Assets: | ||||
Investments in securities: | ||||
Cost - Unaffiliated issuers | $2,229,724,358 | |||
Cost - Controlled affiliates (Note 11) | 6,282,509 | |||
|
| |||
Value - Unaffiliated issuers | $2,289,656,585 | |||
Value - Controlled affiliates (Note 11) | — | |||
Cash | 1,513,442 | |||
Foreign currency, at value (cost $341,079) | 354,029 | |||
Receivables: | ||||
Investment securities sold | 4,617,683 | |||
Capital shares sold | 974,085 | |||
Dividends | 14,008,910 | |||
European Union tax reclaims | 2,777,171 | |||
Deposits with brokers for: | ||||
Futures contracts | 12,664,980 | |||
Unrealized appreciation on OTC forward exchange contracts | 56,646,071 | |||
Other assets | 10,700 | |||
|
| |||
Total assets | 2,383,223,656 | |||
|
| |||
Liabilities: | ||||
Payables: | ||||
Investment securities purchased | 39,864,986 | |||
Capital shares redeemed | 20,732,015 | |||
Management fees | 1,727,002 | |||
Distribution fees | 564,926 | |||
Transfer agent fees | 498,324 | |||
Trustees’ fees and expenses | 94,475 | |||
Variation margin on futures contracts | 6,678,996 | |||
Unrealized depreciation on OTC forward exchange contracts | 602,369 | |||
Accrued expenses and other liabilities | 262,410 | |||
|
| |||
Total liabilities | 71,025,503 | |||
|
| |||
Net assets, at value | $2,312,198,153 | |||
|
| |||
Net assets consist of: | ||||
Paid-in capital | $2,308,939,039 | |||
Undistributed net investment income | 66,187,303 | |||
Net unrealized appreciation (depreciation) | 117,551,080 | |||
Accumulated net realized gain (loss) | (180,479,269 | ) | ||
|
| |||
Net assets, at value | $2,312,198,153 | |||
|
|
| franklintempleton.com | The accompanying notes are an integral part of these financial statements. | Semiannual Report | 21 |
FRANKLIN MUTUAL EUROPEAN FUND
FINANCIAL STATEMENTS
Statement of Assets and Liabilities (continued)
June 30, 2018 (unaudited)
| Class Z: | ||||
Net assets, at value | $1,222,874,620 | |||
|
| |||
Shares outstanding | 59,421,365 | |||
|
| |||
Net asset value and maximum offering price per share | $20.58 | |||
|
| |||
| Class A: | ||||
Net assets, at value | $659,964,509 | |||
|
| |||
Shares outstanding | 33,046,569 | |||
|
| |||
Net asset value per sharea | $19.97 | |||
|
| |||
Maximum offering price per share (net asset value per share ÷ 94.25%) | $21.19 | |||
|
| |||
| Class C: | ||||
Net assets, at value | $154,287,587 | |||
|
| |||
Shares outstanding | 7,737,112 | |||
|
| |||
Net asset value and maximum offering price per sharea | $19.94 | |||
|
| |||
| Class R: | ||||
Net assets, at value | $877,424 | |||
|
| |||
Shares outstanding | 44,800 | |||
|
| |||
Net asset value and maximum offering price per share | $19.59 | |||
|
| |||
| Class R6: | ||||
Net assets, at value | $274,194,013 | |||
|
| |||
Shares outstanding | 13,326,087 | |||
|
| |||
Net asset value and maximum offering price per share | $20.58 | |||
|
| |||
aRedemption price is equal to net asset value less contingent deferred sales charges, if applicable.
| 22 | Semiannual Report | The accompanying notes are an integral part of these financial statements. | franklintempleton.com |
FRANKLIN MUTUAL EUROPEAN FUND
FINANCIAL STATEMENTS
Statement of Operations
for the six months ended June 30, 2018 (unaudited)
Investment income: | ||||
Dividends: (net of foreign taxes)* | ||||
Unaffiliated issuers | $57,628,118 | |||
Interest: | ||||
Unaffiliated issuers | 1,615,872 | |||
|
| |||
Total investment income | 59,243,990 | |||
|
| |||
Expenses: | ||||
Management fees (Note 3a) | 10,530,054 | |||
Distribution fees: (Note 3c) | ||||
Class A | 872,642 | |||
Class C | 845,495 | |||
Class R | 2,114 | |||
Transfer agent fees: (Note 3e) | ||||
Class Z | 928,569 | |||
Class A | 491,267 | |||
Class C | 119,010 | |||
Class R | 597 | |||
Class R6 | 33,926 | |||
Custodian fees (Note 4) | 127,659 | |||
Reports to shareholders | 77,719 | |||
Registration and filing fees | 59,947 | |||
Professional fees | 74,303 | |||
Trustees’ fees and expenses | 44,000 | |||
Other | 36,383 | |||
|
| |||
Total expenses | 14,243,685 | |||
Expense reductions (Note 4) | (5,954 | ) | ||
Expenses waived/paid by affiliates (Note 3f) | (5,910 | ) | ||
|
| |||
Net expenses | 14,231,821 | |||
|
| |||
Net investment income | 45,012,169 | |||
|
| |||
Realized and unrealized gains (losses): | ||||
Net realized gain (loss) from: | ||||
Investments: | ||||
Unaffiliated issuers | 63,771,097 | |||
Foreign currency transactions | 2,193 | |||
Forward exchange contracts | (39,050,563 | ) | ||
Futures contracts | 9,551,522 | |||
|
| |||
Net realized gain (loss) | 34,274,249 | |||
|
| |||
Net change in unrealized appreciation (depreciation) on: | ||||
Investments: | ||||
Unaffiliated issuers | (222,988,683 | ) | ||
Translation of other assets and liabilities denominated in foreign currencies | (586,336 | ) | ||
Forward exchange contracts | 82,155,012 | |||
Futures contracts | 18,921,283 | |||
|
| |||
Net change in unrealized appreciation (depreciation) | (122,498,724 | ) | ||
|
| |||
Net realized and unrealized gain (loss) | (88,224,475 | ) | ||
|
| |||
Net increase (decrease) in net assets resulting from operations | $(43,212,306 | ) | ||
|
| |||
*Foreign taxes withheld on dividends | $6,462,574 | |||
| franklintempleton.com | The accompanying notes are an integral part of these financial statements. | Semiannual Report | 23 |
FRANKLIN MUTUAL EUROPEAN FUND
FINANCIAL STATEMENTS
Statements of Changes in Net Assets
| Six Months Ended June 30, 2018 (unaudited) | Year Ended December 31, 2017 | |||||||
Increase (decrease) in net assets: | ||||||||
Operations: | ||||||||
Net investment income | $45,012,169 | $41,754,082 | ||||||
Net realized gain (loss) | 34,274,249 | (36,941,433 | ) | |||||
Net change in unrealized appreciation (depreciation) | (122,498,724 | ) | 245,053,933 | |||||
|
| |||||||
Net increase (decrease) in net assets resulting from operations | (43,212,306 | ) | 249,866,582 | |||||
|
| |||||||
Distributions to shareholders from: | ||||||||
Net investment income: | ||||||||
Class Z | — | (17,540,243 | ) | |||||
Class A | — | (7,669,484 | ) | |||||
Class C | — | (661,962 | ) | |||||
Class R | — | (7,585 | ) | |||||
Class R6 | — | (4,427,392 | ) | |||||
|
| |||||||
Total distributions to shareholders | — | (30,306,666 | ) | |||||
|
| |||||||
Capital share transactions: (Note 2) | ||||||||
Class Z | (81,213,673 | ) | 43,359,185 | |||||
Class A | (43,348,215 | ) | (118,591,024 | ) | ||||
Class C | (21,526,252 | ) | (47,346,696 | ) | ||||
Class R | 74,729 | 141,266 | ||||||
Class R6 | (16,716,841 | ) | (45,857,168 | ) | ||||
|
| |||||||
Total capital share transactions | (162,730,252 | ) | (168,294,437 | ) | ||||
|
| |||||||
Net increase (decrease) in net assets | (205,942,558 | ) | 51,265,479 | |||||
Net assets: | ||||||||
Beginning of period | 2,518,140,711 | 2,466,875,232 | ||||||
|
| |||||||
End of period | $2,312,198,153 | $2,518,140,711 | ||||||
|
| |||||||
Undistributed net investment income included in net assets: | ||||||||
End of period | $66,187,303 | $21,175,134 | ||||||
|
| |||||||
| 24 | Semiannual Report | The accompanying notes are an integral part of these financial statements. | franklintempleton.com |
FRANKLIN MUTUAL EUROPEAN FUND
Notes to Financial Statements (unaudited)
1. Organization and Significant Accounting Policies
Franklin Mutual Series Funds (Trust) is registered under the Investment Company Act of 1940 (1940 Act) as an open-end management investment company, consisting of seven separate funds and applies the specialized accounting and reporting guidance in U.S. Generally Accepted Accounting Principles (U.S. GAAP). Franklin Mutual European Fund (Fund) is included in this report. The Fund offers five classes of shares: Class Z, Class A, Class C, Class R and Class R6. Each class of shares may differ by its initial sales load, contingent deferred sales charges, voting rights on matters affecting a single class, its exchange privilege and fees due to differing arrangements for distribution and transfer agent fees.
The following summarizes the Fund’s significant accounting policies.
a. Financial Instrument Valuation
The Fund’s investments in financial instruments are carried at fair value daily. Fair value is the price that would be received to sell an asset or paid to transfer a liability in an orderly transaction between market participants on the measurement date. The Fund calculates the net asset value (NAV) per share each business day as of 4 p.m. Eastern time or the regularly scheduled close of the New York Stock Exchange (NYSE), whichever is earlier. Under compliance policies and procedures approved by the Trust’s Board of Trustees (the Board), the Fund’s administrator has responsibility for oversight of valuation, including leading the cross-functional Valuation Committee (VC). The VC provides administration and oversight of the Fund’s valuation policies and procedures, which are approved annually by the Board. Among other things, these procedures allow the Fund to utilize independent pricing services, quotations from securities and financial instrument dealers, and other market sources to determine fair value.
Equity securities and derivative financial instruments listed on an exchange or on the NASDAQ National Market System are valued at the last quoted sale price or the official closing price of the day, respectively. Foreign equity securities are valued as of the close of trading on the foreign stock exchange on which the security is primarily traded, or as of 4 p.m. Eastern time. The value is then converted into its U.S. dollar equivalent at the foreign exchange rate in effect at 4 p.m. Eastern time on the day that the value of the security is determined. Over-the-counter (OTC) securities are valued within the range of the most recent
quoted bid and ask prices. Securities that trade in multiple markets or on multiple exchanges are valued according to the broadest and most representative market. Certain equity securities are valued based upon fundamental characteristics or relationships to similar securities.
Debt securities generally trade in the OTC market rather than on a securities exchange. The Fund’s pricing services use multiple valuation techniques to determine fair value. In instances where sufficient market activity exists, the pricing services may utilize a market-based approach through which quotes from market makers are used to determine fair value. In instances where sufficient market activity may not exist or is limited, the pricing services also utilize proprietary valuation models which may consider market characteristics such as benchmark yield curves, credit spreads, estimated default rates, anticipated market interest rate volatility, coupon rates, anticipated timing of principal repayments, underlying collateral, and other unique security features in order to estimate the relevant cash flows, which are then discounted to calculate the fair value.
Certain derivative financial instruments trade in the OTC market. The Fund’s pricing services use various techniques including industry standard option pricing models and proprietary discounted cash flow models to determine the fair value of those instruments. The Fund’s net benefit or obligation under the derivative contract, as measured by the fair value of the contract, is included in net assets.
The Fund has procedures to determine the fair value of financial instruments for which market prices are not reliable or readily available. Under these procedures, the VC convenes on a regular basis to review such financial instruments and considers a number of factors, including significant unobservable valuation inputs, when arriving at fair value. The VC primarily employs a market-based approach which may use related or comparable assets or liabilities, recent transactions, market multiples, book values, and other relevant information for the investment to determine the fair value of the investment. An income-based valuation approach may also be used in which the anticipated future cash flows of the investment are discounted to calculate fair value. Discounts may also be applied due to the nature or duration of any restrictions on the disposition of the investments. Due to the inherent uncertainty of valuations of such investments, the fair values may differ significantly from the values that would have been used had an active market existed. The VC employs various methods for calibrating these
| franklintempleton.com | Semiannual Report | 25 |
FRANKLIN MUTUAL EUROPEAN FUND
NOTES TO FINANCIAL STATEMENTS (UNAUDITED)
1. Organization and Significant Accounting
Policies (continued)
a. Financial Instrument Valuation (continued)
valuation approaches including a regular review of key inputs and assumptions, transactional back-testing or disposition analysis, and reviews of any related market activity.
Trading in securities on foreign securities stock exchanges and OTC markets may be completed before 4 p.m. Eastern time. In addition, trading in certain foreign markets may not take place on every Fund’s business day. Occasionally, events occur between the time at which trading in a foreign security is completed and 4 p.m. Eastern time that might call into question the reliability of the value of a portfolio security held by the Fund. As a result, differences may arise between the value of the Fund’s portfolio securities as determined at the foreign market close and the latest indications of value at 4 p.m. Eastern time. In order to minimize the potential for these differences, the VC monitors price movements following the close of trading in foreign stock markets through a series of country specific market proxies (such as baskets of American Depositary Receipts, futures contracts and exchange traded funds). These price movements are measured against established trigger thresholds for each specific market proxy to assist in determining if an event has occurred that may call into question the reliability of the values of the foreign securities held by the Fund. If such an event occurs, the securities may be valued using fair value procedures, which may include the use of independent pricing services.
When the last day of the reporting period is a non-business day, certain foreign markets may be open on those days that the Fund’s NAV is not calculated, which could result in differences between the value of the Fund’s portfolio securities on the last business day and the last calendar day of the reporting period. Any significant security valuation changes due to an open foreign market are adjusted and reflected by the Fund for financial reporting purposes.
b. Foreign Currency Translation
Portfolio securities and other assets and liabilities denominated in foreign currencies are translated into U.S. dollars based on the exchange rate of such currencies against U.S. dollars on the date of valuation. The Fund may enter into foreign currency exchange contracts to facilitate transactions denominated in a foreign currency. Purchases and sales of securities, income and
expense items denominated in foreign currencies are translated into U.S. dollars at the exchange rate in effect on the transaction date. Portfolio securities and assets and liabilities denominated in foreign currencies contain risks that those currencies will decline in value relative to the U.S. dollar. Occasionally, events may impact the availability or reliability of foreign exchange rates used to convert the U.S. dollar equivalent value. If such an event occurs, the foreign exchange rate will be valued at fair value using procedures established and approved by the Board.
The Fund does not separately report the effect of changes in foreign exchange rates from changes in market prices on securities held. Such changes are included in net realized and unrealized gain or loss from investments in the Statement of Operations.
Realized foreign exchange gains or losses arise from sales of foreign currencies, currency gains or losses realized between the trade and settlement dates on securities transactions and the difference between the recorded amounts of dividends, interest, and foreign withholding taxes and the U.S. dollar equivalent of the amounts actually received or paid. Net unrealized foreign exchange gains and losses arise from changes in foreign exchange rates on foreign denominated assets and liabilities other than investments in securities held at the end of the reporting period.
c. Derivative Financial Instruments
The Fund invested in derivative financial instruments in order to manage risk or gain exposure to various other investments or markets. Derivatives are financial contracts based on an underlying or notional amount, require no initial investment or an initial net investment that is smaller than would normally be required to have a similar response to changes in market factors, and require or permit net settlement. Derivatives contain various risks including the potential inability of the counterparty to fulfill their obligations under the terms of the contract, the potential for an illiquid secondary market, and/or the potential for market movements which expose the Fund to gains or losses in excess of the amounts shown in the Statement of Assets and Liabilities. Realized gain and loss and unrealized appreciation and depreciation on these contracts for the period are included in the Statement of Operations.
Derivative counterparty credit risk is managed through a formal evaluation of the creditworthiness of all potential counterparties. The Fund attempts to reduce its exposure to
| 26 | Semiannual Report | franklintempleton.com |
FRANKLIN MUTUAL EUROPEAN FUND
NOTES TO FINANCIAL STATEMENTS (UNAUDITED)
counterparty credit risk on OTC derivatives, whenever possible, by entering into International Swaps and Derivatives Association (ISDA) master agreements with certain counterparties. These agreements contain various provisions, including but not limited to collateral requirements, events of default, or early termination. Termination events applicable to the counterparty include certain deteriorations in the credit quality of the counterparty. Termination events applicable to the Fund include failure of the Fund to maintain certain net asset levels and/or limit the decline in net assets over various periods of time. In the event of default or early termination, the ISDA master agreement gives the non-defaulting party the right to net and close-out all transactions traded, whether or not arising under the ISDA agreement, to one net amount payable by one counterparty to the other. However, absent an event of default or early termination, OTC derivative assets and liabilities are presented gross and not offset in the Statement of Assets and Liabilities. Early termination by the counterparty may result in an immediate payment by the Fund of any net liability owed to that counterparty under the ISDA agreement.
Collateral requirements differ by type of derivative. Collateral or initial margin requirements are set by the broker or exchange clearing house for exchange traded and centrally cleared derivatives. Initial margin deposited is held at the exchange and can be in the form of cash and/or securities. For OTC derivatives traded under an ISDA master agreement, posting of collateral is required by either the Fund or the applicable counterparty if the total net exposure of all OTC derivatives with the applicable counterparty exceeds the minimum transfer amount, which typically ranges from $100,000 to $250,000, and can vary depending on the counterparty and the type of the agreement. Generally, collateral is determined at the close of Fund business each day and any additional collateral required due to changes in derivative values may be delivered by the Fund or the counterparty the next business day, or within a few business days. Collateral pledged and/or received by the Fund for OTC derivatives, if any, is held in segregated accounts with the Fund’s custodian/counterparty broker and can be in the form of cash and/or securities. Unrestricted cash may be invested according to the Fund’s investment objectives. To the extent that the amounts due to the Fund from its counterparties are not subject to collateralization or are not fully collateralized, the Fund bears the risk of loss from counterparty non-performance.
The Fund entered into exchange traded futures contracts primarily to manage exposure to certain foreign currencies. A futures contract is an agreement between the Fund and a counterparty to buy or sell an asset at a specified price on a future date. Required initial margins are pledged by the Fund, and the daily change in fair value is accounted for as a variation margin payable or receivable in the Statement of Assets and Liabilities.
The Fund entered into OTC forward exchange contracts primarily to manage exposure to certain foreign currencies. A forward exchange contract is an agreement between the Fund and a counterparty to buy or sell a foreign currency at a specific exchange rate on a future date.
See Note 10 regarding other derivative information.
d. Securities Sold Short
The Fund is engaged in selling securities short, which obligates the Fund to replace a borrowed security with the same security at current fair value. The Fund incurs a loss if the price of the security increases between the date of the short sale and the date on which the Fund replaces the borrowed security. The Fund realizes a gain if the price of the security declines between those dates. Gains are limited to the price at which the Fund sold the security short, while losses are potentially unlimited in size.
The Fund is required to establish a margin account with the broker lending the security sold short. While the short sale is outstanding, the broker retains the proceeds of the short sale to the extent necessary to meet margin requirements until the short position is closed out. A deposit must also be maintained with the Fund’s custodian/counterparty broker consisting of cash and/or securities having a value equal to a specified percentage of the value of the securities sold short. The Fund is obligated to pay fees for borrowing the securities sold short and is required to pay the counterparty any dividends and/or interest due on securities sold short. Such dividends and/or interest and any security borrowing fees are recorded as an expense to the Fund. At June 30, 2018, the Fund had no securities sold short.
e. Income and Deferred Taxes
It is the Fund’s policy to qualify as a regulated investment company under the Internal Revenue Code. The Fund intends to distribute to shareholders substantially all of its taxable income
| franklintempleton.com | Semiannual Report | 27 |
FRANKLIN MUTUAL EUROPEAN FUND
NOTES TO FINANCIAL STATEMENTS (UNAUDITED)
1. Organization and Significant Accounting Policies (continued)
e. Income and Deferred Taxes (continued)
and net realized gains to relieve it from federal income and excise taxes. As a result, no provision for U.S. federal income taxes is required.
The Fund may be subject to foreign taxation related to income received, capital gains on the sale of securities and certain foreign currency transactions in the foreign jurisdictions in which it invests. Foreign taxes, if any, are recorded based on the tax regulations and rates that exist in the foreign markets in which the Fund invests. When a capital gain tax is determined to apply, the Fund records an estimated deferred tax liability in an amount that would be payable if the securities were disposed of on the valuation date.
As a result of several court cases, in certain countries across the European Union, the Fund filed additional tax reclaims for previously withheld taxes on dividends earned in those countries (EU reclaims). These additional filings are subject to various administrative proceedings by the local jurisdictions’ tax authorities within the European Union, as well as a number of related judicial proceedings. Income recognized, if any, for EU reclaims is reflected as other income in the Statement of Operations and any related receivable, if any, is reflected as European Union tax reclaims in the Statement of Assets and Liabilities. When uncertainty exists as to the ultimate resolution of these proceedings, the likelihood of receipt of these EU reclaims, and the potential timing of payment, no amounts are reflected in the financial statements. For U.S. income tax purposes, EU reclaims received by the Fund, if any, reduce the amounts of foreign taxes Fund shareholders can use as tax credits in their individual income tax returns.
The Fund may recognize an income tax liability related to its uncertain tax positions under U.S. GAAP when the uncertain tax position has a less than 50% probability that it will be sustained upon examination by the tax authorities based on its technical merits. As of June 30, 2018, the Fund has determined that no tax liability is required in its financial statements related to uncertain tax positions for any open tax years (or expected to be taken in future tax years). Open tax years are those that remain subject to examination and are based on the statute of limitations in each jurisdiction in which the Fund invests.
f. Security Transactions, Investment Income, Expenses and Distributions
Security transactions are accounted for on trade date. Realized gains and losses on security transactions are determined on a specific identification basis. Interest income and estimated expenses are accrued daily. Amortization of premium and accretion of discount on debt securities are included in interest income. Dividend income is recorded on the ex-dividend date except for certain dividends from securities where the dividend rate is not available. In such cases, the dividend is recorded as soon as the information is received by the Fund. Distributions to shareholders are recorded on the ex-dividend date. Distributable earnings are determined according to income tax regulations (tax basis) and may differ from earnings recorded in accordance with U.S. GAAP. These differences may be permanent or temporary. Permanent differences are reclassified among capital accounts to reflect their tax character. These reclassifications have no impact on net assets or the results of operations. Temporary differences are not reclassified, as they may reverse in subsequent periods.
Common expenses incurred by the Trust are allocated among the Funds based on the ratio of net assets of each Fund to the combined net assets of the Trust or based on the ratio of number of shareholders of each Fund to the combined number of shareholders of the Trust. Fund specific expenses are charged directly to the Fund that incurred the expense.
Realized and unrealized gains and losses and net investment income, excluding class specific expenses, are allocated daily to each class of shares based upon the relative proportion of net assets of each class. Differences in per share distributions by class are generally due to differences in class specific expenses.
g. Accounting Estimates
The preparation of financial statements in accordance with U.S. GAAP requires management to make estimates and assumptions that affect the reported amounts of assets and liabilities at the date of the financial statements and the amounts of income and expenses during the reporting period. Actual results could differ from those estimates.
h. Guarantees and Indemnifications
Under the Trust’s organizational documents, its officers and trustees are indemnified by the Trust against certain liabilities arising out of the performance of their duties to the Trust. Additionally, in the normal course of business, the Trust, on
| 28 | Semiannual Report | franklintempleton.com |
FRANKLIN MUTUAL EUROPEAN FUND
NOTES TO FINANCIAL STATEMENTS (UNAUDITED)
behalf of the Fund, enters into contracts with service providers that contain general indemnification clauses. The Trust’s maximum exposure under these arrangements is unknown as
this would involve future claims that may be made against the Trust that have not yet occurred. Currently, the Trust expects the risk of loss to be remote.
2. Shares of Beneficial Interest
At June 30, 2018, there were an unlimited number of shares authorized (without par value). Transactions in the Fund’s shares were as follows:
Six Months Ended June 30, 2018
| Year Ended December 31, 2017
| |||||||||||||||
| Shares | Amount | Shares | Amount | |||||||||||||
| Class Z Shares: | ||||||||||||||||
Shares sold | 10,461,559 | $ | 223,525,754 | 17,236,906 | $ | 350,944,087 | ||||||||||
Shares issued in reinvestment of distributions | — | — | 789,963 | 16,435,905 | ||||||||||||
Shares redeemed | (14,529,131 | ) | (304,739,427 | ) | (15,782,895 | ) | (324,020,807 | ) | ||||||||
|
| |||||||||||||||
Net increase (decrease) | (4,067,572 | ) | $ | (81,213,673 | ) | 2,243,974 | $ | 43,359,185 | ||||||||
|
| |||||||||||||||
| Class A Shares: | ||||||||||||||||
| Shares sold | 2,649,305 | $ | 54,377,038 | 15,602,529 | $ | 310,200,219 | ||||||||||
| Shares issued in reinvestment of distributions | — | — | 287,521 | 5,802,513 | ||||||||||||
| Shares redeemed | (4,765,269 | ) | (97,725,253 | ) | (21,954,991 | ) | (434,593,756 | ) | ||||||||
|
| |||||||||||||||
Net increase (decrease) | (2,115,964 | ) | $ | (43,348,215 | ) | (6,064,941 | ) | $ | (118,591,024 | ) | ||||||
|
| |||||||||||||||
| Class C Shares: | ||||||||||||||||
Shares sold | 314,123 | $ | 6,466,775 | 1,180,124 | $ | 23,513,530 | ||||||||||
Shares issued in reinvestment of distributions | — | — | 32,119 | 639,507 | ||||||||||||
Shares redeemed | (1,366,744 | ) | (27,993,027 | ) | (3,606,833 | ) | (71,499,733 | ) | ||||||||
|
| |||||||||||||||
Net increase (decrease) | (1,052,621 | ) | $ | (21,526,252 | ) | (2,394,590 | ) | $ | (47,346,696 | ) | ||||||
|
| |||||||||||||||
| Class R Shares: | ||||||||||||||||
Shares sold | 6,988 | $ | 141,489 | 16,679 | $ | 329,815 | ||||||||||
Shares issued in reinvestment of distributions | — | — | 382 | 7,585 | ||||||||||||
Shares redeemed | (3,299 | ) | (66,760 | ) | (10,067 | ) | (196,134 | ) | ||||||||
|
| |||||||||||||||
Net increase (decrease) | 3,689 | $ | 74,729 | 6,994 | $ | 141,266 | ||||||||||
|
| |||||||||||||||
| Class R6 Shares: | ||||||||||||||||
Shares sold | 558,334 | $ | 11,647,483 | 3,235,565 | $ | 65,830,080 | ||||||||||
Shares issued in reinvestment of distributions | — | — | 185,294 | 3,853,120 | ||||||||||||
Shares redeemed | (1,323,905 | ) | (28,364,324 | ) | (5,580,242 | ) | (115,540,368 | ) | ||||||||
|
| |||||||||||||||
Net increase (decrease) | (765,571 | ) | $ | (16,716,841 | ) | (2,159,383 | ) | $ | (45,857,168 | ) | ||||||
|
| |||||||||||||||
3. Transactions with Affiliates
Franklin Resources, Inc. is the holding company for various subsidiaries that together are referred to as Franklin Templeton Investments. Certain officers and trustees of the Fund are also officers and/or directors of the following subsidiaries:
| Subsidiary | Affiliation | |
Franklin Mutual Advisers, LLC (Franklin Mutual) | Investment manager | |
Franklin Templeton Services, LLC (FT Services) | Administrative manager | |
Franklin Templeton Distributors, Inc. (Distributors) | Principal underwriter | |
Franklin Templeton Investor Services, LLC (Investor Services) | Transfer agent |
| franklintempleton.com | Semiannual Report | 29 |
FRANKLIN MUTUAL EUROPEAN FUND
NOTES TO FINANCIAL STATEMENTS (UNAUDITED)
3. Transactions with Affiliates (continued)
a. Management Fees
The Fund pays an investment management fee to Franklin Mutual based on the average daily net assets of the Fund as follows:
| Annualized Fee Rate | Net Assets | |
0.875% | Up to and including $1 billion | |
0.845% | Over $1 billion, up to and including $2 billion | |
0.825% | Over $2 billion, up to and including $5 billion | |
0.805% | In excess of $5 billion |
For the period ended June 30, 2018, the annualized gross effective investment management fee rate was 0.853% of the Fund’s average daily net assets.
b. Administrative Fees
Under an agreement with Franklin Mutual, FT Services provides administrative services to the Fund. The fee is paid by Franklin Mutual based on the Fund’s average daily net assets, and is not an additional expense of the Fund.
c. Distribution Fees
The Board has adopted distribution plans for each share class, with the exception of Class Z and Class R6 shares, pursuant to Rule 12b-1 under the 1940 Act. Under the Fund’s Class A reimbursement distribution plan, the Fund reimburses Distributors for costs incurred in connection with the servicing, sale and distribution of the Fund’s shares up to the maximum annual plan rate. Under the Class A reimbursement distribution plan, costs exceeding the maximum for the current plan year cannot be reimbursed in subsequent periods. In addition, under the Fund’s Class C and R compensation distribution plans, the Fund pays Distributors for costs incurred in connection with the servicing, sale and distribution of the Fund’s shares up to the maximum annual plan rate for each class. The plan year, for purposes of monitoring compliance with the maximum annual plan rates, is February 1 through January 31.
The maximum annual plan rates, based on the average daily net assets, for each class, are as follows:
Class A | 0.35% | |||
Class C | 1.00% | |||
Class R | 0.50% |
The Board has set the current rate at 0.25% per year for Class A shares until further notice and approval by the Board.
d. Sales Charges/Underwriting Agreements
Front-end sales charges and contingent deferred sales charges (CDSC) do not represent expenses of the Fund. These charges are deducted from the proceeds of sales of Fund shares prior to investment or from redemption proceeds prior to remittance, as applicable. Distributors has advised the Fund of the following commission transactions related to the sales and redemptions of the Fund’s shares for the period:
Sales charges retained net of commissions paid to unaffiliated brokers/dealers. | $36,325 | |||
CDSC retained | $12,110 |
| 30 | Semiannual Report | franklintempleton.com |
FRANKLIN MUTUAL EUROPEAN FUND
NOTES TO FINANCIAL STATEMENTS (UNAUDITED)
e. Transfer Agent Fees
Each class of shares pays transfer agent fees to Investor Services for its performance of shareholder servicing obligations. Effective November 1, 2017, the fees are based on an annualized asset based fee of 0.02% plus a transaction based fee. Prior to November 1, 2017, the fees were account based fees that varied based on fund or account type. In addition, each class reimburses Investor Services for out of pocket expenses incurred and, except for Class R6, reimburses shareholder servicing fees paid to third parties. These fees are allocated daily based upon their relative proportion of such classes’ aggregate net assets. Class R6 pays Investor Services transfer agent fees specific to that class.
For the period ended June 30, 2018, the Fund paid transfer agent fees of $1,573,369, of which $562,062 was retained by Investor Services.
f. Waiver and Expense Reimbursements
Investor Services has voluntarily agreed in advance to waive or limit its fees so that the Class R6 transfer agent fees do not exceed 0.02% based on the average net assets of the class. Investor Services may discontinue this waiver in the future.
g. Other Affiliated Transactions
At June 30, 2018, one or more of the funds in Franklin Fund Allocator Series owned 9.6% of the Fund’s outstanding shares.
h. Interfund Transactions
The Fund engaged in purchases and sales of investments with funds or other accounts that have common investment managers (or affiliated investment managers), directors, trustees or officers. During the period ended June 30, 2018, these purchase and sale transactions aggregated $1,820,107 and $—, respectively.
4. Expense Offset Arrangement
The Fund has entered into an arrangement with its custodian whereby credits realized as a result of uninvested cash balances are used to reduce a portion of the Fund’s custodian expenses. During the period ended June 30, 2018, the custodian fees were reduced as noted in the Statement of Operations.
5. Independent Trustees’ Retirement Plan
On January 1, 1993, the Trust adopted an Independent Trustees’ Retirement Plan (Plan). The Plan is an unfunded defined benefit plan that provides benefit payments to Trustees whose length of service and retirement age meets the eligibility requirements of the Plan. Benefits under the Plan are based on years of service and fees paid to each trustee at the time of retirement. Effective in December 1996, the Plan was closed to new participants.
During the period ended June 30, 2018, the Fund’s projected benefit obligation and benefit payments under the Plan were as follows:
aProjected benefit obligation at June 30, 2018 | $94,475 | |||
bIncrease in projected benefit obligation | $1,035 | |||
Benefit payments made to retired trustees | $(1,280 | ) |
aThe projected benefit obligation is included in trustees’ fees and expenses in the Statement of Assets and Liabilities.
bThe increase in projected benefit obligation is included in trustees’ fees and expenses in the Statement of Operations.
| franklintempleton.com | Semiannual Report | 31 |
FRANKLIN MUTUAL EUROPEAN FUND
NOTES TO FINANCIAL STATEMENTS (UNAUDITED)
6. Income Taxes
For tax purposes, capital losses may be carried over to offset future capital gains, if any.
At December 31, 2017, the capital loss carryforwards were as follows:
Capital loss carryforwards not subject to expiration: | ||||
Short term | $ | 82,846,650 | ||
Long term | 171,281,334 | |||
|
| |||
Total capital loss carryforwards | $ | 254,127,984 | ||
|
|
At June 30, 2018, the cost of investments and net unrealized appreciation (depreciation) for income tax purposes were as follows:
Cost of investments | $ | 2,197,410,718 | ||
|
| |||
Unrealized appreciation | $ | 353,256,995 | ||
Unrealized depreciation | (196,859,684 | ) | ||
|
| |||
Net unrealized appreciation (depreciation) | $ | 156,397,311 | ||
|
|
Differences between income and/or capital gains as determined on a book basis and a tax basis are primarily due to differing treatment of foreign currency transactions.
7. Investment Transactions
Purchases and sales of investments (excluding short term securities) for the period ended June 30, 2018, aggregated $358,396,119 and $362,294,174, respectively.
8. Concentration of Risk
Investing in foreign securities may include certain risks and considerations not typically associated with investing in U.S. securities, such as fluctuating currency values and changing local and regional economic, political and social conditions, which may result in greater market volatility. In addition, certain foreign securities may not be as liquid as U.S. securities.
9. Restricted Securities
The Fund invests in securities that are restricted under the Securities Act of 1933 (1933 Act). Restricted securities are often purchased in private placement transactions, and cannot be sold without prior registration unless the sale is pursuant to an exemption under the 1933 Act. Disposal of these securities may require greater effort and expense, and prompt sale at an acceptable price may be difficult. The Fund may have registration rights for restricted securities. The issuer generally incurs all registration costs.
At June 30, 2018, investments in restricted securities, excluding securities exempt from registration under the 1933 Act deemed to be liquid, were as follows:
| Shares | Issuer | Acquisition Date | Cost | Value | ||||||||||||
| 16,127,149 | Euro Wagon LP (Value is —% of Net Assets) | 12/08/05 - 1/02/08 | $6,282,509 | $— | ||||||||||||
|
| |||||||||||||||
| 32 | Semiannual Report | franklintempleton.com |
FRANKLIN MUTUAL EUROPEAN FUND
NOTES TO FINANCIAL STATEMENTS (UNAUDITED)
10. Other Derivative Information
At June 30, 2018, the Fund’s investments in derivative contracts are reflected in the Statement of Assets and Liabilities as follows:
Asset Derivatives | Liability Derivatives | |||||||||||
Derivative Contracts Not Accounted for as Hedging Instruments | Statement of Assets and Liabilities | Fair Value | Statement of Assets and Liabilities | Fair Value | ||||||||
Foreign exchange contracts | Variation margin on futures contracts | $8,087,656 | a | Variation margin on futures contracts | $— | |||||||
Unrealized appreciation on OTC forward exchange contracts | 56,646,071 | Unrealized depreciation on OTC forward exchange contracts | 602,369 | |||||||||
|
|
|
| |||||||||
Totals | $64,733,727 | $602,369 | ||||||||||
|
|
|
| |||||||||
aThis amount reflects the cumulative appreciation (depreciation) of futures contracts as reported in the Statement of Investments. Only the variation margin receivable/ payable at period end is separately reported within the Statement of Assets and Liabilities. Prior variation margin movements were recorded to cash upon receipt or payment.
For the period ended June 30, 2018, the effect of derivative contracts in the Fund’s Statement of Operations was as follows:
Derivative Contracts Not Accounted for as Hedging Instruments | Statement of Operations Location | Net Realized Gain (Loss) for the Period | Statement of Operations Location | Net Change in Unrealized Appreciation (Depreciation) for the Period | ||||||||
Net realized gain (loss) from: | Net change in unrealized appreciation (depreciation) on: | |||||||||||
Foreign exchange contracts | Forward exchange contracts | $(39,050,563 | ) | Forward exchange contracts | $82,155,012 | |||||||
Futures contracts | 9,551,522 | Futures contracts | 18,921,283 | |||||||||
|
|
|
| |||||||||
Totals | $(29,499,041 | ) | $101,076,295 | |||||||||
|
|
|
| |||||||||
For the period ended June 30, 2018, the average month end notional amount of futures contracts represented $725,124,171. The average month end contract value of forward exchange contracts was $1,293,071,390.
At June 30, 2018, the Fund’s OTC derivative assets and liabilities are as follows:
Gross Amounts of Assets and Liabilities Presented | ||||||||
| Assetsa | Liabilitiesa | |||||||
| Derivatives | ||||||||
Forward exchange contracts | $56,646,071 | $602,369 | ||||||
|
| |||||||
aAbsent an event of default or early termination, OTC derivative assets and liabilities are presented gross and not offset in the Statement of Assets and Liabilities.
| franklintempleton.com | Semiannual Report | 33 |
FRANKLIN MUTUAL EUROPEAN FUND
NOTES TO FINANCIAL STATEMENTS (UNAUDITED)
10. Other Derivative Information (continued)
At June 30, 2018, the Fund’s OTC derivative assets, which may be offset against the Fund’s OTC derivative liabilities and collateral received from the counterparty, are as follows:
| Amounts Not Offset in the Statement of Assets and Liabilities | ||||||||||||||||||||
Gross Amounts of | Financial Instruments Available for Offset | Financial Instruments Collateral Receiveda,b | Cash Collateral Received | Net Amount (Not less than zero) | ||||||||||||||||
| Counterparty | ||||||||||||||||||||
BOFA | $ 6,424,305 | $ (38,033 | ) | $ (6,386,272 | ) | $ — | $ — | |||||||||||||
BONY | 16,569,167 | (36,938 | ) | (16,532,229 | ) | — | — | |||||||||||||
HSBK | 8,779,606 | (22,860 | ) | (8,756,746 | ) | — | — | |||||||||||||
SSBT | 15,069,703 | (10 | ) | (15,069,693 | ) | — | — | |||||||||||||
UBSW | 9,803,290 | (504,528 | ) | (9,298,762 | ) | — | — | |||||||||||||
|
| |||||||||||||||||||
Total | $56,646,071 | $(602,369 | ) | $(56,043,702 | ) | $ — | $ — | |||||||||||||
|
| |||||||||||||||||||
At June 30, 2018, the Fund’s OTC derivative liabilities, which may be offset against the Fund’s OTC derivative assets and collateral pledged to the counterparty, are as follows:
| Amounts Not Offset in the Statement of Assets and Liabilities | ||||||||||||||||||||
Gross Amounts of | Financial Instruments Available for Offset | Financial Instruments Collateral Pledged | Cash Collateral Pledged | Net Amount (Not less than zero) | ||||||||||||||||
| Counterparty | ||||||||||||||||||||
BOFA | $ 38,033 | $ (38,033 | ) | $ — | $ — | $ — | ||||||||||||||
BONY | 36,938 | (36,938 | ) | — | — | — | ||||||||||||||
HSBK | 22,860 | (22,860 | ) | — | — | — | ||||||||||||||
SSBT | 10 | (10 | ) | — | — | — | ||||||||||||||
UBSW | 504,528 | (504,528 | ) | — | — | — | ||||||||||||||
|
| |||||||||||||||||||
Total | $602,369 | $(602,369 | ) | $ — | $ — | $ — | ||||||||||||||
|
| |||||||||||||||||||
aAt June 30, 2018, the Fund received U.K. Treasury Bonds and U.S. Treasury Bills, Bonds and Notes as collateral for derivatives.
bIn some instances, the collateral amounts disclosed in the table above were adjusted due to the requirement to limit collateral amounts to avoid the effect of overcollateralization. Actual collateral received and/or pledged may be more than the amounts disclosed herein.
See Note 1(c) regarding derivative financial instruments.
See Abbreviations on page 36.
| 34 | Semiannual Report | franklintempleton.com |
FRANKLIN MUTUAL EUROPEAN FUND
NOTES TO FINANCIAL STATEMENTS (UNAUDITED)
11. Holdings of 5% Voting Securities of Portfolio Companies
The 1940 Act defines “affiliated companies” to include investments in portfolio companies in which a fund owns 5% or more of the outstanding voting securities. During the period ended June 30, 2018, investments in “affiliated companies” were as follows:
| Name of Issuer | Number of Shares Held at Beginning of Period | Gross Additions | Gross Reductions | Number of at End | Value of | Dividend Income | Realized (Loss) | Net Change in Unrealized Appreciation (Depreciation) | ||||||||||||||||||||||||
| Controlled Affiliatesa | ||||||||||||||||||||||||||||||||
Euro Wagon LP (Value is —% of Net Assets) | 16,127,149 | — | — | 16,127,149 | $— | $— | $— | $— | ||||||||||||||||||||||||
|
| |||||||||||||||||||||||||||||||
aIssuer in which the Fund owns 25% or more of the outstanding voting securities.
12. Credit Facility
The Fund, together with other U.S. registered and foreign investment funds (collectively, Borrowers), managed by Franklin Templeton Investments, are borrowers in a joint syndicated senior unsecured credit facility totaling $2 billion (Global Credit Facility) which matures on February 8, 2019. This Global Credit Facility provides a source of funds to the Borrowers for temporary and emergency purposes, including the ability to meet future unanticipated or unusually large redemption requests.
Under the terms of the Global Credit Facility, the Fund shall, in addition to interest charged on any borrowings made by the Fund and other costs incurred by the Fund, pay its share of fees and expenses incurred in connection with the implementation and maintenance of the Global Credit Facility, based upon its relative share of the aggregate net assets of all of the Borrowers, including an annual commitment fee of 0.15% based upon the unused portion of the Global Credit Facility. These fees are reflected in other expenses in the Statement of Operations. During the period ended June 30, 2018, the Fund did not use the Global Credit Facility.
13. Fair Value Measurements
The Fund follows a fair value hierarchy that distinguishes between market data obtained from independent sources (observable inputs) and the Fund’s own market assumptions (unobservable inputs). These inputs are used in determining the value of the Fund’s financial instruments and are summarized in the following fair value hierarchy:
| • | Level 1 – quoted prices in active markets for identical financial instruments |
| • | Level 2 – other significant observable inputs (including quoted prices for similar financial instruments, interest rates, prepayment speed, credit risk, etc.) |
| • | Level 3 – significant unobservable inputs (including the Fund’s own assumptions in determining the fair value of financial instruments) |
The input levels are not necessarily an indication of the risk or liquidity associated with financial instruments at that level.
For movements between the levels within the fair value hierarchy, the Fund has adopted a policy of recognizing the transfers as of the date of the underlying event which caused the movement.
| franklintempleton.com | Semiannual Report | 35 |
FRANKLIN MUTUAL EUROPEAN FUND
NOTES TO FINANCIAL STATEMENTS (UNAUDITED)
13. Fair Value Measurements (continued)
A summary of inputs used as of June 30, 2018, in valuing the Fund’s assets and liabilities carried at fair value, is as follows:
| Level 1 | Level 2 | Level 3 | Total | |||||||||||||
| Assets: | ||||||||||||||||
Investments in Securities:a | ||||||||||||||||
Equity Investments:b | $ | 54,838,032 | $ | 8,857,450 | $ | — | $ | 63,695,482 | ||||||||
All Other Equity Investments | 2,080,799,554 | — | — | c | 2,080,799,554 | |||||||||||
Short Term Investments | 138,061,549 | 7,100,000 | — | 145,161,549 | ||||||||||||
|
| |||||||||||||||
Total Investments in Securities | $ | 2,273,699,135 | $ | 15,957,450 | $ | — | $ | 2,289,656,585 | ||||||||
|
| |||||||||||||||
Other Financial Instruments: | ||||||||||||||||
Futures Contracts | $ | 8,087,656 | $ | — | $ | — | $ | 8,087,656 | ||||||||
Forward Exchange Contracts | — | 56,646,071 | — | 56,646,071 | ||||||||||||
|
| |||||||||||||||
Total Other Financial Instruments | $ | 8,087,656 | $ | 56,646,071 | $ | — | $ | 64,733,727 | ||||||||
|
| |||||||||||||||
| Liabilities: | ||||||||||||||||
Other Financial Instruments: | ||||||||||||||||
Forward Exchange Contracts | $ | — | $ | 602,369 | $ | — | $ | 602,369 | ||||||||
|
| |||||||||||||||
aFor detailed categories, see the accompanying Statement of Investments.
bIncludes common and preferred stocks.
cIncludes securities determined to have no value at June 30, 2018.
A reconciliation of assets in which Level 3 inputs are used in determining fair value is presented when there are significant Level 3 financial instruments at the beginning and/or end of the period.
14. Subsequent Events
The Fund has evaluated subsequent events through the issuance of the financial statements and determined that no events have occurred that require disclosure, except for the following:
On February 27, 2018, the Board approved an automatic conversion feature for Class C that will convert shareholders’ Class C shares into Class A shares after they have been held for 10 years. The conversion feature will become effective on a future date prior to the calendar year end of 2018. Further details are disclosed in the Fund’s Prospectus.
On May 17, 2018, the Board approved changes to certain front-end sales charges and dealer commissions on Class A shares. The changes will become effective on or about September 10, 2018. Further details are disclosed in the Fund’s Prospectus.
Abbreviations
| Counterparty | Currency | Selected Portfolio | ||||||||
| BOFA | Bank of America Corp. | EUR | Euro | ADR | American Depositary Receipt | |||||
| BONY | The Bank of New York Mellon Corp. | GBP | British Pound | FHLB | Federal Home Loan Bank | |||||
| HSBK | HSBC Bank PLC | USD | United States Dollar | |||||||
| SSBT | State Street Bank and Trust Co., N.A. | |||||||||
| UBSW | UBS AG | |||||||||
| 36 | Semiannual Report | franklintempleton.com |
FRANKLIN MUTUAL SERIES FUNDS
FRANKLIN MUTUAL EUROPEAN FUND
Shareholder Information
Board Approval of Investment Management Agreements
FRANKLIN MUTUAL SERIES FUNDS
Franklin Mutual European Fund
(Fund)
The Board of Trustees (Board), including a majority of trustees that are not “interested persons” as such term is defined in section 2(a)(19) of the Investment Company Act of 1940 (hereinafter referred to as “independent trustees”), at an in-person meeting held on May 17, 2018, unanimously approved the renewal of the Fund’s investment management agreement. Prior to a meeting of all of the trustees for the purpose of considering such renewal, the independent trustees participated in two other meetings held in connection with the renewal process. Throughout the process, the independent trustees received assistance and advice from and met separately with independent counsel. The independent trustees met with and interviewed officers of the investment manager (including portfolio managers), the transfer agent and shareholder services group and the distributor. In approving the renewal of the investment management agreement for the Fund, the Board, including the independent trustees, determined that the investment management fee structure was fair and reasonable and that continuance of the agreement was in the best interests of the Fund and its shareholders.
In reaching their decision on the investment management agreement, the trustees took into account information furnished throughout the year at regular Board meetings, as well as information specifically requested and furnished for the renewal process, which culminated in the meetings referred to above for the specific purpose of considering such agreement. Information furnished throughout the year included, among others, reports on the Fund’s investment performance, expenses, portfolio composition, portfolio brokerage execution, client commission arrangements, derivatives, securities lending, asset segregation, portfolio turnover, Rule 12b-1 plan, distribution, shareholder servicing, legal and compliance matters, pricing of securities, sales and redemptions, and marketing support payments made to financial intermediaries, as well as a third-party survey of transfer agent fees charged to funds within the Franklin Templeton Investments (FTI) complex in comparison with those charged to other fund complexes deemed comparable. Also, related financial statements and other information about the scope and quality of services provided by the investment manager and its affiliates and enhancements to such services over the past year were provided. In addition, the trustees received periodic reports
throughout the year and during the renewal process relating to compliance with the Fund’s investment policies and restrictions. During the renewal process, the independent trustees considered the investment manager’s methods of operation within the Franklin Templeton group and its activities on behalf of other clients. The Board also noted that it received an annual report on all payments made by FTI or the Fund to financial intermediaries engaged in the sale of Fund shares, as well as a memorandum relating to third-party servicing arrangements in response to a Guidance Update from the U.S. Securities and Exchange Commission (SEC) relating to mutual fund distribution and sub-accounting fees.
The information obtained by the trustees during the renewal process also included a special report prepared by Broadridge Financial Solutions, Inc., an independent third-party analyst that utilizes data from Lipper, Inc. (“Lipper”), comparing the Fund’s investment performance and expenses with those of other mutual funds deemed comparable to the Fund as selected by Lipper (Broadridge Section 15(c) Report). The trustees reviewed the Broadridge Section 15(c) Report and its usefulness in the renewal process with respect to matters such as comparative fees, expenses, expense ratios, performance and volatility. They concluded that the report continues to be a reliable resource in the performance of their duties.
In addition, the trustees received a Profitability Study (Profitability Study) prepared by management discussing the profitability to FTI from its overall U.S. fund operations, as well as on an individual fund-by-fund basis. Over the past year, the Board and counsel to the independent trustees continued to receive reports on management’s handling of recent regulatory inquiries and pending legal actions against the investment manager and its affiliates. The independent trustees were satisfied with the actions taken to date by management in response to such regulatory and legal matters.
The trustees reviewed the personnel, operations, financial condition, and investment management capabilities, methodologies and resources of the investment manager. As part of this review, particular attention was given to management’s diligent risk management program, including continual monitoring and management of cybersecurity, liquidity and counterparty credit risk, and attention given to derivatives and other complex instruments that are held and expected to be held by the Fund and how such instruments are used to carry out the Fund’s investment goal(s). The Board also took into account, among other things, management’s efforts in establishing a global credit facility for the benefit of the Fund and other accounts managed by FTI to provide a source of cash
| franklintempleton.com | Semiannual Report | 37 |
FRANKLIN MUTUAL SERIES FUNDS
FRANKLIN MUTUAL EUROPEAN FUND
SHAREHOLDER INFORMATION
for temporary and emergency purposes or to meet unusual redemption requests as well as the strong financial position of the investment manager’s parent company and its commitment to the mutual fund business. The Board noted management’s continuing efforts and expenditures in establishing effective business continuity plans and developing strategies to address areas of heightened concern in the mutual fund industry, such as cybersecurity and liquidity risk management. The Board also recognized management’s commitment to facilitating Board oversight of particular areas, including derivatives and payments to intermediaries, by enhanced reporting.
In addition to the above and other matters considered by the trustees throughout the course of the year, the following discussion relates to certain primary factors relevant to the Board’s decision. This discussion of the information and factors considered by the Board (including the information and factors discussed above) is not intended to be exhaustive, but rather summarizes certain factors considered by the Board. In view of the wide variety of factors considered, the Board did not, unless otherwise noted, find it practicable to quantify or otherwise assign relative weights to the foregoing factors. In addition, individual trustees may have assigned different weights to various factors.
NATURE, EXTENT AND QUALITY OF SERVICES. The trustees reviewed the nature, extent and quality of the services provided, and to be provided, by the investment manager. The trustees cited the investment manager’s ability to implement the Fund’s disciplined value investment approach and its long-term relationship with the Fund as reasons that shareholders choose to invest, and remain invested, in the Fund. The trustees reviewed the Fund’s portfolio management team, including its performance, staffing, skills and compensation program. With respect to portfolio manager compensation, management assured the trustees that the Fund’s long-term performance is a significant component of incentive-based compensation and noted that a portion of a portfolio manager’s incentive-based compensation is paid in shares of pre-designated funds from the portfolio manager’s fund management area. The trustees noted that the portfolio manager compensation program aligned the interests of the portfolio managers with that of shareholders of the Fund. The trustees discussed with management various other products, portfolios and entities that are advised by the investment manager and the allocation of assets and expenses among and within them, as well as their relative fees and reasons for differences with respect thereto and any potential conflicts. During regular Board meetings and the aforementioned meetings of the independent trustees, the trustees
received reports and presentations on the investment manager’s best execution trading policies. The trustees considered periodic reports provided to them showing that the investment manager complied with the investment policies and restrictions of the Fund as well as other reports periodically furnished to the Board covering matters such as the compliance of portfolio managers and other management personnel with the code of ethics covering the investment management personnel, the adherence to fair value pricing procedures established by the Board and the accuracy of net asset value calculations. The Board noted the extent of the benefits provided to Fund shareholders from being part of the Franklin Templeton group of funds, including the right to exchange investments between funds (same class) without a sales charge, the ability to reinvest Fund dividends into other funds and the right to combine holdings of other funds to obtain reduced sales charges. The Board considered the investment manager’s significant efforts in developing and implementing compliance procedures established in accordance with SEC and other requirements.
The Board considered the nature, extent and quality of the services to be provided under the Fund’s other service agreements to determine that, on an overall basis, Fund shareholders were well served. In this connection, the Board also took into account transfer agent and shareholder services provided to Fund shareholders by an affiliate of the investment manager, noting continuing expenditures by management to increase and improve the scope of such services and favorable periodic reports on shareholder services conducted by independent third parties. While such considerations directly affected the trustees’ decision in renewing the Fund’s transfer agent and shareholder services agreement, the Board also considered these commitments as incidental benefits to Fund shareholders deriving from the investment management relationship.
Based on their review, the trustees were satisfied with the nature and quality of the overall services provided, and to be provided, by the investment manager and its affiliates to the Fund and its shareholders and were confident in the abilities of the management team to continue the disciplined value investment approach of the Fund and to provide quality services to the Fund and its shareholders.
INVESTMENT PERFORMANCE. The trustees reviewed and placed significant emphasis on the investment performance of the Fund over the one-, three-, five- and 10-year periods ended December 31, 2017. They considered the history of successful performance of the Fund relative to various benchmarks. As part of their review, they inquired of
| 38 | Semiannual Report | franklintempleton.com |
FRANKLIN MUTUAL SERIES FUNDS
FRANKLIN MUTUAL EUROPEAN FUND
SHAREHOLDER INFORMATION
management regarding benchmarks, style drift and restrictions on permitted investments. Consideration was also given to performance in the context of available levels of cash during the periods.
The trustees had meetings during the year, including the meetings referred to above held in connection with the renewal process, with the Fund’s portfolio managers to discuss performance and the management of the Fund. In addition to the materials provided by management in connection with the renewal process, the independent trustees requested supplemental information and additional presentations from the investment manager and senior management of FTI regarding the performance of the investment manager and the Fund. As part of these presentations, it was noted that senior management of FTI is conducting a review of the investment manager and the Fund and will report the results thereof to the independent trustees when completed. In addition, particular attention in assessing performance was given to the Broadridge Section 15(c) Report. That report showed the investment performance of the Fund (Class A shares) in comparison to other funds determined comparable by Lipper.
The comparable funds to the Fund, as chosen by Lipper, included all retail and institutional European region funds. The Fund had total returns in the lowest performing quintile for the one-year period ended December 31, 2017, and had annualized total returns for the three- and five-year periods in the lowest and second-lowest performing quintiles, respectively. The trustees noted that the Fund’s total return on an annualized basis for the 10-year period ended December 31, 2017 was in the second-best performing quintile. The trustees discussed with management the reasons for the relative underperformance for the one- and three-year periods ended December 31, 2017. Taking into account such discussions and intending to continue to monitor future performance, the Board did not believe such comparative performance warranted any change in portfolio management, and concluded that the Fund had performed in an acceptable manner in the context of the Fund’s goals.
The trustees also compared Fund performance to other industry benchmarks, including measures of risk-adjusted performance of a fund, as part of their evaluation of investment performance. The trustees concluded that the Fund had continued to perform well in comparison to its various benchmarks and in the context of the Fund’s goals.
COMPARATIVE EXPENSES AND MANAGEMENT PROFITABILITY. The trustees considered the cost of the services provided and to be provided and the profits realized by
the investment manager and its affiliates from their respective relationships with the Fund. As part of the renewal process, the trustees explored with management the trends in expense ratios over the past three fiscal years and the reasons for any increases in the Fund’s expense ratios (or components thereof). In considering the appropriateness of the management fee and other expenses charged to the Fund, the Board took into account various factors including investment performance and matters relating to Fund operations, including, but not limited to, the quality and experience of its portfolio managers and research staff. Consideration was also given to a comparative analysis in the Broadridge Section 15(c) Report of the investment management fee and total expense ratio of the Fund in comparison with those of a group of other funds selected by Lipper as its appropriate Lipper expense group. Lipper expense data is based upon information taken from each fund’s most recent annual report, which reflects historical asset levels that may be quite different from those currently existing, particularly in a period of market volatility. While recognizing such inherent limitation and the fact that expense ratios generally increase as assets decline and decrease as assets grow, the Board believed the independent analysis conducted by Lipper to be an appropriate measure of comparative expenses.
In reviewing comparative costs, emphasis was given to the Fund’s contractual management fee in comparison with the contractual management fee that would have been charged by other funds within its Lipper expense group assuming they were similar in size to the Fund, as well as the actual total expenses of the Fund in comparison with those of its Lipper expense group. The Lipper contractual management fee analysis includes administrative charges as being part of the management fee, and total expenses, for comparative consistency, are shown by Lipper for Fund Class A shares.
The Fund’s contractual management fee rate was in the second-most expensive quintile of its Lipper expense group and its total expenses were in the second-least expensive quintile of such group. The Board was satisfied with such comparative fees and expenses.
The trustees also reviewed the Profitability Study addressing profitability of Franklin Resources, Inc., from its overall U.S. fund business, as well as profitability to the Fund’s investment manager and its affiliates, from providing investment management and other services to the Fund during the 12-month period ended September 30, 2017, the most recent fiscal year-end of Franklin Resources, Inc. The trustees reviewed the basis on which such reports are prepared and the
| franklintempleton.com | Semiannual Report | 39 |
FRANKLIN MUTUAL SERIES FUNDS
FRANKLIN MUTUAL EUROPEAN FUND
SHAREHOLDER INFORMATION
cost allocation methodology utilized in the Profitability Study, it being recognized that allocation methodologies may each be reasonable while producing different results. In this respect, the Board noted that the reasonableness of the cost allocation methodologies was reviewed by independent accountants on an every other year basis.
The independent trustees met with management to discuss the Profitability Study. This included, among other things, a comparison of investment management income with investment management expenses of the Fund; comparison of underwriting revenues and expenses; the relative relationship of investment management and underwriting expenses; shareholder servicing profitability; economies of scale; and the relative contribution of the Fund to the profitability of the investment manager and its parent. In discussing the Profitability Study with the Board, the investment manager stated its belief that the costs incurred in establishing the infrastructure necessary to operate the type of mutual fund operations conducted by it and its affiliates may not be fully reflected in the expenses allocated to the Fund in determining its profitability.
The Board also took into account management’s expenditures in improving shareholder services provided to the Fund, as well as the need to meet additional regulatory and compliance requirements. The trustees also considered the extent to which the investment manager may derive ancillary benefits from Fund operations, including those derived from economies of scale, discussed below, the allocation of Fund brokerage and the use of commission dollars to pay for research and other similar services.
Based upon their consideration of all these factors, the trustees determined that the level of profits realized by the investment manager and its affiliates in providing services to the Fund was not excessive in view of the nature, quality and extent of services provided.
ECONOMIES OF SCALE. The Board considered economies of scale realized by the investment manager and its affiliates as the Fund grows larger and the extent to which they are shared with Fund shareholders, as for example, in the level of the investment management fee charged, in the quality and efficiency of services rendered and in increased capital commitments benefiting the Fund directly or indirectly. While recognizing that any precise determination is inherently subjective, the trustees noted that, based upon the Profitability Study, as some funds increase in size, at some point economies of scale may result in the investment manager realizing a larger profit margin on investment management services provided to
such a fund. The trustees also noted that benefits of economies of scale will be shared with Fund shareholders due to the decline in the effective investment management fee rate as breakpoints are achieved by the Fund.
The trustees noted that breakpoints had been instituted as part of the Fund’s investment management fee and that the Board regularly evaluates whether additional breakpoints are appropriate. The trustees assessed the savings to shareholders resulting from such breakpoints and believed they were, and continue to be, appropriate and they agreed to continue to monitor the appropriateness of the breakpoints. The trustees also considered the effects an increase in assets under management would have on the investment management fee and expense ratio of the Fund. To the extent further economies of scale may be realized by the investment manager and its affiliates, the Board believed the investment management and administrative fees provide a sharing of benefits with the Fund and its shareholders.
Proxy Voting Policies and Procedures
The Fund’s investment manager has established Proxy Voting Policies and Procedures (Policies) that the Fund uses to determine how to vote proxies relating to portfolio securities. Shareholders may view the Fund’s complete Policies online at franklintempleton.com. Alternatively, shareholders may request copies of the Policies free of charge by calling the Proxy Group collect at (954) 527-7678 or by sending a written request to: Franklin Templeton Companies, LLC, 300 S.E. 2nd Street, Fort Lauderdale, FL 33301, Attention: Proxy Group. Copies of the Fund’s proxy voting records are also made available online at franklintempleton.com and posted on the US Securities and Exchange Commission’s website at sec.gov and reflect the most recent 12-month period ended June 30.
Quarterly Statement of Investments
The Trust, on behalf of the Fund, files a complete statement of investments with the US Securities and Exchange Commission for the first and third quarters for each fiscal year on Form N-Q. Shareholders may view the filed Form N-Q by visiting the Commission’s website at sec.gov. The filed form may also be viewed and copied at the Commission’s Public Reference Room in Washington, DC. Information regarding the operations of the Public Reference Room may be obtained by calling (800) SEC-0330.
| 40 | Semiannual Report | franklintempleton.com |
Semiannual Report and Shareholder Letter
Franklin Mutual European Fund
Investment Manager
Franklin Mutual Advisers, LLC
Distributor
Franklin Templeton Distributors, Inc.
(800) DIAL BEN® / 342-5236
franklintempleton.com
Shareholder Services
(800) 632-2301 - (Class A, C, R & R6)
(800) 448-FUND - (Class Z)
Authorized for distribution only when accompanied or preceded by a summary prospectus and/or prospectus. Investors should carefully consider a fund’s investment goals, risks, charges and expenses before investing. A prospectus contains this and other information; please read it carefully before investing.
To help ensure we provide you with quality service, all calls to and from our service areas are monitored and/or recorded.
| © 2018 Franklin Templeton Investments. All rights reserved. | 478 S 08/18 |

Franklin Templeton Investments
Why choose Franklin Templeton Investments?
Successful investing begins with ambition. And achievement only comes when you reach for it. That’s why we continually strive to deliver better outcomes for investors. No matter what your goals are, our deep, global investment expertise allows us to offer solutions that can help.
During our more than 70 years of experience, we’ve managed through all kinds of markets—up, down and those in between. We’re always preparing for what may come next. It’s because of this, combined with our strength as one of the world’s largest asset managers that we’ve earned the trust of millions of investors around the world.
Dear Franklin Mutual Quest Fund Shareholder:
Securities markets started 2018 with positive momentum. Investors began the year focused on global economic growth, strong corporate profits across most developed markets and the potential benefits of US corporate and personal tax cuts. However, volatility and market downturns emerged due to political risks and trade tariffs, a temporary deceleration in developed market economic activity during the first quarter, and higher bond yields amid potential signs of increasing inflation pressures and likely interest rate hikes. Although some risks faded, such as the first-quarter deceleration in economic growth, the potential for an escalating trade war between the US and its trading partners remained a meaningful uncertainty for investors. For the period ended June 30, 2018, US stocks, as measured by the Standard & Poor’s® 500 Index (S&P 500®), produced a +2.65% total return.1 Stocks in global developed markets, as measured by the MSCI World Index, returned +0.76%, while investment-grade bonds, as measured by the Bloomberg Barclays US Aggregate Bond Index, had a -1.62% total return.1
Market performance was rather uneven during the period. Although the S&P 500 performed positively, most of the gains could be accounted for by a small number of companies. The list of those leading performers showed a concentration in information technology and internet-focused companies, or businesses that directly benefit from increased online commerce. It is no surprise, therefore, that growth stocks managed to outpace value stocks during the period. The Russell
1000® Growth Index returned +7.25%, while the Russell 1000® Value Index had a -1.69% total return.1
We do not know how long growth will continue to outpace value, but historically, periods of solid and steady economic growth have been a positive backdrop for value stocks. Low unemployment rates, increased business investment and solid consumer spending are all constructive signs for such a pace of economic growth. The US Federal Reserve’s efforts to gradually raise interest rates may be favorable for financial equities.
Value investing often requires an investor to be contrarian in nature. We continue to maintain a bottom-up stock-picking process that is disciplined, driven by rigorous fundamental analysis and attempts to limit downside risk. In our view, investing in underappreciated and misunderstood companies with identifiable catalysts for unlocking shareholder value can offer meaningful upside potential and a degree of downside protection in periods of financial market turbulence.
Although economic and investment fundamentals still appear to be favorable, the return of volatility is another reminder that securities markets are dynamic. As we enter into the second half of 2018, market sentiment may easily turn again given the uncertainty regarding an escalation in trade tensions, the upcoming US midterm elections, Brexit, the ability of US tax cuts to prolong the current economic expansion, and the pace of
1. Source: Morningstar. Frank Russell Company is the source and owner of the trademarks, service marks and copyrights related to the Russell Indexes. Russell® is a trademark of Frank Russell Company.
See www.franklintempletondatasources.com for additional data provider information.
| Not FDIC Insured | | | May Lose Value | | | No Bank Guarantee |
| franklintempleton.com | Not part of the semiannual report | 1 |
inflation. Therefore, we believe active, professional investment management serves investors well.
We also recognize the important role of financial advisors in today’s markets and encourage investors to continue to seek their advice. Amid changing markets and economic conditions, we are confident investors with a well-diversified portfolio and a patient, long-term outlook should be well positioned for the years ahead.
On the following pages, the Fund’s portfolio management team reviews investment decisions that pertain to performance during the past six months in light of the economic environment and other factors. Please remember all securities markets fluctuate, as do mutual fund share prices.
We thank you for investing with Franklin Templeton, welcome your questions and comments, and look forward to continuing to serve your investment needs in the years ahead.
Sincerely,
Peter A. Langerman
Chairman, President and Chief Executive Officer
Franklin Mutual Advisers, LLC
This letter reflects our analysis and opinions as of June 30, 2018, unless otherwise indicated. The information is not a complete analysis of every aspect of any market, country, industry, security or fund. Statements of fact are from sources considered reliable.
Contents
Semiannual Report
| Franklin Mutual Quest Fund | 3 | |||
| Performance Summary | 9 | |||
| Your Fund’s Expenses | 11 | |||
| Financial Highlights and Statement of Investments | 12 | |||
| Financial Statements | 25 | |||
| Notes to Financial Statements | 30 | |||
| Shareholder Information | 45 | |||
Visit franklintempleton.com for fund updates, to access your account, or to find helpful financial planning tools.
| 2 | Not part of the semiannual report | franklintempleton.com |
Semiannual Report
Franklin Mutual Quest Fund
We are pleased to bring you Franklin Mutual Quest Fund’s semiannual report for the period ended June 30, 2018.
Your Fund’s Goal and Main Investments
The Fund seeks capital appreciation, which may occasionally be short term, with income as a secondary goal. Under normal market conditions, the Fund invests substantially to primarily in equity securities of US and foreign companies that the investment manager believes are available at market prices less than their intrinsic value. The equity securities in which the Fund invests are primarily common stock, with a current focus on mid- and large-cap companies. To a lesser extent, the Fund also invests in merger arbitrage securities and the debt and equity of distressed companies. The Fund may invest a substantial portion, potentially up to 100% of its assets, in foreign securities, which may include sovereign debt and participations in foreign government debt. The Geographic Composition bar chart on this page lists the leading countries where the Fund invests.
Performance Overview
The Fund’s Class Z shares delivered a +3.02% cumulative total return for the six months ended June 30, 2018. In comparison, the Fund’s benchmark, the MSCI World Index (USD), which tracks stock performance in global developed markets, generated a total return of +0.76%.1 Also for comparison, the Fund’s secondary benchmark, the Bloomberg Barclays US Corporate High Yield Index, which measures the US corporate market of non-investment grade, fixed-rate corporate bonds, defined as the middle or lower ratings of Moody’s, Fitch and Standard & Poor’s, posted a +0.16% total return.1 You can find more of the Fund’s performance data in the Performance Summary beginning on page 9.
Geographic Composition*
Based on Total Net Assets as of 6/30/18
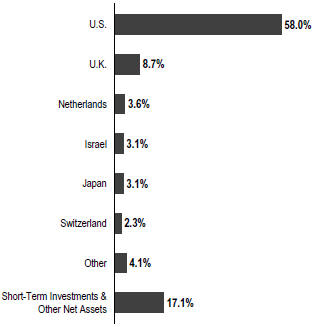
*Figures are stated as a percentage of total and may not equal 100% or may be negative due to rounding, use of any derivatives, unsettled trades or other factors.
Performance data represent past performance, which does not guarantee future results. Investment return and principal value will fluctuate, and you may have a gain or loss when you sell your shares. Current performance may differ from figures shown. For most recent month-end performance, go to franklintempleton.com or call (800) 342-5236.
Economic and Market Overview
The global economy expanded during the six-month period under review amid generally upbeat economic data across regions. In this environment, global developed and emerging market stocks reached a new all-time high in January 2018, as measured by the MSCI All Country World Index (ACWI). During the period, global markets were aided by price gains in oil and other commodities, encouraging corporate earnings reports and investor optimism about global economic growth. However, global stocks had a -0.13% total return for the
1. Source: Morningstar.
The indexes are unmanaged and include reinvestment of any income or distributions. They do not reflect any fees, expenses or sales charges. One cannot invest directly in an index, and an index is not representative of the Fund’s portfolio.
The dollar value, number of shares or principal amount, and names of all portfolio holdings are listed in the Fund’s Statement of Investments (SOI).
The SOI begins on page 17.
| franklintempleton.com | Semiannual Report | 3 |
FRANKLIN MUTUAL QUEST FUND
six-month period, as measured by the MSCI ACWI, largely due to an overall decline in emerging market stocks.1
Global markets reflected investor concerns about tensions in the Korean peninsula and political uncertainties in the US and the European Union, as well as worries that strong economic growth and rising inflation in some parts of the world, particularly in the US, would lead central banks to increase interest rates sooner than expected. Markets were further pressured by the Trump administration’s protectionist trade policies, uncertainty surrounding the US-China trade relationship, and a broad sell-off in information technology stocks in March due to a potential for tighter regulation in the sector arising from concerns about consumer data privacy. Near period-end, an overall easing of tensions in the Korean peninsula relieved investors, but ongoing US trade disputes with its allies and China hindered global markets.
The US economy continued to grow during the six months under review. After moderating for three consecutive quarters, the economy grew faster in 2018’s second quarter, driven by consumer spending, exports, business investment and government spending. The unemployment rate declined from 4.1% in December 2017, as reported at the beginning of the six-month period, to 4.0% at period-end.2 Annual inflation, as measured by the Consumer Price Index, increased from 2.1% in December 2017, as reported at the beginning of the period, to 2.9% at period-end.2 The US Federal Reserve raised its target range for the federal funds rate in March and June 2018 and continued reducing its balance sheet as part of its ongoing plan to normalize monetary policy.
In Europe, the UK’s quarterly economic growth moderated in 2018’s first quarter amid a decline in construction output. The Bank of England kept its key policy rate unchanged during the period. The eurozone’s quarterly growth moderated in 2018’s first quarter due to a decline in external demand. The bloc’s annual inflation rate ended the period higher than in December 2017. The European Central Bank (ECB) kept its benchmark interest rate unchanged during the period. However, at its June meeting, the ECB announced it would further reduce its monthly bond purchases beginning in October 2018 and indicated it would conclude the program at the end of 2018 while continuing to keep interest rates unchanged through at least the summer of 2019.
In Asia, Japan’s quarterly gross domestic product (GDP) growth in 2018’s first quarter was negative, the country’s first
contraction since 2015’s fourth quarter, mainly due to a decline in private residential investment and household consumption. The Bank of Japan left its benchmark interest rate unchanged during the period and continued its monetary stimulus measures.
In emerging markets, Brazil’s quarterly GDP accelerated in 2018’s first quarter compared to the previous quarter. The country’s central bank cut its benchmark interest rate twice during the period to spur economic growth. Russia’s annual GDP grew in 2018’s first quarter compared to the prior-year period, amid the Bank of Russia’s continued policy support. China’s annual GDP moderated in 2018’s first quarter compared to the prior-year period. The People’s Bank of China left its benchmark interest rate unchanged during the period. Overall, emerging market stocks, as measured by the MSCI Emerging Markets Index, declined during the period.
Investment Strategy
At Franklin Mutual Series, we are committed to our distinctive value approach to investing, which we believe can generate above-average risk-adjusted returns over time for our shareholders. Our major investment strategy is investing in undervalued stocks. When selecting undervalued equities, we are attracted to what we believe are fundamentally strong companies with healthy balance sheets, high-quality assets, substantial free cash flow and shareholder-oriented management teams and whose stocks are trading at discounts to our assessment of the companies’ intrinsic or business value. We also look for asset-rich companies whose shares may be trading at depressed levels due to concerns over short-term earnings disappointments, litigation, management strategy or other perceived negatives. This strict value approach is not only intended to improve the likelihood of upside potential, but also reduces the risk of substantial declines, in our opinion. While the vast majority of our undervalued equity investments are made in publicly traded companies globally, we may invest occasionally in privately held companies as well.
We complement this more traditional investment strategy with two others. One is distressed investing, a highly specialized field that has proven quite profitable during certain periods over the years. Distressed investing is complex and can take many forms. The most common distressed investment the Fund undertakes is the purchase of financially troubled or bankrupt companies’ debt at a substantial discount to face value. After the financially distressed company is reorganized, often in
2. Source: Bureau of Labor Statistics.
| 4 | Semiannual Report | franklintempleton.com |
FRANKLIN MUTUAL QUEST FUND
bankruptcy court, the old debt is typically replaced with new securities issued by the financially stronger company.
The other piece of our investment strategy is participating in arbitrage situations, another highly specialized field. When companies announce proposed mergers or takeovers, commonly referred to as “deals,” the target company may trade at a discount to the bid it ultimately accepts. One form of arbitrage involves purchasing the target company’s stock when it is trading below the value we believe it would receive in a deal. In keeping with our commitment to a relatively conservative investment approach, we typically focus our arbitrage efforts on announced deals, and avoid rumored deals or other situations we consider relatively risky. The current percentages of the Fund’s assets devoted to these investment strategies are listed in the Asset Allocation bar chart on this page. In addition, it is our practice to hedge the Fund’s currency exposure when we deem it advantageous for our shareholders.
What is meant by “hedge”?
To hedge an investment is to take a position intended to offset potential losses/gains that may be incurred by a companion financial instrument.
Manager’s Discussion
In the first half of 2018, positive corporate fundamentals were overshadowed by political and economic concerns. Corporate profits in the US and other developed markets continued their impressive year-over-year pace of growth. In the US and other developed markets, economic activity moderated during the first quarter, but appeared to have recovered during the second quarter. Financial markets were also aided by improved industrial commodity prices, most notably crude oil. Nonetheless, investor sentiment became less upbeat and volatility returned to financial markets, after an historically calm 2017.
As investors entered 2018, overall US equity market valuations (e.g., price-to-earnings, price-to-book or price-to-sales) were elevated relative to most historical benchmarks. The uneven equity market performance during the period and the strong pace of corporate earnings growth helped to reduce valuations somewhat. At the same time, the rise in volatility provided us with select opportunities to initiate or add to positions in companies that we believed were trading at undeservedly discounted prices.
A further escalation of trade-related rhetoric and tariffs, in our view, could have important consequences for the US and
Asset Allocation*
Based on Total Net Assets as of 6/30/18
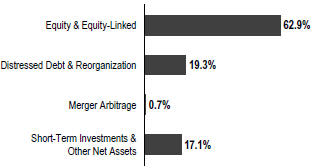
*Figures are stated as a percentage of total and may not equal 100% or may be negative due to rounding, use of any derivatives, unsettled trades or other factors.
abroad. We have already begun to see disruptions to global supply chains and added pressure on China’s financial and credit markets. Additional tariffs imposed by the US and its trading partners could rattle business confidence, curb corporate earnings growth, undermine favorable fundamentals in specific industries, provoke further financial market volatility and raise uncertainty regarding the solid pace of global growth.
Europe’s equity market overall was still trading at an attractively lower price-to-earnings multiple and higher dividend yield than the US equity market at period-end. However, in addition to trade tensions, we are paying close attention to Brexit negotiations, Italy’s new populist government, a potentially fraying relationship between Germany’s two conservative parties and the future of the international nuclear deal with Iran. As of period-end, we still believe Europe’s economic recovery is fairly resilient, but any of the aforementioned challenges has the potential to fuel volatility and even slow economic growth. In such an environment, we believe domestically oriented companies may fare relatively better.
In Asia, we have said for some time that China needs to address the high level of corporate leverage, and the People’s Bank of China has recently mandated that much of the debt residing in the shadow banking market be brought back onto bank balance sheets. The resulting burden may impair bank earnings in the short term, which, in our view, is underappreciated by many investors and could create some investment opportunities. Meanwhile, Japan’s government has proposed further amendments to its Corporate Governance Code. We believe the proposals have the potential to drive further improvements in capital allocation and operating discipline, which have long
| franklintempleton.com | Semiannual Report | 5 |
FRANKLIN MUTUAL QUEST FUND
been a concern of investors. We have become more interested in finding opportunities to take advantage of this emerging trend.
Mergers and acquisitions (M&A) have remained active. In the first half of 2018, the market received some clarity regarding the regulatory environment when a federal judge ruled in favor of AT&T and Time Warner3, and against the US Department of Justice (DOJ) in its antitrust lawsuit. The judge decided the DOJ had failed to show the merger would be anti-competitive, and the deal closed promptly after the opinion was released. In response, the shares of companies involved in several other pending deals traded higher, indicating a higher expected probability of closing. The market also saw the development of a bidding war between Walt Disney and Comcast for control of Twenty-First Century Fox and Sky. As the year began, Disney had a deal to buy Fox and Fox had an offer pending to acquire the 61% of Sky it did not own. Comcast subsequently launched bids for both companies, and when Fox raised its bid for Sky, Comcast promptly raised its bid to a higher level. Comcast has indicated it will not bid further for Fox and, while Fox could raise its bid for Sky, it appears most likely that Comcast will purchase Sky. This bidding war showed the ongoing uncertainty in media, in which major media firms believe they need even more scale to compete with internet rivals that are experiencing significant growth. The Top 10 Sectors/Industries table on this page lists media and also other leading industries in which the Fund currently invests. We expect ongoing activity in M&A markets and, with the increased regulatory clarity provided by the Time Warner decision, further opportunities in merger arbitrage.
Finding mispriced risk in credit markets remains difficult due in part to the decline in debt covenants, which include terms that restrict financial activities by the borrower or set parameters for specific financial metrics. The search is also complicated by private equity firms involved in leveraged buyout transactions using increasingly liberal interpretations of credit agreements and bond indentures to potentially shift valuable assets beyond the reach of creditors. We have directed much of our focus on out-of-favor industries in pursuit of securities with the potential to benefit most from heightened M&A activity and other liquidity-enhancing events, such as asset sales, the ability to issue secured debt within existing agreements, and free-cash flow that could buy time for a company to weather its financial storm.
| Top 10 Sectors/Industries | ||||
| Based on Equity Securities as of 6/30/18 | ||||
| % of Total Net Assets | ||||
| Media | 11.6% | |||
| Pharmaceuticals | 8.0% | |||
| Insurance | 6.3% | |||
| Oil, Gas & Consumable Fuels | 4.9% | |||
| Diversified Telecommunication Services | 3.9% | |||
| Wireless Telecommunication Services | 3.7% | |||
| Communications Equipment | 3.5% | |||
| Software | 3.4% | |||
| Tobacco | 3.3% | |||
| Equity Real Estate Investment Trusts (REITs) | 2.1% | |||
Fund Performance
Turning to Fund performance, top contributors included US-based phone, TV and internet services provider Frontier Communications; UK-based pharmaceutical company GlaxoSmithKline and France-based automaker Peugeot.
Frontier Communications provides phone, TV and internet services to business and residential customers. Our investment in Frontier consists of fixed income securities (CTF bonds) issued to purchase assets from Verizon4 in 2015. The bond prices appreciated during the period when Frontier was able to amend covenants (agreements that require or restrict certain actions by the bond issuer). As a result, Frontier was able to repurchase some existing bonds, including some held by the Fund, by issuing new debt with a later maturity date. The price Frontier paid to repurchase the bonds was above par (the price at issuance) and the trading price before the announcement. Frontier is attempting to gain more time to stabilize its business and achieve more synergies from the Verizon assets. The Fund continues to hold positions in the remaining CTF bonds, which have the tightest covenants, and is a member of an ad-hoc steering committee that holds greater than 66% of the bonds outstanding. We believe this positions us to negotiate the terms of any amendments to those restrictions if Frontier requires relief in the future.
Investors reacted positively to GlaxoSmithKline’s March announcements that it had pulled out of the auction for Pfizer’s4 consumer health business and agreed to buy Novartis out of its consumer health care joint venture for $13 billion. In our view, not purchasing the Pfizer consumer business at a high
3. Not held at period-end.
4. Not a Fund holding.
See www.franklintempletondatasources.com for additional data provider information.
| 6 | Semiannual Report | franklintempleton.com |
FRANKLIN MUTUAL QUEST FUND
price demonstrated capital discipline and the ability to exercise restraint by not overpaying for strategically desirable assets, thus enhancing management credibility. In addition, not consummating the Pfizer consumer-asset deal eliminated concerns around a potential cut to the dividend to finance the deal, which had been a serious concern for investors. Also, investors have become more willing to give Glaxo some credit for research and development returns improving under the new management team.
Shares of Peugeot rose amid positive global economic fundamentals, as well as the announcements of strong full-year 2017 results in March 2018 and first-quarter 2018 results in April 2018 that showed a continuation of the positive trends from last year. Peugeot’s results were evidence, in our view, that its restructuring plan to improve production efficiency has been successful. In addition, the early returns from Peugeot’s integration and cost-cutting efforts related to its 2017 acquisition of General Motors’ European business (Opel Vauxhall) exceeded investors’ initial expectations. We believe the acquisition should enable Peugeot to increase its profit margins and cash flow through additional product development improvements, greater vehicle production efficiency and the utilization of better powertrains (engine, transmission, drive shaft and differential) in its Opel and Vauxhall vehicles.
During the period under review, Fund investments that detracted from performance included UK-based global mobile telecommunications company Vodafone Group, Netherlandsbased cable operator KPN and US-based industrials company General Electric3. Vodafone Group is listed among the Fund’s largest positions in the Top 10 Equity Holdings table on this page.
In May 2018, Vodafone Group reported better-than-expected fiscal year-end results, but the outlook for fiscal year 2019 was below expectations with much of the growth forecast to come in the latter part of the year. In addition, Vodafone chief executive officer (CEO) Vittorio Colao announced his intention to retire in October 2018. The CEO’s decision was not a total surprise given his decade long tenure, but the timing was unexpected given Vodafone’s purchase of certain Liberty Global4 assets that is still being reviewed by government regulators. We believe that Vodafone will receive regulatory approval. In addition, the naming of Nick Read, the current chief financial officer (CFO), as the new CEO, and promoting the deputy CFO, signal the board’s focus on operating performance after a period of addressing the major strategic issues facing the company.
| Top 10 Equity Holdings | ||||
| 6/30/18 | ||||
Company Sector Industry, Country | % of Total Net Assets | |||
Twenty-First Century Fox Inc. Media, U.S. | 3.6% | |||
Sorenson Communications LLC Communications Equipment, U.S. | 3.5% | |||
British American Tobacco PLC Tobacco, U.K. | 3.3% | |||
Vodafone Group PLC Wireless Telecommunication Services, U.K. | 3.0% | |||
The Hartford Financial Services Group Inc. Insurance, U.S. | 2.5% | |||
Novartis AG Pharmaceuticals, Switzerland | 2.3% | |||
JXTG Holdings Inc. Oil, Gas & Consumable Fuels, Japan | 2.2% | |||
Check Point Software Technologies Ltd. Software, Israel | 2.2% | |||
Charter Communications Inc. Media, U.S. | 2.1% | |||
Vornado Realty Trust Equity Real Estate Investment Trusts (REITs), U.S. | 2.1% | |||
Multiple factors hurt shares of KPN during the period. Quarterly earnings reported in January were in line with expectations, but the outlook for another year of flat earnings in 2018 was disappointing. In February, the Authority of Consumers and Markets (ACM), a Dutch regulator, proposed new rules for cable operators. The proposal would not change KPN’s current regulatory framework, but could reduce its wholesale revenues. Although the ACM’s proposal is disappointing and the European Union has recently softened its opposition to cable regulation, the impact of the proposals would likely be modest as cable’s wholesale access rates are unlikely to be more attractive than KPN’s existing rates. We continue to hold a favorable view of KPN. Free cash flow growth has been strong, and we have begun to see a recovery in the business-to-business segment, which had been a drag on revenues and earnings.
In January 2018, General Electric (GE) announced a greater-than-expected $6.2 billion after-tax charge related to its insurance subsidiary at GE Capital. Management also moved ahead with what amounts to a breakup of GE. In May 2018, the company announced the merger of its transportation operations into Wabtec4, and in June 2018 it announced a plan to spin off its health care division and divest its stake in oil-services firm Baker Hughes4. Once completed, we believe the moves will streamline GE and enable the company to reduce debt and build
| franklintempleton.com | Semiannual Report | 7 |
FRANKLIN MUTUAL QUEST FUND
up a cash buffer, as well as help management better focus on its key aviation, power and renewable energy divisions.
During the period, the Fund held currency forwards and futures seeking to hedge most of the currency risk of the portfolio’s non-US dollar investments. The hedges had a positive overall impact on the Fund’s performance because of the appreciation of the US dollar versus the hedged currencies.
What is a currency forward?
A currency forward is a direct agreement between the Fund and a counterparty to buy or sell a foreign currency in exchange for another currency at a specific exchange rate on a future date.
What is a future?
A future is an agreement between the Fund and a counterparty made through a US or foreign futures exchange to buy or sell an underlying instrument or asset at a specific price on a future date.
Thank you for your participation in Franklin Mutual Quest Fund. We look forward to continuing to serve your investment needs.
 |
Shawn M. Tumulty Co-Portfolio Manager |

 |
Keith Luh, CFA Co-Portfolio Manager |

CFA® is a trademark owned by CFA Institute.
The foregoing information reflects our analysis, opinions and portfolio holdings as of June 30, 2018, the end of the reporting period. The way we implement our main investment strategies and the resulting portfolio holdings may change depending on factors such as market and economic conditions. These opinions may not be relied upon as investment advice or an offer for a particular security. The information is not a complete analysis of every aspect of any market, country, industry, security or the Fund. Statements of fact are from sources considered reliable, but the investment manager makes no representation or warranty as to their completeness or accuracy. Although historical performance is no guarantee of future results, these insights may help you understand our investment management philosophy.
Shawn Tumulty has been a portfolio manager for Franklin Mutual Quest Fund since 2003 and a co-portfolio manager since 2010. He joined Franklin Templeton Investments in 2000. Prior to joining Franklin Templeton Investments, Mr. Tumulty was an analyst and portfolio manager at Hamilton Partners Limited.
Keith Luh has been a co-portfolio manager for Franklin Mutual Quest Fund since 2010. He is also head of cross asset investing for Franklin Mutual Series with a value and event-driven focus across equity and fixed income investments, globally. Prior to joining in 2005, Mr. Luh was a senior analyst in global investment research at Putnam Investments, where he also helped manage a best-ideas research fund. Previously, he worked in the investment banking group at Volpe Brown Whelan and Co., LLC, and the derivative products trading group at BNP. Mr. Luh is also Adjunct Professor in Finance and Economics at the Graduate School of Business, Columbia University.
| 8 | Semiannual Report | franklintempleton.com |
FRANKLIN MUTUAL QUEST FUND
Performance Summary as of June 30, 2018
The performance table does not reflect any taxes that a shareholder would pay on Fund dividends, capital gain distributions, if any, or any realized gains on the sale of Fund shares. Total return reflects reinvestment of the Fund’s dividends and capital gain distributions, if any, and any unrealized gains or losses. Your dividend income will vary depending on dividends or interest paid by securities in the Fund’s portfolio, adjusted for operating expenses of each class. Capital gain distributions are net profits realized from the sale of portfolio securities.
Performance as of 6/30/18
Cumulative total return excludes sales charges. Average annual total return includes maximum sales charges. Sales charges will vary depending on the size of the investment and the class of share purchased. The maximum is 5.75% and the minimum is 0%. Class A: 5.75% maximum initial sales charge. For other share classes, visit franklintempleton.com.
| Share Class | Cumulative Total Return1 | Average Annual Total Return2 | ||||||
| Z | ||||||||
6-Month | +3.02%3 | +3.02%3 | ||||||
1-Year | +7.38% | +7.38% | ||||||
5-Year | +41.36% | +7.17% | ||||||
10-Year | +90.48% | +6.66% | ||||||
| A | ||||||||
6-Month | +2.87%3 | -3.07% | ||||||
1-Year | +7.08% | +0.93% | ||||||
5-Year | +39.46% | +5.62% | ||||||
10-Year | +85.00% | +5.72% | ||||||
Performance data represent past performance, which does not guarantee future results. Investment return and principal value will fluctuate, and you may have a gain or loss when you sell your shares. Current performance may differ from figures shown. For most recent month-end performance, go to franklintempleton.com or call (800) 342-5236.
See page 10 for Performance Summary footnotes.
| franklintempleton.com | Semiannual Report | 9 |
FRANKLIN MUTUAL QUEST FUND
PERFORMANCE SUMMARY
Total Annual Operating Expenses4
| Share Class | ||||
Z | 0.79% | |||
A | 1.04% | |||
Each class of shares is available to certain eligible investors and has different annual fees and expenses, as described in the prospectus.
All investments involve risks, including possible loss of principal. Value securities may not increase in price as anticipated or may decline further in value. Special risks are associated with foreign investing, including currency fluctuations, economic instability and political developments. Because the Fund may invest its assets in companies in a specific region, including Europe, it is subject to greater risks of adverse developments in that region and/or the surrounding regions than a fund that is more broadly diversified geographically. Current political and financial uncertainty surrounding the European Union may increase market volatility and the economic risk of investing in companies in Europe. Smaller company stocks have exhibited greater price volatility than larger company stocks, particularly over the short term. The Fund’s investments in companies engaged in mergers, reorganizations or liquidations also involve special risks as pending deals may not be completed on time or on favorable terms. The Fund may invest in lower rated bonds, which entail higher credit risk. The Fund is actively managed but there is no guarantee that the manager’s investment decisions will produce the desired results. The Fund’s prospectus also includes a description of the main investment risks.
1. Cumulative total return represents the change in value of an investment over the periods indicated.
2. Average annual total return represents the average annual change in value of an investment over the periods indicated. Return for less than one year, if any, has not been annualized.
3. Total return information is based on net asset values calculated for shareholder transactions. Certain adjustments were made to the net assets of the Fund at 12/31/17 for financial reporting purposes, and as a result, the total returns based on those net asset values differ from the adjusted total returns reported in the Financial Highlights.
4. Figures are as stated in the Fund’s current prospectus and may differ from the expense ratios disclosed in the Your Fund’s Expenses and Financial Highlights sections in this report. In periods of market volatility, assets may decline significantly, causing total annual Fund operating expenses to become higher than the figures shown.
| 10 | Semiannual Report | franklintempleton.com |
FRANKLIN MUTUAL QUEST FUND
Your Fund’s Expenses
As a Fund shareholder, you can incur two types of costs: (1) transaction costs, including sales charges (loads) on Fund purchases and redemptions; and (2) ongoing Fund costs, including management fees, distribution and service (12b-1) fees, and other Fund expenses. All mutual funds have ongoing costs, sometimes referred to as operating expenses. The table below shows ongoing costs of investing in the Fund and can help you understand these costs and compare them with those of other mutual funds. The table assumes a $1,000 investment held for the six months indicated.
Actual Fund Expenses
The table below provides information about actual account values and actual expenses in the columns under the heading “Actual.” In these columns the Fund’s actual return, which includes the effect of Fund expenses, is used to calculate the “Ending Account Value” for each class of shares. You can estimate the expenses you paid during the period by following these steps (of course, your account value and expenses will differ from those in this illustration): Divide your account value by $1,000 (if your account had an $8,600 value, then $8,600 ÷ $1,000 = 8.6). Then multiply the result by the number in the row for your class of shares under the headings “Actual” and “Expenses Paid During Period” (if Actual Expenses Paid During Period were $7.50, then 8.6 x $7.50 = $64.50). In this illustration, the actual expenses paid this period are $64.50.
Hypothetical Example for Comparison with Other Funds
Under the heading “Hypothetical” in the table, information is provided about hypothetical account values and hypothetical expenses based on the Fund’s actual expense ratio and an assumed rate of return of 5% per year before expenses, which is not the Fund’s actual return. This information may not be used to estimate the actual ending account balance or expenses you paid for the period, but it can help you compare ongoing costs of investing in the Fund with those of other funds. To do so, compare this 5% hypothetical example for the class of shares you hold with the 5% hypothetical examples that appear in the shareholder reports of other funds.
Please note that expenses shown in the table are meant to highlight ongoing costs and do not reflect any transactional costs. Therefore, information under the heading “Hypothetical” is useful in comparing ongoing costs only, and will not help you compare total costs of owning different funds. In addition, if transactional costs were included, your total costs would have been higher.
| Actual (actual return after expenses) | Hypothetical (5% annual return before expenses) | |||||||||||||||||||||||||||||
Share | Beginning Account Value 1/1/18 | Ending Account Value 6/30/18 | Expenses Paid During Period 1/1/18–6/30/181,2 | Ending Account Value 6/30/18 | Expenses Paid During Period 1/1/18–6/30/181,2 | Net Annualized Expense Ratio2 | ||||||||||||||||||||||||
| Z | $1,000 | $1,033.50 | $3.98 | $1,020.88 | $3.96 | 0.79 | % | |||||||||||||||||||||||
| A | $1,000 | $1,032.70 | $5.24 | $1,019.64 | $5.21 | 1.04 | % | |||||||||||||||||||||||
| C | $1,000 | $1,028.00 | $9.00 | $1,015.92 | $8.95 | 1.79 | % | |||||||||||||||||||||||
| R | $1,000 | $1,031.20 | $6.50 | $1,018.40 | $6.46 | 1.29 | % | |||||||||||||||||||||||
| R6 | $1,000 | $1,034.20 | $3.63 | $1,021.22 | $3.61 | 0.72 | % | |||||||||||||||||||||||
1. Expenses are equal to the annualized expense ratio for the six-month period as indicated above—in the far right column—multiplied by the simple average account value over the period indicated, and then multiplied by 181/365 to reflect the one-half year period.
2. Reflects expenses after fee waivers and expense reimbursements. Does not include acquired fund fees and expenses.
| franklintempleton.com | Semiannual Report | 11 |
FRANKLIN MUTUAL QUEST FUND
Financial Highlights
| Six Months Ended June 30, 2018 (unaudited) | Year Ended December 31, | |||||||||||||||||||||||
| 2017 | 2016 | 2015 | 2014 | 2013 | ||||||||||||||||||||
| Class Z | ||||||||||||||||||||||||
| Per share operating performance (for a share outstanding throughout the period) | ||||||||||||||||||||||||
Net asset value, beginning of period | $15.83 | $15.52 | $14.47 | $16.21 | $18.18 | $16.55 | ||||||||||||||||||
|
| |||||||||||||||||||||||
| Income from investment operationsa: | ||||||||||||||||||||||||
Net investment incomeb | 0.25 | 0.58 | 0.87 | c | 0.54 | 0.78 | d | 0.54 | ||||||||||||||||
Net realized and unrealized gains (losses) | 0.28 | 0.49 | 1.47 | (1.45 | ) | (0.16 | ) | 3.68 | ||||||||||||||||
|
| |||||||||||||||||||||||
Total from investment operations | 0.53 | 1.07 | 2.34 | (0.91 | ) | 0.62 | 4.22 | |||||||||||||||||
|
| |||||||||||||||||||||||
| Less distributions from: | ||||||||||||||||||||||||
Net investment income | — | (0.63 | ) | (1.01 | ) | (0.68 | ) | (0.85 | ) | (0.56 | ) | |||||||||||||
Net realized gains | — | (0.13 | ) | (0.28 | ) | (0.15 | ) | (1.74 | ) | (2.03 | ) | |||||||||||||
|
| |||||||||||||||||||||||
Total distributions | — | (0.76 | ) | (1.29 | ) | (0.83 | ) | (2.59 | ) | (2.59 | ) | |||||||||||||
|
| |||||||||||||||||||||||
| Net asset value, end of period | $16.36 | $15.83 | $15.52 | $14.47 | $16.21 | $18.18 | ||||||||||||||||||
|
| |||||||||||||||||||||||
Total returne | 3.35% | 6.92% | 16.26% | (5.55)% | 3.44% | 25.97% | ||||||||||||||||||
| Ratios to average net assetsf | ||||||||||||||||||||||||
Expensesg,h | 0.79% | 0.79% | 0.79% | i | 0.82% | i | 0.81% | 0.84% | ||||||||||||||||
Expenses incurred in connection with | —% | —% | 0.01% | 0.03% | 0.04% | 0.07% | ||||||||||||||||||
Net investment income | 3.10% | 3.65% | 5.74% | c | 3.35% | 4.18% | d | 2.93% | ||||||||||||||||
| Supplemental data | ||||||||||||||||||||||||
Net assets, end of period (000’s) | $3,522,800 | $3,667,351 | $3,683,095 | $3,577,696 | $4,116,651 | $4,270,828 | ||||||||||||||||||
Portfolio turnover rate | 39.61% | 32.90% | 44.04% | 30.51% | 65.77% | 63.41% | ||||||||||||||||||
aThe amount shown for a share outstanding throughout the period may not correlate with the Statement of Operations for the period due to the timing of sales and repurchases of the Fund’s shares in relation to income earned and/or fluctuating fair value of the investments of the Fund.
bBased on average daily shares outstanding.
cNet investment income per share includes approximately $0.05 per share related to income received in the form of special dividends in connection with certain Fund holdings. Excluding this amount, the ratio of net investment income to average net assets would have been 5.42%.
dNet investment income per share includes approximately $0.27 per share related to income received in the form of special dividends in connection with certain Fund holdings. Excluding this amount, the ratio of net investment income to average net assets would have been 2.73%.
eTotal return is not annualized for periods less than one year.
fRatios are annualized for periods less than one year.
gIncludes dividend and/or interest expense on securities sold short and security borrowing fees, if any. See below for the ratios of such expenses to average net assets for the periods presented. See Note 1(d).
hBenefit of expense reduction rounds to less than 0.01%.
iBenefit of waiver and payments by affiliates rounds to less than 0.01%.
| 12 | Semiannual Report | The accompanying notes are an integral part of these financial statements. | franklintempleton.com |
FRANKLIN MUTUAL QUEST FUND
FINANCIAL HIGHLIGHTS
Six Months Ended (unaudited) | Year Ended December 31, | |||||||||||||||||||||||
| 2017 | 2016 | 2015 | 2014 | 2013 | ||||||||||||||||||||
| Class A | ||||||||||||||||||||||||
| Per share operating performance (for a share outstanding throughout the period) | ||||||||||||||||||||||||
Net asset value, beginning of period | $15.60 | $15.32 | $14.29 | $16.02 | $18.00 | $16.41 | ||||||||||||||||||
|
| |||||||||||||||||||||||
| Income from investment operationsa: | ||||||||||||||||||||||||
Net investment incomeb | 0.23 | 0.53 | 0.83 | c | 0.49 | 0.71 | d | 0.48 | ||||||||||||||||
Net realized and unrealized gains (losses) | 0.28 | 0.46 | 1.45 | (1.43 | ) | (0.15 | ) | 3.65 | ||||||||||||||||
|
| |||||||||||||||||||||||
Total from investment operations | 0.51 | 0.99 | 2.28 | (0.94 | ) | 0.56 | 4.13 | |||||||||||||||||
|
| |||||||||||||||||||||||
| Less distributions from: | ||||||||||||||||||||||||
Net investment income | — | (0.58 | ) | (0.97 | ) | (0.64 | ) | (0.80 | ) | (0.51 | ) | |||||||||||||
Net realized gains | — | (0.13 | ) | (0.28 | ) | (0.15 | ) | (1.74 | ) | (2.03 | ) | |||||||||||||
|
| |||||||||||||||||||||||
Total distributions | — | (0.71 | ) | (1.25 | ) | (0.79 | ) | (2.54 | ) | (2.54 | ) | |||||||||||||
|
| |||||||||||||||||||||||
Net asset value, end of period | $16.11 | $15.60 | $15.32 | $14.29 | $16.02 | $18.00 | ||||||||||||||||||
|
| |||||||||||||||||||||||
Total returne | 3.27% | 6.54% | 16.04% | (5.85)% | 3.11% | 25.61% | ||||||||||||||||||
| Ratios to average net assetsf | ||||||||||||||||||||||||
Expensesg,h | 1.04% | 1.04% | 1.04% | i | 1.10% | i | 1.11% | 1.14% | ||||||||||||||||
Expenses incurred in connection with securities sold short | —% | —% | 0.01% | 0.03% | 0.04% | 0.07% | ||||||||||||||||||
Net investment income | 2.85% | 3.40% | 5.49% | c | 3.07% | 3.88% | d | 2.63% | ||||||||||||||||
| Supplemental data | ||||||||||||||||||||||||
Net assets, end of period (000’s) | $1,118,257 | $1,153,870 | $1,216,085 | $1,203,508 | $1,394,138 | $1,371,789 | ||||||||||||||||||
Portfolio turnover rate | 39.61% | 32.90% | 44.04% | 30.51% | 65.77% | 63.41% | ||||||||||||||||||
aThe amount shown for a share outstanding throughout the period may not correlate with the Statement of Operations for the period due to the timing of sales and repurchases of the Fund’s shares in relation to income earned and/or fluctuating fair value of the investments of the Fund.
bBased on average daily shares outstanding.
cNet investment income per share includes approximately $0.05 per share related to income received in the form of special dividends in connection with certain Fund holdings. Excluding this amount, the ratio of net investment income to average net assets would have been 5.17%.
dNet investment income per share includes approximately $0.27 per share related to income received in the form of special dividends in connection with certain Fund holdings. Excluding this amount, the ratio of net investment income to average net assets would have been 2.43%.
eTotal return does not reflect sales commissions or contingent deferred sales charges, if applicable, and is not annualized for periods less than one year.
fRatios are annualized for periods less than one year.
gIncludes dividend and/or interest expense on securities sold short and security borrowing fees, if any. See below for the ratios of such expenses to average net assets for the periods presented. See Note 1(d).
hBenefit of expense reduction rounds to less than 0.01%.
iBenefit of waiver and payments by affiliates rounds to less than 0.01%.
| franklintempleton.com | The accompanying notes are an integral part of these financial statements. | Semiannual Report | 13 |
FRANKLIN MUTUAL QUEST FUND
FINANCIAL HIGHLIGHTS
Six Months Ended (unaudited) | Year Ended December 31, | |||||||||||||||||||||||
| 2017 | 2016 | 2015 | 2014 | 2013 | ||||||||||||||||||||
| Class C | ||||||||||||||||||||||||
| Per share operating performance (for a share outstanding throughout the period) | ||||||||||||||||||||||||
Net asset value, beginning of period | $15.35 | $15.06 | $14.08 | $15.78 | $17.76 | $16.24 | ||||||||||||||||||
|
| |||||||||||||||||||||||
| Income from investment operationsa: | ||||||||||||||||||||||||
Net investment incomeb | 0.16 | 0.41 | 0.70 | c | 0.36 | 0.57 | d | 0.35 | ||||||||||||||||
Net realized and unrealized gains (losses) | 0.27 | 0.47 | 1.41 | (1.39 | ) | (0.14 | ) | 3.59 | ||||||||||||||||
|
| |||||||||||||||||||||||
Total from investment operations | 0.43 | 0.88 | 2.11 | (1.03 | ) | 0.43 | 3.94 | |||||||||||||||||
|
| |||||||||||||||||||||||
| Less distributions from: | ||||||||||||||||||||||||
Net investment income | — | (0.46 | ) | (0.85 | ) | (0.52 | ) | (0.67 | ) | (0.39 | ) | |||||||||||||
Net realized gains | — | (0.13 | ) | (0.28 | ) | (0.15 | ) | (1.74 | ) | (2.03 | ) | |||||||||||||
|
| |||||||||||||||||||||||
Total distributions | — | (0.59 | ) | (1.13 | ) | (0.67 | ) | (2.41 | ) | (2.42 | ) | |||||||||||||
|
| |||||||||||||||||||||||
Net asset value, end of period | $15.78 | $15.35 | $15.06 | $14.08 | $15.78 | $17.76 | ||||||||||||||||||
|
| |||||||||||||||||||||||
Total returne | 2.80% | 5.89% | 15.10% | (6.49)% | 2.42% | 24.74% | ||||||||||||||||||
| Ratios to average net assetsf | ||||||||||||||||||||||||
Expensesg,h | 1.79% | 1.79% | 1.79% | i | 1.82% | i | 1.81% | 1.84% | ||||||||||||||||
Expenses incurred in connection with securities sold short | —% | —% | 0.01% | 0.03% | 0.04% | 0.07% | ||||||||||||||||||
Net investment income | 2.10% | 2.65% | 4.74% | c | 2.35% | 3.18% | d | 1.93% | ||||||||||||||||
| Supplemental data | ||||||||||||||||||||||||
Net assets, end of period (000’s) | $290,782 | $309,160 | $343,624 | $337,974 | $397,963 | $406,304 | ||||||||||||||||||
Portfolio turnover rate | 39.61% | 32.90% | 44.04% | 30.51% | 65.77% | 63.41% | ||||||||||||||||||
aThe amount shown for a share outstanding throughout the period may not correlate with the Statement of Operations for the period due to the timing of sales and repurchases of the Fund’s shares in relation to income earned and/or fluctuating fair value of the investments of the Fund.
bBased on average daily shares outstanding.
cNet investment income per share includes approximately $0.05 per share related to income received in the form of special dividends in connection with certain Fund holdings. Excluding this amount, the ratio of net investment income to average net assets would have been 4.42%.
dNet investment income per share includes approximately $0.27 per share related to income received in the form of special dividends in connection with certain Fund holdings. Excluding this amount, the ratio of net investment income to average net assets would have been 1.73%.
eTotal return does not reflect sales commissions or contingent deferred sales charges, if applicable, and is not annualized for periods less than one year.
fRatios are annualized for periods less than one year.
gIncludes dividend and/or interest expense on securities sold short and security borrowing fees, if any. See below for the ratios of such expenses to average net assets for the periods presented. See Note 1(d).
hBenefit of expense reduction rounds to less than 0.01%.
iBenefit of waiver and payments by affiliates rounds to less than 0.01%.
| 14 | Semiannual Report | The accompanying notes are an integral part of these financial statements. | franklintempleton.com |
FRANKLIN MUTUAL QUEST FUND
FINANCIAL HIGHLIGHTS
Six Months Ended (unaudited) | Year Ended December 31, | |||||||||||||||||||||||
| 2017 | 2016 | 2015 | 2014 | 2013 | ||||||||||||||||||||
| Class R | ||||||||||||||||||||||||
| Per share operating performance (for a share outstanding throughout the period) | ||||||||||||||||||||||||
Net asset value, beginning of period | $15.40 | $15.14 | $14.14 | $15.87 | $17.84 | $16.33 | ||||||||||||||||||
|
| |||||||||||||||||||||||
| Income from investment operationsa: | ||||||||||||||||||||||||
Net investment incomeb | 0.21 | 0.50 | 0.78 | c | 0.44 | 0.65 | d | 0.50 | ||||||||||||||||
Net realized and unrealized gains (losses) | 0.27 | 0.46 | 1.43 | (1.40 | ) | (0.13 | ) | 3.56 | ||||||||||||||||
|
| |||||||||||||||||||||||
Total from investment operations | 0.48 | 0.96 | 2.21 | (0.96 | ) | 0.52 | 4.06 | |||||||||||||||||
|
| |||||||||||||||||||||||
| Less distributions from: | ||||||||||||||||||||||||
Net investment income | — | (0.57 | ) | (0.93 | ) | (0.62 | ) | (0.75 | ) | (0.52 | ) | |||||||||||||
Net realized gains | — | (0.13 | ) | (0.28 | ) | (0.15 | ) | (1.74 | ) | (2.03 | ) | |||||||||||||
|
| |||||||||||||||||||||||
Total distributions | — | (0.70 | ) | (1.21 | ) | (0.77 | ) | (2.49 | ) | (2.55 | ) | |||||||||||||
|
| |||||||||||||||||||||||
Net asset value, end of period | $15.88 | $15.40 | $15.14 | $14.14 | $15.87 | $17.84 | ||||||||||||||||||
|
| |||||||||||||||||||||||
Total returne | 3.12% | 6.38% | 15.69% | (6.03)% | 2.94% | 25.34% | ||||||||||||||||||
| Ratios to average net assetsf | ||||||||||||||||||||||||
Expensesg,h | 1.29% | 1.29% | 1.29% | i | 1.32% | i | 1.31% | 1.34% | ||||||||||||||||
Expenses incurred in connection with securities sold short | —% | —% | 0.01% | 0.03% | 0.04% | 0.07% | ||||||||||||||||||
Net investment income | 2.60% | 3.15% | 5.24% | c | 2.85% | 3.68% | d | 2.43% | ||||||||||||||||
| Supplemental data | ||||||||||||||||||||||||
Net assets, end of period (000’s) | $2,703 | $1,774 | $880 | $898 | $675 | $853 | ||||||||||||||||||
Portfolio turnover rate | 39.61% | 32.90% | 44.04% | 30.51% | 65.77% | 63.41% | ||||||||||||||||||
aThe amount shown for a share outstanding throughout the period may not correlate with the Statement of Operations for the period due to the timing of sales and repurchases of the Fund’s shares in relation to income earned and/or fluctuating fair value of the investments of the Fund.
bBased on average daily shares outstanding.
cNet investment income per share includes approximately $0.05 per share related to income received in the form of special dividends in connection with certain Fund holdings. Excluding this amount, the ratio of net investment income to average net assets would have been 4.92%.
dNet investment income per share includes approximately $0.27 per share related to income received in the form of special dividends in connection with certain Fund holdings. Excluding this amount, the ratio of net investment income to average net assets would have been 2.23%.
eTotal return is not annualized for periods less than one year.
fRatios are annualized for periods less than one year.
gIncludes dividend and/or interest expense on securities sold short and security borrowing fees, if any. See below for the ratios of such expenses to average net assets for the periods presented. See Note 1(d).
hBenefit of expense reduction rounds to less than 0.01%.
iBenefit of waiver and payments by affiliates rounds to less than 0.01%.
| franklintempleton.com | The accompanying notes are an integral part of these financial statements. | Semiannual Report | 15 |
FRANKLIN MUTUAL QUEST FUND
FINANCIAL HIGHLIGHTS
Six Months Ended (unaudited) | Year Ended December 31, | |||||||||||||||||||||||
| 2017 | 2016 | 2015 | 2014 | 2013a | ||||||||||||||||||||
| Class R6 | ||||||||||||||||||||||||
Per share operating performance (for a share outstanding throughout the period) | ||||||||||||||||||||||||
Net asset value, beginning of period | $15.81 | $15.51 | $14.45 | $16.19 | $18.19 | $18.16 | ||||||||||||||||||
|
| |||||||||||||||||||||||
| Income from investment operationsb: | ||||||||||||||||||||||||
Net investment incomec | 0.25 | 0.64 | 0.88 | d | 0.55 | 0.51 | e | 0.36 | ||||||||||||||||
Net realized and unrealized gains (losses) | 0.29 | 0.43 | 1.48 | (1.44 | ) | 0.10 | 2.28 | |||||||||||||||||
|
| |||||||||||||||||||||||
Total from investment operations | 0.54 | 1.07 | 2.36 | (0.89 | ) | 0.61 | 2.64 | |||||||||||||||||
|
| |||||||||||||||||||||||
| Less distributions from: | ||||||||||||||||||||||||
Net investment income | — | (0.64 | ) | (1.02 | ) | (0.70 | ) | (0.87 | ) | (0.58 | ) | |||||||||||||
Net realized gains | — | (0.13 | ) | (0.28 | ) | (0.15 | ) | (1.74 | ) | (2.03 | ) | |||||||||||||
|
| |||||||||||||||||||||||
Total distributions | — | (0.77 | ) | (1.30 | ) | (0.85 | ) | (2.61 | ) | (2.61 | ) | |||||||||||||
|
| |||||||||||||||||||||||
Net asset value, end of period | $16.35 | $15.81 | $15.51 | $14.45 | $16.19 | $18.19 | ||||||||||||||||||
|
| |||||||||||||||||||||||
Total returnf | 3.42% | 6.94% | 16.44% | (5.54)% | 3.53% | 14.83% | ||||||||||||||||||
| Ratios to average net assetsg | ||||||||||||||||||||||||
Expenses before waiver and payments by affiliates | 0.74% | 0.72% | 0.71% | 0.74% | 0.74% | 2.00% | ||||||||||||||||||
Expenses net of waiver and payments by affiliates | 0.72% | 0.72% | 0.71% | h | 0.74% | h | 0.74% | 0.77% | ||||||||||||||||
Expenses incurred in connection with securities sold short | —% | —% | 0.01% | 0.03% | 0.04% | 0.07% | ||||||||||||||||||
Net investment income | 3.17% | 3.72% | 5.82% | d | 3.43% | 4.25% | e | 3.00% | ||||||||||||||||
| Supplemental data | ||||||||||||||||||||||||
Net assets, end of period (000’s) | $122,160 | $123,863 | $52,277 | $41,408 | $44,340 | $5 | ||||||||||||||||||
Portfolio turnover rate | 39.61% | 32.90% | 44.04% | 30.51% | 65.77% | 63.41% | ||||||||||||||||||
aFor the period May 1, 2013 (effective date) to December 31, 2013.
bThe amount shown for a share outstanding throughout the period may not correlate with the Statement of Operations for the period due to the timing of sales and repurchases of the Fund’s shares in relation to income earned and/or fluctuating fair value of the investments of the Fund.
cBased on average daily shares outstanding.
dNet investment income per share includes approximately $0.05 per share related to income received in the form of special dividends in connection with certain Fund holdings. Excluding this amount, the ratio of net investment income to average net assets would have been 5.50%.
eNet investment income per share includes approximately $0.27 per share related to income received in the form of special dividends in connection with certain Fund holdings. Excluding this amount, the ratio of net investment income to average net assets would have been 2.80%.
fTotal return is not annualized for periods less than one year.
gRatios are annualized for periods less than one year.
hBenefit of waiver and payments by affiliates rounds to less than 0.01%.
iIncludes dividend and/or interest expense on securities sold short and security borrowing fees, if any. See below for the ratios of such expenses to average net assets for the periods presented. See Note 1(d).
| 16 | Semiannual Report | The accompanying notes are an integral part of these financial statements. | franklintempleton.com |
FRANKLIN MUTUAL QUEST FUND
Statement of Investments, June 30, 2018 (unaudited)
| Country | Shares/ Warrants | Value | ||||||||||||||
| Common Stocks and Other Equity Interests 61.3% | ||||||||||||||||
| Auto Components 1.0% | ||||||||||||||||
Cie Generale des Etablissements Michelin SCA | France | 54,266 | $ | 6,612,795 | ||||||||||||
The Goodyear Tire & Rubber Co. | United States | 1,692,672 | 39,422,331 | |||||||||||||
| a,b,c | International Automotive Components Group Brazil LLC | Brazil | 2,548,299 | 57,943 | ||||||||||||
| a,b,c | International Automotive Components Group North America LLC | United States | 19,924,658 | 5,965,224 | ||||||||||||
|
| |||||||||||||||
| 52,058,293 | ||||||||||||||||
|
| |||||||||||||||
| Automobiles 0.5% | ||||||||||||||||
Peugeot SA | France | 1,187,394 | 27,135,427 | |||||||||||||
|
| |||||||||||||||
| Banks 0.9% | ||||||||||||||||
BNP Paribas SA | France | 198,278 | 12,321,894 | |||||||||||||
Guaranty Bancorp | United States | 347,127 | 10,344,385 | |||||||||||||
Wells Fargo & Co. | United States | 409,124 | 22,681,835 | |||||||||||||
|
| |||||||||||||||
| 45,348,114 | ||||||||||||||||
|
| |||||||||||||||
| Chemicals 0.4% | ||||||||||||||||
| d | Advanced Emissions Solutions Inc. | United States | 1,724,209 | 19,587,014 | ||||||||||||
| a,b,e | Dow Corning Corp., Contingent Distribution | United States | 12,089,194 | — | ||||||||||||
|
| |||||||||||||||
| 19,587,014 | ||||||||||||||||
|
| |||||||||||||||
| Communications Equipment 3.5% | ||||||||||||||||
| a,b,c | Sorenson Communications LLC, Membership Interests | United States | 224,279 | 178,301,724 | ||||||||||||
|
| |||||||||||||||
| Consumer Finance 0.4% | ||||||||||||||||
Capital One Financial Corp. | United States | 228,800 | 21,026,720 | |||||||||||||
|
| |||||||||||||||
| Diversified Consumer Services 0.1% | ||||||||||||||||
| a,b | Affinion Group Inc., wts., 11/10/22 | United States | 549,716 | 5,968,573 | ||||||||||||
|
| |||||||||||||||
| Diversified Financial Services 1.4% | ||||||||||||||||
Voya Financial Inc. | United States | 1,540,500 | 72,403,500 | |||||||||||||
|
| |||||||||||||||
| Diversified Telecommunication Services 3.9% | ||||||||||||||||
AT&T Inc. | United States | 2,849,462 | 91,496,225 | |||||||||||||
Koninklijke KPN NV | Netherlands | 38,263,977 | 104,164,322 | |||||||||||||
|
| |||||||||||||||
| 195,660,547 | ||||||||||||||||
|
| |||||||||||||||
| Electric Utilities 0.3% | ||||||||||||||||
PG&E Corp. | United States | 320,300 | 13,631,968 | |||||||||||||
|
| |||||||||||||||
| Electrical Equipment 0.2% | ||||||||||||||||
Osram Licht AG | Germany | 208,374 | 8,520,882 | |||||||||||||
|
| |||||||||||||||
| Energy Equipment & Services 0.0%† | ||||||||||||||||
| a | GulfMark Offshore Inc. | United States | 158 | 5,293 | ||||||||||||
| a | GulfMark Offshore Inc., wts., 11/14/24 | United States | 1,712 | 3,801 | ||||||||||||
|
| |||||||||||||||
| 9,094 | ||||||||||||||||
|
| |||||||||||||||
| Equity Real Estate Investment Trusts (REITs) 2.1% | ||||||||||||||||
Vornado Realty Trust | United States | 1,443,263 | 106,686,001 | |||||||||||||
|
| |||||||||||||||
| Food & Staples Retailing 0.5% | ||||||||||||||||
| a | Rite Aid Corp. | United States | 15,422,700 | 26,681,271 | ||||||||||||
|
| |||||||||||||||
| Health Care Equipment & Supplies 2.1% | ||||||||||||||||
Medtronic PLC | United States | 1,245,243 | 106,605,253 | |||||||||||||
|
| |||||||||||||||
| Independent Power & Renewable Electricity Producers 1.1% | ||||||||||||||||
| a | Vistra Energy Corp. | United States | 2,433,367 | 57,573,463 | ||||||||||||
|
| |||||||||||||||
| franklintempleton.com | Semiannual Report | 17 |
FRANKLIN MUTUAL QUEST FUND
STATEMENT OF INVESTMENTS (UNAUDITED)
| Country | Shares/ Warrants | Value | ||||||||||||||
| Common Stocks and Other Equity Interests (continued) | ||||||||||||||||
| Insurance 6.3% | ||||||||||||||||
ASR Nederland NV | Netherlands | 1,843,213 | $ | 75,330,058 | ||||||||||||
| a | Brighthouse Financial Inc. | United States | 1,319,855 | 52,886,590 | ||||||||||||
Everest Re Group Ltd. | United States | 188,400 | 43,422,432 | |||||||||||||
The Hartford Financial Services Group Inc. | United States | 2,502,890 | 127,972,766 | |||||||||||||
Lancashire Holdings Ltd. | United Kingdom | 790,756 | 5,921,024 | |||||||||||||
RSA Insurance Group PLC | United Kingdom | 1,201,439 | 10,779,498 | |||||||||||||
|
| |||||||||||||||
| 316,312,368 | ||||||||||||||||
|
| |||||||||||||||
| Internet Software & Services 0.7% | ||||||||||||||||
| a | Baidu Inc., ADR | China | 145,593 | 35,379,099 | ||||||||||||
|
| |||||||||||||||
| Machinery 0.8% | ||||||||||||||||
| a | Navistar International Corp. | United States | 930,393 | 37,885,603 | ||||||||||||
|
| |||||||||||||||
| Media 11.6% | ||||||||||||||||
| a | Charter Communications Inc., A | United States | 365,900 | 107,285,539 | ||||||||||||
| f,g | Comcast Corp., A | United States | 2,373,500 | 77,874,535 | ||||||||||||
| a | Cumulus Media Inc., A | United States | 51,173 | 767,595 | ||||||||||||
| a | Cumulus Media Inc., B | United States | 76,298 | 1,201,693 | ||||||||||||
| a | Cumulus Media Inc., wts., 6/04/38 | United States | 57,778 | 910,004 | ||||||||||||
| a | DISH Network Corp., A | United States | 917,600 | 30,840,536 | ||||||||||||
| a,d | Lee Enterprises Inc./IA | United States | 4,824,268 | 13,749,164 | ||||||||||||
| a,b,c,d | Lee Enterprises Inc., wts., 12/31/22 | United States | 1,110,000 | 1,328,592 | ||||||||||||
| d | New Media Investment Group Inc. | United States | 4,154,565 | 76,776,361 | ||||||||||||
Sky PLC | United Kingdom | 1,816,504 | 35,059,559 | |||||||||||||
| f,g | Twenty-First Century Fox Inc., A | United States | 760,200 | 37,774,338 | ||||||||||||
Twenty-First Century Fox Inc., B | United States | 2,951,300 | 145,410,551 | |||||||||||||
| f,g | The Walt Disney Co. | United States | 543,800 | 56,995,678 | ||||||||||||
|
| |||||||||||||||
| 585,974,145 | ||||||||||||||||
|
| |||||||||||||||
| Metals & Mining 0.2% | ||||||||||||||||
Warrior Met Coal Inc. | United States | 296,595 | 8,177,124 | |||||||||||||
|
| |||||||||||||||
| Oil, Gas & Consumable Fuels 4.9% | ||||||||||||||||
Crescent Point Energy Corp. | Canada | 5,903,800 | 43,395,760 | |||||||||||||
JXTG Holdings Inc. | Japan | 16,069,155 | 111,806,885 | |||||||||||||
Kinder Morgan Inc. | United States | 3,697,670 | 65,337,829 | |||||||||||||
Royal Dutch Shell PLC, A | United Kingdom | 755,788 | 26,287,652 | |||||||||||||
|
| |||||||||||||||
| 246,828,126 | ||||||||||||||||
|
| |||||||||||||||
| Pharmaceuticals 7.1% | ||||||||||||||||
Eli Lilly & Co. | United States | 902,947 | 77,048,468 | |||||||||||||
GlaxoSmithKline PLC | United Kingdom | 2,132,254 | 43,076,942 | |||||||||||||
Merck & Co. Inc. | United States | 1,349,370 | 81,906,759 | |||||||||||||
Novartis AG, ADR | Switzerland | 1,556,106 | 117,548,247 | |||||||||||||
Perrigo Co. PLC | United States | 543,400 | 39,619,294 | |||||||||||||
|
| |||||||||||||||
| 359,199,710 | ||||||||||||||||
|
| |||||||||||||||
| Semiconductors & Semiconductor Equipment 0.9% | ||||||||||||||||
| a | Renesas Electronics Corp. | Japan | 4,673,314 | 45,848,674 | ||||||||||||
|
| |||||||||||||||
| Software 3.4% | ||||||||||||||||
| a | Avaya Holdings Corp., wts., 12/15/22 | United States | 338,090 | 1,563,666 | ||||||||||||
| a | Check Point Software Technologies Ltd. | Israel | 1,134,238 | 110,792,368 | ||||||||||||
Symantec Corp. | United States | 2,942,657 | 60,765,867 | |||||||||||||
|
| |||||||||||||||
| 173,121,901 | ||||||||||||||||
|
| |||||||||||||||
| 18 | Semiannual Report | franklintempleton.com |
FRANKLIN MUTUAL QUEST FUND
STATEMENT OF INVESTMENTS (UNAUDITED)
| Country | Shares/ Warrants | Value | ||||||||||||||
| Common Stocks and Other Equity Interests (continued) | ||||||||||||||||
| Tobacco 3.3% | ||||||||||||||||
British American Tobacco PLC | United Kingdom | 3,298,559 | $ | 166,837,741 | ||||||||||||
|
| |||||||||||||||
| Wireless Telecommunication Services 3.7% | ||||||||||||||||
| a | T-Mobile U.S. Inc. | United States | 613,000 | 36,626,750 | ||||||||||||
Vodafone Group PLC | United Kingdom | 61,066,297 | 148,240,073 | |||||||||||||
|
| |||||||||||||||
| 184,866,823 | ||||||||||||||||
|
| |||||||||||||||
Total Common Stocks and Other Equity Interests | 3,097,629,158 | |||||||||||||||
|
| |||||||||||||||
| Convertible Preferred Stocks (Cost $86,875,212) 0.9% | ||||||||||||||||
| Pharmaceuticals 0.9% | ||||||||||||||||
Teva Pharmaceutical Industries Ltd., 7.00%, cvt. pfd. | Israel | 104,000 | 47,268,000 | |||||||||||||
|
| |||||||||||||||
| Preferred Stocks 1.4% | ||||||||||||||||
| Auto Components 0.1% | ||||||||||||||||
| h | Schaeffler AG, 4.933%, pfd. | Germany | 246,066 | 3,205,527 | ||||||||||||
|
| |||||||||||||||
| Automobiles 0.5% | ||||||||||||||||
| h | Volkswagen AG, 2.784%, pfd. | Germany | 169,650 | 28,189,508 | ||||||||||||
|
| |||||||||||||||
| Technology Hardware, Storage & Peripherals 0.8% | ||||||||||||||||
| h | Samsung Electronics Co. Ltd., 3.397%, pfd. | South Korea | 1,179,800 | 39,823,803 | ||||||||||||
|
| |||||||||||||||
Total Preferred Stocks (Cost $49,546,430) | 71,218,838 | |||||||||||||||
|
| |||||||||||||||
| Principal Amount* | ||||||||||||||||
| Corporate Bonds, Notes and Senior Floating Rate Interests 16.4% | ||||||||||||||||
Affinion Group Inc., | ||||||||||||||||
i,j senior note., 144A, PIK, 14.00%, 11/10/22 | United States | $ | 16,818,998 | 14,889,625 | ||||||||||||
k,l Term Loans, 9.807%, (1-month USD LIBOR + 7.75%), 5/10/22 | United States | 74,062,500 | 76,886,133 | |||||||||||||
| l | Belk Inc., second lien Term Loan, 10.50%, 6/12/23 | United States | 25,000,000 | 18,732,000 | ||||||||||||
| k,l | Bluestem Brands, Inc., | |||||||||||||||
Initial Term Loan, 9.594%, (1-month USD LIBOR + 7.50%), 11/09/20 | United States | 38,246,824 | 25,242,904 | |||||||||||||
Initial Term Loan, 9.859%, (3-month USD LIBOR + 7.50%), 11/09/20 | United States | 23,187,937 | 15,304,038 | |||||||||||||
| i | CCO Holdings LLC/CCO Holdings Capital Corp., | |||||||||||||||
senior bond, 144A, 5.75%, 2/15/26 | United States | 2,000,000 | 1,970,000 | |||||||||||||
senior bond, 144A, 5.50%, 5/01/26 | United States | 20,978,000 | 20,394,812 | |||||||||||||
| k,l | Cumulus Media New Holdings Inc., Term Loan, 6.60%, (1-month USD LIBOR + 4.50%), 5/13/22 | United States | 14,420,594 | 14,357,504 | ||||||||||||
Frontier Communications Corp., | ||||||||||||||||
senior note, 10.50%, 9/15/22 | United States | 77,063,000 | 70,319,988 | |||||||||||||
senior note, 11.00%, 9/15/25 | United States | 41,812,000 | 33,646,116 | |||||||||||||
| d | Lee Enterprises Inc., | |||||||||||||||
l Second Lien Term Loan, 12.00%, 12/15/22 | United States | 50,574,814 | 52,092,058 | |||||||||||||
i senior secured note, first lien, 144A, 9.50%, 3/15/22 | United States | 97,050,000 | 101,781,188 | |||||||||||||
| i | Navistar International Corp., senior note, 144A, 6.625%, 11/01/25 | United States | 52,100,000 | 53,793,250 | ||||||||||||
Sorenson Communications LLC, | ||||||||||||||||
k,l Initial Term Loan, 8.09%, (3-month USD LIBOR + 5.75%), 4/30/20 | United States | 139,899,497 | 140,511,558 | |||||||||||||
i,j secured note, second lien, 144A, PIK, 9.00%, 10/31/20 | United States | 96,671,937 | 96,551,097 | |||||||||||||
| franklintempleton.com | Semiannual Report | 19 |
FRANKLIN MUTUAL QUEST FUND
STATEMENT OF INVESTMENTS (UNAUDITED)
| Country | Principal Amount* | Value | ||||||||||||||
| Corporate Bonds, Notes and Senior Floating Rate Interests (continued) | ||||||||||||||||
| i,j | Sorenson Holdings LLC/Finance Corp., senior note, 144A, PIK, 13.85%, 10/31/21 | United States | $ | 20,117,561 | $ | 20,721,088 | ||||||||||
T-Mobile USA Inc., | ||||||||||||||||
senior bond, 6.50%, 1/15/24 | United States | 18,290,000 | 19,077,567 | |||||||||||||
senior note, 6.00%, 3/01/23 | United States | 19,350,000 | 20,036,925 | |||||||||||||
| k,l | Toys R US-Delaware Inc., (DIP), 14.75%, (Prime + 9.75%), 1/18/19 | United States | 32,034,024 | 32,454,470 | ||||||||||||
|
| |||||||||||||||
Total Corporate Bonds, Notes and Senior Floating Rate Interests (Cost $837,051,093) | 828,762,321 | |||||||||||||||
|
| |||||||||||||||
Corporate Notes and Senior Floating Rate Interests in Reorganization 2.8% | ||||||||||||||||
| b,c,m | Broadband Ventures III LLC, secured promissory note, 5.00%, 2/01/12 | United States | 9,272 | — | ||||||||||||
| m | iHeartCommunications Inc., | |||||||||||||||
senior secured note, first lien, 9.00%, 12/15/19 | United States | 72,867,000 | 55,561,088 | |||||||||||||
k,l Tranche D Term Loan, 8.443%, (3-month USD LIBOR + 6.75%), 1/30/19 | United States | 46,662,631 | 35,714,411 | |||||||||||||
k,l Tranche E Term Loan, 9.193%, (3-month USD LIBOR + 7.50%), 7/30/19 | United States | 14,995,598 | 11,473,357 | |||||||||||||
| b,c,m | Sunshine Oilsands Ltd., secured note, 144A, 10.00%, 8/01/17 | Canada | 17,873,000 | 3,931,763 | ||||||||||||
| k,l,m | Toys R US-Delaware Inc., Term B-4 Loan, 10.067%, (1-month USD LIBOR + 8.75%), 4/24/20 | United States | 73,423,169 | 37,235,826 | ||||||||||||
|
| |||||||||||||||
Total Corporate Notes and Senior Floating Rate Interests in Reorganization (Cost $211,949,014) | 143,916,445 | |||||||||||||||
|
| |||||||||||||||
| Shares | ||||||||||||||||
| Companies in Liquidation 0.1% | ||||||||||||||||
| a,b,e | Avaya Holdings Corp., Contingent Distribution | United States | 82,902,380 | — | ||||||||||||
| a,b,e | Avaya Inc., Contingent Distribution | United States | 60,987,607 | — | ||||||||||||
| a,b,e | NewPage Corp., Litigation Trust, Contingent Distribution | United States | 723,000 | — | ||||||||||||
| a,e | Nortel Networks Corp., Contingent Distribution | Canada | 31,192,000 | 1,013,740 | ||||||||||||
| a,e | Nortel Networks Ltd., Contingent Distribution | Canada | 20,912,000 | 575,080 | ||||||||||||
| a,b,e | Tribune Media, Litigation Trust, Contingent Distribution | United States | 1,534,137 | — | ||||||||||||
| a,e | Vistra Energy Corp., Litigation Trust, Contingent Distribution | United States | 144,840,133 | 1,176,826 | ||||||||||||
| a | Vistra Energy Corp., Litigation Trust, TRA | United States | 2,433,367 | 1,581,689 | ||||||||||||
|
| |||||||||||||||
Total Companies in Liquidation (Cost $22,446,970) | 4,347,335 | |||||||||||||||
|
| |||||||||||||||
| Number of Contracts | Notional Amount# | |||||||||||||||
Options Purchased 0.1% | ||||||||||||||||
| Calls - Exchange-Traded | ||||||||||||||||
AT&T Inc., July Strike Price $36, Expires 7/20/18 | 5,000 | 500,000 | 10,000 | |||||||||||||
PG&E Corp., September Strike Price $45, Expires 9/21/18 | 5,000 | 500,000 | 1,500,000 | |||||||||||||
Twenty-First Century Fox Inc., A, August Strike Price $48, Expires 8/17/18 | 8,000 | 800,000 | 2,400,000 | |||||||||||||
|
| |||||||||||||||
Total Options Purchased (Cost $4,154,480) | 3,910,000 | |||||||||||||||
|
| |||||||||||||||
Total Investments before Short Term Investments | 4,197,052,097 | |||||||||||||||
|
| |||||||||||||||
| 20 | Semiannual Report | franklintempleton.com |
FRANKLIN MUTUAL QUEST FUND
STATEMENT OF INVESTMENTS (UNAUDITED)
| Country | Principal Amount* | Value | ||||||||||||||
| Short Term Investments 12.5% | ||||||||||||||||
| U.S. Government and Agency Securities 12.5% | ||||||||||||||||
| n | FHLB, 7/02/18 | United States | $5,600,000 | $5,600,000 | ||||||||||||
| n | U.S. Treasury Bill, | |||||||||||||||
9/20/18 | United States | 56,000,000 | 55,766,978 | |||||||||||||
9/27/18 | United States | 110,000,000 | 109,499,568 | |||||||||||||
g11/15/18 | United States | 50,000,000 | 49,623,167 | |||||||||||||
7/05/18 - 12/06/18 | United States | 415,500,000 | 413,640,604 | |||||||||||||
|
| |||||||||||||||
Total U.S. Government and Agency Securities | 634,130,317 | |||||||||||||||
|
| |||||||||||||||
Total Investments (Cost $4,705,394,272) 95.5% | | 4,831,182,414 (5,676,000 | ) | |||||||||||||
Securities Sold Short (0.1)% | (2,504,707 | ) | ||||||||||||||
Other Assets, less Liabilities 4.7% | 233,700,209 | |||||||||||||||
|
| |||||||||||||||
Net Assets 100.0% | $5,056,701,916 | |||||||||||||||
|
| |||||||||||||||
| Number of Contracts | Notional Amount# | |||||||||||||||
| o | Options Written (0.1)% | |||||||||||||||
| Calls - Exchange-Traded | ||||||||||||||||
Comcast Corp., A, August Strike Price $35.00, Expires 8/17/18 | 4,000 | 400,000 | (312,000 | ) | ||||||||||||
Twenty-First Century Fox Inc., A, August Strike Price $50, Expires 8/17/18 | 2,500 | 250,000 | (400,000 | ) | ||||||||||||
The Walt Disney Co., August Strike Price $110, Expires 8/17/18 | 3,000 | 300,000 | (435,000 | ) | ||||||||||||
|
| |||||||||||||||
| (1,147,000 | ) | |||||||||||||||
|
| |||||||||||||||
| Puts - Exchange-Traded | ||||||||||||||||
AT&T Inc., July Strike Price $33, Expires 7/20/18 | 8,500 | 850,000 | (1,224,000 | ) | ||||||||||||
PG&E Corp., September Strike Price $37.50, Expires 9/21/18 | 8,000 | 800,000 | (1,280,000 | ) | ||||||||||||
Twenty-First Century Fox Inc., A, August Strike Price $48, Expires 8/17/18 | 5,000 | 500,000 | (340,000 | ) | ||||||||||||
The Walt Disney Co., August Strike Price $105, Expires 8/17/18 | 3,750 | 375,000 | (1,372,500 | ) | ||||||||||||
The Walt Disney Co., July Strike Price $105, Expires 7/20/18 | 1,250 | 125,000 | (312,500 | ) | ||||||||||||
|
| |||||||||||||||
| (4,529,000 | ) | |||||||||||||||
|
| |||||||||||||||
Total Options Written (Premiums Received $5,300,047) | $(5,676,000 | ) | ||||||||||||||
|
| |||||||||||||||
| Country | Shares | |||||||||||||||
| p | Securities Sold Short (Proceeds $2,695,461) (0.1)% | |||||||||||||||
| Common Stocks (0.1)% | ||||||||||||||||
| Energy Equipment & Services (0.1)% | ||||||||||||||||
McDermott International Inc | United States | 127,466 | (2,504,707 | ) | ||||||||||||
|
| |||||||||||||||
| franklintempleton.com | Semiannual Report | 21 |
FRANKLIN MUTUAL QUEST FUND
STATEMENT OF INVESTMENTS (UNAUDITED)
†Rounds to less than 0.1% of net assets.
*The principal amount is stated in U.S. dollars unless otherwise indicated.
#Notional amount is the number of units specified in the contract, and can include currency units, bushels, shares, pounds, barrels or other units. Currency units are stated in U.S. dollars unless otherwise indicated.
aNon-income producing.
bFair valued using significant unobservable inputs. See Note 14 regarding fair value measurements.
cSee Note 10 regarding restricted securities.
dSee Note 12 regarding holdings of 5% voting securities.
eContingent distributions represent the right to receive additional distributions, if any, during the reorganization of the underlying company. Shares represent total underlying principal of debt securities.
fA portion or all of the security is held in connection with written option contracts open at period end.
gA portion or all of the security has been segregated as collateral for securities sold short and open written options contracts. At June 30, 2018, the aggregate value of these securities pledged amounted to $82,860,139, representing 1.6% of net assets.
hVariable rate security. The rate shown represents the yield at period end.
iSecurity was purchased pursuant to Rule 144A under the Securities Act of 1933 and may be sold in transactions exempt from registration only to qualified institutional buyers or in a public offering registered under the Securities Act of 1933. These securities have been deemed liquid under guidelines approved by the Trust’s Board of Trustees. At June 30, 2018, the aggregate value of these securities was $310,101,060, representing 6.1% of net assets.
jIncome may be received in additional securities and/or cash.
kThe coupon rate shown represents the rate at period end.
lSee Note 1(e) regarding senior floating rate interests.
mSee Note 8 regarding credit risk and defaulted securities.
nThe security was issued on a discount basis with no stated coupon rate.
oSee Note 1(c) regarding written options.
pSee Note 1(d) regarding securities sold short.
At June 30, 2018, the Fund had the following futures contracts outstanding. See Note 1(c).
| Futures Contracts | ||||||||||||||||||||
| Description | Type | Number of Contracts | Notional Amount* | Expiration Date | Value/ Unrealized Appreciation (Depreciation) | |||||||||||||||
| Currency Contracts | ||||||||||||||||||||
EUR/USD | Short | 814 | $ | 119,418,888 | 9/17/18 | $ | 1,129,322 | |||||||||||||
GBP/USD | Short | 955 | 79,002,375 | 9/17/18 | 1,214,243 | |||||||||||||||
|
| |||||||||||||||||||
Total Futures Contracts |
| $ | 2,343,565 | |||||||||||||||||
|
| |||||||||||||||||||
*As of period end.
| 22 | Semiannual Report | franklintempleton.com |
FRANKLIN MUTUAL QUEST FUND
STATEMENT OF INVESTMENTS (UNAUDITED)
At June 30, 2018, the Fund had the following forward exchange contracts outstanding. See Note 1(c).
| Forward Exchange Contracts | ||||||||||||||||||||||||||||
| Currency | Counterpartya | Type | Quantity | Contract Amount | Settlement Date | Unrealized Appreciation | Unrealized Depreciation | |||||||||||||||||||||
| OTC Forward Exchange Contracts |
| |||||||||||||||||||||||||||
Euro | BOFA | Buy | 1,798,421 | $ | 2,084,872 | 7/12/18 | $ | 18,352 | $ | — | ||||||||||||||||||
Euro | BOFA | Buy | 9,248,482 | 10,930,763 | 7/12/18 | — | (114,809 | ) | ||||||||||||||||||||
Euro | BOFA | Sell | 61,719 | 75,035 | 7/12/18 | 2,855 | — | |||||||||||||||||||||
Euro | BONY | Buy | 19,180,862 | 22,793,547 | 7/12/18 | — | (361,836 | ) | ||||||||||||||||||||
Euro | HSBK | Buy | 1,769,820 | 2,050,939 | 7/12/18 | 18,838 | — | |||||||||||||||||||||
Euro | HSBK | Sell | 19,625,185 | 23,810,783 | 7/12/18 | 859,440 | — | |||||||||||||||||||||
Euro | SSBT | Buy | 2,307,169 | 2,698,719 | 7/12/18 | — | (521 | ) | ||||||||||||||||||||
Euro | SSBT | Sell | 62,728 | 76,037 | 7/12/18 | 2,678 | — | |||||||||||||||||||||
Euro | UBSW | Buy | 1,501,613 | 1,740,125 | 7/12/18 | 15,988 | — | |||||||||||||||||||||
Euro | UBSW | Buy | 3,506,731 | 4,135,866 | 7/12/18 | — | (34,800 | ) | ||||||||||||||||||||
Euro | UBSW | Sell | 19,563,466 | 23,736,647 | 7/12/18 | 857,484 | — | |||||||||||||||||||||
Euro | BONY | Buy | 10,927,518 | 12,749,900 | 7/26/18 | 43,031 | — | |||||||||||||||||||||
Euro | BONY | Sell | 9,763,014 | 12,246,335 | 7/26/18 | 816,697 | — | |||||||||||||||||||||
Euro | HSBK | Buy | 4,739,852 | 5,534,545 | 7/26/18 | 14,437 | — | |||||||||||||||||||||
Euro | HSBK | Sell | 9,763,014 | 12,245,358 | 7/26/18 | 815,720 | — | |||||||||||||||||||||
Euro | UBSW | Buy | 875,313 | 1,033,412 | 7/26/18 | — | (8,675 | ) | ||||||||||||||||||||
Euro | UBSW | Buy | 2,810,277 | 3,262,484 | 7/26/18 | 27,529 | — | |||||||||||||||||||||
South Korean Won | HSBK | Buy | 7,300,178,038 | 6,739,451 | 8/10/18 | — | (186,447 | ) | ||||||||||||||||||||
South Korean Won | HSBK | Sell | 21,532,244,408 | 20,008,002 | 8/10/18 | 679,585 | — | |||||||||||||||||||||
South Korean Won | UBSW | Sell | 1,277,723,400 | 1,188,856 | 8/10/18 | 41,908 | — | |||||||||||||||||||||
British Pound | BOFA | Buy | 8,305,312 | 11,158,124 | 8/14/18 | — | (166,732 | ) | ||||||||||||||||||||
British Pound | BOFA | Sell | 53,684,809 | 76,142,015 | 8/14/18 | 5,094,618 | — | |||||||||||||||||||||
British Pound | BONY | Sell | 8,108,816 | 11,328,756 | 8/14/18 | 597,410 | — | |||||||||||||||||||||
British Pound | HSBK | Buy | 4,357,144 | 5,794,618 | 8/14/18 | — | (28,299 | ) | ||||||||||||||||||||
British Pound | HSBK | Sell | 5,823,113 | 8,157,585 | 8/14/18 | 451,177 | — | |||||||||||||||||||||
British Pound | UBSW | Buy | 7,667,549 | 10,179,555 | 8/14/18 | — | (32,189 | ) | ||||||||||||||||||||
British Pound | UBSW | Sell | 9,409,867 | 13,162,674 | 8/14/18 | 709,495 | — | |||||||||||||||||||||
Euro | BOFA | Buy | 1,040,643 | 1,216,797 | 8/20/18 | 3,902 | — | |||||||||||||||||||||
Euro | BONY | Sell | 36,209,886 | 45,809,742 | 8/20/18 | 3,334,650 | — | |||||||||||||||||||||
Euro | SSBT | Sell | 36,209,887 | 45,795,549 | 8/20/18 | 3,320,456 | — | |||||||||||||||||||||
Euro | BOFA | Sell | 2,607,636 | 3,271,700 | 10/10/18 | 200,486 | — | |||||||||||||||||||||
Euro | UBSW | Sell | 267,441 | 332,859 | 10/10/18 | 17,873 | — | |||||||||||||||||||||
Euro | BOFA | Sell | 2,258,657 | 2,763,812 | 10/18/18 | 101,805 | — | |||||||||||||||||||||
Euro | SSBT | Sell | 2,072,040 | 2,603,581 | 10/18/18 | 161,516 | — | |||||||||||||||||||||
Euro | UBSW | Sell | 2,072,040 | 2,603,591 | 10/18/18 | 161,526 | — | |||||||||||||||||||||
British Pound | BOFA | Sell | 6,720,647 | 9,332,424 | 10/24/18 | 408,974 | — | |||||||||||||||||||||
British Pound | BONY | Sell | 2,870,600 | 3,922,426 | 10/24/18 | 110,940 | — | |||||||||||||||||||||
British Pound | HSBK | Sell | 3,000,000 | 4,005,906 | 10/24/18 | 22,606 | — | |||||||||||||||||||||
British Pound | SSBT | Sell | 27,226,967 | 38,499,749 | 10/24/18 | 2,348,691 | — | |||||||||||||||||||||
British Pound | UBSW | Sell | 2,702,405 | 3,808,797 | 10/24/18 | 220,634 | — | |||||||||||||||||||||
Euro | SSBT | Sell | 5,002,652 | 6,074,720 | 11/07/18 | 168,631 | — | |||||||||||||||||||||
Euro | UBSW | Sell | 5,002,652 | 6,073,519 | 11/07/18 | 167,430 | — | |||||||||||||||||||||
South Korean Won | HSBK | Sell | 16,817,109,927 | 15,704,400 | 11/09/18 | 549,370 | — | |||||||||||||||||||||
South Korean Won | UBSW | Sell | 11,325,700,303 | 10,579,329 | 11/09/18 | 372,976 | — | |||||||||||||||||||||
British Pound | BONY | Sell | 19,742,665 | 26,764,243 | 11/26/18 | 507,265 | — | |||||||||||||||||||||
| franklintempleton.com | Semiannual Report | 23 |
FRANKLIN MUTUAL QUEST FUND
STATEMENT OF INVESTMENTS (UNAUDITED)
| Forward Exchange Contracts (continued) | ||||||||||||||||||||||||||||
| Currency | Counterpartya | Type | Quantity | Contract Amount | Settlement Date | Unrealized Appreciation | Unrealized Depreciation | |||||||||||||||||||||
| OTC Forward Exchange Contracts (continued) |
| |||||||||||||||||||||||||||
British Pound | UBSW | Sell | 19,742,665 | $ | 26,762,327 | 11/26/18 | $ | 505,350 | $ | — | ||||||||||||||||||
|
| |||||||||||||||||||||||||||
Total Forward Exchange Contracts |
| $ | 23,752,323 | $ | (934,308 | ) | ||||||||||||||||||||||
|
| |||||||||||||||||||||||||||
Net unrealized appreciation (depreciation) |
| $ | 22,818,015 | |||||||||||||||||||||||||
|
| |||||||||||||||||||||||||||
aMay be comprised of multiple contracts with the same counterparty, currency and settlement date.
See Note 11 regarding other derivative information.
See Abbreviations on page 44.
| 24 | Semiannual Report | The accompanying notes are an integral part of these financial statements. | franklintempleton.com |
FRANKLIN MUTUAL QUEST FUND
Financial Statements
Statement of Assets and Liabilities
June 30, 2018 (unaudited)
Assets: | ||||
Investments in securities: | ||||
Cost - Unaffiliated issuers | $4,461,462,662 | |||
Cost - Non-controlled affiliates (Note 12) | 243,931,610 | |||
|
| |||
Value - Unaffiliated issuers | $4,565,868,037 | |||
Value - Non-controlled affiliates (Note 12) | 265,314,377 | |||
Cash | 14,705,926 | |||
Foreign currency, at value (cost $24,214,522) | 24,468,000 | |||
Receivables: | ||||
Investment securities sold | 216,147,030 | |||
Capital shares sold | 2,001,209 | |||
Dividends and interest | 24,853,785 | |||
European Union tax reclaims | 671,204 | |||
Deposits with brokers for: | ||||
Options written | 354,596 | |||
Securities sold short | 2,731,870 | |||
Futures contracts | 3,667,860 | |||
Unrealized appreciation on OTC forward exchange contracts | 23,752,323 | |||
Other assets | 3,433 | |||
|
| |||
Total assets | 5,144,539,650 | |||
|
| |||
Liabilities: | ||||
Payables: | ||||
Investment securities purchased | 64,598,639 | |||
Capital shares redeemed | 4,356,682 | |||
Management fees | 2,809,468 | |||
Distribution fees | 969,636 | |||
Transfer agent fees | 905,583 | |||
Trustees’ fees and expenses | 249,010 | |||
Variation margin on futures contracts | 1,883,931 | |||
Due to brokers | 2,474,436 | |||
|
| |||
Options written, at value (premiums received $5,300,047) | 5,676,000 | |||
Securities sold short, at value (proceeds $2,695,461) | 2,504,707 | |||
Unrealized depreciation on OTC forward exchange contracts | 934,308 | |||
Accrued expenses and other liabilities | 475,334 | |||
|
| |||
Total liabilities | 87,837,734 | |||
|
| |||
Net assets, at value | $5,056,701,916 | |||
|
| |||
Net assets consist of: | ||||
Paid-in capital | $4,689,225,369 | |||
Undistributed net investment income | 71,301,465 | |||
Net unrealized appreciation (depreciation) | 150,754,676 | |||
Accumulated net realized gain (loss) | 145,420,406 | |||
|
| |||
Net assets, at value | $5,056,701,916 | |||
|
|
| franklintempleton.com | The accompanying notes are an integral part of these financial statements. | Semiannual Report | 25 |
FRANKLIN MUTUAL QUEST FUND
FINANCIAL STATEMENTS
Statement of Assets and Liabilities (continued)
June 30, 2018 (unaudited)
| Class Z: | ||||
Net assets, at value | $3,522,800,000 | |||
|
| |||
Shares outstanding | 215,317,712 | |||
|
| |||
Net asset value and maximum offering price per share | $16.36 | |||
|
| |||
| Class A: | ||||
Net assets, at value | $1,118,256,966 | |||
|
| |||
Shares outstanding | 69,418,624 | |||
|
| |||
Net asset value per sharea | $16.11 | |||
|
| |||
Maximum offering price per share (net asset value per share ÷ 94.25%) | $17.09 | |||
|
| |||
| Class C: | ||||
Net assets, at value | $ 290,781,930 | |||
|
| |||
Shares outstanding | 18,425,269 | |||
|
| |||
Net asset value and maximum offering price per sharea | $15.78 | |||
|
| |||
| Class R: | ||||
Net assets, at value | $ 2,702,583 | |||
|
| |||
Shares outstanding | 170,219 | |||
|
| |||
Net asset value and maximum offering price per share | $15.88 | |||
|
| |||
| Class R6: | ||||
Net assets, at value | $ 122,160,437 | |||
|
| |||
Shares outstanding | 7,471,723 | |||
|
| |||
Net asset value and maximum offering price per share | $16.35 | |||
|
| |||
aRedemption price is equal to net asset value less contingent deferred sales charges, if applicable.
| 26 | Semiannual Report | The accompanying notes are an integral part of these financial statements. | franklintempleton.com |
FRANKLIN MUTUAL QUEST FUND
FINANCIAL STATEMENTS
Statement of Operations
for the six months ended June 30, 2018 (unaudited)
Investment income: | ||||
Dividends: (net of foreign taxes)* | ||||
Unaffiliated issuers | $ | 35,172,123 | ||
Non-controlled affiliates (Note 12) | 4,573,379 | |||
Interest: | ||||
Unaffiliated issuers | 49,333,300 | |||
Non-controlled affiliates (Note 12) | 10,090,766 | |||
|
| |||
Total investment income | 99,169,568 | |||
|
| |||
Expenses: | ||||
Management fees (Note 3a) | 17,157,286 | |||
Distribution fees: (Note 3c) | ||||
Class A | 1,400,583 | |||
Class C | 1,490,744 | |||
Class R | 5,589 | |||
Transfer agent fees: (Note 3e) | ||||
Class Z | 1,598,438 | |||
Class A | 505,474 | |||
Class C | 134,506 | |||
Class R | 1,009 | |||
Class R6 | 23,442 | |||
Custodian fees (Note 4) | 77,448 | |||
Reports to shareholders | 136,005 | |||
Registration and filing fees | 101,133 | |||
Professional fees | 298,475 | |||
Trustees’ fees and expenses | 92,435 | |||
Other | 57,617 | |||
|
| |||
Total expenses | 23,080,184 | |||
Expense reductions (Note 4) | (21,269 | ) | ||
Expenses waived/paid by affiliates (Note 3f) | (11,206 | ) | ||
|
| |||
Net expenses | 23,047,709 | |||
|
| |||
Net investment income | 76,121,859 | |||
|
| |||
Realized and unrealized gains (losses): | ||||
Net realized gain (loss) from: | ||||
Investments:# | ||||
Unaffiliated issuers | 249,388,933 | |||
Non-controlled affiliates (Note 12) | (37,665,974 | ) | ||
Written options | 1,491,167 | |||
Foreign currency transactions | (1,970,580 | ) | ||
Forward exchange contracts | (16,794,223 | ) | ||
Futures contracts | 2,887,812 | |||
Securities sold short | 6,180,121 | |||
|
| |||
Net realized gain (loss) | 203,517,256 | |||
|
| |||
Net change in unrealized appreciation (depreciation) on: | ||||
Investments: | ||||
Unaffiliated issuers | (220,566,201 | ) | ||
Non-controlled affiliates (Note 12) | 68,668,250 | |||
Translation of other assets and liabilities denominated in foreign currencies | (208,691 | ) | ||
Forward exchange contracts | 34,231,750 | |||
Written options | (1,689,650 | ) | ||
Futures contracts | 4,841,869 |
| franklintempleton.com | The accompanying notes are an integral part of these financial statements. | Semiannual Report | 27 |
FRANKLIN MUTUAL QUEST FUND
FINANCIAL STATEMENTS
Statement of Operations (continued)
for the six months ended June 30, 2018 (unaudited)
Securities sold short | 190,754 | |||
Change in deferred taxes on unrealized appreciation | 680,769 | |||
|
| |||
Net change in unrealized appreciation (depreciation) | (113,851,150 | ) | ||
|
| |||
Net realized and unrealized gain (loss) | 89,666,106 | |||
|
| |||
Net increase (decrease) in net assets resulting from operations | $ | 165,787,965 | ||
|
|
*Foreign taxes withheld on dividends | $ | 2,891,929 | ||
#Net of foreign taxes. | $ | 153,779 |
| 28 | Semiannual Report | The accompanying notes are an integral part of these financial statements. | franklintempleton.com |
FRANKLIN MUTUAL QUEST FUND
FINANCIAL STATEMENTS
Statements of Changes in Net Assets
| Six Months Ended June 30, 2018 (unaudited) | Year Ended December 31, 2017 | |||||||
Increase (decrease) in net assets: | ||||||||
Operations: | ||||||||
Net investment income | $ 76,121,859 | $ 188,827,274 | ||||||
Net realized gain (loss) | 203,517,256 | 37,699,757 | ||||||
Net change in unrealized appreciation (depreciation) | (113,851,150 | ) | 122,317,207 | |||||
|
| |||||||
Net increase (decrease) in net assets resulting from operations | 165,787,965 | 348,844,238 | ||||||
|
| |||||||
Distributions to shareholders from: | ||||||||
Net investment income: | ||||||||
Class Z | — | (141,121,394 | ) | |||||
Class A | — | (42,192,676 | ) | |||||
Class C | — | (9,158,365 | ) | |||||
Class R | — | (62,381 | ) | |||||
Class R6 | — | (4,613,009 | ) | |||||
Net realized gains: | ||||||||
Class Z | — | (31,454,610 | ) | |||||
Class A | — | (9,969,480 | ) | |||||
Class C | — | (2,773,577 | ) | |||||
Class R | — | (12,207 | ) | |||||
Class R6 | — | (303,983 | ) | |||||
|
| |||||||
Total distributions to shareholders | — | (241,661,682 | ) | |||||
|
| |||||||
Capital share transactions: (Note 2) | ||||||||
Class Z | (260,953,084 | ) | (94,442,773 | ) | ||||
Class A | (72,394,111 | ) | (85,348,310 | ) | ||||
Class C | (26,825,188 | ) | (41,119,296 | ) | ||||
Class R | 869,319 | 879,482 | ||||||
Class R6 | (5,801,186 | ) | 72,905,275 | |||||
|
| |||||||
Total capital share transactions | (365,104,250 | ) | (147,125,622 | ) | ||||
|
| |||||||
Net increase (decrease) in net assets | (199,316,285 | ) | (39,943,066 | ) | ||||
Net assets: | ||||||||
Beginning of period | 5,256,018,201 | 5,295,961,267 | ||||||
|
| |||||||
End of period | $5,056,701,916 | $5,256,018,201 | ||||||
|
| |||||||
Undistributed net investment income included in net assets: | ||||||||
End of period | $ 71,301,465 | $ — | ||||||
|
| |||||||
Distributions in excess of net investment income included in net assets: | ||||||||
End of period | $ — | $ (4,820,394 | ) | |||||
|
| |||||||
| franklintempleton.com | The accompanying notes are an integral part of these financial statements. | Semiannual Report | 29 |
FRANKLIN MUTUAL QUEST FUND
Notes to Financial Statements (unaudited)
1. Organization and Significant Accounting Policies
Franklin Mutual Series Funds (Trust) is registered under the Investment Company Act of 1940 (1940 Act) as an open-end management investment company, consisting of seven separate funds and applies the specialized accounting and reporting guidance in U.S. Generally Accepted Accounting Principles (U.S. GAAP). Franklin Mutual Quest Fund (Fund) is included in this report. The Fund offers five classes of shares: Class Z, Class A, Class C, Class R and Class R6. Each class of shares may differ by its initial sales load, contingent deferred sales charges, voting rights on matters affecting a single class, its exchange privilege and fees due to differing arrangements for distribution and transfer agent fees.
The following summarizes the Fund’s significant accounting policies.
a. Financial Instrument Valuation
The Fund’s investments in financial instruments are carried at fair value daily. Fair value is the price that would be received to sell an asset or paid to transfer a liability in an orderly transaction between market participants on the measurement date. The Fund calculates the net asset value (NAV) per share each business day as of 4 p.m. Eastern time or the regularly scheduled close of the New York Stock Exchange (NYSE), whichever is earlier. Under compliance policies and procedures approved by the Trust’s Board of Trustees (the Board), the Fund’s administrator has responsibility for oversight of valuation, including leading the cross-functional Valuation Committee (VC). The VC provides administration and oversight of the Fund’s valuation policies and procedures, which are approved annually by the Board. Among other things, these procedures allow the Fund to utilize independent pricing services, quotations from securities and financial instrument dealers, and other market sources to determine fair value.
Equity securities and derivative financial instruments listed on an exchange or on the NASDAQ National Market System are valued at the last quoted sale price or the official closing price of the day, respectively. Foreign equity securities are valued as of the close of trading on the foreign stock exchange on which the security is primarily traded, or as of 4 p.m. Eastern time. The value is then converted into its U.S. dollar equivalent at the foreign exchange rate in effect at 4 p.m. Eastern time on the day that the value of the security is determined. Over-the-counter (OTC) securities are valued within the range of the most recent
quoted bid and ask prices. Securities that trade in multiple markets or on multiple exchanges are valued according to the broadest and most representative market. Certain equity securities are valued based upon fundamental characteristics or relationships to similar securities.
Debt securities generally trade in the OTC market rather than on a securities exchange. The Fund’s pricing services use multiple valuation techniques to determine fair value. In instances where sufficient market activity exists, the pricing services may utilize a market-based approach through which quotes from market makers are used to determine fair value. In instances where sufficient market activity may not exist or is limited, the pricing services also utilize proprietary valuation models which may consider market characteristics such as benchmark yield curves, credit spreads, estimated default rates, anticipated market interest rate volatility, coupon rates, anticipated timing of principal repayments, underlying collateral, and other unique security features in order to estimate the relevant cash flows, which are then discounted to calculate the fair value.
Certain derivative financial instruments trade in the OTC market. The Fund’s pricing services use various techniques including industry standard option pricing models and proprietary discounted cash flow models to determine the fair value of those instruments. The Fund’s net benefit or obligation under the derivative contract, as measured by the fair value of the contract, is included in net assets.
The Fund has procedures to determine the fair value of financial instruments for which market prices are not reliable or readily available. Under these procedures, the VC convenes on a regular basis to review such financial instruments and considers a number of factors, including significant unobservable valuation inputs, when arriving at fair value. The VC primarily employs a market-based approach which may use related or comparable assets or liabilities, recent transactions, market multiples, book values, and other relevant information for the investment to determine the fair value of the investment. An income-based valuation approach may also be used in which the anticipated future cash flows of the investment are discounted to calculate fair value. Discounts may also be applied due to the nature or duration of any restrictions on the disposition of the investments. Due to the inherent uncertainty of valuations of such investments, the fair values may differ significantly from the values that would have been used had an active market existed. The VC employs various methods for calibrating these
| 30 | Semiannual Report | franklintempleton.com |
FRANKLIN MUTUAL QUEST FUND
NOTES TO FINANCIAL STATEMENTS (UNAUDITED)
valuation approaches including a regular review of key inputs and assumptions, transactional back-testing or disposition analysis, and reviews of any related market activity.
Trading in securities on foreign securities stock exchanges and OTC markets may be completed before 4 p.m. Eastern time. In addition, trading in certain foreign markets may not take place on every Fund’s business day. Occasionally, events occur between the time at which trading in a foreign security is completed and 4 p.m. Eastern time that might call into question the reliability of the value of a portfolio security held by the Fund. As a result, differences may arise between the value of the Fund’s portfolio securities as determined at the foreign market close and the latest indications of value at 4 p.m. Eastern time. In order to minimize the potential for these differences, the VC monitors price movements following the close of trading in foreign stock markets through a series of country specific market proxies (such as baskets of American Depositary Receipts, futures contracts and exchange traded funds). These price movements are measured against established trigger thresholds for each specific market proxy to assist in determining if an event has occurred that may call into question the reliability of the values of the foreign securities held by the Fund. If such an event occurs, the securities may be valued using fair value procedures, which may include the use of independent pricing services.
When the last day of the reporting period is a non-business day, certain foreign markets may be open on those days that the Fund’s NAV is not calculated, which could result in differences between the value of the Fund’s portfolio securities on the last business day and the last calendar day of the reporting period. Any significant security valuation changes due to an open foreign market are adjusted and reflected by the Fund for financial reporting purposes.
b. Foreign Currency Translation
Portfolio securities and other assets and liabilities denominated in foreign currencies are translated into U.S. dollars based on the exchange rate of such currencies against U.S. dollars on the date of valuation. The Fund may enter into foreign currency exchange contracts to facilitate transactions denominated in a foreign currency. Purchases and sales of securities, income and expense items denominated in foreign currencies are translated into U.S. dollars at the exchange rate in effect on the transaction date. Portfolio securities and assets and liabilities denominated in foreign currencies contain risks that those currencies will
decline in value relative to the U.S. dollar. Occasionally, events may impact the availability or reliability of foreign exchange rates used to convert the U.S. dollar equivalent value. If such an event occurs, the foreign exchange rate will be valued at fair value using procedures established and approved by the Board.
The Fund does not separately report the effect of changes in foreign exchange rates from changes in market prices on securities held. Such changes are included in net realized and unrealized gain or loss from investments in the Statement of Operations.
Realized foreign exchange gains or losses arise from sales of foreign currencies, currency gains or losses realized between the trade and settlement dates on securities transactions and the difference between the recorded amounts of dividends, interest, and foreign withholding taxes and the U.S. dollar equivalent of the amounts actually received or paid. Net unrealized foreign exchange gains and losses arise from changes in foreign exchange rates on foreign denominated assets and liabilities other than investments in securities held at the end of the reporting period.
c. Derivative Financial Instruments
The Fund invested in derivative financial instruments in order to manage risk or gain exposure to various other investments or markets. Derivatives are financial contracts based on an underlying or notional amount, require no initial investment or an initial net investment that is smaller than would normally be required to have a similar response to changes in market factors, and require or permit net settlement. Derivatives contain various risks including the potential inability of the counterparty to fulfill their obligations under the terms of the contract, the potential for an illiquid secondary market, and/or the potential for market movements which expose the Fund to gains or losses in excess of the amounts shown in the Statement of Assets and Liabilities. Realized gain and loss and unrealized appreciation and depreciation on these contracts for the period are included in the Statement of Operations.
Derivative counterparty credit risk is managed through a formal evaluation of the creditworthiness of all potential counterparties. The Fund attempts to reduce its exposure to counterparty credit risk on OTC derivatives, whenever possible, by entering into International Swaps and Derivatives Association (ISDA) master agreements with certain counterparties. These agreements contain various provisions,
| franklintempleton.com | Semiannual Report | 31 |
FRANKLIN MUTUAL QUEST FUND
NOTES TO FINANCIAL STATEMENTS (UNAUDITED)
1. Organization and Significant Accounting Policies (continued)
c. Derivative Financial Instruments (continued)
including but not limited to collateral requirements, events of default, or early termination. Termination events applicable to the counterparty include certain deteriorations in the credit quality of the counterparty. Termination events applicable to the Fund include failure of the Fund to maintain certain net asset levels and/or limit the decline in net assets over various periods of time. In the event of default or early termination, the ISDA master agreement gives the non-defaulting party the right to net and close-out all transactions traded, whether or not arising under the ISDA agreement, to one net amount payable by one counterparty to the other. However, absent an event of default or early termination, OTC derivative assets and liabilities are presented gross and not offset in the Statement of Assets and Liabilities. Early termination by the counterparty may result in an immediate payment by the Fund of any net liability owed to that counterparty under the ISDA agreement. At June 30, 2018, the Fund had no OTC derivatives in a net liability position for such contracts.
Collateral requirements differ by type of derivative. Collateral or initial margin requirements are set by the broker or exchange clearing house for exchange traded and centrally cleared derivatives. Initial margin deposited is held at the exchange and can be in the form of cash and/or securities. For OTC derivatives traded under an ISDA master agreement, posting of collateral is required by either the Fund or the applicable counterparty if the total net exposure of all OTC derivatives with the applicable counterparty exceeds the minimum transfer amount, which typically ranges from $100,000 to $250,000, and can vary depending on the counterparty and the type of the agreement. Generally, collateral is determined at the close of Fund business each day and any additional collateral required due to changes in derivative values may be delivered by the Fund or the counterparty the next business day, or within a few business days. Collateral pledged and/or received by the Fund for OTC derivatives, if any, is held in segregated accounts with the Fund’s custodian/counterparty broker and can be in the form of cash and/or securities. Unrestricted cash may be invested according to the Fund’s investment objectives. To the extent that the amounts due to the Fund from its counterparties are not subject to collateralization or are not fully collateralized, the Fund bears the risk of loss from counterparty non-performance.
At June 30, 2018, the Fund received $25,620,459 in U.K. Treasury Bonds and U.S. Treasury Bills, Bonds and Notes as collateral for derivatives.
The Fund entered into exchange traded futures contracts primarily to manage exposure to certain foreign currencies. A futures contract is an agreement between the Fund and a counterparty to buy or sell an asset at a specified price on a future date. Required initial margins are pledged by the Fund, and the daily change in fair value is accounted for as a variation margin payable or receivable in the Statement of Assets and Liabilities.
The Fund entered into OTC forward exchange contracts primarily to manage exposure to certain foreign currencies. A forward exchange contract is an agreement between the Fund and a counterparty to buy or sell a foreign currency at a specific exchange rate on a future date.
The Fund purchased or wrote exchange traded option contracts primarily to manage exposure to equity price risk. An option is a contract entitling the holder to purchase or sell a specific amount of shares or units of an asset or notional amount of a swap (swaption), at a specified price. When an option is purchased or written, an amount equal to the premium paid or received is recorded as an asset or liability, respectively. Upon exercise of an option, the acquisition cost or sales proceeds of the underlying investment is adjusted by any premium received or paid. Upon expiration of an option, any premium received or paid is recorded as a realized gain or loss. Upon closing an option other than through expiration or exercise, the difference between the premium received or paid and the cost to close the position is recorded as a realized gain or loss.
See Note 11 regarding other derivative information.
d. Securities Sold Short
The Fund is engaged in selling securities short, which obligates the Fund to replace a borrowed security with the same security at current fair value. The Fund incurs a loss if the price of the security increases between the date of the short sale and the date on which the Fund replaces the borrowed security. The Fund realizes a gain if the price of the security declines between those dates. Gains are limited to the price at which the Fund sold the security short, while losses are potentially unlimited in size.
| 32 | Semiannual Report | franklintempleton.com |
FRANKLIN MUTUAL QUEST FUND
NOTES TO FINANCIAL STATEMENTS (UNAUDITED)
The Fund is required to establish a margin account with the broker lending the security sold short. While the short sale is outstanding, the broker retains the proceeds of the short sale to the extent necessary to meet margin requirements until the short position is closed out. A deposit must also be maintained with the Fund’s custodian/counterparty broker consisting of cash and/or securities having a value equal to a specified percentage of the value of the securities sold short. The Fund is obligated to pay fees for borrowing the securities sold short and is required to pay the counterparty any dividends and/or interest due on securities sold short. Such dividends and/or interest and any security borrowing fees are recorded as an expense to the Fund.
e. Senior Floating Rate Interests
The Fund invests in senior secured corporate loans that pay interest at rates which are periodically reset by reference to a base lending rate plus a spread. These base lending rates are generally the prime rate offered by a designated U.S. bank or the London InterBank Offered Rate (LIBOR). Senior secured corporate loans often require prepayment of principal from excess cash flows or at the discretion of the borrower. As a result, actual maturity may be substantially less than the stated maturity. Senior secured corporate loans in which the Fund invests are generally readily marketable, but may be subject to certain restrictions on resale.
f. Income and Deferred Taxes
It is the Fund’s policy to qualify as a regulated investment company under the Internal Revenue Code. The Fund intends to distribute to shareholders substantially all of its taxable income and net realized gains to relieve it from federal income and excise taxes. As a result, no provision for U.S. federal income taxes is required.
The Fund may be subject to foreign taxation related to income received, capital gains on the sale of securities and certain foreign currency transactions in the foreign jurisdictions in which it invests. Foreign taxes, if any, are recorded based on the tax regulations and rates that exist in the foreign markets in which the Fund invests. When a capital gain tax is determined to apply, the Fund records an estimated deferred tax liability in an amount that would be payable if the securities were disposed of on the valuation date.
As a result of several court cases, in certain countries across the European Union, the Fund filed additional tax reclaims for previously withheld taxes on dividends earned in those
countries (EU reclaims). These additional filings are subject to various administrative proceedings by the local jurisdictions’ tax authorities within the European Union, as well as a number of related judicial proceedings. Income recognized, if any, for EU reclaims is reflected as other income in the Statement of Operations and any related receivable, if any, is reflected as European Union tax reclaims in the Statement of Assets and Liabilities. When uncertainty exists as to the ultimate resolution of these proceedings, the likelihood of receipt of these EU reclaims, and the potential timing of payment, no amounts are reflected in the financial statements. For U.S. income tax purposes, EU reclaims received by the Fund, if any, reduce the amounts of foreign taxes Fund shareholders can use as tax credits in their individual income tax returns.
The Fund may recognize an income tax liability related to its uncertain tax positions under U.S. GAAP when the uncertain tax position has a less than 50% probability that it will be sustained upon examination by the tax authorities based on its technical merits. As of June 30, 2018, the Fund has determined that no tax liability is required in its financial statements related to uncertain tax positions for any open tax years (or expected to be taken in future tax years). Open tax years are those that remain subject to examination and are based on the statute of limitations in each jurisdiction in which the Fund invests.
g. Security Transactions, Investment Income, Expenses and Distributions
Security transactions are accounted for on trade date. Realized gains and losses on security transactions are determined on a specific identification basis. Interest income and estimated expenses are accrued daily. Amortization of premium and accretion of discount on debt securities are included in interest income. Dividend income and dividends declared on securities sold short are recorded on the ex-dividend date except for certain dividends from securities where the dividend rate is not available. In such cases, the dividend is recorded as soon as the information is received by the Fund. Distributions to shareholders are recorded on the ex-dividend date. Distributable earnings are determined according to income tax regulations (tax basis) and may differ from earnings recorded in accordance with U.S. GAAP. These differences may be permanent or temporary. Permanent differences are reclassified among capital accounts to reflect their tax character. These reclassifications have no impact on net assets or the results of operations. Temporary differences are not reclassified, as they may reverse in subsequent periods.
| franklintempleton.com | Semiannual Report | 33 |
FRANKLIN MUTUAL QUEST FUND
NOTES TO FINANCIAL STATEMENTS (UNAUDITED)
1. Organization and Significant Accounting Policies (continued)
g. Security Transactions, Investment Income, Expenses and Distributions (continued)
Common expenses incurred by the Trust are allocated among the Funds based on the ratio of net assets of each Fund to the combined net assets of the Trust or based on the ratio of number of shareholders of each Fund to the combined number of shareholders of the Trust. Fund specific expenses are charged directly to the Fund that incurred the expense.
Realized and unrealized gains and losses and net investment income, excluding class specific expenses, are allocated daily to each class of shares based upon the relative proportion of net assets of each class. Differences in per share distributions by class are generally due to differences in class specific expenses.
h. Accounting Estimates
The preparation of financial statements in accordance with U.S. GAAP requires management to make estimates and assumptions that affect the reported amounts of assets and
liabilities at the date of the financial statements and the amounts of income and expenses during the reporting period. Actual results could differ from those estimates.
i. Guarantees and Indemnifications
Under the Trust’s organizational documents, its officers and trustees are indemnified by the Trust against certain liabilities arising out of the performance of their duties to the Trust. Additionally, in the normal course of business, the Trust, on behalf of the Fund, enters into contracts with service providers that contain general indemnification clauses. The Trust’s maximum exposure under these arrangements is unknown as this would involve future claims that may be made against the Trust that have not yet occurred. Currently, the Trust expects the risk of loss to be remote.
2. Shares of Beneficial Interest
At June 30, 2018, there were an unlimited number of shares authorized (without par value). Transactions in the Fund’s shares were as follows:
| Six Months Ended June 30, 2018 | Year Ended December 31, 2017 | |||||||||||||||
| Shares | Amount | Shares | Amount | |||||||||||||
| Class Z Shares: | ||||||||||||||||
| Shares sold | 6,696,200 | $ | 107,833,259 | 27,728,870 | $ | 439,840,070 | ||||||||||
Shares issued in reinvestment of distributions | — | — | 10,319,549 | 163,868,714 | ||||||||||||
Shares redeemed | (23,033,790 | ) | (368,786,343 | ) | (43,674,171 | ) | (698,151,557 | ) | ||||||||
|
| |||||||||||||||
Net increase (decrease) | (16,337,590 | ) | $ | (260,953,084 | ) | (5,625,752 | ) | $ | (94,442,773 | ) | ||||||
|
| |||||||||||||||
| Class A Shares: | ||||||||||||||||
Shares sold | 3,640,333 | $ | 57,894,904 | 13,056,163 | $ | 204,059,076 | ||||||||||
Shares issued in reinvestment of distributions | — | — | 3,269,611 | 51,185,442 | ||||||||||||
Shares redeemed | (8,211,128 | ) | (130,289,015 | ) | (21,720,286 | ) | (340,592,828 | ) | ||||||||
|
| |||||||||||||||
Net increase (decrease) | (4,570,795 | ) | $ | (72,394,111 | ) | (5,394,512 | ) | $ | (85,348,310 | ) | ||||||
|
| |||||||||||||||
| Class C Shares: | ||||||||||||||||
| Shares sold | 820,669 | $ | 12,783,209 | 3,143,553 | $ | 48,265,137 | ||||||||||
Shares issued in reinvestment of distributions | — | — | 767,506 | 11,797,949 | ||||||||||||
Shares redeemed | (2,540,648 | ) | (39,608,397 | ) | (6,578,117 | ) | (101,182,382 | ) | ||||||||
|
| |||||||||||||||
Net increase (decrease) | (1,719,979 | ) | $ | (26,825,188 | ) | (2,667,058 | ) | $ | (41,119,296 | ) | ||||||
|
| |||||||||||||||
| 34 | Semiannual Report | franklintempleton.com |
FRANKLIN MUTUAL QUEST FUND
NOTES TO FINANCIAL STATEMENTS (UNAUDITED)
| Six Months Ended June 30, 2018 | Year Ended December 31, 2017 | |||||||||||||||
| Shares | Amount | Shares | Amount | |||||||||||||
| Class R Shares: | ||||||||||||||||
| Shares sold | 71,989 | $ | 1,132,638 | 93,915 | $ | 1,451,999 | ||||||||||
Shares issued in reinvestment of distributions | — | — | 4,829 | 74,588 | ||||||||||||
Shares redeemed | (16,980 | ) | (263,319 | ) | (41,676 | ) | (647,105 | ) | ||||||||
|
| |||||||||||||||
Net increase (decrease) | 55,009 | $ | 869,319 | 57,068 | $ | 879,482 | ||||||||||
|
| |||||||||||||||
| Class R6 Shares: | ||||||||||||||||
Shares sold | 881,577 | $ | 14,189,982 | 6,529,553 | $ | 105,932,665 | ||||||||||
Shares issued in reinvestment of distributions | — | — | 310,142 | 4,916,992 | ||||||||||||
Shares redeemed | (1,241,995 | ) | (19,991,168 | ) | (2,378,788 | ) | (37,944,382 | ) | ||||||||
|
| |||||||||||||||
Net increase (decrease) | (360,418 | ) | $ | (5,801,186 | ) | 4,460,907 | $ | 72,905,275 | ||||||||
|
| |||||||||||||||
3. Transactions with Affiliates
Franklin Resources, Inc. is the holding company for various subsidiaries that together are referred to as Franklin Templeton Investments. Certain officers and trustees of the Fund are also officers and/or directors of the following subsidiaries:
| Subsidiary | Affiliation | |
Franklin Mutual Advisers, LLC (Franklin Mutual) | Investment manager | |
Franklin Templeton Services, LLC (FT Services) | Administrative manager | |
Franklin Templeton Distributors, Inc. (Distributors) | Principal underwriter | |
Franklin Templeton Investor Services, LLC (Investor Services) | Transfer agent |
a. Management Fees
The Fund pays an investment management fee to Franklin Mutual based on the average daily net assets of the Fund as follows:
| Annualized Fee Rate | Net Assets | |
0.675% | Up to and including $5 billion | |
0.645% | Over $5 billion, up to and including $7 billion | |
0.625% | Over $7 billion, up to and including $10 billion | |
0.615% | In excess of $10 billion |
For the period ended June 30, 2018, the annualized gross effective investment management fee rate was 0.674% of the Fund’s average daily net assets.
b. Administrative Fees
Under an agreement with Franklin Mutual, FT Services provides administrative services to the Fund. The fee is paid by Franklin Mutual based on the Fund’s average daily net assets, and is not an additional expense of the Fund.
c. Distribution Fees
The Board has adopted distribution plans for each share class, with the exception of Class Z and Class R6 shares, pursuant to Rule 12b-1 under the 1940 Act. Under the Fund’s Class A reimbursement distribution plan, the Fund reimburses Distributors for costs incurred in connection with the servicing, sale and distribution of the Fund’s shares up to the maximum annual plan rate. Under the Class A reimbursement distribution plan, costs exceeding the maximum for the current plan year cannot be reimbursed in
| franklintempleton.com | Semiannual Report | 35 |
FRANKLIN MUTUAL QUEST FUND
NOTES TO FINANCIAL STATEMENTS (UNAUDITED)
3. Transactions with Affiliates (continued)
c. Distribution Fees (continued)
subsequent periods. In addition, under the Fund’s Class C and R compensation distribution plans, the Fund pays Distributors for costs incurred in connection with the servicing, sale and distribution of the Fund’s shares up to the maximum annual plan rate for each class. The plan year, for purposes of monitoring compliance with the maximum annual plan rates, is February 1 through January 31.
The maximum annual plan rates, based on the average daily net assets, for each class, are as follows:
Class A | 0.35% | |||
Class C | 1.00% | |||
Class R | 0.50% |
The Board has set the current rate at 0.25% per year for Class A shares until further notice and approval by the Board.
d. Sales Charges/Underwriting Agreements
Front-end sales charges and contingent deferred sales charges (CDSC) do not represent expenses of the Fund. These charges are deducted from the proceeds of sales of Fund shares prior to investment or from redemption proceeds prior to remittance, as applicable. Distributors has advised the Fund of the following commission transactions related to the sales and redemptions of the Fund’s shares for the period:
Sales charges retained net of commissions paid to | $112,474 | |||
CDSC retained | $10,946 |
e. Transfer Agent Fees
Each class of shares pays transfer agent fees to Investor Services for its performance of shareholder servicing obligations. Effective November 1, 2017, the fees are based on an annualized asset based fee of 0.02% plus a transaction based fee. Prior to November 1, 2017, the fees were account based fees that varied based on fund or account type. In addition, each class reimburses Investor Services for out of pocket expenses incurred and, except for Class R6, reimburses shareholder servicing fees paid to third parties. These fees are allocated daily based upon their relative proportion of such classes’ aggregate net assets. Class R6 pays Investor Services transfer agent fees specific to that class.
For the period ended June 30, 2018, the Fund paid transfer agent fees of $2,262,869, of which $985,322 was retained by Investor Services.
f. Waiver and Expense Reimbursements
Investor Services has voluntarily agreed in advance to waive or limit its fees so that the Class R6 transfer agent fees do not exceed 0.02% based on the average net assets of the class. Investor Services may discontinue this waiver in the future.
4. Expense Offset Arrangement
The Fund has entered into an arrangement with its custodian whereby credits realized as a result of uninvested cash balances are used to reduce a portion of the Fund’s custodian expenses. During the period ended June 30, 2018, the custodian fees were reduced as noted in the Statement of Operations.
| 36 | Semiannual Report | franklintempleton.com |
FRANKLIN MUTUAL QUEST FUND
NOTES TO FINANCIAL STATEMENTS (UNAUDITED)
5. Independent Trustees’ Retirement Plan
On January 1, 1993, the Trust adopted an Independent Trustees’ Retirement Plan (Plan). The Plan is an unfunded defined benefit plan that provides benefit payments to Trustees whose length of service and retirement age meets the eligibility requirements of the Plan. Benefits under the Plan are based on years of service and fees paid to each trustee at the time of retirement. Effective in December 1996, the Plan was closed to new participants.
During the period ended June 30, 2018, the Fund’s projected benefit obligation and benefit payments under the Plan were as follows:
aProjected benefit obligation at June 30, 2018 | $249,010 | |||
bIncrease in projected benefit obligation | $2,083 | |||
Benefit payments made to retired trustees | $(2,640 | ) |
aThe projected benefit obligation is included in trustees’ fees and expenses in the Statement of Assets and Liabilities.
bThe increase in projected benefit obligation is included in trustees’ fees and expenses in the Statement of Operations.
6. Income Taxes
For tax purposes, capital losses may be carried over to offset future capital gains. Capital loss carryforwards with no expiration, if any, must be fully utilized before those losses with expiration dates.
At December 31, 2017, capital loss carryforwards were as follows:
| Capital loss carryforwards subject to expiration: | ||||
2018 | $18,751,585 | |||
| Capital loss carryforwards not subject to expiration: | ||||
Short Term | 9,021,376 | |||
Long Term | 38,510,337 | |||
|
| |||
Total capital loss carryforwards | $66,283,298a | |||
|
| |||
aIncludes $21,379,658 from the acquired Franklin Mutual Recovery Fund, which may be carried over to offset future capital gains, subject to certain limitations.
At June 30, 2018, the cost of investments and net unrealized appreciation (depreciation) for income tax purposes were as follows:
Cost of investments | $ | 4,713,316,488 | ||
|
| |||
Unrealized appreciation | $ | 533,936,055 | ||
Unrealized depreciation | (399,083,005 | ) | ||
|
| |||
Net unrealized appreciation (depreciation) | $ | 134,853,050 | ||
|
|
Differences between income and/or capital gains as determined on a book basis and a tax basis are primarily due to differing treatments of foreign currency transactions, bond discounts and premiums and defaulted securities.
7. Investment Transactions
Purchases and sales of investments (excluding short term securities and securities sold short) for the period ended June 30, 2018, aggregated $1,717,052,550 and $2,116,219,384, respectively.
| franklintempleton.com | Semiannual Report | 37 |
FRANKLIN MUTUAL QUEST FUND
NOTES TO FINANCIAL STATEMENTS (UNAUDITED)
8. Credit Risk and Defaulted Securities
The Fund may purchase the pre-default or defaulted debt of distressed companies. Distressed companies are financially troubled and could be or are already involved in financial restructuring or bankruptcy. Risks associated with purchasing these securities include the possibility that the bankruptcy or other restructuring process takes longer than expected, or that distributions in restructuring are less than anticipated, either or both of which may result in unfavorable consequences to the Fund. If it becomes probable that the income on debt securities, including those of distressed companies, will not be collected, the Fund discontinues accruing income and recognizes an adjustment for uncollectible interest.
At June 30, 2018, the aggregate long value of distressed company securities for which interest recognition has been discontinued was $143,916,445, representing 2.8% of the Fund’s net assets. For information as to specific securities, see the accompanying Statement of Investments.
9. Concentration of Risk
Investing in foreign securities may include certain risks and considerations not typically associated with investing in U.S. securities, such as fluctuating currency values and changing local and regional economic, political and social conditions, which may result in greater market volatility. In addition, certain foreign securities may not be as liquid as U.S. securities.
10. Restricted Securities
The Fund invests in securities that are restricted under the Securities Act of 1933 (1933 Act). Restricted securities are often purchased in private placement transactions, and cannot be sold without prior registration unless the sale is pursuant to an exemption under the 1933 Act. Disposal of these securities may require greater effort and expense, and prompt sale at an acceptable price may be difficult. The Fund may have registration rights for restricted securities. The issuer generally incurs all registration costs.
At June 30, 2018, investments in restricted securities, excluding securities exempt from registration under the 1933 Act deemed to be liquid, were as follows:
| Principal Amount/ Shares/ Warrants | Issuer | Acquisition Date | Cost | Value | ||||||||||||
| 9,272 | Broadband Ventures III LLC, secured promissory note, 5.00%, 2/01/12 | 7/01/10 - 11/30/12 | $ | 9,272 | $ | — | ||||||||||
| 2,548,299 | International Automotive Components Group Brazil LLC | 4/13/06 - 12/26/08 | 1,692,334 | 57,943 | ||||||||||||
| 19,924,658 | International Automotive Components Group North America LLC | 1/02/06 - 3/18/13 | 16,305,945 | 5,965,224 | ||||||||||||
| 1,110,000 | a Lee Enterprises Inc., wts., 12/31/22 | 3/31/14 | 1,490,026 | 1,328,592 | ||||||||||||
| 224,279 | b Sorenson Communications LLC, Membership Interests | 4/30/14 | — | 178,301,724 | ||||||||||||
| 17,873,000 | Sunshine Oilsands Ltd., secured note, 144A, 10.00%, 8/01/17 | 8/04/14 | 17,706,373 | 3,931,763 | ||||||||||||
|
| |||||||||||||||
| Total Restricted Securities (Value is 3.7% of Net Assets) | $ | 37,203,950 | $ | 189,585,246 | ||||||||||||
|
| |||||||||||||||
aThe Fund also invests in unrestricted securities or other investments in the issuer, valued at $ 167,622,410 as of June 30, 2018.
bThe Fund also invests in unrestricted securities or other investments in the issuer, valued at $ 257,783,743 as of June 30, 2018.
| 38 | Semiannual Report | franklintempleton.com |
FRANKLIN MUTUAL QUEST FUND
NOTES TO FINANCIAL STATEMENTS (UNAUDITED)
11. Other Derivative Information
At June 30, 2018, the Fund’s investments in derivative contracts are reflected in the Statement of Assets and Liabilities as follows:
Asset Derivatives | Liability Derivatives | |||||||||||
| Derivative Contracts Not Accounted for as Hedging Instruments | Statement of Assets and Liabilities Location | Fair Value | Statement of Assets and Liabilities Location | Fair Value | ||||||||
Foreign exchange contracts | Variation margin on futures contracts | $ | 2,343,565 | a | Variation margin on futures contracts | $ | — | |||||
Unrealized appreciation on OTC forward exchange contracts | 23,752,323 | Unrealized depreciation on OTC forward exchange contracts | 934,308 | |||||||||
Equity contracts | Investments in securities, at value | 3,910,000 | b | Options written, at value | 5,676,000 | |||||||
|
|
|
| |||||||||
Totals | $ | 30,005,888 | $ | 6,610,308 | ||||||||
|
|
|
| |||||||||
aThis amount reflects the cumulative appreciation (depreciation) of futures contracts as reported in the Statement of Investments. Only the variation margin receivable/ payable at period end is separately reported within the Statement of Assets and Liabilities. Prior variation margin movements were recorded to cash upon receipt or payment.
bPurchased option contracts are included in investments in securities, at value in the Statement of Assets and Liabilities.
For the period ended June 30, 2018, the effect of derivative contracts in the Fund’s Statement of Operations was as follows:
| Derivative Contracts Not Accounted for as Hedging Instruments | Statement of Operations Location | Net Realized Gain (Loss) for the Period | Statement of Operations Location | Net Change in Unrealized Appreciation (Depreciation) for the Period | ||||||||||
Net realized gain (loss) from: | | Net change in unrealized appreciation (depreciation) on: | | |||||||||||
Foreign exchange contracts | Forward exchange contracts | $ | (16,794,223 | ) | Forward exchange contracts | $ | 34,231,750 | |||||||
Futures contracts | 2,887,812 | Futures contracts | 4,841,869 | |||||||||||
Equity contracts | Investments | — | Investments | (231,193 | )a | |||||||||
Written options | 1,491,167 | Written options | (1,689,650 | ) | ||||||||||
|
|
|
| |||||||||||
Totals | $ | (12,415,244 | ) | $ | 37,152,776 | |||||||||
|
|
|
| |||||||||||
aPurchased option contracts are included in net change in unrealized appreciation (depreciation) on investments in the Statement of Operations.
For the period ended June 30, 2018, the average month end notional amount of futures contracts and options represented $204,832,463 and $847,143, respectively. The average month end contract value of forward exchange contracts was $ 504,581,005.
See Note 1(c) regarding derivative financial instruments.
| franklintempleton.com | Semiannual Report | 39 |
FRANKLIN MUTUAL QUEST FUND
NOTES TO FINANCIAL STATEMENTS (UNAUDITED)
12. Holdings of 5% Voting Securities of Portfolio Companies
The 1940 Act defines “affiliated companies” to include investments in portfolio companies in which a fund owns 5% or more of the outstanding voting securities. During the period ended June 30, 2018, investments in “affiliated companies” were as follows:
| Name of Issuer | Number of Shares/ Warrants/ Principal Amount Held at Beginning of Period | Gross Additions | Gross Reductions | Number of Shares/ Warrants/ Principal Amount Held at End of Period | Value at End of Period | Investment Income | Realized Gain (Loss) | Net Change in Unrealized Appreciation (Depreciation) | ||||||||||||||||||||||||
| Non-Controlled Affiliates |
| |||||||||||||||||||||||||||||||
| Dividends | ||||||||||||||||||||||||||||||||
Advanced Emissions Solutions Inc. | 1,724,209 | — | — | 1,724,209 | $ | 19,587,014 | $ | 862,105 | $ | — | $ | 2,931,155 | ||||||||||||||||||||
Eastman Kodak Co. | 2,613,836 | — | (2,613,836 | ) | — | — | — | (35,037,722 | ) | 40,973,441 | ||||||||||||||||||||||
Eastman Kodak Co., wts., 9/03/18 | 48,582 | — | (48,582 | ) | — | — | — | (1,462,104 | ) | 1,558,221 | ||||||||||||||||||||||
Eastman Kodak Co., wts., 9/03/18 | 48,582 | — | (48,582 | ) | — | — | — | (1,296,546 | ) | 1,379,940 | ||||||||||||||||||||||
Lee Enterprises Inc./IA | 4,824,268 | — | — | 4,824,268 | 13,749,164 | — | — | 2,412,134 | ||||||||||||||||||||||||
Lee Enterprises Inc., wts., 12/31/22 | 1,110,000 | — | — | 1,110,000 | 1,328,592 | — | — | 839,870 | ||||||||||||||||||||||||
New Media Investment Group Inc. | 4,932,482 | 811,410 | (1,589,327 | ) | 4,154,565 | 76,776,361 | 3,711,274 | (946,516 | ) | 17,746,494 | ||||||||||||||||||||||
|
| |||||||||||||||||||||||||||||||
| $ | 111,441,131 | $ | 4,573,379 | $ | (38,742,888 | ) | $ | 67,841,255 | ||||||||||||||||||||||||
|
| |||||||||||||||||||||||||||||||
| Interest | ||||||||||||||||||||||||||||||||
Eastman Kodak Co., Term Loan, 7.819%, (LIBOR + 6.25%), 9/03/19 | 37,302,241 | — | (37,302,241 | ) | — | $ | — | $ | 254,019 | $ | (786,094 | ) | $ | 3,495,088 | ||||||||||||||||||
Lee Enterprises Inc., Second Lien Term Loan, 12.00%, 12/15/22 | 56,941,414 | — | (6,366,600 | ) | 50,574,814 | 52,092,058 | 1,603,707 | 94,097 | (967,224 | ) | ||||||||||||||||||||||
Lee Enterprises Inc., senior secured note, first lien, 144A, 9.50%, 3/15/22 | 99,050,000 | — | (2,000,000 | ) | 97,050,000 | 101,781,188 | 4,677,681 | 100,000 | 678,943 | |||||||||||||||||||||||
New Media Holdings II LLC, Fourth Amendment Replacement Term Loans, 8.127%, (LIBOR + 6.25%), 7/14/22 | 111,005,571 | — | (111,005,571 | ) | — | — | 3,555,359 | 1,668,911 | (2,379,812 | ) | ||||||||||||||||||||||
|
| |||||||||||||||||||||||||||||||
| $ | 153,873,246 | $ | 10,090,766 | $ | 1,076,914 | $ | 826,995 | |||||||||||||||||||||||||
|
| |||||||||||||||||||||||||||||||
Total Affiliated Securities (Value is 5.2% of Net Assets) |
| $ | 265,314,377 | $ | 14,664,145 | $ | (37,665,974 | ) | $ | 68,668,250 | ||||||||||||||||||||||
|
| |||||||||||||||||||||||||||||||
13. Credit Facility
The Fund, together with other U.S. registered and foreign investment funds (collectively, Borrowers), managed by Franklin Templeton Investments, are borrowers in a joint syndicated senior unsecured credit facility totaling $2 billion (Global Credit Facility) which matures on February 8, 2019. This Global Credit Facility provides a source of funds to the Borrowers for temporary and emergency purposes, including the ability to meet future unanticipated or unusually large redemption requests.
Under the terms of the Global Credit Facility, the Fund shall, in addition to interest charged on any borrowings made by the Fund and other costs incurred by the Fund, pay its share of fees and expenses incurred in connection with the implementation and maintenance of the Global Credit Facility, based upon its relative share of the aggregate net assets of all of the Borrowers, including an annual commitment fee of 0.15% based upon the unused portion of the Global Credit Facility. These fees are reflected in other expenses in the Statement of Operations. During the period ended June 30, 2018, the Fund did not use the Global Credit Facility.
| 40 | Semiannual Report | franklintempleton.com |
FRANKLIN MUTUAL QUEST FUND
NOTES TO FINANCIAL STATEMENTS (UNAUDITED)
14. Fair Value Measurements
The Fund follows a fair value hierarchy that distinguishes between market data obtained from independent sources (observable inputs) and the Fund’s own market assumptions (unobservable inputs). These inputs are used in determining the value of the Fund’s financial instruments and are summarized in the following fair value hierarchy:
| • | Level 1 – quoted prices in active markets for identical financial instruments |
| • | Level 2 – other significant observable inputs (including quoted prices for similar financial instruments, interest rates, prepayment speed, credit risk, etc.) |
| • | Level 3 – significant unobservable inputs (including the Fund’s own assumptions in determining the fair value of financial instruments) |
The input levels are not necessarily an indication of the risk or liquidity associated with financial instruments at that level.
For movements between the levels within the fair value hierarchy, the Fund has adopted a policy of recognizing the transfers as of the date of the underlying event which caused the movement.
A summary of inputs used as of June 30, 2018, in valuing the Fund’s assets and liabilities carried at fair value, is as follows:
| Level 1 | Level 2 | Level 3 | Total | |||||||||||||
| Assets: | ||||||||||||||||
Investments in Securities:a | ||||||||||||||||
Equity Investments:b | ||||||||||||||||
Auto Components | $ | 49,240,653 | $ | — | $ | 6,023,167 | $ | 55,263,820 | ||||||||
Communications Equipment | — | — | 178,301,724 | 178,301,724 | ||||||||||||
Diversified Consumer Services | — | — | 5,968,573 | 5,968,573 | ||||||||||||
Media | 582,533,856 | 2,111,697 | 1,328,592 | 585,974,145 | ||||||||||||
Software | 171,558,235 | 1,563,666 | — | 173,121,901 | ||||||||||||
All Other Equity Investments | 2,217,485,833 | — | — | c | 2,217,485,833 | |||||||||||
Corporate Bonds, Notes and Senior Floating Rate Interests | — | 828,762,321 | — | 828,762,321 | ||||||||||||
Corporate Notes and Senior Floating Rate Interests in Reorganization | — | 139,984,682 | 3,931,763 | c | 143,916,445 | |||||||||||
Companies in Liquidation | — | 4,347,335 | — | c | 4,347,335 | |||||||||||
Options Purchased | 3,910,000 | — | — | 3,910,000 | ||||||||||||
Short Term Investments | 628,530,317 | 5,600,000 | — | 634,130,317 | ||||||||||||
|
| |||||||||||||||
Total Investments in Securities | $ | 3,653,258,894 | $ | 982,369,701 | $ | 195,553,819 | $ | 4,831,182,414 | ||||||||
|
| |||||||||||||||
Other Financial Instruments: | ||||||||||||||||
Futures Contracts | $ | 2,343,565 | $ | — | $ | — | $ | 2,343,565 | ||||||||
Forward Exchange Contracts | — | 23,752,323 | — | 23,752,323 | ||||||||||||
|
| |||||||||||||||
Total Other Financial Instruments | $ | 2,343,565 | $ | 23,752,323 | $ | — | $ | 26,095,888 | ||||||||
|
| |||||||||||||||
| Liabilities: | ||||||||||||||||
Other Financial Instruments: | ||||||||||||||||
Options Written | $ | 5,676,000 | $ | — | $ | — | $ | 5,676,000 | ||||||||
Securities Sold Shorta | 2,504,707 | — | — | 2,504,707 | ||||||||||||
Forward Exchange Contracts | — | 934,308 | — | 934,308 | ||||||||||||
|
| |||||||||||||||
Total Other Financial Instruments | $ | 8,180,707 | $ | 934,308 | $ | — | $ | 9,115,015 | ||||||||
|
| |||||||||||||||
aFor detailed categories, see the accompanying Statement of Investments.
bIncludes common, preferred and convertible preferred stocks as well as other equity investments.
cIncludes securities determined to have no value at June 30, 2018.
| franklintempleton.com | Semiannual Report | 41 |
FRANKLIN MUTUAL QUEST FUND
NOTES TO FINANCIAL STATEMENTS (UNAUDITED)
14. Fair Value Measurements (continued)
A reconciliation of assets in which Level 3 inputs are used in determining fair value is presented when there are significant Level 3 financial instruments at the beginning and/or end of the period. At June 30, 2018, the reconciliation of assets, is as follows:
| Balance at Beginning of Period | Purchases (Sales) | Transfer Into (Out of) Level 3a | Cost Basis Adjustmentsb | Net Realized Gain (Loss) | Net Unrealized Appreciation (Depreciation) | Balance at End of Period | Net Change in (Depreciation) | |||||||||||||||||||||||||
| Assets: | ||||||||||||||||||||||||||||||||
Investments in Securities: | ||||||||||||||||||||||||||||||||
Equity Investments:c | ||||||||||||||||||||||||||||||||
Auto Components | $ | 13,213,236 | $ | — | $ | — | $ | — | $ | — | $ | (7,190,069 | ) | $ | 6,023,167 | $ | (7,190,069 | ) | ||||||||||||||
Communications Equipment | 160,414,954 | — | — | — | — | 17,886,770 | 178,301,724 | 17,886,770 | ||||||||||||||||||||||||
Diversified Consumer Services | 10,164,359 | — | — | — | — | (4,195,786 | ) | 5,968,573 | (4,195,786 | ) | ||||||||||||||||||||||
Media | 488,722 | — | — | — | — | 839,870 | 1,328,592 | 839,870 | ||||||||||||||||||||||||
Software | 575,122 | — | (1,234,029 | ) | — | — | 658,907 | — | — | |||||||||||||||||||||||
Corporate Notes and Senior Floating Rate Interests in Reorganization | 8,657,697 | d | — | — | — | — | (4,725,934 | ) | 3,931,763 | d | (4,725,934 | ) | ||||||||||||||||||||
Companies in Liquidation | 1,680,146 | d | — | (1,738,082 | ) | (10,955 | ) | 10,955 | 57,936 | — | d | — | ||||||||||||||||||||
|
| |||||||||||||||||||||||||||||||
Total | $ | 195,194,236 | $ | — | $ | (2,972,111 | ) | $ | (10,955 | ) | $ | 10,955 | $ | 3,331,694 | $ | 195,553,819 | $ | 2,614,851 | ||||||||||||||
|
| |||||||||||||||||||||||||||||||
aThe investments were transferred out of Level 3 as a result of the removal of a significant unobservable valuation input.
bMay include accretion, amortization, partnership adjustments, and/or other cost basis adjustments.
cIncludes common stocks as well as other equity investments.
dIncludes securities determined to have no value.
| 42 | Semiannual Report | franklintempleton.com |
FRANKLIN MUTUAL QUEST FUND
NOTES TO FINANCIAL STATEMENTS (UNAUDITED)
Significant unobservable valuation inputs for material Level 3 financial instruments and impact to fair value as a result of changes in unobservable valuation inputs as of June 30, 2018, are as follows:
| Description | Fair Value at End of Period | Valuation Technique | Unobservable Input | Amount/ Weighting | Impact to Fair Value if Input Increasesa | |||||||||||
| Assets: | ||||||||||||||||
Investments in Securities: | ||||||||||||||||
Equity Investments: | ||||||||||||||||
Auto Components | $ | 5,965,224 | Market comparables/ Discounted cash flow | EV / EBITDA multiple | 3.7x | Increase | ||||||||||
| Discount for lack of marketability | 10% | Decrease | ||||||||||||||
| Discount rate | 10% | Decreaseb | ||||||||||||||
Communications Equipment | 178,301,724 | Market transaction | Transaction price weighting | 50% | Increase | |||||||||||
| Market comparables | EV / EBITDA multiple | 5.8x | Increasec | |||||||||||||
Diversified Consumer Services | 5,968,573 | Market comparables | Discount for lack of marketability | 25.1% | Decreaseb | |||||||||||
All Other Investmentsd | 5,318,298 | |||||||||||||||
Total | $ | 195,553,819 | ||||||||||||||
aRepresents the directional change in the fair value of the Level 3 financial instruments that would result from a significant and reasonable increase in the corresponding input. A significant and reasonable decrease in the input would have the opposite effect. Significant impacts, if any, to fair value and/or net assets have been indicated.
bRepresents a significant impact to fair value but not net assets.
cRepresents a significant impact to fair value and net assets.
dIncludes fair value of immaterial financial instruments and/or other assets developed using various valuation techniques and unobservable inputs. May also include financial instruments with values derived using private transaction prices or non-public third party pricing information which is unobservable.
Abbreviations List
| ||||
EBITDA Earnings before interest, taxes, depreciation and amortization | ||||
EV Enterprise value | ||||
15. Subsequent Events
The Fund has evaluated subsequent events through the issuance of the financial statements and determined that no events have occurred that require disclosure, except for the following:
On February 27, 2018, the Board approved an automatic conversion feature for Class C that will convert shareholders’ Class C shares into Class A shares after they have been held for 10 years. The conversion feature will become effective on a future date prior to the calendar year end of 2018. Further details are disclosed in the Fund’s Prospectus.
On May 17, 2018, the Board approved changes to certain front-end sales charges and dealer commissions on Class A shares. The changes will become effective on or about September 10, 2018. Further details are disclosed in the Fund’s Prospectus.
| franklintempleton.com | Semiannual Report | 43 |
FRANKLIN MUTUAL QUEST FUND
NOTES TO FINANCIAL STATEMENTS (UNAUDITED)
Abbreviations
| Counterparty | Currency | Selected Portfolio | ||||||||
| BOFA | Bank of America Corp. | EUR | Euro | ADR | American Depositary Receipt | |||||
| BONY | The Bank of New York Mellon Corp. | GBP | British Pound | DIP | Debtor-In-Possession | |||||
| HSBK | HSBC Bank PLC | USD | United States Dollar | FHLB | Federal Home Loan Bank | |||||
| SSBT | State Street Bank and Trust Co., N.A. | LIBOR | London InterBank Offered Rate | |||||||
| UBSW | UBS AG | PIK | Payment-In-Kind | |||||||
| TRA | Tax Receivable Agreement Right | |||||||||
| 44 | Semiannual Report | franklintempleton.com |
FRANKLIN MUTUAL SERIES FUNDS
FRANKLIN MUTUAL QUEST FUND
Shareholder Information
Board Approval of Investment Management Agreements
FRANKLIN MUTUAL SERIES FUNDS
Franklin Mutual Quest Fund
(Fund)
The Board of Trustees (Board), including a majority of trustees that are not “interested persons” as such term is defined in section 2(a)(19) of the Investment Company Act of 1940 (hereinafter referred to as “independent trustees”), at an in-person meeting held on May 17, 2018, unanimously approved the renewal of the Fund’s investment management agreement. Prior to a meeting of all of the trustees for the purpose of considering such renewal, the independent trustees participated in two other meetings held in connection with the renewal process. Throughout the process, the independent trustees received assistance and advice from and met separately with independent counsel. The independent trustees met with and interviewed officers of the investment manager (including portfolio managers), the transfer agent and shareholder services group and the distributor. In approving the renewal of the investment management agreement for the Fund, the Board, including the independent trustees, determined that the investment management fee structure was fair and reasonable and that continuance of the agreement was in the best interests of the Fund and its shareholders.
In reaching their decision on the investment management agreement, the trustees took into account information furnished throughout the year at regular Board meetings, as well as information specifically requested and furnished for the renewal process, which culminated in the meetings referred to above for the specific purpose of considering such agreement. Information furnished throughout the year included, among others, reports on the Fund’s investment performance, expenses, portfolio composition, portfolio brokerage execution, client commission arrangements, derivatives, securities lending, asset segregation, portfolio turnover, Rule 12b-1 plan, distribution, shareholder servicing, legal and compliance matters, pricing of securities, sales and redemptions, and marketing support payments made to financial intermediaries, as well as a third-party survey of transfer agent fees charged to funds within the Franklin Templeton Investments (FTI) complex in comparison with those charged to other fund complexes deemed comparable. Also, related financial statements and other information about the scope and quality of services provided by the investment manager and its affiliates and enhancements to such services over the past year were
provided. In addition, the trustees received periodic reports throughout the year and during the renewal process relating to compliance with the Fund’s investment policies and restrictions. During the renewal process, the independent trustees considered the investment manager’s methods of operation within the Franklin Templeton group and its activities on behalf of other clients. The Board also noted that it received an annual report on all payments made by FTI or the Fund to financial intermediaries engaged in the sale of Fund shares, as well as a memorandum relating to third-party servicing arrangements in response to a Guidance Update from the U.S. Securities and Exchange Commission (SEC) relating to mutual fund distribution and sub-accounting fees.
The information obtained by the trustees during the renewal process also included a special report prepared by Broadridge Financial Solutions, Inc., an independent third-party analyst that utilizes data from Lipper, Inc. (“Lipper”), comparing the Fund’s investment performance and expenses with those of other mutual funds deemed comparable to the Fund as selected by Lipper (Broadridge Section 15(c) Report). The trustees reviewed the Broadridge Section 15(c) Report and its usefulness in the renewal process with respect to matters such as comparative fees, expenses, expense ratios, performance and volatility. They concluded that the report continues to be a reliable resource in the performance of their duties.
In addition, the trustees received a Profitability Study (Profitability Study) prepared by management discussing the profitability to FTI from its overall U.S. fund operations, as well as on an individual fund-by-fund basis. Over the past year, the Board and counsel to the independent trustees continued to receive reports on management’s handling of recent regulatory inquiries and pending legal actions against the investment manager and its affiliates. The independent trustees were satisfied with the actions taken to date by management in response to such regulatory and legal matters.
The trustees reviewed the personnel, operations, financial condition, and investment management capabilities, methodologies and resources of the investment manager. As part of this review, particular attention was given to management’s diligent risk management program, including continual monitoring and management of cybersecurity, liquidity and counterparty credit risk, and attention given to derivatives and other complex instruments that are held and expected to be held by the Fund and how such instruments are used to carry out the Fund’s investment goal(s). The Board also took into account, among other things, management’s efforts in
| franklintempleton.com | Semiannual Report | 45 |
FRANKLIN MUTUAL SERIES FUNDS
FRANKLIN MUTUAL QUEST FUND
SHAREHOLDER INFORMATION
establishing a global credit facility for the benefit of the Fund and other accounts managed by FTI to provide a source of cash for temporary and emergency purposes or to meet unusual redemption requests as well as the strong financial position of the investment manager’s parent company and its commitment to the mutual fund business. The Board noted management’s continuing efforts and expenditures in establishing effective business continuity plans and developing strategies to address areas of heightened concern in the mutual fund industry, such as cybersecurity and liquidity risk management. The Board also recognized management’s commitment to facilitating Board oversight of particular areas, including derivatives and payments to intermediaries, by enhanced reporting.
In addition to the above and other matters considered by the trustees throughout the course of the year, the following discussion relates to certain primary factors relevant to the Board’s decision. This discussion of the information and factors considered by the Board (including the information and factors discussed above) is not intended to be exhaustive, but rather summarizes certain factors considered by the Board. In view of the wide variety of factors considered, the Board did not, unless otherwise noted, find it practicable to quantify or otherwise assign relative weights to the foregoing factors. In addition, individual trustees may have assigned different weights to various factors.
NATURE, EXTENT AND QUALITY OF SERVICES. The trustees reviewed the nature, extent and quality of the services provided, and to be provided, by the investment manager. The trustees cited the investment manager’s ability to implement the Fund’s disciplined value investment approach and its long-term relationship with the Fund as reasons that shareholders choose to invest, and remain invested, in the Fund. The trustees reviewed the Fund’s portfolio management team, including its performance, staffing, skills and compensation program. With respect to portfolio manager compensation, management assured the trustees that the Fund’s long-term performance is a significant component of incentive-based compensation and noted that a portion of a portfolio manager’s incentive-based compensation is paid in shares of pre-designated funds from the portfolio manager’s fund management area. The trustees noted that the portfolio manager compensation program aligned the interests of the portfolio managers with that of shareholders of the Fund. The trustees discussed with management various other products, portfolios and entities that are advised by the investment manager and the allocation of assets and expenses among and within them, as well as their relative fees and reasons for differences with respect thereto and any potential
conflicts. During regular Board meetings and the aforementioned meetings of the independent trustees, the trustees received reports and presentations on the investment manager’s best execution trading policies. The trustees considered periodic reports provided to them showing that the investment manager complied with the investment policies and restrictions of the Fund as well as other reports periodically furnished to the Board covering matters such as the compliance of portfolio managers and other management personnel with the code of ethics covering the investment management personnel, the adherence to fair value pricing procedures established by the Board and the accuracy of net asset value calculations. The Board noted the extent of the benefits provided to Fund shareholders from being part of the Franklin Templeton group of funds, including the right to exchange investments between funds (same class) without a sales charge, the ability to reinvest Fund dividends into other funds and the right to combine holdings of other funds to obtain reduced sales charges. The Board considered the investment manager’s significant efforts in developing and implementing compliance procedures established in accordance with SEC and other requirements.
The Board considered the nature, extent and quality of the services to be provided under the Fund’s other service agreements to determine that, on an overall basis, Fund shareholders were well served. In this connection, the Board also took into account transfer agent and shareholder services provided to Fund shareholders by an affiliate of the investment manager, noting continuing expenditures by management to increase and improve the scope of such services and favorable periodic reports on shareholder services conducted by independent third parties. While such considerations directly affected the trustees’ decision in renewing the Fund’s transfer agent and shareholder services agreement, the Board also considered these commitments as incidental benefits to Fund shareholders deriving from the investment management relationship.
Based on their review, the trustees were satisfied with the nature and quality of the overall services provided, and to be provided, by the investment manager and its affiliates to the Fund and its shareholders and were confident in the abilities of the management team to continue the disciplined value investment approach of the Fund and to provide quality services to the Fund and its shareholders.
INVESTMENT PERFORMANCE. The trustees reviewed and placed significant emphasis on the investment performance of the Fund over the one-, three-, five- and 10-year periods
| 46 | Semiannual Report | franklintempleton.com |
FRANKLIN MUTUAL SERIES FUNDS
FRANKLIN MUTUAL QUEST FUND
SHAREHOLDER INFORMATION
ended December 31, 2017. They considered the history of successful performance of the Fund relative to various benchmarks. As part of their review, they inquired of management regarding benchmarks, style drift and restrictions on permitted investments. Consideration was also given to performance in the context of available levels of cash during the periods.
The trustees had meetings during the year, including the meetings referred to above held in connection with the renewal process, with the Fund’s portfolio managers to discuss performance and the management of the Fund. In addition to the materials provided by management in connection with the renewal process, the independent trustees requested supplemental information and additional presentations from the investment manager and senior management of FTI regarding the performance of the investment manager and the Fund. As part of these presentations, it was noted that senior management of FTI is conducting a review of the investment manager and the Fund and will report the results thereof to the independent trustees when completed. In addition, particular attention in assessing performance was given to the Broadridge Section 15(c) Report. That report showed the investment performance of the Fund (Class A shares) in comparison to other funds determined comparable by Lipper.
The comparable funds to the Fund, as chosen by Lipper, included all retail and institutional flexible portfolio funds. The Fund had total returns in the lowest performing quintile for the one-year period ended December 31, 2017, and had annualized total returns for the three- and five-year periods in the middle and best performing quintiles, respectively. The trustees noted that the Fund’s total return on an annualized basis for the 10-year period ended December 31, 2017 was in the second-best performing quintile. The trustees were satisfied with such comparative performance. The trustees discussed with management the reasons for the relative underperformance for the one-year period ended December 31, 2017. While noting such discussions, overall, the trustees were satisfied with such comparative performance.
The trustees also compared Fund performance to other industry benchmarks, including measures of risk-adjusted performance of a fund, as part of their evaluation of investment performance. The trustees concluded that the Fund had continued to perform well in comparison to its various benchmarks and in the context of the Fund’s goals.
COMPARATIVE EXPENSES AND MANAGEMENT PROFITABILITY. The trustees considered the cost of the
services provided and to be provided and the profits realized by the investment manager and its affiliates from their respective relationships with the Fund. As part of the renewal process, the trustees explored with management the trends in expense ratios over the past three fiscal years and the reasons for any increases in the Fund’s expense ratios (or components thereof). In considering the appropriateness of the management fee and other expenses charged to the Fund, the Board took into account various factors including investment performance and matters relating to Fund operations, including, but not limited to, the quality and experience of its portfolio managers and research staff. Consideration was also given to a comparative analysis in the Broadridge Section 15(c) Report of the investment management fee and total expense ratio of the Fund in comparison with those of a group of other funds selected by Lipper as its appropriate Lipper expense group. Lipper expense data is based upon information taken from each fund’s most recent annual report, which reflects historical asset levels that may be quite different from those currently existing, particularly in a period of market volatility. While recognizing such inherent limitation and the fact that expense ratios generally increase as assets decline and decrease as assets grow, the Board believed the independent analysis conducted by Lipper to be an appropriate measure of comparative expenses.
In reviewing comparative costs, emphasis was given to the Fund’s contractual management fee in comparison with the contractual management fee that would have been charged by other funds within its Lipper expense group assuming they were similar in size to the Fund, as well as the actual total expenses of the Fund in comparison with those of its Lipper expense group. The Lipper contractual management fee analysis includes administrative charges as being part of the management fee, and total expenses, for comparative consistency, are shown by Lipper for Fund Class A shares.
The Fund’s contractual management fee rate was in the middle quintile of its Lipper expense group and its total expenses were also in the middle quintile of such group. The Board was satisfied with such comparative fees and expenses.
The trustees also reviewed the Profitability Study addressing profitability of Franklin Resources, Inc., from its overall U.S. fund business, as well as profitability to the Fund’s investment manager and its affiliates, from providing investment management and other services to the Fund during the 12-month period ended September 30, 2017, the most recent fiscal year-end of Franklin Resources, Inc. The trustees
| franklintempleton.com | Semiannual Report | 47 |
FRANKLIN MUTUAL SERIES FUNDS
FRANKLIN MUTUAL QUEST FUND
SHAREHOLDER INFORMATION
reviewed the basis on which such reports are prepared and the cost allocation methodology utilized in the Profitability Study, it being recognized that allocation methodologies may each be reasonable while producing different results. In this respect, the Board noted that the reasonableness of the cost allocation methodologies was reviewed by independent accountants on an every other year basis.
The independent trustees met with management to discuss the Profitability Study. This included, among other things, a comparison of investment management income with investment management expenses of the Fund; comparison of underwriting revenues and expenses; the relative relationship of investment management and underwriting expenses; shareholder servicing profitability; economies of scale; and the relative contribution of the Fund to the profitability of the investment manager and its parent. In discussing the Profitability Study with the Board, the investment manager stated its belief that the costs incurred in establishing the infrastructure necessary to operate the type of mutual fund operations conducted by it and its affiliates may not be fully reflected in the expenses allocated to the Fund in determining its profitability.
The Board also took into account management’s expenditures in improving shareholder services provided to the Fund, as well as the need to meet additional regulatory and compliance requirements. The trustees also considered the extent to which the investment manager may derive ancillary benefits from Fund operations, including those derived from economies of scale, discussed below, the allocation of Fund brokerage and the use of commission dollars to pay for research and other similar services.
Based upon their consideration of all these factors, the trustees determined that the level of profits realized by the investment manager and its affiliates in providing services to the Fund was not excessive in view of the nature, quality and extent of services provided.
ECONOMIES OF SCALE. The Board considered economies of scale realized by the investment manager and its affiliates as the Fund grows larger and the extent to which they are shared with Fund shareholders, as for example, in the level of the investment management fee charged, in the quality and efficiency of services rendered and in increased capital commitments benefiting the Fund directly or indirectly. While recognizing that any precise determination is inherently subjective, the trustees noted that, based upon the Profitability Study, as some funds increase in size, at some point economies of scale may result in the investment manager realizing a larger
profit margin on investment management services provided to such a fund. The trustees also noted that benefits of economies of scale will be shared with Fund shareholders due to the decline in the effective investment management fee rate as breakpoints are achieved by the Fund.
The trustees noted that breakpoints had been instituted as part of the Fund’s investment management fee and that the Board regularly evaluates whether additional breakpoints are appropriate. The trustees assessed the savings to shareholders resulting from such breakpoints and believed they were, and continue to be, appropriate and they agreed to continue to monitor the appropriateness of the breakpoints. The trustees also considered the effects an increase in assets under management would have on the investment management fee and expense ratio of the Fund. To the extent further economies of scale may be realized by the investment manager and its affiliates, the Board believed the investment management and administrative fees provide a sharing of benefits with the Fund and its shareholders.
Proxy Voting Policies and Procedures
The Fund’s investment manager has established Proxy Voting Policies and Procedures (Policies) that the Fund uses to determine how to vote proxies relating to portfolio securities. Shareholders may view the Fund’s complete Policies online at franklintempleton.com. Alternatively, shareholders may request copies of the Policies free of charge by calling the Proxy Group collect at (954) 527-7678 or by sending a written request to: Franklin Templeton Companies, LLC, 300 S.E. 2nd Street, Fort Lauderdale, FL 33301, Attention: Proxy Group. Copies of the Fund’s proxy voting records are also made available online at franklintempleton.com and posted on the US Securities and Exchange Commission’s website at sec.gov and reflect the most recent 12-month period ended June 30.
Quarterly Statement of Investments
The Trust, on behalf of the Fund, files a complete statement of investments with the US Securities and Exchange Commission for the first and third quarters for each fiscal year on Form N-Q. Shareholders may view the filed Form N-Q by visiting the Commission’s website at sec.gov. The filed form may also be viewed and copied at the Commission’s Public Reference Room in Washington, DC. Information regarding the operations of the Public Reference Room may be obtained by calling (800) SEC-0330.
| 48 | Semiannual Report | franklintempleton.com |
Semiannual Report and Shareholder Letter
Franklin Mutual Quest Fund
Investment Manager
Franklin Mutual Advisers, LLC
Distributor
Franklin Templeton Distributors, Inc.
(800) DIAL BEN® / 342-5236
franklintempleton.com
Shareholder Services
(800) 632-2301 - (Class A, C, R & R6)
(800) 448-FUND - (Class Z)
Authorized for distribution only when accompanied or preceded by a summary prospectus and/or prospectus. Investors should carefully consider a fund’s investment goals, risks, charges and expenses before investing. A prospectus contains this and other information; please read it carefully before investing.
To help ensure we provide you with quality service, all calls to and from our service areas are monitored and/or recorded.
| © 2018 Franklin Templeton Investments. All rights reserved. | 475 S 08/18 |
Franklin Templeton Investments
Why choose Franklin Templeton Investments?
Successful investing begins with ambition. And achievement only comes when you reach for it. That’s why we continually strive to deliver better outcomes for investors. No matter what your goals are, our deep, global investment expertise allows us to offer solutions that can help.
During our more than 70 years of experience, we’ve managed through all kinds of markets—up, down and those in between. We’re always preparing for what may come next. It’s because of this, combined with our strength as one of the world’s largest asset managers that we’ve earned the trust of millions of investors around the world.
Dear Franklin Mutual Shares Fund Shareholder:
Securities markets started 2018 with positive momentum. Investors began the year focused on global economic growth, strong corporate profits across most developed markets and the potential benefits of US corporate and personal tax cuts. However, volatility and market downturns emerged due to political risks and trade tariffs, a temporary deceleration in developed market economic activity during the first quarter, and higher bond yields amid potential signs of increasing inflation pressures and likely interest rate hikes. Although some risks faded, such as the first-quarter deceleration in economic growth, the potential for an escalating trade war between the US and its trading partners remained a meaningful uncertainty for investors. For the period ended June 30, 2018, US stocks, as measured by the Standard & Poor’s® 500 Index (S&P 500®), produced a +2.65% total return.1 Stocks in global developed markets, as measured by the MSCI World Index, returned +0.76%, while investment-grade bonds, as measured by the Bloomberg Barclays US Aggregate Bond Index, had a -1.62% total return.1
Market performance was rather uneven during the period. Although the S&P 500 performed positively, most of the gains could be accounted for by a small number of companies. The list of those leading performers showed a concentration in information technology and internet-focused companies, or businesses that directly benefit from increased online commerce. It is no surprise, therefore, that growth stocks managed to outpace value stocks during the period. The Russell
1000® Growth Index returned +7.25%, while the Russell 1000® Value Index had a -1.69% total return.1
We do not know how long growth will continue to outpace value, but historically, periods of solid and steady economic growth have been a positive backdrop for value stocks. Low unemployment rates, increased business investment and solid consumer spending are all constructive signs for such a pace of economic growth. The US Federal Reserve’s efforts to gradually raise interest rates may be favorable for financial equities.
Value investing often requires an investor to be contrarian in nature. We continue to maintain a bottom-up stock-picking process that is disciplined, driven by rigorous fundamental analysis and attempts to limit downside risk. In our view, investing in underappreciated and misunderstood companies with identifiable catalysts for unlocking shareholder value can offer meaningful upside potential and a degree of downside protection in periods of financial market turbulence.
Although economic and investment fundamentals still appear to be favorable, the return of volatility is another reminder that securities markets are dynamic. As we enter into the second half of 2018, market sentiment may easily turn again given the uncertainty regarding an escalation in trade tensions, the upcoming US midterm elections, Brexit, the ability of US tax cuts to prolong the current economic expansion, and the pace of
1. Source: Morningstar. Frank Russell Company is the source and owner of the trademarks, service marks and copyrights related to the Russell Indexes. Russell® is a trademark of Frank Russell Company.
See www.franklintempletondatasources.com for additional data provider information.
| Not FDIC Insured | | | May Lose Value | | | No Bank Guarantee |
| franklintempleton.com | Not part of the semiannual report | 1 |
inflation. Therefore, we believe active, professional investment management serves investors well.
We also recognize the important role of financial advisors in today’s markets and encourage investors to continue to seek their advice. Amid changing markets and economic conditions, we are confident investors with a well-diversified portfolio and a patient, long-term outlook should be well positioned for the years ahead.
On the following pages, the Fund’s portfolio management team reviews investment decisions that pertain to performance during the past six months in light of the economic environment and other factors. Please remember all securities markets fluctuate, as do mutual fund share prices.
We thank you for investing with Franklin Templeton, welcome your questions and comments, and look forward to continuing to serve your investment needs in the years ahead.
Sincerely,
Peter A. Langerman
Chairman, President and Chief Executive Officer
Franklin Mutual Advisers, LLC
This letter reflects our analysis and opinions as of June 30, 2018, unless otherwise indicated. The information is not a complete analysis of every aspect of any market, country, industry, security or fund. Statements of fact are from sources considered reliable.
Contents
Semiannual Report
| Franklin Mutual Shares Fund | 3 | |||
| Performance Summary | 9 | |||
| Your Fund’s Expenses | 11 | |||
| Financial Highlights and Statement of Investments | 12 | |||
| Financial Statements | 24 | |||
| Notes to Financial Statements | 29 | |||
Shareholder Information
|
| 41
|
| |
Visit franklintempleton.com for fund updates, to access your account, or to find helpful financial planning tools.
| 2 | Not part of the semiannual report | franklintempleton.com |
Semiannual Report
Franklin Mutual Shares Fund
This semiannual report for Franklin Mutual Shares Fund covers the period ended June 30, 2018.
Your Fund’s Goal and Main Investments
The Fund seeks capital appreciation, which may occasionally be short term, with income as a secondary goal. Under normal market conditions, the Fund invests primarily in equity securities, primarily common stock, of US and foreign companies that the investment manager believes are available at market prices less than their intrinsic value. To a lesser extent, the Fund also invests in merger arbitrage securities and the debt and equity of distressed companies. The Fund may invest up to 35% of its assets in foreign securities, which may include sovereign debt and participations in foreign government debt. The Geographic Composition bar chart on this page lists the leading countries where the Fund invests.
Performance Overview
The Fund’s Class Z shares had a cumulative total return of -0.84% for the six months ended June 30, 2018. For comparison, the Fund’s benchmark, the Standard & Poor’s 500 Index (S&P 500), which is a broad measure of US stock performance, posted a total return of +2.65%.1 You can find more of the Fund’s performance data in the Performance Summary beginning on page 9.
Performance data represent past performance, which does not guarantee future results. Investment return and principal value will fluctuate, and you may have a gain or loss when you sell your shares. Current performance may differ from figures shown. For most recent month-end performance, go to franklintempleton.com or call (800) 342-5236.
Economic and Market Overview
The global economy expanded during the six-month period under review amid generally upbeat economic data across regions. In this environment, global developed and emerging market stocks reached a new all-time high in January 2018, as measured by the MSCI All Country World Index (ACWI). During the period, global markets were aided by price gains in
Geographic Composition*
Based on Total Net Assets as of 6/30/18
*Figures are stated as a percentage of total and may not equal 100% or may be negative due to rounding, use of any derivatives, unsettled trades or other factors.
oil and other commodities, encouraging corporate earnings reports and investor optimism about global economic growth. However, global stocks had a -0.13% total return for the six-month period, as measured by the MSCI ACWI, largely due to an overall decline in emerging market stocks.1
Global markets reflected investor concerns about tensions in the Korean peninsula and political uncertainties in the US and the European Union, as well as worries that strong economic growth and rising inflation in some parts of the world, particularly in the US, would lead central banks to increase interest rates sooner than expected. Markets were further pressured by the Trump administration’s protectionist trade policies, uncertainty surrounding the US-China trade relationship, and a broad sell-off in information technology stocks in March due to a potential for tighter regulation in the sector arising from concerns about consumer data privacy. Near period-end, an overall easing of tensions in the Korean peninsula relieved investors, but ongoing US trade disputes with its allies and China hindered global markets.
The US economy continued to grow during the six months under review. After moderating for three consecutive quarters, the economy grew faster in 2018’s second quarter, driven by
1. Source: Morningstar.
The index is unmanaged and includes reinvestment of any income or distributions. It does not reflect any fees, expenses or sales charges. One cannot invest directly in an index, and an index is not representative of the Fund’s portfolio.
The dollar value, number of shares or principal amount, and names of all portfolio holdings are listed in the Fund’s Statement of Investments (SOI). The SOI begins on page 17.
| franklintempleton.com | Semiannual Report | 3 |
FRANKLIN MUTUAL SHARES FUND
consumer spending, exports, business investment and government spending. The unemployment rate declined from 4.1% in December 2017, as reported at the beginning of the six-month period, to 4.0% at period-end.2 Annual inflation, as measured by the Consumer Price Index, increased from 2.1% in December 2017, as reported at the beginning of the period, to 2.9% at period-end.2 The US Federal Reserve raised its target range for the federal funds rate in March and June 2018 and continued reducing its balance sheet as part of its ongoing plan to normalize monetary policy.
In Europe, the UK’s quarterly economic growth moderated in 2018’s first quarter amid a decline in construction output. The Bank of England kept its key policy rate unchanged during the period. The eurozone’s quarterly growth moderated in 2018’s first quarter due to a decline in external demand. The bloc’s annual inflation rate ended the period higher than in December 2017. The European Central Bank (ECB) kept its benchmark interest rate unchanged during the period. However, at its June meeting, the ECB announced it would further reduce its monthly bond purchases beginning in October 2018 and indicated it would conclude the program at the end of 2018 while continuing to keep interest rates unchanged through at least the summer of 2019.
In Asia, Japan’s quarterly gross domestic product (GDP) growth in 2018’s first quarter was negative, the country’s first contraction since 2015’s fourth quarter, mainly due to a decline in private residential investment and household consumption. The Bank of Japan left its benchmark interest rate unchanged during the period and continued its monetary stimulus measures.
In emerging markets, Brazil’s quarterly GDP accelerated in 2018’s first quarter compared to the previous quarter. The country’s central bank cut its benchmark interest rate twice during the period to spur economic growth. Russia’s annual GDP grew in 2018’s first quarter compared to the prior-year period, amid the Bank of Russia’s continued policy support. China’s annual GDP moderated in 2018’s first quarter compared to the prior-year period. The People’s Bank of China left its benchmark interest rate unchanged during the period. Overall, emerging market stocks, as measured by the MSCI Emerging Markets Index, declined during the period.
Investment Strategy
At Franklin Mutual Series, we are committed to our distinctive value approach to investing, which we believe can generate
2. Source: Bureau of Labor Statistics.
above-average risk-adjusted returns over time for our shareholders. Our major investment strategy is investing in undervalued stocks. When selecting undervalued equities, we are attracted to what we believe are fundamentally strong companies with healthy balance sheets, high-quality assets, substantial free cash flow and shareholder-oriented management teams and whose stocks are trading at discounts to our assessment of the companies’ intrinsic or business value. We also look for asset-rich companies whose shares may be trading at depressed levels due to concerns over short-term earnings disappointments, litigation, management strategy or other perceived negatives. This strict value approach is not only intended to improve the likelihood of upside potential, but also reduces the risk of substantial declines, in our opinion. While the vast majority of our undervalued equity investments are made in publicly traded companies globally, we may invest occasionally in privately held companies as well.
We complement this more traditional investment strategy with two others. One is distressed investing, a highly specialized field that has proven quite profitable during certain periods over the years. Distressed investing is complex and can take many forms. The most common distressed investment the Fund undertakes is the purchase of financially troubled or bankrupt companies’ debt at a substantial discount to face value. After the financially distressed company is reorganized, often in bankruptcy court, the old debt is typically replaced with new securities issued by the financially stronger company.
The other piece of our investment strategy is participating in arbitrage situations, another highly specialized field. When companies announce proposed mergers or takeovers, commonly referred to as “deals,” the target company may trade at a discount to the bid it ultimately accepts. One form of arbitrage involves purchasing the target company’s stock when it is trading below the value we believe it would receive in a deal. In keeping with our commitment to a relatively conservative investment approach, we typically focus our arbitrage efforts on announced deals, and avoid rumored deals or other situations we consider relatively risky. In addition, it is our practice to hedge the Fund’s currency exposure when we deem it advantageous for our shareholders.
Manager’s Discussion
In the first half of 2018, positive corporate fundamentals were overshadowed by political and economic concerns. Corporate profits in the US and other developed markets continued their
| 4 | Semiannual report | franklintempleton.com |
FRANKLIN MUTUAL SHARES FUND
What is meant by “hedge”?
To hedge an investment is to take a position intended to offset potential losses/gains that may be incurred by a companion financial instrument. |
impressive year-over-year pace of growth. In the US and other developed markets, economic activity moderated during the first quarter, but appeared to have recovered during the second quarter. Financial markets were also aided by improved industrial commodity prices, most notably crude oil. Nonetheless, investor sentiment became less upbeat and volatility returned to financial markets, after an historically calm 2017.
As investors entered 2018, overall US equity market valuations (e.g., price-to-earnings, price-to-book or price-to-sales) were elevated relative to most historical benchmarks. The uneven equity market performance during the period and the strong pace of corporate earnings growth helped to reduce valuations somewhat. At the same time, the rise in volatility provided us with select opportunities to initiate or add to positions in companies that we believed were trading at undeservedly discounted prices.
A further escalation of trade-related rhetoric and tariffs, in our view, could have important consequences for the US and abroad. We have already begun to see disruptions to global supply chains and added pressure on China’s financial and credit markets. Additional tariffs imposed by the US and its trading partners could rattle business confidence, curb corporate earnings growth, undermine favorable fundamentals in specific industries, provoke further financial market volatility and raise uncertainty regarding the solid pace of global growth.
Europe’s equity market overall was still trading at an attractively lower price-to-earnings multiple and higher dividend yield than the US equity market at period-end. However, in addition to trade tensions, we are paying close attention to Brexit negotiations, Italy’s new populist government, a potentially fraying relationship between Germany’s two conservative parties and the future of the international nuclear deal with Iran. As of period-end, we still believe Europe’s economic recovery is fairly resilient, but any of the aforementioned challenges has the potential to fuel volatility and even slow economic growth. In such an
| Top 10 Sectors/Industries | ||||
| Based on Equity Securities as of 6/30/18 | ||||
| % of Total Net Assets | ||||
| Banks | 10.1% | |||
| Oil, Gas & Consumable Fuels | 8.7% | |||
| Pharmaceuticals | 7.8% | |||
| Media | 7.3% | |||
| Insurance | 7.2% | |||
| Software | 5.2% | |||
| Tobacco | 3.5% | |||
| Health Care Equipment & Supplies | 3.4% | |||
| Communications Equipment | 3.1% | |||
| Food & Staples Retailing | 2.6% | |||
environment, we believe domestically oriented companies may fare relatively better.
Mergers and acquisitions (M&A) have remained active. In the first half of 2018, the market received some clarity regarding the regulatory environment when a federal judge ruled in favor of AT&T and Time Warner3, and against the US Department of Justice (DOJ) in its antitrust lawsuit. The judge decided the DOJ had failed to show the merger would be anti-competitive, and the deal closed promptly after the opinion was released. In response, the shares of companies involved in several other pending deals traded higher, indicating a higher expected probability of closing. The market also saw the development of a bidding war between Walt Disney and Comcast for control of Twenty-First Century Fox and Sky. As the year began, Disney had a deal to buy Fox and Fox had an offer pending to acquire the 61% of Sky it did not own. Comcast subsequently launched bids for both companies, and when Fox raised its bid for Sky, Comcast promptly raised its bid to a higher level. Comcast has indicated it will not bid further for Fox and, while Fox could raise its bid for Sky, it appears most likely that Comcast will purchase Sky. This bidding war showed the ongoing uncertainty in media, in which major media firms believe they need even more scale to compete with internet rivals that are experiencing significant growth. The Top 10 Sectors/Industries table on this page lists media and also other leading industries in which the Fund currently invests. We expect ongoing activity in M&A markets and, with the increased regulatory clarity provided by the Time Warner decision, further opportunities in merger arbitrage.
Finding mispriced risk in credit markets remains difficult due in part to the decline in debt covenants, which include terms
3. Not held at period-end.
| franklintempleton.com | Semiannual Report | 5 |
FRANKLIN MUTUAL SHARES FUND
that restrict financial activities by the borrower or set parameters for specific financial metrics. The search is also complicated by private equity firms involved in leveraged buyout transactions using increasingly liberal interpretations of credit agreements and bond indentures to potentially shift valuable assets beyond the reach of creditors. We have directed much of our focus on out-of-favor industries in pursuit of securities with the potential to benefit most from liquidityenhancing events, such as asset sales, the ability to issue secured debt within existing agreements, and free-cash flow that could buy time for a company to weather its financial storm.
Fund Performance
Turning to Fund performance, top positive contributors included US-based oil and gas exploration and production company Anadarko Petroleum, multinational software company Microsoft and global insurer XL Group. Microsoft is listed among the Fund’s largest positions in the Top 10 Equity Holdings table on this page.
Shares of Anadarko Petroleum were supported by rising crude oil prices, and continued disciplined capital allocation by management. Oil prices rose through the period, and in May 2018, Anadarko announced it would accelerate the completion of an existing $3 billion share buyback plan and consider further buybacks if the favorable operating environment persists and drives further increases in its free cash flow.
Microsoft continued to reap the rewards of its rapidly growing cloud computing business and its effort to move Microsoft Office software clients to its subscription-based services. In February and April 2018, Microsoft reported solid quarterly growth in revenues and earnings per share. The company also increased its operating margin estimate for 2018. We believe Microsoft’s cloud computing and subscription-based services can continue to grow at a strong pace, which may further lift its operating margin.
Shares of XL Group, a global insurance and reinsurance company, jumped in early March 2018 when it agreed to be acquired by French insurer AXA4. AXA has the ability to fully finance the acquisition from its current financial resources. In late March, the US Federal Trade Commission granted antitrust clearance and we believe other needed regulatory approvals are likely to be received.
| Top 10 Equity Holdings | ||||
| 6/30/18 | ||||
Company Sector/Industry, Country | % of Total Net Assets | |||
Medtronic PLC Health Care Equipment & Supplies, U.S. | 3.4% | |||
Eli Lilly & Co. Pharmaceuticals, U.S. | 3.0% | |||
Merck & Co. Inc. Pharmaceuticals, U.S. | 2.9% | |||
Cisco Systems Inc. Communications Equipment, U.S. | 2.1% | |||
Microsoft Corp. Software, U.S. | 2.1% | |||
British American Tobacco PLC Tobacco, U.K. | 2.1% | |||
American International Group Inc. Insurance, U.S. | 2.0% | |||
Novartis AG Pharmaceuticals, Switzerland | 2.0% | |||
Wells Fargo & Co. Banks, U.S. | 2.0% | |||
JPMorgan Chase & Co. Banks, U.S. | 2.0% | |||
During the period under review, Fund investments that detracted from performance included British American Tobacco, US-based digital security and storage provider Symantec and US-based industrials company General Electric.
British American Tobacco’s stock price faced downward pressure due to the potential for additional regulation in the US and concerns regarding next generation products. In March 2018, the US Food and Drug Administration issued an Advance Notice of Proposed Rulemaking, which started the process of examining the possibility of regulating nicotine levels in combustible cigarettes. The process may not result in regulation, but if it does, many experts believe the review could take seven to 10 years before a rule is adopted in the marketplace. Meanwhile, JUUL, produced by JUUL Labs4 has emerged as a popular e-cigarette in the US. JUUL’s growth rate is high and its product is popular with young consumers. It is unclear to what degree JUUL is cannibalizing the combustible market, but it has hurt investor sentiment toward the industry.
Shares of Symantec tumbled in May 2018 when the company disclosed an internal investigation resulting from concerns raised by a former employee that could result in a restatement of prior financials, as well as lowered earnings guidance. The
4. Not a Fund Holding.
See www.franklintempletondatasources.com for additional data provider information.
| 6 | Semiannual Report | franklintempleton.com |
FRANKLIN MUTUAL SHARES FUND
stock partially recovered when Symantec’s management provided more information regarding the investigation and reassured investors that financial statements would likely not need to be restated.
In January 2018, General Electric (GE) announced a greater-than-expected $6.2 billion after-tax charge related to its insurance subsidiary at GE Capital. Management also moved ahead with what amounts to a breakup of GE. In May 2018, the company announced the merger of its transportation operations into Wabtec4, and in June 2018 it announced a plan to spin off its health care division and divest its stake in oil-services firm Baker Hughes. Once completed, we believe the moves will streamline GE and enable the company to reduce debt and build up a cash buffer, as well as help management better focus on its key aviation, power and renewable energy divisions.
During the period, the Fund held currency forwards and futures seeking to hedge most of the currency risk of the portfolio’s non-US dollar investments. The hedges had a positive overall impact on the Fund’s performance because of the appreciation of the US dollar versus the hedged currencies.
What is a currency forward?
A currency forward is a direct agreement between the Fund and a counterparty to buy or sell a foreign currency in exchange for another currency at a specific exchange rate on a future date. |
What is a future?
A future is an agreement between the Fund and a counterparty made through a US or foreign futures exchange to buy or sell an underlying instrument or asset at a specific price on a future date. |
As fellow shareholders, we found recent relative and absolute performance disappointing, but it is not uncommon for our strategy to lag the equity markets at times. We remain committed to our disciplined, value investment approach as we seek to generate attractive, long-term, risk-adjusted returns for shareholders.
Thank you for your participation in Franklin Mutual Shares Fund. We look forward to continuing to serve your investment needs.
 |  | |
Peter A. Langerman Co-Portfolio Manager | ||
 |  | |
F. David Segal, CFA Co-Portfolio Manager | ||
 |  | |
Debbie A. Turner, CFA Assistant Portfolio Manager | ||
The foregoing information reflects our analysis, opinions and portfolio holdings as of June 30, 2018, the end of the reporting period. The way we implement our main investment strategies and the resulting portfolio holdings may change depending on factors such as market and economic conditions. These opinions may not be relied upon as investment advice or an offer for a particular security. The information is not a complete analysis of every aspect of any market, country, industry, security or the Fund. Statements of fact are from sources considered reliable, but the investment manager makes no representation or warranty as to their completeness or accuracy. Although historical performance is no guarantee of future results, these insights may help you understand our investment management philosophy.
CFA® is a trademark owned by CFA Institute.
| franklintempleton.com | Semiannual Report | 7 |
FRANKLIN MUTUAL SHARES FUND
Peter Langerman has been portfolio manager for Franklin Mutual Shares Fund since 2005. He joined Franklin Templeton Investments in 1996, serving in various capacities, including President and Chief Executive Officer of Franklin Mutual Advisers and member of the management team of the Funds, including Franklin Mutual Shares Fund. From 2002 to 2005, he served as director of New Jersey’s Division of Investment, overseeing employee pension funds. Between 1986 and 1996, Mr. Langerman was employed at Heine Securities Corporation, the Fund’s former manager.
|
F. David Segal has been portfolio manager for Franklin Mutual Shares Fund since 2005. He joined Franklin Templeton Investments in 2002. Previously, he was an analyst in the Structured Finance Group of MetLife for the period 1999 to 2002.
|
Debbie Turner has been assistant portfolio manager for Franklin Mutual Shares Fund since 2001. She joined Franklin Templeton Investments in 1996. Between 1993 and 1996, Ms. Turner was employed at Heine Securities Corporation, the Fund’s former manager.
|
| 8 | Semiannual Report | franklintempleton.com |
FRANKLIN MUTUAL SHARES FUND
Performance Summary as of June 30, 2018
The performance table does not reflect any taxes that a shareholder would pay on Fund dividends, capital gain distributions, if any, or any realized gains on the sale of Fund shares. Total return reflects reinvestment of the Fund’s dividends and capital gain distributions, if any, and any unrealized gains or losses. Your dividend income will vary depending on dividends or interest paid by securities in the Fund’s portfolio, adjusted for operating expenses of each class. Capital gain distributions are net profits realized from the sale of portfolio securities.
Performance as of 6/30/18
Cumulative total return excludes sales charges. Average annual total return includes maximum sales charges. Sales charges will vary depending on the size of the investment and the class of share purchased. The maximum is 5.75% and the minimum is 0%. Class A: 5.75% maximum initial sales charge. For other share classes, visit franklintempleton.com.
| Share Class | Cumulative Total Return1 | Average Annual Total Return2 | ||||||
Z | ||||||||
6-Month | -0.84% | -0.84% | ||||||
1-Year | +1.98% | +1.98% | ||||||
5-Year | +46.88% | +7.99% | ||||||
10-Year | +94.72% | +6.89% | ||||||
A | ||||||||
6-Month | -0.95% | -6.68% | ||||||
1-Year | +1.72% | -4.14% | ||||||
5-Year | +44.89% | +6.43% | ||||||
10-Year | +89.23% | +5.96% | ||||||
Performance data represent past performance, which does not guarantee future results. Investment return and principal value will fluctuate, and you may have a gain or loss when you sell your shares. Current performance may differ from figures shown. For most recent month-end performance, go to franklintempleton.com or call (800) 342-5236.
See page 10 for Performance Summary footnotes.
| franklintempleton.com | Semiannual Report | 9 |
FRANKLIN MUTUAL SHARES FUND
PERFORMANCE SUMMARY
Total Annual Operating Expenses3
Share Class
| ||||||||||||
Z
| 0.78% | |||||||||||
A
| 1.03% | |||||||||||
Each class of shares is available to certain eligible investors and has different annual fees and expenses, as described in the prospectus.
All investments involve risks, including possible loss of principal. Value securities may not increase in price as anticipated or may decline further in value. Special risks are associated with foreign investing, including currency fluctuations, economic instability and political developments. The Fund’s investments in companies engaged in mergers, reorganizations or liquidations also involve special risks as pending deals may not be completed on time or on favorable terms. The Fund may invest in lower rated bonds, which entail higher credit risk. The Fund is actively managed but there is no guarantee that the manager’s investment decisions will produce the desired results. The Fund’s prospectus also includes a description of the main investment risks.
1. Cumulative total return represents the change in value of an investment over the periods indicated.
2. Average annual total return represents the average annual change in value of an investment over the periods indicated. Return for less than one year, if any, has not been annualized.
3. Figures are as stated in the Fund’s current prospectus and may differ from the expense ratios disclosed in the Your Fund’s Expenses and Financial Highlights sections in this report. In periods of market volatility, assets may decline significantly, causing total annual Fund operating expenses to become higher than the figures shown.
| 10 | Semiannual Report | franklintempleton.com |
FRANKLIN MUTUAL SHARES FUND
Your Fund’s Expenses
As a Fund shareholder, you can incur two types of costs: (1) transaction costs, including sales charges (loads) on Fund purchases and redemptions; and (2) ongoing Fund costs, including management fees, distribution and service (12b-1) fees, and other Fund expenses. All mutual funds have ongoing costs, sometimes referred to as operating expenses. The table below shows ongoing costs of investing in the Fund and can help you understand these costs and compare them with those of other mutual funds. The table assumes a $1,000 investment held for the six months indicated.
Actual Fund Expenses
The table below provides information about actual account values and actual expenses in the columns under the heading “Actual.” In these columns the Fund’s actual return, which includes the effect of Fund expenses, is used to calculate the “Ending Account Value” for each class of shares. You can estimate the expenses you paid during the period by following these steps (of course, your account value and expenses will differ from those in this illustration): Divide your account value by $1,000 (if your account had an $8,600 value, then $8,600 ÷ $1,000 = 8.6). Then multiply the result by the number in the row for your class of shares under the headings “Actual” and “Expenses Paid During Period” (if Actual Expenses Paid During Period were $7.50, then 8.6 x $7.50 = $64.50). In this illustration, the actual expenses paid this period are $64.50.
Hypothetical Example for Comparison with Other Funds
Under the heading “Hypothetical” in the table, information is provided about hypothetical account values and hypothetical expenses based on the Fund’s actual expense ratio and an assumed rate of return of 5% per year before expenses, which is not the Fund’s actual return. This information may not be used to estimate the actual ending account balance or expenses you paid for the period, but it can help you compare ongoing costs of investing in the Fund with those of other funds. To do so, compare this 5% hypothetical example for the class of shares you hold with the 5% hypothetical examples that appear in the shareholder reports of other funds.
Please note that expenses shown in the table are meant to highlight ongoing costs and do not reflect any transactional costs. Therefore, information under the heading “Hypothetical” is useful in comparing ongoing costs only, and will not help you compare total costs of owning different funds. In addition, if transactional costs were included, your total costs would have been higher.
| Actual (actual return after expenses) | Hypothetical (5% annual return before expenses) | |||||||||||||||||
Share Class | Beginning Account Value 1/1/18 | Ending Account Value 6/30/18 | Expenses Paid During Period 1/1/18–6/30/181,2 | Ending Account Value 6/30/18 | Expenses Paid During Period 1/1/18–6/30/181,2 | Net Annualized Expense Ratio2 | ||||||||||||
Z | $1,000 | $991.60 | $3.85 | $1,020.93 | $3.91 | 0.78% | ||||||||||||
A | $1,000 | $990.50 | $5.08 | $1,019.69 | $5.16 | 1.03% | ||||||||||||
C | $1,000 | $986.80 | $8.77 | $1,015.97 | $8.90 | 1.78% | ||||||||||||
R | $1,000 | $989.40 | $6.31 | $1,018.45 | $6.41 | 1.28% | ||||||||||||
R6 | $1,000 | $992.00 | $3.41 | $1,021.37 | $3.46 | 0.69% | ||||||||||||
1. Expenses are equal to the annualized expense ratio for the six-month period as indicated above—in the far right column—multiplied by the simple average account value over the period indicated, and then multiplied by 181/365 to reflect the one-half year period.
2. Reflects expenses after fee waivers and expense reimbursements. Does not include acquired fund fees and expenses.
| franklintempleton.com | Semiannual Report | 11 |
FRANKLIN MUTUAL SHARES FUND
Financial Highlights
Six Months Ended (unaudited) | Year Ended December 31, | |||||||||||||||||||||||
| 2017 | 2016 | 2015 | 2014 | 2013 | ||||||||||||||||||||
Class Z | ||||||||||||||||||||||||
| Per share operating performance | ||||||||||||||||||||||||
(for a share outstanding throughout the period) | ||||||||||||||||||||||||
Net asset value, beginning of period | $28.63 | $28.22 | $26.00 | $29.52 | $28.34 | $22.48 | ||||||||||||||||||
|
| |||||||||||||||||||||||
| Income from investment operationsa: | ||||||||||||||||||||||||
Net investment incomeb | 0.27 | 0.65 | c | 0.63 | d | 0.54 | 0.78 | e | 0.47 | |||||||||||||||
Net realized and unrealized gains (losses) | (0.51 | ) | 1.73 | 3.48 | (1.71 | ) | 1.38 | 5.83 | ||||||||||||||||
|
| |||||||||||||||||||||||
Total from investment operations | (0.24 | ) | 2.38 | 4.11 | (1.17 | ) | 2.16 | 6.30 | ||||||||||||||||
|
| |||||||||||||||||||||||
| Less distributions from: | ||||||||||||||||||||||||
Net investment income | — | (0.68 | ) | (0.64 | ) | (0.59 | ) | (0.98 | ) | (0.44 | ) | |||||||||||||
Net realized gains | — | (1.29 | ) | (1.25 | ) | (1.76 | ) | — | — | |||||||||||||||
|
| |||||||||||||||||||||||
Total distributions | — | (1.97 | ) | (1.89 | ) | (2.35 | ) | (0.98 | ) | (0.44 | ) | |||||||||||||
|
| |||||||||||||||||||||||
| Net asset value, end of period | $28.39 | $28.63 | $28.22 | $26.00 | $29.52 | $28.34 | ||||||||||||||||||
|
| |||||||||||||||||||||||
Total returnf | (0.84)% | 8.49% | 15.88% | (3.81)% | 7.60% | 28.10% | ||||||||||||||||||
| Ratios to average net assetsg | ||||||||||||||||||||||||
Expensesh,i | 0.78% | 0.78% | 0.80% | j | 0.81%j | 0.80% | 0.79% | |||||||||||||||||
Expenses incurred in connection with | 0.01% | —% | 0.01% | 0.02% | 0.03% | —% | k | |||||||||||||||||
Net investment income | 1.89% | 2.23% | c | 2.33% | d | 1.82% | 2.67% | e | 1.85% | |||||||||||||||
| Supplemental data | ||||||||||||||||||||||||
Net assets, end of period (000’s) | $5,916,996 | $6,229,996 | $7,681,881 | $6,770,056 | $7,363,765 | $7,025,908 | ||||||||||||||||||
Portfolio turnover rate | 8.37% | 18.15% | 20.56% | 19.99% | 19.24% | 24.29% | ||||||||||||||||||
aThe amount shown for a share outstanding throughout the period may not correlate with the Statement of Operations for the period due to the timing of sales and repurchases of the Fund’s shares in relation to income earned and/or fluctuating fair value of the investments of the Fund.
bBased on average daily shares outstanding.
cNet investment income per share includes approximately $0.16 per share related to income received in the form of special dividends in connection with certain Fund holdings. Excluding this amount, the ratio of net investment income to average net assets would have been 1.69%.
dNet investment income per share includes approximately $0.10 per share related to income received in the form of special dividends in connection with certain Fund holdings. Excluding this amount, the ratio of net investment income to average net assets would have been 1.96%.
eNet investment income per share includes approximately $0.29 per share related to income received in the form of a special dividend in connection with certain Fund holdings. Excluding this amount, the ratio of net investment income to average net assets would have been 1.66%.
fTotal return is not annualized for periods less than one year.
gRatios are annualized for periods less than one year.
hIncludes dividend and/or interest expense on securities sold short and security borrowing fees, if any. See below for the ratios of such expenses to average net assets for the periods presented. See Note 1(d).
iBenefit of expense reduction rounds to less than 0.01%.
jBenefit of waiver and payments by affiliates rounds to less than 0.01%.
kRounds to less than 0.01%.
| 12 | Semiannual Report | The accompanying notes are an integral part of these financial statements. | franklintempleton.com |
FRANKLIN MUTUAL SHARES FUND
FINANCIAL HIGHLIGHTS
Six Months Ended (unaudited) | Year Ended December 31, | |||||||||||||||||||||||
| 2017 | 2016 | 2015 | 2014 | 2013 | ||||||||||||||||||||
Class A | ||||||||||||||||||||||||
| Per share operating performance | ||||||||||||||||||||||||
(for a share outstanding throughout the period) | ||||||||||||||||||||||||
Net asset value, beginning of period | $28.35 | $27.97 | $25.78 | $29.29 | $28.12 | $22.32 | ||||||||||||||||||
|
| |||||||||||||||||||||||
| Income from investment operationsa: | ||||||||||||||||||||||||
Net investment incomeb | 0.23 | 0.58 | c | 0.56 | d | 0.45 | 0.69 | e | 0.40 | |||||||||||||||
Net realized and unrealized gains (losses) | (0.50 | ) | 1.70 | 3.45 | (1.69 | ) | 1.37 | 5.76 | ||||||||||||||||
|
| |||||||||||||||||||||||
Total from investment operations | (0.27 | ) | 2.28 | 4.01 | (1.24 | ) | 2.06 | 6.16 | ||||||||||||||||
|
| |||||||||||||||||||||||
| Less distributions from: | ||||||||||||||||||||||||
Net investment income | — | (0.61 | ) | (0.57 | ) | (0.51 | ) | (0.89 | ) | (0.36 | ) | |||||||||||||
Net realized gains | — | (1.29 | ) | (1.25 | ) | (1.76 | ) | — | — | |||||||||||||||
|
| |||||||||||||||||||||||
Total distributions | — | (1.90 | ) | (1.82 | ) | (2.27 | ) | (0.89 | ) | (0.36 | ) | |||||||||||||
|
| |||||||||||||||||||||||
| Net asset value, end of period | $28.08 | $28.35 | $27.97 | $25.78 | $29.29 | $28.12 | ||||||||||||||||||
|
| |||||||||||||||||||||||
Total returnf | (0.95)% | 8.21% | 15.61% | (4.10)% | 7.30% | 27.74% | ||||||||||||||||||
| Ratios to average net assetsg | ||||||||||||||||||||||||
Expensesh,i | 1.03% | 1.03% | 1.05% | j | 1.09%j | 1.10% | 1.09% | |||||||||||||||||
Expenses incurred in connection with | 0.01% | —% | 0.01% | 0.02% | 0.03% | —% | k | |||||||||||||||||
Net investment income | 1.64% | 1.98% | c | 2.08% | d | 1.54% | 2.37% | e | 1.55% | |||||||||||||||
| Supplemental data | ||||||||||||||||||||||||
Net assets, end of period (000’s) | $4,064,130 | $4,386,829 | $4,737,576 | $4,819,868 | $5,392,130 | $5,477,733 | ||||||||||||||||||
Portfolio turnover rate | 8.37% | 18.15% | 20.56% | 19.99% | 19.24% | 24.29% | ||||||||||||||||||
aThe amount shown for a share outstanding throughout the period may not correlate with the Statement of Operations for the period due to the timing of sales and repurchases of the Fund’s shares in relation to income earned and/or fluctuating fair value of the investments of the Fund.
bBased on average daily shares outstanding.
cNet investment income per share includes approximately $0.16 per share related to income received in the form of special dividends in connection with certain Fund holdings. Excluding this amount, the ratio of net investment income to average net assets would have been 1.44%.
dNet investment income per share includes approximately $0.10 per share related to income received in the form of special dividends in connection with certain Fund holdings. Excluding this amount, the ratio of net investment income to average net assets would have been 1.71%.
eNet investment income per share includes approximately $0.29 per share related to income received in the form of a special dividend in connection with certain Fund holdings. Excluding this amount, the ratio of net investment income to average net assets would have been 1.36%.
fTotal return does not reflect sales commissions or contingent deferred sales charges, if applicable, and is not annualized for periods less than one year.
gRatios are annualized for periods less than one year.
hIncludes dividend and/or interest expense on securities sold short and security borrowing fees, if any. See below for the ratios of such expenses to average net assets for the periods presented. See Note 1(d).
iBenefit of expense reduction rounds to less than 0.01%.
jBenefit of waiver and payments by affiliates rounds to less than 0.01%.
kRounds to less than 0.01%.
| franklintempleton.com | The accompanying notes are an integral part of these financial statements. | Semiannual Report | 13 |
FRANKLIN MUTUAL SHARES FUND
FINANCIAL HIGHLIGHTS
Six Months Ended (unaudited) | Year Ended December 31, | |||||||||||||||||||||||
| 2017 | 2016 | 2015 | 2014 | 2013 | ||||||||||||||||||||
Class C | ||||||||||||||||||||||||
| Per share operating performance | ||||||||||||||||||||||||
(for a share outstanding throughout the period) | ||||||||||||||||||||||||
Net asset value, beginning of period | $28.04 | $27.68 | $25.54 | $29.02 | $27.88 | $22.13 | ||||||||||||||||||
|
| |||||||||||||||||||||||
| Income from investment operationsa: | ||||||||||||||||||||||||
Net investment incomeb | 0.12 | 0.35 | c | 0.35 | d | 0.24 | 0.48 | e | 0.22 | |||||||||||||||
Net realized and unrealized gains (losses) | (0.49 | ) | 1.67 | 3.40 | (1.67 | ) | 1.34 | 5.71 | ||||||||||||||||
|
| |||||||||||||||||||||||
Total from investment operations | (0.37 | ) | 2.02 | 3.75 | (1.43 | ) | 1.82 | 5.93 | ||||||||||||||||
|
| |||||||||||||||||||||||
| Less distributions from: | ||||||||||||||||||||||||
Net investment income | — | (0.37 | ) | (0.36 | ) | (0.29 | ) | (0.68 | ) | (0.18 | ) | |||||||||||||
Net realized gains | — | (1.29 | ) | (1.25 | ) | (1.76 | ) | — | — | |||||||||||||||
|
| |||||||||||||||||||||||
Total distributions | — | (1.66 | ) | (1.61 | ) | (2.05 | ) | (0.68 | ) | (0.18 | ) | |||||||||||||
|
| |||||||||||||||||||||||
| Net asset value, end of period | $27.67 | $28.04 | $27.68 | $25.54 | $29.02 | $27.88 | ||||||||||||||||||
|
| |||||||||||||||||||||||
Total returnf | (1.32)% | 7.37% | 14.77% | (4.79)% | 6.56% | 26.82% | ||||||||||||||||||
| Ratios to average net assetsg | ||||||||||||||||||||||||
Expensesh,i | 1.78% | 1.78% | 1.80% | j | 1.81%j | 1.80% | 1.79% | |||||||||||||||||
Expenses incurred in connection with securities sold short | 0.01% | —% | 0.01% | 0.02% | 0.03% | —% | k | |||||||||||||||||
| �� | ||||||||||||||||||||||||
Net investment income | 0.89% | 1.23% | c | 1.33% | d | 0.82% | 1.67% | e | 0.85% | |||||||||||||||
| Supplemental data | ||||||||||||||||||||||||
Net assets, end of period (000’s) | $879,965 | $995,665 | $1,114,760 | $1,101,302 | $1,240,845 | $1,236,603 | ||||||||||||||||||
Portfolio turnover rate | 8.37% | 18.15% | 20.56% | 19.99% | 19.24% | 24.29% | ||||||||||||||||||
aThe amount shown for a share outstanding throughout the period may not correlate with the Statement of Operations for the period due to the timing of sales and repurchases of the Fund’s shares in relation to income earned and/or fluctuating fair value of the investments of the Fund.
bBased on average daily shares outstanding.
cNet investment income per share includes approximately $0.16 per share related to income received in the form of special dividends in connection with certain Fund holdings. Excluding this amount, the ratio of net investment income to average net assets would have been 0.69%.
dNet investment income per share includes approximately $0.10 per share related to income received in the form of special dividends in connection with certain Fund holdings. Excluding this amount, the ratio of net investment income to average net assets would have been 0.96%.
eNet investment income per share includes approximately $0.29 per share related to income received in the form of a special dividend in connection with certain Fund holdings. Excluding this amount, the ratio of net investment income to average net assets would have been 0.66%.
fTotal return does not reflect sales commissions or contingent deferred sales charges, if applicable, and is not annualized for periods less than one year.
gRatios are annualized for periods less than one year.
hIncludes dividend and/or interest expense on securities sold short and security borrowing fees, if any. See below for the ratios of such expenses to average net assets for the periods presented. See Note 1(d).
iBenefit of expense reduction rounds to less than 0.01%.
jBenefit of waiver and payments by affiliates rounds to less than 0.01%.
kRounds to less than 0.01%.
| 14 | Semiannual Report | The accompanying notes are an integral part of these financial statements. | franklintempleton.com |
FRANKLIN MUTUAL SHARES FUND
FINANCIAL HIGHLIGHTS
Six Months Ended (unaudited) | Year Ended December 31, | |||||||||||||||||||||||
| 2017 | 2016 | 2015 | 2014 | 2013 | ||||||||||||||||||||
Class R | ||||||||||||||||||||||||
| Per share operating performance | ||||||||||||||||||||||||
(for a share outstanding throughout the period) | ||||||||||||||||||||||||
Net asset value, beginning of period | $28.21 | $27.83 | $25.66 | $29.14 | $27.98 | $22.20 | ||||||||||||||||||
|
| |||||||||||||||||||||||
| Income from investment operationsa: | ||||||||||||||||||||||||
Net investment incomeb | 0.19 | 0.50 | c | 0.49 | d | 0.38 | 0.64 | e | 0.34 | |||||||||||||||
Net realized and unrealized gains (losses) | (0.49 | ) | 1.70 | 3.42 | (1.67 | ) | 1.34 | 5.73 | ||||||||||||||||
|
| |||||||||||||||||||||||
Total from investment operations | (0.30 | ) | 2.20 | 3.91 | (1.29 | ) | 1.98 | 6.07 | ||||||||||||||||
|
| |||||||||||||||||||||||
| Less distributions from: | ||||||||||||||||||||||||
Net investment income | — | (0.53 | ) | (0.49 | ) | (0.43 | ) | (0.82 | ) | (0.29 | ) | |||||||||||||
Net realized gains | — | (1.29 | ) | (1.25 | ) | (1.76 | ) | — | — | |||||||||||||||
|
| |||||||||||||||||||||||
Total distributions | — | (1.82 | ) | (1.74 | ) | (2.19 | ) | (0.82 | ) | (0.29 | ) | |||||||||||||
|
| |||||||||||||||||||||||
| Net asset value, end of period | $27.91 | $28.21 | $27.83 | $25.66 | $29.14 | $27.98 | ||||||||||||||||||
|
| |||||||||||||||||||||||
Total returnf | (1.06)% | 7.96% | 15.31% | (4.32)% | 7.10% | 27.47% | ||||||||||||||||||
| Ratios to average net assetsg | ||||||||||||||||||||||||
Expensesh,i | 1.28% | 1.28% | 1.30% | j | 1.31% | j | 1.30% | 1.29% | ||||||||||||||||
Expenses incurred in connection with securities sold short | 0.01% | —% | 0.01% | 0.02% | 0.03% | —% | k | |||||||||||||||||
Net investment income | 1.39% | 1.73% | c | 1.83% | d | 1.32% | 2.17% | e | 1.35% | |||||||||||||||
| Supplemental data | ||||||||||||||||||||||||
Net assets, end of period (000’s) | $96,863 | $107,660 | $123,013 | $134,050 | $172,938 | $192,658 | ||||||||||||||||||
Portfolio turnover rate | 8.37% | 18.15% | 20.56% | 19.99% | 19.24% | 24.29% | ||||||||||||||||||
aThe amount shown for a share outstanding throughout the period may not correlate with the Statement of Operations for the period due to the timing of sales and repurchases of the Fund’s shares in relation to income earned and/or fluctuating fair value of the investments of the Fund.
bBased on average daily shares outstanding.
cNet investment income per share includes approximately $0.16 per share related to income received in the form of special dividends in connection with certain Fund holdings. Excluding this amount, the ratio of net investment income to average net assets would have been 1.19%.
dNet investment income per share includes approximately $0.10 per share related to income received in the form of special dividends in connection with certain Fund holdings. Excluding this amount, the ratio of net investment income to average net assets would have been 1.46%.
eNet investment income per share includes approximately $0.29 per share related to income received in the form of a special dividend in connection with certain Fund holdings. Excluding this amount, the ratio of net investment income to average net assets would have been 1.16%.
fTotal return is not annualized for periods less than one year.
gRatios are annualized for periods less than one year.
hIncludes dividend and/or interest expense on securities sold short and security borrowing fees, if any. See below for the ratios of such expenses to average net assets for the periods presented. See Note 1(d).
iBenefit of expense reduction rounds to less than 0.01%.
jBenefit of waiver and payments by affiliates rounds to less than 0.01%.
kRounds to less than 0.01%.
| franklintempleton.com | The accompanying notes are an integral part of these financial statements. | Semiannual Report | 15 |
FRANKLIN MUTUAL SHARES FUND
FINANCIAL HIGHLIGHTS
Six Months Ended (unaudited) | Year Ended December 31, | |||||||||||||||||||||||
| 2017 | 2016 | 2015 | 2014 | 2013a | ||||||||||||||||||||
Class R6 | ||||||||||||||||||||||||
| Per share operating performance | ||||||||||||||||||||||||
(for a share outstanding throughout the period) | ||||||||||||||||||||||||
Net asset value, beginning of period | $28.61 | $28.21 | $25.98 | $29.51 | $28.33 | $24.91 | ||||||||||||||||||
|
| |||||||||||||||||||||||
| Income from investment operationsb: | ||||||||||||||||||||||||
Net investment incomec | 0.28 | 0.70 | d | 0.66 | e | 0.57 | 0.82 | f | 0.38 | |||||||||||||||
Net realized and unrealized gains (losses) | (0.51 | ) | 1.71 | 3.49 | (1.71 | ) | 1.37 | 3.51 | ||||||||||||||||
|
| |||||||||||||||||||||||
Total from investment operations | (0.23 | ) | 2.41 | 4.15 | (1.14 | ) | 2.19 | 3.89 | ||||||||||||||||
|
| |||||||||||||||||||||||
| Less distributions from: | ||||||||||||||||||||||||
Net investment income | — | (0.72 | ) | (0.67 | ) | (0.63 | ) | (1.01 | ) | (0.47 | ) | |||||||||||||
Net realized gains | — | (1.29 | ) | (1.25 | ) | (1.76 | ) | — | — | |||||||||||||||
|
| |||||||||||||||||||||||
Total distributions | — | (2.01 | ) | (1.92 | ) | (2.39 | ) | (1.01 | ) | (0.47 | ) | |||||||||||||
|
| |||||||||||||||||||||||
| Net asset value, end of period | $28.38 | $28.61 | $28.21 | $25.98 | $29.51 | $28.33 | ||||||||||||||||||
|
| |||||||||||||||||||||||
Total returng | (0.80)% | 8.61% | 16.05% | (3.71)% | 7.72% | 15.70% | ||||||||||||||||||
| Ratios to average net assetsh | ||||||||||||||||||||||||
Expensesi,j | 0.69% | k | 0.67% | 0.68% | k | 0.69% | k | 0.69% | 0.67% | |||||||||||||||
Expenses incurred in connection with securities sold short | 0.01% | —% | 0.01% | 0.02% | 0.03% | —%l | ||||||||||||||||||
Net investment income | 1.98% | 2.34% | d | 2.45% | e | 1.94% | 2.78% | f | 1.97% | |||||||||||||||
| Supplemental data | ||||||||||||||||||||||||
Net assets, end of period (000’s) | $3,654,494 | $3,741,430 | $1,896,497 | $1,923,466 | $2,249,991 | $2,221,889 | ||||||||||||||||||
Portfolio turnover rate | 8.37% | 18.15% | 20.56% | 19.99% | 19.24% | 24.29% | ||||||||||||||||||
aFor the period May 1, 2013 (effective date) to December 31, 2013.
bThe amount shown for a share outstanding throughout the period may not correlate with the Statement of Operations for the period due to the timing of sales and repurchases of the Fund’s shares in relation to income earned and/or fluctuating fair value of the investments of the Fund.
cBased on average daily shares outstanding.
dNet investment income per share includes approximately $0.16 per share related to income received in the form of special dividends in connection with certain Fund holdings. Excluding this amount, the ratio of net investment income to average net assets would have been 1.80%.
eNet investment income per share includes approximately $0.10 per share related to income received in the form of special dividends in connection with certain Fund holdings. Excluding this amount, the ratio of net investment income to average net assets would have been 2.08%.
fNet investment income per share includes approximately $0.29 per share related to income received in the form of a special dividend in connection with certain Fund holdings. Excluding this amount, the ratio of net investment income to average net assets would have been 1.77%.
gTotal return is not annualized for periods less than one year.
hRatios are annualized for periods less than one year.
iIncludes dividend and/or interest expense on securities sold short and security borrowing fees, if any. See below for the ratios of such expenses to average net assets for the periods presented. See Note 1(d).
jBenefit of expense reduction rounds to less than 0.01%.
kBenefit of waiver and payments by affiliates rounds to less than 0.01%.
lRounds to less than 0.01%.
| 16 | Semiannual Report | The accompanying notes are an integral part of these financial statements. | franklintempleton.com |
FRANKLIN MUTUAL SHARES FUND
Statement of Investments, June 30, 2018 (unaudited)
| Country | Shares/ Units/ Warrants | Value | ||||||||||||||
Common Stocks and Other Equity Interests 88.2% |
| |||||||||||||||
| Aerospace & Defense 0.9% | ||||||||||||||||
BAE Systems PLC | United Kingdom | 15,885,498 | $ | 135,688,211 | ||||||||||||
|
| |||||||||||||||
| Auto Components 0.5% | ||||||||||||||||
The Goodyear Tire & Rubber Co. | United States | 2,382,274 | 55,483,162 | |||||||||||||
| a,b,c,d | International Automotive Components Group Brazil LLC | Brazil | 7,234,813 | 164,505 | ||||||||||||
| a,b,c,d | International Automotive Components Group North America LLC | United States | 63,079,866 | 18,885,418 | ||||||||||||
|
| |||||||||||||||
| 74,533,085 | ||||||||||||||||
|
| |||||||||||||||
| Automobiles 1.2% | ||||||||||||||||
General Motors Co. | United States | 4,507,470 | 177,594,318 | |||||||||||||
|
| |||||||||||||||
| Banks 10.1% | ||||||||||||||||
Barclays PLC | United Kingdom | 38,190,870 | 95,321,886 | |||||||||||||
CIT Group Inc. | United States | 2,759,673 | 139,115,116 | |||||||||||||
Citigroup Inc. | United States | 3,362,406 | 225,012,210 | |||||||||||||
Citizens Financial Group Inc. | United States | 6,757,671 | 262,873,402 | |||||||||||||
Columbia Banking System Inc. | United States | 88,096 | 3,603,126 | |||||||||||||
| a | FCB Financial Holdings Inc., A | United States | 1,647,570 | 96,877,116 | ||||||||||||
Guaranty Bancorp | United States | 1,146,366 | 34,161,707 | |||||||||||||
JPMorgan Chase & Co. | United States | 2,748,790 | 286,423,918 | |||||||||||||
State Bank Financial Corp. | United States | 1,467,000 | 48,997,800 | |||||||||||||
Wells Fargo & Co. | United States | 5,171,930 | 286,731,799 | |||||||||||||
|
| |||||||||||||||
| 1,479,118,080 | ||||||||||||||||
|
| |||||||||||||||
| Beverages 0.9% | ||||||||||||||||
PepsiCo Inc. | United States | 1,185,449 | 129,059,833 | |||||||||||||
|
| |||||||||||||||
| Building Products 0.9% | ||||||||||||||||
Johnson Controls International PLC | United States | 3,754,200 | 125,577,990 | |||||||||||||
|
| |||||||||||||||
| Chemicals 0.0% | ||||||||||||||||
| a,c,e | Dow Corning Corp., Contingent Distribution | United States | 12,630,547 | — | ||||||||||||
|
| |||||||||||||||
| Communications Equipment 3.1% | ||||||||||||||||
Cisco Systems Inc. | United States | 7,313,860 | 314,715,396 | |||||||||||||
Nokia OYJ, A | Finland | 13,670,039 | 78,738,953 | |||||||||||||
Nokia OYJ, ADR | Finland | 10,897,776 | 62,662,212 | |||||||||||||
|
| |||||||||||||||
| 456,116,561 | ||||||||||||||||
|
| |||||||||||||||
| Construction & Engineering 0.8% | ||||||||||||||||
Fluor Corp. | United States | 2,399,827 | 117,063,561 | |||||||||||||
|
| |||||||||||||||
| Construction Materials 0.7% | ||||||||||||||||
LafargeHolcim Ltd., B | Switzerland | 1,946,175 | 95,068,605 | |||||||||||||
|
| |||||||||||||||
| Consumer Finance 1.6% | ||||||||||||||||
Ally Financial Inc. | United States | 2,870,838 | 75,416,914 | |||||||||||||
Capital One Financial Corp. | United States | 1,763,405 | 162,056,920 | |||||||||||||
|
| |||||||||||||||
| 237,473,834 | ||||||||||||||||
|
| |||||||||||||||
| Containers & Packaging 1.6% | ||||||||||||||||
International Paper Co. | United States | 3,276,637 | 170,647,255 | |||||||||||||
WestRock Co. | United States | 1,125,212 | 64,159,588 | |||||||||||||
|
| |||||||||||||||
| 234,806,843 | ||||||||||||||||
|
| |||||||||||||||
| Diversified Financial Services 1.1% | ||||||||||||||||
Voya Financial Inc. | United States | 3,413,030 | 160,412,410 | |||||||||||||
|
| |||||||||||||||
| franklintempleton.com | Semiannual Report | 17 |
FRANKLIN MUTUAL SHARES FUND
STATEMENT OF INVESTMENTS (UNAUDITED)
| Country | Shares/ Units/ Warrants | Value | ||||||||||||||
Common Stocks and Other Equity Interests (continued) |
| |||||||||||||||
| Diversified Telecommunication Services 1.6% | ||||||||||||||||
AT&T Inc. | United States | 4,727,562 | $ | 151,802,016 | ||||||||||||
Koninklijke KPN NV | Netherlands | 30,410,640 | 82,785,532 | |||||||||||||
|
| |||||||||||||||
| 234,587,548 | ||||||||||||||||
|
| |||||||||||||||
| Electric Utilities 0.6% | ||||||||||||||||
PG&E Corp. | United States | 1,882,490 | 80,118,774 | |||||||||||||
|
| |||||||||||||||
| Electrical Equipment 1.3% | ||||||||||||||||
| a | Sensata Technologies Holding PLC | United States | 4,067,870 | 193,549,255 | ||||||||||||
|
| |||||||||||||||
| Energy Equipment & Services 1.2% | ||||||||||||||||
Baker Hughes a GE Co., A | United States | 3,663,252 | 120,997,214 | |||||||||||||
| a | GulfMark Offshore Inc. | United States | 464 | 15,544 | ||||||||||||
| a | GulfMark Offshore Inc., wts., 11/14/24 | United States | 5,020 | 11,144 | ||||||||||||
| a | McDermott International Inc. | United States | 2,645,956 | 51,993,035 | ||||||||||||
|
| |||||||||||||||
| 173,016,937 | ||||||||||||||||
|
| |||||||||||||||
| Equity Real Estate Investment Trusts (REITs) 2.0% | ||||||||||||||||
| b | Alexander’s Inc. | United States | 326,675 | 124,995,655 | ||||||||||||
JBG SMITH Properties | United States | 560,767 | 20,451,173 | |||||||||||||
Vornado Realty Trust | United States | 2,036,522 | 150,539,706 | |||||||||||||
|
| |||||||||||||||
| 295,986,534 | ||||||||||||||||
|
| |||||||||||||||
| Food & Staples Retailing 2.6% | ||||||||||||||||
The Kroger Co. | United States | 8,225,486 | 234,015,077 | |||||||||||||
| a | Rite Aid Corp. | United States | 8,729,840 | 15,102,623 | ||||||||||||
Walgreens Boots Alliance Inc. | United States | 2,283,129 | 137,021,987 | |||||||||||||
|
| |||||||||||||||
| 386,139,687 | ||||||||||||||||
|
| |||||||||||||||
| Health Care Equipment & Supplies 3.4% | ||||||||||||||||
Medtronic PLC | United States | 5,800,058 | 496,542,965 | |||||||||||||
|
| |||||||||||||||
| Health Care Providers & Services 1.3% | ||||||||||||||||
CVS Health Corp. | United States | 3,015,915 | 194,074,130 | |||||||||||||
|
| |||||||||||||||
| Household Durables 0.2% | ||||||||||||||||
Toll Brothers Inc. | United States | 766,723 | 28,361,084 | |||||||||||||
|
| |||||||||||||||
| Household Products 0.8% | ||||||||||||||||
Energizer Holdings Inc. | United States | 1,787,933 | 112,568,262 | |||||||||||||
|
| |||||||||||||||
| Independent Power & Renewable Electricity Producers 0.8% | ||||||||||||||||
| a | Vistra Energy Corp. | United States | 4,927,428 | 116,582,946 | ||||||||||||
|
| |||||||||||||||
| Industrial Conglomerates 1.9% | ||||||||||||||||
General Electric Co. | United States | 20,369,800 | 277,232,978 | |||||||||||||
|
| |||||||||||||||
| Insurance 7.2% | ||||||||||||||||
Alleghany Corp. | United States | 377,389 | 216,987,353 | |||||||||||||
American International Group Inc. | United States | 5,664,539 | 300,333,858 | |||||||||||||
| a | Brighthouse Financial Inc. | United States | 1,615,600 | 64,737,092 | ||||||||||||
Chubb Ltd. | United States | 1,169,358 | 148,531,853 | |||||||||||||
The Hartford Financial Services Group Inc. | United States | 2,286,099 | 116,888,242 | |||||||||||||
MetLife Inc. | United States | 3,551,930 | 154,864,148 | |||||||||||||
XL Group Ltd. | Bermuda | 817,623 | 45,746,007 | |||||||||||||
|
| |||||||||||||||
| 1,048,088,553 | ||||||||||||||||
|
| |||||||||||||||
| IT Services 1.6% | ||||||||||||||||
Cognizant Technology Solutions Corp., A | United States | 2,992,250 | 236,357,828 | |||||||||||||
|
| |||||||||||||||
| 18 | Semiannual Report | franklintempleton.com |
FRANKLIN MUTUAL SHARES FUND
STATEMENT OF INVESTMENTS (UNAUDITED)
| Country | Shares/ Units/ Warrants | Value | ||||||||||||||
Common Stocks and Other Equity Interests (continued) |
| |||||||||||||||
| Machinery 0.7% | ||||||||||||||||
CNH Industrial NV | United Kingdom | 4,351,332 | $ | 46,242,961 | ||||||||||||
CNH Industrial NV, special voting | United Kingdom | 5,296,616 | 56,288,789 | |||||||||||||
|
| |||||||||||||||
| 102,531,750 | ||||||||||||||||
|
| |||||||||||||||
| Media 7.3% | ||||||||||||||||
| a | Charter Communications Inc., A | United States | 865,529 | 253,781,758 | ||||||||||||
Comcast Corp., A | United States | 5,111,400 | 167,705,034 | |||||||||||||
| a | Cumulus Media Inc., A | United States | 151,572 | 2,273,580 | ||||||||||||
| a | Cumulus Media Inc., B | United States | 225,990 | 3,559,343 | ||||||||||||
| a | Cumulus Media Inc., wts., 6/04/38 | United States | 171,135 | 2,695,376 | ||||||||||||
| a | DISH Network Corp., A | United States | 2,879,437 | 96,777,878 | ||||||||||||
Sky PLC | United Kingdom | 9,251,388 | 178,557,043 | |||||||||||||
Twenty-First Century Fox Inc., B | United States | 1,557,900 | 76,757,733 | |||||||||||||
The Walt Disney Co. | United States | 2,716,200 | 284,684,922 | |||||||||||||
|
| |||||||||||||||
| 1,066,792,667 | ||||||||||||||||
|
| |||||||||||||||
| Metals & Mining 0.8% | ||||||||||||||||
thyssenkrupp AG | Germany | 3,973,743 | 96,661,486 | |||||||||||||
Warrior Met Coal Inc. | United States | 795,602 | 21,934,747 | |||||||||||||
|
| |||||||||||||||
| 118,596,233 | ||||||||||||||||
|
| |||||||||||||||
| Oil, Gas & Consumable Fuels 8.7% | ||||||||||||||||
Anadarko Petroleum Corp. | United States | 3,457,413 | 253,255,502 | |||||||||||||
BP PLC | United Kingdom | 14,266,349 | 108,952,527 | |||||||||||||
Kinder Morgan Inc. | United States | 11,533,040 | 203,788,817 | |||||||||||||
Marathon Oil Corp. | United States | 7,854,723 | 163,849,522 | |||||||||||||
Plains All American Pipeline LP | United States | 3,862,400 | 91,307,136 | |||||||||||||
Royal Dutch Shell PLC, A (EUR Traded) | United Kingdom | 4,955,823 | 172,372,344 | |||||||||||||
Royal Dutch Shell PLC, A (GBP Traded) | United Kingdom | 3,159,359 | 109,688,433 | |||||||||||||
The Williams Cos. Inc. | United States | 6,351,184 | 172,180,598 | |||||||||||||
|
| |||||||||||||||
| 1,275,394,879 | ||||||||||||||||
|
| |||||||||||||||
| Pharmaceuticals 7.8% | ||||||||||||||||
Eli Lilly & Co. | United States | 5,068,355 | 432,482,732 | |||||||||||||
Merck & Co. Inc. | United States | 6,989,310 | 424,251,117 | |||||||||||||
Novartis AG, ADR | Switzerland | 3,798,680 | 286,952,287 | |||||||||||||
|
| |||||||||||||||
| 1,143,686,136 | ||||||||||||||||
|
| |||||||||||||||
| Professional Services 0.5% | ||||||||||||||||
RELX PLC | United Kingdom | 3,153,086 | 67,560,335 | |||||||||||||
|
| |||||||||||||||
| Software 5.2% | ||||||||||||||||
| a | Avaya Holdings Corp., wts., 12/15/22 | United States | 276,741 | 1,279,927 | ||||||||||||
CA Inc. | United States | 5,174,940 | 184,486,611 | |||||||||||||
| a | Dell Technologies Inc., V | United States | 720,878 | 60,971,861 | ||||||||||||
Microsoft Corp. | United States | 3,147,885 | 310,412,940 | |||||||||||||
Symantec Corp. | United States | 9,445,251 | 195,044,433 | |||||||||||||
|
| |||||||||||||||
| 752,195,772 | ||||||||||||||||
|
| |||||||||||||||
| Technology Hardware, Storage & Peripherals 2.3% | ||||||||||||||||
Hewlett Packard Enterprise Co. | United States | 7,491,354 | 109,448,682 | |||||||||||||
Samsung Electronics Co. Ltd. | South Korea | 5,521,050 | 230,909,972 | |||||||||||||
|
| |||||||||||||||
| 340,358,654 | ||||||||||||||||
|
| |||||||||||||||
| franklintempleton.com | Semiannual Report | 19 |
FRANKLIN MUTUAL SHARES FUND
STATEMENT OF INVESTMENTS (UNAUDITED)
| Country | Shares/ Units/ Warrants | Value | ||||||||||||||
Common Stocks and Other Equity Interests (continued) |
| |||||||||||||||
| Tobacco 3.5% | ||||||||||||||||
Altria Group Inc. | United States | 2,351,460 | $ | 133,539,413 | ||||||||||||
British American Tobacco PLC | United Kingdom | 4,377,848 | 221,427,075 | |||||||||||||
British American Tobacco PLC, ADR | United Kingdom | 1,655,688 | 83,529,460 | |||||||||||||
Imperial Brands PLC | United Kingdom | 1,751,865 | 65,287,331 | |||||||||||||
|
| |||||||||||||||
| 503,783,279 | ||||||||||||||||
|
| |||||||||||||||
| Wireless Telecommunication Services 1.5% | ||||||||||||||||
| a | T-Mobile U.S. Inc. | United States | 2,480,000 | 148,180,000 | ||||||||||||
Vodafone Group PLC | United Kingdom | 29,287,025 | 71,095,038 | |||||||||||||
|
| |||||||||||||||
| 219,275,038 | ||||||||||||||||
|
| |||||||||||||||
Total Common Stocks and Other Equity Interests | 12,885,895,555 | |||||||||||||||
|
| |||||||||||||||
Management Investment Companies (Cost $78,163,804) 0.6% | ||||||||||||||||
|
| |||||||||||||||
Diversified Financial Services 0.6% | ||||||||||||||||
| a | Altaba Inc. | United States | 1,192,700 | 87,317,567 | ||||||||||||
|
| |||||||||||||||
| | Principal Amount | | ||||||||||||||
|
| |||||||||||||||
| Corporate Notes and Senior Floating Rate Interests 1.8% | ||||||||||||||||
| f,g | Cumulus Media New Holdings Inc., Term Loan, 6.60%, (1-month USD LIBOR + 4.50%), 5/13/22 | United States | $ | 42,712,936 | 42,526,067 | |||||||||||
Frontier Communications Corp., | ||||||||||||||||
senior note, 10.50%, 9/15/22 | United States | 82,365,000 | 75,158,063 | |||||||||||||
senior note, 11.00%, 9/15/25 | United States | 93,006,000 | 74,841,928 | |||||||||||||
| h | McDermott Technology Americas Inc., senior note, 144A, 10.625%, 5/01/24 | United States | 36,543,000 | 38,187,435 | ||||||||||||
| f,g | Toys R US-Delaware Inc., (DIP), 14.75%, (Prime + 9.75%), 1/18/19 | United States | 32,826,854 | 33,257,706 | ||||||||||||
|
| |||||||||||||||
Total Corporate Notes and Senior Floating Rate Interests | 263,971,199 | |||||||||||||||
|
| |||||||||||||||
Corporate Notes and Senior Floating Rate Interests in Reorganization 1.3% | ||||||||||||||||
| c,d,i | Broadband Ventures III LLC, secured promissory note, 5.00%, 2/01/12 | United States | 19,594 | — | ||||||||||||
| i | iHeartCommunications Inc., | |||||||||||||||
senior secured note, first lien, 9.00%, 12/15/19 | United States | 74,295,000 | 56,649,938 | |||||||||||||
f,g Tranche D Term Loan, 8.443%, (3-month USD LIBOR + 6.75%), 1/30/19 | United States | 94,620,526 | 72,420,185 | |||||||||||||
f,g Tranche E Term Loan, 9.193%, (3-month USD LIBOR + 7.50%), 7/30/19 | United States | 30,412,812 | 23,269,299 | |||||||||||||
| f,g,i | Toys R US-Delaware Inc., Term B-4 Loan, 10.067%, (1-month USD LIBOR + 8.75%), 4/24/20 | United States | 77,193,103 | 39,147,710 | ||||||||||||
|
| |||||||||||||||
Total Corporate Notes and Senior Floating Rate Interests in Reorganization (Cost $268,671,472) | 191,487,132 | |||||||||||||||
|
| |||||||||||||||
| Shares | ||||||||||||||||
|
| |||||||||||||||
| Companies in Liquidation 0.0%† | ||||||||||||||||
| a,c,e | Avaya Holdings Corp., Contingent Distribution | United States | 67,859,000 | — | ||||||||||||
| a,c,e | Avaya Inc., Contingent Distribution | United States | 131,491,379 | — | ||||||||||||
| a,c,e | Tribune Media, Litigation Trust, Contingent Distribution. | United States | 1,006,784 | — | ||||||||||||
| a,e | Vistra Energy Corp., Litigation Trust, Contingent Distribution | United States | 292,849,556 | 2,379,403 | ||||||||||||
| 20 | Semiannual Report | franklintempleton.com |
FRANKLIN MUTUAL SHARES FUND
STATEMENT OF INVESTMENTS (UNAUDITED)
| Country | Shares | Value | ||||||||||||||
Companies in Liquidation (continued) |
| |||||||||||||||
| a | Vistra Energy Corp., Litigation Trust, TRA | United States | 4,927,428 | $ | 3,202,828 | |||||||||||
|
| |||||||||||||||
| Total Companies in Liquidation (Cost $29,907,664) | 5,582,231 | |||||||||||||||
|
| |||||||||||||||
Total Investments before Short Term Investments | 13,434,253,684 | |||||||||||||||
|
| |||||||||||||||
| | Principal Amount | | ||||||||||||||
|
| |||||||||||||||
Short Term Investments 7.5% | ||||||||||||||||
U.S. Government and Agency Securities 7.5% | ||||||||||||||||
| j | FHLB, 7/02/18 | United States | $ | 239,700,000 | 239,700,000 | |||||||||||
| j | U.S. Treasury Bill, | |||||||||||||||
k 7/12/18-11/01/18 | United States | 95,000,000 | 94,645,468 | |||||||||||||
7/05/18-12/27/18 | United States | 764,600,000 | 760,624,995 | |||||||||||||
|
| |||||||||||||||
Total U.S. Government and Agency Securities | 1,094,970,463 | |||||||||||||||
|
| |||||||||||||||
| Total Investments (Cost $11,790,937,912) 99.4% | 14,529,224,147 | |||||||||||||||
| Securities Sold Short (0.5)% | (79,661,387 | ) | ||||||||||||||
| Other Assets, less Liabilities 1.1% | 162,885,251 | |||||||||||||||
|
| |||||||||||||||
| Net Assets 100.0% | $ | 14,612,448,011 | ||||||||||||||
|
| |||||||||||||||
| Shares | ||||||||||||||||
|
| |||||||||||||||
| l | Securities Sold Short (Proceeds $75,362,089) (0.5)% | |||||||||||||||
Common Stocks (0.5)% | ||||||||||||||||
Internet Software & Services (0.5)% | ||||||||||||||||
Alibaba Group Holding Ltd., ADR | China | 429,372 | (79,661,387 | ) | ||||||||||||
|
| |||||||||||||||
†Rounds to less than 0.1% of net assets.
aNon-income producing.
bSee Note 11 regarding holdings of 5% voting securities.
cFair valued using significant unobservable inputs. See Note 13 regarding fair value measurements.
dSee Note 9 regarding restricted securities.
eContingent distributions represent the right to receive additional distributions, if any, during the reorganization of the underlying company. Shares represent total underlying principal of debt securities.
fThe coupon rate shown represents the rate at period end.
gSee Note 1(e) regarding senior floating rate interests.
hSecurity was purchased pursuant to Rule 144A under the Securities Act of 1933 and may be sold in transactions exempt from registration only to qualified institutional buyers or in a public offering registered under the Securities Act of 1933. This security has been deemed liquid under guidelines approved by the Trust’s Board of Trustees. At June 30, 2018, the value of this security was $38,187,435, representing 0.3% of net assets.
iSee Note 8 regarding credit risk and defaulted securities.
jThe security was issued on a discount basis with no stated coupon rate.
kA portion or all of the security has been segregated as collateral for securities sold short. At June 30, 2018, the aggregate value of these securities pledged amounted to $39,514,199, representing 0.3% of net assets.
lSee Note 1(d) regarding securities sold short.
| franklintempleton.com | Semiannual Report | 21 |
FRANKLIN MUTUAL SHARES FUND
STATEMENT OF INVESTMENTS (UNAUDITED)
At June 30, 2018, the Fund had the following futures contracts outstanding. See Note 1(c).
| Futures Contracts | ||||||||||||||||||||
| Description | Type | Number of Contracts | Notional Amount* | Expiration Date | Value/ Unrealized Appreciation (Depreciation) | |||||||||||||||
| Currency Contracts | ||||||||||||||||||||
EUR/USD | Short | 1,533 | $ | 224,900,681 | 9/17/18 | $ | 2,301,268 | |||||||||||||
GBP/USD | Short | 3,891 | 321,882,975 | 9/17/18 | 4,903,097 | |||||||||||||||
|
| |||||||||||||||||||
Total Futures Contracts |
| $ | 7,204,365 | |||||||||||||||||
|
| |||||||||||||||||||
*As of period end.
At June 30, 2018, the Fund had the following forward exchange contracts outstanding. See Note 1(c).
| Forward Exchange Contracts | ||||||||||||||||||||||||||||
| Currency | Counterpartya | Type | Quantity | Contract Amount | Settlement Date | Unrealized Appreciation | Unrealized Depreciation | |||||||||||||||||||||
| OTC Forward Exchange Contracts |
| |||||||||||||||||||||||||||
Euro | BOFA | Buy | 1,617,305 | $ | 1,898,577 | 7/12/18 | $ | — | $ | (7,165 | ) | |||||||||||||||||
Euro | BOFA | Buy | 7,711,041 | 8,958,881 | 7/12/18 | 59,059 | — | |||||||||||||||||||||
Euro | BOFA | Sell | 1,388,527 | 1,702,801 | 7/12/18 | 78,940 | — | |||||||||||||||||||||
Euro | BONY | Buy | 769,302 | 900,683 | 7/12/18 | — | (996 | ) | ||||||||||||||||||||
Euro | BONY | Buy | 2,162,162 | 2,523,935 | 7/12/18 | 4,679 | — | |||||||||||||||||||||
Euro | HSBK | Buy | 12,709,560 | 14,772,044 | 7/12/18 | 91,584 | — | |||||||||||||||||||||
Euro | HSBK | Sell | 27,975,413 | 33,956,318 | 7/12/18 | 1,239,518 | — | |||||||||||||||||||||
Euro | SSBT | Buy | 2,162,162 | 2,521,338 | 7/12/18 | 7,276 | — | |||||||||||||||||||||
Euro | SSBT | Sell | 1,421,713 | 1,744,363 | 7/12/18 | 81,692 | — | |||||||||||||||||||||
Euro | UBSW | Buy | 769,302 | 900,416 | 7/12/18 | — | (730 | ) | ||||||||||||||||||||
Euro | UBSW | Buy | 2,162,162 | 2,521,325 | 7/12/18 | 7,289 | — | |||||||||||||||||||||
Euro | UBSW | Sell | 26,586,887 | 32,258,269 | 7/12/18 | 1,165,327 | — | |||||||||||||||||||||
British Pound | BOFA | Buy | 3,844,283 | 5,162,449 | 7/16/18 | — | (81,646 | ) | ||||||||||||||||||||
British Pound | BOFA | Buy | 11,475,932 | 15,134,893 | 7/16/18 | 32,290 | — | |||||||||||||||||||||
British Pound | BOFA | Sell | 5,873,515 | 8,316,316 | 7/16/18 | 553,575 | — | |||||||||||||||||||||
British Pound | BONY | Buy | 6,095,940 | 8,038,777 | 7/16/18 | 17,932 | — | |||||||||||||||||||||
British Pound | BONY | Sell | 3,444,140 | 4,955,945 | 7/16/18 | 403,992 | — | |||||||||||||||||||||
British Pound | HSBK | Buy | 2,100,000 | 2,791,421 | 7/16/18 | — | (15,952 | ) | ||||||||||||||||||||
British Pound | HSBK | Sell | 8,585,736 | 11,885,956 | 7/16/18 | 538,604 | — | |||||||||||||||||||||
British Pound | SSBT | Buy | 1,162,993 | 1,533,447 | 7/16/18 | 3,625 | — | |||||||||||||||||||||
British Pound | UBSW | Sell | 6,775,756 | 9,297,209 | 7/16/18 | 342,020 | — | |||||||||||||||||||||
Euro | BONY | Sell | 36,507,824 | 45,793,954 | 7/26/18 | 3,053,956 | — | |||||||||||||||||||||
Euro | HSBK | Sell | 36,507,825 | 45,790,305 | 7/26/18 | 3,050,306 | — | |||||||||||||||||||||
South Korean Won | HSBK | Buy | 8,049,690,900 | 7,335,198 | 8/10/18 | — | (109,394 | ) | ||||||||||||||||||||
South Korean Won | HSBK | Sell | 84,985,464,351 | 79,180,856 | 8/10/18 | 2,893,657 | — | |||||||||||||||||||||
South Korean Won | UBSW | Buy | 24,779,257,047 | 22,972,917 | 8/10/18 | — | (729,817 | ) | ||||||||||||||||||||
South Korean Won | UBSW | Sell | 63,025,698,677 | 59,089,500 | 8/10/18 | 2,514,486 | — | |||||||||||||||||||||
British Pound | BOFA | Sell | 17,294,714 | 24,233,391 | 8/14/18 | 1,345,269 | — | |||||||||||||||||||||
British Pound | HSBK | Buy | 2,242,997 | 2,965,729 | 8/14/18 | 2,692 | — | |||||||||||||||||||||
British Pound | HSBK | Sell | 19,988,189 | 27,973,011 | 8/14/18 | 1,520,300 | — | |||||||||||||||||||||
British Pound | SSBT | Buy | 2,500,067 | 3,300,744 | 8/14/18 | 7,888 | — | |||||||||||||||||||||
British Pound | UBSW | Buy | 3,663,060 | 4,838,210 | 8/14/18 | 9,546 | — | |||||||||||||||||||||
| 22 | Semiannual Report | franklintempleton.com |
FRANKLIN MUTUAL SHARES FUND
STATEMENT OF INVESTMENTS (UNAUDITED)
Forward Exchange Contracts (continued)
| Currency | Counterpartya | Type | Quantity | Contract Amount | Settlement Date | Unrealized Appreciation | Unrealized Depreciation | |||||||||||||||||||||
| OTC Forward Exchange Contracts (continued) |
| |||||||||||||||||||||||||||
British Pound | UBSW | Buy | 12,002,648 | $ | 15,933,287 | 8/14/18 | $ | — | $ | (48,777 | ) | |||||||||||||||||
Euro | BONY | Sell | 11,912,423 | 15,070,609 | 8/20/18 | 1,097,042 | — | |||||||||||||||||||||
Euro | SSBT | Sell | 11,912,424 | 15,065,940 | 8/20/18 | 1,092,372 | — | |||||||||||||||||||||
Euro | BOFA | Sell | 11,053,544 | 13,870,742 | 10/10/18 | 852,134 | — | |||||||||||||||||||||
Euro | UBSW | Sell | 930,160 | 1,157,682 | 10/10/18 | 62,161 | — | |||||||||||||||||||||
Euro | BOFA | Sell | 4,061,319 | 5,041,618 | 10/18/18 | 255,029 | — | |||||||||||||||||||||
Euro | BONY | Sell | 1,048,695 | 1,286,041 | 10/18/18 | 50,070 | — | |||||||||||||||||||||
Euro | HSBK | Sell | 17,288,524 | 21,104,760 | 10/18/18 | 728,855 | — | |||||||||||||||||||||
Euro | SSBT | Sell | 9,249,646 | 11,610,759 | 10/18/18 | 709,314 | — | |||||||||||||||||||||
Euro | UBSW | Sell | 16,184,229 | 20,023,942 | 10/18/18 | 949,537 | — | |||||||||||||||||||||
British Pound | BOFA | Sell | 5,714,307 | 7,820,532 | 10/24/18 | 233,266 | — | |||||||||||||||||||||
British Pound | HSBK | Sell | 267,630 | 371,317 | 10/24/18 | 15,967 | — | |||||||||||||||||||||
British Pound | SSBT | Sell | 177,981,605 | 251,671,329 | 10/24/18 | 15,353,297 | — | |||||||||||||||||||||
British Pound | UBSW | Sell | 2,192,665 | 3,006,106 | 10/24/18 | 94,759 | — | |||||||||||||||||||||
Euro | SSBT | Sell | 17,393,069 | 21,120,404 | 11/07/18 | 586,289 | — | |||||||||||||||||||||
Euro | UBSW | Sell | 17,393,070 | 21,116,231 | 11/07/18 | 582,114 | — | |||||||||||||||||||||
South Korean Won | HSBK | Sell | 80,180,590,398 | 74,873,804 | 11/09/18 | 2,617,665 | — | |||||||||||||||||||||
South Korean Won | UBSW | Sell | 64,126,544,521 | 59,900,560 | 11/09/18 | 2,111,805 | — | |||||||||||||||||||||
Euro | HSBK | Sell | 37,536,617 | 44,891,992 | 11/21/18 | 523,548 | — | |||||||||||||||||||||
Euro | SSBT | Sell | 37,536,617 | 44,901,301 | 11/21/18 | 532,857 | — | |||||||||||||||||||||
British Pound | BONY | Sell | 59,995,846 | 81,333,669 | 11/26/18 | 1,541,525 | — | |||||||||||||||||||||
British Pound | UBSW | Sell | 59,995,846 | 81,327,849 | 11/26/18 | 1,535,705 | — | |||||||||||||||||||||
|
| |||||||||||||||||||||||||||
Total Forward Exchange Contracts | $ | 50,550,813 | $ | (994,477 | ) | |||||||||||||||||||||||
|
| |||||||||||||||||||||||||||
Net unrealized appreciation (depreciation) |
| $ | 49,556,336 | |||||||||||||||||||||||||
|
| |||||||||||||||||||||||||||
aMay be comprised of multiple contracts with the same counterparty, currency and settlement date.
See Note 10 regarding other derivative information.
See Abbreviations on page 40.
| franklintempleton.com | The accompanying notes are an integral part of these financial statements. | Semiannual Report | 23 |
FRANKLIN MUTUAL SHARES FUND
Financial Statements
Statement of Assets and Liabilities
June 30, 2018 (unaudited)
Assets: | ||||
Investments in securities: | ||||
Cost - Unaffiliated issuers | $ | 11,721,759,009 | ||
Cost - Non-controlled affiliates (Note 11) | 69,178,903 | |||
|
| |||
Value - Unaffiliated issuers | $ | 14,385,178,569 | ||
Value - Non-controlled affiliates (Note 11) | 144,045,578 | |||
Cash | 12,007,446 | |||
Foreign currency, at value (cost $16,382,490) | 16,538,822 | |||
Receivables: | ||||
Investment securities sold | 17,343,904 | |||
Capital shares sold | 3,821,919 | |||
Dividends and interest | 31,082,969 | |||
European Union tax reclaims | 5,338,889 | |||
Deposits with brokers for: | ||||
Securities sold short | 82,621,909 | |||
Futures contracts | 11,027,040 | |||
Unrealized appreciation on OTC forward exchange contracts | 50,550,813 | |||
Other assets | 10,218 | |||
|
| |||
Total assets | 14,759,568,076 | |||
|
| |||
Liabilities: | ||||
Payables: | ||||
Investment securities purchased | 27,952,033 | |||
Capital shares redeemed | 17,934,451 | |||
Management fees | 7,907,033 | |||
Distribution fees | 3,328,286 | |||
Transfer agent fees | 2,716,956 | |||
Trustees’ fees and expenses | 737,644 | |||
Variation margin on futures contracts | 5,156,569 | |||
Securities sold short, at value (proceeds $75,362,089) | 79,661,387 | |||
Unrealized depreciation on OTC forward exchange contracts | 994,477 | |||
Accrued expenses and other liabilities | 731,229 | |||
|
| |||
Total liabilities | 147,120,065 | |||
|
| |||
Net assets, at value | $ | 14,612,448,011 | ||
|
| |||
Net assets consist of: | ||||
Paid-in capital | $ | 10,934,265,420 | ||
Undistributed net investment income | 135,289,236 | |||
Net unrealized appreciation (depreciation) | 2,790,645,962 | |||
Accumulated net realized gain (loss) | 752,247,393 | |||
|
| |||
Net assets, at value | $ | 14,612,448,011 | ||
|
|
| 24 | Semiannual Report | The accompanying notes are an integral part of these financial statements. | franklintempleton.com |
FRANKLIN MUTUAL SHARES FUND
FINANCIAL STATEMENTS
Statement of Assets and Liabilities (continued)
June 30, 2018 (unaudited)
| Class Z: | ||||
Net assets, at value | $ | 5,916,995,929 | ||
|
| |||
Shares outstanding | 208,403,191 | |||
|
| |||
Net asset value and maximum offering price per share | $28.39 | |||
|
| |||
| Class A: | ||||
Net assets, at value | $ | 4,064,129,657 | ||
|
| |||
Shares outstanding | 144,730,613 | |||
|
| |||
Net asset value per sharea | $28.08 | |||
|
| |||
Maximum offering price per share (net asset value per share ÷ 94.25%) | $29.79 | |||
|
| |||
| Class C: | ||||
Net assets, at value | $ | 879,965,221 | ||
|
| |||
Shares outstanding | 31,797,360 | |||
|
| |||
Net asset value and maximum offering price per sharea | $27.67 | |||
|
| |||
| Class R: | ||||
Net assets, at value | $ | 96,862,762 | ||
|
| |||
Shares outstanding | 3,470,879 | |||
|
| |||
Net asset value and maximum offering price per share | $27.91 | |||
|
| |||
| Class R6: | ||||
Net assets, at value | $ | 3,654,494,442 | ||
|
| |||
Shares outstanding | 128,755,921 | |||
|
| |||
Net asset value and maximum offering price per share | $28.38 | |||
|
| |||
aRedemption price is equal to net asset value less contingent deferred sales charges, if applicable.
| franklintempleton.com | The accompanying notes are an integral part of these financial statements. | Semiannual Report | 25 |
FRANKLIN MUTUAL SHARES FUND
FINANCIAL STATEMENTS
Statement of Operations
for the six months ended June 30, 2018 (unaudited)
Investment income: | ||||
Dividends: (net of foreign taxes)* | ||||
Unaffiliated issuers | $ | 170,968,576 | ||
Non-controlled affiliates (Note 11) | 2,940,075 | |||
Interest: | ||||
Unaffiliated issuers | 26,319,095 | |||
|
| |||
Total investment income | 200,227,746 | |||
|
| |||
Expenses: | ||||
Management fees (Note 3a) | 48,544,721 | |||
Distribution fees: (Note 3c) | ||||
Class A | 5,246,965 | |||
Class C | 4,710,797 | |||
Class R | 254,024 | |||
Transfer agent fees: (Note 3e) | ||||
Class Z | 3,206,571 | |||
Class A | 2,226,019 | |||
Class C | 499,668 | |||
Class R | 54,086 | |||
Class R6 | 387,562 | |||
Custodian fees (Note 4) | 197,520 | |||
Reports to shareholders | 375,861 | |||
Registration and filing fees | 114,554 | |||
Professional fees | 274,266 | |||
Trustees’ fees and expenses | 271,707 | |||
Dividends on securities sold short | 550,622 | |||
Other | 131,551 | |||
|
| |||
Total expenses | 67,046,494 | |||
Expense reductions (Note 4) | (35,107 | ) | ||
Expenses waived/paid by affiliates (Note 3f) | (18,453 | ) | ||
|
| |||
Net expenses | 66,992,934 | |||
|
| |||
Net investment income | 133,234,812 | |||
|
| |||
Realized and unrealized gains (losses): | ||||
Net realized gain (loss) from: | ||||
Investments: | ||||
Unaffiliated issuers | 780,940,232 | |||
Controlled affiliates (Note 11) | 27,760 | |||
Non-controlled affiliates (Note 11) | 30,054 | |||
Foreign currency transactions | (1,234,060 | ) | ||
Forward exchange contracts | (40,714,886 | ) | ||
Futures contracts | 6,626,833 | |||
Securities sold short | 3,081,811 | |||
|
| |||
Net realized gain (loss) | 748,757,744 | |||
|
| |||
Net change in unrealized appreciation (depreciation) on: | ||||
Investments: | ||||
Unaffiliated issuers | (1,072,198,513 | ) | ||
Non-controlled affiliates (Note 11) | (27,072,205 | ) | ||
Translation of other assets and liabilities denominated in foreign currencies | �� | (380,180 | ) | |
Forward exchange contracts | 81,695,737 | |||
Futures contracts | 13,707,824 | |||
Securities sold short | (5,259,691 | ) | ||
|
| |||
Net change in unrealized appreciation (depreciation) | (1,009,507,028 | ) | ||
|
| |||
Net realized and unrealized gain (loss) | (260,749,284 | ) | ||
|
|
| 26 | Semiannual Report | The accompanying notes are an integral part of these financial statements. | franklintempleton.com |
FRANKLIN MUTUAL SHARES FUND
FINANCIAL STATEMENTS
Statement of Operations (continued)
for the six months ended June 30, 2018 (unaudited)
Net increase (decrease) in net assets resulting from operations | $ | (127,514,472 | ) | |
|
|
*Foreign taxes withheld on dividends | $ | 5,218,415 |
| franklintempleton.com | The accompanying notes are an integral part of these financial statements. | Semiannual Report | 27 |
FRANKLIN MUTUAL SHARES FUND
FINANCIAL STATEMENTS
Statements of Changes in Net Assets
| Six Months Ended June 30, 2018 (unaudited) | Year Ended December 31, 2017 | |||||||
Increase (decrease) in net assets: | ||||||||
Operations: | ||||||||
Net investment income | $ | 133,234,812 | $ | 329,366,264 | ||||
Net realized gain (loss) | 748,757,744 | 565,295,714 | ||||||
Net change in unrealized appreciation (depreciation) | (1,009,507,028 | ) | 361,422,610 | |||||
|
| |||||||
Net increase (decrease) in net assets resulting from operations | (127,514,472 | ) | 1,256,084,588 | |||||
|
| |||||||
Distributions to shareholders from: | ||||||||
Net investment income: | ||||||||
Class Z | — | (143,391,184 | ) | |||||
Class A | — | (90,135,244 | ) | |||||
Class C | — | (12,762,513 | ) | |||||
Class R | — | (1,950,214 | ) | |||||
Class R6 | — | (87,386,307 | ) | |||||
Net realized gains: | ||||||||
Class Z | — | (296,748,998 | ) | |||||
Class A | — | (194,072,656 | ) | |||||
Class C | — | (44,764,663 | ) | |||||
Class R | — | (4,865,346 | ) | |||||
Class R6 | — | (134,490,114 | ) | |||||
|
| |||||||
Total distributions to shareholders | — | (1,010,567,239 | ) | |||||
|
| |||||||
Capital share transactions: (Note 2) | ||||||||
Class Z | (264,683,954 | ) | (1,618,916,627 | ) | ||||
Class A | (284,641,147 | ) | (431,662,396 | ) | ||||
Class C | (103,644,950 | ) | (138,671,413 | ) | ||||
Class R | (9,776,861 | ) | (17,540,464 | ) | ||||
Class R6 | (58,870,243 | ) | 1,869,126,723 | |||||
|
| |||||||
Total capital share transactions | (721,617,155 | ) | (337,664,177 | ) | ||||
|
| |||||||
Net increase (decrease) in net assets | (849,131,627 | ) | (92,146,828 | ) | ||||
Net assets: | ||||||||
Beginning of period | 15,461,579,638 | 15,553,726,466 | ||||||
|
| |||||||
End of period | $ | 14,612,448,011 | $ | 15,461,579,638 | ||||
|
| |||||||
Undistributed net investment income included in net assets: | ||||||||
End of period | $ | 135,289,236 | $ | 2,054,424 | ||||
|
| |||||||
| 28 | Semiannual Report | The accompanying notes are an integral part of these financial statements. | franklintempleton.com |
FRANKLIN MUTUAL SHARES FUND
Notes to Financial Statements (unaudited)
1. Organization and Significant Accounting Policies
Franklin Mutual Series Funds (Trust) is registered under the Investment Company Act of 1940 (1940 Act) as an open-end management investment company, consisting of seven separate funds and applies the specialized accounting and reporting guidance in U.S. Generally Accepted Accounting Principles (U.S. GAAP). Franklin Mutual Shares Fund (Fund) is included in this report. The Fund offers five classes of shares: Class Z, Class A, Class C, Class R and Class R6. Each class of shares may differ by its initial sales load, contingent deferred sales charges, voting rights on matters affecting a single class, its exchange privilege and fees due to differing arrangements for distribution and transfer agent fees.
The following summarizes the Fund’s significant accounting policies.
a. Financial Instrument Valuation
The Fund’s investments in financial instruments are carried at fair value daily. Fair value is the price that would be received to sell an asset or paid to transfer a liability in an orderly transaction between market participants on the measurement date. The Fund calculates the net asset value (NAV) per share each business day as of 4 p.m. Eastern time or the regularly scheduled close of the New York Stock Exchange (NYSE), whichever is earlier. Under compliance policies and procedures approved by the Trust’s Board of Trustees (the Board), the Fund’s administrator has responsibility for oversight of valuation, including leading the cross-functional Valuation Committee (VC). The VC provides administration and oversight of the Fund’s valuation policies and procedures, which are approved annually by the Board. Among other things, these procedures allow the Fund to utilize independent pricing services, quotations from securities and financial instrument dealers, and other market sources to determine fair value.
Equity securities and derivative financial instruments listed on an exchange or on the NASDAQ National Market System are valued at the last quoted sale price or the official closing price of the day, respectively. Foreign equity securities are valued as of the close of trading on the foreign stock exchange on which the security is primarily traded, or as of 4 p.m. Eastern time. The value is then converted into its U.S. dollar equivalent at the foreign exchange rate in effect at 4 p.m. Eastern time on the day that the value of the security is determined. Over-the-counter (OTC) securities are valued within the range of the most recent
quoted bid and ask prices. Securities that trade in multiple markets or on multiple exchanges are valued according to the broadest and most representative market. Certain equity securities are valued based upon fundamental characteristics or relationships to similar securities.
Debt securities generally trade in the OTC market rather than on a securities exchange. The Fund’s pricing services use multiple valuation techniques to determine fair value. In instances where sufficient market activity exists, the pricing services may utilize a market-based approach through which quotes from market makers are used to determine fair value. In instances where sufficient market activity may not exist or is limited, the pricing services also utilize proprietary valuation models which may consider market characteristics such as benchmark yield curves, credit spreads, estimated default rates, anticipated market interest rate volatility, coupon rates, anticipated timing of principal repayments, underlying collateral, and other unique security features in order to estimate the relevant cash flows, which are then discounted to calculate the fair value.
Certain derivative financial instruments trade in the OTC market. The Fund’s pricing services use various techniques including industry standard option pricing models and proprietary discounted cash flow models to determine the fair value of those instruments. The Fund’s net benefit or obligation under the derivative contract, as measured by the fair value of the contract, is included in net assets.
The Fund has procedures to determine the fair value of financial instruments for which market prices are not reliable or readily available. Under these procedures, the VC convenes on a regular basis to review such financial instruments and considers a number of factors, including significant unobservable valuation inputs, when arriving at fair value. The VC primarily employs a market-based approach which may use related or comparable assets or liabilities, recent transactions, market multiples, book values, and other relevant information for the investment to determine the fair value of the investment. An income-based valuation approach may also be used in which the anticipated future cash flows of the investment are discounted to calculate fair value. Discounts may also be applied due to the nature or duration of any restrictions on the disposition of the investments. Due to the inherent uncertainty of valuations of such investments, the fair values may differ significantly from the values that would have been used had an active market existed. The VC employs various methods for calibrating these
| franklintempleton.com | Semiannual Report | 29 |
FRANKLIN MUTUAL SHARES FUND
NOTES TO FINANCIAL STATEMENTS (UNAUDITED)
1. Organization and Significant Accounting Policies (continued)
a. Financial Instrument Valuation (continued)
valuation approaches including a regular review of key inputs and assumptions, transactional back-testing or disposition analysis, and reviews of any related market activity.
Trading in securities on foreign securities stock exchanges and OTC markets may be completed before 4 p.m. Eastern time. In addition, trading in certain foreign markets may not take place on every Fund’s business day. Occasionally, events occur between the time at which trading in a foreign security is completed and 4 p.m. Eastern time that might call into question the reliability of the value of a portfolio security held by the Fund. As a result, differences may arise between the value of the Fund’s portfolio securities as determined at the foreign market close and the latest indications of value at 4 p.m. Eastern time. In order to minimize the potential for these differences, the VC monitors price movements following the close of trading in foreign stock markets through a series of country specific market proxies (such as baskets of American Depositary Receipts, futures contracts and exchange traded funds). These price movements are measured against established trigger thresholds for each specific market proxy to assist in determining if an event has occurred that may call into question the reliability of the values of the foreign securities held by the Fund. If such an event occurs, the securities may be valued using fair value procedures, which may include the use of independent pricing services.
When the last day of the reporting period is a non-business day, certain foreign markets may be open on those days that the Fund’s NAV is not calculated, which could result in differences between the value of the Fund’s portfolio securities on the last business day and the last calendar day of the reporting period. Any significant security valuation changes due to an open foreign market are adjusted and reflected by the Fund for financial reporting purposes.
b. Foreign Currency Translation
Portfolio securities and other assets and liabilities denominated in foreign currencies are translated into U.S. dollars based on the exchange rate of such currencies against U.S. dollars on the date of valuation. The Fund may enter into foreign currency exchange contracts to facilitate transactions denominated in a foreign currency. Purchases and sales of securities, income and
expense items denominated in foreign currencies are translated into U.S. dollars at the exchange rate in effect on the transaction date. Portfolio securities and assets and liabilities denominated in foreign currencies contain risks that those currencies will decline in value relative to the U.S. dollar. Occasionally, events may impact the availability or reliability of foreign exchange rates used to convert the U.S. dollar equivalent value. If such an event occurs, the foreign exchange rate will be valued at fair value using procedures established and approved by the Board.
The Fund does not separately report the effect of changes in foreign exchange rates from changes in market prices on securities held. Such changes are included in net realized and unrealized gain or loss from investments in the Statement of Operations.
Realized foreign exchange gains or losses arise from sales of foreign currencies, currency gains or losses realized between the trade and settlement dates on securities transactions and the difference between the recorded amounts of dividends, interest, and foreign withholding taxes and the U.S. dollar equivalent of the amounts actually received or paid. Net unrealized foreign exchange gains and losses arise from changes in foreign exchange rates on foreign denominated assets and liabilities other than investments in securities held at the end of the reporting period.
c. Derivative Financial Instruments
The Fund invested in derivative financial instruments in order to manage risk or gain exposure to various other investments or markets. Derivatives are financial contracts based on an underlying or notional amount, require no initial investment or an initial net investment that is smaller than would normally be required to have a similar response to changes in market factors, and require or permit net settlement. Derivatives contain various risks including the potential inability of the counterparty to fulfill their obligations under the terms of the contract, the potential for an illiquid secondary market, and/or the potential for market movements which expose the Fund to gains or losses in excess of the amounts shown in the Statement of Assets and Liabilities. Realized gain and loss and unrealized appreciation and depreciation on these contracts for the period are included in the Statement of Operations.
Derivative counterparty credit risk is managed through a formal evaluation of the creditworthiness of all potential counter-parties. The Fund attempts to reduce its exposure to
| 30 | Semiannual Report | franklintempleton.com |
FRANKLIN MUTUAL SHARES FUND
NOTES TO FINANCIAL STATEMENTS (UNAUDITED)
counterparty credit risk on OTC derivatives, whenever possible, by entering into International Swaps and Derivatives Association (ISDA) master agreements with certain counterparties. These agreements contain various provisions, including but not limited to collateral requirements, events of default, or early termination. Termination events applicable to the counterparty include certain deteriorations in the credit quality of the counterparty. Termination events applicable to the Fund include failure of the Fund to maintain certain net asset levels and/or limit the decline in net assets over various periods of time. In the event of default or early termination, the ISDA master agreement gives the non-defaulting party the right to net and close-out all transactions traded, whether or not arising under the ISDA agreement, to one net amount payable by one counterparty to the other. However, absent an event of default or early termination, OTC derivative assets and liabilities are presented gross and not offset in the Statement of Assets and Liabilities. Early termination by the counterparty may result in an immediate payment by the Fund of any net liability owed to that counterparty under the ISDA agreement. At June 30, 2018, the Fund had no OTC derivatives in a net liability position for such contracts.
Collateral requirements differ by type of derivative. Collateral or initial margin requirements are set by the broker or exchange clearing house for exchange traded and centrally cleared derivatives. Initial margin deposited is held at the exchange and can be in the form of cash and/or securities. For OTC derivatives traded under an ISDA master agreement, posting of collateral is required by either the Fund or the applicable counterparty if the total net exposure of all OTC derivatives with the applicable counterparty exceeds the minimum transfer amount, which typically ranges from $100,000 to $250,000, and can vary depending on the counterparty and the type of the agreement. Generally, collateral is determined at the close of Fund business each day and any additional collateral required due to changes in derivative values may be delivered by the Fund or the counterparty the next business day, or within a few business days. Collateral pledged and/or received by the Fund for OTC derivatives, if any, is held in segregated accounts with the Fund’s custodian/counterparty broker and can be in the form of cash and/or securities. Unrestricted cash may be invested according to the Fund’s investment objectives. To the extent that the amounts due to the Fund from its counterparties are not subject to collateralization or are not fully collateralized, the Fund bears the risk of loss from counterparty non-performance.
At June 30, 2018, the Fund received $57,480,916 in U.K. Treasury Bonds and U.S. Treasury Bills, Bonds and Notes as collateral for derivatives.
The Fund entered into exchange traded futures contracts primarily to manage exposure to certain foreign currencies. A futures contract is an agreement between the Fund and a counterparty to buy or sell an asset at a specified price on a future date. Required initial margins are pledged by the Fund, and the daily change in fair value is accounted for as a variation margin payable or receivable in the Statement of Assets and Liabilities.
The Fund entered into OTC forward exchange contracts primarily to manage exposure to certain foreign currencies. A forward exchange contract is an agreement between the Fund and a counterparty to buy or sell a foreign currency at a specific exchange rate on a future date.
See Note 10 regarding other derivative information.
d. Securities Sold Short
The Fund is engaged in selling securities short, which obligates the Fund to replace a borrowed security with the same security at current fair value. The Fund incurs a loss if the price of the security increases between the date of the short sale and the date on which the Fund replaces the borrowed security. The Fund realizes a gain if the price of the security declines between those dates. Gains are limited to the price at which the Fund sold the security short, while losses are potentially unlimited in size.
The Fund is required to establish a margin account with the broker lending the security sold short. While the short sale is outstanding, the broker retains the proceeds of the short sale to the extent necessary to meet margin requirements until the short position is closed out. A deposit must also be maintained with the Fund’s custodian/counterparty broker consisting of cash and/or securities having a value equal to a specified percentage of the value of the securities sold short. The Fund is obligated to pay fees for borrowing the securities sold short and is required to pay the counterparty any dividends and/or interest due on securities sold short. Such dividends and/or interest and any security borrowing fees are recorded as an expense to the Fund.
e. Senior Floating Rate Interests
The Fund invests in senior secured corporate loans that pay interest at rates which are periodically reset by reference to a base lending rate plus a spread. These base lending rates are
| franklintempleton.com | Semiannual Report | 31 |
FRANKLIN MUTUAL SHARES FUND
NOTES TO FINANCIAL STATEMENTS (UNAUDITED)
1. Organization and Significant Accounting Policies (continued)
e. Senior Floating Rate Interests (continued)
generally the prime rate offered by a designated U.S. bank or the London InterBank Offered Rate (LIBOR). Senior secured corporate loans often require prepayment of principal from excess cash flows or at the discretion of the borrower. As a result, actual maturity may be substantially less than the stated maturity. Senior secured corporate loans in which the Fund invests are generally readily marketable, but may be subject to certain restrictions on resale.
f. Income and Deferred Taxes
It is the Fund’s policy to qualify as a regulated investment company under the Internal Revenue Code. The Fund intends to distribute to shareholders substantially all of its taxable income and net realized gains to relieve it from federal income and excise taxes. As a result, no provision for U.S. federal income taxes is required.
The Fund may be subject to foreign taxation related to income received, capital gains on the sale of securities and certain foreign currency transactions in the foreign jurisdictions in which it invests. Foreign taxes, if any, are recorded based on the tax regulations and rates that exist in the foreign markets in which the Fund invests. When a capital gain tax is determined to apply, the Fund records an estimated deferred tax liability in an amount that would be payable if the securities were disposed of on the valuation date.
As a result of several court cases, in certain countries across the European Union, the Fund filed additional tax reclaims for previously withheld taxes on dividends earned in those countries (EU reclaims). These additional filings are subject to various administrative proceedings by the local jurisdictions’ tax authorities within the European Union, as well as a number of related judicial proceedings. Income recognized, if any, for EU reclaims is reflected as other income in the Statement of Operations and any related receivable, if any, is reflected as European Union tax reclaims in the Statement of Assets and Liabilities. When uncertainty exists as to the ultimate resolution of these proceedings, the likelihood of receipt of these EU reclaims, and the potential timing of payment, no amounts are reflected in the financial statements. For U.S. income tax
purposes, EU reclaims received by the Fund, if any, reduce the amounts of foreign taxes Fund shareholders can use as tax credits in their individual income tax returns.
The Fund may recognize an income tax liability related to its uncertain tax positions under U.S. GAAP when the uncertain tax position has a less than 50% probability that it will be sustained upon examination by the tax authorities based on its technical merits. As of June 30, 2018, the Fund has determined that no tax liability is required in its financial statements related to uncertain tax positions for any open tax years (or expected to be taken in future tax years). Open tax years are those that remain subject to examination and are based on the statute of limitations in each jurisdiction in which the Fund invests.
g. Security Transactions, Investment Income, Expenses and Distributions
Security transactions are accounted for on trade date. Realized gains and losses on security transactions are determined on a specific identification basis. Interest income and estimated expenses are accrued daily. Amortization of premium and accretion of discount on debt securities are included in interest income. Dividend income and dividends declared on securities sold short are recorded on the ex-dividend date except for certain dividends from securities where the dividend rate is not available. In such cases, the dividend is recorded as soon as the information is received by the Fund. Distributions to shareholders are recorded on the ex-dividend date. Distributable earnings are determined according to income tax regulations (tax basis) and may differ from earnings recorded in accordance with U.S. GAAP. These differences may be permanent or temporary. Permanent differences are reclassified among capital accounts to reflect their tax character. These reclassifications have no impact on net assets or the results of operations. Temporary differences are not reclassified, as they may reverse in subsequent periods.
Common expenses incurred by the Trust are allocated among the Funds based on the ratio of net assets of each Fund to the combined net assets of the Trust or based on the ratio of number of shareholders of each Fund to the combined number of shareholders of the Trust. Fund specific expenses are charged directly to the Fund that incurred the expense.
| 32 | Semiannual Report | franklintempleton.com |
FRANKLIN MUTUAL SHARES FUND
NOTES TO FINANCIAL STATEMENTS (UNAUDITED)
Realized and unrealized gains and losses and net investment income, excluding class specific expenses, are allocated daily to each class of shares based upon the relative proportion of net assets of each class. Differences in per share distributions by class are generally due to differences in class specific expenses.
h. Accounting Estimates
The preparation of financial statements in accordance with U.S. GAAP requires management to make estimates and assumptions that affect the reported amounts of assets and liabilities at the date of the financial statements and the amounts of income and expenses during the reporting period. Actual results could differ from those estimates.
i. Guarantees and Indemnifications
Under the Trust’s organizational documents, its officers and trustees are indemnified by the Trust against certain liabilities arising out of the performance of their duties to the Trust. Additionally, in the normal course of business, the Trust, on behalf of the Fund, enters into contracts with service providers that contain general indemnification clauses. The Trust’s maximum exposure under these arrangements is unknown as this would involve future claims that may be made against the Trust that have not yet occurred. Currently, the Trust expects the risk of loss to be remote.
2. Shares of Beneficial Interest
At June 30, 2018, there were an unlimited number of shares authorized (without par value). Transactions in the Fund’s shares were as follows:
Six Months Ended June 30, 2018 | Year Ended December 31, 2017 | |||||||||||||||
| Shares | Amount | Shares | Amount | |||||||||||||
| Class Z Shares: | ||||||||||||||||
Shares sold | 3,986,348 | $ | 114,396,530 | 23,691,795 | $ | 696,267,462 | ||||||||||
Shares issued in reinvestment of distributions | — | — | 13,747,109 | 395,547,594 | ||||||||||||
Shares redeemed | (13,191,719 | ) | (379,080,484 | ) | (92,023,346 | ) | (2,710,731,683) | |||||||||
Net increase (decrease) | (9,205,371 | ) | $ | (264,683,954 | ) | (54,584,442 | ) | $ | (1,618,916,627) | |||||||
| Class A Shares: | ||||||||||||||||
Shares sold | 4,333,347 | $ | 122,857,607 | 17,964,808 | $ | 522,017,079 | ||||||||||
Shares issued in reinvestment of distributions | — | — | 9,145,140 | 260,399,623 | ||||||||||||
Shares redeemed | (14,338,995 | ) | (407,498,754 | ) | (41,761,357 | ) | (1,214,079,098) | |||||||||
Net increase (decrease) | (10,005,648 | ) | $ | (284,641,147 | ) | (14,651,409 | ) | $ | (431,662,396) | |||||||
| Class C Shares: | ||||||||||||||||
Shares sold | 936,208 | $ | 26,345,999 | 2,533,117 | $ | 72,481,356 | ||||||||||
Shares issued in reinvestment of distributions | — | — | 2,024,489 | 56,971,259 | ||||||||||||
Shares redeemed | (4,641,881 | ) | (129,990,949 | ) | (9,333,970 | ) | (268,124,028) | |||||||||
Net increase (decrease) | (3,705,673 | ) | $ | (103,644,950 | ) | (4,776,364 | ) | $ | (138,671,413) | |||||||
| Class R Shares: | ||||||||||||||||
Shares sold | 222,964 | $ | 6,284,052 | 622,054 | $ | 17,981,440 | ||||||||||
Shares issued in reinvestment of distributions | — | — | 239,266 | 6,777,153 | ||||||||||||
Shares redeemed | (568,447 | ) | (16,060,913 | ) | (1,464,599 | ) | (42,299,057) | |||||||||
Net increase (decrease) | (345,483 | ) | $ | (9,776,861 | ) | (603,279 | ) | $ | (17,540,464) | |||||||
| Class R6 Shares: | ||||||||||||||||
Shares sold | 8,166,391 | $ | 233,888,049 | 63,378,950 | $ | 1,870,087,713 | ||||||||||
Shares issued in reinvestment of distributions | — | — | 7,729,991 | 221,874,105 | ||||||||||||
Shares redeemed | (10,192,481 | ) | (292,758,292 | ) | (7,551,970 | ) | (222,835,095) | |||||||||
Net increase (decrease) | (2,026,090 | ) | $ | (58,870,243 | ) | 63,556,971 | $ | 1,869,126,723 | ||||||||
| franklintempleton.com | Semiannual Report | 33 |
FRANKLIN MUTUAL SHARES FUND
NOTES TO FINANCIAL STATEMENTS (UNAUDITED)
3. Transactions with Affiliates
Franklin Resources, Inc. is the holding company for various subsidiaries that together are referred to as Franklin Templeton Investments. Certain officers and trustees of the Fund are also officers and/or directors of the following subsidiaries:
| Subsidiary | Affiliation | |
Franklin Mutual Advisers, LLC (Franklin Mutual) | Investment manager | |
Franklin Templeton Services, LLC (FT Services) | Administrative manager | |
Franklin Templeton Distributors, Inc. (Distributors) | Principal underwriter | |
Franklin Templeton Investor Services, LLC (Investor Services) | Transfer agent |
a. Management Fees
The Fund pays an investment management fee to Franklin Mutual based on the average daily net assets of the Fund as follows:
| Annualized Fee Rate | Net Assets | |
0.675% | Up to and including $5 billion | |
0.645% | Over $5 billion, up to and including $10 billion | |
0.625% | Over $10 billion, up to and including $15 billion | |
0.595% | Over $15 billion, up to and including $20 billion | |
0.585% | Over $20 billion, up to and including $25 billion | |
0.565% | Over $25 billion, up to and including $30 billion | |
0.555% | Over $30 billion, up to and including $35 billion | |
0.545% | In excess of $35 billion |
For the period ended June 30, 2018, the annualized gross effective investment management fee rate was 0.648% of the Fund’s average daily net assets.
b. Administrative Fees
Under an agreement with Franklin Mutual, FT Services provides administrative services to the Fund. The fee is paid by Franklin Mutual based on the Fund’s average daily net assets, and is not an additional expense of the Fund.
c. Distribution Fees
The Board has adopted distribution plans for each share class, with the exception of Class Z and Class R6 shares, pursuant to Rule 12b-1 under the 1940 Act. Under the Fund’s Class A reimbursement distribution plan, the Fund reimburses Distributors for costs incurred in connection with the servicing, sale and distribution of the Fund’s shares up to the maximum annual plan rate. Under the Class A reimbursement distribution plan, costs exceeding the maximum for the current plan year cannot be reimbursed in subsequent periods. In addition, under the Fund’s Class C and R compensation distribution plans, the Fund pays Distributors for costs incurred in connection with the servicing, sale and distribution of the Fund’s shares up to the maximum annual plan rate for each class. The plan year, for purposes of monitoring compliance with the maximum annual plan rates, is February 1 through January 31.
The maximum annual plan rates, based on the average daily net assets, for each class, are as follows:
Class A | 0.35% | |||
Class C | 1.00% | |||
Class R | 0.50% |
The Board has set the current rate at 0.25% per year for Class A shares until further notice and approval by the Board.
| 34 | Semiannual Report | franklintempleton.com |
FRANKLIN MUTUAL SHARES FUND
NOTES TO FINANCIAL STATEMENTS (UNAUDITED)
d. Sales Charges/Underwriting Agreements
Front-end sales charges and contingent deferred sales charges (CDSC) do not represent expenses of the Fund. These charges are deducted from the proceeds of sales of Fund shares prior to investment or from redemption proceeds prior to remittance, as applicable. Distributors has advised the Fund of the following commission transactions related to the sales and redemptions of the Fund’s shares for the period:
Sales charges retained net of commissions paid to unaffiliated brokers/dealers | $ | 188,159 | ||
CDSC retained | $ | 15,003 |
e. Transfer Agent Fees
Each class of shares pays transfer agent fees to Investor Services for its performance of shareholder servicing obligations. Effective November 1, 2017, the fees are based on an annualized asset based fee of 0.02% plus a transaction based fee. Prior to November 1, 2017, the fees were account based fees that varied based on fund or account type. In addition, each class reimburses Investor Services for out of pocket expenses incurred and, except for Class R6 reimburses shareholder servicing fees paid to third parties. These fees are allocated daily based upon their relative proportion of such classes’ aggregate net assets. Class R6 pays Investor Services transfer agent fees specific to that class.
For the period ended June 30, 2018, the Fund paid transfer agent fees of $6,373,906, of which $2,867,866 was retained by Investor Services.
f. Waiver and Expense Reimbursements
Investor Services has voluntarily agreed in advance to waive or limit its fees so that the Class R6 transfer agent fees do not exceed 0.02% based on the average net assets of the class. Investor Services may discontinue this waiver in the future.
g. Other Affiliated Transactions
At June 30, 2018, one or more of the funds in Franklin Fund Allocator Series owned 11.3% of the Fund’s outstanding shares.
4. Expense Offset Arrangement
The Fund has entered into an arrangement with its custodian whereby credits realized as a result of uninvested cash balances are used to reduce a portion of the Fund’s custodian expenses. During the period ended June 30, 2018, the custodian fees were reduced as noted in the Statement of Operations.
5. Independent Trustees’ Retirement Plan
On January 1, 1993, the Trust adopted an Independent Trustees’ Retirement Plan (Plan). The Plan is an unfunded defined benefit plan that provides benefit payments to Trustees whose length of service and retirement age meets the eligibility requirements of the Plan. Benefits under the Plan are based on years of service and fees paid to each trustee at the time of retirement. Effective in December 1996, the Plan was closed to new participants.
During the period ended June 30, 2018, the Fund’s projected benefit obligation and benefit payments under the Plan were as follows:
aProjected benefit obligation at June 30, 2018 | $ | 737,644 | ||
bIncrease in projected benefit obligation | $ | 6,039 |
| franklintempleton.com | Semiannual Report | 35 |
FRANKLIN MUTUAL SHARES FUND
NOTES TO FINANCIAL STATEMENTS (UNAUDITED)
5. Independent Trustees’ Retirement Plan (continued)
Benefit payments made to retired trustees | $ | (7,765 | ) |
aThe projected benefit obligation is included in trustees’ fees and expenses in the Statement of Assets and Liabilities.
bThe increase in projected benefit obligation is included in trustees’ fees and expenses in the Statement of Operations.
6. Income Taxes
For tax purposes, the Fund may elect to defer any portion of a post-October capital loss to the first day of the following fiscal year. At December 31, 2017, the Fund deferred post-October capital losses of $26,175,568.
At June 30, 2018, the cost of investments and net unrealized appreciation (depreciation) for income tax purposes were as follows:
Cost of investments | $ | 11,692,947,700 | ||
|
| |||
Unrealized appreciation | $ | 3,911,433,027 | ||
Unrealized depreciation | (1,098,038,213 | ) | ||
|
| |||
Net unrealized appreciation (depreciation) | $ | 2,813,394,814 | ||
|
|
Differences between income and/or capital gains as determined on a book basis and a tax basis are primarily due to differing treatments of defaulted securities and foreign currency transactions.
7. Investment Transactions
Purchases and sales of investments (excluding short term securities and securities sold short) for the period ended June 30, 2018, aggregated $1,181,449,938 and $2,011,726,994, respectively.
8. Credit Risk and Defaulted Securities
The Fund may purchase the pre-default or defaulted debt of distressed companies. Distressed companies are financially troubled and could be or are already involved in financial restructuring or bankruptcy. Risks associated with purchasing these securities include the possibility that the bankruptcy or other restructuring process takes longer than expected, or that distributions in restructuring are less than anticipated, either or both of which may result in unfavorable consequences to the Fund. If it becomes probable that the income on debt securities, including those of distressed companies, will not be collected, the Fund discontinues accruing income and recognizes an adjustment for uncollectible interest.
At June 30, 2018, the aggregate long value of distressed company securities for which interest recognition has been discontinued was $191,487,132, representing 1.3% of the Fund’s net assets. For information as to specific securities, see the accompanying Statement of Investments.
9. Restricted Securities
The Fund invests in securities that are restricted under the Securities Act of 1933 (1933 Act). Restricted securities are often purchased in private placement transactions, and cannot be sold without prior registration unless the sale is pursuant to an exemption under the 1933 Act. Disposal of these securities may require greater effort and expense, and prompt sale at an acceptable price may be difficult. The Fund may have registration rights for restricted securities. The issuer generally incurs all registration costs.
| 36 | Semiannual Report | franklintempleton.com |
FRANKLIN MUTUAL SHARES FUND
NOTES TO FINANCIAL STATEMENTS (UNAUDITED)
At June 30, 2018, investments in restricted securities, excluding securities exempt from registration under the 1933 Act deemed to be liquid, were as follows:
| Principal Amount/ Shares | Issuer | Acquisition Date | Cost | Value | ||||||||||
19,594 | Broadband Ventures III LLC, secured promissory note, 5.00%, 2/01/12 | 7/01/10 - 11/30/12 | $ | 19,594 | $ | — | ||||||||
7,234,813 | International Automotive Components Group Brazil LLC | 4/13/06 - 12/26/08 | 4,804,678 | 164,505 | ||||||||||
63,079,866 | International Automotive Components Group North America LLC | 1/12/06 - 3/18/13 | 51,662,536 | 18,885,418 | ||||||||||
|
| |||||||||||||
Total Restricted Securities (Value is 0.1% of Net Assets) | $ | 56,486,808 | $ | 19,049,923 | ||||||||||
|
| |||||||||||||
10. Other Derivative Information
At June 30, 2018, the Fund’s investments in derivative contracts are reflected in the Statement of Assets and Liabilities as follows:
| Asset Derivatives | Liability Derivatives | |||||||||||||||
Derivative Contracts Not Accounted for as Hedging Instruments | Statement of Assets and Liabilities Location | Fair Value | Statement of Assets and Liabilities Location | Fair Value | ||||||||||||
Foreign exchange contracts | Variation margin on futures contracts | $ | 7,204,365 | a | Variation margin on futures contracts | $ | — | |||||||||
Unrealized appreciation on OTC forward exchange contracts | 50,550,813 | Unrealized depreciation on OTC forward exchange contracts | 994,477 | |||||||||||||
|
|
|
| |||||||||||||
Totals | $ | 57,755,178 | $ | 994,477 | ||||||||||||
|
|
|
| |||||||||||||
aThis amount reflects the cumulative appreciation (depreciation) of futures contracts as reported in the Statement of Investments. Only the variation margin receivable/ payable at period end is separately reported within the Statement of Assets and Liabilities. Prior variation margin movements were recorded to cash upon receipt or payment.
For the period ended June 30, 2018, the effect of derivative contracts in the Fund’s Statement of Operations was as follows:
Derivative Contracts Not Accounted for as Hedging Instruments | Statement of Operations Location | Net Realized Gain (Loss) for the Period | Statement of Operations Location | Net Change in Unrealized Appreciation (Depreciation) for the Period | ||||||||
| Net realized gain (loss) from: | Net change in unrealized appreciation (depreciation) on: | |||||||||||
Foreign exchange contracts | Forward exchange contracts | $(40,714,886) | Forward exchange contracts | $81,695,737 | ||||||||
| Futures contracts | 6,626,833 | Futures contracts | 13,707,824 | |||||||||
|
|
|
| |||||||||
Totals | $(34,088,053) | $95,403,561 | ||||||||||
|
|
|
| |||||||||
For the period ended June 30, 2018, the average month end notional amount of futures contracts represented $567,016,901. The average month end contract value of forward exchange contracts was $1,250,773,360.
See Note 1(c) regarding derivative financial instruments.
| franklintempleton.com | Semiannual Report | 37 |
FRANKLIN MUTUAL SHARES FUND
NOTES TO FINANCIAL STATEMENTS (UNAUDITED)
11. Holdings of 5% Voting Securities of Portfolio Companies
The 1940 Act defines “affiliated companies” to include investments in portfolio companies in which a fund owns 5% or more of the outstanding voting securities. During the period ended June 30, 2018, investments in “affiliated companies” were as follows:
| Name of Issuer | Number of Shares Held at Beginning of Period | Gross Additions | Gross Reductions | Number of Shares Held at End of Period | Value at End | Dividend Income | Realized Gain (Loss) | Net Change in Unrealized Appreciation (Depreciation) | ||||||||||||||||||||||||
| Controlled Affiliatesa | ||||||||||||||||||||||||||||||||
CB FIM Coinvestors LLC | 43,105,703 | — | (43,105,703 | )b | — | $ | — | $ | — | $ | 27,760 | $ | — | |||||||||||||||||||
|
| |||||||||||||||||||||||||||||||
Non-Controlled Affiliates | ||||||||||||||||||||||||||||||||
Alexander’s Inc. | 326,675 | — | — | 326,675 | $ | 124,995,655 | $ | 2,940,075 | $ | 30,054 | c | $ | (4,318,644 | ) | ||||||||||||||||||
International Automotive Components Group Brazil LLC | 7,234,813 | — | — | 7,234,813 | 164,505 | — | — | (83,541 | ) | |||||||||||||||||||||||
International Automotive Components Group North America LLC | 63,079,866 | — | — | 63,079,866 | 18,885,418 | — | — | (22,670,020 | ) | |||||||||||||||||||||||
|
| |||||||||||||||||||||||||||||||
Total Non-Controlled Affiliates | $ | 144,045,578 | $ | 2,940,075 | $ | 30,054 | $ | (27,072,205 | ) | |||||||||||||||||||||||
|
| |||||||||||||||||||||||||||||||
Total Affiliated Securities (Value is 1.0% of Net Assets) |
| $ | 144,045,578 | $ | 2,940,075 | $ | 57,814 | $ | (27,072,205 | ) | ||||||||||||||||||||||
|
| |||||||||||||||||||||||||||||||
aIssuer in which the Fund owns 25% or more of the outstanding voting securities.
bGross reduction was the result of a corporate action.
cRealized gain distribution from REITs.
12. Credit Facility
The Fund, together with other U.S. registered and foreign investment funds (collectively, Borrowers), managed by Franklin Templeton Investments, are borrowers in a joint syndicated senior unsecured credit facility totaling $2 billion (Global Credit Facility) which matures on February 8, 2019. This Global Credit Facility provides a source of funds to the Borrowers for temporary and emergency purposes, including the ability to meet future unanticipated or unusually large redemption requests.
Under the terms of the Global Credit Facility, the Fund shall, in addition to interest charged on any borrowings made by the Fund and other costs incurred by the Fund, pay its share of fees and expenses incurred in connection with the implementation and maintenance of the Global Credit Facility, based upon its relative share of the aggregate net assets of all of the Borrowers, including an annual commitment fee of 0.15% based upon the unused portion of the Global Credit Facility. These fees are reflected in other expenses in the Statement of Operations. During the period ended June 30, 2018, the Fund did not use the Global Credit Facility.
13. Fair Value Measurements
The Fund follows a fair value hierarchy that distinguishes between market data obtained from independent sources (observable inputs) and the Fund’s own market assumptions (unobservable inputs). These inputs are used in determining the value of the Fund’s financial instruments and are summarized in the following fair value hierarchy:
| • | Level 1 – quoted prices in active markets for identical financial instruments |
| • | Level 2 – other significant observable inputs (including quoted prices for similar financial instruments, interest rates, prepayment speed, credit risk, etc.) |
| • | Level 3 – significant unobservable inputs (including the Fund’s own assumptions in determining the fair value of financial instruments) |
The input levels are not necessarily an indication of the risk or liquidity associated with financial instruments at that level.
| 38 | Semiannual Report | franklintempleton.com |
FRANKLIN MUTUAL SHARES FUND
NOTES TO FINANCIAL STATEMENTS (UNAUDITED)
For movements between the levels within the fair value hierarchy, the Fund has adopted a policy of recognizing the transfers as of the date of the underlying event which caused the movement.
A summary of inputs used as of June 30, 2018, in valuing the Fund’s assets and liabilities carried at fair value, is as follows:
| Level 1 | Level 2 | Level 3 | Total | |||||||||||||
Assets: | ||||||||||||||||
Investments in Securities:a | ||||||||||||||||
Equity Investments:b | ||||||||||||||||
Auto Components | $ | 55,483,162 | $ | — | $ | 19,049,923 | $ | 74,533,085 | ||||||||
Machinery | 46,242,961 | 56,288,789 | — | 102,531,750 | ||||||||||||
Media | 1,060,537,948 | 6,254,719 | — | 1,066,792,667 | ||||||||||||
Software | 750,915,845 | 1,279,927 | — | 752,195,772 | ||||||||||||
All Other Equity Investments | 10,977,159,848 | — | — | c | 10,977,159,848 | |||||||||||
Corporate Notes and Senior Floating Rate Interests | — | 263,971,199 | — | 263,971,199 | ||||||||||||
Corporate Notes and Senior Floating Rate Interests in Reorganization | — | 191,487,132 | — | c | 191,487,132 | |||||||||||
Companies in Liquidation | — | 5,582,231 | — | c | 5,582,231 | |||||||||||
Short Term Investments | 855,270,463 | 239,700,000 | — | 1,094,970,463 | ||||||||||||
|
| |||||||||||||||
Total Investments in Securities | $ | 13,745,610,227 | $ | 764,563,997 | $ | 19,049,923 | $ | 14,529,224,147 | ||||||||
|
| |||||||||||||||
Other Financial Instruments: | ||||||||||||||||
Futures Contracts | $ | 7,204,365 | $ | — | $ | — | $ | 7,204,365 | ||||||||
Forward Exchange Contracts | — | 50,550,813 | — | 50,550,813 | ||||||||||||
|
| |||||||||||||||
Total Other Financial Instruments | $ | 7,204,365 | $ | 50,550,813 | $ | — | $ | 57,755,178 | ||||||||
|
| |||||||||||||||
Liabilities: | ||||||||||||||||
Other Financial Instruments: | ||||||||||||||||
Securities Sold Shorta | $ | 79,661,387 | $ | — | $ | — | $ | 79,661,387 | ||||||||
Forward Exchange Contracts | — | 994,477 | — | 994,477 | ||||||||||||
|
| |||||||||||||||
Total Other Financial Instruments | $ | 79,661,387 | $ | 994,477 | $ | — | $ | 80,655,864 | ||||||||
|
| |||||||||||||||
aFor detailed categories, see the accompanying Statement of Investments.
bIncludes common stocks and management investment companies as well as other equity investments.
cIncludes securities determined to have no value at June 30, 2018.
A reconciliation of assets in which Level 3 inputs are used in determining fair value is presented when there are significant Level 3 financial instruments at the beginning and/or end of the period.
14. Subsequent Events
The Fund has evaluated subsequent events through the issuance of the financial statements and determined that no events have occurred that require disclosure, except for the following:
On February 27, 2018, the Board approved an automatic conversion feature for Class C that will convert shareholders’ Class C shares into Class A shares after they have been held for 10 years. The conversion feature will become effective on a future date prior to the calendar year end of 2018. Further details are disclosed in the Fund’s Prospectus.
On May 17, 2018, the Board approved changes to certain front-end sales charges and dealer commissions on Class A shares. The changes will become effective on or about September 10, 2018. Further details are disclosed in the Fund’s Prospectus.
| franklintempleton.com | Semiannual Report | 39 |
FRANKLIN MUTUAL SHARES FUND
NOTES TO FINANCIAL STATEMENTS (UNAUDITED)
Abbreviations | ||||||||||||
| Counterparty | Currency | Selected Portfolio | ||||||||||
BOFA | Bank of America Corp. | EUR | Euro | ADR | American Depositary Receipt | |||||||
BONY | The Bank of New York Mellon Corp. | GBP | British Pound | DIP | Debtor-In-Possession | |||||||
HSBK | HSBC Bank PLC | USD | United States Dollar | FHLB | Federal Home Loan Bank | |||||||
SSBT | State Street Bank and Trust Co., N.A. | LIBOR | London InterBank Offered Rate | |||||||||
UBSW | UBS AG | TRA | Tax Receivable Agreement Right | |||||||||
| 40 | Semiannual Report | franklintempleton.com |
FRANKLIN MUTUAL SERIES FUNDS
FRANKLIN MUTUAL SHARES FUND
Shareholder Information
Board Approval of Investment Management Agreements
FRANKLIN MUTUAL SERIES FUNDS
Franklin Mutual Shares Fund
(Fund)
The Board of Trustees (Board), including a majority of trustees that are not “interested persons” as such term is defined in section 2(a)(19) of the Investment Company Act of 1940 (hereinafter referred to as “independent trustees”), at an in-person meeting held on May 17, 2018, unanimously approved the renewal of the Fund’s investment management agreement. Prior to a meeting of all of the trustees for the purpose of considering such renewal, the independent trustees participated in two other meetings held in connection with the renewal process. Throughout the process, the independent trustees received assistance and advice from and met separately with independent counsel. The independent trustees met with and interviewed officers of the investment manager (including portfolio managers), the transfer agent and shareholder services group and the distributor. In approving the renewal of the investment management agreement for the Fund, the Board, including the independent trustees, determined that the investment management fee structure was fair and reasonable and that continuance of the agreement was in the best interests of the Fund and its shareholders.
In reaching their decision on the investment management agreement, the trustees took into account information furnished throughout the year at regular Board meetings, as well as information specifically requested and furnished for the renewal process, which culminated in the meetings referred to above for the specific purpose of considering such agreement. Information furnished throughout the year included, among others, reports on the Fund’s investment performance, expenses, portfolio composition, portfolio brokerage execution, client commission arrangements, derivatives, securities lending, asset segregation, portfolio turnover, Rule 12b-1 plan, distribution, shareholder servicing, legal and compliance matters, pricing of securities, sales and redemptions, and marketing support payments made to financial intermediaries, as well as a third-party survey of transfer agent fees charged to funds within the Franklin Templeton Investments (FTI) complex in comparison with those charged to other fund complexes deemed comparable. Also, related financial statements and other information about the scope and quality of services provided by the investment manager and its affiliates and enhancements to such services over the past year were
provided. In addition, the trustees received periodic reports throughout the year and during the renewal process relating to compliance with the Fund’s investment policies and restrictions. During the renewal process, the independent trustees considered the investment manager’s methods of operation within the Franklin Templeton group and its activities on behalf of other clients. The Board also noted that it received an annual report on all payments made by FTI or the Fund to financial intermediaries engaged in the sale of Fund shares, as well as a memorandum relating to third-party servicing arrangements in response to a Guidance Update from the U.S. Securities and Exchange Commission (SEC) relating to mutual fund distribution and sub-accounting fees.
The information obtained by the trustees during the renewal process also included a special report prepared by Broadridge Financial Solutions, Inc., an independent third-party analyst that utilizes data from Lipper, Inc. (“Lipper”), comparing the Fund’s investment performance and expenses with those of other mutual funds deemed comparable to the Fund as selected by Lipper (Broadridge Section 15(c) Report). The trustees reviewed the Broadridge Section 15(c) Report and its usefulness in the renewal process with respect to matters such as comparative fees, expenses, expense ratios, performance and volatility. They concluded that the report continues to be a reliable resource in the performance of their duties.
In addition, the trustees received a Profitability Study (Profitability Study) prepared by management discussing the profitability to FTI from its overall U.S. fund operations, as well as on an individual fund-by-fund basis. Over the past year, the Board and counsel to the independent trustees continued to receive reports on management’s handling of recent regulatory inquiries and pending legal actions against the investment manager and its affiliates. The independent trustees were satisfied with the actions taken to date by management in response to such regulatory and legal matters.
The trustees reviewed the personnel, operations, financial condition, and investment management capabilities, methodologies and resources of the investment manager. As part of this review, particular attention was given to management’s diligent risk management program, including continual monitoring and management of cybersecurity, liquidity and counterparty credit risk, and attention given to derivatives and other complex instruments that are held and expected to be held by the Fund and how such instruments are used to carry out the Fund’s investment goal(s). The Board also took into account, among other things, management’s efforts in
| franklintempleton.com | Semiannual Report | 41 |
FRANKLIN MUTUAL SERIES FUNDS
FRANKLIN MUTUAL SHARES FUND
SHAREHOLDER INFORMATION
establishing a global credit facility for the benefit of the Fund and other accounts managed by FTI to provide a source of cash for temporary and emergency purposes or to meet unusual redemption requests as well as the strong financial position of the investment manager’s parent company and its commitment to the mutual fund business. The Board noted management’s continuing efforts and expenditures in establishing effective business continuity plans and developing strategies to address areas of heightened concern in the mutual fund industry, such as cybersecurity and liquidity risk management. The Board also recognized management’s commitment to facilitating Board oversight of particular areas, including derivatives and payments to intermediaries, by enhanced reporting.
In addition to the above and other matters considered by the trustees throughout the course of the year, the following discussion relates to certain primary factors relevant to the Board’s decision. This discussion of the information and factors considered by the Board (including the information and factors discussed above) is not intended to be exhaustive, but rather summarizes certain factors considered by the Board. In view of the wide variety of factors considered, the Board did not, unless otherwise noted, find it practicable to quantify or otherwise assign relative weights to the foregoing factors. In addition, individual trustees may have assigned different weights to various factors.
NATURE, EXTENT AND QUALITY OF SERVICES. The trustees reviewed the nature, extent and quality of the services provided, and to be provided, by the investment manager. The trustees cited the investment manager’s ability to implement the Fund’s disciplined value investment approach and its long-term relationship with the Fund as reasons that shareholders choose to invest, and remain invested, in the Fund. The trustees reviewed the Fund���s portfolio management team, including its performance, staffing, skills and compensation program. With respect to portfolio manager compensation, management assured the trustees that the Fund’s long-term performance is a significant component of incentive-based compensation and noted that a portion of a portfolio manager’s incentive-based compensation is paid in shares of pre-designated funds from the portfolio manager’s fund management area. The trustees noted that the portfolio manager compensation program aligned the interests of the portfolio managers with that of shareholders of the Fund. The trustees discussed with management various other products, portfolios and entities that are advised by the investment manager and the allocation of assets and expenses among and within them, as well as their relative fees and reasons for differences with respect thereto and any potential
conflicts. During regular Board meetings and the aforementioned meetings of the independent trustees, the trustees received reports and presentations on the investment manager’s best execution trading policies. The trustees considered periodic reports provided to them showing that the investment manager complied with the investment policies and restrictions of the Fund as well as other reports periodically furnished to the Board covering matters such as the compliance of portfolio managers and other management personnel with the code of ethics covering the investment management personnel, the adherence to fair value pricing procedures established by the Board and the accuracy of net asset value calculations. The Board noted the extent of the benefits provided to Fund shareholders from being part of the Franklin Templeton group of funds, including the right to exchange investments between funds (same class) without a sales charge, the ability to reinvest Fund dividends into other funds and the right to combine holdings of other funds to obtain reduced sales charges. The Board considered the investment manager’s significant efforts in developing and implementing compliance procedures established in accordance with SEC and other requirements.
The Board considered the nature, extent and quality of the services to be provided under the Fund’s other service agreements to determine that, on an overall basis, Fund shareholders were well served. In this connection, the Board also took into account transfer agent and shareholder services provided to Fund shareholders by an affiliate of the investment manager, noting continuing expenditures by management to increase and improve the scope of such services and favorable periodic reports on shareholder services conducted by independent third parties. While such considerations directly affected the trustees’ decision in renewing the Fund’s transfer agent and shareholder services agreement, the Board also considered these commitments as incidental benefits to Fund shareholders deriving from the investment management relationship.
Based on their review, the trustees were satisfied with the nature and quality of the overall services provided, and to be provided, by the investment manager and its affiliates to the Fund and its shareholders and were confident in the abilities of the management team to continue the disciplined value investment approach of the Fund and to provide quality services to the Fund and its shareholders.
INVESTMENT PERFORMANCE. The trustees reviewed and placed significant emphasis on the investment performance of the Fund over the one-, three-, five- and 10-year periods
| 42 | Semiannual Report | franklintempleton.com |
FRANKLIN MUTUAL SERIES FUNDS
FRANKLIN MUTUAL SHARES FUND
SHAREHOLDER INFORMATION
ended December 31, 2017. They considered the history of successful performance of the Fund relative to various benchmarks. As part of their review, they inquired of management regarding benchmarks, style drift and restrictions on permitted investments. Consideration was also given to performance in the context of available levels of cash during the periods.
The trustees had meetings during the year, including the meetings referred to above held in connection with the renewal process, with the Fund’s portfolio managers to discuss performance and the management of the Fund. In addition to the materials provided by management in connection with the renewal process, the independent trustees requested supplemental information and additional presentations from the investment manager and senior management of FTI regarding the performance of the investment manager and the Fund. As part of these presentations, it was noted that senior management of FTI is conducting a review of the investment manager and the Fund and will report the results thereof to the independent trustees when completed. In addition, particular attention in assessing performance was given to the Broadridge Section 15(c) Report. That report showed the investment performance of the Fund (Class A shares) in comparison to other funds determined comparable by Lipper.
The comparable funds to the Fund, as chosen by Lipper, included all retail and institutional multi-cap value funds. The Fund had total returns in the lowest performing quintile for the one-year period ended December 31, 2017, and had annualized total returns for the three- and five-year periods in the lowest performing quintile. The trustees noted that the Fund’s total return on an annualized basis for the 10-year period ended December 31, 2017 was also in the lowest performing quintile. The trustees also compared Fund performance to other industry benchmarks, including measures of risk-adjusted performance of a fund, as part of their evaluation of investment performance. The trustees discussed with management the reasons for the relative underperformance for the one-, three-, five- and 10-year periods ended December 31, 2017. While disappointed with the relative underperformance of the Fund, the Board did not believe that any changes with respect to the Fund were warranted at the time. The Board noted that it would continue to monitor future performance and, when available, would evaluate the results of the review being conducted by senior management of FTI.
COMPARATIVE EXPENSES AND MANAGEMENT PROFITABILITY. The trustees considered the cost of the
services provided and to be provided and the profits realized by the investment manager and its affiliates from their respective relationships with the Fund. As part of the renewal process, the trustees explored with management the trends in expense ratios over the past three fiscal years and the reasons for any increases in the Fund’s expense ratios (or components thereof). In considering the appropriateness of the management fee and other expenses charged to the Fund, the Board took into account various factors including investment performance and matters relating to Fund operations, including, but not limited to, the quality and experience of its portfolio managers and research staff. Consideration was also given to a comparative analysis in the Broadridge Section 15(c) Report of the investment management fee and total expense ratio of the Fund in comparison with those of a group of other funds selected by Lipper as its appropriate Lipper expense group. Lipper expense data is based upon information taken from each fund’s most recent annual report, which reflects historical asset levels that may be quite different from those currently existing, particularly in a period of market volatility. While recognizing such inherent limitation and the fact that expense ratios generally increase as assets decline and decrease as assets grow, the Board believed the independent analysis conducted by Lipper to be an appropriate measure of comparative expenses.
In reviewing comparative costs, emphasis was given to the Fund’s contractual management fee in comparison with the contractual management fee that would have been charged by other funds within its Lipper expense group assuming they were similar in size to the Fund, as well as the actual total expenses of the Fund in comparison with those of its Lipper expense group. The Lipper contractual management fee analysis includes administrative charges as being part of the management fee, and total expenses, for comparative consistency, are shown by Lipper for Fund Class A shares.
The Fund’s contractual management fee rate was in the middle quintile of its Lipper expense group and its total expenses were also in the middle quintile of such group. The Board was satisfied with such comparative fees and expenses.
The trustees also reviewed the Profitability Study addressing profitability of Franklin Resources, Inc., from its overall U.S. fund business, as well as profitability to the Fund’s investment manager and its affiliates, from providing investment management and other services to the Fund during the 12-month period ended September 30, 2017, the most recent fiscal year-end of Franklin Resources, Inc. The trustees
| franklintempleton.com | Semiannual Report | 43 |
FRANKLIN MUTUAL SERIES FUNDS
FRANKLIN MUTUAL SHARES FUND
SHAREHOLDER INFORMATION
reviewed the basis on which such reports are prepared and the cost allocation methodology utilized in the Profitability Study, it being recognized that allocation methodologies may each be reasonable while producing different results. In this respect, the Board noted that the reasonableness of the cost allocation methodologies was reviewed by independent accountants on an every other year basis.
The independent trustees met with management to discuss the Profitability Study. This included, among other things, a comparison of investment management income with investment management expenses of the Fund; comparison of underwriting revenues and expenses; the relative relationship of investment management and underwriting expenses; shareholder servicing profitability; economies of scale; and the relative contribution of the Fund to the profitability of the investment manager and its parent. In discussing the Profitability Study with the Board, the investment manager stated its belief that the costs incurred in establishing the infrastructure necessary to operate the type of mutual fund operations conducted by it and its affiliates may not be fully reflected in the expenses allocated to the Fund in determining its profitability.
The Board also took into account management’s expenditures in improving shareholder services provided to the Fund, as well as the need to meet additional regulatory and compliance requirements. The trustees also considered the extent to which the investment manager may derive ancillary benefits from Fund operations, including those derived from economies of scale, discussed below, the allocation of Fund brokerage and the use of commission dollars to pay for research and other similar services.
Based upon their consideration of all these factors, the trustees determined that the level of profits realized by the investment manager and its affiliates in providing services to the Fund was not excessive in view of the nature, quality and extent of services provided.
ECONOMIES OF SCALE. The Board considered economies of scale realized by the investment manager and its affiliates as the Fund grows larger and the extent to which they are shared with Fund shareholders, as for example, in the level of the investment management fee charged, in the quality and efficiency of services rendered and in increased capital commitments benefiting the Fund directly or indirectly. While recognizing that any precise determination is inherently subjective, the trustees noted that, based upon the Profitability Study, as some funds increase in size, at some point economies of scale may result in the investment manager realizing a larger
profit margin on investment management services provided to such a fund. The trustees also noted that benefits of economies of scale will be shared with Fund shareholders due to the decline in the effective investment management fee rate as breakpoints are achieved by the Fund.
The trustees noted that breakpoints had been instituted as part of the Fund’s investment management fee and that the Board regularly evaluates whether additional breakpoints are appropriate. The trustees assessed the savings to shareholders resulting from such breakpoints and believed they were, and continue to be, appropriate and they agreed to continue to monitor the appropriateness of the breakpoints. The trustees also considered the effects an increase in assets under management would have on the investment management fee and expense ratio of the Fund. To the extent further economies of scale may be realized by the investment manager and its affiliates, the Board believed the investment management and administrative fees provide a sharing of benefits with the Fund and its shareholders.
Proxy Voting Policies and Procedures
The Fund’s investment manager has established Proxy Voting Policies and Procedures (Policies) that the Fund uses to determine how to vote proxies relating to portfolio securities. Shareholders may view the Fund’s complete Policies online at franklintempleton.com. Alternatively, shareholders may request copies of the Policies free of charge by calling the Proxy Group collect at (954) 527-7678 or by sending a written request to: Franklin Templeton Companies, LLC, 300 S.E. 2nd Street, Fort Lauderdale, FL 33301, Attention: Proxy Group. Copies of the Fund’s proxy voting records are also made available online at franklintempleton.com and posted on the US Securities and Exchange Commission’s website at sec.gov and reflect the most recent 12-month period ended June 30.
Quarterly Statement of Investments
The Trust, on behalf of the Fund, files a complete statement of investments with the US Securities and Exchange Commission for the first and third quarters for each fiscal year on Form N-Q. Shareholders may view the filed Form N-Q by visiting the Commission’s website at sec.gov. The filed form may also be viewed and copied at the Commission’s Public Reference Room in Washington, DC. Information regarding the operations of the Public Reference Room may be obtained by calling (800) SEC-0330.
| 44 | Semiannual Report | franklintempleton.com |
| Semiannual Report and Shareholder Letter Franklin Mutual Shares Fund
| |||
Investment Manager Franklin Mutual Advisers, LLC
| ||||
| Distributor | ||||
Franklin Templeton Distributors, Inc. (800) DIAL BEN® / 342-5236 franklintempleton.com
| ||||
Shareholder Services (800) 632-2301 - (Class A, C, R & R6) (800) 448-FUND - (Class Z) |
Authorized for distribution only when accompanied or preceded by a summary prospectus and/or prospectus. Investors should carefully consider a fund’s investment goals, risks, charges and expenses before investing. A prospectus contains this and other information; please read it carefully before investing.
To help ensure we provide you with quality service, all calls to and from our service areas are monitored and/or recorded.
| © 2018 Franklin Templeton Investments. All rights reserved. | 474 S 08/18 |

Franklin Templeton Investments
Why choose Franklin Templeton Investments?
Successful investing begins with ambition. And achievement only comes when you reach for it. That’s why we continually strive to deliver better outcomes for investors. No matter what your goals are, our deep, global investment expertise allows us to offer solutions that can help.
During our more than 70 years of experience, we’ve managed through all kinds of markets—up, down and those in between. We’re always preparing for what may come next. It’s because of this, combined with our strength as one of the world’s largest asset managers that we’ve earned the trust of millions of investors around the world.
Dear Franklin Mutual Financial Services Fund Shareholder:
Securities markets started 2018 with positive momentum. Investors began the year focused on global economic growth, strong corporate profits across most developed markets and the potential benefits of US corporate and personal tax cuts. However, volatility and market downturns emerged due to political risks and trade tariffs, a temporary deceleration in developed market economic activity during the first quarter, and higher bond yields amid potential signs of increasing inflation pressures and likely interest rate hikes. Although some risks faded, such as the first-quarter deceleration in economic growth, the potential for an escalating trade war between the US and its trading partners remained a meaningful uncertainty for investors. For the period ended June 30, 2018, US stocks, as measured by the Standard & Poor’s® 500 Index (S&P 500®), produced a +2.65% total return.1 Stocks in global developed markets, as measured by the MSCI World Index, returned +0.76%, while investment-grade bonds, as measured by the Bloomberg Barclays US Aggregate Bond Index, had a -1.62% total return.1
Value investing often requires an investor to be contrarian in nature. We continue to maintain a bottom-up stock-picking process that is disciplined, driven by rigorous fundamental analysis and attempts to limit downside risk. In our view, investing in underappreciated and misunderstood companies with identifiable catalysts for unlocking shareholder value
can offer meaningful upside potential and a degree of downside protection in periods of financial market turbulence.
Although economic and investment fundamentals still appear to be favorable, the return of volatility is another reminder that securities markets are dynamic. As we enter into the second half of 2018, market sentiment may easily turn again given the uncertainty regarding an escalation in trade tensions, the upcoming US midterm elections, Brexit, the ability of US tax cuts to prolong the current economic expansion, and the pace of inflation. Therefore, we believe active, professional investment management serves investors well.
We also recognize the important role of financial advisors in today’s markets and encourage investors to continue to seek their advice. Amid changing markets and economic conditions, we are confident investors with a well-diversified portfolio and a patient, long-term outlook should be well positioned for the years ahead.
On the following pages, the Fund’s portfolio management team reviews investment decisions that pertain to performance during the past six months in light of the economic environment and other factors. Please remember all securities markets fluctuate, as do mutual fund share prices.
1. Source: Morningstar.
See www.franklintempletondatasources.com for additional data provider information.
| Not FDIC Insured | | | May Lose Value | | | No Bank Guarantee |
| franklintempleton.com | Not part of the semiannual report | 1 |
We thank you for investing with Franklin Templeton, welcome your questions and comments, and look forward to continuing to serve your investment needs in the years ahead.
Sincerely,

Peter A. Langerman
Chairman, President and Chief Executive Officer
Franklin Mutual Advisers, LLC
This letter reflects our analysis and opinions as of June 30, 2018, unless otherwise indicated. The information is not a complete analysis of every aspect of any market, country, industry, security or fund. Statements of fact are from sources considered reliable.
Contents
Semiannual Report
| Franklin Mutual Financial Services Fund | 3 | |||
Performance Summary | 8 | |||
Your Fund’s Expenses | 10 | |||
Financial Highlights and Statement of Investments | 11 | |||
Financial Statements | 19 | |||
Notes to Financial Statements | 23 | |||
Shareholder Information | 35 |
Visit franklintempleton.com for fund updates, to access your account, or to find helpful financial planning tools.
| 2 | Not part of the semiannual report | franklintempleton.com |
Semiannual Report
Franklin Mutual Financial Services Fund
This semiannual report for Franklin Mutual Financial Services Fund covers the period ended June 30, 2018.
Your Fund’s Goal and Main Investments
The Fund seeks capital appreciation, which may occasionally be short term, with income as a secondary goal. Under normal market conditions, the Fund invests at least 80% of its net assets in securities of financial services companies that the investment manager believes are available at market prices less than their intrinsic value. The equity securities in which the Fund invests are primarily common stock with a current focus on mid- and large cap companies. To a lesser extent, the Fund also invests in merger arbitrage securities and the debt and equity of distressed companies. The Fund may invest in foreign securities without limit. The Geographic Composition bar chart on this page lists the leading countries where the Fund invests.
Performance Overview
The Fund’s Class Z shares had a cumulative total return of -4.56% for the six months ended June 30, 2018. For comparison, the Fund’s primary benchmark, the MSCI World Financials Index (USD), which captures large and midcap representation across 23 developed markets countries, had a -5.79% total return, while its secondary benchmark, the Standard & Poor’s 500 (S&P 500®) Financials Index, which tracks financials stocks in the S&P 500 Index, had a -4.09% total return.1 You can find more of the Fund’s performance data in the Performance Summary beginning on page 8.
Performance data represent past performance, which does not guarantee future results. Investment return and principal value will fluctuate, and you may have a gain or loss when you sell your shares. Current performance may differ from figures shown. For most recent month-end performance, go to franklintempleton.com or call (800) 342-5236.
Economic and Market Overview
The global economy expanded during the six-month period under review amid generally upbeat economic data across regions. In this environment, global developed and emerging
Geographic Composition*
Based on Total Net Assets as of 6/30/18
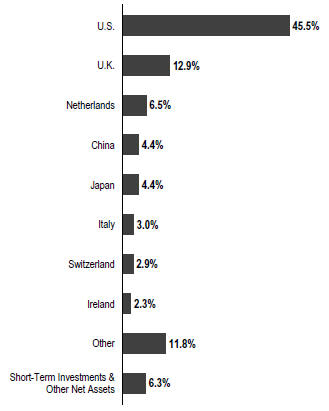
*Figures are stated as a percentage of total and may not equal 100% or may be negative due to rounding, use of any derivatives, unsettled trades or other factors.
market stocks reached a new all-time high in January 2018, as measured by the MSCI All Country World Index (ACWI). During the period, global markets were aided by price gains in oil and other commodities, encouraging corporate earnings reports and investor optimism about global economic growth. However, global stocks had a -0.13% total return for the six-month period, as measured by the MSCI ACWI, largely due to an overall decline in emerging market stocks.1
Global markets reflected investor concerns about tensions in the Korean peninsula and political uncertainties in the US and the European Union, as well as worries that strong economic growth and rising inflation in some parts of the world,
1. Source: Morningstar.
The indexes are unmanaged and include reinvestment of any income or distributions. They do not reflect any fees, expenses or sales charges. One cannot invest directly in an index, and an index is not representative of the Fund’s portfolio.
The dollar value, number of shares or principal amount, and names of all portfolio holdings are listed in the Fund’s Statement of Investments (SOI). The SOI begins on page 15.
| franklintempleton.com | Semiannual Report | 3 |
FRANKLIN MUTUAL FINANCIAL SERVICES FUND
particularly in the US, would lead central banks to increase interest rates sooner than expected. Markets were further pressured by the Trump administration’s protectionist trade policies, uncertainty surrounding the US-China trade relationship, and a broad sell-off in information technology stocks in March due to a potential for tighter regulation in the sector arising from concerns about consumer data privacy. Near period-end, an overall easing of tensions in the Korean peninsula relieved investors, but ongoing US trade disputes with its allies and China hindered global markets.
The US economy moderated in 2018’s first quarter due to a slowdown in consumer spending, exports, federal, state and local government spending, as well as a decline in residential fixed income investment. The unemployment rate declined from 4.1% in December 2017, as reported at the beginning of the six-month period, to 4.0% at period-end.2 Annual inflation, as measured by the Consumer Price Index, increased from 2.1% in December 2017, as reported at the beginning of the period, to 2.9% at period-end.2 The US Federal Reserve raised its target range for the federal funds rate in March and June 2018 and continued reducing its balance sheet as part of its ongoing plan to normalize monetary policy.
In Europe, the UK’s quarterly economic growth moderated in 2018’s first quarter amid a decline in construction output. The Bank of England kept its key policy rate unchanged during the period. The eurozone’s quarterly growth moderated in 2018’s first quarter due to a decline in external demand. The bloc’s annual inflation rate ended the period higher than in December 2017. The European Central Bank (ECB) kept its benchmark interest rate unchanged during the period. However, at its June meeting, the ECB announced it would further reduce its monthly bond purchases beginning in October 2018 and indicated it would conclude the program at the end of 2018 while continuing to keep interest rates unchanged through at least the summer of 2019.
In Asia, Japan’s quarterly gross domestic product (GDP) growth in 2018’s first quarter was negative, the country’s first contraction since 2015’s fourth quarter, mainly due to a decline in private residential investment and household consumption. The Bank of Japan left its benchmark interest rate unchanged during the period and continued its monetary stimulus measures.
In emerging markets, Brazil’s quarterly GDP accelerated in 2018’s first quarter compared to the previous quarter. The
2. Source: Bureau of Labor Statistics.
country’s central bank cut its benchmark interest rate twice during the period to spur economic growth. Russia’s annual GDP grew in 2018’s first quarter compared to the prior-year period, amid the Bank of Russia’s continued policy support. China’s annual GDP moderated in 2018’s first quarter compared to the prior-year period. The People’s Bank of China left its benchmark interest rate unchanged during the period. Overall, emerging market stocks, as measured by the MSCI Emerging Markets Index, declined during the period.
Investment Strategy
We strive to provide investors with superior risk-adjusted returns over time through our distinctive, value investment style, which includes investments in undervalued common stocks, distressed debt and merger arbitrage. Rigorous fundamental analysis drives our investment process. We attempt to determine each investment’s intrinsic value as well as the price at which we would be willing to commit shareholder funds. While valuation remains our key consideration, we utilize numerous fundamental factors such as return on equity, financial leverage and long-term earnings power. We also consider factors such as management quality and competitive position. As always, our approach to investing is as much about assessing risk and containing losses as it is about achieving profits. In addition, it is our practice to hedge the Fund’s currency exposure when we deem it advantageous for our shareholders.
What is return on equity?
Return on equity is a measure of profitability, expressed as a percentage, calculated by dividing a company’s net income by total shareholder equity for a given period. Return on equity tells common shareholders how effectually their money is being employed. Comparing percentages for current and prior periods also reveals trends, and comparison with industry composites reveals how well a company is holding its own against its competitors.
|
What is meant by “hedge”?
To hedge an investment is to take a position intended to offset potential losses/gains that may be incurred by a companion financial instrument.
|
Manager’s Discussion
Despite an upbeat economic backdrop in the US and stabilizing economies in Europe in the first half of 2018, the financials
| 4 | Semiannual Report | franklintempleton.com |
FRANKLIN MUTUAL FINANCIAL SERVICES FUND
sector underperformed the broader market due to geopolitical concerns resulting in a flattening yield curve. In the US, we continue to find value in the sector as we believe that a slow and steady rise in interest rates across the yield curve will improve the earnings prospects of the Fund’s holdings, specifically in the bank and life insurance names. In the bank sector, we continue to think the largest banks are attractive, as they have the scale to invest in technology and continually improve their franchises by competing on service rather than price. In addition, regional and smaller US banks have higher valuations thanks to increased merger and acquisition (M&A) activity. In Europe, we believe the banking industry offers some interesting opportunities, as we near the end of the restructuring process that took place in the US many years ago, thereby enabling the ECB to consider rate hikes. Globally, we continue to favor insurance companies that we view as having cheap valuations and unique catalysts to realize the value of the franchise. We expect the M&A cycle to be a tailwind and higher interest rates to relieve margin pressures. The Portfolio Composition table on this page lists banks, insurance and also other leading industries in which the Fund currently invests.
Fund Performance
Turning to Fund performance, top positive contributors included global insurer XL Group,3 US-based bank holding company State Bank Financial and international diversified insurer Ageas.
Shares of XL Group, a global insurance and reinsurance company, jumped in early March 2018 when it agreed to be acquired by French insurer AXA4. AXA has the ability to fully finance the acquisition from its current financial resources. In late March, the US Federal Trade Commission granted antitrust clearance and we believe other needed regulatory approvals are likely to be received.
The continued trend of industry consolidation was a significant catalyst for the positive performance of regional lenders, including State Bank Financial. In May, the company agreed to be acquired by Cadence Bancorp4. State Bank Financial also reported solid underlying quarterly results, including strong loan growth, an increase in the net interest margin and further progress on containing expenses. Passage of the Economic Growth, Regulatory Relief and Consumer Protection Act by the US Congress also had a broadly positive impact on bank stocks. The legislation included easing liquidity rules to include
Portfolio Composition*
Based on Total Net Assets as of 6/30/18
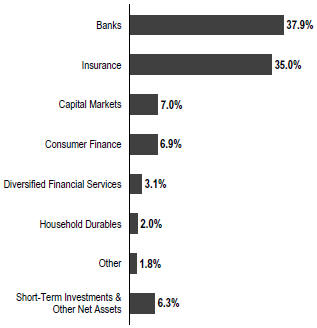
*Figures are stated as a percentage of total and may not equal 100% or may be negative due to rounding, use of any derivatives, unsettled trades or other factors.
higher quality municipal securities as part of the liquidity calculation and making it easier for consumers to qualify for mortgages. Other notable changes within the legislation do not directly affect smaller banks, but an indirect impact could be more consolidation in the industry.
Ageas is a diversified insurance company with operations in Belgium, the UK, Portugal, Turkey and Asia. It announced a greater-than-expected dividend increase in February 2018 and solid quarterly results in May, despite investor concerns about potentially higher weather-related losses. Ageas has done a good job overall with improving its cash generation as well as increasing its regulatory capital base, which is a positive for further dividend increases.
During the period under review, Fund investments that detracted from performance included Italy-based bank Credito Valtellinese, Japan-based Shinsei Bank and Sweden-based Hoist Finance.
Credito Valtellinese (Creval) is an Italian bank that we helped to recapitalize in February 2018. The stock rallied significantly after a new share offering intended to raise capital and upon
3. Not held at period-end.
4. Not a Fund holding.
See www.franklintempletondatasources.com for additional data provider information.
| franklintempleton.com | Semiannual Report | 5 |
FRANKLIN MUTUAL FINANCIAL SERVICES FUND
announcing the sale of a big block of non-performing exposures, which are loans, advances or debt securities that are more than 90 days past due and unlikely to be paid back. However, the stock subsequently sold off due to political uncertainty in Italy. Despite market concerns, Creval was able to sell off a second large block of non-performing exposures during the period under review, in line with its business plan, and undertook larger layoffs than it forecast. We believe the bank trades at a significant discount to book value at period-end and has a very large deferred tax asset off the balance sheet.
Similar to its Japanese peers, shares of Shinsei Bank fell as interest rates in Japan declined at the start of 2018. Also in January, Shinsei Bank announced quarterly results that showed credit costs related to its growing consumer loan business that hurt earnings and a share buyback plan that many investors viewed as somewhat underwhelming and lacking detail on future returns of capital to shareholders. The stock price regained some lost ground in May when Shinsei announced improved quarterly results, a dividend increase, another round of share buybacks and the cancelation of a large number of treasury shares. We believe the bank will keep pushing ahead with the process to remove the government as a shareholder, which may be a catalyst for additional shareholder returns over time.
Hoist Finance purchases and manages non-performing loans from international banks and other financial institutions. Investors became more cautious about potential return rates from its portfolio on non-performing loans and Hoist’s ability to operate more efficiently as it makes significant capital investments in its collections business, as well as potential regulatory changes in Italy, which if implemented, may make collecting on debts more difficult. We believe Hoist will continue to benefit from having the lowest funding costs in the industry, and that efforts to improve operating performance may hamper short-term financial results but yield potential margin improvements in the longer term.
During the period, the Fund held currency forwards and futures seeking to hedge most of the currency risk of the portfolio’s non-US dollar investments. The hedges had a positive overall impact on the Fund’s performance because of the appreciation of the US dollar versus the hedged currencies.
What is a currency forward?
A currency forward is a direct agreement between the Fund and a counterparty to buy or sell a foreign currency in exchange for another currency at a specific exchange rate on a future date.
|
| Top 10 Equity Holdings | ||||
6/30/18 | ||||
Company Sector/Industry, Country | % of Total Net Assets | |||
Wells Fargo & Co. Banks, U.S. | 3.8% | |||
Alleghany Corp. Insurance, U.S. | 3.8% | |||
American International Group Inc. Insurance, U.S. | 3.7% | |||
NN Group NV Insurance, Netherlands | 3.7% | |||
The Hartford Financial Services Group Inc. Insurance, U.S. | 3.3% | |||
CIT Group Inc. Banks, U.S. | 3.1% | |||
Voya Financial Inc. Diversified Financial Services, U.S. | 3.1% | |||
Citigroup Inc. Banks, U.S. | 3.1% | |||
Capital One Financial Corp. Consumer Finance, U.S. | 3.0% | |||
JPMorgan Chase & Co. Banks, U.S. | 2.9% | |||
What is a future?
A future is an agreement between the Fund and a counterparty made through a US or foreign futures exchange to buy or sell an underlying instrument or asset at a specific price on a future date.
|
As fellow shareholders, we found recent relative and absolute performance disappointing, but it is not uncommon for our strategy to lag the equity markets at times. We remain committed to our disciplined, value investment approach as we seek to generate attractive, long-term, risk-adjusted returns for shareholders.
On August 15, 2018, subsequent to period-end, Richard Cetlin (Portfolio Manager) stepped off the Fund, prior to his planned departure from the firm on October 1, 2018. His responsibilities have been allocated to others in the portfolio management team.
| 6 | Semiannual Report | franklintempleton.com |
FRANKLIN MUTUAL FINANCIAL SERVICES FUND
Thank you for your participation in Franklin Mutual Financial Services Fund. We look forward to continuing to serve your investment needs.
 |  | |
| Andrew Sleeman, CFA | ||
| Co-Portfolio Manager | ||
 |  | |
| Andrew B. Dinnhaupt, CFA | ||
| Co-Portfolio Manager | ||
 |  | |
| Richard Cetlin | ||
| Assistant Portfolio Manager | ||
The foregoing information reflects our analysis, opinions and portfolio holdings as of June 30, 2018, the end of the reporting period. The way we implement our main investment strategies and the resulting portfolio holdings may change depending on factors such as market and economic conditions. These opinions may not be relied upon as investment advice or an offer for a particular security. The information is not a complete analysis of every aspect of any market, country, industry, security or the Fund. Statements of fact are from sources considered reliable, but the investment manager makes no representation or warranty as to their completeness or accuracy. Although historical performance is no guarantee of future results, these insights may help you understand our investment management philosophy.
Andrew Sleeman has been portfolio manager for Franklin Mutual Financial Services Fund since 2009. Mr. Sleeman joined Franklin Templeton Investments in 2007. Previously, he was with Fox-Pitt, Kelton, a financials specialist firm, where he focused on international financial equities. Prior to that, he worked in international equities at BNP Paribas. Mr. Sleeman also worked in Australia in the fixed income division of JP Morgan Investment Management.
Andrew Dinnhaupt has been co-portfolio manager for Franklin Mutual Financial Services Fund since 2014 and was assistant portfolio manager since 2013. Mr. Dinnhaupt has been an analyst for Franklin Mutual Advisers since 2011, specializing in the global insurance industry. Previously, Mr. Dinnhaupt was a portfolio manager and senior analyst covering the global financial services sector for RBC Capital Markets. Prior to RBC, Mr. Dinnhaupt worked at several hedge funds where he was responsible for analyzing and managing portfolios in the financial services sector. Before that, he worked at Mitchell Hutchins Asset Management where he covered the financial services industry.
Richard Cetlin has been assistant portfolio manager for Franklin Mutual Financial Services Fund since 2010 with primary coverage of European banks. Prior to joining Franklin Templeton Investments in 2010, Mr. Cetlin was a consultant for Asian Century Quest, a hedge fund focused on the Asia-Pacific region. In this role, he focused on the analysis of banking, insurance and real estate stocks in China and banking stocks in Hong Kong and Korea. Prior to that, Mr. Cetlin worked for 14 years at AllianceBernstein where he was a senior vice president and senior analyst for US banking and specialty finance.
CFA® is a trademark owned by CFA Institute.
| franklintempleton.com | Semiannual Report | 7 |
FRANKLIN MUTUAL FINANCIAL SERVICES FUND
Performance Summary as of June 30, 2018
The performance table does not reflect any taxes that a shareholder would pay on Fund dividends, capital gain distributions, if any, or any realized gains on the sale of Fund shares. Total return reflects reinvestment of the Fund’s dividends and capital gain distributions, if any, and any unrealized gains or losses. Your dividend income will vary depending on dividends or interest paid by securities in the Fund’s portfolio, adjusted for operating expenses of each class. Capital gain distributions are net profits realized from the sale of portfolio securities.
Performance as of 6/30/18
Cumulative total return excludes sales charges. Average annual total return includes maximum sales charges. Sales charges will vary depending on the size of the investment and the class of share purchased. The maximum is 5.75% and the minimum is 0%. Class A: 5.75% maximum initial sales charge. For other share classes, visit franklintempleton.com.
| Share Class | | Cumulative Total Return | 1 | | Average Annual Total Return | 2 | ||
Z | ||||||||
6-Month | -4.56% | -4.56% | ||||||
1-Year | +2.75% | +2.75% | ||||||
5-Year | +65.76% | +10.64% | ||||||
10-Year | +99.45% | +7.15% | ||||||
A | ||||||||
6-Month | -4.71% | -10.16% | ||||||
1-Year | +2.49% | -3.41% | ||||||
5-Year | +63.52% | +9.04% | ||||||
10-Year | +93.80% | +6.21% | ||||||
Performance data represent past performance, which does not guarantee future results. Investment return and principal value will fluctuate, and you may have a gain or loss when you sell your shares. Current performance may differ from figures shown. For most recent month-end performance, go to franklintempleton.com or call (800) 342-5236.
See page 9 for Performance Summary footnotes.
| 8 | Semiannual Report | franklintempleton.com |
FRANKLIN MUTUAL FINANCIAL SERVICES FUND
PERFORMANCE SUMMARY
Total Annual Operating Expenses3
| Share Class | ||||
Z | 1.09% | |||
A | 1.34% | |||
Each class of shares is available to certain eligible investors and has different annual fees and expenses, as described in the prospectus.
All investments involve risks, including possible loss of principal. Value securities may not increase in price as anticipated or may decline further in value. Special risks are associated with foreign investing, including currency fluctuations, economic instability and political developments. Investing in a single-sector fund involves special risks, including greater sensitivity to economic, political or regulatory developments impacting the sector. Because the Fund may invest its assets in companies in a specific region, including Europe, it is subject to greater risks of adverse developments in that region and/or the surrounding regions than a fund that is more broadly diversified geographically. Current political and financial uncertainty surrounding the European Union may increase market volatility and the economic risk of investing in companies in Europe. Smaller company stocks have exhibited greater price volatility than larger company stocks, particularly over the short term. The Fund’s investments in companies engaged in mergers, reorganizations or liquidations also involve special risks as pending deals may not be completed on time or on favorable terms. The Fund may invest in lower rated bonds, which entail higher credit risk. The Fund is actively managed but there is no guarantee that the manager’s investment decisions will produce the desired results. The Fund’s prospectus also includes a description of the main investment risks.
1. Cumulative total return represents the change in value of an investment over the periods indicated.
2. Average annual total return represents the average annual change in value of an investment over the periods indicated. Return for less than one year, if any, has not been annualized.
3. Figures are as stated in the Fund’s current prospectus and may differ from the expense ratios disclosed in the Your Fund’s Expenses and Financial Highlights sections in this report. In periods of market volatility, assets may decline significantly, causing total annual Fund operating expenses to become higher than the figures shown.
| franklintempleton.com | Semiannual Report | 9 |
FRANKLIN MUTUAL FINANCIAL SERVICES FUND
Your Fund’s Expenses
As a Fund shareholder, you can incur two types of costs: (1) transaction costs, including sales charges (loads) on Fund purchases and redemptions; and (2) ongoing Fund costs, including management fees, distribution and service (12b-1) fees, and other Fund expenses. All mutual funds have ongoing costs, sometimes referred to as operating expenses. The table below shows ongoing costs of investing in the Fund and can help you understand these costs and compare them with those of other mutual funds. The table assumes a $1,000 investment held for the six months indicated.
Actual Fund Expenses
The table below provides information about actual account values and actual expenses in the columns under the heading “Actual.” In these columns the Fund’s actual return, which includes the effect of Fund expenses, is used to calculate the “Ending Account Value” for each class of shares. You can estimate the expenses you paid during the period by following these steps (of course, your account value and expenses will differ from those in this illustration): Divide your account value by $1,000 (if your account had an $8,600 value, then $8,600 ÷ $1,000 = 8.6). Then multiply the result by the number in the row for your class of shares under the headings “Actual” and “Expenses Paid During Period” (if Actual Expenses Paid During Period were $7.50, then 8.6 x $7.50 = $64.50). In this illustration, the actual expenses paid this period are $64.50.
Hypothetical Example for Comparison with Other Funds
Under the heading “Hypothetical” in the table, information is provided about hypothetical account values and hypothetical expenses based on the Fund’s actual expense ratio and an assumed rate of return of 5% per year before expenses, which is not the Fund’s actual return. This information may not be used to estimate the actual ending account balance or expenses you paid for the period, but it can help you compare ongoing costs of investing in the Fund with those of other funds. To do so, compare this 5% hypothetical example for the class of shares you hold with the 5% hypothetical examples that appear in the shareholder reports of other funds.
Please note that expenses shown in the table are meant to highlight ongoing costs and do not reflect any transactional costs. Therefore, information under the heading “Hypothetical” is useful in comparing ongoing costs only, and will not help you compare total costs of owning different funds. In addition, if transactional costs were included, your total costs would have been higher.
Actual (actual return after expenses) | Hypothetical (5% annual return before expenses) | |||||||||||||||||||||||||||||||||||
| Share Class | Beginning Account Value 1/1/18 | Ending Account Value 6/30/18 | Expenses Paid During 1/1/18–6/30/181,2 | Ending Account Value 6/30/18 | Expenses Paid During Period 1/1/18–6/30/181,2 | Net Annualized Expense Ratio2 | ||||||||||||||||||||||||||||||
Z | $ | 1,000 | $ | 954.40 | $5.19 | $ | 1,019.49 | $5.36 | 1.07% | |||||||||||||||||||||||||||
A | $ | 1,000 | $ | 952.90 | $6.39 | $ | 1,018.25 | $6.61 | 1.32% | |||||||||||||||||||||||||||
C | $ | 1,000 | $ | 949.80 | $10.01 | $ | 1,014.53 | $10.34 | 2.07% | |||||||||||||||||||||||||||
R6 | $ | 1,000 | $ | 955.10 | $4.61 | $ | 1,020.08 | $4.76 | 0.95% | |||||||||||||||||||||||||||
1. Expenses are equal to the annualized expense ratio for the six-month period as indicated above—in the far right column—multiplied by the simple average account value over the period indicated, and then multiplied by 181/365 to reflect the one-half year period.
2. Reflects expenses after fee waivers and expense reimbursements. Does not include acquired fund fees and expenses.
| 10 | Semiannual Report | franklintempleton.com |
FRANKLIN MUTUAL FINANCIAL SERVICES FUND
Financial Highlights
Six Months Ended (unaudited) | Year Ended December 31, | |||||||||||||||||||||||
| 2017 | 2016 | 2015 | 2014 | 2013 | ||||||||||||||||||||
| Class Z | ||||||||||||||||||||||||
| Per share operating performance (for a share outstanding throughout the period) | ||||||||||||||||||||||||
Net asset value, beginning of period | $24.14 | $21.65 | $19.63 | $18.40 | $16.90 | $13.59 | ||||||||||||||||||
| Income from investment operationsa: | ||||||||||||||||||||||||
Net investment incomeb | 0.26 | c | 0.22 | 0.31 | d | 0.30 | e | 0.25 | 0.24 | |||||||||||||||
Net realized and unrealized gains (losses) | (1.36 | ) | 2.76 | 2.00 | 1.23 | 1.62 | 3.24 | |||||||||||||||||
Total from investment operations | (1.10 | ) | 2.98 | 2.31 | 1.53 | 1.87 | 3.48 | |||||||||||||||||
Less distributions from net investment income | — | (0.49 | ) | (0.29 | ) | (0.30 | ) | (0.37 | ) | (0.17 | ) | |||||||||||||
Net asset value, end of period | $23.04 | $24.14 | $21.65 | $19.63 | $18.40 | $16.90 | ||||||||||||||||||
Total returnf | (4.56)% | 13.77% | 11.79% | 8.34% | 11.07% | 25.67% | ||||||||||||||||||
| Ratios to average net assetsg | ||||||||||||||||||||||||
Expensesh | 1.07% | i | 1.09% | 1.13% | i | 1.13% | 1.14% | 1.16% | ||||||||||||||||
Net investment income | 2.17% | c | 0.95% | 1.64% | d | 1.53% | e | 1.44% | 1.51% | |||||||||||||||
| Supplemental data | ||||||||||||||||||||||||
Net assets, end of period (000’s) | $199,166 | $210,825 | $162,687 | $178,157 | $112,156 | $105,279 | ||||||||||||||||||
Portfolio turnover rate | 19.12% | 67.89% | 34.58% | 25.43% | 33.69% | 25.73% | ||||||||||||||||||
aThe amount shown for a share outstanding throughout the period may not correlate with the Statement of Operations for the period due to the timing of sales and repurchases of the Fund’s shares in relation to income earned and/or fluctuating fair value of the investments of the Fund.
bBased on average daily shares outstanding.
cNet investment income per share includes approximately $0.06 per share related to income received in the form of special dividends in connection with certain Fund holdings. Excluding this amount, the ratio of net investment income to average net assets would have been 1.67%.
dNet investment income per share includes approximately $0.05 per share related to income received in the form of special dividends in connection with certain Fund holdings. Excluding this amount, the ratio of net investment income to average net assets would have been 1.38%.
eNet investment income per share includes approximately $0.14 per share related to income received in the form of special dividends in connection with certain Fund holdings. Excluding this amount, the ratio of net investment income to average net assets would have been 0.81%.
fTotal return is not annualized for periods less than one year.
gRatios are annualized for periods less than one year.
hBenefit of expense reduction rounds to less than 0.01%.
iBenefit of waiver and payments by affiliates rounds to less than 0.01%.
| franklintempleton.com | The accompanying notes are an integral part of these financial statements. | Semiannual Report | 11 |
FRANKLIN MUTUAL FINANCIAL SERVICES FUND
FINANCIAL HIGHLIGHTS
Six Months Ended (unaudited) | Year Ended December 31, | |||||||||||||||||||||||
| 2017 | 2016 | 2015 | 2014 | 2013 | ||||||||||||||||||||
| Class A | ||||||||||||||||||||||||
| Per share operating performance (for a share outstanding throughout the period) | ||||||||||||||||||||||||
Net asset value, beginning of period | $24.21 | $21.70 | $19.69 | $18.46 | $16.96 | $13.64 | ||||||||||||||||||
| Income from investment operationsa: | ||||||||||||||||||||||||
Net investment incomeb | 0.23 | c | 0.16 | 0.26 | d | 0.25 | e | 0.20 | 0.19 | |||||||||||||||
Net realized and unrealized gains (losses) | (1.37 | ) | 2.78 | 1.99 | 1.23 | 1.61 | 3.26 | |||||||||||||||||
Total from investment operations | (1.14 | ) | 2.94 | 2.25 | 1.48 | 1.81 | 3.45 | |||||||||||||||||
Less distributions from net investment income | — | (0.43 | ) | (0.24 | ) | (0.25 | ) | (0.31 | ) | (0.13 | ) | |||||||||||||
Net asset value, end of period | $23.07 | $24.21 | $21.70 | $19.69 | $18.46 | $16.96 | ||||||||||||||||||
Total returnf | (4.71)% | 13.55% | 11.46% | 8.05% | 10.71% | 25.32% | ||||||||||||||||||
| Ratios to average net assetsg | ||||||||||||||||||||||||
Expensesh | 1.32% | i | 1.34% | 1.38% | i | 1.41% | 1.44% | 1.46% | ||||||||||||||||
Net investment income | 1.92% | c | 0.70% | 1.39% | d | 1.25% | e | 1.14% | 1.21% | |||||||||||||||
| Supplemental data | ||||||||||||||||||||||||
Net assets, end of period (000’s) | $347,586 | $368,850 | $346,008 | $360,278 | $255,242 | $240,529 | ||||||||||||||||||
Portfolio turnover rate | 19.12% | 67.89% | 34.58% | 25.43% | 33.69% | 25.73% | ||||||||||||||||||
aThe amount shown for a share outstanding throughout the period may not correlate with the Statement of Operations for the period due to the timing of sales and repurchases of the Fund’s shares in relation to income earned and/or fluctuating fair value of the investments of the Fund.
bBased on average daily shares outstanding.
cNet investment income per share includes approximately $0.06 per share related to income received in the form of special dividends in connection with certain Fund holdings. Excluding this amount, the ratio of net investment income to average net assets would have been 1.42%.
dNet investment income per share includes approximately $0.05 per share related to income received in the form of special dividends in connection with certain Fund holdings. Excluding this amount, the ratio of net investment income to average net assets would have been 1.13%.
eNet investment income per share includes approximately $0.14 per share related to income received in the form of special dividends in connection with certain Fund holdings. Excluding this amount, the ratio of net investment income to average net assets would have been 0.53%.
fTotal return does not reflect sales commissions or contingent deferred sales charges, if applicable, and is not annualized for periods less than one year.
gRatios are annualized for periods less than one year.
hBenefit of expense reduction rounds to less than 0.01%.
iBenefit of waiver and payments by affiliates rounds to less than 0.01%.
| 12 | Semiannual Report | The accompanying notes are an integral part of these financial statements. | franklintempleton.com |
FRANKLIN MUTUAL FINANCIAL SERVICES FUND
FINANCIAL HIGHLIGHTS
Six Months Ended (unaudited) | Year Ended December 31, | |||||||||||||||||||||||
| 2017 | 2016 | 2015 | 2014 | 2013 | ||||||||||||||||||||
| Class C | ||||||||||||||||||||||||
| Per share operating performance (for a share outstanding throughout the period) | ||||||||||||||||||||||||
Net asset value, beginning of period | $24.08 | $21.60 | $19.61 | $18.41 | $16.92 | $13.61 | ||||||||||||||||||
| Income from investment operationsa: | ||||||||||||||||||||||||
Net investment income (loss)b | 0.14 | c | (0.01 | ) | 0.12 | d | 0.10 | e | 0.08 | 0.08 | ||||||||||||||
Net realized and unrealized gains (losses) | (1.35 | ) | 2.74 | 1.96 | 1.24 | 1.60 | 3.25 | |||||||||||||||||
Total from investment operations | (1.21 | ) | 2.73 | 2.08 | 1.34 | 1.68 | 3.33 | |||||||||||||||||
Less distributions from net investment income | — | (0.25 | ) | (0.09 | ) | (0.14 | ) | (0.19 | ) | (0.02 | ) | |||||||||||||
Net asset value, end of period | $22.87 | $24.08 | $21.60 | $19.61 | $18.41 | $16.92 | ||||||||||||||||||
Total returnf | (5.02)% | 12.66% | 10.64% | 7.30% | 9.93% | 24.50% | ||||||||||||||||||
| Ratios to average net assetsg | ||||||||||||||||||||||||
Expensesh | 2.07% | i | 2.09% | 2.13% | i | 2.13% | 2.14% | 2.16% | ||||||||||||||||
Net investment income (loss) | 1.17% | c | (0.05 | )% | 0.64% | d | 0.53% | e | 0.44% | 0.51% | ||||||||||||||
| Supplemental data | ||||||||||||||||||||||||
Net assets, end of period (000’s) | $121,598 | $134,117 | $128,766 | $132,975 | $89,341 | $86,370 | ||||||||||||||||||
Portfolio turnover rate | 19.12% | 67.89% | 34.58% | 25.43% | 33.69% | 25.73% | ||||||||||||||||||
aThe amount shown for a share outstanding throughout the period may not correlate with the Statement of Operations for the period due to the timing of sales and repurchases of the Fund’s shares in relation to income earned and/or fluctuating fair value of the investments of the Fund.
bBased on average daily shares outstanding.
cNet investment income per share includes approximately $0.06 per share related to income received in the form of special dividends in connection with certain Fund holdings. Excluding this amount, the ratio of net investment income to average net assets would have been 0.67%.
dNet investment income per share includes approximately $0.05 per share related to income received in the form of special dividends in connection with certain Fund holdings. Excluding this amount, the ratio of net investment income to average net assets would have been 0.38%.
eNet investment income per share includes approximately $0.14 per share related to income received in the form of special dividends in connection with certain Fund holdings. Excluding this amount, the ratio of net investment income to average net assets would have been (0.19)%.
fTotal return does not reflect sales commissions or contingent deferred sales charges, if applicable, and is not annualized for periods less than one year.
gRatios are annualized for periods less than one year.
hBenefit of expense reduction rounds to less than 0.01%.
iBenefit of waiver and payments by affiliates rounds to less than 0.01%.
| franklintempleton.com | The accompanying notes are an integral part of these financial statements. | Semiannual Report | 13 |
FRANKLIN MUTUAL FINANCIAL SERVICES FUND
FINANCIAL HIGHLIGHTS
Six Months Ended (unaudited) | Year Ended December 31, | |||||||||||||||||||||||
| 2017 | 2016 | 2015 | 2014 | 2013a | ||||||||||||||||||||
Class R6 | ||||||||||||||||||||||||
| Per share operating performance (for a share outstanding throughout the period) | ||||||||||||||||||||||||
Net asset value, beginning of period | $24.30 | $21.79 | $19.76 | $18.52 | $16.88 | $14.89 | ||||||||||||||||||
| Income from investment operationsb: | ||||||||||||||||||||||||
Net investment incomec | 0.28 | d | 0.25 | 0.32 | e | 0.07 | f | 0.25 | 0.13 | |||||||||||||||
Net realized and unrealized gains (losses) | (1.37 | ) | 2.78 | 2.03 | 1.49 | 1.66 | 2.07 | |||||||||||||||||
Total from investment operations | (1.09 | ) | 3.03 | 2.35 | 1.56 | 1.91 | 2.20 | |||||||||||||||||
Less distributions from net investment income . | — | (0.52 | ) | (0.32 | ) | (0.32 | ) | (0.27 | ) | (0.21 | ) | |||||||||||||
Net asset value, end of period | $23.21 | $24.30 | $21.79 | $19.76 | $18.52 | $16.88 | ||||||||||||||||||
Total returng | (4.49)% | 13.92% | 11.93% | 8.55% | 11.23% | 14.86% | ||||||||||||||||||
| Ratios to average net assetsh | ||||||||||||||||||||||||
Expenses before waiver and payments by affiliates | 1.01% | 0.97% | 0.99% | 1.16% | 2.61% | 2.18% | ||||||||||||||||||
Expenses net of waiver and payments by affiliatesi | 0.95% | 0.95% | 0.96% | 0.96% | 0.97% | 0.97% | ||||||||||||||||||
Net investment income | 2.29% | d | 1.09% | 1.81% | e | 1.70% | f | 1.61% | 1.70% | |||||||||||||||
| Supplemental data | ||||||||||||||||||||||||
Net assets, end of period (000’s) | $4,267 | $4,523 | $2,601 | $1,421 | $12 | $6 | ||||||||||||||||||
Portfolio turnover rate | 19.12% | 67.89% | 34.58% | 25.43% | 33.69% | 25.73% | ||||||||||||||||||
aFor the period May 1, 2013 (effective date) to December 31, 2013.
bThe amount shown for a share outstanding throughout the period may not correlate with the Statement of Operations for the period due to the timing of sales and repurchases of the Fund’s shares in relation to income earned and/or fluctuating fair value of the investments of the Fund.
cBased on average daily shares outstanding.
dNet investment income per share includes approximately $0.06 per share related to income received in the form of special dividends in connection with certain Fund holdings. Excluding this amount, the ratio of net investment income to average net assets would have been 1.79%.
eNet investment income per share includes approximately $0.05 per share related to income received in the form of special dividends in connection with certain Fund holdings. Excluding this amount, the ratio of net investment income to average net assets would have been 1.55%.
fNet investment income per share includes approximately $0.14 per share related to income received in the form of special dividends in connection with certain Fund holdings. Excluding this amount, the ratio of net investment income to average net assets would have been 0.98%.
gTotal return is not annualized for periods less than one year.
hRatios are annualized for periods less than one year.
iBenefit of expense reduction rounds to less than 0.01%.
| 14 | Semiannual Report | The accompanying notes are an integral part of these financial statements. | franklintempleton.com |
FRANKLIN MUTUAL FINANCIAL SERVICES FUND
Statement of Investments, June 30, 2018 (unaudited)
| Country | Shares | Value | ||||||||||||
| Common Stocks 93.7% | ||||||||||||||
| Banks 37.9% | ||||||||||||||
| a,b | AB&T Financial Corp. | United States | 226,100 | $ | 143,573 | |||||||||
AIB Group PLC | Ireland | 1,627,776 | 8,843,426 | |||||||||||
Barclays PLC | United Kingdom | 3,329,942 | 8,311,315 | |||||||||||
CIT Group Inc. | United States | 419,311 | 21,137,468 | |||||||||||
Citigroup Inc. | United States | 309,410 | 20,705,717 | |||||||||||
Citizens Financial Group Inc. | United States | 504,700 | 19,632,830 | |||||||||||
| a | Credito Valtellinese SpA | Italy | 117,345,631 | 13,230,225 | ||||||||||
| a | FCB Financial Holdings Inc., A | United States | 167,387 | 9,842,356 | ||||||||||
First Horizon National Corp. | United States | 425,229 | 7,586,085 | |||||||||||
Guaranty Bancorp | United States | 215,561 | 6,423,718 | |||||||||||
HSBC Holdings PLC | United Kingdom | 1,823,653 | 17,115,902 | |||||||||||
JPMorgan Chase & Co. | United States | 188,880 | 19,681,296 | |||||||||||
Shinsei Bank Ltd. | Japan | 1,134,000 | 17,476,887 | |||||||||||
Societe Generale SA | France | 309,549 | 13,061,408 | |||||||||||
Southern National Bancorp of Virginia Inc. | United States | 649,760 | 11,591,718 | |||||||||||
Standard Chartered PLC | United Kingdom | 1,562,466 | 14,291,056 | |||||||||||
State Bank Financial Corp. | United States | 402,960 | 13,458,864 | |||||||||||
UniCredit SpA | Italy | 404,554 | 6,757,157 | |||||||||||
Wells Fargo & Co. | United States | 457,170 | 25,345,505 | |||||||||||
|
| |||||||||||||
| 254,636,506 | ||||||||||||||
|
| |||||||||||||
| Capital Markets 7.0% | ||||||||||||||
Credit Suisse Group AG | Switzerland | 719,393 | 10,859,173 | |||||||||||
Deutsche Bank AG | Germany | 755,974 | 8,145,260 | |||||||||||
Guotai Junan Securities Co. Ltd. | China | 3,217,063 | 6,839,188 | |||||||||||
Oslo Bors VPS Holding ASA. | Norway | 911,000 | 12,862,492 | |||||||||||
UBS Group AG | Switzerland | 555,037 | 8,588,391 | |||||||||||
|
| |||||||||||||
| 47,294,504 | ||||||||||||||
|
| |||||||||||||
| Consumer Finance 6.9% | ||||||||||||||
Capital One Financial Corp. | United States | 218,510 | 20,081,069 | |||||||||||
| c | Hoist Finance AB, 144A | Sweden | 1,228,219 | 8,986,533 | ||||||||||
| a | PPDAI Group Inc., ADR | China | 851,710 | 5,067,675 | ||||||||||
| a | Qudian Inc., ADR | China | 526,847 | 4,667,864 | ||||||||||
Sun Hung Kai & Co. Ltd. | Hong Kong | 14,145,704 | 7,950,823 | |||||||||||
|
| |||||||||||||
| 46,753,964 | ||||||||||||||
|
| |||||||||||||
| Diversified Financial Services 3.1% | ||||||||||||||
Voya Financial Inc. | United States | 449,050 | 21,105,350 | |||||||||||
|
| |||||||||||||
| Household Durables 2.0% | ||||||||||||||
| a | Cairn Homes PLC | Ireland | 3,177,704 | 6,593,703 | ||||||||||
| a,c | Neinor Homes SA, 144A | Spain | 380,000 | 7,121,327 | ||||||||||
|
| |||||||||||||
| 13,715,030 | ||||||||||||||
|
| |||||||||||||
| Insurance 35.0% | ||||||||||||||
Ageas | Belgium | 202,418 | 10,218,952 | |||||||||||
Alleghany Corp. | United States | 43,937 | 25,262,457 | |||||||||||
American International Group Inc. | United States | 469,958 | 24,917,173 | |||||||||||
ASR Nederland NV | Netherlands | 460,370 | 18,814,808 | |||||||||||
| a | Brighthouse Financial Inc. | United States | 152,300 | 6,102,661 | ||||||||||
China Pacific Insurance Group Co. Ltd., H | China | 3,456,540 | 13,370,548 | |||||||||||
Chubb Ltd. | United States | 64,950 | 8,249,949 | |||||||||||
Direct Line Insurance Group PLC | United Kingdom | 2,785,939 | 12,615,671 | |||||||||||
Everest Re Group Ltd. | United States | 29,900 | 6,891,352 | |||||||||||
The Hartford Financial Services Group Inc. | United States | 439,772 | 22,485,543 | |||||||||||
| franklintempleton.com | Semiannual Report | 15 |
FRANKLIN MUTUAL FINANCIAL SERVICES FUND
STATEMENT OF INVESTMENTS, (UNAUDITED)
| Country | Shares | Value | ||||||||||||
| Common Stocks (continued) | ||||||||||||||
| Insurance (continued) | ||||||||||||||
Just Group PLC. | United Kingdom | 138,731 | $ | 247,331 | ||||||||||
Lancashire Holdings Ltd. | United Kingdom | 1,404,769 | 10,518,632 | |||||||||||
MetLife Inc. | United States | 352,070 | 15,350,252 | |||||||||||
NN Group NV | Netherlands | 605,115 | 24,631,396 | |||||||||||
RSA Insurance Group PLC | United Kingdom | 1,347,824 | 12,092,887 | |||||||||||
| a | Sabre Insurance Group PLC | United Kingdom | 3,137,265 | 11,227,725 | ||||||||||
T&D Holdings Inc. | Japan | 812,169 | 12,212,433 | |||||||||||
|
| |||||||||||||
| 235,209,770 | ||||||||||||||
|
| |||||||||||||
| Real Estate Management & Development 0.1% | ||||||||||||||
| a | Dolphin Capital Investors Ltd. | Greece | 3,979,650 | 354,748 | ||||||||||
|
| |||||||||||||
| Thrifts & Mortgage Finance 1.7% | ||||||||||||||
Indiabulls Housing Finance Ltd. | India | 677,412 | 11,305,042 | |||||||||||
|
| |||||||||||||
Total Common Stocks | 630,374,914 | |||||||||||||
|
| |||||||||||||
| Principal Amount | ||||||||||||||
| Short Term Investments 4.8%
| ||||||||||||||
| U.S. Government and Agency Securities 4.8% | ||||||||||||||
| d | FHLB, 7/02/18 | United States | $ | 1,000,000 | 1,000,000 | |||||||||
| d | U.S. Treasury Bill, 7/12/18—12/06/18 | United States | 31,100,000 | 30,936,406 | ||||||||||
|
| |||||||||||||
Total U.S. Government and Agency Securities | 31,936,406 | |||||||||||||
|
| |||||||||||||
Total Investments (Cost $657,167,421) 98.5% | 662,311,320 | |||||||||||||
Other Assets, less Liabilities 1.5% | 10,306,273 | |||||||||||||
|
| |||||||||||||
Net Assets 100.0% | $ | 672,617,593 | ||||||||||||
|
| |||||||||||||
aNon-income producing.
bSee Note 10 regarding holdings of 5% voting securities.
cSecurity was purchased pursuant to Rule 144A under the Securities Act of 1933 and may be sold in transactions exempt from registration only to qualified institutional buyers or in a public offering registered under the Securities Act of 1933. These securities have been deemed liquid under guidelines approved by the Trust’s Board of Trustees. At June 30, 2018, the aggregate value of these securities was $16,107,860, representing 2.4% of net assets.
dThe security was issued on a discount basis with no stated coupon rate.
| 16 | Semiannual Report | franklintempleton.com |
FRANKLIN MUTUAL FINANCIAL SERVICES FUND
STATEMENT OF INVESTMENTS (UNAUDITED)
At June 30, 2018, the Fund had the following futures contracts outstanding. See Note 1(c).
| Futures Contracts | ||||||||||||||||||||
| Description | Type | | Number of Contracts | | | Notional Amount | * | | Expiration Date | | | Value/ Unrealized Appreciation (Depreciation) | | |||||||
| Currency Contracts | ||||||||||||||||||||
EUR/USD | Short | 163 | $ | 23,913,119 | 9/17/18 | $233,074 | ||||||||||||||
GBP/USD | Short | 166 | 13,732,350 | 9/17/18 | 209,627 | |||||||||||||||
|
| |||||||||||||||||||
Total Futures Contracts | $442,701 | |||||||||||||||||||
|
| |||||||||||||||||||
*As of period end.
At June 30, 2018, the Fund had the following forward exchange contracts outstanding. See Note 1(c).
| Forward Exchange Contracts | ||||||||||||||||||||||||||||
| Currency | Counterparty | a | Type | Quantity | | Contract Amount | | | Settlement Date | | | Unrealized Appreciation | | | Unrealized Depreciation | | ||||||||||||
| OTC Forward Exchange Contracts |
| |||||||||||||||||||||||||||
Swiss Franc | BONY | Buy | 151,000 | $ | 151,991 | 7/09/18 | $ | 604 | $ | — | ||||||||||||||||||
Swiss Franc | UBSW | Buy | 432,222 | 440,003 | 7/09/18 | — | (3,215 | ) | ||||||||||||||||||||
Swiss Franc | UBSW | Buy | 468,305 | 472,473 | 7/09/18 | 780 | — | |||||||||||||||||||||
Swiss Franc | UBSW | Sell | 11,782,560 | 11,850,940 | 7/09/18 | — | (56,108 | ) | ||||||||||||||||||||
Euro | BOFA | Buy | 1,476,758 | 1,735,037 | 7/12/18 | — | (7,993 | ) | ||||||||||||||||||||
Euro | BOFA | Buy | 1,608,290 | 1,862,648 | 7/12/18 | 18,222 | — | |||||||||||||||||||||
Euro | BOFA | Sell | 3,000,000 | 3,750,468 | 7/12/18 | 242,016 | — | |||||||||||||||||||||
Euro | BONY | Buy | 3,980 | 4,621 | 7/12/18 | 34 | — | |||||||||||||||||||||
Euro | BONY | Buy | 1,069,102 | 1,262,644 | 7/12/18 | — | (12,347 | ) | ||||||||||||||||||||
Euro | HSBK | Buy | 1,569,402 | 1,821,355 | 7/12/18 | 14,036 | — | |||||||||||||||||||||
Euro | HSBK | Sell | 1,975,376 | 2,396,655 | 7/12/18 | 86,484 | — | |||||||||||||||||||||
Euro | SSBT | Buy | 238,769 | 277,200 | 7/12/18 | 2,036 | — | |||||||||||||||||||||
Euro | UBSW | Buy | 984,450 | 1,140,817 | 7/12/18 | 10,482 | — | |||||||||||||||||||||
Euro | UBSW | Sell | 1,975,374 | 2,396,751 | 7/12/18 | 86,582 | — | |||||||||||||||||||||
British Pound | BOFA | Buy | 47,758 | 64,016 | 7/16/18 | — | (896 | ) | ||||||||||||||||||||
British Pound | BOFA | Sell | 100,000 | 137,625 | 7/16/18 | 5,460 | — | |||||||||||||||||||||
British Pound | HSBK | Buy | 750,000 | 996,936 | 7/16/18 | — | (5,697 | ) | ||||||||||||||||||||
British Pound | HSBK | Sell | 3,217,536 | 4,392,901 | 7/16/18 | 140,440 | — | |||||||||||||||||||||
British Pound | SSBT | Sell | 606,805 | 851,508 | 7/16/18 | 49,523 | — | |||||||||||||||||||||
British Pound | UBSW | Sell | 3,112,667 | 4,242,634 | 7/16/18 | 128,772 | — | |||||||||||||||||||||
Norwegian Krone | BONY | Buy | 3,425,000 | 426,260 | 7/25/18 | — | (5,307 | ) | ||||||||||||||||||||
Norwegian Krone | BONY | Buy | 6,378,000 | 783,326 | 7/25/18 | 568 | — | |||||||||||||||||||||
Norwegian Krone | BONY | Sell | 114,202,746 | 14,531,964 | 7/25/18 | 495,767 | — | |||||||||||||||||||||
Euro | BOFA | Buy | 188,940 | 220,789 | 7/26/18 | 405 | — | |||||||||||||||||||||
Euro | BONY | Buy | 238,693 | 278,421 | 7/26/18 | 1,019 | — | |||||||||||||||||||||
Euro | BONY | Sell | 5,554,706 | 6,967,601 | 7/26/18 | 464,663 | — | |||||||||||||||||||||
Euro | HSBK | Buy | 188,940 | 220,368 | 7/26/18 | 826 | — | |||||||||||||||||||||
Euro | HSBK | Sell | 5,554,706 | 6,967,046 | 7/26/18 | 464,107 | — | |||||||||||||||||||||
Euro | SSBT | Buy | 1,377,744 | 1,602,181 | 7/26/18 | 10,756 | — | |||||||||||||||||||||
Euro | UBSW | Buy | 196,441 | 229,309 | 7/26/18 | 666 | — | |||||||||||||||||||||
Swedish Krona | BONY | Buy | 1,549,600 | 179,708 | 7/31/18 | — | (6,186 | ) | ||||||||||||||||||||
Swedish Krona | BONY | Sell | 4,543,385 | 507,490 | 7/31/18 | — | (1,275 | ) | ||||||||||||||||||||
| franklintempleton.com | Semiannual Report | 17 |
FRANKLIN MUTUAL FINANCIAL SERVICES FUND
STATEMENT OF INVESTMENTS (UNAUDITED)
| Forward Exchange Contracts (continued) | ||||||||||||||||||||||||||||
| Currency | Counterparty | a | Type | Quantity | | Contract Amount | | | Settlement Date | | | Unrealized Appreciation | | | Unrealized Depreciation | | ||||||||||||
| OTC Forward Exchange Contracts (continued) |
| |||||||||||||||||||||||||||
Swedish Krona | BONY | Sell | 16,577,290 | $ | 1,874,986 | 7/31/18 | $ | 18,670 | $ | — | ||||||||||||||||||
Swedish Krona | SSBT | Buy | 2,180,657 | 249,535 | 7/31/18 | — | (5,346 | ) | ||||||||||||||||||||
Swedish Krona | SSBT | Sell | 187,278 | 20,967 | 7/31/18 | — | (5 | ) | ||||||||||||||||||||
Swedish Krona | SSBT | Sell | 60,081,917 | 7,035,703 | 7/31/18 | 307,768 | — | |||||||||||||||||||||
South Korean Won | HSBK | Buy | 2,125,574,818 | 1,993,654 | 8/10/18 | — | (85,631 | ) | ||||||||||||||||||||
South Korean Won | HSBK | Sell | 2,125,574,818 | 1,966,122 | 8/10/18 | 58,100 | — | |||||||||||||||||||||
South Korean Won | UBSW | Buy | 2,419,175,321 | 2,277,656 | 8/10/18 | — | (106,084 | ) | ||||||||||||||||||||
South Korean Won | UBSW | Sell | 2,419,175,321 | 2,267,646 | 8/10/18 | 96,074 | — | |||||||||||||||||||||
British Pound | BOFA | Sell | 990,000 | 1,399,118 | 8/14/18 | 88,935 | — | |||||||||||||||||||||
British Pound | BONY | Sell | 11,960,892 | 16,634,611 | 8/14/18 | 805,361 | — | |||||||||||||||||||||
British Pound | UBSW | Sell | 11,960,891 | 16,634,370 | 8/14/18 | 805,122 | — | |||||||||||||||||||||
Euro | BOFA | Sell | 9,576,182 | 11,957,625 | 8/20/18 | 724,527 | — | |||||||||||||||||||||
Euro | BONY | Sell | 10,901,031 | 13,764,261 | 8/20/18 | 977,081 | — | |||||||||||||||||||||
Euro | SSBT | Sell | 8,560,328 | 10,826,461 | 8/20/18 | 784,984 | — | |||||||||||||||||||||
Japanese Yen | HSBK | Sell | 3,343,755,919 | 30,402,065 | 8/20/18 | 84,473 | — | |||||||||||||||||||||
Japanese Yen | UBSW | Buy | 58,162,675 | 531,845 | 8/20/18 | — | (4,488 | ) | ||||||||||||||||||||
Euro | BOFA | Sell | 3,285,077 | 4,121,576 | 10/10/18 | 252,489 | — | |||||||||||||||||||||
Euro | BONY | Sell | 3,550,725 | 4,439,131 | 10/10/18 | 257,170 | — | |||||||||||||||||||||
Euro | UBSW | Sell | 344,215 | 428,412 | 10/10/18 | 23,003 | — | |||||||||||||||||||||
Euro | BOFA | Sell | 1,546,363 | 1,936,584 | 10/18/18 | 114,073 | — | |||||||||||||||||||||
Euro | HSBK | Sell | 268,307 | 336,354 | 10/18/18 | 20,133 | — | |||||||||||||||||||||
Euro | SSBT | Sell | 2,603,880 | 3,271,853 | 10/18/18 | 202,973 | — | |||||||||||||||||||||
Euro | UBSW | Sell | 2,959,389 | 3,718,727 | 10/18/18 | 230,851 | — | |||||||||||||||||||||
British Pound | BOFA | Sell | 1,619,114 | 2,257,753 | 10/24/18 | 107,948 | — | |||||||||||||||||||||
British Pound | BONY | Sell | 967,583 | 1,352,771 | 10/24/18 | 68,047 | — | |||||||||||||||||||||
British Pound | SSBT | Sell | 333,333 | 451,980 | 10/24/18 | 9,391 | — | |||||||||||||||||||||
British Pound | UBSW | Sell | 870,766 | 1,222,475 | 10/24/18 | 66,300 | — | |||||||||||||||||||||
Euro | SSBT | Sell | 2,558,246 | 3,106,478 | 11/07/18 | 86,234 | — | |||||||||||||||||||||
Euro | UBSW | Sell | 8,506,284 | 10,200,351 | 11/07/18 | 157,902 | — | |||||||||||||||||||||
Euro | HSBK | Sell | 8,254,757 | 9,872,293 | 11/21/18 | 115,134 | — | |||||||||||||||||||||
Euro | SSBT | Sell | 8,254,756 | 9,874,339 | 11/21/18 | 117,182 | — | |||||||||||||||||||||
British Pound | BONY | Sell | 7,328,434 | 9,934,828 | 11/26/18 | 188,296 | — | |||||||||||||||||||||
British Pound | UBSW | Sell | 7,328,433 | 9,934,116 | 11/26/18 | 187,585 | — | |||||||||||||||||||||
|
| |||||||||||||||||||||||||||
Total Forward Exchange Contracts | $ | 9,180,054 | $ | (300,578 | ) | |||||||||||||||||||||||
|
| |||||||||||||||||||||||||||
Net unrealized appreciation (depreciation) |
| $ | 8,879,476 | |||||||||||||||||||||||||
|
| |||||||||||||||||||||||||||
aMay be comprised of multiple contracts with the same counterparty, currency and settlement date.
See Note 9 regarding other derivative information.
See Abbreviations on page 34.
| 18 | Semiannual Report | The accompanying notes are an integral part of these financial statements. | franklintempleton.com |
FRANKLIN MUTUAL FINANCIAL SERVICES FUND
Financial Statements
Statement of Assets and Liabilities
June 30, 2018 (unaudited)
Assets: | ||||
Investments in securities: | ||||
Cost - Unaffiliated issuers | $654,940,666 | |||
Cost - Non-controlled affiliates (Note 3f and 10) | 2,226,755 | |||
|
| |||
Value - Unaffiliated issuers | $662,167,747 | |||
Value - Non-controlled affiliates (Note 3f and 10) | 143,573 | |||
Cash | 302,255 | |||
Restricted cash for OTC derivative contracts (Note 1d) | 260,000 | |||
Foreign currency, at value (cost $559,102) | 558,984 | |||
Receivables: | ||||
Investment securities sold | 166,971 | |||
Capital shares sold | 776,446 | |||
Dividends | 1,167,637 | |||
European Union tax reclaims | 867,698 | |||
Deposits with brokers for: | ||||
Futures contracts | 699,760 | |||
Unrealized appreciation on OTC forward exchange contracts | 9,180,054 | |||
Other assets | 92,505 | |||
|
| |||
Total assets | 676,383,630 | |||
|
| |||
Liabilities: | ||||
Payables: | ||||
Investment securities purchased | 776,092 | |||
Capital shares redeemed | 912,851 | |||
Management fees | 499,275 | |||
Distribution fees | 366,572 | |||
Transfer agent fees | 152,535 | |||
Trustees’ fees and expenses | 23,816 | |||
Variation margin on futures contracts | 357,850 | |||
Deposits from brokers for: | ||||
OTC derivative contracts | 260,000 | |||
Unrealized depreciation on OTC forward exchange contracts | 300,578 | |||
Accrued expenses and other liabilities | 116,468 | |||
|
| |||
Total liabilities | 3,766,037 | |||
|
| |||
Net assets, at value | $672,617,593 | |||
|
| |||
Net assets consist of: | ||||
Paid-in capital | $654,735,668 | |||
Distributions in excess of net investment income | (276,655 | ) | ||
Net unrealized appreciation (depreciation) | 14,411,606 | |||
Accumulated net realized gain (loss) | 3,746,974 | |||
|
| |||
Net assets, at value | $672,617,593 | |||
|
|
| franklintempleton.com | The accompanying notes are an integral part of these financial statements. | Semiannual Report | 19 |
FRANKLIN MUTUAL FINANCIAL SERVICES FUND
FINANCIAL STATEMENTS
Statement of Assets and Liabilities (continued)
June 30, 2018 (unaudited)
| Class Z: | ||||
Net assets, at value | $199,165,668 | |||
|
| |||
Shares outstanding | 8,643,728 | |||
|
| |||
Net asset value and maximum offering price per share | $23.04 | |||
|
| |||
| Class A: | ||||
Net assets, at value | $347,586,116 | |||
|
| |||
Shares outstanding | 15,064,088 | |||
|
| |||
Net asset value per sharea | $23.07 | |||
|
| |||
Maximum offering price per share (net asset value per share ÷ 94.25%) | $24.48 | |||
|
| |||
| Class C: | ||||
Net assets, at value | $121,598,436 | |||
|
| |||
Shares outstanding | 5,317,191 | |||
|
| |||
Net asset value and maximum offering price per sharea | $22.87 | |||
|
| |||
| Class R6: | ||||
Net assets, at value | $4,267,373 | |||
|
| |||
Shares outstanding | 183,870 | |||
|
| |||
Net asset value and maximum offering price per share | $23.21 | |||
|
| |||
aRedemption price is equal to net asset value less contingent deferred sales charges, if applicable.
| 20 | Semiannual Report | The accompanying notes are an integral part of these financial statements. | franklintempleton.com |
FRANKLIN MUTUAL FINANCIAL SERVICES FUND
FINANCIAL STATEMENTS
Statement of Operations
for the six months ended June 30, 2018 (unaudited)
Investment income: | ||||
Dividends: (net of foreign taxes)* | ||||
Unaffiliated issuers | $ | 11,211,002 | ||
Interest: | ||||
Unaffiliated issuers | 329,856 | |||
Income from securities loaned (net of fees and rebates) | 29,874 | |||
|
| |||
Total investment income | 11,570,732 | |||
|
| |||
Expenses: | ||||
Management fees (Note 3a) | 3,125,700 | |||
Distribution fees: (Note 3c) | ||||
Class A | 457,128 | |||
Class C | 656,941 | |||
Transfer agent fees: (Note 3e) | ||||
Class Z | 148,524 | |||
Class A | 255,604 | |||
Class C | 91,833 | |||
Class R6 | 1,768 | |||
Custodian fees (Note 4) | 26,281 | |||
Reports to shareholders | 43,747 | |||
Registration and filing fees | 40,993 | |||
Professional fees | 61,678 | |||
Trustees’ fees and expenses | 11,586 | |||
Other | 14,893 | |||
|
| |||
Total expenses | 4,936,676 | |||
Expense reductions (Note 4) | (810 | ) | ||
Expenses waived/paid by affiliates (Note 3f and 3g) | (2,075 | ) | ||
|
| |||
Net expenses | 4,933,791 | |||
|
| |||
Net investment income. | 6,636,941 | |||
|
| |||
Realized and unrealized gains (losses): | ||||
Net realized gain (loss) from: | ||||
Investments: | ||||
Unaffiliated issuers | 16,910,303 | |||
Foreign currency transactions | (175,004 | ) | ||
Forward exchange contracts | (5,286,344 | ) | ||
Futures contracts | 509,101 | |||
|
| |||
Net realized gain (loss) | 11,958,056 | |||
|
| |||
Net change in unrealized appreciation (depreciation) on: | ||||
Investments: | ||||
Unaffiliated issuers | (66,397,951 | ) | ||
Non-controlled affiliates (Note 3f and 10) | 14,696 | |||
Translation of other assets and liabilities denominated in foreign currencies | (99,078 | ) | ||
Forward exchange contracts | 12,488,138 | |||
Futures contracts | 970,883 | |||
Change in deferred taxes on unrealized appreciation | 646,818 | |||
|
| |||
Net change in unrealized appreciation (depreciation) | (52,376,494 | ) | ||
|
| |||
Net realized and unrealized gain (loss) | (40,418,438 | ) | ||
|
| |||
Net increase (decrease) in net assets resulting from operations | $ | (33,781,497 | ) | |
|
|
*Foreign taxes withheld on dividends | $ | 951,114 |
| franklintempleton.com | The accompanying notes are an integral part of these financial statements. | Semiannual Report | 21 |
FRANKLIN MUTUAL FINANCIAL SERVICES FUND
FINANCIAL STATEMENTS
Statements of Changes in Net Assets
| Six Months Ended June 30, 2018 (unaudited) | Year Ended December 31, 2017 | |||||||
Increase (decrease) in net assets: | ||||||||
Operations: | ||||||||
Net investment income | $ 6,636,941 | $ 4,252,474 | ||||||
Net realized gain (loss) | 11,958,056 | 88,325,620 | ||||||
Net change in unrealized appreciation (depreciation) | (52,376,494 | ) | (7,117,836 | ) | ||||
|
| |||||||
Net increase (decrease) in net assets resulting from operations | (33,781,497 | ) | 85,460,258 | |||||
|
| |||||||
Distributions to shareholders from: | ||||||||
Net investment income: | ||||||||
Class Z | — | (4,211,056 | ) | |||||
Class A | — | (6,418,111 | ) | |||||
Class C | — | (1,393,532 | ) | |||||
Class R6 | — | (93,577 | ) | |||||
|
| |||||||
Total distributions to shareholders | — | (12,116,276 | ) | |||||
|
| |||||||
Capital share transactions: (Note 2) | ||||||||
Class Z | (1,898,000 | ) | 27,417,572 | |||||
Class A | (4,067,266 | ) | (15,335,232 | ) | ||||
Class C | (5,910,420 | ) | (8,715,929 | ) | ||||
Class R6 | (41,555 | ) | 1,544,299 | |||||
|
| |||||||
Total capital share transactions | (11,917,241 | ) | 4,910,710 | |||||
|
| |||||||
Net increase (decrease) in net assets | (45,698,738 | ) | 78,254,692 | |||||
Net assets: | ||||||||
Beginning of period | 718,316,331 | 640,061,639 | ||||||
|
| |||||||
End of period | $672,617,593 | $718,316,331 | ||||||
|
| |||||||
Distributions in excess of net investment income included in net assets: | ||||||||
End of period | $ (276,655 | ) | $ (6,913,596 | ) | ||||
|
| |||||||
| 22 | Semiannual Report | The accompanying notes are an integral part of these financial statements. | franklintempleton.com |
FRANKLIN MUTUAL FINANCIAL SERVICES FUND
Notes to Financial Statements (unaudited)
1. Organization and Significant Accounting Policies
Franklin Mutual Series Funds (Trust) is registered under the Investment Company Act of 1940 (1940 Act) as an open-end management investment company, consisting of seven separate funds and applies the specialized accounting and reporting guidance in U.S. Generally Accepted Accounting Principles (U.S. GAAP). Franklin Mutual Financial Services Fund (Fund) is included in this report. The Fund offers four classes of shares: Class Z, Class A, Class C and Class R6. Each class of shares may differ by its initial sales load, contingent deferred sales charges, voting rights on matters affecting a single class, its exchange privilege and fees due to differing arrangements for distribution and transfer agent fees.
The following summarizes the Fund’s significant accounting policies.
a. Financial Instrument Valuation
The Fund’s investments in financial instruments are carried at fair value daily. Fair value is the price that would be received to sell an asset or paid to transfer a liability in an orderly transaction between market participants on the measurement date. The Fund calculates the net asset value (NAV) per share each business day as of 4 p.m. Eastern time or the regularly scheduled close of the New York Stock Exchange (NYSE), whichever is earlier. Under compliance policies and procedures approved by the Trust’s Board of Trustees (the Board), the Fund’s administrator has responsibility for oversight of valuation, including leading the cross-functional Valuation Committee (VC). The VC provides administration and oversight of the Fund’s valuation policies and procedures, which are approved annually by the Board. Among other things, these procedures allow the Fund to utilize independent pricing services, quotations from securities and financial instrument dealers, and other market sources to determine fair value.
Equity securities and derivative financial instruments listed on an exchange or on the NASDAQ National Market System are valued at the last quoted sale price or the official closing price of the day, respectively. Foreign equity securities are valued as of the close of trading on the foreign stock exchange on which the security is primarily traded, or as of 4 p.m. Eastern time. The value is then converted into its U.S. dollar equivalent at the foreign exchange rate in effect at 4 p.m. Eastern time on the day that the value of the security is determined. Over-the-counter (OTC) securities are valued within the range of the most recent
quoted bid and ask prices. Securities that trade in multiple markets or on multiple exchanges are valued according to the broadest and most representative market. Certain equity securities are valued based upon fundamental characteristics or relationships to similar securities.
Debt securities generally trade in the OTC market rather than on a securities exchange. The Fund’s pricing services use multiple valuation techniques to determine fair value. In instances where sufficient market activity exists, the pricing services may utilize a market-based approach through which quotes from market makers are used to determine fair value. In instances where sufficient market activity may not exist or is limited, the pricing services also utilize proprietary valuation models which may consider market characteristics such as benchmark yield curves, credit spreads, estimated default rates, anticipated market interest rate volatility, coupon rates, anticipated timing of principal repayments, underlying collateral, and other unique security features in order to estimate the relevant cash flows, which are then discounted to calculate the fair value.
Investments in open-end mutual funds are valued at the closing NAV.
Certain derivative financial instruments trade in the OTC market. The Fund’s pricing services use various techniques including industry standard option pricing models and proprietary discounted cash flow models to determine the fair value of those instruments. The Fund’s net benefit or obligation under the derivative contract, as measured by the fair value of the contract, is included in net assets.
The Fund has procedures to determine the fair value of financial instruments for which market prices are not reliable or readily available. Under these procedures, the VC convenes on a regular basis to review such financial instruments and considers a number of factors, including significant unobservable valuation inputs, when arriving at fair value. The VC primarily employs a market-based approach which may use related or comparable assets or liabilities, recent transactions, market multiples, book values, and other relevant information for the investment to determine the fair value of the investment. An income-based valuation approach may also be used in which the anticipated future cash flows of the investment are discounted to calculate fair value. Discounts may also be applied due to the nature or duration of any restrictions on the disposition of the investments. Due to the inherent uncertainty of valuations of such investments, the fair values may differ significantly from
| franklintempleton.com | Semiannual Report | 23 |
FRANKLIN MUTUAL FINANCIAL SERVICES FUND
NOTES TO FINANCIAL STATEMENTS (UNAUDITED)
1. Organization and Significant Accounting Policies (continued)
a. Financial Instrument Valuation (continued)
the values that would have been used had an active market existed. The VC employs various methods for calibrating these valuation approaches including a regular review of key inputs and assumptions, transactional back-testing or disposition analysis, and reviews of any related market activity.
Trading in securities on foreign securities stock exchanges and OTC markets may be completed before 4 p.m. Eastern time. In addition, trading in certain foreign markets may not take place on every Fund’s business day. Occasionally, events occur between the time at which trading in a foreign security is completed and 4 p.m. Eastern time that might call into question the reliability of the value of a portfolio security held by the Fund. As a result, differences may arise between the value of the Fund’s portfolio securities as determined at the foreign market close and the latest indications of value at 4 p.m. Eastern time. In order to minimize the potential for these differences, the VC monitors price movements following the close of trading in foreign stock markets through a series of country specific market proxies (such as baskets of American Depositary Receipts, futures contracts and exchange traded funds). These price movements are measured against established trigger thresholds for each specific market proxy to assist in determining if an event has occurred that may call into question the reliability of the values of the foreign securities held by the Fund. If such an event occurs, the securities may be valued using fair value procedures, which may include the use of independent pricing services.
When the last day of the reporting period is a non-business day, certain foreign markets may be open on those days that the Fund’s NAV is not calculated, which could result in differences between the value of the Fund’s portfolio securities on the last business day and the last calendar day of the reporting period. Any significant security valuation changes due to an open foreign market are adjusted and reflected by the Fund for financial reporting purposes.
b. Foreign Currency Translation
Portfolio securities and other assets and liabilities denominated in foreign currencies are translated into U.S. dollars based on the exchange rate of such currencies against U.S. dollars on the date of valuation. The Fund may enter into foreign currency
exchange contracts to facilitate transactions denominated in a foreign currency. Purchases and sales of securities, income and expense items denominated in foreign currencies are translated into U.S. dollars at the exchange rate in effect on the transaction date. Portfolio securities and assets and liabilities denominated in foreign currencies contain risks that those currencies will decline in value relative to the U.S. dollar. Occasionally, events may impact the availability or reliability of foreign exchange rates used to convert the U.S. dollar equivalent value. If such an event occurs, the foreign exchange rate will be valued at fair value using procedures established and approved by the Board.
The Fund does not separately report the effect of changes in foreign exchange rates from changes in market prices on securities held. Such changes are included in net realized and unrealized gain or loss from investments in the Statement of Operations.
Realized foreign exchange gains or losses arise from sales of foreign currencies, currency gains or losses realized between the trade and settlement dates on securities transactions and the difference between the recorded amounts of dividends, interest, and foreign withholding taxes and the U.S. dollar equivalent of the amounts actually received or paid. Net unrealized foreign exchange gains and losses arise from changes in foreign exchange rates on foreign denominated assets and liabilities other than investments in securities held at the end of the reporting period.
c. Derivative Financial Instruments
The Fund invested in derivative financial instruments in order to manage risk or gain exposure to various other investments or markets. Derivatives are financial contracts based on an underlying or notional amount, require no initial investment or an initial net investment that is smaller than would normally be required to have a similar response to changes in market factors, and require or permit net settlement. Derivatives contain various risks including the potential inability of the counterparty to fulfill their obligations under the terms of the contract, the potential for an illiquid secondary market, and/or the potential for market movements which expose the Fund to gains or losses in excess of the amounts shown in the Statement of Assets and Liabilities. Realized gain and loss and unrealized appreciation and depreciation on these contracts for the period are included in the Statement of Operations.
| 24 | Semiannual Report | franklintempleton.com |
FRANKLIN MUTUAL FINANCIAL SERVICES FUND
NOTES TO FINANCIAL STATEMENTS (UNAUDITED)
Derivative counterparty credit risk is managed through a formal evaluation of the creditworthiness of all potential counter-parties. The Fund attempts to reduce its exposure to counterparty credit risk on OTC derivatives, whenever possible, by entering into International Swaps and Derivatives Association (ISDA) master agreements with certain counterparties. These agreements contain various provisions, including but not limited to collateral requirements, events of default, or early termination. Termination events applicable to the counterparty include certain deteriorations in the credit quality of the counterparty. Termination events applicable to the Fund include failure of the Fund to maintain certain net asset levels and/or limit the decline in net assets over various periods of time. In the event of default or early termination, the ISDA master agreement gives the non-defaulting party the right to net and close-out all transactions traded, whether or not arising under the ISDA agreement, to one net amount payable by one counterparty to the other. However, absent an event of default or early termination, OTC derivative assets and liabilities are presented gross and not offset in the Statement of Assets and Liabilities. Early termination by the counterparty may result in an immediate payment by the Fund of any net liability owed to that counterparty under the ISDA agreement.
Collateral requirements differ by type of derivative. Collateral or initial margin requirements are set by the broker or exchange clearing house for exchange traded and centrally cleared derivatives. Initial margin deposited is held at the exchange and can be in the form of cash and/or securities. For OTC derivatives traded under an ISDA master agreement, posting of collateral is required by either the Fund or the applicable counterparty if the total net exposure of all OTC derivatives with the applicable counterparty exceeds the minimum transfer amount, which typically ranges from $100,000 to $250,000, and can vary depending on the counterparty and the type of the agreement. Generally, collateral is determined at the close of Fund business each day and any additional collateral required due to changes in derivative values may be delivered by the Fund or the counterparty the next business day, or within a few business days. Collateral pledged and/or received by the Fund for OTC derivatives, if any, is held in segregated accounts with the Fund’s custodian/counterparty broker and can be in the form of cash and/or securities. Unrestricted cash may be invested according to the Fund’s investment objectives. To the extent that the amounts due to the Fund from its counterparties are not subject to collateralization or are not fully collateralized, the Fund bears the risk of loss from counterparty non-performance.
The Fund entered into exchange traded futures contracts primarily to manage exposure to certain foreign currencies. A futures contract is an agreement between the Fund and a counterparty to buy or sell an asset at a specified price on a future date. Required initial margins are pledged by the Fund, and the daily change in fair value is accounted for as a variation margin payable or receivable in the Statement of Assets and Liabilities.
The Fund entered into OTC forward exchange contracts primarily to manage exposure to certain foreign currencies. A forward exchange contract is an agreement between the Fund and a counterparty to buy or sell a foreign currency at a specific exchange rate on a future date.
See Note 9 regarding other derivative information.
d. Restricted Cash
At June 30, 2018, the Fund held restricted cash in connection with investments in certain derivative securities. Restricted cash is held in a segregated account with the counterparty broker and is reflected in the Statement of Assets and Liabilities.
e. Securities Lending
The Fund participates in an agency based securities lending program to earn additional income. The Fund receives cash collateral against the loaned securities in an amount equal to at least 102% of the fair value of the loaned securities. Collateral is maintained over the life of the loan in an amount not less than 100% of the fair value of loaned securities, as determined at the close of Fund business each day; any additional collateral required due to changes in security values is delivered to the Fund on the next business day. The collateral is deposited into a joint cash account with other funds and is used to invest in a money market fund managed by Franklin Advisers, Inc., an affiliate of the Fund, and/or a joint repurchase agreement. The Fund may receive income from the investment of cash collateral, in addition to lending fees and rebates paid by the borrower. Income from securities loaned, net of fees paid to the securities lending agent and/or third-party vendor, is reported separately in the Statement of Operations. The Fund bears the market risk with respect to the collateral investment, securities loaned, and the risk that the agent may default on its obligations to the Fund. If the borrower defaults on its obligation to return the securities loaned, the Fund has the right to repurchase the securities in the open market using the collateral received. The
| franklintempleton.com | Semiannual Report | 25 |
FRANKLIN MUTUAL FINANCIAL SERVICES FUND
NOTES TO FINANCIAL STATEMENTS (UNAUDITED)
1. Organization and Significant Accounting Policies (continued)
e. Securities Lending (continued)
securities lending agent has agreed to indemnify the Fund in the event of default by a third party borrower. At June 30, 2018, the Fund had no securities on loan.
f. Income and Deferred Taxes
It is the Fund’s policy to qualify as a regulated investment company under the Internal Revenue Code. The Fund intends to distribute to shareholders substantially all of its taxable income and net realized gains to relieve it from federal income and excise taxes. As a result, no provision for U.S. federal income taxes is required.
The Fund may be subject to foreign taxation related to income received, capital gains on the sale of securities and certain foreign currency transactions in the foreign jurisdictions in which it invests. Foreign taxes, if any, are recorded based on the tax regulations and rates that exist in the foreign markets in which the Fund invests. When a capital gain tax is determined to apply, the Fund records an estimated deferred tax liability in an amount that would be payable if the securities were disposed of on the valuation date.
As a result of several court cases, in certain countries across the European Union, the Fund filed additional tax reclaims for previously withheld taxes on dividends earned in those countries (EU reclaims). These additional filings are subject to various administrative proceedings by the local jurisdictions’ tax authorities within the European Union, as well as a number of related judicial proceedings. Income recognized, if any, for EU reclaims is reflected as other income in the Statement of Operations and any related receivable, if any, is reflected as European Union tax reclaims in the Statement of Assets and Liabilities. When uncertainty exists as to the ultimate resolution of these proceedings, the likelihood of receipt of these EU reclaims, and the potential timing of payment, no amounts are reflected in the financial statements. For U.S. income tax purposes, EU reclaims received by the Fund, if any, reduce the amounts of foreign taxes Fund shareholders can use as tax credits in their individual income tax returns.
The Fund may recognize an income tax liability related to its uncertain tax positions under U.S. GAAP when the uncertain tax position has a less than 50% probability that it will be sustained upon examination by the tax authorities based on its
technical merits. As of June 30, 2018, the Fund has determined that no tax liability is required in its financial statements related to uncertain tax positions for any open tax years (or expected to be taken in future tax years). Open tax years are those that remain subject to examination and are based on the statute of limitations in each jurisdiction in which the Fund invests.
g. Security Transactions, Investment Income, Expenses and Distributions
Security transactions are accounted for on trade date. Realized gains and losses on security transactions are determined on a specific identification basis. Interest income and estimated expenses are accrued daily. Amortization of premium and accretion of discount on debt securities are included in interest income. Dividend income is recorded on the ex-dividend date except for certain dividends from securities where the dividend rate is not available. In such cases, the dividend is recorded as soon as the information is received by the Fund. Distributions to shareholders are recorded on the ex-dividend date. Distributable earnings are determined according to income tax regulations (tax basis) and may differ from earnings recorded in accordance with U.S. GAAP. These differences may be permanent or temporary. Permanent differences are reclassified among capital accounts to reflect their tax character. These reclassifications have no impact on net assets or the results of operations. Temporary differences are not reclassified, as they may reverse in subsequent periods.
Common expenses incurred by the Trust are allocated among the Funds based on the ratio of net assets of each Fund to the combined net assets of the Trust or based on the ratio of number of shareholders of each Fund to the combined number of shareholders of the Trust. Fund specific expenses are charged directly to the Fund that incurred the expense.
Realized and unrealized gains and losses and net investment income, excluding class specific expenses, are allocated daily to each class of shares based upon the relative proportion of net assets of each class. Differences in per share distributions by class are generally due to differences in class specific expenses.
h. Accounting Estimates
The preparation of financial statements in accordance with U.S. GAAP requires management to make estimates and assumptions that affect the reported amounts of assets and
| 26 | Semiannual Report | franklintempleton.com |
FRANKLIN MUTUAL FINANCIAL SERVICES FUND
NOTES TO FINANCIAL STATEMENTS (UNAUDITED)
liabilities at the date of the financial statements and the amounts of income and expenses during the reporting period. Actual results could differ from those estimates.
i. Guarantees and Indemnifications
Under the Trust’s organizational documents, its officers and trustees are indemnified by the Trust against certain liabilities arising out of the performance of their duties to the Trust.
Additionally, in the normal course of business, the Trust, on behalf of the Fund, enters into contracts with service providers that contain general indemnification clauses. The Trust’s maximum exposure under these arrangements is unknown as this would involve future claims that may be made against the Trust that have not yet occurred. Currently, the Trust expects the risk of loss to be remote.
2. Shares of Beneficial Interest
At June 30, 2018, there were an unlimited number of shares authorized (without par value). Transactions in the Fund’s shares were as follows:
Six Months Ended June 30, 2018 | Year Ended December 31, 2017 | |||||||||||||||
| Shares | Amount | Shares | Amount | |||||||||||||
| Class Z Shares: | ||||||||||||||||
| Shares sold | 1,160,001 | $ | 28,148,564 | 2,575,987 | $ | 58,323,294 | ||||||||||
| Shares issued in reinvestment of distributions | — | — | 156,102 | 3,762,873 | ||||||||||||
| Shares redeemed | (1,249,197 | ) | (30,046,564 | ) | (1,515,027 | ) | (34,668,595 | ) | ||||||||
|
| |||||||||||||||
| Net increase (decrease) | (89,196 | ) | $ | (1,898,000 | ) | 1,217,062 | $ | 27,417,572 | ||||||||
|
| |||||||||||||||
| Class A Shares: | ||||||||||||||||
| Shares sold | 1,510,612 | $ | 36,810,568 | 3,502,833 | $ | 79,651,690 | ||||||||||
| Shares issued in reinvestment of distributions | — | — | 257,411 | 6,217,199 | ||||||||||||
| Shares redeemed | (1,684,989 | ) | (40,877,834 | ) | (4,464,692 | ) | (101,204,121 | ) | ||||||||
|
| |||||||||||||||
| Net increase (decrease) | (174,377 | ) | $ | (4,067,266 | ) | (704,448 | ) | $ | (15,335,232 | ) | ||||||
|
| |||||||||||||||
| Class C Shares: | ||||||||||||||||
| Shares sold | 428,359 | $ | 10,358,369 | 998,768 | $ | 22,519,991 | ||||||||||
| Shares issued in reinvestment of distributions | — | — | 56,775 | 1,357,536 | ||||||||||||
| Shares redeemed | (680,884 | ) | (16,268,789 | ) | (1,447,619 | ) | (32,593,456 | ) | ||||||||
|
| |||||||||||||||
| Net increase (decrease) | (252,525 | ) | $ | (5,910,420 | ) | (392,076 | ) | $ | (8,715,929 | ) | ||||||
|
| |||||||||||||||
| Class R6 Shares: | ||||||||||||||||
| Shares sold | 44,919 | $ | 1,096,040 | 109,161 | $ | 2,521,815 | ||||||||||
| Shares issued in reinvestment of distributions | — | — | 3,853 | 93,577 | ||||||||||||
| Shares redeemed | (47,182 | ) | (1,137,595 | ) | (46,239 | ) | (1,071,093 | ) | ||||||||
|
| |||||||||||||||
| Net increase (decrease) | (2,263 | ) | $ | (41,555 | ) | 66,775 | $ | 1,544,299 | ||||||||
|
| |||||||||||||||
3. Transactions with Affiliates
Franklin Resources, Inc. is the holding company for various subsidiaries that together are referred to as Franklin Templeton Investments. Certain officers and trustees of the Fund are also officers and/or directors of the following subsidiaries:
| Subsidiary | Affiliation | |
Franklin Mutual Advisers, LLC (Franklin Mutual) | Investment manager | |
Franklin Templeton Services, LLC (FT Services) | Administrative manager | |
Franklin Templeton Distributors, Inc. (Distributors) | Principal underwriter | |
Franklin Templeton Investor Services, LLC (Investor Services) | Transfer agent |
| franklintempleton.com | Semiannual Report | 27 |
FRANKLIN MUTUAL FINANCIAL SERVICES FUND
NOTES TO FINANCIAL STATEMENTS (UNAUDITED)
3. Transactions with Affiliates (continued)
a. Management Fees
The Fund pays an investment management fee to Franklin Mutual based on the average daily net assets of the Fund as follows:
| Annualized Fee Rate | Net Assets | |
0.875% | Up to and including $1 billion | |
0.845% | Over $1 billion, up to and including $2 billion | |
0.825% | Over $2 billion, up to and including $5 billion | |
0.805% | In excess of $5 billion |
For the period ended June 30, 2018, the annualized gross effective investment management fee rate was 0.875% of the Fund’s average daily net assets.
b. Administrative Fees
Under an agreement with Franklin Mutual, FT Services provides administrative services to the Fund. The fee is paid by Franklin Mutual based on the Fund’s average daily net assets, and is not an additional expense of the Fund.
c. Distribution Fees
The Board has adopted distribution plans for each share class, with the exception of Class Z and Class R6 shares, pursuant to Rule 12b-1 under the 1940 Act. Under the Fund’s Class A reimbursement distribution plan, the Fund reimburses Distributors for costs incurred in connection with the servicing, sale and distribution of the Fund’s shares up to the maximum annual plan rate. Under the Class A reimbursement distribution plan, costs exceeding the maximum for the current plan year cannot be reimbursed in subsequent periods. In addition, under the Fund’s Class C compensation distribution plan, the Fund pays Distributors for costs incurred in connection with the servicing, sale and distribution of the Fund’s shares up to the maximum annual plan rate. The plan year, for purposes of monitoring compliance with the maximum annual plan rates, is February 1 through January 31.
The maximum annual plan rates, based on the average daily net assets, for each class, are as follows:
Class A | 0.35% | |||
Class C | 1.00% |
The Board has set the current rate at 0.25% per year for Class A shares until further notice and approval by the Board.
d. Sales Charges/Underwriting Agreements
Front-end sales charges and contingent deferred sales charges (CDSC) do not represent expenses of the Fund. These charges are deducted from the proceeds of sales of Fund shares prior to investment or from redemption proceeds prior to remittance, as applicable. Distributors has advised the Fund of the following commission transactions related to the sales and redemptions of the Fund’s shares for the period:
Sales charges retained net of commissions paid to unaffiliated brokers/dealers. | $ | 58,299 | ||
CDSC retained | $ | 5,510 |
e. Transfer Agent Fees
Each class of shares pays transfer agent fees to Investor Services for its performance of shareholder servicing obligations. Effective November 1, 2017, the fees are based on an annualized asset based fee of 0.02% plus a transaction based fee. Prior to November 1, 2017, the fees were account based fees that varied based on fund or account type. In addition, each class reimburses Investor
| 28 | Semiannual Report | franklintempleton.com |
FRANKLIN MUTUAL FINANCIAL SERVICES FUND
NOTES TO FINANCIAL STATEMENTS (UNAUDITED)
Services for out of pocket expenses incurred and, except for Class R6 reimburses shareholder servicing fees paid to third parties. These fees are allocated daily based upon their relative proportion of such classes’ aggregate net assets. Class R6 pays Investor Services transfer agent fees specific to that class.
For the period ended June 30, 2018, the Fund paid transfer agent fees of $497,729, of which $226,886 was retained by Investor Services.
f. Investments in Affiliated Management Investment Companies
The Fund invests in one or more affiliated management investment companies for purposes other than exercising a controlling influence over the management or policies. Management fees paid by the Fund are waived on assets invested in the affiliated management investment companies, as noted in the Statement of Operations, in an amount not to exceed the management and administrative fees paid directly or indirectly by each affiliate. During the period ended June 30, 2018, the Fund held investments in affiliated management investment companies as follows:
| Number of Shares Held at Beginning of Period | Gross Additions | Gross Reductions | Number of Shares Held at End of Period | Value at End of Period | Dividend Income | Realized Gain (Loss) | Net Change in Unrealized Appreciation (Depreciation) | |||||||||||||||||||||||||
| Non-Controlled Affiliates |
| |||||||||||||||||||||||||||||||
Institutional Fiduciary Trust Money Market Portfolio, 1.51% | — | 5,128,000 | (5,128,000 | ) | — | $ | — | $ | — | $ | — | $ | — | |||||||||||||||||||
|
| |||||||||||||||||||||||||||||||
g. Waiver and Expense Reimbursements
Investor Services has voluntarily agreed in advance to waive or limit its fees so that the Class R6 transfer agent fees do not exceed 0.03% based on the average net assets of the class. Investor Services may discontinue this waiver in the future. Prior to May 1, 2018, the Class R6 transfer agent fees were limited to 0.01%.
4. Expense Offset Arrangement
The Fund has entered into an arrangement with its custodian whereby credits realized as a result of uninvested cash balances are used to reduce a portion of the Fund’s custodian expenses. During the period ended June 30, 2018, the custodian fees were reduced as noted in the Statement of Operations.
5. Independent Trustees’ Retirement Plan
On January 1, 1993, the Trust adopted an Independent Trustees’ Retirement Plan (Plan). The Plan is an unfunded defined benefit plan that provides benefit payments to Trustees whose length of service and retirement age meets the eligibility requirements of the Plan. Benefits under the Plan are based on years of service and fees paid to each trustee at the time of retirement. Effective in December 1996, the Plan was closed to new participants.
During the period ended June 30, 2018, the Fund’s projected benefit obligation and benefit payments under the Plan were as follows:
aProjected benefit obligation at June 30, 2018 | $ | 23,816 | ||
bIncrease in projected benefit obligation | $ | 277 | ||
Benefit payments made to retired trustees | $ | (368 | ) |
aThe projected benefit obligation is included in trustees’ fees and expenses in the Statement of Assets and Liabilities.
bThe increase in projected benefit obligation is included in trustees’ fees and expenses in the Statement of Operations.
| franklintempleton.com | Semiannual Report | 29 |
FRANKLIN MUTUAL FINANCIAL SERVICES FUND
NOTES TO FINANCIAL STATEMENTS (UNAUDITED)
6. Income Taxes
For tax purposes, capital losses may be carried over to offset future capital gains. Capital loss carryforwards with no expiration, if any, must be fully utilized before those losses with expiration dates.
At December 31, 2017, the Fund had capital loss carryforwards of $7,872,501 expiring in 2018.
At June 30, 2018, the cost of investments and net unrealized appreciation (depreciation) for income tax purposes were as follows:
Cost of investments | $666,433,647 | |||
|
| |||
Unrealized appreciation | $ 78,672,653 | |||
Unrealized depreciation | (73,471,645 | ) | ||
|
| |||
Net unrealized appreciation (depreciation) | $ 5,201,008 | |||
|
| |||
Differences between income and/or capital gains as determined on a book basis and a tax basis are primarily due to differing treatment of foreign currency transactions.
7. Investment Transactions
Purchases and sales of investments (excluding short term securities) for the period ended June 30, 2018, aggregated $128,400,725 and $133,484,438, respectively.
8. Concentration of Risk
Investing in foreign securities may include certain risks and considerations not typically associated with investing in U.S. securities, such as fluctuating currency values and changing local and regional economic, political and social conditions, which may result in greater market volatility. In addition, certain foreign securities may not be as liquid as U.S. securities.
9. Other Derivative Information
At June 30, 2018, the Fund’s investments in derivative contracts are reflected in the Statement of Assets and Liabilities as follows:
Asset Derivatives | Liability Derivatives | |||||||||||
Derivative Contracts Not Accounted for as Hedging Instruments | Statement of Assets and Liabilities Location | Fair Value | Statement of Assets and Liabilities Location | Fair Value | ||||||||
Foreign exchange contracts | Variation margin on futures contracts | $ | 442,701 | a | Variation margin on futures contracts | $ | — | |||||
Unrealized appreciation on OTC forward exchange contracts | 9,180,054 | Unrealized depreciation on OTC forward exchange contracts | 300,578 | |||||||||
|
|
|
| |||||||||
Totals | $ | 9,622,755 | $ | 300,578 | ||||||||
|
|
|
| |||||||||
aThis amount reflects the cumulative appreciation (depreciation) of futures contracts as reported in the Statement of Investments. Only the variation margin receivable/ payable at period end is separately reported within the Statement of Assets and Liabilities. Prior variation margin movements were recorded to cash upon receipt or payment.
| 30 | Semiannual Report | franklintempleton.com |
FRANKLIN MUTUAL FINANCIAL SERVICES FUND
NOTES TO FINANCIAL STATEMENTS (UNAUDITED)
For the period ended June 30, 2018, the effect of derivative contracts in the Fund’s Statement of Operations was as follows:
Derivative Contracts Not Accounted for as Hedging Instruments | Statement of Operations Location | Net Realized Gain (Loss) for the Period | Statement of Operations Location | Net Change in Unrealized Appreciation (Depreciation) for the Period | ||||||||
Net realized gain (loss) from: | Net change in unrealized | |||||||||||
appreciation (depreciation) on: | ||||||||||||
Foreign exchange contracts | Forward exchange contracts | $(5,286,344 | ) | Forward exchange contracts | $12,488,138 | |||||||
Futures contracts | 509,101 | Futures contracts | 970,883 | |||||||||
|
|
|
| |||||||||
Totals | $(4,777,243 | ) | $13,459,021 | |||||||||
|
|
|
| |||||||||
For the period ended June 30, 2018, the average month end notional amount of futures contracts represented $38,856,013. The average month end contract value of forward exchange contracts was $262,130,723.
At June 30, 2018, the Fund’s OTC derivative assets and liabilities are as follows:
| Gross Amounts of Assets and Liabilities Presented in the Statement of Assets and Liabilities | ||||||||
| Assetsa | Liabilitiesa | |||||||
| ||||||||
| Derivatives | ||||||||
Forward exchange contracts | $9,180,054 | $300,578 | ||||||
|
| |||||||
aAbsent an event of default or early termination, OTC derivative assets and liabilities are presented gross and not offset in the Statement of Assets and Liabilities.
At June 30, 2018, the Fund’s OTC derivative assets, which may be offset against the Fund’s OTC derivative liabilities and collateral received from the counterparty, are as follows:
| Amounts Not Offset in the Statement of Assets and Liabilities | ||||||||||||||||||||
| Gross Amounts of Assets Presented in the Statement of Assets and Liabilities | Financial Instruments Available for Offset | Financial Instruments Collateral Receiveda,b | Cash Collateral Received | Net Amount (Not less than zero) | ||||||||||||||||
| Counterparty | ||||||||||||||||||||
BOFA | $1,554,075 | $ (8,889 | ) | $(1,545,186 | ) | $ — | $ — | |||||||||||||
BONY | 3,277,280 | (25,115 | ) | (3,252,165 | ) | — | — | |||||||||||||
HSBK | 983,733 | (91,328 | ) | (834,112 | ) | — | 58,293 | |||||||||||||
SSBT | 1,570,847 | (5,351 | ) | (1,565,496 | ) | — | — | |||||||||||||
UBSW | 1,794,119 | (169,895 | ) | (1,364,224 | ) | (260,000 | ) | — | ||||||||||||
|
| |||||||||||||||||||
Total | $9,180,054 | $(300,578 | ) | $(8,561,183 | ) | $(260,000 | ) | $58,293 | ||||||||||||
|
| |||||||||||||||||||
| franklintempleton.com | Semiannual Report | 31 |
FRANKLIN MUTUAL FINANCIAL SERVICES FUND
NOTES TO FINANCIAL STATEMENTS (UNAUDITED)
9. Other Derivative Information (continued)
At June 30, 2018, the Fund’s OTC derivative liabilities, which may be offset against the Fund’s OTC derivative assets and collateral pledged to the counterparty, are as follows:
| Amounts Not Offset in the Statement of Assets and Liabilities | ||||||||||||||||||||
| Gross Amounts of Liabilities Presented in the Statement of Assets and Liabilities | Financial Instruments Available for Offset | Financial Instruments Collateral Pledged | Cash Collateral Pledged | Net Amount (Not less than zero) | ||||||||||||||||
| Counterparty | ||||||||||||||||||||
BOFA | $ 8,889 | $ (8,889 | ) | $ — | $ — | $ — | ||||||||||||||
BONY | 25,115 | (25,115 | ) | — | — | — | ||||||||||||||
HSBK | 91,328 | (91,328 | ) | — | — | — | ||||||||||||||
SSBT | 5,351 | (5,351 | ) | — | — | — | ||||||||||||||
UBSW | 169,895 | (169,895 | ) | — | — | — | ||||||||||||||
|
| |||||||||||||||||||
Total | $300,578 | $(300,578 | ) | $ — | $ — | $ — | ||||||||||||||
|
| |||||||||||||||||||
aAt June 30, 2018, the Fund received U.K. Treasury Bonds and U.S. Treasury Bonds and Notes as collateral for derivatives.
bIn some instances, the collateral amounts disclosed in the table above were adjusted due to the requirement to limit collateral amounts to avoid the effect of overcollateral-ization. Actual collateral received and/or pledged may be more than the amounts disclosed herein.
See Note 1(c) regarding derivative financial instruments.
See Abbreviations on page 34.
10. Holdings of 5% Voting Securities of Portfolio Companies
The 1940 Act defines “affiliated companies” to include investments in portfolio companies in which a fund owns 5% or more of the outstanding voting securities. During the period ended June 30, 2018, investments in “affiliated companies” were as follows:
| Name of Issuer | Number of Shares Held at Beginning of Period | Gross Additions | Gross Reductions | Number of Shares Held at End of Period | Value at End of Period | Dividend Income | Realized Gain (Loss) | Net Change in Unrealized Appreciation (Depreciation) | ||||||||||||||||||||||||
| Non-Controlled Affiliates |
| |||||||||||||||||||||||||||||||
AB&T Financial Corp. (Value is 0.0%a of Net Assets). | 226,100 | — | — | 226,100 | $143,573 | $ — | $ — | $14,696 | ||||||||||||||||||||||||
|
| |||||||||||||||||||||||||||||||
aRounds to less than 0.1% of net assets.
11. Credit Facility
The Fund, together with other U.S. registered and foreign investment funds (collectively, Borrowers), managed by Franklin Templeton Investments, are borrowers in a joint syndicated senior unsecured credit facility totaling $2 billion (Global Credit Facility) which matures on February 8, 2019. This Global Credit Facility provides a source of funds to the Borrowers for temporary and emergency purposes, including the ability to meet future unanticipated or unusually large redemption requests.
Under the terms of the Global Credit Facility, the Fund shall, in addition to interest charged on any borrowings made by the Fund and other costs incurred by the Fund, pay its share of fees and expenses incurred in connection with the implementation and maintenance of the Global Credit Facility, based upon its relative share of the aggregate net assets of all of the Borrowers, including an annual commitment fee of 0.15% based upon the unused portion of the Global Credit Facility. These fees are reflected in other expenses in the Statement of Operations. During the period ended June 30, 2018, the Fund did not use the Global Credit Facility.
| 32 | Semiannual Report | franklintempleton.com |
FRANKLIN MUTUAL FINANCIAL SERVICES FUND
NOTES TO FINANCIAL STATEMENTS (UNAUDITED)
12. Fair Value Measurements
The Fund follows a fair value hierarchy that distinguishes between market data obtained from independent sources (observable inputs) and the Fund’s own market assumptions (unobservable inputs). These inputs are used in determining the value of the Fund’s financial instruments and are summarized in the following fair value hierarchy:
| • | Level 1 – quoted prices in active markets for identical financial instruments |
| • | Level 2 – other significant observable inputs (including quoted prices for similar financial instruments, interest rates, prepayment speed, credit risk, etc.) |
| • | Level 3 – significant unobservable inputs (including the Fund’s own assumptions in determining the fair value of financial instruments) |
The input levels are not necessarily an indication of the risk or liquidity associated with financial instruments at that level.
For movements between the levels within the fair value hierarchy, the Fund has adopted a policy of recognizing the transfers as of the date of the underlying event which caused the movement.
A summary of inputs used as of June 30, 2018, in valuing the Fund’s assets and liabilities carried at fair value, is as follows:
| Level 1 | Level 2 | Level 3 | Total | |||||||||||||
| Assets: | ||||||||||||||||
Investments in Securities:a | ||||||||||||||||
Equity Investments | $630,374,914 | $ — | $ — | $630,374,914 | ||||||||||||
Short Term Investments | 30,936,406 | 1,000,000 | — | 31,936,406 | ||||||||||||
|
| |||||||||||||||
Total Investments in Securities | $661,311,320 | $1,000,000 | $ — | $662,311,320 | ||||||||||||
|
| |||||||||||||||
Other Financial Instruments: | ||||||||||||||||
Futures Contracts | $ 442,701 | $ — | $ — | $ 442,701 | ||||||||||||
Forward Exchange Contracts | — | 9,180,054 | — | 9,180,054 | ||||||||||||
|
| |||||||||||||||
Total Other Financial Instruments | $ 442,701 | $9,180,054 | $ — | $ 9,622,755 | ||||||||||||
|
| |||||||||||||||
| Liabilities: | ||||||||||||||||
Other Financial Instruments: | ||||||||||||||||
Forward Exchange Contracts | $ — | $ 300,578 | $ — | $ 300,578 | ||||||||||||
|
| |||||||||||||||
aFor detailed categories, see the accompanying Statement of Investments.
13. Subsequent Events
The Fund has evaluated subsequent events through the issuance of the financial statements and determined that no events have occurred that require disclosure other than those already disclosed in the financial statements, except for the following:
On February 27, 2018, the Board approved an automatic conversion feature for Class C that will convert shareholders’ Class C shares into Class A shares after they have been held for 10 years. The conversion feature will become effective on a future date prior to the calendar year end of 2018. Further details are disclosed in the Fund’s Prospectus.
On May 17, 2018, the Board approved changes to certain front-end sales charges and dealer commissions on Class A shares. The changes will become effective on or about September 10, 2018. Further details are disclosed in the Fund’s Prospectus.
| franklintempleton.com | Semiannual Report | 33 |
FRANKLIN MUTUAL FINANCIAL SERVICES FUND
NOTES TO FINANCIAL STATEMENTS (UNAUDITED)
Abbreviations
| Counterparty | Currency | Selected Portfolio | ||||||||
| BOFA | Bank of America Corp. | EUR | Euro | ADR | American Depositary Receipt | |||||
| BONY | The Bank of New York Mellon Corp. | GBP | British Pound | FHLB | Federal Home Loan Bank | |||||
| HSBK | HSBC Bank PLC | USD | United States Dollar | |||||||
| SSBT | State Street Bank and Trust Co., N.A. | |||||||||
| UBSW | UBS AG | |||||||||
| 34 | Semiannual Report | franklintempleton.com |
FRANKLIN MUTUAL SERIES FUNDS
FRANKLIN MUTUAL FINANCIAL SERVICES FUND
Shareholder Information
Board Approval of Investment Management Agreements
FRANKLIN MUTUAL SERIES FUNDS
Franklin Mutual Financial Services Fund
(Fund)
The Board of Trustees (Board), including a majority of trustees that are not “interested persons” as such term is defined in section 2(a)(19) of the Investment Company Act of 1940 (hereinafter referred to as “independent trustees”), at an in-person meeting held on May 17, 2018, unanimously approved the renewal of the Fund’s investment management agreement. Prior to a meeting of all of the trustees for the purpose of considering such renewal, the independent trustees participated in two other meetings held in connection with the renewal process. Throughout the process, the independent trustees received assistance and advice from and met separately with independent counsel. The independent trustees met with and interviewed officers of the investment manager (including portfolio managers), the transfer agent and shareholder services group and the distributor. In approving the renewal of the investment management agreement for the Fund, the Board, including the independent trustees, determined that the investment management fee structure was fair and reasonable and that continuance of the agreement was in the best interests of the Fund and its shareholders.
In reaching their decision on the investment management agreement, the trustees took into account information furnished throughout the year at regular Board meetings, as well as information specifically requested and furnished for the renewal process, which culminated in the meetings referred to above for the specific purpose of considering such agreement. Information furnished throughout the year included, among others, reports on the Fund’s investment performance, expenses, portfolio composition, portfolio brokerage execution, client commission arrangements, derivatives, securities lending, asset segregation, portfolio turnover, Rule 12b-1 plan, distribution, shareholder servicing, legal and compliance matters, pricing of securities, sales and redemptions, and marketing support payments made to financial intermediaries, as well as a third-party survey of transfer agent fees charged to funds within the Franklin Templeton Investments (FTI) complex in comparison with those charged to other fund complexes deemed comparable. Also, related financial statements and other information about the scope and quality of services provided by the investment manager and its affiliates and enhancements to such services over the past year were
provided. In addition, the trustees received periodic reports throughout the year and during the renewal process relating to compliance with the Fund’s investment policies and restrictions. During the renewal process, the independent trustees considered the investment manager’s methods of operation within the Franklin Templeton group and its activities on behalf of other clients. The Board also noted that it received an annual report on all payments made by FTI or the Fund to financial intermediaries engaged in the sale of Fund shares, as well as a memorandum relating to third-party servicing arrangements in response to a Guidance Update from the U.S. Securities and Exchange Commission (SEC) relating to mutual fund distribution and sub-accounting fees.
The information obtained by the trustees during the renewal process also included a special report prepared by Broadridge Financial Solutions, Inc., an independent third-party analyst that utilizes data from Lipper, Inc. (“Lipper”), comparing the Fund’s investment performance and expenses with those of other mutual funds deemed comparable to the Fund as selected by Lipper (Broadridge Section 15(c) Report). The trustees reviewed the Broadridge Section 15(c) Report and its usefulness in the renewal process with respect to matters such as comparative fees, expenses, expense ratios, performance and volatility. They concluded that the report continues to be a reliable resource in the performance of their duties.
In addition, the trustees received a Profitability Study (Profitability Study) prepared by management discussing the profitability to FTI from its overall U.S. fund operations, as well as on an individual fund-by-fund basis. Over the past year, the Board and counsel to the independent trustees continued to receive reports on management’s handling of recent regulatory inquiries and pending legal actions against the investment manager and its affiliates. The independent trustees were satisfied with the actions taken to date by management in response to such regulatory and legal matters.
The trustees reviewed the personnel, operations, financial condition, and investment management capabilities, methodologies and resources of the investment manager. As part of this review, particular attention was given to management’s diligent risk management program, including continual monitoring and management of cybersecurity, liquidity and counterparty credit risk, and attention given to derivatives and other complex instruments that are held and expected to be held by the Fund and how such instruments are used to carry out the Fund’s investment goal(s). The Board also took into account, among other things, management’s efforts in
| franklintempleton.com | Semiannual Report | 35 |
FRANKLIN MUTUAL SERIES FUNDS
FRANKLIN MUTUAL FINANCIAL SERVICES FUND
SHAREHOLDER INFORMATION
establishing a global credit facility for the benefit of the Fund and other accounts managed by FTI to provide a source of cash for temporary and emergency purposes or to meet unusual redemption requests as well as the strong financial position of the investment manager’s parent company and its commitment to the mutual fund business. The Board noted management’s continuing efforts and expenditures in establishing effective business continuity plans and developing strategies to address areas of heightened concern in the mutual fund industry, such as cybersecurity and liquidity risk management. The Board also recognized management’s commitment to facilitating Board oversight of particular areas, including derivatives and payments to intermediaries, by enhanced reporting.
In addition to the above and other matters considered by the trustees throughout the course of the year, the following discussion relates to certain primary factors relevant to the Board’s decision. This discussion of the information and factors considered by the Board (including the information and factors discussed above) is not intended to be exhaustive, but rather summarizes certain factors considered by the Board. In view of the wide variety of factors considered, the Board did not, unless otherwise noted, find it practicable to quantify or otherwise assign relative weights to the foregoing factors. In addition, individual trustees may have assigned different weights to various factors.
NATURE, EXTENT AND QUALITY OF SERVICES. The trustees reviewed the nature, extent and quality of the services provided, and to be provided, by the investment manager. The trustees cited the investment manager’s ability to implement the Fund’s disciplined value investment approach and its long-term relationship with the Fund as reasons that shareholders choose to invest, and remain invested, in the Fund. The trustees reviewed the Fund’s portfolio management team, including its performance, staffing, skills and compensation program. With respect to portfolio manager compensation, management assured the trustees that the Fund’s long-term performance is a significant component of incentive-based compensation and noted that a portion of a portfolio manager’s incentive-based compensation is paid in shares of pre-designated funds from the portfolio manager’s fund management area. The trustees noted that the portfolio manager compensation program aligned the interests of the portfolio managers with that of shareholders of the Fund. The trustees discussed with management various other products, portfolios and entities that are advised by the investment manager and the allocation of assets and expenses among and within them, as well as their relative fees and reasons for differences with respect thereto and any potential
conflicts. During regular Board meetings and the aforementioned meetings of the independent trustees, the trustees received reports and presentations on the investment manager’s best execution trading policies. The trustees considered periodic reports provided to them showing that the investment manager complied with the investment policies and restrictions of the Fund as well as other reports periodically furnished to the Board covering matters such as the compliance of portfolio managers and other management personnel with the code of ethics covering the investment management personnel, the adherence to fair value pricing procedures established by the Board and the accuracy of net asset value calculations. The Board noted the extent of the benefits provided to Fund shareholders from being part of the Franklin Templeton group of funds, including the right to exchange investments between funds (same class) without a sales charge, the ability to reinvest Fund dividends into other funds and the right to combine holdings of other funds to obtain reduced sales charges. The Board considered the investment manager’s significant efforts in developing and implementing compliance procedures established in accordance with SEC and other requirements.
The Board considered the nature, extent and quality of the services to be provided under the Fund’s other service agreements to determine that, on an overall basis, Fund shareholders were well served. In this connection, the Board also took into account transfer agent and shareholder services provided to Fund shareholders by an affiliate of the investment manager, noting continuing expenditures by management to increase and improve the scope of such services and favorable periodic reports on shareholder services conducted by independent third parties. While such considerations directly affected the trustees’ decision in renewing the Fund’s transfer agent and shareholder services agreement, the Board also considered these commitments as incidental benefits to Fund shareholders deriving from the investment management relationship.
Based on their review, the trustees were satisfied with the nature and quality of the overall services provided, and to be provided, by the investment manager and its affiliates to the Fund and its shareholders and were confident in the abilities of the management team to continue the disciplined value investment approach of the Fund and to provide quality services to the Fund and its shareholders.
INVESTMENT PERFORMANCE. The trustees reviewed and placed significant emphasis on the investment performance of the Fund over the one-, three-, five- and 10-year periods
| 36 | Semiannual Report | franklintempleton.com |
FRANKLIN MUTUAL SERIES FUNDS
FRANKLIN MUTUAL FINANCIAL SERVICES FUND
SHAREHOLDER INFORMATION
ended December 31, 2017. They considered the history of successful performance of the Fund relative to various benchmarks. As part of their review, they inquired of management regarding benchmarks, style drift and restrictions on permitted investments. Consideration was also given to performance in the context of available levels of cash during the periods.
The trustees had meetings during the year, including the meetings referred to above held in connection with the renewal process, with the Fund’s portfolio managers to discuss performance and the management of the Fund. In addition to the materials provided by management in connection with the renewal process, the independent trustees requested supplemental information and additional presentations from the investment manager and senior management of FTI regarding the performance of the investment manager and the Fund. As part of these presentations, it was noted that senior management of FTI is conducting a review of the investment manager and the Fund and will report the results thereof to the independent trustees when completed. In addition, particular attention in assessing performance was given to the Broadridge Section 15(c) Report. That report showed the investment performance of the Fund (Class A shares) in comparison to other funds determined comparable by Lipper.
The comparable funds to the Fund, as chosen by Lipper, included all retail and institutional global financial services funds. The Fund had total returns in the lowest performing quintile for the one-year period ended December 31, 2017, and had annualized total returns for the three- and five-year periods in the best and second-best performing quintiles, respectively. The trustees noted that the Fund’s total return on an annualized basis for the 10-year period ended December 31, 2017 was in the second-best performing quintile. The trustees discussed with management the reasons for the relative underperformance for the one-year period ended December 31, 2017. While noting such discussions, overall, the trustees were satisfied with such comparative performance.
The trustees also compared Fund performance to other industry benchmarks, including measures of risk-adjusted performance of a fund, as part of their evaluation of investment performance. The trustees concluded that the Fund had continued to perform well in comparison to its various benchmarks and in the context of the Fund’s goals.
COMPARATIVE EXPENSES AND MANAGEMENT PROFITABILITY. The trustees considered the cost of the services provided and to be provided and the profits realized by
the investment manager and its affiliates from their respective relationships with the Fund. As part of the renewal process, the trustees explored with management the trends in expense ratios over the past three fiscal years and the reasons for any increases in the Fund’s expense ratios (or components thereof). In considering the appropriateness of the management fee and other expenses charged to the Fund, the Board took into account various factors including investment performance and matters relating to Fund operations, including, but not limited to, the quality and experience of its portfolio managers and research staff. Consideration was also given to a comparative analysis in the Broadridge Section 15(c) Report of the investment management fee and total expense ratio of the Fund in comparison with those of a group of other funds selected by Lipper as its appropriate Lipper expense group. Lipper expense data is based upon information taken from each fund’s most recent annual report, which reflects historical asset levels that may be quite different from those currently existing, particularly in a period of market volatility. While recognizing such inherent limitation and the fact that expense ratios generally increase as assets decline and decrease as assets grow, the Board believed the independent analysis conducted by Lipper to be an appropriate measure of comparative expenses.
In reviewing comparative costs, emphasis was given to the Fund’s contractual management fee in comparison with the contractual management fee that would have been charged by other funds within its Lipper expense group assuming they were similar in size to the Fund, as well as the actual total expenses of the Fund in comparison with those of its Lipper expense group. The Lipper contractual management fee analysis includes administrative charges as being part of the management fee, and total expenses, for comparative consistency, are shown by Lipper for Fund Class A shares.
The Fund’s contractual management fee rate was in the second-most expensive quintile of its Lipper expense group and its total expenses were in the second-least expensive quintile of such group. The Board noted that the Fund’s contractual management fee rate was within 3 basis points of its Lipper expense group median. The Board was satisfied with such comparative fees and expenses.
The trustees also reviewed the Profitability Study addressing profitability of Franklin Resources, Inc., from its overall U.S. fund business, as well as profitability to the Fund’s investment manager and its affiliates, from providing investment management and other services to the Fund during the
| franklintempleton.com | Semiannual Report | 37 |
FRANKLIN MUTUAL SERIES FUNDS
FRANKLIN MUTUAL FINANCIAL SERVICES FUND
SHAREHOLDER INFORMATION
12-month period ended September 30, 2017, the most recent fiscal year-end of Franklin Resources, Inc. The trustees reviewed the basis on which such reports are prepared and the cost allocation methodology utilized in the Profitability Study, it being recognized that allocation methodologies may each be reasonable while producing different results. In this respect, the Board noted that the reasonableness of the cost allocation methodologies was reviewed by independent accountants on an every other year basis.
The independent trustees met with management to discuss the Profitability Study. This included, among other things, a comparison of investment management income with investment management expenses of the Fund; comparison of underwriting revenues and expenses; the relative relationship of investment management and underwriting expenses; shareholder servicing profitability; economies of scale; and the relative contribution of the Fund to the profitability of the investment manager and its parent. In discussing the Profitability Study with the Board, the investment manager stated its belief that the costs incurred in establishing the infrastructure necessary to operate the type of mutual fund operations conducted by it and its affiliates may not be fully reflected in the expenses allocated to the Fund in determining its profitability.
The Board also took into account management’s expenditures in improving shareholder services provided to the Fund, as well as the need to meet additional regulatory and compliance requirements. The trustees also considered the extent to which the investment manager may derive ancillary benefits from Fund operations, including those derived from economies of scale, discussed below, the allocation of Fund brokerage and the use of commission dollars to pay for research and other similar services.
Based upon their consideration of all these factors, the trustees determined that the level of profits realized by the investment manager and its affiliates in providing services to the Fund was not excessive in view of the nature, quality and extent of services provided.
ECONOMIES OF SCALE. The Board considered economies of scale realized by the investment manager and its affiliates as the Fund grows larger and the extent to which they are shared with Fund shareholders, as for example, in the level of the investment management fee charged, in the quality and efficiency of services rendered and in increased capital commitments benefiting the Fund directly or indirectly. While recognizing that any precise determination is inherently subjective, the trustees noted that, based upon the Profitability
Study, as some funds increase in size, at some point economies of scale may result in the investment manager realizing a larger profit margin on investment management services provided to such a fund. The trustees also noted that benefits of economies of scale will be shared with Fund shareholders due to the decline in the effective investment management fee rate as breakpoints are achieved by the Fund.
The trustees noted that breakpoints had been instituted as part of the Fund’s investment management fee and that the Board regularly evaluates whether additional breakpoints are appropriate. The trustees assessed the savings to shareholders resulting from such breakpoints and believed they were, and continue to be, appropriate and they agreed to continue to monitor the appropriateness of the breakpoints. The trustees also considered the effects an increase in assets under management would have on the investment management fee and expense ratio of the Fund. To the extent further economies of scale may be realized by the investment manager and its affiliates, the Board believed the investment management and administrative fees provide a sharing of benefits with the Fund and its shareholders.
Proxy Voting Policies and Procedures
The Fund’s investment manager has established Proxy Voting Policies and Procedures (Policies) that the Fund uses to determine how to vote proxies relating to portfolio securities. Shareholders may view the Fund’s complete Policies online at franklintempleton.com. Alternatively, shareholders may request copies of the Policies free of charge by calling the Proxy Group collect at (954) 527-7678 or by sending a written request to: Franklin Templeton Companies, LLC, 300 S.E. 2nd Street, Fort Lauderdale, FL 33301, Attention: Proxy Group. Copies of the Fund’s proxy voting records are also made available online at franklintempleton.com and posted on the US Securities and Exchange Commission’s website at sec.gov and reflect the most recent 12-month period ended June 30.
Quarterly Statement of Investments
The Trust, on behalf of the Fund, files a complete statement of investments with the US Securities and Exchange Commission for the first and third quarters for each fiscal year on Form N-Q. Shareholders may view the filed Form N-Q by visiting the Commission’s website at sec.gov. The filed form may also be viewed and copied at the Commission’s Public Reference Room in Washington, DC. Information regarding the operations of the Public Reference Room may be obtained by calling (800) SEC-0330.
| 38 | Semiannual Report | franklintempleton.com |
This page intentionally left blank.
This page intentionally left blank.
| Semiannual Report and Shareholder Letter Franklin Mutual Financial Services Fund
| |||
Investment Manager Franklin Mutual Advisers, LLC
| ||||
| Distributor | ||||
Franklin Templeton Distributors, Inc. (800) DIAL BEN® / 342-5236 franklintempleton.com
| ||||
Shareholder Services (800) 632-2301 - (Class A, C & R6) (800) 448-FUND - (Class Z) |
Authorized for distribution only when accompanied or preceded by a summary prospectus and/or prospectus. Investors should carefully consider a fund’s investment goals, risks, charges and expenses before investing. A prospectus contains this and other information; please read it carefully before investing.
To help ensure we provide you with quality service, all calls to and from our service areas are monitored and/or recorded.
| © 2018 Franklin Templeton Investments. All rights reserved. | 479 S 08/18 |

Franklin Templeton Investments
Why choose Franklin Templeton Investments?
Successful investing begins with ambition. And achievement only comes when you reach for it. That’s why we continually strive to deliver better outcomes for investors. No matter what your goals are, our deep, global investment expertise allows us to offer solutions that can help.
During our more than 70 years of experience, we’ve managed through all kinds of markets—up, down and those in between. We’re always preparing for what may come next. It’s because of this, combined with our strength as one of the world’s largest asset managers that we’ve earned the trust of millions of investors around the world.
Dear Franklin Mutual International Fund Shareholder:
Securities markets started 2018 with positive momentum. Investors began the year focused on global economic growth, strong corporate profits across most developed markets and the potential benefits of US corporate and personal tax cuts. However, volatility and market downturns emerged due to political risks and trade tariffs, a temporary deceleration in developed market economic activity during the first quarter, and higher bond yields amid potential signs of increasing inflation pressures and likely interest rate hikes. Although some risks faded, such as the first-quarter deceleration in economic growth, the potential for an escalating trade war between the US and its trading partners remained a meaningful uncertainty for investors. For the period ended June 30, 2018, US stocks, as measured by the Standard & Poor’s® 500 Index (S&P 500®), produced a +2.65% total return.1 Stocks in global developed markets, as measured by the MSCI World Index, returned +0.76%, while investment-grade bonds, as measured by the Bloomberg Barclays US Aggregate Bond Index, had a -1.62% total return.1
Market performance was rather uneven during the period. Although the S&P 500 performed positively, most of the gains could be accounted for by a small number of companies. The list of those leading performers showed a concentration in information technology and internet-focused companies, or businesses that directly benefit from increased online commerce. It is no surprise, therefore, that growth stocks managed to outpace value stocks during the period. The Russell
1000® Growth Index returned +7.25%, while the Russell 1000® Value Index had a -1.69% total return.1
We do not know how long growth will continue to outpace value, but historically, periods of solid and steady economic growth have been a positive backdrop for value stocks. Low unemployment rates, increased business investment and solid consumer spending are all constructive signs for such a pace of economic growth. The US Federal Reserve’s efforts to gradually raise interest rates may be favorable for financial equities.
Value investing often requires an investor to be contrarian in nature. We continue to maintain a bottom-up stock-picking process that is disciplined, driven by rigorous fundamental analysis and attempts to limit downside risk. In our view, investing in underappreciated and misunderstood companies with identifiable catalysts for unlocking shareholder value can offer meaningful upside potential and a degree of downside protection in periods of financial market turbulence.
Although economic and investment fundamentals still appear to be favorable, the return of volatility is another reminder that securities markets are dynamic. As we enter into the second half of 2018, market sentiment may easily turn again given the uncertainty regarding an escalation in trade tensions, the upcoming US midterm elections, Brexit, the ability of US tax cuts to prolong the current economic expansion, and the pace of
1. Source: Morningstar. Frank Russell Company is the source and owner of the trademarks, service marks and copyrights related to the Russell Indexes. Russell® is a trademark of Frank Russell Company.
See www.franklintempletondatasources.com for additional data provider information.
| Not FDIC Insured | | | May Lose Value | | | No Bank Guarantee |
| franklintempleton.com | Not part of the semiannual report | 1 |
inflation. Therefore, we believe active, professional investment management serves investors well.
We also recognize the important role of financial advisors in today’s markets and encourage investors to continue to seek their advice. Amid changing markets and economic conditions, we are confident investors with a well-diversified portfolio and a patient, long-term outlook should be well positioned for the years ahead.
On the following pages, the Fund’s portfolio management team reviews investment decisions that pertain to performance during the past six months in light of the economic environment and other factors. Please remember all securities markets fluctuate, as do mutual fund share prices.
We thank you for investing with Franklin Templeton, welcome your questions and comments, and look forward to continuing to serve your investment needs in the years ahead.
Sincerely,
Peter A. Langerman
Chairman, President and Chief Executive Officer
Franklin Mutual Advisers, LLC
This letter reflects our analysis and opinions as of June 30, 2018, unless otherwise indicated. The information is not a complete analysis of every aspect of any market, country, industry, security or fund. Statements of fact are from sources considered reliable.
Contents
Semiannual Report
| Franklin Mutual International Fund | 3 | |||
| Performance Summary | 9 | |||
| Your Fund’s Expenses | 11 | |||
| Financial Highlights and Statement of Investments | 12 | |||
| Financial Statements | 22 | |||
| Notes to Financial Statements | 26 | |||
| Shareholder Information | 38 | |||
Visit franklintempleton.com for fund updates, to access your account, or to find helpful financial planning tools.
| 2 | Not part of the semiannual report | franklintempleton.com |
Semiannual Report
Franklin Mutual International Fund
This semiannual report for Franklin Mutual International Fund covers the period ended June 30, 2018.
Your Fund’s Goal and Main Investments
The Fund seeks capital appreciation, which may occasionally be short term, with income as a secondary goal. Under normal market conditions, the Fund invests at least 80% of its net assets in securities of non-US issuers, primarily Asian and European companies. The investment manager focuses the Fund’s investments on securities believed to be available at market prices less than their intrinsic value. The equity securities in which the Fund invests are primarily common stocks, with a current focus on mid- and large-cap companies. To a lesser extent, the Fund also invests in merger arbitrage securities and the debt and equity of distressed companies. The Geographic Composition bar chart on page 4 lists the leading countries where the Fund invests.
Performance Overview
The Fund’s Class Z shares had a -3.20% cumulative total return for the six months ended June 30, 2018. In comparison, the Fund’s benchmark, the MSCI All Country World Index (ACWI) ex USA Net Return (Local Currency), which is a free float-adjusted,1 market capitalization-weighted index designed to measure equity market performance in global developed and emerging markets, had a -1.25% total return.2 Also for comparison, the Fund’s secondary benchmark, the MSCI ACWI ex USA Net Return (US dollar) had a -3.77% total return.2 You can find more of the Fund’s performance data in the Performance Summary beginning on page 9.
Performance data represent past performance, which does not guarantee future results. Investment return and principal value will fluctuate, and you may have a gain or loss when you sell your shares. Current performance may differ from figures shown. For most recent month-end performance, go to franklintempleton.com or call (800) 342-5236.
Economic and Market Overview
The global economy expanded during the six-month period under review amid generally upbeat economic data across regions. In this environment, global developed and emerging market stocks reached a new all-time high in January 2018, as measured by the MSCI All Country World Index (ACWI). During the period, global markets were aided by price gains in oil and other commodities, encouraging corporate earnings reports and investor optimism about global economic growth. However, global stocks had a -0.13% total return for the six-month period, as measured by the MSCI ACWI, largely due to an overall decline in emerging market stocks.2
Global markets reflected investor concerns about tensions in the Korean peninsula and political uncertainties in the US and the European Union, as well as worries that strong economic growth and rising inflation in some parts of the world, particularly in the US, would lead central banks to increase interest rates sooner than expected. Markets were further pressured by the Trump administration’s protectionist trade policies, uncertainty surrounding the US-China trade relationship, and a broad sell-off in information technology stocks in March due to a potential for tighter regulation in the sector arising from concerns about consumer data privacy. Near period-end, an overall easing of tensions in the Korean peninsula relieved investors, but ongoing US trade disputes with its allies and China hindered global markets.
The US economy continued to grow during the six months under review. After moderating for three consecutive quarters, the economy grew faster in 2018’s second quarter, driven by consumer spending, exports, business investment and
1. A “free float-adjusted” index means that companies with larger proportions of their shares being actively traded, rather than being held by company insiders, governments or cross held by other companies, receive higher weightings within the index.
2. Source: Morningstar.
The indexes are unmanaged and include reinvestment of any income or distributions. They do not reflect any fees, expenses or sales charges. One cannot invest directly in an index, and an index is not representative of the Fund’s portfolio.
The dollar value, number of shares or principal amount, and names of all portfolio holdings are listed in the Fund’s Statement of Investments (SOI). The SOI begins on page 17.
| franklintempleton.com | Semiannual Report | 3 |
FRANKLIN MUTUAL INTERNATIONAL FUND
government spending. The unemployment rate declined from 4.1% in December 2017, as reported at the beginning of the six-month period, to 4.0% at period-end.3 Annual inflation, as measured by the Consumer Price Index, increased from 2.1% in December 2017, as reported at the beginning of the period, to 2.9% at period-end.3 The US Federal Reserve raised its target range for the federal funds rate in March and June 2018 and continued reducing its balance sheet as part of its ongoing plan to normalize monetary policy.
In Europe, the UK’s quarterly economic growth moderated in 2018’s first quarter amid a decline in construction output. The Bank of England kept its key policy rate unchanged during the period. The eurozone’s quarterly growth moderated in 2018’s first quarter due to a decline in external demand. The bloc’s annual inflation rate ended the period higher than in December 2017. The European Central Bank (ECB) kept its benchmark interest rate unchanged during the period. However, at its June meeting, the ECB announced it would further reduce its monthly bond purchases beginning in October 2018 and indicated it would conclude the program at the end of 2018 while continuing to keep interest rates unchanged through at least the summer of 2019.
In Asia, Japan’s quarterly gross domestic product (GDP) growth in 2018’s first quarter was negative, the country’s first contraction since 2015’s fourth quarter, mainly due to a decline in private residential investment and household consumption. The Bank of Japan left its benchmark interest rate unchanged during the period and continued its monetary stimulus measures.
In emerging markets, Brazil’s quarterly GDP accelerated in 2018’s first quarter compared to the previous quarter. The country’s central bank cut its benchmark interest rate twice during the period to spur economic growth. Russia’s annual GDP grew in 2018’s first quarter compared to the prior-year period, amid the Bank of Russia’s continued policy support. China’s annual GDP moderated in 2018’s first quarter compared to the prior-year period. The People’s Bank of China left its benchmark interest rate unchanged during the period. Overall, emerging market stocks, as measured by the MSCI Emerging Markets Index, declined during the period.
Investment Strategy
At Franklin Mutual Series, we are committed to our distinctive value approach to investing, which we believe can generate above-average risk-adjusted returns over time for our
3. Source: Bureau of Labor Statistics.
Geographic Composition*
Based on Total Net Assets as of 6/30/18
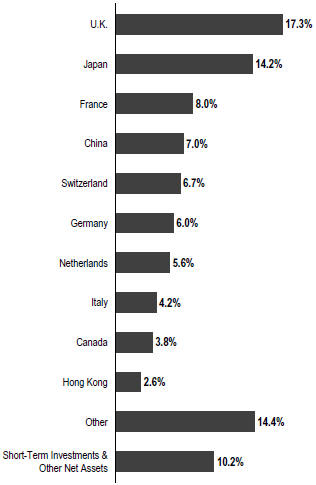
*Figures are stated as a percentage of total and may not equal 100% or may be negative due to rounding, use of any derivatives, unsettled trades or other factors.
shareholders. Our major investment strategy is investing in undervalued stocks in Asia and Europe. We have the ability to invest in emerging markets, although this is unlikely to be a significant focus of our strategy. When selecting undervalued equities, we are attracted to what we believe are fundamentally strong companies with healthy balance sheets, high-quality assets, substantial free cash flow and shareholder-oriented management teams and whose stocks are trading at discounts to our assessment of the companies’ intrinsic or business value. We also look for asset-rich companies whose shares may be trading at depressed levels due to concerns over short-term earnings disappointments, litigation, management strategy or other perceived negatives. This strict value approach is not only intended to improve the likelihood of upside potential, but also reduces the risk of substantial declines, in our opinion. While
| 4 | Semiannual Report | franklintempleton.com |
FRANKLIN MUTUAL INTERNATIONAL FUND
the vast majority of our undervalued equity investments are made in publicly traded companies internationally, we may invest occasionally in privately held companies as well.
We complement this more traditional investment strategy with two others. One is distressed investing, a highly specialized field that has proven quite profitable during certain periods over the years. Distressed investing is complex and can take many forms. The most common distressed investment the Fund undertakes is the purchase of financially troubled or bankrupt companies’ debt at a substantial discount to face value. After the financially distressed company is reorganized, the old debt is typically replaced with new securities issued by the financially stronger company.
The other piece of our investment strategy is participating in arbitrage situations, another highly specialized field. When companies announce proposed mergers or takeovers, commonly referred to as “deals,” the target company may trade at a discount to the bid it ultimately accepts. One form of arbitrage involves purchasing the target company’s stock when it is trading below the value we believe it would receive in a deal. In keeping with our commitment to a relatively conservative investment approach, we typically focus our arbitrage efforts on announced deals, and avoid rumored deals or other situations we consider relatively risky. In addition, it is our practice to hedge the Fund’s currency exposure when we deem it advantageous for our shareholders.
What is meant by “hedge”?
To hedge an investment is to take a position intended to offset
|
Manager’s Discussion
In the first half of 2018, positive corporate fundamentals were overshadowed by political and economic concerns. Corporate profits in the US and other developed markets continued their impressive year-over-year pace of growth. In the US and other developed markets, economic activity moderated during the first quarter, but appeared to have recovered during the second quarter. Financial markets were also aided by improved industrial commodity prices, most notably crude oil. Nonetheless, investor sentiment became less upbeat and volatility returned to financial markets, after an historically calm 2017. These times present an opportunity for us as bottom-up stock pickers to find stocks that we view as unreasonably caught up in broader market weakness. The Top 10 Sectors/Industries table on this page lists insurance; oil, gas
| Top 10 Sectors/Industries | ||||
| Based on Equity Securities as of 6/30/18 | ||||
| % of Total Net Assets | ||||
| Insurance | 16.1% | |||
| Oil, Gas & Consumable Fuels | 10.0% | |||
| Banks | 8.9% | |||
| Pharmaceuticals | 4.4% | |||
| Automobiles | 4.3% | |||
| Auto Components | 3.9% | |||
| Hotels, Restaurants & Leisure | 3.7% | |||
| Capital Markets | 3.5% | |||
| Beverages | 3.3% | |||
| Internet Software & Services | 3.2% | |||
and consumable fuels; and also other leading industries in which the Fund currently invests.
As investors entered 2018, overall US equity market valuations
(e.g., price-to-earnings, price-to-book or price-to-sales) were elevated relative to most historical benchmarks. The uneven equity market performance during the period and the strong pace of corporate earnings growth helped to reduce valuations somewhat. At the same time, the rise in volatility provided us with select opportunities to initiate or add to positions in companies that we believed were trading at undeservedly discounted prices.
A further escalation of trade-related rhetoric and tariffs, in our view, could have important consequences for the US and abroad. We have already begun to see disruptions to global supply chains and added pressure on China’s financial and credit markets. Additional tariffs imposed by the US and its trading partners could rattle business confidence, curb corporate earnings growth, undermine favorable fundamentals in specific industries, provoke further financial market volatility and raise uncertainty regarding the solid pace of global growth.
Europe’s equity market overall was still trading at an attractively lower price-to-earnings multiple and higher dividend yield than the US equity market at period-end. However, in addition to trade tensions, we are paying close attention to Brexit negotiations, Italy’s new populist government, a potentially fraying relationship between Germany’s two conservative parties and the future of the international nuclear deal with Iran. As of period-end, we still believe Europe’s economic recovery is fairly resilient, but any of the aforementioned challenges has the potential to fuel volatility and even slow economic growth. In such an
| franklintempleton.com | Semiannual Report | 5 |
FRANKLIN MUTUAL INTERNATIONAL FUND
environment, we believe domestically oriented companies may fare relatively better.
In Asia, we have said for some time that China needs to address the high level of corporate leverage, and the People’s Bank of China has recently mandated that much of the debt residing in the shadow banking market be brought back onto bank balance sheets. The resulting burden may impair bank earnings in the short term, which, in our view, is underappreciated by many investors and could create some investment opportunities. Meanwhile, Japan’s government has proposed further amendments to its Corporate Governance Code. We believe the proposals have the potential to drive further improvements in capital allocation and operating discipline, which have long been a concern of investors. We have become more interested in finding opportunities to take advantage of this emerging trend. Coca-Cola Bottlers Japan Holdings and JXTG Holdings are two Japan-based companies listed among the Fund’s largest positions in the Top 10 Equity Holdings table on this page.
Fund Performance
Turning to Fund performance, top contributors included China-based wind farm operator China Longyuan Power Group, Netherlands-based Koninklijke Philips4 and Finland-based global communications and information technology company Nokia.
China Longyuan Power Group is the largest wind farm operator in China. The company’s stock reacted positively during the period to a Chinese government announcement of a policy draft that demonstrated its support of and removed some uncertainties for renewable energy. In addition, Longyuan reported good quarterly results in April 2018 with net profit increasing by more than 60% on a year-over-year basis. The strong result was primarily driven by utilization improvement of its wind farms.
Koninklijke Philips is near the end of its restructuring efforts. In line with our initial investment thesis, the company has almost fully pivoted its business model from being an industrial conglomerate to becoming a focused health care technology company. In April, Philips reported better-than-expected results, particularly strong order growth overall and sales growth within its diagnostics and treatment business. Recent positive results have increased our confidence in management’s ability to deliver on its long-term strategy and targets.
4. Not held at period-end.
| Top 10 Equity Holdings | ||||
| 6/30/18 | ||||
| Company Sector/Industry, Country | % of Total Net Assets | |||
| Coca-Cola Bottlers Japan Holdings Inc. Beverages, Japan | 3.3% | |||
| Enel SpA Electric Utilities, Italy | 2.6% | |||
| Volkswagen AG Automobiles, Germany | 2.4% | |||
| JXTG Holdings Inc. Oil, Gas & Consumable Fuels, Japan | 2.2% | |||
| Accor SA Hotels, Restaurants & Leisure, France | 2.2% | |||
| Novartis AG Pharmaceuticals, Switzerland | 2.2% | |||
| GlaxoSmithKline PLC Pharmaceuticals, U.K. | 2.2% | |||
| ASR Nederland NV Insurance, Netherlands | 2.1% | |||
| NN Group NV Insurance, Netherlands | 2.1% | |||
| Royal Dutch Shell PLC Oil, Gas & Consumable Fuels, U.K. | 2.1% | |||
Nokia announced solid fourth-quarter and full-year 2017 results in February 2018, particularly better-than-expected profits for 2017 and significant improvement in cash flow. Management also issued a new earnings target for 2020 that was higher than many investors had anticipated. Subsequent quarterly results issued in April 2018 were weaker than expected, but management emphasized the company’s strong levels of new and existing orders and indicated that sales for full-year 2018 could exceed its previous guidance. We believe Nokia is serious about cutting costs and improving cash flow following its acquisition of Alcatel in 2016 to increase its dividend in 2018 and stay on course to reach its 2020 earnings target.
During the period under review, Fund investments that detracted from performance included UK-based global mobile telecommunications company Vodafone, Japan-based Toyo Tire & Rubber and Philippines-based Metro Pacific Investments.
Vodafone Group is a UK-based global mobile telecommunications company. In May 2018, it reported better-than-expected fiscal year-end results, but the outlook for fiscal year 2019 was below expectations with much of the growth forecast to come in the latter part of the year. In addition, Vodafone chief
| 6 | Semiannual Report | franklintempleton.com |
FRANKLIN MUTUAL INTERNATIONAL FUND
executive officer (CEO) Vittorio Colao announced his intention to retire in October 2018. The CEO’s decision was not a total surprise given his decade long tenure, but the timing was unexpected given Vodafone’s purchase of certain Liberty Global5 assets that is still being reviewed by government regulators. We believe that Vodafone will receive regulatory approval. In addition, the naming of Nick Read, the current chief financial officer (CFO), as the new CEO, and promoting the deputy CFO, signal the board’s focus on operating performance after a period of addressing the major strategic issues facing the company.
Toyo Tire & Rubber is a niche tire company with a focus on large, specialty tires for SUVs (sports utility vehicles) and pickup trucks. Investors reacted negatively to factors that we believe to be temporary. Weaker-than-expected fourth-quarter results were related to increased purchases in Japan before the period, due to an impending price increase for tires. Also, management’s announcement of higher costs in 2018 was largely driven by capacity expansion, which will bring benefits in 2019, in our view. Since then, Toyo Tire made steady progress by delivering solid first-quarter results in 2018. Although weak investor sentiment toward tire makers also weighed on the stock, we continue to like it because of its highly profitable specialty tires and what we consider cheap valuation.
Metro Pacific invests in utility, real estate and infrastructure projects in the Philippines. Shares of the company declined due in part to an ongoing rate dispute between the Philippine government and a water utility owned by Metro Pacific. In February 2018, the government appealed to an international tribunal to reverse a prior ruling. In the original decision, the tribunal stated that the Philippine government should not have rejected a rate increase request by the water utility and ordered the government to pay for lost revenue. A tribunal decision is expected by August 2018. Although the stock was trading below its intrinsic value at period-end, Metro Pacific’s impressive full-year 2017 results despite the ongoing dispute gave us further confidence in the company’s operational ability.
During the period, the Fund held currency forwards and futures seeking to hedge most of the currency risk of the portfolio’s non-US dollar investments. The hedges had a positive overall impact on the Fund’s performance because of the appreciation of the US dollar versus the hedged currencies.
CFA® is a trademark owned by CFA Institute.
5. Not a Fund holding.
See www.franklintempletondatasources.com for additional data provider information.
What is a currency forward?
A currency forward is a direct agreement between the Fund and a counterparty to buy or sell a foreign currency in exchange for another currency at a specific exchange rate on a future date.
|
What is a future?
A future is an agreement between the Fund and a counterparty made through a US or foreign futures exchange to buy or sell an underlying instrument or asset at a specific price on a future date.
|
As fellow shareholders, we found recent relative and absolute performance disappointing, but it is not uncommon for our strategy to lag the equity markets at times. We remain committed to our disciplined, value investment approach as we seek to generate attractive, long-term, risk-adjusted returns for shareholders.
Thank you for your participation in Franklin Mutual International Fund. We look forward to continuing to serve your investment needs.
 |  | |
| Andrew Sleeman, CFA | ||
| Co-Portfolio Manager | ||
 |  | |
| Timothy Rankin, CFA | ||
| Co-Portfolio Manager | ||
| franklintempleton.com | Semiannual Report | 7 |
FRANKLIN MUTUAL INTERNATIONAL FUND
The foregoing information reflects our analysis, opinions and portfolio holdings as of June 30, 2018, the end of the reporting period. The way we implement our main investment strategies and the resulting portfolio holdings may change depending on factors such as market and economic conditions. These opinions may not be relied upon as investment advice or an offer for a particular security. The information is not a complete analysis of every aspect of any market, country, industry, security or the Fund. Statements of fact are from sources considered reliable, but the investment manager makes no representation or warranty as to their completeness or accuracy. Although historical performance is no guarantee of future results, these insights may help you understand our investment management philosophy.
Andrew Sleeman has been a co-portfolio manager for Franklin Mutual International Fund since 2009. Mr. Sleeman joined Franklin Templeton Investments in 2007. Previously, he was with Fox-Pitt, Kelton, a financials specialist firm, where he focused on international financial equities. Prior to that, he worked in international equities at BNP Paribas. Mr. Sleeman also worked in Australia in the fixed income division of JP Morgan Investment Management.
|
Timothy Rankin rejoined the Franklin Mutual Series investment group in 2010 and currently serves as co-portfolio manager for Franklin Mutual International Fund, and as a research analyst, responsible for the analysis of the global energy and chemical industries. Mr. Rankin had previously worked at Franklin Mutual Series from 1997 through 2004. Mr. Rankin has over 20 years of experience in the investment management industry, including over 10 years with Franklin Mutual Series as a research analyst and portfolio manager. Before his most recent employment with Franklin Mutual Series, he was managing director of Blue Harbour Group, LLC, a private investment firm focused on small- and mid-cap North American companies. Prior to his original employment with Franklin Mutual Series, Mr. Rankin was an equity analyst at Glickenhaus & Co.
|
| 8 | Semiannual Report | franklintempleton.com |
FRANKLIN MUTUAL INTERNATIONAL FUND
Performance Summary as of June 30, 2018
The performance table does not reflect any taxes that a shareholder would pay on Fund dividends, capital gain distributions, if any, or any realized gains on the sale of Fund shares. Total return reflects reinvestment of the Fund’s dividends and capital gain distributions, if any, and any unrealized gains or losses. Your dividend income will vary depending on dividends or interest paid by securities in the Fund’s portfolio, adjusted for operating expenses of each class. Capital gain distributions are net profits realized from the sale of portfolio securities.
Performance as of 6/30/181
Cumulative total return excludes sales charges. Average annual total return includes maximum sales charges. Sales charges will vary depending on the size of the investment and the class of share purchased. The maximum is 5.75% and the minimum is 0%. Class A: 5.75% maximum initial sales charge. For other share classes, visit franklintempleton.com.
| Share Class | Cumulative Total Return2 | Average Annual Total Return3 | ||||||
Z | ||||||||
6-Month | -3.20% | -3.20% | ||||||
1-Year | +1.35% | +1.35% | ||||||
5-Year | +31.09% | +5.56% | ||||||
Since Inception (5/1/09) | +105.51% | +8.18% | ||||||
A | ||||||||
6-Month | -3.33% | -8.84% | ||||||
1-Year | +1.08% | -4.76% | ||||||
5-Year | +29.36% | +4.04% | ||||||
Since Inception (5/1/09) | +100.32% | +7.18% | ||||||
Performance data represent past performance, which does not guarantee future results. Investment return and principal value will fluctuate, and you may have a gain or loss when you sell your shares. Current performance may differ from figures shown. For most recent month-end performance, go to franklintempleton.com or call (800) 342-5236.
See page 10 for Performance Summary footnotes.
| franklintempleton.com | Semiannual Report | 9 |
FRANKLIN MUTUAL INTERNATIONAL FUND
PERFORMANCE SUMMARY
Total Annual Operating Expenses4
| Share Class | With Waiver | Without Waiver | ||||||
Z | 0.97% | 1.17% | ||||||
A | 1.22% | 1.42% | ||||||
Each class of shares is available to certain eligible investors and has different annual fees and expenses, as described in the prospectus.
All investments involve risks, including possible loss of principal. Value securities may not increase in price as anticipated or may decline further in value. Special risks are associated with foreign investing, including currency fluctuations, economic instability and political developments; investments in emerging markets involve heightened risks related to the same factors. Because the Fund may invest its assets in companies in a specific region, including Europe, it is subject to greater risks of adverse developments in that region and/or the surrounding regions than a fund that is more broadly diversified geographically. Current political and financial uncertainty surrounding the European Union may increase market volatility and the economic risk of investing in companies in Europe. Smaller company stocks have exhibited greater price volatility than larger company stocks, particularly over the short term. The Fund’s investments in companies engaged in mergers, reorganizations or liquidations also involve special risks as pending deals may not be completed on time or on favorable terms. The Fund may invest in lower rated bonds, which entail higher credit risk. The Fund is actively managed but there is no guarantee that the manager’s investment decisions will produce the desired results. The Fund’s prospectus also includes a description of the main investment risks.
1. The Fund has an expense reduction contractually guaranteed through 4/30/19. Fund investment results reflect the expense reduction; without this reduction, the results would have been lower.
2. Cumulative total return represents the change in value of an investment over the periods indicated.
3. Average annual total return represents the average annual change in value of an investment over the periods indicated. Return for less than one year, if any, has not been annualized.
4. Figures are as stated in the Fund’s current prospectus and may differ from the expense ratios disclosed in the Your Fund’s Expenses and Financial Highlights sections in this report. In periods of market volatility, assets may decline significantly, causing total annual Fund operating expenses to become higher than the figures shown.
| 10 | Semiannual Report | franklintempleton.com |
FRANKLIN MUTUAL INTERNATIONAL FUND
Your Fund’s Expenses
As a Fund shareholder, you can incur two types of costs: (1) transaction costs, including sales charges (loads) on Fund purchases and redemptions; and (2) ongoing Fund costs, including management fees, distribution and service (12b-1) fees, and other Fund expenses. All mutual funds have ongoing costs, sometimes referred to as operating expenses. The table below shows ongoing costs of investing in the Fund and can help you understand these costs and compare them with those of other mutual funds. The table assumes a $1,000 investment held for the six months indicated.
Actual Fund Expenses
The table below provides information about actual account values and actual expenses in the columns under the heading “Actual.” In these columns the Fund’s actual return, which includes the effect of Fund expenses, is used to calculate the “Ending Account Value” for each class of shares. You can estimate the expenses you paid during the period by following these steps (of course, your account value and expenses will differ from those in this illustration): Divide your account value by $1,000 (if your account had an $8,600 value, then $8,600 ÷ $1,000 = 8.6). Then multiply the result by the number in the row for your class of shares under the headings “Actual” and “Expenses Paid During Period” (if Actual Expenses Paid During Period were $7.50, then 8.6 x $7.50 = $64.50). In this illustration, the actual expenses paid this period are $64.50.
Hypothetical Example for Comparison with Other Funds
Under the heading “Hypothetical” in the table, information is provided about hypothetical account values and hypothetical expenses based on the Fund’s actual expense ratio and an assumed rate of return of 5% per year before expenses, which is not the Fund’s actual return. This information may not be used to estimate the actual ending account balance or expenses you paid for the period, but it can help you compare ongoing costs of investing in the Fund with those of other funds. To do so, compare this 5% hypothetical example for the class of shares you hold with the 5% hypothetical examples that appear in the shareholder reports of other funds.
Please note that expenses shown in the table are meant to highlight ongoing costs and do not reflect any transactional costs. Therefore, information under the heading “Hypothetical” is useful in comparing ongoing costs only, and will not help you compare total costs of owning different funds. In addition, if transactional costs were included, your total costs would have been higher.
| Actual (actual return after expenses) | Hypothetical (5% annual return before expenses) | |||||||||||||||||
| Share Class | Beginning Account Value 1/1/18 | Ending Account Value 6/30/18 | Expenses Paid During 1/1/18–6/30/181,2,3 | Ending Account Value 6/30/18 | Expenses Paid During Period 1/1/18–6/30/181,2,3 | Net Annualized | ||||||||||||
|
|
|
| |||||||||||||||
Z | $1,000 | $968.00 | $4.88 | $1,019.84 | $5.01 | 1.00% | ||||||||||||
A | $1,000 | $966.70 | $6.10 | $1,018.60 | $6.26 | 1.25% | ||||||||||||
C | $1,000 | $963.00 | $9.73 | $1,014.88 | $9.99 | 2.00% | ||||||||||||
R | $1,000 | $965.20 | $7.31 | $1,017.36 | $7.50 | 1.50% | ||||||||||||
R6 | $1,000 | $968.70 | $4.15 | $1,020.58 | $4.26 | 0.85% | ||||||||||||
1. Expenses are equal to the annualized expense ratio for the six-month period as indicated above—in the far right column—multiplied by the simple average account value over the period indicated, and then multiplied by 181/365 to reflect the one-half year period.
2. Reflects expenses after fee waivers and expense reimbursements. Does not include acquired fund fees and expenses.
3. Effective February 1, 2018, the expense waivers for Classes Z, A, C, R and R6 changed and the new annualized net expense ratios for each class were: Class Z 0.97%, Class A 1.22%, Class C 1.97%, Class R 1.47% and Class R6 0.83%. Had such expense waivers been in effect for the full period, the Actual expenses paid for each share class would have been: Z $4.73, A $5.95, C $9.59, R $7.16 and R6 $4.05, and the Hypothetical expenses paid for each share class would have been: Z $4.86, A $6.11, C $9.84, R $7.35 and R6 $4.16.
| franklintempleton.com | Semiannual Report | 11 |
FRANKLIN MUTUAL INTERNATIONAL FUND
Financial Highlights
Six Months Ended (unaudited) | Year Ended December 31, | |||||||||||||||||||||||||||
| 2017 | 2016 | 2015 | 2014 | 2013 | ||||||||||||||||||||||||
Class Z | ||||||||||||||||||||||||||||
| Per share operating performance | ||||||||||||||||||||||||||||
(for a share outstanding throughout the period) | ||||||||||||||||||||||||||||
Net asset value, beginning of period | $15.96 | $14.32 | $14.17 | $14.59 | $15.90 | $13.58 | ||||||||||||||||||||||
| Income from investment operationsa: | ||||||||||||||||||||||||||||
Net investment incomeb | 0.22 | 0.21 | 0.27 | c | 0.18 | d | 0.30 | e | 0.24 | |||||||||||||||||||
Net realized and unrealized gains (losses) | (0.73 | ) | 1.78 | 0.20 | (0.17 | ) | (0.57 | ) | 2.42 | |||||||||||||||||||
Total from investment operations | (0.51 | ) | 1.99 | 0.47 | 0.01 | (0.27 | ) | 2.66 | ||||||||||||||||||||
| Less distributions from: | ||||||||||||||||||||||||||||
Net investment income | — | (0.35 | ) | (0.27 | ) | (0.16 | ) | (0.43 | ) | (0.24 | ) | |||||||||||||||||
Net realized gains | — | — | (0.05 | ) | (0.27 | ) | (0.61 | ) | (0.10 | ) | ||||||||||||||||||
Total distributions | — | (0.35 | ) | (0.32 | ) | (0.43 | ) | (1.04 | ) | (0.34 | ) | |||||||||||||||||
| Net asset value, end of period | $15.45 | $15.96 | $14.32 | $14.17 | $14.59 | $15.90 | ||||||||||||||||||||||
Total returnf | (3.20)% | 13.99% | 3.34% | 0.15% | (1.63)% | 19.71% | ||||||||||||||||||||||
| Ratios to average net assetsg | ||||||||||||||||||||||||||||
Expenses before waiver and payments by affiliatesh | 1.17% | 1.17% | 1.22% | 1.24% | 1.39% | 1.49% | ||||||||||||||||||||||
Expenses net of waiver and payments by affiliatesh,i | 1.00% | 1.16% | 1.17% | 1.15% | 1.16% | 1.17% | ||||||||||||||||||||||
Expenses incurred in connection with securities sold short | —% | —% | —% | —% | —%j | —% | ||||||||||||||||||||||
Net investment income | 2.82% | 1.41% | 2.07%c | 1.26%d | 1.78%e | 1.64% | ||||||||||||||||||||||
| Supplemental data | ||||||||||||||||||||||||||||
Net assets, end of period (000’s) | $78,136 | $86,274 | $40,875 | $49,963 | $19,940 | $14,732 | ||||||||||||||||||||||
Portfolio turnover rate | 14.02% | 38.77% | 24.87% | 28.64% | 54.78% | 41.47% | ||||||||||||||||||||||
aThe amount shown for a share outstanding throughout the period may not correlate with the Statement of Operations for the period due to the timing of sales and repurchases of the Fund’s shares in relation to income earned and/or fluctuating fair value of the investments of the Fund.
bBased on average daily shares outstanding.
cNet investment income per share includes approximately $0.06 per share related to income received in the form of special dividends in connection with certain Fund holdings. Excluding this amount, the ratio of net investment income to average net assets would have been 1.63%.
dNet investment income per share includes approximately $0.08 per share related to income received in the form of special dividends in connection with certain Fund holdings. Excluding this amount, the ratio of net investment income to average net assets would have been 0.71%.
eNet investment income per share includes approximately $0.08 per share related to income received in the form of special dividends in connection with certain Fund holdings. Excluding this amount, the ratio of net investment income to average net assets would have been 1.27%.
fTotal return is not annualized for periods less than one year.
gRatios are annualized for periods less than one year.
hIncludes dividend and/or interest expense on securities sold short and security borrowing fees, if any. See below for the ratios of such expenses to average net assets for the periods presented. See Note 1(d).
iBenefit of expense reduction rounds to less than 0.01%.
jRounds to less than 0.01%.
| 12 | Semiannual Report | The accompanying notes are an integral part of these financial statements. | franklintempleton.com |
FRANKLIN MUTUAL INTERNATIONAL FUND
FINANCIAL HIGHLIGHTS
Six Months Ended (unaudited) | Year Ended December 31, | |||||||||||||||||||||||||||
| 2017 | 2016 | 2015 | 2014 | 2013 | ||||||||||||||||||||||||
Class A | ||||||||||||||||||||||||||||
| Per share operating performance | ||||||||||||||||||||||||||||
(for a share outstanding throughout the period) | ||||||||||||||||||||||||||||
Net asset value, beginning of period | $15.90 | $14.25 | $14.10 | $14.54 | $15.84 | $13.54 | ||||||||||||||||||||||
| Income from investment operationsa: | ||||||||||||||||||||||||||||
Net investment incomeb | 0.20 | 0.18 | 0.24 | c | 0.15 | d | 0.26 | e | 0.20 | |||||||||||||||||||
Net realized and unrealized gains (losses) | (0.73 | ) | 1.78 | 0.19 | (0.19 | ) | (0.57 | ) | 2.41 | |||||||||||||||||||
Total from investment operations | (0.53 | ) | 1.96 | 0.43 | (0.04 | ) | (0.31 | ) | 2.61 | |||||||||||||||||||
| Less distributions from: | ||||||||||||||||||||||||||||
Net investment income | — | (0.31 | ) | (0.23 | ) | (0.13 | ) | (0.38 | ) | (0.21) | ||||||||||||||||||
Net realized gains | — | — | (0.05 | ) | (0.27 | ) | (0.61 | ) | (0.10 | ) | ||||||||||||||||||
Total distributions | — | (0.31 | ) | (0.28 | ) | (0.40 | ) | (0.99 | ) | (0.31) | ||||||||||||||||||
| Net asset value, end of period | $15.37 | $15.90 | $14.25 | $14.10 | $14.54 | $15.84 | ||||||||||||||||||||||
Total returnf | (3.33)% | 13.67% | 3.14% | (0.20)% | (1.89)% | 19.34% | ||||||||||||||||||||||
| Ratios to average net assetsg | ||||||||||||||||||||||||||||
Expenses before waiver and payments by affiliatesh | 1.42% | 1.42% | 1.47% | 1.52% | 1.69% | 1.79% | ||||||||||||||||||||||
Expenses net of waiver and payments by affiliatesh,i | 1.25% | 1.41% | 1.42% | 1.43% | 1.46% | 1.47% | ||||||||||||||||||||||
Expenses incurred in connection with securities sold short | —% | —% | —% | —% | —%j | —% | ||||||||||||||||||||||
Net investment income | 2.57% | 1.16% | 1.82%c | 0.98%d | 1.48%e | 1.34% | ||||||||||||||||||||||
| Supplemental data | ||||||||||||||||||||||||||||
Net assets, end of period (000’s) | $70,677 | $82,965 | $82,626 | $110,591 | $39,810 | $35,319 | ||||||||||||||||||||||
Portfolio turnover rate | 14.02% | 38.77% | 24.87% | 28.64% | 54.78% | 41.47% | ||||||||||||||||||||||
aThe amount shown for a share outstanding throughout the period may not correlate with the Statement of Operations for the period due to the timing of sales and repurchases of the Fund’s shares in relation to income earned and/or fluctuating fair value of the investments of the Fund.
bBased on average daily shares outstanding.
cNet investment income per share includes approximately $0.06 per share related to income received in the form of special dividends in connection with certain Fund holdings. Excluding this amount, the ratio of net investment income to average net assets would have been 1.38%.
dNet investment income per share includes approximately $0.08 per share related to income received in the form of special dividends in connection with certain Fund holdings. Excluding this amount, the ratio of net investment income to average net assets would have been 0.43%.
eNet investment income per share includes approximately $0.08 per share related to income received in the form of special dividends in connection with certain Fund holdings. Excluding this amount, the ratio of net investment income to average net assets would have been 0.97%.
fTotal return does not reflect sales commissions or contingent deferred sales charges, if applicable, and is not annualized for periods less than one year.
gRatios are annualized for periods less than one year.
hIncludes dividend and/or interest expense on securities sold short and security borrowing fees, if any. See below for the ratios of such expenses to average net assets for the periods presented. See Note 1(d).
iBenefit of expense reduction rounds to less than 0.01%.
jRounds to less than 0.01%.
| franklintempleton.com | The accompanying notes are an integral part of these financial statements. | Semiannual Report | 13 |
FRANKLIN MUTUAL INTERNATIONAL FUND
FINANCIAL HIGHLIGHTS
Six Months Ended (unaudited) | Year Ended December 31, | |||||||||||||||||||||||||||
| 2017 | 2016 | 2015 | 2014 | 2013 | ||||||||||||||||||||||||
Class C | ||||||||||||||||||||||||||||
| Per share operating performance | ||||||||||||||||||||||||||||
(for a share outstanding throughout the period) | ||||||||||||||||||||||||||||
Net asset value, beginning of period | $15.69 | $14.08 | $13.92 | $14.38 | $15.68 | $13.41 | ||||||||||||||||||||||
| Income from investment operationsa: | ||||||||||||||||||||||||||||
Net investment incomeb | 0.14 | 0.08 | 0.15 | c | 0.04 | d | 0.15 | e | 0.10 | |||||||||||||||||||
Net realized and unrealized gains (losses) | (0.72 | ) | 1.72 | 0.18 | (0.18 | ) | (0.56 | ) | 2.38 | |||||||||||||||||||
Total from investment operations | (0.58 | ) | 1.80 | 0.33 | (0.14 | ) | (0.41 | ) | 2.48 | |||||||||||||||||||
| Less distributions from: | ||||||||||||||||||||||||||||
Net investment income | — | (0.19 | ) | (0.12 | ) | (0.05 | ) | (0.28 | ) | (0.11 | ) | |||||||||||||||||
Net realized gains | — | — | (0.05 | ) | (0.27 | ) | (0.61 | ) | (0.10 | ) | ||||||||||||||||||
Total distributions | — | (0.19 | ) | (0.17 | ) | (0.32 | ) | (0.89 | ) | (0.21 | ) | |||||||||||||||||
| Net asset value, end of period | $15.11 | $15.69 | $14.08 | $13.92 | $14.38 | $15.68 | ||||||||||||||||||||||
Total returnf | (3.70)% | 12.79% | 2.44% | (0.93)% | (2.58)% | 18.54% | ||||||||||||||||||||||
| Ratios to average net assetsg | ||||||||||||||||||||||||||||
Expenses before waiver and payments by affiliatesh | 2.17% | 2.17% | 2.22% | 2.24% | 2.39% | 2.49% | ||||||||||||||||||||||
Expenses net of waiver and payments by affiliatesh,i | 2.00% | 2.16% | 2.17% | 2.15% | 2.16% | 2.17% | ||||||||||||||||||||||
Expenses incurred in connection with securities sold short | —% | —% | —% | —% | —%j | —% | ||||||||||||||||||||||
Net investment income | 1.82% | 0.41% | 1.07% | c | 0.26% | d | 0.78% | e | 0.64% | |||||||||||||||||||
| Supplemental data | ||||||||||||||||||||||||||||
Net assets, end of period (000’s) | $23,521 | $29,109 | $25,860 | $34,611 | $14,794 | $14,198 | ||||||||||||||||||||||
Portfolio turnover rate | 14.02% | 38.77% | 24.87% | 28.64% | 54.78% | 41.47% | ||||||||||||||||||||||
aThe amount shown for a share outstanding throughout the period may not correlate with the Statement of Operations for the period due to the timing of sales and repurchases of the Fund’s shares in relation to income earned and/or fluctuating fair value of the investments of the Fund.
bBased on average daily shares outstanding.
cNet investment income per share includes approximately $0.06 per share related to income received in the form of special dividends in connection with certain Fund holdings. Excluding this amount, the ratio of net investment income to average net assets would have been 0.63%.
dNet investment income per share includes approximately $0.08 per share related to income received in the form of special dividends in connection with certain Fund holdings. Excluding this amount, the ratio of net investment income to average net assets would have been (0.29)%.
eNet investment income per share includes approximately $0.08 per share related to income received in the form of special dividends in connection with certain Fund holdings. Excluding this amount, the ratio of net investment income to average net assets would have been 0.27%.
fTotal return does not reflect sales commissions or contingent deferred sales charges, if applicable, and is not annualized for periods less than one year.
gRatios are annualized for periods less than one year.
hIncludes dividend and/or interest expense on securities sold short and security borrowing fees, if any. See below for the ratios of such expenses to average net assets for the periods presented. See Note 1(d).
iBenefit of expense reduction rounds to less than 0.01%.
jRounds to less than 0.01%.
| 14 | Semiannual Report | The accompanying notes are an integral part of these financial statements. | franklintempleton.com |
FRANKLIN MUTUAL INTERNATIONAL FUND
FINANCIAL HIGHLIGHTS
Six Months Ended (unaudited) | Year Ended December 31, | |||||||||||||||||||||||||||
| 2017 | 2016 | 2015 | 2014 | 2013 | ||||||||||||||||||||||||
Class R | ||||||||||||||||||||||||||||
| Per share operating performance | ||||||||||||||||||||||||||||
(for a share outstanding throughout the period) | ||||||||||||||||||||||||||||
Net asset value, beginning of period | $15.80 | $14.19 | $14.05 | $14.51 | $15.83 | $13.54 | ||||||||||||||||||||||
| Income from investment operationsa: | ||||||||||||||||||||||||||||
Net investment incomeb | 0.19 | 0.10 | 0.20 | c | 0.04 | d | 0.18 | e | 0.15 | |||||||||||||||||||
Net realized and unrealized gains (losses) | (0.74 | ) | 1.80 | 0.20 | (0.10 | ) | (0.52 | ) | 2.43 | |||||||||||||||||||
Total from investment operations | (0.55 | ) | 1.90 | 0.40 | (0.06 | ) | (0.34 | ) | 2.58 | |||||||||||||||||||
| Less distributions from: | ||||||||||||||||||||||||||||
Net investment income | — | (0.29 | ) | (0.21 | ) | (0.13 | ) | (0.37 | ) | (0.19) | ||||||||||||||||||
Net realized gains | — | — | (0.05 | ) | (0.27 | ) | (0.61 | ) | (0.10 | ) | ||||||||||||||||||
Total distributions | — | (0.29 | ) | (0.26 | ) | (0.40 | ) | (0.98 | ) | (0.29) | ||||||||||||||||||
| Net asset value, end of period | $15.25 | $15.80 | $14.19 | $14.05 | $14.51 | $15.83 | ||||||||||||||||||||||
Total returnf | (3.48)% | 13.43% | 2.90% | (0.38)% | (2.13)% | 19.13% | ||||||||||||||||||||||
| Ratios to average net assetsg | ||||||||||||||||||||||||||||
Expenses before waiver and payments by affiliatesh | 1.67% | 1.64% | 1.72% | 1.74% | 1.89% | 1.99% | ||||||||||||||||||||||
Expenses net of waiver and payments by affiliatesh,i | 1.50% | 1.63% | 1.67% | 1.65% | 1.66% | 1.67% | ||||||||||||||||||||||
Expenses incurred in connection with securities sold short | —% | —% | —% | —% | —%j | —% | ||||||||||||||||||||||
Net investment income | 2.32% | 0.94% | 1.57%c | 0.76%d | 1.28%e | 1.14% | ||||||||||||||||||||||
| Supplemental data | ||||||||||||||||||||||||||||
Net assets, end of period (000’s) | $1,998 | $1,867 | $694 | $662 | $112 | $90 | ||||||||||||||||||||||
Portfolio turnover rate | 14.02% | 38.77% | 24.87% | 28.64% | 54.78% | 41.47% | ||||||||||||||||||||||
aThe amount shown for a share outstanding throughout the period may not correlate with the Statement of Operations for the period due to the timing of sales and repurchases of the Fund’s shares in relation to income earned and/or fluctuating fair value of the investments of the Fund.
bBased on average daily shares outstanding.
cNet investment income per share includes approximately $0.06 per share related to income received in the form of special dividends in connection with certain Fund holdings. Excluding this amount, the ratio of net investment income to average net assets would have been 1.13%.
dNet investment income per share includes approximately $0.08 per share related to income received in the form of special dividends in connection with certain Fund holdings. Excluding this amount, the ratio of net investment income to average net assets would have been 0.21%.
eNet investment income per share includes approximately $0.08 per share related to income received in the form of special dividends in connection with certain Fund holdings. Excluding this amount, the ratio of net investment income to average net assets would have been 0.77%.
fTotal return is not annualized for periods less than one year.
gRatios are annualized for periods less than one year.
hIncludes dividend and/or interest expense on securities sold short and security borrowing fees, if any. See below for the ratios of such expenses to average net assets for the periods presented. See Note 1(d).
iBenefit of expense reduction rounds to less than 0.01%.
jRounds to less than 0.01%.
| franklintempleton.com | The accompanying notes are an integral part of these financial statements. | Semiannual Report | 15 |
FRANKLIN MUTUAL INTERNATIONAL FUND
FINANCIAL HIGHLIGHTS
Six Months Ended (unaudited) | Year Ended December 31, | |||||||||||||||||||||||||||
| 2017 | 2016 | 2015 | 2014 | 2013a | ||||||||||||||||||||||||
Class R6 | ||||||||||||||||||||||||||||
| Per share operating performance | ||||||||||||||||||||||||||||
(for a share outstanding throughout the period) | ||||||||||||||||||||||||||||
Net asset value, beginning of period | $15.97 | $14.32 | $14.17 | $14.59 | $15.87 | $14.26 | ||||||||||||||||||||||
| Income from investment operationsb: | ||||||||||||||||||||||||||||
Net investment incomec | 0.24 | 0.24 | 0.33 | d | 0.22 | e | — | f,g | 0.15 | |||||||||||||||||||
Net realized and unrealized gains (losses) | (0.74 | ) | 1.78 | 0.17 | (0.20 | ) | (0.22 | ) | 1.83 | |||||||||||||||||||
Total from investment operations | (0.50 | ) | 2.02 | 0.50 | 0.02 | (0.22 | ) | 1.98 | ||||||||||||||||||||
| Less distributions from: | ||||||||||||||||||||||||||||
Net investment income | — | (0.37 | ) | (0.30 | ) | (0.17 | ) | (0.45 | ) | (0.27 | ) | |||||||||||||||||
Net realized gains | — | — | (0.05 | ) | (0.27 | ) | (0.61 | ) | (0.10 | ) | ||||||||||||||||||
Total distributions | — | (0.37 | ) | (0.35 | ) | (0.44 | ) | (1.06 | ) | (0.37 | ) | |||||||||||||||||
| Net asset value, end of period | $15.47 | $15.97 | $14.32 | $14.17 | $14.59 | $15.87 | ||||||||||||||||||||||
Total returnh | (3.13)% | 14.11% | 3.58% | 0.23% | (1.46)% | 14.09% | ||||||||||||||||||||||
| Ratios to average net assetsi | ||||||||||||||||||||||||||||
Expenses before waiver and payments by affiliatesj | 1.06% | 1.03% | 1.06% | 1.06% | 1.24% | 2.89% | ||||||||||||||||||||||
Expenses net of waiver and payments by affiliatesj,k | 0.85% | 1.01% | 1.00% | 1.02% | 1.00% | 1.00% | ||||||||||||||||||||||
Expenses incurred in connection with securities sold short | —% | —% | —% | —% | —%l | —% | ||||||||||||||||||||||
Net investment income | 2.97% | 1.56% | 2.24%d | 1.39%e | 1.94%f | 1.81% | ||||||||||||||||||||||
| Supplemental data | ||||||||||||||||||||||||||||
Net assets, end of period (000’s) | $24,735 | $25,697 | $16,687 | $23,793 | $19,398 | $6 | ||||||||||||||||||||||
Portfolio turnover rate | 14.02% | 38.77% | 24.87% | 28.64% | 54.78% | 41.47% | ||||||||||||||||||||||
aFor the period May 1, 2013 (commencement of operations) to December 31, 2013.
bThe amount shown for a share outstanding throughout the period may not correlate with the Statement of Operations for the period due to the timing of sales and repurchases of the Fund’s shares in relation to income earned and/or fluctuating fair value of the investments of the Fund.
cBased on average daily shares outstanding.
dNet investment income per share includes approximately $0.06 per share related to income received in the form of special dividends in connection with certain Fund holdings. Excluding this amount, the ratio of net investment income to average net assets would have been 1.80%.
eNet investment income per share includes approximately $0.08 per share related to income received in the form of special dividends in connection with certain Fund holdings. Excluding this amount, the ratio of net investment income to average net assets would have been 0.84%.
fNet investment income per share includes approximately $0.08 per share related to income received in the form of special dividends in connection with certain Fund holdings. Excluding this amount, the ratio of net investment income to average net assets would have been 1.42%.
gAmount rounds to less than $0.01 per share.
hTotal return is not annualized for periods less than one year.
iRatios are annualized for periods less than one year.
jIncludes dividend and/or interest expense on securities sold short and security borrowing fees, if any. See below for the ratios of such expenses to average net assets for the periods presented. See Note 1(d).
kBenefit of expense reduction rounds to less than 0.01%.
lRounds to less than 0.01%.
| 16 | Semiannual Report | The accompanying notes are an integral part of these financial statements. | franklintempleton.com |
FRANKLIN MUTUAL INTERNATIONAL FUND
Statement of Investments, June 30, 2018 (unaudited)
| Country | Shares | Value | ||||||||||||
| Common Stocks 86.6% | ||||||||||||||
| Auto Components 3.0% | ||||||||||||||
Cie Generale des Etablissements Michelin SCA | France | 14,989 | $ | 1,826,543 | ||||||||||
Toyo Tire & Rubber Co. Ltd | Japan | 280,051 | 4,101,023 | |||||||||||
|
| |||||||||||||
| 5,927,566 | ||||||||||||||
|
| |||||||||||||
| Automobiles 2.0% | ||||||||||||||
Peugeot SA | France | 176,908 | 4,042,865 | |||||||||||
|
| |||||||||||||
| Banks 8.9% | ||||||||||||||
AIB Group PLC | Ireland | 336,291 | 1,827,011 | |||||||||||
| a | Credito Valtellinese SpA | Italy | 28,038,943 | 3,161,273 | ||||||||||
HSBC Holdings PLC | United Kingdom | 235,534 | 2,210,605 | |||||||||||
Shinsei Bank Ltd. | Japan | 255,900 | 3,943,858 | |||||||||||
Societe Generale SA | France | 77,411 | 3,266,354 | |||||||||||
Standard Chartered PLC | United Kingdom | 366,605 | 3,353,143 | |||||||||||
|
| |||||||||||||
| 17,762,244 | ||||||||||||||
|
| |||||||||||||
| Beverages 3.3% | ||||||||||||||
Coca-Cola Bottlers Japan Holdings Inc. | Japan | 165,515 | 6,616,413 | |||||||||||
|
| |||||||||||||
| Capital Markets 3.5% | ||||||||||||||
Credit Suisse Group AG | Switzerland | 204,958 | 3,093,823 | |||||||||||
Deutsche Bank AG | Germany | 183,119 | 1,973,020 | |||||||||||
Guotai Junan Securities Co. Ltd. | China | 852,864 | 1,813,112 | |||||||||||
|
| |||||||||||||
| 6,879,955 | ||||||||||||||
|
| |||||||||||||
| Communications Equipment 1.7% | ||||||||||||||
Nokia OYJ, A | Finland | 356,803 | 2,055,173 | |||||||||||
Nokia OYJ, ADR | Finland | 227,640 | 1,308,930 | |||||||||||
|
| |||||||||||||
| 3,364,103 | ||||||||||||||
|
| |||||||||||||
| Construction Materials 1.4% | ||||||||||||||
LafargeHolcim Ltd., B | Switzerland | 57,170 | 2,792,694 | |||||||||||
|
| |||||||||||||
| Consumer Finance 2.9% | ||||||||||||||
| b | Hoist Finance AB, 144A | Sweden | 372,679 | 2,726,787 | ||||||||||
| a | Qudian Inc., ADR | China | 166,932 | 1,479,018 | ||||||||||
Sun Hung Kai & Co. Ltd. | Hong Kong | 2,877,748 | 1,617,486 | |||||||||||
|
| |||||||||||||
| 5,823,291 | ||||||||||||||
|
| |||||||||||||
| Diversified Financial Services 1.6% | ||||||||||||||
Metro Pacific Investments Corp. | Philippines | 36,164,200 | 3,117,399 | |||||||||||
|
| |||||||||||||
| Diversified Telecommunication Services 3.0% | ||||||||||||||
Hellenic Telecommunications Organization SA | Greece | 269,294 | 3,335,074 | |||||||||||
Koninklijke KPN NV | Netherlands | 969,692 | 2,639,750 | |||||||||||
|
| |||||||||||||
| 5,974,824 | ||||||||||||||
|
| |||||||||||||
| Electric Utilities 2.6% | ||||||||||||||
Enel SpA | Italy | 931,370 | 5,176,406 | |||||||||||
|
| |||||||||||||
| Hotels, Restaurants & Leisure 3.7% | ||||||||||||||
Accor SA | France | 89,097 | 4,374,134 | |||||||||||
Sands China Ltd. | Hong Kong | 546,000 | 2,919,265 | |||||||||||
|
| |||||||||||||
| 7,293,399 | ||||||||||||||
|
| |||||||||||||
| Household Durables 2.1% | ||||||||||||||
| a | Cairn Homes PLC | Ireland | 1,005,848 | 2,087,124 | ||||||||||
| a,b | Neinor Homes SA, 144A | Spain | 115,583 | 2,166,064 | ||||||||||
|
| |||||||||||||
| 4,253,188 | ||||||||||||||
|
| |||||||||||||
| franklintempleton.com | Semiannual Report | 17 |
FRANKLIN MUTUAL INTERNATIONAL FUND
STATEMENT OF INVESTMENTS (UNAUDITED)
| Country | Shares | Value | ||||||||||||
| Common Stocks (continued) | ||||||||||||||
| Independent Power & Renewable Electricity Producers 1.7% | ||||||||||||||
China Longyuan Power Group Corp. | China | 4,208,700 | $ | 3,390,112 | ||||||||||
|
| |||||||||||||
| Insurance 16.1% | ||||||||||||||
Ageas | Belgium | 60,007 | 3,029,418 | |||||||||||
ASR Nederland NV | Netherlands | 104,987 | 4,290,701 | |||||||||||
China Pacific Insurance Group Co. Ltd., H | China | 879,045 | 3,400,312 | |||||||||||
Direct Line Insurance Group PLC | United Kingdom | 739,157 | 3,347,152 | |||||||||||
Lancashire Holdings Ltd. | United Kingdom | 388,658 | 2,910,194 | |||||||||||
NN Group NV | Netherlands | 103,498 | 4,212,919 | |||||||||||
RSA Insurance Group PLC | United Kingdom | 389,405 | 3,493,802 | |||||||||||
| a | Sabre Insurance Group PLC | United Kingdom | 1,028,590 | 3,681,144 | ||||||||||
T&D Holdings Inc. | Japan | 248,433 | 3,735,641 | |||||||||||
|
| |||||||||||||
| 32,101,283 | ||||||||||||||
|
| |||||||||||||
| Internet Software & Services 3.2% | ||||||||||||||
| a | Baidu Inc., ADR | China | 16,131 | 3,919,833 | ||||||||||
Yahoo Japan Corp. | Japan | 734,600 | 2,442,141 | |||||||||||
|
| |||||||||||||
| 6,361,974 | ||||||||||||||
|
| |||||||||||||
| Media 0.3% | ||||||||||||||
| c | Clear Media Ltd. | Hong Kong | 886,000 | 651,999 | ||||||||||
|
| |||||||||||||
| Metals & Mining 0.7% | ||||||||||||||
thyssenkrupp AG | Germany | 58,392 | 1,420,388 | |||||||||||
|
| |||||||||||||
| Oil, Gas & Consumable Fuels 10.0% | ||||||||||||||
BP PLC | United Kingdom | 495,900 | 3,787,203 | |||||||||||
Crescent Point Energy Corp. | Canada | 507,400 | 3,729,633 | |||||||||||
Husky Energy Inc. | Canada | 244,200 | 3,807,379 | |||||||||||
JXTG Holdings Inc. | Japan | 628,708 | 4,374,461 | |||||||||||
Royal Dutch Shell PLC, B | United Kingdom | 117,500 | 4,210,551 | |||||||||||
|
| |||||||||||||
| 19,909,227 | ||||||||||||||
|
| |||||||||||||
| Pharmaceuticals 4.4% | ||||||||||||||
GlaxoSmithKline PLC | United Kingdom | 213,777 | 4,318,838 | |||||||||||
Novartis AG | Switzerland | 57,144 | 4,343,498 | |||||||||||
|
| |||||||||||||
| 8,662,336 | ||||||||||||||
|
| |||||||||||||
| Semiconductors & Semiconductor Equipment 1.5% | ||||||||||||||
| a | Renesas Electronics Corp | Japan | 308,510 | 3,026,712 | ||||||||||
|
| |||||||||||||
| Specialty Retail 2.6% | ||||||||||||||
Dufry AG | Switzerland | 22,459 | 2,866,335 | |||||||||||
Hornbach Holding AG & Co. KGaA | Germany | 31,290 | 2,259,264 | |||||||||||
|
| |||||||||||||
| 5,125,599 | ||||||||||||||
|
| |||||||||||||
| Technology Hardware, Storage & Peripherals 1.9% | ||||||||||||||
Samsung Electronics Co. Ltd. | South Korea | 88,900 | 3,718,115 | |||||||||||
|
| |||||||||||||
| Thrifts & Mortgage Finance 1.6% | ||||||||||||||
Indiabulls Housing Finance Ltd. | India | 187,229 | 3,124,586 | |||||||||||
|
| |||||||||||||
| Trading Companies & Distributors 1.3% | ||||||||||||||
Rexel SA | France | 180,233 | 2,593,234 | |||||||||||
|
| |||||||||||||
| Wireless Telecommunication Services 1.6% | ||||||||||||||
Vodafone Group PLC | United Kingdom | 1,324,860 | 3,216,133 | |||||||||||
|
| |||||||||||||
Total Common Stocks (Cost $168,228,196) | 172,326,045 | |||||||||||||
|
| |||||||||||||
| 18 | Semiannual Report | franklintempleton.com |
FRANKLIN MUTUAL INTERNATIONAL FUND
STATEMENT OF INVESTMENTS (UNAUDITED)
| Country | Shares | Value | ||||||||||||
| Preferred Stocks 3.2% | ||||||||||||||
| Auto Components 0.9% | ||||||||||||||
| d | Schaeffler AG, 4.933%, pfd. | Germany | 133,577 | $ | 1,740,121 | |||||||||
|
| |||||||||||||
| Automobiles 2.3% | ||||||||||||||
| d | Volkswagen AG, 2.784%, pfd. | Germany | 28,352 | 4,711,046 | ||||||||||
|
| |||||||||||||
Total Preferred Stocks (Cost $6,559,548) | 6,451,167 | |||||||||||||
|
| |||||||||||||
Total Investments before Short Term Investments | 178,777,212 | |||||||||||||
|
| |||||||||||||
| Principal Amount | ||||||||||||||
| Short Term Investments 7.2% | ||||||||||||||
| U.S. Government and Agency Securities 7.2% | ||||||||||||||
| e | FHLB, 7/02/18 | United States | $ | 8,800,000 | 8,800,000 | |||||||||
| e | U.S. Treasury Bill, | |||||||||||||
7/26/18 | United States | 2,000,000 | 1,997,703 | |||||||||||
7/05/18 - 9/20/18 | United States | 3,598,000 | 3,591,369 | |||||||||||
|
| |||||||||||||
Total U.S. Government and Agency Securities | 14,389,072 | |||||||||||||
|
| |||||||||||||
Total Investments (Cost $189,175,815) 97.0% | 193,166,284 | |||||||||||||
Other Assets, less Liabilities 3.0% | 5,901,611 | |||||||||||||
|
| |||||||||||||
Net Assets 100.0% | $ | 199,067,895 | ||||||||||||
|
| |||||||||||||
aNon-income producing.
bSecurity was purchased pursuant to Rule 144A under the Securities Act of 1933 and may be sold in transactions exempt from registration only to qualified institutional buyers or in a public offering registered under the Securities Act of 1933. These securities have been deemed liquid under guidelines approved by the Trust’s Board of Trustees. At June 30, 2018, the aggregate value of these securities was $4,892,851, representing 2.5% of net assets.
cFair valued using significant unobservable inputs. See Note 11 regarding fair value measurements.
dVariable rate security. The rate shown represents the yield at period end.
eThe security was issued on a discount basis with no stated coupon rate.
At June 30, 2018, the Fund had the following futures contracts outstanding. See Note 1(c).
| Futures Contracts | ||||||||||||||||||||
| Description | Type | Number of Contracts | Notional Amount* | Expiration Date | Value/ Unrealized Appreciation (Depreciation) | |||||||||||||||
| Currency Contracts | ||||||||||||||||||||
EUR/USD | Short | 137 | $20,098,756 | 9/17/18 | $185,947 | |||||||||||||||
GBP/USD | Short | 68 | 5,625,300 | 9/17/18 | 86,680 | |||||||||||||||
|
| |||||||||||||||||||
Total Futures Contracts | $272,627 | |||||||||||||||||||
|
| |||||||||||||||||||
*As of period end.
| franklintempleton.com | Semiannual Report | 19 |
FRANKLIN MUTUAL INTERNATIONAL FUND
STATEMENT OF INVESTMENTS (UNAUDITED)
At June 30, 2018, the Fund had the following forward exchange contracts outstanding. See Note 1(c).
| Forward Exchange Contracts | ||||||||||||||||||||||||||||
| Currency | Counterpartya | Type | Quantity | Contract Amount | Settlement Date | Unrealized Appreciation | Unrealized Depreciation | |||||||||||||||||||||
| OTC Forward Exchange Contracts |
| |||||||||||||||||||||||||||
Swiss Franc | BONY | Buy | 36,255 | $ | 36,493 | 7/09/18 | $ | 145 | $ | — | ||||||||||||||||||
Swiss Franc | UBSW | Buy | 69,988 | 71,279 | 7/09/18 | — | (552 | ) | ||||||||||||||||||||
Swiss Franc | UBSW | Buy | 112,895 | 113,885 | 7/09/18 | 203 | — | |||||||||||||||||||||
Swiss Franc | UBSW | Sell | 465,000 | 473,174 | 7/09/18 | 3,261 | — | |||||||||||||||||||||
Swiss Franc | UBSW | Sell | 2,811,456 | 2,827,772 | 7/09/18 | — | (13,387 | ) | ||||||||||||||||||||
Euro | BOFA | Buy | 364,127 | 428,260 | 7/12/18 | — | (2,420 | ) | ||||||||||||||||||||
Euro | BOFA | Buy | 2,267,269 | 2,633,299 | 7/12/18 | 18,237 | — | |||||||||||||||||||||
Euro | BONY | Buy | 310,265 | 359,227 | 7/12/18 | 3,622 | — | |||||||||||||||||||||
Euro | BONY | Buy | 321,104 | 379,234 | 7/12/18 | — | (3,709 | ) | ||||||||||||||||||||
Euro | HSBK | Buy | 90,785 | 107,531 | 7/12/18 | — | (1,359 | ) | ||||||||||||||||||||
Euro | HSBK | Buy | 2,826,939 | 3,285,986 | 7/12/18 | 20,073 | — | |||||||||||||||||||||
Euro | HSBK | Sell | 10,097,025 | 12,250,367 | 7/12/18 | 442,056 | — | |||||||||||||||||||||
Euro | SSBT | Buy | 354,693 | 414,888 | 7/12/18 | — | (80 | ) | ||||||||||||||||||||
Euro | SSBT | Buy | 1,730,580 | 2,015,770 | 7/12/18 | 8,115 | — | |||||||||||||||||||||
Euro | UBSW | Buy | 551,418 | 639,294 | 7/12/18 | 5,581 | — | |||||||||||||||||||||
Euro | UBSW | Sell | 10,097,026 | 12,250,873 | 7/12/18 | 442,562 | — | |||||||||||||||||||||
South Korean Won | HSBK | Buy | 336,194,908 | 308,444 | 7/13/18 | — | (6,919 | ) | ||||||||||||||||||||
South Korean Won | HSBK | Sell | 1,690,548,424 | 1,565,685 | 7/13/18 | 49,471 | — | |||||||||||||||||||||
South Korean Won | UBSW | Sell | 2,823,946,484 | 2,617,832 | 7/13/18 | 85,099 | — | |||||||||||||||||||||
British Pound | BOFA | Buy | 207,918 | 278,695 | 7/16/18 | — | (3,900 | ) | ||||||||||||||||||||
British Pound | BOFA | Sell | 331,723 | 465,118 | 7/16/18 | 26,696 | — | |||||||||||||||||||||
British Pound | BONY | Sell | 19,162 | 27,573 | 7/16/18 | 2,248 | — | |||||||||||||||||||||
British Pound | HSBK | Buy | 115,000 | 152,864 | 7/16/18 | — | (874 | ) | ||||||||||||||||||||
British Pound | HSBK | Sell | 2,388,991 | 3,261,902 | 7/16/18 | 104,487 | — | |||||||||||||||||||||
British Pound | SSBT | Sell | 75,975 | 106,613 | 7/16/18 | 6,201 | — | |||||||||||||||||||||
British Pound | UBSW | Buy | 1,515,685 | 2,030,885 | 7/16/18 | — | (27,676 | ) | ||||||||||||||||||||
British Pound | UBSW | Sell | 2,312,705 | 3,153,199 | 7/16/18 | 96,609 | — | |||||||||||||||||||||
Euro | BONY | Sell | 4,683,042 | 5,874,221 | 7/26/18 | 391,746 | — | |||||||||||||||||||||
Euro | HSBK | Sell | 4,683,041 | 5,873,751 | 7/26/18 | 391,278 | — | |||||||||||||||||||||
Swedish Krona | BONY | Buy | 390,119 | 45,243 | 7/31/18 | — | (1,558 | ) | ||||||||||||||||||||
Swedish Krona | BONY | Sell | 3,633,599 | 405,868 | 7/31/18 | — | (1,020 | ) | ||||||||||||||||||||
Swedish Krona | BONY | Sell | 5,466,296 | 618,094 | 7/31/18 | 5,983 | — | |||||||||||||||||||||
Swedish Krona | SSBT | Buy | 548,217 | 62,733 | 7/31/18 | — | (1,343 | ) | ||||||||||||||||||||
Swedish Krona | SSBT | Sell | 149,720 | 16,762 | 7/31/18 | — | (4 | ) | ||||||||||||||||||||
Swedish Krona | SSBT | Sell | 15,125,111 | 1,771,178 | 7/31/18 | 77,478 | — | |||||||||||||||||||||
Philippine Peso | BONY | Buy | 10,544,291 | 196,550 | 8/07/18 | 429 | — | |||||||||||||||||||||
Philippine Peso | BONY | Sell | 175,995,506 | 3,328,206 | 8/07/18 | 40,414 | — | |||||||||||||||||||||
British Pound | BOFA | Sell | 288,582 | 407,329 | 8/14/18 | 25,415 | — | |||||||||||||||||||||
British Pound | BONY | Sell | 2,765,198 | 3,856,364 | 8/14/18 | 196,853 | — | |||||||||||||||||||||
British Pound | UBSW | Sell | 2,502,535 | 3,481,050 | 8/14/18 | 169,153 | — | |||||||||||||||||||||
Euro | BOFA | Sell | 2,300,000 | 2,871,973 | 8/20/18 | 174,016 | — | |||||||||||||||||||||
Japanese Yen | HSBK | Sell | 1,869,434,186 | 16,997,251 | 8/20/18 | 47,227 | — | |||||||||||||||||||||
Japanese Yen | UBSW | Buy | 46,867,728 | 428,919 | 8/20/18 | — | (3,973 | ) | ||||||||||||||||||||
Euro | BOFA | Sell | 70,353 | 87,975 | 10/10/18 | 5,115 | — | |||||||||||||||||||||
Euro | UBSW | Sell | 33,388 | 41,555 | 10/10/18 | 2,231 | — | |||||||||||||||||||||
Euro | BOFA | Sell | 474,977 | 594,640 | 10/18/18 | 34,841 | — | |||||||||||||||||||||
Euro | SSBT | Sell | 32,732 | 41,128 | 10/18/18 | 2,551 | — | |||||||||||||||||||||
Euro | UBSW | Sell | 90,319 | 113,514 | 10/18/18 | 7,066 | — | |||||||||||||||||||||
British Pound | BOFA | Sell | 771,718 | 1,077,963 | 10/24/18 | 53,301 | — | |||||||||||||||||||||
| 20 | Semiannual Report | franklintempleton.com |
FRANKLIN MUTUAL INTERNATIONAL FUND
STATEMENT OF INVESTMENTS (UNAUDITED)
| Forward Exchange Contracts (continued) | ||||||||||||||||||||||||||||
| Currency | Counterpartya | Type | Quantity | Contract Amount | Settlement Date | Unrealized Appreciation | Unrealized Depreciation | |||||||||||||||||||||
| OTC Forward Exchange Contracts (continued) |
| |||||||||||||||||||||||||||
British Pound | SSBT | Sell | 4,346,468 | $6,146,036 | 10/24/18 | $ 374,941 | $ — | |||||||||||||||||||||
British Pound | UBSW | Sell | 603,440 | 847,331 | 10/24/18 | 46,104 | — | |||||||||||||||||||||
Euro | SSBT | Sell | 1,367,024 | 1,659,977 | 11/07/18 | 46,080 | — | |||||||||||||||||||||
Euro | UBSW | Sell | 1,367,024 | 1,659,649 | 11/07/18 | 45,752 | — | |||||||||||||||||||||
Euro | HSBK | Sell | 6,946,092 | 8,307,193 | 11/21/18 | 96,882 | — | |||||||||||||||||||||
Euro | SSBT | Sell | 6,946,093 | 8,308,916 | 11/21/18 | 98,604 | — | |||||||||||||||||||||
British Pound | BONY | Sell | 3,732,914 | 5,060,544 | 11/26/18 | 95,913 | — | |||||||||||||||||||||
British Pound | UBSW | Sell | 3,732,915 | 5,060,183 | 11/26/18 | �� | 95,551 | — | ||||||||||||||||||||
|
| |||||||||||||||||||||||||||
Total Forward Exchange Contracts |
| $3,839,590 | $ (68,774 | ) | ||||||||||||||||||||||||
|
| |||||||||||||||||||||||||||
Net unrealized appreciation (depreciation) |
| $3,770,816 | ||||||||||||||||||||||||||
|
| |||||||||||||||||||||||||||
aMay be comprised of multiple contracts with the same counterparty, currency and settlement date.
See Note 9 regarding other derivative information.
See Abbreviations on page 37.
| franklintempleton.com | The accompanying notes are an integral part of these financial statements. | Semiannual Report | 21 |
FRANKLIN MUTUAL INTERNATIONAL FUND
Financial Statements
Statement of Assets and Liabilities
June 30, 2018 (unaudited)
Assets: | ||||
Investments in securities: | ||||
Cost - Unaffiliated issuers | $ | 189,175,815 | ||
|
| |||
Value - Unaffiliated issuers | $ | 193,166,284 | ||
Cash | 55,076 | |||
Foreign currency, at value (cost $300,583) | 301,456 | |||
Receivables: | ||||
Investment securities sold | 1,719,440 | |||
Capital shares sold | 80,788 | |||
Dividends | 934,968 | |||
Deposits with brokers for: | ||||
Futures contracts | 445,090 | |||
Unrealized appreciation on OTC forward exchange contracts | 3,839,590 | |||
Other assets | 146 | |||
|
| |||
Total assets | 200,542,838 | |||
|
| |||
Liabilities: | ||||
Payables: | ||||
Investment securities purchased | 693,566 | |||
Capital shares redeemed | 244,544 | |||
Management fees | 114,824 | |||
Distribution fees | 75,367 | |||
Transfer agent fees | 15,336 | |||
Trustees’ fees and expenses | 292 | |||
Variation margin on futures contracts | 245,788 | |||
Unrealized depreciation on OTC forward exchange contracts | 68,774 | |||
Accrued expenses and other liabilities | 16,452 | |||
|
| |||
Total liabilities | 1,474,943 | |||
|
| |||
Net assets, at value | $ | 199,067,895 | ||
|
| |||
Net assets consist of: | ||||
Paid-in capital | $ | 197,668,056 | ||
Undistributed net investment income | 670,111 | |||
Net unrealized appreciation (depreciation) | 8,041,989 | |||
Accumulated net realized gain (loss) | (7,312,261 | ) | ||
|
| |||
Net assets, at value | $ | 199,067,895 | ||
|
|
| 22 | Semiannual Report | The accompanying notes are an integral part of these financial statements. | franklintempleton.com |
FRANKLIN MUTUAL INTERNATIONAL FUND
FINANCIAL STATEMENTS
Statement of Assets and Liabilities (continued)
June 30, 2018 (unaudited)
| Class Z: | ||||
Net assets, at value | $78,136,418 | |||
|
| |||
Shares outstanding | 5,057,730 | |||
|
| |||
Net asset value and maximum offering price per share | $15.45 | |||
|
| |||
| Class A: | ||||
Net assets, at value | $70,676,976 | |||
|
| |||
Shares outstanding | 4,599,679 | |||
|
| |||
Net asset value per sharea | $15.37 | |||
|
| |||
Maximum offering price per share (net asset value per share ÷ 94.25%) | $16.31 | |||
|
| |||
| Class C: | ||||
Net assets, at value | $23,520,865 | |||
|
| |||
Shares outstanding | 1,556,522 | |||
|
| |||
Net asset value and maximum offering price per sharea | $15.11 | |||
|
| |||
| Class R: | ||||
Net assets, at value | $ 1,998,271 | |||
|
| |||
Shares outstanding | 131,033 | |||
|
| |||
Net asset value and maximum offering price per share | $15.25 | |||
|
| |||
| Class R6: | ||||
Net assets, at value | $24,735,365 | |||
|
| |||
Shares outstanding | 1,598,961 | |||
|
| |||
Net asset value and maximum offering price per share | $15.47 | |||
|
| |||
aRedemption price is equal to net asset value less contingent deferred sales charges, if applicable.
| franklintempleton.com | The accompanying notes are an integral part of these financial statements. | Semiannual Report | 23 |
FRANKLIN MUTUAL INTERNATIONAL FUND
FINANCIAL STATEMENTS
Statement of Operations
for the six months ended June 30, 2018 (unaudited)
Investment income: | ||||
Dividends: (net of foreign taxes)* | ||||
Unaffiliated issuers | $ | 3,993,175 | ||
Interest: | ||||
Unaffiliated issuers | 79,010 | |||
Income from securities loaned (net of fees and rebates) | 7,723 | |||
|
| |||
Total investment income | 4,079,908 | |||
|
| |||
Expenses: | ||||
Management fees (Note 3a) | 935,562 | |||
Distribution fees: (Note 3c) | ||||
Class A | 97,054 | |||
Class C | 134,759 | |||
Class R | 5,002 | |||
Transfer agent fees: (Note 3e) | ||||
Class Z | 69,111 | |||
Class A | 65,241 | |||
Class C | 22,665 | |||
Class R | 1,685 | |||
Class R6 | 8,047 | |||
Custodian fees (Note 4) | 16,506 | |||
Reports to shareholders | 17,952 | |||
Registration and filing fees | 41,885 | |||
Professional fees | 40,290 | |||
Trustees’ fees and expenses | 3,371 | |||
Other | 10,981 | |||
|
| |||
Total expenses | 1,470,111 | |||
Expense reductions (Note 4) | (576 | ) | ||
Expenses waived/paid by affiliates (Note 3f and 3g) | (184,848 | ) | ||
|
| |||
Net expenses | 1,284,687 | |||
|
| |||
Net investment income | 2,795,221 | |||
|
| |||
Realized and unrealized gains (losses): | ||||
Net realized gain (loss) from: | ||||
Investments:# | ||||
Unaffiliated issuers | 6,479,028 | |||
Foreign currency transactions | (35,271 | ) | ||
Forward exchange contracts | (3,249,189 | ) | ||
Futures contracts | 396,005 | |||
|
| |||
Net realized gain (loss) | 3,590,573 | |||
|
| |||
Net change in unrealized appreciation (depreciation) on: | ||||
Investments: | ||||
Unaffiliated issuers | (20,938,800 | ) | ||
Translation of other assets and liabilities | (12,766 | ) | ||
Forward exchange contracts | 6,725,764 | |||
Futures contracts | 654,583 | |||
Change in deferred taxes on unrealized appreciation | 244,572 | |||
|
| |||
Net change in unrealized appreciation (depreciation) | (13,326,647 | ) | ||
|
| |||
Net realized and unrealized gain (loss) | (9,736,074 | ) | ||
|
| |||
Net increase (decrease) in net assets resulting from operations | $ | (6,940,853 | ) | |
|
| |||
*Foreign taxes withheld on dividends | $ | 389,511 | ||
#Net of foreign taxes | $ | 119,767 | ||
| 24 | Semiannual Report | The accompanying notes are an integral part of these financial statements. | franklintempleton.com |
FRANKLIN MUTUAL INTERNATIONAL FUND
FINANCIAL STATEMENTS
Statements of Changes in Net Assets
| Six Months Ended June 30, 2018 (unaudited) | Year Ended December 31, 2017 | |||||||
Increase (decrease) in net assets: | ||||||||
Operations: | ||||||||
Net investment income | $ 2,795,221 | $ 2,319,028 | ||||||
Net realized gain (loss) | 3,590,573 | (1,282,671 | ) | |||||
Net change in unrealized appreciation (depreciation) | (13,326,647 | ) | 22,778,947 | |||||
|
| |||||||
Net increase (decrease) in net assets resulting from operations | (6,940,853 | ) | 23,815,304 | |||||
|
| |||||||
Distributions to shareholders from: | ||||||||
Net investment income: | ||||||||
Class Z | — | (1,857,997 | ) | |||||
Class A | — | (1,574,566 | ) | |||||
Class C | — | (348,684 | ) | |||||
Class R | — | (35,346 | ) | |||||
Class R6 | — | (569,536 | ) | |||||
|
| |||||||
Total distributions to shareholders | — | (4,386,129 | ) | |||||
|
| |||||||
Capital share transactions: (Note 2) | ||||||||
Class Z | (5,506,080 | ) | 39,322,326 | |||||
Class A | (9,793,038 | ) | (7,963,782 | ) | ||||
Class C | (4,610,307 | ) | 226,100 | |||||
Class R | 198,408 | 1,060,015 | ||||||
Class R6 | (191,591 | ) | 7,095,104 | |||||
|
| |||||||
Total capital share transactions | (19,902,608 | ) | 39,739,763 | |||||
|
| |||||||
Net increase (decrease) in net assets | (26,843,461 | ) | 59,168,938 | |||||
Net assets: | ||||||||
Beginning of period | 225,911,356 | 166,742,418 | ||||||
|
| |||||||
End of period | $199,067,895 | $225,911,356 | ||||||
|
| |||||||
Undistributed net investment income included in net assets: | ||||||||
End of period | $ 670,111 | $ — | ||||||
|
| |||||||
Distributions in excess of net investment income included in net assets: | ||||||||
End of period | $ — | $ (2,125,110 | ) | |||||
|
| |||||||
| franklintempleton.com | The accompanying notes are an integral part of these financial statements. | Semiannual Report | 25 |
FRANKLIN MUTUAL INTERNATIONAL FUND
Notes to Financial Statements (unaudited)
1. Organization and Significant Accounting Policies
Franklin Mutual Series Funds (Trust) is registered under the Investment Company Act of 1940 (1940 Act) as an open-end management investment company, consisting of seven separate funds and applies the specialized accounting and reporting guidance in U.S. Generally Accepted Accounting Principles (U.S. GAAP). Franklin Mutual International Fund (Fund) is included in this report. The Fund offers five classes of shares: Class Z, Class A, Class C, Class R and Class R6. Each class of shares may differ by its initial sales load, contingent deferred sales charges, voting rights on matters affecting a single class, its exchange privilege and fees due to differing arrangements for distribution and transfer agent fees.
The following summarizes the Fund’s significant accounting policies.
a. Financial Instrument Valuation
The Fund’s investments in financial instruments are carried at fair value daily. Fair value is the price that would be received to sell an asset or paid to transfer a liability in an orderly transaction between market participants on the measurement date. The Fund calculates the net asset value (NAV) per share each business day as of 4 p.m. Eastern time or the regularly scheduled close of the New York Stock Exchange (NYSE), whichever is earlier. Under compliance policies and procedures approved by the Trust’s Board of Trustees (the Board), the Fund’s administrator has responsibility for oversight of valuation, including leading the cross-functional Valuation Committee (VC). The VC provides administration and oversight of the Fund’s valuation policies and procedures, which are approved annually by the Board. Among other things, these procedures allow the Fund to utilize independent pricing services, quotations from securities and financial instrument dealers, and other market sources to determine fair value.
Equity securities and derivative financial instruments listed on an exchange or on the NASDAQ National Market System are valued at the last quoted sale price or the official closing price of the day, respectively. Foreign equity securities are valued as of the close of trading on the foreign stock exchange on which the security is primarily traded, or as of 4 p.m. Eastern time. The value is then converted into its U.S. dollar equivalent at the foreign exchange rate in effect at 4 p.m. Eastern time on the day that the value of the security is determined. Over-the-counter (OTC) securities are valued within the range of the most recent
quoted bid and ask prices. Securities that trade in multiple markets or on multiple exchanges are valued according to the broadest and most representative market. Certain equity securities are valued based upon fundamental characteristics or relationships to similar securities.
Debt securities generally trade in the OTC market rather than on a securities exchange. The Fund’s pricing services use multiple valuation techniques to determine fair value. In instances where sufficient market activity exists, the pricing services may utilize a market-based approach through which quotes from market makers are used to determine fair value. In instances where sufficient market activity may not exist or is limited, the pricing services also utilize proprietary valuation models which may consider market characteristics such as benchmark yield curves, credit spreads, estimated default rates, anticipated market interest rate volatility, coupon rates, anticipated timing of principal repayments, underlying collateral, and other unique security features in order to estimate the relevant cash flows, which are then discounted to calculate the fair value.
Investments in open-end mutual funds are valued at the closing NAV.
Certain derivative financial instruments trade in the OTC market. The Fund’s pricing services use various techniques including industry standard option pricing models and proprietary discounted cash flow models to determine the fair value of those instruments. The Fund’s net benefit or obligation under the derivative contract, as measured by the fair value of the contract, is included in net assets.
The Fund has procedures to determine the fair value of financial instruments for which market prices are not reliable or readily available. Under these procedures, the VC convenes on a regular basis to review such financial instruments and considers a number of factors, including significant unobservable valuation inputs, when arriving at fair value. The VC primarily employs a market-based approach which may use related or comparable assets or liabilities, recent transactions, market multiples, book values, and other relevant information for the investment to determine the fair value of the investment. An income-based valuation approach may also be used in which the anticipated future cash flows of the investment are discounted to calculate fair value. Discounts may also be applied due to the nature or duration of any restrictions on the disposition of the investments. Due to the inherent uncertainty of valuations of such investments, the fair values may differ significantly from
| 26 | Semiannual Report | franklintempleton.com |
FRANKLIN MUTUAL INTERNATIONAL FUND
NOTES TO FINANCIAL STATEMENTS (UNAUDITED)
the values that would have been used had an active market existed. The VC employs various methods for calibrating these valuation approaches including a regular review of key inputs and assumptions, transactional back-testing or disposition analysis, and reviews of any related market activity.
Trading in securities on foreign securities stock exchanges and OTC markets may be completed before 4 p.m. Eastern time. In addition, trading in certain foreign markets may not take place on every Fund’s business day. Occasionally, events occur between the time at which trading in a foreign security is completed and 4 p.m. Eastern time that might call into question the reliability of the value of a portfolio security held by the Fund. As a result, differences may arise between the value of the Fund’s portfolio securities as determined at the foreign market close and the latest indications of value at 4 p.m. Eastern time. In order to minimize the potential for these differences, the VC monitors price movements following the close of trading in foreign stock markets through a series of country specific market proxies (such as baskets of American Depositary Receipts, futures contracts and exchange traded funds). These price movements are measured against established trigger thresholds for each specific market proxy to assist in determining if an event has occurred that may call into question the reliability of the values of the foreign securities held by the Fund. If such an event occurs, the securities may be valued using fair value procedures, which may include the use of independent pricing services.
When the last day of the reporting period is a non-business day, certain foreign markets may be open on those days that the Fund’s NAV is not calculated, which could result in differences between the value of the Fund’s portfolio securities on the last business day and the last calendar day of the reporting period. Any significant security valuation changes due to an open foreign market are adjusted and reflected by the Fund for financial reporting purposes.
b. Foreign Currency Translation
Portfolio securities and other assets and liabilities denominated in foreign currencies are translated into U.S. dollars based on the exchange rate of such currencies against U.S. dollars on the date of valuation. The Fund may enter into foreign currency exchange contracts to facilitate transactions denominated in a foreign currency. Purchases and sales of securities, income and expense items denominated in foreign currencies are translated into U.S. dollars at the exchange rate in effect on the transaction
date. Portfolio securities and assets and liabilities denominated in foreign currencies contain risks that those currencies will decline in value relative to the U.S. dollar. Occasionally, events may impact the availability or reliability of foreign exchange rates used to convert the U.S. dollar equivalent value. If such an event occurs, the foreign exchange rate will be valued at fair value using procedures established and approved by the Board.
The Fund does not separately report the effect of changes in foreign exchange rates from changes in market prices on securities held. Such changes are included in net realized and unrealized gain or loss from investments in the Statement of Operations.
Realized foreign exchange gains or losses arise from sales of foreign currencies, currency gains or losses realized between the trade and settlement dates on securities transactions and the difference between the recorded amounts of dividends, interest, and foreign withholding taxes and the U.S. dollar equivalent of the amounts actually received or paid. Net unrealized foreign exchange gains and losses arise from changes in foreign exchange rates on foreign denominated assets and liabilities other than investments in securities held at the end of the reporting period.
c. Derivative Financial Instruments
The Fund invested in derivative financial instruments in order to manage risk or gain exposure to various other investments or markets. Derivatives are financial contracts based on an underlying or notional amount, require no initial investment or an initial net investment that is smaller than would normally be required to have a similar response to changes in market factors, and require or permit net settlement. Derivatives contain various risks including the potential inability of the counterparty to fulfill their obligations under the terms of the contract, the potential for an illiquid secondary market, and/or the potential for market movements which expose the Fund to gains or losses in excess of the amounts shown in the Statement of Assets and Liabilities. Realized gain and loss and unrealized appreciation and depreciation on these contracts for the period are included in the Statement of Operations.
Derivative counterparty credit risk is managed through a formal evaluation of the creditworthiness of all potential counter-parties. The Fund attempts to reduce its exposure to counterparty credit risk on OTC derivatives, whenever possible, by entering into International Swaps and Derivatives
| franklintempleton.com | Semiannual Report | 27 |
FRANKLIN MUTUAL INTERNATIONAL FUND
NOTES TO FINANCIAL STATEMENTS (UNAUDITED)
1. Organization and Significant Accounting Policies (continued)
c. Derivative Financial Instruments (continued)
Association (ISDA) master agreements with certain counterparties. These agreements contain various provisions, including but not limited to collateral requirements, events of default, or early termination. Termination events applicable to the counterparty include certain deteriorations in the credit quality of the counterparty. Termination events applicable to the Fund include failure of the Fund to maintain certain net asset levels and/or limit the decline in net assets over various periods of time. In the event of default or early termination, the ISDA master agreement gives the non-defaulting party the right to net and close-out all transactions traded, whether or not arising under the ISDA agreement, to one net amount payable by one counterparty to the other. However, absent an event of default or early termination, OTC derivative assets and liabilities are presented gross and not offset in the Statement of Assets and Liabilities. Early termination by the counterparty may result in an immediate payment by the Fund of any net liability owed to that counterparty under the ISDA agreement.
Collateral requirements differ by type of derivative. Collateral or initial margin requirements are set by the broker or exchange clearing house for exchange traded and centrally cleared derivatives. Initial margin deposited is held at the exchange and can be in the form of cash and/or securities. For OTC derivatives traded under an ISDA master agreement, posting of collateral is required by either the Fund or the applicable counterparty if the total net exposure of all OTC derivatives with the applicable counterparty exceeds the minimum transfer amount, which typically ranges from $100,000 to $250,000, and can vary depending on the counterparty and the type of the agreement. Generally, collateral is determined at the close of Fund business each day and any additional collateral required due to changes in derivative values may be delivered by the Fund or the counterparty the next business day, or within a few business days. Collateral pledged and/or received by the Fund for OTC derivatives, if any, is held in segregated accounts with the Fund’s custodian/counterparty broker and can be in the form of cash and/or securities. Unrestricted cash may be invested according to the Fund’s investment objectives. To the extent that the amounts due to the Fund from its counterparties are not subject to collateralization or are not fully collateralized, the Fund bears the risk of loss from counterparty non-performance.
The Fund entered into exchange traded futures contracts primarily to manage exposure to certain foreign currencies. A futures contract is an agreement between the Fund and a counterparty to buy or sell an asset at a specified price on a future date. Required initial margins are pledged by the Fund, and the daily change in fair value is accounted for as a variation margin payable or receivable in the Statement of Assets and Liabilities.
The Fund entered into OTC forward exchange contracts primarily to manage exposure to certain foreign currencies. A forward exchange contract is an agreement between the Fund and a counterparty to buy or sell a foreign currency at a specific exchange rate on a future date.
See Note 9 regarding other derivative information.
d. Securities Sold Short
The Fund is engaged in selling securities short, which obligates the Fund to replace a borrowed security with the same security at current fair value. The Fund incurs a loss if the price of the security increases between the date of the short sale and the date on which the Fund replaces the borrowed security. The Fund realizes a gain if the price of the security declines between those dates. Gains are limited to the price at which the Fund sold the security short, while losses are potentially unlimited in size.
The Fund is required to establish a margin account with the broker lending the security sold short. While the short sale is outstanding, the broker retains the proceeds of the short sale to the extent necessary to meet margin requirements until the short position is closed out. A deposit must also be maintained with the Fund’s custodian/counterparty broker consisting of cash and/or securities having a value equal to a specified percentage of the value of the securities sold short. The Fund is obligated to pay fees for borrowing the securities sold short and is required to pay the counterparty any dividends and/or interest due on securities sold short. Such dividends and/or interest and any security borrowing fees are recorded as an expense to the Fund. At June 30, 2018, the Fund had no securities sold short.
e. Securities Lending
The Fund participates in an agency based securities lending program to earn additional income. The Fund receives cash collateral against the loaned securities in an amount equal to at least 102% of the fair value of the loaned securities. Collateral is maintained over the life of the loan in an amount not less than
| 28 | Semiannual Report | franklintempleton.com |
FRANKLIN MUTUAL INTERNATIONAL FUND
NOTES TO FINANCIAL STATEMENTS (UNAUDITED)
100% of the fair value of loaned securities, as determined at the close of Fund business each day; any additional collateral required due to changes in security values is delivered to the Fund on the next business day. The collateral is deposited into a joint cash account with other funds and is used to invest in a money market fund managed by Franklin Advisers, Inc., an affiliate of the Fund, and/or a joint repurchase agreement. The Fund may receive income from the investment of cash collateral, in addition to lending fees and rebates paid by the borrower. Income from securities loaned, net of fees paid to the securities lending agent and/or third-party vendor, is reported separately in the Statement of Operations. The Fund bears the market risk with respect to the collateral investment, securities loaned, and the risk that the agent may default on its obligations to the Fund. If the borrower defaults on its obligation to return the securities loaned, the Fund has the right to repurchase the securities in the open market using the collateral received. The securities lending agent has agreed to indemnify the Fund in the event of default by a third party borrower. At June 30, 2018, the Fund had no securities on loan.
f. Income and Deferred Taxes
It is the Fund’s policy to qualify as a regulated investment company under the Internal Revenue Code. The Fund intends to distribute to shareholders substantially all of its taxable income and net realized gains to relieve it from federal income and excise taxes. As a result, no provision for U.S. federal income taxes is required.
The Fund may be subject to foreign taxation related to income received, capital gains on the sale of securities and certain foreign currency transactions in the foreign jurisdictions in which it invests. Foreign taxes, if any, are recorded based on the tax regulations and rates that exist in the foreign markets in which the Fund invests. When a capital gain tax is determined to apply, the Fund records an estimated deferred tax liability in an amount that would be payable if the securities were disposed of on the valuation date.
The Fund may recognize an income tax liability related to its uncertain tax positions under U.S. GAAP when the uncertain tax position has a less than 50% probability that it will be sustained upon examination by the tax authorities based on its technical merits. As of June 30, 2018, the Fund has determined that no tax liability is required in its financial statements related to uncertain tax positions for any open tax years (or expected to
be taken in future tax years). Open tax years are those that remain subject to examination and are based on the statute of limitations in each jurisdiction in which the Fund invests.
g. Security Transactions, Investment Income, Expenses and Distributions
Security transactions are accounted for on trade date. Realized gains and losses on security transactions are determined on a specific identification basis. Interest income and estimated expenses are accrued daily. Amortization of premium and accretion of discount on debt securities are included in interest income. Dividend income is recorded on the ex-dividend date except for certain dividends from securities where the dividend rate is not available. In such cases, the dividend is recorded as soon as the information is received by the Fund. Distributions to shareholders are recorded on the ex-dividend date. Distributable earnings are determined according to income tax regulations (tax basis) and may differ from earnings recorded in accordance with U.S. GAAP. These differences may be permanent or temporary. Permanent differences are reclassified among capital accounts to reflect their tax character. These reclassifications have no impact on net assets or the results of operations. Temporary differences are not reclassified, as they may reverse in subsequent periods.
Common expenses incurred by the Trust are allocated among the Funds based on the ratio of net assets of each Fund to the combined net assets of the Trust or based on the ratio of number of shareholders of each Fund to the combined number of shareholders of the Trust. Fund specific expenses are charged directly to the Fund that incurred the expense.
Realized and unrealized gains and losses and net investment income, excluding class specific expenses, are allocated daily to each class of shares based upon the relative proportion of net assets of each class. Differences in per share distributions by class are generally due to differences in class specific expenses.
h. Accounting Estimates
The preparation of financial statements in accordance with U.S. GAAP requires management to make estimates and assumptions that affect the reported amounts of assets and liabilities at the date of the financial statements and the amounts of income and expenses during the reporting period. Actual results could differ from those estimates.
| franklintempleton.com | Semiannual Report | 29 |
FRANKLIN MUTUAL INTERNATIONAL FUND
NOTES TO FINANCIAL STATEMENTS (UNAUDITED)
1. Organization and Significant Accounting Policies (continued)
i. Guarantees and Indemnifications
Under the Trust’s organizational documents, its officers and trustees are indemnified by the Trust against certain liabilities arising out of the performance of their duties to the Trust. Additionally, in the normal course of business, the Trust, on
behalf of the Fund, enters into contracts with service providers that contain general indemnification clauses. The Trust’s maximum exposure under these arrangements is unknown as this would involve future claims that may be made against the Trust that have not yet occurred. Currently, the Trust expects the risk of loss to be remote.
2. Shares of Beneficial Interest
At June 30, 2018, there were an unlimited number of shares authorized (without par value). Transactions in the Fund’s shares were as follows:
| Six Months Ended June 30, 2018 | Year Ended December 31, 2017 | |||||||||||||||
| Shares | Amount | Shares | Amount | |||||||||||||
| Class Z Shares: | ||||||||||||||||
| Shares sold | 709,355 | $ | 11,376,283 | 3,534,237 | $ | 54,797,744 | ||||||||||
| Shares issued in reinvestment of distributions | — | — | 114,066 | 1,815,700 | ||||||||||||
| Shares redeemed | (1,056,374 | ) | (16,882,363 | ) | (1,098,953 | ) | (17,291,118 | ) | ||||||||
|
| |||||||||||||||
| Net increase (decrease) | (347,019 | ) | $ | (5,506,080 | ) | 2,549,350 | $ | 39,322,326 | ||||||||
|
| |||||||||||||||
| Class A Shares: | ||||||||||||||||
| Shares sold | 414,403 | $ | 6,589,240 | 1,959,536 | $ | 30,501,176 | ||||||||||
| Shares issued in reinvestment of distributions | — | — | 98,350 | 1,558,023 | ||||||||||||
| Shares redeemed | (1,034,042 | ) | (16,382,278 | ) | (2,635,900 | ) | (40,022,981 | ) | ||||||||
|
| |||||||||||||||
| Net increase (decrease) | (619,639 | ) | $ | (9,793,038 | ) | (578,014 | ) | $ | (7,963,782 | ) | ||||||
|
| |||||||||||||||
| Class C Shares: | ||||||||||||||||
| Shares sold | 161,158 | $ | 2,547,740 | 572,952 | $ | 8,653,851 | ||||||||||
| Shares issued in reinvestment of distributions | — | — | 22,302 | 348,313 | ||||||||||||
| Shares redeemed | (459,810 | ) | (7,158,047 | ) | (577,334 | ) | (8,776,064 | ) | ||||||||
|
| |||||||||||||||
| Net increase (decrease) | (298,652 | ) | $ | (4,610,307 | ) | 17,920 | $ | 226,100 | ||||||||
|
| |||||||||||||||
| Class R Shares: | ||||||||||||||||
| Shares sold | 34,442 | $ | 544,163 | 113,248 | $ | 1,751,799 | ||||||||||
| Shares issued in reinvestment of distributions | — | — | 2,245 | 35,346 | ||||||||||||
| Shares redeemed | (21,576 | ) | (345,755 | ) | (46,246 | ) | (727,130 | ) | ||||||||
|
| |||||||||||||||
| Net increase (decrease) | 12,866 | $ | 198,408 | 69,247 | $ | 1,060,015 | ||||||||||
|
| |||||||||||||||
| Class R6 Shares: | ||||||||||||||||
| Shares sold | 201,360 | $ | 3,206,190 | 685,257 | $ | 10,863,178 | ||||||||||
| Shares issued in reinvestment of distributions | — | — | 35,752 | 569,536 | ||||||||||||
| Shares redeemed | (211,258 | ) | (3,397,781 | ) | (277,679 | ) | (4,337,610 | ) | ||||||||
|
| |||||||||||||||
| Net increase (decrease) | (9,898 | ) | $ | (191,591 | ) | 443,330 | $ | 7,095,104 | ||||||||
|
| |||||||||||||||
| 30 | Semiannual Report | franklintempleton.com |
FRANKLIN MUTUAL INTERNATIONAL FUND
NOTES TO FINANCIAL STATEMENTS (UNAUDITED)
3. Transactions with Affiliates
Franklin Resources, Inc. is the holding company for various subsidiaries that together are referred to as Franklin Templeton Investments. Certain officers and trustees of the Fund are also officers and/or directors of the following subsidiaries:
| Subsidiary | Affiliation | |
Franklin Mutual Advisers, LLC (Franklin Mutual) | Investment manager | |
Franklin Templeton Services, LLC (FT Services) | Administrative manager | |
Franklin Templeton Distributors, Inc. (Distributors) | Principal underwriter | |
Franklin Templeton Investor Services, LLC (Investor Services) | Transfer agent |
a. Management Fees
The Fund pays an investment management fee to Franklin Mutual of 0.875% per year of the average daily net assets of the Fund.
b. Administrative Fees
Under an agreement with Franklin Mutual, FT Services provides administrative services to the Fund. The fee is paid by Franklin Mutual based on the Fund’s average daily net assets, and is not an additional expense of the Fund.
c. Distribution Fees
The Board has adopted distribution plans for each share class, with the exception of Class Z and Class R6 shares, pursuant to Rule 12b-1 under the 1940 Act. Under the Fund’s Class A reimbursement distribution plan, the Fund reimburses Distributors for costs incurred in connection with the servicing, sale and distribution of the Fund’s shares up to the maximum annual plan rate. Under the Class A reimbursement distribution plan, costs exceeding the maximum for the current plan year cannot be reimbursed in subsequent periods. In addition, under the Fund’s Class C and R compensation distribution plans, the Fund pays Distributors for costs incurred in connection with the servicing, sale and distribution of the Fund’s shares up to the maximum annual plan rate for each class. The plan year, for purposes of monitoring compliance with the maximum annual plan rates, is February 1 through January 31.
The maximum annual plan rates, based on the average daily net assets, for each class, are as follows:
Class A | 0.35% | |||
Class C | 1.00% | |||
Class R | 0.50% |
The Board has set the current rate at 0.25% per year for Class A shares until further notice and approval by the Board.
d. Sales Charges/Underwriting Agreements
Front-end sales charges and contingent deferred sales charges (CDSC) do not represent expenses of the Fund. These charges are deducted from the proceeds of sales of Fund shares prior to investment or from redemption proceeds prior to remittance, as applicable. Distributors has advised the Fund of the following commission transactions related to the sales and redemptions of the Fund’s shares for the period:
Sales charges retained net of commissions paid to unaffiliated brokers/dealers | $ | 10,758 | ||
CDSC retained | $ | 361 |
| franklintempleton.com | Semiannual Report | 31 |
FRANKLIN MUTUAL INTERNATIONAL FUND
NOTES TO FINANCIAL STATEMENTS (UNAUDITED)
3. Transactions with Affiliates (continued)
e. Transfer Agent Fees
Each class of shares pays transfer agent fees to Investor Services for its performance of shareholder servicing obligations. Effective November 1, 2017, the fees are based on an annualized asset based fee of 0.02% plus a transaction based fee. Prior to November 1, 2017, the fees were account based fees that varied based on fund or account type. In addition, each class reimburses Investor Services for out of pocket expenses incurred and, except for Class R6, reimburses shareholder servicing fees paid to third parties. These fees are allocated daily based upon their relative proportion of such classes’ aggregate net assets. Class R6 pays Investor Services transfer agent fees specific to that class.
For the period ended June 30, 2018, the Fund paid transfer agent fees of $166,749, of which $89,953 was retained by Investor Services.
f. Investments in Affiliated Management Investment Companies
The Fund invests in one or more affiliated management investment companies for purposes other than exercising a controlling influence over the management or policies. Management fees paid by the Fund are waived on assets invested in the affiliated management investment companies, as noted in the Statement of Operations, in an amount not to exceed the management and administrative fees paid directly or indirectly by each affiliate. During the period ended June 30, 2018, the Fund held investments in affiliated management investment companies as follows:
| Number of Shares Held at Beginning of Period | Gross Additions | Gross Reductions | Number of Shares Held at End of Period | Value at End of Period | Dividend Income | Realized Gain (Loss) | Net Change in Unrealized Appreciation (Depreciation) | |||||||||||||||||||||||||
| Non-Controlled Affiliates | ||||||||||||||||||||||||||||||||
Institutional Fiduciary Trust Money Market Portfolio, 1.51% | — | 1,357,000 | (1,357,000 | ) | — | $ — | $ — | $ — | $ — | |||||||||||||||||||||||
|
| |||||||||||||||||||||||||||||||
g. Waiver and Expense Reimbursements
Franklin Mutual and Investor Services have contractually agreed in advance to waive or limit their respective fees and to assume as their own expense certain expenses otherwise payable by the Fund so that the expenses (excluding distribution fees, acquired fund fees and expenses) for each class of the Fund do not exceed 0.97% and Class R6 does not exceed 0.83% based on the average net assets of each class (other than certain non-routine expenses or costs, including those relating to litigation, indemnification, reorganizations, and liquidations) until April 30, 2019. Total expenses waived or paid are not subject to recapture subsequent to the Fund’s fiscal year end. Prior to May 1, 2018, expenses for Class R6 were limited to 0.81%. Prior to February 1, 2018, expenses for each class of the Fund were limited to 1.17% and expenses for Class R6 were limited to 1.01%.
h. Other Affiliated Transactions
At June 30, 2018, one or more of the funds in Franklin Fund Allocator Series owned 8.0% of the Fund’s outstanding shares.
4. Expense Offset Arrangement
The Fund has entered into an arrangement with its custodian whereby credits realized as a result of uninvested cash balances are used to reduce a portion of the Fund’s custodian expenses. During the period ended June 30, 2018, the custodian fees were reduced as noted in the Statement of Operations.
| 32 | Semiannual Report | franklintempleton.com |
FRANKLIN MUTUAL INTERNATIONAL FUND
NOTES TO FINANCIAL STATEMENTS (UNAUDITED)
5. Independent Trustees’ Retirement Plan
On January 1, 1993, the Trust adopted an Independent Trustees’ Retirement Plan (Plan). The Plan is an unfunded defined benefit plan that provides benefit payments to Trustees whose length of service and retirement age meets the eligibility requirements of the Plan. Benefits under the Plan are based on years of service and fees paid to each trustee at the time of retirement. Effective in December 1996, the Plan was closed to new participants.
During the period ended June 30, 2018, the Fund’s projected benefit obligation and benefit payments under the Plan were as follows:
aProjected benefit obligation at June 30, 2018. | $ | 292 | ||
bIncrease in projected benefit obligation | $ | 89 | ||
Benefit payments made to retired trustees | $ | (112 | ) |
aThe projected benefit obligation is included in trustees’ fees and expenses in the Statement of Assets and Liabilities.
bThe increase in projected benefit obligation is included in trustees’ fees and expenses in the Statement of Operations.
6. Income Taxes
For tax purposes, capital losses may be carried over to offset future capital gains, if any.
At December 31, 2017, the capital loss carryforwards were as follows:
Capital loss carryforwards not subject to expiration: | ||||
Short term | $ 5,601,773 | |||
Long term | 8,348,899 | |||
|
| |||
Total capital loss carryforwards | $13,950,672 | |||
|
|
At June 30, 2018, the cost of investments and net unrealized appreciation (depreciation) for income tax purposes were as follows:
Cost of investments | $188,516,419 | |||
|
| |||
Unrealized appreciation | $ 26,895,252 | |||
Unrealized depreciation | (18,201,220 | ) | ||
|
| |||
Net unrealized appreciation (depreciation) | $ 8,694,032 | |||
|
| |||
Differences between income and/or capital gains as determined on a book basis and a tax basis are primarily due to differing treatment of foreign currency transactions.
7. Investment Transactions
Purchases and sales of investments (excluding short term securities) for the period ended June 30, 2018, aggregated $28,569,927 and $50,025,890, respectively.
8. Concentration of Risk
Investing in foreign securities may include certain risks and considerations not typically associated with investing in U.S. securities, such as fluctuating currency values and changing local and regional economic, political and social conditions, which may result in greater market volatility. In addition, certain foreign securities may not be as liquid as U.S. securities.
| franklintempleton.com | Semiannual Report | 33 |
FRANKLIN MUTUAL INTERNATIONAL FUND
NOTES TO FINANCIAL STATEMENTS (UNAUDITED)
9. Other Derivative Information
At June 30, 2018, the Fund’s investments in derivative contracts are reflected in the Statement of Assets and Liabilities as follows:
Asset Derivatives | Liability Derivatives | |||||||||||
Derivative Contracts Not Accounted for as Hedging Instruments | Statement of Assets and Liabilities Location | Fair Value | Statement of Assets and Liabilities Location | Fair Value | ||||||||
| Foreign exchange contracts | Variation margin on futures contracts | $ 272,627 | a | Variation margin on futures contracts | $ — | |||||||
Unrealized appreciation on OTC forward exchange contracts | 3,839,590 | Unrealized depreciation on OTC forward exchange contracts | 68,774 | |||||||||
|
|
|
| |||||||||
Totals | $4,112,217 | $68,774 | ||||||||||
|
|
|
| |||||||||
aThis amount reflects the cumulative appreciation (depreciation) of futures contracts as reported in the Statement of Investments. Only the variation margin receivable/ payable at period end is separately reported within the Statement of Assets and Liabilities. Prior variation margin movements were recorded to cash upon receipt or payment.
For the period ended June 30, 2018, the effect of derivative contracts in the Fund’s Statement of Operations was as follows:
Derivative Contracts Not Accounted for as Hedging Instruments | Statement of Operations Location | Net Realized Gain (Loss) for the Period | Statement of Operations Location | Net Change in Unrealized Appreciation (Depreciation) for the Period | ||||||||
Net realized gain (loss) from: | Net change in unrealized appreciation (depreciation) on: | |||||||||||
Foreign exchange contracts | Forward exchange contracts | $(3,249,189 | ) | Forward exchange contracts | $6,725,764 | |||||||
Futures contracts | 396,005 | Futures contracts | 654,583 | |||||||||
|
|
|
| |||||||||
Totals | $(2,853,184 | ) | $7,380,347 | |||||||||
|
|
|
| |||||||||
For the period ended June 30, 2018, the average month end notional amount of futures contracts represented $26,533,840. The average month end contract value of forward exchange contracts was $139,211,169.
At June 30, 2018, the Fund’s OTC derivative assets and liabilities are as follows:
| Gross Amounts of Assets and Liabilities Presented in the Statement of Assets and Liabilities | ||||||||
| Assetsa | Liabilitiesa | |||||||
| Derivatives | ||||||||
Forward exchange contracts | $3,839,590 | $68,774 | ||||||
|
| |||||||
aAbsent an event of default or early termination, OTC derivative assets and liabilities are presented gross and not offset in the Statement of Assets and Liabilities.
| 34 | Semiannual Report | franklintempleton.com |
FRANKLIN MUTUAL INTERNATIONAL FUND
NOTES TO FINANCIAL STATEMENTS (UNAUDITED)
At June 30, 2018, the Fund’s OTC derivative assets, which may be offset against the Fund’s OTC derivative liabilities and collateral received from the counterparty, are as follows:
| Amounts Not Offset in the Statement of Assets and Liabilities | ||||||||||||||||||||
Gross Amounts of | Financial Instruments Available for Offset | Financial Instruments Collateral Receiveda,b | Cash Collateral Received | Net Amount (Not less than zero) | ||||||||||||||||
| Counterparty | ||||||||||||||||||||
BOFA | $ 337,621 | $ (6,320 | ) | $ (276,641 | ) | $ — | $ 54,660 | |||||||||||||
BONY | 737,353 | (6,287 | ) | (731,066 | ) | — | — | |||||||||||||
HSBK | 1,151,474 | (9,152 | ) | (1,084,736 | ) | — | 57,586 | |||||||||||||
SSBT | 613,970 | (1,427 | ) | (612,543 | ) | — | — | |||||||||||||
UBSW | 999,172 | (45,588 | ) | (953,584 | ) | — | — | |||||||||||||
|
| |||||||||||||||||||
Total | $3,839,590 | $(68,774 | ) | $(3,658,570 | ) | $ — | $112,246 | |||||||||||||
|
| |||||||||||||||||||
At June 30, 2018, the Fund’s OTC derivative liabilities, which may be offset against the Fund’s OTC derivative assets and collateral pledged to the counterparty, are as follows:
| Amounts Not Offset in the Statement of Assets and Liabilities | ||||||||||||||||||||
Gross Amounts of | Financial Instruments Available for Offset | Financial Instruments Collateral Pledged | Cash Collateral Pledged | Net Amount (Not less than zero) | ||||||||||||||||
| Counterparty | ||||||||||||||||||||
BOFA | $ 6,320 | $ (6,320 | ) | $ — | $ — | $ — | ||||||||||||||
BONY | 6,287 | (6,287 | ) | — | — | — | ||||||||||||||
HSBK | 9,152 | (9,152 | ) | — | — | — | ||||||||||||||
SSBT | 1,427 | (1,427 | ) | — | — | — | ||||||||||||||
UBSW | 45,588 | (45,588 | ) | — | — | — | ||||||||||||||
|
| |||||||||||||||||||
Total | $68,774 | $(68,774 | ) | $ — | $ — | $ — | ||||||||||||||
|
| |||||||||||||||||||
aAt June 30, 2018, the Fund received U.K. Treasury Bonds and U.S. Treasury Bills and Notes as collateral for derivatives.
bIn some instances, the collateral amounts disclosed in the table above were adjusted due to the requirement to limit collateral amounts to avoid the effect of overcollateralization. Actual collateral received and/or pledged may be more than the amounts disclosed herein.
See Note 1(c) regarding derivative financial instruments.
See Abbreviations on page 37.
10. Credit Facility
The Fund, together with other U.S. registered and foreign investment funds (collectively, Borrowers), managed by Franklin Templeton Investments, are borrowers in a joint syndicated senior unsecured credit facility totaling $2 billion (Global Credit Facility) which matures on February 8, 2019. This Global Credit Facility provides a source of funds to the Borrowers for temporary and emergency purposes, including the ability to meet future unanticipated or unusually large redemption requests.
| franklintempleton.com | Semiannual Report | 35 |
FRANKLIN MUTUAL INTERNATIONAL FUND
NOTES TO FINANCIAL STATEMENTS (UNAUDITED)
10. Credit Facility (continued)
Under the terms of the Global Credit Facility, the Fund shall, in addition to interest charged on any borrowings made by the Fund and other costs incurred by the Fund, pay its share of fees and expenses incurred in connection with the implementation and maintenance of the Global Credit Facility, based upon its relative share of the aggregate net assets of all of the Borrowers, including an annual commitment fee of 0.15% based upon the unused portion of the Global Credit Facility. These fees are reflected in other expenses in the Statement of Operations. During the period ended June 30, 2018, the Fund did not use the Global Credit Facility.
11. Fair Value Measurements
The Fund follows a fair value hierarchy that distinguishes between market data obtained from independent sources (observable inputs) and the Fund’s own market assumptions (unobservable inputs). These inputs are used in determining the value of the Fund’s financial instruments and are summarized in the following fair value hierarchy:
| • | Level 1 – quoted prices in active markets for identical financial instruments |
| • | Level 2 – other significant observable inputs (including quoted prices for similar financial instruments, interest rates, prepayment speed, credit risk, etc.) |
| • | Level 3 – significant unobservable inputs (including the Fund’s own assumptions in determining the fair value of financial instruments) |
The input levels are not necessarily an indication of the risk or liquidity associated with financial instruments at that level.
For movements between the levels within the fair value hierarchy, the Fund has adopted a policy of recognizing the transfers as of the date of the underlying event which caused the movement.
A summary of inputs used as of June 30, 2018, in valuing the Fund’s assets and liabilities carried at fair value, is as follows:
| Level 1 | Level 2 | Level 3 | Total | |||||||||||||
| Assets: | ||||||||||||||||
Investments in Securities:a | ||||||||||||||||
Equity Investments:b | ||||||||||||||||
Media | $ | — | $ | — | $ | 651,999 | $ | 651,999 | ||||||||
All Other Equity Investments | 178,125,213 | — | — | 178,125,213 | ||||||||||||
Short Term Investments | 5,589,072 | 8,800,000 | — | 14,389,072 | ||||||||||||
|
| |||||||||||||||
Total Investments in Securities | $ | 183,714,285 | $ | 8,800,000 | $ | 651,999 | $ | 193,166,284 | ||||||||
|
| |||||||||||||||
Other Financial Instruments: | ||||||||||||||||
Futures Contracts | $ | 272,627 | $ | — | $ | — | $ | 272,627 | ||||||||
Forward Exchange Contracts | — | 3,839,590 | — | 3,839,590 | ||||||||||||
|
| |||||||||||||||
Total Other Financial Instruments | $ | 272,627 | $ | 3,839,590 | $ | — | $ | 4,112,217 | ||||||||
|
| |||||||||||||||
| Liabilities: | ||||||||||||||||
Other Financial Instruments: | ||||||||||||||||
Forward Exchange Contracts | $ | — | $ | 68,774 | $ | — | $ | 68,774 | ||||||||
|
| |||||||||||||||
aFor detailed categories, see the accompanying Statement of Investments.
bIncludes common and preferred stocks.
A reconciliation of assets in which Level 3 inputs are used in determining fair value is presented when there are significant Level 3 financial instruments at the beginning and/or end of the period.
| 36 | Semiannual Report | franklintempleton.com |
FRANKLIN MUTUAL INTERNATIONAL FUND
NOTES TO FINANCIAL STATEMENTS (UNAUDITED)
12. Subsequent Events
The Fund has evaluated subsequent events through the issuance of the financial statements and determined that no events have occurred that require disclosure, except for the following:
On February 27, 2018, the Board approved an automatic conversion feature for Class C that will convert shareholders’ Class C shares into Class A shares after they have been held for 10 years. The conversion feature will become effective on a future date prior to the calendar year end of 2018. Further details are disclosed in the Fund’s Prospectus.
On May 17, 2018, the Board approved changes to certain front-end sales charges and dealer commissions on Class A shares. The changes will become effective on or about September 10, 2018. Further details are disclosed in the Fund’s Prospectus.
Abbreviations
| Counterparty | Currency | Selected Portfolio | ||||||||
| BOFA | Bank of America Corp. | EUR | Euro | ADR | American Depositary Receipt | |||||
| BONY | The Bank of New York Mellon Corp. | GBP | British Pound | FHLB | Federal Home Loan Bank | |||||
| HSBK | HSBC Bank PLC | USD | United States Dollar | |||||||
| SSBT | State Street Bank and Trust Co., N.A. | |||||||||
| UBSW | UBS AG | |||||||||
| franklintempleton.com | Semiannual Report | 37 |
FRANKLIN MUTUAL SERIES FUNDS
FRANKLIN MUTUAL INTERNATIONAL FUND
Shareholder Information
Board Approval of Investment Management Agreements
FRANKLIN MUTUAL SERIES FUNDS
Franklin Mutual International Fund
(Fund)
The Board of Trustees (Board), including a majority of trustees that are not “interested persons” as such term is defined in section 2(a)(19) of the Investment Company Act of 1940 (hereinafter referred to as “independent trustees”), at an in-person meeting held on May 17, 2018, unanimously approved the renewal of the Fund’s investment management agreement. Prior to a meeting of all of the trustees for the purpose of considering such renewal, the independent trustees participated in two other meetings held in connection with the renewal process. Throughout the process, the independent trustees received assistance and advice from and met separately with independent counsel. The independent trustees met with and interviewed officers of the investment manager (including portfolio managers), the transfer agent and shareholder services group and the distributor. In approving the renewal of the investment management agreement for the Fund, the Board, including the independent trustees, determined that the investment management fee structure was fair and reasonable and that continuance of the agreement was in the best interests of the Fund and its shareholders.
In reaching their decision on the investment management agreement, the trustees took into account information furnished throughout the year at regular Board meetings, as well as information specifically requested and furnished for the renewal process, which culminated in the meetings referred to above for the specific purpose of considering such agreement. Information furnished throughout the year included, among others, reports on the Fund’s investment performance, expenses, portfolio composition, portfolio brokerage execution, client commission arrangements, derivatives, securities lending, asset segregation, portfolio turnover, Rule 12b-1 plan, distribution, shareholder servicing, legal and compliance matters, pricing of securities, sales and redemptions, and marketing support payments made to financial intermediaries, as well as a third-party survey of transfer agent fees charged to funds within the Franklin Templeton Investments (FTI) complex in comparison with those charged to other fund complexes deemed comparable. Also, related financial statements and other information about the scope and quality of services provided by the investment manager and its affiliates and enhancements to such services over the past year were
provided. In addition, the trustees received periodic reports throughout the year and during the renewal process relating to compliance with the Fund’s investment policies and restrictions. During the renewal process, the independent trustees considered the investment manager’s methods of operation within the Franklin Templeton group and its activities on behalf of other clients. The Board also noted that it received an annual report on all payments made by FTI or the Fund to financial intermediaries engaged in the sale of Fund shares, as well as a memorandum relating to third-party servicing arrangements in response to a Guidance Update from the U.S. Securities and Exchange Commission (SEC) relating to mutual fund distribution and sub-accounting fees.
The information obtained by the trustees during the renewal process also included a special report prepared by Broadridge Financial Solutions, Inc., an independent third-party analyst that utilizes data from Lipper, Inc. (“Lipper”), comparing the Fund’s investment performance and expenses with those of other mutual funds deemed comparable to the Fund as selected by Lipper (Broadridge Section 15(c) Report). The trustees reviewed the Broadridge Section 15(c) Report and its usefulness in the renewal process with respect to matters such as comparative fees, expenses, expense ratios, performance and volatility. They concluded that the report continues to be a reliable resource in the performance of their duties.
In addition, the trustees received a Profitability Study (Profitability Study) prepared by management discussing the profitability to FTI from its overall U.S. fund operations, as well as on an individual fund-by-fund basis. Over the past year, the Board and counsel to the independent trustees continued to receive reports on management’s handling of recent regulatory inquiries and pending legal actions against the investment manager and its affiliates. The independent trustees were satisfied with the actions taken to date by management in response to such regulatory and legal matters.
The trustees reviewed the personnel, operations, financial condition, and investment management capabilities, methodologies and resources of the investment manager. As part of this review, particular attention was given to management’s diligent risk management program, including continual monitoring and management of cybersecurity, liquidity and counterparty credit risk, and attention given to derivatives and other complex instruments that are held and expected to be held by the Fund and how such instruments are used to carry out the Fund’s investment goal(s). The Board also took into account, among other things, management’s efforts in
| 38 | Semiannual Report | franklintempleton.com |
FRANKLIN MUTUAL SERIES FUNDS
FRANKLIN MUTUAL INTERNATIONAL FUND
SHAREHOLDER INFORMATION
establishing a global credit facility for the benefit of the Fund and other accounts managed by FTI to provide a source of cash for temporary and emergency purposes or to meet unusual redemption requests as well as the strong financial position of the investment manager’s parent company and its commitment to the mutual fund business. The Board noted management’s continuing efforts and expenditures in establishing effective business continuity plans and developing strategies to address areas of heightened concern in the mutual fund industry, such as cybersecurity and liquidity risk management. The Board also recognized management’s commitment to facilitating Board oversight of particular areas, including derivatives and payments to intermediaries, by enhanced reporting.
In addition to the above and other matters considered by the trustees throughout the course of the year, the following discussion relates to certain primary factors relevant to the Board’s decision. This discussion of the information and factors considered by the Board (including the information and factors discussed above) is not intended to be exhaustive, but rather summarizes certain factors considered by the Board. In view of the wide variety of factors considered, the Board did not, unless otherwise noted, find it practicable to quantify or otherwise assign relative weights to the foregoing factors. In addition, individual trustees may have assigned different weights to various factors.
NATURE, EXTENT AND QUALITY OF SERVICES. The trustees reviewed the nature, extent and quality of the services provided, and to be provided, by the investment manager. The trustees cited the investment manager’s ability to implement the Fund’s disciplined value investment approach and its long-term relationship with the Fund as reasons that shareholders choose to invest, and remain invested, in the Fund. The trustees reviewed the Fund’s portfolio management team, including its performance, staffing, skills and compensation program. With respect to portfolio manager compensation, management assured the trustees that the Fund’s long-term performance is a significant component of incentive-based compensation and noted that a portion of a portfolio manager’s incentive-based compensation is paid in shares of pre-designated funds from the portfolio manager’s fund management area. The trustees noted that the portfolio manager compensation program aligned the interests of the portfolio managers with that of shareholders of the Fund. The trustees discussed with management various other products, portfolios and entities that are advised by the investment manager and the allocation of assets and expenses among and within them, as well as their relative fees and reasons for differences with respect thereto and any potential
conflicts. During regular Board meetings and the aforementioned meetings of the independent trustees, the trustees received reports and presentations on the investment manager’s best execution trading policies. The trustees considered periodic reports provided to them showing that the investment manager complied with the investment policies and restrictions of the Fund as well as other reports periodically furnished to the Board covering matters such as the compliance of portfolio managers and other management personnel with the code of ethics covering the investment management personnel, the adherence to fair value pricing procedures established by the Board and the accuracy of net asset value calculations. The Board noted the extent of the benefits provided to Fund shareholders from being part of the Franklin Templeton group of funds, including the right to exchange investments between funds (same class) without a sales charge, the ability to reinvest Fund dividends into other funds and the right to combine holdings of other funds to obtain reduced sales charges. The Board considered the investment manager’s significant efforts in developing and implementing compliance procedures established in accordance with SEC and other requirements.
The Board considered the nature, extent and quality of the services to be provided under the Fund’s other service agreements to determine that, on an overall basis, Fund shareholders were well served. In this connection, the Board also took into account transfer agent and shareholder services provided to Fund shareholders by an affiliate of the investment manager, noting continuing expenditures by management to increase and improve the scope of such services and favorable periodic reports on shareholder services conducted by independent third parties. While such considerations directly affected the trustees’ decision in renewing the Fund’s transfer agent and shareholder services agreement, the Board also considered these commitments as incidental benefits to Fund shareholders deriving from the investment management relationship.
Based on their review, the trustees were satisfied with the nature and quality of the overall services provided, and to be provided, by the investment manager and its affiliates to the Fund and its shareholders and were confident in the abilities of the management team to continue the disciplined value investment approach of the Fund and to provide quality services to the Fund and its shareholders.
INVESTMENT PERFORMANCE. As the Fund commenced operations on May 31, 2009, the trustees reviewed the investment performance of the Fund for the one-, three- and
| franklintempleton.com | Semiannual Report | 39 |
FRANKLIN MUTUAL SERIES FUNDS
FRANKLIN MUTUAL INTERNATIONAL FUND
SHAREHOLDER INFORMATION
five-year periods ended December 31, 2017. They considered the history of successful performance of the Fund relative to various benchmarks. As part of their review, they inquired of management regarding benchmarks, style drift and restrictions on permitted investments. Consideration was also given to performance in the context of available levels of cash during the periods.
The trustees had meetings during the year, including the meetings referred to above held in connection with the renewal process, with the Fund’s portfolio managers to discuss performance and the management of the Fund. In addition to the materials provided by management in connection with the renewal process, the independent trustees requested supplemental information and additional presentations from the investment manager and senior management of FTI regarding the performance of the investment manager and the Fund. As part of these presentations, it was noted that senior management of FTI is conducting a review of the investment manager and the Fund and will report the results thereof to the independent trustees when completed. In addition, particular attention in assessing performance was given to the Broadridge Section 15(c) Report. That report showed the investment performance of the Fund (Class A shares) in comparison to other funds determined comparable by Lipper.
The comparable funds to the Fund, as chosen by Lipper, included all retail and institutional international multi-cap value funds. The Fund had total returns in the lowest performing quintile for the one-year period ended December 31, 2017, and had annualized total returns for the three- and five-year periods in the second-lowest performing quintile. The trustees also compared Fund performance to other industry benchmarks, including measures of risk-adjusted performance of a fund, as part of their evaluation of investment performance. The trustees discussed with management the reasons for the relative underperformance for the one-, three-, and five-year periods ended December 31, 2017. While disappointed with the relative underperformance of the Fund, the Board did not believe that any changes with respect to the Fund were warranted at the time. The Board noted that it would continue to monitor future performance and, when available, would evaluate the results of the review being conducted by senior management of FTI.
COMPARATIVE EXPENSES AND MANAGEMENT PROFITABILITY. The trustees considered the cost of the services provided and to be provided and the profitability of the investment manager and its affiliates from their respective relationships with the Fund. In considering the appropriateness
of the management fee and other expenses charged to the Fund, the Board took into account various factors including investment performance and matters relating to Fund operations, including, but not limited to, the quality and experience of its portfolio managers and research staff. As part of this discussion, the Board took into account the extension for an additional year of the fee waiver and expense limitation arrangement. Consideration was also given to a comparative analysis in the Broadridge Section 15(c) Report of the investment management fee and total expense ratio of the Fund in comparison with those of a group of other funds selected by Lipper as its appropriate Lipper expense group. Lipper expense data is based upon information taken from each fund’s most recent annual report, which reflects historical asset levels that may be quite different from those currently existing, particularly in a period of market volatility. While recognizing such inherent limitation and the fact that expense ratios generally increase as assets decline and decrease as assets grow, the Board believed the independent analysis conducted by Lipper to be an appropriate measure of comparative expenses.
In reviewing comparative costs, emphasis was given to the Fund’s contractual management fee in comparison with the contractual management fee that would have been charged by other funds within its Lipper expense group assuming they were similar in size to the Fund, as well as the actual total expenses of the Fund in comparison with those of its Lipper expense group. The Lipper contractual management fee analysis includes administrative charges as being part of the management fee, and total expenses, for comparative consistency, are shown by Lipper for Fund Class A shares.
The Fund’s contractual management fee rate was in the most expensive quintile of its Lipper expense group and its total expenses were in the second-most expensive quintile of such group. The Board noted that the Fund’s total expenses were within 6 basis points of its expense group median. The Board found such comparative fees and expenses to be acceptable in view of factors relating to the Fund’s operations, such as the quality and experience of its portfolio managers.
The trustees also reviewed the Profitability Study addressing profitability of Franklin Resources, Inc., from its overall U.S. fund business, as well as profitability to the Fund’s investment manager and its affiliates, from providing investment management and other services to the Fund during the 12-month period ended September 30, 2017, the most recent fiscal year-end of Franklin Resources, Inc. The trustees
| 40 | Semiannual Report | franklintempleton.com |
FRANKLIN MUTUAL SERIES FUNDS
FRANKLIN MUTUAL INTERNATIONAL FUND
SHAREHOLDER INFORMATION
reviewed the basis on which such reports are prepared and the cost allocation methodology utilized in the Profitability Study, it being recognized that allocation methodologies may each be reasonable while producing different results. In this respect, the Board noted that the reasonableness of the cost allocation methodologies was reviewed by independent accountants on an every other year basis.
The independent trustees met with management to discuss the Profitability Study. This included, among other things, a comparison of investment management income with investment management expenses of the Fund; comparison of underwriting revenues and expenses; the relative relationship of investment management and underwriting expenses; shareholder servicing profitability; economies of scale; and the relative contribution of the Fund to the profitability of the investment manager and its parent. In discussing the Profitability Study with the Board, the investment manager stated its belief that the costs incurred in establishing the infrastructure necessary to operate the type of mutual fund operations conducted by it and its affiliates may not be fully reflected in the expenses allocated to the Fund in determining its profitability.
The Board also took into account management’s expenditures in improving shareholder services provided to the Fund, as well as the need to meet additional regulatory and compliance requirements. The trustees also considered the extent to which the investment manager may derive ancillary benefits from Fund operations, including those derived from economies of scale, discussed below, the allocation of Fund brokerage and the use of commission dollars to pay for research and other similar services.
Based upon their consideration of all these factors, the trustees determined that the level of profits realized by the investment manager and its affiliates in providing services to the Fund was not excessive in view of the nature, quality and extent of services provided.
ECONOMIES OF SCALE. The Board considered economies of scale realized by the investment manager and its affiliates as the Fund grows larger and the extent to which they are shared with Fund shareholders, as for example, in the level of the investment management fee charged, in the quality and efficiency of services rendered and in increased capital commitments benefiting the Fund directly or indirectly. The Board also considered the fee waiver and expense limitation arrangement in effect, and the amount of Fund expenses that were absorbed since inception of the Fund by the investment manager through such waiver and arrangement. The Board
concluded that economies of scale were deemed not to be a significant factor at that time in light of, among other matters, the fee waiver and expense limitation arrangement in effect and the limited size of assets under management.
Proxy Voting Policies and Procedures
The Fund’s investment manager has established Proxy Voting Policies and Procedures (Policies) that the Fund uses to determine how to vote proxies relating to portfolio securities. Shareholders may view the Fund’s complete Policies online at franklintempleton.com. Alternatively, shareholders may request copies of the Policies free of charge by calling the Proxy Group collect at (954) 527-7678 or by sending a written request to: Franklin Templeton Companies, LLC, 300 S.E. 2nd Street, Fort Lauderdale, FL 33301, Attention: Proxy Group. Copies of the Fund’s proxy voting records are also made available online at franklintempleton.com and posted on the US Securities and Exchange Commission’s website at sec.gov and reflect the most recent 12-month period ended June 30.
Quarterly Statement of Investments
The Trust, on behalf of the Fund, files a complete statement of investments with the US Securities and Exchange Commission for the first and third quarters for each fiscal year on Form N-Q. Shareholders may view the filed Form N-Q by visiting the Commission’s website at sec.gov. The filed form may also be viewed and copied at the Commission’s Public Reference Room in Washington, DC. Information regarding the operations of the Public Reference Room may be obtained by calling (800) SEC-0330.
| franklintempleton.com | Semiannual Report | 41 |
This page intentionally left blank.
This page intentionally left blank.
This page intentionally left blank.
| Semiannual Report and Shareholder Letter Franklin Mutual International Fund
| |||
Investment Manager Franklin Mutual Advisers, LLC
| ||||
| Distributor | ||||
Franklin Templeton Distributors, Inc. (800) DIAL BEN® / 342-5236 franklintempleton.com
| ||||
Shareholder Services (800) 632-2301 - (Class A, C, R & R6) (800) 448-FUND - (Class Z) |
Authorized for distribution only when accompanied or preceded by a summary prospectus and/or prospectus. Investors should carefully consider a fund’s investment goals, risks, charges and expenses before investing. A prospectus contains this and other information; please read it carefully before investing.
To help ensure we provide you with quality service, all calls to and from our service areas are monitored and/or recorded.
| © 2018 Franklin Templeton Investments. All rights reserved. | 373 S 08/18 |
Item 2. Code of Ethics.
(a) The Registrant has adopted a code of ethics that applies to its principal executive officers and principal financial and accounting officer.
| (c) N/A |
| (d) N/A |
(f) Pursuant to Item 12(a)(1), the Registrant is attaching as an exhibit a copy of its code of ethics that applies to its principal executive officers and principal financial and accounting officer.
Item 3. Audit Committee Financial Expert.
(a)(1) The Registrant has an audit committee financial expert serving on its audit committee.
(2) The audit committee financial expert is Ann Torre Bates, and she is “independent” as defined under the relevant Securities and Exchange Commission Rules and Releases.
Item 4. Principal Accountant Fees and Services. N/A
Item 5. Audit Committee of Listed Registrants. N/A
| Item 6. Schedule | of Investments. N/A |
Item 7. Disclosure of Proxy Voting Policies and Procedures for Closed-End Management Investment Companies. N/A
Item 8. Portfolio Managers of Closed-End Management Investment Companies. N/A
| Item 9. Purchases | of Equity Securities by Closed-End Management Investment Company and Affiliated Purchasers. N/A |
Item 10. Submission of Matters to a Vote of Security Holders.
There have been no changes to the procedures by which shareholders may recommend nominees to the Registrant’s Board of Trustees that would require disclosure herein.
Item 11. Controls and Procedures.
(a) Evaluation of Disclosure Controls and Procedures. The Registrant maintains disclosure controls and procedures that are designed to ensure that information required to be disclosed in the Registrant’s filings under the Securities Exchange Act of 1934 and the Investment Company Act of 1940 is recorded, processed, summarized and reported
within the periods specified in the rules and forms of the Securities and Exchange Commission. Such information is accumulated and communicated to the Registrant’s management, including its principal executive officer and principal financial officer, as appropriate, to allow timely decisions regarding required disclosure. The Registrant’s management, including the principal executive officer and the principal financial officer, recognizes that any set of controls and procedures, no matter how well designed and operated, can provide only reasonable assurance of achieving the desired control objectives.
Within 90 days prior to the filing date of this Shareholder Report on Form N-CSR, the Registrant had carried out an evaluation, under the supervision and with the participation of the Registrant’s management, including the Registrant’s principal executive officer and the Registrant’s principal financial officer, of the effectiveness of the design and operation of the Registrant’s disclosure controls and procedures. Based on such evaluation, the Registrant’s principal executive officer and principal financial officer concluded that the Registrant’s disclosure controls and procedures are effective.
(b) Changes in Internal Controls. There have been no changes in the Registrant’s internal controls or in other factors that could materially affect the internal controls over financial reporting subsequent to the date of their evaluation in connection with the preparation of this Shareholder Report on Form N-CSR.
Item 12. Disclosure of Securities Lending Activities for Closed-End Management Investment Company. N/A
| Item 13. Exhibits. |
(a)(1) Code of Ethics
(a)(2) Certifications pursuant to Section 302 of the Sarbanes-Oxley Act of 2002 of Matthew T. Hinkle, Chief Executive Officer - Finance and Administration, and Robert G. Kubilis, Chief Financial Officer and Chief Accounting Officer
(b) Certifications pursuant to Section 906 of the Sarbanes-Oxley Act of 2002 of Matthew T. Hinkle, Chief Executive Officer - Finance and Administration, and Robert G. Kubilis, Chief Financial Officer and Chief Accounting Officer
SIGNATURES
Pursuant to the requirements of the Securities Exchange Act of 1934 and the Investment Company Act of 1940, the registrant has duly caused this report to be signed on its behalf by the undersigned, thereunto duly authorized.
FRANKLIN MUTUAL SERIES FUNDS
| By | /s/ MATTHEW T. HINKLE | |
| Matthew T. Hinkle | ||
Chief Executive Officer – Finance and Administration | ||
| Date August 24, 2018 | ||
Pursuant to the requirements of the Securities Exchange Act of 1934 and the Investment Company Act of 1940, this report has been signed below by the following persons on behalf of the registrant and in the capacities and on the dates indicated.
| By | /s/ MATTHEW T. HINKLE | |
| Matthew T. Hinkle | ||
Chief Executive Officer – Finance and Administration | ||
| Date August 24, 2018 | ||
| By | /s/ ROBERT G. KUBILIS | |
| Robert G. Kubilis | ||
| Chief Financial Officer and Chief Accounting Officer | ||
| Date: August 24, 2018 | ||