UNITED STATES
SECURITIES AND EXCHANGE COMMISSION
Washington, DC 20549
FORMN-CSRS
CERTIFIED SHAREHOLDER REPORT OF REGISTERED
MANAGEMENT INVESTMENT COMPANIES
Investment Company Act file number811-05387
Franklin Mutual Series Funds
(Exact name of registrant as specified in charter)
101 John F. Kennedy Parkway, Short Hills, NJ 07078-2705
(Address of principal executive offices) (Zip code)
Craig S. Tyle, One Franklin Parkway, San Mateo, CA 94403-1906
(Name and address of agent for service)
Registrant’s telephone number, including area code: (210)912-2100
Date of fiscal year end: 12/31
Date of reporting period: 6/30/19
| Item 1. | Reports to Stockholders. |
Sign up for electronic delivery at franklintempleton.com/edelivery
Internet Delivery of Fund Reports Unless You Request Paper Copies: Effective January 1, 2021, as permitted by the SEC, paper copies of the Fund’s shareholder reports will no longer be sent by mail, unless you specifically request them from the Fund or your financial intermediary. Instead, the reports will be made available on a website, and you will be notified by mail each time a report is posted and provided with a website link to access the report.
If you already elected to receive shareholder reports electronically, you will not be affected by this change and you need not take any action. If you have not signed up for electronic delivery, we would encourage you to join fellow shareholders who have. You may elect to receive shareholder reports and other communications electronically from the Fund by calling (800)632-2301 or by contacting your financial intermediary.
You may elect to continue to receive paper copies of all your future shareholder reports free of charge by contacting your financial intermediary or, if you invest directly with a Fund, calling (800)632-2301 to let the Fund know of your request. Your election to receive reports in paper will apply to all funds held in your account.
FRANKLIN TEMPLETON
Successful investing begins with ambition. And achievement only comes when you reach for it. That’s why we continually strive to deliver better outcomes for investors. No matter what your goals are, our deep, global investment expertise allows us to offer solutions that can help.
During our more than 70 years of experience, we’ve managed through all kinds of markets—up, down and those in between. We’re always preparing for what may come next. It’s because of this, combined with our strength as one of the world’s largest asset managers that we’ve earned the trust of millions of investors around the world.
Dear Franklin Mutual Beacon Fund Shareholder:
The markets came into 2019 in a fog of uncertainty. The outlook for economic growth had become less bright and fears were mounting that the U.S. Federal Reserve (Fed) would make a policy misstep in raising interest rates too far. Over the past six months, many of these economic concerns have eased, as the Fed and other major central banks like the European Central Bank (ECB) turned more dovish amid signs that growth was becoming a bit more sluggish. The ECB suggested it would act should growth soften and inflation not materialize. This dovishness helped propel the U.S. equity market back toward record highs in June. Bond yields, meanwhile, fell on the prospect for increased central bank-driven liquidity, with some sovereign European bonds sliding back into negative territory.
Although the prospects of a more accommodative monetary policy eased fears about the economic outlook, persistent trade tensions between the U.S. and China, among other nations, kept markets on edge. This was on full display in May when markets fell sharply on a ratcheting up of tensions and after the U.S. government threatened to place tariffs on Mexican goods. Mideast tensions also began to heat up in June with attacks on oil tankers in the Persian Gulf and greater tensions between the U.S. and Iran.
How, and even whether, the U.K. will leave the European Union has also remained unresolved. Atperiod-end, the U.K. Conservative Party was conducting a leadership contest,
which has the potential to complicate future Brexit negotiations and leave markets vulnerable to increased volatility.
Despite all this uncertainty, for thesix-month period ended June 30, 2019, U.S. stocks, as measured by the Standard & Poor’s 500® Index (S&P 500®), posted a +18.54% total return, while stocks in global developed markets, as measured by the MSCI World Index, posted a +17.38% total return.1
As has been the case in recent years, growth stocks, particularly in the technology sector, have outperformed over thesix-month period. Value stocks generally have remained disfavored in this environment where, at times, economic factors and monetary policy have had greater sway on equity returns than corporate fundamentals.
We recognize the important role of financial advisors in today’s markets and encourage investors to continue to seek their advice. Amid changing markets and economic conditions, we are confident investors with a well-diversified portfolio and a patient, long-term outlook will be well positioned for the years ahead.
On the following pages, the Fund’s portfolio management team reviews investment decisions that pertain to performance during the past six months considering the
1. Source: Morningstar.
See www.franklintempletondatasources.com for additional data provider information.
| Not FDIC Insured | | | May Lose Value | | | No Bank Guarantee | ||||
| franklintempleton.com | Not part of the semiannual report | 1 | ||||
economic environment and other factors. Please remember all securities markets fluctuate, as do mutual fund share prices.
We thank you for investing with Franklin Templeton, welcome your questions and comments, and look forward to continuing to serve your investment needs in the years ahead.
Sincerely,

Peter A. Langerman
Chairman, President and Chief Executive Officer
Franklin Mutual Advisers, LLC
This letter reflects our analysis and opinions as of June 30, 2019, unless otherwise indicated. The information is not a complete analysis of every aspect of any market, country, industry, security or fund. Statements of fact are from sources considered reliable.
Semiannual Report | ||||
| Franklin Mutual Beacon Fund | 3 | |||
| Performance Summary | 9 | |||
| Your Fund’s Expenses | 11 | |||
| Financial Highlights and Statement of Investments | 12 | |||
| Financial Statements | 22 | |||
| Notes to Financial Statements | 27 | |||
| Shareholder Information | 40 | |||
| Visitfranklintempleton.comfor fund updates, to access your account, or to find helpful financial planning tools. | ||||
| 2 | Not part of the semiannual report | franklintempleton.com | ||||
SEMIANNUAL REPORT
This semiannual report for Franklin Mutual Beacon Fund covers the period ended June 30, 2019.
Your Fund’s Goal and Main Investments
The Fund seeks capital appreciation, which may occasionally be short term, with income as a secondary goal. Under normal market conditions, the Fund invests primarily in equity securities of U.S. and foreign companies that the investment manager believes are available at market prices less than their intrinsic value. The equity securities in which the Fund invests are primarily common stock, with a current focus onmid- andlarge-cap companies. To a lesser extent, the Fund also invests in merger arbitrage securities and the debt and equity of distressed companies. The Fund may invest a substantial portion, potentially up to 100% of its assets, in foreign securities, which may include sovereign debt and participations in foreign government debt. The Geographic Composition bar chart on this page lists the leading countries where the Fund invests.
Performance Overview
The Fund’s Class Z shares posted a +14.03% cumulative total return for the six months ended June 30, 2019. In comparison, the Fund’s benchmark, the MSCI World Index (USD), which tracks stock performance in global developed markets, posted a +17.38% total return.1 You can find more of the Fund’s performance data in the Performance Summary beginning on page 9.
Performance data represent past performance, which does not guarantee future results. Investment return and principal value will fluctuate, and you may have a gain or loss when you sell your shares. Current performance may differ from figures shown. For most recentmonth-end performance, go tofranklintempleton.comor call(800)342-5236.
Economic and Market Overview
The global economy expanded during the six months ended June 30, 2019 despite weakness in certain regions. Global developed and emerging market stocks were aided by upbeat economic data in some regions, encouraging corporate earnings reports and periods of optimism about a
Geographic Composition*
Based on Total Net Assets as of 6/30/19
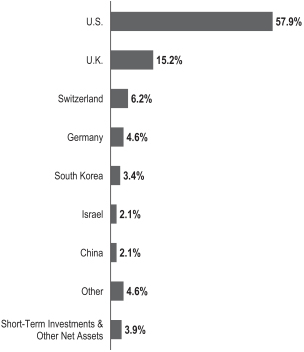
*Figures are stated as a percentage of total and may not equal 100% or may be negative due to rounding, use of any derivatives, unsettled trades or other factors. The Fund held 38.2% of total net assets in foreign securities.
potential U.S.-China trade deal. Further supporting markets were the U.S. Federal Reserve’s (Fed’s) patient approach to its monetary policy in 2019 and recent indication it will act as appropriate to sustain U.S. economic expansion.
However, markets reflected concerns about political uncertainties in the U.S. and the European Union, geopolitical risks in certain regions, and the impact of U.S. trade disputes with China and other trading partners on global growth and corporate earnings. In this environment, global developed and emerging market stocks, as measured by the MSCI All Country World Index, posted a +16.60% total return for thesix-month period.1
1. Source: Morningstar.
The index is unmanaged and includes reinvestment of any income or distributions. It does not reflect any fees, expenses or sales charges. One cannot invest directly in an index, and an index is not representative of the Fund’s portfolio.
The dollar value, number of shares or principal amount, and names of all portfolio holdings are listed in the Fund’s Statement of Investments (SOI).
The SOI begins on page 17.
| franklintempleton.com | Semiannual Report | 3 | ||||
FRANKLIN MUTUAL BEACON FUND
The U.S. economy grew during the six months ended June 30, 2019. After moderating for two consecutive quarters, the economy grew significantly faster in 2019’s first quarter, driven by growth in consumer spending, inventory investment, exports, business investment, and state and local government spending. However, the economy moderated again in the second quarter, due to weakness in inventory investment, exports, business investment and housing investment. The unemployment rate decreased from 3.9% in December 2018 to 3.7% atperiod-end.2 The annual inflation rate, as measured by the Consumer Price Index, decreased from 1.9% in December 2018 to 1.6% atperiod-end.2
The Fed held its target range for the federal funds rate unchanged, at 2.25%–2.50%, during the reporting period. In March, the Fed mentioned it would end its balance sheet normalization program by the end of September 2019. In June, the Fed indicated increased uncertainties around its views on economic activity and the labor market. With market-based inflation measures remaining low recently, the market has interpreted the Fed’s recent statements to mean it will likely cut rates in 2019’s second half to foster continued economic growth while attempting to achieve its inflation objective.
In Europe, the U.K.’s quarterly gross domestic product (GDP) growth accelerated in 2019’s first quarter, but GDP contracted in the second quarter compared with the first quarter as Brexit uncertainties weighed on business sentiment. The Bank of England left its key policy rate unchanged during the period. The eurozone’s quarterly GDP accelerated in 2019’s first quarter but moderated in the second quarter, and the bloc’s annual inflation rate marginally decreased byperiod-end. The European Central Bank (ECB) kept its benchmark interest rate unchanged for the same time. In June, the ECB mentioned it would leave interest rates unchanged through the first half of 2020, provided details of its new stimulus, and indicated its openness to cut rates or increase stimulus.
In Asia, Japan’s quarterly GDP growth accelerated in 2019’s first quarter. In June, the Bank of Japan also left its benchmark interest rate unchanged, while continuing its stimulus measures, and expressed its openness to cut interest rates or increase stimulus.
In larger emerging markets, Brazil’s quarterly GDP growth contracted in 2019’s first quarter. The Central Bank of Brazil
left its benchmark interest rate unchanged during the period. Russia’s annual GDP growth moderated in 2019’s first quarter. The Bank of Russia cut its key rate once during the period. China’s annual GDP growth rate stabilized in 2019’s first quarter. The People’s Bank of China left its benchmark interest rate unchanged, but it took measures to improve financial liquidity to mitigate the effects of the U.S.-China trade dispute and support economic growth. Overall, global emerging market stocks, as measured by the MSCI Emerging Markets Index, posted a +10.78% total return during thesix-month period.1
Investment Strategy
At Franklin Mutual Series, we are committed to our distinctive value approach to investing, which we believe can generate above-average risk-adjusted returns over time for our shareholders. Our major investment strategy is investing in undervalued stocks. When selecting undervalued equities, we are attracted to what we believe are fundamentally strong companies with healthy balance sheets, high-quality assets, substantial free cash flow and shareholder-oriented management teams and whose stocks are trading at discounts to our assessment of the companies’ intrinsic or business value. We also look for asset-rich companies whose shares may be trading at depressed levels due to concerns over short-term earnings disappointments, litigation, management strategy or other perceived negatives. This strict value approach is not only intended to improve the likelihood of capital appreciation, but also reduces the risk of substantial declines, in our opinion. While the vast majority of our undervalued equity investments are made in publicly traded companies globally, we may invest occasionally in privately held companies as well.
To a lesser extent, we complement this more traditional investment strategy with two others. One is distressed investing, a highly specialized field that has proven quite profitable during certain periods over the years. Distressed investing is complex and can take many forms. The most common distressed investment the Fund undertakes is the purchase of financially troubled or bankrupt companies’ debt at a substantial discount to face value. After the financially distressed company is reorganized, often in bankruptcy court, the old debt is typically replaced with new securities issued by the financially stronger company.
The other piece of our investment strategy is participating in arbitrage situations, another highly specialized field. When
2. Source: U.S. Bureau of Labor Statistics.
See www.franklintempletondatasources.com for additional data provider information.
| 4 | Semiannual Report | franklintempleton.com | ||
FRANKLIN MUTUAL BEACON FUND
companies announce proposed mergers or takeovers, commonly referred to as “deals,” the target company may trade at a discount to the bid it ultimately accepts. One form of arbitrage involves purchasing the target company’s stock when it is trading below the value we believe it would receive in a deal. In keeping with our commitment to a relatively conservative investment approach, we typically focus our arbitrage efforts on announced deals, and avoid rumored deals or other situations we consider relatively risky. In addition, it is our practice to hedge the Fund’s currency exposure when we deem it advantageous for our shareholders.
What is meant by “hedge”?
|
To hedge an investment is to take a position intended to offset potential losses that may be incurred by a companion financial instrument. Hedging an investment may also offset potential gains.
|
Manager’s Discussion
Franklin Mutual Series has long analyzed companies in many ways beyond just looking at the numbers. We analyze the way a company is run and how decisions are made at the executive and board levels. We look at the sustainability of a company, including the relationships with employees and customers, as well as the environmental impacts of a company’s business. In many ways this is common sense. A company that takes advantage of customers and unsustainably produces environmental waste is worth less than one that does not do these things. Similarly, a company that iswell-run and responsive to shareholders is worth more than one whose executives manage the company for their private benefit. However, disclosure has been limited on many relevant issues, and there is disagreement among companies, shareholders and data providers about which factors should be measured and how they should be measured.
This type of analysis is labeled ESG analysis, where ESG stands for environmental, social, and governance factors. Many firms, including Franklin Templeton, are incorporating ESG factors in their investment research. In addition, there are other bodies such as the Sustainable Accounting Standards Board that are working on standardizing metrics for companies and industries to improve their reporting on these factors, particularly in the environmental and social areas. As a result, ESG analysis is improving across the market, and Franklin Mutual Series analysts are better able to analyzenon-traditional factors, including greenhouse gas emissions, water consumption, energy usage, talent
Top 10 Sectors/Industries
Based on Equity Securities as of 6/30/19
| % of Total Net Assets | ||||
| Pharmaceuticals | 10.2% | |||
| Banks | 9.2% | |||
| Media | 8.2% | |||
| Oil, Gas & Consumable Fuels | 6.0% | |||
| Technology Hardware, Storage & Peripherals | 5.9% | |||
| Software | 5.4% | |||
| Insurance | 5.1% | |||
| Health Care Equipment & Supplies | 4.3% | |||
| Entertainment | 3.8% | |||
| Electrical Equipment | 3.6% | |||
management, diversity and inclusion, executive compensation, and enterprise risk management, to name a few. ESG investing should not be confused with social or exclusionary types of investing, but should rather be viewed as an additional tool analysts and portfolio managers use in the investment process to identify and measurenon-traditional, potential business risks and opportunities at a company.
Today, Franklin Mutual Series analysts review and analyze ESG reports produced by third parties or the companies themselves to assess potential risks that could have an impact on shareholder value. In addition, we have discussions with management teams around ESG risks, how they deal with them and the potential impact on stakeholders. Our discussions have included issues such as water consumption in mining, the impact of changing carbon dioxide emission standards on the automotive industry and discussions with boards and management teams around management pay. Although more work needs to be done to standardize data from companies within industries so that comparisons can be relevant, the identification and discussion of ESG risk factors is an input we consider in helping frame the potential negative events individual companies or industries may face. In our view, solid ESG ratings are an output of fundamentally good business practices, not an input. As the data and information regarding ESG risk factors continue to evolve, we believe the increased information will highlight additional risk factors to enterprises and help us make more informed investment decisions going forward.
Mergers and Acquisitions
Merger and acquisition (M&A) activity remained healthy in the first half of 2019. The health care sector led the way, with pharmaceuticals megamergers among the biggest
| franklintempleton.com | Semiannual Report | 5 | ||||
FRANKLIN MUTUAL BEACON FUND
transactions. The pending acquisitions of Celgene and Allergan (not a Fund holding), each worth almost $90 billion, exemplify this strength. The Top 10 Sectors/Industries table on this page lists pharmaceuticals and other leading industries in which the Fund currently invests. Large deals have also been announced in the defense, oil and gas exploration and production, and diversified financial services industries, underlying the broad strength of the M&A boom. In addition, U.S. and foreign regulators appear to be more amenable to deals, leading markets to expect fewer regulatory surprises. We are closely monitoring the U.S.-China trade conflict, becauseflare-ups could potentially impact pending and future deals. We expect M&A activity to remain strong for as long as the equity markets remain positive, as has been the historical pattern.
Credit Markets
Opportunities to invest in mispriced risk across global fixed income markets remained limited in the first half of 2019. The low interest-rate environment kept credit widely available, and default rates are still at historically low levels. Debt covenant terms, which include restrictions on the borrower’s financial activities, remain loose or nonexistent. In such an environment, we believe it is prudent to focus our efforts on investing in short-term mispriced risk and catalyst-driven credit opportunities.
On the restructuring side, Cumulus Media and iHeartMedia, two long-term distressed credit positions, emerged from bankruptcy or had reached a confirmable restructuring agreement in 2018, reducing further the purely distressed portion of the credit holdings within the Funds. We are hopeful more opportunities may emerge as the business and economic cycles elongate amid persistent uncertainties. We will continue to seek to invest across the capital structures of companies that avail themselves of opportunities to bolster liquidity through internally generated free cash flow and corporate actions, including asset sales and debt refinancing.
Fund Performance
Top positive contributors to performance included Charter Communications, Novartis and Walt Disney. These companies are listed among the Fund’s largest positions in the Top 10 Equity Holdings table on this page.
In late January, U.S.-based Charter Communications, a telecommunications and mass media company, reported quarterly earnings, revenues and free cash flow that topped market expectations. Charter also estimated that 2019 capital spending and operating costs per customer could likely be lower than 2018, providing a boost to operating
| Top 10 Equity Holdings | ||||
| 6/30/19 | ||||
Company Sector/Industry, Country
| % of Total
| |||
Novartis AG Pharmaceuticals, Switzerland | 4.5% | |||
Medtronic PLC Health Care Equipment & Supplies, U.S. | 4.3% | |||
The Walt Disney Co. Entertainment, U.S. | 3.9% | |||
Sensata Technologies Holding PLC Electrical Equipment, U.S. | 3.6% | |||
Charter Communications Inc. Media, U.S. | 3.5% | |||
Samsung Electronics Co. Ltd. Technology Hardware, Storage & Peripherals, South Korea | 3.4% | |||
GlaxoSmithKline PLC Pharmaceuticals, U.K. | 3.2% | |||
Cognizant Technology Solutions Corp. IT Services, U.S. | 3.2% | |||
JPMorgan Chase & Co. Banks, U.S. | 3.1% | |||
Standard Chartered PLC Banks, U.K. | 3.1% | |||
margins. In our view, Charter’s integration plan following the 2016 acquisition of Time Warner Cable is starting to produce positive results.
In March, Switzerland-based drug maker Novartis announced the official process and dates for itstax-free spinoff of the eye care device and consumer products business of Alcon (shares received by the Fund not held atperiod-end), and the U.S. Food and Drug Administration approved Mayzent, the first oral drug to treat secondary progressive multiple sclerosis. In May, Novartis won U.S. regulatory approval for gene therapy that treats spinal muscular atrophy and announced the purchase of a dry eye drug from a Japanese drug company. We believe Novartis is continuing to position itself as a more focused and innovation-driven drug company, and that the market does not fully appreciate the many innovative products it has in development.
The stock of U.S.-based diversified international family entertainment and media enterprise Walt Disney surged following an investor event outlining the strategy and expectations for its new streaming service. The breadth and depth of content, the price point, and the technology and user interface supporting it have increased optimism about
| 6 | Semiannual Report | franklintempleton.com | ||
FRANKLIN MUTUAL BEACON FUND
the service. Market expectations for the service’s growth and profitability rose significantly on the back of this event.
During the period under review, Fund investments that detracted from performance included Baidu, Indiabulls Housing Finance and Dufry.
Shares of China-based internet search firm Baidu slid after the company posted a loss for its fiscal first-quarter 2019. The weaker economic environment in China coupled with governmental regulation led to slower advertisement sales growth during the quarter. However, Baidu continues to invest heavily in its video-streaming platform and other initiatives like artificial intelligence. These investments should help the company further diversify its business into new growth markets.
Shares of Indiabulls Housing Finance, an India-based consumer finance company, declined after a criminal writ was filed alleging financial fraud. The company described the allegations as baseless, and the writ was subsequently withdrawn. The company has continued its pursuit to merge parts of its business with a local bank. Indiabulls seeks to gain a banking license through the deal and has received some regulatory approval. The deal remains subject to the receipt of additional regulatory and shareholder approvals.
Dufry is a Switzerland-based global travel retailer with duty-free and duty-paid stores in airports and other transportation-related facilities. During the period, ongoing foreign exchange and economic pressures, particularly in Latin America, hindered the stock. However, we believe Dufry’s dominant industry position, global scale and strong free cash flow generation continues to make it a compelling investment.
During the period, the Fund held currency forwards and futures seeking to hedge most of the currency risk of the portfolio’snon-U.S. dollar investments. The hedges had a positive overall impact on the Fund’s performance because of the appreciation of the U.S. dollar versus the hedged currencies.
What is a currency forward?
|
| |
A currency forward is a direct agreement between the Fund and a counterparty to buy or sell a foreign currency in exchange for another currency at a specific exchange rate on a future date.
| ||
As fellow shareholders, we found recent relative performance disappointing, but it is not uncommon for our strategy to lag the equity markets at times. We remain
CFA® is a trademark owned by CFA Institute.
What is a future? | ||
A future is an agreement between the Fund and a counterparty made through a U.S. or foreign futures exchange to buy or sell an underlying instrument or asset at a specific price on a future date.
|
| |
committed to our disciplined, value investment approach as we seek to generate attractive, long-term, risk-adjusted returns for shareholders.
Thank you for your participation in Franklin Mutual Beacon Fund. We look forward to continuing to serve your investment needs.
 |  | |
Christian Correa, CFA Co-Portfolio Manager | ||
 |  | |
Mandana Hormozi Co-Portfolio Manager | ||
 |  | |
Aman Gupta, CFA Co-Portfolio Manager | ||
| franklintempleton.com | Semiannual Report | 7 | ||||
FRANKLIN MUTUAL BEACON FUND
The foregoing information reflects our analysis, opinions and portfolio holdings as of June 30, 2019, the end of the reporting period. The way we implement our main investment strategies and the resulting portfolio holdings may change depending on factors such as market and economic conditions. These opinions may not be relied upon as investment advice or an offer for a particular security. The information is not a complete analysis of every aspect of any market, country, industry, security or the Fund. Statements of fact are from sources considered reliable, but the investment manager makes no representation or warranty as to their completeness or accuracy. Although historical performance is no guarantee of future results, these insights may help you understand our investment management philosophy.
| 8 | Semiannual Report | franklintempleton.com | ||
FRANKLIN MUTUAL BEACON FUND
Performance Summary as of June 30, 2019
The performance table does not reflect any taxes that a shareholder would pay on Fund dividends, capital gain distributions, if any, or any realized gains on the sale of Fund shares. Total return reflects reinvestment of the Fund’s dividends and capital gain distributions, if any, and any unrealized gains or losses. Your dividend income will vary depending on dividends or interest paid by securities in the Fund’s portfolio, adjusted for operating expenses of each class. Capital gain distributions are net profits realized from the sale of portfolio securities.
Performance as of 6/30/19
Cumulative total return excludes sales charges. Average annual total return includes maximum sales charges. Sales charges will vary depending on the size of the investment and the class of share purchased. The maximum is 5.50% and the minimum is 0%.Class A:5.50% maximum initial sales charge. For other share classes, visitfranklintempleton.com.
| Share Class | Cumulative Total Return1 | Average Annual Total Return2 | ||||||
Z | ||||||||
6-Month | +14.03% | +14.03% | ||||||
1-Year | +6.63% | +6.63% | ||||||
5-Year | +32.81% | +5.84% | ||||||
10-Year | +182.60% | +10.95% | ||||||
A3 | ||||||||
6-Month | +13.87% | +7.63% | ||||||
1-Year | +6.33% | +0.48% | ||||||
5-Year | +31.04% | +4.36% | ||||||
10-Year | +174.71% | +10.01% | ||||||
Performance data represent past performance, which does not guarantee future results. Investment return and principal value will fluctuate, and you may have a gain or loss when you sell your shares. Current performance may differ from figures shown. For most recentmonth-end performance, go tofranklintempleton.comor call(800)342-5236.
See page 10 for Performance Summary footnotes.
| franklintempleton.com | Semiannual Report | 9 | ||||
FRANKLIN MUTUAL BEACON FUND
PERFORMANCE SUMMARY
Total Annual Operating Expenses4
| Share Class | ||||
Z | 0.81 | % | ||
A | 1.06 | % | ||
Each class of shares is available to certain eligible investors and has different annual fees and expenses, as described in the prospectus.
All investments involve risks, including possible loss of principal. Value securities may not increase in price as anticipated or may decline further in value. Special risks are associated with foreign investing, including currency fluctuations, economic instability and political developments. Because the Fund may invest its assets in companies in a specific region, including Europe, it is subject to greater risks of adverse developments in that region and/or the surrounding regions than a fund that is more broadly diversified geographically. Current political and financial uncertainty surrounding the European Union may increase market volatility and the economic risk of investing in companies in Europe. Smaller-company stocks have exhibited greater price volatility than larger-company stocks, particularly over the short term. The Fund’s investments in companies engaged in mergers, reorganizations or liquidations also involve special risks as pending deals may not be completed on time or on favorable terms. The Fund may invest in lower-rated bonds, which entail higher credit risk. The Fund is actively managed but there is no guarantee that the manager’s investment decisions will produce the desired results. The Fund’s prospectus also includes a description of the main investment risks.
1. Cumulative total return represents the change in value of an investment over the periods indicated.
2. Average annual total return represents the average annual change in value of an investment over the periods indicated. Return for less than one year, if any, has not been annualized.
3. Prior to 9/10/18, these shares were offered at a higher initial sales charge of 5.75%, thus actual returns (with sales charges) would have differed. Average annual total returns (with sales charges) have been restated to reflect the current maximum initial sales charge of 5.50%.
4. Figures are as stated in the Fund’s current prospectus and may differ from the expense ratios disclosed in the Your Fund’s Expenses and Financial Highlights sections in this report. In periods of market volatility, assets may decline significantly, causing total annual Fund operating expenses to become higher than the figures shown.
| 10 | Semiannual Report | franklintempleton.com | ||
FRANKLIN MUTUAL BEACON FUND
As a Fund shareholder, you can incur two types of costs: (1) transaction costs, including sales charges (loads) on Fund purchases and redemptions; and (2) ongoing Fund costs, including management fees, distribution and service(12b-1) fees, and other Fund expenses. All mutual funds have ongoing costs, sometimes referred to as operating expenses. The table below shows ongoing costs of investing in the Fund and can help you understand these costs and compare them with those of other mutual funds. The table assumes a $1,000 investment held for the six months indicated.
Actual Fund Expenses
The table below provides information about actual account values and actual expenses in the columns under the heading “Actual.” In these columns the Fund’s actual return, which includes the effect of Fund expenses, is used to calculate the “Ending Account Value” for each class of shares. You can estimate the expenses you paid during the period by following these steps (of course, your account value and expenses will differ from those in this illustration): Divide your account value by $1,000 (if your account had an $8,600 value, then $8,600÷ $1,000 = 8.6). Then multiply the result by the number in the row for your class of shares under the headings “Actual” and “Expenses Paid During Period” (if Actual Expenses Paid During Period were $7.50, then 8.6 x $7.50 = $64.50). In this illustration, the actual expenses paid this period are $64.50.
Hypothetical Example for Comparison with Other Funds
Under the heading “Hypothetical” in the table, information is provided about hypothetical account values and hypothetical expenses based on the Fund’s actual expense ratio and an assumed rate of return of 5% per year before expenses, which is not the Fund’s actual return. This information may not be used to estimate the actual ending account balance or expenses you paid for the period, but it can help you compare ongoing costs of investing in the Fund with those of other funds. To do so, compare this 5% hypothetical example for the class of shares you hold with the 5% hypothetical examples that appear in the shareholder reports of other funds.
Please note that expenses shown in the table are meant to highlight ongoing costs and do not reflect any transactional costs. Therefore, information under the heading “Hypothetical” is useful in comparing ongoing costs only, and will not help you compare total costs of owning different funds. In addition, if transactional costs were included, your total costs would have been higher.
| Actual (actual return after expenses) | Hypothetical (5% annual return before expenses) | |||||||||||||||||
| Share Class | Beginning Account Value 1/1/19 | Ending Account Value 6/30/19 | Expenses Paid During Period 1/1/19–6/30/191, 2 | Ending Account Value 6/30/19 | Expenses Paid During Period 1/1/19–6/30/191, 2 | Net Annualized Expense Ratio2 | ||||||||||||
Z | $1,000 | $1,140.30 | $4.25 | $1,020.83 | $4.01 | 0.80% | ||||||||||||
A | $1,000 | $1,138.70 | $5.57 | $1,019.59 | $5.26 | 1.05% | ||||||||||||
C | $1,000 | $1,135.50 | $9.53 | $1,015.87 | $9.00 | 1.80% | ||||||||||||
R | $1,000 | $1,138.20 | $6.89 | $1,018.35 | $6.51 | 1.30% | ||||||||||||
R6 | $1,000 | $1,141.10 | $3.88 | $1,021.17 | $3.66 | 0.73% | ||||||||||||
1. Expenses are equal to the annualized expense ratio for thesix-month period as indicated above—in the far right column—multiplied by the simple average account value over the period indicated, and then multiplied by 181/365 to reflect theone-half year period.
2. Reflects expenses after fee waivers and expense reimbursements. Does not include acquired fund fees and expenses.
| franklintempleton.com | Semiannual Report | 11 | ||||
FRANKLIN MUTUAL SERIES FUNDS
Franklin Mutual Beacon Fund
Six Months Ended (unaudited) | Year Ended December 31, | |||||||||||||||||||||||
|
| |||||||||||||||||||||||
| 2018 | 2017 | 2016 | 2015 | 2014 | ||||||||||||||||||||
| ||||||||||||||||||||||||
Class Z | ||||||||||||||||||||||||
Per share operating performance (for a share outstanding throughout the period) | ||||||||||||||||||||||||
Net asset value, beginning of period | $13.76 | $16.61 | $15.30 | $14.30 | $16.59 | $16.91 | ||||||||||||||||||
|
| |||||||||||||||||||||||
| Income from investment operationsa: | ||||||||||||||||||||||||
Net investment incomeb | 0.18 | 0.29 | 0.29 | 0.37 | c | 0.29 | 0.54d | |||||||||||||||||
Net realized and unrealized gains (losses) | 1.75 | (1.68 | ) | 1.90 | 1.93 | (0.99 | ) | 0.62 | ||||||||||||||||
|
| |||||||||||||||||||||||
Total from investment operations | 1.93 | (1.39 | ) | 2.19 | 2.30 | (0.70 | ) | 1.16 | ||||||||||||||||
|
| |||||||||||||||||||||||
| Less distributions from: | ||||||||||||||||||||||||
Net investment income | — | (0.31 | ) | (0.31 | ) | (0.37 | ) | (0.37 | ) | (0.69) | ||||||||||||||
Net realized gains | — | (1.15 | ) | (0.57 | ) | (0.93 | ) | (1.22 | ) | (0.79) | ||||||||||||||
|
| |||||||||||||||||||||||
Total distributions | — | (1.46 | ) | (0.88 | ) | (1.30 | ) | (1.59 | ) | (1.48) | ||||||||||||||
|
| |||||||||||||||||||||||
| Net asset value, end of period | $15.69 | $13.76 | $16.61 | $15.30 | $14.30 | $16.59 | ||||||||||||||||||
|
| |||||||||||||||||||||||
Total returne | 14.03% | (8.24)% | 14.39% | 16.11% | (4.14)% | 6.82% | ||||||||||||||||||
| Ratios to average net assetsf | ||||||||||||||||||||||||
Expensesg,h | 0.80% | i | 0.80% | i | 0.78% | 0.80% | 0.84% | i | 0.83% | |||||||||||||||
Expenses incurred in connection with securities sold short | 0.01% | 0.01% | —% | 0.01% | 0.04% | 0.04% | ||||||||||||||||||
Net investment income | 2.46% | 1.77% | 1.78% | 2.48% | c | 1.73% | 3.14%d | |||||||||||||||||
| Supplemental data | ||||||||||||||||||||||||
Net assets, end of period (000’s) | $2,489,722 | $2,271,217 | $2,700,327 | $2,564,120 | $2,420,165 | $2,774,929 | ||||||||||||||||||
Portfolio turnover rate | 10.82% | 47.20% | 24.80% | 30.94% | 35.80% | 40.06% | ||||||||||||||||||
aThe amount shown for a share outstanding throughout the period may not correlate with the Statement of Operations for the period due to the timing of sales and repurchases of the Fund’s shares in relation to income earned and/or fluctuating fair value of the investments of the Fund.
bBased on average daily shares outstanding.
cNet investment income per share includes approximately $0.10 per share related to income received in the form of special dividends in connection with certain Fund holdings. Excluding this amount, the ratio of net investment income to average net assets would have been 1.81%.
dNet investment income per share includes approximately $0.24 per share related to income received in the form of a special dividend in connection with certain Fund holdings. Excluding this amount, the ratio of net investment income to average net assets would have been 1.74%.
eTotal return is not annualized for periods less than one year.
fRatios are annualized for periods less than one year.
gIncludes dividend and/or interest expense on securities sold short and security borrowing fees, if any. See below for the ratios of such expenses to average net assets for the periods presented. See Note 1(d).
hBenefit of expense reduction rounds to less than 0.01%.
iBenefit of waiver and payments by affiliates rounds to less than 0.01%.
| 12 | Semiannual Report | The accompanying notes are an integral part of these financial statements. | franklintempleton.com | ||
FRANKLIN MUTUAL SERIES FUNDS
FINANCIAL HIGHLIGHTS
Franklin Mutual Beacon Fund(continued)
Six Months Ended (unaudited) | Year Ended December 31, | |||||||||||||||||||||||
|
| |||||||||||||||||||||||
| 2018 | 2017 | 2016 | 2015 | 2014 | ||||||||||||||||||||
| ||||||||||||||||||||||||
Class A | ||||||||||||||||||||||||
Per share operating performance (for a share outstanding throughout the period) | ||||||||||||||||||||||||
Net asset value, beginning of period | $13.63 | $16.47 | $15.18 | $14.20 | $16.47 | $16.80 | ||||||||||||||||||
|
| |||||||||||||||||||||||
| Income from investment operationsa: | ||||||||||||||||||||||||
Net investment incomeb | 0.16 | 0.25 | 0.25 | 0.33 | c | 0.24 | 0.49d | |||||||||||||||||
Net realized and unrealized gains (losses) | 1.73 | (1.67 | ) | 1.87 | 1.91 | (0.97 | ) | 0.60 | ||||||||||||||||
|
| |||||||||||||||||||||||
Total from investment operations | 1.89 | (1.42 | ) | 2.12 | 2.24 | (0.73 | ) | 1.09 | ||||||||||||||||
|
| |||||||||||||||||||||||
| Less distributions from: | ||||||||||||||||||||||||
Net investment income | — | (0.27 | ) | (0.26 | ) | (0.33 | ) | (0.32 | ) | (0.63) | ||||||||||||||
Net realized gains | — | (1.15 | ) | (0.57 | ) | (0.93 | ) | (1.22 | ) | (0.79) | ||||||||||||||
|
| |||||||||||||||||||||||
Total distributions | — | (1.42 | ) | (0.83 | ) | (1.26 | ) | (1.54 | ) | (1.42) | ||||||||||||||
|
| |||||||||||||||||||||||
| Net asset value, end of period | $15.52 | $13.63 | $16.47 | $15.18 | $14.20 | $16.47 | ||||||||||||||||||
|
| |||||||||||||||||||||||
Total returne | 13.87% | (8.49)% | 14.09% | 15.80% | (4.33)% | 6.48% | ||||||||||||||||||
| Ratios to average net assetsf | ||||||||||||||||||||||||
Expensesg,h | 1.05% | i | 1.05% | i | 1.03% | 1.05% | 1.12% | i | 1.13% | |||||||||||||||
Expenses incurred in connection with securities sold short | 0.01% | 0.01% | —% | 0.01% | 0.04% | 0.04% | ||||||||||||||||||
Net investment income | 2.21% | 1.52% | 1.53% | 2.23% | c | 1.45% | 2.84%d | |||||||||||||||||
| Supplemental data | ||||||||||||||||||||||||
Net assets, end of period (000’s) | $969,005 | $890,294 | $983,048 | $992,306 | $1,019,568 | $1,101,706 | ||||||||||||||||||
Portfolio turnover rate | 10.82% | 47.20% | 24.80% | 30.94% | 35.80% | 40.06% | ||||||||||||||||||
aThe amount shown for a share outstanding throughout the period may not correlate with the Statement of Operations for the period due to the timing of sales and repurchases of the Fund’s shares in relation to income earned and/or fluctuating fair value of the investments of the Fund.
bBased on average daily shares outstanding.
cNet investment income per share includes approximately $0.10 per share related to income received in the form of special dividends in connection with certain Fund holdings. Excluding this amount, the ratio of net investment income to average net assets would have been 1.56%.
dNet investment income per share includes approximately $0.24 per share related to income received in the form of a special dividend in connection with certain Fund holdings. Excluding this amount, the ratio of net investment income to average net assets would have been 1.44%.
eTotal return does not reflect sales commissions or contingent deferred sales charges, if applicable, and is not annualized for periods less than one year.
fRatios are annualized for periods less than one year.
gIncludes dividend and/or interest expense on securities sold short and security borrowing fees, if any. See below for the ratios of such expenses to average net assets for the periods presented. See Note 1(d).
hBenefit of expense reduction rounds to less than 0.01%.
iBenefit of waiver and payments by affiliates rounds to less than 0.01%.
| franklintempleton.com | The accompanying notes are an integral part of these financial statements. | Semiannual Report | 13 | ||||
FRANKLIN MUTUAL SERIES FUNDS
FINANCIAL HIGHLIGHTS
Franklin Mutual Beacon Fund(continued)
Six Months Ended (unaudited) | Year Ended December 31, | |||||||||||||||||||||||
|
| |||||||||||||||||||||||
| 2018 | 2017 | 2016 | 2015 | 2014 | ||||||||||||||||||||
| ||||||||||||||||||||||||
Class C | ||||||||||||||||||||||||
Per share operating performance (for a share outstanding throughout the period) | ||||||||||||||||||||||||
Net asset value, beginning of period | $13.65 | $16.34 | $15.06 | $14.10 | $16.36 | $16.70 | ||||||||||||||||||
|
| |||||||||||||||||||||||
| Income from investment operationsa: | ||||||||||||||||||||||||
Net investment incomeb | 0.11 | 0.13 | 0.12 | 0.22 | c | 0.12 | 0.37d | |||||||||||||||||
Net realized and unrealized gains (losses) | 1.74 | (1.65 | ) | 1.86 | 1.88 | (0.96 | ) | 0.59 | ||||||||||||||||
|
| |||||||||||||||||||||||
Total from investment operations | 1.85 | (1.52 | ) | 1.98 | 2.10 | (0.84 | ) | 0.96 | ||||||||||||||||
|
| |||||||||||||||||||||||
| Less distributions from: | ||||||||||||||||||||||||
Net investment income | — | (0.02 | ) | (0.13 | ) | (0.21 | ) | (0.20 | ) | (0.51) | ||||||||||||||
Net realized gains | — | (1.15 | ) | (0.57 | ) | (0.93 | ) | (1.22 | ) | (0.79) | ||||||||||||||
|
| |||||||||||||||||||||||
Total distributions | — | (1.17 | ) | (0.70 | ) | (1.14 | ) | (1.42 | ) | (1.30) | ||||||||||||||
|
| |||||||||||||||||||||||
| Net asset value, end of period | $15.50 | $13.65 | $16.34 | $15.06 | $14.10 | $16.36 | ||||||||||||||||||
|
| |||||||||||||||||||||||
Total returne | 13.55% | (9.19)% | 13.25% | 14.94% | (5.06)% | 5.78% | ||||||||||||||||||
| Ratios to average net assetsf | ||||||||||||||||||||||||
Expensesg,h | 1.80%i | 1.80%i | 1.78% | 1.80% | 1.84%i | 1.83% | ||||||||||||||||||
Expenses incurred in connection with securities sold short | 0.01% | 0.01% | —% | 0.01% | 0.04% | 0.04% | ||||||||||||||||||
Net investment income | 1.46% | 0.77% | 0.78% | 1.48% | c | 0.73% | 2.14%d | |||||||||||||||||
| Supplemental data | ||||||||||||||||||||||||
Net assets, end of period (000’s) | $59,351 | $59,828 | $260,113 | $275,138 | $285,333 | $320,832 | ||||||||||||||||||
Portfolio turnover rate | 10.82% | 47.20% | 24.80% | 30.94% | 35.80% | 40.06% | ||||||||||||||||||
aThe amount shown for a share outstanding throughout the period may not correlate with the Statement of Operations for the period due to the timing of sales and repurchases of the Fund’s shares in relation to income earned and/or fluctuating fair value of the investments of the Fund.
bBased on average daily shares outstanding.
cNet investment income per share includes approximately $0.10 per share related to income received in the form of special dividends in connection with certain Fund holdings. Excluding this amount, the ratio of net investment income to average net assets would have been 0.81%.
dNet investment income per share includes approximately $0.24 per share related to income received in the form of a special dividend in connection with certain Fund holdings. Excluding this amount, the ratio of net investment income to average net assets would have been 0.74%.
eTotal return does not reflect sales commissions or contingent deferred sales charges, if applicable, and is not annualized for periods less than one year.
fRatios are annualized for periods less than one year.
gIncludes dividend and/or interest expense on securities sold short and security borrowing fees, if any. See below for the ratios of such expenses to average net assets for the periods presented. See Note 1(d).
hBenefit of expense reduction rounds to less than 0.01%.
iBenefit of waiver and payments by affiliates rounds to less than 0.01%.
| 14 | Semiannual Report | The accompanying notes are an integral part of these financial statements. | franklintempleton.com | ||
FRANKLIN MUTUAL SERIES FUNDS
FINANCIAL HIGHLIGHTS
Franklin Mutual Beacon Fund(continued)
Six Months Ended (unaudited) | Year Ended December 31, | |||||||||||||||||||||||
|
| |||||||||||||||||||||||
| 2018 | 2017 | 2016 | 2015 | 2014 | ||||||||||||||||||||
| ||||||||||||||||||||||||
Class R | ||||||||||||||||||||||||
Per share operating performance (for a share outstanding throughout the period) | ||||||||||||||||||||||||
Net asset value, beginning of period | $13.46 | $16.28 | $15.01 | $14.05 | $16.33 | $16.68 | ||||||||||||||||||
|
| |||||||||||||||||||||||
| Income from investment operationsa: | ||||||||||||||||||||||||
Net investment incomeb | 0.14 | 0.20 | 0.21 | 0.30 | c | 0.20 | 0.44d | |||||||||||||||||
Net realized and unrealized gains (losses) | 1.72 | (1.64 | ) | 1.84 | 1.89 | (0.97 | ) | 0.61 | ||||||||||||||||
|
| |||||||||||||||||||||||
Total from investment operations | 1.86 | (1.44 | ) | 2.05 | 2.19 | (0.77 | ) | 1.05 | ||||||||||||||||
|
| |||||||||||||||||||||||
| Less distributions from: | ||||||||||||||||||||||||
Net investment income | — | (0.23 | ) | (0.21 | ) | (0.30 | ) | (0.29 | ) | (0.61) | ||||||||||||||
Net realized gains | — | (1.15 | ) | (0.57 | ) | (0.93 | ) | (1.22 | ) | (0.79) | ||||||||||||||
|
| |||||||||||||||||||||||
Total distributions | — | (1.38 | ) | (0.78 | ) | (1.23 | ) | (1.51 | ) | (1.40) | ||||||||||||||
|
| |||||||||||||||||||||||
| Net asset value, end of period | $15.32 | $13.46 | $16.28 | $15.01 | $14.05 | $16.33 | ||||||||||||||||||
|
| |||||||||||||||||||||||
Total returne | 13.82% | (8.65)% | 13.76% | 15.58% | (4.61)% | 6.31% | ||||||||||||||||||
| Ratios to average net assetsf | ||||||||||||||||||||||||
Expensesg,h | 1.30%i | 1.30%i | 1.28% | 1.30% | 1.34%i | 1.33% | ||||||||||||||||||
Expenses incurred in connection with securities sold short | 0.01% | 0.01% | —% | 0.01% | 0.04% | 0.04% | ||||||||||||||||||
Net investment income | 1.96% | 1.27% | 1.28% | 1.98% | c | 1.23% | 2.64%d | |||||||||||||||||
| Supplemental data | ||||||||||||||||||||||||
Net assets, end of period (000’s) | $1,684 | $1,662 | $1,601 | $2,035 | $2,343 | $2,246 | ||||||||||||||||||
Portfolio turnover rate | 10.82% | 47.20% | 24.80% | 30.94% | 35.80% | 40.06% | ||||||||||||||||||
aThe amount shown for a share outstanding throughout the period may not correlate with the Statement of Operations for the period due to the timing of sales and repurchases of the Fund’s shares in relation to income earned and/or fluctuating fair value of the investments of the Fund.
bBased on average daily shares outstanding.
cNet investment income per share includes approximately $0.10 per share related to income received in the form of special dividends in connection with certain Fund holdings. Excluding this amount, the ratio of net investment income to average net assets would have been 1.31%.
dNet investment income per share includes approximately $0.24 per share related to income received in the form of a special dividend in connection with certain Fund holdings. Excluding this amount, the ratio of net investment income to average net assets would have been 1.24%.
eTotal return is not annualized for periods less than one year.
fRatios are annualized for periods less than one year.
gIncludes dividend and/or interest expense on securities sold short and security borrowing fees, if any. See below for the ratios of such expenses to average net assets for the periods presented. See Note 1(d).
hBenefit of expense reduction rounds to less than 0.01%.
iBenefit of waiver and payments by affiliates rounds to less than 0.01%.
| franklintempleton.com | The accompanying notes are an integral part of these financial statements. | Semiannual Report | 15 | ||||
FRANKLIN MUTUAL SERIES FUNDS
FINANCIAL HIGHLIGHTS
Franklin Mutual Beacon Fund(continued)
Six Months Ended (unaudited) | Year Ended December 31, | |||||||||||||||||||||||
|
| |||||||||||||||||||||||
| 2018 | 2017 | 2016 | 2015 | 2014 | ||||||||||||||||||||
| ||||||||||||||||||||||||
Class R6 | ||||||||||||||||||||||||
Per share operating performance (for a share outstanding throughout the period) | ||||||||||||||||||||||||
Net asset value, beginning of period | $13.75 | $16.60 | $15.30 | $14.30 | $16.58 | $16.88 | ||||||||||||||||||
|
| |||||||||||||||||||||||
| Income from investment operationsa: | ||||||||||||||||||||||||
Net investment incomeb | 0.19 | 0.30 | 0.37 | 0.38 | c | 0.30 | 0.56d | |||||||||||||||||
Net realized and unrealized gains (losses) | 1.75 | (1.68 | ) | 1.82 | 1.93 | (0.98 | ) | 0.63 | ||||||||||||||||
|
| |||||||||||||||||||||||
Total from investment operations | 1.94 | (1.38 | ) | 2.19 | 2.31 | (0.68 | ) | 1.19 | ||||||||||||||||
|
| |||||||||||||||||||||||
| Less distributions from: | ||||||||||||||||||||||||
Net investment income | — | (0.32 | ) | (0.32 | ) | (0.38 | ) | (0.38 | ) | (0.70) | ||||||||||||||
Net realized gains | — | (1.15 | ) | (0.57 | ) | (0.93 | ) | (1.22 | ) | (0.79) | ||||||||||||||
|
| |||||||||||||||||||||||
Total distributions | — | (1.47 | ) | (0.89 | ) | (1.31 | ) | (1.60 | ) | (1.49) | ||||||||||||||
|
| |||||||||||||||||||||||
| Net asset value, end of period | $15.69 | $13.75 | $16.60 | $15.30 | $14.30 | $16.58 | ||||||||||||||||||
|
| |||||||||||||||||||||||
Total returne | 14.11% | (8.18)% | 14.42% | 16.20% | (3.98)% | 6.91% | ||||||||||||||||||
| Ratios to average net assetsf | ||||||||||||||||||||||||
Expenses before waiver and payments by affiliatesg | 0.75% | 0.75% | 0.72% | 0.71% | 0.74% | 0.74% | ||||||||||||||||||
Expenses net of waiver and payments by affiliatesg,h | 0.73% | 0.73% | 0.71% | 0.71% | 0.74% | i | 0.74% | |||||||||||||||||
Expenses incurred in connection with securities sold short | 0.01% | 0.01% | —% | 0.01% | 0.04% | 0.04% | ||||||||||||||||||
Net investment income | 2.53% | 1.84% | 1.85% | 2.57% | c | 1.83% | 3.23%d | |||||||||||||||||
| Supplemental data | ||||||||||||||||||||||||
Net assets, end of period (000’s) | $86,322 | $79,358 | $106,845 | $604 | $48,844 | $50,868 | ||||||||||||||||||
Portfolio turnover rate | 10.82% | 47.20% | 24.80% | 30.94% | 35.80% | 40.06% | ||||||||||||||||||
aThe amount shown for a share outstanding throughout the period may not correlate with the Statement of Operations for the period due to the timing of sales and repurchases of the Fund’s shares in relation to income earned and/or fluctuating fair value of the investments of the Fund.
bBased on average daily shares outstanding.
cNet investment income per share includes approximately $0.10 per share related to income received in the form of special dividends in connection with certain Fund holdings. Excluding this amount, the ratio of net investment income to average net assets would have been 1.90%.
dNet investment income per share includes approximately $0.24 per share related to income received in the form of a special dividend in connection with certain Fund holdings. Excluding this amount, the ratio of net investment income to average net assets would have been 1.83%.
eTotal return is not annualized for periods less than one year.
fRatios are annualized for periods less than one year.
gIncludes dividend and/or interest expense on securities sold short and security borrowing fees, if any. See below for the ratios of such expenses to average net assets for the periods presented. See Note 1(d).
hBenefit of expense reduction rounds to less than 0.01%.
iBenefit of waiver and payments by affiliates rounds to less than 0.01%.
| 16 | Semiannual Report | The accompanying notes are an integral part of these financial statements. | franklintempleton.com | ||
FRANKLIN MUTUAL SERIES FUNDS
Statement of Investments, June 30, 2019 (unaudited)
Franklin Mutual Beacon Fund
| Country | Shares/ Warrants | Value | ||||||||||||
Common Stocks and Other Equity Interests 88.8% | ||||||||||||||
| Aerospace & Defense 2.1% | ||||||||||||||
BAE Systems PLC | United Kingdom | 11,814,998 | $ | 74,332,076 | ||||||||||
|
| |||||||||||||
| Auto Components 0.0%† | ||||||||||||||
| a,b,c | International Automotive Components Group Brazil LLC | Brazil | 2,846,329 | 73,088 | ||||||||||
|
| |||||||||||||
| Banks 9.2% | ||||||||||||||
JPMorgan Chase & Co. | United States | 1,007,630 | 112,653,034 | |||||||||||
Standard Chartered PLC | United Kingdom | 12,354,785 | 112,057,685 | |||||||||||
Wells Fargo & Co. | United States | 2,274,050 | 107,608,046 | |||||||||||
|
| |||||||||||||
| 332,318,765 | ||||||||||||||
|
| |||||||||||||
| Biotechnology 1.5% | ||||||||||||||
| a | Celgene Corp. | United States | 574,700 | 53,125,268 | ||||||||||
|
| |||||||||||||
| Chemicals 2.1% | ||||||||||||||
BASF SE | Germany | 1,007,304 | 73,198,217 | |||||||||||
| a,b,d | Dow Corning Corp. (Revolver/Term Loan Claims), Contingent Distribution | United States | 4,920,704 | 2,624,974 | ||||||||||
| a,b,d | Dow Corning Corp. (Swap Agreement Claims), Contingent Distribution | United States | 7,677,844 | 159,592 | ||||||||||
|
| |||||||||||||
| 75,982,783 | ||||||||||||||
|
| |||||||||||||
| Communications Equipment 2.0% | ||||||||||||||
Cisco Systems Inc. | United States | 1,299,242 | 71,107,515 | |||||||||||
|
| |||||||||||||
| Consumer Finance 2.8% | ||||||||||||||
Capital One Financial Corp. | United States | 1,102,998 | 100,086,039 | |||||||||||
|
| |||||||||||||
| Diversified Telecommunication Services 1.1% | ||||||||||||||
Koninklijke KPN NV | Netherlands | 13,500,370 | 41,439,319 | |||||||||||
|
| |||||||||||||
| Electrical Equipment 3.6% | ||||||||||||||
| a | Sensata Technologies Holding PLC | United States | 2,626,802 | 128,713,298 | ||||||||||
|
| |||||||||||||
| Entertainment 3.8% | ||||||||||||||
The Walt Disney Co. | United States | 994,700 | 138,899,908 | |||||||||||
|
| |||||||||||||
| Equity Real Estate Investment Trusts (REITs) 1.7% | ||||||||||||||
Brixmor Property Group Inc. | United States | 3,429,800 | 61,324,824 | |||||||||||
|
| |||||||||||||
| Food Products 1.5% | ||||||||||||||
The Kraft Heinz Co. | United States | 1,744,137 | 54,138,012 | |||||||||||
|
| |||||||||||||
| Health Care Equipment & Supplies 4.3% | ||||||||||||||
Medtronic PLC | United States | 1,576,090 | 153,495,405 | |||||||||||
|
| |||||||||||||
| Hotels, Restaurants & Leisure 1.8% | ||||||||||||||
Sands China Ltd. | China | 13,934,400 | 66,620,564 | |||||||||||
|
| |||||||||||||
| Insurance 5.1% | ||||||||||||||
American International Group Inc. | United States | 1,514,000 | 80,665,920 | |||||||||||
The Hartford Financial Services Group Inc. | United States | 1,859,200 | 103,594,624 | |||||||||||
|
| |||||||||||||
| 184,260,544 | ||||||||||||||
|
| |||||||||||||
| Interactive Media & Services 2.1% | ||||||||||||||
| a | Baidu Inc., ADR | China | 633,547 | 74,353,076 | ||||||||||
|
| |||||||||||||
| IT Services 3.2% | ||||||||||||||
Cognizant Technology Solutions Corp., A | United States | 1,811,030 | 114,801,192 | |||||||||||
|
| |||||||||||||
| franklintempleton.com | Semiannual Report | 17 | ||||
FRANKLIN MUTUAL SERIES FUNDS
STATEMENT OF INVESTMENTS (UNAUDITED)
Franklin Mutual Beacon Fund(continued)
| Country | Shares/ Warrants | Value | ||||||||||||
Common Stocks and Other Equity Interests(continued) | ||||||||||||||
| Media 8.2% | ||||||||||||||
| a | Charter Communications Inc., A | United States | 322,487 | $ | 127,440,413 | |||||||||
| a | Discovery Inc., C | United States | 3,297,023 | 93,800,304 | ||||||||||
| a,b,c | iHeartMedia Inc., A | United States | �� | 416,304 | 6,042,772 | |||||||||
| a,b,c | iHeartMedia Inc., B | United States | 7,025 | 101,970 | ||||||||||
| a,b,c | iHeartMedia Inc., wts., A, 5/01/39 | United States | 418 | 6,067 | ||||||||||
| a | Liberty Global PLC, C | United Kingdom | 2,575,500 | 68,328,015 | ||||||||||
|
| |||||||||||||
| 295,719,541 | ||||||||||||||
|
| |||||||||||||
| Oil, Gas & Consumable Fuels 6.0% | ||||||||||||||
Anadarko Petroleum Corp. | United States | 762,700 | 53,816,112 | |||||||||||
Kinder Morgan Inc. | United States | 4,414,700 | 92,178,936 | |||||||||||
Royal Dutch Shell PLC, A | United Kingdom | 2,206,089 | 72,004,460 | |||||||||||
|
| |||||||||||||
| 217,999,508 | ||||||||||||||
|
| |||||||||||||
| Pharmaceuticals 10.7% | ||||||||||||||
Eli Lilly & Co. | United States | 453,112 | 50,200,278 | |||||||||||
GlaxoSmithKline PLC | United Kingdom | 5,783,258 | 115,792,572 | |||||||||||
Merck & Co. Inc. | United States | 707,577 | 59,330,331 | |||||||||||
Novartis AG, ADR | Switzerland | 1,774,190 | 162,001,289 | |||||||||||
|
| |||||||||||||
| 387,324,470 | ||||||||||||||
|
| |||||||||||||
| Software 5.4% | ||||||||||||||
| a | Check Point Software Technologies Ltd. | Israel | 661,312 | 76,454,280 | ||||||||||
| a | Red Hat Inc. | United States | 293,600 | 55,126,336 | ||||||||||
Symantec Corp. | United States | 2,955,337 | 64,308,133 | |||||||||||
|
| |||||||||||||
| 195,888,749 | ||||||||||||||
|
| |||||||||||||
| Specialty Retail 1.7% | ||||||||||||||
Dufry AG | Switzerland | 708,780 | 60,015,290 | |||||||||||
|
| |||||||||||||
| Technology Hardware, Storage & Peripherals 2.5% | ||||||||||||||
Western Digital Corp. | United States | 1,908,800 | 90,763,440 | |||||||||||
|
| |||||||||||||
| Thrifts & Mortgage Finance 1.7% | ||||||||||||||
Indiabulls Housing Finance Ltd. | India | 6,872,654 | 60,573,051 | |||||||||||
|
| |||||||||||||
| Tobacco 2.9% | ||||||||||||||
British American Tobacco PLC | United Kingdom | 2,948,136 | 102,922,153 | |||||||||||
|
| |||||||||||||
| Wireless Telecommunication Services 1.8% | ||||||||||||||
| a | T-Mobile U.S. Inc. | United States | 869,414 | 64,475,484 | ||||||||||
|
| |||||||||||||
Total Common Stocks and Other Equity Interests | 3,200,753,362 | |||||||||||||
|
| |||||||||||||
| Preferred Stocks 6.0% | ||||||||||||||
| Automobiles 2.6% | ||||||||||||||
| e | Porsche Automobil Holding SE, 3.868%, pfd | Germany | 1,451,423 | 94,283,873 | ||||||||||
|
| |||||||||||||
| Technology Hardware, Storage & Peripherals 3.4% | ||||||||||||||
| e | Samsung Electronics Co. Ltd., 3.705%, pfd | South Korea | 3,738,607 | 123,603,400 | ||||||||||
|
| |||||||||||||
Total Preferred Stocks (Cost $145,744,618) | 217,887,273 | |||||||||||||
|
| |||||||||||||
| 18 | Semiannual Report | franklintempleton.com | ||
FRANKLIN MUTUAL SERIES FUNDS
STATEMENT OF INVESTMENTS (UNAUDITED)
Franklin Mutual Beacon Fund(continued)
| Country | Principal Amount | Value | ||||||||||||
Corporate Notes and Senior Floating Rate Interests 1.8% | ||||||||||||||
Frontier Communications Corp., | ||||||||||||||
senior note, 10.50%, 9/15/22 | United States | $ | 16,691,000 | $ | 11,391,607 | |||||||||
senior note, 11.00%, 9/15/25 | United States | 23,907,000 | 14,941,875 | |||||||||||
| f,g | Veritas U.S. Inc., | |||||||||||||
Term Loan B1, 6.902%,(1-month USD LIBOR + 4.50%), 1/27/23 | United States | 14,396,149 | 13,100,496 | |||||||||||
Term Loan B1, 6.83%,(3-month USD LIBOR + 4.50%), 1/27/23 | United States | 2,857,483 | 2,600,310 | |||||||||||
| h | Veritas U.S. Inc./Veritas Bermuda Ltd., | |||||||||||||
senior note, 144A, 7.50%, 2/01/23 | United States | 2,766,000 | 2,600,040 | |||||||||||
senior note, 144A, 10.50%, 2/01/24 | United States | 22,708,000 | 19,528,880 | |||||||||||
|
| |||||||||||||
Total Corporate Notes and Senior Floating Rate Interests | 64,163,208 | |||||||||||||
|
| |||||||||||||
Corporate Notes in Reorganization (Cost $10,848) 0.0% | ||||||||||||||
| b,c,i | Broadband Ventures III LLC, secured promissory note, 5.00%, 2/01/12 | United States | 10,848 | — | ||||||||||
|
| |||||||||||||
| Shares | ||||||||||||||
| Companies in Liquidation 0.0%† | ||||||||||||||
| a,b,d | Clear Channel Communications Inc., Contingent Distribution | United States | 18,873,000 | — | ||||||||||
| a,b,d | iHeartCommunications Inc., Contingent Distribution | United States | 20,894,418 | — | ||||||||||
| a,b,d | Tribune Media, Litigation Trust, Contingent Distribution | United States | 502,429 | — | ||||||||||
| a,d | Vistra Energy Corp., Litigation Trust, Contingent Distribution | United States | 46,282,735 | 69,424 | ||||||||||
|
| |||||||||||||
Total Companies in Liquidation (Cost $1,456,992) | 69,424 | |||||||||||||
|
| |||||||||||||
Total Investments before Short Term Investments | 3,482,873,267 | |||||||||||||
|
| |||||||||||||
| Principal Amount | ||||||||||||||
| Short Term Investments 1.2% | ||||||||||||||
U.S. Government and Agency Securities 1.2% | ||||||||||||||
| j | FHLB, 7/01/19 | United States | $ | 15,000,000 | 15,000,000 | |||||||||
| j | U.S. Treasury Bill, | |||||||||||||
7/05/19 | United States | 500,000 | 499,892 | |||||||||||
k 8/15/19 - 10/24/19 | United States | 28,000,000 | 27,857,009 | |||||||||||
|
| |||||||||||||
Total U.S. Government and Agency Securities | 43,356,901 | |||||||||||||
|
| |||||||||||||
| Total Investments (Cost $2,911,457,664) 97.8% | 3,526,230,168 | |||||||||||||
| Securities Sold Short (0.5)% | (19,536,780 | ) | ||||||||||||
| Other Assets, less Liabilities 2.7% | 99,391,140 | |||||||||||||
|
| |||||||||||||
| Net Assets 100.0% | $ | 3,606,084,528 | ||||||||||||
|
| |||||||||||||
| franklintempleton.com | Semiannual Report | 19 | ||||
FRANKLIN MUTUAL SERIES FUNDS
STATEMENT OF INVESTMENTS (UNAUDITED)
Franklin Mutual Beacon Fund(continued)
| Country | Shares | Value | ||||||||||||
| l | Securities Sold Short (Proceeds $20,861,738) (0.5)% | |||||||||||||
| Common Stocks (0.5)% | ||||||||||||||
| Pharmaceuticals (0.5)% | ||||||||||||||
Bristol-Myers Squibb Co. | United States | 430,800 | $ | (19,536,780 | ) | |||||||||
|
| |||||||||||||
†Rounds to less than 0.1% of net assets.
aNon-income producing.
bFair valued using significant unobservable inputs. See Note 13 regarding fair value measurements.
cSee Note 10 regarding restricted securities.
dContingent distributions represent the right to receive additional distributions, if any, during the reorganization of the underlying company. Shares represent total underlying principal of debt securities.
eVariable rate security. The rate shown represents the yield at period end.
fThe coupon rate shown represents the rate at period end.
gSee Note 1(f) regarding senior floating rate interests.
hSecurity was purchased pursuant to Rule 144A under the Securities Act of 1933 and may be sold in transactions exempt from registration only to qualified institutional buyers or in a public offering registered under the Securities Act of 1933. These securities have been deemed liquid under guidelines approved by the Trust’s Board of Trustees. At June 30, 2019, the aggregate value of these securities was $22,128,920, representing 0.6% of net assets.
iSee Note 8 regarding credit risk and defaulted securities.
jThe security was issued on a discount basis with no stated coupon rate.
kA portion or all of the security has been segregated as collateral for securities sold short and/or open forward exchange contracts. At June 30, 2019, the aggregate value of these securities pledged amounted to $10,341,082, representing 0.3% of net assets.
lSee Note 1(d) regarding securities sold short.
At June 30, 2019, the Fund had the following futures contracts outstanding. See Note 1(c).
Futures Contracts
| Description | Type | Number of Contracts | Notional Amount* | Expiration Date | Value/ Unrealized Appreciation (Depreciation) | |||||||||||||||
| Currency Contracts | ||||||||||||||||||||
EUR/USD | Short | 855 | $ | 122,334,469 | 9/16/19 | $ | (360,965 | ) | ||||||||||||
GBP/USD | Short | 1,141 | 90,916,306 | 9/16/19 | 90,878 | |||||||||||||||
|
| |||||||||||||||||||
Total Futures Contracts | $ | (270,087 | ) | |||||||||||||||||
|
| |||||||||||||||||||
*As of period end.
| 20 | Semiannual Report | franklintempleton.com | ||
FRANKLIN MUTUAL SERIES FUNDS
STATEMENT OF INVESTMENTS (UNAUDITED)
Franklin Mutual Beacon Fund(continued)
At June 30, 2019, the Fund had the following forward exchange contracts outstanding. See Note 1(c).
Forward Exchange Contracts
| Currency | Counterpartya | Type | Quantity | Contract Amount | Settlement Date | Unrealized Appreciation | Unrealized Depreciation | |||||||||||||||||||||
OTC Forward Exchange Contracts |
| |||||||||||||||||||||||||||
Euro | BOFA | Buy | 4,516,422 | $ | 5,060,266 | 7/15/19 | $ | 81,731 | $ | — | ||||||||||||||||||
Euro | BOFA | Sell | 730,451 | 835,386 | 7/15/19 | 3,760 | — | |||||||||||||||||||||
Euro | HSBK | Buy | 2,924,969 | 3,268,488 | 7/15/19 | 61,620 | — | |||||||||||||||||||||
Euro | HSBK | Sell | 925,000 | 1,048,767 | 7/15/19 | — | (4,356 | ) | ||||||||||||||||||||
Euro | HSBK | Sell | 7,000,451 | 8,050,392 | 7/15/19 | 80,301 | — | |||||||||||||||||||||
Euro | SSBT | Sell | 925,000 | 1,048,794 | 7/15/19 | — | (4,329 | ) | ||||||||||||||||||||
Euro | UBSW | Buy | 4,145,756 | 4,645,897 | 7/15/19 | 74,091 | — | |||||||||||||||||||||
Euro | UBSW | Sell | 2,006,245 | 2,301,020 | 7/15/19 | 16,889 | — | |||||||||||||||||||||
British Pound | BOFA | Buy | 857,472 | 1,086,160 | 7/16/19 | 3,801 | — | |||||||||||||||||||||
British Pound | BOFA | Sell | 1,758,950 | 2,296,603 | 7/16/19 | 60,743 | — | |||||||||||||||||||||
British Pound | HSBK | Buy | 233,716 | 294,491 | 7/16/19 | 2,593 | — | |||||||||||||||||||||
British Pound | HSBK | Sell | 21,275,597 | 27,620,166 | 7/16/19 | 576,045 | — | |||||||||||||||||||||
British Pound | BOFA | Sell | 5,944,697 | 7,838,642 | 8/14/19 | 271,875 | — | |||||||||||||||||||||
British Pound | BONY | Sell | 18,849,415 | 24,518,660 | 8/14/19 | 525,989 | — | |||||||||||||||||||||
British Pound | HSBK | Sell | 7,501,881 | 9,885,664 | 8/14/19 | 336,819 | — | |||||||||||||||||||||
British Pound | UBSW | Sell | 958,337 | 1,242,235 | 8/14/19 | 22,406 | — | |||||||||||||||||||||
South Korean Won | HSBK | Buy | 9,907,308,550 | 8,365,092 | 8/16/19 | 209,138 | — | |||||||||||||||||||||
South Korean Won | HSBK | Sell | 49,051,417,649 | 43,726,240 | 8/16/19 | 1,274,940 | — | |||||||||||||||||||||
South Korean Won | UBSW | Sell | 36,680,818,350 | 33,044,294 | 8/16/19 | 1,299,065 | — | |||||||||||||||||||||
Euro | BOFA | Buy | 2,733,227 | 3,085,267 | 10/18/19 | 49,624 | — | |||||||||||||||||||||
Euro | BONY | Buy | 316,502 | 361,513 | 10/18/19 | 1,500 | — | |||||||||||||||||||||
Euro | HSBK | Buy | 5,518,594 | 6,268,476 | 10/18/19 | 61,107 | — | |||||||||||||||||||||
Euro | HSBK | Sell | 7,410,000 | 8,502,975 | 10/18/19 | 4,033 | — | |||||||||||||||||||||
Euro | SSBT | Sell | 11,994,511 | 13,572,389 | 10/18/19 | — | (184,784 | ) | ||||||||||||||||||||
Euro | UBSW | Buy | 4,808,574 | 5,495,147 | 10/18/19 | 20,075 | — | |||||||||||||||||||||
British Pound | SSBT | Sell | 1,200,000 | 1,538,076 | 10/24/19 | 6,417 | — | |||||||||||||||||||||
British Pound | UBSW | Sell | 850,077 | 1,121,257 | 10/24/19 | 36,233 | — | |||||||||||||||||||||
Euro | HSBK | Sell | 29,868,572 | 33,854,798 | 11/07/19 | — | (456,284 | ) | ||||||||||||||||||||
Euro | UBSW | Sell | 20,253,066 | 22,948,142 | 11/07/19 | — | (317,271 | ) | ||||||||||||||||||||
South Korean Won | HSBK | Sell | 24,776,684,588 | 21,272,174 | 11/15/19 | — | (232,876 | ) | ||||||||||||||||||||
South Korean Won | UBSW | Sell | 40,156,941,513 | 34,692,973 | 11/15/19 | — | (161,450 | ) | ||||||||||||||||||||
Euro | SSBT | Sell | 20,098,703 | 22,799,969 | 11/21/19 | — | (313,225 | ) | ||||||||||||||||||||
British Pound | BOFA | Sell | 220,001 | 281,987 | 11/22/19 | 872 | — | |||||||||||||||||||||
British Pound | HSBK | Sell | 1,685,481 | 2,158,528 | 11/22/19 | 4,843 | — | |||||||||||||||||||||
British Pound | SSBT | Sell | 42,890,060 | 54,647,298 | 11/22/19 | — | (157,047 | ) | ||||||||||||||||||||
British Pound | UBSW | Sell | 400,000 | 511,002 | 11/22/19 | — | (112 | ) | ||||||||||||||||||||
|
| |||||||||||||||||||||||||||
Total Forward Exchange Contracts |
| $ | 5,086,510 | $ | (1,831,734 | ) | ||||||||||||||||||||||
|
| |||||||||||||||||||||||||||
Net unrealized appreciation (depreciation) |
| $ | 3,254,776 | |||||||||||||||||||||||||
|
| |||||||||||||||||||||||||||
aMay be comprised of multiple contracts with the same counterparty, currency and settlement date.
See Note 11 regarding other derivative information.
See Abbreviations on page 39.
| franklintempleton.com | The accompanying notes are an integral part of these financial statements. | Semiannual Report | 21 | ||||
FRANKLIN MUTUAL SERIES FUNDS
Statement of Assets and Liabilities
June 30, 2019 (unaudited)
Franklin Mutual Beacon Fund
Assets: | ||||
Investments in securities: | ||||
Cost - Unaffiliated issuers | $2,911,457,664 | |||
|
| |||
Value - Unaffiliated issuers | $3,526,230,168 | |||
Cash | 588,154 | |||
Foreign currency, at value (cost $5,467,544) | 5,468,197 | |||
Receivables: | ||||
Investment securities sold | 58,243,938 | |||
Capital shares sold | 2,642,585 | |||
Dividends and interest | 12,002,356 | |||
European Union tax reclaims | 3,426,985 | |||
Deposits with brokers for: | ||||
Securities sold short | 19,817,174 | |||
Futures contracts | 4,292,760 | |||
Unrealized appreciation on OTC forward exchange contracts | 5,086,510 | |||
Other assets | 144,140 | |||
|
| |||
Total assets | 3,637,942,967 | |||
|
| |||
Liabilities: | ||||
Payables: | ||||
Investment securities purchased | 3,557,198 | |||
Capital shares redeemed | 3,011,726 | |||
Management fees | 1,966,364 | |||
Distribution fees | 500,708 | |||
Transfer agent fees | 530,662 | |||
Trustees’ fees and expenses | 305,171 | |||
Variation margin on futures contracts | 344,050 | |||
Securities sold short, at value (proceeds $20,861,738) | 19,536,780 | |||
Unrealized depreciation on OTC forward exchange contracts | 1,831,734 | |||
Accrued expenses and other liabilities | 274,046 | |||
|
| |||
Total liabilities | 31,858,439 | |||
|
| |||
Net assets, at value | $3,606,084,528 | |||
|
| |||
Net assets consist of: | ||||
Paid-in capital | $2,873,339,929 | |||
Total distributable earnings (loss) | 732,744,599 | |||
|
| |||
Net assets, at value | $3,606,084,528 | |||
|
| |||
| 22 | Semiannual Report | The accompanying notes are an integral part of these financial statements. | franklintempleton.com | ||
FRANKLIN MUTUAL SERIES FUNDS
FINANCIAL STATEMENTS
Statement of Assets and Liabilities(continued)
June 30, 2019 (unaudited)
Franklin Mutual Beacon Fund
| Class Z: | ||||
Net assets, at value | $ | 2,489,721,987 | ||
|
| |||
Shares outstanding | 158,692,692 | |||
|
| |||
Net asset value and maximum offering price per share | $15.69 | |||
|
| |||
| Class A: | ||||
Net assets, at value | $ | 969,005,475 | ||
|
| |||
Shares outstanding | 62,423,339 | |||
|
| |||
Net asset value per sharea | $15.52 | |||
|
| |||
Maximum offering price per share (net asset value per share ÷ 94.50%) | $16.42 | |||
|
| |||
| Class C: | ||||
Net assets, at value | $ | 59,351,239 | ||
|
| |||
Shares outstanding | 3,830,303 | |||
|
| |||
Net asset value and maximum offering price per sharea | $15.50 | |||
|
| |||
| Class R: | ||||
Net assets, at value | $ | 1,683,690 | ||
|
| |||
Shares outstanding | 109,926 | |||
|
| |||
Net asset value and maximum offering price per share | $15.32 | |||
|
| |||
| Class R6: | ||||
Net assets, at value | $ | 86,322,137 | ||
|
| |||
Shares outstanding | 5,502,280 | |||
|
| |||
Net asset value and maximum offering price per share | $15.69 | |||
|
| |||
aRedemption price is equal to net asset value less contingent deferred sales charges, if applicable.
| franklintempleton.com | The accompanying notes are an integral part of these financial statements. | Semiannual Report | 23 | ||||
FRANKLIN MUTUAL SERIES FUNDS
FINANCIAL STATEMENTS
Statement of Operations
for the six months ended June 30, 2019 (unaudited)
Franklin Mutual Beacon Fund
Investment income: | ||||
Dividends: (net of foreign taxes)* | ||||
Unaffiliated issuers | $ | 50,439,702 | ||
Interest: | ||||
Unaffiliated issuers | 6,560,693 | |||
Income from securities loaned: | ||||
Unaffiliated issuers (net of fees and rebates) | 322,938 | |||
Non-controlled affiliates (Note 3f) | 21,748 | |||
|
| |||
Total investment income | 57,345,081 | |||
|
| |||
Expenses: | ||||
Management fees (Note 3a) | 11,863,469 | |||
Distribution fees: (Note 3c) | ||||
Class A | 1,181,676 | |||
Class C | 304,519 | |||
Class R | 4,136 | |||
Transfer agent fees: (Note 3e) | ||||
Class Z | 1,105,934 | |||
Class A | 431,911 | |||
Class C | 27,819 | |||
Class R | 756 | |||
Class R6 | 18,060 | |||
Custodian fees (Note 4) | 163,646 | |||
Reports to shareholders | 95,707 | |||
Registration and filing fees | 55,413 | |||
Professional fees | 72,850 | |||
Trustees’ fees and expenses | 121,774 | |||
Dividends on securities sold short | 79,294 | |||
Other | 42,177 | |||
|
| |||
Total expenses | 15,569,141 | |||
Expense reductions (Note 4) | (11,758 | ) | ||
Expenses waived/paid by affiliates (Note 3f and 3g) | (13,306 | ) | ||
|
| |||
Net expenses | 15,544,077 | |||
|
| |||
Net investment income | 41,801,004 | |||
|
| |||
Realized and unrealized gains (losses): | ||||
Net realized gain (loss) from: | ||||
Investments: | ||||
Unaffiliated issuers | (23,792,787 | ) | ||
Foreign currency transactions | 363,817 | |||
Forward exchange contracts | 10,657,605 | |||
Futures contracts | 4,614,936 | |||
Securities sold short | 1,351,960 | |||
|
| |||
Net realized gain (loss) | (6,804,469 | ) | ||
|
| |||
Net change in unrealized appreciation (depreciation) on: | ||||
Investments: | ||||
Unaffiliated issuers | 428,342,452 | |||
Translation of other assets and liabilities denominated in foreign currencies | (117,404 | ) | ||
Forward exchange contracts | 520,628 | |||
Futures contracts | (480,563 | ) | ||
Securities sold short | (8,799,368 | ) | ||
Change in deferred taxes on unrealized appreciation | 1,170,447 | |||
|
| |||
| 24 | Semiannual Report | The accompanying notes are an integral part of these financial statements. | franklintempleton.com | ||
FRANKLIN MUTUAL SERIES FUNDS
FINANCIAL STATEMENTS
Statement of Operations(continued)
for the six months ended June 30, 2019 (unaudited)
Franklin Mutual Beacon Fund
Net change in unrealized appreciation (depreciation) | 420,636,192 | |||
|
| |||
Net realized and unrealized gain (loss) | 413,831,723 | |||
|
| |||
Net increase (decrease) in net assets resulting from operations | $ | 455,632,727 | ||
|
| |||
*Foreign taxes withheld on dividends | $2,925,248 |
| franklintempleton.com | The accompanying notes are an integral part of these financial statements. | Semiannual Report | 25 | ||||
FRANKLIN MUTUAL SERIES FUNDS
FINANCIAL STATEMENTS
Statements of Changes in Net Assets
Franklin Mutual Beacon Fund
| Six Months Ended June 30, 2019 (unaudited) | Year Ended December 31, 2018 | |||||||
| ||||||||
Increase (decrease) in net assets: | ||||||||
Operations: | ||||||||
Net investment income | $ 41,801,004 | $ 63,233,210 | ||||||
Net realized gain (loss) | (6,804,469 | ) | 325,997,036 | |||||
Net change in unrealized appreciation (depreciation) | 420,636,192 | (694,921,118 | ) | |||||
|
| |||||||
Net increase (decrease) in net assets resulting from operations | 455,632,727 | (305,690,872 | ) | |||||
|
| |||||||
Distributions to shareholders: | ||||||||
Class Z | — | (221,433,179 | ) | |||||
Class A | — | (83,941,345 | ) | |||||
Class C | — | (5,683,570 | ) | |||||
Class R | — | (157,769 | ) | |||||
Class R6 | — | (7,782,384 | ) | |||||
|
| |||||||
Total distributions to shareholders | — | (318,998,247 | ) | |||||
|
| |||||||
Capital share transactions: (Note 2) | ||||||||
Class Z | (96,234,563 | ) | 540,717 | |||||
Class A | (43,142,550 | ) | 72,748,807 | |||||
Class C | (8,259,556 | ) | (185,991,052 | ) | ||||
Class R | (191,773 | ) | 390,017 | |||||
Class R6 | (4,078,262 | ) | (12,575,413 | ) | ||||
|
| |||||||
Total capital share transactions | (151,906,704 | ) | (124,886,924 | ) | ||||
|
| |||||||
Net increase (decrease) in net assets | 303,726,023 | (749,576,043 | ) | |||||
Net assets: | ||||||||
Beginning of period | 3,302,358,505 | 4,051,934,548 | ||||||
|
| |||||||
End of period | $3,606,084,528 | $3,302,358,505 | ||||||
|
| |||||||
| 26 | Semiannual Report | The accompanying notes are an integral part of these financial statements. | franklintempleton.com | ||
FRANKLIN MUTUAL SERIES FUNDS
Notes to Financial Statements (unaudited)
Franklin Mutual Beacon Fund
1. Organization and Significant Accounting Policies
Franklin Mutual Series Funds (Trust) is registered under the Investment Company Act of 1940 (1940 Act) as anopen-end management investment company, consisting of seven separate funds and applies the specialized accounting and reporting guidance in U.S. Generally Accepted Accounting Principles (U.S. GAAP). Franklin Mutual Beacon Fund (Fund) is included in this report. The Fund offers five classes of shares: Class Z, Class A, Class C, Class R and Class R6. Class C shares automatically convert to Class A shares after they have been held for 10 years. Each class of shares may differ by its initial sales load, contingent deferred sales charges, voting rights on matters affecting a single class, its exchange privilege and fees due to differing arrangements for distribution and transfer agent fees.
The following summarizes the Fund’s significant accounting policies.
a. Financial Instrument Valuation
The Fund’s investments in financial instruments are carried at fair value daily. Fair value is the price that would be received to sell an asset or paid to transfer a liability in an orderly transaction between market participants on the measurement date. The Fund calculates the net asset value (NAV) per share each business day as of 4 p.m. Eastern time or the regularly scheduled close of the New York Stock Exchange (NYSE), whichever is earlier. Under compliance policies and procedures approved by the Trust’s Board of Trustees (the Board), the Fund’s administrator has responsibility for oversight of valuation, including leading the cross-functional Valuation Committee (VC). The Fund may utilize independent pricing services, quotations from securities and financial instrument dealers, and other market sources to determine fair value.
Equity securities and derivative financial instruments listed on an exchange or on the NASDAQ National Market System are valued at the last quoted sale price or the official closing price of the day, respectively. Foreign equity securities are valued as of the close of trading on the foreign stock exchange on which the security is primarily traded, or as of 4 p.m. Eastern time. The value is then converted into its U.S. dollar equivalent at the foreign exchange rate in effect at 4 p.m. Eastern time on the day that the value of the security is determined.Over-the-counter (OTC) securities are valued within the range of the most recent quoted bid and ask prices. Securities that trade in multiple markets or on multiple
exchanges are valued according to the broadest and most representative market. Certain equity securities are valued based upon fundamental characteristics or relationships to similar securities.
Debt securities generally trade in the OTC market rather than on a securities exchange. The Fund’s pricing services use multiple valuation techniques to determine fair value. In instances where sufficient market activity exists, the pricing services may utilize a market-based approach through which quotes from market makers are used to determine fair value. In instances where sufficient market activity may not exist or is limited, the pricing services also utilize proprietary valuation models which may consider market characteristics such as benchmark yield curves, credit spreads, estimated default rates, anticipated market interest rate volatility, coupon rates, anticipated timing of principal repayments, underlying collateral, and other unique security features in order to estimate the relevant cash flows, which are then discounted to calculate the fair value.
Investments inopen-end mutual funds are valued at the closing NAV.
Certain derivative financial instruments trade in the OTC market. The Fund’s pricing services use various techniques including industry standard option pricing models and proprietary discounted cash flow models to determine the fair value of those instruments. The Fund’s net benefit or obligation under the derivative contract, as measured by the fair value of the contract, is included in net assets.
The Fund has procedures to determine the fair value of financial instruments for which market prices are not reliable or readily available. Under these procedures, the Fund primarily employs a market-based approach which may use related or comparable assets or liabilities, recent transactions, market multiples, book values, and other relevant information for the investment to determine the fair value of the investment. An income-based valuation approach may also be used in which the anticipated future cash flows of the investment are discounted to calculate fair value. Discounts may also be applied due to the nature or duration of any restrictions on the disposition of the investments. Due to the inherent uncertainty of valuations of such investments, the fair values may differ significantly from the values that would have been used had an active market existed.
franklintempleton.com |
Semiannual Report |
|
27 |
| ||
FRANKLIN MUTUAL SERIES FUNDS
NOTES TO FINANCIAL STATEMENTS (UNAUDITED)
Franklin Mutual Beacon Fund(continued)
1. Organization and Significant Accounting Policies(continued)
a. Financial Instrument Valuation(continued)
Trading in securities on foreign securities stock exchanges and OTC markets may be completed before 4 p.m. Eastern time. In addition, trading in certain foreign markets may not take place on every Fund’s business day. Occasionally, events occur between the time at which trading in a foreign security is completed and 4 p.m. Eastern time that might call into question the reliability of the value of a portfolio security held by the Fund. As a result, differences may arise between the value of the Fund’s portfolio securities as determined at the foreign market close and the latest indications of value at 4 p.m. Eastern time. In order to minimize the potential for these differences, the VC monitors price movements following the close of trading in foreign stock markets through a series of country specific market proxies (such as baskets of American Depositary Receipts, futures contracts and exchange traded funds). These price movements are measured against established trigger thresholds for each specific market proxy to assist in determining if an event has occurred that may call into question the reliability of the values of the foreign securities held by the Fund. If such an event occurs, the securities may be valued using fair value procedures, which may include the use of independent pricing services.
When the last day of the reporting period is anon-business day, certain foreign markets may be open on those days that the Fund’s NAV is not calculated, which could result in differences between the value of the Fund’s portfolio securities on the last business day and the last calendar day of the reporting period. Any significant security valuation changes due to an open foreign market are adjusted and reflected by the Fund for financial reporting purposes.
b. Foreign Currency Translation
Portfolio securities and other assets and liabilities denominated in foreign currencies are translated into U.S. dollars based on the exchange rate of such currencies against U.S. dollars on the date of valuation. The Fund may enter into foreign currency exchange contracts to facilitate transactions denominated in a foreign currency. Purchases and sales of securities, income and expense items denominated in foreign currencies are translated into U.S. dollars at the exchange rate in effect on the transaction date. Portfolio securities and assets and liabilities denominated in
foreign currencies contain risks that those currencies will decline in value relative to the U.S. dollar. Occasionally, events may impact the availability or reliability of foreign exchange rates used to convert the U.S. dollar equivalent value. If such an event occurs, the foreign exchange rate will be valued at fair value using procedures established and approved by the Board.
The Fund does not separately report the effect of changes in foreign exchange rates from changes in market prices on securities held. Such changes are included in net realized and unrealized gain or loss from investments in the Statement of Operations.
Realized foreign exchange gains or losses arise from sales of foreign currencies, currency gains or losses realized between the trade and settlement dates on securities transactions and the difference between the recorded amounts of dividends, interest, and foreign withholding taxes and the U.S. dollar equivalent of the amounts actually received or paid. Net unrealized foreign exchange gains and losses arise from changes in foreign exchange rates on foreign denominated assets and liabilities other than investments in securities held at the end of the reporting period.
c. Derivative Financial Instruments
The Fund invested in derivative financial instruments in order to manage risk or gain exposure to various other investments or markets. Derivatives are financial contracts based on an underlying or notional amount, require no initial investment or an initial net investment that is smaller than would normally be required to have a similar response to changes in market factors, and require or permit net settlement. Derivatives contain various risks including the potential inability of the counterparty to fulfill their obligations under the terms of the contract, the potential for an illiquid secondary market, and/or the potential for market movements which expose the Fund to gains or losses in excess of the amounts shown in the Statement of Assets and Liabilities. Realized gain and loss and unrealized appreciation and depreciation on these contracts for the period are included in the Statement of Operations.
Derivative counterparty credit risk is managed through a formal evaluation of the creditworthiness of all potential counterparties. The Fund attempts to reduce its exposure to counterparty credit risk on OTC derivatives, whenever possible, by entering into International Swaps and Derivatives Association (ISDA) master agreements with certain
28 |
Semiannual Report |
franklintempleton.com | ||
FRANKLIN MUTUAL SERIES FUNDS
NOTES TO FINANCIAL STATEMENTS (UNAUDITED)
Franklin Mutual Beacon Fund(continued)
counterparties. These agreements contain various provisions, including but not limited to collateral requirements, events of default, or early termination. Termination events applicable to the counterparty include certain deteriorations in the credit quality of the counterparty. Termination events applicable to the Fund include failure of the Fund to maintain certain net asset levels and/or limit the decline in net assets over various periods of time. In the event of default or early termination, the ISDA master agreement gives thenon-defaulting party the right to net andclose-out all transactions traded, whether or not arising under the ISDA agreement, to one net amount payable by one counterparty to the other. However, absent an event of default or early termination, OTC derivative assets and liabilities are presented gross and not offset in the Statement of Assets and Liabilities. Early termination by the counterparty may result in an immediate payment by the Fund of any net liability owed to that counterparty under the ISDA agreement. At June 30, 2019, the Fund had OTC derivatives in a net liability position of $652,968 and the aggregate value of collateral pledged for such contracts was $530,410.
Collateral requirements differ by type of derivative. Collateral or initial margin requirements are set by the broker or exchange clearing house for exchange traded and centrally cleared derivatives. Initial margin deposited is held at the exchange and can be in the form of cash and/or securities. For OTC derivatives traded under an ISDA master agreement, posting of collateral is required by either the Fund or the applicable counterparty if the total net exposure of all OTC derivatives with the applicable counterparty exceeds the minimum transfer amount, which typically ranges from $100,000 to $250,000, and can vary depending on the counterparty and the type of the agreement. Generally, collateral is determined at the close of Fund business each day and any additional collateral required due to changes in derivative values may be delivered by the Fund or the counterparty the next business day, or within a few business days. Collateral pledged and/or received by the Fund for OTC derivatives, if any, is held in segregated accounts with the Fund’s custodian/counterparty broker and can be in the form of cash and/or securities. Unrestricted cash may be invested according to the Fund’s investment objectives. To the extent that the amounts due to the Fund from its counterparties are not subject to collateralization or are not fully collateralized, the Fund bears the risk of loss from counterpartynon-performance.
At June 30, 2019, the Fund received $3,516,778 in U.K. Treasury Bonds and U.S. Treasury Bills, Bonds and Notes as collateral for derivatives.
The Fund entered into exchange traded futures contracts primarily to manage exposure to certain foreign currencies. A futures contract is an agreement between the Fund and a counterparty to buy or sell an asset at a specified price on a future date. Required initial margins are pledged by the Fund, and the daily change in fair value is accounted for as a variation margin payable or receivable in the Statement of Assets and Liabilities.
The Fund entered into OTC forward exchange contracts primarily to manage exposure to certain foreign currencies. A forward exchange contract is an agreement between the Fund and a counterparty to buy or sell a foreign currency at a specific exchange rate on a future date.
See Note 11 regarding other derivative information.
d. Securities Sold Short
The Fund is engaged in selling securities short, which obligates the Fund to replace a borrowed security with the same security at current fair value. The Fund incurs a loss if the price of the security increases between the date of the short sale and the date on which the Fund replaces the borrowed security. The Fund realizes a gain if the price of the security declines between those dates. Gains are limited to the price at which the Fund sold the security short, while losses are potentially unlimited in size.
The Fund is required to establish a margin account with the broker lending the security sold short. While the short sale is outstanding, the broker retains the proceeds of the short sale to the extent necessary to meet margin requirements until the short position is closed out. A deposit must also be maintained with the Fund’s custodian/counterparty broker consisting of cash and/or securities having a value equal to a specified percentage of the value of the securities sold short. The Fund is obligated to pay fees for borrowing the securities sold short and is required to pay the counterparty any dividends and/or interest due on securities sold short. Such dividends and/or interest and any security borrowing fees are recorded as an expense to the Fund.
franklintempleton.com |
Semiannual Report |
|
29 |
| ||
FRANKLIN MUTUAL SERIES FUNDS
NOTES TO FINANCIAL STATEMENTS (UNAUDITED)
Franklin Mutual Beacon Fund(continued)
1. Organization and Significant Accounting
Policies (continued)
e. Securities Lending
The Fund participates in an agency based securities lending program to earn additional income. The Fund receives cash collateral against the loaned securities in an amount equal to at least 102% of the fair value of the loaned securities. Collateral is maintained over the life of the loan in an amount not less than 100% of the fair value of loaned securities, as determined at the close of Fund business each day; any additional collateral required due to changes in security values is delivered to the Fund on the next business day. The collateral is deposited into a joint cash account with other funds and is used to invest in a money market fund managed by Franklin Advisers, Inc., an affiliate of the Fund, and/or a joint repurchase agreement. The Fund may receive income from the investment of cash collateral, in addition to lending fees and rebates paid by the borrower. Income from securities loaned, net of fees paid to the securities lending agent and/or third-party vendor, is reported separately in the Statement of Operations. The Fund bears the market risk with respect to the collateral investment, securities loaned, and the risk that the agent may default on its obligations to the Fund. If the borrower defaults on its obligation to return the securities loaned, the Fund has the right to repurchase the securities in the open market using the collateral received. The securities lending agent has agreed to indemnify the Fund in the event of default by a third party borrower. At June 30, 2019, the Fund had no securities on loan.
f. Senior Floating Rate Interests
The Fund invests in senior secured corporate loans that pay interest at rates which are periodically reset by reference to a base lending rate plus a spread. These base lending rates are generally the prime rate offered by a designated U.S. bank or the London InterBank Offered Rate (LIBOR). Senior secured corporate loans often require prepayment of principal from excess cash flows or at the discretion of the borrower. As a result, actual maturity may be substantially less than the stated maturity. Senior secured corporate loans in which the Fund invests are generally readily marketable, but may be subject to certain restrictions on resale.
g. Income and Deferred Taxes
It is the Fund’s policy to qualify as a regulated investment company under the Internal Revenue Code. The Fund intends to distribute to shareholders substantially all of its taxable income and net realized gains to relieve it from federal income and excise taxes. As a result, no provision for U.S. federal income taxes is required.
The Fund may be subject to foreign taxation related to income received, capital gains on the sale of securities and certain foreign currency transactions in the foreign jurisdictions in which it invests. Foreign taxes, if any, are recorded based on the tax regulations and rates that exist in the foreign markets in which the Fund invests. When a capital gain tax is determined to apply, the Fund records an estimated deferred tax liability in an amount that would be payable if the securities were disposed of on the valuation date.
As a result of several court cases, in certain countries across the European Union, the Fund filed additional tax reclaims for previously withheld taxes on dividends earned in those countries (EU reclaims). These additional filings are subject to various administrative proceedings by the local jurisdictions’ tax authorities within the European Union, as well as a number of related judicial proceedings. Income recognized, if any, for EU reclaims is reflected as other income in the Statement of Operations and any related receivable, if any, is reflected as European Union tax reclaims in the Statement of Assets and Liabilities. When uncertainty exists as to the ultimate resolution of these proceedings, the likelihood of receipt of these EU reclaims, and the potential timing of payment, no amounts are reflected in the financial statements. For U.S. income tax purposes, EU reclaims received by the Fund, if any, reduce the amounts of foreign taxes Fund shareholders can use as tax credits in their individual income tax returns.
The Fund may recognize an income tax liability related to its uncertain tax positions under U.S. GAAP when the uncertain tax position has a less than 50% probability that it will be sustained upon examination by the tax authorities based on its technical merits. As of June 30, 2019, the Fund has determined that no tax liability is required in its financial statements related to uncertain tax positions for any open tax years (or expected to be taken in future tax years). Open tax years are those that remain subject to examination and are based on the statute of limitations in each jurisdiction in which the Fund invests.
| 30 | Semiannual Report | franklintempleton.com | ||
FRANKLIN MUTUAL SERIES FUNDS
NOTES TO FINANCIAL STATEMENTS (UNAUDITED)
Franklin Mutual Beacon Fund(continued)
h. Security Transactions, Investment Income, Expenses and Distributions
Security transactions are accounted for on trade date. Realized gains and losses on security transactions are determined on a specific identification basis. Interest income and estimated expenses are accrued daily. Amortization of premium and accretion of discount on debt securities are included in interest income. Dividend income and dividends declared on securities sold short are recorded on theex-dividend date except for certain dividends from securities where the dividend rate is not available. In such cases, the dividend is recorded as soon as the information is received by the Fund. Distributions to shareholders are recorded on theex-dividend date. Distributable earnings are determined according to income tax regulations (tax basis) and may differ from earnings recorded in accordance with U.S. GAAP. These differences may be permanent or temporary. Permanent differences are reclassified among capital accounts to reflect their tax character. These reclassifications have no impact on net assets or the results of operations. Temporary differences are not reclassified, as they may reverse in subsequent periods.
Common expenses incurred by the Trust are allocated among the Funds based on the ratio of net assets of each Fund to the combined net assets of the Trust or based on the ratio of number of shareholders of each Fund to the combined number of shareholders of the Trust. Fund specific expenses are charged directly to the Fund that incurred the expense.
Realized and unrealized gains and losses and net investment income, excluding class specific expenses, are allocated daily to each class of shares based upon the relative proportion of net assets of each class. Differences in per share distributions by class are generally due to differences in class specific expenses.
i. Accounting Estimates
The preparation of financial statements in accordance with U.S. GAAP requires management to make estimates and assumptions that affect the reported amounts of assets and liabilities at the date of the financial statements and the amounts of income and expenses during the reporting period. Actual results could differ from those estimates.
j. Guarantees and Indemnifications
Under the Trust’s organizational documents, its officers and trustees are indemnified by the Trust against certain liabilities arising out of the performance of their duties to the Trust. Additionally, in the normal course of business, the Trust, on behalf of the Fund, enters into contracts with service providers that contain general indemnification clauses. The Trust’s maximum exposure under these arrangements is unknown as this would involve future claims that may be made against the Trust that have not yet occurred. Currently, the Trust expects the risk of loss to be remote.
2. Shares of Beneficial Interest
At June 30, 2019, there were an unlimited number of shares authorized (without par value). Transactions in the Fund’s shares were as follows:
| Six Months Ended June 30, 2019 | Year Ended December 31, 2018 | |||||||||||||||
| Shares | Amount | Shares | Amount | |||||||||||||
| Class Z Shares: | ||||||||||||||||
| Shares sold | 3,211,692 | $ | 48,706,443 | 8,257,116 | $ | 133,575,147 | ||||||||||
| Shares issued in reinvestment of distributions | — | — | 15,183,241 | 206,770,472 | ||||||||||||
| Shares redeemed | (9,620,679 | ) | (144,941,006 | ) | (20,924,183 | ) | (339,804,902) | |||||||||
|
| |||||||||||||||
| Net increase (decrease) | (6,408,987 | ) | $ | (96,234,563 | ) | 2,516,174 | $ | 540,717 | ||||||||
|
| |||||||||||||||
| franklintempleton.com | Semiannual Report | 31 | ||||
FRANKLIN MUTUAL SERIES FUNDS
NOTES TO FINANCIAL STATEMENTS (UNAUDITED)
Franklin Mutual Beacon Fund(continued)
2. Shares of Beneficial Interest(continued)
Six Months Ended June 30, 2019 | Year Ended December 31, 2018 | |||||||||||||||
|
| |||||||||||||||
| Shares | Amount | Shares | Amount | |||||||||||||
| ||||||||||||||||
| Class A Shares: | ||||||||||||||||
| Shares solda | 2,567,807 | $ | 38,530,135 | 13,762,741 | $ | 220,038,461 | ||||||||||
| Shares issued in reinvestment of distributions | — | — | 6,066,419 | 81,741,950 | ||||||||||||
| Shares redeemed | (5,473,054 | ) | (81,672,685 | ) | (14,199,056 | ) | (229,031,604) | |||||||||
|
| |||||||||||||||
| Net increase (decrease) | (2,905,247 | ) | $ | (43,142,550 | ) | 5,630,104 | $ | 72,748,807 | ||||||||
|
| |||||||||||||||
| Class C Shares: | ||||||||||||||||
| Shares sold | 188,423 | $ | 2,811,574 | 777,745 | $ | 12,227,859 | ||||||||||
| Shares issued in reinvestment of distributions | — | — | 398,415 | 5,563,069 | ||||||||||||
| Shares redeemeda | (739,831 | ) | (11,071,130 | ) | (12,713,218 | ) | (203,781,980) | |||||||||
|
| |||||||||||||||
| Net increase (decrease) | (551,408 | ) | $ | (8,259,556 | ) | (11,537,058 | ) | $ | (185,991,052) | |||||||
|
| |||||||||||||||
| Class R Shares: | ||||||||||||||||
| Shares sold | 7,771 | $ | 111,486 | 27,604 | $ | 454,716 | ||||||||||
| Shares issued in reinvestment of distributions | — | — | 11,829 | 157,768 | ||||||||||||
| Shares redeemed | (21,255 | ) | (303,259 | ) | (14,360 | ) | (222,467) | |||||||||
|
| |||||||||||||||
| Net increase (decrease) | (13,484 | ) | $ | (191,773 | ) | 25,073 | $ | 390,017 | ||||||||
|
| |||||||||||||||
| Class R6 Shares: | ||||||||||||||||
| Shares sold | 658,753 | $ | 9,954,269 | 1,125,287 | $ | 18,530,681 | ||||||||||
| Shares issued in reinvestment of distributions | — | — | 570,780 | 7,773,465 | ||||||||||||
| Shares redeemed | (927,439 | ) | (14,032,531 | ) | (2,360,255 | ) | (38,879,559) | |||||||||
|
| |||||||||||||||
| Net increase (decrease) | (268,686 | ) | $ | (4,078,262 | ) | (664,188 | ) | $ | (12,575,413) | |||||||
|
| |||||||||||||||
aMay include a portion of Class C shares that were automatically converted to Class A.
3. Transactions with Affiliates
Franklin Resources, Inc. is the holding company for various subsidiaries that together are referred to as Franklin Templeton. Certain officers and trustees of the Fund are also officers and/or directors of the following subsidiaries:
| Subsidiary | Affiliation | |
Franklin Mutual Advisers, LLC (Franklin Mutual) | Investment manager | |
Franklin Templeton Services, LLC (FT Services) | Administrative manager | |
Franklin Templeton Distributors, Inc. (Distributors) | Principal underwriter | |
Franklin Templeton Investor Services, LLC (Investor Services) | Transfer agent | |
| 32 | Semiannual Report | franklintempleton.com | ||
FRANKLIN MUTUAL SERIES FUNDS
NOTES TO FINANCIAL STATEMENTS (UNAUDITED)
Franklin Mutual Beacon Fund(continued)
a. Management Fees
The Fund pays an investment management fee to Franklin Mutual based on the average daily net assets of the Fund as follows:
| Annualized Fee Rate | Net Assets | |
0.675% | Up to and including $5 billion | |
0.645% | Over $5 billion, up to and including $7 billion | |
0.625% | Over $7 billion, up to and including $10 billion | |
0.615% | In excess of $10 billion | |
b. Administrative Fees
Under an agreement with Franklin Mutual, FT Services provides administrative services to the Fund. The fee is paid by Franklin Mutual based on the Fund’s average daily net assets, and is not an additional expense of the Fund.
c. Distribution Fees
The Board has adopted distribution plans for each share class, with the exception of Class Z and Class R6 shares, pursuant to Rule12b-1 under the 1940 Act. Under the Fund’s Class A reimbursement distribution plan, the Fund reimburses Distributors for costs incurred in connection with the servicing, sale and distribution of the Fund’s shares up to the maximum annual plan rate. Under the Class A reimbursement distribution plan, costs exceeding the maximum for the current plan year cannot be reimbursed in subsequent periods. In addition, under the Fund’s Class C and R compensation distribution plans, the Fund pays Distributors for costs incurred in connection with the servicing, sale and distribution of the Fund’s shares up to the maximum annual plan rate for each class. The plan year, for purposes of monitoring compliance with the maximum annual plan rates, is February 1 through January 31.
The maximum annual plan rates, based on the average daily net assets, for each class, are as follows:
Class A | 0.35% | |||
Class C | 1.00% | |||
Class R | 0.50% |
The Board has set the current rate at 0.25% per year for Class A shares until further notice and approval by the Board.
d. Sales Charges/Underwriting Agreements
Front-end sales charges and contingent deferred sales charges (CDSC) do not represent expenses of the Fund. These charges are deducted from the proceeds of sales of Fund shares prior to investment or from redemption proceeds prior to remittance, as applicable. Distributors has advised the Fund of the following commission transactions related to the sales and redemptions of the Fund’s shares for the period:
Sales charges retained net of commissions paid to unaffiliated brokers/dealers | $ | 30,197 | ||
CDSC retained | $ | 5,838 |
| franklintempleton.com | Semiannual Report | 33 | ||||
FRANKLIN MUTUAL SERIES FUNDS
NOTES TO FINANCIAL STATEMENTS (UNAUDITED)
Franklin Mutual Beacon Fund(continued)
3. Transactions with Affiliates(continued)
e. Transfer Agent Fees
Each class of shares pays transfer agent fees to Investor Services for its performance of shareholder servicing obligations. The fees are based on an annualized asset based fee of 0.02% plus a transaction based fee. In addition, each class reimburses Investor Services for out of pocket expenses incurred and, except for Class R6, reimburses shareholder servicing fees paid to third parties. These fees are allocated daily based upon their relative proportion of such classes’ aggregate net assets. Class R6 pays Investor Services transfer agent fees specific to that class.
For the period ended June 30, 2019, the Fund paid transfer agent fees of $1,584,480, of which $681,213 was retained by Investor Services.
f. Investments in Affiliated Management Investment Companies
The Fund invests in one or more affiliated management investment companies for purposes other than exercising a controlling influence over the management or policies. Management fees paid by the Fund are waived on assets invested in the affiliated management investment companies, as noted in the Statement of Operations, in an amount not to exceed the management and administrative fees paid directly or indirectly by each affiliate. During the period ended June 30, 2019, the Fund held investments in affiliated management investment companies as follows:
| Value at Beginning of Period | Purchases | Sales | Realized Gain (Loss) | Net Change in Unrealized Appreciation (Depreciation) | Value at End of Period | Number of Shares Held at End of Period | Income from securities loaned | |||||||||||||||||||||||||
| Non-Controlled Affiliates | ||||||||||||||||||||||||||||||||
Institutional Fiduciary Trust Money Market Portfolio, 2.05% | $ — | $51,845,000 | $(51,845,000) | $ — | $ — | $ — | — | $21,748 | ||||||||||||||||||||||||
|
|
|
| |||||||||||||||||||||||||||||
g. Waiver and Expense Reimbursements
Investor Services has contractually agreed in advance to waive or limit its fees so that the Class R6 transfer agent fees do not exceed 0.02% based on the average net assets of the class until April 30, 2020.
h. Interfund Transactions
The Fund engaged in purchases and sales of investments with funds or other accounts that have common investment managers (or affiliated investment managers), directors, trustees or officers. During the period ended June 30, 2019, these purchase and sale transactions aggregated $0 and $5,196,414, respectively.
4. Expense Offset Arrangement
The Fund has entered into an arrangement with its custodian whereby credits realized as a result of uninvested cash balances are used to reduce a portion of the Fund’s custodian expenses. During the period ended June 30, 2019, the custodian fees were reduced as noted in the Statement of Operations.
5. Independent Trustees’ Retirement Plan
On January 1, 1993, the Trust adopted an Independent Trustees’ Retirement Plan (Plan). The Plan is an unfunded defined benefit plan that provides benefit payments to Trustees whose length of service and retirement age meets the eligibility requirements of the Plan. Benefits under the Plan are based on years of service and fees paid to each trustee at the time of retirement. Effective in December 1996, the Plan was closed to new participants.
| 34 | Semiannual Report | franklintempleton.com | ||
FRANKLIN MUTUAL SERIES FUNDS
NOTES TO FINANCIAL STATEMENTS (UNAUDITED)
Franklin Mutual Beacon Fund(continued)
During the period ended June 30, 2019, the Fund’s projected benefit obligation and benefit payments under the Plan were as follows:
aProjected benefit obligation at June 30, 2019 | $ | 305,171 | ||
bIncrease in projected benefit obligation | $ | 30,187 | ||
Benefit payments made to retired trustees | $ | (2,199 | ) | |
aThe projected benefit obligation is included in trustees’ fees and expenses in the Statement of Assets and Liabilities.
bThe increase in projected benefit obligation is included in trustees’ fees and expenses in the Statement of Operations.
6. Income Taxes
At June 30, 2019, the cost of investments and net unrealized appreciation (depreciation) for income tax purposes were as follows:
Cost of investments | $ | 2,906,254,957 | ||
|
| |||
Unrealized appreciation | $ | 732,765,171 | ||
Unrealized depreciation | (129,337,121) | |||
|
| |||
Net unrealized appreciation (depreciation) | $ | 603,428,050 | ||
|
| |||
Differences between income and/or capital gains as determined on a book basis and a tax basis are primarily due to differing treatments of foreign currency transactions and passive foreign investment company shares.
7. Investment Transactions
Purchases and sales of investments (excluding short term securities and securities sold short) for the period ended June 30, 2019, aggregated $368,164,766 and $473,509,198, respectively.
8. Credit Risk and Defaulted Securities
The Fund may purchase thepre-default or defaulted debt of distressed companies. Distressed companies are financially troubled and could be or are already involved in financial restructuring or bankruptcy. Risks associated with purchasing these securities include the possibility that the bankruptcy or other restructuring process takes longer than expected, or that distributions in restructuring are less than anticipated, either or both of which may result in unfavorable consequences to the Fund. If it becomes probable that the income on debt securities, including those of distressed companies, will not be collected, the Fund discontinues accruing income and recognizes an adjustment for uncollectible interest.
9. Concentration of Risk
Investing in foreign securities may include certain risks and considerations not typically associated with investing in U.S. securities, such as fluctuating currency values and changing local and regional economic, political and social conditions, which may result in greater market volatility. Current political and financial uncertainty surrounding the European Union may increase market volatility and the economic risk of investing in securities in Europe. In addition, certain foreign securities may not be as liquid as U.S. securities.
| franklintempleton.com | Semiannual Report | 35 | ||||
FRANKLIN MUTUAL SERIES FUNDS
NOTES TO FINANCIAL STATEMENTS (UNAUDITED)
Franklin Mutual Beacon Fund(continued)
10. Restricted Securities
The Fund invests in securities that are restricted under the Securities Act of 1933 (1933 Act). Restricted securities are often purchased in private placement transactions, and cannot be sold without prior registration unless the sale is pursuant to an exemption under the 1933 Act. Disposal of these securities may require greater effort and expense, and prompt sale at an acceptable price may be difficult. The Fund may have registration rights for restricted securities. The issuer generally incurs all registration costs.
At June 30, 2019, investments in restricted securities, excluding securities exempt from registration under the 1933 Act deemed to be liquid, were as follows:
| Principal Amount/ Shares/ Warrants | Issuer | Acquisition Date | Cost | Value | ||||||||||||
| 10,848 | Broadband Ventures III LLC, secured promissory note, 5.00%, 2/01/12 | 7/01/10 - 11/30/12 | $ | 10,848 | $ | — | ||||||||||
| 416,304 | iHeartMedia Inc., A | 1/03/11 - 12/19/13 | 9,731,079 | 6,042,772 | ||||||||||||
| 7,025 | iHeartMedia Inc., B | 1/03/11 - 12/19/13 | 163,678 | 101,970 | ||||||||||||
| 418 | iHeartMedia Inc., wts., A, 5/01/39 | 1/03/11 - 12/19/13 | 9,739 | 6,067 | ||||||||||||
| 2,846,329 | International Automotive Components Group Brazil LLC | 4/13/06 - 12/26/08 | 1,890,264 | 73,088 | ||||||||||||
|
| |||||||||||||||
Total Restricted Securities(Value is 0.2% of Net Assets) | $ | 11,805,608 | $ | 6,223,897 | ||||||||||||
|
| |||||||||||||||
11. Other Derivative Information
At June 30, 2019, investments in derivative contracts are reflected in the Statement of Assets and Liabilities as follows:
Asset Derivatives | Liability Derivatives | |||||||||||
| Derivative Contracts Not Accounted for as Hedging Instruments | Statement of Assets and Liabilities Location | Fair Value | Statement of Assets and Liabilities Location | Fair Value | ||||||||
| ||||||||||||
| Foreign exchange contracts | Variation margin on futures contracts | | $ 90,878 | a | Variation margin on futures contracts | | $ 360,965 | a | ||||
Unrealized appreciation on OTC forward exchange contracts | 5,086,510 | Unrealized depreciation on OTC forward exchange contracts | 1,831,734 | |||||||||
|
|
|
| |||||||||
| Totals | $5,177,388 | $2,192,699 | ||||||||||
|
|
|
| |||||||||
aThis amount reflects the cumulative appreciation (depreciation) of futures contracts as reported in the Statement of Investments. Only the variation margin receivable/ payable at period end is separately reported within the Statement of Assets and Liabilities. Prior variation margin movements were recorded to cash upon receipt or payment.
| 36 | Semiannual Report | franklintempleton.com | ||
FRANKLIN MUTUAL SERIES FUNDS
NOTES TO FINANCIAL STATEMENTS (UNAUDITED)
Franklin Mutual Beacon Fund(continued)
For the period ended June 30, 2019, the effect of derivative contracts in the Statement of Operations was as follows:
| Derivative Contracts Not Accounted for as Hedging Instruments | Statement of Operations Location | Net Realized Gain (Loss) for the Period | Statement of Operations Location | Net Change in Unrealized Appreciation (Depreciation) for the Period | ||||||||
Net realized gain (loss) from: |
Net change in unrealized appreciation (depreciation) on: | |||||||||||
Foreign exchange contracts | Forward exchange contracts | $10,657,605 | Forward exchange contracts | $ 520,628 | ||||||||
Futures contracts | 4,614,936 | Futures contracts | (480,563) | |||||||||
|
|
|
| |||||||||
Totals | $15,272,541 | $ 40,065 | ||||||||||
|
|
|
| |||||||||
For the period ended June 30, 2019, the average month end notional amount of futures contracts represented $223,616,973. The average month end contract value of forward exchange contracts was $434,854,840.
See Note 1(c) regarding derivative financial instruments.
12. Credit Facility
The Fund, together with other U.S. registered and foreign investment funds (collectively, Borrowers), managed by Franklin Templeton, are borrowers in a joint syndicated senior unsecured credit facility totaling $2 billion (Global Credit Facility) which matures on February 7, 2020. This Global Credit Facility provides a source of funds to the Borrowers for temporary and emergency purposes, including the ability to meet future unanticipated or unusually large redemption requests.
Under the terms of the Global Credit Facility, the Fund shall, in addition to interest charged on any borrowings made by the Fund and other costs incurred by the Fund, pay its share of fees and expenses incurred in connection with the implementation and maintenance of the Global Credit Facility, based upon its relative share of the aggregate net assets of all of the Borrowers, including an annual commitment fee of 0.15% based upon the unused portion of the Global Credit Facility. These fees are reflected in other expenses in the Statement of Operations. During the period ended June 30, 2019, the Fund did not use the Global Credit Facility.
13. Fair Value Measurements
The Fund follows a fair value hierarchy that distinguishes between market data obtained from independent sources (observable inputs) and the Fund’s own market assumptions (unobservable inputs). These inputs are used in determining the value of the Fund’s financial instruments and are summarized in the following fair value hierarchy:
| • | Level 1 – quoted prices in active markets for identical financial instruments |
| • | Level 2 – other significant observable inputs (including quoted prices for similar financial instruments, interest rates, prepayment speed, credit risk, etc.) |
| • | Level 3 – significant unobservable inputs (including the Fund’s own assumptions in determining the fair value of financial instruments) |
The input levels are not necessarily an indication of the risk or liquidity associated with financial instruments at that level.
| franklintempleton.com | Semiannual Report | 37 | ||||
FRANKLIN MUTUAL SERIES FUNDS
NOTES TO FINANCIAL STATEMENTS (UNAUDITED)
Franklin Mutual Beacon Fund(continued)
13. Fair Value Measurements(continued)
A summary of inputs used as of June 30, 2019, in valuing the Fund’s assets and liabilities carried at fair value, is as follows:
| Level 1 | Level 2 | Level 3 | Total | |||||||||||||
| Assets: | ||||||||||||||||
Investments in Securities:a | ||||||||||||||||
Equity Investments:b | ||||||||||||||||
Auto Components | $ | — | $ | — | $ | 73,088 | $ | 73,088 | ||||||||
Chemicals | 73,198,217 | — | 2,784,566 | 75,982,783 | ||||||||||||
Media | 289,568,732 | — | 6,150,809 | c | 295,719,541 | |||||||||||
All Other Equity Investments | 3,046,865,223 | — | — | c | 3,046,865,223 | |||||||||||
Corporate Notes and Senior Floating Rate Interests. | — | 64,163,208 | — | 64,163,208 | ||||||||||||
Corporate Notes in Reorganization | — | — | — | c | — | |||||||||||
Companies in Liquidation | — | 69,424 | — | c | 69,424 | |||||||||||
Short Term Investments | 28,356,901 | 15,000,000 | — | 43,356,901 | ||||||||||||
|
| |||||||||||||||
Total Investments in Securities | $ | 3,437,989,073 | $ | 79,232,632 | $ | 9,008,463 | $ | 3,526,230,168 | ||||||||
|
| |||||||||||||||
Other Financial Instruments: | ||||||||||||||||
Futures Contracts | $ | 90,878 | $ | — | $ | — | $ | 90,878 | ||||||||
Forward Exchange Contracts | — | 5,086,510 | — | 5,086,510 | ||||||||||||
|
| |||||||||||||||
Total Other Financial Instruments | $ | 90,878 | $ | 5,086,510 | $ | — | $ | 5,177,388 | ||||||||
|
| |||||||||||||||
| Liabilities: | ||||||||||||||||
Other Financial Instruments: | ||||||||||||||||
Securities Sold Shorta | $ | 19,536,780 | $ | — | $ | — | $ | 19,536,780 | ||||||||
Futures Contracts | 360,965 | — | — | 360,965 | ||||||||||||
Forward Exchange Contracts | — | 1,831,734 | — | 1,831,734 | ||||||||||||
|
| |||||||||||||||
Total Other Financial Instruments | $ | 19,897,745 | $ | 1,831,734 | $ | — | $ | 21,729,479 | ||||||||
|
| |||||||||||||||
aFor detailed categories, see the accompanying Statement of Investments.
bIncludes common and preferred stocks as well as other equity interests.
cIncludes securities determined to have no value at June 30, 2019.
A reconciliation of assets in which Level 3 inputs are used in determining fair value is presented when there are significant Level 3 financial instruments at the beginning and/or end of the period.
14. New Accounting Pronouncements
In August 2018, the Financial Accounting Standards Board issued Accounting Standards Update (ASU)No. 2018-14, Compensation—Retirement Benefits—Defined Benefit Plans—General (Subtopic715-20): Disclosure Framework—Changes to the Disclosure Requirements for Defined Benefit Plans. The amendments in the ASU modify the disclosure requirements for employers that sponsor defined benefit pension or other postretirement plans. The ASU is effective for annual reporting periods ending after December 15, 2020. Management has reviewed the requirements and believes the adoption of this ASU will not have a material impact on the financial statements.
15. Subsequent Events
The Fund has evaluated subsequent events through the issuance of the financial statements and determined that no events have occurred that require disclosure.
| 38 | Semiannual Report | franklintempleton.com | ||
FRANKLIN MUTUAL SERIES FUNDS
NOTES TO FINANCIAL STATEMENTS (UNAUDITED)
Franklin Mutual Beacon Fund(continued)
Abbreviations
| Counterparty | Currency | Selected Portfolio | ||||||||
| BOFA | Bank of America Corp. | EUR | Euro | ADR | American Depositary Receipt | |||||
| BONY | The Bank of New York Mellon Corp. | GBP | British Pound | FHLB | Federal Home Loan Bank | |||||
| HSBK | HSBC Bank PLC | USD | United States Dollar | LIBOR | London InterBank Offered Rate | |||||
| SSBT | State Street Bank and Trust Co., N.A. | |||||||||
| UBSW | UBS AG | |||||||||
| franklintempleton.com | Semiannual Report | 39 | ||||
FRANKLIN MUTUAL SERIES FUNDS
FRANKLIN MUTUAL BEACON FUND
Board Approval of Investment Management Agreements
FRANKLIN MUTUAL SERIES FUNDS
Franklin Mutual Beacon Fund
(Fund)
The Board of Trustees (Board), including a majority of trustees that are not “interested persons” as such term is defined in section 2(a)(19) of the Investment Company Act of 1940 (hereinafter referred to as “independent trustees”), at anin-person meeting held on May 22, 2019, unanimously approved the renewal of the Fund’s investment management agreement. Prior to a meeting of all of the trustees for the purpose of considering such renewal, the independent trustees participated in two other meetings held in connection with the renewal process. Throughout the process, the independent trustees received assistance and advice from and met separately with independent counsel. The independent trustees met with and interviewed officers of the investment manager (including portfolio managers), the transfer agent and shareholder services group and the distributor. In approving the renewal of the investment management agreement for the Fund, the Board, including the independent trustees, determined that the investment management fee structure was fair and reasonable and that continuance of the agreement was in the best interests of the Fund and its shareholders.
In reaching their decision on the investment management agreement, the trustees took into account information furnished throughout the year at regular Board meetings, as well as information specifically requested and furnished for the renewal process, which culminated in the meetings referred to above for the specific purpose of considering such agreement. Information furnished throughout the year included, among others, reports on the Fund’s investment performance, expenses, portfolio composition, portfolio brokerage execution, client commission arrangements, derivatives, securities lending, asset segregation, portfolio turnover, Rule12b-1 plan, distribution, shareholder servicing, legal and compliance matters, pricing of securities, sales and redemptions, and marketing support payments made to financial intermediaries, as well as a third-party survey of transfer agent fees charged to funds within the Franklin Templeton Investments (FTI) complex in comparison with those charged to other fund complexes deemed comparable. Also, related financial statements and other information about the scope and quality of services provided by the investment manager and its affiliates and enhancements to
such services over the past year were provided. In addition, the trustees received periodic reports throughout the year and during the renewal process relating to compliance with the Fund’s investment policies and restrictions. During the renewal process, the independent trustees considered the investment manager’s methods of operation within the Franklin Templeton group and its activities on behalf of other clients. The Board also noted that it received an annual report on all payments made by FTI or the Fund to financial intermediaries engaged in the sale of Fund shares, as well as a memorandum relating to third-party servicing arrangements in response to a Guidance Update from the U.S. Securities and Exchange Commission (SEC) relating to mutual fund distribution andsub-accounting fees.
The information obtained by the trustees during the renewal process also included a special report prepared by Broadridge Financial Solutions, Inc., an independent third-party analyst that utilizes data from Lipper, Inc. (“Lipper”), comparing the Fund’s investment performance and expenses with those of other mutual funds deemed comparable to the Fund as selected by Lipper (Broadridge Section 15(c) Report). The trustees reviewed the Broadridge Section 15(c) Report and its usefulness in the renewal process with respect to matters such as comparative fees, expenses, expense ratios, performance and volatility. They concluded that the report continues to be a reliable resource in the performance of their duties.
In addition, the trustees received a Profitability Study (Profitability Study) prepared by management discussing the profitability to FTI from its overall U.S. fund operations, as well as on an individualfund-by-fund basis. Over the past year, the Board and counsel to the independent trustees continued to receive reports on management’s handling of recent regulatory inquiries and pending legal actions against the investment manager and its affiliates. The independent trustees were satisfied with the actions taken to date by management in response to such regulatory and legal matters.
The trustees reviewed the personnel, operations, financial condition, and investment management capabilities, methodologies and resources of the investment manager. As part of this review, particular attention was given to management’s diligent risk management program, including continual monitoring and management of cybersecurity, liquidity and counterparty credit risk, and attention given to derivatives and other complex instruments that are held and expected to be held by the Fund and how such instruments
| 40 | Semiannual Report | franklintempleton.com | ||
FRANKLIN MUTUAL SERIES FUNDS
FRANKLIN MUTUAL BEACON FUND
SHAREHOLDER INFORMATION
are used to carry out the Fund’s investment goal(s). The Board also took into account, among other things, management’s efforts in establishing a global credit facility for the benefit of the Fund and other accounts managed by FTI to provide a source of cash for temporary and emergency purposes or to meet unusual redemption requests as well as the strong financial position of the investment manager’s parent company and its commitment to the mutual fund business. The Board noted management’s continuing efforts and expenditures in establishing effective business continuity plans and developing strategies to address areas of heightened concern in the mutual fund industry, such as cybersecurity and liquidity risk management. The Board also recognized management’s commitment to facilitating Board oversight of particular areas, including derivatives and payments to intermediaries, by enhanced reporting.
In addition to the above and other matters considered by the trustees throughout the course of the year, the following discussion relates to certain primary factors relevant to the Board’s decision. This discussion of the information and factors considered by the Board (including the information and factors discussed above) is not intended to be exhaustive, but rather summarizes certain factors considered by the Board. In view of the wide variety of factors considered, the Board did not, unless otherwise noted, find it practicable to quantify or otherwise assign relative weights to the foregoing factors. In addition, individual trustees may have assigned different weights to various factors.
NATURE, EXTENT AND QUALITY OF SERVICES.The trustees reviewed the nature, extent and quality of the services provided, and to be provided, by the investment manager. The trustees cited the investment manager’s ability to implement the Fund’s disciplined value investment approach and its long-term relationship with the Fund as reasons that shareholders choose to invest, and remain invested, in the Fund. The trustees reviewed the Fund’s portfolio management team, including its performance, staffing, skills and compensation program. With respect to portfolio manager compensation, management assured the trustees that the Fund’s long-term performance is a significant component of incentive-based compensation and noted that a portion of a portfolio manager’s incentive-based compensation is paid in shares ofpre- designated funds from the portfolio manager’s fund management area. The trustees noted that the portfolio manager compensation program aligned the interests of the portfolio managers with that of shareholders of the Fund. The trustees discussed
with management various other products, portfolios and entities that are advised by the investment manager and the allocation of assets and expenses among and within them, as well as their relative fees and reasons for differences with respect thereto and any potential conflicts. During regular Board meetings and the aforementioned meetings of the independent trustees, the trustees received reports and presentations on the investment manager’s best execution trading policies. The trustees considered periodic reports provided to them showing that the investment manager complied with the investment policies and restrictions of the Fund as well as other reports periodically furnished to the Board covering matters such as the compliance of portfolio managers and other management personnel with the code of ethics covering the investment management personnel, the adherence to fair value pricing procedures established by the Board and the accuracy of net asset value calculations. The Board noted the extent of the benefits provided to Fund shareholders from being part of the Franklin Templeton group of funds, including the right to exchange investments between funds (same class) without a sales charge, the ability to reinvest Fund dividends into other funds and the right to combine holdings of other funds to obtain reduced sales charges. The Board considered the investment manager’s significant efforts in developing and implementing compliance procedures established in accordance with SEC and other requirements.
The Board considered the nature, extent and quality of the services to be provided under the Fund’s other service agreements to determine that, on an overall basis, Fund shareholders were well served. In this connection, the Board also took into account transfer agent and shareholder services provided to Fund shareholders by an affiliate of the investment manager, noting continuing expenditures by management to increase and improve the scope of such services and favorable periodic reports on shareholder services conducted by independent third parties. While such considerations directly affected the trustees’ decision in renewing the Fund’s transfer agent and shareholder services agreement, the Board also considered these commitments as incidental benefits to Fund shareholders deriving from the investment management relationship.
Based on their review, the trustees were satisfied with the nature and quality of the overall services provided, and to be provided, by the investment manager and its affiliates to the Fund and its shareholders and were confident in the abilities of the management team to continue the disciplined value
| franklintempleton.com | Semiannual Report | 41 | ||||
FRANKLIN MUTUAL SERIES FUNDS
FRANKLIN MUTUAL BEACON FUND
SHAREHOLDER INFORMATION
investment approach of the Fund and to provide quality services to the Fund and its shareholders.
INVESTMENT PERFORMANCE.The trustees reviewed and placed significant emphasis on the investment performance of the Fund over theone-, three-, five- and10-year periods ended December 31, 2018. They considered the history of successful performance of the Fund relative to various benchmarks. As part of their review, they inquired of management regarding benchmarks, style drift and restrictions on permitted investments. Consideration was also given to performance in the context of available levels of cash during the periods. The trustees had meetings during the year, including the meetings referred to above held in connection with the renewal process, with the Fund’s portfolio managers to discuss performance and the management of the Fund. In addition to the materials provided by management in connection with the renewal process, the independent trustees requested throughout the year (and received) additional presentations from the investment manager and senior management of FTI regarding the performance of the investment manager and the Fund. As part of these presentations, the investment manager and senior management of FTI reviewed enhancements that have been made, and are being made, to the investment manager’s investment process. In addition, particular attention in assessing performance was given to the Broadridge Section 15(c) Report. That report showed the investment performance of the Fund (Class A shares) in comparison to other funds determined comparable by Lipper.
The comparable funds to the Fund, as chosen by Lipper, included all retail and institutional globalmulti-cap core funds. The Fund had total returns in the second-best performing quintile for theone-year period ended December 31, 2018, and had annualized total returns for the three- and five-year periods in the second-best and middle performing quintiles, respectively. The trustees noted that the Fund’s total return on an annualized basis for the10-year period ended December 31, 2018 was in the second-best performing quintile. The Board was satisfied with such comparative performance.
The trustees also compared Fund performance to other industry benchmarks, including measures of risk-adjusted performance of a fund, as part of their evaluation of investment performance. The trustees concluded that the Fund had continued to perform well in comparison to its various benchmarks and in the context of the Fund’s goals.
COMPARATIVE EXPENSES AND MANAGEMENT PROFITABILITY.The trustees considered the cost of the services provided and to be provided and the profits realized by the investment manager and its affiliates from their respective relationships with the Fund. As part of the renewal process, the trustees explored with management the trends in expense ratios over the past three fiscal years and the reasons for any increases in the Fund’s expense ratios (or components thereof). In considering the appropriateness of the management fee and other expenses charged to the Fund, the Board took into account various factors including investment performance and matters relating to Fund operations, including, but not limited to, the quality and experience of its portfolio managers and research staff. Consideration was also given to a comparative analysis in the Broadridge Section 15(c) Report of the investment management fee and total expense ratio of the Fund in comparison with those of a group of other funds selected by Lipper as its appropriate Lipper expense group. Lipper expense data is based upon information taken from each fund’s most recent annual report, which reflects historical asset levels that may be quite different from those currently existing, particularly in a period of market volatility. While recognizing such inherent limitation and the fact that expense ratios generally increase as assets decline and decrease as assets grow, the Board believed the independent analysis conducted by Lipper to be an appropriate measure of comparative expenses.
In reviewing comparative costs, emphasis was given to the Fund’s contractual management fee in comparison with the contractual management fee that would have been charged by other funds within its Lipper expense group assuming they were similar in size to the Fund, as well as the actual total expenses of the Fund in comparison with those of its Lipper expense group. The Lipper contractual management fee analysis includes administrative charges as being part of the management fee, and total expenses, for comparative consistency, are shown by Lipper for Fund Class A shares.
The Fund’s contractual management fee rate was in the second-least expensive quintile of its Lipper expense group and its total expenses were in the least expensive quintile of such group. The Board was satisfied with such comparative fees and expenses.
The trustees also reviewed the Profitability Study addressing profitability of Franklin Resources, Inc., from its overall U.S. fund business, as well as profitability to the Fund’s investment manager and its affiliates, from providing
| 42 | Semiannual Report | franklintempleton.com | ||
FRANKLIN MUTUAL SERIES FUNDS
FRANKLIN MUTUAL BEACON FUND
SHAREHOLDER INFORMATION
investment management and other services to the Fund during the12-month period ended September 30, 2018, the most recent fiscalyear-end of Franklin Resources, Inc. The trustees reviewed the basis on which such reports are prepared and the cost allocation methodology utilized in the Profitability Study, it being recognized that allocation methodologies may each be reasonable while producing different results. In this respect, the Board noted that the reasonableness of the cost allocation methodologies was reviewed by independent accountants on an every other year basis.
The independent trustees met with management to discuss the Profitability Study. This included, among other things, a comparison of investment management income with investment management expenses of the Fund; comparison of underwriting revenues and expenses; the relative relationship of investment management and underwriting expenses; shareholder servicing profitability; economies of scale; and the relative contribution of the Fund to the profitability of the investment manager and its parent. In discussing the Profitability Study with the Board, the investment manager stated its belief that the costs incurred in establishing the infrastructure necessary to operate the type of mutual fund operations conducted by it and its affiliates may not be fully reflected in the expenses allocated to the Fund in determining its profitability.
The Board also took into account management’s expenditures in improving shareholder services provided to the Fund, as well as the need to meet additional regulatory and compliance requirements. The trustees also considered the extent to which the investment manager may derive ancillary benefits from Fund operations, including those derived from economies of scale, discussed below, the allocation of Fund brokerage and the use of commission dollars to pay for research and other similar services.
Based upon their consideration of all these factors, the trustees determined that the level of profits realized by the investment manager and its affiliates in providing services to the Fund was not excessive in view of the nature, quality and extent of services provided.
ECONOMIES OF SCALE.The Board considered economies of scale realized by the investment manager and its affiliates as the Fund grows larger and the extent to which they are shared with Fund shareholders, as for example, in the level of the investment management fee charged, in the quality and efficiency of services rendered and in increased capital commitments benefiting the Fund directly or indirectly. While
recognizing that any precise determination is inherently subjective, the trustees noted that, based upon the Profitability Study, as some funds increase in size, at some point economies of scale may result in the investment manager realizing a larger profit margin on investment management services provided to such a fund. The trustees also noted that benefits of economies of scale will be shared with Fund shareholders due to the decline in the effective investment management fee rate as breakpoints are achieved by the Fund.
The trustees noted that breakpoints had been instituted as part of the Fund’s investment management fee and that the Board regularly evaluates whether additional breakpoints are appropriate. The trustees assessed the savings to shareholders resulting from such breakpoints and believed they were, and continue to be, appropriate and they agreed to continue to monitor the appropriateness of the breakpoints. The trustees also considered the effects an increase in assets under management would have on the investment management fee and expense ratio of the Fund. To the extent further economies of scale may be realized by the investment manager and its affiliates, the Board believed the investment management fees provide a sharing of benefits with the Fund and its shareholders.
Proxy Voting Policies and Procedures
The Fund’s investment manager has established Proxy Voting Policies and Procedures (Policies) that the Fund uses to determine how to vote proxies relating to portfolio securities. Shareholders may view the Fund’s complete Policies online at franklintempleton.com. Alternatively, shareholders may request copies of the Policies free of charge by calling the Proxy Group collect at (954)527-7678 or by sending a written request to: Franklin Templeton Companies, LLC, 300 S.E. 2nd Street, Fort Lauderdale, FL 33301, Attention: Proxy Group. Copies of the Fund’s proxy voting records are also made available online at franklintempleton.com and posted on the U.S. Securities and Exchange Commission’s website at sec.gov and reflect the most recent12-month period ended June 30.
Quarterly Statement of Investments
The Trust, on behalf of the Fund, files a complete statement of investments with the U.S. Securities and Exchange Commission for the first and third quarters for each fiscal year as an exhibit to its report on FormN-PORT. Shareholders may view the filed FormN-PORT by visiting
| franklintempleton.com | Semiannual Report | 43 | ||||
FRANKLIN MUTUAL SERIES FUNDS
FRANKLIN MUTUAL BEACON FUND
SHAREHOLDER INFORMATION
the Commission’s website at sec.gov. The filed form may also be viewed and copied at the Commission’s Public Reference Room in Washington, DC. Information regarding the operations of the Public Reference Room may be obtained by calling(800) SEC-0330.
| 44 | Semiannual Report | franklintempleton.com | ||
Authorized for distribution only when accompanied or preceded by a summary prospectus and/or prospectus. Investors should carefully consider a fund’s investment goals, risks, charges and expenses before investing. A prospectus contains this and other information; please read it carefully before investing.
To help ensure we provide you with quality service, all calls to and from our service areas are monitored and/or recorded.
 | Semiannual Report and Shareholder Letter | |||||
| Franklin Mutual Beacon Fund | ||||||
Investment Manager | Distributor | Shareholder Services | ||||
| Franklin Mutual Advisers, LLC | Franklin Templeton Distributors, Inc. (800) DIAL BEN®/342-5236 franklintempleton.com | (800) 632-2301 - (Class A, C, R & R6) (800)448-FUND - (Class Z) | ||||
| © 2019 Franklin Templeton Investments. All rights reserved. | 476 S 08/19 |

Sign up for electronic delivery at franklintempleton.com/edelivery
Internet Delivery of Fund Reports Unless You Request Paper Copies:Effective January 1, 2021, as permitted by the SEC, paper copies of the Fund’s shareholder reports will no longer be sent by mail, unless you specifically request them from the Fund or your financial intermediary. Instead, the reports will be made available on a website, and you will be notified by mail each time a report is posted and provided with a website link to access the report.
If you already elected to receive shareholder reports electronically, you will not be affected by this change and you need not take any action. If you have not signed up for electronic delivery, we would encourage you to join fellow shareholders who have. You may elect to receive shareholder reports and other communications electronically from the Fund by calling (800)632-2301 or by contacting your financial intermediary.
You may elect to continue to receive paper copies of all your future shareholder reports free of charge by contacting your financial intermediary or, if you invest directly with a Fund, calling (800)632-2301 to let the Fund know of your request. Your election to receive reports in paper will apply to all funds held in your account.
FRANKLIN TEMPLETON
Successful investing begins with ambition. And achievement only comes when you reach for it. That’s why we continually strive to deliver better outcomes for investors. No matter what your goals are, our deep, global investment expertise allows us to offer solutions that can help.
During our more than 70 years of experience, we’ve managed through all kinds of markets—up, down and those in between. We’re always preparing for what may come next. It’s because of this, combined with our strength as one of the world’s largest asset managers that we’ve earned the trust of millions of investors around the world.
Dear Franklin Mutual Global Discovery Fund Shareholder:
The markets came into 2019 in a fog of uncertainty. The outlook for economic growth had become less bright and fears were mounting that the U.S. Federal Reserve (Fed) would make a policy misstep in raising interest rates too far. Over the past six months, many of these economic concerns have eased, as the Fed and other major central banks like the European Central Bank (ECB) turned more dovish amid signs that growth was becoming a bit more sluggish. The ECB suggested it would act should growth soften and inflation not materialize. This dovishness helped propel the U.S. equity market back toward record highs in June. Bond yields, meanwhile, fell on the prospect for increased central bank-driven liquidity, with some sovereign European bonds sliding back into negative territory.
Although the prospects of a more accommodative monetary policy eased fears about the economic outlook, persistent trade tensions between the U.S. and China, among other nations, kept markets on edge. This was on full display in May when markets fell sharply on a ratcheting up of tensions and after the U.S. government threatened to place tariffs on Mexican goods. Mideast tensions also began to heat up in June with attacks on oil tankers in the Persian Gulf and greater tensions between the U.S. and Iran.
How, and even whether, the U.K. will leave the European Union has also remained unresolved. Atperiod-end, the U.K. Conservative Party was conducting a leadership contest,
which has the potential to complicate future Brexit negotiations and leave markets vulnerable to increased volatility.
Despite all this uncertainty, for thesix-month period ended June 30, 2019, U.S. stocks, as measured by the Standard & Poor’s 500® Index (S&P 500®), posted a +18.54% total return, while stocks in global developed markets, as measured by the MSCI World Index, posted a +17.38% total return.1
As has been the case in recent years, growth stocks, particularly in the technology sector, have outperformed over thesix-month period. Value stocks generally have remained disfavored in this environment where, at times, economic factors and monetary policy have had greater sway on equity returns than corporate fundamentals.
We recognize the important role of financial advisors in today’s markets and encourage investors to continue to seek their advice. Amid changing markets and economic conditions, we are confident investors with a well-diversified portfolio and a patient, long-term outlook will be well positioned for the years ahead.
On the following pages, the Fund’s portfolio management team reviews investment decisions that pertain to performance during the past six months considering the
1. Source: Morningstar.
See www.franklintempletondatasources.com for additional data provider information.
| Not FDIC Insured | | | May Lose Value | | | No Bank Guarantee | ||||
franklintempleton.com |
Not part of the semiannual report |
|
1 |
| ||
economic environment and other factors. Please remember all securities markets fluctuate, as do mutual fund share prices.
We thank you for investing with Franklin Templeton, welcome your questions and comments, and look forward to continuing to serve your investment needs in the years ahead.
Sincerely,

Peter A. Langerman
Chairman, President and Chief Executive Officer
Franklin Mutual Advisers, LLC
This letter reflects our analysis and opinions as of June 30, 2019, unless otherwise indicated. The information is not a complete analysis of every aspect of any market, country, industry, security or fund. Statements of fact are from sources considered reliable.
| Visitfranklintempleton.comfor fund updates, to access your account, or to find helpful financial planning tools. |
|
2 |
|
Not part of the semiannual report |
franklintempleton.com | ||
SEMIANNUAL REPORT
Franklin Mutual Global Discovery Fund
This semiannual report for Franklin Mutual Global Discovery Fund covers the period ended June 30, 2019. As previously communicated, Franklin Mutual International Fund is proposing to reorganize into Franklin Mutual Global Discovery Fund effective February 21, 2020, subject to shareholder approval.
Your Fund’s Goal and Main Investments
The Fund seeks capital appreciation. Under normal market conditions, the Fund invests primarily in equity securities of U.S. and foreign companies that the investment manager believes are available at market prices less than their intrinsic value. The equity securities in which the Fund invests are primarily common stock, with a current focus onmid- and large cap companies. To a lesser extent, the Fund also invests in merger arbitrage securities and the debt and equity of distressed companies. The Fund may invest a substantial portion, potentially up to 100% of its assets, in foreign securities, which may include sovereign debt and participations in foreign government debt. The Geographic Composition bar chart on this page lists the leading countries where the Fund invests.
Performance Overview
The Fund’s Class Z shares posted a +15.04% cumulative total return for the six months ended June 30, 2019. For comparison, the Fund’s benchmark, the MSCI World Index (USD), which tracks stock performance in global developed markets, posted a +17.38% total return.1 You can find more of the Fund’s performance data in the Performance Summary beginning on page 9.
Performance data represent past performance, which does not guarantee future results. Investment return and principal value will fluctuate, and you may have a gain or loss when you sell your shares. Current performance may differ from figures shown. For most recentmonth-end performance, go tofranklintempleton.comor call(800)342-5236.
Economic and Market Overview
The global economy expanded during the six months ended June 30, 2019 despite weakness in certain regions. Global
Geographic Composition*
Based on Total Net Assets as of 6/30/19
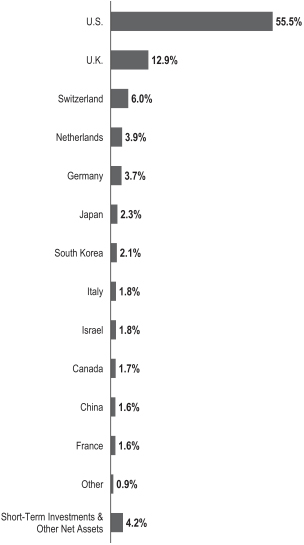
*Figures are stated as a percentage of total and may not equal 100% or may be negative due to rounding, use of any derivatives, unsettled trades or other factors.
developed and emerging market stocks were aided by upbeat economic data in some regions, encouraging corporate earnings reports and periods of optimism about a potential U.S.-China trade deal. Further supporting markets
1. Source: Morningstar.
The index is unmanaged and includes reinvestment of any income or distributions. It does not reflect any fees, expenses or sales charges. One cannot invest directly in an index, and an index is not representative of the Fund’s portfolio.
The dollar value, number of shares or principal amount, and names of all portfolio holdings are listed in the Fund’s Statement of Investments (SOI).
The SOI begins on page 17.
franklintempleton.com |
Semiannual Report |
|
3 |
| ||
FRANKLIN MUTUAL GLOBAL DISCOVERY FUND
were the U.S. Federal Reserve’s (Fed’s) patient approach to its monetary policy in 2019 and recent indication it will act as appropriate to sustain U.S. economic expansion.
However, markets reflected concerns about political uncertainties in the U.S. and the European Union, geopolitical risks in certain regions, and the impact of U.S. trade disputes with China and other trading partners on global growth and corporate earnings. In this environment, global developed and emerging market stocks, as measured by the MSCI All Country World Index, posted a +16.60% total return for thesix-month period.1
The U.S. economy grew during the six months ended June 30, 2019. After moderating for two consecutive quarters, the economy grew significantly faster in 2019’s first quarter, driven by growth in consumer spending, inventory investment, exports, business investment, and state and local government spending. However, the economy moderated again in the second quarter, due to weakness in inventory investment, exports, business investment and housing investment. The unemployment rate decreased from 3.9% in December 2018 to 3.7% atperiod-end.2 The annual inflation rate, as measured by the Consumer Price Index, decreased from 1.9% in December 2018 to 1.6% atperiod-end.2
The Fed held its target range for the federal funds rate unchanged, at 2.25%–2.50%, during the reporting period. In March, the Fed mentioned it would end its balance sheet normalization program by the end of September 2019. In June, the Fed indicated increased uncertainties around its views on economic activity and the labor market. With market-based inflation measures remaining low recently, the market has interpreted the Fed’s recent statements to mean it will likely cut rates in 2019’s second half to foster continued economic growth while attempting to achieve its inflation objective.
In Europe, the U.K.’s quarterly gross domestic product (GDP) growth accelerated in 2019’s first quarter, but GDP contracted in the second quarter compared with the first quarter as Brexit uncertainties weighed on business sentiment. The Bank of England left its key policy rate unchanged during the period. The eurozone’s quarterly GDP accelerated in 2019’s first quarter but moderated in the second quarter, and the bloc’s annual inflation rate marginally decreased byperiod-end. The European Central Bank (ECB) kept its benchmark interest rate unchanged for
the same time. In June, the ECB mentioned it would leave interest rates unchanged through the first half of 2020, provided details of its new stimulus, and indicated its openness to cut rates or increase stimulus.
In Asia, Japan’s quarterly GDP growth accelerated in 2019’s first quarter. In June, the Bank of Japan also left its benchmark interest rate unchanged, while continuing its stimulus measures, and expressed its openness to cut interest rates or increase stimulus.
In larger emerging markets, Brazil’s quarterly GDP growth contracted in 2019’s first quarter. The Central Bank of Brazil left its benchmark interest rate unchanged during the period. Russia’s annual GDP growth moderated in 2019’s first quarter. The Bank of Russia cut its key rate once during the period. China’s annual GDP growth rate stabilized in 2019’s first quarter. The People’s Bank of China left its benchmark interest rate unchanged, but it took measures to improve financial liquidity to mitigate the effects of the U.S.-China trade dispute and support economic growth. Overall, global emerging market stocks, as measured by the MSCI Emerging Markets Index, posted a +10.78% total return during thesix-month period.1
Investment Strategy
At Franklin Mutual Series, we are committed to our distinctive value approach to investing, which we believe can generate above-average risk-adjusted returns over time for our shareholders. Our major investment strategy is investing in undervalued stocks. When selecting undervalued equities, we are attracted to what we believe are fundamentally strong companies with healthy balance sheets, high-quality assets, substantial free cash flow and shareholder-oriented management teams and whose stocks are trading at discounts to our assessment of the companies’ intrinsic or business value. We also look for asset-rich companies whose shares may be trading at depressed levels due to concerns over short-term earnings disappointments, litigation, management strategy or other perceived negatives. This strict value approach is not only intended to improve the likelihood of capital appreciation, but also reduces the risk of substantial declines, in our opinion. While the vast majority of our undervalued equity investments are made in publicly traded companies globally, we may invest occasionally in privately held companies as well.
To a lesser extent, we complement this more traditional investment strategy with two others. One is distressed
2. Source: U.S. Bureau of Labor Statistics.
See www.franklintempletondatasources.com for additional data provider information.
4 |
Semiannual Report |
franklintempleton.com |
FRANKLIN MUTUAL GLOBAL DISCOVERY FUND
investing, a highly specialized field that has proven quite profitable during certain periods over the years. Distressed investing is complex and can take many forms. The most common distressed investment the Fund undertakes is the purchase of financially troubled or bankrupt companies’ debt at a substantial discount to face value. After the financially distressed company is reorganized, often in bankruptcy court, the old debt is typically replaced with new securities issued by the financially stronger company.
The other piece of our investment strategy is participating in arbitrage situations, another highly specialized field. When companies announce proposed mergers or takeovers, commonly referred to as “deals,” the target company may trade at a discount to the bid it ultimately accepts. One form of arbitrage involves purchasing the target company’s stock when it is trading below the value we believe it would receive in a deal. In keeping with our commitment to a relatively conservative investment approach, we typically focus our arbitrage efforts on announced deals, and avoid rumored deals or other situations we consider relatively risky. In addition, it is our practice to hedge the Fund’s currency exposure when we deem it advantageous for our shareholders.
What is meant by “hedge”?
To hedge an investment is to take a position intended to offset potential losses that may be incurred by a companion financial instrument. Hedging an investment may also offset potential gains.
|
Manager’s Discussion
Franklin Mutual Series has long analyzed companies in many ways beyond just looking at the numbers. We analyze the way a company is run and how decisions are made at the executive and board levels. We look at the sustainability of a company, including the relationships with employees and customers, as well as the environmental impacts of a company’s business. In many ways this is common sense. A company that takes advantage of customers and unsustainably produces environmental waste is worth less than one that does not do these things. Similarly, a company that iswell-run and responsive to shareholders is worth more than one whose executives manage the company for their private benefit. However, disclosure has been limited on many relevant issues, and there is disagreement among companies, shareholders and data providers about which factors should be measured and how they should be measured.
| Top 10 Sectors/Industries | ||||
| Based on Equity Securities as of 6/30/19 |
| |||
| % of Total Net Assets | ||||
| ||||
| Oil, Gas & Consumable Fuels | 11.8% | |||
| ||||
| Banks | 11.2% | |||
| ||||
| Insurance | 9.5% | |||
| ||||
| Pharmaceuticals | 7.8% | |||
| ||||
| Media | 5.1% | |||
| ||||
| Software | 4.2% | |||
| ||||
| Technology Hardware, Storage & Peripherals | 4.1% | |||
| ||||
| Health Care Equipment & Supplies | 3.4% | |||
| ||||
| Automobiles | 3.3% | |||
| ||||
| Entertainment | 3.3% | |||
| ||||
This type of analysis is labeled ESG analysis, where ESG stands for environmental, social, and governance factors. Many firms, including Franklin Templeton, are incorporating ESG factors in their investment research. In addition, there are other bodies such as the Sustainable Accounting Standards Board that are working on standardizing metrics for companies and industries to improve their reporting on these factors, particularly in the environmental and social areas. As a result, ESG analysis is improving across the market, and Franklin Mutual Series analysts are better able to analyzenon-traditional factors, including greenhouse gas emissions, water consumption, energy usage, talent management, diversity and inclusion, executive compensation, and enterprise risk management, to name a few. ESG investing should not be confused with social or exclusionary types of investing, but should rather be viewed as an additional tool analysts and portfolio managers use in the investment process to identify and measurenon-traditional, potential business risks and opportunities at a company.
Today, Franklin Mutual Series analysts review and analyze ESG reports produced by third parties or the companies themselves to assess potential risks that could have an impact on shareholder value. In addition, we have discussions with management teams around ESG risks, how they deal with them and the potential impact on stakeholders. Our discussions have included issues such as water consumption in mining, the impact of changing carbon dioxide emission standards on the automotive industry and discussions with boards and management teams around management pay. Although more work needs to be done to standardize data from companies within industries so that comparisons can be relevant, the identification and discussion of ESG risk factors is an input we consider in helping frame the potential negative events individual companies or industries may face. In our view, solid ESG
franklintempleton.com |
Semiannual Report |
|
5 |
| ||
FRANKLIN MUTUAL GLOBAL DISCOVERY FUND
ratings are an output of fundamentally good business practices, not an input. As the data and information regarding ESG risk factors continue to evolve, we believe the increased information will highlight additional risk factors to enterprises and help us make more informed investment decisions going forward.
Mergers and Acquisitions
Merger and acquisition (M&A) activity remained healthy in the first half of 2019. The health care sector led the way, with pharmaceuticals megamergers among the biggest transactions. The pending acquisitions of Celgene and Allergan (not a Fund holding), each worth almost $90 billion, exemplify this strength. The Top 10 Sectors/Industries table on page 5 lists pharmaceuticals and also other leading industries in which the Fund currently invests. Large deals have also been announced in the defense, oil and gas exploration and production, and diversified financial services industries, underlying the broad strength of the M&A boom. In addition, U.S. and foreign regulators appear to be more amenable to deals, leading markets to expect fewer regulatory surprises. We are closely monitoring the U.S.-China trade conflict, becauseflare-ups could potentially impact pending and future deals. We expect M&A activity to remain strong for as long as the equity markets remain positive, as has been the historical pattern.
Credit Markets
Opportunities to invest in mispriced risk across global fixed income markets remained limited in the first half of 2019. The low interest-rate environment kept credit widely available, and default rates are still at historically low levels. Debt covenant terms, which include restrictions on the borrower’s financial activities, remain loose or nonexistent. In such an environment, we believe it is prudent to focus our efforts on investing in short-term mispriced risk and catalyst-driven credit opportunities.
On the restructuring side, Cumulus Media and iHeartMedia, two long-term distressed credit positions, emerged from bankruptcy or had reached a confirmable restructuring agreement in 2018, reducing further the purely distressed portion of the credit holdings within the Funds. PG&E, which recently filed for bankruptcy, became a new distressed credit position. We are hopeful more opportunities may emerge as the business and economic cycles elongate amid persistent uncertainties. We will continue to seek to invest across the capital structures of companies that avail themselves of opportunities to bolster liquidity through internally generated free cash flow and corporate actions, including asset sales and debt refinancing.
| Top 10 Equity Holdings | ||||
| 6/30/19 | ||||
Company Sector/Industry, Country | % of Total Net Assets | |||
| ||||
Medtronic PLC Health Care Equipment & Supplies, U.S. | 3.4% | |||
| ||||
Novartis AG Pharmaceuticals, Switzerland | 3.3% | |||
| ||||
The Walt Disney Co. Entertainment, U.S. | 3.3% | |||
| ||||
Royal Dutch Shell PLC Oil, Gas & Consumable Fuels, U.K. | 2.6% | |||
| ||||
Charter Communications Inc. Media, U.S. | 2.4% | |||
| ||||
GlaxoSmithKline PLC Pharmaceuticals, U.K. | 2.4% | |||
| ||||
Kinder Morgan Inc. Oil, Gas & Consumable Fuels, U.S. | 2.1% | |||
| ||||
Samsung Electronics Co. Ltd. Technology Hardware, Storage & Peripherals, | 2.1% | |||
| ||||
| Citigroup Inc. Banks, U.S. | 2.1% | |||
| ||||
Citizens Financial Group Inc. Banks, U.S. | 2.0% | |||
| ||||
Fund Performance
Top positive contributors to performance included Walt Disney, Novartis and Kinder Morgan.These companies are listed among the Fund’s largest positions in the Top 10 Equity Holdings table on this page.
The stock of U.S.-based diversified international family entertainment and media enterprise Walt Disney surged following an investor event outlining the strategy and expectations for its new streaming service. The breadth and depth of content, the price point, and the technology and user interface supporting it have increased optimism about the service. Market expectations for the service’s growth and profitability rose significantly on the back of this event.
In March, Switzerland-based drug maker Novartis announced the official process and dates for itstax-free spinoff of the eye care device and consumer products business of Alcon (shares received by the Fund not held atperiod-end), and the U.S. Food and Drug Administration approved Mayzent, the first oral drug to treat secondary progressive multiple sclerosis. In May, Novartis won U.S. regulatory approval for gene therapy that treats spinal muscular atrophy and announced the purchase of a dry eye drug from a Japanese drug company. We believe Novartis is
6 |
Semiannual Report |
franklintempleton.com | ||
FRANKLIN MUTUAL GLOBAL DISCOVERY FUND
continuing to position itself as a more focused and innovation-driven drug company, and that the market does not fully appreciate the many innovative products it has in development.
Shares of U.S.-based energy company Kinder Morgan rose in early 2019, as the energy sector rebounded from weak performance in the fourth quarter of 2018. In addition, U.S. pipeline companies have benefited from increased volumes of U.S. crude oil, natural gas and natural gas liquids, along with limited pipeline supply. We believe conditions are likely to remain favorable for the energy sector if commodity prices hold up, most notably if crude oil prices remain above US$50 per barrel.
During the period under review, Fund investments that detracted from performance included Walgreens Boots Alliance, CVS Health and Imperial Brands.
Shares of U.S.-based Walgreens Boots Alliance did not keep up with the market rebound in January and February. In March, the stock price fell when the chief financial officer cited negative industry trends in drug prices and pharmacy benefit manager (PBM) reimbursement rates, as well as the company’s limited success offsetting those challenges by increasing its volume of drug sales or renegotiating with PBMs. These pressures and weakness in both its U.S. and U.K. stores resulted in a cut to full-year guidance in April. However, Walgreens is reducing costs throughout the enterprise, and within the front end of the store, it is attempting to reduce exposure to lower margin categories, which we believe can help boost growth and profitability over the longer term.
In January, the chief executive officer of U.S.-based CVS Health, an integrated pharmacy health care provider, highlighted probable headwinds for 2019, and in February the company detailed the financial drag from those headwinds. Possible negative factors included: higher costs from increased investments in its workforce, which could have a year-over-year drag on earnings through the first half of 2019; greater price competition in nursing care; and lower-than-expected branded drug price increases.
Shares of U.K. tobacco company Imperial Brands traded lower after the company reported below-expected first-half fiscal 2019 revenues amid concerns about stricter U.S. regulation and waning tobacco product distribution at large U.S. drugstores. The U.S. has considered banning menthol cigarettes and enacting stricter regulation ofe-cigarettes and vaping products, particularly flavors more prone to attract underaged consumers. Tobacco companies were pressured by recent Nielsen industry data suggesting deteriorating U.S.
industry volumes. The industry urged investors to use more reliable data sources, as Nielsen does not measure a number of tobacco distribution channels.
During the period, the Fund held currency forwards and futures seeking to hedge most of the currency risk of the portfolio’snon-U.S. dollar investments. The hedges had a positive overall impact on the Fund’s performance because of the appreciation of the U.S. dollar versus the hedged currencies.
What is a currency forward?
A currency forward is a direct agreement between the Fund and a counterparty to buy or sell a foreign currency in exchange for another currency at a specific exchange rate on a future date.
|
What is a future?
A future is an agreement between the Fund and a counterparty made through a U.S. or foreign futures exchange to buy or sell an underlying instrument or asset at a specific price on a future date.
|
As fellow shareholders, we found recent relative performance disappointing, but it is not uncommon for our strategy to lag the equity markets at times. We remain committed to our disciplined, value investment approach as we seek to generate attractive, long-term, risk-adjusted returns for shareholders.
franklintempleton.com |
Semiannual Report |
|
7 |
| ||
FRANKLIN MUTUAL GLOBAL DISCOVERY FUND
Thank you for your participation in Franklin Mutual Global Discovery Fund. We look forward to continuing to serve your investment needs.
 |
Peter A. Langerman Co-Portfolio Manager | |
 |
Timothy Rankin, CFA Co-Portfolio Manager | |
 |
Christian Correa, CFA Co-Portfolio Manager | |


The foregoing information reflects our analysis, opinions and portfolio holdings as of June 30, 2019, the end of the reporting period. The way we implement our main investment strategies and the resulting portfolio holdings may change depending on factors such as market and economic conditions. These opinions may not be relied upon as investment advice or an offer for a particular security. The information is not a complete analysis of every aspect of any market, country, industry, security or the Fund. Statements of fact are from sources considered reliable, but the investment manager makes no representation or warranty as to their completeness or accuracy. Although historical performance is no guarantee of future results, these insights may help you understand our investment management philosophy.
CFA® is a trademark owned by CFA Institute.
8 |
Semiannual Report |
franklintempleton.com | ||
FRANKLIN MUTUAL GLOBAL DISCOVERY FUND
Performance Summary as of June 30, 2019
The performance table does not reflect any taxes that a shareholder would pay on Fund dividends, capital gain distributions, if any, or any realized gains on the sale of Fund shares. Total return reflects reinvestment of the Fund’s dividends and capital gain distributions, if any, and any unrealized gains or losses. Your dividend income will vary depending on dividends or interest paid by securities in the Fund’s portfolio, adjusted for operating expenses of each class. Capital gain distributions are net profits realized from the sale of portfolio securities.
Performance as of 6/30/19
Cumulative total return excludes sales charges. Average annual total return includes maximum sales charges. Sales charges will vary depending on the size of the investment and the class of share purchased. The maximum is 5.50% and the minimum is 0%.Class A:5.50% maximum initial sales charge. For other share classes, visitfranklintempleton.com.
| Share Class | Cumulative Total Return1 | Average Annual Total Return2 | ||
| Z | ||||
6-Month | +15.04% | +15.04% | ||
1-Year | +4.14% | +4.14% | ||
5-Year | +21.77% | +4.02% | ||
10-Year | +125.53% | +8.47% | ||
| A3 | ||||
6-Month | +14.86% | +8.55% | ||
1-Year | +3.86% | -1.85% | ||
5-Year | +20.16% | +2.58% | ||
10-Year | +119.16% | +7.55% | ||
Performance data represent past performance, which does not guarantee future results. Investment return and principal value will fluctuate, and you may have a gain or loss when you sell your shares. Current performance may differ from figures shown. For most recentmonth-end performance, go tofranklintempleton.comor call(800)342-5236.
See page 10 for Performance Summary footnotes.
franklintempleton.com |
Semiannual Report |
|
9 |
| ||
FRANKLIN MUTUAL GLOBAL DISCOVERY FUND
PERFORMANCE SUMMARY
Total Annual Operating Expenses4
| Share Class | ||||
Z | 0.98% | |||
A | 1.23% | |||
Each class of shares is available to certain eligible investors and has different annual fees and expenses, as described in the prospectus.
All investments involve risks, including possible loss of principal. Value securities may not increase in price as anticipated or may decline further in value. Special risks are associated with foreign investing, including currency fluctuations, economic instability and political developments. To the extent that the Fund focuses on particular countries, regions, industries, sectors or types of investment from time to time, the Fund may be subject to greater risks of adverse developments in such areas of focus than a fund that invests in a wider variety of countries, regions, industries, sectors or investments. Financial services companies are subject to extensive government regulation that may affect their profitability in many ways, including by limiting the amount and types of loans and other commitments they can make, and the interest rates and fees they can charge. Because the Fund may invest its assets in companies in a specific region, including Europe, it is subject to greater risks of adverse developments in that region and/or the surrounding regions than a fund that is more broadly diversified geographically. Current political and financial uncertainty surrounding the European Union may increase market volatility and the economic risk of investing in companies in Europe. Smaller-company stocks have exhibited greater price volatility than larger-company stocks, particularly over the short term. The Fund’s investments in companies engaged in mergers, reorganizations or liquidations also involve special risks as pending deals may not be completed on time or on favorable terms. The Fund may invest in lower-rated bonds, which entail higher credit risk. The Fund is actively managed but there is no guarantee that the manager’s investment decisions will produce the desired results. The Fund’s prospectus also includes a description of the main investment risks.
1. Cumulative total return represents the change in value of an investment over the periods indicated.
2. Average annual total return represents the average annual change in value of an investment over the periods indicated. Return for less than one year, if any, has not been annualized.
3. Prior to 9/10/18, these shares were offered at a higher initial sales charge of 5.75%, thus actual returns (with sales charges) would have differed. Average annual total returns (with sales charges) have been restated to reflect the current maximum initial sales charge of 5.50%.
4. Figures are as stated in the Fund’s current prospectus and may differ from the expense ratios disclosed in the Your Fund’s Expenses and Financial Highlights sections in this report. In periods of market volatility, assets may decline significantly, causing total annual Fund operating expenses to become higher than the figures shown.
10 |
Semiannual Report |
franklintempleton.com | ||
FRANKLIN MUTUAL GLOBAL DISCOVERY FUND
As a Fund shareholder, you can incur two types of costs: (1) transaction costs, including sales charges (loads) on Fund purchases and redemptions; and (2) ongoing Fund costs, including management fees, distribution and service(12b-1) fees, and other Fund expenses. All mutual funds have ongoing costs, sometimes referred to as operating expenses. The table below shows ongoing costs of investing in the Fund and can help you understand these costs and compare them with those of other mutual funds. The table assumes a $1,000 investment held for the six months indicated.
Actual Fund Expenses
The table below provides information about actual account values and actual expenses in the columns under the heading “Actual.” In these columns the Fund’s actual return, which includes the effect of Fund expenses, is used to calculate the “Ending Account Value” for each class of shares. You can estimate the expenses you paid during the period by following these steps (ofcourse, your account value and expenses will differ from those in this illustration):Divide your account value by $1,000 (ifyour account had an $8,600 value, then $8,600÷ $1,000 = 8.6). Then multiply the result by the number in the row for your class of shares under the headings “Actual” and “Expenses Paid During Period” (ifActual Expenses Paid During Period were $7.50, then 8.6 x $7.50 = $64.50). In this illustration, the actual expenses paid this period are $64.50.
Hypothetical Example for Comparison with Other Funds
Under the heading “Hypothetical” in the table, information is provided about hypothetical account values and hypothetical expenses based on the Fund’s actual expense ratio and an assumed rate of return of 5% per year before expenses, which is not the Fund’s actual return. This information may not be used to estimate the actual ending account balance or expenses you paid for the period, but it can help you compare ongoing costs of investing in the Fund with those of other funds. To do so, compare this 5% hypothetical example for the class of shares you hold with the 5% hypothetical examples that appear in the shareholder reports of other funds.
Please note that expenses shown in the table are meant to highlight ongoing costs and do not reflect any transactional costs. Therefore, information under the heading “Hypothetical” is useful in comparing ongoing costs only, and will not help you compare total costs of owning different funds. In addition, if transactional costs were included, your total costs would have been higher.
Actual (actual return after expenses) | Hypothetical (5% annual return before expenses) | |||||||||||||||||
| Share Class | Beginning Account Value 1/1/19 | Ending Account Value 6/30/19 | Expenses Paid During Period 1/1/19–6/30/191, 2 | Ending Account Value 6/30/19 | Expenses Paid During Period 1/1/19–6/30/191, 2 | Net Annualized Expense Ratio2 | ||||||||||||
Z | $1,000 | $1,150.40 | $ 5.28 | $1,019.89 | $4.96 | 0.99% | ||||||||||||
A | $1,000 | $1,148.60 | $ 6.61 | $1,018.65 | $6.21 | 1.24% | ||||||||||||
C | $1,000 | $1,144.40 | $10.58 | $1,014.93 | $9.94 | 1.99% | ||||||||||||
R | $1,000 | $1,147.10 | $ 7.93 | $1,017.41 | $7.45 | 1.49% | ||||||||||||
R6 | $1,000 | $1,150.80 | $ 4.69 | $1,020.43 | $4.41 | 0.88% | ||||||||||||
1. Expenses are equal to the annualized expense ratio for thesix-month period as indicated above—in the far right column—multiplied by the simple average account value over the period indicated, and then multiplied by 181/365 to reflect theone-half year period.
2. Reflects expenses after fee waivers and expense reimbursements. Does not include acquired fund fees and expenses.
franklintempleton.com |
Semiannual Report |
|
11 |
| ||
FRANKLIN MUTUAL SERIES FUNDS
Franklin Mutual Global Discovery Fund
Six Months Ended (unaudited) | Year Ended December 31, | |||||||||||||||||||||||
| 2018 | 2017 | 2016 | 2015 | 2014 | ||||||||||||||||||||
| Class Z | ||||||||||||||||||||||||
| Per share operating performance (for a share outstanding throughout the period) | ||||||||||||||||||||||||
Net asset value, beginning of period | $26.86 | $32.42 | $31.12 | $29.35 | $33.32 | $33.73 | ||||||||||||||||||
|
| |||||||||||||||||||||||
Income from investment operationsa: | ||||||||||||||||||||||||
Net investment incomeb | 0.40 | 0.58 | 0.76 | c | 0.67 | d | 0.53 | 0.82e | ||||||||||||||||
Net realized and unrealized gains (losses) | 3.64 | (4.13 | ) | 2.29 | 3.08 | (1.71 | ) | 0.97 | ||||||||||||||||
|
| |||||||||||||||||||||||
Total from investment operations | 4.04 | (3.55 | ) | 3.05 | 3.75 | (1.18 | ) | 1.79 | ||||||||||||||||
|
| |||||||||||||||||||||||
Less distributions from: | ||||||||||||||||||||||||
Net investment income | — | (0.64 | ) | (0.79 | ) | (0.69 | ) | (0.55 | ) | (0.82) | ||||||||||||||
Net realized gains | — | (1.37 | ) | (0.96 | ) | (1.29 | ) | (2.24 | ) | (1.38) | ||||||||||||||
|
| |||||||||||||||||||||||
Total distributions | — | (2.01 | ) | (1.75 | ) | (1.98 | ) | (2.79 | ) | (2.20) | ||||||||||||||
|
| |||||||||||||||||||||||
Net asset value, end of period | $30.90 | $26.86 | $32.42 | $31.12 | $29.35 | $33.32 | ||||||||||||||||||
|
| |||||||||||||||||||||||
Total returnf | 15.04% | (10.78)% | 9.84% | 12.86% | (3.36)% | 5.33% | ||||||||||||||||||
| Ratios to average net assetsg | ||||||||||||||||||||||||
Expensesh,i | 0.99% | j | 0.97% | j | 0.96% | 0.99% | j | 0.99% | j | 0.99% | ||||||||||||||
Expenses incurred in connection with securities sold short | 0.01% | —% | k | —% | 0.01% | 0.02% | 0.03% | |||||||||||||||||
Net investment income | 2.73% | 1.82% | 2.30% | c | 2.27% | d | 1.56% | 2.38%e | ||||||||||||||||
| Supplemental data | ||||||||||||||||||||||||
Net assets, end of period (000’s) | $5,287,537 | $5,114,274 | $7,175,981 | $8,354,865 | $9,132,752 | $10,375,518 | ||||||||||||||||||
Portfolio turnover rate | 6.36% | 14.70% | 17.50% | 17.01% | 21.79% | 23.66% | ||||||||||||||||||
aThe amount shown for a share outstanding throughout the period may not correlate with the Statement of Operations for the period due to the timing of sales and repurchases of the Fund’s shares in relation to income earned and/or fluctuating fair value of the investments of the Fund.
bBased on average daily shares outstanding.
cNet investment income per share includes approximately $0.20 per share related to income received in the form of special dividends in connection with certain Fund holdings. Excluding this amount, the ratio of net investment income to average net assets would have been 1.68%.
dNet investment income per share includes approximately $0.10 per share related to income received in the form of special dividends in connection with certain Fund holdings. Excluding this amount, the ratio of net investment income to average net assets would have been 1.94%.
eNet investment income per share includes approximately $0.34 per share related to income received in the form of special dividends in connection with certain Fund holdings. Excluding this amount, the ratio of net investment income to average net assets would have been 1.40%.
fTotal return is not annualized for periods less than one year.
gRatios are annualized for periods less than one year.
hIncludes dividend and/or interest expense on securities sold short and security borrowing fees, if any. See below for the ratios of such expenses to average net assets for the periods presented. See Note 1(d).
iBenefit of expense reduction rounds to less than 0.01%.
jBenefit of waiver and payments by affiliates rounds to less than 0.01%.
kRounds to less than 0.01%.
12 |
Semiannual Report | The accompanying notes are an integral part of these financial statements. |
franklintempleton.com | ||
FINANCIAL HIGHLIGHTS
Franklin Mutual Global Discovery Fund(continued)
Six Months Ended June 30, 2019 (unaudited) | Year Ended December 31, | |||||||||||||||||||||||
| 2018 | 2017 | 2016 | 2015 | 2014 | ||||||||||||||||||||
| Class A | ||||||||||||||||||||||||
| Per share operating performance (for a share outstanding throughout the period) | ||||||||||||||||||||||||
Net asset value, beginning of period | $26.32 | $31.80 | $30.57 | $28.86 | $32.81 | $33.24 | ||||||||||||||||||
|
| |||||||||||||||||||||||
Income from investment operationsa: | ||||||||||||||||||||||||
Net investment incomeb | 0.36 | 0.49 | 0.66 | c | 0.59 | d | 0.42 | 0.71e | ||||||||||||||||
Net realized and unrealized gains (losses) | 3.55 | (4.04 | ) | 2.25 | 3.01 | (1.67 | ) | 0.96 | ||||||||||||||||
|
| |||||||||||||||||||||||
Total from investment operations | 3.91 | (3.55 | ) | 2.91 | 3.60 | (1.25 | ) | 1.67 | ||||||||||||||||
|
| |||||||||||||||||||||||
Less distributions from: | ||||||||||||||||||||||||
Net investment income | — | (0.56 | ) | (0.72 | ) | (0.60 | ) | (0.46 | ) | (0.72) | ||||||||||||||
Net realized gains | — | (1.37 | ) | (0.96 | ) | (1.29 | ) | (2.24 | ) | (1.38) | ||||||||||||||
|
| |||||||||||||||||||||||
Total distributions | — | (1.93 | ) | (1.68 | ) | (1.89 | ) | (2.70 | ) | (2.10) | ||||||||||||||
|
| |||||||||||||||||||||||
Net asset value, end of period | $30.23 | $26.32 | $31.80 | $30.57 | $28.86 | $32.81 | ||||||||||||||||||
|
| |||||||||||||||||||||||
Total returnf | 14.86% | (10.99)% | 9.57% | 12.56% | (3.63)% | 5.01% | ||||||||||||||||||
| Ratios to average net assetsg | ||||||||||||||||||||||||
Expensesh,i | 1.24% | j | 1.22% | j | 1.21% | 1.24% | j | 1.27% | j | 1.29% | ||||||||||||||
Expenses incurred in connection with securities sold short | 0.01% | —% | k | —% | 0.01% | 0.02% | 0.03% | |||||||||||||||||
Net investment income | 2.48% | 1.57% | 2.05% | c | 2.02% | d | 1.28% | 2.08%e | ||||||||||||||||
| Supplemental data | ||||||||||||||||||||||||
Net assets, end of period (000’s) | $7,786,790 | $7,461,444 | $9,589,033 | $10,498,722 | $11,274,721 | $11,573,196 | ||||||||||||||||||
Portfolio turnover rate | 6.36% | 14.70% | 17.50% | 17.01% | 21.79% | 23.66% | ||||||||||||||||||
aThe amount shown for a share outstanding throughout the period may not correlate with the Statement of Operations for the period due to the timing of sales and repurchases of the Fund’s shares in relation to income earned and/or fluctuating fair value of the investments of the Fund.
bBased on average daily shares outstanding.
cNet investment income per share includes approximately $0.20 per share related to income received in the form of special dividends in connection with certain Fund holdings. Excluding this amount, the ratio of net investment income to average net assets would have been 1.43%.
dNet investment income per share includes approximately $0.10 per share related to income received in the form of special dividends in connection with certain Fund holdings. Excluding this amount, the ratio of net investment income to average net assets would have been 1.69%.
eNet investment income per share includes approximately $0.34 per share related to income received in the form of special dividends in connection with certain Fund holdings. Excluding this amount, the ratio of net investment income to average net assets would have been 1.10%.
fTotal return does not reflect sales commissions or contingent deferred sales charges, if applicable, and is not annualized for periods less than one year.
gRatios are annualized for periods less than one year.
hIncludes dividend and/or interest expense on securities sold short and security borrowing fees, if any. See below for the ratios of such expenses to average net assets for the periods presented. See Note 1(d).
iBenefit of expense reduction rounds to less than 0.01%.
jBenefit of waiver and payments by affiliates rounds to less than 0.01%.
kRounds to less than 0.01%.
franklintempleton.com |
The accompanying notes are an integral part of these financial statements. | Semiannual Report |
|
13 |
| ||
FINANCIAL HIGHLIGHTS
Franklin Mutual Global Discovery Fund(continued)
Six Months Ended (unaudited) | Year Ended December 31, | |||||||||||||||||||||||
| 2018 | 2017 | 2016 | 2015 | 2014 | ||||||||||||||||||||
| Class C | ||||||||||||||||||||||||
| Per share operating performance (for a share outstanding throughout the period) | ||||||||||||||||||||||||
Net asset value, beginning of period | $26.25 | $31.44 | $30.22 | $28.55 | $32.49 | $32.94 | ||||||||||||||||||
|
| |||||||||||||||||||||||
Income from investment operationsa: | ||||||||||||||||||||||||
Net investment incomeb | 0.25 | 0.26 | 0.41 | c | 0.36 | d | 0.18 | 0.47e | ||||||||||||||||
Net realized and unrealized gains (losses) | 3.54 | (3.98 | ) | 2.23 | 2.97 | (1.64 | ) | 0.95 | ||||||||||||||||
|
| |||||||||||||||||||||||
Total from investment operations | 3.79 | (3.72 | ) | 2.64 | 3.33 | (1.46 | ) | 1.42 | ||||||||||||||||
|
| |||||||||||||||||||||||
Less distributions from: | ||||||||||||||||||||||||
Net investment income | — | (0.10 | ) | (0.46 | ) | (0.37 | ) | (0.24 | ) | (0.49) | ||||||||||||||
Net realized gains | — | (1.37 | ) | (0.96 | ) | (1.29 | ) | (2.24 | ) | (1.38) | ||||||||||||||
|
| |||||||||||||||||||||||
Total distributions | — | (1.47 | ) | (1.42 | ) | (1.66 | ) | (2.48 | ) | (1.87) | ||||||||||||||
|
| |||||||||||||||||||||||
Net asset value, end of period | $30.04 | $26.25 | $31.44 | $30.22 | $28.55 | $32.49 | ||||||||||||||||||
|
| |||||||||||||||||||||||
Total returnf | 14.44% | (11.70)% | 8.78% | 11.70% | (4.33)% | 4.28% | ||||||||||||||||||
| Ratios to average net assetsg | ||||||||||||||||||||||||
Expensesh,i | 1.99% | j | 1.97% | j | 1.96% | 1.99% | j | 1.99% | j | 1.99% | ||||||||||||||
Expenses incurred in connection with securities sold short | 0.01% | —% | k | —% | 0.01% | 0.02% | 0.03% | |||||||||||||||||
Net investment income | 1.73% | 0.82% | 1.30% | c | 1.27% | d | 0.56% | 1.38%e | ||||||||||||||||
| Supplemental data | ||||||||||||||||||||||||
Net assets, end of period (000’s) | $1,003,276 | $1,054,412 | $2,438,507 | $2,758,563 | $2,983,216 | $3,077,691 | ||||||||||||||||||
Portfolio turnover rate | 6.36% | 14.70% | 17.50% | 17.01% | 21.79% | 23.66% | ||||||||||||||||||
aThe amount shown for a share outstanding throughout the period may not correlate with the Statement of Operations for the period due to the timing of sales and repurchases of the Fund’s shares in relation to income earned and/or fluctuating fair value of the investments of the Fund.
bBased on average daily shares outstanding.
cNet investment income per share includes approximately $0.20 per share related to income received in the form of special dividends in connection with certain Fund holdings. Excluding this amount, the ratio of net investment income to average net assets would have been 0.68%.
dNet investment income per share includes approximately $0.10 per share related to income received in the form of special dividends in connection with certain Fund holdings. Excluding this amount, the ratio of net investment income to average net assets would have been 0.94%.
eNet investment income per share includes approximately $0.34 per share related to income received in the form of special dividends in connection with certain Fund holdings. Excluding this amount, the ratio of net investment income to average net assets would have been 0.40%.
fTotal return does not reflect sales commissions or contingent deferred sales charges, if applicable, and is not annualized for periods less than one year.
gRatios are annualized for periods less than one year.
hIncludes dividend and/or interest expense on securities sold short and security borrowing fees, if any. See below for the ratios of such expenses to average net assets for the periods presented. See Note 1(d).
iBenefit of expense reduction rounds to less than 0.01%.
jBenefit of waiver and payments by affiliates rounds to less than 0.01%.
kRounds to less than 0.01%.
14 |
Semiannual Report | The accompanying notes are an integral part of these financial statements. |
franklintempleton.com | ||
FINANCIAL HIGHLIGHTS
Franklin Mutual Global Discovery Fund(continued)
Six Months Ended (unaudited) | Year Ended December 31, | |||||||||||||||||||||||
| 2018 | 2017 | 2016 | 2015 | 2014 | ||||||||||||||||||||
| Class R | ||||||||||||||||||||||||
| Per share operating performance (for a share outstanding throughout the period) | ||||||||||||||||||||||||
Net asset value, beginning of period | $25.97 | $31.37 | $30.17 | $28.51 | $32.43 | $32.88 | ||||||||||||||||||
|
| |||||||||||||||||||||||
Income from investment operationsa: | ||||||||||||||||||||||||
Net investment incomeb | 0.32 | 0.41 | 0.57 | c | 0.50 | d | 0.35 | 0.65e | ||||||||||||||||
Net realized and unrealized gains (losses) | 3.50 | (3.97 | ) | 2.22 | 2.98 | (1.64 | ) | 0.93 | ||||||||||||||||
|
| |||||||||||||||||||||||
Total from investment operations | 3.82 | (3.56 | ) | 2.79 | 3.48 | (1.29 | ) | 1.58 | ||||||||||||||||
|
| |||||||||||||||||||||||
Less distributions from: | ||||||||||||||||||||||||
Net investment income | — | (0.47 | ) | (0.63 | ) | (0.53 | ) | (0.39 | ) | (0.65) | ||||||||||||||
Net realized gains | — | (1.37 | ) | (0.96 | ) | (1.29 | ) | (2.24 | ) | (1.38) | ||||||||||||||
|
| |||||||||||||||||||||||
Total distributions | — | (1.84 | ) | (1.59 | ) | (1.82 | ) | (2.63 | ) | (2.03) | ||||||||||||||
|
| |||||||||||||||||||||||
Net asset value, end of period | $29.79 | $25.97 | $31.37 | $30.17 | $28.51 | $32.43 | ||||||||||||||||||
|
| |||||||||||||||||||||||
Total returnf | 14.71% | (11.24)% | 9.31% | 12.28% | (3.82)% | 4.77% | ||||||||||||||||||
| Ratios to average net assetsg | ||||||||||||||||||||||||
Expensesh,i | 1.49% | j | 1.47% | j | 1.46% | 1.49% | j | 1.49% | j | 1.49% | ||||||||||||||
Expenses incurred in connection with securities sold short | 0.01% | —% | k | —% | 0.01% | 0.02% | 0.03% | |||||||||||||||||
Net investment income | 2.23% | 1.32% | 1.80% | c | 1.77% | d | 1.06% | 1.88%e | ||||||||||||||||
| Supplemental data | ||||||||||||||||||||||||
Net assets, end of period (000’s) | $275,262 | $274,086 | $398,692 | $444,813 | $468,425 | $528,439 | ||||||||||||||||||
Portfolio turnover rate | 6.36% | 14.70% | 17.50% | 17.01% | 21.79% | 23.66% | ||||||||||||||||||
aThe amount shown for a share outstanding throughout the period may not correlate with the Statement of Operations for the period due to the timing of sales and repurchases of the Fund’s shares in relation to income earned and/or fluctuating fair value of the investments of the Fund.
bBased on average daily shares outstanding.
cNet investment income per share includes approximately $0.20 per share related to income received in the form of special dividends in connection with certain Fund holdings. Excluding this amount, the ratio of net investment income to average net assets would have been 1.18%.
dNet investment income per share includes approximately $0.10 per share related to income received in the form of special dividends in connection with certain Fund holdings. Excluding this amount, the ratio of net investment income to average net assets would have been 1.44%.
eNet investment income per share includes approximately $0.34 per share related to income received in the form of special dividends in connection with certain Fund holdings. Excluding this amount, the ratio of net investment income to average net assets would have been 0.90%.
fTotal return is not annualized for periods less than one year.
gRatios are annualized for periods less than one year.
hIncludes dividend and/or interest expense on securities sold short and security borrowing fees, if any. See below for the ratios of such expenses to average net assets for the periods presented. See Note 1(d).
iBenefit of expense reduction rounds to less than 0.01%.
jBenefit of waiver and payments by affiliates rounds to less than 0.01%.
kRounds to less than 0.01%.
franklintempleton.com |
The accompanying notes are an integral part of these financial statements. | Semiannual Report |
|
15 |
| ||
FINANCIAL HIGHLIGHTS
Franklin Mutual Global Discovery Fund(continued)
Six Months Ended (unaudited) | Year Ended December 31, | |||||||||||||||||||||||
| 2018 | 2017 | 2016 | 2015 | 2014 | ||||||||||||||||||||
| Class R6 | ||||||||||||||||||||||||
| Per share operating performance (for a share outstanding throughout the period) | ||||||||||||||||||||||||
Net asset value, beginning of period | $26.85 | $32.41 | $31.13 | $29.35 | $33.33 | $33.73 | ||||||||||||||||||
|
| |||||||||||||||||||||||
Income from investment operationsa: | ||||||||||||||||||||||||
Net investment incomeb | 0.42 | 0.62 | 0.75 | c | 0.61 | d | 0.55 | 0.85e | ||||||||||||||||
Net realized and unrealized gains (losses) | 3.63 | (4.13 | ) | 2.34 | 3.19 | (1.69 | ) | 1.00 | ||||||||||||||||
|
| |||||||||||||||||||||||
Total from investment operations | 4.05 | (3.51 | ) | 3.09 | 3.80 | (1.14 | ) | 1.85 | ||||||||||||||||
|
| |||||||||||||||||||||||
Less distributions from: | ||||||||||||||||||||||||
Net investment income | — | (0.68 | ) | (0.85 | ) | (0.73 | ) | (0.60 | ) | (0.87) | ||||||||||||||
Net realized gains | — | (1.37 | ) | (0.96 | ) | (1.29 | ) | (2.24 | ) | (1.38) | ||||||||||||||
|
| |||||||||||||||||||||||
Total distributions | — | (2.05 | ) | (1.81 | ) | (2.02 | ) | (2.84 | ) | (2.25) | ||||||||||||||
|
| |||||||||||||||||||||||
Net asset value, end of period | $30.90 | $26.85 | $32.41 | $31.13 | $29.35 | $33.33 | ||||||||||||||||||
|
| |||||||||||||||||||||||
Total returnf | 15.08% | (10.67)% | 9.98% | 13.02% | (3.23)% | 5.46% | ||||||||||||||||||
| Ratios to average net assetsg | ||||||||||||||||||||||||
Expenses before waiver and payments by affiliatesh | 0.89% | 0.88% | 0.84% | 0.85% | 0.84% | 0.85% | ||||||||||||||||||
Expenses net of waiver and payments by affiliatesh,i | 0.88% | 0.87% | 0.84% | 0.85% | j | 0.84% | j | 0.85% | ||||||||||||||||
Expenses incurred in connection with securities sold short | 0.01% | —% | k | —% | 0.01% | 0.02% | 0.03% | |||||||||||||||||
Net investment income | 2.84% | 1.92% | 2.42% | c | 2.41% | d | 1.71% | 2.52%e | ||||||||||||||||
| Supplemental data | ||||||||||||||||||||||||
Net assets, end of period (000’s) | $1,392,409 | $1,418,812 | $2,221,338 | $528,617 | $229,765 | $137,922 | ||||||||||||||||||
Portfolio turnover rate | 6.36% | 14.70% | 17.50% | 17.01% | 21.79% | 23.66% | ||||||||||||||||||
aThe amount shown for a share outstanding throughout the period may not correlate with the Statement of Operations for the period due to the timing of sales and repurchases of the Fund’s shares in relation to income earned and/or fluctuating fair value of the investments of the Fund.
bBased on average daily shares outstanding.
cNet investment income per share includes approximately $0.20 per share related to income received in the form of special dividends in connection with certain Fund holdings. Excluding this amount, the ratio of net investment income to average net assets would have been 1.80%.
dNet investment income per share includes approximately $0.10 per share related to income received in the form of special dividends in connection with certain Fund holdings. Excluding this amount, the ratio of net investment income to average net assets would have been 2.08%.
eNet investment income per share includes approximately $0.34 per share related to income received in the form of special dividends in connection with certain Fund holdings. Excluding this amount, the ratio of net investment income to average net assets would have been 1.54%.
fTotal return is not annualized for periods less than one year.
gRatios are annualized for periods less than one year.
hIncludes dividend and/or interest expense on securities sold short and security borrowing fees, if any. See below for the ratios of such expenses to average net assets for the periods presented. See Note 1(d).
iBenefit of expense reduction rounds to less than 0.01%.
jBenefit of waiver and payments by affiliates rounds to less than 0.01%.
kRounds to less than 0.01%.
16 |
Semiannual Report | The accompanying notes are an integral part of these financial statements. |
franklintempleton.com | ||
FRANKLIN MUTUAL SERIES FUNDS
Statement of Investments, June 30, 2019 (unaudited)
Franklin Mutual Global Discovery Fund
| Country | Shares/ Units/ Warrants | Value | ||||||||||||
Common Stocks and Other Equity Interests 92.9% | ||||||||||||||
| Aerospace & Defense 0.9% | ||||||||||||||
BAE Systems PLC | United Kingdom | 21,584,405 | $ | 135,794,660 | ||||||||||
|
| |||||||||||||
| Auto Components 0.4% | ||||||||||||||
| a,b,c | International Automotive Components Group Brazil LLC | Brazil | 3,819,425 | 98,075 | ||||||||||
Toyo Tire Corp. | Japan | 4,446,741 | 58,440,290 | |||||||||||
|
| |||||||||||||
58,538,365 | ||||||||||||||
|
| |||||||||||||
| Automobiles 1.3% | ||||||||||||||
General Motors Co. | United States | 5,350,852 | 206,168,328 | |||||||||||
|
| |||||||||||||
| Banks 11.2% | ||||||||||||||
Barclays PLC | United Kingdom | 428,918 | 815,967 | |||||||||||
CIT Group Inc. | United States | 3,015,260 | 158,421,760 | |||||||||||
Citigroup Inc. | United States | 4,720,240 | 330,558,407 | |||||||||||
Citizens Financial Group Inc. | United States | 9,225,010 | 326,196,354 | |||||||||||
First Horizon National Corp. | United States | 7,743,203 | 115,606,021 | |||||||||||
ING Groep NV | Netherlands | 12,428,617 | 144,064,113 | |||||||||||
JPMorgan Chase & Co. | United States | 1,959,756 | 219,100,721 | |||||||||||
Standard Chartered PLC | United Kingdom | 21,632,144 | 196,203,170 | |||||||||||
Wells Fargo & Co. | United States | 5,713,404 | 270,358,277 | |||||||||||
|
| |||||||||||||
|
1,761,324,790 |
| ||||||||||||
|
| |||||||||||||
| Biotechnology 1.4% | ||||||||||||||
| a | Celgene Corp. | United States | 2,290,100 | 211,696,844 | ||||||||||
|
| |||||||||||||
| Building Products 1.6% | ||||||||||||||
Johnson Controls International PLC | United States | 6,119,300 | 252,788,283 | |||||||||||
|
| |||||||||||||
| Capital Markets 1.8% | ||||||||||||||
Credit Suisse Group AG | Switzerland | 12,875,441 | 154,341,786 | |||||||||||
Deutsche Bank AG | Germany | 6,644,039 | 51,211,211 | |||||||||||
Guotai Junan Securities Co. Ltd. | China | 41,520,689 | 73,983,217 | |||||||||||
|
| |||||||||||||
279,536,214 | ||||||||||||||
|
| |||||||||||||
| Chemicals 1.4% | ||||||||||||||
BASF SE | Germany | 2,946,786 | 214,135,435 | |||||||||||
| a,b,d | Dow Corning Corp. (Revolver/Term Loan Claims), Contingent Distribution | United States | 4,491,480 | 2,396,003 | ||||||||||
| a,b,d | Dow Corning Corp. (Swap Agreement Claims), Contingent Distribution | United States | 6,938,673 | 144,227 | ||||||||||
|
| |||||||||||||
216,675,665 | ||||||||||||||
|
| |||||||||||||
| Communications Equipment 1.0% | ||||||||||||||
Cisco Systems Inc. | United States | 2,838,530 | 155,352,747 | |||||||||||
|
| |||||||||||||
| Construction Materials 1.1% | ||||||||||||||
LafargeHolcim Ltd., B | Switzerland | 3,691,245 | 180,205,488 | |||||||||||
|
| |||||||||||||
| Consumer Finance 1.6% | ||||||||||||||
Ally Financial Inc. | United States | 1,438,941 | 44,592,782 | |||||||||||
Capital One Financial Corp. | United States | 2,190,465 | 198,762,794 | |||||||||||
|
| |||||||||||||
243,355,576 | ||||||||||||||
|
| |||||||||||||
| Containers & Packaging 1.0% | ||||||||||||||
International Paper Co. | United States | 3,679,148 | 159,380,691 | |||||||||||
|
| |||||||||||||
franklintempleton.com |
Semiannual Report |
|
17 |
| ||
FRANKLIN MUTUAL SERIES FUNDS
STATEMENT OF INVESTMENTS (UNAUDITED)
Franklin Mutual Global Discovery Fund(continued)
| Country | Shares/ Units/ Warrants | Value | ||||||||||||
Common Stocks and Other Equity Interests(continued) | ||||||||||||||
| Diversified Financial Services 1.2% | ||||||||||||||
Voya Financial Inc. | United States | 3,426,353 | $ | 189,477,321 | ||||||||||
|
| |||||||||||||
| Diversified Telecommunication Services 1.0% | ||||||||||||||
Koninklijke KPN NV | Netherlands | 53,238,928 | 163,416,627 | |||||||||||
|
| |||||||||||||
| Electric Utilities 1.8% | ||||||||||||||
Enel SpA | Italy | 40,912,036 | 285,576,614 | |||||||||||
|
| |||||||||||||
| Energy Equipment & Services 1.2% | ||||||||||||||
Baker Hughes a GE Co., A | United States | 7,502,843 | 184,795,023 | |||||||||||
|
| |||||||||||||
| Entertainment 3.3% | ||||||||||||||
The Walt Disney Co. | United States | 3,701,900 | 516,933,316 | |||||||||||
|
| |||||||||||||
| Food & Staples Retailing 1.0% | ||||||||||||||
Walgreens Boots Alliance Inc. | United States | 2,833,972 | 154,933,249 | |||||||||||
|
| |||||||||||||
| Food Products 0.8% | ||||||||||||||
The Kraft Heinz Co. | United States | 4,078,600 | 126,599,744 | |||||||||||
|
| |||||||||||||
| Health Care Equipment & Supplies 3.4% | ||||||||||||||
Medtronic PLC | United States | 5,470,184 | 532,741,220 | |||||||||||
|
| |||||||||||||
| Health Care Providers & Services 1.4% | ||||||||||||||
CVS Health Corp. | United States | 3,993,966 | 217,631,207 | |||||||||||
|
| |||||||||||||
| Hotels, Restaurants & Leisure 2.3% | ||||||||||||||
Accor SA | France | 5,757,306 | 247,081,054 | |||||||||||
Sands China Ltd. | China | 25,499,100 | 121,911,559 | |||||||||||
|
| |||||||||||||
368,992,613 | ||||||||||||||
|
| |||||||||||||
| Independent Power & Renewable Electricity Producers 0.5% | ||||||||||||||
Vistra Energy Corp. | United States | 3,709,858 | 83,991,185 | |||||||||||
|
| |||||||||||||
| Industrial Conglomerates 1.1% | ||||||||||||||
General Electric Co. | United States | 16,950,050 | 177,975,525 | |||||||||||
|
| |||||||||||||
| Insurance 9.5% | ||||||||||||||
| a | Alleghany Corp. | United States | 76,761 | 52,282,685 | ||||||||||
American International Group Inc. | United States | 5,102,618 | 271,867,487 | |||||||||||
China Pacific Insurance Group Co. Ltd., H | China | 44,491,587 | 173,987,696 | |||||||||||
Chubb Ltd. | United States | 1,511,898 | 222,687,456 | |||||||||||
The Hartford Financial Services Group Inc. | United States | 5,478,587 | 305,266,868 | |||||||||||
NN Group NV | Netherlands | 7,550,480 | 303,865,224 | |||||||||||
RSA Insurance Group PLC | United Kingdom | 13,308,282 | 97,484,116 | |||||||||||
T&D Holdings Inc. | Japan | 6,611,212 | 71,710,373 | |||||||||||
|
| |||||||||||||
1,499,151,905 | ||||||||||||||
|
| |||||||||||||
| IT Services 1.4% | ||||||||||||||
Cognizant Technology Solutions Corp., A | United States | 3,420,390 | 216,818,522 | |||||||||||
|
| |||||||||||||
| Machinery 0.9% | ||||||||||||||
CNH Industrial NV | United Kingdom | 5,804,196 | 59,505,276 | |||||||||||
CNH Industrial NV, special voting | United Kingdom | 7,338,645 | 75,236,622 | |||||||||||
|
| |||||||||||||
134,741,898 | ||||||||||||||
|
| |||||||||||||
18 |
Semiannual Report |
franklintempleton.com | ||
FRANKLIN MUTUAL SERIES FUNDS
STATEMENT OF INVESTMENTS (UNAUDITED)
Franklin Mutual Global Discovery Fund(continued)
| Country | Shares/ Units/ Warrants | Value | ||||||||||||
Common Stocks and Other Equity Interests(continued) | ||||||||||||||
| Media 5.1% | ||||||||||||||
| a | Charter Communications Inc., A | United States | 950,265 | $ | 375,525,723 | |||||||||
| a | Clear Channel Outdoor Holdings Inc. | United States | 5,716,745 | 26,983,036 | ||||||||||
| a | Cumulus Media Inc., A | United States | 191,134 | 3,545,536 | ||||||||||
| a | Cumulus Media Inc., B | United States | 284,470 | 5,276,918 | ||||||||||
| a | Cumulus Media Inc., wts., 6/04/38 | United States | 243,863 | 3,962,774 | ||||||||||
| a | DISH Network Corp., A | United States | 4,143,726 | 159,160,516 | ||||||||||
| a,b,c | iHeartMedia Inc., A | United States | 2,634,302 | 38,237,647 | ||||||||||
| a,b,c | iHeartMedia Inc., B | United States | 44,430 | 644,914 | ||||||||||
| a,b,c | iHeartMedia Inc., wts., A, 5/01/39 | United States | 292 | 4,238 | ||||||||||
| a | Liberty Global PLC, C | United Kingdom | 7,299,000 | 193,642,470 | ||||||||||
|
| |||||||||||||
806,983,772 | ||||||||||||||
|
| |||||||||||||
| Metals & Mining 0.0%† | ||||||||||||||
Warrior Met Coal Inc. | United States | 106,705 | 2,787,135 | |||||||||||
|
| |||||||||||||
| Oil, Gas & Consumable Fuels 11.8% | ||||||||||||||
Anadarko Petroleum Corp. | United States | 2,323,300 | 163,932,048 | |||||||||||
BP PLC | United Kingdom | 24,503,699 | 170,715,935 | |||||||||||
Caltex Australia Ltd. | Australia | 768,566 | 13,352,499 | |||||||||||
Canadian Natural Resources Ltd. | Canada | 7,822,700 | 210,894,856 | |||||||||||
Crescent Point Energy Corp. | Canada | 19,234,400 | 63,588,434 | |||||||||||
JXTG Holdings Inc. | Japan | 22,697,867 | 112,499,909 | |||||||||||
Kinder Morgan Inc. | United States | 15,908,858 | 332,176,955 | |||||||||||
Occidental Petroleum Corp. | United States | 1,430,700 | 71,935,596 | |||||||||||
Plains All American Pipeline LP | United States | 5,573,200 | 135,707,420 | |||||||||||
Royal Dutch Shell PLC, A (EUR Traded) | United Kingdom | 6,246,107 | 203,866,463 | |||||||||||
Royal Dutch Shell PLC, A (GBP Traded) | United Kingdom | 6,164,658 | 201,396,065 | |||||||||||
The Williams Cos. Inc. | United States | 6,364,035 | 178,447,541 | |||||||||||
|
| |||||||||||||
|
1,858,513,721 |
| ||||||||||||
|
| |||||||||||||
| Pharmaceuticals 8.1% | ||||||||||||||
Eli Lilly & Co. | United States | 1,578,417 | 174,872,819 | |||||||||||
GlaxoSmithKline PLC | United Kingdom | 18,674,012 | 373,891,649 | |||||||||||
Merck & Co. Inc. | United States | 2,408,566 | 201,958,259 | |||||||||||
Novartis AG, ADR | Switzerland | 5,703,042 | 520,744,765 | |||||||||||
|
| |||||||||||||
1,271,467,492 | ||||||||||||||
|
| |||||||||||||
| Semiconductors & Semiconductor Equipment 0.7% | ||||||||||||||
| a | Renesas Electronics Corp. | Japan | 23,512,917 | 116,670,475 | ||||||||||
|
| |||||||||||||
| Software 4.2% | ||||||||||||||
| a | Avaya Holdings Corp., wts., 12/15/22 | United States | 401,411 | 401,411 | ||||||||||
| a | Check Point Software Technologies Ltd. | Israel | 2,433,172 | 281,299,015 | ||||||||||
| a | Red Hat Inc. | United States | 906,600 | 170,323,127 | ||||||||||
Symantec Corp. | United States | 9,568,159 | 208,203,140 | |||||||||||
|
| |||||||||||||
|
660,226,693 |
| ||||||||||||
|
| |||||||||||||
| Specialty Retail 0.6% | ||||||||||||||
Dufry AG | Switzerland | 1,124,346 | 95,202,957 | |||||||||||
|
| |||||||||||||
franklintempleton.com |
Semiannual Report |
|
19 |
| ||
FRANKLIN MUTUAL SERIES FUNDS
STATEMENT OF INVESTMENTS (UNAUDITED)
Franklin Mutual Global Discovery Fund(continued)
| Country | Shares/ Units/ Warrants | Value | ||||||||||||
Common Stocks and Other Equity Interests(continued) | ||||||||||||||
| Technology Hardware, Storage & Peripherals 4.1% | ||||||||||||||
Hewlett Packard Enterprise Co. | United States | 10,039,360 | $ | 150,088,432 | ||||||||||
Samsung Electronics Co. Ltd. | South Korea | 8,138,650 | 330,627,820 | |||||||||||
Western Digital Corp. | United States | 3,527,471 | 167,731,246 | |||||||||||
|
| |||||||||||||
648,447,498 | ||||||||||||||
|
| |||||||||||||
| Tobacco 2.8% | ||||||||||||||
Altria Group Inc. | United States | 2,606,727 | 123,428,524 | |||||||||||
British American Tobacco PLC | United Kingdom | 5,783,513 | 201,907,785 | |||||||||||
British American Tobacco PLC, ADR | United Kingdom | 2,178,905 | 75,978,417 | |||||||||||
Imperial Brands PLC | United Kingdom | 1,937,431 | 45,439,414 | |||||||||||
|
| |||||||||||||
446,754,140 | ||||||||||||||
|
| |||||||||||||
Total Common Stocks and Other Equity Interests | ||||||||||||||
(Cost $12,026,627,315) | 14,621,647,503 | |||||||||||||
|
| |||||||||||||
| Preferred Stocks (Cost $391,187,080) 2.0% | ||||||||||||||
| Automobiles 2.0% | ||||||||||||||
| e | Volkswagen AG, 3.279%, pfd | Germany | 1,896,164 | 319,511,050 | ||||||||||
|
| |||||||||||||
| Principal Amount | ||||||||||||||
Corporate Notes 1.0% | ||||||||||||||
Frontier Communications Corp., | ||||||||||||||
senior note, 10.50%, 9/15/22 | United States | $ | 117,895,000 | 80,463,338 | ||||||||||
senior note, 11.00%, 9/15/25 | United States | 133,179,000 | 83,236,875 | |||||||||||
|
| |||||||||||||
Total Corporate Notes (Cost $231,355,595) |
|
163,700,213 |
| |||||||||||
|
| |||||||||||||
Corporate Bonds and Notes in Reorganization 0.2% | ||||||||||||||
| b,c,f | Broadband Ventures III LLC, secured promissory note, 5.00%, 2/01/12 | United States | 8,893 | — | ||||||||||
| f | Pacific Gas & Electric Co., | |||||||||||||
senior bond, 4.45%, 4/15/42 | United States | 4,774,000 | 4,594,975 | |||||||||||
senior bond, 3.75%, 8/15/42 | United States | 7,586,000 | 6,903,260 | |||||||||||
senior bond, 4.00%, 12/01/46 | United States | 8,213,000 | 7,494,362 | |||||||||||
senior bond, 3.95%, 12/01/47 | United States | 3,961,000 | 3,579,754 | |||||||||||
|
| |||||||||||||
Total Corporate Bonds and Notes in Reorganization | ||||||||||||||
(Cost $18,571,788) | 22,572,351 | |||||||||||||
|
| |||||||||||||
| Shares | ||||||||||||||
Companies in Liquidation 0.0%† | ||||||||||||||
| a,b,d | Avaya Holdings Corp., Contingent Distribution | United States | 123,916,000 | — | ||||||||||
| a,b,d | Avaya Inc., Contingent Distribution | United States | 168,607,601 | — | ||||||||||
| a,b,d | Clear Channel Communications Inc., Contingent Distribution | United States | 95,618,000 | — | ||||||||||
| a,b,d | iHeartCommunications Inc., Contingent Distribution | United States | 155,900,649 | — | ||||||||||
| a,b,d | NewPage Corp., Litigation Trust, Contingent Distribution | United States | 145,817,000 | — | ||||||||||
| a,b,d | Tribune Media, Litigation Trust, Contingent Distribution | United States | 1,300,519 | — | ||||||||||
20 |
Semiannual Report |
franklintempleton.com | ||
FRANKLIN MUTUAL SERIES FUNDS
STATEMENT OF INVESTMENTS (UNAUDITED)
Franklin Mutual Global Discovery Fund(continued)
| Country | Shares | Value | ||||||||||||
Companies in Liquidation(continued) | ||||||||||||||
| a,d | Vistra Energy Corp., Litigation Trust, Contingent Distribution | United States | 142,325,613 | $ | 213,489 | |||||||||
|
| |||||||||||||
Total Companies in Liquidation (Cost $4,503,161) | 213,489 | |||||||||||||
|
| |||||||||||||
Total Investments before Short Term Investments | 15,127,644,606 | |||||||||||||
|
| |||||||||||||
| Principal Amount | ||||||||||||||
Short Term Investments 3.1% | ||||||||||||||
U.S. Government and Agency Securities 3.1% | ||||||||||||||
| g | FHLB, 7/01/19 | United States | $ | 68,100,000 | 68,100,000 | |||||||||
| g | U.S. Treasury Bill, 7/02/19 - 10/10/19 | United States | 294,000,000 | 293,510,580 | ||||||||||
h 10/17/19 - 10/31/19 | United States | 125,000,000 | 124,198,484 | |||||||||||
|
| |||||||||||||
Total U.S. Government and Agency Securities | 485,809,064 | |||||||||||||
|
| |||||||||||||
Total Investments (Cost $13,157,790,496) 99.2% | 15,613,453,670 | |||||||||||||
Securities Sold Short (0.3)% | (40,901,165 | ) | ||||||||||||
Other Assets, less Liabilities 1.1% | 172,720,617 | |||||||||||||
|
| |||||||||||||
Net Assets 100.0% |
$ |
15,745,273,122 |
| |||||||||||
|
| |||||||||||||
| Shares | ||||||||||||||
| i | Securities Sold Short (Proceeds $43,284,760) (0.3)% | |||||||||||||
| Common Stocks (0.3)% | ||||||||||||||
| Pharmaceuticals (0.3)% | ||||||||||||||
Bristol-Myers Squibb Co. | United States | 901,900 | (40,901,165 | ) | ||||||||||
|
| |||||||||||||
†Rounds to less than 0.1% of net assets.
aNon-income producing.
bFair valued using significant unobservable inputs. See Note 15 regarding fair value measurements.
cSee Note 10 regarding restricted securities.
dContingent distributions represent the right to receive additional distributions, if any, during the reorganization of the underlying company. Shares represent total underlying principal of debt securities.
eVariable rate security. The rate shown represents the yield at period end.
fSee Note 8 regarding credit risk and defaulted securities.
gThe security was issued on a discount basis with no stated coupon rate.
hA portion or all of the security has been segregated as collateral for securities sold short and/or open forward exchange contracts. At June 30, 2019, the aggregate value of these securities pledged amounted to $23,056,601, representing 0.1% of net assets.
iSee Note 1(d) regarding securities sold short.
franklintempleton.com |
Semiannual Report |
|
21 |
| ||
FRANKLIN MUTUAL SERIES FUNDS
STATEMENT OF INVESTMENTS (UNAUDITED)
Franklin Mutual Global Discovery Fund(continued)
At June 30, 2019, the Fund had the following futures contracts outstanding. See Note 1(c).
Futures Contracts
| Description | Type | | Number of Contracts | | | Notional Amount | * | | Expiration Date | | | Value/ Unrealized Appreciation (Depreciation) | | |||||||
| ||||||||||||||||||||
| Currency Contracts | ||||||||||||||||||||
EUR/USD | Short | 7,133 | $1,020,598,557 | 9/16/19 | $(3,183,111 | ) | ||||||||||||||
GBP/USD | Short | 4,797 | 382,230,956 | 9/16/19 | 389,473 | |||||||||||||||
|
| |||||||||||||||||||
Total Futures Contracts | $(2,793,638 | ) | ||||||||||||||||||
|
| |||||||||||||||||||
*As of period end.
At June 30, 2019, the Fund had the following forward exchange contracts outstanding. See Note 1(c).
Forward Exchange Contracts
| Currency | Counterparty | a | Type | Quantity | | Contract Amount | | | Settlement Date | | | Unrealized Appreciation | | | Unrealized Depreciation | | ||||||||||||
| ||||||||||||||||||||||||||||
OTC Forward Exchange Contracts |
| |||||||||||||||||||||||||||
Euro | BOFA | Buy | 18,908,422 | $ | 21,222,207 | 7/15/19 | $ | 305,240 | $ | — | ||||||||||||||||||
Euro | BOFA | Sell | 131,406,302 | 149,304,498 | 7/15/19 | — | (303,031 | ) | ||||||||||||||||||||
Euro | HSBK | Buy | 53,714,919 | 60,267,304 | 7/15/19 | 887,725 | — | |||||||||||||||||||||
Euro | HSBK | Sell | 4,940,617 | 5,679,141 | 7/15/19 | 54,193 | — | |||||||||||||||||||||
Euro | UBSW | Buy | 29,027,835 | 32,623,699 | 7/15/19 | 424,813 | — | |||||||||||||||||||||
Euro | UBSW | Sell | 2,519,294 | 2,896,163 | 7/15/19 | 27,919 | — | |||||||||||||||||||||
Swiss Franc | HSBK | Buy | 2,375,837 | 2,367,970 | 7/15/19 | 69,204 | — | |||||||||||||||||||||
Swiss Franc | HSBK | Sell | 2,236,179 | 2,255,804 | 7/15/19 | — | (38,107 | ) | ||||||||||||||||||||
Swiss Franc | UBSW | Sell | 147,598,720 | 147,366,369 | 7/15/19 | — | (4,042,952 | ) | ||||||||||||||||||||
British Pound | BOFA | Buy | 21,552,483 | 27,319,640 | 7/16/19 | 76,439 | — | |||||||||||||||||||||
British Pound | BOFA | Sell | 3,522,218 | 4,598,844 | 7/16/19 | 121,635 | — | |||||||||||||||||||||
British Pound | HSBK | Buy | 4,218,217 | 5,374,535 | 7/16/19 | — | (12,619 | ) | ||||||||||||||||||||
British Pound | HSBK | Buy | 7,526,260 | 9,489,204 | 7/16/19 | 77,676 | — | |||||||||||||||||||||
British Pound | HSBK | Sell | 184,046,689 | 238,919,665 | 7/16/19 | 4,971,779 | — | |||||||||||||||||||||
British Pound | UBSW | Buy | 1,756,679 | 2,235,287 | 7/16/19 | — | (2,313 | ) | ||||||||||||||||||||
British Pound | UBSW | Buy | 52,356,616 | 66,181,925 | 7/16/19 | 370,317 | — | |||||||||||||||||||||
British Pound | UBSW | Sell | 1,267,017 | 1,668,957 | 7/16/19 | 58,409 | — | |||||||||||||||||||||
British Pound | BOFA | Sell | 14,590,368 | 19,264,596 | 8/14/19 | 693,097 | — | |||||||||||||||||||||
British Pound | BONY | Sell | 20,230,555 | 26,290,841 | 8/14/19 | 540,172 | — | |||||||||||||||||||||
British Pound | HSBK | Sell | 14,840,022 | 19,483,629 | 8/14/19 | 594,356 | — | |||||||||||||||||||||
British Pound | UBSW | Sell | 5,294,015 | 6,881,929 | 8/14/19 | 143,387 | — | |||||||||||||||||||||
South Korean Won | HSBK | Buy | 24,009,017,500 | 20,325,409 | 8/16/19 | 453,073 | — | |||||||||||||||||||||
South Korean Won | HSBK | Sell | 78,766,286,177 | 70,135,808 | 8/16/19 | 1,967,924 | — | |||||||||||||||||||||
South Korean Won | UBSW | Sell | 153,884,334,740 | 138,628,291 | 8/16/19 | 5,449,871 | — | |||||||||||||||||||||
Australian Dollar | HSBK | Sell | 16,407,764 | 11,421,304 | 8/26/19 | — | (118,388 | ) | ||||||||||||||||||||
Japanese Yen | UBSW | Sell | 7,499,858,061 | 69,972,222 | 8/26/19 | 99,057 | — | |||||||||||||||||||||
Euro | BONY | Sell | 151,927,258 | 174,333,490 | 10/18/19 | 79,653 | — | |||||||||||||||||||||
Euro | SSBT | Sell | 61,680,696 | 69,794,792 | 10/18/19 | — | (950,235 | ) | ||||||||||||||||||||
Euro | SSBT | Sell | 151,927,257 | 174,334,704 | 10/18/19 | 80,868 | — | |||||||||||||||||||||
Euro | HSBK | Sell | 170,306,881 | 193,035,284 | 11/07/19 | — | (2,602,244 | ) | ||||||||||||||||||||
22 |
Semiannual Report |
franklintempleton.com | ||
FRANKLIN MUTUAL SERIES FUNDS
STATEMENT OF INVESTMENTS (UNAUDITED)
Franklin Mutual Global Discovery Fund(continued)
Forward Exchange Contracts(continued)
| Currency | Counterpartya | Type | Quantity | | Contract Amount | | | Settlement Date | | | Unrealized Appreciation | | | Unrealized Depreciation | | |||||||||||||
| ||||||||||||||||||||||||||||
| OTC Forward Exchange Contracts(continued) |
| |||||||||||||||||||||||||||
Euro | UBSW | Sell | 104,149,571 | $ | 118,008,754 | 11/07/19 | $ | — | $ | (1,631,536 | ) | |||||||||||||||||
South Korean Won | HSBK | Sell | 74,874,809,919 | 64,275,498 | 11/15/19 | — | (712,475 | ) | ||||||||||||||||||||
South Korean Won | UBSW | Sell | 86,792,161,664 | 75,086,220 | 11/15/19 | — | (245,479 | ) | ||||||||||||||||||||
Euro | BOFA | Sell | 7,795,248 | 8,941,227 | 11/21/19 | — | (23,186 | ) | ||||||||||||||||||||
Euro | SSBT | Sell | 138,284,571 | 156,870,017 | 11/21/19 | — | (2,155,072 | ) | ||||||||||||||||||||
Euro | UBSW | Sell | 52,916,516 | 60,341,904 | 11/21/19 | — | (511,258 | ) | ||||||||||||||||||||
British Pound | SSBT | Sell | 5,971,029 | 7,607,838 | 11/22/19 | — | (21,864 | ) | ||||||||||||||||||||
|
| |||||||||||||||||||||||||||
Total Forward Exchange Contracts |
| $ | 17,546,807 | $ | (13,370,759 | ) | ||||||||||||||||||||||
|
| |||||||||||||||||||||||||||
Net unrealized appreciation (depreciation) |
| $ | 4,176,048 | |||||||||||||||||||||||||
|
| |||||||||||||||||||||||||||
aMay be comprised of multiple contracts with the same counterparty, currency and settlement date.
See Note 11 regarding other derivative information.
See Abbreviations on page 42.
franklintempleton.com |
The accompanying notes are an integral part of these financial statements. | Semiannual Report |
|
23 |
| ||
FRANKLIN MUTUAL SERIES FUNDS
Statement of Assets and Liabilities
June 30, 2019 (unaudited)
Franklin Mutual Global Discovery Fund
Assets: | ||||
Investments in securities: | ||||
Cost - Unaffiliated issuers | $ | 13,157,790,496 | ||
|
| |||
Value - Unaffiliated issuers | $ | 15,613,453,670 | ||
Cash | 516,830 | |||
Foreign currency, at value (cost $15,417,363) | 15,435,245 | |||
Receivables: | ||||
Investment securities sold | 76,786,089 | |||
Capital shares sold | 6,704,952 | |||
Dividends and interest | 49,511,354 | |||
European Union tax reclaims | 7,573,388 | |||
Deposits with brokers for: | ||||
Securities sold short | 41,490,109 | |||
Futures contracts | 25,582,720 | |||
Unrealized appreciation on OTC forward exchange contracts | 17,546,807 | |||
Other assets | 900,671 | |||
|
| |||
Total assets | 15,855,501,835 | |||
|
| |||
Liabilities: | ||||
Payables: | ||||
Investment securities purchased | 3,189,387 | |||
Capital shares redeemed | 28,597,779 | |||
Management fees | 10,640,613 | |||
Distribution fees | 5,164,471 | |||
Transfer agent fees | 3,738,053 | |||
Trustees’ fees and expenses | 1,193,854 | |||
Variation margin on futures contracts | 1,601,262 | |||
Securities sold short, at value (proceeds $43,284,760) | 40,901,165 | |||
Unrealized depreciation on OTC forward exchange contracts | 13,370,759 | |||
Accrued expenses and other liabilities | 1,831,370 | |||
|
| |||
Total liabilities | 110,228,713 | |||
|
| |||
Net assets, at value | $ | 15,745,273,122 | ||
|
| |||
Net assets consist of: | ||||
Paid-in capital | $ | 12,500,033,676 | ||
Total distributable earnings (loss) | 3,245,239,446 | |||
|
| |||
Net assets, at value | $ | 15,745,273,122 | ||
|
| |||
24 |
Semiannual Report | The accompanying notes are an integral part of these financial statements. |
franklintempleton.com | ||
FRANKLIN MUTUAL SERIES FUNDS
FINANCIAL STATEMENTS
Statement of Assets and Liabilities(continued)
June 30, 2019 (unaudited)
Franklin Mutual Global Discovery Fund
| Class Z: | ||||
Net assets, at value | $5,287,536,842 | |||
|
| |||
Shares outstanding | 171,143,267 | |||
|
| |||
Net asset value and maximum offering price per share | $30.90 | |||
|
| |||
| Class A: | ||||
Net assets, at value | $7,786,789,827 | |||
|
| |||
Shares outstanding | 257,552,985 | |||
|
| |||
Net asset value per sharea | $30.23 | |||
|
| |||
Maximum offering price per share (net asset value per share ÷ 94.50%) | $31.99 | |||
|
| |||
| Class C: | ||||
Net assets, at value | $1,003,276,187 | |||
|
| |||
Shares outstanding | 33,393,158 | |||
|
| |||
Net asset value and maximum offering price per sharea | $30.04 | |||
|
| |||
| Class R: | ||||
Net assets, at value | $ 275,261,520 | |||
|
| |||
Shares outstanding | 9,240,728 | |||
|
| |||
Net asset value and maximum offering price per share | $29.79 | |||
|
| |||
| Class R6: | ||||
Net assets, at value | $1,392,408,746 | |||
|
| |||
Shares outstanding | 45,062,062 | |||
|
| |||
Net asset value and maximum offering price per share | $30.90 | |||
|
|
aRedemption price is equal to net asset value less contingent deferred sales charges, if applicable.
| franklintempleton.com | The accompanying notes are an integral part of these financial statements. | Semiannual Report | 25 | ||||
FRANKLIN MUTUAL SERIES FUNDS
FINANCIAL STATEMENTS
Statement of Operations
for the six months ended June 30, 2019 (unaudited)
Franklin Mutual Global Discovery Fund
Investment income: | ||||
Dividends: (net of foreign taxes)* | ||||
Unaffiliated issuers | $ | 270,302,193 | ||
Interest: | ||||
Unaffiliated issuers | 24,592,893 | |||
Income from securities loaned: | ||||
Unaffiliated issuers (net of fees and rebates) | 1,208,403 | |||
Non-controlled affiliates (Note 3f) | 82,368 | |||
|
| |||
Total investment income | 296,185,857 | |||
|
| |||
Expenses: | ||||
Management fees (Note 3a) | 65,908,921 | |||
Distribution fees: (Note 3c) | ||||
Class A | 9,743,614 | |||
Class C | 5,265,412 | |||
Class R | 699,162 | |||
Transfer agent fees: (Note 3e) | ||||
Class Z | 3,541,918 | |||
Class A | 5,194,411 | |||
Class C | 701,773 | |||
Class R | 186,905 | |||
Class R6 | 199,947 | |||
Custodian fees (Note 4) | 718,857 | |||
Reports to shareholders | 733,846 | |||
Registration and filing fees | 132,197 | |||
Professional fees | 80,232 | |||
Trustees’ fees and expenses | 622,014 | |||
Dividends on securities sold short | 369,779 | |||
Other | 213,187 | |||
|
| |||
Total expenses | 94,312,175 | |||
Expense reductions (Note 4) | (45,975 | ) | ||
Expenses waived/paid by affiliates (Note 3f and 3g) | (70,807 | ) | ||
|
| |||
Net expenses | 94,195,393 | |||
|
| |||
Net investment income | 201,990,464 | |||
|
| |||
Realized and unrealized gains (losses): | ||||
Net realized gain (loss) from: | ||||
Investments: | ||||
Unaffiliated issuers | 225,926,114 | |||
Non-controlled affiliates (Note 3f and 12) | (23,807,201 | ) | ||
Foreign currency transactions | 1,374,544 | |||
Forward exchange contracts | 81,548,530 | |||
Futures contracts | 34,142,520 | |||
Securities sold short | 2,536,941 | |||
|
| |||
Net realized gain (loss) | 321,721,448 | |||
|
| |||
Net change in unrealized appreciation (depreciation) on: | ||||
Investments: | ||||
Unaffiliated issuers | 1,727,362,086 | |||
Non-controlled affiliates (Note 3f and 12) | 24,864,834 | |||
Translation of other assets and liabilities denominated in foreign currencies | (162,266 | ) | ||
Forward exchange contracts | (28,091,977 | ) | ||
Futures contracts | (3,779,815 | ) | ||
26 |
Semiannual Report | The accompanying notes are an integral part of these financial statements. |
franklintempleton.com | ||
FRANKLIN MUTUAL SERIES FUNDS
FINANCIAL STATEMENTS
Statement of Operations(continued)
for the six months ended June 30, 2019 (unaudited)
Franklin Mutual Global Discovery Fund
Securities sold short | (32,329,071 | ) | ||
|
| |||
Net change in unrealized appreciation (depreciation) | 1,687,863,791 | |||
|
| |||
Net realized and unrealized gain (loss) | 2,009,585,239 | |||
|
| |||
Net increase (decrease) in net assets resulting from operations | $2,211,575,703 | |||
|
| |||
*Foreign taxes withheld on dividends | $ | 16,135,082 |
| franklintempleton.com | The accompanying notes are an integral part of these financial statements. | Semiannual Report | 27 | ||||
FRANKLIN MUTUAL SERIES FUNDS
FINANCIAL STATEMENTS
Statements of Changes in Net Assets
Franklin Mutual Global Discovery Fund
| Six Months Ended June 30, 2019 (unaudited) | Year Ended December 31, 2018 | |||||||
Increase (decrease) in net assets: | ||||||||
Operations: | ||||||||
Net investment income | $ 201,990,464 | $ 315,277,410 | ||||||
Net realized gain (loss) | 321,721,448 | 1,263,045,185 | ||||||
Net change in unrealized appreciation (depreciation) | 1,687,863,791 | (3,569,979,292 | ) | |||||
|
| |||||||
Net increase (decrease) in net assets resulting from operations | 2,211,575,703 | (1,991,656,697 | ) | |||||
|
| |||||||
Distributions to shareholders: | ||||||||
Class Z | — | (374,006,499 | ) | |||||
Class A | — | (521,977,539 | ) | |||||
Class C | — | (57,992,699 | ) | |||||
Class R | — | (18,330,147 | ) | |||||
Class R6 | — | (102,685,299 | ) | |||||
|
| |||||||
Total distributions to shareholders | — | (1,074,992,183 | ) | |||||
|
| |||||||
Capital share transactions: (Note 2) | ||||||||
Class Z | (571,033,565 | ) | (1,016,045,824 | ) | ||||
Class A | (755,125,504 | ) | (656,381,733 | ) | ||||
Class C | (195,708,750 | ) | (1,164,168,030 | ) | ||||
Class R | (37,586,690 | ) | (70,948,671 | ) | ||||
Class R6 | (229,877,303 | ) | (526,328,702 | ) | ||||
|
| |||||||
Total capital share transactions | (1,789,331,812 | ) | (3,433,872,960 | ) | ||||
|
| |||||||
Net increase (decrease) in net assets | 422,243,891 | (6,500,521,840 | ) | |||||
Net assets: | ||||||||
Beginning of period | 15,323,029,231 | 21,823,551,071 | ||||||
|
| |||||||
End of period | $15,745,273,122 | $15,323,029,231 | ||||||
|
| |||||||
28 |
Semiannual Report | The accompanying notes are an integral part of these financial statements. |
franklintempleton.com | ||
FRANKLIN MUTUAL SERIES FUNDS
Notes to Financial Statements (unaudited)
Franklin Mutual Global Discovery Fund
1. Organization and Significant Accounting Policies
Franklin Mutual Series Funds (Trust) is registered under the Investment Company Act of 1940 (1940 Act) as anopen-end management investment company, consisting of seven separate funds and applies the specialized accounting and reporting guidance in U.S. Generally Accepted Accounting Principles (U.S. GAAP). Franklin Mutual Global Discovery Fund (Fund) is included in this report. The Fund offers five classes of shares: Class Z, Class A, Class C, Class R and Class R6. Class C shares automatically convert to Class A shares after they have been held for 10 years. Each class of shares may differ by its initial sales load, contingent deferred sales charges, voting rights on matters affecting a single class, its exchange privilege and fees due to differing arrangements for distribution and transfer agent fees.
The following summarizes the Fund’s significant accounting policies.
a. Financial Instrument Valuation
The Fund’s investments in financial instruments are carried at fair value daily. Fair value is the price that would be received to sell an asset or paid to transfer a liability in an orderly transaction between market participants on the measurement date. The Fund calculates the net asset value (NAV) per share each business day as of 4 p.m. Eastern time or the regularly scheduled close of the New York Stock Exchange (NYSE), whichever is earlier. Under compliance policies and procedures approved by the Trust’s Board of Trustees (the Board), the Fund’s administrator has responsibility for oversight of valuation, including leading the cross-functional Valuation Committee (VC). The Fund may utilize independent pricing services, quotations from securities and financial instrument dealers, and other market sources to determine fair value.
Equity securities and derivative financial instruments listed on an exchange or on the NASDAQ National Market System are valued at the last quoted sale price or the official closing price of the day, respectively. Foreign equity securities are valued as of the close of trading on the foreign stock exchange on which the security is primarily traded, or as of 4 p.m. Eastern time. The value is then converted into its U.S. dollar equivalent at the foreign exchange rate in effect at 4 p.m. Eastern time on the day that the value of the security is determined.Over-the-counter (OTC) securities are valued within the range of the most recent quoted bid and ask prices. Securities that trade in multiple markets or on multiple
exchanges are valued according to the broadest and most representative market. Certain equity securities are valued based upon fundamental characteristics or relationships to similar securities.
Debt securities generally trade in the OTC market rather than on a securities exchange. The Fund’s pricing services use multiple valuation techniques to determine fair value. In instances where sufficient market activity exists, the pricing services may utilize a market-based approach through which quotes from market makers are used to determine fair value. In instances where sufficient market activity may not exist or is limited, the pricing services also utilize proprietary valuation models which may consider market characteristics such as benchmark yield curves, credit spreads, estimated default rates, anticipated market interest rate volatility, coupon rates, anticipated timing of principal repayments, underlying collateral, and other unique security features in order to estimate the relevant cash flows, which are then discounted to calculate the fair value.
Investments inopen-end mutual funds are valued at the closing NAV.
Certain derivative financial instruments trade in the OTC market. The Fund’s pricing services use various techniques including industry standard option pricing models and proprietary discounted cash flow models to determine the fair value of those instruments. The Fund’s net benefit or obligation under the derivative contract, as measured by the fair value of the contract, is included in net assets.
The Fund has procedures to determine the fair value of financial instruments for which market prices are not reliable or readily available. Under these procedures, the Fund primarily employs a market-based approach which may use related or comparable assets or liabilities, recent transactions, market multiples, book values, and other relevant information for the investment to determine the fair value of the investment. An income-based valuation approach may also be used in which the anticipated future cash flows of the investment are discounted to calculate fair value. Discounts may also be applied due to the nature or duration of any restrictions on the disposition of the investments. Due to the inherent uncertainty of valuations of such investments, the fair values may differ significantly from the values that would have been used had an active market existed.
franklintempleton.com |
Semiannual Report |
|
29 |
| ||
FRANKLIN MUTUAL SERIES FUNDS
NOTES TO FINANCIAL STATEMENTS (UNAUDITED)
Franklin Mutual Global Discovery Fund(continued)
1. Organization and Significant Accounting Policies (continued)
a. Financial Instrument Valuation(continued)
Trading in securities on foreign securities stock exchanges and OTC markets may be completed before 4 p.m. Eastern time. In addition, trading in certain foreign markets may not take place on every Fund’s business day. Occasionally, events occur between the time at which trading in a foreign security is completed and 4 p.m. Eastern time that might call into question the reliability of the value of a portfolio security held by the Fund. As a result, differences may arise between the value of the Fund’s portfolio securities as determined at the foreign market close and the latest indications of value at 4 p.m. Eastern time. In order to minimize the potential for these differences, the VC monitors price movements following the close of trading in foreign stock markets through a series of country specific market proxies (such as baskets of American Depositary Receipts, futures contracts and exchange traded funds). These price movements are measured against established trigger thresholds for each specific market proxy to assist in determining if an event has occurred that may call into question the reliability of the values of the foreign securities held by the Fund. If such an event occurs, the securities may be valued using fair value procedures, which may include the use of independent pricing services.
When the last day of the reporting period is anon-business day, certain foreign markets may be open on those days that the Fund’s NAV is not calculated, which could result in differences between the value of the Fund’s portfolio securities on the last business day and the last calendar day of the reporting period. Any significant security valuation changes due to an open foreign market are adjusted and reflected by the Fund for financial reporting purposes.
b. Foreign Currency Translation
Portfolio securities and other assets and liabilities denominated in foreign currencies are translated into U.S. dollars based on the exchange rate of such currencies against U.S. dollars on the date of valuation. The Fund may enter into foreign currency exchange contracts to facilitate transactions denominated in a foreign currency. Purchases and sales of securities, income and expense items denominated in foreign currencies are translated into U.S. dollars at the exchange rate in effect on the transaction date. Portfolio securities and assets and liabilities denominated in
foreign currencies contain risks that those currencies will decline in value relative to the U.S. dollar. Occasionally, events may impact the availability or reliability of foreign exchange rates used to convert the U.S. dollar equivalent value. If such an event occurs, the foreign exchange rate will be valued at fair value using procedures established and approved by the Board.
The Fund does not separately report the effect of changes in foreign exchange rates from changes in market prices on securities held. Such changes are included in net realized and unrealized gain or loss from investments in the Statement of Operations.
Realized foreign exchange gains or losses arise from sales of foreign currencies, currency gains or losses realized between the trade and settlement dates on securities transactions and the difference between the recorded amounts of dividends, interest, and foreign withholding taxes and the U.S. dollar equivalent of the amounts actually received or paid. Net unrealized foreign exchange gains and losses arise from changes in foreign exchange rates on foreign denominated assets and liabilities other than investments in securities held at the end of the reporting period.
c. Derivative Financial Instruments
The Fund invested in derivative financial instruments in order to manage risk or gain exposure to various other investments or markets. Derivatives are financial contracts based on an underlying or notional amount, require no initial investment or an initial net investment that is smaller than would normally be required to have a similar response to changes in market factors, and require or permit net settlement. Derivatives contain various risks including the potential inability of the counterparty to fulfill their obligations under the terms of the contract, the potential for an illiquid secondary market, and/or the potential for market movements which expose the Fund to gains or losses in excess of the amounts shown in the Statement of Assets and Liabilities. Realized gain and loss and unrealized appreciation and depreciation on these contracts for the period are included in the Statement of Operations.
Derivative counterparty credit risk is managed through a formal evaluation of the creditworthiness of all potential counterparties. The Fund attempts to reduce its exposure to counterparty credit risk on OTC derivatives, whenever possible, by entering into International Swaps and Derivatives Association (ISDA) master agreements with certain
30 |
Semiannual Report |
franklintempleton.com | ||
FRANKLIN MUTUAL SERIES FUNDS
NOTES TO FINANCIAL STATEMENTS (UNAUDITED)
Franklin Mutual Global Discovery Fund(continued)
counterparties. These agreements contain various provisions, including but not limited to collateral requirements, events of default, or early termination. Termination events applicable to the counterparty include certain deteriorations in the credit quality of the counterparty. Termination events applicable to the Fund include failure of the Fund to maintain certain net asset levels and/or limit the decline in net assets over various periods of time. In the event of default or early termination, the ISDA master agreement gives thenon-defaulting party the right to net andclose-out all transactions traded, whether or not arising under the ISDA agreement, to one net amount payable by one counterparty to the other. However, absent an event of default or early termination, OTC derivative assets and liabilities are presented gross and not offset in the Statement of Assets and Liabilities. Early termination by the counterparty may result in an immediate payment by the Fund of any net liability owed to that counterparty under the ISDA agreement. At June 30, 2019, the Fund had OTC derivatives in a net liability position of $3,046,303 and the aggregate value of collateral pledged for such contracts was $3,145,004.
Collateral requirements differ by type of derivative. Collateral or initial margin requirements are set by the broker or exchange clearing house for exchange traded and centrally cleared derivatives. Initial margin deposited is held at the exchange and can be in the form of cash and/or securities. For OTC derivatives traded under an ISDA master agreement, posting of collateral is required by either the Fund or the applicable counterparty if the total net exposure of all OTC derivatives with the applicable counterparty exceeds the minimum transfer amount, which typically ranges from $100,000 to $250,000, and can vary depending on the counterparty and the type of the agreement. Generally, collateral is determined at the close of Fund business each day and any additional collateral required due to changes in derivative values may be delivered by the Fund or the counterparty the next business day, or within a few business days. Collateral pledged and/or received by the Fund for OTC derivatives, if any, is held in segregated accounts with the Fund’s custodian/counterparty broker and can be in the form of cash and/or securities. Unrestricted cash may be invested according to the Fund’s investment objectives. To the extent that the amounts due to the Fund from its counterparties are not subject to collateralization or are not fully collateralized, the Fund bears the risk of loss from counterpartynon-performance.
At June 30, 2019, the Fund received $6,481,633 in U.K. Treasury Bonds and U.S. Treasury Bills, Bonds and Notes as collateral for derivatives.
The Fund entered into exchange traded futures contracts primarily to manage exposure to certain foreign currencies. A futures contract is an agreement between the Fund and a counterparty to buy or sell an asset at a specified price on a future date. Required initial margins are pledged by the Fund, and the daily change in fair value is accounted for as a variation margin payable or receivable in the Statement of Assets and Liabilities.
The Fund entered into OTC forward exchange contracts primarily to manage exposure to certain foreign currencies. A forward exchange contract is an agreement between the Fund and a counterparty to buy or sell a foreign currency at a specific exchange rate on a future date.
See Note 11 regarding other derivative information.
d. Securities Sold Short
The Fund is engaged in selling securities short, which obligates the Fund to replace a borrowed security with the same security at current fair value. The Fund incurs a loss if the price of the security increases between the date of the short sale and the date on which the Fund replaces the borrowed security. The Fund realizes a gain if the price of the security declines between those dates. Gains are limited to the price at which the Fund sold the security short, while losses are potentially unlimited in size.
The Fund is required to establish a margin account with the broker lending the security sold short. While the short sale is outstanding, the broker retains the proceeds of the short sale to the extent necessary to meet margin requirements until the short position is closed out. A deposit must also be maintained with the Fund’s custodian/counterparty broker consisting of cash and/or securities having a value equal to a specified percentage of the value of the securities sold short. The Fund is obligated to pay fees for borrowing the securities sold short and is required to pay the counterparty any dividends and/or interest due on securities sold short. Such dividends and/or interest and any security borrowing fees are recorded as an expense to the Fund.
franklintempleton.com |
Semiannual Report |
|
31 |
| ||
FRANKLIN MUTUAL SERIES FUNDS
NOTES TO FINANCIAL STATEMENTS (UNAUDITED)
Franklin Mutual Global Discovery Fund(continued)
1. Organization and Significant Accounting Policies (continued)
e. Securities Lending
The Fund participates in an agency based securities lending program to earn additional income. The Fund receives cash collateral against the loaned securities in an amount equal to at least 102% of the fair value of the loaned securities. Collateral is maintained over the life of the loan in an amount not less than 100% of the fair value of loaned securities, as determined at the close of Fund business each day; any additional collateral required due to changes in security values is delivered to the Fund on the next business day. The collateral is deposited into a joint cash account with other funds and is used to invest in a money market fund managed by Franklin Advisers, Inc., an affiliate of the Fund, and/or a joint repurchase agreement. The Fund may receive income from the investment of cash collateral, in addition to lending fees and rebates paid by the borrower. Income from securities loaned, net of fees paid to the securities lending agent and/or third-party vendor, is reported separately in the Statement of Operations. The Fund bears the market risk with respect to the collateral investment, securities loaned, and the risk that the agent may default on its obligations to the Fund. If the borrower defaults on its obligation to return the securities loaned, the Fund has the right to repurchase the securities in the open market using the collateral received. The securities lending agent has agreed to indemnify the Fund in the event of default by a third party borrower. At June 30, 2019, the Fund had no securities on loan.
f. Income and Deferred Taxes
It is the Fund’s policy to qualify as a regulated investment company under the Internal Revenue Code. The Fund intends to distribute to shareholders substantially all of its taxable income and net realized gains to relieve it from federal income and excise taxes. As a result, no provision for U.S. federal income taxes is required.
The Fund may be subject to foreign taxation related to income received, capital gains on the sale of securities and certain foreign currency transactions in the foreign jurisdictions in which it invests. Foreign taxes, if any, are recorded based on the tax regulations and rates that exist in the foreign markets in which the Fund invests. When a capital
gain tax is determined to apply, the Fund records an estimated deferred tax liability in an amount that would be payable if the securities were disposed of on the valuation date.
As a result of several court cases, in certain countries across the European Union, the Fund filed additional tax reclaims for previously withheld taxes on dividends earned in those countries (EU reclaims). These additional filings are subject to various administrative proceedings by the local jurisdictions’ tax authorities within the European Union, as well as a number of related judicial proceedings. Income recognized, if any, for EU reclaims is reflected as other income in the Statement of Operations and any related receivable, if any, is reflected as European Union tax reclaims in the Statement of Assets and Liabilities. When uncertainty exists as to the ultimate resolution of these proceedings, the likelihood of receipt of these EU reclaims, and the potential timing of payment, no amounts are reflected in the financial statements. For U.S. income tax purposes, EU reclaims received by the Fund, if any, reduce the amounts of foreign taxes Fund shareholders can use as tax credits in their individual income tax returns.
The Fund may recognize an income tax liability related to its uncertain tax positions under U.S. GAAP when the uncertain tax position has a less than 50% probability that it will be sustained upon examination by the tax authorities based on its technical merits. As of June 30, 2019, the Fund has determined that no tax liability is required in its financial statements related to uncertain tax positions for any open tax years (or expected to be taken in future tax years). Open tax years are those that remain subject to examination and are based on the statute of limitations in each jurisdiction in which the Fund invests.
g. Security Transactions, Investment Income, Expenses and Distributions
Security transactions are accounted for on trade date. Realized gains and losses on security transactions are determined on a specific identification basis. Interest income and estimated expenses are accrued daily. Amortization of premium and accretion of discount on debt securities are included in interest income. Dividend income and dividends declared on securities sold short are recorded on theex-dividend date except for certain dividends from securities where the dividend rate is not available. In such cases, the dividend is recorded as soon as the information is received by
32 |
Semiannual Report |
franklintempleton.com | ||
FRANKLIN MUTUAL SERIES FUNDS
NOTES TO FINANCIAL STATEMENTS (UNAUDITED)
Franklin Mutual Global Discovery Fund(continued)
the Fund. Distributions to shareholders are recorded on theex-dividend date. Distributable earnings are determined according to income tax regulations (tax basis) and may differ from earnings recorded in accordance with U.S. GAAP. These differences may be permanent or temporary. Permanent differences are reclassified among capital accounts to reflect their tax character. These reclassifications have no impact on net assets or the results of operations. Temporary differences are not reclassified, as they may reverse in subsequent periods.
Common expenses incurred by the Trust are allocated among the Funds based on the ratio of net assets of each Fund to the combined net assets of the Trust or based on the ratio of number of shareholders of each Fund to the combined number of shareholders of the Trust. Fund specific expenses are charged directly to the Fund that incurred the expense.
Realized and unrealized gains and losses and net investment income, excluding class specific expenses, are allocated daily to each class of shares based upon the relative proportion of net assets of each class. Differences in per share distributions by class are generally due to differences in class specific expenses.
h. Accounting Estimates
The preparation of financial statements in accordance with U.S. GAAP requires management to make estimates and assumptions that affect the reported amounts of assets and liabilities at the date of the financial statements and the amounts of income and expenses during the reporting period. Actual results could differ from those estimates.
i. Guarantees and Indemnifications
Under the Trust’s organizational documents, its officers and trustees are indemnified by the Trust against certain liabilities arising out of the performance of their duties to the Trust. Additionally, in the normal course of business, the Trust, on behalf of the Fund, enters into contracts with service providers that contain general indemnification clauses. The Trust’s maximum exposure under these arrangements is unknown as this would involve future claims that may be made against the Trust that have not yet occurred. Currently, the Trust expects the risk of loss to be remote.
2. Shares of Beneficial Interest
At June 30, 2019, there were an unlimited number of shares authorized (without par value). Transactions in the Fund’s shares were as follows:
| Six Months Ended June 30, 2019 | Year Ended December 31, 2018 | |||||||||||||||
| Shares | Amount | Shares | Amount | |||||||||||||
| Class Z Shares: | ||||||||||||||||
| Shares sold | 7,186,674 | $ | 211,987,070 | 23,075,260 | $ | 743,381,791 | ||||||||||
| Shares issued in reinvestment of distributions | — | — | 12,874,929 | 339,549,151 | ||||||||||||
| Shares redeemed | (26,416,620 | ) | (783,020,635 | ) | (66,928,248 | ) | (2,098,976,766) | |||||||||
|
| |||||||||||||||
Net increase (decrease) | (19,229,946 | ) | $ | (571,033,565 | ) | (30,978,059 | ) | $ | (1,016,045,824) | |||||||
|
| |||||||||||||||
| Class A Shares: | ||||||||||||||||
| Shares solda | 8,838,914 | $ | 255,893,303 | 39,540,409 | $ | 1,238,132,295 | ||||||||||
| Shares issued in reinvestment of distributions | — | — | 19,765,773 | 510,690,925 | ||||||||||||
| Shares redeemed | (34,755,848 | ) | (1,011,018,807 | ) | (77,371,791 | ) | (2,405,204,953) | |||||||||
|
| |||||||||||||||
Net increase (decrease) | (25,916,934 | ) | $ | (755,125,504 | ) | (18,065,609 | ) | $ | (656,381,733) | |||||||
|
| |||||||||||||||
franklintempleton.com |
Semiannual Report |
|
33 |
| ||
FRANKLIN MUTUAL SERIES FUNDS
NOTES TO FINANCIAL STATEMENTS (UNAUDITED)
Franklin Mutual Global Discovery Fund(continued)
2. Shares of Beneficial Interest(continued)
| Six Months Ended June 30, 2019 | Year Ended December 31, 2018 | |||||||||||||||
| Shares | Amount | Shares | Amount | |||||||||||||
| Class C Shares: | ||||||||||||||||
| Shares sold | 984,501 | $ | 28,413,958 | 3,686,938 | $ | 114,177,734 | ||||||||||
| Shares issued in reinvestment of distributions | — | — | 2,158,214 | 55,791,403 | ||||||||||||
| Shares redeemeda | (7,753,147 | ) | (224,122,708 | ) | (43,253,998 | ) | (1,334,137,167) | |||||||||
|
| |||||||||||||||
| Net increase (decrease) | (6,768,646 | ) | $ | (195,708,750 | ) | (37,408,846 | ) | $ | (1,164,168,030) | |||||||
|
| |||||||||||||||
| Class R Shares: | ||||||||||||||||
| Shares sold | 404,541 | $ | 11,571,192 | 952,638 | $ | 29,475,566 | ||||||||||
| Shares issued in reinvestment of distributions | — | — | 699,971 | 17,846,355 | ||||||||||||
| Shares redeemed | (1,719,550 | ) | (49,157,882 | ) | (3,807,349 | ) | (118,270,592) | |||||||||
|
| |||||||||||||||
| Net increase (decrease) | (1,315,009 | ) | $ | (37,586,690 | ) | (2,154,740 | ) | $ | (70,948,671) | |||||||
|
| |||||||||||||||
| Class R6 Shares: | ||||||||||||||||
| Shares sold | 3,186,991 | $ | 94,013,514 | 12,000,653 | $ | 384,806,245 | ||||||||||
| Shares issued in reinvestment of distributions | — | — | 3,572,465 | 94,139,840 | ||||||||||||
| Shares redeemed | (10,960,576 | ) | (323,890,817 | ) | (31,266,192 | ) | (1,005,274,787) | |||||||||
|
| |||||||||||||||
Net increase (decrease) | (7,773,585 | ) | $ | (229,877,303 | ) | (15,693,074 | ) | $ | (526,328,702) | |||||||
|
| |||||||||||||||
aMay include a portion of Class C shares that were automatically converted to Class A.
3. Transactions with Affiliates
Franklin Resources, Inc. is the holding company for various subsidiaries that together are referred to as Franklin Templeton. Certain officers and trustees of the Fund are also officers and/or directors of the following subsidiaries:
| Subsidiary | Affiliation | |
Franklin Mutual Advisers, LLC (Franklin Mutual) | Investment manager | |
Franklin Templeton Services, LLC (FT Services) | Administrative manager | |
Franklin Templeton Distributors, Inc. (Distributors) | Principal underwriter | |
Franklin Templeton Investor Services, LLC (Investor Services) | Transfer agent | |
34 |
Semiannual Report |
franklintempleton.com | ||
FRANKLIN MUTUAL SERIES FUNDS
NOTES TO FINANCIAL STATEMENTS (UNAUDITED)
Franklin Mutual Global Discovery Fund(continued)
a. Management Fees
The Fund pays an investment management fee to Franklin Mutual based on the average daily net assets of the Fund as follows:
| Annualized Fee Rate | Net Assets | |
0.875% | Up to and including $4 billion | |
0.845% | Over $4 billion, up to and including $7 billion | |
0.825% | Over $7 billion, up to and including $10 billion | |
0.805% | Over $10 billion, up to and including $13 billion | |
0.785% | Over $13 billion, up to and including $16 billion | |
0.765% | Over $16 billion, up to and including $19 billion | |
0.745% | Over $19 billion, up to and including $22 billion | |
0.725% | Over $22 billion, up to and including $25 billion | |
0.705% | Over $25 billion, up to and including $28 billion | |
0.685% | In excess of $28 billion | |
For the period ended June 30, 2019, the annualized gross effective investment management fee rate was 0.830% of the Fund’s average daily net assets.
b. Administrative Fees
Under an agreement with Franklin Mutual, FT Services provides administrative services to the Fund. The fee is paid by Franklin Mutual based on the Fund’s average daily net assets, and is not an additional expense of the Fund.
c. Distribution Fees
The Board has adopted distribution plans for each share class, with the exception of Class Z and Class R6 shares, pursuant to Rule12b-1 under the 1940 Act. Under the Fund’s Class A reimbursement distribution plan, the Fund reimburses Distributors for costs incurred in connection with the servicing, sale and distribution of the Fund’s shares up to the maximum annual plan rate. Under the Class A reimbursement distribution plan, costs exceeding the maximum for the current plan year cannot be reimbursed in subsequent periods. In addition, under the Fund’s Class C and R compensation distribution plans, the Fund pays Distributors for costs incurred in connection with the servicing, sale and distribution of the Fund’s shares up to the maximum annual plan rate for each class. The plan year, for purposes of monitoring compliance with the maximum annual plan rates, is February 1 through January 31.
The maximum annual plan rates, based on the average daily net assets, for each class, are as follows:
Class A | 0.35% | |||
Class C | 1.00% | |||
Class R | 0.50% |
The Board has set the current rate at 0.25% per year for Class A shares until further notice and approval by the Board.
franklintempleton.com |
Semiannual Report |
|
35 |
| ||
FRANKLIN MUTUAL SERIES FUNDS
NOTES TO FINANCIAL STATEMENTS (UNAUDITED)
Franklin Mutual Global Discovery Fund(continued)
3. Transactions with Affiliates(continued)
d. Sales Charges/Underwriting Agreements
Front-end sales charges and contingent deferred sales charges (CDSC) do not represent expenses of the Fund. These charges are deducted from the proceeds of sales of Fund shares prior to investment or from redemption proceeds prior to remittance, as applicable. Distributors has advised the Fund of the following commission transactions related to the sales and redemptions of the Fund’s shares for the period:
Sales charges retained net of commissions paid to unaffiliated brokers/dealers | $ | 295,031 | ||
CDSC retained | $ | 25,366 |
e. Transfer Agent Fees
Each class of shares pays transfer agent fees to Investor Services for its performance of shareholder servicing obligations. The fees are based on an annualized asset based fee of 0.02% plus a transaction based fee. In addition, each class reimburses Investor Services for out of pocket expenses incurred and, except for Class R6 reimburses shareholder servicing fees paid to third parties. These fees are allocated daily based upon their relative proportion of such classes’ aggregate net assets. Class R6 pays Investor Services transfer agent fees specific to that class.
For the period ended June 30, 2019, the Fund paid transfer agent fees of $9,824,954, of which $3,917,444 was retained by Investor Services.
f. Investments in Affiliated Management Investment Companies
The Fund invests in one or more affiliated management investment companies for purposes other than exercising a controlling influence over the management or policies. Management fees paid by the Fund are waived on assets invested in the affiliated management investment companies, as noted in the Statement of Operations, in an amount not to exceed the management and administrative fees paid directly or indirectly by each affiliate. During the period ended June 30, 2019, the Fund held investments in affiliated management investment companies as follows:
| Value at Beginning of Period | Purchases | Sales | Realized Gain (Loss) | Net Change in Unrealized Appreciation (Depreciation) | Value at End of Period | Number of Shares Held at End of Period | Income from securities loaned | |||||||||||||||||||||||||
| Non-Controlled Affiliates | ||||||||||||||||||||||||||||||||
Institutional Fiduciary Trust Money Market Portfolio, 2.05% | $ — | $200,368,000 | $(200,368,000 | ) | $ — | $ — | $ — | — | $82,368 | |||||||||||||||||||||||
|
|
|
| |||||||||||||||||||||||||||||
g. Waiver and Expense Reimbursements
Investor Services has contractually agreed in advance to waive or limit its fees so that the Class R6 transfer agent fees do not exceed 0.02% based on the average net assets of the class until April 30, 2020.
h. Interfund Transactions
The Fund engaged in purchases and sales of investments with funds or other accounts that have common investment managers (or affiliated investment managers), directors, trustees or officers. During the period ended June 30, 2019, these purchase and sale transactions aggregated $0 and $22,306,665, respectively.
36 |
Semiannual Report |
franklintempleton.com | ||
FRANKLIN MUTUAL SERIES FUNDS
NOTES TO FINANCIAL STATEMENTS (UNAUDITED)
Franklin Mutual Global Discovery Fund(continued)
4. Expense Offset Arrangement
The Fund has entered into an arrangement with its custodian whereby credits realized as a result of uninvested cash balances are used to reduce a portion of the Fund’s custodian expenses. During the period ended June 30, 2019, the custodian fees were reduced as noted in the Statement of Operations.
5. Independent Trustees’ Retirement Plan
On January 1, 1993, the Trust adopted an Independent Trustees’ Retirement Plan (Plan). The Plan is an unfunded defined benefit plan that provides benefit payments to Trustees whose length of service and retirement age meets the eligibility requirements of the Plan. Benefits under the Plan are based on years of service and fees paid to each trustee at the time of retirement. Effective in December 1996, the Plan was closed to new participants.
During the period ended June 30, 2019, the Fund’s projected benefit obligation and benefit payments under the Plan were as follows:
aProjected benefit obligation at June 30, 2019 | $ | 1,193,854 | ||
bIncrease in projected benefit obligation | $ | 148,924 | ||
Benefit payments made to retired trustees | $ | (10,152 | ) |
aThe projected benefit obligation is included in trustees’ fees and expenses in the Statement of Assets and Liabilities.
bThe increase in projected benefit obligation is included in trustees’ fees and expenses in the Statement of Operations.
6. Income Taxes
For tax purposes, the Fund may elect to defer any portion of a post-October capital loss or late-year ordinary loss to the first day of the following fiscal year. At December 31, 2018, the Fund deferred post-October capital losses of $7,188,295.
At June 30, 2019, the cost of investments and net unrealized appreciation (depreciation) for income tax purposes were as follows:
Cost of investments | $ | 13,187,506,743 | ||
|
| |||
Unrealized appreciation | $ | 3,692,034,392 | ||
Unrealized depreciation | (1,305,576,753) | |||
|
| |||
Net unrealized appreciation (depreciation) | $ | 2,386,457,639 | ||
|
| |||
Differences between income and/or capital gains as determined on a book basis and a tax basis are primarily due to differing treatment of foreign currency transactions.
7. Investment Transactions
Purchases and sales of investments (excluding short term securities and securities sold short) for the period ended June 30, 2019, aggregated $976,363,393 and $2,849,058,832, respectively.
8. Credit Risk and Defaulted Securities
The Fund may purchase thepre-default or defaulted debt of distressed companies. Distressed companies are financially troubled and could be or are already involved in financial restructuring or bankruptcy. Risks associated with purchasing these securities include the possibility that the bankruptcy or other restructuring process takes longer than expected, or that
franklintempleton.com |
Semiannual Report |
|
37 |
| ||
FRANKLIN MUTUAL SERIES FUNDS
NOTES TO FINANCIAL STATEMENTS (UNAUDITED)
Franklin Mutual Global Discovery Fund(continued)
8. Credit Risk and Defaulted Securities(continued)
distributions in restructuring are less than anticipated, either or both of which may result in unfavorable consequences to the Fund. If it becomes probable that the income on debt securities, including those of distressed companies, will not be collected, the Fund discontinues accruing income and recognizes an adjustment for uncollectible interest.
At June 30, 2019, the aggregate long value of distressed company securities for which interest recognition has been discontinued was $22,572,351, representing 0.2% of the Fund’s net assets. For information as to specific securities, see the accompanying Statement of Investments.
9. Concentration of Risk
Investing in foreign securities may include certain risks and considerations not typically associated with investing in U.S. securities, such as fluctuating currency values and changing local and regional economic, political and social conditions, which may result in greater market volatility. Current political and financial uncertainty surrounding the European Union may increase market volatility and the economic risk of investing in securities in Europe. In addition, certain foreign securities may not be as liquid as U.S. securities.
10. Restricted Securities
The Fund invests in securities that are restricted under the Securities Act of 1933 (1933 Act). Restricted securities are often purchased in private placement transactions, and cannot be sold without prior registration unless the sale is pursuant to an exemption under the 1933 Act. Disposal of these securities may require greater effort and expense, and prompt sale at an acceptable price may be difficult. The Fund may have registration rights for restricted securities. The issuer generally incurs all registration costs.
At June 30, 2019, investments in restricted securities, excluding securities exempt from registration under the 1933 Act deemed to be liquid, were as follows:
| Principal Amount/ Shares/ Warrants | Issuer | Acquisition Date | Cost | Value | ||||||||||||
| 8,893 | Broadband Ventures III LLC, secured promissory note, 5.00%, 2/01/12 | 7/01/10 - 11/30/12 | $ | 8,893 | $ | — | ||||||||||
| 2,634,302 | iHeartMedia Inc., A | 1/03/11 - 12/19/13 | 61,719,548 | 38,237,647 | ||||||||||||
| 44,430 | iHeartMedia Inc., B | 1/03/11 - 12/19/13 | 1,038,264 | 644,914 | ||||||||||||
| 292 | iHeartMedia Inc., wts., A, 5/01/39 | 1/03/11 - 12/19/13 | 6,824 | 4,238 | ||||||||||||
| 3,819,425 | International Automotive Components Group Brazil LLC | 4/13/06 - 12/26/08 | 2,536,498 | 98,075 | ||||||||||||
|
| |||||||||||||||
Total Restricted Securities(Value is 0.2% of Net Assets) | $ | 65,310,027 | $ | 38,984,874 | ||||||||||||
|
| |||||||||||||||
38 |
Semiannual Report |
franklintempleton.com | ||
FRANKLIN MUTUAL SERIES FUNDS
NOTES TO FINANCIAL STATEMENTS (UNAUDITED)
Franklin Mutual Global Discovery Fund(continued)
11. Other Derivative Information
At June 30, 2019, investments in derivative contracts are reflected in the Statement of Assets and Liabilities as follows:
Asset Derivatives | Liability Derivatives | |||||||||||
| Derivative Contracts Not Accounted for as Hedging Instruments | Statement of Assets and Liabilities Location | Fair Value | Statement of Assets and Liabilities Location | Fair Value | ||||||||
| Foreign exchange contracts | Variation margin on futures contracts | $ | 389,473 | a | Variation margin on futures contracts | $ | 3,183,111 | a | ||||
Unrealized appreciation on OTC forward exchange contracts | 17,546,807 | Unrealized depreciation on OTC forward exchange contracts | 13,370,759 | |||||||||
|
|
|
| |||||||||
| Totals | $ | 17,936,280 | $ | 16,553,870 | ||||||||
|
|
|
| |||||||||
aThis amount reflects the cumulative appreciation (depreciation) of futures contracts as reported in the Statement of Investments. Only the variation margin receivable/ payable at period end is separately reported within the Statement of Assets and Liabilities. Prior variation margin movements were recorded to cash upon receipt or payment.
For the period ended June 30, 2019, the effect of derivative contracts in the Statement of Operations was as follows:
| Derivative Contracts Not Accounted for as Hedging Instruments | Statement of Operations Location | Net Realized Gain (Loss) for the Period | Statement of Operations Location | Net Change in Unrealized Appreciation (Depreciation) for the Period | ||||||||
Net realized gain (loss) from: | Net change in unrealized appreciation (depreciation) on: | |||||||||||
Foreign exchange contracts | Forward exchange contracts | $ 81,548,530 | Forward exchange contracts | $(28,091,977) | ||||||||
Futures contracts | 34,142,520 | Futures contracts | (3,779,815) | |||||||||
|
|
|
| |||||||||
| Totals | $115,691,050 | $(31,871,792) | ||||||||||
|
|
|
| |||||||||
For the period ended June 30, 2019, the average month end notional amount of futures contracts represented $1,494,620,235. The average month end contract value of forward exchange contracts was $2,328,641,318.
See Note 1(c) regarding derivative financial instruments.
12. Holdings of 5% Voting Securities of Portfolio Companies
The 1940 Act defines “affiliated companies” to include investments in portfolio companies in which a fund owns 5% or more of the outstanding voting securities. During the period ended June 30, 2019, investments in “affiliated companies” were as follows:
| Name of Issuer | Value at of Period | Purchases | Sales | Realized Gain (Loss) | Net Change in Unrealized Appreciation (Depreciation) | Value at End of Period | Number of Shares Held at End of Period | Dividend Income | ||||||||||||||||||||||||
| Non-Controlled Affiliates | ||||||||||||||||||||||||||||||||
International Automotive Components Group North America LLC (Value is —% of Net Assets) | $4,230,537 | $ — | $(5,288,170 | ) | $(23,807,201 | ) | $24,864,834 | $ — | — | $ — | ||||||||||||||||||||||
|
|
|
| |||||||||||||||||||||||||||||
franklintempleton.com |
Semiannual Report |
|
39 |
| ||
FRANKLIN MUTUAL SERIES FUNDS
NOTES TO FINANCIAL STATEMENTS (UNAUDITED)
Franklin Mutual Global Discovery Fund(continued)
13. Upcoming Acquisitions/Reorganization
On July 16, 2019, the Board approved a proposal to reorganize Franklin Mutual International Fund with and into the Fund subject to approval by the shareholders of Franklin Mutual International Fund.
14. Credit Facility
The Fund, together with other U.S. registered and foreign investment funds (collectively, Borrowers), managed by Franklin Templeton, are borrowers in a joint syndicated senior unsecured credit facility totaling $2 billion (Global Credit Facility) which matures on February 7, 2020. This Global Credit Facility provides a source of funds to the Borrowers for temporary and emergency purposes, including the ability to meet future unanticipated or unusually large redemption requests.
Under the terms of the Global Credit Facility, the Fund shall, in addition to interest charged on any borrowings made by the Fund and other costs incurred by the Fund, pay its share of fees and expenses incurred in connection with the implementation and maintenance of the Global Credit Facility, based upon its relative share of the aggregate net assets of all of the Borrowers, including an annual commitment fee of 0.15% based upon the unused portion of the Global Credit Facility. These fees are reflected in other expenses in the Statement of Operations. During the period ended June 30, 2019, the Fund did not use the Global Credit Facility.
15. Fair Value Measurements
The Fund follows a fair value hierarchy that distinguishes between market data obtained from independent sources (observable inputs) and the Fund’s own market assumptions (unobservable inputs). These inputs are used in determining the value of the Fund’s financial instruments and are summarized in the following fair value hierarchy:
| • | Level 1 – quoted prices in active markets for identical financial instruments |
| • | Level 2 – other significant observable inputs (including quoted prices for similar financial instruments, interest rates, prepayment speed, credit risk, etc.) |
| • | Level 3 – significant unobservable inputs (including the Fund’s own assumptions in determining the fair value of financial instruments) |
The input levels are not necessarily an indication of the risk or liquidity associated with financial instruments at that level.
40 |
Semiannual Report |
franklintempleton.com | ||
FRANKLIN MUTUAL SERIES FUNDS
NOTES TO FINANCIAL STATEMENTS (UNAUDITED)
Franklin Mutual Global Discovery Fund(continued)
A summary of inputs used as of June 30, 2019, in valuing the Fund’s assets and liabilities carried at fair value, is as follows:
| Level 1 | Level 2 | Level 3 | Total | |||||||||||||
| Assets: | ||||||||||||||||
Investments in Securities:a | ||||||||||||||||
Equity Investments:b | ||||||||||||||||
Auto Components | $ | 58,440,290 | $ | — | $ | 98,075 | $ | 58,538,365 | ||||||||
Chemicals | 214,135,435 | — | 2,540,230 | 216,675,665 | ||||||||||||
Machinery | 59,505,276 | 75,236,622 | — | 134,741,898 | ||||||||||||
Media | 764,134,199 | 3,962,774 | 38,886,799 | 806,983,772 | ||||||||||||
All Other Equity Investments | 13,724,218,853 | — | — | 13,724,218,853 | ||||||||||||
Corporate Notes | — | 163,700,213 | — | 163,700,213 | ||||||||||||
Corporate Bonds and Notes in Reorganization | — | 22,572,351 | — | c | 22,572,351 | |||||||||||
Companies in Liquidation | — | 213,489 | — | c | 213,489 | |||||||||||
Short Term Investments | 417,709,064 | 68,100,000 | — | 485,809,064 | ||||||||||||
|
| |||||||||||||||
Total Investments in Securities | $ | 15,238,143,117 | $ | 333,785,449 | $ | 41,525,104 | $ | 15,613,453,670 | ||||||||
|
| |||||||||||||||
Other Financial Instruments: | ||||||||||||||||
Futures Contracts | $ | 389,473 | $ | — | $ | — | $ | 389,473 | ||||||||
Forward Exchange Contracts | — | 17,546,807 | — | 17,546,807 | ||||||||||||
|
| |||||||||||||||
Total Other Financial Instruments | $ | 389,473 | $ | 17,546,807 | $ | — | $ | 17,936,280 | ||||||||
|
| |||||||||||||||
| Liabilities: | ||||||||||||||||
Other Financial Instruments: | ||||||||||||||||
Securities Sold Shorta | $ | 40,901,165 | $ | — | $ | — | $ | 40,901,165 | ||||||||
Futures Contracts | 3,183,111 | — | — | 3,183,111 | ||||||||||||
Forward Exchange Contracts | — | 13,370,759 | — | 13,370,759 | ||||||||||||
|
| |||||||||||||||
Total Other Financial Instruments | $ | 44,084,276 | $ | 13,370,759 | $ | — | $ | 57,455,035 | ||||||||
|
| |||||||||||||||
aFor detailed categories, see the accompanying Statement of Investments.
bIncludes common and preferred stocks as well as other equity interests.
cIncludes securities determined to have no value at June 30, 2019.
A reconciliation of assets in which Level 3 inputs are used in determining fair value is presented when there are significant Level 3 financial instruments at the beginning and/or end of the period.
16. New Accounting Pronouncements
In August 2018, the Financial Accounting Standards Board issued Accounting Standards Update (ASU)No. 2018-14, Compensation—Retirement Benefits—Defined Benefit Plans—General (Subtopic715-20): Disclosure Framework—Changes to the Disclosure Requirements for Defined Benefit Plans. The amendments in the ASU modify the disclosure requirements for employers that sponsor defined benefit pension or other postretirement plans. The ASU is effective for annual reporting periods ending after December 15, 2020. Management has reviewed the requirements and believes the adoption of this ASU will not have a material impact on the financial statements.
17. Subsequent Events
The Fund has evaluated subsequent events through the issuance of the financial statements and determined that no events have occurred that require disclosure other than those already disclosed in the financial statements.
franklintempleton.com |
Semiannual Report |
|
41 |
| ||
FRANKLIN MUTUAL SERIES FUNDS
NOTES TO FINANCIAL STATEMENTS (UNAUDITED)
Franklin Mutual Global Discovery Fund(continued)
Abbreviations
| Counterparty | Currency | Selected Portfolio | ||||||||
| BOFA | Bank of America Corp. | EUR | Euro | ADR | American Depositary Receipt | |||||
| BONY | The Bank of New York Mellon Corp. | GBP | British Pound | FHLB | Federal Home Loan Bank | |||||
| HSBK | HSBC Bank PLC | USD | United States Dollar | |||||||
| SSBT | State Street Bank and Trust Co., N.A. | |||||||||
| UBSW | UBS AG | |||||||||
| 42 | Semiannual Report | franklintempleton.com | ||
FRANKLIN MUTUAL SERIES FUNDS
FRANKLIN MUTUAL GLOBAL DISCOVERY FUND
Board Approval of Investment
Management Agreements
FRANKLIN MUTUAL SERIES FUNDS
Franklin Mutual Global Discovery Fund
(Fund)
The Board of Trustees (Board), including a majority of trustees that are not “interested persons” as such term is defined in section 2(a)(19) of the Investment Company Act of 1940 (hereinafter referred to as “independent trustees”), at anin-person meeting held on May 22, 2019, unanimously approved the renewal of the Fund’s investment management agreement. Prior to a meeting of all of the trustees for the purpose of considering such renewal, the independent trustees participated in two other meetings held in connection with the renewal process. Throughout the process, the independent trustees received assistance and advice from and met separately with independent counsel. The independent trustees met with and interviewed officers of the investment manager (including portfolio managers), the transfer agent and shareholder services group and the distributor. In approving the renewal of the investment management agreement for the Fund, the Board, including the independent trustees, determined that the investment management fee structure was fair and reasonable and that continuance of the agreement was in the best interests of the Fund and its shareholders.
In reaching their decision on the investment management agreement, the trustees took into account information furnished throughout the year at regular Board meetings, as well as information specifically requested and furnished for the renewal process, which culminated in the meetings referred to above for the specific purpose of considering such agreement. Information furnished throughout the year included, among others, reports on the Fund’s investment performance, expenses, portfolio composition, portfolio brokerage execution, client commission arrangements, derivatives, securities lending, asset segregation, portfolio turnover, Rule12b-1 plan, distribution, shareholder servicing, legal and compliance matters, pricing of securities, sales and redemptions, and marketing support payments made to financial intermediaries, as well as a third-party survey of transfer agent fees charged to funds within the Franklin Templeton Investments (FTI) complex in comparison with those charged to other fund complexes deemed comparable. Also, related financial statements and other information about the scope and quality of services provided by the investment manager and its affiliates and enhancements to
such services over the past year were provided. In addition, the trustees received periodic reports throughout the year and during the renewal process relating to compliance with the Fund’s investment policies and restrictions. During the renewal process, the independent trustees considered the investment manager’s methods of operation within the Franklin Templeton group and its activities on behalf of other clients. The Board also noted that it received an annual report on all payments made by FTI or the Fund to financial intermediaries engaged in the sale of Fund shares, as well as a memorandum relating to third-party servicing arrangements in response to a Guidance Update from the U.S. Securities and Exchange Commission (SEC) relating to mutual fund distribution andsub-accounting fees.
The information obtained by the trustees during the renewal process also included a special report prepared by Broadridge Financial Solutions, Inc., an independent third-party analyst that utilizes data from Lipper, Inc. (“Lipper”), comparing the Fund’s investment performance and expenses with those of other mutual funds deemed comparable to the Fund as selected by Lipper (Broadridge Section 15(c) Report). The trustees reviewed the Broadridge Section 15(c) Report and its usefulness in the renewal process with respect to matters such as comparative fees, expenses, expense ratios, performance and volatility. They concluded that the report continues to be a reliable resource in the performance of their duties.
In addition, the trustees received a Profitability Study (Profitability Study) prepared by management discussing the profitability to FTI from its overall U.S. fund operations, as well as on an individualfund-by-fund basis. Over the past year, the Board and counsel to the independent trustees continued to receive reports on management’s handling of recent regulatory inquiries and pending legal actions against the investment manager and its affiliates. The independent trustees were satisfied with the actions taken to date by management in response to such regulatory and legal matters.
The trustees reviewed the personnel, operations, financial condition, and investment management capabilities, methodologies and resources of the investment manager. As part of this review, particular attention was given to management’s diligent risk management program, including continual monitoring and management of cybersecurity, liquidity and counterparty credit risk, and attention given to derivatives and other complex instruments that are held and expected to be held by the Fund and how such instruments
| franklintempleton.com | Semiannual Report | 43 | ||||
FRANKLIN MUTUAL SERIES FUNDS
FRANKLIN MUTUAL GLOBAL DISCOVERY FUND
SHAREHOLDER INFORMATION
are used to carry out the Fund’s investment goal(s). The Board also took into account, among other things, management’s efforts in establishing a global credit facility for the benefit of the Fund and other accounts managed by FTI to provide a source of cash for temporary and emergency purposes or to meet unusual redemption requests as well as the strong financial position of the investment manager’s parent company and its commitment to the mutual fund business. The Board noted management’s continuing efforts and expenditures in establishing effective business continuity plans and developing strategies to address areas of heightened concern in the mutual fund industry, such as cybersecurity and liquidity risk management. The Board also recognized management’s commitment to facilitating Board oversight of particular areas, including derivatives and payments to intermediaries, by enhanced reporting.
In addition to the above and other matters considered by the trustees throughout the course of the year, the following discussion relates to certain primary factors relevant to the Board’s decision. This discussion of the information and factors considered by the Board (including the information and factors discussed above) is not intended to be exhaustive, but rather summarizes certain factors considered by the Board. In view of the wide variety of factors considered, the Board did not, unless otherwise noted, find it practicable to quantify or otherwise assign relative weights to the foregoing factors. In addition, individual trustees may have assigned different weights to various factors.
NATURE, EXTENT AND QUALITY OF SERVICES.The trustees reviewed the nature, extent and quality of the services provided, and to be provided, by the investment manager. The trustees cited the investment manager’s ability to implement the Fund’s disciplined value investment approach and its long-term relationship with the Fund as reasons that shareholders choose to invest, and remain invested, in the Fund. The trustees reviewed the Fund’s portfolio management team, including its performance, staffing, skills and compensation program. With respect to portfolio manager compensation, management assured the trustees that the Fund’s long-term performance is a significant component of incentive-based compensation and noted that a portion of a portfolio manager’s incentive-based compensation is paid in shares ofpre- designated funds from the portfolio manager’s fund management area. The trustees noted that the portfolio manager compensation program aligned the interests of the portfolio managers with that of shareholders of the Fund. The trustees discussed
with management various other products, portfolios and entities that are advised by the investment manager and the allocation of assets and expenses among and within them, as well as their relative fees and reasons for differences with respect thereto and any potential conflicts. During regular Board meetings and the aforementioned meetings of the independent trustees, the trustees received reports and presentations on the investment manager’s best execution trading policies. The trustees considered periodic reports provided to them showing that the investment manager complied with the investment policies and restrictions of the Fund as well as other reports periodically furnished to the Board covering matters such as the compliance of portfolio managers and other management personnel with the code of ethics covering the investment management personnel, the adherence to fair value pricing procedures established by the Board and the accuracy of net asset value calculations. The Board noted the extent of the benefits provided to Fund shareholders from being part of the Franklin Templeton group of funds, including the right to exchange investments between funds (same class) without a sales charge, the ability to reinvest Fund dividends into other funds and the right to combine holdings of other funds to obtain reduced sales charges. The Board considered the investment manager’s significant efforts in developing and implementing compliance procedures established in accordance with SEC and other requirements.
The Board considered the nature, extent and quality of the services to be provided under the Fund’s other service agreements to determine that, on an overall basis, Fund shareholders were well served. In this connection, the Board also took into account transfer agent and shareholder services provided to Fund shareholders by an affiliate of the investment manager, noting continuing expenditures by management to increase and improve the scope of such services and favorable periodic reports on shareholder services conducted by independent third parties. While such considerations directly affected the trustees’ decision in renewing the Fund’s transfer agent and shareholder services agreement, the Board also considered these commitments as incidental benefits to Fund shareholders deriving from the investment management relationship.
Based on their review, the trustees were satisfied with the nature and quality of the overall services provided, and to be provided, by the investment manager and its affiliates to the Fund and its shareholders and were confident in the abilities of the management team to continue the disciplined value
| 44 | Semiannual Report | franklintempleton.com | ||
FRANKLIN MUTUAL SERIES FUNDS
FRANKLIN MUTUAL GLOBAL DISCOVERY FUND
SHAREHOLDER INFORMATION
investment approach of the Fund and to provide quality services to the Fund and its shareholders.
INVESTMENT PERFORMANCE.The trustees reviewed and placed significant emphasis on the investment performance of the Fund over theone-, three-, five- and10-year periods ended December 31, 2018. They considered the history of successful performance of the Fund relative to various benchmarks. As part of their review, they inquired of management regarding benchmarks, style drift and restrictions on permitted investments. Consideration was also given to performance in the context of available levels of cash during the periods.
The trustees had meetings during the year, including the meetings referred to above held in connection with the renewal process, with the Fund’s portfolio managers to discuss performance and the management of the Fund. In addition to the materials provided by management in connection with the renewal process, the independent trustees requested throughout the year (and received) additional presentations from the investment manager and senior management of FTI regarding the performance of the investment manager and the Fund. As part of these presentations, the investment manager and senior management of FTI reviewed enhancements that have been made, and are being made, to the investment manager’s investment process. In addition, particular attention in assessing performance was given to the Broadridge Section 15(c) Report. That report showed the investment performance of the Fund (Class A shares) in comparison to other funds determined comparable by Lipper.
The comparable funds to the Fund, as chosen by Lipper, included all retail and institutional globalmulti-cap value funds. The Fund had total returns in the second-best performing quintile for theone-year period ended December 31, 2018, and had annualized total returns for the three- and five-year periods in the second-lowest and middle performing quintiles, respectively. The trustees noted that the Fund’s total return on an annualized basis for the10-year period ended December 31, 2018 was in the second-lowest performing quintile. The trustees noted that the Fund exhibited improved relative performance in 2018 and discussed with management the reasons for the relative underperformance for the three- and10-year periods ended December 31, 2018. Encouraged by the improved relative performance and enhancements to the investment process noted above, the Board did not believe that any changes with
respect to the Fund were warranted at the time and noted that it would continue to monitor future performance.
The trustees also compared Fund performance to other industry benchmarks, including measures of risk-adjusted performance of a fund, as part of their evaluation of investment performance. The trustees concluded that the Fund had continued to perform well in comparison to its various benchmarks and in the context of the Fund’s goal.
COMPARATIVE EXPENSES AND MANAGEMENT PROFITABILITY.The trustees considered the cost of the services provided and to be provided and the profits realized by the investment manager and its affiliates from their respective relationships with the Fund. As part of the renewal process, the trustees explored with management the trends in expense ratios over the past three fiscal years and the reasons for any increases in the Fund’s expense ratios (or components thereof). In considering the appropriateness of the management fee and other expenses charged to the Fund, the Board took into account various factors including investment performance and matters relating to Fund operations, including, but not limited to, the quality and experience of its portfolio managers and research staff. Consideration was also given to a comparative analysis in the Broadridge Section 15(c) Report of the investment management fee and total expense ratio of the Fund in comparison with those of a group of other funds selected by Lipper as its appropriate Lipper expense group. Lipper expense data is based upon information taken from each fund’s most recent annual report, which reflects historical asset levels that may be quite different from those currently existing, particularly in a period of market volatility. While recognizing such inherent limitation and the fact that expense ratios generally increase as assets decline and decrease as assets grow, the Board believed the independent analysis conducted by Lipper to be an appropriate measure of comparative expenses.
In reviewing comparative costs, emphasis was given to the Fund’s contractual management fee in comparison with the contractual management fee that would have been charged by other funds within its Lipper expense group assuming they were similar in size to the Fund, as well as the actual total expenses of the Fund in comparison with those of its Lipper expense group. The Lipper contractual management fee analysis includes administrative charges as being part of the management fee, and total expenses, for comparative consistency, are shown by Lipper for Fund Class A shares.
| franklintempleton.com | Semiannual Report | 45 | ||||
FRANKLIN MUTUAL SERIES FUNDS
FRANKLIN MUTUAL GLOBAL DISCOVERY FUND
SHAREHOLDER INFORMATION
The Fund’s contractual management fee rate was in the most expensive quintile of its Lipper expense group and its total expenses were in the middle quintile of such group. The Board found such comparative fees and expenses to be acceptable in view of factors relating to the Fund’s operations, such as the quality and experience of its portfolio managers.
The trustees also reviewed the Profitability Study addressing profitability of Franklin Resources, Inc., from its overall U.S. fund business, as well as profitability to the Fund’s investment manager and its affiliates, from providing investment management and other services to the Fund during the12-month period ended September 30, 2018, the most recent fiscalyear-end of Franklin Resources, Inc. The trustees reviewed the basis on which such reports are prepared and the cost allocation methodology utilized in the Profitability Study, it being recognized that allocation methodologies may each be reasonable while producing different results. In this respect, the Board noted that the reasonableness of the cost allocation methodologies was reviewed by independent accountants on an every other year basis.
The independent trustees met with management to discuss the Profitability Study. This included, among other things, a comparison of investment management income with investment management expenses of the Fund; comparison of underwriting revenues and expenses; the relative relationship of investment management and underwriting expenses; shareholder servicing profitability; economies of scale; and the relative contribution of the Fund to the profitability of the investment manager and its parent. In discussing the Profitability Study with the Board, the investment manager stated its belief that the costs incurred in establishing the infrastructure necessary to operate the type of mutual fund operations conducted by it and its affiliates may not be fully reflected in the expenses allocated to the Fund in determining its profitability.
The Board also took into account management’s expenditures in improving shareholder services provided to the Fund, as well as the need to meet additional regulatory and compliance requirements. The trustees also considered the extent to which the investment manager may derive ancillary benefits from Fund operations, including those derived from economies of scale, discussed below, the allocation of Fund brokerage and the use of commission dollars to pay for research and other similar services.
Based upon their consideration of all these factors, the trustees determined that the level of profits realized by the investment manager and its affiliates in providing services to the Fund was not excessive in view of the nature, quality and extent of services provided.
ECONOMIES OF SCALE.The Board considered economies of scale realized by the investment manager and its affiliates as the Fund grows larger and the extent to which they are shared with Fund shareholders, as for example, in the level of the investment management fee charged, in the quality and efficiency of services rendered and in increased capital commitments benefiting the Fund directly or indirectly. While recognizing that any precise determination is inherently subjective, the trustees noted that, based upon the Profitability Study, as some funds increase in size, at some point economies of scale may result in the investment manager realizing a larger profit margin on investment management services provided to such a fund. The trustees also noted that benefits of economies of scale will be shared with Fund shareholders due to the decline in the effective investment management fee rate as breakpoints are achieved by the Fund.
The trustees noted that breakpoints had been instituted as part of the Fund’s investment management fee and that the Board regularly evaluates whether additional breakpoints are appropriate. The trustees assessed the savings to shareholders resulting from such breakpoints and believed they were, and continue to be, appropriate and they agreed to continue to monitor the appropriateness of the breakpoints. The trustees also considered the effects an increase in assets under management would have on the investment management fee and expense ratio of the Fund. To the extent further economies of scale may be realized by the investment manager and its affiliates, the Board believed the investment management fees provide a sharing of benefits with the Fund and its shareholders.
Proxy Voting Policies and Procedures
The Fund’s investment manager has established Proxy Voting Policies and Procedures (Policies) that the Fund uses to determine how to vote proxies relating to portfolio securities. Shareholders may view the Fund’s complete Policies online at franklintempleton.com. Alternatively, shareholders may request copies of the Policies free of charge by calling the Proxy Group collect at (954)527-7678 or by sending a written request to: Franklin Templeton Companies, LLC, 300 S.E. 2nd Street, Fort Lauderdale, FL
| 46 | Semiannual Report | franklintempleton.com | ||
FRANKLIN MUTUAL SERIES FUNDS
FRANKLIN MUTUAL GLOBAL DISCOVERY FUND
SHAREHOLDER INFORMATION
33301, Attention: Proxy Group. Copies of the Fund’s proxy voting records are also made available online at franklintempleton.com and posted on the U.S. Securities and Exchange Commission’s website at sec.gov and reflect the most recent12-month period ended June 30.
Quarterly Statement of Investments
The Trust, on behalf of the Fund, files a complete statement of investments with the U.S. Securities and Exchange Commission for the first and third quarters for each fiscal year as an exhibit to its report on FormN-PORT. Shareholders may view the filed FormN-PORT by visiting the Commission’s website at sec.gov. The filed form may also be viewed and copied at the Commission’s Public Reference Room in Washington, DC. Information regarding the operations of the Public Reference Room may be obtained by calling(800) SEC-0330.
| franklintempleton.com | Semiannual Report | 47 | ||||
This page intentionally left blank.
Authorized for distribution only when accompanied or preceded by a summary prospectus and/or prospectus. Investors should carefully consider a fund’s investment goals, risks, charges and expenses before investing. A prospectus contains this and other information; please read it carefully before investing.
To help ensure we provide you with quality service, all calls to and from our service areas are monitored and/or recorded.
| Semiannual Report and Shareholder Letter | |||||
| Franklin Mutual Global Discovery Fund | ||||||
Investment Manager | Distributor | Shareholder Services | ||||
| Franklin Mutual Advisers, LLC | Franklin Templeton Distributors, Inc. (800) DIAL BEN®/342-5236 franklintempleton.com | (800) 632-2301 - (Class A, C, R & R6) (800)448-FUND - (Class Z) | ||||
| © 2019 Franklin Templeton Investments. All rights reserved. | 477 S 08/19 |

Sign up for electronic delivery at franklintempleton.com/edelivery
Internet Delivery of Fund Reports Unless You Request Paper Copies: Effective January 1, 2021, as permitted by the SEC, paper copies of the Fund’s shareholder reports will no longer be sent by mail, unless you specifically request them from the Fund or your financial intermediary. Instead, the reports will be made available on a website, and you will be notified by mail each time a report is posted and provided with a website link to access the report.
If you already elected to receive shareholder reports electronically, you will not be affected by this change and you need not take any action. If you have not signed up for electronic delivery, we would encourage you to join fellow shareholders who have. You may elect to receive shareholder reports and other communications electronically from the Fund by calling (800)632-2301 or by contacting your financial intermediary.
You may elect to continue to receive paper copies of all your future shareholder reports free of charge by contacting your financial intermediary or, if you invest directly with a Fund, calling (800)632-2301 to let the Fund know of your request. Your election to receive reports in paper will apply to all funds held in your account.
FRANKLIN TEMPLETON
Successful investing begins with ambition. And achievement only comes when you reach for it. That’s why we continually strive to deliver better outcomes for investors. No matter what your goals are, our deep, global investment expertise allows us to offer solutions that can help.
During our more than 70 years of experience, we’ve managed through all kinds of markets—up, down and those in between. We’re always preparing for what may come next. It’s because of this, combined with our strength as one of the world’s largest asset managers that we’ve earned the trust of millions of investors around the world.
Dear Franklin Mutual European Fund Shareholder:
The markets came into 2019 in a fog of uncertainty. The outlook for economic growth had become less bright and fears were mounting that the U.S. Federal Reserve (Fed) would make a policy misstep in raising interest rates too far. Over the past six months, many of these economic concerns have eased, as the Fed and other major central banks like the European Central Bank (ECB) turned more dovish amid signs that growth was becoming a bit more sluggish. The ECB suggested it would act should growth soften and inflation not materialize. This dovishness helped propel the U.S. equity market back toward record highs in June. Bond yields, meanwhile, fell on the prospect for increased central bank-driven liquidity, with some sovereign European bonds sliding back into negative territory.
Although the prospects of a more accommodative monetary policy eased fears about the economic outlook, persistent trade tensions between the U.S. and China, among other nations, kept markets on edge. This was on full display in May when markets fell sharply on a ratcheting up of tensions and after the U.S. government threatened to place tariffs on Mexican goods. Mideast tensions also began to heat up in June with attacks on oil tankers in the Persian Gulf and greater tensions between the U.S. and Iran.
How, and even whether, the U.K. will leave the European Union has also remained unresolved. Atperiod-end, the U.K. Conservative Party was conducting a leadership contest, which has the potential to complicate future Brexit negotiations and leave markets vulnerable to increased volatility.
Despite all this uncertainty, for thesix-month period ended June 30, 2019, European equities, as measured by the MSCI Europe Index, posted a +16.73% total return in local currency terms.1
As has been the case in recent years, growth stocks, particularly in the technology sector, have outperformed over thesix-month period. Value stocks generally have remained disfavored in this environment where, at times, economic factors and monetary policy have had greater sway on equity returns than corporate fundamentals.
We recognize the important role of financial advisors in today’s markets and encourage investors to continue to seek their advice. Amid changing markets and economic conditions, we are confident investors with a well-diversified portfolio and a patient, long-term outlook will be well positioned for the years ahead.
On the following pages, the Fund’s portfolio management team reviews investment decisions that pertain to performance during the past six months considering the economic environment and other factors. Please remember all securities markets fluctuate, as do mutual fund share prices.
We thank you for investing with Franklin Templeton, welcome your questions and comments, and look forward to continuing to serve your investment needs in the years ahead.
1. Source: Morningstar.
See www.franklintempletondatasources.com for additional data provider information.
Not FDIC Insured | May Lose Value | No Bank Guarantee |
| franklintempleton.com | Not part of the semiannual report | 1 | ||||
Sincerely,
Peter A. Langerman
Chairman, President and Chief Executive Officer
Franklin Mutual Advisers, LLC
This letter reflects our analysis and opinions as of June 30, 2019, unless otherwise indicated. The information is not a complete analysis of every aspect of any market, country, industry, security or fund. Statements of fact are from sources considered reliable.
| ||||
Semiannual Report
| ||||
| 3 | |||
| 8 | |||
| 10 | |||
Financial Highlights and Statement of Investments
| 11 | |||
| 21 | |||
| 25 | |||
| 37 |
Visitfranklintempleton.comfor fund updates, to access your account, or to find helpful financial planning tools. |
| 2 | Not part of the semiannual report | franklintempleton.com | ||||
SEMIANNUAL REPORT
This semiannual report for Franklin Mutual European Fund covers the period ended June 30, 2019.
Your Fund’s Goal and Main Investments
The Fund seeks capital appreciation, which may occasionally be short term, with income as a secondary goal, by investing at least 80% of its net assets in securities of European companies that the investment manager believes are available at market prices less than their intrinsic value. The Fund invests primarily in equity securities, mainly common stocks, with a focus onmid- and large cap companies. To a lesser extent, the Fund also invests in merger arbitrage securities and the debt and equity of distressed companies. The Geographic Composition bar chart on this page lists the leading European countries where the Fund invests.
Performance Overview
The Fund’s Class Z shares posted a +12.02% cumulative total return for the six months ended June 30, 2019. For comparison, the Fund’s benchmark, the MSCI Europe (Net Dividends) Index, which tracks equity performance in Europe’s developed markets, posted a +16.08% total return in local currency terms and +15.80% in U.S. dollar terms.1 You can find more of the Fund’s performance data in the Performance Summary beginning on page 8.
Performance data represent past performance, which does not guarantee future results. Investment return and principal value will fluctuate, and you may have a gain or loss when you sell your shares. Current performance may differ from figures shown. For most recentmonth-end performance, go tofranklintempleton.comor call(800)342-5236.
Economic and Market Overview
The global economy expanded during the six months ended June 30, 2019 despite weakness in certain regions. Global developed and emerging market stocks were aided by upbeat economic data in some regions, encouraging corporate earnings reports and periods of optimism about a potential U.S.-China trade deal. Further supporting markets
Geographic Composition*
Based on Total Net Assets as of 6/30/19
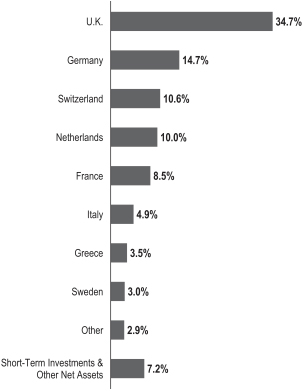
*Figures are stated as a percentage of total and may not equal 100% or may be negative due to rounding, use of any derivatives, unsettled trades or other factors.
were the U.S. Federal Reserve’s patient approach to its monetary policy in 2019 and recent indication it will act as appropriate to sustain U.S. economic expansion.
However, markets reflected concerns about political uncertainties in the U.S. and the European Union, geopolitical risks in certain regions, and the impact of U.S. trade disputes with China and other trading partners on global growth and corporate earnings. In this environment, global developed and emerging market stocks, as measured by the MSCI All Country World Index, posted a +16.60% total return for thesix-month period.1
1. Source: Morningstar.
The index is unmanaged and includes reinvestment of any income or distributions. It does not reflect any fees, expenses or sales charges. One cannot invest directly in an index, and an index is not representative of the Fund’s portfolio.
See www.franklintempletondatasources.com for additional data provider information.
The dollar value, number of shares or principal amount, and names of all portfolio holdings are listed in the Fund’s Statement of Investments (SOI).
The SOI begins on page 16.
| franklintempleton.com | Semiannual Report | 3 | ||||
FRANKLIN MUTUAL EUROPEAN FUND
In Europe, the U.K.’s quarterly gross domestic product (GDP) growth accelerated in 2019’s first quarter, but GDP contracted in the second quarter compared with the first quarter as Brexit uncertainties weighed on business sentiment. The Bank of England left its key policy rate unchanged during the period. The eurozone’s quarterly GDP accelerated in 2019’s first quarter but moderated in the second quarter, and the bloc’s annual inflation rate marginally decreased byperiod-end. The European Central Bank (ECB) kept its benchmark interest rate unchanged for the same time. In June, the ECB mentioned it would leave interest rates unchanged through the first half of 2020, provided details of its new stimulus, and indicated its openness to cut rates or increase stimulus.
Investment Strategy
We follow a distinctive value investment approach that combines investments in what we believe are undervalued common stocks with, to a lesser extent, distressed debt investing and merger arbitrage. Our style aims to provide our shareholders with superior risk-adjusted results over time. We employ rigorous, fundamental analysis to find compelling situations. In our opinion, successful investing is as much about assessing risk and containing losses as it is about achieving profits. In choosing investments, we look at the market price of an individual company’s securities relative to our evaluation of its intrinsic value based on factors including book value, cash flow generation, long-term earnings potential and earnings multiples. We may invest in bankrupt or distressed companies if we believe the market overreacted to adverse developments or failed to appreciate positive changes, including restructuring. In addition, it is our practice to hedge the Fund’s currency exposure when we deem it advantageous for our shareholders.
What is meant by “hedge”?
To hedge an investment is to take a position intended to offset potential losses that may be incurred by a companion financial instrument. Hedging an investment may also offset potential gains.
|
Manager’s Discussion
Franklin Mutual Series has long analyzed companies in many ways beyond just looking at the numbers. We analyze the way a company is run and how decisions are made at the executive and board levels. We look at the sustainability of a company, including the relationships with employees and customers, as well as the environmental impacts of a company’s business. In many ways this is common sense. A company that takes advantage of customers and
Top 10 Sectors/Industries
Based on Equity Securities as of 6/30/19
| % of Total Net Assets | ||||
Insurance
| 11.3% | |||
Banks
| 8.7% | |||
Oil, Gas & Consumable Fuels
| 7.7% | |||
Pharmaceuticals
| 6.8% | |||
Construction Materials
| 6.4% | |||
Diversified Telecommunication Services
| 5.9% | |||
Auto Components
| 4.3% | |||
Trading Companies & Distributors
| 4.2% | |||
Machinery
| 3.9% | |||
Household Durables
| 3.1% | |||
unsustainably produces environmental waste is worth less than one that does not do these things. Similarly, a company that iswell-run and responsive to shareholders is worth more than one whose executives manage the company for their private benefit. However, disclosure has been limited on many relevant issues, and there is disagreement among companies, shareholders and data providers about which factors should be measured and how they should be measured.
This type of analysis is labeled ESG analysis, where ESG stands for environmental, social, and governance factors. Many firms, including Franklin Templeton, are incorporating ESG factors in their investment research. In addition, there are other bodies such as the Sustainable Accounting Standards Board that are working on standardizing metrics for companies and industries to improve their reporting on these factors, particularly in the environmental and social areas. As a result, ESG analysis is improving across the market, and Franklin Mutual Series analysts are better able to analyzenon-traditional factors, including greenhouse gas emissions, water consumption, energy usage, talent management, diversity and inclusion, executive compensation, and enterprise risk management, to name a few. ESG investing should not be confused with social or exclusionary types of investing, but should rather be viewed as an additional tool analysts and portfolio managers use in the investment process to identify and measurenon-traditional, potential business risks and opportunities at a company.
Today, Franklin Mutual Series analysts review and analyze ESG reports produced by third parties or the companies themselves to assess potential risks that could have an impact on shareholder value. In addition, we have discussions with management teams around ESG risks, how
| 4 | Semiannual Report | franklintempleton.com | ||
FRANKLIN MUTUAL EUROPEAN FUND
they deal with them and the potential impact on stakeholders. Our discussions have included issues such as water consumption in mining, the impact of changing carbon dioxide emission standards on the automotive industry and discussions with boards and management teams around management pay. Although more work needs to be done to standardize data from companies within industries so that comparisons can be relevant, the identification and discussion of ESG risk factors is an input we consider in helping frame the potential negative events individual companies or industries may face. In our view, solid ESG ratings are an output of fundamentally good business practices, not an input. As the data and information regarding ESG risk factors continue to evolve, we believe the increased information will highlight additional risk factors to enterprises and help us make more informed investment decisions going forward.
Mergers and Acquisitions
Merger and acquisition (M&A) activity remained healthy in the first half of 2019. The health care sector led the way, with pharmaceuticals megamergers among the biggest transactions. The pending acquisitions of Celgene and Allergan (these companies are not Fund holdings), each worth almost $90 billion, exemplify this strength. The Top 10 Sectors/Industries table on page 4 lists pharmaceuticals and other leading industries in which the Fund currently invests. Large deals have also been announced in the defense, oil and gas exploration and production, and diversified financial services industries, underlying the broad strength of the M&A boom. In addition, U.S. and foreign regulators appear to be more amenable to deals, leading markets to expect fewer regulatory surprises. We are closely monitoring the U.S.-China trade conflict, becauseflare-ups could potentially impact pending and future deals. We expect M&A activity to remain strong for as long as the equity markets remain positive, as has been the historical pattern.
Credit Markets
Opportunities to invest in mispriced risk across global fixed income markets remained limited in the first half of 2019. The low interest-rate environment kept credit widely available, and default rates are still at historically low levels. Debt covenant terms, which include restrictions on the borrower’s financial activities, remain loose or nonexistent. In such an environment, we believe it is prudent to focus our efforts on investing in short-term mispriced risk and catalyst-driven credit opportunities.
On the restructuring side, we are hopeful more opportunities may emerge as the business and economic cycles elongate
Top 10 Equity Holdings
6/30/19
Company Sector/Industry, Country | % of Total Net Assets | |||
LafargeHolcim Ltd. Construction Materials, Switzerland | 3.8% | |||
GlaxoSmithKline PLC Pharmaceuticals, U.K. | 3.6% | |||
Hellenic Telecommunications Organization SA Diversified Telecommunication Services, Greece | 3.5% | |||
Novartis AG Pharmaceuticals, Switzerland | 3.3% | |||
Rexel SA Trading Companies & Distributors, France | 3.1% | |||
Royal Dutch Shell PLC Oil, Gas & Consumable Fuels, U.K. | 3.0% | |||
Standard Chartered PLC Banks, U.K. | 2.8% | |||
Volkswagen AG Automobiles, Germany | 2.7% | |||
Cie Generale des Etablissements Michelin SCA Auto Components, France | 2.7% | |||
RSA Insurance Group PLC Insurance, U.K. | 2.7% | |||
amid persistent uncertainties. We will continue to seek to invest across the capital structures of companies that avail themselves of opportunities to bolster liquidity through internally generated free cash flow and corporate actions, including asset sales and debt refinancing.
Fund Performance
Top positive contributors to performance included Hellenic Telecommunications, Novartis and LafargeHolcim. These companies are listed among the Fund’s largest positions in the Top 10 Equity Holdings table on this page.
Greece-based Hellenic Telecommunications, partially owned by Germany’s Deutsche Telekom (not a Fund holding), provides fixed and mobile telecommunication services in Greece and neighboring European countries. The company’s shares followed the broader equity market rally in January and details within its fiscal full-year 2018 results and 2019 guidance further supported the stock in February. The company continued to perform well given improved demand in Greece, successful cost cutting efforts, a slightly larger-than-expected dividend increase and another share buyback plan.
In March, Switzerland-based drug maker Novartis announced the official process and dates for itstax-free
| franklintempleton.com | Semiannual Report | 5 | ||||
FRANKLIN MUTUAL EUROPEAN FUND
spinoff of the eye care device and consumer products business of Alcon (shares received by the Fund not held atperiod-end), and the U.S. Food and Drug Administration approved Mayzent, the first oral drug to treat secondary progressive multiple sclerosis. In May, Novartis won U.S. regulatory approval for gene therapy that treats spinal muscular atrophy and announced the purchase of a dry eye drug from a Japanese drug company. We believe Novartis is continuing to position itself as a more focused and innovation-driven drug company, and that the market does not fully appreciate the many innovative products it has in development.
After cement companies underperformed in 2018 due to rising energy prices and poor weather, shares of Switzerland-based LafargeHolcim moved higher. Additional appreciation in the stock price came from news that the company had sold its operations in Malaysia and the Philippines as it continued to streamline its operations and deleverage. LafargeHolcim also reported good quarterly results and provided upbeat guidance for 2019, in line with its long-term strategy announced by the company’s new chief executive officer.
During the period under review, Fund investments that detracted from performance included Osram Licht, Vossloh and Vodafone Group.
The stock of Germany-based lighting manufacturer Osram Licht was hurt by weaker economic conditions in China, a deterioration in global manufacturing activity and disruptions to auto manufacturing from the European Union’s new vehicle testing procedure. As a result, Osram issued a profit warning in January, weak quarterly results in February and a downward revision to its full-year guidance in late March. We believe Osram is an underappreciated technology company with an inexpensive valuation, and recently disclosed talks with private equity firms adds to the significant upside potential in its shares, in our opinion.
Shares of Germany-based rail equipment manufacturer Vossloh traded lower in June due to U.S.-China trade tensions. Vossloh is a supplier to the Chinese rail market. The company should be done divesting itself of its transportation division soon, which should allow it to focus on core components, customized modules and life cycle solutions for the rail infrastructure market.
U.K.-based multinational telecommunications conglomerate Vodafone Group provided a quarterly trading update that showed a greater-than-expected slowdown in revenues, as well as guidance of additional deterioration in revenues next quarter. A revenue decline in South Africa and a
weaker-than-expected gain in Germany more than offset smaller-than-expected revenue declines in Italy, Spain and the U.K. On balance, we believe conditions may become less negative for Vodafone, which sets up a likely upturn in revenues and improvement in earnings growth in the second half of the company’s fiscal 2020, in our view.
During the period, the Fund held currency forwards and futures seeking to hedge most of the currency risk of the portfolio’snon-U.S. dollar investments. The hedges had a positive overall impact on the Fund’s performance because of the appreciation of the U.S. dollar versus the hedged currencies.
What is a currency forward?
A currency forward is a direct agreement between the Fund and a counterparty to buy or sell a foreign currency in exchange for another currency at a specific exchange rate on a future date.
|
What is a future?
A future is an agreement between the Fund and a counterparty made through a U.S. or foreign futures exchange to buy or sell an underlying instrument or asset at a specific price on a future date.
|
As fellow shareholders, we found recent relative performance disappointing, but it is not uncommon for the performance of our strategy to diverge from European equity market returns at times. We remain committed to our disciplined, value investment approach as we seek to generate attractive, long-term, risk-adjusted returns for shareholders.
| 6 | Semiannual Report | franklintempleton.com | ||
FRANKLIN MUTUAL EUROPEAN FUND
Thank you for your participation in Franklin Mutual European Fund. We look forward to continuing to serve your investment needs.
 |  | |
Katrina Dudley, CFA Co-Portfolio Manager |
 |  | |
Mandana Hormozi Co-Portfolio Manager |
 |  | |
Todd Ostrow Co-Portfolio Manager |
The foregoing information reflects our analysis, opinions and portfolio holdings as of June 30, 2019, the end of the reporting period. The way we implement our main investment strategies and the resulting portfolio holdings may change depending on factors such as market and economic conditions. These opinions may not be relied upon as investment advice or an offer for a particular security. The information is not a complete analysis of every aspect of any market, country, industry, security or the Fund. Statements of fact are from sources considered reliable, but the investment manager makes no representation or warranty as to their completeness or accuracy. Although historical performance is no guarantee of future results, these insights may help you understand our investment management philosophy.
CFA® is a trademark owned by CFA Institute.
| franklintempleton.com | Semiannual Report | 7 | ||||
FRANKLIN MUTUAL EUROPEAN FUND
Performance Summary as of June 30, 2019
The performance table does not reflect any taxes that a shareholder would pay on Fund dividends, capital gain distributions, if any, or any realized gains on the sale of Fund shares. Total return reflects reinvestment of the Fund’s dividends and capital gain distributions, if any, and any unrealized gains or losses. Your dividend income will vary depending on dividends or interest paid by securities in the Fund’s portfolio, adjusted for operating expenses of each class. Capital gain distributions are net profits realized from the sale of portfolio securities.
Performance as of 6/30/19
Cumulative total return excludes sales charges. Average annual total return includes maximum sales charges. Sales charges will vary depending on the size of the investment and the class of share purchased. The maximum is 5.50% and the minimum is 0%.Class A:5.50% maximum initial sales charge. For other share classes, visitfranklintempleton.com.
| Share Class | Cumulative Total Return1 | Average Annual Total Return2 | ||||||
Z | ||||||||
6-Month | +12.02% | +12.02% | ||||||
| 1-Year | +1.26% |
+1.26% | ||||||
5-Year | +8.47% |
|
+1.64% |
| ||||
10-Year | +93.91% |
|
+6.85% |
| ||||
A3 | ||||||||
6-Month | +11.86% | +5.71% | ||||||
1-Year | +1.02% |
|
-4.53% |
| ||||
5-Year | +7.06% |
|
+0.24% |
| ||||
10-Year | +88.49% |
|
+5.94% |
| ||||
Performance data represent past performance, which does not guarantee future results. Investment return and principal value will fluctuate, and you may have a gain or loss when you sell your shares. Current performance may differ from figures shown. For most recentmonth-end performance, go tofranklintempleton.comor call(800)342-5236.
See page 9 for Performance Summary footnotes.
| 8 | Semiannual Report | franklintempleton.com | ||
FRANKLIN MUTUAL EUROPEAN FUND
PERFORMANCE SUMMARY
Total Annual Operating Expenses4
| Share Class | ||||
Z | 1.04% | |||
A | 1.29% | |||
Each class of shares is available to certain eligible investors and has different annual fees and expenses, as described in the prospectus.
All investments involve risks, including possible loss of principal. Value securities may not increase in price as anticipated or may decline further in value. Special risks are associated with foreign investing, including currency fluctuations, economic instability and political developments. Because the Fund may invest its assets in companies in a specific region, including Europe, it is subject to greater risks of adverse developments in that region and/or the surrounding regions than a fund that is more broadly diversified geographically. Current political and financial uncertainty surrounding the European Union may increase market volatility and the economic risk of investing in companies in Europe. The Fund’s investments in smaller-company stocks carry an increased risk of price fluctuation, especially over the short term. The Fund’s investments in companies engaged in mergers, reorganizations or liquidations also involve special risks as pending deals may not be completed on time or on favorable terms. The Fund is actively managed but there is no guarantee that the manager’s investment decisions will produce the desired results. The Fund’s prospectus also includes a description of the main investment risks.
1. Cumulative total return represents the change in value of an investment over the periods indicated.
2. Average annual total return represents the average annual change in value of an investment over the periods indicated. Return for less than one year, if any, has not been annualized.
3. Prior to 9/10/18, these shares were offered at a higher initial sales charge of 5.75%, thus actual returns (with sales charges) would have differed. Average annual total returns (with sales charges) have been restated to reflect the current maximum initial sales charge of 5.50%.
4. Figures are as stated in the Fund’s current prospectus and may differ from the expense ratios disclosed in the Your Fund’s Expenses and Financial Highlights sections in this report. In periods of market volatility, assets may decline significantly, causing total annual Fund operating expenses to become higher than the figures shown.
| franklintempleton.com | Semiannual Report | 9 | ||||
FRANKLIN MUTUAL EUROPEAN FUND
As a Fund shareholder, you can incur two types of costs: (1) transaction costs, including sales charges (loads) on Fund purchases and redemptions; and (2) ongoing Fund costs, including management fees, distribution and service(12b-1) fees, and other Fund expenses. All mutual funds have ongoing costs, sometimes referred to as operating expenses. The table below shows ongoing costs of investing in the Fund and can help you understand these costs and compare them with those of other mutual funds. The table assumes a $1,000 investment held for the six months indicated.
Actual Fund Expenses
The table below provides information about actual account values and actual expenses in the columns under the heading “Actual.” In these columns the Fund’s actual return, which includes the effect of Fund expenses, is used to calculate the “Ending Account Value” for each class of shares. You can estimate the expenses you paid during the period by following these steps (ofcourse, your account value and expenses will differ from those in this illustration):Divide your account value by $1,000 (ifyour account had an $8,600 value, then $8,600÷ $1,000 = 8.6). Then multiply the result by the number in the row for your class of shares under the headings “Actual” and “Expenses Paid During Period” (ifActual Expenses Paid During Period were $7.50, then 8.6 x $7.50 = $64.50). In this illustration, the actual expenses paid this period are $64.50.
Hypothetical Example for Comparison with Other Funds
Under the heading “Hypothetical” in the table, information is provided about hypothetical account values and hypothetical expenses based on the Fund’s actual expense ratio and an assumed rate of return of 5% per year before expenses, which is not the Fund’s actual return. This information may not be used to estimate the actual ending account balance or expenses you paid for the period, but it can help you compare ongoing costs of investing in the Fund with those of other funds. To do so, compare this 5% hypothetical example for the class of shares you hold with the 5% hypothetical examples that appear in the shareholder reports of other funds.
Please note that expenses shown in the table are meant to highlight ongoing costs and do not reflect any transactional costs. Therefore, information under the heading “Hypothetical” is useful in comparing ongoing costs only, and will not help you compare total costs of owning different funds. In addition, if transactional costs were included, your total costs would have been higher.
Actual (actual return after expenses) | Hypothetical (5% annual return before expenses) | |||||||||||||||||
| Share Class | Beginning Account Value 1/1/19 | Ending Account Value 6/30/19 | Expenses Paid During 1/1/19–6/30/191,2 | Ending Account Value 6/30/19 | Expenses Paid During 1/1/19–6/30/191, 2 | Net Annualized Expense Ratio2 | ||||||||||||
Z | $1,000 | $1,120.20 | $ 5.57 | $1,019.54 | $ 5.31 | 1.06% | ||||||||||||
A | $1,000 | $1,118.60 | $ 6.88 | $1,018.30 | $ 6.56 | 1.31% | ||||||||||||
C | $1,000 | $1,114.50 | $10.80 | $1,014.58 | $10.29 | 2.06% | ||||||||||||
R | $1,000 | $1,117.30 | $ 8.19 | $1,017.06 | $ 7.80 | 1.56% | ||||||||||||
R6 | $1,000 | $1,120.90 | $ 4.89 | $1,020.18 | $ 4.66 | 0.93% | ||||||||||||
1. Expenses are equal to the annualized expense ratio for thesix-month period as indicated above—in the far right column—multiplied by the simple average account value over the period indicated, and then multiplied by 181/365 to reflect theone-half year period.
2. Reflects expenses after fee waivers and expense reimbursements, for Class R6.
| 10 | Semiannual Report | franklintempleton.com | ||
FRANKLIN MUTUAL SERIES FUNDS
Franklin Mutual European Fund
Six Months Ended (unaudited) | Year Ended December 31, | |||||||||||||||||||||||
| 2018 | 2017 | 2016 | 2015 | 2014 | ||||||||||||||||||||
Class Z | ||||||||||||||||||||||||
Per share operating performance (for a share outstanding throughout the period) | ||||||||||||||||||||||||
Net asset value, beginning of period | $17.89 | $20.93 | $19.20 | $19.48 | $20.86 | $24.76 | ||||||||||||||||||
|
| |||||||||||||||||||||||
| Income from investment operationsa: | ||||||||||||||||||||||||
Net investment incomeb | 0.38 | 0.49 | 0.35 | 0.63 | c | 0.42 | 0.73d | |||||||||||||||||
Net realized and unrealized gains (losses) | 1.77 | (2.80 | ) | 1.65 | (0.17 | ) | (0.27 | ) | (1.73) | |||||||||||||||
|
| |||||||||||||||||||||||
Total from investment operations | 2.15 | (2.31 | ) | 2.00 | 0.46 | 0.15 | (1.00) | |||||||||||||||||
|
| |||||||||||||||||||||||
| Less distributions from: | ||||||||||||||||||||||||
Net investment income | — | (0.73 | ) | (0.27 | ) | (0.47 | ) | (0.46 | ) | (0.67) | ||||||||||||||
Net realized gains | — | — | — | (0.27 | ) | (1.07 | ) | (2.23) | ||||||||||||||||
|
| |||||||||||||||||||||||
Total distributions | — | (0.73 | ) | (0.27 | ) | (0.74 | ) | (1.53 | ) | (2.90) | ||||||||||||||
|
| |||||||||||||||||||||||
| Net asset value, end of period | $20.04 | $17.89 | $20.93 | $19.20 | $19.48 | $20.86 | ||||||||||||||||||
|
| |||||||||||||||||||||||
Total returne | 12.02% | (11.12)% | 10.45% | 2.40% | 0.82% | (4.00)% | ||||||||||||||||||
| Ratios to average net assetsf | ||||||||||||||||||||||||
Expensesg | 1.06% | h | 1.04% | h,i | 1.04% | h | 1.06% | h,i | 1.05% | 1.04%h | ||||||||||||||
Expenses incurred in connection with securities sold short | —% | —% | j | —% | —% | —%j | 0.01% | |||||||||||||||||
Net investment income | 4.06% | 2.38% | 1.75% | 3.42% | c | 1.93% | 2.93%d | |||||||||||||||||
| Supplemental data | ||||||||||||||||||||||||
Net assets, end of period (000’s) | $797,030 | $958,149 | $1,328,622 | $1,175,972 | $1,355,780 | $1,128,769 | ||||||||||||||||||
Portfolio turnover rate | 5.83% | 35.42% | 17.33% | 16.43% | 32.59% | 54.05% | ||||||||||||||||||
aThe amount shown for a share outstanding throughout the period may not correlate with the Statement of Operations for the period due to the timing of sales and repurchases of the Fund’s shares in relation to income earned and/or fluctuating fair value of the investments of the Fund.
bBased on average daily shares outstanding.
cNet investment income per share includes approximately $0.17 per share related to a nonrecurring distribution. The amount, although initially recorded as dividend income, is subject to recharacterization once the issuer provides information regarding the actual composition of the distribution. Excluding this amount, the ratio of net investment income to average net assets would have been 2.50%.
dNet investment income per share includes approximately $0.29 per share related to income received in the form of a special dividend in connection with certain Fund holdings. Excluding this amount, the ratio of net investment income to average net assets would have been 1.74%.
eTotal return is not annualized for periods less than one year.
fRatios are annualized for periods less than one year.
gIncludes dividend and/or interest expense on securities sold short and security borrowing fees, if any. See below for the ratios of such expenses to average net assets for the periods presented. See Note 1(d).
hBenefit of expense reduction rounds to less than 0.01%.
iBenefit of waiver and payments by affiliates rounds to less than 0.01%.
jRounds to less than 0.01%.
| franklintempleton.com | The accompanying notes are an integral part of these financial statements. | Semiannual Report | 11 | ||||
FRANKLIN MUTUAL SERIES FUNDS
FINANCIAL HIGHLIGHTS
Franklin Mutual European Fund(continued)
Six Months Ended (unaudited) | Year Ended December 31, | |||||||||||||||||||||||
| 2018 | 2017 | 2016 | 2015 | 2014 | ||||||||||||||||||||
Class A | ||||||||||||||||||||||||
Per share operating performance (for a share outstanding throughout the period) | ||||||||||||||||||||||||
Net asset value, beginning of period | $17.37 | $20.33 | $18.66 | $18.95 | $20.33 | $24.21 | ||||||||||||||||||
|
| |||||||||||||||||||||||
Income from investment operationsa: | ||||||||||||||||||||||||
Net investment incomeb | 0.36 | 0.41 | 0.31 | 0.57 | c | 0.35 | 0.61d | |||||||||||||||||
Net realized and unrealized gains (losses) | 1.70 | (2.69 | ) | 1.58 | (0.18 | ) | (0.26 | ) | (1.66) | |||||||||||||||
|
| |||||||||||||||||||||||
Total from investment operations | 2.06 | (2.28 | ) | 1.89 | 0.39 | 0.09 | (1.05) | |||||||||||||||||
|
| |||||||||||||||||||||||
Less distributions from: | ||||||||||||||||||||||||
Net investment income | — | (0.68 | ) | (0.22 | ) | (0.41 | ) | (0.40 | ) | (0.60) | ||||||||||||||
Net realized gains | — | — | — | (0.27 | ) | (1.07 | ) | (2.23) | ||||||||||||||||
|
| |||||||||||||||||||||||
Total distributions | — | (0.68 | ) | (0.22 | ) | (0.68 | ) | (1.47 | ) | (2.83) | ||||||||||||||
|
| |||||||||||||||||||||||
| Net asset value, end of period | $19.43 | $17.37 | $20.33 | $18.66 | $18.95 | $20.33 | ||||||||||||||||||
|
| |||||||||||||||||||||||
Total returne | 11.86% | (11.29)% | 10.14% | 2.12% | 0.57% | (4.31)% | ||||||||||||||||||
| Ratios to average net assetsf | ||||||||||||||||||||||||
Expensesg | 1.31% | h | 1.29% | h,i | 1.29% | h | 1.31% | h,i | 1.33% | 1.34%h | ||||||||||||||
Expenses incurred in connection with securities sold short | —% | —% | j | —% | —% | —% | j | 0.01% | ||||||||||||||||
Net investment income | 3.81% | 2.13% | 1.50% | 3.17% | c | 1.65% | 2.63%d | |||||||||||||||||
| Supplemental data | ||||||||||||||||||||||||
Net assets, end of period (000’s) | $575,473 | $564,038 | $714,915 | $769,297 | $1,033,307 | $843,836 | ||||||||||||||||||
Portfolio turnover rate | 5.83% | 35.42% | 17.33% | 16.43% | 32.59% | 54.05% | ||||||||||||||||||
aThe amount shown for a share outstanding throughout the period may not correlate with the Statement of Operations for the period due to the timing of sales and repurchases of the Fund’s shares in relation to income earned and/or fluctuating fair value of the investments of the Fund.
bBased on average daily shares outstanding.
cNet investment income per share includes approximately $0.17 per share related to a nonrecurring distribution. The amount, although initially recorded as dividend income, is subject to recharacterization once the issuer provides information regarding the actual composition of the distribution. Excluding this amount, the ratio of net investment income to average net assets would have been 2.25%.
dNet investment income per share includes approximately $0.29 per share related to income received in the form of a special dividend in connection with certain Fund holdings. Excluding this amount, the ratio of net investment income to average net assets would have been 1.44%.
eTotal return does not reflect sales commissions or contingent deferred sales charges, if applicable, and is not annualized for periods less than one year.
fRatios are annualized for periods less than one year.
gIncludes dividend and/or interest expense on securities sold short and security borrowing fees, if any. See below for the ratios of such expenses to average net assets for the periods presented. See Note 1(d).
hBenefit of expense reduction rounds to less than 0.01%.
iBenefit of waiver and payments by affiliates rounds to less than 0.01%.
jRounds to less than 0.01%.
| 12 | Semiannual Report | The accompanying notes are an integral part of these financial statements. | franklintempleton.com | ||
FRANKLIN MUTUAL SERIES FUNDS
FINANCIAL HIGHLIGHTS
Franklin Mutual European Fund(continued)
Six Months Ended June 30, 2019 (unaudited) | Year Ended December 31, | |||||||||||||||||||||||
| 2018 | 2017 | 2016 | 2015 | 2014 | ||||||||||||||||||||
| Class C | ||||||||||||||||||||||||
| Per share operating performance (for a share outstanding throughout the period) | ||||||||||||||||||||||||
Net asset value, beginning of period | $17.56 | $20.38 | $18.70 | $18.97 | $20.37 | $24.25 | ||||||||||||||||||
|
| |||||||||||||||||||||||
| Income from investment operationsa: | ||||||||||||||||||||||||
Net investment incomeb | 0.29 | 0.29 | 0.15 | 0.44 | c | 0.19 | 0.43d | |||||||||||||||||
Net realized and unrealized gains (losses) | 1.72 | (2.72 | ) | 1.60 | (0.19 | ) | (0.25 | ) | (1.64) | |||||||||||||||
|
| |||||||||||||||||||||||
Total from investment operations | 2.01 | (2.43 | ) | 1.75 | 0.25 | (0.06 | ) | (1.21) | ||||||||||||||||
|
| |||||||||||||||||||||||
| Less distributions from: | ||||||||||||||||||||||||
Net investment income | — | (0.39 | ) | (0.07 | ) | (0.25 | ) | (0.27 | ) | (0.44) | ||||||||||||||
Net realized gains | — | — | — | (0.27 | ) | (1.07 | ) | (2.23) | ||||||||||||||||
|
| |||||||||||||||||||||||
Total distributions | — | (0.39 | ) | (0.07 | ) | (0.52 | ) | (1.34 | ) | (2.67) | ||||||||||||||
|
| |||||||||||||||||||||||
Net asset value, end of period | $19.57 | $17.56 | $20.38 | $18.70 | $18.97 | $20.37 | ||||||||||||||||||
|
| |||||||||||||||||||||||
Total returne | 11.45% | (11.96)% | 9.37% | 1.32% | (0.16)% | (4.97)% | ||||||||||||||||||
| Ratios to average net assetsf | ||||||||||||||||||||||||
Expensesg | 2.06% | h | 2.04% | h,i | 2.04% | h | 2.06% | h,i | 2.05% | 2.04%h | ||||||||||||||
Expenses incurred in connection with securities sold short | —% | —% | j | —% | —% | —%j | 0.01% | |||||||||||||||||
Net investment income | 3.06% | 1.38% | 0.75% | 2.42%c | 0.93% | 1.93%d | ||||||||||||||||||
| Supplemental data | ||||||||||||||||||||||||
Net assets, end of period (000’s) | $72,100 | $78,149 | $179,123 | $209,196 | $291,752 | $216,258 | ||||||||||||||||||
Portfolio turnover rate | 5.83% | 35.42% | 17.33% | 16.43% | 32.59% | 54.05% | ||||||||||||||||||
aThe amount shown for a share outstanding throughout the period may not correlate with the Statement of Operations for the period due to the timing of sales and repurchases of the Fund’s shares in relation to income earned and/or fluctuating fair value of the investments of the Fund.
bBased on average daily shares outstanding.
cNet investment income per share includes approximately $0.17 per share related to a nonrecurring distribution. The amount, although initially recorded as dividend income, is subject to recharacterization once the issuer provides information regarding the actual composition of the distribution. Excluding this amount, the ratio of net investment income to average net assets would have been 1.50%.
dNet investment income per share includes approximately $0.29 per share related to income received in the form of a special dividend in connection with certain Fund holdings. Excluding this amount, the ratio of net investment income to average net assets would have been 0.74%.
eTotal return does not reflect sales commissions or contingent deferred sales charges, if applicable, and is not annualized for periods less than one year.
fRatios are annualized for periods less than one year.
gIncludes dividend and/or interest expense on securities sold short and security borrowing fees, if any. See below for the ratios of such expenses to average net assets for the periods presented. See Note 1(d).
hBenefit of expense reduction rounds to less than 0.01%.
iBenefit of waiver and payments by affiliates rounds to less than 0.01%.
jRounds to less than 0.01%.
| franklintempleton.com | The accompanying notes are an integral part of these financial statements. | Semiannual Report | 13 | ||||
FRANKLIN MUTUAL SERIES FUNDS
FINANCIAL HIGHLIGHTS
Franklin Mutual European Fund(continued)
Six Months Ended June 30, 2019 (unaudited) | Year Ended December 31, | |||||||||||||||||||||||
| 2018 | 2017 | 2016 | 2015 | 2014 | ||||||||||||||||||||
Class R | ||||||||||||||||||||||||
| Per share operating performance (for a share outstanding throughout the period) | ||||||||||||||||||||||||
Net asset value, beginning of period | $17.05 | $19.97 | $18.35 | $18.62 | $20.04 | $23.95 | ||||||||||||||||||
|
| |||||||||||||||||||||||
| Income from investment operationsa: | ||||||||||||||||||||||||
Net investment incomeb | 0.33 | 0.35 | 0.22 | 0.52 | c | 0.27 | 0.41d | |||||||||||||||||
Net realized and unrealized gains (losses) | 1.67 | (2.64 | ) | 1.60 | (0.18 | ) | (0.23 | ) | (1.49) | |||||||||||||||
|
| |||||||||||||||||||||||
Total from investment operations | 2.00 | (2.29 | ) | 1.82 | 0.34 | 0.04 | (1.08) | |||||||||||||||||
|
| |||||||||||||||||||||||
| Less distributions from: | ||||||||||||||||||||||||
Net investment income | — | (0.63 | ) | (0.20 | ) | (0.34 | ) | (0.39 | ) | (0.60) | ||||||||||||||
Net realized gains | — | — | — | (0.27 | ) | (1.07 | ) | (2.23) | ||||||||||||||||
|
| |||||||||||||||||||||||
Total distributions | — | (0.63 | ) | (0.20 | ) | (0.61 | ) | (1.46 | ) | (2.83) | ||||||||||||||
|
| |||||||||||||||||||||||
Net asset value, end of period | $19.05 | $17.05 | $19.97 | $18.35 | $18.62 | $20.04 | ||||||||||||||||||
|
| |||||||||||||||||||||||
Total returne | 11.73% | (11.54)% | 9.92% | 1.86% | 0.37% | (4.52)% | ||||||||||||||||||
| Ratios to average net assetsf | ||||||||||||||||||||||||
Expensesg | 1.56% | h | 1.54% | h,i | 1.54% | h | 1.56% | h,i | 1.55% | 1.54%h | ||||||||||||||
Expenses incurred in connection with securities sold short | —% | —% | j | —% | —% | —% | j | 0.01% | ||||||||||||||||
Net investment income | 3.56% | 1.88% | 1.25% | 2.92% | c | 1.43% | 2.43%d | |||||||||||||||||
| Supplemental data | ||||||||||||||||||||||||
Net assets, end of period (000’s) | $709 | $731 | $821 | $626 | $997 | $421 | ||||||||||||||||||
Portfolio turnover rate | 5.83% | 35.42% | 17.33% | 16.43% | 32.59% | 54.05% | ||||||||||||||||||
aThe amount shown for a share outstanding throughout the period may not correlate with the Statement of Operations for the period due to the timing of sales and repurchases of the Fund’s shares in relation to income earned and/or fluctuating fair value of the investments of the Fund.
bBased on average daily shares outstanding.
cNet investment income per share includes approximately $0.17 per share related to a nonrecurring distribution. The amount, although initially recorded as dividend income, is subject to recharacterization once the issuer provides information regarding the actual composition of the distribution. Excluding this amount, the ratio of net investment income to average net assets would have been 2.00%.
dNet investment income per share includes approximately $0.29 per share related to income received in the form of a special dividend in connection with certain Fund holdings. Excluding this amount, the ratio of net investment income to average net assets would have been 1.24%.
eTotal return is not annualized for periods less than one year.
fRatios are annualized for periods less than one year.
gIncludes dividend and/or interest expense on securities sold short and security borrowing fees, if any. See below for the ratios of such expenses to average net assets for the periods presented. See Note 1(d).
hBenefit of expense reduction rounds to less than 0.01%.
iBenefit of waiver and payments by affiliates rounds to less than 0.01%.
jRounds to less than 0.01%.
| 14 | Semiannual Report | The accompanying notes are an integral part of these financial statements. | franklintempleton.com | ||
FRANKLIN MUTUAL SERIES FUNDS
FINANCIAL HIGHLIGHTS
Franklin Mutual European Fund(continued)
Six Months Ended June 30, 2019 (unaudited) | Year Ended December 31, | |||||||||||||||||||||||
| 2018 | 2017 | 2016 | 2015 | 2014 | ||||||||||||||||||||
Class R6 | ||||||||||||||||||||||||
| Per share operating performance (for a share outstanding throughout the period) | ||||||||||||||||||||||||
Net asset value, beginning of period | $17.87 | $20.91 | $19.19 | $19.47 | $20.85 | $24.75 | ||||||||||||||||||
|
| |||||||||||||||||||||||
| Income from investment operationsa: | ||||||||||||||||||||||||
Net investment incomeb | 0.41 | 0.56 | 0.41 | 0.66c | 0.46 | 0.75d | ||||||||||||||||||
Net realized and unrealized gains (losses) | 1.75 | (2.85 | ) | 1.62 | (0.17 | ) | (0.28 | ) | (1.71) | |||||||||||||||
|
| |||||||||||||||||||||||
Total from investment operations | 2.16 | (2.29 | ) | 2.03 | 0.49 | 0.18 | (0.96) | |||||||||||||||||
|
| |||||||||||||||||||||||
| Less distributions from: | ||||||||||||||||||||||||
Net investment income | — | (0.75 | ) | (0.31 | ) | (0.50 | ) | (0.49 | ) | (0.71) | ||||||||||||||
Net realized gains | — | — | — | (0.27 | ) | (1.07 | ) | (2.23) | ||||||||||||||||
|
| |||||||||||||||||||||||
Total distributions | — | (0.75 | ) | (0.31 | ) | (0.77 | ) | (1.56 | ) | (2.94) | ||||||||||||||
|
| |||||||||||||||||||||||
Net asset value, end of period | $20.03 | $17.87 | $20.91 | $19.19 | $19.47 | $20.85 | ||||||||||||||||||
|
| |||||||||||||||||||||||
Total returne | 12.09% | (10.94)% | 10.63% | 2.53% | 0.98% | (3.88)% | ||||||||||||||||||
| Ratios to average net assetsf | ||||||||||||||||||||||||
Expenses before waiver and payments by affiliatesg | 0.94% | 0.92% | 0.88% | 0.89% | 0.89% | 0.89% | ||||||||||||||||||
Expenses net of waiver and payments by affiliatesg | 0.93% | h | 0.91% | h | 0.88% | h | 0.89% | h,i | 0.89% | 0.89%h | ||||||||||||||
Expenses incurred in connection with securities sold short | —% | —% | j | —% | —% | —% | j | 0.01% | ||||||||||||||||
Net investment income | 4.19% | 2.51% | 1.91% | 3.59% | c | 2.09% | 3.08%d | |||||||||||||||||
| Supplemental data | ||||||||||||||||||||||||
Net assets, end of period (000’s) | $155,461 | $149,796 | $294,660 | $311,784 | $373,904 | $334,396 | ||||||||||||||||||
Portfolio turnover rate | 5.83% | 35.42% | 17.33% | 16.43% | 32.59% | 54.05% | ||||||||||||||||||
aThe amount shown for a share outstanding throughout the period may not correlate with the Statement of Operations for the period due to the timing of sales and repurchases of the Fund’s shares in relation to income earned and/or fluctuating fair value of the investments of the Fund.
bBased on average daily shares outstanding.
cNet investment income per share includes approximately $0.17 per share related to a nonrecurring distribution. The amount, although initially recorded as dividend income, is subject to recharacterization once the issuer provides information regarding the actual composition of the distribution. Excluding this amount, the ratio of net investment income to average net assets would have been 2.67%.
dNet investment income per share includes approximately $0.29 per share related to income received in the form of a special dividend in connection with certain Fund holdings. Excluding this amount, the ratio of net investment income to average net assets would have been 1.89%.
eTotal return is not annualized for periods less than one year.
fRatios are annualized for periods less than one year.
gIncludes dividend and/or interest expense on securities sold short and security borrowing fees, if any. See below for the ratios of such expenses to average net assets for the periods presented. See Note 1(d).
hBenefit of expense reduction rounds to less than 0.01%.
iBenefit of waiver and payments by affiliates rounds to less than 0.01%.
jRounds to less than 0.01%.
| franklintempleton.com | The accompanying notes are an integral part of these financial statements. | Semiannual Report | 15 | ||||
FRANKLIN MUTUAL SERIES FUNDS
Statement of Investments, June 30, 2019 (unaudited)
Franklin Mutual European Fund
Country
| Shares
| Value
| ||||||||||||
| ||||||||||||||
| Common Stocks 88.5% | ||||||||||||||
| Aerospace & Defense 1.8% | ||||||||||||||
BAE Systems PLC | United Kingdom | 4,553,139 | $ | 28,645,310 | ||||||||||
|
| |||||||||||||
| Auto Components 2.7% | ||||||||||||||
Cie Generale des Etablissements Michelin SCA | France | 342,111 | 43,385,019 | |||||||||||
|
| |||||||||||||
| Banks 8.7% | ||||||||||||||
AIB Group PLC | Ireland | 5,555,365 | 22,710,958 | |||||||||||
Barclays PLC | United Kingdom | 8,742,929 | 16,632,417 | |||||||||||
ING Groep NV | Netherlands | 3,059,161 | 35,459,723 | |||||||||||
Standard Chartered PLC | United Kingdom | 4,960,260 | 44,989,472 | |||||||||||
UniCredit SpA | Italy | 1,581,443 | 19,463,671 | |||||||||||
|
| |||||||||||||
| 139,256,241 | ||||||||||||||
|
| |||||||||||||
| Capital Markets 2.7% | ||||||||||||||
Credit Suisse Group AG | Switzerland | 2,270,342 | 27,215,273 | |||||||||||
Deutsche Bank AG | Germany | 2,148,475 | 16,560,108 | |||||||||||
|
| |||||||||||||
| 43,775,381 | ||||||||||||||
|
| |||||||||||||
| Chemicals 2.3% | ||||||||||||||
BASF SE | Germany | 497,440 | 36,147,698 | |||||||||||
|
| |||||||||||||
| Commercial Services & Supplies 1.3% | ||||||||||||||
G4S PLC | United Kingdom | 8,137,683 | 21,495,656 | |||||||||||
|
| |||||||||||||
| Construction Materials 6.4% | ||||||||||||||
HeidelbergCement AG | Germany | 500,319 | 40,474,931 | |||||||||||
LafargeHolcim Ltd., B | Switzerland | 1,259,095 | 61,468,645 | |||||||||||
|
| |||||||||||||
| 101,943,576 | ||||||||||||||
|
| |||||||||||||
| Diversified Telecommunication Services 5.9% | ||||||||||||||
| a | Hellenic Telecommunications Organization SA | Greece | 3,817,744 | 56,422,631 | ||||||||||
Koninklijke KPN NV | Netherlands | 12,263,002 | 37,641,224 | |||||||||||
|
| |||||||||||||
| 94,063,855 | ||||||||||||||
|
| |||||||||||||
| Electric Utilities 1.7% | ||||||||||||||
Enel SpA | Italy | 4,011,949 | 28,004,444 | |||||||||||
|
| |||||||||||||
| Electrical Equipment 1.6% | ||||||||||||||
Osram Licht AG | Germany | 764,465 | 25,168,616 | |||||||||||
|
| |||||||||||||
| Energy Equipment & Services 1.2% | ||||||||||||||
The Drilling Co. of 1972 AS | Denmark | 30,714 | 2,385,717 | |||||||||||
Tenaris SA, ADR | Italy | 635,416 | 16,717,795 | |||||||||||
|
| |||||||||||||
| 19,103,512 | ||||||||||||||
|
| |||||||||||||
| Health Care Providers & Services 0.0%† | ||||||||||||||
Fresenius SE and Co. KGaA | Germany | 614 | 33,282 | |||||||||||
|
| |||||||||||||
| Hotels, Restaurants & Leisure 2.7% | ||||||||||||||
Accor SA | France | 1,001,794 | 42,993,080 | |||||||||||
|
| |||||||||||||
| Household Durables 3.1% | ||||||||||||||
Husqvarna AB, B | Sweden | 2,085,623 | 19,508,848 | |||||||||||
JM AB | Sweden | 1,249,153 | 28,720,336 | |||||||||||
| a,b | Neinor Homes SA, 144A | Spain | 95,289 | 1,159,124 | ||||||||||
|
| |||||||||||||
| 49,388,308 | ||||||||||||||
|
| |||||||||||||
| 16 | Semiannual Report | franklintempleton.com | ||
FRANKLIN MUTUAL SERIES FUNDS
STATEMENT OF INVESTMENTS (UNAUDITED)
Franklin Mutual European Fund(continued)
Country
| Shares
| Value
| ||||||||||||
| ||||||||||||||
| Common Stocks(continued) | ||||||||||||||
| Insurance 11.3% | ||||||||||||||
ASR Nederland NV | Netherlands | 852,316 | $ | 34,649,847 | ||||||||||
Direct Line Insurance Group PLC | United Kingdom | 10,211,469 | 43,028,005 | |||||||||||
Lancashire Holdings Ltd. | United Kingdom | 2,827,000 | 24,718,173 | |||||||||||
NN Group NV | Netherlands | 855,360 | 34,423,528 | |||||||||||
RSA Insurance Group PLC | United Kingdom | 5,917,210 | 43,343,986 | |||||||||||
|
| |||||||||||||
| 180,163,539 | ||||||||||||||
|
| |||||||||||||
| Machinery 3.9% | ||||||||||||||
CNH Industrial NV | United Kingdom | 2,270,191 | 23,274,256 | |||||||||||
CNH Industrial NV, special voting | United Kingdom | 833,461 | 8,544,737 | |||||||||||
Vossloh AG | Germany | 500,980 | 18,396,114 | |||||||||||
Weir Group PLC | United Kingdom | 615,463 | 12,087,555 | |||||||||||
|
| |||||||||||||
| 62,302,662 | ||||||||||||||
|
| |||||||||||||
| Marine 1.2% | ||||||||||||||
A.P. Moeller-Maersk AS, B | Denmark | 15,357 | 19,043,634 | |||||||||||
|
| |||||||||||||
| Media 2.5% | ||||||||||||||
| a | Liberty Global PLC, C | United Kingdom | 1,531,500 | 40,630,695 | ||||||||||
|
| |||||||||||||
| Oil, Gas & Consumable Fuels 7.7% | ||||||||||||||
BP PLC | United Kingdom | 5,184,495 | 36,120,094 | |||||||||||
| a | Cairn Energy PLC | United Kingdom | 11,140,689 | 24,490,391 | ||||||||||
Royal Dutch Shell PLC, A (EUR Traded) | United Kingdom | 370,119 | 12,080,301 | |||||||||||
Royal Dutch Shell PLC, A (GBP Traded) | United Kingdom | 1,095,418 | 35,786,718 | |||||||||||
Saras SpA | Italy | 10,256,302 | 15,437,677 | |||||||||||
|
| |||||||||||||
| 123,915,181 | ||||||||||||||
|
| |||||||||||||
| Pharmaceuticals 6.8% | ||||||||||||||
GlaxoSmithKline PLC | United Kingdom | 2,850,731 | 57,077,425 | |||||||||||
Novartis AG | Switzerland | 569,797 | 52,051,710 | |||||||||||
|
| |||||||||||||
| 109,129,135 | ||||||||||||||
|
| |||||||||||||
| Road & Rail 0.0% | ||||||||||||||
| a,c,d,e | Euro Wagon LP | Jersey Islands | 16,127,149 | — | ||||||||||
|
| |||||||||||||
| Semiconductors & Semiconductor Equipment 1.0% | ||||||||||||||
BE Semiconductor Industries NV | Netherlands | 618,850 | 15,928,137 | |||||||||||
|
| |||||||||||||
| Software 1.4% | ||||||||||||||
Avast PLC | United Kingdom | 5,837,250 | 22,239,046 | |||||||||||
|
| |||||||||||||
| Specialty Retail 2.6% | ||||||||||||||
Dufry AG | Switzerland | 347,239 | 29,402,141 | |||||||||||
Hornbach Holding AG & Co. KGaA | Germany | 213,786 | 12,139,979 | |||||||||||
|
| |||||||||||||
| 41,542,120 | ||||||||||||||
|
| |||||||||||||
| Tobacco 1.9% | ||||||||||||||
British American Tobacco PLC | United Kingdom | 881,269 | 30,765,916 | |||||||||||
|
| |||||||||||||
| Trading Companies & Distributors 4.2% | ||||||||||||||
Kloeckner & Co. SE | Germany | 3,031,653 | 18,146,006 | |||||||||||
Rexel SA | France | 3,855,030 | 48,931,628 | |||||||||||
|
| |||||||||||||
| 67,077,634 | ||||||||||||||
|
| |||||||||||||
| franklintempleton.com | Semiannual Report | 17 | ||||
FRANKLIN MUTUAL SERIES FUNDS
STATEMENT OF INVESTMENTS (UNAUDITED)
Franklin Mutual European Fund(continued)
Country
| Shares
| Value
| ||||||||||||
| ||||||||||||||
| Common Stocks(continued) | ||||||||||||||
| Wireless Telecommunication Services 1.9% | ||||||||||||||
Vodafone Group PLC | United Kingdom | 18,316,426 | $ | 30,081,053 | ||||||||||
|
| |||||||||||||
Total Common Stocks (Cost $1,479,608,463) | 1,416,222,730 | |||||||||||||
|
| |||||||||||||
Preferred Stocks 4.3% | ||||||||||||||
| Auto Components 1.6% | ||||||||||||||
| f | Schaeffler AG, 8.405%, pfd. | Germany | 3,533,679 | 26,288,970 | ||||||||||
|
| |||||||||||||
| Automobiles 2.7% | ||||||||||||||
| f | Volkswagen AG, 3.279%, pfd. | Germany | 258,663 | 43,585,727 | ||||||||||
Total Preferred Stocks (Cost $85,632,633) | 69,874,697 | |||||||||||||
|
| |||||||||||||
Total Investments before Short Term Investments | ||||||||||||||
(Cost $1,565,241,096) | 1,486,097,427 | |||||||||||||
|
| |||||||||||||
| Principal Amount | ||||||||||||||
Short Term Investments 5.8%
| ||||||||||||||
U.S. Government and Agency Securities 5.8% | ||||||||||||||
| g | FHLB, 7/01/19 | United States | $ | 42,500,000 | 42,500,000 | |||||||||
| g | U.S. Treasury Bill, | |||||||||||||
7/02/19 - 8/15/19 | United States | 40,000,000 | 39,965,828 | |||||||||||
h 10/17/19 - 10/31/19 | United States | 10,000,000 | 9,935,017 | |||||||||||
|
| |||||||||||||
Total U.S. Government and Agency Securities | 92,400,845 | |||||||||||||
|
| |||||||||||||
Total Investments (Cost $1,657,616,943) 98.6% | 1,578,498,272 | |||||||||||||
Other Assets, less Liabilities 1.4% | 22,274,886 | |||||||||||||
|
| |||||||||||||
Net Assets 100.0% | $ | 1,600,773,158 | ||||||||||||
|
| |||||||||||||
†Rounds to less than 0.1% of net assets.
aNon-income producing.
bSecurity was purchased pursuant to Rule 144A under the Securities Act of 1933 and may be sold in transactions exempt from registration only to qualified institutional buyers or in a public offering registered under the Securities Act of 1933. This security has been deemed liquid under guidelines approved by the Trust’s Board of Trustees. At June 30, 2019, the value of this security was $1,159,124, representing less than 0.1% of net assets.
cSee Note 11 regarding holdings of 5% voting securities.
dFair valued using significant unobservable inputs. See Note 13 regarding fair value measurements.
eSee Note 9 regarding restricted securities.
fVariable rate security. The rate shown represents the yield at period end.
gThe security was issued on a discount basis with no stated coupon rate.
hA portion or all of the security has been segregated as collateral for open forward exchange contracts. At June 30, 2019, the aggregate value of these securities pledged amounted to $4,688,128, representing 0.3% of net assets.
| 18 | Semiannual Report | franklintempleton.com | ||
FRANKLIN MUTUAL SERIES FUNDS
STATEMENT OF INVESTMENTS (UNAUDITED)
Franklin Mutual European Fund(continued)
At June 30, 2019, the Fund had the following futures contracts outstanding. See Note 1(c).
Futures Contracts
| Description | Type | Number of Contracts | Notional Amount* | Expiration Date | Value/ Unrealized Appreciation (Depreciation) | |||||||||||||||
| Currency Contracts | ||||||||||||||||||||
EUR/USD | Short | 2,666 | $381,454,613 | 9/16/19 | $(1,215,803 | ) | ||||||||||||||
GBP/USD | Short | 1,900 | 151,394,375 | 9/16/19 | 187,045 | |||||||||||||||
|
| |||||||||||||||||||
Total Futures Contracts | $(1,028,758 | ) | ||||||||||||||||||
|
| |||||||||||||||||||
*As of period end.
At June 30, 2019, the Fund had the following forward exchange contracts outstanding. See Note 1(c).
Forward Exchange Contracts
| Currency | Counterpartya | Type | Quantity | Contract Amount | Settlement Date | Unrealized Appreciation | Unrealized Depreciation | |||||||||||||||||||||
| ||||||||||||||||||||||||||||
| OTC Forward Exchange Contracts |
| |||||||||||||||||||||||||||
Euro | BOFA | Buy | 3,684,026 | $ | 4,131,187 | 7/15/19 | $ | 63,119 | $ | — | ||||||||||||||||||
Euro | BOFA | Sell | 3,811,570 | 4,359,133 | 7/15/19 | 19,618 | — | |||||||||||||||||||||
Euro | HSBK | Buy | 4,797,083 | 5,365,649 | 7/15/19 | 95,883 | — | |||||||||||||||||||||
Euro | HSBK | Sell | 2,885,000 | 3,271,019 | 7/15/19 | — | (13,585 | ) | ||||||||||||||||||||
Euro | HSBK | Sell | 138,359,404 | 158,825,264 | 7/15/19 | 1,301,553 | — | |||||||||||||||||||||
Euro | SSBT | Buy | 920,707 | 1,029,226 | 7/15/19 | 19,009 | — | |||||||||||||||||||||
Euro | SSBT | Sell | 2,885,000 | 3,271,102 | 7/15/19 | — | (13,502 | ) | ||||||||||||||||||||
Euro | UBSW | Buy | 6,475,438 | 7,252,048 | 7/15/19 | 120,309 | — | |||||||||||||||||||||
Euro | UBSW | Sell | 6,929,162 | 7,933,026 | 7/15/19 | 44,099 | — | |||||||||||||||||||||
Swiss Franc | HSBK | Sell | 3,513,839 | 3,544,678 | 7/15/19 | — | (59,879 | ) | ||||||||||||||||||||
Swiss Franc | UBSW | Sell | 73,053,136 | 72,768,807 | 7/15/19 | — | (2,170,365 | ) | ||||||||||||||||||||
British Pound | HSBK | Buy | 3,737,297 | 4,723,547 | 7/16/19 | 27,056 | — | |||||||||||||||||||||
British Pound | HSBK | Sell | 23,780,677 | 30,887,339 | 7/16/19 | 658,927 | — | |||||||||||||||||||||
British Pound | UBSW | Buy | 5,662,240 | 7,217,322 | 7/16/19 | — | (19,860 | ) | ||||||||||||||||||||
Swedish Krona | BONY | Sell | 4,274,550 | 453,262 | 7/31/19 | — | (8,246 | ) | ||||||||||||||||||||
Swedish Krona | SSBT | Sell | 420,328,999 | 44,658,134 | 7/31/19 | — | (723,291 | ) | ||||||||||||||||||||
British Pound | BOFA | Sell | 8,545,441 | 11,259,569 | 8/14/19 | 382,416 | — | |||||||||||||||||||||
British Pound | BONY | Sell | 84,607,228 | 110,037,421 | 8/14/19 | 2,344,249 | — | |||||||||||||||||||||
British Pound | HSBK | Sell | 12,167,572 | 16,060,036 | 8/14/19 | 572,417 | — | |||||||||||||||||||||
British Pound | UBSW | Sell | 6,610,288 | 8,635,627 | 8/14/19 | 221,654 | — | |||||||||||||||||||||
Euro | SSBT | Sell | 22,005,834 | 24,900,701 | 10/18/19 | — | (339,016 | ) | ||||||||||||||||||||
British Pound | BONY | Sell | 48,931,671 | 64,235,626 | 10/24/19 | 1,780,091 | — | |||||||||||||||||||||
Euro | HSBK | Sell | 66,817,727 | 75,734,740 | 11/07/19 | — | (1,021,142 | ) | ||||||||||||||||||||
Euro | UBSW | Sell | 37,157,462 | 42,102,005 | 11/07/19 | — | (582,083 | ) | ||||||||||||||||||||
Euro | BOFA | Sell | 247,116 | 283,445 | 11/21/19 | — | (735 | ) | ||||||||||||||||||||
Euro | HSBK | Sell | 2,272,510 | 2,588,669 | 11/21/19 | — | (24,681 | ) | ||||||||||||||||||||
Euro | SSBT | Sell | 61,997,033 | 70,329,434 | 11/21/19 | — | (966,182 | ) | ||||||||||||||||||||
British Pound | BOFA | Sell | 291,225 | 373,278 | 11/22/19 | 1,155 | — | |||||||||||||||||||||
British Pound | HSBK | Sell | 904,061 | 1,157,795 | 11/22/19 | 2,598 | — | |||||||||||||||||||||
British Pound | SSBT | Sell | 17,504,525 | 22,302,953 | 11/22/19 | — | (64,095 | ) | ||||||||||||||||||||
| franklintempleton.com | Semiannual Report | 19 | ||||
FRANKLIN MUTUAL SERIES FUNDS
STATEMENT OF INVESTMENTS (UNAUDITED)
Franklin Mutual European Fund(continued)
Forward Exchange Contracts(continued)
| Currency | Counterpartya | Type | Quantity | Contract Amount | Settlement Date | Unrealized Appreciation | Unrealized Depreciation | |||||||||||||||||||||
| ||||||||||||||||||||||||||||
| OTC Forward Exchange Contracts(continued) |
| |||||||||||||||||||||||||||
British Pound | UBSW | Sell | 2,000,846 | $ | 2,546,675 | 11/22/19 | $ | — | $ | (9,981 | ) | |||||||||||||||||
|
| |||||||||||||||||||||||||||
Total Forward Exchange Contracts |
| $7,654,153 | $ | (6,016,643 | ) | |||||||||||||||||||||||
|
| |||||||||||||||||||||||||||
Net unrealized appreciation (depreciation) |
| $1,637,510 | ||||||||||||||||||||||||||
|
| |||||||||||||||||||||||||||
aMay be comprised of multiple contracts with the same counterparty, currency and settlement date.
See Note 10 regarding other derivative information.
See Abbreviations on page 36.
| 20 | Semiannual Report | The accompanying notes are an integral part of these financial statements. | franklintempleton.com | ||
FRANKLIN MUTUAL SERIES FUNDS
Statement of Assets and Liabilities
June 30, 2019 (unaudited)
Franklin Mutual European Fund
Assets: | ||||
Investments in securities: | ||||
Cost - Unaffiliated issuers | $1,651,334,434 | |||
Cost - Controlled affiliates (Note 11) | 6,282,509 | |||
|
| |||
Value - Unaffiliated issuers | $1,578,498,272 | |||
Value - Controlled affiliates (Note 11) | — | |||
Cash | 329,023 | |||
Foreign currency, at value (cost $3,222,963) | 3,228,263 | |||
Receivables: | ||||
Investment securities sold | 963,009 | |||
Capital shares sold | 553,769 | |||
Dividends | 7,392,298 | |||
European Union tax reclaims | 3,380,174 | |||
Deposits with brokers for: | ||||
Futures contracts | 9,790,520 | |||
Unrealized appreciation on OTC forward exchange contracts | 7,654,153 | |||
Other assets | 1,261 | |||
|
| |||
Total assets | 1,611,790,742 | |||
|
| |||
Liabilities: | ||||
Payables: | ||||
Capital shares redeemed | 1,949,820 | |||
Management fees | 1,119,234 | |||
Distribution fees | 362,566 | |||
Transfer agent fees | 549,933 | |||
Trustees’ fees and expenses | 141,470 | |||
Variation margin on futures contracts | 627,262 | |||
Unrealized depreciation on OTC forward exchange contracts | 6,016,643 | |||
Accrued expenses and other liabilities | 250,656 | |||
|
| |||
Total liabilities | 11,017,584 | |||
|
| |||
Net assets, at value | $1,600,773,158 | |||
|
| |||
Net assets consist of: | ||||
Paid-in capital | $1,665,247,934 | |||
Total distributable earnings (loss) | (64,474,776 | ) | ||
|
| |||
Net assets, at value | $1,600,773,158 | |||
|
| |||
| franklintempleton.com | The accompanying notes are an integral part of these financial statements. | Semiannual Report | 21 | ||||
FRANKLIN MUTUAL SERIES FUNDS
FINANCIAL STATEMENTS
Statement of Assets and Liabilities(continued)
June 30, 2019 (unaudited)
Franklin Mutual European Fund
| Class Z: | ||||
Net assets, at value | $797,029,735 | |||
|
| |||
Shares outstanding | 39,775,830 | |||
|
| |||
Net asset value and maximum offering price per share | $20.04 | |||
|
| |||
| Class A: | ||||
Net assets, at value | $575,473,318 | |||
|
| |||
Shares outstanding | 29,622,671 | |||
|
| |||
Net asset value per sharea | $19.43 | |||
|
| |||
Maximum offering price per share (net asset value per share ÷ 94.50%) | $20.56 | |||
|
| |||
| Class C: | ||||
Net assets, at value | $ 72,100,486 | |||
|
| |||
Shares outstanding | 3,683,920 | |||
|
| |||
Net asset value and maximum offering price per sharea | $19.57 | |||
|
| |||
| Class R: | ||||
Net assets, at value | $ 708,904 | |||
|
| |||
Shares outstanding | 37,222 | |||
|
| |||
Net asset value and maximum offering price per share | $19.05 | |||
|
| |||
| Class R6: | ||||
Net assets, at value | $155,460,715 | |||
|
| |||
Shares outstanding | 7,761,872 | |||
|
| |||
Net asset value and maximum offering price per share | $20.03 | |||
|
| |||
aRedemption price is equal to net asset value less contingent deferred sales charges, if applicable.
| 22 | Semiannual Report | The accompanying notes are an integral part of these financial statements. | franklintempleton.com | ||
FRANKLIN MUTUAL SERIES FUNDS
FINANCIAL STATEMENTS
Statement of Operations
for the six months ended June 30, 2019 (unaudited)
Franklin Mutual European Fund
Investment income: | ||||
Dividends: (net of foreign taxes)* | ||||
Unaffiliated issuers | $ 41,924,738 | |||
Interest: | ||||
Unaffiliated issuers | 1,162,119 | |||
|
| |||
Total investment income |
|
43,086,857 |
| |
|
| |||
Expenses: | ||||
Management fees (Note 3a) | 7,262,048 | |||
Distribution fees: (Note 3c) | ||||
Class A | 726,933 | |||
Class C | 384,975 | |||
Class R | 1,852 | |||
Transfer agent fees: (Note 3e) | ||||
Class Z | 666,571 | |||
Class A | 446,424 | |||
Class C | 59,093 | |||
Class R | 569 | |||
Class R6 | 20,733 | |||
Custodian fees (Note 4) | 135,843 | |||
Reports to shareholders | 69,647 | |||
Registration and filing fees | 52,354 | |||
Professional fees | 60,932 | |||
Trustees’ fees and expenses | 72,742 | |||
Other | 29,907 | |||
|
| |||
Total expenses | 9,990,623 | |||
Expense reductions (Note 4) | (10,966 | ) | ||
Expenses waived/paid by affiliates (Note 3f) | (5,260 | ) | ||
|
| |||
Net expenses | 9,974,397 | |||
|
| |||
Net investment income | 33,112,460 | |||
|
| |||
Realized and unrealized gains (losses): | ||||
Net realized gain (loss) from: | ||||
Investments: | ||||
Unaffiliated issuers | (18,761,959 | ) | ||
Foreign currency transactions | (120,005 | ) | ||
Forward exchange contracts | 29,436,698 | |||
Futures contracts | 13,011,842 | |||
Securities sold short | 709,734 | |||
|
| |||
Net realized gain (loss) | 24,276,310 | |||
|
| |||
Net change in unrealized appreciation (depreciation) on: | ||||
Investments: | ||||
Unaffiliated issuers | 151,408,802 | |||
Translation of other assets and liabilities denominated in foreign currencies | (144,663 | ) | ||
Forward exchange contracts | (9,695,987 | ) | ||
Futures contracts | (1,407,551 | ) | ||
Securities sold short | (1,515,523 | ) | ||
|
| |||
Net change in unrealized appreciation (depreciation) | 138,645,078 | |||
|
| |||
Net realized and unrealized gain (loss) | 162,921,388 | |||
|
| |||
Net increase (decrease) in net assets resulting from operations | $196,033,848 | |||
|
| |||
*Foreign taxes withheld on dividends | $ 3,958,791 | |||
| franklintempleton.com | The accompanying notes are an integral part of these financial statements. | Semiannual Report | 23 | ||||
FRANKLIN MUTUAL SERIES FUNDS
FINANCIAL STATEMENTS
Statements of Changes in Net Assets
Franklin Mutual European Fund
| Six Months Ended June 30, 2019 (unaudited) | Year Ended December 31, 2018 | |||||||
| ||||||||
Increase (decrease) in net assets: | ||||||||
Operations: | ||||||||
Net investment income | $ 33,112,460 | $ 51,748,479 | ||||||
Net realized gain (loss) | 24,276,310 | 168,364,634 | ||||||
Net change in unrealized appreciation (depreciation) | 138,645,078 | (457,535,035 | ) | |||||
|
| |||||||
Net increase (decrease) in net assets resulting from operations | 196,033,848 | (237,421,922 | ) | |||||
|
| |||||||
Distributions to shareholders: | ||||||||
Class Z | — | (39,537,213 | ) | |||||
Class A | — | (21,635,584 | ) | |||||
Class C | — | (2,285,511 | ) | |||||
Class R | — | (26,901 | ) | |||||
Class R6 | — | (6,073,341 | ) | |||||
|
| |||||||
Total distributions to shareholders | — | (69,558,550 | ) | |||||
|
| |||||||
Capital share transactions: (Note 2) | ||||||||
Class Z | (265,349,793 | ) | (197,936,001 | ) | ||||
Class A | (53,988,307 | ) | (56,127,793 | ) | ||||
Class C | (14,610,985 | ) | (84,206,336 | ) | ||||
Class R | (104,447 | ) | 38,579 | |||||
Class R6 | (12,070,233 | ) | (122,065,613 | ) | ||||
|
| |||||||
Total capital share transactions | (346,123,765 | ) | (460,297,164 | ) | ||||
|
| |||||||
Net increase (decrease) in net assets | (150,089,917 | ) | (767,277,636 | ) | ||||
Net assets: | ||||||||
Beginning of period | 1,750,863,075 | 2,518,140,711 | ||||||
|
| |||||||
End of period | $1,600,773,158 | $1,750,863,075 | ||||||
|
| |||||||
| 24 | Semiannual Report | The accompanying notes are an integral part of these financial statements. | franklintempleton.com | ||
FRANKLIN MUTUAL SERIES FUNDS
Notes to Financial Statements (unaudited)
Franklin Mutual European Fund
1. Organization and Significant Accounting Policies
Franklin Mutual Series Funds (Trust) is registered under the Investment Company Act of 1940 (1940 Act) as anopen-end management investment company, consisting of seven separate funds and applies the specialized accounting and reporting guidance in U.S. Generally Accepted Accounting Principles (U.S. GAAP). Franklin Mutual European Fund (Fund) is included in this report. The Fund offers five classes of shares: Class Z, Class A, Class C, Class R and Class R6. Class C shares automatically convert to Class A shares after they have been held for 10 years. Each class of shares may differ by its initial sales load, contingent deferred sales charges, voting rights on matters affecting a single class, its exchange privilege and fees due to differing arrangements for distribution and transfer agent fees.
The following summarizes the Fund’s significant accounting policies.
a. Financial Instrument Valuation
The Fund’s investments in financial instruments are carried at fair value daily. Fair value is the price that would be received to sell an asset or paid to transfer a liability in an orderly transaction between market participants on the measurement date. The Fund calculates the net asset value (NAV) per share each business day as of 4 p.m. Eastern time or the regularly scheduled close of the New York Stock Exchange (NYSE), whichever is earlier. Under compliance policies and procedures approved by the Trust’s Board of Trustees (the Board), the Fund’s administrator has responsibility for oversight of valuation, including leading the cross-functional Valuation Committee (VC). The Fund may utilize independent pricing services, quotations from securities and financial instrument dealers, and other market sources to determine fair value.
Equity securities and derivative financial instruments listed on an exchange or on the NASDAQ National Market System are valued at the last quoted sale price or the official closing price of the day, respectively. Foreign equity securities are valued as of the close of trading on the foreign stock exchange on which the security is primarily traded, or as of 4 p.m. Eastern time. The value is then converted into its U.S. dollar equivalent at the foreign exchange rate in effect at 4 p.m. Eastern time on the day that the value of the security is determined.Over-the-counter (OTC) securities are valued within the range of the most recent quoted bid and ask prices. Securities that trade in multiple markets or on multiple
exchanges are valued according to the broadest and most representative market. Certain equity securities are valued based upon fundamental characteristics or relationships to similar securities.
Debt securities generally trade in the OTC market rather than on a securities exchange. The Fund’s pricing services use multiple valuation techniques to determine fair value. In instances where sufficient market activity exists, the pricing services may utilize a market-based approach through which quotes from market makers are used to determine fair value. In instances where sufficient market activity may not exist or is limited, the pricing services also utilize proprietary valuation models which may consider market characteristics such as benchmark yield curves, credit spreads, estimated default rates, anticipated market interest rate volatility, coupon rates, anticipated timing of principal repayments, underlying collateral, and other unique security features in order to estimate the relevant cash flows, which are then discounted to calculate the fair value.
Certain derivative financial instruments trade in the OTC market. The Fund’s pricing services use various techniques including industry standard option pricing models and proprietary discounted cash flow models to determine the fair value of those instruments. The Fund’s net benefit or obligation under the derivative contract, as measured by the fair value of the contract, is included in net assets.
The Fund has procedures to determine the fair value of financial instruments for which market prices are not reliable or readily available. Under these procedures, the Fund primarily employs a market-based approach which may use related or comparable assets or liabilities, recent transactions, market multiples, book values, and other relevant information for the investment to determine the fair value of the investment. An income-based valuation approach may also be used in which the anticipated future cash flows of the investment are discounted to calculate fair value. Discounts may also be applied due to the nature or duration of any restrictions on the disposition of the investments. Due to the inherent uncertainty of valuations of such investments, the fair values may differ significantly from the values that would have been used had an active market existed.
Trading in securities on foreign securities stock exchanges and OTC markets may be completed before 4 p.m. Eastern time. In addition, trading in certain foreign markets may not take place on every Fund’s business day. Occasionally,
| franklintempleton.com | Semiannual Report | 25 | ||||
FRANKLIN MUTUAL SERIES FUNDS
NOTES TO FINANCIAL STATEMENTS (UNAUDITED)
Franklin Mutual European Fund(continued)
1. Organization and Significant Accounting Policies(continued)
a. Financial Instrument Valuation(continued)
events occur between the time at which trading in a foreign security is completed and 4 p.m. Eastern time that might call into question the reliability of the value of a portfolio security held by the Fund. As a result, differences may arise between the value of the Fund’s portfolio securities as determined at the foreign market close and the latest indications of value at 4 p.m. Eastern time. In order to minimize the potential for these differences, the VC monitors price movements following the close of trading in foreign stock markets through a series of country specific market proxies (such as baskets of American Depositary Receipts, futures contracts and exchange traded funds). These price movements are measured against established trigger thresholds for each specific market proxy to assist in determining if an event has occurred that may call into question the reliability of the values of the foreign securities held by the Fund. If such an event occurs, the securities may be valued using fair value procedures, which may include the use of independent pricing services.
When the last day of the reporting period is anon-business day, certain foreign markets may be open on those days that the Fund’s NAV is not calculated, which could result in differences between the value of the Fund’s portfolio securities on the last business day and the last calendar day of the reporting period. Any significant security valuation changes due to an open foreign market are adjusted and reflected by the Fund for financial reporting purposes.
b. Foreign Currency Translation
Portfolio securities and other assets and liabilities denominated in foreign currencies are translated into U.S. dollars based on the exchange rate of such currencies against U.S. dollars on the date of valuation. The Fund may enter into foreign currency exchange contracts to facilitate transactions denominated in a foreign currency. Purchases and sales of securities, income and expense items denominated in foreign currencies are translated into U.S. dollars at the exchange rate in effect on the transaction date. Portfolio securities and assets and liabilities denominated in foreign currencies contain risks that those currencies will decline in value relative to the U.S. dollar. Occasionally, events may impact the availability or reliability of foreign exchange rates used to convert the U.S. dollar equivalent
value. If such an event occurs, the foreign exchange rate will be valued at fair value using procedures established and approved by the Board.
The Fund does not separately report the effect of changes in foreign exchange rates from changes in market prices on securities held. Such changes are included in net realized and unrealized gain or loss from investments in the Statement of Operations.
Realized foreign exchange gains or losses arise from sales of foreign currencies, currency gains or losses realized between the trade and settlement dates on securities transactions and the difference between the recorded amounts of dividends, interest, and foreign withholding taxes and the U.S. dollar equivalent of the amounts actually received or paid. Net unrealized foreign exchange gains and losses arise from changes in foreign exchange rates on foreign denominated assets and liabilities other than investments in securities held at the end of the reporting period.
c. Derivative Financial Instruments
The Fund invested in derivative financial instruments in order to manage risk or gain exposure to various other investments or markets. Derivatives are financial contracts based on an underlying or notional amount, require no initial investment or an initial net investment that is smaller than would normally be required to have a similar response to changes in market factors, and require or permit net settlement. Derivatives contain various risks including the potential inability of the counterparty to fulfill their obligations under the terms of the contract, the potential for an illiquid secondary market, and/or the potential for market movements which expose the Fund to gains or losses in excess of the amounts shown in the Statement of Assets and Liabilities. Realized gain and loss and unrealized appreciation and depreciation on these contracts for the period are included in the Statement of Operations.
Derivative counterparty credit risk is managed through a formal evaluation of the creditworthiness of all potential counterparties. The Fund attempts to reduce its exposure to counterparty credit risk on OTC derivatives, whenever possible, by entering into International Swaps and Derivatives Association (ISDA) master agreements with certain counterparties. These agreements contain various provisions, including but not limited to collateral requirements, events of default, or early termination. Termination events applicable to the counterparty include certain deteriorations in the credit
| 26 | Semiannual Report | franklintempleton.com | ||
FRANKLIN MUTUAL SERIES FUNDS
NOTES TO FINANCIAL STATEMENTS (UNAUDITED)
Franklin Mutual European Fund(continued)
quality of the counterparty. Termination events applicable to the Fund include failure of the Fund to maintain certain net asset levels and/or limit the decline in net assets over various periods of time. In the event of default or early termination, the ISDA master agreement gives thenon-defaulting party the right to net andclose-out all transactions traded, whether or not arising under the ISDA agreement, to one net amount payable by one counterparty to the other. However, absent an event of default or early termination, OTC derivative assets and liabilities are presented gross and not offset in the Statement of Assets and Liabilities. Early termination by the counterparty may result in an immediate payment by the Fund of any net liability owed to that counterparty under the ISDA agreement. At June 30, 2019, the Fund had OTC derivatives in a net liability position of $4,483,304 and the aggregate value of collateral pledged for such contracts was $4,688,128.
Collateral requirements differ by type of derivative. Collateral or initial margin requirements are set by the broker or exchange clearing house for exchange traded and centrally cleared derivatives. Initial margin deposited is held at the exchange and can be in the form of cash and/or securities. For OTC derivatives traded under an ISDA master agreement, posting of collateral is required by either the Fund or the applicable counterparty if the total net exposure of all OTC derivatives with the applicable counterparty exceeds the minimum transfer amount, which typically ranges from $100,000 to $250,000, and can vary depending on the counterparty and the type of the agreement. Generally, collateral is determined at the close of Fund business each day and any additional collateral required due to changes in derivative values may be delivered by the Fund or the counterparty the next business day, or within a few business days. Collateral pledged and/or received by the Fund for OTC derivatives, if any, is held in segregated accounts with the Fund’s custodian/counterparty broker and can be in the form of cash and/or securities. Unrestricted cash may be invested according to the Fund’s investment objectives. To the extent that the amounts due to the Fund from its counterparties are not subject to collateralization or are not fully collateralized, the Fund bears the risk of loss from counterpartynon-performance.
At June 30, 2019, the Fund received $6,602,293 in U.K. Treasury Bonds and U.S. Treasury Bills, Bonds and Notes as collateral for derivatives.
The Fund entered into exchange traded futures contracts primarily to manage exposure to certain foreign currencies. A futures contract is an agreement between the Fund and a counterparty to buy or sell an asset at a specified price on a future date. Required initial margins are pledged by the Fund, and the daily change in fair value is accounted for as a variation margin payable or receivable in the Statement of Assets and Liabilities.
The Fund entered into OTC forward exchange contracts primarily to manage exposure to certain foreign currencies. A forward exchange contract is an agreement between the Fund and a counterparty to buy or sell a foreign currency at a specific exchange rate on a future date.
See Note 10 regarding other derivative information.
d. Securities Sold Short
The Fund is engaged in selling securities short, which obligates the Fund to replace a borrowed security with the same security at current fair value. The Fund incurs a loss if the price of the security increases between the date of the short sale and the date on which the Fund replaces the borrowed security. The Fund realizes a gain if the price of the security declines between those dates. Gains are limited to the price at which the Fund sold the security short, while losses are potentially unlimited in size.
The Fund is required to establish a margin account with the broker lending the security sold short. While the short sale is outstanding, the broker retains the proceeds of the short sale to the extent necessary to meet margin requirements until the short position is closed out. A deposit must also be maintained with the Fund’s custodian/counterparty broker consisting of cash and/or securities having a value equal to a specified percentage of the value of the securities sold short. The Fund is obligated to pay fees for borrowing the securities sold short and is required to pay the counterparty any dividends and/or interest due on securities sold short. Such dividends and/or interest and any security borrowing fees are recorded as an expense to the Fund. At June 30, 2019, the Fund had no securities sold short.
e. Securities Lending
The Fund participates in an agency based securities lending program to earn additional income. The Fund receives cash collateral against the loaned securities in an amount equal to at least 102% of the fair value of the loaned securities.
| franklintempleton.com | Semiannual Report | 27 | ||||
FRANKLIN MUTUAL SERIES FUNDS
NOTES TO FINANCIAL STATEMENTS (UNAUDITED)
Franklin Mutual European Fund(continued)
1. Organization and Significant Accounting Policies(continued)
e. Securities Lending(continued)
Collateral is maintained over the life of the loan in an amount not less than 100% of the fair value of loaned securities, as determined at the close of Fund business each day; any additional collateral required due to changes in security values is delivered to the Fund on the next business day. The collateral is deposited into a joint cash account with other funds and is used to invest in a money market fund managed by Franklin Advisers, Inc., an affiliate of the Fund, and/or a joint repurchase agreement. The Fund may receive income from the investment of cash collateral, in addition to lending fees and rebates paid by the borrower. Income from securities loaned, net of fees paid to the securities lending agent and/or third-party vendor, is reported separately in the Statement of Operations. The Fund bears the market risk with respect to the collateral investment, securities loaned, and the risk that the agent may default on its obligations to the Fund. If the borrower defaults on its obligation to return the securities loaned, the Fund has the right to repurchase the securities in the open market using the collateral received. The securities lending agent has agreed to indemnify the Fund in the event of default by a third party borrower. At June 30, 2019, the Fund had no securities on loan.
f. Income and Deferred Taxes
It is the Fund’s policy to qualify as a regulated investment company under the Internal Revenue Code. The Fund intends to distribute to shareholders substantially all of its taxable income and net realized gains to relieve it from federal income and excise taxes. As a result, no provision for U.S. federal income taxes is required.
The Fund may be subject to foreign taxation related to income received, capital gains on the sale of securities and certain foreign currency transactions in the foreign jurisdictions in which it invests. Foreign taxes, if any, are recorded based on the tax regulations and rates that exist in the foreign markets in which the Fund invests. When a capital gain tax is determined to apply, the Fund records an estimated deferred tax liability in an amount that would be payable if the securities were disposed of on the valuation date.
As a result of several court cases, in certain countries across the European Union, the Fund filed additional tax reclaims for previously withheld taxes on dividends earned in those countries (EU reclaims). These additional filings are subject to various administrative proceedings by the local jurisdictions’ tax authorities within the European Union, as well as a number of related judicial proceedings. Income recognized, if any, for EU reclaims is reflected as other income in the Statement of Operations and any related receivable, if any, is reflected as European Union tax reclaims in the Statement of Assets and Liabilities. When uncertainty exists as to the ultimate resolution of these proceedings, the likelihood of receipt of these EU reclaims, and the potential timing of payment, no amounts are reflected in the financial statements. For U.S. income tax purposes, EU reclaims received by the Fund, if any, reduce the amounts of foreign taxes Fund shareholders can use as tax credits in their individual income tax returns.
The Fund may recognize an income tax liability related to its uncertain tax positions under U.S. GAAP when the uncertain tax position has a less than 50% probability that it will be sustained upon examination by the tax authorities based on its technical merits. As of June 30, 2019, the Fund has determined that no tax liability is required in its financial statements related to uncertain tax positions for any open tax years (or expected to be taken in future tax years). Open tax years are those that remain subject to examination and are based on the statute of limitations in each jurisdiction in which the Fund invests.
g. Security Transactions, Investment Income, Expenses and Distributions
Security transactions are accounted for on trade date. Realized gains and losses on security transactions are determined on a specific identification basis. Interest income and estimated expenses are accrued daily. Amortization of premium and accretion of discount on debt securities are included in interest income. Dividend income and dividends declared on securities sold short are recorded on theex-dividend date except for certain dividends from securities where the dividend rate is not available. In such cases, the dividend is recorded as soon as the information is received by the Fund. Distributions to shareholders are recorded on theex-dividend date. Distributable earnings are determined according to income tax regulations (tax basis) and may differ from earnings recorded in accordance with U.S. GAAP. These differences may be permanent or temporary. Permanent
| 28 | Semiannual Report | franklintempleton.com | ||
FRANKLIN MUTUAL SERIES FUNDS
NOTES TO FINANCIAL STATEMENTS (UNAUDITED)
Franklin Mutual European Fund(continued)
differences are reclassified among capital accounts to reflect their tax character. These reclassifications have no impact on net assets or the results of operations. Temporary differences are not reclassified, as they may reverse in subsequent periods.
Common expenses incurred by the Trust are allocated among the Funds based on the ratio of net assets of each Fund to the combined net assets of the Trust or based on the ratio of number of shareholders of each Fund to the combined number of shareholders of the Trust. Fund specific expenses are charged directly to the Fund that incurred the expense.
Realized and unrealized gains and losses and net investment income, excluding class specific expenses, are allocated daily to each class of shares based upon the relative proportion of net assets of each class. Differences in per share distributions by class are generally due to differences in class specific expenses.
h. Accounting Estimates
The preparation of financial statements in accordance with U.S. GAAP requires management to make estimates and assumptions that affect the reported amounts of assets and
liabilities at the date of the financial statements and the amounts of income and expenses during the reporting period. Actual results could differ from those estimates.
i. Guarantees and Indemnifications
Under the Trust’s organizational documents, its officers and trustees are indemnified by the Trust against certain liabilities arising out of the performance of their duties to the Trust. Additionally, in the normal course of business, the Trust, on behalf of the Fund, enters into contracts with service providers that contain general indemnification clauses. The Trust’s maximum exposure under these arrangements is unknown as this would involve future claims that may be made against the Trust that have not yet occurred. Currently, the Trust expects the risk of loss to be remote.
2. Shares of Beneficial Interest
At June 30, 2019, there were an unlimited number of shares authorized (without par value). Transactions in the Fund’s shares were as follows:
Six Months Ended June 30, 2019 | Year Ended December 31, 2018 | |||||||||||||||
| Shares | Amount | Shares | Amount | |||||||||||||
| Class Z Shares: | ||||||||||||||||
Shares sold | 3,003,797 | $ | 58,172,567 | 15,870,789 | $ | 328,884,286 | ||||||||||
Shares issued in reinvestment of distributions | — | — | 2,023,721 | 37,225,839 | ||||||||||||
Shares redeemed | (16,777,038 | ) | (323,522,360 | ) | (27,834,376 | ) | (564,046,126 | ) | ||||||||
|
| |||||||||||||||
Net increase (decrease) | (13,773,241 | ) | $ | (265,349,793 | ) | (9,939,866 | ) | $ | (197,936,001 | ) | ||||||
|
| |||||||||||||||
| Class A Shares: | ||||||||||||||||
| Shares solda | 1,523,609 | $ | 28,488,618 | 6,861,993 | $ | 134,662,400 | ||||||||||
| Shares issued in reinvestment of distributions | — | — | 870,701 | 15,538,916 | ||||||||||||
| Shares redeemed | (4,374,956 | ) | (82,476,925 | ) | (10,421,209 | ) | (206,329,109 | ) | ||||||||
|
| |||||||||||||||
Net increase (decrease) | (2,851,347 | ) | $ | (53,988,307 | ) | (2,688,515 | ) | $ | (56,127,793 | ) | ||||||
|
| |||||||||||||||
| franklintempleton.com | Semiannual Report | 29 | ||||
FRANKLIN MUTUAL SERIES FUNDS
NOTES TO FINANCIAL STATEMENTS (UNAUDITED)
Franklin Mutual European Fund(continued)
2. Shares of Beneficial Interest(continued)
Six Months Ended June 30, 2019
| Year Ended December 31, 2018
| |||||||||||||||
| Shares | Amount | Shares | Amount | |||||||||||||
| Class C Shares: | ||||||||||||||||
Shares sold | 94,027 | $ 1,785,956 | 486,940 | $ 9,826,395 | ||||||||||||
Shares issued in reinvestment of distributions | — | — | 117,682 | 2,203,229 | ||||||||||||
Shares redeemeda | (859,546 | ) | (16,396,941 | ) | (4,944,916 | ) | (96,235,960) | |||||||||
|
| |||||||||||||||
Net increase (decrease) | (765,519 | ) | $ (14,610,985 | ) | (4,340,294 | ) | $ (84,206,336) | |||||||||
|
| |||||||||||||||
| Class R Shares: | ||||||||||||||||
Shares sold | 2,445 | $ 45,249 | 8,109 | $ 162,976 | ||||||||||||
Shares issued in reinvestment of distributions | — | — | 1,528 | 26,901 | ||||||||||||
Shares redeemed | (8,111 | ) | (149,696 | ) | (7,860 | ) | (151,298) | |||||||||
|
| |||||||||||||||
Net increase (decrease) | (5,666 | ) | $ (104,447 | ) | 1,777 | $ 38,579 | ||||||||||
|
| |||||||||||||||
| Class R6 Shares: | ||||||||||||||||
Shares sold | 205,886 | $ 3,979,085 | 1,059,999 | $ 21,160,059 | ||||||||||||
Shares issued in reinvestment of distributions | — | — | 261,913 | 4,800,226 | ||||||||||||
Shares redeemed | (825,071 | ) | (16,049,318 | ) | (7,032,513 | ) | (148,025,898) | |||||||||
|
| |||||||||||||||
Net increase (decrease) | (619,185 | ) | $ (12,070,233 | ) | (5,710,601 | ) | $(122,065,613) | |||||||||
|
| |||||||||||||||
aMay include a portion of Class C shares that were automatically converted to Class A.
3. Transactions with Affiliates
Franklin Resources, Inc. is the holding company for various subsidiaries that together are referred to as Franklin Templeton. Certain officers and trustees of the Fund are also officers and/or directors of the following subsidiaries:
| Subsidiary | Affiliation | |
Franklin Mutual Advisers, LLC (Franklin Mutual) | Investment manager | |
Franklin Templeton Services, LLC (FT Services) | Administrative manager | |
Franklin Templeton Distributors, Inc. (Distributors) | Principal underwriter | |
Franklin Templeton Investor Services, LLC (Investor Services) | Transfer agent | |
a. Management Fees
The Fund pays an investment management fee to Franklin Mutual based on the average daily net assets of the Fund as follows:
| Annualized Fee Rate | Net Assets | |
0.875% | Up to and including $1 billion | |
0.845% | Over $1 billion, up to and including $2 billion | |
0.825% | Over $2 billion, up to and including $5 billion | |
0.805% | In excess of $5 billion | |
For the period ended June 30, 2019, the annualized gross effective investment management fee rate was 0.863% of the Fund’s average daily net assets.
| 30 | Semiannual Report | franklintempleton.com | ||
FRANKLIN MUTUAL SERIES FUNDS
NOTES TO FINANCIAL STATEMENTS (UNAUDITED)
Franklin Mutual European Fund(continued)
b. Administrative Fees
Under an agreement with Franklin Mutual, FT Services provides administrative services to the Fund. The fee is paid by Franklin Mutual based on the Fund’s average daily net assets, and is not an additional expense of the Fund.
c. Distribution Fees
The Board has adopted distribution plans for each share class, with the exception of Class Z and Class R6 shares, pursuant to Rule12b-1 under the 1940 Act. Under the Fund’s Class A reimbursement distribution plan, the Fund reimburses Distributors for costs incurred in connection with the servicing, sale and distribution of the Fund’s shares up to the maximum annual plan rate. Under the Class A reimbursement distribution plan, costs exceeding the maximum for the current plan year cannot be reimbursed in subsequent periods. In addition, under the Fund’s Class C and R compensation distribution plans, the Fund pays Distributors for costs incurred in connection with the servicing, sale and distribution of the Fund’s shares up to the maximum annual plan rate for each class. The plan year, for purposes of monitoring compliance with the maximum annual plan rates, is February 1 through January 31.
The maximum annual plan rates, based on the average daily net assets, for each class, are as follows:
Class A | 0.35% | |||
Class C | 1.00% | |||
Class R | 0.50% |
The Board has set the current rate at 0.25% per year for Class A shares until further notice and approval by the Board.
d. Sales Charges/Underwriting Agreements
Front-end sales charges and contingent deferred sales charges (CDSC) do not represent expenses of the Fund. These charges are deducted from the proceeds of sales of Fund shares prior to investment or from redemption proceeds prior to remittance, as applicable. Distributors has advised the Fund of the following commission transactions related to the sales and redemptions of the Fund’s shares for the period:
Sales charges retained net of commissions paid to unaffiliated brokers/dealers | $ | 7,269 | ||
CDSC retained | $ | 3,384 |
e. Transfer Agent Fees
Each class of shares pays transfer agent fees to Investor Services for its performance of shareholder servicing obligations. The fees are based on an annualized asset based fee of 0.02% plus a transaction based fee. In addition, each class reimburses Investor Services for out of pocket expenses incurred and, except for Class R6 reimburses shareholder servicing fees paid to third parties. These fees are allocated daily based upon their relative proportion of such classes’ aggregate net assets. Class R6 pays Investor Services transfer agent fees specific to that class.
For the period ended June 30, 2019, the Fund paid transfer agent fees of $1,193,390, of which $398,577 was retained by Investor Services.
f. Waiver and Expense Reimbursements
Investor Services has contractually agreed in advance to waive or limit its fees so that the Class R6 transfer agent fees do not exceed 0.02% based on the average net assets of the class until April 30, 2020.
| franklintempleton.com | Semiannual Report | 31 | ||||
FRANKLIN MUTUAL SERIES FUNDS
NOTES TO FINANCIAL STATEMENTS (UNAUDITED)
Franklin Mutual European Fund(continued)
3. Transactions with Affiliates(continued)
g. Other Affiliated Transactions
At June 30, 2019, one or more of the funds in Franklin Fund Allocator Series owned 6.9% of the Fund’s outstanding shares.
h. Interfund Transactions
The Fund engaged in purchases and sales of investments with funds or other accounts that have common investment managers (or affiliated investment managers), directors, trustees or officers. During the period ended June 30, 2019, these purchase and sale transactions aggregated $0 and $12,456,798, respectively.
4. Expense Offset Arrangement
The Fund has entered into an arrangement with its custodian whereby credits realized as a result of uninvested cash balances are used to reduce a portion of the Fund’s custodian expenses. During the period ended June 30, 2019, the custodian fees were reduced as noted in the Statement of Operations.
5. Independent Trustees’ Retirement Plan
On January 1, 1993, the Trust adopted an Independent Trustees’ Retirement Plan (Plan). The Plan is an unfunded defined benefit plan that provides benefit payments to Trustees whose length of service and retirement age meets the eligibility requirements of the Plan. Benefits under the Plan are based on years of service and fees paid to each trustee at the time of retirement. Effective in December 1996, the Plan was closed to new participants.
During the period ended June 30, 2019, the Fund’s projected benefit obligation and benefit payments under the Plan were as follows:
aProjected benefit obligation at June 30, 2019 | $141,470 | |||
bIncrease in projected benefit obligation | $ 16,786 | |||
Benefit payments made to retired trustees | $ (1,102 | ) |
aThe projected benefit obligation is included in trustees’ fees and expenses in the Statement of Assets and Liabilities.
bThe increase in projected benefit obligation is included in trustees’ fees and expenses in the Statement of Operations.
6. Income Taxes
For tax purposes, capital losses may be carried over to offset future capital gains.
At December 31, 2018, the capital loss carryforwards were as follows:
Capital loss carryforwards not subject to expiration: | ||||
Short term | $ | 26,173,614 | ||
Long term | 12,955,592 | |||
|
| |||
Total capital loss carryforwards | $ | 39,129,206 | ||
|
| |||
| 32 | Semiannual Report | franklintempleton.com | ||
FRANKLIN MUTUAL SERIES FUNDS
NOTES TO FINANCIAL STATEMENTS (UNAUDITED)
Franklin Mutual European Fund(continued)
At June 30, 2019, the cost of investments and net unrealized appreciation (depreciation) for income tax purposes were as follows:
Cost of investments | $ | 1,665,759,585 | ||
|
| |||
Unrealized appreciation | $ | 174,089,134 | ||
Unrealized depreciation | (260,730,417 | ) | ||
|
| |||
Net unrealized appreciation (depreciation) | $ | (86,641,283 | ) | |
|
| |||
Differences between income and/or capital gains as determined on a book basis and a tax basis are primarily due to differing treatment of foreign currency transactions.
7. Investment Transactions
Purchases and sales of investments (excluding short term securities and securities sold short) for the period ended June 30, 2019, aggregated $91,784,715 and $413,266,937, respectively.
8. Concentration of Risk
Investing in foreign securities may include certain risks and considerations not typically associated with investing in U.S. securities, such as fluctuating currency values and changing local and regional economic, political and social conditions, which may result in greater market volatility. Current political and financial uncertainty surrounding the European Union may increase market volatility and the economic risk of investing in securities in Europe. In addition, certain foreign securities may not be as liquid as U.S. securities.
9. Restricted Securities
The Fund invests in securities that are restricted under the Securities Act of 1933 (1933 Act). Restricted securities are often purchased in private placement transactions, and cannot be sold without prior registration unless the sale is pursuant to an exemption under the 1933 Act. Disposal of these securities may require greater effort and expense, and prompt sale at an acceptable price may be difficult. The Fund may have registration rights for restricted securities. The issuer generally incurs all registration costs.
At June 30, 2019, investments in restricted securities, excluding securities exempt from registration under the 1933 Act deemed to be liquid, were as follows:
| Shares | Issuer | Acquisition Date | Cost | Value | ||||||||||||
| 16,127,149 | Euro Wagon LP (Value is —% of Net Assets) | 12/08/05 - 1/02/08 | $ | 6,282,509 | $ | — | ||||||||||
|
| |||||||||||||||
| franklintempleton.com | Semiannual Report | 33 | ||||
FRANKLIN MUTUAL SERIES FUNDS
NOTES TO FINANCIAL STATEMENTS (UNAUDITED)
Franklin Mutual European Fund(continued)
10. Other Derivative Information
At June 30, 2019, investments in derivative contracts are reflected in the Statement of Assets and Liabilities as follows:
Asset Derivatives | Liability Derivatives | |||||||||||
Derivative Contracts Not Accounted for as Hedging Instruments | Statement of Assets and Liabilities Location | Fair Value | Statement of Assets and Liabilities | Fair Value | ||||||||
| Foreign exchange contracts | Variation margin on futures | $ 187,045 | a | Variation margin on futures | $1,215,803 | a | ||||||
Unrealized appreciation on OTC forward exchange contracts | 7,654,153 | Unrealized depreciation on OTC forward exchange contracts | 6,016,643 | |||||||||
|
|
|
| |||||||||
| Totals | $7,841,198 | $7,232,446 | ||||||||||
|
|
|
| |||||||||
aThis amount reflects the cumulative appreciation (depreciation) of futures contracts as reported in the Statement of Investments. Only the variation margin receivable/ payable at period end is separately reported within the Statement of Assets and Liabilities. Prior variation margin movements were recorded to cash upon receipt or payment.
For the period ended June 30, 2019, the effect of derivative contracts in the Statement of Operations was as follows:
Derivative Contracts Hedging Instruments | Statement of Operations Location | Net Realized Gain (Loss) for the Period | Statement of Operations Location | Net Change in Unrealized Appreciation (Depreciation) for the Period | ||||||||
Net realized gain (loss) from: | Net change in unrealized appreciation (depreciation) on: | |||||||||||
Foreign exchange contracts | Forward exchange contracts | $ | 29,436,698 | Forward exchange contracts | $ | (9,695,987 | ) | |||||
Futures contracts | 13,011,842 | Futures contracts | (1,407,551 | ) | ||||||||
|
|
|
| |||||||||
Totals | $ | 42,448,540 | $ | (11,103,538 | ) | |||||||
|
|
|
| |||||||||
For the period ended June 30, 2019, the average month end notional amount of futures contracts represented $566,909,265. The average month end contract value of forward exchange contracts was $932,660,815.
See Note 1(c) regarding derivative financial instruments.
11. Holdings of 5% Voting Securities of Portfolio Companies
The 1940 Act defines “affiliated companies” to include investments in portfolio companies in which a fund owns 5% or more of the outstanding voting securities. During the period ended June 30, 2019, investments in “affiliated companies” were as follows:
| Name of Issuer | Value at Beginning of Period | Purchases | Sales | Realized Gain (Loss) | Net Change in Unrealized Appreciation (Depreciation) | Value at End of Period | Number of Shares Held at End of Period | Dividend Income | ||||||||||||||||||||||||
| Controlled Affiliatesa | ||||||||||||||||||||||||||||||||
Euro Wagon LP (Value is —% of Net Assets) | $ — | $ — | $ — | $ — | $ — | $ — | 16,127,149 | $ — | ||||||||||||||||||||||||
|
|
|
| |||||||||||||||||||||||||||||
aIssuer in which the Fund owns 25% or more of the outstanding voting securities.
| 34 | Semiannual Report | franklintempleton.com | ||
FRANKLIN MUTUAL SERIES FUNDS
NOTES TO FINANCIAL STATEMENTS (UNAUDITED)
Franklin Mutual European Fund(continued)
12. Credit Facility
The Fund, together with other U.S. registered and foreign investment funds (collectively, Borrowers), managed by Franklin Templeton, are borrowers in a joint syndicated senior unsecured credit facility totaling $2 billion (Global Credit Facility) which matures on February 7, 2020. This Global Credit Facility provides a source of funds to the Borrowers for temporary and emergency purposes, including the ability to meet future unanticipated or unusually large redemption requests.
Under the terms of the Global Credit Facility, the Fund shall, in addition to interest charged on any borrowings made by the Fund and other costs incurred by the Fund, pay its share of fees and expenses incurred in connection with the implementation and maintenance of the Global Credit Facility, based upon its relative share of the aggregate net assets of all of the Borrowers, including an annual commitment fee of 0.15% based upon the unused portion of the Global Credit Facility. These fees are reflected in other expenses in the Statement of Operations. During the period ended June 30, 2019, the Fund did not use the Global Credit Facility.
13. Fair Value Measurements
The Fund follows a fair value hierarchy that distinguishes between market data obtained from independent sources
(observable inputs) and the Fund’s own market assumptions (unobservable inputs). These inputs are used in determining the value of the Fund’s financial instruments and are summarized in the following fair value hierarchy:
| • | Level 1 – quoted prices in active markets for identical financial instruments |
| • | Level 2 – other significant observable inputs (including quoted prices for similar financial instruments, interest rates, prepayment speed, credit risk, etc.) |
| • | Level 3 – significant unobservable inputs (including the Fund’s own assumptions in determining the fair value of financial instruments) |
The input levels are not necessarily an indication of the risk or liquidity associated with financial instruments at that level.
A summary of inputs used as of June 30, 2019, in valuing the Fund’s assets and liabilities carried at fair value, is as follows:
| Level 1 | Level 2 | Level 3 | Total | |||||||||||||
Assets: | ||||||||||||||||
Investments in Securities:a | ||||||||||||||||
Equity Investments:b | ||||||||||||||||
Machinery | $ | 53,757,925 | $ | 8,544,737 | $ | — | $ | 62,302,662 | ||||||||
All Other Equity Investments | 1,423,794,765 | — | — | c | 1,423,794,765 | |||||||||||
Short Term Investments | 49,900,845 | 42,500,000 | — | 92,400,845 | ||||||||||||
|
| |||||||||||||||
Total Investments in Securities | $ | 1,527,453,535 | $ | 51,044,737 | $ | — | $ | 1,578,498,272 | ||||||||
|
| |||||||||||||||
Other Financial Instruments: | ||||||||||||||||
Futures Contracts | $ | 187,045 | $ | — | $ | — | $ | 187,045 | ||||||||
Forward Exchange Contracts | — | 7,654,153 | — | 7,654,153 | ||||||||||||
|
| |||||||||||||||
Total Other Financial Instruments | $ | 187,045 | $ | 7,654,153 | $ | — | $ | 7,841,198 | ||||||||
|
| |||||||||||||||
| franklintempleton.com | Semiannual Report | 35 | ||||
FRANKLIN MUTUAL SERIES FUNDS
NOTES TO FINANCIAL STATEMENTS (UNAUDITED)
Franklin Mutual European Fund(continued)
13. Fair Value Measurements(continued)
| Level 1 | Level 2 | Level 3 | Total | |||||||||||||
| Liabilities: | ||||||||||||||||
Other Financial Instruments: | ||||||||||||||||
Futures Contracts | $ | 1,215,803 | $ | — | $ | — | $ | 1,215,803 | ||||||||
Forward Exchange Contracts | — | 6,016,643 | — | 6,016,643 | ||||||||||||
|
| |||||||||||||||
Total Other Financial Instruments | $ | 1,215,803 | $ | 6,016,643 | $ | — | $ | 7,232,446 | ||||||||
|
| |||||||||||||||
aFor detailed categories, see the accompanying Statement of Investments.
bIncludes common and preferred stocks.
cIncludes securities determined to have no value at June 30, 2019.
A reconciliation of assets in which Level 3 inputs are used in determining fair value is presented when there are significant Level 3 financial instruments at the beginning and/or end of the period.
14. New Accounting Pronouncements
In August 2018, the Financial Accounting Standards Board issued Accounting Standards Update (ASU)No. 2018-14, Compensation—Retirement Benefits—Defined Benefit Plans—General (Subtopic715-20): Disclosure Framework—Changes to the Disclosure Requirements for Defined Benefit Plans. The amendments in the ASU modify the disclosure requirements for employers that sponsor defined benefit pension or other postretirement plans. The ASU is effective for annual reporting periods ending after December 15, 2020. Management has reviewed the requirements and believes the adoption of this ASU will not have a material impact on the financial statements.
15. Subsequent Events
The Fund has evaluated subsequent events through the issuance of the financial statements and determined that no events have occurred that require disclosure.
Abbreviations
| Counterparty | Currency | Selected Portfolio | ||||||||
| BOFA | Bank of America Corp. | EUR | Euro | ADR | American Depositary Receipt | |||||
| BONY | The Bank of New York Mellon Corp. | GBP | British Pound | FHLB | Federal Home Loan Bank | |||||
| HSBK | HSBC Bank PLC | USD | United States Dollar | |||||||
| SSBT | State Street Bank and Trust Co., N.A. | |||||||||
| UBSW | UBS AG | |||||||||
| 36 | Semiannual Report | franklintempleton.com | ||
FRANKLIN MUTUAL SERIES FUNDS
FRANKLIN MUTUAL EUROPEAN FUND
Board Approval of Investment Management Agreements
FRANKLIN MUTUAL SERIES FUNDS
Franklin Mutual European Fund
(Fund)
The Board of Trustees (Board), including a majority of trustees that are not “interested persons” as such term is defined in section 2(a)(19) of the Investment Company Act of 1940 (hereinafter referred to as “independent trustees”), at anin-person meeting held on May 22, 2019, unanimously approved the renewal of the Fund’s investment management agreement. Prior to a meeting of all of the trustees for the purpose of considering such renewal, the independent trustees participated in two other meetings held in connection with the renewal process. Throughout the process, the independent trustees received assistance and advice from and met separately with independent counsel. The independent trustees met with and interviewed officers of the investment manager (including portfolio managers), the transfer agent and shareholder services group and the distributor. In approving the renewal of the investment management agreement for the Fund, the Board, including the independent trustees, determined that the investment management fee structure was fair and reasonable and that continuance of the agreement was in the best interests of the Fund and its shareholders.
In reaching their decision on the investment management agreement, the trustees took into account information furnished throughout the year at regular Board meetings, as well as information specifically requested and furnished for the renewal process, which culminated in the meetings referred to above for the specific purpose of considering such agreement. Information furnished throughout the year included, among others, reports on the Fund’s investment performance, expenses, portfolio composition, portfolio brokerage execution, client commission arrangements, derivatives, securities lending, asset segregation, portfolio turnover, Rule12b-1 plan, distribution, shareholder servicing, legal and compliance matters, pricing of securities, sales and redemptions, and marketing support payments made to financial intermediaries, as well as a third-party survey of transfer agent fees charged to funds within the Franklin Templeton Investments (FTI) complex in comparison with those charged to other fund complexes deemed comparable. Also, related financial statements and other information about the scope and quality of services provided by the investment manager and its affiliates and enhancements to
such services over the past year were provided. In addition, the trustees received periodic reports throughout the year and during the renewal process relating to compliance with the Fund’s investment policies and restrictions. During the renewal process, the independent trustees considered the investment manager’s methods of operation within the Franklin Templeton group and its activities on behalf of other clients. The Board also noted that it received an annual report on all payments made by FTI or the Fund to financial intermediaries engaged in the sale of Fund shares, as well as a memorandum relating to third-party servicing arrangements in response to a Guidance Update from the U.S. Securities and Exchange Commission (SEC) relating to mutual fund distribution andsub-accounting fees.
The information obtained by the trustees during the renewal process also included a special report prepared by Broadridge Financial Solutions, Inc., an independent third-party analyst that utilizes data from Lipper, Inc. (“Lipper”), comparing the Fund’s investment performance and expenses with those of other mutual funds deemed comparable to the Fund as selected by Lipper (Broadridge Section 15(c) Report). The trustees reviewed the Broadridge Section 15(c) Report and its usefulness in the renewal process with respect to matters such as comparative fees, expenses, expense ratios, performance and volatility. They concluded that the report continues to be a reliable resource in the performance of their duties.
In addition, the trustees received a Profitability Study (Profitability Study) prepared by management discussing the profitability to FTI from its overall U.S. fund operations, as well as on an individualfund-by-fund basis. Over the past year, the Board and counsel to the independent trustees continued to receive reports on management’s handling of recent regulatory inquiries and pending legal actions against the investment manager and its affiliates. The independent trustees were satisfied with the actions taken to date by management in response to such regulatory and legal matters.
The trustees reviewed the personnel, operations, financial condition, and investment management capabilities, methodologies and resources of the investment manager. As part of this review, particular attention was given to management’s diligent risk management program, including continual monitoring and management of cybersecurity, liquidity and counterparty credit risk, and attention given to derivatives and other complex instruments that are held and expected to be held by the Fund and how such instruments
| franklintempleton.com | Semiannual Report | 37 | ||||
FRANKLIN MUTUAL SERIES FUNDS
FRANKLIN MUTUAL EUROPEAN FUND
SHAREHOLDER INFORMATION
are used to carry out the Fund’s investment goal(s). The Board also took into account, among other things, management’s efforts in establishing a global credit facility for the benefit of the Fund and other accounts managed by FTI to provide a source of cash for temporary and emergency purposes or to meet unusual redemption requests as well as the strong financial position of the investment manager’s parent company and its commitment to the mutual fund business. The Board noted management’s continuing efforts and expenditures in establishing effective business continuity plans and developing strategies to address areas of heightened concern in the mutual fund industry, such as cybersecurity and liquidity risk management. The Board also recognized management’s commitment to facilitating Board oversight of particular areas, including derivatives and payments to intermediaries, by enhanced reporting.
In addition to the above and other matters considered by the trustees throughout the course of the year, the following discussion relates to certain primary factors relevant to the Board’s decision. This discussion of the information and factors considered by the Board (including the information and factors discussed above) is not intended to be exhaustive, but rather summarizes certain factors considered by the Board. In view of the wide variety of factors considered, the Board did not, unless otherwise noted, find it practicable to quantify or otherwise assign relative weights to the foregoing factors. In addition, individual trustees may have assigned different weights to various factors.
NATURE, EXTENT AND QUALITY OF SERVICES.The trustees reviewed the nature, extent and quality of the services provided, and to be provided, by the investment manager. The trustees cited the investment manager’s ability to implement the Fund’s disciplined value investment approach and its long-term relationship with the Fund as reasons that shareholders choose to invest, and remain invested, in the Fund. The trustees reviewed the Fund’s portfolio management team, including its performance, staffing, skills and compensation program. With respect to portfolio manager compensation, management assured the trustees that the Fund’s long-term performance is a significant component of incentive-based compensation and noted that a portion of a portfolio manager’s incentive-based compensation is paid in shares ofpre- designated funds from the portfolio manager’s fund management area. The trustees noted that the portfolio manager compensation program aligned the interests of the portfolio managers with that of shareholders of the Fund. The trustees discussed
with management various other products, portfolios and entities that are advised by the investment manager and the allocation of assets and expenses among and within them, as well as their relative fees and reasons for differences with respect thereto and any potential conflicts. During regular Board meetings and the aforementioned meetings of the independent trustees, the trustees received reports and presentations on the investment manager’s best execution trading policies. The trustees considered periodic reports provided to them showing that the investment manager complied with the investment policies and restrictions of the Fund as well as other reports periodically furnished to the Board covering matters such as the compliance of portfolio managers and other management personnel with the code of ethics covering the investment management personnel, the adherence to fair value pricing procedures established by the Board and the accuracy of net asset value calculations. The Board noted the extent of the benefits provided to Fund shareholders from being part of the Franklin Templeton group of funds, including the right to exchange investments between funds (same class) without a sales charge, the ability to reinvest Fund dividends into other funds and the right to combine holdings of other funds to obtain reduced sales charges. The Board considered the investment manager’s significant efforts in developing and implementing compliance procedures established in accordance with SEC and other requirements.
The Board considered the nature, extent and quality of the services to be provided under the Fund’s other service agreements to determine that, on an overall basis, Fund shareholders were well served. In this connection, the Board also took into account transfer agent and shareholder services provided to Fund shareholders by an affiliate of the investment manager, noting continuing expenditures by management to increase and improve the scope of such services and favorable periodic reports on shareholder services conducted by independent third parties. While such considerations directly affected the trustees’ decision in renewing the Fund’s transfer agent and shareholder services agreement, the Board also considered these commitments as incidental benefits to Fund shareholders deriving from the investment management relationship.
Based on their review, the trustees were satisfied with the nature and quality of the overall services provided, and to be provided, by the investment manager and its affiliates to the Fund and its shareholders and were confident in the abilities of the management team to continue the disciplined value
38 |
Semiannual Report |
franklintempleton.com | ||
FRANKLIN MUTUAL SERIES FUNDS
FRANKLIN MUTUAL EUROPEAN FUND
SHAREHOLDER INFORMATION
investment approach of the Fund and to provide quality services to the Fund and its shareholders.
INVESTMENT PERFORMANCE.The trustees reviewed and placed significant emphasis on the investment performance of the Fund over theone-, three-, five- and10-year periods ended December 31, 2018. They considered the history of successful performance of the Fund relative to various benchmarks. As part of their review, they inquired of management regarding benchmarks, style drift and restrictions on permitted investments. Consideration was also given to performance in the context of available levels of cash during the periods.
The trustees had meetings during the year, including the meetings referred to above held in connection with the renewal process, with the Fund’s portfolio managers to discuss performance and the management of the Fund. In addition to the materials provided by management in connection with the renewal process, the independent trustees requested throughout the year (and received) additional presentations from the investment manager and senior management of FTI regarding the performance of the investment manager and the Fund. As part of these presentations, the investment manager and senior management of FTI reviewed enhancements that have been made, and are being made, to the investment manager’s investment process. In addition, particular attention in assessing performance was given to the Broadridge Section 15(c) Report. That report showed the investment performance of the Fund (Class A shares) in comparison to other funds determined comparable by Lipper.
The comparable funds to the Fund, as chosen by Lipper, included all retail and institutional European region funds. The Fund had total returns in the best performing quintile for theone-year period ended December 31, 2018, and had annualized total returns for the three- and five-year periods in the second-lowest and middle performing quintiles, respectively. The trustees noted that the Fund’s total return on an annualized basis for the10-year period ended December 31, 2018 was in the second-lowest performing quintile. The trustees noted that the Fund exhibited improved relative performance in 2018 and discussed with management the reasons for the relative underperformance for the three- and10-year periods ended December 31, 2018. Encouraged by the improved relative performance and enhancements to the investment process noted above, the Board did not believe that any changes with respect to the
Fund were warranted at the time and noted that it would continue to monitor future performance.
The trustees also compared Fund performance to other industry benchmarks, including measures of risk-adjusted performance of a fund, as part of their evaluation of investment performance. The trustees concluded that the Fund had continued to perform well in comparison to its various benchmarks and in the context of the Fund’s goals.
COMPARATIVE EXPENSES AND MANAGEMENT PROFITABILITY.The trustees considered the cost of the services provided and to be provided and the profits realized by the investment manager and its affiliates from their respective relationships with the Fund. As part of the renewal process, the trustees explored with management the trends in expense ratios over the past three fiscal years and the reasons for any increases in the Fund’s expense ratios (or components thereof). In considering the appropriateness of the management fee and other expenses charged to the Fund, the Board took into account various factors including investment performance and matters relating to Fund operations, including, but not limited to, the quality and experience of its portfolio managers and research staff. Consideration was also given to a comparative analysis in the Broadridge Section 15(c) Report of the investment management fee and total expense ratio of the Fund in comparison with those of a group of other funds selected by Lipper as its appropriate Lipper expense group. Lipper expense data is based upon information taken from each fund’s most recent annual report, which reflects historical asset levels that may be quite different from those currently existing, particularly in a period of market volatility. While recognizing such inherent limitation and the fact that expense ratios generally increase as assets decline and decrease as assets grow, the Board believed the independent analysis conducted by Lipper to be an appropriate measure of comparative expenses.
In reviewing comparative costs, emphasis was given to the Fund’s contractual management fee in comparison with the contractual management fee that would have been charged by other funds within its Lipper expense group assuming they were similar in size to the Fund, as well as the actual total expenses of the Fund in comparison with those of its Lipper expense group. The Lipper contractual management fee analysis includes administrative charges as being part of the management fee, and total expenses, for comparative consistency, are shown by Lipper for Fund Class A shares.
franklintempleton.com |
Semiannual Report |
|
39 |
| ||
FRANKLIN MUTUAL SERIES FUNDS
FRANKLIN MUTUAL EUROPEAN FUND
SHAREHOLDER INFORMATION
The Fund’s contractual management fee rate was in the second-most expensive quintile of its Lipper expense group and its total expenses were in the middle quintile of such group. The Board found such comparative fees and expenses to be acceptable in view of factors relating to the Fund’s operations, such as the quality and experience of its portfolio managers.
The trustees also reviewed the Profitability Study addressing profitability of Franklin Resources, Inc., from its overall U.S. fund business, as well as profitability to the Fund’s investment manager and its affiliates, from providing investment management and other services to the Fund during the12-month period ended September 30, 2018, the most recent fiscalyear-end of Franklin Resources, Inc. The trustees reviewed the basis on which such reports are prepared and the cost allocation methodology utilized in the Profitability Study, it being recognized that allocation methodologies may each be reasonable while producing different results. In this respect, the Board noted that the reasonableness of the cost allocation methodologies was reviewed by independent accountants on an every other year basis.
The independent trustees met with management to discuss the Profitability Study. This included, among other things, a comparison of investment management income with investment management expenses of the Fund; comparison of underwriting revenues and expenses; the relative relationship of investment management and underwriting expenses; shareholder servicing profitability; economies of scale; and the relative contribution of the Fund to the profitability of the investment manager and its parent. In discussing the Profitability Study with the Board, the investment manager stated its belief that the costs incurred in establishing the infrastructure necessary to operate the type of mutual fund operations conducted by it and its affiliates may not be fully reflected in the expenses allocated to the Fund in determining its profitability.
The Board also took into account management’s expenditures in improving shareholder services provided to the Fund, as well as the need to meet additional regulatory and compliance requirements. The trustees also considered the extent to which the investment manager may derive ancillary benefits from Fund operations, including those derived from economies of scale, discussed below, the allocation of Fund brokerage and the use of commission dollars to pay for research and other similar services.
Based upon their consideration of all these factors, the trustees determined that the level of profits realized by the investment manager and its affiliates in providing services to the Fund was not excessive in view of the nature, quality and extent of services provided.
ECONOMIES OF SCALE.The Board considered economies of scale realized by the investment manager and its affiliates as the Fund grows larger and the extent to which they are shared with Fund shareholders, as for example, in the level of the investment management fee charged, in the quality and efficiency of services rendered and in increased capital commitments benefiting the Fund directly or indirectly. While recognizing that any precise determination is inherently subjective, the trustees noted that, based upon the Profitability Study, as some funds increase in size, at some point economies of scale may result in the investment manager realizing a larger profit margin on investment management services provided to such a fund. The trustees also noted that benefits of economies of scale will be shared with Fund shareholders due to the decline in the effective investment management fee rate as breakpoints are achieved by the Fund.
The trustees noted that breakpoints had been instituted as part of the Fund’s investment management fee and that the Board regularly evaluates whether additional breakpoints are appropriate. The trustees assessed the savings to shareholders resulting from such breakpoints and believed they were, and continue to be, appropriate and they agreed to continue to monitor the appropriateness of the breakpoints. The trustees also considered the effects an increase in assets under management would have on the investment management fee and expense ratio of the Fund. To the extent further economies of scale may be realized by the investment manager and its affiliates, the Board believed the investment management fees provide a sharing of benefits with the Fund and its shareholders.
Proxy Voting Policies and Procedures
The Fund’s investment manager has established Proxy Voting Policies and Procedures (Policies) that the Fund uses to determine how to vote proxies relating to portfolio securities. Shareholders may view the Fund’s complete Policies online at franklintempleton.com. Alternatively, shareholders may request copies of the Policies free of charge by calling the Proxy Group collect at (954)527-7678 or by sending a written request to: Franklin Templeton Companies, LLC, 300 S.E. 2nd Street, Fort Lauderdale, FL
40 |
Semiannual Report |
franklintempleton.com | ||
FRANKLIN MUTUAL SERIES FUNDS
FRANKLIN MUTUAL EUROPEAN FUND
SHAREHOLDER INFORMATION
33301, Attention: Proxy Group. Copies of the Fund’s proxy voting records are also made available online at franklintempleton.com and posted on the U.S. Securities and Exchange Commission’s website at sec.gov and reflect the most recent12-month period ended June 30.
Quarterly Statement of Investments
The Trust, on behalf of the Fund, files a complete statement of investments with the U.S. Securities and Exchange Commission for the first and third quarters for each fiscal year as an exhibit to its report on FormN-PORT. Shareholders may view the filed FormN-PORT by visiting the Commission’s website at sec.gov. The filed form may also be viewed and copied at the Commission’s Public Reference Room in Washington, DC. Information regarding the operations of the Public Reference Room may be obtained by calling(800) SEC-0330.
franklintempleton.com |
Semiannual Report |
|
41 |
| ||
This page intentionally left blank.
This page intentionally left blank.
This page intentionally left blank.
Authorized for distribution only when accompanied or preceded by a summary prospectus and/or prospectus. Investors should carefully consider a fund’s investment goals, risks, charges and expenses before investing. A prospectus contains this and other information; please read it carefully before investing.
To help ensure we provide you with quality service, all calls to and from our service areas are monitored and/or recorded.
| Semiannual Report and Shareholder Letter | |||||
| Franklin Mutual European Fund | ||||||
Investment Manager | Distributor | Shareholder Services | ||||
| Franklin Mutual Advisers, LLC | Franklin Templeton Distributors, Inc. (800) DIAL BEN®/342-5236 franklintempleton.com | (800) 632-2301 - (Class A, C, R & R6) (800)448-FUND - (Class Z) | ||||
| © 2019 Franklin Templeton Investments. All rights reserved. | 478 S 08/19 |
Sign up for electronic delivery at franklintempleton.com/edelivery
Internet Delivery of Fund Reports Unless You Request Paper Copies: Effective January 1, 2021, as permitted by the SEC, paper copies of the Fund’s shareholder reports will no longer be sent by mail, unless you specifically request them from the Fund or your financial intermediary. Instead, the reports will be made available on a website, and you will be notified by mail each time a report is posted and provided with a website link to access the report.
If you already elected to receive shareholder reports electronically, you will not be affected by this change and you need not take any action. If you have not signed up for electronic delivery, we would encourage you to join fellow shareholders who have. You may elect to receive shareholder reports and other communications electronically from the Fund by calling (800)632-2301 or by contacting your financial intermediary.
You may elect to continue to receive paper copies of all your future shareholder reports free of charge by contacting your financial intermediary or, if you invest directly with a Fund, calling (800)632-2301 to let the Fund know of your request. Your election to receive reports in paper will apply to all funds held in your account.
FRANKLIN TEMPLETON
Successful investing begins with ambition. And achievement only comes when you reach for it. That’s why we continually strive to deliver better outcomes for investors. No matter what your goals are, our deep, global investment expertise allows us to offer solutions that can help.
During our more than 70 years of experience, we’ve managed through all kinds of markets—up, down and those in between. We’re always preparing for what may come next. It’s because of this, combined with our strength as one of the world’s largest asset managers that we’ve earned the trust of millions of investors around the world.
Dear Franklin Mutual Quest Fund Shareholder:
The markets came into 2019 in a fog of uncertainty. The outlook for economic growth had become less bright and fears were mounting that the U.S. Federal Reserve (Fed) would make a policy misstep in raising interest rates too far. Over the past six months, many of these economic concerns have eased, as the Fed and other major central banks like the European Central Bank (ECB) turned more dovish amid signs that growth was becoming a bit more sluggish. The ECB suggested it would act should growth soften and inflation not materialize. This dovishness helped propel the U.S. equity market back toward record highs in June. Bond yields, meanwhile, fell on the prospect for increased central bank-driven liquidity, with some sovereign European bonds sliding back into negative territory.
Although the prospects of a more accommodative monetary policy eased fears about the economic outlook, persistent trade tensions between the U.S. and China, among other nations, kept markets on edge. This was on full display in May when markets fell sharply on a ratcheting up of tensions and after the U.S. government threatened to place tariffs on Mexican goods. Mideast tensions also began to heat up in June with attacks on oil tankers in the Persian Gulf and greater tensions between the U.S. and Iran.
How, and even whether, the U.K. will leave the European Union has also remained unresolved. Atperiod-end, the U.K. Conservative Party was conducting a leadership contest,
which has the potential to complicate future Brexit negotiations and leave markets vulnerable to increased volatility.
Despite all this uncertainty, for thesix-month period ended June 30, 2019, U.S. stocks, as measured by the Standard & Poor’s 500® Index (S&P 500®), posted a +18.54% total return, while stocks in global developed markets, as measured by the MSCI World Index, posted a +17.38% total return.1
As has been the case in recent years, growth stocks, particularly in the technology sector, have outperformed over thesix-month period. Value stocks generally have remained disfavored in this environment where, at times, economic factors and monetary policy have had greater sway on equity returns than corporate fundamentals.
We recognize the important role of financial advisors in today’s markets and encourage investors to continue to seek their advice. Amid changing markets and economic conditions, we are confident investors with a well-diversified portfolio and a patient, long-term outlook will be well positioned for the years ahead.
On the following pages, the Fund’s portfolio management team reviews investment decisions that pertain to performance during the past six months considering the
1. Source: Morningstar.
See www.franklintempletondatasources.com for additional data provider information.
| Not FDIC Insured | | | May Lose Value | | | No Bank Guarantee |
franklintempleton.com | Not part of the semiannual report
|
|
1 |
| ||
economic environment and other factors. Please remember all securities markets fluctuate, as do mutual fund share prices.
We thank you for investing with Franklin Templeton, welcome your questions and comments, and look forward to continuing to serve your investment needs in the years ahead.
Sincerely,

Peter A. Langerman
Chairman, President and Chief Executive Officer
Franklin Mutual Advisers, LLC
This letter reflects our analysis and opinions as of June 30, 2019, unless otherwise indicated. The information is not a complete analysis of every aspect of any market, country, industry, security or fund. Statements of fact are from sources considered reliable.
Semiannual Report
| Visitfranklintempleton.comfor fund updates, to access your account, or to find helpful financial planning tools. |
|
2 |
|
Not part of the semiannual report |
franklintempleton.com | ||
SEMIANNUAL REPORT
This semiannual report for Franklin Mutual Quest Fund covers the period ended June 30, 2019.
Your Fund’s Goal and Main Investments
The Fund seeks capital appreciation, which may occasionally be short term, with income as a secondary goal. Under normal market conditions, the Fund invests substantially to primarily in equity securities of U.S. and foreign companies that the investment manager believes are available at market prices less than their intrinsic value. The equity securities in which the Fund invests are primarily common stock, with a current focus onmid- andlarge-cap companies. To a lesser extent, the Fund also invests in merger arbitrage securities and the debt and equity of distressed companies. The Fund may invest a substantial portion, potentially up to 100% of its assets, in foreign securities, which may include sovereign debt and participations in foreign government debt. The Geographic Composition bar chart on this page lists the leading countries where the Fund invests.
Performance Overview
The Fund’s Class Z shares posted a +7.64% cumulative total return for the six months ended June 30, 2019. In comparison, the Fund’s benchmark, the MSCI World Index (USD), which tracks stock performance in global developed markets, posted a total return of +17.38%.1 Also for comparison, the Fund’s secondary benchmark, the Bloomberg Barclays U.S. Corporate High Yield Index, which measures the U.S. corporate market ofnon-investment grade, fixed-rate corporate bonds, defined as the middle or lower ratings of Moody’s, Fitch and Standard & Poor’s, posted a +9.94% total return.1 You can find more of the Fund’s performance data in the Performance Summary beginning on page 9.
Geographic Composition*
Based on Total Net Assets as of 6/30/19
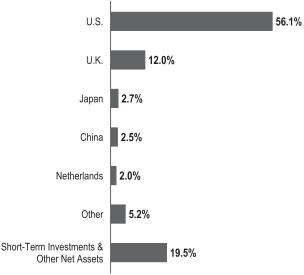
*Figures are stated as a percentage of total and may not equal 100% or may be negative due to rounding, use of any derivatives, unsettled trades or other factors.
Performance data represent past performance, which does not guarantee future results. Investment return and principal value will fluctuate, and you may have a gain or loss when you sell your shares. Current performance may differ from figures shown. For most recentmonth-end performance, go tofranklintempleton.comor call(800)342-5236.
Economic and Market Overview
The global economy expanded during the six months ended June 30, 2019 despite weakness in certain regions. Global developed and emerging market stocks were aided by upbeat economic data in some regions, encouraging corporate earnings reports and periods of optimism about a potential U.S.-China trade deal. Further supporting markets were the U.S. Federal Reserve’s (Fed’s) patient approach to its monetary policy in 2019 and recent indication it will act as appropriate to sustain U.S. economic expansion.
However, markets reflected concerns about political uncertainties in the U.S. and the European Union,
1. Source: Morningstar.
The index is unmanaged and includes reinvestment of any income or distributions. It does not reflect any fees, expenses or sales charges. One cannot invest directly in an index, and an index is not representative of the Fund’s portfolio.
The dollar value, number of shares or principal amount, and names of all portfolio holdings are listed in the Fund’s Statement of Investments (SOI).
The SOI begins on page 17.
franklintempleton.com |
Semiannual Report |
|
3 |
| ||
FRANKLIN MUTUAL QUEST FUND
geopolitical risks in certain regions, and the impact of U.S. trade disputes with China and other trading partners on global growth and corporate earnings. In this environment, global developed and emerging market stocks, as measured by the MSCI All Country World Index, posted a +16.60% total return for thesix-month period.1
The U.S. economy grew during the six months ended June 30, 2019. After moderating for two consecutive quarters, the economy grew significantly faster in 2019’s first quarter, driven by growth in consumer spending, inventory investment, exports, business investment, and state and local government spending. However, the economy moderated again in the second quarter, due to weakness in inventory investment, exports, business investment and housing investment. The unemployment rate decreased from 3.9% in December 2018 to 3.7% atperiod-end.2 The annual inflation rate, as measured by the Consumer Price Index, decreased from 1.9% in December 2018 to 1.6% atperiod-end.2
The Fed held its target range for the federal funds rate unchanged, at 2.25%–2.50%, during the reporting period. In March, the Fed mentioned it would end its balance sheet normalization program by the end of September 2019. In June, the Fed indicated increased uncertainties around its views on economic activity and the labor market. With market-based inflation measures remaining low recently, the market has interpreted the Fed’s recent statements to mean it will likely cut rates in 2019’s second half to foster continued economic growth while attempting to achieve its inflation objective.
In Europe, the U.K.’s quarterly gross domestic product (GDP) growth accelerated in 2019’s first quarter, but GDP contracted in the second quarter compared with the first quarter as Brexit uncertainties weighed on business sentiment. The Bank of England left its key policy rate unchanged during the period. The eurozone’s quarterly GDP accelerated in 2019’s first quarter but moderated in the second quarter, and the bloc’s annual inflation rate marginally decreased byperiod-end. The European Central Bank (ECB) kept its benchmark interest rate unchanged for the same time. In June, the ECB mentioned it would leave interest rates unchanged through the first half of 2020, provided details of its new stimulus, and indicated its openness to cut rates or increase stimulus.
In Asia, Japan’s quarterly GDP growth accelerated in 2019’s first quarter. In June, the Bank of Japan also left its benchmark interest rate unchanged, while continuing its stimulus measures, and expressed its openness to cut interest rates or increase stimulus.
In larger emerging markets, Brazil’s quarterly GDP growth contracted in 2019’s first quarter. The Central Bank of Brazil left its benchmark interest rate unchanged during the period. Russia’s annual GDP growth moderated in 2019’s first quarter. The Bank of Russia cut its key rate once during the period. China’s annual GDP growth rate stabilized in 2019’s first quarter. The People’s Bank of China left its benchmark interest rate unchanged, but it took measures to improve financial liquidity to mitigate the effects of the U.S.-China trade dispute and support economic growth. Overall, global emerging market stocks, as measured by the MSCI Emerging Markets Index, posted a +10.78% total return during thesix-month period.1
Investment Strategy
At Franklin Mutual Series, we are committed to our distinctive value approach to investing, which we believe can generate above-average risk-adjusted returns over time for our shareholders. Our major investment strategy is investing in undervalued stocks. When selecting undervalued equities, we are attracted to what we believe are fundamentally strong companies with healthy balance sheets, high-quality assets, substantial free cash flow and shareholder-oriented management teams and whose stocks are trading at discounts to our assessment of the companies’ intrinsic or business value. We also look for asset-rich companies whose shares may be trading at depressed levels due to concerns over short-term earnings disappointments, litigation, management strategy or other perceived negatives. This strict value approach is not only intended to improve the likelihood of capital appreciation, but also reduces the risk of substantial declines, in our opinion. While the vast majority of our undervalued equity investments are made in publicly traded companies globally, we may invest occasionally in privately held companies as well.
To a lesser extent, we complement this more traditional investment strategy with two others. One is distressed investing, a highly specialized field that has proven quite profitable during certain periods over the years. Distressed investing is complex and can take many forms. The most common distressed investment the Fund undertakes is the
2. Source: U.S. Bureau of Labor Statistics.
See www.franklintempletondatasources.com for additional data provider information.
4 |
Semiannual Report |
franklintempleton.com | ||
FRANKLIN MUTUAL QUEST FUND
purchase of financially troubled or bankrupt companies’ debt at a substantial discount to face value. After the financially distressed company is reorganized, often in bankruptcy court, the old debt is typically replaced with new securities issued by the financially stronger company.
The other piece of our investment strategy is participating in arbitrage situations, another highly specialized field. When companies announce proposed mergers or takeovers, commonly referred to as “deals,” the target company may trade at a discount to the bid it ultimately accepts. One form of arbitrage involves purchasing the target company’s stock when it is trading below the value we believe it would receive in a deal. In keeping with our commitment to a relatively conservative investment approach, we typically focus our arbitrage efforts on announced deals, and avoid rumored deals or other situations we consider relatively risky. The current percentages of the Fund’s assets devoted to these investment strategies are listed in the Asset Allocation bar chart on this page. In addition, it is our practice to hedge the Fund’s currency exposure when we deem it advantageous for our shareholders.
What is meant by “hedge”?
To hedge an investment is to take a position intended to offset potential losses that may be incurred by a companion financial instrument. Hedging an investment may also offset potential gains.
Manager’s Discussion
Franklin Mutual Series has long analyzed companies in many ways beyond just looking at the numbers. We analyze the way a company is run and how decisions are made at the executive and board levels. We look at the sustainability of a company, including the relationships with employees and customers, as well as the environmental impacts of a company’s business. In many ways this is common sense. A company that takes advantage of customers and unsustainably produces environmental waste is worth less than one that does not do these things. Similarly, a company that iswell-run and responsive to shareholders is worth more than one whose executives manage the company for their private benefit. However, disclosure has been limited on many relevant issues, and there is disagreement among companies, shareholders and data providers about which factors should be measured and how they should be measured.
This type of analysis is labeled ESG analysis, where ESG stands for environmental, social, and governance factors. Many firms, including Franklin Templeton, are incorporating
Asset Allocation*
Based on Total Net Assets as of 6/30/19
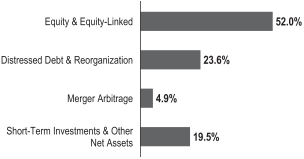
*Figures are stated as a percentage of total and may not equal 100% or may be negative due to rounding, use of any derivatives, unsettled trades or other factors.
ESG factors in their investment research. In addition, there are other bodies such as the Sustainable Accounting Standards Board that are working on standardizing metrics for companies and industries to improve their reporting on these factors, particularly in the environmental and social areas. As a result, ESG analysis is improving across the market, and Franklin Mutual Series analysts are better able to analyzenon-traditional factors, including greenhouse gas emissions, water consumption, energy usage, talent management, diversity and inclusion, executive compensation, and enterprise risk management, to name a few. ESG investing should not be confused with social or exclusionary types of investing, but should rather be viewed as an additional tool analysts and portfolio managers use in the investment process to identify and measurenon-traditional, potential business risks and opportunities at a company.
Today, Franklin Mutual Series analysts review and analyze ESG reports produced by third parties or the companies themselves to assess potential risks that could have an impact on shareholder value. In addition, we have discussions with management teams around ESG risks, how they deal with them and the potential impact on stakeholders. Our discussions have included issues such as water consumption in mining, the impact of changing carbon dioxide emission standards on the automotive industry and discussions with boards and management teams around management pay. Although more work needs to be done to standardize data from companies within industries so that comparisons can be relevant, the identification and discussion of ESG risk factors is an input we consider in helping frame the potential negative events individual companies or industries may face. In our view, solid ESG ratings are an output of fundamentally good business practices, not an input. As the data and information regarding ESG risk factors continue to evolve, we believe the increased information will highlight additional risk factors to
franklintempleton.com |
Semiannual Report |
|
5 |
| ||
FRANKLIN MUTUAL QUEST FUND
enterprises and help us make more informed investment decisions going forward.
Mergers and Acquisitions
Merger and acquisition (M&A) activity remained healthy in the first half of 2019. The health care sector led the way, with pharmaceuticals megamergers among the biggest transactions. The pending acquisitions of Celgene and Allergan (not a Fund holding), each worth almost $90 billion, exemplify this strength. The Top 10 Sectors/Industries table on this page lists pharmaceuticals and other leading industries in which the Fund currently invests. Large deals have also been announced in the defense, oil and gas exploration and production, and diversified financial services industries, underlying the broad strength of the M&A boom. In addition, U.S. and foreign regulators appear to be more amenable to deals, leading markets to expect fewer regulatory surprises. We are closely monitoring the U.S.-China trade conflict, becauseflare-ups could potentially impact pending and future deals. We expect M&A activity to remain strong for as long as the equity markets remain positive, as has been the historical pattern.
Credit Markets
Opportunities to invest in mispriced risk across global fixed income markets remained limited in the first half of 2019. The low interest-rate environment kept credit widely available, and default rates are still at historically low levels. Debt covenant terms, which include restrictions on the borrower’s financial activities, remain loose or nonexistent. In such an environment, we believe it is prudent to focus our efforts on investing in short-term mispriced risk and catalyst-driven credit opportunities. The debt securities of Sprint and Symantec, which we purchased given the valuation support and attractive current yield, exemplify such opportunities.
On the restructuring side, Cumulus Media and iHeartMedia, two long-term distressed credit positions, emerged from bankruptcy or had reached a confirmable restructuring agreement in 2018, reducing further the purely distressed portion of the credit holdings within the Funds. PG&E, which recently filed for bankruptcy, became a new distressed credit position. Furthermore, Windstream Services became a new distressed credit position after parent company Windstream Holdings and its subsidiaries filed for bankruptcy. We are hopeful more opportunities may emerge as the business and economic cycles elongate amid persistent uncertainties. We will continue to seek to invest across the capital structures of companies that avail themselves of opportunities to bolster liquidity through internally generated free cash flow and
Top 10 Sectors/Industries
Based on Equity Securities as of 6/30/19
| % of Total Net Assets | ||||
Insurance
|
|
8.7% |
| |
Media
|
|
7.2% |
| |
Tobacco
|
|
6.6% |
| |
Oil, Gas & Consumable Fuels
|
|
5.5% |
| |
Software
|
|
4.5% |
| |
Communications Equipment
|
|
4.0% |
| |
Pharmaceuticals
|
|
2.8% |
| |
Interactive Media & Services
|
|
2.6% |
| |
Wireless Telecommunication Services
|
|
2.4% |
| |
Diversified Telecommunication Services
|
|
1.9% |
| |
corporate actions, including asset sales and debt refinancing.
Fund Performance
Top positive contributors to performance included Micron Technology, Charter Communications and Kinder Morgan.
U.S.-based microchip maker Micron Technology benefited from the general rebound in global equities despite a slowdown in demand and lower prices for memory chips. The company posted weak, but much better-than-expected, results for its fiscal third-quarter 2019. In our view, negative supply and demand conditions for memory chips should begin to improve in 2019’s second half.
In late January, U.S.-based Charter Communications, a telecommunications and mass media company, reported quarterly earnings, revenues and free cash flow that topped market expectations. Charter also estimated that 2019 capital spending and operating costs per customer could likely be lower than 2018, providing a boost to operating margins. In our view, Charter’s integration plan following the 2016 acquisition of Time Warner Cable is starting to produce positive results.
Shares of U.S.-based energy company Kinder Morgan rose in early 2019, as the energy sector rebounded from weak performance in the fourth quarter of 2018. In addition, U.S. pipeline companies have benefited from increased volumes of U.S. crude oil, natural gas and natural gas liquids, along with limited pipeline supply. We believe conditions are likely to remain favorable for the energy sector if commodity prices hold up, most notably if crude oil prices remain above US$50 per barrel.
6 |
Semiannual Report |
franklintempleton.com | ||
FRANKLIN MUTUAL QUEST FUND
During the period under review, Fund investments that detracted from performance included Baidu, Imperial Brands and Vodafone Group. Baidu and Vodafone are listed among the Fund’s largest positions in the Top 10 Equity Holdings table on page 7.
Shares of China-based internet search firm Baidu slid after the company posted a loss for its fiscal first-quarter 2019. The weaker economic environment in China coupled with governmental regulation led to slower advertisement sales growth during the quarter. However, Baidu continues to invest heavily in its video-streaming platform and other initiatives like artificial intelligence. These investments should help the company further diversify its business into new growth markets.
Shares of U.K. tobacco company Imperial Brands traded lower after the company reported below-expected first-half fiscal 2019 revenues amid concerns about stricter U.S. regulation and waning tobacco product distribution at large U.S. drugstores. The U.S. has considered banning menthol cigarettes and enacting stricter regulation ofe-cigarettes and vaping products, particularly flavors more prone to attract underaged consumers. Tobacco companies were pressured by recent Nielsen industry data suggesting deteriorating U.S. industry volumes. The industry urged investors to use more reliable data sources, as Nielsen does not measure a number of tobacco distribution channels.
U.K.-based multinational telecommunications conglomerate Vodafone Group provided a quarterly trading update that showed a greater-than-expected slowdown in revenues, as well as guidance of additional deterioration in revenues next quarter. A revenue decline in South Africa and a weaker-than-expected gain in Germany more than offset smaller-than-expected revenue declines in Italy, Spain and the U.K. On balance, we believe conditions may become less negative for Vodafone, which sets up a likely upturn in revenues and improvement in earnings growth in the second half of the company’s fiscal 2020, in our view.
During the period, the Fund held currency forwards and futures seeking to hedge most of the currency risk of the portfolio’snon-U.S. dollar investments. The hedges had a positive overall impact on the Fund’s performance because of the appreciation of the U.S. dollar versus the hedged currencies.
What is a currency forward?
A currency forward is a direct agreement between the Fund and a counterparty to buy or sell a foreign currency in exchange for another currency at a specific exchange rate on a future date.
Top 10 Equity Holdings
6/30/19
Company Sector/Industry, Country | % of Total Net Assets | |||
Sorenson Communications LLC Communications Equipment, U.S. | 4.0% | |||
British American Tobacco PLC Tobacco, U.K.
| 3.8% | |||
Red Hat Inc. Software, U.S. | 3.6% | |||
Baidu Inc. Interactive Media & Services, China | 2.6% | |||
Everest Re Group Ltd. Insurance, U.S. | 2.6% | |||
JXTG Holdings Inc. Oil, Gas & Consumable Fuels, Japan | 2.5% | |||
Vodafone Group PLC Wireless Telecommunication Services, U.K. | 2.4% | |||
Liberty Global PLC Media, U.K. | 2.2% | |||
AT&T Inc. Diversified Telecommunication Services, U.S. | 1.9% | |||
Voya Financial Inc. Diversified Financial Services, U.S.
| 1.8% | |||
What is a future?
A future is an agreement between the Fund and a counterparty made through a U.S. or foreign futures exchange to buy or sell an underlying instrument or asset at a specific price on a future date.
As fellow shareholders, we found recent relative performance disappointing, but it is not uncommon for our strategy to lag the equity markets at times. We remain committed to our disciplined, value investment approach as we seek to generate attractive, long-term, risk-adjusted returns for shareholders.
franklintempleton.com |
Semiannual Report |
|
7 |
| ||
FRANKLIN MUTUAL QUEST FUND
Thank you for your participation in Franklin Mutual Quest Fund. We look forward to continuing to serve your investment needs.
 |
Shawn M. Tumulty Co-Portfolio Manager |

|
Keith Luh, CFA Co-Portfolio Manager
|


The foregoing information reflects our analysis, opinions and portfolio holdings as of June 30, 2019, the end of the reporting period. The way we implement our main investment strategies and the resulting portfolio holdings may change depending on factors such as market and economic conditions. These opinions may not be relied upon as investment advice or an offer for a particular security. The information is not a complete analysis of every aspect of any market, country, industry, security or the Fund. Statements of fact are from sources considered reliable, but the investment manager makes no representation or warranty as to their completeness or accuracy. Although historical performance is no guarantee of future results, these insights may help you understand our investment management philosophy.
CFA® is a trademark owned by CFA Institute.
8 |
Semiannual Report |
franklintempleton.com | ||
FRANKLIN MUTUAL QUEST FUND
Performance Summary as of June 30, 2019
The performance table does not reflect any taxes that a shareholder would pay on Fund dividends, capital gain distributions, if any, or any realized gains on the sale of Fund shares. Total return reflects reinvestment of the Fund’s dividends and capital gain distributions, if any, and any unrealized gains or losses. Your dividend income will vary depending on dividends or interest paid by securities in the Fund’s portfolio, adjusted for operating expenses of each class. Capital gain distributions are net profits realized from the sale of portfolio securities.
Performance as of 6/30/19
Cumulative total return excludes sales charges. Average annual total return includes maximum sales charges. Sales charges will vary depending on the size of the investment and the class of share purchased. The maximum is 5.50% and the minimum is 0%.Class A:5.50% maximum initial sales charge. For other share classes, visitfranklintempleton.com.
| Share Class | Cumulative Total Return1 | Average Annual Total Return2 | ||||||
| Z | ||||||||
6-Month | +7.64% | +7.64% | ||||||
1-Year | -2.98% | -2.98% | ||||||
5-Year | +13.36% | +2.54% | ||||||
10-Year | +113.65% | +7.89% | ||||||
| A3 | ||||||||
6-Month | +7.53% | +1.63% | ||||||
1-Year | -3.17% | -8.50% | ||||||
5-Year | +11.88% | +1.12% | ||||||
10-Year | +107.79% | +6.98% | ||||||
Performance data represent past performance, which does not guarantee future results. Investment return and principal value will fluctuate, and you may have a gain or loss when you sell your shares. Current performance may differ from figures shown. For most recentmonth-end performance, go tofranklintempleton.comor call(800)342-5236.
See page 10 for Performance Summary footnotes.
franklintempleton.com |
Semiannual Report |
|
9 |
| ||
FRANKLIN MUTUAL QUEST FUND
PERFORMANCE SUMMARY
Total Annual Operating Expenses4
| Share Class | ||||
Z | 0.78% | |||
A | 1.03% | |||
Each class of shares is available to certain eligible investors and has different annual fees and expenses, as described in the prospectus.
All investments involve risks, including possible loss of principal. Value securities may not increase in price as anticipated or may decline further in value. Special risks are associated with foreign investing, including currency fluctuations, economic instability and political developments. Because the Fund may invest its assets in companies in a specific region, including Europe, it is subject to greater risks of adverse developments in that region and/or the surrounding regions than a fund that is more broadly diversified geographically. Current political and financial uncertainty surrounding the European Union may increase market volatility and the economic risk of investing in companies in Europe. Smaller-company stocks have exhibited greater price volatility than larger-company stocks, particularly over the short term. The Fund’s investments in companies engaged in mergers, reorganizations or liquidations also involve special risks as pending deals may not be completed on time or on favorable terms. The Fund may invest in lower-rated bonds, which entail higher credit risk. The Fund is actively managed but there is no guarantee that the manager’s investment decisions will produce the desired results. The Fund’s prospectus also includes a description of the main investment risks.
1. Cumulative total return represents the change in value of an investment over the periods indicated.
2. Average annual total return represents the average annual change in value of an investment over the periods indicated. Return for less than one year, if any, has not been annualized.
3. Prior to 9/10/18, these shares were offered at a higher initial sales charge of 5.75%, thus actual returns (with sales charges) would have differed. Average annual total returns (with sales charges) have been restated to reflect the current maximum initial sales charge of 5.50%.
4. Figures are as stated in the Fund’s current prospectus and may differ from the expense ratios disclosed in the Your Fund’s Expenses and Financial Highlights sections in this report. In periods of market volatility, assets may decline significantly, causing total annual Fund operating expenses to become higher than the figures shown.
10 |
Semiannual Report |
franklintempleton.com | ||
FRANKLIN MUTUAL QUEST FUND
As a Fund shareholder, you can incur two types of costs: (1) transaction costs, including sales charges (loads) on Fund purchases and redemptions; and (2) ongoing Fund costs, including management fees, distribution and service(12b-1) fees, and other Fund expenses. All mutual funds have ongoing costs, sometimes referred to as operating expenses. The table below shows ongoing costs of investing in the Fund and can help you understand these costs and compare them with those of other mutual funds. The table assumes a $1,000 investment held for the six months indicated.
Actual Fund Expenses
The table below provides information about actual account values and actual expenses in the columns under the heading “Actual.” In these columns the Fund’s actual return, which includes the effect of Fund expenses, is used to calculate the “Ending Account Value” for each class of shares. You can estimate the expenses you paid during the period by following these steps (ofcourse, your account value and expenses will differ from those in this illustration):Divide your account value by $1,000 (ifyour account had an $8,600 value, then $8,600÷ $1,000 = 8.6). Then multiply the result by the number in the row for your class of shares under the headings “Actual” and “Expenses Paid During Period” (ifActual Expenses Paid During Period were $7.50, then 8.6 x $7.50 = $64.50). In this illustration, the actual expenses paid this period are $64.50.
Hypothetical Example for Comparison with Other Funds
Under the heading “Hypothetical” in the table, information is provided about hypothetical account values and hypothetical expenses based on the Fund’s actual expense ratio and an assumed rate of return of 5% per year before expenses, which is not the Fund’s actual return. This information may not be used to estimate the actual ending account balance or expenses you paid for the period, but it can help you compare ongoing costs of investing in the Fund with those of other funds. To do so, compare this 5% hypothetical example for the class of shares you hold with the 5% hypothetical examples that appear in the shareholder reports of other funds.
Please note that expenses shown in the table are meant to highlight ongoing costs and do not reflect any transactional costs. Therefore, information under the heading “Hypothetical” is useful in comparing ongoing costs only, and will not help you compare total costs of owning different funds. In addition, if transactional costs were included, your total costs would have been higher.
Actual (actual return after expenses) | Hypothetical (5% annual return before expenses) | ||||||||||||||||||||||||||||||||||||||
| Share Class | Beginning Account | Ending Account Value 6/30/19 | Expenses Paid During 1/1/19–6/30/191, 2 |
| Ending Account Value 6/30/19 | Expenses Paid During 1/1/19–6/30/191, 2 | Net Annualized Expense Ratio2 | ||||||||||||||||||||||||||||||||
| Z | $1,000 | $1,076.40 | $4.07 | $1,020.88 | $3.96 | 0.79 | % | ||||||||||||||||||||||||||||||||
| A | $1,000 | $1,075.30 | $5.35 | $1,019.64 | $5.21 | 1.04 | % | ||||||||||||||||||||||||||||||||
| C | $1,000 | $1,070.40 | $9.19 | $1,015.92 | $8.95 | 1.79 | % | ||||||||||||||||||||||||||||||||
| R | $1,000 | $1,074.20 | $6.63 | $1,018.40 | $6.46 | 1.29 | % | ||||||||||||||||||||||||||||||||
| R6 | $1,000 | $1,076.50 | $3.76 | $1,021.17 | $3.66 | 0.73 | % | ||||||||||||||||||||||||||||||||
1. Expenses are equal to the annualized expense ratio for thesix-month period as indicated above—in the far right column—multiplied by the simple average account value over the period indicated, and then multiplied by 181/365 to reflect theone-half year period.
2. Reflects expenses after fee waivers and expense reimbursements, for Class R6.
franklintempleton.com |
Semiannual Report |
|
11 |
| ||
FRANKLIN MUTUAL SERIES FUNDS
Franklin Mutual Quest Fund
Six Months Ended June 30, 2019 (unaudited) | Year Ended December 31, | |||||||||||||||||||||||
| 2018 | 2017 | 2016 | 2015 | 2014 | ||||||||||||||||||||
| Class Z | ||||||||||||||||||||||||
Per share operating performance (for a share outstanding throughout the period) | ||||||||||||||||||||||||
Net asset value, beginning of period | $12.95 | $15.83 | $15.52 | $14.47 | $16.21 | $18.18 | ||||||||||||||||||
|
| |||||||||||||||||||||||
| Income from investment operationsa: | ||||||||||||||||||||||||
Net investment incomeb | 0.22 | 0.48 | 0.58 | 0.87c | 0.54 | 0.78d | ||||||||||||||||||
Net realized and unrealized gains (losses) | 0.77 | (1.58 | ) | 0.49 | 1.47 | (1.45 | ) | (0.16) | ||||||||||||||||
|
| |||||||||||||||||||||||
Total from investment operations | 0.99 | (1.10 | ) | 1.07 | 2.34 | (0.91 | ) | 0.62 | ||||||||||||||||
|
| |||||||||||||||||||||||
| Less distributions from: | ||||||||||||||||||||||||
Net investment income | — | (0.58 | ) | (0.63 | ) | (1.01 | ) | (0.68 | ) | (0.85) | ||||||||||||||
Net realized gains | — | (1.20 | ) | (0.13 | ) | (0.28 | ) | (0.15 | ) | (1.74) | ||||||||||||||
|
| |||||||||||||||||||||||
Total distributions | — | (1.78 | ) | (0.76 | ) | (1.29 | ) | (0.83 | ) | (2.59) | ||||||||||||||
|
| |||||||||||||||||||||||
| Net asset value, end of period | $13.94 | $12.95 | $15.83 | $15.52 | $14.47 | $16.21 | ||||||||||||||||||
|
| |||||||||||||||||||||||
Total returne | 7.64% | (6.85)% | 6.92% | 16.26% | (5.55)% | 3.44% | ||||||||||||||||||
| Ratios to average net assetsf | ||||||||||||||||||||||||
Expensesg,h | 0.79% | 0.78% | 0.79% | 0.79%i | 0.82%i | 0.81% | ||||||||||||||||||
Expenses incurred in connection with securities sold short | 0.01% | —%j | —% | 0.01% | 0.03% | 0.04% | ||||||||||||||||||
Net investment income | 3.24% | 2.96% | 3.65% | 5.74%c | 3.35% | 4.18%d | ||||||||||||||||||
| Supplemental data | ||||||||||||||||||||||||
Net assets, end of period (000’s) | $3,132,876 | $3,054,792 | $3,667,351 | $3,683,095 | $3,577,696 | $4,116,651 | ||||||||||||||||||
Portfolio turnover rate | 32.00% | 115.52% | 32.90% | 44.04% | 30.51% | 65.77% | ||||||||||||||||||
aThe amount shown for a share outstanding throughout the period may not correlate with the Statement of Operations for the period due to the timing of sales and repurchases of the Fund’s shares in relation to income earned and/or fluctuating fair value of the investments of the Fund.
bBased on average daily shares outstanding.
cNet investment income per share includes approximately $0.05 per share related to income received in the form of special dividends in connection with certain Fund holdings. Excluding this amount, the ratio of net investment income to average net assets would have been 5.42%.
dNet investment income per share includes approximately $0.27 per share related to income received in the form of special dividends in connection with certain Fund holdings. Excluding this amount, the ratio of net investment income to average net assets would have been 2.73%.
eTotal return is not annualized for periods less than one year.
fRatios are annualized for periods less than one year.
gIncludes dividend and/or interest expense on securities sold short and security borrowing fees, if any. See below for the ratios of such expenses to average net assets for the periods presented. See Note 1(e).
hBenefit of expense reduction rounds to less than 0.01%.
iBenefit of waiver and payments by affiliates rounds to less than 0.01%.
jRounds to less than 0.01%.
12 |
Semiannual Report | The accompanying notes are an integral part of these financial statements. |
franklintempleton.com | ||
FRANKLIN MUTUAL SERIES FUNDS
FINANCIAL HIGHLIGHTS
Franklin Mutual Quest Fund(continued)
Six Months Ended June 30, 2019 (unaudited) | Year Ended December 31, | |||||||||||||||||||||||
| 2018 | 2017 | 2016 | 2015 | 2014 | ||||||||||||||||||||
| Class A | ||||||||||||||||||||||||
Per share operating performance (for a share outstanding throughout the period) | ||||||||||||||||||||||||
Net asset value, beginning of period | $12.75 | $15.60 | $15.32 | $14.29 | $16.02 | $18.00 | ||||||||||||||||||
|
| |||||||||||||||||||||||
| Income from investment operationsa: | ||||||||||||||||||||||||
Net investment incomeb | 0.20 | 0.43 | 0.53 | 0.83c | 0.49 | 0.71d | ||||||||||||||||||
Net realized and unrealized gains (losses) | 0.76 | (1.54 | ) | 0.46 | 1.45 | (1.43 | ) | (0.15) | ||||||||||||||||
|
| |||||||||||||||||||||||
Total from investment operations | 0.96 | (1.11 | ) | 0.99 | 2.28 | (0.94 | ) | 0.56 | ||||||||||||||||
|
| |||||||||||||||||||||||
| Less distributions from: | ||||||||||||||||||||||||
Net investment income | — | (0.54 | ) | (0.58 | ) | (0.97 | ) | (0.64 | ) | (0.80) | ||||||||||||||
Net realized gains | — | (1.20 | ) | (0.13 | ) | (0.28 | ) | (0.15 | ) | (1.74) | ||||||||||||||
|
| |||||||||||||||||||||||
Total distributions | — | (1.74 | ) | (0.71 | ) | (1.25 | ) | (0.79 | ) | (2.54) | ||||||||||||||
|
| |||||||||||||||||||||||
Net asset value, end of period | $13.71 | $12.75 | $15.60 | $15.32 | $14.29 | $16.02 | ||||||||||||||||||
|
| |||||||||||||||||||||||
Total returne | 7.53% | (7.00)% | 6.54% | 16.04% | (5.85)% | 3.11% | ||||||||||||||||||
| Ratios to average net assetsf | ||||||||||||||||||||||||
Expensesg,h | 1.04% | 1.03% | 1.04% | 1.04%i | 1.10%i | 1.11% | ||||||||||||||||||
Expenses incurred in connection with securities sold short | 0.01% | —%j | —% | 0.01% | 0.03% | 0.04% | ||||||||||||||||||
Net investment income | 2.99% | 2.71% | 3.40% | 5.49%c | 3.07% | 3.88%d | ||||||||||||||||||
| Supplemental data | ||||||||||||||||||||||||
Net assets, end of period (000’s) | $1,090,419 | $1,067,382 | $1,153,870 | $1,216,085 | $1,203,508 | $1,394,138 | ||||||||||||||||||
Portfolio turnover rate | 32.00% | 115.52% | 32.90% | 44.04% | 30.51% | 65.77% | ||||||||||||||||||
aThe amount shown for a share outstanding throughout the period may not correlate with the Statement of Operations for the period due to the timing of sales and repurchases of the Fund’s shares in relation to income earned and/or fluctuating fair value of the investments of the Fund.
bBased on average daily shares outstanding.
cNet investment income per share includes approximately $0.05 per share related to income received in the form of special dividends in connection with certain Fund holdings. Excluding this amount, the ratio of net investment income to average net assets would have been 5.17%.
dNet investment income per share includes approximately $0.27 per share related to income received in the form of special dividends in connection with certain Fund holdings. Excluding this amount, the ratio of net investment income to average net assets would have been 2.43%.
eTotal return does not reflect sales commissions or contingent deferred sales charges, if applicable, and is not annualized for periods less than one year.
fRatios are annualized for periods less than one year.
gIncludes dividend and/or interest expense on securities sold short and security borrowing fees, if any. See below for the ratios of such expenses to average net assets for the periods presented. See Note 1(e).
hBenefit of expense reduction rounds to less than 0.01%.
iBenefit of waiver and payments by affiliates rounds to less than 0.01%.
jRounds to less than 0.01%.
franklintempleton.com |
The accompanying notes are an integral part of these financial statements. | Semiannual Report |
|
13 |
| ||
FRANKLIN MUTUAL SERIES FUNDS
FINANCIAL HIGHLIGHTS
Franklin Mutual Quest Fund(continued)
Six Months Ended June 30, 2019 (unaudited) | Year Ended December 31, | |||||||||||||||||||||||
| 2018 | 2017 | 2016 | 2015 | 2014 | ||||||||||||||||||||
| Class C | ||||||||||||||||||||||||
Per share operating performance (for a share outstanding throughout the period) | ||||||||||||||||||||||||
Net asset value, beginning of period | $12.64 | $15.35 | $15.06 | $14.08 | $15.78 | $17.76 | ||||||||||||||||||
|
| |||||||||||||||||||||||
| Income from investment operationsa: | ||||||||||||||||||||||||
Net investment incomeb | 0.15 | 0.29 | 0.41 | 0.70c | 0.36 | 0.57d | ||||||||||||||||||
Net realized and unrealized gains (losses) | 0.74 | (1.49) | 0.47 | 1.41 | (1.39) | (0.14) | ||||||||||||||||||
|
| |||||||||||||||||||||||
Total from investment operations | 0.89 | (1.20) | 0.88 | 2.11 | (1.03) | 0.43 | ||||||||||||||||||
|
| |||||||||||||||||||||||
| Less distributions from: | ||||||||||||||||||||||||
Net investment income | — | (0.31) | (0.46) | (0.85) | (0.52) | (0.67) | ||||||||||||||||||
Net realized gains | — | (1.20) | (0.13) | (0.28) | (0.15) | (1.74) | ||||||||||||||||||
|
| |||||||||||||||||||||||
Total distributions | — | (1.51) | (0.59) | (1.13) | (0.67) | (2.41) | ||||||||||||||||||
|
| |||||||||||||||||||||||
Net asset value, end of period | $13.53 | $12.64 | $15.35 | $15.06 | $14.08 | $15.78 | ||||||||||||||||||
|
| |||||||||||||||||||||||
Total returne | 7.04% | (7.77)% | 5.89% | 15.10% | (6.49)% | 2.42% | ||||||||||||||||||
| Ratios to average net assetsf | ||||||||||||||||||||||||
Expensesg,h | 1.79% | 1.78% | 1.79% | 1.79%i | 1.82%i | 1.81% | ||||||||||||||||||
Expenses incurred in connection with securities sold short | 0.01% | —%j | —% | 0.01% | 0.03% | 0.04% | ||||||||||||||||||
Net investment income | 2.24% | 1.96% | 2.65% | 4.74%c | 2.35% | 3.18%d | ||||||||||||||||||
| Supplemental data | ||||||||||||||||||||||||
Net assets, end of period (000’s) | $132,260 | $141,619 | $309,160 | $343,624 | $337,974 | $397,963 | ||||||||||||||||||
Portfolio turnover rate | 32.00% | 115.52% | 32.90% | 44.04% | 30.51% | 65.77% | ||||||||||||||||||
aThe amount shown for a share outstanding throughout the period may not correlate with the Statement of Operations for the period due to the timing of sales and repurchases of the Fund’s shares in relation to income earned and/or fluctuating fair value of the investments of the Fund.
bBased on average daily shares outstanding.
cNet investment income per share includes approximately $0.05 per share related to income received in the form of special dividends in connection with certain Fund holdings. Excluding this amount, the ratio of net investment income to average net assets would have been 4.42%.
dNet investment income per share includes approximately $0.27 per share related to income received in the form of special dividends in connection with certain Fund holdings. Excluding this amount, the ratio of net investment income to average net assets would have been 1.73%.
eTotal return does not reflect sales commissions or contingent deferred sales charges, if applicable, and is not annualized for periods less than one year.
fRatios are annualized for periods less than one year.
gIncludes dividend and/or interest expense on securities sold short and security borrowing fees, if any. See below for the ratios of such expenses to average net assets for the periods presented. See Note 1(e).
hBenefit of expense reduction rounds to less than 0.01%.
iBenefit of waiver and payments by affiliates rounds to less than 0.01%.
jRounds to less than 0.01%.
14 |
Semiannual Report | The accompanying notes are an integral part of these financial statements. |
franklintempleton.com | ||
FRANKLIN MUTUAL SERIES FUNDS
FINANCIAL HIGHLIGHTS
Franklin Mutual Quest Fund(continued)
Six Months Ended June 30, 2019 (unaudited) | Year Ended December 31, | |||||||||||||||||||||||
| 2018 | 2017 | 2016 | 2015 | 2014 | ||||||||||||||||||||
| Class R | ||||||||||||||||||||||||
Per share operating performance (for a share outstanding throughout the period) | ||||||||||||||||||||||||
Net asset value, beginning of period | $12.54 | $15.40 | $15.14 | $14.14 | $15.87 | $17.84 | ||||||||||||||||||
|
| |||||||||||||||||||||||
| Income from investment operationsa: | ||||||||||||||||||||||||
Net investment incomeb | 0.19 | 0.39 | 0.50 | 0.78c | 0.44 | 0.65d | ||||||||||||||||||
Net realized and unrealized gains (losses) | 0.74 | (1.53 | ) | 0.46 | 1.43 | (1.40 | ) | (0.13 | ) | |||||||||||||||
|
| |||||||||||||||||||||||
Total from investment operations | 0.93 | (1.14 | ) | 0.96 | 2.21 | (0.96 | ) | 0.52 | ||||||||||||||||
|
| |||||||||||||||||||||||
| Less distributions from: | ||||||||||||||||||||||||
Net investment income | — | (0.52 | ) | (0.57 | ) | (0.93 | ) | (0.62 | ) | (0.75 | ) | |||||||||||||
Net realized gains | — | (1.20 | ) | (0.13 | ) | (0.28 | ) | (0.15 | ) | (1.74 | ) | |||||||||||||
|
| |||||||||||||||||||||||
Total distributions | — | (1.72 | ) | (0.70 | ) | (1.21 | ) | (0.77 | ) | (2.49 | ) | |||||||||||||
|
| |||||||||||||||||||||||
Net asset value, end of period | $13.47 | $12.54 | $15.40 | $15.14 | $14.14 | $15.87 | ||||||||||||||||||
|
| |||||||||||||||||||||||
Total returne | 7.42% | (7.31)% | 6.38% | 15.69% | (6.03)% | 2.94% | ||||||||||||||||||
| Ratios to average net assetsf | ||||||||||||||||||||||||
Expensesg,h | 1.29% | 1.28% | 1.29% | 1.29%i | 1.32%i | 1.31% | ||||||||||||||||||
Expenses incurred in connection with securities sold short | 0.01% | —%j | —% | 0.01% | 0.03% | 0.04% | ||||||||||||||||||
Net investment income | 2.74% | 2.46% | 3.15% | 5.24%c | 2.85% | 3.68%d | ||||||||||||||||||
| Supplemental data | ||||||||||||||||||||||||
Net assets, end of period (000’s) | $3,739 | $2,929 | $1,774 | $880 | $898 | $675 | ||||||||||||||||||
Portfolio turnover rate | 32.00% | 115.52% | 32.90% | 44.04% | 30.51% | 65.77% | ||||||||||||||||||
aThe amount shown for a share outstanding throughout the period may not correlate with the Statement of Operations for the period due to the timing of sales and repurchases of the Fund’s shares in relation to income earned and/or fluctuating fair value of the investments of the Fund.
bBased on average daily shares outstanding.
cNet investment income per share includes approximately $0.05 per share related to income received in the form of special dividends in connection with certain Fund holdings. Excluding this amount, the ratio of net investment income to average net assets would have been 4.92%.
dNet investment income per share includes approximately $0.27 per share related to income received in the form of special dividends in connection with certain Fund holdings. Excluding this amount, the ratio of net investment income to average net assets would have been 2.23%.
eTotal return is not annualized for periods less than one year.
fRatios are annualized for periods less than one year.
gIncludes dividend and/or interest expense on securities sold short and security borrowing fees, if any. See below for the ratios of such expenses to average net assets for the periods presented. See Note 1(e).
hBenefit of expense reduction rounds to less than 0.01%.
iBenefit of waiver and payments by affiliates rounds to less than 0.01%.
jRounds to less than 0.01%.
franklintempleton.com |
The accompanying notes are an integral part of these financial statements. | Semiannual Report |
|
15 |
| ||
FRANKLIN MUTUAL SERIES FUNDS
FINANCIAL HIGHLIGHTS
Franklin Mutual Quest Fund(continued)
Six Months Ended June 30, 2019 (unaudited) | Year Ended December 31, | |||||||||||||||||||||||
| 2018 | 2017 | 2016 | 2015 | 2014 | ||||||||||||||||||||
| Class R6 | ||||||||||||||||||||||||
Per share operating performance (for a share outstanding throughout the period) | ||||||||||||||||||||||||
Net asset value, beginning of period | $12.94 | $15.81 | $15.51 | $14.45 | $16.19 | $18.19 | ||||||||||||||||||
|
| |||||||||||||||||||||||
| Income from investment operationsa: | ||||||||||||||||||||||||
Net investment incomeb | 0.23 | 0.49 | 0.64 | 0.88 | c | 0.55 | 0.51d | |||||||||||||||||
Net realized and unrealized gains (losses) | 0.76 | (1.57 | ) | 0.43 | 1.48 | (1.44 | ) | 0.10 | ||||||||||||||||
|
| |||||||||||||||||||||||
Total from investment operations | 0.99 | (1.08 | ) | 1.07 | 2.36 | (0.89 | ) | 0.61 | ||||||||||||||||
|
| |||||||||||||||||||||||
| Less distributions from: | ||||||||||||||||||||||||
Net investment income | — | (0.59 | ) | (0.64 | ) | (1.02 | ) | (0.70 | ) | (0.87) | ||||||||||||||
Net realized gains | — | (1.20 | ) | (0.13 | ) | (0.28 | ) | (0.15 | ) | (1.74) | ||||||||||||||
|
| |||||||||||||||||||||||
Total distributions | — | (1.79 | ) | (0.77 | ) | (1.30 | ) | (0.85 | ) | (2.61) | ||||||||||||||
|
| |||||||||||||||||||||||
Net asset value, end of period | $13.93 | $12.94 | $15.81 | $15.51 | $14.45 | $16.19 | ||||||||||||||||||
|
| |||||||||||||||||||||||
Total returne | 7.65% | (6.73)% | 6.94% | 16.44% | (5.54)% | 3.53% | ||||||||||||||||||
| Ratios to average net assetsf | ||||||||||||||||||||||||
Expenses before waiver and payments by affiliatesg | 0.75% | 0.74% | 0.72% | 0.71% | 0.74% | 0.74% | ||||||||||||||||||
Expenses net of waiver and payments by affiliatesg,h | 0.73% | 0.72% | 0.72% | 0.71% | i | 0.74% | i | 0.74% | ||||||||||||||||
Expenses incurred in connection with securities sold short | 0.01% | —% | j | —% | 0.01% | 0.03% | 0.04% | |||||||||||||||||
Net investment income | 3.30% | 3.02% | 3.72% | 5.82% | c | 3.43% | 4.25%d | |||||||||||||||||
| Supplemental data | ||||||||||||||||||||||||
Net assets, end of period (000’s) | $119,373 | $116,012 | $123,863 | $52,277 | $41,408 | $44,340 | ||||||||||||||||||
Portfolio turnover rate | 32.00% | 115.52% | 32.90% | 44.04% | 30.51% | 65.77% | ||||||||||||||||||
aThe amount shown for a share outstanding throughout the period may not correlate with the Statement of Operations for the period due to the timing of sales and repurchases of the Fund’s shares in relation to income earned and/or fluctuating fair value of the investments of the Fund.
bBased on average daily shares outstanding.
cNet investment income per share includes approximately $0.05 per share related to income received in the form of special dividends in connection with certain Fund holdings. Excluding this amount, the ratio of net investment income to average net assets would have been 5.50%.
dNet investment income per share includes approximately $0.27 per share related to income received in the form of special dividends in connection with certain Fund holdings. Excluding this amount, the ratio of net investment income to average net assets would have been 2.80%.
eTotal return is not annualized for periods less than one year.
fRatios are annualized for periods less than one year.
gIncludes dividend and/or interest expense on securities sold short and security borrowing fees, if any. See below for the ratios of such expenses to average net assets for the periods presented. See Note 1(e).
hBenefit of expense reduction rounds to less than 0.01%.
iBenefit of waiver and payments by affiliates rounds to less than 0.01%.
jRounds to less than 0.01%.
16 |
Semiannual Report | The accompanying notes are an integral part of these financial statements. |
franklintempleton.com | ||
FRANKLIN MUTUAL SERIES FUNDS
Statement of Investments, June 30, 2019 (unaudited)
Franklin Mutual Quest Fund
| Country | | Shares/ Units/ Warrants | | Value | ||||||||||
Common Stocks and Other Equity Interests 62.6% | ||||||||||||||
Aerospace & Defense 1.6% | ||||||||||||||
BAE Systems PLC | United Kingdom | 6,235,873 | $ | 39,231,948 | ||||||||||
Huntington Ingalls Industries Inc. | United States | 144,552 | 32,486,617 | |||||||||||
|
| |||||||||||||
| 71,718,565 | ||||||||||||||
|
| |||||||||||||
| Auto Components 0.0%† | ||||||||||||||
| a,b,c | International Automotive Components Group Brazil LLC | Brazil | 2,548,299 | 65,435 | ||||||||||
|
| |||||||||||||
| Banks 0.9% | ||||||||||||||
AIB Group PLC | Ireland | 1,592,995 | 6,512,343 | |||||||||||
BNP Paribas SA | France | 339,053 | 16,098,420 | |||||||||||
Wells Fargo & Co. | United States | 349,700 | 16,547,804 | |||||||||||
|
| |||||||||||||
| 39,158,567 | ||||||||||||||
|
| |||||||||||||
Biotechnology 1.2% | ||||||||||||||
| a | Celgene Corp. | United States | 598,500 | 55,325,340 | ||||||||||
|
| |||||||||||||
Chemicals 0.6% | ||||||||||||||
| d | Advanced Emissions Solutions Inc. | United States | 1,724,209 | 21,794,002 | ||||||||||
| a,b,e | Dow Corning Corp. (Revolver/Term Loan Claims), Contingent Distribution | United States | 4,651,364 | 2,481,293 | ||||||||||
| a,b,e | Dow Corning Corp. (Swap Agreement Claims), Contingent Distribution | United States | 7,437,830 | 154,603 | ||||||||||
|
| |||||||||||||
|
24,429,898 |
| ||||||||||||
|
| |||||||||||||
Commercial Services & Supplies 0.5% | ||||||||||||||
| a | Advanced Disposal Services Inc. | United States | 684,500 | 21,842,395 | ||||||||||
|
| |||||||||||||
| Communications Equipment 4.0% | ||||||||||||||
| a,b,c,d | Sorenson Communications LLC, Membership Interests | United States | 224,279 | 179,507,964 | ||||||||||
|
| |||||||||||||
| Diversified Consumer Services 0.0% | ||||||||||||||
| a,b | Affinion Group Holdings Inc., wts., 11/10/22 | United States | 549,716 | — | ||||||||||
|
| |||||||||||||
| Diversified Financial Services 1.8% | ||||||||||||||
Voya Financial Inc. | United States | 1,492,186 | 82,517,886 | |||||||||||
|
| |||||||||||||
| Diversified Telecommunication Services 1.9% | ||||||||||||||
AT&T Inc. | United States | 2,483,275 | 83,214,545 | |||||||||||
|
| |||||||||||||
| Food Products 1.0% | ||||||||||||||
Bunge Ltd. | United States | 837,200 | 46,640,412 | |||||||||||
|
| |||||||||||||
| Health Care Equipment & Supplies 0.9% | ||||||||||||||
Medtronic PLC | United States | 398,143 | 38,775,147 | |||||||||||
|
| |||||||||||||
| Independent Power & Renewable Electricity Producers 1.5% | ||||||||||||||
Vistra Energy Corp. | United States | 3,037,472 | 68,768,366 | |||||||||||
|
| |||||||||||||
| Insurance 8.7% | ||||||||||||||
ASR Nederland NV | Netherlands | 973,898 | 39,592,613 | |||||||||||
| a | Brighthouse Financial Inc. | United States | 2,017,398 | 74,018,332 | ||||||||||
Chubb Ltd. | United States | 44,100 | 6,495,489 | |||||||||||
Everest Re Group Ltd. | United States | 475,366 | 117,500,968 | |||||||||||
The Hartford Financial Services Group Inc. | United States | 1,116,790 | 62,227,539 | |||||||||||
Lancashire Holdings Ltd. | United Kingdom | 899,403 | 7,864,025 | |||||||||||
NN Group NV | �� | Netherlands | 1,223,210 | 49,227,464 | ||||||||||
franklintempleton.com |
Semiannual Report |
|
17 |
| ||
FRANKLIN MUTUAL SERIES FUNDS
STATEMENT OF INVESTMENTS (UNAUDITED)
Franklin Mutual Quest Fund(continued)
| Country | | Shares/ Units/ Warrants | | Value | ||||||||||
| Common Stocks and Other Equity Interests(continued) | ||||||||||||||
| Insurance(continued) | ||||||||||||||
RSA Insurance Group PLC | United Kingdom | 4,597,724 | $ | 33,678,656 | ||||||||||
|
| |||||||||||||
| 390,605,086 | ||||||||||||||
|
| |||||||||||||
Interactive Media & Services 2.6% | ||||||||||||||
| a | Baidu Inc., ADR | China | 1,004,493 | 117,887,299 | ||||||||||
|
| |||||||||||||
IT Services 1.6% | ||||||||||||||
Cognizant Technology Solutions Corp., A | United States | 949,400 | 60,182,466 | |||||||||||
| a | First Data Corp., A | United States | 457,500 | 12,384,525 | ||||||||||
|
| |||||||||||||
|
72,566,991 |
| ||||||||||||
|
| |||||||||||||
Machinery 1.4% | ||||||||||||||
| a | Navistar International Corp. | United States | 1,870,986 | 64,455,468 | ||||||||||
|
| |||||||||||||
Media 7.2% | ||||||||||||||
| a | Charter Communications Inc., A | United States | 166,989 | 65,990,713 | ||||||||||
| a | Clear Channel Outdoor Holdings Inc. | United States | 4,368,132 | 20,617,583 | ||||||||||
| a | Cumulus Media Inc., A | United States | 56,050 | 1,039,728 | ||||||||||
| a | Cumulus Media Inc., B | United States | 67,399 | 1,250,252 | ||||||||||
| a | Cumulus Media Inc., wts., 6/04/38 | United States | 57,778 | 938,893 | ||||||||||
| a | Discovery Inc., C | United States | 2,890,384 | 82,171,702 | ||||||||||
| a,b,c | iHeartMedia Inc., A | United States | 1,408,213 | 20,440,614 | ||||||||||
| a,b,c | iHeartMedia Inc., B | United States | 23,770 | 345,028 | ||||||||||
| a,b,c | iHeartMedia Inc., wts., A, 5/01/39 | United States | 1,872 | 27,171 | ||||||||||
| a,d | Lee Enterprises Inc./IA | United States | 3,245,968 | 7,270,968 | ||||||||||
| a,b,c,d | Lee Enterprises Inc., wts., 12/31/22 | United States | 1,110,000 | 523,132 | ||||||||||
| a | Liberty Global PLC, C | United Kingdom | 3,675,389 | 97,508,070 | ||||||||||
New Media Investment Group Inc. | United States | 2,768,935 | 26,138,746 | |||||||||||
|
| |||||||||||||
|
324,262,600 |
| ||||||||||||
|
| |||||||||||||
| Metals & Mining 0.0%† | ||||||||||||||
Warrior Met Coal Inc. | United States | 25,353 | 662,220 | |||||||||||
|
| |||||||||||||
| Oil, Gas & Consumable Fuels 5.5% | ||||||||||||||
Anadarko Petroleum Corp. | United States | 96,900 | 6,837,264 | |||||||||||
Canadian Natural Resources Ltd. | Canada | 388,900 | 10,484,489 | |||||||||||
Crescent Point Energy Corp. | Canada | 5,965,553 | 19,721,966 | |||||||||||
JXTG Holdings Inc. | Japan | 22,389,037 | 110,969,221 | |||||||||||
Kinder Morgan Inc. | United States | 947,170 | 19,776,909 | |||||||||||
Marathon Oil Corp. | United States | 1,683,900 | 23,928,219 | |||||||||||
Occidental Petroleum Corp. | United States | 1,104,100 | 55,514,148 | |||||||||||
|
| |||||||||||||
|
247,232,216 |
| ||||||||||||
|
| |||||||||||||
Pharmaceuticals 3.3% | ||||||||||||||
Eli Lilly & Co. | United States | 212,900 | 23,587,191 | |||||||||||
Novartis AG, ADR | Switzerland | 529,806 | 48,376,586 | |||||||||||
Perrigo Co. PLC | United States | 1,384,942 | 65,950,938 | |||||||||||
| a | Teva Pharmaceutical Industries Ltd., ADR | Israel | 992,424 | 9,160,073 | ||||||||||
|
| |||||||||||||
|
147,074,788 |
| ||||||||||||
|
| |||||||||||||
18 |
Semiannual Report |
franklintempleton.com | ||
FRANKLIN MUTUAL SERIES FUNDS
STATEMENT OF INVESTMENTS (UNAUDITED)
Franklin Mutual Quest Fund(continued)
| Country | | Shares/ Units/ Warrants | | Value | ||||||||||
Common Stocks and Other Equity Interests(continued) | ||||||||||||||
| Semiconductors & Semiconductor Equipment 1.6% | ||||||||||||||
| a,f,g | Micron Technology Inc. | United States | 1,563,072 | $ | 60,318,948 | |||||||||
| a | Renesas Electronics Corp. | Japan | 1,837,914 | 9,119,681 | ||||||||||
|
| |||||||||||||
| 69,438,629 | ||||||||||||||
|
| |||||||||||||
| Software 4.5% | ||||||||||||||
| a | Avaya Holdings Corp., wts., 12/15/22 | United States | 338,090 | 338,090 | ||||||||||
| a | Check Point Software Technologies Ltd. | Israel | 95,538 | 11,045,148 | ||||||||||
| a | Red Hat Inc. | United States | 857,900 | 161,079,304 | ||||||||||
Symantec Corp. | United States | 1,222,399 | 26,599,402 | |||||||||||
|
| |||||||||||||
|
199,061,944 |
| ||||||||||||
|
| |||||||||||||
| Specialty Retail 1.2% | ||||||||||||||
Dufry AG | Switzerland | 336,596 | 28,500,955 | |||||||||||
| a,b,d | TRU Kids Parent LLC | United States | 7,104 | 25,930,372 | ||||||||||
|
| |||||||||||||
|
54,431,327 |
| ||||||||||||
|
| |||||||||||||
| Technology Hardware, Storage & Peripherals 0.1% | ||||||||||||||
| a,b,d | Wayne Services Legacy Inc. | United States | 7,104 | 2,484,752 | ||||||||||
|
| |||||||||||||
| Tobacco 6.6% | ||||||||||||||
Altria Group Inc. | United States | 990,100 | 46,881,235 | |||||||||||
British American Tobacco PLC | United Kingdom | 4,861,205 | 169,709,161 | |||||||||||
Imperial Brands PLC | United Kingdom | 3,434,804 | 80,557,955 | |||||||||||
|
| |||||||||||||
|
297,148,351 |
| ||||||||||||
|
| |||||||||||||
Wireless Telecommunication Services 2.4% | ||||||||||||||
Vodafone Group PLC | United Kingdom | 64,643,156 | 106,163,409 | |||||||||||
|
| |||||||||||||
Total Common Stocks and Other Equity Interests | 2,805,439,600 | |||||||||||||
|
| |||||||||||||
Management Investment Companies (Cost $1,786,725) 0.0%† | ||||||||||||||
Diversified Financial Services 0.0%† | ||||||||||||||
| a | Altaba Inc. | United States | 30,100 | 2,088,037 | ||||||||||
|
| |||||||||||||
Convertible Preferred Stocks (Cost $16,185,410) 0.4% | ||||||||||||||
| Multi-Utilities 0.4% | ||||||||||||||
Sempra Energy, 6.00%, cvt. pfd., A | United States | 160,650 | 17,910,869 | |||||||||||
|
| |||||||||||||
| Preferred Stocks 1.7% | ||||||||||||||
Auto Components 0.7% | ||||||||||||||
| h | Schaeffler AG, 8.405%, pfd | Germany | 3,994,296 | 29,715,751 | ||||||||||
|
| |||||||||||||
Automobiles 0.1% | ||||||||||||||
| h | Volkswagen AG, 3.279%, pfd | Germany | 38,884 | 6,552,106 | ||||||||||
|
| |||||||||||||
Technology Hardware, Storage & Peripherals 0.9% | ||||||||||||||
| h | Samsung Electronics Co. Ltd., 3.705%, pfd | South Korea | 1,162,517 | 38,434,383 | ||||||||||
|
| |||||||||||||
Total Preferred Stocks (Cost $69,153,470) | 74,702,240 | |||||||||||||
|
| |||||||||||||
franklintempleton.com |
Semiannual Report |
|
19 |
| ||
FRANKLIN MUTUAL SERIES FUNDS
STATEMENT OF INVESTMENTS (UNAUDITED)
Franklin Mutual Quest Fund(continued)
| Country | | Principal Amount | * | Value | ||||||||||
| Corporate Bonds, Notes and Senior Floating Rate Interests 16.7% | ||||||||||||||
| i,j | Affinion Group Inc., Term Loan, 8.154%,(1-month USD LIBOR + 5.75%), 4/05/24 | United States | $ 18,492,195 | $ 15,937,961 | ||||||||||
| k | Banff Merger Sub Inc., senior note, 144A, 9.75%, 9/01/26 | United States | 50,000,000 | 43,625,000 | ||||||||||
| k | CCO Holdings LLC/CCO Holdings Capital Corp., | |||||||||||||
senior bond, 144A, 5.75%, 2/15/26 | United States | 2,000,000 | 2,102,500 | |||||||||||
senior bond, 144A, 5.50%, 5/01/26 | United States | 27,978,000 | 29,350,321 | |||||||||||
Envision Healthcare Corp., | ||||||||||||||
ksenior note, 144A, 8.75%, 10/15/26 | United States | 140,000,000 | 98,350,000 | |||||||||||
i,jTerm Loan B, 6.152%,(1-month USD LIBOR + 3.75%), 10/11/25 | United States | 40,844,875 | 36,198,770 | |||||||||||
| k | First Data Corp., senior secured note, first lien, 144A, 5.375%, 8/15/23 | United States | 46,273,000 | 47,163,755 | ||||||||||
Frontier Communications Corp., | ||||||||||||||
senior note, 8.875%, 9/15/20 | United States | 21,382,000 | 16,784,870 | |||||||||||
senior note, 10.50%, 9/15/22 | United States | 77,063,000 | 52,595,497 | |||||||||||
senior note, 11.00%, 9/15/25 | United States | 41,812,000 | 26,132,500 | |||||||||||
ksenior secured note, first lien, 144A, 8.00%, 4/01/27 | United States | 20,000,000 | 20,850,000 | |||||||||||
| d | Lee Enterprises Inc., | |||||||||||||
jSecond Lien Term Loan, 12.00%, 12/15/22 | United States | 37,375,947 | 37,562,827 | |||||||||||
ksenior secured note, first lien, 144A, 9.50%, 3/15/22 | United States | 97,050,000 | 98,991,000 | |||||||||||
| k | Navistar International Corp., senior note, 144A, 6.625%, 11/01/25 | United States | 32,270,000 | 33,964,175 | ||||||||||
| k | Rite Aid Corp., senior note, 144A, 6.125%, 4/01/23 | United States | 37,132,000 | 31,469,370 | ||||||||||
| d,i,j | Sorenson Communications LLC, Initial Term Loans, 8.83%,(3-month USD LIBOR + 6.50%), 3/14/24 | United States | 13,500,000 | 13,550,625 | ||||||||||
Sprint Communications Inc., senior note, 7.00%, 8/15/20 | United States | 12,000,000 | 12,465,000 | |||||||||||
| k | Symantec Corp., senior note, 144A, 5.00%, 4/15/25 | United States | 7,000,000 | 7,179,083 | ||||||||||
| i,j | Veritas U.S. Inc., | |||||||||||||
Term Loan B1, 6.902%,(1-month USD LIBOR + 4.50%), 1/27/23 | United States | 19,226,634 | 17,496,237 | |||||||||||
Term Loan B1, 6.83%,(3-month USD LIBOR + 4.50%), 1/27/23 | United States | 3,816,283 | 3,472,818 | |||||||||||
| k | Veritas U.S. Inc./Veritas Bermuda Ltd., | |||||||||||||
senior note, 144A, 7.50%, 2/01/23 | United States | 3,682,000 | 3,461,080 | |||||||||||
senior note, 144A, 10.50%, 2/01/24 | United States | 30,222,000 | 25,990,920 | |||||||||||
Western Digital Corp., senior note, 4.75%, 2/15/26 | United States | 14,000,000 | 13,769,700 | |||||||||||
| i,j,l | Windstream Services LLC, | |||||||||||||
mRevolving Commitment, 8.50%, (Prime + 3.00%), 4/24/20 | United States | 53,543,799 | 53,836,684 | |||||||||||
nTerm Loan B6, TBD, 3/30/21 | United States | 5,049,000 | 5,206,781 | |||||||||||
|
| |||||||||||||
Total Corporate Bonds, Notes and Senior Floating Rate Interests |
| 747,507,474 | ||||||||||||
|
| |||||||||||||
Corporate Bonds and Notes in Reorganization 0.2% | ||||||||||||||
| b,c,o | Broadband Ventures III LLC, secured promissory note, 5.00%, 2/01/12 | United States | 9,272 | — | ||||||||||
| o | Pacific Gas & Electric Co., | |||||||||||||
senior bond, 4.45%, 4/15/42 | United States | 1,375,000 | 1,323,437 | |||||||||||
senior bond, 3.75%, 8/15/42 | United States | 2,143,000 | 1,950,130 | |||||||||||
senior bond, 4.00%, 12/01/46 | United States | 2,428,000 | 2,215,550 | |||||||||||
senior bond, 3.95%, 12/01/47 | United States | 1,141,000 | 1,031,179 | |||||||||||
| b,c,o | Sunshine Oilsands Ltd., secured note, 144A, 10.00%, 8/01/17 | Canada | 17,873,000 | 2,608,484 | ||||||||||
|
| |||||||||||||
Total Corporate Bonds and Notes in Reorganization | 9,128,780 | |||||||||||||
|
| |||||||||||||
20 |
Semiannual Report |
franklintempleton.com | ||
FRANKLIN MUTUAL SERIES FUNDS
STATEMENT OF INVESTMENTS (UNAUDITED)
Franklin Mutual Quest Fund(continued)
Country
| Shares
| Value
| ||||||||||||
| ||||||||||||||
| Companies in Liquidation 0.0%† | ||||||||||||||
| a,b,e | Avaya Holdings Corp., Contingent Distribution | United States | 82,902,380 | $ | — | |||||||||
| a,b,e | Avaya Inc., Contingent Distribution | United States | 60,987,607 | — | ||||||||||
| a,b,e | Clear Channel Communications Inc., Contingent Distribution | United States | 72,867,000 | — | ||||||||||
| a,b,e | iHeartCommunications Inc., Contingent Distribution | United States | 61,658,229 | — | ||||||||||
| a,b,e | NewPage Corp., Litigation Trust, Contingent Distribution | United States | 723,000 | — | ||||||||||
| a,b,e | Tribune Media, Litigation Trust, Contingent Distribution | United States | 1,514,115 | — | ||||||||||
| a,e | Vistra Energy Corp., Litigation Trust, Contingent Distribution | United States | 104,175,133 | 156,263 | ||||||||||
|
| |||||||||||||
Total Companies in Liquidation (Cost $3,236,688) | 156,263 | |||||||||||||
|
| |||||||||||||
Total Investments before Short Term Investments | 3,656,933,263 | |||||||||||||
|
| |||||||||||||
|
| Principal Amount
| *
| ||||||||||||
|
| |||||||||||||
Short Term Investments 17.6% | ||||||||||||||
U.S. Government and Agency Securities 17.6% | ||||||||||||||
| p | FHLB, 7/01/19 | United States | $ | 117,200,000 | 117,200,000 | |||||||||
| p | U.S. Treasury Bill, | |||||||||||||
7/18/19 | United States | 100,000,000 | 99,904,611 | |||||||||||
8/01/19 | United States | 50,000,000 | 49,913,350 | |||||||||||
8/15/19 | United States | 50,000,000 | 49,871,094 | |||||||||||
8/22/19 | United States | 50,000,000 | 49,850,590 | |||||||||||
8/29/19 | United States | 50,000,000 | 49,828,531 | |||||||||||
9/05/19 | United States | 50,000,000 | 49,809,081 | |||||||||||
7/02/19 - 9/26/19 | United States | 147,400,000 | 147,185,875 | |||||||||||
10/10/19 | United States | 50,000,000 | 49,708,047 | |||||||||||
10/17/19 | United States | 50,000,000 | 49,696,625 | |||||||||||
g 10/24/19 | United States | 25,000,000 | 24,842,061 | |||||||||||
g 10/31/19 | United States | 50,000,000 | 49, 659,798 | |||||||||||
|
| |||||||||||||
Total U.S. Government and Agency Securities (Cost $787,040,568) | 787,469,663 | |||||||||||||
|
| |||||||||||||
Total Investments (Cost $4,601,148,600) 99.2% | 4,444,402,926 | |||||||||||||
Options Written (0.0)%† | (748,500 | ) | ||||||||||||
Securities Sold Short (1.1)% | (50,502,333 | ) | ||||||||||||
Other Assets, less Liabilities 1.9% | 85,514,736 | |||||||||||||
|
| |||||||||||||
Net Assets 100.0% | $ | 4,478,666,829 | ||||||||||||
|
| |||||||||||||
Number of
| Notional
| |||||||||||||
|
|
|
| |||||||||||
| q | Options Written (0.0)%† | |||||||||||||
Calls - Exchange-Traded | ||||||||||||||
Micron Technology Inc., September Strike Price $40, Expires 9/20/19 | 2,250 | 225,000 | (598,500 | ) | ||||||||||
|
| |||||||||||||
| franklintempleton.com | Semiannual Report | 21 | ||
FRANKLIN MUTUAL SERIES FUNDS
STATEMENT OF INVESTMENTS (UNAUDITED)
Franklin Mutual Quest Fund(continued)
| Number of Contracts | Notional Amount# | Value | ||||||||||||
| ||||||||||||||
| q | Options Written(continued) |
| ||||||||||||
| Puts - Exchange-Traded | ||||||||||||||
Symantec Corp., October Strike Price $19, Expires 10/18/19 | 2,500 | 250,000 | $ | (150,000 | ) | |||||||||
|
| |||||||||||||
Total Options Written (Premiums received $809,054) | $ | (748,500 | ) | |||||||||||
|
| |||||||||||||
| Country | Shares | |||||||||||||
r | Securities Sold Short (1.1)% | |||||||||||||
Common Stocks (1.1)% | ||||||||||||||
Equity Real Estate Investment Trusts (REITs) (0.2)% | ||||||||||||||
Seritage Growth Properties, A | United States | 226,850 | (9,745,476 | ) | ||||||||||
|
| |||||||||||||
Internet & Direct Marketing Retail (0.1)% | ||||||||||||||
Alibaba Group Holding Ltd., ADR | China | 32,000 | (5,422,400 | ) | ||||||||||
|
| |||||||||||||
IT Services (0.3)% | ||||||||||||||
Fiserv Inc. | United States | 138,622 | (12,636,782 | ) | ||||||||||
|
| |||||||||||||
Pharmaceuticals (0.5)% | ||||||||||||||
Bristol-Myers Squibb Co. | United States | 500,500 | (22,697,675 | ) | ||||||||||
|
| |||||||||||||
Total Securities Sold Short (Proceeds $51,185,080) | $ | (50,502,333 | ) | |||||||||||
|
| |||||||||||||
†Rounds to less than 0.1% of net assets.
*The principal amount is stated in U.S. dollars unless otherwise indicated.
#Notional amount is the number of units specified in the contract, and can include currency units, bushels, shares, pounds barrels or other units. Currency units are stated in U.S. dollars unless otherwise indicated.
aNon-income producing.
bFair valued using significant unobservable inputs. See Note 15 regarding fair value measurements.
cSee Note 10 regarding restricted securities.
dSee Note 13 regarding holdings of 5% voting securities.
eContingent distributions represent the right to receive additional distributions, if any, during the reorganization of the underlying company. Shares represent total underlying principal of debt securities.
fA portion or all of the security is held in connection with written option contracts open at period end.
gA portion or all of the security has been segregated as collateral for securities sold short and/or open written options contracts. At June 30, 2019, the aggregate value of these securities pledged amounted to $30,761,549, representing 0.7% of net assets.
hVariable rate security. The rate shown represents the yield at period end.
iThe coupon rate shown represents the rate at period end.
jSee Note 1(f) regarding senior floating rate interests.
kSecurity was purchased pursuant to Rule 144A under the Securities Act of 1933 and may be sold in transactions exempt from registration only to qualified institutional buyers or in a public offering registered under the Securities Act of 1933. These securities have been deemed liquid under guidelines approved by the Trust’s Board of Trustees. At June 30, 2019, the aggregate value of these securities was $442,497,204, representing 9.9% of net assets.
lSecurity purchased on a delayed delivery basis. See Note 1(c).
mSee Note 11 regarding unfunded loan commitments.
nA portion or all of the security represents an unsettled loan commitment. The coupon rate isto-be determined (TBD) at the time of settlement and will be based upon a reference index/floor plus a spread.
oSee Note 8 regarding credit risk and defaulted securities.
pThe security was issued on a discount basis with no stated coupon rate.
qSee Note 1(d) regarding written options.
rSee Note 1(e) regarding securities sold short.
| 22 | Semiannual Report | franklintempleton.com | ||
FRANKLIN MUTUAL SERIES FUNDS
STATEMENT OF INVESTMENTS (UNAUDITED)
Franklin Mutual Quest Fund(continued)
At June 30, 2019, the Fund had the following futures contracts outstanding. See Note 1(d).
| Futures Contracts | ||||||||||||||||||||
| Description | Type | Number of Contracts | Notional Amount* | Expiration Date | Value/ Unrealized Appreciation (Depreciation) | |||||||||||||||
| ||||||||||||||||||||
Currency Contracts | ||||||||||||||||||||
EUR/USD | Short | 516 | $73,829,925 | 9/16/19 | $(205,017 | ) | ||||||||||||||
GBP/USD | Short | 815 | 64,940,219 | 9/16/19 | 136,065 | |||||||||||||||
|
| |||||||||||||||||||
Total Futures Contracts |
| $ (68,952 | ) | |||||||||||||||||
|
| |||||||||||||||||||
*As of period end.
At June 30, 2019, the Fund had the following forward exchange contracts outstanding. See Note 1(d).
| Forward Exchange Contracts | ||||||||||||||||||||||||||||
| Currency | Counterpartya | Type | Quantity | Contract Amount | Settlement Date | Unrealized Appreciation | Unrealized Depreciation | |||||||||||||||||||||
| ||||||||||||||||||||||||||||
| OTC Forward Exchange Contracts |
| |||||||||||||||||||||||||||
Euro | BOFA | Buy | 2,457,855 | $ | 2,810,250 | 7/15/19 | $ | — | $ | (11,955 | ) | |||||||||||||||||
Euro | BOFA | Buy | 3,694,579 | 4,159,281 | 7/15/19 | 47,037 | — | |||||||||||||||||||||
Euro | BONY | Buy | 953,042 | 1,075,970 | 7/15/19 | 9,079 | — | |||||||||||||||||||||
Euro | BONY | Sell | 20,867,567 | 24,065,250 | 7/15/19 | 307,295 | — | |||||||||||||||||||||
Euro | HSBK | Buy | 1,386,957 | 1,565,781 | 7/15/19 | 13,286 | — | |||||||||||||||||||||
Euro | HSBK | Sell | 1,050,000 | 1,190,492 | 7/15/19 | — | (4,945 | ) | ||||||||||||||||||||
Euro | HSBK | Sell | 36,944,263 | 42,339,708 | 7/15/19 | 278,258 | — | |||||||||||||||||||||
Euro | SSBT | Buy | 3,637,367 | 4,107,715 | 7/15/19 | 33,467 | — | |||||||||||||||||||||
Euro | SSBT | Sell | 1,050,000 | 1,190,523 | 7/15/19 | — | (4,914 | ) | ||||||||||||||||||||
Euro | UBSW | Buy | 6,802,219 | 7,678,534 | 7/15/19 | 65,868 | — | |||||||||||||||||||||
British Pound | BOFA | Sell | 6,964,452 | 9,152,833 | 8/14/19 | 288,060 | — | |||||||||||||||||||||
British Pound | BONY | Sell | 79,734,374 | 103,740,300 | 8/14/19 | 2,249,589 | — | |||||||||||||||||||||
British Pound | HSBK | Buy | 2,667,318 | 3,378,272 | 8/14/19 | 16,851 | — | |||||||||||||||||||||
British Pound | HSBK | Sell | 2,978,917 | 3,885,617 | 8/14/19 | 93,870 | — | |||||||||||||||||||||
British Pound | UBSW | Buy | 1,355,949 | 1,709,634 | 8/14/19 | 16,299 | — | |||||||||||||||||||||
British Pound | UBSW | Buy | 2,500,000 | 3,185,485 | 8/14/19 | — | (3,334 | ) | ||||||||||||||||||||
British Pound | UBSW | Sell | 6,895,924 | 9,112,262 | 8/14/19 | 334,716 | — | |||||||||||||||||||||
South Korean Won | HSBK | Buy | 3,080,670,050 | 2,601,119 | 8/16/19 | 65,031 | — | |||||||||||||||||||||
South Korean Won | HSBK | Sell | 9,658,801,056 | 8,600,928 | 8/16/19 | 241,768 | — | |||||||||||||||||||||
South Korean Won | UBSW | Sell | 4,671,363,326 | 4,208,246 | 8/16/19 | 165,438 | — | |||||||||||||||||||||
British Pound | BONY | Sell | 89,508,288 | 117,506,033 | 10/24/19 | 3,259,210 | — | |||||||||||||||||||||
South Korean Won | HSBK | Sell | 19,481,138,785 | 16,739,091 | 11/15/19 | — | (169,662 | ) | ||||||||||||||||||||
South Korean Won | UBSW | Sell | 13,038,131,933 | 11,264,751 | 11/15/19 | — | (51,762 | ) | ||||||||||||||||||||
Euro | BOFA | Sell | 3,646,168 | 4,159,299 | 11/21/19 | — | (33,738 | ) | ||||||||||||||||||||
Euro | UBSW | Sell | 1,821,178 | 2,060,665 | 11/21/19 | — | (33,661 | ) | ||||||||||||||||||||
British Pound | BOFA | Sell | 829,093 | 1,062,692 | 11/22/19 | 3,288 | — | |||||||||||||||||||||
British Pound | HSBK | Sell | 726,053 | 929,827 | 11/22/19 | 2,086 | — | |||||||||||||||||||||
| franklintempleton.com | Semiannual Report | 23 | ||
FRANKLIN MUTUAL SERIES FUNDS
STATEMENT OF INVESTMENTS (UNAUDITED)
Franklin Mutual Quest Fund(continued)
| Forward Exchange Contracts(continued) | ||||||||||||||||||||||||||||
| Currency | Counterpartya | Type | Quantity | Contract Amount | Settlement Date | Unrealized Appreciation | Unrealized Depreciation | |||||||||||||||||||||
| ||||||||||||||||||||||||||||
| OTC Forward Exchange Contracts(continued) |
| |||||||||||||||||||||||||||
British Pound | SSBT | Sell | 32,038,055 | $ | 40,820,487 | 11/22/19 | $ — | $(117,311 | ) | |||||||||||||||||||
|
| |||||||||||||||||||||||||||
Total Forward Exchange Contracts |
| $7,490,496 | $(431,282 | ) | ||||||||||||||||||||||||
|
| |||||||||||||||||||||||||||
Net unrealized appreciation (depreciation) |
| $7,059,214 | ||||||||||||||||||||||||||
|
| |||||||||||||||||||||||||||
aMay be comprised of multiple contracts with the same counterparty, currency and settlement date.
See Note 12 regarding other derivative information.
See Abbreviations on page 44.
| 24 | Semiannual Report | The accompanying notes are an integral part of these financial statements. | franklintempleton.com | ||
FRANKLIN MUTUAL SERIES FUNDS
Statement of Assets and Liabilities
June 30, 2019 (unaudited)
Franklin Mutual Quest Fund
Assets: | ||||
Investments in securities: | ||||
Cost - Unaffiliated issuers | $4,380,123,674 | |||
Cost -Non-controlled affiliates (Note 13) | 221,024,926 | |||
|
| |||
Value - Unaffiliated issuers | $4,056,787,284 | |||
Value -Non-controlled affiliates (Note 13) | 387,615,642 | |||
Cash | 931,268 | |||
Foreign currency, at value (cost $4,101,292) | 4,101,030 | |||
Receivables: | ||||
Investment securities sold | 36,625,271 | |||
Capital shares sold | 1,761,344 | |||
Dividends and interest | 27,622,884 | |||
European Union tax reclaims | 647,077 | |||
Deposits with brokers for: | ||||
Securities sold short | 51,549,475 | |||
Futures contracts | 2,769,230 | |||
Due from brokers | 197,217 | |||
Unrealized appreciation on OTC forward exchange contracts | 7,490,496 | |||
Unrealized appreciation on unfunded loan commitments (Note 11) | 11,535 | |||
Other assets | 353,270 | |||
|
| |||
Total assets |
|
4,578,463,023 |
| |
|
| |||
Liabilities: | ||||
Payables: | ||||
Investment securities purchased | 40,511,508 | |||
Capital shares redeemed | 3,155,389 | |||
Management fees | 2,489,056 | |||
Distribution fees | 700,680 | |||
Transfer agent fees | 356,407 | |||
Trustees’ fees and expenses | 363,794 | |||
Variation margin on futures contracts | 241,606 | |||
Options written, at value (premiums received $809,054) | 748,500 | |||
Securities sold short, at value (proceeds $51,185,080) | 50,502,333 | |||
Unrealized depreciation on OTC forward exchange contracts | 431,282 | |||
Accrued expenses and other liabilities | 295,639 | |||
|
| |||
Total liabilities |
|
99,796,194 |
| |
|
| |||
Net assets, at value |
|
$4,478,666,829 |
| |
|
| |||
Net assets consist of: | ||||
Paid-in capital | $4,802,956,942 | |||
Total distributable earnings (loss) | (324,290,113 | ) | ||
|
| |||
Net assets, at value |
|
$4,478,666,829 |
| |
|
|
| franklintempleton.com | The accompanying notes are an integral part of these financial statements. | Semiannual Report | 25 | ||
FRANKLIN MUTUAL SERIES FUNDS
FINANCIAL STATEMENTS
Statement of Assets and Liabilities(continued)
June 30, 2019 (unaudited)
Franklin Mutual Quest Fund
| Class Z: | ||||
Net assets, at value | $3,132,875,519 | |||
|
| |||
Shares outstanding | 224,736,896 | |||
|
| |||
Net asset value and maximum offering price per share | $13.94 | |||
|
| |||
| Class A: | ||||
Net assets, at value | $1,090,418,847 | |||
|
| |||
Shares outstanding | 79,547,841 | |||
|
| |||
Net asset value per sharea | $13.71 | |||
|
| |||
Maximum offering price per share (net asset value per share ÷ 94.50%) | $14.51 | |||
|
| |||
| Class C: | ||||
Net assets, at value | $ 132,260,217 | |||
|
| |||
Shares outstanding | 9,773,498 | |||
|
| |||
Net asset value and maximum offering price per sharea | $13.53 | |||
|
| |||
| Class R: | ||||
Net assets, at value | $ 3,738,944 | |||
|
| |||
Shares outstanding | 277,676 | |||
|
| |||
Net asset value and maximum offering price per share | $13.47 | |||
|
| |||
| Class R6: | ||||
Net assets, at value | $ 119,373,302 | |||
|
| |||
Shares outstanding | 8,571,229 | |||
|
| |||
Net asset value and maximum offering price per share | $13.93 | |||
|
| |||
aRedemption price is equal to net asset value less contingent deferred sales charges, if applicable.
| 26 | Semiannual Report | The accompanying notes are an integral part of these financial statements. | franklintempleton.com | ||
FRANKLIN MUTUAL SERIES FUNDS
FINANCIAL STATEMENTS
Statement of Operations
for the six months ended June 30, 2019 (unaudited)
Franklin Mutual Quest Fund
Investment income: | ||||
Dividends: (net of foreign taxes)* | ||||
Unaffiliated issuers | $ | 34,023,396 | ||
Non-controlled affiliates (Note 13) | 1,914,300 | |||
Interest: | ||||
Unaffiliated issuers | 43,788,981 | |||
Non-controlled affiliates (Note 13) | 12,410,787 | |||
|
| |||
Total investment income |
|
92,137,464 |
| |
|
| |||
Expenses: | ||||
Management fees (Note 3a) | 15,430,162 | |||
Distribution fees: (Note 3c) | ||||
Class A | 1,391,366 | |||
Class C | 703,183 | |||
Class R | 8,711 | |||
Transfer agent fees: (Note 3e) | ||||
Class Z | 1,315,656 | |||
Class A | 459,555 | |||
Class C | 58,068 | |||
Class R | 1,439 | |||
Class R6 | 26,269 | |||
Custodian fees (Note 4) | 87,525 | |||
Reports to shareholders | 126,804 | |||
Registration and filing fees | 64,997 | |||
Professional fees | 35,122 | |||
Trustees’ fees and expenses | 161,360 | |||
Dividends on securities sold short | 222,883 | |||
Other | 54,339 | |||
|
| |||
Total expenses | 20,147,439 | |||
Expense reductions (Note 4) | (42,145 | ) | ||
Expenses waived/paid by affiliates (Note 3f) | (13,993 | ) | ||
|
| |||
Net expenses |
|
20,091,301 |
| |
|
| |||
Net investment income |
|
72,046,163 |
| |
|
| |||
Realized and unrealized gains (losses): | ||||
Net realized gain (loss) from: | ||||
Investments: | ||||
Unaffiliated issuers | (169,805,277 | ) | ||
Non-controlled affiliates (Note 13) | 2,036,685 | |||
Written options | 2,057,126 | |||
Foreign currency transactions | 224,991 | |||
Forward exchange contracts | 10,170,034 | |||
Futures contracts | 3,455,409 | |||
Securities sold short | 292,415 | |||
|
| |||
Net realized gain (loss) |
|
(151,568,617 |
) | |
|
| |||
Net change in unrealized appreciation (depreciation) on: | ||||
Investments: | ||||
Unaffiliated issuers | 389,440,425 | |||
Non-controlled affiliates (Note 13) | 20,993,020 | |||
Translation of other assets and liabilities denominated in foreign currencies | (49,974 | ) | ||
Forward exchange contracts | (3,214,173 | ) | ||
Written options | 6,108,322 | |||
| franklintempleton.com | The accompanying notes are an integral part of these financial statements. | Semiannual Report | 27 | ||
FRANKLIN MUTUAL SERIES FUNDS
FINANCIAL STATEMENTS
Statement of Operations(continued)
for the six months ended June 30, 2019 (unaudited)
Franklin Mutual Quest Fund
Futures contracts | (220,361 | ) | ||
Securities sold short | (657,511 | ) | ||
|
| |||
Net change in unrealized appreciation (depreciation) | 412,399,748 | |||
|
| |||
Net realized and unrealized gain (loss) | 260,831,131 | |||
|
| |||
Net increase (decrease) in net assets resulting from operations | $ | 332,877,294 | ||
|
| |||
*Foreign taxes withheld on dividends | $ | 1,615,294 |
| 28 | Semiannual Report | The accompanying notes are an integral part of these financial statements. | franklintempleton.com | ||
FRANKLIN MUTUAL SERIES FUNDS
FINANCIAL STATEMENTS
Statements of Changes in Net Assets
Franklin Mutual Quest Fund
| Six Months Ended June 30, 2019 (unaudited) | Year Ended December 31, 2018 | |||||||
Increase (decrease) in net assets: | ||||||||
Operations: | ||||||||
Net investment income | $ 72,046,163 | $ 143,898,637 | ||||||
Net realized gain (loss) | (151,568,617 | ) | 354,503,773 | |||||
Net change in unrealized appreciation (depreciation) | 412,399,748 | (826,097,878 | ) | |||||
|
| |||||||
Net increase (decrease) in net assets resulting from operations | 332,877,294 | (327,695,468 | ) | |||||
|
| |||||||
Distributions to shareholders: | ||||||||
Class Z | — | (375,929,219 | ) | |||||
Class A | — | (130,844,029 | ) | |||||
Class C | — | (15,959,447 | ) | |||||
Class R | — | (352,629 | ) | |||||
Class R6 | — | (14,194,157 | ) | |||||
|
| |||||||
Total distributions to shareholders | — | (537,279,481 | ) | |||||
|
| |||||||
Capital share transactions: (Note 2) | ||||||||
Class Z | (155,098,878 | ) | (10,462,191 | ) | ||||
Class A | (57,354,432 | ) | 126,783,503 | |||||
Class C | (19,457,741 | ) | (141,318,519 | ) | ||||
Class R | 589,612 | 1,767,885 | ||||||
Class R6 | (5,622,672 | ) | 14,919,716 | |||||
|
| |||||||
Total capital share transactions | (236,944,111 | ) | (8,309,606 | ) | ||||
|
| |||||||
Net increase (decrease) in net assets | 95,933,183 | (873,284,555 | ) | |||||
Net assets: | ||||||||
Beginning of period | 4,382,733,646 | 5,256,018,201 | ||||||
|
| |||||||
End of period | $4,478,666,829 | $4,382,733,646 | ||||||
|
| |||||||
| franklintempleton.com | The accompanying notes are an integral part of these financial statements. | Semiannual Report | 29 | ||
FRANKLIN MUTUAL SERIES FUNDS
Notes to Financial Statements (unaudited)
Franklin Mutual Quest Fund
1. Organization and Significant Accounting Policies
Franklin Mutual Series Funds (Trust) is registered under the Investment Company Act of 1940 (1940 Act) as anopen-end management investment company, consisting of seven separate funds and applies the specialized accounting and reporting guidance in U.S. Generally Accepted Accounting Principles (U.S. GAAP). Franklin Mutual Quest Fund (Fund) is included in this report. The Fund offers five classes of shares: Class Z, Class A, Class C, Class R and Class R6. Class C shares automatically convert to Class A shares after they have been held for 10 years. Each class of shares may differ by its initial sales load, contingent deferred sales charges, voting rights on matters affecting a single class, its exchange privilege and fees due to differing arrangements for distribution and transfer agent fees.
The following summarizes the Fund’s significant accounting policies.
a. Financial Instrument Valuation
The Fund’s investments in financial instruments are carried at fair value daily. Fair value is the price that would be received to sell an asset or paid to transfer a liability in an orderly transaction between market participants on the measurement date. The Fund calculates the net asset value (NAV) per share each business day as of 4 p.m. Eastern time or the regularly scheduled close of the New York Stock Exchange (NYSE), whichever is earlier. Under compliance policies and procedures approved by the Trust’s Board of Trustees (the Board), the Fund’s administrator has responsibility for oversight of valuation, including leading the cross-functional Valuation Committee (VC). The Fund may utilize independent pricing services, quotations from securities and financial instrument dealers, and other market sources to determine fair value.
Equity securities and derivative financial instruments listed on an exchange or on the NASDAQ National Market System are valued at the last quoted sale price or the official closing price of the day, respectively. Foreign equity securities are valued as of the close of trading on the foreign stock exchange on which the security is primarily traded, or as of 4 p.m. Eastern time. The value is then converted into its U.S. dollar equivalent at the foreign exchange rate in effect at 4 p.m. Eastern time on the day that the value of the security is determined.Over-the-counter (OTC) securities are valued within the range of the most recent quoted bid and ask prices. Securities that trade in multiple markets or on multiple
exchanges are valued according to the broadest and most representative market. Certain equity securities are valued based upon fundamental characteristics or relationships to similar securities.
Debt securities generally trade in the OTC market rather than on a securities exchange. The Fund’s pricing services use multiple valuation techniques to determine fair value. In instances where sufficient market activity exists, the pricing services may utilize a market-based approach through which quotes from market makers are used to determine fair value. In instances where sufficient market activity may not exist or is limited, the pricing services also utilize proprietary valuation models which may consider market characteristics such as benchmark yield curves, credit spreads, estimated default rates, anticipated market interest rate volatility, coupon rates, anticipated timing of principal repayments, underlying collateral, and other unique security features in order to estimate the relevant cash flows, which are then discounted to calculate the fair value.
Certain derivative financial instruments trade in the OTC market. The Fund’s pricing services use various techniques including industry standard option pricing models and proprietary discounted cash flow models to determine the fair value of those instruments. The Fund’s net benefit or obligation under the derivative contract, as measured by the fair value of the contract, is included in net assets.
The Fund has procedures to determine the fair value of financial instruments for which market prices are not reliable or readily available. Under these procedures, the Fund primarily employs a market-based approach which may use related or comparable assets or liabilities, recent transactions, market multiples, book values, and other relevant information for the investment to determine the fair value of the investment. An income-based valuation approach may also be used in which the anticipated future cash flows of the investment are discounted to calculate fair value. Discounts may also be applied due to the nature or duration of any restrictions on the disposition of the investments. Due to the inherent uncertainty of valuations of such investments, the fair values may differ significantly from the values that would have been used had an active market existed.
Trading in securities on foreign securities stock exchanges and OTC markets may be completed before 4 p.m. Eastern time. In addition, trading in certain foreign markets may not take place on every Fund’s business day. Occasionally,
| 30 | Semiannual Report | franklintempleton.com | ||
FRANKLIN MUTUAL SERIES FUNDS
NOTES TO FINANCIAL STATEMENTS (UNAUDITED)
Franklin Mutual Quest Fund(continued)
events occur between the time at which trading in a foreign security is completed and 4 p.m. Eastern time that might call into question the reliability of the value of a portfolio security held by the Fund. As a result, differences may arise between the value of the Fund’s portfolio securities as determined at the foreign market close and the latest indications of value at 4 p.m. Eastern time. In order to minimize the potential for these differences, the VC monitors price movements following the close of trading in foreign stock markets through a series of country specific market proxies (such as baskets of American Depositary Receipts, futures contracts and exchange traded funds). These price movements are measured against established trigger thresholds for each specific market proxy to assist in determining if an event has occurred that may call into question the reliability of the values of the foreign securities held by the Fund. If such an event occurs, the securities may be valued using fair value procedures, which may include the use of independent pricing services.
When the last day of the reporting period is anon-business day, certain foreign markets may be open on those days that the Fund’s NAV is not calculated, which could result in differences between the value of the Fund’s portfolio securities on the last business day and the last calendar day of the reporting period. Any significant security valuation changes due to an open foreign market are adjusted and reflected by the Fund for financial reporting purposes.
b. Foreign Currency Translation
Portfolio securities and other assets and liabilities denominated in foreign currencies are translated into U.S. dollars based on the exchange rate of such currencies against U.S. dollars on the date of valuation. The Fund may enter into foreign currency exchange contracts to facilitate transactions denominated in a foreign currency. Purchases and sales of securities, income and expense items denominated in foreign currencies are translated into U.S. dollars at the exchange rate in effect on the transaction date. Portfolio securities and assets and liabilities denominated in foreign currencies contain risks that those currencies will decline in value relative to the U.S. dollar. Occasionally, events may impact the availability or reliability of foreign exchange rates used to convert the U.S. dollar equivalent value. If such an event occurs, the foreign exchange rate will be valued at fair value using procedures established and approved by the Board.
The Fund does not separately report the effect of changes in foreign exchange rates from changes in market prices on securities held. Such changes are included in net realized and unrealized gain or loss from investments in the Statement of Operations.
Realized foreign exchange gains or losses arise from sales of foreign currencies, currency gains or losses realized between the trade and settlement dates on securities transactions and the difference between the recorded amounts of dividends, interest, and foreign withholding taxes and the U.S. dollar equivalent of the amounts actually received or paid. Net unrealized foreign exchange gains and losses arise from changes in foreign exchange rates on foreign denominated assets and liabilities other than investments in securities held at the end of the reporting period.
c. Securities Purchased on a Delayed Delivery Basis
The Fund purchases securities on a delayed delivery basis, with payment and delivery scheduled for a future date. These transactions are subject to market fluctuations and are subject to the risk that the value at delivery may be more or less than the trade date purchase price. Although the Fund will generally purchase these securities with the intention of holding the securities, it may sell the securities before the settlement date. Sufficient assets have been segregated for these securities.
d. Derivative Financial Instruments
The Fund invested in derivative financial instruments in order to manage risk or gain exposure to various other investments or markets. Derivatives are financial contracts based on an underlying or notional amount, require no initial investment or an initial net investment that is smaller than would normally be required to have a similar response to changes in market factors, and require or permit net settlement. Derivatives contain various risks including the potential inability of the counterparty to fulfill their obligations under the terms of the contract, the potential for an illiquid secondary market, and/or the potential for market movements which expose the Fund to gains or losses in excess of the amounts shown in the Statement of Assets and Liabilities. Realized gain and loss and unrealized appreciation and depreciation on these contracts for the period are included in the Statement of Operations.
| franklintempleton.com | Semiannual Report | 31 | ||
FRANKLIN MUTUAL SERIES FUNDS
NOTES TO FINANCIAL STATEMENTS (UNAUDITED)
Franklin Mutual Quest Fund(continued)
1. Organization and Significant Accounting Policies (continued)
d. Derivative Financial Instruments(continued)
Derivative counterparty credit risk is managed through a formal evaluation of the creditworthiness of all potential counterparties. The Fund attempts to reduce its exposure to counterparty credit risk on OTC derivatives, whenever possible, by entering into International Swaps and Derivatives Association (ISDA) master agreements with certain counterparties. These agreements contain various provisions, including but not limited to collateral requirements, events of default, or early termination. Termination events applicable to the counterparty include certain deteriorations in the credit quality of the counterparty. Termination events applicable to the Fund include failure of the Fund to maintain certain net asset levels and/or limit the decline in net assets over various periods of time. In the event of default or early termination, the ISDA master agreement gives thenon-defaulting party the right to net andclose-out all transactions traded, whether or not arising under the ISDA agreement, to one net amount payable by one counterparty to the other. However, absent an event of default or early termination, OTC derivative assets and liabilities are presented gross and not offset in the Statement of Assets and Liabilities. Early termination by the counterparty may result in an immediate payment by the Fund of any net liability owed to that counterparty under the ISDA agreement. At June 30, 2019, the Fund had OTC derivatives in a net liability position of $88,758.
Collateral requirements differ by type of derivative. Collateral or initial margin requirements are set by the broker or exchange clearing house for exchange traded and centrally cleared derivatives. Initial margin deposited is held at the exchange and can be in the form of cash and/or securities. For OTC derivatives traded under an ISDA master agreement, posting of collateral is required by either the Fund or the applicable counterparty if the total net exposure of all OTC derivatives with the applicable counterparty exceeds the minimum transfer amount, which typically ranges from $100,000 to $250,000, and can vary depending on the counterparty and the type of the agreement. Generally, collateral is determined at the close of Fund business each day and any additional collateral required due to changes in derivative values may be delivered by the Fund or the counterparty the next business day, or within a few business days. Collateral pledged and/or received by the Fund for OTC derivatives, if any, is held in segregated accounts with the Fund’s custodian/counterparty broker and can be in the form
of cash and/or securities. Unrestricted cash may be invested according to the Fund’s investment objectives. To the extent that the amounts due to the Fund from its counterparties are not subject to collateralization or are not fully collateralized, the Fund bears the risk of loss from counterpartynon-performance.
At June 30, 2019, the Fund received $7,708,748 in U.K. Treasury Bonds and U.S. Treasury Bills, Bonds and Notes as collateral for derivatives.
The Fund entered into exchange traded futures contracts primarily to manage exposure to certain foreign currencies. A futures contract is an agreement between the Fund and a counterparty to buy or sell an asset at a specified price on a future date. Required initial margins are pledged by the Fund, and the daily change in fair value is accounted for as a variation margin payable or receivable in the Statement of Assets and Liabilities.
The Fund entered into OTC forward exchange contracts primarily to manage exposure to certain foreign currencies. A forward exchange contract is an agreement between the Fund and a counterparty to buy or sell a foreign currency at a specific exchange rate on a future date.
The Fund purchased or wrote exchange traded option contracts primarily to manage exposure to equity price risk. An option is a contract entitling the holder to purchase or sell a specific amount of shares or units of an asset or notional amount of a swap (swaption), at a specified price. When an option is purchased or written, an amount equal to the premium paid or received is recorded as an asset or liability, respectively. Upon exercise of an option, the acquisition cost or sales proceeds of the underlying investment is adjusted by any premium received or paid. Upon expiration of an option, any premium received or paid is recorded as a realized gain or loss. Upon closing an option other than through expiration or exercise, the difference between the premium received or paid and the cost to close the position is recorded as a realized gain or loss.
See Note 12 regarding other derivative information.
e. Securities Sold Short
The Fund is engaged in selling securities short, which obligates the Fund to replace a borrowed security with the same security at current fair value. The Fund incurs a loss if the price of the security increases between the date of the
| 32 | Semiannual Report | franklintempleton.com | ||
FRANKLIN MUTUAL SERIES FUNDS
NOTES TO FINANCIAL STATEMENTS (UNAUDITED)
Franklin Mutual Quest Fund(continued)
short sale and the date on which the Fund replaces the borrowed security. The Fund realizes a gain if the price of the security declines between those dates. Gains are limited to the price at which the Fund sold the security short, while losses are potentially unlimited in size.
The Fund is required to establish a margin account with the broker lending the security sold short. While the short sale is outstanding, the broker retains the proceeds of the short sale to the extent necessary to meet margin requirements until the short position is closed out. A deposit must also be maintained with the Fund’s custodian/counterparty broker consisting of cash and/or securities having a value equal to a specified percentage of the value of the securities sold short. The Fund is obligated to pay fees for borrowing the securities sold short and is required to pay the counterparty any dividends and/or interest due on securities sold short. Such dividends and/or interest and any security borrowing fees are recorded as an expense to the Fund.
f. Senior Floating Rate Interests
The Fund invests in senior secured corporate loans that pay interest at rates which are periodically reset by reference to a base lending rate plus a spread. These base lending rates are generally the prime rate offered by a designated U.S. bank or the London InterBank Offered Rate (LIBOR). Senior secured corporate loans often require prepayment of principal from excess cash flows or at the discretion of the borrower. As a result, actual maturity may be substantially less than the stated maturity. Senior secured corporate loans in which the Fund invests are generally readily marketable, but may be subject to certain restrictions on resale.
g. Income and Deferred Taxes
It is the Fund’s policy to qualify as a regulated investment company under the Internal Revenue Code. The Fund intends to distribute to shareholders substantially all of its taxable income and net realized gains to relieve it from federal income and excise taxes. As a result, no provision for U.S. federal income taxes is required.
The Fund may be subject to foreign taxation related to income received, capital gains on the sale of securities and certain foreign currency transactions in the foreign jurisdictions in which it invests. Foreign taxes, if any, are recorded based on the tax regulations and rates that exist in the foreign markets in which the Fund invests. When a capital
gain tax is determined to apply, the Fund records an estimated deferred tax liability in an amount that would be payable if the securities were disposed of on the valuation date.
As a result of several court cases, in certain countries across the European Union, the Fund filed additional tax reclaims for previously withheld taxes on dividends earned in those countries (EU reclaims). These additional filings are subject to various administrative proceedings by the local jurisdictions’ tax authorities within the European Union, as well as a number of related judicial proceedings. Income recognized, if any, for EU reclaims is reflected as other income in the Statement of Operations and any related receivable, if any, is reflected as European Union tax reclaims in the Statement of Assets and Liabilities. When uncertainty exists as to the ultimate resolution of these proceedings, the likelihood of receipt of these EU reclaims, and the potential timing of payment, no amounts are reflected in the financial statements. For U.S. income tax purposes, EU reclaims received by the Fund, if any, reduce the amounts of foreign taxes Fund shareholders can use as tax credits in their individual income tax returns.
The Fund may recognize an income tax liability related to its uncertain tax positions under U.S. GAAP when the uncertain tax position has a less than 50% probability that it will be sustained upon examination by the tax authorities based on its technical merits. As of June 30, 2019, the Fund has determined that no tax liability is required in its financial statements related to uncertain tax positions for any open tax years (or expected to be taken in future tax years). Open tax years are those that remain subject to examination and are based on the statute of limitations in each jurisdiction in which the Fund invests.
h. Security Transactions, Investment Income, Expenses and Distributions
Security transactions are accounted for on trade date. Realized gains and losses on security transactions are determined on a specific identification basis. Interest income and estimated expenses are accrued daily. Amortization of premium and accretion of discount on debt securities are included in interest income. Dividend income and dividends declared on securities sold short are recorded on theex-dividend date except for certain dividends from securities where the dividend rate is not available. In such cases, the dividend is recorded as soon as the information is received by
| franklintempleton.com | Semiannual Report | 33 | ||
FRANKLIN MUTUAL SERIES FUNDS
NOTES TO FINANCIAL STATEMENTS (UNAUDITED)
Franklin Mutual Quest Fund(continued)
1. Organization and Significant Accounting Policies (continued)
h. Security Transactions, Investment Income, Expenses and Distributions(continued)
the Fund. Distributions to shareholders are recorded on theex-dividend date. Distributable earnings are determined according to income tax regulations (tax basis) and may differ from earnings recorded in accordance with U.S. GAAP. These differences may be permanent or temporary. Permanent differences are reclassified among capital accounts to reflect their tax character. These reclassifications have no impact on net assets or the results of operations. Temporary differences are not reclassified, as they may reverse in subsequent periods.
Common expenses incurred by the Trust are allocated among the Funds based on the ratio of net assets of each Fund to the combined net assets of the Trust or based on the ratio of number of shareholders of each Fund to the combined number of shareholders of the Trust. Fund specific expenses are charged directly to the Fund that incurred the expense.
Realized and unrealized gains and losses and net investment income, excluding class specific expenses, are allocated daily to each class of shares based upon the relative proportion of
net assets of each class. Differences in per share distributions by class are generally due to differences in class specific expenses.
i. Accounting Estimates
The preparation of financial statements in accordance with U.S. GAAP requires management to make estimates and assumptions that affect the reported amounts of assets and liabilities at the date of the financial statements and the amounts of income and expenses during the reporting period. Actual results could differ from those estimates.
j. Guarantees and Indemnifications
Under the Trust’s organizational documents its officers and trustees are indemnified by the Trust against certain liabilities arising out of the performance of their duties to the Trust. Additionally, in the normal course of business, the Trust, on behalf of the Fund, enters into contracts with service providers that contain general indemnification clauses. The Trust’s maximum exposure under these arrangements is unknown as this would involve future claims that may be made against the Trust that have not yet occurred. Currently, the Trust expects the risk of loss to be remote.
2. Shares of Beneficial Interest
At June 30, 2019, there were an unlimited number of shares authorized (without par value). Transactions in the Fund’s shares were as follows:
Six Months Ended June 30, 2019 | Year Ended December 31, 2018 | |||||||||||||||||||
| Shares | Amount | Shares | Amount | |||||||||||||||||
| Class Z Shares: | ||||||||||||||||||||
Shares sold | 8,329,397 | $ | 115,981,307 | 19,486,438 | $ | 309,433,086 | ||||||||||||||
Shares issued in reinvestment of distributions | — | — | 27,534,405 | 355,938,444 | ||||||||||||||||
Shares redeemed | (19,453,127 | ) | (271,080,185 | ) | (42,815,519 | ) | (675,833,721 | ) | ||||||||||||
Net increase (decrease) | (11,123,730 | ) | $ | (155,098,878 | ) | 4,205,324 | $ | (10,462,191 | ) | |||||||||||
| Class A Shares: | ||||||||||||||||||||
Shares solda | 4,895,873 | $ | 66,973,454 | 18,112,061 | $ | 282,062,168 | ||||||||||||||
Shares issued in reinvestment of distributions | — | — | 10,086,321 | 128,317,894 | ||||||||||||||||
Shares redeemed | (9,054,813 | ) | (124,327,886 | ) | (18,481,020 | ) | (283,596,559 | ) | ||||||||||||
Net increase (decrease) | (4,158,940 | ) | $ | (57,354,432 | ) | 9,717,362 | $ | 126,783,503 | ||||||||||||
| 34 | Semiannual Report | franklintempleton.com | ||
FRANKLIN MUTUAL SERIES FUNDS
NOTES TO FINANCIAL STATEMENTS (UNAUDITED)
Franklin Mutual Quest Fund(continued)
Six Months Ended June 30, 2019 | Year Ended December 31, 2018 | |||||||||||||||
| Shares | Amount | Shares | Amount | |||||||||||||
| Class C Shares: | ||||||||||||||||
Shares sold | 731,432 | $ 9,910,948 | 2,391,188 | $ 36,406,068 | ||||||||||||
Shares issued in reinvestment of distributions | — | — | 1,234,078 | 15,734,249 | ||||||||||||
Shares redeemeda | (2,166,056 | ) | (29,368,689 | ) | (12,562,392 | ) | (193,458,836 | ) | ||||||||
Net increase (decrease) | (1,434,624 | ) | $ (19,457,741 | ) | (8,937,126 | ) | $(141,318,519 | ) | ||||||||
| Class R Shares: | ||||||||||||||||
Shares sold | 63,387 | $ 847,610 | 121,081 | $ 1,898,376 | ||||||||||||
Shares issued in reinvestment of distributions | — | — | 28,180 | 352,629 | ||||||||||||
Shares redeemed | (19,224 | ) | (257,998 | ) | (30,958 | ) | (483,120 | ) | ||||||||
Net increase (decrease) | 44,163 | $ 589,612 | 118,303 | $ 1,767,885 | ||||||||||||
| Class R6 Shares: | ||||||||||||||||
Shares sold | 1,198,413 | $ 16,661,200 | 2,288,195 | $ 36,596,048 | ||||||||||||
Shares issued in reinvestment of distributions | — | — | 1,096,020 | 14,150,067 | ||||||||||||
Shares redeemed | (1,595,595 | ) | (22,283,872 | ) | (2,247,945 | ) | (35,826,399 | ) | ||||||||
Net increase (decrease) | (397,182 | ) | $ (5,622,672 | ) | 1,136,270 | $ 14,919,716 | ||||||||||
aMay include a portion of Class C shares that were automatically converted to Class A.
3. Transactions with Affiliates
Franklin Resources, Inc. is the holding company for various subsidiaries that together are referred to as Franklin Templeton. Certain officers and trustees of the Fund are also officers and/or directors of the following subsidiaries:
| Subsidiary | Affiliation | |
Franklin Mutual Advisers, LLC (Franklin Mutual) | Investment manager | |
Franklin Templeton Services, LLC (FT Services) | Administrative manager | |
Franklin Templeton Distributors, Inc. (Distributors) | Principal underwriter | |
Franklin Templeton Investor Services, LLC (Investor Services) | Transfer agent | |
a. Management Fees
The Fund pays an investment management fee to Franklin Mutual based on the average daily net assets of the Fund as follows:
| Annualized Fee Rate | Net Assets | |
0.675% | Up to and including $5 billion | |
0.645% | Over $5 billion, up to and including $7 billion | |
0.625% | Over $7 billion, up to and including $10 billion | |
0.615% | In excess of $10 billion | |
b. Administrative Fees
Under an agreement with Franklin Mutual, FT Services provides administrative services to the Fund. The fee is paid by Franklin Mutual based on the Fund’s average daily net assets, and is not an additional expense of the Fund.
| franklintempleton.com | Semiannual Report | 35 | ||
FRANKLIN MUTUAL SERIES FUNDS
NOTES TO FINANCIAL STATEMENTS (UNAUDITED)
Franklin Mutual Quest Fund(continued)
3. Transactions with Affiliates(continued)
c. Distribution Fees
The Board has adopted distribution plans for each share class, with the exception of Class Z and Class R6 shares, pursuant to Rule12b-1 under the 1940 Act. Under the Fund’s Class A reimbursement distribution plan, the Fund reimburses Distributors for costs incurred in connection with the servicing, sale and distribution of the Fund’s shares up to the maximum annual plan rate. Under the Class A reimbursement distribution plan, costs exceeding the maximum for the current plan year cannot be reimbursed in subsequent periods. In addition, under the Fund’s Class C and R compensation distribution plans, the Fund pays Distributors for costs incurred in connection with the servicing, sale and distribution of the Fund’s shares up to the maximum annual plan rate for each class. The plan year, for purposes of monitoring compliance with the maximum annual plan rates, is February 1 through January 31.
The maximum annual plan rates, based on the average daily net assets, for each class, are as follows:
Class A | 0.35% | |||
Class C | 1.00% | |||
Class R | 0.50% |
The Board has set the current rate at 0.25% per year for Class A shares until further notice and approval by the Board.
d. Sales Charges/Underwriting Agreements
Front-end sales charges and contingent deferred sales charges (CDSC) do not represent expenses of the Fund. These charges are deducted from the proceeds of sales of Fund shares prior to investment or from redemption proceeds prior to remittance, as applicable. Distributors has advised the Fund of the following commission transactions related to the sales and redemptions of the Fund’s shares for the period:
Sales charges retained net of commissions paid to unaffiliated brokers/dealers | $ | 64,420 | ||
CDSC retained | $ | 6,350 |
e. Transfer Agent Fees
Each class of shares pays transfer agent fees to Investor Services for its performance of shareholder servicing obligations. The fees are based on an annualized asset based fee of 0.02% plus a transaction based fee. In addition, each class reimburses Investor Services for out of pocket expenses incurred and, except for Class R6, reimburses shareholder servicing fees paid to third parties. These fees are allocated daily based upon their relative proportion of such classes’ aggregate net assets. Class R6 pays Investor Services transfer agent fees specific to that class.
For the period ended June 30, 2019, the Fund paid transfer agent fees of $1,860,987, of which $1,104,226 was retained by Investor Services.
f. Waiver and Expense Reimbursements
Investor Services has contractually agreed in advance to waive or limit its fees so that the Class R6 transfer agent fees do not exceed 0.02% based on the average net assets of the class until April 30, 2020.
| 36 | Semiannual Report | franklintempleton.com | ||
FRANKLIN MUTUAL SERIES FUNDS
NOTES TO FINANCIAL STATEMENTS (UNAUDITED)
Franklin Mutual Quest Fund(continued)
g. Interfund Transactions
The Fund engaged in purchases and sales of investments with funds or other accounts that have common investment managers (or affiliated investment managers), directors, trustees or officers. During the period ended June 30, 2019, these purchase and sale transactions aggregated $52,272,536 and $0, respectively.
4. Expense Offset Arrangement
The Fund has entered into an arrangement with its custodian whereby credits realized as a result of uninvested cash balances are used to reduce a portion of the Fund’s custodian expenses. During the period ended June 30, 2019, the custodian fees were reduced as noted in the Statement of Operations.
5. Independent Trustees’ Retirement Plan
On January 1, 1993, the Trust adopted an Independent Trustees’ Retirement Plan (Plan). The Plan is an unfunded defined benefit plan that provides benefit payments to Trustees whose length of service and retirement age meets the eligibility requirements of the Plan. Benefits under the Plan are based on years of service and fees paid to each trustee at the time of retirement. Effective in December 1996, the Plan was closed to new participants.
During the period ended June 30, 2019, the Fund’s projected benefit obligation and benefit payments under the Plan were as follows:
aProjected benefit obligation at June 30, 2019 | $ | 363,794 | ||
bIncrease in projected benefit obligation | $ | 40,844 | ||
Benefit payments made to retired trustees | $ | (2,889 | ) |
aThe projected benefit obligation is included in trustees’ fees and expenses in the Statement of Assets and Liabilities.
bThe increase in projected benefit obligation is included in trustees’ fees and expenses in the Statement of Operations.
6. Income Taxes
For tax purposes, capital losses may be carried over to offset future capital gains. At December 31, 2018, the Fund had long-term capital loss carryforwards of $5,625,011, not subject to expiration, which is from the acquired Franklin Mutual Recovery Fund, which may be carried over to offset future capital gains, subject to certain limitations.
For tax purposes, the Fund may elect to defer any portion of a post-October capital loss or late-year ordinary loss to the first day of the following fiscal year. At December 31, 2018, the Fund deferred post-October capital losses of $15,196,442.
At June 30, 2019, the cost of investments and net unrealized appreciation (depreciation) for income tax purposes were as follows:
Cost of investments | $ | 4,628,145,888 | ||
|
| |||
Unrealized appreciation | $ | 396,715,616 | ||
Unrealized depreciation | (624,715,861 | ) | ||
|
| |||
Net unrealized appreciation (depreciation) | $ | (228,000,245 | ) | |
|
| |||
Differences between income and/or capital gains as determined on a book basis and a tax basis are primarily due to differing treatments of foreign currency transactions and wash sales.
| franklintempleton.com | Semiannual Report | 37 | ||
FRANKLIN MUTUAL SERIES FUNDS
NOTES TO FINANCIAL STATEMENTS (UNAUDITED)
Franklin Mutual Quest Fund(continued)
7. Investment Transactions
Purchases and sales of investments (excluding short term securities and securities sold short) for the period ended June 30, 2019, aggregated $1,194,819,164 and $1,640,478,853, respectively.
8. Credit Risk and Defaulted Securities
The Fund may purchase thepre-default or defaulted debt of distressed companies. Distressed companies are financially troubled and could be or are already involved in financial restructuring or bankruptcy. Risks associated with purchasing these securities include the possibility that the bankruptcy or other restructuring process takes longer than expected, or that distributions in restructuring are less than anticipated, either or both of which may result in unfavorable consequences to the Fund. If it becomes probable that the income on debt securities, including those of distressed companies, will not be collected, the Fund discontinues accruing income and recognizes an adjustment for uncollectible interest.
At June 30, 2019, the aggregate long value of distressed company securities for which interest recognition has been discontinued was $9,128,780, representing 0.2% of the Fund’s net assets. For information as to specific securities, see the accompanying Statement of Investments.
9. Concentration of Risk
Investing in foreign securities may include certain risks and considerations not typically associated with investing in U.S. securities, such as fluctuating currency values and changing local and regional economic, political and social conditions, which may result in greater market volatility. Current political and financial uncertainty surrounding the European Union may increase market volatility and the economic risk of investing in securities in Europe. In addition, certain foreign securities may not be as liquid as U.S. securities.
10. Restricted Securities
The Fund invests in securities that are restricted under the Securities Act of 1933 (1933 Act). Restricted securities are often purchased in private placement transactions, and cannot be sold without prior registration unless the sale is pursuant to an exemption under the 1933 Act. Disposal of these securities may require greater effort and expense, and prompt sale at an acceptable price may be difficult. The Fund may have registration rights for restricted securities. The issuer generally incurs all registration costs.
At June 30, 2019, investments in restricted securities, excluding securities exempt from registration under the 1933 Act deemed to be liquid, were as follows:
| Principal Amount/ Shares/ Warrants | Issuer | Acquisition Date | Cost | Value | ||||||||||
9,272 | Broadband Ventures III LLC, secured promissory note, 5.00%, 2/01/12 | 7/01/10 - 11/30/12 | $ | 9,272 | $ | — | ||||||||
1,408,213 | iHeartMedia Inc., A | 1/03/11 - 11/15/17 | 30,891,474 | 20,440,614 | ||||||||||
23,770 | iHeartMedia Inc., B | 1/03/11 - 11/15/17 | 519,611 | 345,028 | ||||||||||
1,872 | iHeartMedia Inc., wts., A, 5/01/39 | 1/03/11 - 11/15/17 | 40,969 | 27,171 | ||||||||||
2,548,299 | International Automotive Components Group Brazil LLC | 4/13/06 - 12/26/08 | 1,692,334 | 65,435 | ||||||||||
1,110,000 | aLee Enterprises Inc., wts., 12/31/22 | 3/31/14 | 1,490,026 | 523,132 | ||||||||||
224,279 | bSorenson Communications LLC, Membership Interests | 4/30/14 | — | 179,507,964 | ||||||||||
| 38 | Semiannual Report | franklintempleton.com | ||
FRANKLIN MUTUAL SERIES FUNDS
NOTES TO FINANCIAL STATEMENTS (UNAUDITED)
Franklin Mutual Quest Fund(continued)
| Principal Amount/ Shares/ Warrants | Issuer | Acquisition Date | Cost | Value | ||||||||||
| ||||||||||||||
17,873,000 | Sunshine Oilsands Ltd., secured note, 144A, 10.00%, 8/01/17 | 8/04/14 | $ | 17,706,373 | $ | 2,608,484 | ||||||||
|
| |||||||||||||
| Total Restricted Securities(Value is 4.5% of Net Assets) | $ | 52,350,059 | $ | 203,517,828 | ||||||||||
|
| |||||||||||||
aThe Fund also invests in unrestricted securities or other investments in the issuer, valued at $143,824,795 as of June 30, 2019.
bThe Fund also invests in unrestricted securities or other investments in the issuer, valued at $13,550,625 as of June 30, 2019.
11. Unfunded Loan Commitments
The Fund enters into certain credit agreements, all or a portion of which may be unfunded. The Fund is obligated to fund these loan commitments at the borrowers’ discretion. Unfunded loan commitments and funded portions of credit agreements are marked to market daily and any unrealized appreciation or depreciation is included in the Statement of Assets and Liabilities and the Statement of Operations. Funded portions of credit agreements are presented in the Statement of Investments.
At June 30, 2019, unfunded commitments were as follows:
| Borrower | Unfunded Commitment | |||
Windstream Services LLC, Revolving Commitment | $70,870 | |||
|
| |||
12. Other Derivative Information
At June 30, 2019, investments in derivative contracts are reflected in the Statement of Assets and Liabilities as follows:
| Asset Derivatives | Liability Derivatives | |||||||||||||||
|
| |||||||||||||||
Derivative Contracts Not Accounted for as | Statement of Assets and Liabilities Location | Fair Value | Statement of Assets and Liabilities | Fair Value | ||||||||||||
| ||||||||||||||||
Foreign exchange contracts | Variation margin on futures contracts | | $ 136,065 | a | Variation margin on futures contracts | $ 205,017 | a | |||||||||
Unrealized appreciation on OTC forward exchange contracts | 7,490,496 |
Unrealized depreciation on OTC forward exchange contracts | 431,282 | |||||||||||||
Equity contracts |
Investments in securities, at value | — |
Options written, at value | 748,500 | ||||||||||||
|
|
|
| |||||||||||||
Totals | $7,626,561 | $1,384,799 | ||||||||||||||
|
|
|
| |||||||||||||
aThis amount reflects the cumulative appreciation (depreciation) of futures contracts as reported in the Statement of Investments. Only the variation margin receivable/ payable at period end is separately reported within the Statement of Assets and Liabilities. Prior variation margin movements were recorded to cash upon receipt or payment.
| franklintempleton.com | Semiannual Report | 39 | ||
FRANKLIN MUTUAL SERIES FUNDS
NOTES TO FINANCIAL STATEMENTS (UNAUDITED)
Franklin Mutual Quest Fund(continued)
12. Other Derivative Information(continued)
For the period ended June 30, 2019, the effect of derivative contracts in the Statement of Operations was as follows:
Derivative Contracts Not Accounted for as Hedging Instruments | Statement of Operations Location | Net Realized Gain (Loss) for the Period | Statement of Operations Location | Net Change in Unrealized Appreciation (Depreciation) for the Period | ||||||||
Net realized gain (loss) from: | Net change in unrealized appreciation (depreciation) on: | |||||||||||
Foreign exchange contracts | Forward exchange contracts | $10,170,034 | Forward exchange contracts | $(3,214,173 | ) | |||||||
Futures contracts | 3,455,409 | Futures contracts | (220,361 | ) | ||||||||
Equity contracts | Investments | (1,129,832 | )a | Investments | 913,523 | a | ||||||
Written options | 2,057,126 | Written options | 6,108,322 | |||||||||
|
|
|
| |||||||||
Totals | $14,552,737 | $ 3,587,311 | ||||||||||
|
|
|
| |||||||||
aPurchased option contracts are included in net realized gain (loss) from investments and net change in unrealized appreciation (depreciation) on investments in the Statement of Operations.
For the period ended June 30, 2019, the average month end notional amount of futures contracts and options represented $158,318,829 and 1,052,500 shares, respectively. The average month end contract value of forward exchange contracts was $538,126,437.
See Note 1(d) regarding derivative financial instruments.
13. Holdings of 5% Voting Securities of Portfolio Companies
The 1940 Act defines “affiliated companies” to include investments in portfolio companies in which a fund owns 5% or more of the outstanding voting securities. During the period ended June 30, 2019, investments in “affiliated companies” were as follows:
| Name of Issuer | Value at of Period | Purchases | Sales | Realized Gain (Loss) | Net Change in Unrealized Appreciation (Depreciation) | Value at End of | Number of of Period | Investment Income | ||||||||||||||||||||||||
| Non-Controlled Affiliates |
| |||||||||||||||||||||||||||||||
| Dividends | ||||||||||||||||||||||||||||||||
Advanced Emissions Solutions Inc. | $ | 18,190,405 | $ | — | $ | — | $ — | $ 3,603,597 | $ | 21,794,002 | 1,724,209 | $ | 862,104 | |||||||||||||||||||
Lee Enterprises Inc./IA | 10,179,206 | — | (5,444,799 | ) | 438,041 | 2,098,520 | 7,270,968 | 3,245,968 | — | |||||||||||||||||||||||
Lee Enterprises Inc., wts., 12/31/22 | 217,582 | — | — | — | 305,550 | 523,132 | 1,110,000 | — | ||||||||||||||||||||||||
New Media Investment Group Inc. | 37,084,199 | — | (5,996,577 | ) | 119,111 | — | a | — | a | — | a | 1,052,196 | ||||||||||||||||||||
Sorenson Communications LLC, Membership | ||||||||||||||||||||||||||||||||
Interests | 155,100,344 | — | — | — | 24,407,620 | 179,507,964 | 224,279 | — | ||||||||||||||||||||||||
TRU Kids Parent LLC | — | 34,810,099 | b | — | — | (8,879,727 | ) | 25,930,372 | 7,104 | — | ||||||||||||||||||||||
Wayne Services Legacy Inc. | — | 2,484,752 | b | — | — | — | 2,484,752 | 7,104 | — | |||||||||||||||||||||||
|
|
|
| |||||||||||||||||||||||||||||
| $ | 220,771,736 | $ | 37,294,851 | $ | (11,441,376 | ) | $557,152 | $21,535,560 | $ | 237,511,190 | $1,914,300 | |||||||||||||||||||||
|
|
|
| |||||||||||||||||||||||||||||
40 |
Semiannual Report |
franklintempleton.com | ||
FRANKLIN MUTUAL SERIES FUNDS
NOTES TO FINANCIAL STATEMENTS (UNAUDITED)
Franklin Mutual Quest Fund(continued)
| Name of Issuer | Value at Beginning of Period | Purchases | Sales | Realized Gain (Loss) | Net Change in Unrealized Appreciation (Depreciation) | Value at End of Period | Number of Shares/Units/ Warrants/ Principal Amount Held at End of Period | Investment Income | ||||||||||||||||||||||||
| Non-Controlled Affiliates(continued) |
| |||||||||||||||||||||||||||||||
| Interest | ||||||||||||||||||||||||||||||||
|
| |||||||||||||||||||||||||||||||
Lee Enterprises Inc., Second Lien Term Loan, 12/15/22 | $ | 47,222,199 | $ | 109,254b | $ | (9,403,706 | )b | $ | 146,009 | $ | (510,929 | ) | $ | 37,562,827 | 37,375,947 | $ | 1,344,242 | |||||||||||||||
Lee Enterprises Inc., senior secured note, first lien, 144A, 9.50%, 3/15/22 | 99,476,250 | 100,173b | — | — | (585,423 | ) | 98,991,000 | 97,050,000 | 4,584,265 | |||||||||||||||||||||||
Sorenson Communications LLC, Initial Term Loan, 4/30/20 | 138,475,000 | 44,289b | (139,170,854 | ) | 120,026 | 531,539 | — | — | 2,758,168 | |||||||||||||||||||||||
Sorenson Communications LLC, Initial Term Loans, 3/14/24 | — | 12,975,605b | — | — | 575,020 | 13,550,625 | 13,500,000 | 143,812 | ||||||||||||||||||||||||
Sorenson Communications LLC, secured note, second lien, 144A, PIK, 9.00%, 10/31/20 | 94,738,498 | 222,447b | (96,671,937 | ) | 1,144,350 | 566,642 | — | — | 2,875,990 | |||||||||||||||||||||||
Sorenson Holdings LLC/Finance Corp., senior note, 144A, PIK, 13.85%, 10/31/21 | 20,620,500 | 44,363b | (19,614,622 | ) | 69,148 | (1,119,389 | ) | — | — | 704,310 | ||||||||||||||||||||||
|
|
|
| |||||||||||||||||||||||||||||
| $ | 400,532,447 | $ | 13,496,131 | $ | (264,861,119 | ) | $ | 1,479,533 | $ | (542,540 | ) | $ | 150,104,452 | $ | 12,410,787 | |||||||||||||||||
|
|
|
| |||||||||||||||||||||||||||||
Total Affiliated Securities(Value is 8.7% of Net Assets) | $ | 621,304,183 | $ | 50,790,982 | $ | (276,302,495 | ) | $ | 2,036,685 | $ | 20,993,020 | $ | 387,615,642 | $ | 14,325,087 | |||||||||||||||||
|
|
|
| |||||||||||||||||||||||||||||
aAs of June 30, 2019, no longer an affiliate.
bMay include accretion, amortization, partnership adjustments, and/or other cost basis adjustments.
14. Credit Facility
The Fund, together with other U.S. registered and foreign investment funds (collectively, Borrowers), managed by Franklin Templeton, are borrowers in a joint syndicated senior unsecured credit facility totaling $2 billion (Global Credit Facility) which matures on February 7, 2020. This Global Credit Facility provides a source of funds to the Borrowers for temporary and emergency purposes, including the ability to meet future unanticipated or unusually large redemption requests.
Under the terms of the Global Credit Facility, the Fund shall, in addition to interest charged on any borrowings made by the Fund and other costs incurred by the Fund, pay its share of fees and expenses incurred in connection with the implementation and maintenance of the Global Credit Facility, based upon its relative share of the aggregate net assets of all of the Borrowers, including an annual commitment fee of 0.15% based upon the unused portion of the Global Credit Facility. These fees are reflected in other expenses in the Statement of Operations. During the period ended June 30, 2019, the Fund did not use the Global Credit Facility.
15. Fair Value Measurements
The Fund follows a fair value hierarchy that distinguishes between market data obtained from independent sources (observable inputs) and the Fund’s own market assumptions (unobservable inputs). These inputs are used in determining the value of the Fund’s financial instruments and are summarized in the following fair value hierarchy:
| • | Level 1 – quoted prices in active markets for identical financial instruments |
franklintempleton.com |
Semiannual Report |
41 | ||
FRANKLIN MUTUAL SERIES FUNDS
NOTES TO FINANCIAL STATEMENTS (UNAUDITED)
Franklin Mutual Quest Fund(continued)
15. Fair Value Measurements(continued)
| • | Level 2 – other significant observable inputs (including quoted prices for similar financial instruments, interest rates, prepayment speed, credit risk, etc.) |
| • | Level 3 – significant unobservable inputs (including the Fund’s own assumptions in determining the fair value of financial instruments) |
The input levels are not necessarily an indication of the risk or liquidity associated with financial instruments at that level.
A summary of inputs used as of June 30, 2019, in valuing the Fund’s assets and liabilities carried at fair value, is as follows:
| Level 1 | Level 2 | Level 3 | Total | |||||||||||||
Assets: | ||||||||||||||||
Investments in Securities:a | ||||||||||||||||
Equity Investments:b | ||||||||||||||||
Auto Components | $ | 29,715,751 | $ | — | $ | 65,435 | $ | 29,781,186 | ||||||||
Chemicals | 21,794,002 | — | 2,635,896 | 24,429,898 | ||||||||||||
Communications Equipment | — | — | 179,507,964 | 179,507,964 | ||||||||||||
Media | 301,987,762 | 938,893 | 21,335,945 | 324,262,600 | ||||||||||||
Specialty Retail | 28,500,955 | — | 25,930,372 | 54,431,327 | ||||||||||||
Technology Hardware, Storage & Peripherals | 38,434,383 | — | 2,484,752 | 40,919,135 | ||||||||||||
All Other Equity Investments | 2,246,808,636 | — | — | c | 2,246,808,636 | |||||||||||
Corporate Bonds, Notes and Senior Floating Rate Interests | — | 747,507,474 | — | 747,507,474 | ||||||||||||
Corporate Bonds and Notes in Reorganization | — | 6,520,296 | 2,608,484 | c | 9,128,780 | |||||||||||
Companies in Liquidation | — | 156,263 | — | c | 156,263 | |||||||||||
Short Term Investments | 670,269,663 | 117,200,000 | — | 787,469,663 | ||||||||||||
|
| |||||||||||||||
Total Investments in Securities | $ | 3,337,511,152 | $ | 872,322,926 | $ | 234,568,848 | $ | 4,444,402,926 | ||||||||
|
| |||||||||||||||
Other Financial Instruments: | ||||||||||||||||
Futures Contracts | $ | 136,065 | $ | — | $ | — | $ | 136,065 | ||||||||
Forward Exchange Contracts | — | 7,490,496 | — | 7,490,496 | ||||||||||||
Unfunded Loan Commitments | — | 11,535 | — | 11,535 | ||||||||||||
|
| |||||||||||||||
Total Other Financial Instruments | $ | 136,065 | $ | 7,502,031 | $ | — | $ | 7,638,096 | ||||||||
|
| |||||||||||||||
Liabilities: | ||||||||||||||||
Other Financial Instruments: | ||||||||||||||||
Options Written | $ | 748,500 | $ | — | $ | — | $ | 748,500 | ||||||||
Securities Sold Shorta | 50,502,333 | — | — | 50,502,333 | ||||||||||||
Futures Contracts | 205,017 | — | — | 205,017 | ||||||||||||
Forward Exchange Contracts | — | 431,282 | — | 431,282 | ||||||||||||
|
| |||||||||||||||
Total Other Financial Instruments | $ | 51,455,850 | $ | 431,282 | $ | — | $ | 51,887,132 | ||||||||
|
| |||||||||||||||
aFor detailed categories, see the accompanying Statement of Investments.
bIncludes common, preferred and convertible preferred stocks and management investment companies as well as other equity interests.
cIncludes securities determined to have no value at June 30, 2019.
42 |
Semiannual Report |
franklintempleton.com | ||
FRANKLIN MUTUAL SERIES FUNDS
NOTES TO FINANCIAL STATEMENTS (UNAUDITED)
Franklin Mutual Quest Fund(continued)
A reconciliation of assets in which Level 3 inputs are used in determining fair value is presented when there are significant Level 3 financial instruments at the beginning and/or end of the period. At June 30, 2019, the reconciliation of assets are as follows:
| Balance at Beginning of Period | Purchases | Sales | Transfer Into (Out of) Level 3 | Cost Basis Adjustments | Net (Loss) | Net Unrealized | Balance at End of Period | Net Change in Period End | ||||||||||||||||||||||||||||
| Assets: | ||||||||||||||||||||||||||||||||||||
Investments in Securities: | ||||||||||||||||||||||||||||||||||||
Equity Investments:a | ||||||||||||||||||||||||||||||||||||
Auto Components | $ 2,483,009 | $ — | $(2,968,774 | ) | $— | $— | $(13,337,171 | ) | $13,888,371 | $ 65,435 | $ (42,554 | ) | ||||||||||||||||||||||||
Chemicals | — | b | — | — | — | — | — | 2,635,896 | 2,635,896 | 2,635,896 | ||||||||||||||||||||||||||
Communications Equipment | 155,100,344 | — | — | — | — | — | 24,407,620 | 179,507,964 | 24,407,620 | |||||||||||||||||||||||||||
Diversified Consumer Services | 3,664,436 | — | — | — | — | — | (3,664,436 | ) | — | b | (3,664,436 | ) | ||||||||||||||||||||||||
Media | 217,582 | — | — | — | — | — | 21,118,363 | 21,335,945 | 21,118,363 | |||||||||||||||||||||||||||
Specialty Retail | — | 34,810,099 | — | — | — | — | (8,879,727 | ) | 25,930,372 | (8,879,727 | ) | |||||||||||||||||||||||||
Technology Hardware, Storage & Peripherals | — | 2,484,752 | — | — | — | — | — | 2,484,752 | — | |||||||||||||||||||||||||||
Corporate Bonds and Notes in Reorganization | 3,563,602 | b | — | — | — | — | — | (955,118 | ) | 2,608,484 | b | (955,118 | ) | |||||||||||||||||||||||
Companies in Liquidation | — | b | — | — | — | — | — | — | — | b | — | |||||||||||||||||||||||||
|
| |||||||||||||||||||||||||||||||||||
Total | $165,028,973 | $37,294,851 | $(2,968,774 | ) | $— | $— | $(13,337,171 | ) | $48,550,969 | $234,568,848 | $34,620,044 | |||||||||||||||||||||||||
|
| |||||||||||||||||||||||||||||||||||
aIncludes common stocks as well as other equity interests.
bIncludes securities determined to have no value.
Significant unobservable valuation inputs for material Level 3 financial instruments and impact to fair value as a result of changes in unobservable valuation inputs as of June 30, 2019, are as follows:
| Description | Fair Value at End of Period | Valuation Technique | Unobservable Inputs | Amount | Impact to Fair Value if Input Increasesa | |||||||||||||||
| Assets: | ||||||||||||||||||||
Investments in Securities: | ||||||||||||||||||||
Equity Investments: | ||||||||||||||||||||
Communications Equipment | $179,507,964 | Market transaction | | Transaction price weighting | 50% | Increaseb | ||||||||||||||
| franklintempleton.com | Semiannual Report | 43 | ||||
FRANKLIN MUTUAL SERIES FUNDS
NOTES TO FINANCIAL STATEMENTS (UNAUDITED)
Franklin Mutual Quest Fund(continued)
15. Fair Value Measurements(continued)
| Description | Fair Value at End of Period | Valuation Technique | Unobservable Inputs | Amount | Impact to Fair Value if Input Increasesa | |||||||||||
| Market comparables | EV / EBITDA multiple | 4.9x | Increaseb | |||||||||||||
Media | 20,440,614 | Market comparables | Discount for lack of marketability | 3.6% | | Decreasec | | |||||||||
Specialty Retail | 25,930,372 | Consensus Pricing | Offered quotes | $4,800 | Increase | |||||||||||
All Other Investmentsd | 8,689,898 | |||||||||||||||
Total | $234,568,848 | |||||||||||||||
aRepresents the directional change in the fair value of the Level 3 financial instruments that would result from a significant and reasonable increase in the corresponding input. A significant and reasonable decrease in the input would have the opposite effect. Significant impacts, if any, to fair value and/or net assets have been indicated.
bRepresents a significant impact to fair value and net assets.
cRepresents a significant impact to fair value but not net assets.
dIncludes fair value of immaterial financial instruments developed using various valuation techniques and unobservable inputs. May also include financial instruments with values derived using private transaction prices ornon-public third party pricing information which is unobservable.
Abbreviations List
| ||||
| EBITDA Earnings before interest, taxes, depreciation and amortization | ||||
| EV Enterprise value | ||||
16. New Accounting Pronouncements
In August 2018, the Financial Accounting Standards Board issued Accounting Standards Update (ASU)No. 2018-14, Compensation—Retirement Benefits—Defined Benefit Plans—General (Subtopic715-20): Disclosure Framework—Changes to the Disclosure Requirements for Defined Benefit Plans. The amendments in the ASU modify the disclosure requirements for employers that sponsor defined benefit pension or other postretirement plans. The ASU is effective for annual reporting periods ending after December 15, 2020. Management has reviewed the requirements and believes the adoption of this ASU will not have a material impact on the financial statements.
17. Subsequent Events
The Fund has evaluated subsequent events through the issuance of the financial statements and determined that no events have occurred that require disclosure.
Abbreviations
| Counterparty | Currency | Selected Portfolio | ||||||||
| BOFA | Bank of America Corp. | EUR | Euro | ADR | American Depositary Receipt | |||||
| BONY | The Bank of New York Mellon Corp. | GBP | British Pound | FHLB | Federal Home Loan Bank | |||||
| HSBK | HSBC Bank PLC | USD | United States Dollar | LIBOR | London InterBank Offered Rate | |||||
| SSBT | State Street Bank and Trust Co., N.A. | |||||||||
| UBSW | UBS AG | |||||||||
| 44 | Semiannual Report | franklintempleton.com | ||
FRANKLIN MUTUAL SERIES FUNDS
FRANKLIN MUTUAL QUEST FUND
Board Approval of Investment Management Agreements
FRANKLIN MUTUAL SERIES FUNDS
Franklin Mutual Quest Fund
(Fund)
The Board of Trustees (Board), including a majority of trustees that are not “interested persons” as such term is defined in section 2(a)(19) of the Investment Company Act of 1940 (hereinafter referred to as “independent trustees”), at anin-person meeting held on May 22, 2019, unanimously approved the renewal of the Fund’s investment management agreement. Prior to a meeting of all of the trustees for the purpose of considering such renewal, the independent trustees participated in two other meetings held in connection with the renewal process. Throughout the process, the independent trustees received assistance and advice from and met separately with independent counsel. The independent trustees met with and interviewed officers of the investment manager (including portfolio managers), the transfer agent and shareholder services group and the distributor. In approving the renewal of the investment management agreement for the Fund, the Board, including the independent trustees, determined that the investment management fee structure was fair and reasonable and that continuance of the agreement was in the best interests of the Fund and its shareholders.
In reaching their decision on the investment management agreement, the trustees took into account information furnished throughout the year at regular Board meetings, as well as information specifically requested and furnished for the renewal process, which culminated in the meetings referred to above for the specific purpose of considering such agreement. Information furnished throughout the year included, among others, reports on the Fund’s investment performance, expenses, portfolio composition, portfolio brokerage execution, client commission arrangements, derivatives, securities lending, asset segregation, portfolio turnover, Rule12b-1 plan, distribution, shareholder servicing, legal and compliance matters, pricing of securities, sales and redemptions, and marketing support payments made to financial intermediaries, as well as a third-party survey of transfer agent fees charged to funds within the Franklin Templeton Investments (FTI) complex in comparison with those charged to other fund complexes deemed comparable. Also, related financial statements and other information about the scope and quality of services provided by the investment manager and its affiliates and enhancements to
such services over the past year were provided. In addition, the trustees received periodic reports throughout the year and during the renewal process relating to compliance with the Fund’s investment policies and restrictions. During the renewal process, the independent trustees considered the investment manager’s methods of operation within the Franklin Templeton group and its activities on behalf of other clients. The Board also noted that it received an annual report on all payments made by FTI or the Fund to financial intermediaries engaged in the sale of Fund shares, as well as a memorandum relating to third-party servicing arrangements in response to a Guidance Update from the U.S. Securities and Exchange Commission (SEC) relating to mutual fund distribution andsub-accounting fees.
The information obtained by the trustees during the renewal process also included a special report prepared by Broadridge Financial Solutions, Inc., an independent third-party analyst that utilizes data from Lipper, Inc. (“Lipper”), comparing the Fund’s investment performance and expenses with those of other mutual funds deemed comparable to the Fund as selected by Lipper (Broadridge Section 15(c) Report). The trustees reviewed the Broadridge Section 15(c) Report and its usefulness in the renewal process with respect to matters such as comparative fees, expenses, expense ratios, performance and volatility. They concluded that the report continues to be a reliable resource in the performance of their duties.
In addition, the trustees received a Profitability Study (Profitability Study) prepared by management discussing the profitability to FTI from its overall U.S. fund operations, as well as on an individualfund-by-fund basis. Over the past year, the Board and counsel to the independent trustees continued to receive reports on management’s handling of recent regulatory inquiries and pending legal actions against the investment manager and its affiliates. The independent trustees were satisfied with the actions taken to date by management in response to such regulatory and legal matters.
The trustees reviewed the personnel, operations, financial condition, and investment management capabilities, methodologies and resources of the investment manager. As part of this review, particular attention was given to management’s diligent risk management program, including continual monitoring and management of cybersecurity, liquidity and counterparty credit risk, and attention given to derivatives and other complex instruments that are held and expected to be held by the Fund and how such instruments
franklintempleton.com |
Semiannual Report |
|
45 |
| ||
FRANKLIN MUTUAL SERIES FUNDS
FRANKLIN MUTUAL QUEST FUND
SHAREHOLDER INFORMATION
are used to carry out the Fund’s investment goal(s). The Board also took into account, among other things, management’s efforts in establishing a global credit facility for the benefit of the Fund and other accounts managed by FTI to provide a source of cash for temporary and emergency purposes or to meet unusual redemption requests as well as the strong financial position of the investment manager’s parent company and its commitment to the mutual fund business. The Board noted management’s continuing efforts and expenditures in establishing effective business continuity plans and developing strategies to address areas of heightened concern in the mutual fund industry, such as cybersecurity and liquidity risk management. The Board also recognized management’s commitment to facilitating Board oversight of particular areas, including derivatives and payments to intermediaries, by enhanced reporting.
In addition to the above and other matters considered by the trustees throughout the course of the year, the following discussion relates to certain primary factors relevant to the Board’s decision. This discussion of the information and factors considered by the Board (including the information and factors discussed above) is not intended to be exhaustive, but rather summarizes certain factors considered by the Board. In view of the wide variety of factors considered, the Board did not, unless otherwise noted, find it practicable to quantify or otherwise assign relative weights to the foregoing factors. In addition, individual trustees may have assigned different weights to various factors.
NATURE, EXTENT AND QUALITY OF SERVICES. The trustees reviewed the nature, extent and quality of the services provided, and to be provided, by the investment manager. The trustees cited the investment manager’s ability to implement the Fund’s disciplined value investment approach and its long-term relationship with the Fund as reasons that shareholders choose to invest, and remain invested, in the Fund. The trustees reviewed the Fund’s portfolio management team, including its performance, staffing, skills and compensation program. With respect to portfolio manager compensation, management assured the trustees that the Fund’s long-term performance is a significant component of incentive-based compensation and noted that a portion of a portfolio manager’s incentive-based compensation is paid in shares ofpre- designated funds from the portfolio manager’s fund management area. The trustees noted that the portfolio manager compensation program aligned the interests of the portfolio managers with that of shareholders of the Fund. The trustees discussed
with management various other products, portfolios and entities that are advised by the investment manager and the allocation of assets and expenses among and within them, as well as their relative fees and reasons for differences with respect thereto and any potential conflicts. During regular Board meetings and the aforementioned meetings of the independent trustees, the trustees received reports and presentations on the investment manager’s best execution trading policies. The trustees considered periodic reports provided to them showing that the investment manager complied with the investment policies and restrictions of the Fund as well as other reports periodically furnished to the Board covering matters such as the compliance of portfolio managers and other management personnel with the code of ethics covering the investment management personnel, the adherence to fair value pricing procedures established by the Board and the accuracy of net asset value calculations. The Board noted the extent of the benefits provided to Fund shareholders from being part of the Franklin Templeton group of funds, including the right to exchange investments between funds (same class) without a sales charge, the ability to reinvest Fund dividends into other funds and the right to combine holdings of other funds to obtain reduced sales charges. The Board considered the investment manager’s significant efforts in developing and implementing compliance procedures established in accordance with SEC and other requirements.
The Board considered the nature, extent and quality of the services to be provided under the Fund’s other service agreements to determine that, on an overall basis, Fund shareholders were well served. In this connection, the Board also took into account transfer agent and shareholder services provided to Fund shareholders by an affiliate of the investment manager, noting continuing expenditures by management to increase and improve the scope of such services and favorable periodic reports on shareholder services conducted by independent third parties. While such considerations directly affected the trustees’ decision in renewing the Fund’s transfer agent and shareholder services agreement, the Board also considered these commitments as incidental benefits to Fund shareholders deriving from the investment management relationship.
Based on their review, the trustees were satisfied with the nature and quality of the overall services provided, and to be provided, by the investment manager and its affiliates to the Fund and its shareholders and were confident in the abilities of the management team to continue the disciplined value
46 |
Semiannual Report |
franklintempleton.com | ||
FRANKLIN MUTUAL SERIES FUNDS
FRANKLIN MUTUAL QUEST FUND
SHAREHOLDER INFORMATION
investment approach of the Fund and to provide quality services to the Fund and its shareholders.
INVESTMENT PERFORMANCE.The trustees reviewed and placed significant emphasis on the investment performance of the Fund over theone-, three-, five- and10-year periods ended December 31, 2018. They considered the history of successful performance of the Fund relative to various benchmarks. As part of their review, they inquired of management regarding benchmarks, style drift and restrictions on permitted investments. Consideration was also given to performance in the context of available levels of cash during the periods.
The trustees had meetings during the year, including the meetings referred to above held in connection with the renewal process, with the Fund’s portfolio managers to discuss performance and the management of the Fund. In addition to the materials provided by management in connection with the renewal process, the independent trustees requested throughout the year (and received) additional presentations from the investment manager and senior management of FTI regarding the performance of the investment manager and the Fund. As part of these presentations, the investment manager and senior management of FTI reviewed enhancements that have been made, and are being made, to the investment manager’s investment process. In addition, particular attention in assessing performance was given to the Broadridge Section 15(c) Report. That report showed the investment performance of the Fund (Class A shares) in comparison to other funds determined comparable by Lipper.
The comparable funds to the Fund, as chosen by Lipper, included all retail and institutional flexible portfolio funds. The Fund had total returns in the middle performing quintile for theone-year period ended December 31, 2018, and had annualized total returns for the three- and five-year periods in the second-best and middle performing quintiles, respectively. The trustees noted that the Fund’s total return on an annualized basis for the10-year period ended December 31, 2018 was in the middle performing quintile. The trustees also compared Fund performance to other industry benchmarks, including measures of risk-adjusted performance of a fund, as part of their evaluation of investment performance. The Board concluded that such comparative performance was acceptable.
COMPARATIVE EXPENSES AND MANAGEMENT PROFITABILITY.The trustees considered the cost of the services provided and to be provided and the profits realized
by the investment manager and its affiliates from their respective relationships with the Fund. As part of the renewal process, the trustees explored with management the trends in expense ratios over the past three fiscal years and the reasons for any increases in the Fund’s expense ratios (or components thereof). In considering the appropriateness of the management fee and other expenses charged to the Fund, the Board took into account various factors including investment performance and matters relating to Fund operations, including, but not limited to, the quality and experience of its portfolio managers and research staff. Consideration was also given to a comparative analysis in the Broadridge Section 15(c) Report of the investment management fee and total expense ratio of the Fund in comparison with those of a group of other funds selected by Lipper as its appropriate Lipper expense group. Lipper expense data is based upon information taken from each fund’s most recent annual report, which reflects historical asset levels that may be quite different from those currently existing, particularly in a period of market volatility. While recognizing such inherent limitation and the fact that expense ratios generally increase as assets decline and decrease as assets grow, the Board believed the independent analysis conducted by Lipper to be an appropriate measure of comparative expenses.
In reviewing comparative costs, emphasis was given to the Fund’s contractual management fee in comparison with the contractual management fee that would have been charged by other funds within its Lipper expense group assuming they were similar in size to the Fund, as well as the actual total expenses of the Fund in comparison with those of its Lipper expense group. The Lipper contractual management fee analysis includes administrative charges as being part of the management fee, and total expenses, for comparative consistency, are shown by Lipper for Fund Class A shares.
The Fund’s contractual management fee rate was in the second-least expensive quintile of its Lipper expense group and its total expenses were also in the second-least expensive quintile of such group. The Board was satisfied with such comparative fees and expenses.
The trustees also reviewed the Profitability Study addressing profitability of Franklin Resources, Inc., from its overall U.S. fund business, as well as profitability to the Fund’s investment manager and its affiliates, from providing investment management and other services to the Fund during the12-month period ended September 30, 2018, the most recent fiscalyear-end of Franklin Resources, Inc. The
franklintempleton.com |
Semiannual Report |
|
47 |
| ||
FRANKLIN MUTUAL SERIES FUNDS
FRANKLIN MUTUAL QUEST FUND
SHAREHOLDER INFORMATION
trustees reviewed the basis on which such reports are prepared and the cost allocation methodology utilized in the Profitability Study, it being recognized that allocation methodologies may each be reasonable while producing different results. In this respect, the Board noted that the reasonableness of the cost allocation methodologies was reviewed by independent accountants on an every other year basis.
The independent trustees met with management to discuss the Profitability Study. This included, among other things, a comparison of investment management income with investment management expenses of the Fund; comparison of underwriting revenues and expenses; the relative relationship of investment management and underwriting expenses; shareholder servicing profitability; economies of scale; and the relative contribution of the Fund to the profitability of the investment manager and its parent. In discussing the Profitability Study with the Board, the investment manager stated its belief that the costs incurred in establishing the infrastructure necessary to operate the type of mutual fund operations conducted by it and its affiliates may not be fully reflected in the expenses allocated to the Fund in determining its profitability.
The Board also took into account management’s expenditures in improving shareholder services provided to the Fund, as well as the need to meet additional regulatory and compliance requirements. The trustees also considered the extent to which the investment manager may derive ancillary benefits from Fund operations, including those derived from economies of scale, discussed below, the allocation of Fund brokerage and the use of commission dollars to pay for research and other similar services.
Based upon their consideration of all these factors, the trustees determined that the level of profits realized by the investment manager and its affiliates in providing services to the Fund was not excessive in view of the nature, quality and extent of services provided.
ECONOMIES OF SCALE. The Board considered economies of scale realized by the investment manager and its affiliates as the Fund grows larger and the extent to which they are shared with Fund shareholders, as for example, in the level of the investment management fee charged, in the quality and efficiency of services rendered and in increased capital commitments benefiting the Fund directly or indirectly. While recognizing that any precise determination is inherently subjective, the trustees noted that, based upon the Profitability Study, as some funds increase in size, at some
point economies of scale may result in the investment manager realizing a larger profit margin on investment management services provided to such a fund. The trustees also noted that benefits of economies of scale will be shared with Fund shareholders due to the decline in the effective investment management fee rate as breakpoints are achieved by the Fund.
The trustees noted that breakpoints had been instituted as part of the Fund’s investment management fee and that the Board regularly evaluates whether additional breakpoints are appropriate. The trustees assessed the savings to shareholders resulting from such breakpoints and believed they were, and continue to be, appropriate and they agreed to continue to monitor the appropriateness of the breakpoints. The trustees also considered the effects an increase in assets under management would have on the investment management fee and expense ratio of the Fund. To the extent further economies of scale may be realized by the investment manager and its affiliates, the Board believed the investment management fees provide a sharing of benefits with the Fund and its shareholders.
Proxy Voting Policies and Procedures
The Fund’s investment manager has established Proxy Voting Policies and Procedures (Policies) that the Fund uses to determine how to vote proxies relating to portfolio securities. Shareholders may view the Fund’s complete Policies online at franklintempleton.com. Alternatively, shareholders may request copies of the Policies free of charge by calling the Proxy Group collect at (954)527-7678 or by sending a written request to: Franklin Templeton Companies, LLC, 300 S.E. 2nd Street, Fort Lauderdale, FL 33301, Attention: Proxy Group. Copies of the Fund’s proxy voting records are also made available online at franklintempleton.com and posted on the U.S. Securities and Exchange Commission’s website at sec.gov and reflect the most recent12-month period ended June 30.
Quarterly Statement of Investments
The Trust, on behalf of the Fund, files a complete statement of investments with the U.S. Securities and Exchange Commission for the first and third quarters for each fiscal year as an exhibit to its report on FormN-PORT. Shareholders may view the filed FormN-PORT by visiting the Commission’s website at sec.gov. The filed form may also be viewed and copied at the Commission’s Public Reference Room in Washington, DC. Information regarding
48 |
Semiannual Report |
franklintempleton.com | ||
FRANKLIN MUTUAL SERIES FUNDS
FRANKLIN MUTUAL QUEST FUND
SHAREHOLDER INFORMATION
the operations of the Public Reference Room may be obtained by calling(800) SEC-0330.
franklintempleton.com |
Semiannual Report |
|
49 |
| ||
This page intentionally left blank.
This page intentionally left blank.
This page intentionally left blank.
Authorized for distribution only when accompanied or preceded by a summary prospectus and/or prospectus. Investors should carefully consider a fund’s investment goals, risks, charges and expenses before investing. A prospectus contains this and other information; please read it carefully before investing.
To help ensure we provide you with quality service, all calls to and from our service areas are monitored and/or recorded.
| Semiannual Report and Shareholder Letter | |||||
| Franklin Mutual Quest Fund | ||||||
Investment Manager | Distributor | Shareholder Services | ||||
| Franklin Mutual Advisers, LLC | Franklin Templeton Distributors, Inc. (800) DIAL BEN®/342-5236 franklintempleton.com | (800) 632-2301 - (Class A, C, R & R6) (800)448-FUND - (Class Z) | ||||
| © 2019 Franklin Templeton Investments. All rights reserved. | 475 S 08/19 |
Sign up for electronic delivery at franklintempleton.com/edelivery
Internet Delivery of Fund Reports Unless You Request Paper Copies:Effective January 1, 2021, as permitted by the SEC, paper copies of the Fund’s shareholder reports will no longer be sent by mail, unless you specifically request them from the Fund or your financial intermediary. Instead, the reports will be made available on a website, and you will be notified by mail each time a report is posted and provided with a website link to access the report.
If you already elected to receive shareholder reports electronically, you will not be affected by this change and you need not take any action. If you have not signed up for electronic delivery, we would encourage you to join fellow shareholders who have. You may elect to receive shareholder reports and other communications electronically from the Fund by calling (800)632-2301 or by contacting your financial intermediary.
You may elect to continue to receive paper copies of all your future shareholder reports free of charge by contacting your financial intermediary or, if you invest directly with a Fund, calling (800)632-2301 to let the Fund know of your request. Your election to receive reports in paper will apply to all funds held in your account.
FRANKLIN TEMPLETON
Successful investing begins with ambition. And achievement only comes when you reach for it. That’s why we continually strive to deliver better outcomes for investors. No matter what your goals are, our deep, global investment expertise allows us to offer solutions that can help.
During our more than 70 years of experience, we’ve managed through all kinds of markets—up, down and those in between. We’re always preparing for what may come next. It’s because of this, combined with our strength as one of the world’s largest asset managers that we’ve earned the trust of millions of investors around the world.
Dear Franklin Mutual Shares Fund Shareholder:
The markets came into 2019 in a fog of uncertainty. The outlook for economic growth had become less bright and fears were mounting that the U.S. Federal Reserve (Fed) would make a policy misstep in raising interest rates too far. Over the past six months, many of these economic concerns have eased, as the Fed and other major central banks like the European Central Bank (ECB) turned more dovish amid signs that growth was becoming a bit more sluggish. The ECB suggested it would act should growth soften and inflation not materialize. This dovishness helped propel the U.S. equity market back toward record highs in June. Bond yields, meanwhile, fell on the prospect for increased central bank-driven liquidity, with some sovereign European bonds sliding back into negative territory.
Although the prospects of a more accommodative monetary policy eased fears about the economic outlook, persistent trade tensions between the U.S. and China, among other nations, kept markets on edge. This was on full display in May when markets fell sharply on a ratcheting up of tensions and after the U.S. government threatened to place tariffs on Mexican goods. Mideast tensions also began to heat up in June with attacks on oil tankers in the Persian Gulf and greater tensions between the U.S. and Iran.
How, and even whether, the U.K. will leave the European Union has also remained unresolved. Atperiod-end, the U.K. Conservative Party was conducting a leadership contest,
which has the potential to complicate future Brexit negotiations and leave markets vulnerable to increased volatility.
Despite all this uncertainty, for thesix-month period ended June 30, 2019, U.S. stocks, as measured by the Standard & Poor’s 500® Index (S&P 500®), posted a +18.54% total return, while stocks in global developed markets, as measured by the MSCI World Index, posted a +17.38% total return.1
As has been the case in recent years, growth stocks, particularly in the technology sector, have outperformed over thesix-month period. Value stocks generally have remained disfavored in this environment where, at times, economic factors and monetary policy have had greater sway on equity returns than corporate fundamentals.
We recognize the important role of financial advisors in today’s markets and encourage investors to continue to seek their advice. Amid changing markets and economic conditions, we are confident investors with a well-diversified portfolio and a patient, long-term outlook will be well positioned for the years ahead.
On the following pages, the Fund’s portfolio management team reviews investment decisions that pertain to performance during the past six months considering the
1. Source: Morningstar.
See www.franklintempletondatasources.com for additional data provider information.
Not FDIC Insured | | | May Lose Value | | | No Bank Guarantee |
franklintempleton.com |
Not part of the semiannual report |
|
1 |
| ||
economic environment and other factors. Please remember all securities markets fluctuate, as do mutual fund share prices.
We thank you for investing with Franklin Templeton, welcome your questions and comments, and look forward to continuing to serve your investment needs in the years ahead.
Sincerely,

Peter A. Langerman
Chairman, President and Chief Executive Officer
Franklin Mutual Advisers, LLC
This letter reflects our analysis and opinions as of June 30, 2019, unless otherwise indicated. The information is not a complete analysis of every aspect of any market, country, industry, security or fund. Statements of fact are from sources considered reliable.
Semiannual Report
| 3 | ||||
| 9 | ||||
| 11 | ||||
| 12 | ||||
| 24 | ||||
| 29 | ||||
| 43 | ||||
| Visitfranklintempleton.comfor fund updates, to access your account, or to find helpful financial planning tools. |
| 2 | Not part of the semiannual report | franklintempleton.com | ||||
SEMIANNUAL REPORT
This semiannual report for Franklin Mutual Shares Fund covers the period ended June 30, 2019.
Your Fund’s Goal and Main Investments
The Fund seeks capital appreciation, which may occasionally be short term, with income as a secondary goal. Under normal market conditions, the Fund invests primarily in equity securities, primarily common stock, of U.S. and foreign companies that the investment manager believes are available at market prices less than their intrinsic value. To a lesser extent, the Fund also invests in merger arbitrage securities and the debt and equity of distressed companies. The Fund may invest up to 35% of its assets in foreign securities, which may include sovereign debt and participations in foreign government debt. The Geographic Composition bar chart on this page lists the leading countries where the Fund invests.
Performance Overview
The Fund’s Class Z shares posted a cumulative total return of +13.77% for the six months ended June 30, 2019. For comparison, the Fund’s benchmark, the Standard & Poor’s 500 Index (S&P 500), which is a broad measure of U.S. stock performance, posted a total return of +18.54%.1 You can find more of the Fund’s performance data in the Performance Summary beginning on page 9.
Performance data represent past performance, which does not guarantee future results. Investment return and principal value will fluctuate, and you may have a gain or loss when you sell your shares. Current performance may differ from figures shown. For most recentmonth-end performance, go tofranklintempleton.comor call(800)342-5236.
Economic and Market Overview
The global economy expanded during the six months ended June 30, 2019 despite weakness in certain regions. Global developed and emerging market stocks were aided by upbeat economic data in some regions, encouraging corporate earnings reports and periods of optimism about a
Geographic Composition*
Based on Total Net Assets as of 6/30/19
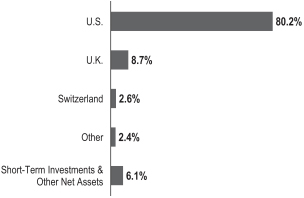
*Figures are stated as a percentage of total and may not equal 100% or may be negative due to rounding, use of any derivatives, unsettled trades or other factors.
potential U.S.-China trade deal. Further supporting markets were the U.S. Federal Reserve’s (Fed’s) patient approach to its monetary policy in 2019 and recent indication it will act as appropriate to sustain U.S. economic expansion.
However, markets reflected concerns about political uncertainties in the U.S. and the European Union, geopolitical risks in certain regions, and the impact of U.S. trade disputes with China and other trading partners on global growth and corporate earnings. In this environment, global developed and emerging market stocks, as measured by the MSCI All Country World Index, posted a +16.60% total return for thesix-month period.1
The U.S. economy grew during the six months ended June 30, 2019. After moderating for two consecutive quarters, the economy grew significantly faster in 2019’s first quarter, driven by growth in consumer spending, inventory investment, exports, business investment, and state and local government spending. However, the economy moderated again in the second quarter, due to weakness in inventory investment, exports, business investment and housing investment. The unemployment rate decreased from
1. Source: Morningstar.
The index is unmanaged and includes reinvestment of any income or distributions. It does not reflect any fees, expenses or sales charges. One cannot invest directly in an index, and an index is not representative of the Fund’s portfolio.
The dollar value, number of shares or principal amount, and names of all portfolio holdings are listed in the Fund’s Statement of Investments (SOI).
The SOI begins on page 17.
| franklintempleton.com | Semiannual Report |
|
3 |
| ||
FRANKLIN MUTUAL SHARES FUND
3.9% in December 2018 to 3.7% atperiod-end.2 The annual inflation rate, as measured by the Consumer Price Index, decreased from 1.9% in December 2018 to 1.6% atperiod-end.2
The Fed held its target range for the federal funds rate unchanged, at 2.25%–2.50%, during the reporting period. In March, the Fed mentioned it would end its balance sheet normalization program by the end of September 2019. In June, the Fed indicated increased uncertainties around its views on economic activity and the labor market. With market-based inflation measures remaining low recently, the market has interpreted the Fed’s recent statements to mean it will likely cut rates in 2019’s second half to foster continued economic growth while attempting to achieve its inflation objective.
In Europe, the U.K.’s quarterly gross domestic product (GDP) growth accelerated in 2019’s first quarter, but GDP contracted in the second quarter compared with the first quarter as Brexit uncertainties weighed on business sentiment. The Bank of England left its key policy rate unchanged during the period. The eurozone’s quarterly GDP accelerated in 2019’s first quarter but moderated in the second quarter, and the bloc’s annual inflation rate marginally decreased byperiod-end. The European Central Bank (ECB) kept its benchmark interest rate unchanged for the same time. In June, the ECB mentioned it would leave interest rates unchanged through the first half of 2020, provided details of its new stimulus, and indicated its openness to cut rates or increase stimulus.
In Asia, Japan’s quarterly GDP growth accelerated in 2019’s first quarter. In June, the Bank of Japan also left its benchmark interest rate unchanged, while continuing its stimulus measures, and expressed its openness to cut interest rates or increase stimulus.
In larger emerging markets, Brazil’s quarterly GDP growth contracted in 2019’s first quarter. The Central Bank of Brazil left its benchmark interest rate unchanged during the period. Russia’s annual GDP growth moderated in 2019’s first quarter. The Bank of Russia cut its key rate once during the period. China’s annual GDP growth rate stabilized in 2019’s first quarter. The People’s Bank of China left its benchmark interest rate unchanged, but it took measures to improve financial liquidity to mitigate the effects of the U.S.-China trade dispute and support economic growth. Overall, global
emerging market stocks, as measured by the MSCI Emerging Markets Index, posted a +10.78% total return during thesix-month period.1
Investment Strategy
At Franklin Mutual Series, we are committed to our distinctive value approach to investing, which we believe can generate above-average risk-adjusted returns over time for our shareholders. Our major investment strategy is investing in undervalued stocks. When selecting undervalued equities, we are attracted to what we believe are fundamentally strong companies with healthy balance sheets, high-quality assets, substantial free cash flow and shareholder-oriented management teams and whose stocks are trading at discounts to our assessment of the companies’ intrinsic or business value. We also look for asset-rich companies whose shares may be trading at depressed levels due to concerns over short-term earnings disappointments, litigation, management strategy or other perceived negatives. This strict value approach is not only intended to improve the likelihood of capital appreciation, but also reduces the risk of substantial declines, in our opinion. While the vast majority of our undervalued equity investments are made in publicly traded companies globally, we may invest occasionally in privately held companies as well.
To a lesser extent, we complement this more traditional investment strategy with two others. One is distressed investing, a highly specialized field that has proven quite profitable during certain periods over the years. Distressed investing is complex and can take many forms. The most common distressed investment the Fund undertakes is the purchase of financially troubled or bankrupt companies’ debt at a substantial discount to face value. After the financially distressed company is reorganized, often in bankruptcy court, the old debt is typically replaced with new securities issued by the financially stronger company.
The other piece of our investment strategy is participating in arbitrage situations, another highly specialized field. When companies announce proposed mergers or takeovers, commonly referred to as “deals,” the target company may trade at a discount to the bid it ultimately accepts. One form of arbitrage involves purchasing the target company’s stock when it is trading below the value we believe it would receive in a deal. In keeping with our commitment to a relatively conservative investment approach, we typically focus our
2. Source: U.S. Bureau of Labor Statistics.
See www.franklintempletondatasources.com for additional data provider information
| 4 | Semiannual Report | franklintempleton.com | ||
FRANKLIN MUTUAL SHARES FUND
arbitrage efforts on announced deals, and avoid rumored deals or other situations we consider relatively risky. In addition, it is our practice to hedge the Fund’s currency exposure when we deem it advantageous for our shareholders.
What is meant by “hedge”?
To hedge an investment is to take a position intended to offset potential losses that may be incurred by a companion financial instrument.Hedging an investment may also offset potential gains.
|
Manager’s Discussion
Franklin Mutual Series has long analyzed companies in many ways beyond just looking at the numbers. We analyze the way a company is run and how decisions are made at the executive and board levels. We look at the sustainability of a company, including the relationships with employees and customers, as well as the environmental impacts of a company’s business. In many ways this is common sense. A company that takes advantage of customers and unsustainably produces environmental waste is worth less than one that does not do these things. Similarly, a company that iswell-run and responsive to shareholders is worth more than one whose executives manage the company for their private benefit. However, disclosure has been limited on many relevant issues, and there is disagreement among companies, shareholders and data providers about which factors should be measured and how they should be measured.
This type of analysis is labeled ESG analysis, where ESG stands for environmental, social, and governance factors. Many firms, including Franklin Templeton, are incorporating ESG factors in their investment research. In addition, there are other bodies such as the Sustainable Accounting Standards Board that are working on standardizing metrics for companies and industries to improve their reporting on these factors, particularly in the environmental and social areas. As a result, ESG analysis is improving across the market, and Franklin Mutual Series analysts are better able to analyzenon-traditional factors, including greenhouse gas emissions, water consumption, energy usage, talent management, diversity and inclusion, executive compensation, and enterprise risk management, to name a few. ESG investing should not be confused with social or exclusionary types of investing, but should rather be viewed as an additional tool analysts and portfolio managers use in the investment process to identify and measurenon-traditional, potential business risks and opportunities at a company.
Top 10 Sectors/Industries
Based on Equity Securities as of 6/30/19
% of Total Net Assets | ||||
| Banks | 10.6% | |||
| Oil, Gas & Consumable Fuels | 10.0% | |||
| Insurance | 8.3% | |||
| Pharmaceuticals | 6.8% | |||
| Media | 6.5% | |||
| Health Care Equipment & Supplies | 3.8% | |||
| Technology Hardware, Storage & Peripherals | 3.5% | |||
| Entertainment | 2.9% | |||
| Tobacco | 2.8% | |||
| Software | 2.6% | |||
Today, Franklin Mutual Series analysts review and analyze ESG reports produced by third parties or the companies themselves to assess potential risks that could have an impact on shareholder value. In addition, we have discussions with management teams around ESG risks, how they deal with them and the potential impact on stakeholders. Our discussions have included issues such as water consumption in mining, the impact of changing carbon dioxide emission standards on the automotive industry and discussions with boards and management teams around management pay. Although more work needs to be done to standardize data from companies within industries so that comparisons can be relevant, the identification and discussion of ESG risk factors is an input we consider in helping frame the potential negative events individual companies or industries may face. In our view, solid ESG ratings are an output of fundamentally good business practices, not an input. As the data and information regarding ESG risk factors continue to evolve, we believe the increased information will highlight additional risk factors to enterprises and help us make more informed investment decisions going forward.
Mergers and Acquisitions
Merger and acquisition (M&A) activity remained healthy in the first half of 2019. The health care sector led the way, with pharmaceuticals megamergers among the biggest transactions. The pending acquisitions of Celgene and Allergan (not a Fund holding), each worth almost $90 billion, exemplify this strength. The Top 10 Sectors/Industries table on this page lists pharmaceuticals and also other leading industries in which the Fund currently invests. Large deals have also been announced in the defense, oil and gas exploration and production, and diversified financial services industries, underlying the broad strength of the M&A boom.
| franklintempleton.com | Semiannual Report |
|
5 |
| ||
FRANKLIN MUTUAL SHARES FUND
In addition, U.S. and foreign regulators appear to be more amenable to deals, leading markets to expect fewer regulatory surprises. We are closely monitoring the U.S.-China trade conflict, becauseflare-ups could potentially impact pending and future deals. We expect M&A activity to remain strong for as long as the equity markets remain positive, as has been the historical pattern.
Credit Markets
Opportunities to invest in mispriced risk across global fixed income markets remained limited in the first half of 2019. The low interest-rate environment kept credit widely available, and default rates are still at historically low levels. Debt covenant terms, which include restrictions on the borrower’s financial activities, remain loose or nonexistent. In such an environment, we believe it is prudent to focus our efforts on investing in short-term mispriced risk and catalyst-driven credit opportunities.
On the restructuring side, Cumulus Media and iHeartMedia, two long-term distressed credit positions, emerged from bankruptcy or had reached a confirmable restructuring agreement in 2018, reducing further the purely distressed portion of the credit holdings within the Funds. PG&E, which recently filed for bankruptcy, became a new distressed credit position. Furthermore, Windstream Services became a new distressed credit position after parent company Windstream Holdings and its subsidiaries filed for bankruptcy. We are hopeful more opportunities may emerge as the business and economic cycles elongate amid persistent uncertainties. We will continue to seek to invest across the capital structures of companies that avail themselves of opportunities to bolster liquidity through internally generated free cash flow and corporate actions, including asset sales and debt refinancing.
Fund Performance
Top positive contributors to performance included Charter Communications, American International Group and Walt Disney. These companies are listed among the Fund’s largest positions in the Top 10 Equity Holdings table on this page.
In late January, U.S.-based Charter Communications, a telecommunications and mass media company, reported quarterly earnings, revenues and free cash flow that topped market expectations. Charter also estimated that 2019 capital spending and operating costs per customer could likely be lower than 2018, providing a boost to operating margins. In our view, Charter’s integration plan following the 2016 acquisition of Time Warner Cable is starting to produce positive results.
Top 10 Equity Holdings
6/30/19
Company Sector/Industry, Country | % of Total Net Assets | |||
Medtronic PLC Health Care Equipment & Supplies, U.S. | 3.8% | |||
The Walt Disney Co. Entertainment, U.S. | 2.9% | |||
Novartis AG Pharmaceuticals, Switzerland | 2.6% | |||
Charter Communications Inc. Media, U.S. | 2.6% | |||
JPMorgan Chase & Co. Banks, U.S. | 2.4% | |||
American International Group Inc. Insurance, U.S. | 2.3% | |||
Royal Dutch Shell PLC Oil, Gas & Consumable Fuels, U.K. | 2.0% | |||
Alleghany Corp. Insurance, U.S. | 1.9% | |||
Citigroup Inc. Banks, U.S. | 1.9% | |||
Wells Fargo & Co. Banks, U.S. | 1.9% | |||
Shares of American International Group (AIG), a U.S.-based insurer, rose following its fiscal first-quarter 2019 earnings release in May, which indicated a stabilization in its business. AIG has been repositioning itself to focus on writing more profitable business and reducing its overall risk exposure. As a result, the insurer expects to report an underwriting profit for its full fiscal year.
The stock of U.S.-based diversified international family entertainment and media enterprise Walt Disney surged following an investor event outlining the strategy and expectations for its new streaming service. The breadth and depth of content, the price point, and the technology and user interface supporting it have increased optimism about the service. Market expectations for the service’s growth and profitability rose significantly on the back of this event.
During the period under review, Fund investments that detracted from performance included Kroger, Walgreens Boots Alliance and CVS Health.
U.S.-based grocery retailer Kroger reported weaker-than-expected quarterly revenues and earnings per share (EPS), and its 2019 EPS guidance was below the consensus estimate. Investments, stronger growth in its lower-margin specialty pharmacy business and the opening of a new
| 6 | Semiannual Report | franklintempleton.com | ||
FRANKLIN MUTUAL SHARES FUND
warehouse caused a decline in Kroger’s gross margin. In our view, the immediate stock price decline was an overreaction, but earnings announcements can be high volatility events, as a small change in the margin has a significant effect on earnings.
Shares of U.S.-based Walgreens Boots Alliance did not keep up with the market rebound in January and February. In March, the stock price fell when the chief financial officer cited negative industry trends in drug prices and pharmacy benefit manager (PBM) reimbursement rates, as well as the company’s limited success offsetting those challenges by increasing its volume of drug sales or renegotiating with PBMs. These pressures and weakness in both its U.S. and U.K. stores resulted in a cut to full-year guidance in April. However, Walgreens is reducing costs throughout the enterprise, and within the front end of the store, it is attempting to reduce exposure to lower margin categories, which we believe can help boost growth and profitability over the longer term.
In January, the chief executive officer of U.S.-based CVS Health, an integrated pharmacy health care provider, highlighted probable headwinds for 2019, and in February the company detailed the financial drag from those headwinds. Possible negative factors included: higher costs from increased investments in its workforce, which could have a year-over-year drag on earnings through the first half of 2019; greater price competition in nursing care; and lower-than-expected branded drug price increases.
During the period, the Fund held currency forwards and futures seeking to hedge most of the currency risk of the portfolio’snon-U.S. dollar investments. The hedges had a positive overall impact on the Fund’s performance because of the appreciation of the U.S. dollar versus the hedged currencies.
What is a currency forward?
A currency forward is a direct agreement between the Fund and a counterparty to buy or sell a foreign currency in exchange for another currency at a specific exchange rate on a future date.
|
What is a future?
A future is an agreement between the Fund and a counterparty made through a U.S. or foreign futures exchange to buy or sell an underlying instrument or asset at a specific price on a future date.
|
As fellow shareholders, we found recent relative performance disappointing, but it is not uncommon for our strategy to lag the equity markets at times. We remain committed to our disciplined, value investment approach as we seek to generate attractive, long-term, risk-adjusted returns for shareholders.
Thank you for your participation in Franklin Mutual Shares Fund. We look forward to continuing to serve your investment needs.
 |  | |
Peter A. Langerman Co-Portfolio Manager | ||
 |
F. David Segal, CFA Co-Portfolio Manager | |
 |  | |
Debbie A. Turner, CFA Co-Portfolio Manager | ||

CFA® is a trademark owned by CFA Institute.
franklintempleton.com |
Semiannual Report |
|
7 |
| ||
FRANKLIN MUTUAL SHARES FUND
The foregoing information reflects our analysis, opinions and portfolio holdings as of June 30, 2019, the end of the reporting period. The way we implement our main investment strategies and the resulting portfolio holdings may change depending on factors such as market and economic conditions. These opinions may not be relied upon as investment advice or an offer for a particular security. The information is not a complete analysis of every aspect of any market, country, industry, security or the Fund. Statements of fact are from sources considered reliable, but the investment manager makes no representation or warranty as to their completeness or accuracy. Although historical performance is no guarantee of future results, these insights may help you understand our investment management philosophy.
| 8 | Semiannual Report | franklintempleton.com | ||
FRANKLIN MUTUAL SHARES FUND
Performance Summary as of June 30, 2019
The performance table does not reflect any taxes that a shareholder would pay on Fund dividends, capital gain distributions, if any, or any realized gains on the sale of Fund shares. Total return reflects reinvestment of the Fund’s dividends and capital gain distributions, if any, and any unrealized gains or losses. Your dividend income will vary depending on dividends or interest paid by securities in the Fund’s portfolio, adjusted for operating expenses of each class. Capital gain distributions are net profits realized from the sale of portfolio securities.
Performance as of 6/30/19
Cumulative total return excludes sales charges. Average annual total return includes maximum sales charges. Sales charges will vary depending on the size of the investment and the class of share purchased. The maximum is 5.50% and the minimum is 0%.Class A:5.50% maximum initial sales charge. For other share classes, visitfranklintempleton.com.
| Share Class | Cumulative Total Return1 | Average Annual Total Return2 | ||||||
Z | ||||||||
6-Month
|
| +13.77%
|
|
| +13.77%
|
| ||
1-Year
|
| +4.51%
|
|
| +4.51%
|
| ||
5-Year
|
| +24.81%
|
|
| +4.53%
|
| ||
10-Year
|
| +166.16%
|
|
| +10.28%
|
| ||
A3 | ||||||||
6-Month
|
| +13.63%
|
|
| +7.36%
|
| ||
1-Year
|
| +4.23%
|
|
| -1.49%
|
| ||
5-Year
|
| +23.17%
|
|
| +3.08%
|
| ||
10-Year
|
| +158.80%
|
|
| +9.36%
|
| ||
Performance data represent past performance, which does not guarantee future results. Investment return and principal value will fluctuate, and you may have a gain or loss when you sell your shares. Current performance may differ from figures shown. For most recentmonth-end performance, go tofranklintempleton.comor call(800)342-5236.
See page 10 for Performance Summary footnotes.
franklintempleton.com |
Semiannual Report |
|
9 |
| ||
FRANKLIN MUTUAL SHARES FUND
PERFORMANCE SUMMARY
Total Annual Operating Expenses4
Share Class
| ||||||||||||
Z
| 0.77% | |||||||||||
A
| 1.02% | |||||||||||
Each class of shares is available to certain eligible investors and has different annual fees and expenses, as described in the prospectus.
All investments involve risks, including possible loss of principal. Value securities may not increase in price as anticipated or may decline further in value. Special risks are associated with foreign investing, including currency fluctuations, economic instability and political developments. The Fund’s investments in companies engaged in mergers, reorganizations or liquidations also involve special risks as pending deals may not be completed on time or on favorable terms. The Fund may invest in lower rated bonds, which entail higher credit risk. The Fund is actively managed but there is no guarantee that the manager’s investment decisions will produce the desired results. The Fund’s prospectus also includes a description of the main investment risks.
1. Cumulative total return represents the change in value of an investment over the periods indicated.
2. Average annual total return represents the average annual change in value of an investment over the periods indicated. Return for less than one year, if any, has not been annualized.
3. Prior to 9/10/18, these shares were offered at a higher initial sales charge of 5.75%, thus actual returns (with sales charges) would have differed. Average annual total returns (with sales charges) have been restated to reflect the current maximum initial sales charge of 5.50%.
4. Figures are as stated in the Fund’s current prospectus and may differ from the expense ratios disclosed in the Your Fund’s Expenses and Financial Highlights sections in this report. In periods of market volatility, assets may decline significantly, causing total annual Fund operating expenses to become higher than the figures shown.
10 |
Semiannual Report |
franklintempleton.com | ||
FRANKLIN MUTUAL SHARES FUND
As a Fund shareholder, you can incur two types of costs: (1) transaction costs, including sales charges (loads) on Fund purchases and redemptions; and (2) ongoing Fund costs, including management fees, distribution and service(12b-1) fees, and other Fund expenses. All mutual funds have ongoing costs, sometimes referred to as operating expenses. The table below shows ongoing costs of investing in the Fund and can help you understand these costs and compare them with those of other mutual funds. The table assumes a $1,000 investment held for the six months indicated.
Actual Fund Expenses
The table below provides information about actual account values and actual expenses in the columns under the heading “Actual.” In these columns the Fund’s actual return, which includes the effect of Fund expenses, is used to calculate the “Ending Account Value” for each class of shares. You can estimate the expenses you paid during the period by following these steps (of course, your account value and expenses will differ from those in this illustration): Divide your account value by $1,000 (if your account had an $8,600 value, then $8,600 ÷ $1,000 = 8.6). Then multiply the result by the number in the row for your class of shares under the headings “Actual” and “Expenses Paid During Period” (if Actual Expenses Paid During Period were $7.50, then 8.6 x $7.50 = $64.50). In this illustration, the actual expenses paid this period are $64.50.
Hypothetical Example for Comparison with Other Funds
Under the heading “Hypothetical” in the table, information is provided about hypothetical account values and hypothetical expenses based on the Fund’s actual expense ratio and an assumed rate of return of 5% per year before expenses, which is not the Fund’s actual return. This information may not be used to estimate the actual ending account balance or expenses you paid for the period, but it can help you compare ongoing costs of investing in the Fund with those of other funds. To do so, compare this 5% hypothetical example for the class of shares you hold with the 5% hypothetical examples that appear in the shareholder reports of other funds.
Please note that expenses shown in the table are meant to highlight ongoing costs and do not reflect any transactional costs. Therefore, information under the heading “Hypothetical” is useful in comparing ongoing costs only, and will not help you compare total costs of owning different funds. In addition, if transactional costs were included, your total costs would have been higher.
Actual (actual return after expenses) | Hypothetical (5% annual return before expenses) | |||||||||||||||||||||||||||||||||||
| Share Class | Beginning Account Value 1/1/19 |
| Ending Account Value 6/30/19 | Expenses Paid During Period |
| Ending Account | Expenses Period |
| Net Annualized Expense Ratio2 | |||||||||||||||||||||||||||
Z | $ | 1,000 | $ | 1,137.70 | $4.13 | $ | 1,020.93 | $3.91 | 0.78% | |||||||||||||||||||||||||||
A | $ | 1,000 | $ | 1,136.30 | $5.46 | $ | 1,019.69 | $5.16 | 1.03% | |||||||||||||||||||||||||||
C | $ | 1,000 | $ | 1,132.20 | $9.41 | $ | 1,015.97 | $8.90 | 1.78% | |||||||||||||||||||||||||||
R | $ | 1,000 | $ | 1,135.10 | $6.78 | $ | 1,018.45 | $6.41 | 1.28% | |||||||||||||||||||||||||||
R6 | $ | 1,000 | $ | 1,138.30 | $3.71 | $ | 1,021.32 | $3.51 | 0.70% | |||||||||||||||||||||||||||
1. Expenses are equal to the annualized expense ratio for thesix-month period as indicated above—in the far right column—multiplied by the simple average account value over the period indicated, and then multiplied by 181/365 to reflect theone-half year period.
2. Reflects expenses after fee waivers and expense reimbursements. Does not include acquired fund fees and expenses.
franklintempleton.com |
Semiannual Report |
|
11 |
| ||
FRANKLIN MUTUAL SERIES FUNDS
Franklin Mutual Shares Fund
Six Months Ended (unaudited) | Year Ended December 31, | |||||||||||||||||||||||
| 2018 | 2017 | 2016 | 2015 | 2014 | ||||||||||||||||||||
| ||||||||||||||||||||||||
Class Z | ||||||||||||||||||||||||
| Per share operating performance (for a share outstanding throughout the period) | ||||||||||||||||||||||||
Net asset value, beginning of period | $24.25 | $28.63 | $28.22 | $26.00 | $29.52 | $28.34 | ||||||||||||||||||
|
| |||||||||||||||||||||||
| Income from investment operationsa: | ||||||||||||||||||||||||
Net investment incomeb | 0.31 | 0.51 | 0.65 | c | 0.63 | d | 0.54 | 0.78e | ||||||||||||||||
Net realized and unrealized gains (losses) | 3.03 | (3.11 | ) | 1.73 | 3.48 | (1.71 | ) | 1.38 | ||||||||||||||||
|
| |||||||||||||||||||||||
Total from investment operations | 3.34 | (2.60 | ) | 2.38 | 4.11 | (1.17 | ) | 2.16 | ||||||||||||||||
|
| |||||||||||||||||||||||
| Less distributions from: | ||||||||||||||||||||||||
Net investment income | — | (0.53 | ) | (0.68 | ) | (0.64 | ) | (0.59 | ) | (0.98) | ||||||||||||||
Net realized gains | — | (1.25 | ) | (1.29 | ) | (1.25 | ) | (1.76 | ) | — | ||||||||||||||
|
| |||||||||||||||||||||||
Total distributions | — | (1.78 | ) | (1.97 | ) | (1.89 | ) | (2.35 | ) | (0.98) | ||||||||||||||
|
| |||||||||||||||||||||||
| Net asset value, end of period | $27.59 | $24.25 | $28.63 | $28.22 | $26.00 | $29.52 | ||||||||||||||||||
|
| |||||||||||||||||||||||
Total returnf | 13.77% | (8.95)% | 8.49% | 15.88% | (3.81)% | 7.60% | ||||||||||||||||||
| Ratios to average net assetsg | ||||||||||||||||||||||||
Expensesh,i | 0.78% | j | 0.76% | j | 0.78% | 0.80% | j | 0.81%j | 0.80% | |||||||||||||||
Expenses incurred in connection with securities sold short | 0.01% | —% | k | —% | 0.01% | 0.02% | 0.03% | |||||||||||||||||
Net investment income | 2.37% | 1.77% | 2.23% | c | 2.33% | d | 1.82% | 2.67% | e | |||||||||||||||
| Supplemental data | ||||||||||||||||||||||||
Net assets, end of period (000’s) | $5,357,029 | $5,189,476 | $6,229,996 | $7,681,881 | $6,770,056 | $7,363,765 | ||||||||||||||||||
Portfolio turnover rate | 10.06% | 20.72% | 18.15% | 20.56% | 19.99% | 19.24% | ||||||||||||||||||
aThe amount shown for a share outstanding throughout the period may not correlate with the Statement of Operations for the period due to the timing of sales and repurchases of the Fund’s shares in relation to income earned and/or fluctuating fair value of the investments of the Fund.
bBased on average daily shares outstanding.
cNet investment income per share includes approximately $0.16 per share related to income received in the form of special dividends in connection with certain Fund holdings. Excluding this amount, the ratio of net investment income to average net assets would have been 1.69%.
dNet investment income per share includes approximately $0.10 per share related to income received in the form of special dividends in connection with certain Fund holdings. Excluding this amount, the ratio of net investment income to average net assets would have been 1.96%.
eNet investment income per share includes approximately $0.29 per share related to income received in the form of a special dividend in connection with certain Fund holdings. Excluding this amount, the ratio of net investment income to average net assets would have been 1.66%.
fTotal return is not annualized for periods less than one year.
gRatios are annualized for periods less than one year.
hIncludes dividend and/or interest expense on securities sold short and security borrowing fees, if any. See below for the ratios of such expenses to average net assets for the periods presented. See Note 1(e).
iBenefit of expense reduction rounds to less than 0.01%.
jBenefit of waiver and payments by affiliates rounds to less than 0.01%.
kRounds to less than 0.01%.
| 12 |
Semiannual Report | The accompanying notes are an integral part of these financial statements. | franklintempleton.com | ||
FRANKLIN MUTUAL SERIES FUNDS
FINANCIAL HIGHLIGHTS
Franklin Mutual Shares Fund(continued)
Six Months Ended (unaudited) | Year Ended December 31, | |||||||||||||||||||||||
| 2018 | 2017 | 2016 | 2015 | 2014 | ||||||||||||||||||||
| ||||||||||||||||||||||||
Class A | ||||||||||||||||||||||||
| Per share operating performance (for a share outstanding throughout the period) | ||||||||||||||||||||||||
Net asset value, beginning of period | $24.00 | $28.35 | $27.97 | $25.78 | $29.29 | $28.12 | ||||||||||||||||||
|
| |||||||||||||||||||||||
| Income from investment operationsa: | ||||||||||||||||||||||||
Net investment incomeb | 0.28 | 0.43 | 0.58 | c | 0.56 | d | 0.45 | 0.69 | e | |||||||||||||||
Net realized and unrealized gains (losses) | 2.99 | (3.07 | ) | 1.70 | 3.45 | (1.69 | ) | 1.37 | ||||||||||||||||
|
| |||||||||||||||||||||||
Total from investment operations | 3.27 | (2.64 | ) | 2.28 | 4.01 | (1.24 | ) | 2.06 | ||||||||||||||||
|
| |||||||||||||||||||||||
| Less distributions from: | ||||||||||||||||||||||||
Net investment income | — | (0.46 | ) | (0.61 | ) | (0.57 | ) | (0.51 | ) | (0.89) | ||||||||||||||
Net realized gains | — | (1.25 | ) | (1.29 | ) | (1.25 | ) | (1.76 | ) | — | ||||||||||||||
|
| |||||||||||||||||||||||
Total distributions | — | (1.71 | ) | (1.90 | ) | (1.82 | ) | (2.27 | ) | (0.89) | ||||||||||||||
|
| |||||||||||||||||||||||
| Net asset value, end of period | $27.27 | $24.00 | $28.35 | $27.97 | $25.78 | $29.29 | ||||||||||||||||||
|
| |||||||||||||||||||||||
Total returnf | 13.63% | (9.18)% | 8.21% | 15.61% | (4.10)% | 7.30% | ||||||||||||||||||
| Ratios to average net assetsg | ||||||||||||||||||||||||
Expensesh,i | 1.03% | j | 1.01% | j | 1.03% | 1.05% | j | 1.09%j | 1.10% | |||||||||||||||
Expenses incurred in connection with securities sold short | 0.01% | —% | k | —% | 0.01% | 0.02% | 0.03% | |||||||||||||||||
Net investment income | 2.12% | 1.52% | 1.98%c | 2.08% | d | 1.54% | 2.37% | e | ||||||||||||||||
| Supplemental data | ||||||||||||||||||||||||
Net assets, end of period (000’s) | $4,128,726 | $3,852,134 | $4,386,829 | $4,737,576 | $4,819,868 | $5,392,130 | ||||||||||||||||||
Portfolio turnover rate | 10.06% | 20.72% | 18.15% | 20.56% | 19.99% | 19.24% | ||||||||||||||||||
aThe amount shown for a share outstanding throughout the period may not correlate with the Statement of Operations for the period due to the timing of sales and repurchases of the Fund’s shares in relation to income earned and/or fluctuating fair value of the investments of the Fund.
bBased on average daily shares outstanding.
cNet investment income per share includes approximately $0.16 per share related to income received in the form of special dividends in connection with certain Fund holdings. Excluding this amount, the ratio of net investment income to average net assets would have been 1.44%.
dNet investment income per share includes approximately $0.10 per share related to income received in the form of special dividends in connection with certain Fund holdings. Excluding this amount, the ratio of net investment income to average net assets would have been 1.71%.
eNet investment income per share includes approximately $0.29 per share related to income received in the form of a special dividend in connection with certain Fund holdings. Excluding this amount, the ratio of net investment income to average net assets would have been 1.36%.
fTotal return does not reflect sales commissions or contingent deferred sales charges, if applicable, and is not annualized for periods less than one year.
gRatios are annualized for periods less than one year.
hIncludes dividend and/or interest expense on securities sold short and security borrowing fees, if any. See below for the ratios of such expenses to average net assets for the periods presented. See Note 1(e).
iBenefit of expense reduction rounds to less than 0.01%.
jBenefit of waiver and payments by affiliates rounds to less than 0.01%.
kRounds to less than 0.01%.
| franklintempleton.com | The accompanying notes are an integral part of these financial statements. | Semiannual Report | 13 | ||||
FRANKLIN MUTUAL SERIES FUNDS
FINANCIAL HIGHLIGHTS
Franklin Mutual Shares Fund(continued)
Six Months Ended (unaudited) | Year Ended December 31, | |||||||||||||||||||||||
| 2018 | 2017 | 2016 | 2015 | 2014 | ||||||||||||||||||||
| ||||||||||||||||||||||||
Class C | ||||||||||||||||||||||||
| Per share operating performance (for a share outstanding throughout the period) | ||||||||||||||||||||||||
Net asset value, beginning of period | $23.97 | $28.04 | $27.68 | $25.54 | $29.02 | $27.88 | ||||||||||||||||||
|
| |||||||||||||||||||||||
| Income from investment operationsa: | ||||||||||||||||||||||||
Net investment incomeb | 0.18 | 0.21 | 0.35 | c | 0.35 | d | 0.24 | 0.48 | e | |||||||||||||||
Net realized and unrealized gains (losses) | 2.99 | (3.00 | ) | 1.67 | 3.40 | (1.67 | ) | 1.34 | ||||||||||||||||
|
| |||||||||||||||||||||||
Total from investment operations | 3.17 | (2.79 | ) | 2.02 | 3.75 | (1.43 | ) | 1.82 | ||||||||||||||||
|
| |||||||||||||||||||||||
| Less distributions from: | ||||||||||||||||||||||||
Net investment income | — | (0.03 | ) | (0.37 | ) | (0.36 | ) | (0.29 | ) | (0.68) | ||||||||||||||
Net realized gains | — | (1.25 | ) | (1.29 | ) | (1.25 | ) | (1.76 | ) | — | ||||||||||||||
|
| |||||||||||||||||||||||
Total distributions | — | (1.28 | ) | (1.66 | ) | (1.61 | ) | (2.05 | ) | (0.68) | ||||||||||||||
|
| |||||||||||||||||||||||
| Net asset value, end of period | $27.14 | $23.97 | $28.04 | $27.68 | $25.54 | $29.02 | ||||||||||||||||||
|
| |||||||||||||||||||||||
Total returnf | 13.22% | (9.87)% | 7.37% | 14.77% | (4.79)% | 6.56% | ||||||||||||||||||
| Ratios to average net assetsg | ||||||||||||||||||||||||
Expensesh,i | 1.78% | j | 1.76% | j | 1.78% | 1.80% | j | 1.81% | j | 1.80% | ||||||||||||||
Expenses incurred in connection with securities sold short | 0.01% | —% | k | —% | 0.01% | 0.02% | 0.03% | |||||||||||||||||
Net investment income | 1.37% | 0.77% | 1.23% | c | 1.33% | d | 0.82% | 1.67% | e | |||||||||||||||
| Supplemental data | ||||||||||||||||||||||||
Net assets, end of period (000’s) | $311,307 | $309,756 | $995,665 | $1,114,760 | $1,101,302 | $1,240,845 | ||||||||||||||||||
Portfolio turnover rate | 10.06% | 20.72% | 18.15% | 20.56% | 19.99% | 19.24% | ||||||||||||||||||
aThe amount shown for a share outstanding throughout the period may not correlate with the Statement of Operations for the period due to the timing of sales and repurchases of the Fund’s shares in relation to income earned and/or fluctuating fair value of the investments of the Fund.
bBased on average daily shares outstanding.
cNet investment income per share includes approximately $0.16 per share related to income received in the form of special dividends in connection with certain Fund holdings. Excluding this amount, the ratio of net investment income to average net assets would have been 0.69%.
dNet investment income per share includes approximately $0.10 per share related to income received in the form of special dividends in connection with certain Fund holdings. Excluding this amount, the ratio of net investment income to average net assets would have been 0.96%.
eNet investment income per share includes approximately $0.29 per share related to income received in the form of a special dividend in connection with certain Fund holdings. Excluding this amount, the ratio of net investment income to average net assets would have been 0.66%.
fTotal return does not reflect sales commissions or contingent deferred sales charges, if applicable, and is not annualized for periods less than one year.
gRatios are annualized for periods less than one year.
hIncludes dividend and/or interest expense on securities sold short and security borrowing fees, if any. See below for the ratios of such expenses to average net assets for the periods presented. See Note 1(e).
iBenefit of expense reduction rounds to less than 0.01%.
jBenefit of waiver and payments by affiliates rounds to less than 0.01%.
kRounds to less than 0.01%.
| 14 |
Semiannual Report | The accompanying notes are an integral part of these financial statements. | franklintempleton.com | ||
FRANKLIN MUTUAL SERIES FUNDS
FINANCIAL HIGHLIGHTS
Franklin Mutual Shares Fund(continued)
Six Months Ended (unaudited) | Year Ended December 31, | |||||||||||||||||||||||
| 2018 | 2017 | 2016 | 2015 | 2014 | ||||||||||||||||||||
| ||||||||||||||||||||||||
Class R | ||||||||||||||||||||||||
| Per share operating performance (for a share outstanding throughout the period) | ||||||||||||||||||||||||
Net asset value, beginning of period | $23.91 | $28.21 | $27.83 | $25.66 | $29.14 | $27.98 | ||||||||||||||||||
|
| |||||||||||||||||||||||
| Income from investment operationsa: | ||||||||||||||||||||||||
Net investment incomeb | 0.24 | 0.36 | 0.50 | c | 0.49 | d | 0.38 | 0.64 | e | |||||||||||||||
Net realized and unrealized gains (losses) | 2.99 | (3.05 | ) | 1.70 | 3.42 | (1.67 | ) | 1.34 | ||||||||||||||||
|
| |||||||||||||||||||||||
Total from investment operations | 3.23 | (2.69 | ) | 2.20 | 3.91 | (1.29 | ) | 1.98 | ||||||||||||||||
|
| |||||||||||||||||||||||
| Less distributions from: | ||||||||||||||||||||||||
Net investment income | — | (0.36 | ) | (0.53 | ) | (0.49 | ) | (0.43 | ) | (0.82) | ||||||||||||||
Net realized gains | — | (1.25 | ) | (1.29 | ) | (1.25 | ) | (1.76 | ) | — | ||||||||||||||
|
| |||||||||||||||||||||||
Total distributions | — | (1.61 | ) | (1.82 | ) | (1.74 | ) | (2.19 | ) | (0.82) | ||||||||||||||
|
| |||||||||||||||||||||||
| Net asset value, end of period | $27.14 | $23.91 | $28.21 | $27.83 | $25.66 | $29.14 | ||||||||||||||||||
|
| |||||||||||||||||||||||
Total returnf | 13.51% | (9.41)% | 7.96% | 15.31% | (4.32)% | 7.10% | ||||||||||||||||||
| Ratios to average net assetsg | ||||||||||||||||||||||||
Expensesh,i | 1.28%j | 1.26% | j | 1.28% | 1.30% | j | 1.31% | j | 1.30% | |||||||||||||||
Expenses incurred in connection with securities sold short | 0.01% | —% | k | —% | 0.01% | 0.02% | 0.03% | |||||||||||||||||
Net investment income | 1.87% | 1.27% | 1.73% | c | 1.83% | d | 1.32% | 2.17% | e | |||||||||||||||
| Supplemental data | ||||||||||||||||||||||||
Net assets, end of period (000’s) | $79,980 | $74,345 | $107,660 | $123,013 | $134,050 | $172,938 | ||||||||||||||||||
Portfolio turnover rate | 10.06% | 20.72% | 18.15% | 20.56% | 19.99% | 19.24% | ||||||||||||||||||
aThe amount shown for a share outstanding throughout the period may not correlate with the Statement of Operations for the period due to the timing of sales and repurchases of the Fund’s shares in relation to income earned and/or fluctuating fair value of the investments of the Fund.
bBased on average daily shares outstanding.
cNet investment income per share includes approximately $0.16 per share related to income received in the form of special dividends in connection with certain Fund holdings. Excluding this amount, the ratio of net investment income to average net assets would have been 1.19%.
dNet investment income per share includes approximately $0.10 per share related to income received in the form of special dividends in connection with certain Fund holdings. Excluding this amount, the ratio of net investment income to average net assets would have been 1.46%.
eNet investment income per share includes approximately $0.29 per share related to income received in the form of a special dividend in connection with certain Fund holdings. Excluding this amount, the ratio of net investment income to average net assets would have been 1.16%.
fTotal return is not annualized for periods less than one year.
gRatios are annualized for periods less than one year.
hIncludes dividend and/or interest expense on securities sold short and security borrowing fees, if any. See below for the ratios of such expenses to average net assets for the periods presented. See Note 1(e).
iBenefit of expense reduction rounds to less than 0.01%.
jBenefit of waiver and payments by affiliates rounds to less than 0.01%.
kRounds to less than 0.01%.
| franklintempleton.com |
The accompanying notes are an integral part of these financial statements. | Semiannual Report | 15 | ||||
FRANKLIN MUTUAL SERIES FUNDS
FINANCIAL HIGHLIGHTS
Franklin Mutual Shares Fund(continued)
Six Months Ended (unaudited) | Year Ended December 31, | |||||||||||||||||||||||
| 2018 | 2017 | 2016 | 2015 | 2014 | ||||||||||||||||||||
| ||||||||||||||||||||||||
Class R6 | ||||||||||||||||||||||||
| Per share operating performance (for a share outstanding throughout the period) | ||||||||||||||||||||||||
Net asset value, beginning of period | $24.23 | $28.61 | $28.21 | $25.98 | $29.51 | $28.33 | ||||||||||||||||||
|
| |||||||||||||||||||||||
| Income from investment operationsa: | ||||||||||||||||||||||||
Net investment incomeb | 0.32 | 0.53 | 0.70 | c | 0.66 | d | 0.57 | 0.82e | ||||||||||||||||
Net realized and unrealized gains (losses) | 3.03 | (3.11 | ) | 1.71 | 3.49 | (1.71 | ) | 1.37 | ||||||||||||||||
|
| |||||||||||||||||||||||
Total from investment operations | 3.35 | (2.58 | ) | 2.41 | 4.15 | (1.14 | ) | 2.19 | ||||||||||||||||
|
| |||||||||||||||||||||||
| Less distributions from: | ||||||||||||||||||||||||
Net investment income | — | (0.55 | ) | (0.72 | ) | (0.67 | ) | (0.63 | ) | (1.01) | ||||||||||||||
Net realized gains | — | (1.25 | ) | (1.29 | ) | (1.25 | ) | (1.76 | ) | — | ||||||||||||||
|
| |||||||||||||||||||||||
Total distributions | — | (1.80 | ) | (2.01 | ) | (1.92 | ) | (2.39 | ) | (1.01) | ||||||||||||||
|
| |||||||||||||||||||||||
| Net asset value, end of period | $27.58 | $24.23 | $28.61 | $28.21 | $25.98 | $29.51 | ||||||||||||||||||
|
| |||||||||||||||||||||||
Total returnf | 13.83% | (8.88)% | 8.61% | 16.05% | (3.71)% | 7.72% | ||||||||||||||||||
| Ratios to average net assetsg | ||||||||||||||||||||||||
Expensesh,i | 0.70% | j | 0.69% | j | 0.67% | 0.68%j | 0.69% | j | 0.69% | |||||||||||||||
Expenses incurred in connection with securities sold short | 0.01% | —% | k | —% | 0.01% | 0.02% | 0.03% | |||||||||||||||||
Net investment income | 2.45% | 1.84% | 2.34% | c | 2.45% | d | 1.94% | 2.78%e | ||||||||||||||||
| Supplemental data | ||||||||||||||||||||||||
Net assets, end of period (000’s) | $3,352,932 | $3,160,186 | $3,741,430 | $1,896,497 | $1,923,466 | $2,249,991 | ||||||||||||||||||
Portfolio turnover rate | 10.06% | 20.72% | 18.15% | 20.56% | 19.99% | 19.24% | ||||||||||||||||||
aThe amount shown for a share outstanding throughout the period may not correlate with the Statement of Operations for the period due to the timing of sales and repurchases of the Fund’s shares in relation to income earned and/or fluctuating fair value of the investments of the Fund.
bBased on average daily shares outstanding.
cNet investment income per share includes approximately $0.16 per share related to income received in the form of special dividends in connection with certain Fund holdings. Excluding this amount, the ratio of net investment income to average net assets would have been 1.80%.
dNet investment income per share includes approximately $0.10 per share related to income received in the form of special dividends in connection with certain Fund holdings. Excluding this amount, the ratio of net investment income to average net assets would have been 2.08%.
eNet investment income per share includes approximately $0.29 per share related to income received in the form of a special dividend in connection with certain Fund holdings. Excluding this amount, the ratio of net investment income to average net assets would have been 1.77%.
fTotal return is not annualized for periods less than one year.
gRatios are annualized for periods less than one year.
hIncludes dividend and/or interest expense on securities sold short and security borrowing fees, if any. See below for the ratios of such expenses to average net assets for the periods presented. See Note 1(e).
iBenefit of expense reduction rounds to less than 0.01%.
jBenefit of waiver and payments by affiliates rounds to less than 0.01%.
kRounds to less than 0.01%.
| 16 |
Semiannual Report | The accompanying notes are an integral part of these financial statements. | franklintempleton.com | ||
FRANKLIN MUTUAL SERIES FUNDS
Statement of Investments, June 30, 2019 (unaudited)
Franklin Mutual Shares Fund
| Country | Shares/ Units/ Warrants | Value | ||||||||||||||
Common Stocks and Other Equity Interests 90.6% |
| |||||||||||||||
| Aerospace & Defense 1.8% | ||||||||||||||||
BAE Systems PLC | United Kingdom | 18,114,621 | $ | 113,965,097 | ||||||||||||
Huntington Ingalls Industries Inc. | United States | 557,981 | 125,400,650 | |||||||||||||
|
| |||||||||||||||
|
239,365,747 |
| ||||||||||||||
|
| |||||||||||||||
| Auto Components 0.1% | ||||||||||||||||
The Goodyear Tire & Rubber Co. | United States | 1,184,447 | 18,122,039 | |||||||||||||
| a,b,c,d | International Automotive Components Group Brazil LLC | Brazil | 7,234,813 | 185,776 | ||||||||||||
|
| |||||||||||||||
|
18,307,815 |
| ||||||||||||||
|
| |||||||||||||||
| Automobiles 1.3% | ||||||||||||||||
General Motors Co. | United States | 4,507,470 | 173,672,819 | |||||||||||||
|
| |||||||||||||||
| Banks 10.6% | ||||||||||||||||
Barclays PLC | United Kingdom | 38,190,870 | 72,653,740 | |||||||||||||
Cadence Bancorp | United States | 1,864,557 | 38,782,786 | |||||||||||||
CIT Group Inc. | United States | 2,759,673 | 144,993,219 | |||||||||||||
Citigroup Inc. | United States | 3,576,406 | 250,455,712 | |||||||||||||
Citizens Financial Group Inc. | United States | 6,757,671 | 238,951,247 | |||||||||||||
Columbia Banking System Inc. | United States | 88,096 | 3,187,313 | |||||||||||||
Independent Bank Group Inc. | United States | 515,864 | 28,351,885 | |||||||||||||
JPMorgan Chase & Co. | United States | 2,871,890 | 321,077,302 | |||||||||||||
Synovus Financial Corp. | United States | 1,738,186 | 60,744,179 | |||||||||||||
Wells Fargo & Co. | United States | 5,171,930 | 244,735,728 | |||||||||||||
|
| |||||||||||||||
|
1,403,933,111 |
| ||||||||||||||
|
| |||||||||||||||
| Biotechnology 1.1% | ||||||||||||||||
| a | Celgene Corp. | United States | 1,590,143 | 146,992,819 | ||||||||||||
|
| |||||||||||||||
| Building Products 1.5% | ||||||||||||||||
Johnson Controls International PLC | United States | 4,783,800 | 197,618,778 | |||||||||||||
|
| |||||||||||||||
| Chemicals 0.1% | ||||||||||||||||
| a,c,e | Dow Corning Corp. (Revolver/Term Loan Claims), Contingent Distribution | United States | 11,630,547 | 6,204,374 | ||||||||||||
| a,c,e | Dow Corning Corp. (Swap Agreement Claims), Contingent Distribution | United States | 1,000,000 | 20,786 | ||||||||||||
|
| |||||||||||||||
|
6,225,160 |
| ||||||||||||||
|
| |||||||||||||||
| Communications Equipment 1.1% | ||||||||||||||||
Cisco Systems Inc. | United States | 2,588,110 | 141,647,260 | |||||||||||||
|
| |||||||||||||||
| Construction & Engineering 0.6% | ||||||||||||||||
Fluor Corp. | United States | 2,399,827 | 80,850,172 | |||||||||||||
|
| |||||||||||||||
| Consumer Finance 1.6% | ||||||||||||||||
Ally Financial Inc. | United States | 1,008,976 | 31,268,166 | |||||||||||||
Capital One Financial Corp. | United States | 2,011,505 | 182,523,964 | |||||||||||||
|
| |||||||||||||||
|
213,792,130 |
| ||||||||||||||
|
| |||||||||||||||
| Containers & Packaging 1.5% | ||||||||||||||||
International Paper Co. | United States | 3,741,837 | 162,096,379 | |||||||||||||
WestRock Co. | United States | 1,125,212 | 41,036,481 | |||||||||||||
|
| |||||||||||||||
|
203,132,860 |
| ||||||||||||||
|
| |||||||||||||||
| franklintempleton.com | Semiannual Report | 17 | ||||
FRANKLIN MUTUAL SERIES FUNDS
STATEMENT OF INVESTMENTS (UNAUDITED)
Franklin Mutual Shares Fund(continued)
| Country | Shares/ Units/ Warrants | Value | ||||||||||||||
Common Stocks and Other Equity Interests(continued) |
| |||||||||||||||
| Diversified Financial Services 1.4% | ||||||||||||||||
Voya Financial Inc. | United States | 3,413,030 | $ | 188,740,559 | ||||||||||||
|
| |||||||||||||||
| Diversified Telecommunication Services 0.7% | ||||||||||||||||
Koninklijke KPN NV | Netherlands | 30,410,640 | 93,345,310 | |||||||||||||
|
| |||||||||||||||
| Electrical Equipment 1.6% | ||||||||||||||||
| a | Sensata Technologies Holding PLC | United States | 4,363,870 | 213,829,630 | ||||||||||||
|
| |||||||||||||||
| Electronic Equipment, Instruments & Components 0.5% | ||||||||||||||||
Corning Inc. | United States | 2,006,414 | 66,673,137 | |||||||||||||
|
| |||||||||||||||
| Energy Equipment & Services 1.3% | ||||||||||||||||
Baker Hughes a GE Co., A | United States | 5,908,552 | 145,527,636 | |||||||||||||
| a | McDermott International Inc. | United States | 2,645,956 | 25,559,935 | ||||||||||||
|
| |||||||||||||||
|
171,087,571 |
| ||||||||||||||
|
| |||||||||||||||
| Entertainment 2.9% | ||||||||||||||||
The Walt Disney Co. | United States | 2,716,200 | 379,290,168 | |||||||||||||
|
| |||||||||||||||
| Equity Real Estate Investment Trusts (REITs) 1.8% | ||||||||||||||||
| b | Alexander’s Inc. | United States | 299,604 | 110,943,361 | ||||||||||||
Vornado Realty Trust | United States | 2,036,522 | 130,541,060 | |||||||||||||
|
| |||||||||||||||
|
241,484,421 |
| ||||||||||||||
|
| |||||||||||||||
| Food & Staples Retailing 2.2% | ||||||||||||||||
The Kroger Co. | United States | 7,402,986 | 160,718,826 | |||||||||||||
Walgreens Boots Alliance Inc. | United States | 2,446,029 | 133,724,405 | |||||||||||||
|
| |||||||||||||||
|
294,443,231 |
| ||||||||||||||
|
| |||||||||||||||
| Food Products 1.6% | ||||||||||||||||
Archer-Daniels-Midland Co. | United States | 1,639,797 | 66,903,718 | |||||||||||||
The Kraft Heinz Co. | United States | 4,507,800 | 139,922,112 | |||||||||||||
|
| |||||||||||||||
|
206,825,830 |
| ||||||||||||||
|
| |||||||||||||||
| Health Care Equipment & Supplies 3.8% | ||||||||||||||||
Medtronic PLC | United States | 5,180,794 | 504,557,528 | |||||||||||||
|
| |||||||||||||||
| Health Care Providers & Services 1.2% | ||||||||||||||||
CVS Health Corp. | United States | 3,015,915 | 164,337,208 | |||||||||||||
|
| |||||||||||||||
| Household Durables 2.6% | ||||||||||||||||
Lennar Corp., A | United States | 2,378,700 | 115,271,802 | |||||||||||||
Newell Brands Inc. | United States | 9,867,795 | 152,161,399 | |||||||||||||
Toll Brothers Inc. | United States | 1,993,600 | 73,005,632 | |||||||||||||
|
| |||||||||||||||
|
340,438,833 |
| ||||||||||||||
|
| |||||||||||||||
| Household Products 0.5% | ||||||||||||||||
Energizer Holdings Inc. | United States | 1,787,933 | 69,085,731 | |||||||||||||
|
| |||||||||||||||
| Independent Power & Renewable Electricity Producers 0.5% | ||||||||||||||||
Vistra Energy Corp. | United States | 3,124,828 | 70,746,106 | |||||||||||||
|
| |||||||||||||||
| Industrial Conglomerates 1.1% | ||||||||||||||||
General Electric Co. | United States | 13,594,500 | 142,742,250 | |||||||||||||
|
| |||||||||||||||
| 18 | Semiannual Report | franklintempleton.com | ||
FRANKLIN MUTUAL SERIES FUNDS
STATEMENT OF INVESTMENTS (UNAUDITED)
Franklin Mutual Shares Fund(continued)
| Country | Shares/ Units/ Warrants | Value | ||||||||||||||
Common Stocks and Other Equity Interests(continued) |
| |||||||||||||||
| Insurance 8.3% | ||||||||||||||||
| a | Alleghany Corp. | United States | 377,389 | $ | 257,043,422 | |||||||||||
American International Group Inc. | United States | 5,664,539 | 301,806,638 | |||||||||||||
| a | Brighthouse Financial Inc. | United States | 726,194 | 26,644,058 | ||||||||||||
Chubb Ltd. | United States | 1,084,658 | 159,759,277 | |||||||||||||
The Hartford Financial Services Group Inc. | United States | 3,734,899 | 208,108,572 | |||||||||||||
MetLife Inc. | United States | 2,841,530 | 141,138,795 | |||||||||||||
|
| |||||||||||||||
|
1,094,500,762 |
| ||||||||||||||
|
| |||||||||||||||
| IT Services 1.6% | ||||||||||||||||
Cognizant Technology Solutions Corp., A | United States | 3,320,050 | 210,457,969 | |||||||||||||
|
| |||||||||||||||
| Machinery 0.8% | ||||||||||||||||
CNH Industrial NV | United Kingdom | 4,351,332 | 44,610,350 | |||||||||||||
CNH Industrial NV, special voting | United Kingdom | 5,296,616 | 54,301,508 | |||||||||||||
|
| |||||||||||||||
|
98,911,858 |
| ||||||||||||||
|
| |||||||||||||||
| Media 6.5% | ||||||||||||||||
| a | Charter Communications Inc., A | United States | 865,529 | 342,039,750 | ||||||||||||
| a | Clear Channel Outdoor Holdings Inc. | United States | 4,530,372 | 21,383,356 | ||||||||||||
Comcast Corp., A | United States | 5,111,400 | 216,109,992 | |||||||||||||
| a | Cumulus Media Inc., A | United States | 134,131 | 2,488,130 | ||||||||||||
| a | Cumulus Media Inc., B | United States | 199,632 | 3,703,174 | ||||||||||||
| a | Cumulus Media Inc., wts., 6/04/38 | United States | 171,135 | 2,780,944 | ||||||||||||
| a | Discovery Inc., C | United States | 4,772,200 | 135,769,090 | ||||||||||||
| a | DISH Network Corp., A | United States | 2,879,437 | 110,599,175 | ||||||||||||
| a,c,d | iHeartMedia Inc., A | United States | 2,086,072 | 30,279,932 | ||||||||||||
| a,c,d | iHeartMedia Inc., B | United States | 35,201 | 510,952 | ||||||||||||
| a,c,d | iHeartMedia Inc., wts., A, 5/01/39 | United States | 1,786 | 25,922 | ||||||||||||
|
| |||||||||||||||
|
865,690,417 |
| ||||||||||||||
|
| |||||||||||||||
| Metals & Mining 0.0%† | ||||||||||||||||
Warrior Met Coal Inc. | United States | 68,967 | 1,801,418 | |||||||||||||
|
| |||||||||||||||
| Oil, Gas & Consumable Fuels 10.0% | ||||||||||||||||
Anadarko Petroleum Corp. | United States | 3,198,080 | 225,656,525 | |||||||||||||
BP PLC | United Kingdom | 14,266,349 | 99,392,876 | |||||||||||||
Kinder Morgan Inc. | United States | 11,533,040 | 240,809,875 | |||||||||||||
Marathon Oil Corp. | United States | 10,959,685 | 155,737,124 | |||||||||||||
Occidental Petroleum Corp. | United States | 1,183,200 | 59,491,296 | |||||||||||||
Plains All American Pipeline LP | United States | 3,862,400 | 94,049,440 | |||||||||||||
Royal Dutch Shell PLC, A (EUR Traded) | United Kingdom | 4,955,823 | 161,752,930 | |||||||||||||
Royal Dutch Shell PLC, A (GBP Traded) | United Kingdom | 3,159,359 | 103,214,561 | |||||||||||||
The Williams Cos. Inc. | United States | 6,351,184 | 178,087,199 | |||||||||||||
|
| |||||||||||||||
|
1,318,191,826 |
| ||||||||||||||
|
| |||||||||||||||
| Pharmaceuticals 7.1% | ||||||||||||||||
Eli Lilly & Co. | United States | 1,561,543 | 173,003,349 | |||||||||||||
GlaxoSmithKline PLC | United Kingdom | 11,675,992 | 233,777,075 | |||||||||||||
Merck & Co. Inc. | United States | 2,133,471 | 178,891,543 | |||||||||||||
| franklintempleton.com | Semiannual Report | 19 | ||||
FRANKLIN MUTUAL SERIES FUNDS
STATEMENT OF INVESTMENTS (UNAUDITED)
Franklin Mutual Shares Fund(continued)
| Country | Shares/ Units/ Warrants | Value | ||||||||||||||
Common Stocks and Other Equity Interests(continued) |
| |||||||||||||||
| Pharmaceuticals(continued) | ||||||||||||||||
Novartis AG, ADR | Switzerland | 3,798,680 | $ | 346,857,471 | ||||||||||||
|
| |||||||||||||||
|
932,529,438 |
| ||||||||||||||
|
| |||||||||||||||
| Software 2.6% | ||||||||||||||||
| a | Avaya Holdings Corp., wts., 12/15/22 | United States | 276,741 | 276,741 | ||||||||||||
| a | Red Hat Inc. | United States | 747,300 | 140,313,048 | ||||||||||||
Symantec Corp. | United States | 9,445,251 | 205,528,662 | |||||||||||||
|
| |||||||||||||||
|
346,118,451 |
| ||||||||||||||
|
| |||||||||||||||
| Specialty Retail 0.2% | ||||||||||||||||
| a,b,c | TRU Kids Parent LLC | United States | 7,469 | 27,261,772 | ||||||||||||
|
| |||||||||||||||
| Technology Hardware, Storage & Peripherals 3.5% | ||||||||||||||||
Hewlett Packard Enterprise Co. | United States | 7,491,354 | 111,995,742 | |||||||||||||
Samsung Electronics Co. Ltd. | South Korea | 5,521,050 | 224,289,376 | |||||||||||||
| a,b,c | Wayne Services Legacy Inc. | United States | 7,469 | 2,612,332 | ||||||||||||
Western Digital Corp. | United States | 2,716,857 | 129,186,550 | |||||||||||||
|
| |||||||||||||||
|
468,084,000 |
| ||||||||||||||
|
| |||||||||||||||
| Textiles, Apparel & Luxury Goods 1.1% | ||||||||||||||||
PVH Corp. | United States | 1,494,300 | 141,420,552 | |||||||||||||
|
| |||||||||||||||
| Tobacco 2.8% | ||||||||||||||||
Altria Group Inc. | United States | 2,351,460 | 111,341,631 | |||||||||||||
British American Tobacco PLC | United Kingdom | 4,377,848 | 152,834,721 | |||||||||||||
British American Tobacco PLC, ADR | United Kingdom | 1,655,688 | 57,733,841 | |||||||||||||
Imperial Brands PLC | United Kingdom | 1,751,865 | 41,087,254 | |||||||||||||
|
| |||||||||||||||
|
362,997,447 |
| ||||||||||||||
|
| |||||||||||||||
| Wireless Telecommunication Services 1.1% | ||||||||||||||||
| a | T-Mobile U.S. Inc. | United States | 2,007,091 | 148,805,727 | ||||||||||||
|
| |||||||||||||||
Total Common Stocks and Other Equity Interests | 11,989,937,821 | |||||||||||||||
|
| |||||||||||||||
|
| Principal Amount
|
| ||||||||||||||
|
| |||||||||||||||
| Corporate Notes and Senior Floating Rate Interests 3.5% | ||||||||||||||||
| f | Banff Merger Sub Inc., senior note, 144A, 9.75%, 9/01/26 | United States | $ | 68,188,000 | 59,494,030 | |||||||||||
Frontier Communications Corp., | ||||||||||||||||
senior note, 10.50%, 9/15/22 | United States | 82,365,000 | 56,214,112 | |||||||||||||
senior note, 11.00%, 9/15/25 | United States | 93,006,000 | 58,128,750 | |||||||||||||
fsenior secured note, first lien, 144A, 8.00%, 4/01/27 | United States | 22,878,000 | 23,850,315 | |||||||||||||
| f | McDermott Technology Americas Inc., senior note, 144A, 10.625%, 5/01/24 | United States | 36,543,000 | 34,259,062 | ||||||||||||
| g,h | Veritas U.S. Inc., | |||||||||||||||
Term Loan B1, 6.902%,(1-month USD LIBOR + 4.50%), 1/27/23 | United States | 55,788,393 | 50,767,438 | |||||||||||||
Term Loan B1, 6.83%,(3-month USD LIBOR + 4.50%), 1/27/23 | United States | 11,073,404 | 10,076,798 | |||||||||||||
| f | Veritas U.S. Inc./Veritas Bermuda Ltd., | |||||||||||||||
senior note, 144A, 7.50%, 2/01/23 | United States | 10,656,000 | 10,016,640 | |||||||||||||
senior note, 144A, 10.50%, 2/01/24 | United States | 87,705,000 | 75,426,300 | |||||||||||||
| 20 | Semiannual Report | franklintempleton.com | ||
FRANKLIN MUTUAL SERIES FUNDS
STATEMENT OF INVESTMENTS (UNAUDITED)
Franklin Mutual Shares Fund(continued)
| Country | Principal Amount | Value | ||||||||||||||
Corporate Notes and Senior Floating Rate Interests(continued) |
| |||||||||||||||
| g,h,i | Windstream Services LLC, | |||||||||||||||
jRevolving Commitment, 8.50%, (Prime + 3.00%), 4/24/20 | United States | $ | 66,297,554 | $ | 66,660,202 | |||||||||||
kTerm Loan B6, TBD, 3/30/21 | United States | 14,465,000 | 14,917,031 | |||||||||||||
|
| |||||||||||||||
Total Corporate Notes and Senior Floating Rate Interests | 459,810,678 | |||||||||||||||
|
| |||||||||||||||
Corporate Bonds and Notes in Reorganization 0.1% | ||||||||||||||||
| c,d,l | Broadband Ventures III LLC, secured promissory note, 5.00%, 2/01/12 | United States | 19,594 | — | ||||||||||||
| l | Pacific Gas & Electric Co., | |||||||||||||||
senior bond, 4.45%, 4/15/42 | United States | 3,947,000 | 3,798,988 | |||||||||||||
senior bond, 3.75%, 8/15/42 | United States | 6,225,000 | 5,664,750 | |||||||||||||
senior bond, 4.00%, 12/01/46 | United States | 6,835,000 | 6,236,937 | |||||||||||||
senior bond, 3.95%, 12/01/47 | United States | 3,273,000 | 2,957,974 | |||||||||||||
|
| |||||||||||||||
Total Corporate Bonds and Notes in Reorganization | 18,658,649 | |||||||||||||||
|
| |||||||||||||||
|
| Shares
|
| ||||||||||||||
|
| |||||||||||||||
| Companies in Liquidation 0.0%† | ||||||||||||||||
| a,c,e | Avaya Holdings Corp., Contingent Distribution | United States | 67,859,000 | — | ||||||||||||
| a,c,e | Avaya Inc., Contingent Distribution | United States | 131,491,379 | — | ||||||||||||
| a,c,e | Clear Channel Communications Inc., Contingent Distribution | United States | 74,295,000 | — | ||||||||||||
| a,c,e | iHeartCommunications Inc., Contingent Distribution | United States | 125,033,338 | — | ||||||||||||
| a,c,e | Tribune Media, Litigation Trust, Contingent Distribution | United States | 1,007,002 | — | ||||||||||||
| a,e | Vistra Energy Corp., Litigation Trust, Contingent Distribution | United States | 194,177,556 | 291,266 | ||||||||||||
|
| |||||||||||||||
Total Companies in Liquidation (Cost $6,075,215) | 291,266 | |||||||||||||||
|
| |||||||||||||||
Total Investments before Short Term Investments | 12,468,698,414 | |||||||||||||||
|
| |||||||||||||||
|
| Principal Amount
|
| ||||||||||||||
|
| |||||||||||||||
Short Term Investments 5.1% | ||||||||||||||||
U.S. Government and Agency Securities 5.1% | ||||||||||||||||
| m | FHLB, 7/01/19 | United States | $ | 115,700,000 | 115,700,000 | |||||||||||
| m | U.S. Treasury Bill, | |||||||||||||||
7/02/19 - 10/17/19 | United States | 508,300,000 | 507,112,672 | |||||||||||||
n10/24/19 - 10/31/19 | United States | 50,000,000 | 49,671,960 | |||||||||||||
|
| |||||||||||||||
Total U.S. Government and Agency Securities | 672,484,632 | |||||||||||||||
|
| |||||||||||||||
| Total Investments (Cost $10,612,583,488) 99.3% | 13,141,183,046 | |||||||||||||||
| Securities Sold Short (0.3)% | (33,713,190 | ) | ||||||||||||||
| Other Assets, less Liabilities 1.0% | 122,504,554 | |||||||||||||||
|
| |||||||||||||||
| Net Assets 100.0% |
$ |
13,229,974,410 |
| |||||||||||||
|
| |||||||||||||||
| franklintempleton.com | Semiannual Report | 21 | ||||
FRANKLIN MUTUAL SERIES FUNDS
STATEMENT OF INVESTMENTS (UNAUDITED)
Franklin Mutual Shares Fund(continued) | ||||||||||||||
| Country | Shares | Value | ||||||||||||
| oSecurities Sold Short (Proceeds $35,677,892) (0.3)% | ||||||||||||||
| Common Stocks (0.3)% | ||||||||||||||
Pharmaceuticals (0.3)% | ||||||||||||||
Bristol-Myers Squibb Co. | United States | 743,400 | $ | (33,713,190 | ) | |||||||||
|
| |||||||||||||
†Rounds to less than 0.1% of net assets.
aNon-income producing.
bSee Note 12 regarding holdings of 5% voting securities.
cFair valued using significant unobservable inputs. See Note 14 regarding fair value measurements.
dSee Note 9 regarding restricted securities.
eContingent distributions represent the right to receive additional distributions, if any, during the reorganization of the underlying company. Shares represent total underlying principal of debt securities.
fSecurity was purchased pursuant to Rule 144A under the Securities Act of 1933 and may be sold in transactions exempt from registration only to qualified institutional buyers or in a public offering registered under the Securities Act of 1933. These securities have been deemed liquid under guidelines approved by the Trust’s Board of Trustees. At June 30, 2019, the aggregate value of these securities was $203,046,347, representing 1.5% of net assets.
gThe coupon rate shown represents the rate at period end.
hSee Note 1(g) regarding senior floating rate interests.
iA portion or all of the security purchased on a delayed delivery basis. See Note 1(c).
jSee Note 10 regarding unfunded loan commitments.
kA portion or all of the security represents an unsettled loan commitment. The coupon rate isto-be determined (TBD) at the time of settlement and will be based upon a reference index/floor plus a spread.
lSee Note 8 regarding credit risk and defaulted securities.
mThe security was issued on a discount basis with no stated coupon rate.
nA portion or all of the security has been segregated as collateral for securities sold short and/or open forward exchange contracts. At June 30, 2019, the aggregate value of these securities pledged amounted to $17,098,183, representing 0.1% of net assets.
oSee Note 1(e) regarding securities sold short.
At June 30, 2019, the Fund had the following futures contracts outstanding. See Note 1(d).
Futures Contracts
| Description | Type | Number of Contracts | Notional Amount* | Expiration Date | Value/ Unrealized Appreciation (Depreciation) | |||||||||||||||
| Currency Contracts | ||||||||||||||||||||
EUR/USD | Short | 784 | $ | 112,175,700 | 9/16/19 | $(366,973 | ) | |||||||||||||
GBP/USD | Short | 2,203 | 175,537,794 | 9/16/19 | 153,499 | |||||||||||||||
|
| |||||||||||||||||||
Total Futures Contracts | $(213,474 | ) | ||||||||||||||||||
|
| |||||||||||||||||||
*As of period end.
| 22 | Semiannual Report | franklintempleton.com | ||
FRANKLIN MUTUAL SERIES FUNDS
STATEMENT OF INVESTMENTS (UNAUDITED)
Franklin Mutual Shares Fund(continued)
At June 30, 2019, the Fund had the following forward exchange contracts outstanding. See Note 1(d).
| Forward Exchange Contracts | ||||||||||||||||||||||||||||
| Currency | Counterpartya | Type | Quantity | Contract Amount | Settlement Date | Unrealized Appreciation | Unrealized Depreciation | |||||||||||||||||||||
| OTC Forward Exchange Contracts |
| |||||||||||||||||||||||||||
Euro | BOFA | Buy | 900,000 | $ | 1,005,092 | 7/15/19 | $ | 19,568 | $ | — | ||||||||||||||||||
Euro | BOFA | Sell | 5,602,335 | 6,417,648 | 7/15/19 | 39,327 | — | |||||||||||||||||||||
Euro | BOFA | Sell | 5,814,244 | 6,606,173 | 7/15/19 | — | (13,408 | ) | ||||||||||||||||||||
Euro | HSBK | Sell | 26,147,511 | 30,015,897 | 7/15/19 | 246,667 | — | |||||||||||||||||||||
Euro | UBSW | Sell | 134,125 | 153,211 | 7/15/19 | 508 | — | |||||||||||||||||||||
British Pound | BOFA | Buy | 1,661,585 | 2,105,770 | 7/16/19 | 6,326 | — | |||||||||||||||||||||
British Pound | BOFA | Sell | 6,405,658 | 8,411,935 | 7/16/19 | 269,490 | — | |||||||||||||||||||||
British Pound | HSBK | Buy | 1,653,273 | 2,090,201 | 7/16/19 | 11,329 | — | |||||||||||||||||||||
British Pound | HSBK | Sell | 7,869,232 | 10,268,981 | 7/16/19 | 266,137 | — | |||||||||||||||||||||
British Pound | BOFA | Sell | 4,752,122 | 6,233,845 | 8/14/19 | 185,057 | — | |||||||||||||||||||||
British Pound | BONY | Sell | 1,550,469 | 2,009,020 | 8/14/19 | 35,490 | — | |||||||||||||||||||||
British Pound | HSBK | Sell | 2,097,920 | 2,732,581 | 8/14/19 | 62,222 | — | |||||||||||||||||||||
British Pound | UBSW | Sell | 1,550,469 | 2,009,780 | 8/14/19 | 36,250 | — | |||||||||||||||||||||
South Korean Won | HSBK | Buy | 16,287,097,500 | 13,788,234 | 8/16/19 | 307,353 | — | |||||||||||||||||||||
South Korean Won | HSBK | Sell | 80,684,307,466 | 71,916,352 | 8/16/19 | 2,088,525 | — | |||||||||||||||||||||
South Korean Won | UBSW | Sell | 33,749,933,184 | 30,403,976 | 8/16/19 | 1,195,266 | — | |||||||||||||||||||||
Euro | BONY | Sell | 10,516,734 | 12,067,742 | 10/18/19 | 5,514 | — | |||||||||||||||||||||
Euro | SSBT | Sell | 1,596,798 | 1,806,857 | 10/18/19 | — | (24,600 | ) | ||||||||||||||||||||
Euro | SSBT | Sell | 10,516,735 | 12,067,827 | �� | 10/18/19 | 5,598 | — | ||||||||||||||||||||
British Pound | BONY | Sell | 13,121,429 | 17,225,747 | 10/24/19 | 477,783 | — | |||||||||||||||||||||
Euro | HSBK | Sell | 13,492,373 | 15,292,727 | 11/07/19 | — | (206,437 | ) | ||||||||||||||||||||
Euro | UBSW | Sell | 2,696,239 | 3,055,027 | 11/07/19 | — | (42,237 | ) | ||||||||||||||||||||
South Korean Won | HSBK | Sell | 94,142,264,623 | 80,869,969 | 11/15/19 | — | (841,290 | ) | ||||||||||||||||||||
South Korean Won | UBSW | Sell | 58,918,367,227 | 50,971,855 | 11/15/19 | — | (166,642 | ) | ||||||||||||||||||||
Euro | BOFA | Sell | 2,273,762 | 2,608,028 | 11/21/19 | — | (6,763 | ) | ||||||||||||||||||||
Euro | HSBK | Sell | 3,732,730 | 4,238,440 | 11/21/19 | — | (54,141 | ) | ||||||||||||||||||||
Euro | SSBT | Sell | 22,566,499 | 25,599,436 | 11/21/19 | — | (351,684 | ) | ||||||||||||||||||||
British Pound | BOFA | Sell | 3,346,955 | 4,289,966 | 11/22/19 | 13,272 | — | |||||||||||||||||||||
British Pound | HSBK | Sell | 2,204,721 | 2,823,498 | 11/22/19 | 6,335 | — | |||||||||||||||||||||
British Pound | SSBT | Sell | 88,694,627 | 113,008,041 | 11/22/19 | — | (324,765 | ) | ||||||||||||||||||||
|
| |||||||||||||||||||||||||||
Total Forward Exchange Contracts |
| $ | 5,278,017 | $ | (2,031,967 | ) | ||||||||||||||||||||||
|
| |||||||||||||||||||||||||||
Net unrealized appreciation (depreciation) |
| $ | 3,246,050 | |||||||||||||||||||||||||
|
| |||||||||||||||||||||||||||
aMay be comprised of multiple contracts with the same counterparty, currency and settlement date.
See Note 11 regarding other derivative information.
See Abbreviations on page 42.
| franklintempleton.com | The accompanying notes are an integral part of these financial statements. | Semiannual Report | 23 | ||||
FRANKLIN MUTUAL SERIES FUNDS
Statement of Assets and Liabilities
June 30, 2019 (unaudited)
Franklin Mutual Shares Fund
Assets: | ||||
Investments in securities: | ||||
Cost - Unaffiliated issuers | $ | 10,557,159,210 | ||
Cost -Non-controlled affiliates (Note 3f and 12) | 55,424,278 | |||
|
| |||
Value - Unaffiliated issuers | $ | 13,000,179,805 | ||
Value -Non-controlled affiliates (Note 3f and 12) | 141,003,241 | |||
Cash | 1,396,639 | |||
Foreign currency, at value (cost $6,747,138) | 6,755,751 | |||
Receivables: | ||||
Investment securities sold | 82,123,285 | |||
Capital shares sold | 3,894,749 | |||
Dividends and interest | 34,671,861 | |||
European Union tax reclaims | 6,455,039 | |||
Deposits with brokers for: | ||||
Securities sold short | 34,198,339 | |||
Futures contracts | 6,559,070 | |||
Unrealized appreciation on OTC forward exchange contracts | 5,278,017 | |||
Unrealized appreciation on unfunded loan commitments (Note 10) | 32,442 | |||
Other assets | 713,710 | |||
|
| |||
Total assets | 13,323,261,948 | |||
|
| |||
Liabilities: | ||||
Payables: | ||||
Investment securities purchased | 32,789,095 | |||
Capital shares redeemed | 11,499,374 | |||
Management fees | 7,000,350 | |||
Distribution fees | 2,304,769 | |||
Transfer agent fees | 1,505,784 | |||
Trustees’ fees and expenses | 1,063,452 | |||
Variation margin on futures contracts | 626,356 | |||
Securities sold short, at value (proceeds $35,677,892) | 33,713,190 | |||
Unrealized depreciation on OTC forward exchange contracts | 2,031,967 | |||
Accrued expenses and other liabilities | 753,201 | |||
|
| |||
Total liabilities | 93,287,538 | |||
|
| |||
Net assets, at value | $ | 13,229,974,410 | ||
|
| |||
Net assets consist of: | ||||
Paid-in capital | $ | 9,952,441,766 | ||
Total distributable earnings (loss) | 3,277,532,644 | |||
|
| |||
Net assets, at value | $ | 13,229,974,410 | ||
|
| |||
| 24 | Semiannual Report | The accompanying notes are an integral part of these financial statements. | franklintempleton.com | ||
FRANKLIN MUTUAL SERIES FUNDS
FINANCIAL STATEMENTS
Statement of Assets and Liabilities(continued)
June 30, 2019 (unaudited)
Franklin Mutual Shares Fund
| Class Z: | ||||
Net assets, at value | $ | 5,357,028,733 | ||
|
| |||
Shares outstanding | 194,160,674 | |||
|
| |||
Net asset value and maximum offering price per share | $27.59 | |||
|
| |||
| Class A: | ||||
Net assets, at value | $ | 4,128,726,247 | ||
|
| |||
Shares outstanding | 151,385,836 | |||
|
| |||
Net asset value per sharea | $27.27 | |||
|
| |||
Maximum offering price per share (net asset value per share ÷ 94.50%) | $28.86 | |||
|
| |||
| Class C: | ||||
Net assets, at value | $ | 311,307,022 | ||
|
| |||
Shares outstanding | 11,471,793 | |||
|
| |||
Net asset value and maximum offering price per sharea | $27.14 | |||
|
| |||
| Class R: | ||||
Net assets, at value | $ | 79,980,056 | ||
|
| |||
Shares outstanding | 2,947,160 | |||
|
| |||
Net asset value and maximum offering price per share | $27.14 | |||
|
| |||
| Class R6: | ||||
Net assets, at value | $ | 3,352,932,352 | ||
|
| |||
Shares outstanding | 121,584,516 | |||
|
| |||
Net asset value and maximum offering price per share | $27.58 | |||
|
| |||
aRedemption price is equal to net asset value less contingent deferred sales charges, if applicable.
| franklintempleton.com | The accompanying notes are an integral part of these financial statements. | Semiannual Report | 25 | ||||
FRANKLIN MUTUAL SERIES FUNDS
FINANCIAL STATEMENTS
Statement of Operations
for the six months ended June 30, 2019 (unaudited)
Franklin Mutual Shares Fund
Investment income: | ||||
Dividends: (net of foreign taxes)* | ||||
Unaffiliated issuers | $ | 160,014,104 | ||
Non-controlled affiliates (Note 3f and 12) | 2,898,806 | |||
Interest: | ||||
Unaffiliated issuers | 42,732,064 | |||
Income from securities loaned: | ||||
Unaffiliated issuers (net of fees and rebates) | 1,068,265 | |||
Non-controlled affiliates (Note 3f) | 72,310 | |||
|
| |||
Total investment income | 206,785,549 | |||
|
| |||
Expenses: | ||||
Management fees (Note 3a) | 42,816,018 | |||
Distribution fees: (Note 3c) | ||||
Class A | 5,096,566 | |||
Class C | 1,594,217 | |||
Class R | 195,348 | |||
Transfer agent fees: (Note 3e) | ||||
Class Z | 2,630,934 | |||
Class A | 2,010,523 | |||
Class C | 157,204 | |||
Class R | 38,703 | |||
Class R6 | 357,590 | |||
Custodian fees (Note 4) | 412,073 | |||
Reports to shareholders | 363,652 | |||
Registration and filing fees | 99,540 | |||
Professional fees | 75,288 | |||
Trustees’ fees and expenses | 465,486 | |||
Dividends on securities sold short | 304,794 | |||
Other | 141,674 | |||
|
| |||
Total expenses | 56,759,610 | |||
Expense reductions (Note 4) | (24,866 | ) | ||
Expenses waived/paid by affiliates (Note 3f and 3g) | (36,794 | ) | ||
|
| |||
Net expenses | 56,697,950 | |||
|
| |||
Net investment income | 150,087,599 | |||
|
| |||
Realized and unrealized gains (losses): | ||||
Net realized gain (loss) from: | ||||
Investments: | ||||
Unaffiliated issuers | 245,350,786 | |||
Non-controlled affiliates (Note 3f and 12) | (33,179,342 | ) | ||
Foreign currency transactions | 1,157,150 | |||
Forward exchange contracts | 18,416,609 | |||
Futures contracts | 4,444,658 | |||
Securities sold short | (14,512,515 | ) | ||
|
| |||
Net realized gain (loss) | 221,677,346 | |||
|
| |||
Net change in unrealized appreciation (depreciation) on: | ||||
Investments: | ||||
Unaffiliated issuers | 1,296,699,737 | |||
Non-controlled affiliates (Note 3f and 12) | 47,381,217 | |||
Translation of other assets and liabilities denominated in foreign currencies | (271,608 | ) | ||
Forward exchange contracts | (4,517,241 | ) | ||
| 26 | Semiannual Report | The accompanying notes are an integral part of these financial statements. | franklintempleton.com | ||
FRANKLIN MUTUAL SERIES FUNDS
FINANCIAL STATEMENTS
Statement of Operations(continued)
for the six months ended June 30, 2019 (unaudited)
Franklin Mutual Shares Fund
Futures contracts | (678,487 | ) | ||
Securities sold short | (23,540,623 | ) | ||
|
| |||
Net change in unrealized appreciation (depreciation) | 1,315,072,995 | |||
|
| |||
Net realized and unrealized gain (loss) | 1,536,750,341 | |||
|
| |||
Net increase (decrease) in net assets resulting from operations | $ | 1,686,837,940 | ||
|
| |||
*Foreign taxes withheld on dividends | $ | 3,760,167 | ||
| franklintempleton.com | The accompanying notes are an integral part of these financial statements. | Semiannual Report | 27 | ||||
FRANKLIN MUTUAL SERIES FUNDS
FINANCIAL STATEMENTS
Statements of Changes in Net Assets
Franklin Mutual Shares Fund
| Six Months Ended June 30, 2019 (unaudited) | Year Ended December 31, 2018 | |||||||
| ||||||||
Increase (decrease) in net assets: | ||||||||
Operations: | ||||||||
Net investment income | $ | 150,087,599 | $ 244,198,602 | |||||
Net realized gain (loss) | 221,677,346 | 1,079,036,473 | ||||||
Net change in unrealized appreciation (depreciation) | 1,315,072,995 | (2,582,054,169 | ) | |||||
|
| |||||||
Net increase (decrease) in net assets resulting from operations | 1,686,837,940 | (1,258,819,094 | ) | |||||
|
| |||||||
Distributions to shareholders: | ||||||||
Class Z | — | (359,738,797 | ) | |||||
Class A | — | (258,843,422 | ) | |||||
Class C | — | (16,133,984 | ) | |||||
Class R | — | (4,696,240 | ) | |||||
Class R6 | — | (218,275,931 | ) | |||||
|
| |||||||
Total distributions to shareholders | — | (857,688,374 | ) | |||||
|
| |||||||
Capital share transactions: (Note 2) | ||||||||
Class Z | (522,227,861 | ) | (162,098,601 | ) | ||||
Class A | (241,321,376 | ) | 114,605,103 | |||||
Class C | (38,330,388 | ) | (631,170,380 | ) | ||||
Class R | (4,234,354 | ) | (21,048,937 | ) | ||||
Class R6 | (236,646,377 | ) | (59,462,529 | ) | ||||
|
| |||||||
Total capital share transactions | (1,042,760,356 | ) | (759,175,344 | ) | ||||
|
| |||||||
Net increase (decrease) in net assets | 644,077,584 | (2,875,682,812 | ) | |||||
Net assets: | ||||||||
Beginning of period | 12,585,896,826 | 15,461,579,638 | ||||||
|
| |||||||
End of period | $ | 13,229,974,410 | $12,585,896,826 | |||||
|
| |||||||
| 28 | Semiannual Report | The accompanying notes are an integral part of these financial statements. | franklintempleton.com | ||
FRANKLIN MUTUAL SERIES FUNDS
Notes to Financial Statements (unaudited)
Franklin Mutual Shares Fund
1. Organization and Significant Accounting Policies
Franklin Mutual Series Funds (Trust) is registered under the Investment Company Act of 1940 (1940 Act) as anopen-end management investment company, consisting of seven separate funds and applies the specialized accounting and reporting guidance in U.S. Generally Accepted Accounting Principles (U.S. GAAP). Franklin Mutual Shares Fund (Fund) is included in this report. The Fund offers five classes of shares: Class Z, Class A, Class C, Class R and Class R6. Class C shares automatically convert to Class A shares after they have been held for 10 years. Each class of shares may differ by its initial sales load, contingent deferred sales charges, voting rights on matters affecting a single class, its exchange privilege and fees due to differing arrangements for distribution and transfer agent fees.
The following summarizes the Fund’s significant accounting policies.
a. Financial Instrument Valuation
The Fund’s investments in financial instruments are carried at fair value daily. Fair value is the price that would be received to sell an asset or paid to transfer a liability in an orderly transaction between market participants on the measurement date. The Fund calculates the net asset value (NAV) per share each business day as of 4 p.m. Eastern time or the regularly scheduled close of the New York Stock Exchange (NYSE), whichever is earlier. Under compliance policies and procedures approved by the Trust’s Board of Trustees (the Board), the Fund’s administrator has responsibility for oversight of valuation, including leading the cross-functional Valuation Committee (VC). The Fund may utilize independent pricing services, quotations from securities and financial instrument dealers, and other market sources to determine fair value.
Equity securities and derivative financial instruments listed on an exchange or on the NASDAQ National Market System are valued at the last quoted sale price or the official closing price of the day, respectively. Foreign equity securities are valued as of the close of trading on the foreign stock exchange on which the security is primarily traded, or as of 4 p.m. Eastern time. The value is then converted into its U.S. dollar equivalent at the foreign exchange rate in effect at 4 p.m. Eastern time on the day that the value of the security is determined.Over-the-counter (OTC) securities are valued within the range of the most recent quoted bid and ask prices. Securities that trade in multiple markets or on multiple
exchanges are valued according to the broadest and most representative market. Certain equity securities are valued based upon fundamental characteristics or relationships to similar securities.
Debt securities generally trade in the OTC market rather than on a securities exchange. The Fund’s pricing services use multiple valuation techniques to determine fair value. In instances where sufficient market activity exists, the pricing services may utilize a market-based approach through which quotes from market makers are used to determine fair value. In instances where sufficient market activity may not exist or is limited, the pricing services also utilize proprietary valuation models which may consider market characteristics such as benchmark yield curves, credit spreads, estimated default rates, anticipated market interest rate volatility, coupon rates, anticipated timing of principal repayments, underlying collateral, and other unique security features in order to estimate the relevant cash flows, which are then discounted to calculate the fair value.
Investments inopen-end mutual funds are valued at the closing NAV.
Certain derivative financial instruments trade in the OTC market. The Fund’s pricing services use various techniques including industry standard option pricing models and proprietary discounted cash flow models to determine the fair value of those instruments. The Fund’s net benefit or obligation under the derivative contract, as measured by the fair value of the contract, is included in net assets.
The Fund has procedures to determine the fair value of financial instruments for which market prices are not reliable or readily available. Under these procedures, the Fund primarily employs a market-based approach which may use related or comparable assets or liabilities, recent transactions, market multiples, book values, and other relevant information for the investment to determine the fair value of the investment. An income-based valuation approach may also be used in which the anticipated future cash flows of the investment are discounted to calculate fair value. Discounts may also be applied due to the nature or duration of any restrictions on the disposition of the investments. Due to the inherent uncertainty of valuations of such investments, the fair values may differ significantly from the values that would have been used had an active market existed.
| franklintempleton.com | Semiannual Report | 29 | ||||
FRANKLIN MUTUAL SERIES FUNDS
NOTES TO FINANCIAL STATEMENTS (UNAUDITED)
Franklin Mutual Shares Fund(continued)
1. Organization and Significant Accounting
Policies(continued)
a. Financial Instrument Valuation(continued)
Trading in securities on foreign securities stock exchanges and OTC markets may be completed before 4 p.m. Eastern time. In addition, trading in certain foreign markets may not take place on every Fund’s business day. Occasionally, events occur between the time at which trading in a foreign security is completed and 4 p.m. Eastern time that might call into question the reliability of the value of a portfolio security held by the Fund. As a result, differences may arise between the value of the Fund’s portfolio securities as determined at the foreign market close and the latest indications of value at 4 p.m. Eastern time. In order to minimize the potential for these differences, the VC monitors price movements following the close of trading in foreign stock markets through a series of country specific market proxies (such as baskets of American Depositary Receipts, futures contracts and exchange traded funds). These price movements are measured against established trigger thresholds for each specific market proxy to assist in determining if an event has occurred that may call into question the reliability of the values of the foreign securities held by the Fund. If such an event occurs, the securities may be valued using fair value procedures, which may include the use of independent pricing services.
When the last day of the reporting period is anon-business day, certain foreign markets may be open on those days that the Fund’s NAV is not calculated, which could result in differences between the value of the Fund’s portfolio securities on the last business day and the last calendar day of the reporting period. Any significant security valuation changes due to an open foreign market are adjusted and reflected by the Fund for financial reporting purposes.
b. Foreign Currency Translation
Portfolio securities and other assets and liabilities denominated in foreign currencies are translated into U.S. dollars based on the exchange rate of such currencies against U.S. dollars on the date of valuation. The Fund may enter into foreign currency exchange contracts to facilitate transactions denominated in a foreign currency. Purchases and sales of securities, income and expense items denominated in foreign currencies are translated into U.S. dollars at the exchange rate in effect on the transaction date. Portfolio securities and assets and liabilities denominated in
foreign currencies contain risks that those currencies will decline in value relative to the U.S. dollar. Occasionally, events may impact the availability or reliability of foreign exchange rates used to convert the U.S. dollar equivalent value. If such an event occurs, the foreign exchange rate will be valued at fair value using procedures established and approved by the Board.
The Fund does not separately report the effect of changes in foreign exchange rates from changes in market prices on securities held. Such changes are included in net realized and unrealized gain or loss from investments in the Statement of Operations.
Realized foreign exchange gains or losses arise from sales of foreign currencies, currency gains or losses realized between the trade and settlement dates on securities transactions and the difference between the recorded amounts of dividends, interest, and foreign withholding taxes and the U.S. dollar equivalent of the amounts actually received or paid. Net unrealized foreign exchange gains and losses arise from changes in foreign exchange rates on foreign denominated assets and liabilities other than investments in securities held at the end of the reporting period.
c. Securities Purchased on a Delayed Delivery Basis
The Fund purchases securities on a delayed delivery basis, with payment and delivery scheduled for a future date. These transactions are subject to market fluctuations and are subject to the risk that the value at delivery may be more or less than the trade date purchase price. Although the Fund will generally purchase these securities with the intention of holding the securities, it may sell the securities before the settlement date. Sufficient assets have been segregated for these securities.
d. Derivative Financial Instruments
The Fund invested in derivative financial instruments in order to manage risk or gain exposure to various other investments or markets. Derivatives are financial contracts based on an underlying or notional amount, require no initial investment or an initial net investment that is smaller than would normally be required to have a similar response to changes in market factors, and require or permit net settlement. Derivatives contain various risks including the potential inability of the counterparty to fulfill their obligations under the terms of the contract, the potential for an illiquid secondary market, and/or the potential for market movements which expose the Fund to
| 30 | Semiannual Report | franklintempleton.com | ||
FRANKLIN MUTUAL SERIES FUNDS
NOTES TO FINANCIAL STATEMENTS (UNAUDITED)
Franklin Mutual Shares Fund(continued)
gains or losses in excess of the amounts shown in the Statement of Assets and Liabilities. Realized gain and loss and unrealized appreciation and depreciation on these contracts for the period are included in the Statement of Operations.
Derivative counterparty credit risk is managed through a formal evaluation of the creditworthiness of all potential counterparties. The Fund attempts to reduce its exposure to counterparty credit risk on OTC derivatives, whenever possible, by entering into International Swaps and Derivatives Association (ISDA) master agreements with certain counterparties. These agreements contain various provisions, including but not limited to collateral requirements, events of default, or early termination. Termination events applicable to the counterparty include certain deteriorations in the credit quality of the counterparty. Termination events applicable to the Fund include failure of the Fund to maintain certain net asset levels and/or limit the decline in net assets over various periods of time. In the event of default or early termination, the ISDA master agreement gives thenon-defaulting party the right to net andclose-out all transactions traded, whether or not arising under the ISDA agreement, to one net amount payable by one counterparty to the other. However, absent an event of default or early termination, OTC derivative assets and liabilities are presented gross and not offset in the Statement of Assets and Liabilities. Early termination by the counterparty may result in an immediate payment by the Fund of any net liability owed to that counterparty under the ISDA agreement. At June 30, 2019, the Fund had OTC derivatives in a net liability position of $695,451 and the aggregate value of collateral pledged for such contracts was $640,925.
Collateral requirements differ by type of derivative. Collateral or initial margin requirements are set by the broker or exchange clearing house for exchange traded and centrally cleared derivatives. Initial margin deposited is held at the exchange and can be in the form of cash and/or securities. For OTC derivatives traded under an ISDA master agreement, posting of collateral is required by either the Fund or the applicable counterparty if the total net exposure of all OTC derivatives with the applicable counterparty exceeds the minimum transfer amount, which typically ranges from $100,000 to $250,000, and can vary depending on the counterparty and the type of the agreement. Generally, collateral is determined at the close of Fund business each day and any additional collateral required due to changes in derivative values may be delivered by the Fund or the
counterparty the next business day, or within a few business days. Collateral pledged and/or received by the Fund for OTC derivatives, if any, is held in segregated accounts with the Fund’s custodian/counterparty broker and can be in the form of cash and/or securities. Unrestricted cash may be invested according to the Fund’s investment objectives. To the extent that the amounts due to the Fund from its counterparties are not subject to collateralization or are not fully collateralized, the Fund bears the risk of loss from counterpartynon-performance.
At June 30, 2019, the Fund received $3,530,015 in U.K. Treasury Bonds and U.S. Treasury Bills, Bonds and Notes as collateral for derivatives.
The Fund entered into exchange traded futures contracts primarily to manage exposure to certain foreign currencies. A futures contract is an agreement between the Fund and a counterparty to buy or sell an asset at a specified price on a future date. Required initial margins are pledged by the Fund, and the daily change in fair value is accounted for as a variation margin payable or receivable in the Statement of Assets and Liabilities.
The Fund entered into OTC forward exchange contracts primarily to manage exposure to certain foreign currencies. A forward exchange contract is an agreement between the Fund and a counterparty to buy or sell a foreign currency at a specific exchange rate on a future date.
See Note 11 regarding other derivative information.
e. Securities Sold Short
The Fund is engaged in selling securities short, which obligates the Fund to replace a borrowed security with the same security at current fair value. The Fund incurs a loss if the price of the security increases between the date of the short sale and the date on which the Fund replaces the borrowed security. The Fund realizes a gain if the price of the security declines between those dates. Gains are limited to the price at which the Fund sold the security short, while losses are potentially unlimited in size.
The Fund is required to establish a margin account with the broker lending the security sold short. While the short sale is outstanding, the broker retains the proceeds of the short sale to the extent necessary to meet margin requirements until the short position is closed out. A deposit must also be maintained with the Fund’s custodian/counterparty broker
| franklintempleton.com | Semiannual Report | 31 | ||||
FRANKLIN MUTUAL SERIES FUNDS
NOTES TO FINANCIAL STATEMENTS (UNAUDITED)
Franklin Mutual Shares Fund(continued)
1. Organization and Significant Accounting Policies(continued)
e. Securities Sold Short(continued)
consisting of cash and/or securities having a value equal to a specified percentage of the value of the securities sold short. The Fund is obligated to pay fees for borrowing the securities sold short and is required to pay the counterparty any dividends and/or interest due on securities sold short. Such dividends and/or interest and any security borrowing fees are recorded as an expense to the Fund.
f. Securities Lending
The Fund participates in an agency based securities lending program to earn additional income. The Fund receives cash collateral against the loaned securities in an amount equal to at least 102% of the fair value of the loaned securities. Collateral is maintained over the life of the loan in an amount not less than 100% of the fair value of loaned securities, as determined at the close of Fund business each day; any additional collateral required due to changes in security values is delivered to the Fund on the next business day. The collateral is deposited into a joint cash account with other funds and is used to invest in a money market fund managed by Franklin Advisers, Inc., an affiliate of the Fund, and/or a joint repurchase agreement. The Fund may receive income from the investment of cash collateral, in addition to lending fees and rebates paid by the borrower. Income from securities loaned, net of fees paid to the securities lending agent and/or third-party vendor, is reported separately in the Statement of Operations. The Fund bears the market risk with respect to the collateral investment, securities loaned, and the risk that the agent may default on its obligations to the Fund. If the borrower defaults on its obligation to return the securities loaned, the Fund has the right to repurchase the securities in the open market using the collateral received. The securities lending agent has agreed to indemnify the Fund in the event of default by a third party borrower. At June 30, 2019, the Fund had no securities on loan.
g. Senior Floating Rate Interests
The Fund invests in senior secured corporate loans that pay interest at rates which are periodically reset by reference to a base lending rate plus a spread. These base lending rates are generally the prime rate offered by a designated U.S. bank or the London InterBank Offered Rate (LIBOR). Senior secured corporate loans often require prepayment of
principal from excess cash flows or at the discretion of the borrower. As a result, actual maturity may be substantially less than the stated maturity. Senior secured corporate loans in which the Fund invests are generally readily marketable, but may be subject to certain restrictions on resale.
h. Income and Deferred Taxes
It is the Fund’s policy to qualify as a regulated investment company under the Internal Revenue Code. The Fund intends to distribute to shareholders substantially all of its taxable income and net realized gains to relieve it from federal income and excise taxes. As a result, no provision for U.S. federal income taxes is required.
The Fund may be subject to foreign taxation related to income received, capital gains on the sale of securities and certain foreign currency transactions in the foreign jurisdictions in which it invests. Foreign taxes, if any, are recorded based on the tax regulations and rates that exist in the foreign markets in which the Fund invests. When a capital gain tax is determined to apply, the Fund records an estimated deferred tax liability in an amount that would be payable if the securities were disposed of on the valuation date.
As a result of several court cases, in certain countries across the European Union, the Fund filed additional tax reclaims for previously withheld taxes on dividends earned in those countries (EU reclaims). These additional filings are subject to various administrative proceedings by the local jurisdictions’ tax authorities within the European Union, as well as a number of related judicial proceedings. Income recognized, if any, for EU reclaims is reflected as other income in the Statement of Operations and any related receivable, if any, is reflected as European Union tax reclaims in the Statement of Assets and Liabilities. When uncertainty exists as to the ultimate resolution of these proceedings, the likelihood of receipt of these EU reclaims, and the potential timing of payment, no amounts are reflected in the financial statements. For U.S. income tax purposes, EU reclaims received by the Fund, if any, reduce the amounts of foreign taxes Fund shareholders can use as tax credits in their individual income tax returns.
The Fund may recognize an income tax liability related to its uncertain tax positions under U.S. GAAP when the uncertain tax position has a less than 50% probability that it will be sustained upon examination by the tax authorities based on its technical merits. As of June 30, 2019, the Fund has
| 32 | Semiannual Report | franklintempleton.com | ||
FRANKLIN MUTUAL SERIES FUNDS
NOTES TO FINANCIAL STATEMENTS (UNAUDITED)
Franklin Mutual Shares Fund(continued)
determined that no tax liability is required in its financial statements related to uncertain tax positions for any open tax years (or expected to be taken in future tax years). Open tax years are those that remain subject to examination and are based on the statute of limitations in each jurisdiction in which the Fund invests.
i. Security Transactions, Investment Income, Expenses and Distributions
Security transactions are accounted for on trade date. Realized gains and losses on security transactions are determined on a specific identification basis. Interest income and estimated expenses are accrued daily. Amortization of premium and accretion of discount on debt securities are included in interest income. Dividend income and dividends declared on securities sold short are recorded on theex-dividend date except for certain dividends from securities where the dividend rate is not available. In such cases, the dividend is recorded as soon as the information is received by the Fund. Distributions to shareholders are recorded on theex-dividend date. Distributable earnings are determined according to income tax regulations (tax basis) and may differ from earnings recorded in accordance with U.S. GAAP. These differences may be permanent or temporary. Permanent differences are reclassified among capital accounts to reflect their tax character. These reclassifications have no impact on net assets or the results of operations. Temporary differences are not reclassified, as they may reverse in subsequent periods.
Common expenses incurred by the Trust are allocated among the Funds based on the ratio of net assets of each Fund to the combined net assets of the Trust or based on the ratio of
number of shareholders of each Fund to the combined number of shareholders of the Trust. Fund specific expenses are charged directly to the Fund that incurred the expense.
Realized and unrealized gains and losses and net investment income, excluding class specific expenses, are allocated daily to each class of shares based upon the relative proportion of net assets of each class. Differences in per share distributions by class are generally due to differences in class specific expenses.
j. Accounting Estimates
The preparation of financial statements in accordance with U.S. GAAP requires management to make estimates and assumptions that affect the reported amounts of assets and liabilities at the date of the financial statements and the amounts of income and expenses during the reporting period. Actual results could differ from those estimates.
k. Guarantees and Indemnifications
Under the Trust’s organizational documents, its officers and trustees are indemnified by the Trust against certain liabilities arising out of the performance of their duties to the Trust. Additionally, in the normal course of business, the Trust, on behalf of the Fund, enters into contracts with service providers that contain general indemnification clauses. The Trust’s maximum exposure under these arrangements is unknown as this would involve future claims that may be made against the Trust that have not yet occurred. Currently, the Trust expects the risk of loss to be remote.
2. Shares of Beneficial Interest
At June 30, 2019, there were an unlimited number of shares authorized (without par value). Transactions in the Fund’s shares were as follows:
Six Months Ended June 30, 2019 | Year Ended December 31, 2018 | |||||||||||||||
| Shares | Amount | Shares | Amount | |||||||||||||
| Class Z Shares: | ||||||||||||||||
| Shares sold | 2,785,139 | $ 73,790,254 | 10,029,587 | $ 284,766,342 | ||||||||||||
| Shares issued in reinvestment of distributions | — | — | 13,492,550 | 320,309,753 | ||||||||||||
| Shares redeemed | (22,631,431 | ) | (596,018,115 | ) | (27,123,733 | ) | (767,174,696 | ) | ||||||||
|
| |||||||||||||||
| Net increase (decrease) | (19,846,292 | ) | $(522,227,861 | ) | (3,601,596 | ) | $(162,098,601 | ) | ||||||||
|
| |||||||||||||||
| franklintempleton.com | Semiannual Report | 33 | ||||
FRANKLIN MUTUAL SERIES FUNDS
NOTES TO FINANCIAL STATEMENTS (UNAUDITED)
Franklin Mutual Shares Fund(continued)
2. Shares of Beneficial Interest(continued)
Six Months Ended June 30, 2019 | Year Ended December 31, 2018 | |||||||||||||||
| Shares | Amount | Shares | Amount | |||||||||||||
| Class A Shares: | ||||||||||||||||
| Shares solda | 4,538,729 | $ | 118,993,928 | 25,412,499 | $ | 710,808,675 | ||||||||||
| Shares issued in reinvestment of distributions | — | — | 10,148,432 | 238,431,075 | ||||||||||||
| Shares redeemed | (13,663,002 | ) | (360,315,304 | ) | (29,787,083 | ) | (834,634,647) | |||||||||
|
| |||||||||||||||
| Net increase (decrease) | (9,124,273 | ) | $ | (241,321,376 | ) | 5,773,848 | $ | 114,605,103 | ||||||||
|
| |||||||||||||||
| Class C Shares: | ||||||||||||||||
| Shares sold | 679,319 | $ | 17,549,559 | 2,074,273 | $ | 57,275,560 | ||||||||||
| Shares issued in reinvestment of distributions | — | — | 675,227 | 15,942,868 | ||||||||||||
| Shares redeemeda | (2,130,819 | ) | (55,879,947 | ) | (25,329,240 | ) | (704,388,808) | |||||||||
|
| |||||||||||||||
| Net increase (decrease) | (1,451,500 | ) | $ | (38,330,388 | ) | (22,579,740 | ) | $ | (631,170,380) | |||||||
|
| |||||||||||||||
| Class R Shares: | ||||||||||||||||
| Shares sold | 139,497 | $ | 3,653,382 | 347,792 | $ | 9,776,448 | ||||||||||
| Shares issued in reinvestment of distributions | — | — | 199,115 | 4,662,921 | ||||||||||||
| Shares redeemed | (301,696 | ) | (7,887,736 | ) | (1,253,910 | ) | (35,488,306) | |||||||||
|
| |||||||||||||||
| Net increase (decrease) | (162,199 | ) | $ | (4,234,354 | ) | (707,003 | ) | $ | (21,048,937) | |||||||
|
| |||||||||||||||
| Class R6 Shares: | ||||||||||||||||
| Shares sold | 4,520,371 | $ | 120,323,441 | 14,420,824 | $ | 412,295,163 | ||||||||||
| Shares issued in reinvestment of distributions | — | — | 9,195,249 | 218,103,352 | ||||||||||||
| Shares redeemed | (13,374,269 | ) | (356,969,818 | ) | (23,959,670 | ) | (689,861,044) | |||||||||
|
| |||||||||||||||
| Net increase (decrease) | (8,853,898 | ) | $ | (236,646,377 | ) | (343,597 | ) | $ | (59,462,529) | |||||||
|
| |||||||||||||||
aMay include a portion of Class C shares that were automatically converted to Class A.
3. Transactions with Affiliates
Franklin Resources, Inc. is the holding company for various subsidiaries that together are referred to as Franklin Templeton. Certain officers and trustees of the Fund are also officers and/or directors of the following subsidiaries:
| Subsidiary | Affiliation | |
Franklin Mutual Advisers, LLC (Franklin Mutual)
| Investment manager
| |
Franklin Templeton Services, LLC (FT Services)
|
Administrative manager
| |
Franklin Templeton Distributors, Inc. (Distributors)
|
Principal underwriter
| |
Franklin Templeton Investor Services, LLC (Investor Services)
|
Transfer agent
| |
| 34 | Semiannual Report | franklintempleton.com | ||
FRANKLIN MUTUAL SERIES FUNDS
NOTES TO FINANCIAL STATEMENTS (UNAUDITED)
Franklin Mutual Shares Fund(continued)
a. Management Fees
The Fund pays an investment management fee to Franklin Mutual based on the average daily net assets of the Fund as follows:
| Annualized Fee Rate | Net Assets | |
0.675%
| Up to and including $5 billion | |
0.645%
| Over $5 billion, up to and including $10 billion | |
0.625%
| Over $10 billion, up to and including $15 billion | |
0.595%
| Over $15 billion, up to and including $20 billion | |
0.585%
| Over $20 billion, up to and including $25 billion | |
0.565%
| Over $25 billion, up to and including $30 billion | |
0.555%
| Over $30 billion, up to and including $35 billion | |
0.545%
| In excess of $35 billion | |
For the period ended June 30, 2019, the annualized gross effective investment management fee rate was 0.651% of the Fund’s average daily net assets.
b. Administrative Fees
Under an agreement with Franklin Mutual, FT Services provides administrative services to the Fund. The fee is paid by Franklin Mutual based on the Fund’s average daily net assets, and is not an additional expense of the Fund.
c. Distribution Fees
The Board has adopted distribution plans for each share class, with the exception of Class Z and Class R6 shares, pursuant to Rule12b-1 under the 1940 Act. Under the Fund’s Class A reimbursement distribution plan, the Fund reimburses Distributors for costs incurred in connection with the servicing, sale and distribution of the Fund’s shares up to the maximum annual plan rate. Under the Class A reimbursement distribution plan, costs exceeding the maximum for the current plan year cannot be reimbursed in subsequent periods. In addition, under the Fund’s Class C and R compensation distribution plans, the Fund pays Distributors for costs incurred in connection with the servicing, sale and distribution of the Fund’s shares up to the maximum annual plan rate for each class. The plan year, for purposes of monitoring compliance with the maximum annual plan rates, is February 1 through January 31.
The maximum annual plan rates, based on the average daily net assets, for each class, are as follows:
Class A | 0.35% | |||
Class C | 1.00% | |||
Class R | 0.50% |
The Board has set the current rate at 0.25% per year for Class A shares until further notice and approval by the Board.
| franklintempleton.com | Semiannual Report | 35 | ||||
FRANKLIN MUTUAL SERIES FUNDS
NOTES TO FINANCIAL STATEMENTS (UNAUDITED)
Franklin Mutual Shares Fund(continued)
3. Transactions with Affiliates(continued)
d. Sales Charges/Underwriting Agreements
Front-end sales charges and contingent deferred sales charges (CDSC) do not represent expenses of the Fund. These charges are deducted from the proceeds of sales of Fund shares prior to investment or from redemption proceeds prior to remittance, as applicable. Distributors has advised the Fund of the following commission transactions related to the sales and redemptions of the Fund’s shares for the period:
Sales charges retained net of commissions paid to unaffiliated brokers/dealers | $ | 116,300 | ||
CDSC retained | $ | 2,362 |
e. Transfer Agent Fees
Each class of shares pays transfer agent fees to Investor Services for its performance of shareholder servicing obligations. The fees are based on an annualized asset based fee of 0.02% plus a transaction based fee. In addition, each class reimburses Investor Services for out of pocket expenses incurred and, except for Class R6, reimburses shareholder servicing fees paid to third parties. These fees are allocated daily based upon their relative proportion of such classes’ aggregate net assets. Class R6 pays Investor Services transfer agent fees specific to that class.
For the period ended June 30, 2019, the Fund paid transfer agent fees of $5,194,954, of which $2,647,591 was retained by Investor Services.
f. Investments in Affiliated Management Investment Companies
The Fund invests in one or more affiliated management investment companies for purposes other than exercising a controlling influence over the management or policies. Management fees paid by the Fund are waived on assets invested in the affiliated management investment companies, as noted in the Statement of Operations, in an amount not to exceed the management and administrative fees paid directly or indirectly by each affiliate. During the period ended June 30, 2019, the Fund held investments in affiliated management investment companies as follows:
| Value at Beginning of Period | Purchases | Sales | Realized Gain (Loss) | Net Change in Unrealized Appreciation (Depreciation) | Value at End of Period | Number of Shares Held at End of Period | Income from securities loaned | |||||||||||||||||||||||||
| ||||||||||||||||||||||||||||||||
| Non-Controlled Affiliates | ||||||||||||||||||||||||||||||||
Institutional Fiduciary Trust Money Market Portfolio, 2.05% | $ — | $176,535,000 | $(176,535,000 | ) | $ — | $ — | $ — | — | $72,310 | |||||||||||||||||||||||
|
|
|
| |||||||||||||||||||||||||||||
g. Waiver and Expense Reimbursements
Investor Services has contractually agreed in advance to waive or limit its fees so that the Class R6 transfer agent fees do not exceed 0.02% based on the average net assets of the class until April 30, 2020.
h. Other Affiliated Transactions
At June 30, 2019, one or more of the funds in Franklin Fund Allocator Series owned 11.3% of the Fund’s outstanding shares.
| 36 | Semiannual Report | franklintempleton.com | ||
FRANKLIN MUTUAL SERIES FUNDS
NOTES TO FINANCIAL STATEMENTS (UNAUDITED)
Franklin Mutual Shares Fund(continued)
4. Expense Offset Arrangement
The Fund has entered into an arrangement with its custodian whereby credits realized as a result of uninvested cash balances are used to reduce a portion of the Fund’s custodian expenses. During the period ended June 30, 2019, the custodian fees were reduced as noted in the Statement of Operations.
5. Independent Trustees’ Retirement Plan
On January 1, 1993, the Trust adopted an Independent Trustees’ Retirement Plan (Plan). The Plan is an unfunded defined benefit plan that provides benefit payments to Trustees whose length of service and retirement age meets the eligibility requirements of the Plan. Benefits under the Plan are based on years of service and fees paid to each trustee at the time of retirement. Effective in December 1996, the Plan was closed to new participants.
During the period ended June 30, 2019, the Fund’s projected benefit obligation and benefit payments under the Plan were as follows:
aProjected benefit obligation at June 30, 2019 | $ | 1,063,452 | ||
bIncrease in projected benefit obligation | $ | 116,062 | ||
Benefit payments made to retired trustees | $ | (8,315 | ) |
aThe projected benefit obligation is included in trustees’ fees and expenses in the Statement of Assets and Liabilities.
bThe increase in projected benefit obligation is included in trustees’ fees and expenses in the Statement of Operations.
6. Income Taxes
At June 30, 2019, the cost of investments and net unrealized appreciation (depreciation) for income tax purposes were as follows:
Cost of investments | $ | 10,595,568,956 | ||
|
| |||
Unrealized appreciation | $ | 3,179,874,920 | ||
Unrealized depreciation | (664,934,067) | |||
|
| |||
Net unrealized appreciation (depreciation) | $ | 2,514,940,853 | ||
|
| |||
Differences between income and/or capital gains as determined on a book basis and a tax basis are primarily due to differing treatment of foreign currency transactions.
7. Investment Transactions
Purchases and sales of investments (excluding short term securities and securities sold short) for the period ended June 30, 2019, aggregated $1,226,502,771 and $1,528,618,714, respectively.
8. Credit Risk and Defaulted Securities
The Fund may purchase thepre-default or defaulted debt of distressed companies. Distressed companies are financially troubled and could be or are already involved in financial restructuring or bankruptcy. Risks associated with purchasing these securities include the possibility that the bankruptcy or other restructuring process takes longer than expected, or that distributions in restructuring are less than anticipated, either or both of which may result in unfavorable consequences to the Fund. If it becomes probable that the income on debt securities, including those of distressed companies, will not be collected, the Fund discontinues accruing income and recognizes an adjustment for uncollectible interest.
| franklintempleton.com | Semiannual Report | 37 | ||||
FRANKLIN MUTUAL SERIES FUNDS
NOTES TO FINANCIAL STATEMENTS (UNAUDITED)
Franklin Mutual Shares Fund(continued)
8. Credit Risk and Defaulted Securities(continued)
At June 30, 2019, the aggregate long value of distressed company securities for which interest recognition has been discontinued was $18,658,649, representing 0.1% of the Fund’s net assets. For information as to specific securities, see the accompanying Statement of Investments.
9. Restricted Securities
The Fund invests in securities that are restricted under the Securities Act of 1933 (1933 Act). Restricted securities are often purchased in private placement transactions, and cannot be sold without prior registration unless the sale is pursuant to an exemption under the 1933 Act. Disposal of these securities may require greater effort and expense, and prompt sale at an acceptable price may be difficult. The Fund may have registration rights for restricted securities. The issuer generally incurs all registration costs.
At June 30, 2019, investments in restricted securities, excluding securities exempt from registration under the 1933 Act deemed to be liquid, were as follows:
| Principal Amount/ Shares/ Warrants | Issuer | Acquisition Date | Cost | Value | ||||||||||
19,594 | Broadband Ventures III LLC, secured promissory note, 5.00%, 2/01/12 | 7/01/10 - 11/30/12 | $ | 19,594 | $ | — | ||||||||
2,086,072 | iHeartMedia Inc., A | 1/03/11 - 12/19/13 | 48,894,322 | 30,279,932 | ||||||||||
35,201 | iHeartMedia Inc., B | 1/03/11 - 12/19/13 | 822,964 | 510,952 | ||||||||||
1,786 | iHeartMedia Inc., wts., A, 5/01/39 | 1/03/11 - 12/19/13 | 41,802 | 25,922 | ||||||||||
7,234,813 | International Automotive Components Group Brazil LLC | 4/13/06 - 12/26/08 | 4,804,678 | 185,776 | ||||||||||
|
| |||||||||||||
Total Restricted Securities(Value is 0.2% of Net Assets) |
$ |
54,583,360 |
| $ | 31,002,582 | |||||||||
|
| |||||||||||||
10. Unfunded Loan Commitments
The Fund enters into certain credit agreements, all or a portion of which may be unfunded. The Fund is obligated to fund these loan commitments at the borrowers’ discretion. Unfunded loan commitments and funded portions of credit agreements are marked to market daily and any unrealized appreciation or depreciation is included in the Statement of Assets and Liabilities and the Statement of Operations. Funded portions of credit agreements are presented in the Statement of Investments.
At June 30, 2019, unfunded commitments were as follows:
| Borrower | Unfunded Commitment | |||
| ||||
Windstream Services LLC, Revolving Commitment | $199,500 | |||
|
| |||
| 38 | Semiannual Report | franklintempleton.com | ||
FRANKLIN MUTUAL SERIES FUNDS
NOTES TO FINANCIAL STATEMENTS (UNAUDITED)
Franklin Mutual Shares Fund(continued)
11. Other Derivative Information
At June 30, 2019, investments in derivative contracts are reflected in the Statement of Assets and Liabilities as follows:
| Asset Derivatives | Liability Derivatives | |||||||||||||||
|
| |||||||||||||||
Derivative Contracts Not Accounted for as Hedging Instruments |
Statement of Assets and Liabilities Location | Fair Value | Statement of Assets and Liabilities Location | Fair Value | ||||||||||||
| ||||||||||||||||
Foreign exchange contracts | Variation margin on futures contracts | $ | 153,499 | a | Variation margin on futures contracts | $ | 366,973 | a | ||||||||
Unrealized appreciation on OTC forward exchange contracts | 5,278,017 | Unrealized depreciation on OTC forward exchange contracts | 2,031,967 | |||||||||||||
|
|
|
| |||||||||||||
Totals | $ | 5,431,516 | $ | 2,398,940 | ||||||||||||
|
|
|
| |||||||||||||
aThis amount reflects the cumulative appreciation (depreciation) of futures contracts as reported in the Statement of Investments. Only the variation margin receivable/ payable at period end is separately reported within the Statement of Assets and Liabilities. Prior variation margin movements were recorded to cash upon receipt or payment.
For the period ended June 30, 2019, the effect of derivative contracts in the Statement of Operations was as follows:
Derivative Contracts Not Accounted for as Hedging Instruments | Statement of Operations Location | Net Realized Gain (Loss) for the Period | Statement of Operations Location | Net Change in Unrealized Appreciation (Depreciation) for the Period | ||||||||
| Net realized gain (loss) from: | Net change in unrealized appreciation (depreciation) on: | |||||||||||
Foreign exchange contracts | Forward exchange contracts | $18,416,609 | Forward exchange contracts | $(4,517,241) | ||||||||
| Futures contracts | 4,444,658 | Futures contracts | (678,487) | |||||||||
|
|
|
| |||||||||
Totals | $22,861,267 | $(5,195,728) | ||||||||||
|
|
|
| |||||||||
For the period ended June 30, 2019, the average month end notional amount of futures contracts represented $317,075,136. The average month end contract value of forward exchange contracts was $596,002,841.
See Note 1(d) regarding derivative financial instruments.
12. Holdings of 5% Voting Securities of Portfolio Companies
The 1940 Act defines “affiliated companies” to include investments in portfolio companies in which a fund owns 5% or more of the outstanding voting securities. During the period ended June 30, 2019, investments in “affiliated companies” were as follows:
| Name of Issuer | Value at Beginning of Period | Purchases | Sales | Realized Gain (Loss) | Net Change in Unrealized Appreciation (Depreciation) | Value at End of | Number of of Period | Dividend Income | ||||||||||||||||||||||||
| Non-Controlled Affiliates | ||||||||||||||||||||||||||||||||
Alexander’s Inc. | $99,550,939 | $ — | $(10,386,145 | ) | $ 9,084,294 | $12,694,273 | $110,943,361 | 299,604 | $2,898,806 | |||||||||||||||||||||||
International Automotive Components Group Brazil LLC | 306,590 | — | — | — | (120,814 | ) | 185,776 | 7,234,813 | — | |||||||||||||||||||||||
International Automotive Components Group North America LLC | 7,519,120 | — | (9,398,900 | ) | $(42,263,636 | ) | 44,143,416 | — | — | — | ||||||||||||||||||||||
| franklintempleton.com | Semiannual Report | 39 | ||||
FRANKLIN MUTUAL SERIES FUNDS
NOTES TO FINANCIAL STATEMENTS (UNAUDITED)
Franklin Mutual Shares Fund(continued)
12. Holdings of 5% Voting Securities of Portfolio Companies(continued)
| Name of Issuer | Value at of Period | Purchases | Sales | Realized Gain (Loss) | Net Change in Unrealized Appreciation (Depreciation) | Value at End of Period | Number of of Period | Dividend Income | ||||||||||||||||||||||||
| Non-Controlled Affiliates(continued) |
| |||||||||||||||||||||||||||||||
TRU Kids Parent LLC | $ | — | $36,597,430 | a | $ | — | $ | — | $ (9,335,658 | ) | $ | 27,261,772 | 7,469 | $ | — | |||||||||||||||||
Wayne Services Legacy Inc. | — | 2,612,332 | a | — | — | — | 2,612,332 | 7,469 | — | |||||||||||||||||||||||
|
|
|
| |||||||||||||||||||||||||||||
Total Affiliated Securities(Value is 1.1% of Net Assets) | $ | 107,376,649 | $ | 39,209,762 | $ | (19,785,045 | ) | $ | (33,179,342 | ) | $47,381,217 | $ | 141,003,241 | $ | 2,898,806 | |||||||||||||||||
|
|
|
| |||||||||||||||||||||||||||||
aPurchase was the result of a corporate action.
13. Credit Facility
The Fund, together with other U.S. registered and foreign investment funds (collectively, Borrowers), managed by Franklin Templeton, are borrowers in a joint syndicated senior unsecured credit facility totaling $2 billion (Global Credit Facility) which matures on February 7, 2020. This Global Credit Facility provides a source of funds to the Borrowers for temporary and emergency purposes, including the ability to meet future unanticipated or unusually large redemption requests.
Under the terms of the Global Credit Facility, the Fund shall, in addition to interest charged on any borrowings made by the Fund and other costs incurred by the Fund, pay its share of fees and expenses incurred in connection with the implementation and maintenance of the Global Credit Facility, based upon its relative share of the aggregate net assets of all of the Borrowers, including an annual commitment fee of 0.15% based upon the unused portion of the Global Credit Facility. These fees are reflected in other expenses in the Statement of Operations. During the period ended June 30, 2019, the Fund did not use the Global Credit Facility.
14. Fair Value Measurements
The Fund follows a fair value hierarchy that distinguishes between market data obtained from independent sources (observable inputs) and the Fund’s own market assumptions (unobservable inputs). These inputs are used in determining the value of the Fund’s financial instruments and are summarized in the following fair value hierarchy:
| • | Level 1 – quoted prices in active markets for identical financial instruments |
| • | Level 2 – other significant observable inputs (including quoted prices for similar financial instruments, interest rates, prepayment speed, credit risk, etc.) |
| • | Level 3 – significant unobservable inputs (including the Fund’s own assumptions in determining the fair value of financial instruments) |
The input levels are not necessarily an indication of the risk or liquidity associated with financial instruments at that level.
| 40 | Semiannual Report | franklintempleton.com | ||
FRANKLIN MUTUAL SERIES FUNDS
NOTES TO FINANCIAL STATEMENTS (UNAUDITED)
Franklin Mutual Shares Fund(continued)
A summary of inputs used as of June 30, 2019, in valuing the Fund’s assets and liabilities carried at fair value, is as follows:
| Level 1 | Level 2 | Level 3 | Total | |||||||||||||
| Assets: | ||||||||||||||||
Investments in Securities:a | ||||||||||||||||
Equity Investments:b | ||||||||||||||||
Auto Components | $ | 18,122,039 | $ | — | $ | 185,776 | $ | 18,307,815 | ||||||||
Chemicals | — | — | 6,225,160 | 6,225,160 | ||||||||||||
Machinery | 44,610,350 | 54,301,508 | — | 98,911,858 | ||||||||||||
Media | 832,092,667 | 2,780,944 | 30,816,806 | 865,690,417 | ||||||||||||
Specialty Retail | — | — | 27,261,772 | 27,261,772 | ||||||||||||
Technology Hardware, Storage & Peripherals | 465,471,668 | — | 2,612,332 | 468,084,000 | ||||||||||||
All Other Equity Investments | 10,505,456,799 | — | — | 10,505,456,799 | ||||||||||||
Corporate Notes and Senior Floating Rate Interests | — | 459,810,678 | — | 459,810,678 | ||||||||||||
Corporate Bonds and Notes in Reorganization | — | 18,658,649 | — | c | 18,658,649 | |||||||||||
Companies in Liquidation | — | 291,266 | — | c | 291,266 | |||||||||||
Short Term Investments | 556,784,632 | 115,700,000 | — | 672,484,632 | ||||||||||||
|
| |||||||||||||||
Total Investments in Securities | $ | 12,422,538,155 | $ | 651,543,045 | $ | 67,101,846 | $ | 13,141,183,046 | ||||||||
|
| |||||||||||||||
Other Financial Instruments: | ||||||||||||||||
Futures Contracts | $ | 153,499 | $ | — | $ | — | $ | 153,499 | ||||||||
Forward Exchange Contracts | — | 5,278,017 | — | 5,278,017 | ||||||||||||
Unfunded Loan Commitments | — | 32,442 | — | 32,442 | ||||||||||||
|
| |||||||||||||||
Total Other Financial Instruments | $ | 153,499 | $ | 5,310,459 | $ | — | $ | 5,463,958 | ||||||||
|
| |||||||||||||||
| Liabilities: | ||||||||||||||||
Other Financial Instruments: | ||||||||||||||||
Securities Sold Shorta | $ | 33,713,190 | $ | — | $ | — | $ | 33,713,190 | ||||||||
Futures Contracts | 366,973 | — | — | 366,973 | ||||||||||||
Forward Exchange Contracts | — | 2,031,967 | — | 2,031,967 | ||||||||||||
|
| |||||||||||||||
Total Other Financial Instruments | $ | 34,080,163 | $ | 2,031,967 | $ | — | $ | 36,112,130 | ||||||||
|
| |||||||||||||||
aFor detailed categories, see the accompanying Statement of Investments.
bIncludes common stocks as well as other equity interests.
cIncludes securities determined to have no value at June 30, 2019.
A reconciliation of assets in which Level 3 inputs are used in determining fair value is presented when there are significant Level 3 financial instruments at the beginning and/or end of the period.
15. New Accounting Pronouncements
In August 2018, the Financial Accounting Standards Board issued Accounting Standards Update (ASU)No. 2018-14, Compensation—Retirement Benefits—Defined Benefit Plans—General (Subtopic715-20): Disclosure Framework—Changes to the Disclosure Requirements for Defined Benefit Plans. The amendments in the ASU modify the disclosure requirements for employers that sponsor defined benefit pension or other postretirement plans. The ASU is effective for annual reporting periods ending after December 15, 2020. Management has reviewed the requirements and believes the adoption of this ASU will not have a material impact on the financial statements.
| franklintempleton.com | Semiannual Report | 41 | ||||
FRANKLIN MUTUAL SERIES FUNDS
NOTES TO FINANCIAL STATEMENTS (UNAUDITED)
Franklin Mutual Shares Fund(continued)
16. Subsequent Events
The Fund has evaluated subsequent events through the issuance of the financial statements and determined that no events have occurred that require disclosure.
Abbreviations
| Counterparty | Currency | Selected Portfolio | ||||||||
| BOFA | Bank of America Corp. | EUR | Euro | ADR | American Depositary Receipt | |||||
| BONY | The Bank of New York Mellon Corp. | GBP | British Pound | FHLB | Federal Home Loan Bank | |||||
| HSBK | HSBC Bank PLC | USD | United States Dollar | LIBOR | London InterBank Offered Rate | |||||
| SSBT | State Street Bank and Trust Co., N.A. | |||||||||
| UBSW | UBS AG | |||||||||
| 42 | Semiannual Report | franklintempleton.com | ||
FRANKLIN MUTUAL SERIES FUNDS
FRANKLIN MUTUAL SHARES FUND
Board Approval of Investment
Management Agreements
FRANKLIN MUTUAL SERIES FUNDS
Franklin Mutual Shares Fund
(Fund)
The Board of Trustees (Board), including a majority of trustees that are not “interested persons” as such term is defined in section 2(a)(19) of the Investment Company Act of 1940 (hereinafter referred to as “independent trustees”), at anin-person meeting held on May 22, 2019, unanimously approved the renewal of the Fund’s investment management agreement. Prior to a meeting of all of the trustees for the purpose of considering such renewal, the independent trustees participated in two other meetings held in connection with the renewal process. Throughout the process, the independent trustees received assistance and advice from and met separately with independent counsel. The independent trustees met with and interviewed officers of the investment manager (including portfolio managers), the transfer agent and shareholder services group and the distributor. In approving the renewal of the investment management agreement for the Fund, the Board, including the independent trustees, determined that the investment management fee structure was fair and reasonable and that continuance of the agreement was in the best interests of the Fund and its shareholders.
In reaching their decision on the investment management agreement, the trustees took into account information furnished throughout the year at regular Board meetings, as well as information specifically requested and furnished for the renewal process, which culminated in the meetings referred to above for the specific purpose of considering such agreement. Information furnished throughout the year included, among others, reports on the Fund’s investment performance, expenses, portfolio composition, portfolio brokerage execution, client commission arrangements, derivatives, securities lending, asset segregation, portfolio turnover, Rule12b-1 plan, distribution, shareholder servicing, legal and compliance matters, pricing of securities, sales and redemptions, and marketing support payments made to financial intermediaries, as well as a third-party survey of transfer agent fees charged to funds within the Franklin Templeton Investments (FTI) complex in comparison with those charged to other fund complexes deemed comparable. Also, related financial statements and other information about the scope and quality of services provided by the investment manager and its affiliates and enhancements to
such services over the past year were provided. In addition, the trustees received periodic reports throughout the year and during the renewal process relating to compliance with the Fund’s investment policies and restrictions. During the renewal process, the independent trustees considered the investment manager’s methods of operation within the Franklin Templeton group and its activities on behalf of other clients. The Board also noted that it received an annual report on all payments made by FTI or the Fund to financial intermediaries engaged in the sale of Fund shares, as well as a memorandum relating to third-party servicing arrangements in response to a Guidance Update from the U.S. Securities and Exchange Commission (SEC) relating to mutual fund distribution andsub-accounting fees.
The information obtained by the trustees during the renewal process also included a special report prepared by Broadridge Financial Solutions, Inc., an independent third-party analyst that utilizes data from Lipper, Inc. (“Lipper”), comparing the Fund’s investment performance and expenses with those of other mutual funds deemed comparable to the Fund as selected by Lipper (Broadridge Section 15(c) Report). The trustees reviewed the Broadridge Section 15(c) Report and its usefulness in the renewal process with respect to matters such as comparative fees, expenses, expense ratios, performance and volatility. They concluded that the report continues to be a reliable resource in the performance of their duties.
In addition, the trustees received a Profitability Study (Profitability Study) prepared by management discussing the profitability to FTI from its overall U.S. fund operations, as well as on an individualfund-by-fund basis. Over the past year, the Board and counsel to the independent trustees continued to receive reports on management’s handling of recent regulatory inquiries and pending legal actions against the investment manager and its affiliates. The independent trustees were satisfied with the actions taken to date by management in response to such regulatory and legal matters.
The trustees reviewed the personnel, operations, financial condition, and investment management capabilities, methodologies and resources of the investment manager. As part of this review, particular attention was given to management’s diligent risk management program, including continual monitoring and management of cybersecurity, liquidity and counterparty credit risk, and attention given to derivatives and other complex instruments that are held and expected to be held by the Fund and how such instruments
| franklintempleton.com | Semiannual Report | 43 | ||||
FRANKLIN MUTUAL SERIES FUNDS
FRANKLIN MUTUAL SHARES FUND
SHAREHOLDER INFORMATION
are used to carry out the Fund’s investment goal(s). The Board also took into account, among other things, management’s efforts in establishing a global credit facility for the benefit of the Fund and other accounts managed by FTI to provide a source of cash for temporary and emergency purposes or to meet unusual redemption requests as well as the strong financial position of the investment manager’s parent company and its commitment to the mutual fund business. The Board noted management’s continuing efforts and expenditures in establishing effective business continuity plans and developing strategies to address areas of heightened concern in the mutual fund industry, such as cybersecurity and liquidity risk management. The Board also recognized management’s commitment to facilitating Board oversight of particular areas, including derivatives and payments to intermediaries, by enhanced reporting.
In addition to the above and other matters considered by the trustees throughout the course of the year, the following discussion relates to certain primary factors relevant to the Board’s decision. This discussion of the information and factors considered by the Board (including the information and factors discussed above) is not intended to be exhaustive, but rather summarizes certain factors considered by the Board. In view of the wide variety of factors considered, the Board did not, unless otherwise noted, find it practicable to quantify or otherwise assign relative weights to the foregoing factors. In addition, individual trustees may have assigned different weights to various factors.
NATURE, EXTENT AND QUALITY OF SERVICES.The trustees reviewed the nature, extent and quality of the services provided, and to be provided, by the investment manager. The trustees cited the investment manager’s ability to implement the Fund’s disciplined value investment approach and its long-term relationship with the Fund as reasons that shareholders choose to invest, and remain invested, in the Fund. The trustees reviewed the Fund’s portfolio management team, including its performance, staffing, skills and compensation program. With respect to portfolio manager compensation, management assured the trustees that the Fund’s long-term performance is a significant component of incentive-based compensation and noted that a portion of a portfolio manager’s incentive-based compensation is paid in shares ofpre-designated funds from the portfolio manager’s fund management area. The trustees noted that the portfolio manager compensation program aligned the interests of the portfolio managers with that of shareholders of the Fund. The trustees discussed with
management various other products, portfolios and entities that are advised by the investment manager and the allocation of assets and expenses among and within them, as well as their relative fees and reasons for differences with respect thereto and any potential conflicts. During regular Board meetings and the aforementioned meetings of the independent trustees, the trustees received reports and presentations on the investment manager’s best execution trading policies. The trustees considered periodic reports provided to them showing that the investment manager complied with the investment policies and restrictions of the Fund as well as other reports periodically furnished to the Board covering matters such as the compliance of portfolio managers and other management personnel with the code of ethics covering the investment management personnel, the adherence to fair value pricing procedures established by the Board and the accuracy of net asset value calculations. The Board noted the extent of the benefits provided to Fund shareholders from being part of the Franklin Templeton group of funds, including the right to exchange investments between funds (same class) without a sales charge, the ability to reinvest Fund dividends into other funds and the right to combine holdings of other funds to obtain reduced sales charges. The Board considered the investment manager’s significant efforts in developing and implementing compliance procedures established in accordance with SEC and other requirements.
The Board considered the nature, extent and quality of the services to be provided under the Fund’s other service agreements to determine that, on an overall basis, Fund shareholders were well served. In this connection, the Board also took into account transfer agent and shareholder services provided to Fund shareholders by an affiliate of the investment manager, noting continuing expenditures by management to increase and improve the scope of such services and favorable periodic reports on shareholder services conducted by independent third parties. While such considerations directly affected the trustees’ decision in renewing the Fund’s transfer agent and shareholder services agreement, the Board also considered these commitments as incidental benefits to Fund shareholders deriving from the investment management relationship.
Based on their review, the trustees were satisfied with the nature and quality of the overall services provided, and to be provided, by the investment manager and its affiliates to the Fund and its shareholders and were confident in the abilities of the management team to continue the disciplined value
| 44 | Semiannual Report | franklintempleton.com | ||
FRANKLIN MUTUAL SERIES FUNDS
FRANKLIN MUTUAL SHARES FUND
SHAREHOLDER INFORMATION
investment approach of the Fund and to provide quality services to the Fund and its shareholders.
INVESTMENT PERFORMANCE.The trustees reviewed and placed significant emphasis on the investment performance of the Fund over theone-, three-, five- and10-year periods ended December 31, 2018. They considered the history of successful performance of the Fund relative to various benchmarks. As part of their review, they inquired of management regarding benchmarks, style drift and restrictions on permitted investments. Consideration was also given to performance in the context of available levels of cash during the periods.
The trustees had meetings during the year, including the meetings referred to above held in connection with the renewal process, with the Fund’s portfolio managers to discuss performance and the management of the Fund. In addition to the materials provided by management in connection with the renewal process, the independent trustees requested throughout the year (and received) additional presentations from the investment manager and senior management of FTI regarding the performance of the investment manager and the Fund. As part of these presentations, the investment manager and senior management of FTI reviewed enhancements that have been made, and are being made, to the investment manager’s investment process. In addition, particular attention in assessing performance was given to the Broadridge Section 15(c) Report. That report showed the investment performance of the Fund (Class A shares) in comparison to other funds determined comparable by Lipper.
The comparable funds to the Fund, as chosen by Lipper, included all retail and institutionalmulti-cap value funds. The Fund had total returns in the second-best performing quintile for theone-year period ended December 31, 2018, and had annualized total returns for the three- and five-year periods in the second-lowest performing quintile. The trustees noted that the Fund’s total return on an annualized basis for the10-year period ended December 31, 2018 was in the lowest performing quintile. The trustees also compared Fund performance to other industry benchmarks, including measures of risk-adjusted performance of a fund, as part of their evaluation of investment performance. The trustees noted that the Fund exhibited improved relative performance in 2018 and discussed with management the reasons for the relative underperformance for the three-, five- and10-year periods ended December 31, 2018. Encouraged by the improved relative performance and enhancements to the
investment process noted above, the Board did not believe that any changes with respect to the Fund were warranted at the time and noted that it would continue to monitor future performance.
COMPARATIVE EXPENSES AND MANAGEMENT PROFITABILITY.The trustees considered the cost of the services provided and to be provided and the profits realized by the investment manager and its affiliates from their respective relationships with the Fund. As part of the renewal process, the trustees explored with management the trends in expense ratios over the past three fiscal years and the reasons for any increases in the Fund’s expense ratios (or components thereof). In considering the appropriateness of the management fee and other expenses charged to the Fund, the Board took into account various factors including investment performance and matters relating to Fund operations, including, but not limited to, the quality and experience of its portfolio managers and research staff. Consideration was also given to a comparative analysis in the Broadridge Section 15(c) Report of the investment management fee and total expense ratio of the Fund in comparison with those of a group of other funds selected by Lipper as its appropriate Lipper expense group. Lipper expense data is based upon information taken from each fund’s most recent annual report, which reflects historical asset levels that may be quite different from those currently existing, particularly in a period of market volatility. While recognizing such inherent limitation and the fact that expense ratios generally increase as assets decline and decrease as assets grow, the Board believed the independent analysis conducted by Lipper to be an appropriate measure of comparative expenses.
In reviewing comparative costs, emphasis was given to the Fund’s contractual management fee in comparison with the contractual management fee that would have been charged by other funds within its Lipper expense group assuming they were similar in size to the Fund, as well as the actual total expenses of the Fund in comparison with those of its Lipper expense group. The Lipper contractual management fee analysis includes administrative charges as being part of the management fee, and total expenses, for comparative consistency, are shown by Lipper for Fund Class A shares.
The Fund’s contractual management fee rate was in the second-least expensive quintile of its Lipper expense group and its total expenses were in the least expensive quintile of such group. The Board was satisfied with such comparative fees and expenses.
| franklintempleton.com | Semiannual Report | 45 | ||||
FRANKLIN MUTUAL SERIES FUNDS
FRANKLIN MUTUAL SHARES FUND
SHAREHOLDER INFORMATION
The trustees also reviewed the Profitability Study addressing profitability of Franklin Resources, Inc., from its overall U.S. fund business, as well as profitability to the Fund’s investment manager and its affiliates, from providing investment management and other services to the Fund during the12-month period ended September 30, 2018, the most recent fiscalyear-end of Franklin Resources, Inc. The trustees reviewed the basis on which such reports are prepared and the cost allocation methodology utilized in the Profitability Study, it being recognized that allocation methodologies may each be reasonable while producing different results. In this respect, the Board noted that the reasonableness of the cost allocation methodologies was reviewed by independent accountants on an every other year basis.
The independent trustees met with management to discuss the Profitability Study. This included, among other things, a comparison of investment management income with investment management expenses of the Fund; comparison of underwriting revenues and expenses; the relative relationship of investment management and underwriting expenses; shareholder servicing profitability; economies of scale; and the relative contribution of the Fund to the profitability of the investment manager and its parent. In discussing the Profitability Study with the Board, the investment manager stated its belief that the costs incurred in establishing the infrastructure necessary to operate the type of mutual fund operations conducted by it and its affiliates may not be fully reflected in the expenses allocated to the Fund in determining its profitability.
The Board also took into account management’s expenditures in improving shareholder services provided to the Fund, as well as the need to meet additional regulatory and compliance requirements. The trustees also considered the extent to which the investment manager may derive ancillary benefits from Fund operations, including those derived from economies of scale, discussed below, the allocation of Fund brokerage and the use of commission dollars to pay for research and other similar services.
Based upon their consideration of all these factors, the trustees determined that the level of profits realized by the investment manager and its affiliates in providing services to the Fund was not excessive in view of the nature, quality and extent of services provided.
ECONOMIES OF SCALE.The Board considered economies of scale realized by the investment manager and its affiliates as the Fund grows larger and the extent to which they are
shared with Fund shareholders, as for example, in the level of the investment management fee charged, in the quality and efficiency of services rendered and in increased capital commitments benefiting the Fund directly or indirectly. While recognizing that any precise determination is inherently subjective, the trustees noted that, based upon the Profitability Study, as some funds increase in size, at some point economies of scale may result in the investment manager realizing a larger profit margin on investment management services provided to such a fund. The trustees also noted that benefits of economies of scale will be shared with Fund shareholders due to the decline in the effective investment management fee rate as breakpoints are achieved by the Fund.
The trustees noted that breakpoints had been instituted as part of the Fund’s investment management fee and that the Board regularly evaluates whether additional breakpoints are appropriate. The trustees assessed the savings to shareholders resulting from such breakpoints and believed they were, and continue to be, appropriate and they agreed to continue to monitor the appropriateness of the breakpoints. The trustees also considered the effects an increase in assets under management would have on the investment management fee and expense ratio of the Fund. To the extent further economies of scale may be realized by the investment manager and its affiliates, the Board believed the investment management fees provide a sharing of benefits with the Fund and its shareholders.
Proxy Voting Policies and Procedures
The Fund’s investment manager has established Proxy Voting Policies and Procedures (Policies) that the Fund uses to determine how to vote proxies relating to portfolio securities. Shareholders may view the Fund’s complete Policies online at franklintempleton.com. Alternatively, shareholders may request copies of the Policies free of charge by calling the Proxy Group collect at (954)527-7678 or by sending a written request to: Franklin Templeton Companies, LLC, 300 S.E. 2nd Street, Fort Lauderdale, FL 33301, Attention: Proxy Group. Copies of the Fund’s proxy voting records are also made available online at franklintempleton.com and posted on the U.S. Securities and Exchange Commission’s website at sec.gov and reflect the most recent12-month period ended June 30.
| 46 | Semiannual Report | franklintempleton.com | ||
FRANKLIN MUTUAL SERIES FUNDS
FRANKLIN MUTUAL SHARES FUND
SHAREHOLDER INFORMATION
Quarterly Statement of Investments
The Trust, on behalf of the Fund, files a complete statement of investments with the U.S. Securities and Exchange Commission for the first and third quarters for each fiscal year as an exhibit to its report on FormN-PORT. Shareholders may view the filed FormN-PORT by visiting the Commission’s website at sec.gov. The filed form may also be viewed and copied at the Commission’s Public Reference Room in Washington, DC. Information regarding the operations of the Public Reference Room may be obtained by calling(800) SEC-0330.
| franklintempleton.com | Semiannual Report | 47 | ||||
This page intentionally left blank.
Authorized for distribution only when accompanied or preceded by a summary prospectus and/or prospectus. Investors should carefully consider a fund’s investment goals, risks, charges and expenses before investing. A prospectus contains this and other information; please read it carefully before investing.
To help ensure we provide you with quality service, all calls to and from our service areas are monitored and/or recorded.
| Semiannual Report and Shareholder Letter | |||||
| Franklin Mutual Shares Fund | ||||||
Investment Manager | Distributor | Shareholder Services | ||||
| Franklin Mutual Advisers, LLC | Franklin Templeton Distributors, Inc. (800) DIAL BEN®/342-5236 franklintempleton.com | (800) 632-2301 - (Class A, C, R & R6) (800)448-FUND - (Class Z) | ||||
| © 2019 Franklin Templeton Investments. All rights reserved. | 474 S 08/19 |
Sign up for electronic delivery at franklintempleton.com/edelivery
Internet Delivery of Fund Reports Unless You Request Paper Copies: Effective January 1, 2021, as permitted by the SEC, paper copies of the Fund’s shareholder reports will no longer be sent by mail, unless you specifically request them from the Fund or your financial intermediary. Instead, the reports will be made available on a website, and you will be notified by mail each time a report is posted and provided with a website link to access the report.
If you already elected to receive shareholder reports electronically, you will not be affected by this change and you need not take any action. If you have not signed up for electronic delivery, we would encourage you to join fellow shareholders who have. You may elect to receive shareholder reports and other communications electronically from the Fund by calling (800)632-2301 or by contacting your financial intermediary.
You may elect to continue to receive paper copies of all your future shareholder reports free of charge by contacting your financial intermediary or, if you invest directly with a Fund, calling (800)632-2301 to let the Fund know of your request. Your election to receive reports in paper will apply to all funds held in your account.
FRANKLIN TEMPLETON
Successful investing begins with ambition. And achievement only comes when you reach for it. That’s why we continually strive to deliver better outcomes for investors. No matter what your goals are, our deep, global investment expertise allows us to offer solutions that can help.
During our more than 70 years of experience, we’ve managed through all kinds of markets—up, down and those in between. We’re always preparing for what may come next. It’s because of this, combined with our strength as one of the world’s largest asset managers that we’ve earned the trust of millions of investors around the world.
Dear Franklin Mutual Financial Services Fund Shareholder:
The markets came into 2019 in a fog of uncertainty. The outlook for economic growth had become less bright and fears were mounting that the U.S. Federal Reserve (Fed) would make a policy misstep in raising interest rates too far. Over the past six months, many of these economic concerns have eased, as the Fed and other major central banks like the European Central Bank (ECB) turned more dovish amid signs that growth was becoming a bit more sluggish. The ECB suggested it would act should growth soften and inflation not materialize. This dovishness helped propel the U.S. equity market back toward record highs in June. Bond yields, meanwhile, fell on the prospect for increased central bank-driven liquidity, with some sovereign European bonds sliding back into negative territory.
Although the prospects of a more accommodative monetary policy eased fears about the economic outlook, persistent trade tensions between the U.S. and China, among other nations, kept markets on edge. This was on full display in May when markets fell sharply on a ratcheting up of tensions and after the U.S. government threatened to place tariffs on Mexican goods. Mideast tensions also began to heat up in June with attacks on oil tankers in the Persian Gulf and greater tensions between the U.S. and Iran.
How, and even whether, the U.K. will leave the European Union has also remained unresolved. Atperiod-end, the U.K. Conservative Party was conducting a leadership contest,
which has the potential to complicate future Brexit negotiations and leave markets vulnerable to increased volatility.
Despite all this uncertainty, for thesix-month period ended June 30, 2019, U.S. stocks, as measured by the Standard & Poor’s 500® Index (S&P 500®), posted a +18.54% total return, while stocks in global developed markets, as measured by the MSCI World Index, posted a +17.38% total return.1
As has been the case in recent years, growth stocks, particularly in the technology sector, have outperformed over thesix-month period. Value stocks generally have remained disfavored in this environment where, at times, economic factors and monetary policy have had greater sway on equity returns than corporate fundamentals.
We recognize the important role of financial advisors in today’s markets and encourage investors to continue to seek their advice. Amid changing markets and economic conditions, we are confident investors with a well-diversified portfolio and a patient, long-term outlook will be well positioned for the years ahead.
On the following pages, the Fund’s portfolio management team reviews investment decisions that pertain to performance during the past six months considering the
1. Source: Morningstar.
See www.franklintempletondatasources.com for additional data provider information.
| Not FDIC Insured | | | May Lose Value | | | No Bank Guarantee |
| franklintempleton.com | Not part of the semiannual report | 1 | ||||
economic environment and other factors. Please remember all securities markets fluctuate, as do mutual fund share prices.
We thank you for investing with Franklin Templeton, welcome your questions and comments, and look forward to continuing to serve your investment needs in the years ahead.
Sincerely,

Peter A. Langerman
Chairman, President and Chief Executive Officer
Franklin Mutual Advisers, LLC
This letter reflects our analysis and opinions as of June 30, 2019, unless otherwise indicated. The information is not a complete analysis of every aspect of any market, country, industry, security or fund. Statements of fact are from sources considered reliable.
Semiannual Report | ||||
| 3 | ||||
| 9 | ||||
| 11 | ||||
| 12 | ||||
| 20 | ||||
| 24 | ||||
| 35 | ||||
| Visitfranklintempleton.comfor fund updates, to access your account, or to find helpful financial planning tools. |
| 2 | Not part of the semiannual report | franklintempleton.com | ||||
SEMIANNUAL REPORT
Franklin Mutual Financial Services Fund
This semiannual report for Franklin Mutual Financial Services Fund covers the period ended June 30, 2019.
Your Fund’s Goal and Main Investments
The Fund seeks capital appreciation, which may occasionally be short term, with income as a secondary goal. Under normal market conditions, the Fund invests at least 80% of its net assets in securities of financial services companies that the investment manager believes are available at market prices less than their intrinsic value. The Fund invests primarily in equity securities, mainly common stocks with a current focus onmid- and large cap companies. To a lesser extent, the Fund also invests in merger arbitrage securities and the debt and equity of distressed companies. The Fund may invest in foreign securities without limit. The Geographic Composition bar chart on this page lists the leading countries where the Fund invests.
Performance Overview
The Fund’s Class Z shares posted a cumulative total return of +10.95% for the six months ended June 30, 2019. For comparison, the Fund’s primary benchmark, the MSCI World Financials Index (USD), which captures large and midcap representation across 23 developed markets countries, posted a +15.60% total return, while its secondary benchmark, the Standard & Poor’s 500 (S&P 500®) Financials Index, which tracks financials stocks in the S&P 500 Index, posted a +17.24% total return.1 You can find more of the Fund’s performance data in the Performance Summary beginning on page 9.
Performance data represent past performance, which does not guarantee future results. Investment return and principal value will fluctuate, and you may have a gain or loss when you sell your shares. Current performance may differ from figures shown. For most recentmonth-end performance, go tofranklintempleton.comor call(800)342-5236.
Economic and Market Overview
The global economy expanded during the six months ended June 30, 2019 despite weakness in certain regions. Global
Geographic Composition*
Based on Total Net Assets as of 6/30/19
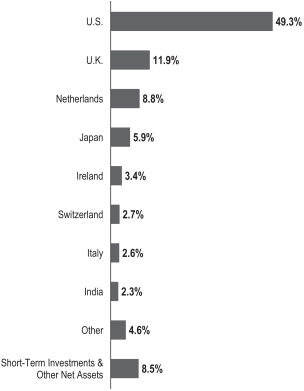
*Figures are stated as a percentage of total and may not equal 100% or may be negative due to rounding, use of any derivatives, unsettled trades or other factors.
developed and emerging market stocks were aided by upbeat economic data in some regions, encouraging corporate earnings reports and periods of optimism about a potential U.S.-China trade deal. Further supporting markets were the U.S. Federal Reserve’s (Fed’s) patient approach to its monetary policy in 2019 and recent indication it will act as appropriate to sustain U.S. economic expansion.
However, markets reflected concerns about political uncertainties in the U.S. and the European Union, geopolitical risks in certain regions, and the impact of U.S. trade disputes with China and other trading partners on global growth and corporate earnings. In this environment,
1. Source: Morningstar.
The indexes are unmanaged and include reinvestment of any income or distributions. They do not reflect any fees, expenses or sales charges. One cannot invest directly in an index, and an index is not representative of the Fund’s portfolio.
The dollar value, number of shares or principal amount, and names of all portfolio holdings are listed in the Fund’s Statement of Investments (SOI).
The SOI begins on page 16.
franklintempleton.com |
Semiannual Report |
|
3 |
| ||
FRANKLIN MUTUAL FINANCIAL SERVICES FUND
global developed and emerging market stocks, as measured by the MSCI All Country World Index, posted a +16.60% total return for thesix-month period.1
The U.S. economy grew during the six months ended June 30, 2019. After moderating for two consecutive quarters, the economy grew significantly faster in 2019’s first quarter, driven by growth in consumer spending, inventory investment, exports, business investment, and state and local government spending. However, the economy moderated again in the second quarter, due to weakness in inventory investment, exports, business investment and housing investment. The unemployment rate decreased from 3.9% in December 2018 to 3.7% atperiod-end.2 The annual inflation rate, as measured by the Consumer Price Index, decreased from 1.9% in December 2018 to 1.6% atperiod-end.2
The Fed held its target range for the federal funds rate unchanged, at 2.25%–2.50%, during the reporting period. In March, the Fed mentioned it would end its balance sheet normalization program by the end of September 2019. In June, the Fed indicated increased uncertainties around its views on economic activity and the labor market. With market-based inflation measures remaining low recently, the market has interpreted the Fed’s recent statements to mean it will likely cut rates in 2019’s second half to foster continued economic growth while attempting to achieve its inflation objective.
In Europe, the U.K.’s quarterly gross domestic product (GDP) growth accelerated in 2019’s first quarter, but GDP contracted in the second quarter compared with the first quarter as Brexit uncertainties weighed on business sentiment. The Bank of England left its key policy rate unchanged during the period. The eurozone’s quarterly GDP accelerated in 2019’s first quarter but moderated in the second quarter, and the bloc’s annual inflation rate marginally decreased byperiod-end. The European Central Bank (ECB) kept its benchmark interest rate unchanged for the same time. In June, the ECB mentioned it would leave interest rates unchanged through the first half of 2020, provided details of its new stimulus, and indicated its openness to cut rates or increase stimulus.
In Asia, Japan’s quarterly GDP growth accelerated in 2019’s first quarter. In June, the Bank of Japan also left its benchmark interest rate unchanged, while continuing its
stimulus measures, and expressed its openness to cut interest rates or increase stimulus.
In larger emerging markets, Brazil’s quarterly GDP growth contracted in 2019’s first quarter. The Central Bank of Brazil left its benchmark interest rate unchanged during the period. Russia’s annual GDP growth moderated in 2019’s first quarter. The Bank of Russia cut its key rate once during the period. China’s annual GDP growth rate stabilized in 2019’s first quarter. The People’s Bank of China left its benchmark interest rate unchanged, but it took measures to improve financial liquidity to mitigate the effects of the U.S.-China trade dispute and support economic growth. Overall, global emerging market stocks, as measured by the MSCI Emerging Markets Index, posted a +10.78% total return during thesix-month period.1
Investment Strategy
We strive to provide investors with superior risk-adjusted returns over time through our distinctive, value investment style, which includes investments in undervalued common stocks, and to a significantly lesser extent, distressed debt and merger arbitrage. Rigorous fundamental analysis drives our investment process. We attempt to determine each investment’s intrinsic value as well as the price at which we would be willing to commit shareholder funds. While valuation remains our key consideration, we utilize numerous fundamental factors such as return on equity, financial leverage and long-term earnings power. We also consider factors such as management quality and competitive position. As always, our approach to investing is as much about assessing risk and containing losses as it is about achieving profits. In addition, it is our practice to hedge the Fund’s currency exposure when we deem it advantageous for our shareholders.
What is return on equity?
Return on equity is a measure of profitability, expressed as a percentage, calculated by dividing a company’s net income by total shareholder equity for a given period. Return on equity tells common shareholders how effectually their money is being employed. Comparing percentages for current and prior periods also reveals trends, and comparison with industry composites reveals how well a company is holding its own against its competitors.
|
2. Source: U.S. Bureau of Labor Statistics.
See www.franklintempletondatasources.com for additional data provider information.
4 |
Semiannual Report |
franklintempleton.com |
FRANKLIN MUTUAL FINANCIAL SERVICES FUND
What is meant by “hedge”?
To hedge an investment is to take a position intended to offset potential losses that may be incurred by a companion financial instrument. Hedging an investment may also offset potential gains.
|
Manager’s Discussion
Franklin Mutual Series has long analyzed companies in many ways beyond just looking at the numbers. We analyze the way a company is run and how decisions are made at the executive and board levels. We look at the sustainability of a company, including the relationships with employees and customers, as well as the environmental impacts of a company’s business. In many ways this is common sense. A company that takes advantage of customers and unsustainably produces environmental waste is worth less than one that does not do these things. Similarly, a company that iswell-run and responsive to shareholders is worth more than one whose executives manage the company for their private benefit. However, disclosure has been limited on many relevant issues, and there is disagreement among companies, shareholders and data providers about which factors should be measured and how they should be measured.
This type of analysis is labeled ESG analysis, where ESG stands for environmental, social, and governance factors. Many firms, including Franklin Templeton, are incorporating ESG factors in their investment research. In addition, there are other bodies such as the Sustainable Accounting Standards Board that are working on standardizing metrics for companies and industries to improve their reporting on these factors, particularly in the environmental and social areas. As a result, ESG analysis is improving across the market, and Franklin Mutual Series analysts are better able to analyzenon-traditional factors, including greenhouse gas emissions, water consumption, energy usage, talent management, diversity and inclusion, executive compensation, and enterprise risk management, to name a few. ESG investing should not be confused with social or exclusionary types of investing, but should rather be viewed as an additional tool analysts and portfolio managers use in the investment process to identify and measurenon-traditional, potential business risks and opportunities at a company.
Today, Franklin Mutual Series analysts review and analyze ESG reports produced by third parties or the companies themselves to assess potential risks that could have an impact on shareholder value. In addition, we have discussions with management teams around ESG risks, how
Portfolio Composition*
Based on Total Net Assets as of 6/30/19
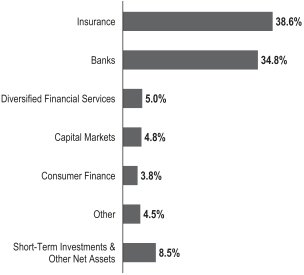
*Figures are stated as a percentage of total and may not equal 100% or may be negative due to rounding, use of any derivatives, unsettled trades or other factors.
they deal with them and the potential impact on stakeholders. Our discussions have included issues such as water consumption in mining, the impact of changing carbon dioxide emission standards on the automotive industry and discussions with boards and management teams around management pay. Although more work needs to be done to standardize data from companies within industries so that comparisons can be relevant, the identification and discussion of ESG risk factors is an input we consider in helping frame the potential negative events individual companies or industries may face. In our view, solid ESG ratings are an output of fundamentally good business practices, not an input. As the data and information regarding ESG risk factors continue to evolve, we believe the increased information will highlight additional risk factors to enterprises and help us make more informed investment decisions going forward.
Mergers and Acquisitions
Merger and acquisition (M&A) activity remained healthy in the first half of 2019. The health care sector led the way, with pharmaceuticals megamergers among the biggest transactions. The pending acquisitions of Celgene and Allergan (these companies are not held by the Fund), each worth almost $90 billion, exemplify this strength. Large deals have also been announced in the defense, oil and gas exploration and production, and diversified financial services industries, underlying the broad strength of the M&A boom. The Portfolio Composition bar chart on this page lists
franklintempleton.com |
Semiannual Report |
|
5 |
| ||
FRANKLIN MUTUAL FINANCIAL SERVICES FUND
diversified financial services and other leading financial industries in which the Fund currently invests. In addition, U.S. and foreign regulators appear to be more amenable to deals, leading markets to expect fewer regulatory surprises. We are closely monitoring the U.S.-China trade conflict, becauseflare-ups could potentially impact pending and future deals. We expect M&A activity to remain strong for as long as the equity markets remain positive, as has been the historical pattern.
Credit Markets
Opportunities to invest in mispriced risk across global fixed income markets remained limited in the first half of 2019. The low interest-rate environment kept credit widely available, and default rates are still at historically low levels. Debt covenant terms, which include restrictions on the borrower’s financial activities, remain loose or nonexistent. In such an environment, we believe it is prudent to focus our efforts on investing in short-term mispriced risk and catalyst-driven credit opportunities.
On the restructuring side, we are hopeful more opportunities may emerge as the business and economic cycles elongate amid persistent uncertainties. We will continue to seek to invest across the capital structures of companies that avail themselves of opportunities to bolster liquidity through internally generated free cash flow and corporate actions, including asset sales and debt refinancing.
Fund Performance
Top positive contributors to performance included Voya Financial, American International Group and Shinsei Bank. These companies are listed among the Fund’s largest positions in the Top 10 Equity Holdings table on this page.
Positive business trends helped U.S.-based Voya Financial, a provider of retirement planning, investment and insurance services, to post strong quarterly results in February. Voya also announced a share repurchase plan for 2019, provided a positive full-year outlook and restated its commitment to achieving 10% annual earnings growth through 2021. Even after Voya’s solid operating and financial performance, we believe the stock remains attractively valued.
Shares of American International Group (AIG), a U.S.-based insurer, rose following its fiscal first-quarter 2019 earnings release in May, which indicated a stabilization in its business. AIG has been repositioning itself to focus on writing more profitable business and reducing its overall risk exposure. As a result, the insurer expects to report an underwriting profit for its full fiscal year.
Top 10 Equity Holdings
6/30/19
Company Sector/Industry, Country | % of Total Net Assets | |||
The Hartford Financial Services Group Inc. Insurance, U.S. | 5.2% | |||
American International Group Inc. Insurance, U.S. | 5.0% | |||
Voya Financial Inc. Diversified Financial Services, U.S. | 5.0% | |||
Everest Re Group Ltd. Insurance, U.S. | 4.4% | |||
JPMorgan Chase & Co. Banks, U.S. | 4.2% | |||
Alleghany Corp. Insurance, U.S. | 4.1% | |||
Shinsei Bank Ltd. Banks, Japan | 3.6% | |||
Citizens Financial Group Inc. Banks, U.S. | 3.5% | |||
Standard Chartered PLC Banks, U.K. | 3.2% | |||
Wells Fargo & Co. Banks, U.S. | 3.1% | |||
Shares of Japan-based leading diversified financial institution Shinsei Bank rose steadily in January and February. The company’s earnings through the first three quarters of its 2018 fiscal year ending March 31, 2019, were ahead of Shinsei’s conservative guidance. Shinsei Bank’s operating costs were well contained and its unsecured loan business is close to reversing a downward trend that began at the start of the 2018 fiscal year.
During the period under review, Fund investments that detracted from performance included Indiabulls Housing Finance, Yes Bank and Credito Valtellinese.
Shares of Indiabulls Housing Finance, an India-based consumer finance company, declined after a criminal writ was filed alleging financial fraud. The company described the allegations as baseless, and the writ was subsequently withdrawn. The company has continued its pursuit to merge parts of its business with a local bank. Indiabulls seeks to gain a banking license through the deal and has received some regulatory approval. The deal remains subject to the receipt of additional regulatory and shareholder approvals.
Shares of India-based Yes Bank tumbled after the bank posted an unexpected loss largely due to weaker fee income and deteriorating credit quality. However, investors favored
6 |
Semiannual Report |
franklintempleton.com | ||
FRANKLIN MUTUAL FINANCIAL SERVICES FUND
the appointment of a new chief executive officer (CEO) from outside the bank, following the Royal Bank of India (RBI) denying a request to allow the founder to stay on as the CEO until September 2019. Investors also favorably viewed RBI’s latest risk assessment of Yes Bank that showed no issues. The bank’s new CEO is beginning a new strategy to focus more on retail and digital banking in an effort to turn the bank around after recent weakness.
Despite improved first-quarter results, shares of Italy-based commercial bank Credito Valtellinese suffered due tonon-performing asset exposure, includingnon-performing loans. In February, the company announced the appointment of a new CEO who planned to create a three-year strategic plan. In June, the company approved a new 2019–2023 business plan that included revamping its commercial platform with a stronger customer-centered business model, a more efficient operational structure and a redesigned lending process and monitoring. The plan also included improving the company’s risk profile by creating a separate portfolio ofnon-performing loans with the goal of an 80% reduction by 2023 and by reducing securities holdings and issuing new bonds to support new funding.
During the period, the Fund held currency forwards and futures seeking to hedge most of the currency risk of the portfolio’snon-U.S. dollar investments. The hedges had a positive overall impact on the Fund’s performance because of the appreciation of the U.S. dollar versus the hedged currencies.
What is a currency forward?
A currency forward is a direct agreement between the Fund and a counterparty to buy or sell a foreign currency in exchange for another currency at a specific exchange rate on a future date.
|
What is a future?
A future is an agreement between the Fund and a counterparty made through a U.S. or foreign futures exchange to buy or sell an underlying instrument or asset at a specific price on a future date.
|
As fellow shareholders, we found recent relative performance disappointing, but it is not uncommon for our strategy to lag the equity markets at times. We remain committed to our disciplined, value investment approach as we seek to generate attractive, long-term, risk-adjusted returns for shareholders.
Thank you for your participation in Franklin Mutual Financial Services Fund. We look forward to continuing to serve your investment needs.
 |  | |
Andrew Sleeman, CFA Co-Portfolio Manager | ||
 |  | |
Andrew B. Dinnhaupt, CFA Co-Portfolio Manager | ||
 |  | |
Luis Hernandez | ||
| Co-Portfolio Manager | ||
CFA® is a trademark owned by CFA Institute.
| franklintempleton.com | Semiannual Report | 7 | ||||
FRANKLIN MUTUAL FINANCIAL SERVICES FUND
The foregoing information reflects our analysis, opinions and portfolio holdings as of June 30, 2019, the end of the reporting period. The way we implement our main investment strategies and the resulting portfolio holdings may change depending on factors such as market and economic conditions. These opinions may not be relied upon as investment advice or an offer for a particular security. The information is not a complete analysis of every aspect of any market, country, industry, security or the Fund. Statements of fact are from sources considered reliable, but the investment manager makes no representation or warranty as to their completeness or accuracy. Although historical performance is no guarantee of future results, these insights may help you understand our investment management philosophy.
| 8 | Semiannual Report | franklintempleton.com | ||
FRANKLIN MUTUAL FINANCIAL SERVICES FUND
Performance Summary as of June 30, 2019
The performance table does not reflect any taxes that a shareholder would pay on Fund dividends, capital gain distributions, if any, or any realized gains on the sale of Fund shares. Total return reflects reinvestment of the Fund’s dividends and capital gain distributions, if any, and any unrealized gains or losses. Your dividend income will vary depending on dividends or interest paid by securities in the Fund’s portfolio, adjusted for operating expenses of each class. Capital gain distributions are net profits realized from the sale of portfolio securities.
Performance as of 6/30/19
Cumulative total return excludes sales charges. Average annual total return includes maximum sales charges. Sales charges will vary depending on the size of the investment and the class of share purchased. The maximum is 5.50% and the minimum is 0%.Class A:5.50% maximum initial sales charge. For other share classes, visitfranklintempleton.com.
| Share Class | | Cumulative Total Return | 1 | | Average Annual Total Return | 2 | ||
| ||||||||
Z | ||||||||
6-Month | +10.95% | +10.95% | ||||||
| ||||||||
1-Year | -2.93% | -2.93% | ||||||
| ||||||||
5-Year | +35.92% | +6.33% | ||||||
| ||||||||
10-Year | +142.15% | +9.25% | ||||||
| ||||||||
A3 | ||||||||
6-Month | +10.82% | +4.70% | ||||||
| ||||||||
1-Year | -3.19% | -8.51% | ||||||
| ||||||||
5-Year | +34.04% | +4.84% | ||||||
| ||||||||
10-Year | +135.42% | +8.33% | ||||||
| ||||||||
Performance data represent past performance, which does not guarantee future results. Investment return and principal value will fluctuate, and you may have a gain or loss when you sell your shares. Current performance may differ from figures shown. For most recentmonth-end performance, go tofranklintempleton.comor call(800)342-5236.
See page 10 for Performance Summary footnotes.
| franklintempleton.com | Semiannual Report | 9 | ||||
FRANKLIN MUTUAL FINANCIAL SERVICES FUND
PERFORMANCE SUMMARY
Total Annual Operating Expenses4
| Share Class | ||||
Z | 1.09% | |||
A | 1.34% | |||
Each class of shares is available to certain eligible investors and has different annual fees and expenses, as described in the prospectus.
All investments involve risks, including possible loss of principal. Value securities may not increase in price as anticipated or may decline further in value. Special risks are associated with foreign investing, including currency fluctuations, economic instability and political developments. Investing in a single-sector fund involves special risks, including greater sensitivity to economic, political or regulatory developments impacting the sector. Because the Fund may invest its assets in companies in a specific region, including Europe, it is subject to greater risks of adverse developments in that region and/or the surrounding regions than a fund that is more broadly diversified geographically. Current political and financial uncertainty surrounding the European Union may increase market volatility and the economic risk of investing in companies in Europe. Smaller-company stocks have exhibited greater price volatility than larger-company stocks, particularly over the short term. The Fund’s investments in companies engaged in mergers, reorganizations or liquidations also involve special risks as pending deals may not be completed on time or on favorable terms. The Fund may invest in lower-rated bonds, which entail higher credit risk. The Fund is actively managed but there is no guarantee that the manager’s investment decisions will produce the desired results. The Fund’s prospectus also includes a description of the main investment risks.
1. Cumulative total return represents the change in value of an investment over the periods indicated.
2. Average annual total return represents the average annual change in value of an investment over the periods indicated. Return for less than one year, if any, has not been annualized.
3. Prior to 9/10/18, these shares were offered at a higher initial sales charge of 5.75%, thus actual returns (with sales charges) would have differed. Average annual total returns (with sales charges) have been restated to reflect the current maximum initial sales charge of 5.50%.
4. Figures are as stated in the Fund’s current prospectus and may differ from the expense ratios disclosed in the Your Fund’s Expenses and Financial Highlights sections in this report. In periods of market volatility, assets may decline significantly, causing total annual Fund operating expenses to become higher than the figures shown.
| 10 | Semiannual Report | franklintempleton.com | ||
FRANKLIN MUTUAL FINANCIAL SERVICES FUND
As a Fund shareholder, you can incur two types of costs: (1) transaction costs, including sales charges (loads) on Fund purchases and redemptions; and (2) ongoing Fund costs, including management fees, distribution and service(12b-1) fees, and other Fund expenses. All mutual funds have ongoing costs, sometimes referred to as operating expenses. The table below shows ongoing costs of investing in the Fund and can help you understand these costs and compare them with those of other mutual funds. The table assumes a $1,000 investment held for the six months indicated.
Actual Fund Expenses
The table below provides information about actual account values and actual expenses in the columns under the heading “Actual.” In these columns the Fund’s actual return, which includes the effect of Fund expenses, is used to calculate the “Ending Account Value” for each class of shares. You can estimate the expenses you paid during the period by following these steps (of course, your account value and expenses will differ from those in this illustration): Divide your account value by $1,000 (if your account had an $8,600 value, then $8,600 ÷ $1,000 = 8.6). Then multiply the result by the number in the row for your class of shares under the headings “Actual” and “Expenses Paid During Period” (if Actual Expenses Paid During Period were $7.50, then 8.6 x $7.50 = $64.50). In this illustration, the actual expenses paid this period are $64.50.
Hypothetical Example for Comparison with Other Funds
Under the heading “Hypothetical” in the table, information is provided about hypothetical account values and hypothetical expenses based on the Fund’s actual expense ratio and an assumed rate of return of 5% per year before expenses, which is not the Fund’s actual return. This information may not be used to estimate the actual ending account balance or expenses you paid for the period, but it can help you compare ongoing costs of investing in the Fund with those of other funds. To do so, compare this 5% hypothetical example for the class of shares you hold with the 5% hypothetical examples that appear in the shareholder reports of other funds.
Please note that expenses shown in the table are meant to highlight ongoing costs and do not reflect any transactional costs. Therefore, information under the heading “Hypothetical” is useful in comparing ongoing costs only, and will not help you compare total costs of owning different funds. In addition, if transactional costs were included, your total costs would have been higher.
Actual (actual return after expenses) | Hypothetical (5% annual return before expenses) | |||||||||||||||||||||||||||||||||||
| Share Class | Beginning Account Value 1/1/19 | Ending Account Value 6/30/19 | Expenses Paid During 1/1/19–6/30/191, 2 | Ending Account Value 6/30/19 | Expenses Paid During 1/1/19–6/30/191, 2 | Net Annualized Expense Ratio2 | ||||||||||||||||||||||||||||||
Z | $ | 1,000 | $ | 1,109.50 | $ | 5.81 | $ | 1,019.29 | $ | 5.56 | 1.11% | |||||||||||||||||||||||||
A | $ | 1,000 | $ | 1,107.60 | $ | 7.11 | $ | 1,018.05 | $ | 6.81 | 1.36% | |||||||||||||||||||||||||
C | $ | 1,000 | $ | 1,104.00 | $ | 11.01 | $ | 1,014.33 | $ | 10.54 | 2.11% | |||||||||||||||||||||||||
R6 | $ | 1,000 | $ | 1,110.30 | $ | 5.08 | $ | 1,019.98 | $ | 4.86 | 0.97% | |||||||||||||||||||||||||
1. Expenses are equal to the annualized expense ratio for thesix-month period as indicated above—in the far right column—multiplied by the simple average account value over the period indicated, and then multiplied by 181/365 to reflect theone-half year period.
2. Reflects expenses after fee waivers and expense reimbursements, for Class R6.
| franklintempleton.com | Semiannual Report | 11 | ||||
FRANKLIN MUTUAL SERIES FUNDS
Franklin Mutual Financial Services Fund
Six Months Ended (unaudited) | Year Ended December 31, | |||||||||||||||||||||||
| 2018 | 2017 | 2016 | 2015 | 2014 | ||||||||||||||||||||
| Class Z | ||||||||||||||||||||||||
| Per share operating performance (for a share outstanding throughout the period) | ||||||||||||||||||||||||
Net asset value, beginning of period | $19.46 | $24.14 | $21.65 | $19.63 | $18.40 | $16.90 | ||||||||||||||||||
| Income from investment operationsa: | ||||||||||||||||||||||||
Net investment incomeb | 0.24 | 0.38 | c | 0.22 | 0.31 | d | 0.30 | e | 0.25 | |||||||||||||||
Net realized and unrealized gains (losses) | 1.89 | (4.37 | ) | 2.76 | 2.00 | 1.23 | 1.62 | |||||||||||||||||
Total from investment operations | 2.13 | (3.99 | ) | 2.98 | 2.31 | 1.53 | 1.87 | |||||||||||||||||
Less distributions from: | ||||||||||||||||||||||||
Net investment income | — | (0.17 | ) | (0.49 | ) | (0.29 | ) | (0.30 | ) | (0.37 | ) | |||||||||||||
Net realized gains | — | (0.52 | ) | — | — | — | — | |||||||||||||||||
Total distributions | — | (0.69 | ) | (0.49 | ) | (0.29 | ) | (0.30 | ) | (0.37 | ) | |||||||||||||
Net asset value, end of period | $21.59 | $19.46 | $24.14 | $21.65 | $19.63 | $18.40 | ||||||||||||||||||
Total returnf | 10.95% | (16.49)% | 13.77% | 11.79% | 8.34% | 11.07% | ||||||||||||||||||
| Ratios to average net assetsg | ||||||||||||||||||||||||
Expensesh | 1.11% | 1.09% | i | 1.09% | 1.13% | i | 1.13% | 1.14% | ||||||||||||||||
Net investment income | 2.26% | 1.61% | c | 0.95% | 1.64% | d | 1.53% | e | 1.44% | |||||||||||||||
| Supplemental data | ||||||||||||||||||||||||
Net assets, end of period (000’s) | $142,247 | $142,212 | $210,825 | $162,687 | $178,157 | $112,156 | ||||||||||||||||||
Portfolio turnover rate | 6.21% | 33.11% | 67.89% | 34.58% | 25.43% | 33.69% | ||||||||||||||||||
aThe amount shown for a share outstanding throughout the period may not correlate with the Statement of Operations for the period due to the timing of sales and repurchases of the Fund’s shares in relation to income earned and/or fluctuating fair value of the investments of the Fund.
bBased on average daily shares outstanding.
cNet investment income per share includes approximately $0.08 per share related to income received in the form of special dividends in connection with certain Fund holdings. Excluding this amount, the ratio of net investment income to average net assets would have been 1.29%.
dNet investment income per share includes approximately $0.05 per share related to income received in the form of special dividends in connection with certain Fund holdings. Excluding this amount, the ratio of net investment income to average net assets would have been 1.38%.
eNet investment income per share includes approximately $0.14 per share related to income received in the form of special dividends in connection with certain Fund holdings. Excluding this amount, the ratio of net investment income to average net assets would have been 0.81%.
fTotal return is not annualized for periods less than one year.
gRatios are annualized for periods less than one year.
hBenefit of expense reduction rounds to less than 0.01%.
iBenefit of waiver and payments by affiliates rounds to less than 0.01%.
| 12 | Semiannual Report | The accompanying notes are an integral part of these financial statements. | franklintempleton.com | ||
FRANKLIN MUTUAL SERIES FUNDS
FINANCIAL HIGHLIGHTS
Franklin Mutual Financial Services Fund(continued)
Six Months Ended (unaudited) | Year Ended December 31, | |||||||||||||||||||||||
| 2018 | 2017 | 2016 | 2015 | 2014 | ||||||||||||||||||||
| Class A | ||||||||||||||||||||||||
| Per share operating performance (for a share outstanding throughout the period) | ||||||||||||||||||||||||
Net asset value, beginning of period | $19.52 | $24.21 | $21.70 | $19.69 | $18.46 | $16.96 | ||||||||||||||||||
| Income from investment operationsa: | ||||||||||||||||||||||||
Net investment incomeb | 0.21 | 0.31 | c | 0.16 | 0.26 | d | 0.25 | e | 0.20 | |||||||||||||||
Net realized and unrealized gains (losses) | 1.89 | (4.36 | ) | 2.78 | 1.99 | 1.23 | 1.61 | |||||||||||||||||
Total from investment operations | 2.10 | (4.05 | ) | 2.94 | 2.25 | 1.48 | 1.81 | |||||||||||||||||
Less distributions from: | ||||||||||||||||||||||||
Net investment income | — | (0.12 | ) | (0.43 | ) | (0.24 | ) | (0.25 | ) | (0.31 | ) | |||||||||||||
Net realized gains | — | (0.52 | ) | — | — | — | — | |||||||||||||||||
Total distributions | — | (0.64 | ) | (0.43 | ) | (0.24 | ) | (0.25 | ) | (0.31 | ) | |||||||||||||
Net asset value, end of period | $21.62 | $19.52 | $24.21 | $21.70 | $19.69 | $18.46 | ||||||||||||||||||
Total returnf | 10.76% | (16.72)% | 13.55% | 11.46% | 8.05% | 10.71% | ||||||||||||||||||
| Ratios to average net assetsg | ||||||||||||||||||||||||
Expensesh | 1.36% | 1.34% | i | 1.34% | 1.38% | i | 1.41% | 1.44% | ||||||||||||||||
Net investment income | 2.01% | 1.36% | c | 0.70% | 1.39% | d | 1.25% | e | 1.14% | |||||||||||||||
| Supplemental data | ||||||||||||||||||||||||
Net assets, end of period (000’s) | $288,380 | $298,878 | $368,850 | $346,008 | $360,278 | $255,242 | ||||||||||||||||||
Portfolio turnover rate | 6.21% | 33.11% | 67.89% | 34.58% | 25.43% | 33.69% | ||||||||||||||||||
aThe amount shown for a share outstanding throughout the period may not correlate with the Statement of Operations for the period due to the timing of sales and repurchases of the Fund’s shares in relation to income earned and/or fluctuating fair value of the investments of the Fund.
bBased on average daily shares outstanding.
cNet investment income per share includes approximately $0.08 per share related to income received in the form of special dividends in connection with certain Fund holdings. Excluding this amount, the ratio of net investment income to average net assets would have been 1.04%.
dNet investment income per share includes approximately $0.05 per share related to income received in the form of special dividends in connection with certain Fund holdings. Excluding this amount, the ratio of net investment income to average net assets would have been 1.13%.
eNet investment income per share includes approximately $0.14 per share related to income received in the form of special dividends in connection with certain Fund holdings. Excluding this amount, the ratio of net investment income to average net assets would have been 0.53%.
fTotal return does not reflect sales commissions or contingent deferred sales charges, if applicable, and is not annualized for periods less than one year.
gRatios are annualized for periods less than one year.
hBenefit of expense reduction rounds to less than 0.01%.
iBenefit of waiver and payments by affiliates rounds to less than 0.01%.
| franklintempleton.com | The accompanying notes are an integral part of these financial statements. | Semiannual Report | 13 | ||||
FRANKLIN MUTUAL SERIES FUNDS
FINANCIAL HIGHLIGHTS
Franklin Mutual Financial Services Fund(continued)
Six Months Ended (unaudited) | Year Ended December 31, | |||||||||||||||||||||||
| 2018 | 2017 | 2016 | 2015 | 2014 | ||||||||||||||||||||
| Class C | ||||||||||||||||||||||||
Per share operating performance (for a share outstanding throughout the period) | ||||||||||||||||||||||||
Net asset value, beginning of period | $19.32 | $24.08 | $21.60 | $19.61 | $18.41 | $16.92 | ||||||||||||||||||
| Income from investment operationsa: | ||||||||||||||||||||||||
Net investment income (loss)b | 0.13 | 0.15 | c | (0.01 | ) | 0.12 | d | 0.10 | e | 0.08 | ||||||||||||||
Net realized and unrealized gains (losses) | 1.88 | (4.33 | ) | 2.74 | 1.96 | 1.24 | 1.60 | |||||||||||||||||
Total from investment operations | 2.01 | (4.18 | ) | 2.73 | 2.08 | 1.34 | 1.68 | |||||||||||||||||
Less distributions from: | ||||||||||||||||||||||||
Net investment income | — | (0.06 | ) | (0.25 | ) | (0.09 | ) | (0.14 | ) | (0.19 | ) | |||||||||||||
Net realized gains | — | (0.52 | ) | — | — | — | — | |||||||||||||||||
Total distributions | — | (0.58 | ) | (0.25 | ) | (0.09 | ) | (0.14 | ) | (0.19 | ) | |||||||||||||
Net asset value, end of period | $21.33 | $19.32 | $24.08 | $21.60 | $19.61 | $18.41 | ||||||||||||||||||
Total returnf | 10.40% | (17.35)% | 12.66% | 10.64% | 7.30% | 9.93% | ||||||||||||||||||
| Ratios to average net assetsg | ||||||||||||||||||||||||
Expensesh | 2.11% | 2.09% | i | 2.09% | 2.13% | i | 2.13% | 2.14% | ||||||||||||||||
Net investment income (loss) | 1.26% | 0.61% | c | (0.05)% | 0.64% | d | 0.53% | e | 0.44% | |||||||||||||||
| Supplemental data | ||||||||||||||||||||||||
Net assets, end of period (000’s) | $53,853 | $58,610 | $134,117 | $128,766 | $132,975 | $89,341 | ||||||||||||||||||
Portfolio turnover rate | 6.21% | 33.11% | 67.89% | 34.58% | 25.43% | 33.69% | ||||||||||||||||||
aThe amount shown for a share outstanding throughout the period may not correlate with the Statement of Operations for the period due to the timing of sales and repurchases of the Fund’s shares in relation to income earned and/or fluctuating fair value of the investments of the Fund.
bBased on average daily shares outstanding.
cNet investment income per share includes approximately $0.08 per share related to income received in the form of special dividends in connection with certain Fund holdings. Excluding this amount, the ratio of net investment income to average net assets would have been 0.29%.
dNet investment income per share includes approximately $0.05 per share related to income received in the form of special dividends in connection with certain Fund holdings. Excluding this amount, the ratio of net investment income to average net assets would have been 0.38%.
eNet investment income per share includes approximately $0.14 per share related to income received in the form of special dividends in connection with certain Fund holdings. Excluding this amount, the ratio of net investment income to average net assets would have been (0.19)%.
fTotal return does not reflect sales commissions or contingent deferred sales charges, if applicable, and is not annualized for periods less than one year.
gRatios are annualized for periods less than one year.
hBenefit of expense reduction rounds to less than 0.01%.
iBenefit of waiver and payments by affiliates rounds to less than 0.01%.
| 14 | Semiannual Report | The accompanying notes are an integral part of these financial statements. | franklintempleton.com | ||
FRANKLIN MUTUAL SERIES FUNDS
FINANCIAL HIGHLIGHTS
Franklin Mutual Financial Services Fund(continued)
Six Months Ended (unaudited) | Year Ended December 31, | |||||||||||||||||||||||
| 2018 | 2017 | 2016 | 2015 | 2014 | ||||||||||||||||||||
| Class R6 | ||||||||||||||||||||||||
| Per share operating performance (for a share outstanding throughout the period) | ||||||||||||||||||||||||
Net asset value, beginning of period | $19.58 | $24.30 | $21.79 | $19.76 | $18.52 | $16.88 | ||||||||||||||||||
| Income from investment operationsa: | ||||||||||||||||||||||||
Net investment incomeb | 0.25 | 0.41 | c | 0.25 | 0.32 | d | 0.07 | e | 0.25 | |||||||||||||||
Net realized and unrealized gains (losses) | 1.91 | (4.41 | ) | 2.78 | 2.03 | 1.49 | 1.66 | |||||||||||||||||
Total from investment operations | 2.16 | (4.00 | ) | 3.03 | 2.35 | 1.56 | 1.91 | |||||||||||||||||
Less distributions from: | ||||||||||||||||||||||||
Net investment income | — | (0.20 | ) | (0.52 | ) | (0.32 | ) | (0.32 | ) | (0.27 | ) | |||||||||||||
Net realized gains | — | (0.52 | ) | — | — | — | — | |||||||||||||||||
Total distributions | — | (0.72 | ) | (0.52 | ) | (0.32 | ) | (0.32 | ) | (0.27 | ) | |||||||||||||
Net asset value, end of period | $21.74 | $19.58 | $24.30 | $21.79 | $19.76 | $18.52 | ||||||||||||||||||
Total returnf | 11.03% | (16.41)% | 13.92% | 11.93% | 8.55% | 11.23% | ||||||||||||||||||
| Ratios to average net assetsg | ||||||||||||||||||||||||
Expenses before waiver and payments by affiliates | 1.05% | 1.06% | 0.97% | 0.99% | 1.16% | 2.61% | ||||||||||||||||||
Expenses net of waiver and payments by affiliatesh | 0.97% | 0.97% | 0.95% | 0.96% | 0.96% | 0.97% | ||||||||||||||||||
Net investment income | 2.40% | 1.73% | c | 1.09% | 1.81% | d | 1.70% | e | 1.61% | |||||||||||||||
| Supplemental data | ||||||||||||||||||||||||
Net assets, end of period (000’s) | $3,760 | $3,371 | $4,523 | $2,601 | $1,421 | $12 | ||||||||||||||||||
Portfolio turnover rate | 6.21% | 33.11% | 67.89% | 34.58% | 25.43% | 33.69% | ||||||||||||||||||
aThe amount shown for a share outstanding throughout the period may not correlate with the Statement of Operations for the period due to the timing of sales and repurchases of the Fund’s shares in relation to income earned and/or fluctuating fair value of the investments of the Fund.
bBased on average daily shares outstanding.
cNet investment income per share includes approximately $0.08 per share related to income received in the form of special dividends in connection with certain Fund holdings. Excluding this amount, the ratio of net investment income to average net assets would have been 1.41%.
dNet investment income per share includes approximately $0.05 per share related to income received in the form of special dividends in connection with certain Fund holdings. Excluding this amount, the ratio of net investment income to average net assets would have been 1.55%.
eNet investment income per share includes approximately $0.14 per share related to income received in the form of special dividends in connection with certain Fund holdings. Excluding this amount, the ratio of net investment income to average net assets would have been 0.98%.
fTotal return is not annualized for periods less than one year.
gRatios are annualized for periods less than one year.
hBenefit of expense reduction rounds to less than 0.01%.
| franklintempleton.com | The accompanying notes are an integral part of these financial statements. | Semiannual Report | 15 | ||||
FRANKLIN MUTUAL SERIES FUNDS
Statement of Investments, June 30, 2019 (unaudited)
Franklin Mutual Financial Services Fund
| Country | Shares | Value | ||||||||||||
| Common Stocks 91.5% | ||||||||||||||
| Banks 34.8% | ||||||||||||||
| a | AB&T Financial Corp. | United States | 226,100 | $ | 118,714 | |||||||||
AIB Group PLC | Ireland | 2,267,537 | 9,269,947 | |||||||||||
Barclays PLC | United Kingdom | 2,700,433 | 5,137,263 | |||||||||||
CIT Group Inc. | United States | 123,611 | 6,494,522 | |||||||||||
Citigroup Inc. | United States | 180,610 | 12,648,118 | |||||||||||
Citizens Financial Group Inc. | United States | 487,200 | 17,227,392 | |||||||||||
| b | Credito Valtellinese SpA | Italy | 117,345,631 | 7,537,348 | ||||||||||
First Horizon National Corp. | United States | 386,229 | 5,766,399 | |||||||||||
ING Groep NV | Netherlands | 1,200,685 | 13,917,528 | |||||||||||
JPMorgan Chase & Co. | United States | 183,680 | 20,535,424 | |||||||||||
Shinsei Bank Ltd. | Japan | 1,134,000 | 17,595,826 | |||||||||||
Southern National Bancorp of Virginia Inc. | United States | 649,760 | 9,947,826 | |||||||||||
Standard Chartered PLC | United Kingdom | 1,728,056 | 15,673,438 | |||||||||||
Synovus Financial Corp. | United States | 121,311 | 4,245,885 | |||||||||||
UniCredit SpA | Italy | 404,554 | 4,979,064 | |||||||||||
Wells Fargo & Co. | United States | 323,670 | 15,316,064 | |||||||||||
Yes Bank Ltd. | India | 2,293,512 | 3,617,396 | |||||||||||
|
| |||||||||||||
|
170,028,154 |
| ||||||||||||
|
| |||||||||||||
| Capital Markets 4.8% | ||||||||||||||
Credit Suisse Group AG | Switzerland | 1,102,649 | 13,217,785 | |||||||||||
Deutsche Bank AG | Germany | 991,436 | 7,641,833 | |||||||||||
Guotai Junan Securities Co. Ltd. | China | 1,396,063 | 2,487,561 | |||||||||||
|
| |||||||||||||
|
23,347,179 |
| ||||||||||||
|
| |||||||||||||
| Consumer Finance 3.8% | ||||||||||||||
Capital One Financial Corp. | United States | 132,810 | 12,051,179 | |||||||||||
Sun Hung Kai & Co. Ltd. | Hong Kong | 14,145,704 | 6,609,169 | |||||||||||
|
| |||||||||||||
|
18,660,348 |
| ||||||||||||
|
| |||||||||||||
| Diversified Financial Services 5.0% | ||||||||||||||
Voya Financial Inc. | United States | 436,050 | 24,113,565 | |||||||||||
|
| |||||||||||||
| Equity Real Estate Investment Trusts (REITs) 0.8% | ||||||||||||||
Brixmor Property Group Inc. | United States | 215,900 | 3,860,292 | |||||||||||
|
| |||||||||||||
| Household Durables 1.5% | ||||||||||||||
| b | Cairn Homes PLC | Ireland | 5,428,109 | 7,318,742 | ||||||||||
|
| |||||||||||||
| Insurance 38.6% | ||||||||||||||
| b | Alleghany Corp. | United States | 29,137 | 19,845,502 | ||||||||||
American International Group Inc. | United States | 456,658 | 24,330,738 | |||||||||||
ASR Nederland NV | Netherlands | 352,478 | 14,329,555 | |||||||||||
| b | Brighthouse Financial Inc. | United States | 106,843 | 3,920,070 | ||||||||||
China Pacific Insurance Group Co. Ltd., H | China | 1,351,600 | 5,285,533 | |||||||||||
Chubb Ltd. | United States | 34,050 | 5,015,224 | |||||||||||
Direct Line Insurance Group PLC | United Kingdom | 3,006,354 | 12,667,856 | |||||||||||
Everest Re Group Ltd. | United States | 86,000 | 21,257,480 | |||||||||||
The Hartford Financial Services Group Inc. | United States | 458,972 | 25,573,920 | |||||||||||
Lancashire Holdings Ltd. | United Kingdom | 603,347 | 5,275,428 | |||||||||||
MetLife Inc. | United States | 172,370 | 8,561,618 | |||||||||||
| 16 | Semiannual Report | franklintempleton.com | ||
FRANKLIN MUTUAL SERIES FUNDS
STATEMENT OF INVESTMENTS (UNAUDITED)
Franklin Mutual Financial Services Fund(continued)
| Country | Shares | Value | ||||||||||||
| Common Stocks(continued) | ||||||||||||||
| Insurance(continued) | ||||||||||||||
NN Group NV | Netherlands | 365,392 | $ | 14,705,015 | ||||||||||
RSA Insurance Group PLC | United Kingdom | 1,959,394 | 14,352,701 | |||||||||||
Sabre Insurance Group PLC | United Kingdom | 1,343,342 | 4,657,318 | |||||||||||
T&D Holdings Inc. | Japan | 812,169 | 8,809,420 | |||||||||||
|
| |||||||||||||
| 188,587,378 | ||||||||||||||
|
| |||||||||||||
| Real Estate Management & Development 0.6% | ||||||||||||||
| b | Dolphin Capital Investors Ltd. | Greece | 3,979,650 | 255,225 | ||||||||||
Kenedix Inc. | Japan | 500,197 | 2,491,242 | |||||||||||
|
| |||||||||||||
| 2,746,467 | ||||||||||||||
|
| |||||||||||||
| Thrifts & Mortgage Finance 1.6% | ||||||||||||||
Indiabulls Housing Finance Ltd. | India | 907,348 | 7,997,032 | |||||||||||
|
| |||||||||||||
| Total Common Stocks (Cost $457,357,659) | 446,659,157 | |||||||||||||
|
| |||||||||||||
| Principal Amount | ||||||||||||||
| Short Term Investments 8.6% | ||||||||||||||
| U.S. Government and Agency Securities 8.6% | ||||||||||||||
| c | FHLB, 7/01/19 | United States | $ | 22,000,000 | 22,000,000 | |||||||||
| c | U.S. Treasury Bill, | |||||||||||||
7/02/19 - 10/24/19 | United States | 17,500,000 | 17,457,846 | |||||||||||
d10/31/19 | United States | 2,500,000 | 2,482,990 | |||||||||||
|
| |||||||||||||
Total U.S. Government and Agency Securities | 41,940,836 | |||||||||||||
|
| |||||||||||||
Total Investments (Cost $499,284,491) 100.1% | 488,599,993 | |||||||||||||
Other Assets, less Liabilities (0.1)% | (361,210 | ) | ||||||||||||
|
| |||||||||||||
| Net Assets 100.0% | $488,238,783 | |||||||||||||
|
| |||||||||||||
aSee Note 10 regarding holdings of 5% voting securities.
bNon-income producing.
cThe security was issued on a discount basis with no stated coupon rate.
dA portion or all of the security has been segregated as collateral for open forward exchange contracts. At June 30, 2019, the value of this security pledged amounted to $547,251, representing 0.1% of net assets.
| franklintempleton.com | Semiannual Report | 17 | ||||
FRANKLIN MUTUAL SERIES FUNDS
STATEMENT OF INVESTMENTS (UNAUDITED)
Franklin Mutual Financial Services Fund(continued)
At June 30, 2019, the Fund had the following futures contracts outstanding. See Note 1(c).
Futures Contracts
| Description | Type | Number of Contracts | Notional Amount* | Expiration Date | Value/ Unrealized Appreciation (Depreciation) | |||||||||||||||
| Currency Contracts | ||||||||||||||||||||
EUR/USD | Short | 154 | $22,034,513 | 9/16/19 | $(64,917 | ) | ||||||||||||||
GBP/USD | Short | 141 | 11,235,056 | 9/16/19 | 17,236 | |||||||||||||||
|
| |||||||||||||||||||
Total Futures Contracts | $(47,681 | ) | ||||||||||||||||||
|
| |||||||||||||||||||
*As of period end.
At June 30, 2019, the Fund had the following forward exchange contracts outstanding. See Note 1(c).
Forward Exchange Contracts
| Currency | Counterpartya | Type | Quantity | Contract Amount | Settlement Date | Unrealized Appreciation | Unrealized Depreciation | |||||||||||||||||||
OTC Forward Exchange Contracts | ||||||||||||||||||||||||||
Euro | BOFA | Buy | 4,729,298 | $ | 5,298,015 | 7/15/19 | $ | 86,343 | $ | — | ||||||||||||||||
Euro | BOFA | Sell | 283,727 | 324,931 | 7/15/19 | 1,904 | — | |||||||||||||||||||
Euro | BOFA | Sell | 4,285,359 | 4,863,774 | 7/15/19 | — | (15,153 | ) | ||||||||||||||||||
Euro | BONY | Sell | 561,990 | 649,693 | 7/15/19 | 9,861 | — | |||||||||||||||||||
Euro | HSBK | Buy | 92,699 | 103,586 | 7/15/19 | 1,953 | — | |||||||||||||||||||
Euro | HSBK | Sell | 140,000 | 158,732 | 7/15/19 | — | (659 | ) | ||||||||||||||||||
Euro | HSBK | Sell | 25,741,132 | 29,507,369 | 7/15/19 | 200,805 | — | |||||||||||||||||||
Euro | SSBT | Sell | 140,000 | 158,736 | 7/15/19 | — | (655 | ) | ||||||||||||||||||
Euro | SSBT | Sell | 476,744 | 549,896 | 7/15/19 | 7,117 | — | |||||||||||||||||||
Euro | UBSW | Buy | 2,098,948 | 2,378,878 | 7/15/19 | 10,798 | — | |||||||||||||||||||
Euro | UBSW | Sell | 1,781,726 | 2,054,305 | 7/15/19 | 25,789 | — | |||||||||||||||||||
Swiss Franc | HSBK | Buy | 340,225 | 339,098 | 7/15/19 | 9,912 | — | |||||||||||||||||||
Swiss Franc | HSBK | Sell | 191,753 | 193,436 | 7/15/19 | — | (3,268 | ) | ||||||||||||||||||
Swiss Franc | UBSW | Sell | 12,776,508 | 12,717,126 | 7/15/19 | — | (389,234 | ) | ||||||||||||||||||
British Pound | BOFA | Buy | 3,884,986 | 4,931,028 | 7/16/19 | 7,307 | — | |||||||||||||||||||
British Pound | HSBK | Buy | 241,590 | 307,815 | 7/16/19 | — | (723 | ) | ||||||||||||||||||
British Pound | HSBK | Buy | 517,395 | 651,938 | 7/16/19 | 5,740 | — | |||||||||||||||||||
British Pound | HSBK | Sell | 6,952,726 | 9,023,846 | 7/16/19 | 186,004 | — | |||||||||||||||||||
British Pound | UBSW | Buy | 47,715 | 60,715 | 7/16/19 | — | (63 | ) | ||||||||||||||||||
British Pound | UBSW | Buy | 1,435,573 | 1,816,433 | 7/16/19 | 8,371 | — | |||||||||||||||||||
British Pound | BOFA | Sell | 389,221 | 504,194 | 8/14/19 | 8,770 | — | |||||||||||||||||||
British Pound | BONY | Sell | 26,574,856 | 34,551,750 | 8/14/19 | 725,672 | — | |||||||||||||||||||
British Pound | HSBK | Sell | 366,014 | 475,197 | 8/14/19 | 9,312 | — | |||||||||||||||||||
British Pound | UBSW | Sell | 403,293 | 522,764 | 8/14/19 | 9,429 | — | |||||||||||||||||||
Japanese Yen | UBSW | Sell | 101,400,693 | 943,945 | 8/26/19 | — | (765 | ) | ||||||||||||||||||
Japanese Yen | UBSW | Sell | 2,830,472,629 | 26,407,661 | 8/26/19 | 37,285 | — | |||||||||||||||||||
Euro | BONY | Sell | 109,502 | 125,652 | 10/18/19 | 57 | — | |||||||||||||||||||
Euro | SSBT | Sell | 109,502 | 125,652 | 10/18/19 | 58 | — | |||||||||||||||||||
Euro | SSBT | Sell | 2,565,269 | 2,902,730 | 10/18/19 | — | (39,520 | ) | ||||||||||||||||||
British Pound | UBSW | Sell | 350,000 | 459,389 | 10/24/19 | 12,655 | — | |||||||||||||||||||
| 18 | Semiannual Report | franklintempleton.com | ||
FRANKLIN MUTUAL SERIES FUNDS
STATEMENT OF INVESTMENTS (UNAUDITED)
Franklin Mutual Financial Services Fund(continued)
Forward Exchange Contracts(continued)
| Currency | Counterpartya | Type | Quantity | Contract Amount | Settlement Date | Unrealized Appreciation | Unrealized Depreciation | |||||||||||||||||
| OTC Forward Exchange Contracts (continued) | ||||||||||||||||||||||||
| Euro | HSBK | Sell | 7,705,877 | $ | 8,734,249 | 11/07/19 | $ | — | $ | (117,763 | ) | |||||||||||||
| Euro | UBSW | Sell | 4,331,528 | 4,907,924 | 11/07/19 | — | (67,855 | ) | ||||||||||||||||
| Euro | BOFA | Sell | 30,046 | 34,463 | 11/21/19 | — | (89 | ) | ||||||||||||||||
| Euro | SSBT | Sell | 7,053,194 | 8,001,143 | 11/21/19 | — | (109,919 | ) | ||||||||||||||||
| British Pound | SSBT | Sell | 3,166,961 | 4,035,105 | 11/22/19 | — | (11,596 | ) | ||||||||||||||||
Total Forward Exchange Contracts | $ | 1,365,142 | $ | (757,262 | ) | |||||||||||||||||||
Net unrealized appreciation (depreciation) | $ | 607,880 | ||||||||||||||||||||||
aMay be comprised of multiple contracts with the same counterparty, currency and settlement date.
See Note 9 regarding other derivative information.
See Abbreviations on page 34.
| franklintempleton.com | The accompanying notes are an integral part of these financial statements. | Semiannual Report | 19 | ||||
FRANKLIN MUTUAL SERIES FUNDS
Statement of Assets and Liabilities
June 30, 2019 (unaudited)
Franklin Mutual Financial Services Fund
Assets: | ||||
Investments in securities: | ||||
Cost - Unaffiliated issuers | $ | 497,057,736 | ||
Cost -Non-controlled affiliates (Note 10) | 2,226,755 | |||
|
| |||
Value - Unaffiliated issuers | $ | 488,481,279 | ||
Value -Non-controlled affiliates (Note 10) | 118,714 | |||
Cash | 45,750 | |||
Foreign currency, at value (cost $753,088) | 754,470 | |||
Receivables: | ||||
Capital shares sold | 134,376 | |||
Dividends | 1,092,181 | |||
European Union tax reclaims | 836,507 | |||
Deposits with brokers for: | ||||
Futures contracts | 623,680 | |||
Unrealized appreciation on OTC forward exchange contracts | 1,365,142 | |||
Other assets | 367 | |||
|
| |||
Total assets | 493,452,466 | |||
|
| |||
Liabilities: | ||||
Payables: | ||||
Investment securities purchased | 2,462,231 | |||
Capital shares redeemed | 1,048,133 | |||
Management fees | 349,552 | |||
Distribution fees | 213,702 | |||
Transfer agent fees | 134,852 | |||
Trustees’ fees and expenses | 37,454 | |||
Variation margin on futures contracts | 44,631 | |||
Unrealized depreciation on OTC forward exchange contracts | 757,262 | |||
Accrued expenses and other liabilities | 165,866 | |||
|
| |||
Total liabilities | 5,213,683 | |||
|
| |||
Net assets, at value | $ | 488,238,783 | ||
|
| |||
Net assets consist of: | ||||
Paid-in capital | $ | 512,635,601 | ||
Total distributable earnings (loss) | (24,396,818 | ) | ||
|
| |||
Net assets, at value | $ | 488,238,783 | ||
|
| |||
| 20 | Semiannual Report | The accompanying notes are an integral part of these financial statements. | franklintempleton.com | ||
FRANKLIN MUTUAL SERIES FUNDS
FINANCIAL STATEMENTS
Statement of Assets and Liabilities(continued)
June 30, 2019 (unaudited)
Franklin Mutual Financial Services Fund
| Class Z: | ||||
Net assets, at value | $142,246,979 | |||
|
| |||
Shares outstanding | 6,590,038 | |||
|
| |||
Net asset value and maximum offering price per share | $21.59 | |||
|
| |||
| Class A: | ||||
Net assets, at value | $288,379,527 | |||
|
| |||
Shares outstanding | 13,337,476 | |||
|
| |||
Net asset value per sharea | $21.62 | |||
|
| |||
Maximum offering price per share (net asset value per share ÷ 94.50%) | $22.88 | |||
|
| |||
| Class C: | ||||
Net assets, at value | $ 53,852,684 | |||
|
| |||
Shares outstanding | 2,525,052 | |||
|
| |||
Net asset value and maximum offering price per sharea | $21.33 | |||
|
| |||
| Class R6: | ||||
Net assets, at value | $ 3,759,593 | |||
|
| |||
Shares outstanding | 172,941 | |||
|
| |||
Net asset value and maximum offering price per share | $21.74 | |||
|
| |||
aRedemption price is equal to net asset value less contingent deferred sales charges, if applicable.
| franklintempleton.com | The accompanying notes are an integral part of these financial statements. | Semiannual Report | 21 | ||||
FRANKLIN MUTUAL SERIES FUNDS
FINANCIAL STATEMENTS
Statement of Operations
for the six months ended June 30, 2019 (unaudited)
Franklin Mutual Financial Services Fund
Investment income: | ||||
Dividends: (net of foreign taxes)* | ||||
Unaffiliated issuers | $ | 8,088,673 | ||
Non-controlled affiliates (Note 10) | 287 | |||
Interest: | ||||
Unaffiliated issuers | 395,654 | |||
|
| |||
Total investment income | 8,484,614 | |||
|
| |||
Expenses: | ||||
Management fees (Note 3a) | 2,203,397 | |||
Distribution fees: (Note 3c) | ||||
Class A | 372,806 | |||
Class C | 285,915 | |||
Transfer agent fees: (Note 3e) | ||||
Class Z | 118,238 | |||
Class A | 244,565 | |||
Class C | 46,883 | |||
Class R6 | 1,882 | |||
Custodian fees (Note 4) | 23,393 | |||
Reports to shareholders | 39,871 | |||
Registration and filing fees | 37,050 | |||
Professional fees | 57,264 | |||
Trustees’ fees and expenses | 21,040 | |||
Other | 15,765 | |||
|
| |||
Total expenses | 3,468,069 | |||
Expense reductions (Note 4) | (1,506 | ) | ||
Expenses waived/paid by affiliates (Note 3f) | (1,396 | ) | ||
|
| |||
Net expenses | 3,465,167 | |||
|
| |||
Net investment income | 5,019,447 | |||
|
| |||
Realized and unrealized gains (losses): | ||||
Net realized gain (loss) from: | ||||
Investments: | ||||
Unaffiliated issuers | (7,877,074 | ) | ||
Foreign currency transactions | 13,982 | |||
Forward exchange contracts | 3,610,188 | |||
Futures contracts | 693,691 | |||
|
| |||
Net realized gain (loss) | (3,559,213 | ) | ||
|
| |||
Net change in unrealized appreciation (depreciation) on: | ||||
Investments: | ||||
Unaffiliated issuers | 52,132,628 | |||
Non-controlled affiliates (Note 10) | (7,902 | ) | ||
Translation of other assets and liabilities denominated in foreign currencies | (101,871 | ) | ||
Forward exchange contracts | (964,477 | ) | ||
Futures contracts | (74,350 | ) | ||
|
| |||
Net change in unrealized appreciation (depreciation) | 50,984,028 | |||
|
| |||
Net realized and unrealized gain (loss) | 47,424,815 | |||
|
| |||
Net increase (decrease) in net assets resulting from operations | $ | 52,444,262 | ||
|
| |||
*Foreign taxes withheld on dividends | $ | 290,712 | ||
| 22 | Semiannual Report | The accompanying notes are an integral part of these financial statements. | franklintempleton.com | ||
FRANKLIN MUTUAL SERIES FUNDS
FINANCIAL STATEMENTS
Statements of Changes in Net Assets
Franklin Mutual Financial Services Fund
| Six Months Ended June 30, 2019 (unaudited) | Year Ended December 31, 2018 | |||||||
| ||||||||
Increase (decrease) in net assets: | ||||||||
Operations: | ||||||||
Net investment income | $ 5,019,447 | $ 8,665,785 | ||||||
Net realized gain (loss) | (3,559,213 | ) | 9,412,447 | |||||
Net change in unrealized appreciation (depreciation) | 50,984,028 | (127,980,059 | ) | |||||
|
| |||||||
Net increase (decrease) in net assets resulting from operations | 52,444,262 | (109,901,827 | ) | |||||
|
| |||||||
Distributions to shareholders: | ||||||||
Class Z | — | (4,996,108 | ) | |||||
Class A | — | (9,609,536 | ) | |||||
Class C | — | (1,856,107 | ) | |||||
Class R6 | — | (115,264 | ) | |||||
|
| |||||||
Total distributions to shareholders | — |
|
(16,577,015 |
) | ||||
|
| |||||||
Capital share transactions: (Note 2) | ||||||||
Class Z | (14,976,101 | ) | (32,948,539 | ) | ||||
Class A | (41,727,727 | ) | 734,715 | |||||
Class C | (10,588,381 | ) | (56,197,465 | ) | ||||
Class R6 | 15,016 | (354,486 | ) | |||||
|
| |||||||
Total capital share transactions | (67,277,193 | ) |
|
(88,765,775 |
) | |||
|
| |||||||
Net increase (decrease) in net assets | (14,832,931 | ) | (215,244,617 | ) | ||||
Net assets: | ||||||||
Beginning of period | 503,071,714 | 718,316,331 | ||||||
|
| |||||||
End of period | $488,238,783 |
|
$ 503,071,714 |
| ||||
|
| |||||||
| franklintempleton.com | The accompanying notes are an integral part of these financial statements. | Semiannual Report | 23 | ||||
FRANKLIN MUTUAL SERIES FUNDS
Notes to Financial Statements (unaudited)
Franklin Mutual Financial Services Fund
1. Organization and Significant Accounting Policies
Franklin Mutual Series Funds (Trust) is registered under the Investment Company Act of 1940 (1940 Act) as anopen-end management investment company, consisting of seven separate funds and applies the specialized accounting and reporting guidance in U.S. Generally Accepted Accounting Principles (U.S. GAAP). Franklin Mutual Financial Services Fund (Fund) is included in this report. The Fund offers four classes of shares: Class Z, Class A, Class C and Class R6. Class C shares automatically convert to Class A shares after they have been held for 10 years. Each class of shares may differ by its initial sales load, contingent deferred sales charges, voting rights on matters affecting a single class, its exchange privilege and fees due to differing arrangements for distribution and transfer agent fees.
The following summarizes the Fund’s significant accounting policies.
a. Financial Instrument Valuation
The Fund’s investments in financial instruments are carried at fair value daily. Fair value is the price that would be received to sell an asset or paid to transfer a liability in an orderly transaction between market participants on the measurement date. The Fund calculates the net asset value (NAV) per share each business day as of 4 p.m. Eastern time or the regularly scheduled close of the New York Stock Exchange (NYSE), whichever is earlier. Under compliance policies and procedures approved by the Trust’s Board of Trustees (the Board), the Fund’s administrator has responsibility for oversight of valuation, including leading the cross-functional Valuation Committee (VC). The Fund may utilize independent pricing services, quotations from securities and financial instrument dealers, and other market sources to determine fair value.
Equity securities and derivative financial instruments listed on an exchange or on the NASDAQ National Market System are valued at the last quoted sale price or the official closing price of the day, respectively. Foreign equity securities are valued as of the close of trading on the foreign stock exchange on which the security is primarily traded, or as of 4 p.m. Eastern time. The value is then converted into its U.S. dollar equivalent at the foreign exchange rate in effect at 4 p.m. Eastern time on the day that the value of the security is determined.Over-the-counter (OTC) securities are valued within the range of the most recent quoted bid and ask prices. Securities that trade in multiple markets or on multiple
exchanges are valued according to the broadest and most representative market. Certain equity securities are valued based upon fundamental characteristics or relationships to similar securities.
Debt securities generally trade in the OTC market rather than on a securities exchange. The Fund’s pricing services use multiple valuation techniques to determine fair value. In instances where sufficient market activity exists, the pricing services may utilize a market-based approach through which quotes from market makers are used to determine fair value. In instances where sufficient market activity may not exist or is limited, the pricing services also utilize proprietary valuation models which may consider market characteristics such as benchmark yield curves, credit spreads, estimated default rates, anticipated market interest rate volatility, coupon rates, anticipated timing of principal repayments, underlying collateral, and other unique security features in order to estimate the relevant cash flows, which are then discounted to calculate the fair value.
Certain derivative financial instruments trade in the OTC market. The Fund’s pricing services use various techniques including industry standard option pricing models and proprietary discounted cash flow models to determine the fair value of those instruments. The Fund’s net benefit or obligation under the derivative contract, as measured by the fair value of the contract, is included in net assets.
The Fund has procedures to determine the fair value of financial instruments for which market prices are not reliable or readily available. Under these procedures, the Fund primarily employs a market-based approach which may use related or comparable assets or liabilities, recent transactions, market multiples, book values, and other relevant information for the investment to determine the fair value of the investment. An income-based valuation approach may also be used in which the anticipated future cash flows of the investment are discounted to calculate fair value. Discounts may also be applied due to the nature or duration of any restrictions on the disposition of the investments. Due to the inherent uncertainty of valuations of such investments, the fair values may differ significantly from the values that would have been used had an active market existed.
Trading in securities on foreign securities stock exchanges and OTC markets may be completed before 4 p.m. Eastern time. In addition, trading in certain foreign markets may not take place on every Fund’s business day. Occasionally,
| 24 | Semiannual Report | franklintempleton.com | ||
FRANKLIN MUTUAL SERIES FUNDS
NOTES TO FINANCIAL STATEMENTS (UNAUDITED)
Franklin Mutual Financial Services Fund(continued)
events occur between the time at which trading in a foreign security is completed and 4 p.m. Eastern time that might call into question the reliability of the value of a portfolio security held by the Fund. As a result, differences may arise between the value of the Fund’s portfolio securities as determined at the foreign market close and the latest indications of value at 4 p.m. Eastern time. In order to minimize the potential for these differences, the VC monitors price movements following the close of trading in foreign stock markets through a series of country specific market proxies (such as baskets of American Depositary Receipts, futures contracts and exchange traded funds). These price movements are measured against established trigger thresholds for each specific market proxy to assist in determining if an event has occurred that may call into question the reliability of the values of the foreign securities held by the Fund. If such an event occurs, the securities may be valued using fair value procedures, which may include the use of independent pricing services.
When the last day of the reporting period is anon-business day, certain foreign markets may be open on those days that the Fund’s NAV is not calculated, which could result in differences between the value of the Fund’s portfolio securities on the last business day and the last calendar day of the reporting period. Any significant security valuation changes due to an open foreign market are adjusted and reflected by the Fund for financial reporting purposes.
b. Foreign Currency Translation
Portfolio securities and other assets and liabilities denominated in foreign currencies are translated into U.S. dollars based on the exchange rate of such currencies against U.S. dollars on the date of valuation. The Fund may enter into foreign currency exchange contracts to facilitate transactions denominated in a foreign currency. Purchases and sales of securities, income and expense items denominated in foreign currencies are translated into U.S. dollars at the exchange rate in effect on the transaction date. Portfolio securities and assets and liabilities denominated in foreign currencies contain risks that those currencies will decline in value relative to the U.S. dollar. Occasionally, events may impact the availability or reliability of foreign exchange rates used to convert the U.S. dollar equivalent value. If such an event occurs, the foreign exchange rate will be valued at fair value using procedures established and approved by the Board.
The Fund does not separately report the effect of changes in foreign exchange rates from changes in market prices on securities held. Such changes are included in net realized and unrealized gain or loss from investments in the Statement of Operations.
Realized foreign exchange gains or losses arise from sales of foreign currencies, currency gains or losses realized between the trade and settlement dates on securities transactions and the difference between the recorded amounts of dividends, interest, and foreign withholding taxes and the U.S. dollar equivalent of the amounts actually received or paid. Net unrealized foreign exchange gains and losses arise from changes in foreign exchange rates on foreign denominated assets and liabilities other than investments in securities held at the end of the reporting period.
c. Derivative Financial Instruments
The Fund invested in derivative financial instruments in order to manage risk or gain exposure to various other investments or markets. Derivatives are financial contracts based on an underlying or notional amount, require no initial investment or an initial net investment that is smaller than would normally be required to have a similar response to changes in market factors, and require or permit net settlement. Derivatives contain various risks including the potential inability of the counterparty to fulfill their obligations under the terms of the contract, the potential for an illiquid secondary market, and/or the potential for market movements which expose the Fund to gains or losses in excess of the amounts shown in the Statement of Assets and Liabilities. Realized gain and loss and unrealized appreciation and depreciation on these contracts for the period are included in the Statement of Operations.
Derivative counterparty credit risk is managed through a formal evaluation of the creditworthiness of all potential counterparties. The Fund attempts to reduce its exposure to counterparty credit risk on OTC derivatives, whenever possible, by entering into International Swaps and Derivatives Association (ISDA) master agreements with certain counterparties. These agreements contain various provisions, including but not limited to collateral requirements, events of default, or early termination. Termination events applicable to the counterparty include certain deteriorations in the credit quality of the counterparty. Termination events applicable to the Fund include failure of the Fund to maintain certain net asset levels and/or limit the decline in net assets over various
| franklintempleton.com | Semiannual Report | 25 | ||
FRANKLIN MUTUAL SERIES FUNDS
NOTES TO FINANCIAL STATEMENTS (UNAUDITED)
Franklin Mutual Financial Services Fund(continued)
1. Organization and Significant Accounting Policies (continued)
c. Derivative Financial Instruments(continued)
periods of time. In the event of default or early termination, the ISDA master agreement gives thenon-defaulting party the right to net andclose-out all transactions traded, whether or not arising under the ISDA agreement, to one net amount payable by one counterparty to the other. However, absent an event of default or early termination, OTC derivative assets and liabilities are presented gross and not offset in the Statement of Assets and Liabilities. Early termination by the counterparty may result in an immediate payment by the Fund of any net liability owed to that counterparty under the ISDA agreement. At June 30, 2019, the Fund had OTC derivatives in a net liability position of $508,105 and the aggregate value of collateral pledged for such contracts was $547,251.
Collateral requirements differ by type of derivative. Collateral or initial margin requirements are set by the broker or exchange clearing house for exchange traded and centrally cleared derivatives. Initial margin deposited is held at the exchange and can be in the form of cash and/or securities. For OTC derivatives traded under an ISDA master agreement, posting of collateral is required by either the Fund or the applicable counterparty if the total net exposure of all OTC derivatives with the applicable counterparty exceeds the minimum transfer amount, which typically ranges from $100,000 to $250,000, and can vary depending on the counterparty and the type of the agreement. Generally, collateral is determined at the close of Fund business each day and any additional collateral required due to changes in derivative values may be delivered by the Fund or the counterparty the next business day, or within a few business days. Collateral pledged and/or received by the Fund for OTC derivatives, if any, is held in segregated accounts with the Fund’s custodian/counterparty broker and can be in the form of cash and/or securities. Unrestricted cash may be invested according to the Fund’s investment objectives. To the extent that the amounts due to the Fund from its counterparties are not subject to collateralization or are not fully collateralized, the Fund bears the risk of loss from counterpartynon-performance.
At June 30, 2019, the Fund received $1,066,916 in U.K. Treasury Bonds and U.S. Treasury Bills, Bonds and Notes as collateral for derivatives.
The Fund entered into exchange traded futures contracts primarily to manage exposure to certain foreign currencies. A futures contract is an agreement between the Fund and a counterparty to buy or sell an asset at a specified price on a future date. Required initial margins are pledged by the Fund, and the daily change in fair value is accounted for as a variation margin payable or receivable in the Statement of Assets and Liabilities.
The Fund entered into OTC forward exchange contracts primarily to manage exposure to certain foreign currencies. A forward exchange contract is an agreement between the Fund and a counterparty to buy or sell a foreign currency at a specific exchange rate on a future date.
See Note 9 regarding other derivative information.
d. Securities Lending
The Fund participates in an agency based securities lending program to earn additional income. The Fund receives cash collateral against the loaned securities in an amount equal to at least 102% of the fair value of the loaned securities. Collateral is maintained over the life of the loan in an amount not less than 100% of the fair value of loaned securities, as determined at the close of Fund business each day; any additional collateral required due to changes in security values is delivered to the Fund on the next business day. The collateral is deposited into a joint cash account with other funds and is used to invest in a money market fund managed by Franklin Advisers, Inc., an affiliate of the Fund, and/or a joint repurchase agreement. The Fund may receive income from the investment of cash collateral, in addition to lending fees and rebates paid by the borrower. Income from securities loaned, net of fees paid to the securities lending agent and/or third-party vendor, is reported separately in the Statement of Operations. The Fund bears the market risk with respect to the collateral investment, securities loaned, and the risk that the agent may default on its obligations to the Fund. If the borrower defaults on its obligation to return the securities loaned, the Fund has the right to repurchase the securities in the open market using the collateral received. The securities lending agent has agreed to indemnify the Fund in the event of default by a third party borrower. At June 30, 2019, the Fund had no securities on loan.
| 26 | Semiannual Report | franklintempleton.com | ||
FRANKLIN MUTUAL SERIES FUNDS
NOTES TO FINANCIAL STATEMENTS (UNAUDITED)
Franklin Mutual Financial Services Fund(continued)
e. Income and Deferred Taxes
It is the Fund’s policy to qualify as a regulated investment company under the Internal Revenue Code. The Fund intends to distribute to shareholders substantially all of its taxable income and net realized gains to relieve it from federal income and excise taxes. As a result, no provision for U.S. federal income taxes is required.
The Fund may be subject to foreign taxation related to income received, capital gains on the sale of securities and certain foreign currency transactions in the foreign jurisdictions in which it invests. Foreign taxes, if any, are recorded based on the tax regulations and rates that exist in the foreign markets in which the Fund invests. When a capital gain tax is determined to apply, the Fund records an estimated deferred tax liability in an amount that would be payable if the securities were disposed of on the valuation date.
As a result of several court cases, in certain countries across the European Union, the Fund filed additional tax reclaims for previously withheld taxes on dividends earned in those countries (EU reclaims). These additional filings are subject to various administrative proceedings by the local jurisdictions’ tax authorities within the European Union, as well as a number of related judicial proceedings. Income recognized, if any, for EU reclaims is reflected as other income in the Statement of Operations and any related receivable, if any, is reflected as European Union tax reclaims in the Statement of Assets and Liabilities. When uncertainty exists as to the ultimate resolution of these proceedings, the likelihood of receipt of these EU reclaims, and the potential timing of payment, no amounts are reflected in the financial statements. For U.S. income tax purposes, EU reclaims received by the Fund, if any, reduce the amounts of foreign taxes Fund shareholders can use as tax credits in their individual income tax returns.
The Fund may recognize an income tax liability related to its uncertain tax positions under U.S. GAAP when the uncertain tax position has a less than 50% probability that it will be sustained upon examination by the tax authorities based on its technical merits. As of June 30, 2019, the Fund has determined that no tax liability is required in its financial statements related to uncertain tax positions for any open tax years (or expected to be taken in future tax years). Open tax years are those that remain subject to examination and are based on the statute of limitations in each jurisdiction in which the Fund invests.
f. Security Transactions, Investment Income, Expenses and Distributions
Security transactions are accounted for on trade date. Realized gains and losses on security transactions are determined on a specific identification basis. Interest income and estimated expenses are accrued daily. Amortization of premium and accretion of discount on debt securities are included in interest income. Dividend income is recorded on theex-dividend date except for certain dividends from securities where the dividend rate is not available. In such cases, the dividend is recorded as soon as the information is received by the Fund. Distributions to shareholders are recorded on theex-dividend date. Distributable earnings are determined according to income tax regulations (tax basis) and may differ from earnings recorded in accordance with U.S. GAAP. These differences may be permanent or temporary. Permanent differences are reclassified among capital accounts to reflect their tax character. These reclassifications have no impact on net assets or the results of operations. Temporary differences are not reclassified, as they may reverse in subsequent periods.
Common expenses incurred by the Trust are allocated among the Funds based on the ratio of net assets of each Fund to the combined net assets of the Trust or based on the ratio of number of shareholders of each Fund to the combined number of shareholders of the Trust. Fund specific expenses are charged directly to the Fund that incurred the expense.
Realized and unrealized gains and losses and net investment income, excluding class specific expenses, are allocated daily to each class of shares based upon the relative proportion of net assets of each class. Differences in per share distributions by class are generally due to differences in class specific expenses.
g. Accounting Estimates
The preparation of financial statements in accordance with U.S. GAAP requires management to make estimates and assumptions that affect the reported amounts of assets and liabilities at the date of the financial statements and the amounts of income and expenses during the reporting period. Actual results could differ from those estimates.
h. Guarantees and Indemnifications
Under the Trust’s organizational documents, its officers and trustees are indemnified by the Trust against certain liabilities arising out of the performance of their duties to the Trust.
| franklintempleton.com | Semiannual Report | 27 | ||
FRANKLIN MUTUAL SERIES FUNDS
NOTES TO FINANCIAL STATEMENTS (UNAUDITED)
Franklin Mutual Financial Services Fund(continued)
1. Organization and Significant Accounting
Policies(continued)
h. Guarantees and Indemnifications(continued)
Additionally, in the normal course of business, the Trust, on behalf of the Fund, enters into contracts with service
providers that contain general indemnification clauses. The Trust’s maximum exposure under these arrangements is unknown as this would involve future claims that may be made against the Trust that have not yet occurred. Currently, the Trust expects the risk of loss to be remote.
2. Shares of Beneficial Interest
At June 30, 2019, there were an unlimited number of shares authorized (without par value). Transactions in the Fund’s shares were as follows:
Six Months Ended June 30, 2019 | Year Ended December 31, 2018 | |||||||||||||||
| Shares | Amount | Shares | Amount | |||||||||||||
| Class Z Shares: | ||||||||||||||||
| Shares sold | 509,025 | $ | 10,785,069 | 1,795,911 | $ | 42,587,212 | ||||||||||
| Shares issued in reinvestment of distributions | — | — | 232,915 | 4,484,624 | ||||||||||||
| Shares redeemed | (1,227,440 | ) | (25,761,170 | ) | (3,453,297 | ) | (80,020,375) | |||||||||
|
| |||||||||||||||
| Net increase (decrease) | (718,415 | ) | $ | (14,976,101 | ) | (1,424,471 | ) | $ | (32,948,539) | |||||||
|
| |||||||||||||||
| Class A Shares: | ||||||||||||||||
| Shares solda | 453,668 | $ | 9,550,207 | 3,840,652 | $ | 88,515,496 | ||||||||||
| Shares issued in reinvestment of distributions | — | — | 483,446 | 9,333,950 | ||||||||||||
| Shares redeemed | (2,431,075 | ) | (51,277,934 | ) | (4,247,680 | ) | (97,114,731) | |||||||||
|
| |||||||||||||||
| Net increase (decrease) | (1,977,407 | ) | $ | (41,727,727 | ) | 76,418 | $ | 734,715 | ||||||||
|
| |||||||||||||||
| Class C Shares: | ||||||||||||||||
| Shares sold | 102,935 | $ | 2,132,582 | 619,361 | $ | 14,593,999 | ||||||||||
| Shares issued in reinvestment of distributions | — | — | 92,903 | 1,798,559 | ||||||||||||
| Shares redeemeda | (611,258 | ) | (12,720,963 | ) | (3,248,605 | ) | (72,590,023) | |||||||||
|
| |||||||||||||||
| Net increase (decrease) | (508,323 | ) | $ | (10,588,381 | ) | (2,536,341 | ) | $ | (56,197,465) | |||||||
|
| |||||||||||||||
| Class R6 Shares: | ||||||||||||||||
| Shares sold | 11,059 | $ | 232,597 | 79,359 | $ | 1,851,756 | ||||||||||
| Shares issued in reinvestment of distributions | — | — | 5,949 | 115,264 | ||||||||||||
| Shares redeemed | (10,250 | ) | (217,581 | ) | (99,309 | ) | (2,321,506) | |||||||||
|
| |||||||||||||||
| Net increase (decrease) | 809 | $ | 15,016 | (14,001 | ) | $ | (354,486) | |||||||||
|
| |||||||||||||||
aMay include a portion of Class C shares that were automatically converted to Class A.
| 28 | Semiannual Report | franklintempleton.com | ||
FRANKLIN MUTUAL SERIES FUNDS
NOTES TO FINANCIAL STATEMENTS (UNAUDITED)
Franklin Mutual Financial Services Fund(continued)
3. Transactions with Affiliates
Franklin Resources, Inc. is the holding company for various subsidiaries that together are referred to as Franklin Templeton. Certain officers and trustees of the Fund are also officers and/or directors of the following subsidiaries:
| Subsidiary | Affiliation | |
Franklin Mutual Advisers, LLC (Franklin Mutual)
|
Investment manager
| |
Franklin Templeton Services, LLC (FT Services)
|
Administrative manager
| |
Franklin Templeton Distributors, Inc. (Distributors)
|
Principal underwriter
| |
Franklin Templeton Investor Services, LLC (Investor Services)
|
Transfer agent
| |
a. Management Fees
The Fund pays an investment management fee to Franklin Mutual based on the average daily net assets of the Fund as follows:
| Annualized Fee Rate | Net Assets | |
0.875% | Up to and including $1 billion | |
0.845% | Over $1 billion, up to and including $2 billion | |
0.825% | Over $2 billion, up to and including $5 billion | |
0.805% | In excess of $5 billion | |
b. Administrative Fees
Under an agreement with Franklin Mutual, FT Services provides administrative services to the Fund. The fee is paid by Franklin Mutual based on the Fund’s average daily net assets, and is not an additional expense of the Fund.
c. Distribution Fees
The Board has adopted distribution plans for each share class, with the exception of Class Z and Class R6 shares, pursuant to Rule12b-1 under the 1940 Act. Under the Fund’s Class A reimbursement distribution plan, the Fund reimburses Distributors for costs incurred in connection with the servicing, sale and distribution of the Fund’s shares up to the maximum annual plan rate. Under the Class A reimbursement distribution plan, costs exceeding the maximum for the current plan year cannot be reimbursed in subsequent periods. In addition, under the Fund’s Class C compensation distribution plan, the Fund pays Distributors for costs incurred in connection with the servicing, sale and distribution of the Fund’s shares up to the maximum annual plan rate. The plan year, for purposes of monitoring compliance with the maximum annual plan rates, is February 1 through January 31.
The maximum annual plan rates, based on the average daily net assets, for each class, are as follows:
Class A | 0.35% | |||
Class C | 1.00% |
The Board has set the current rate at 0.25% per year for Class A shares until further notice and approval by the Board.
| franklintempleton.com | Semiannual Report | 29 | ||||
FRANKLIN MUTUAL SERIES FUNDS
NOTES TO FINANCIAL STATEMENTS (UNAUDITED)
Franklin Mutual Financial Services Fund (continued)
3. Transactions with Affiliates(continued)
d. Sales Charges/Underwriting Agreements
Front-end sales charges and contingent deferred sales charges (CDSC) do not represent expenses of the Fund. These charges are deducted from the proceeds of sales of Fund shares prior to investment or from redemption proceeds prior to remittance, as applicable. Distributors has advised the Fund of the following commission transactions related to the sales and redemptions of the Fund’s shares for the period:
Sales charges retained net of commissions paid to unaffiliated brokers/dealers | $ | 9,649 | ||
CDSC retained | $ | 3,253 |
e. Transfer Agent Fees
Each class of shares pays transfer agent fees to Investor Services for its performance of shareholder servicing obligations. The fees are based on an annualized asset based fee of 0.02% plus a transaction based fee. In addition, each class reimburses Investor Services for out of pocket expenses incurred and, except for Class R6 reimburses shareholder servicing fees paid to third parties. These fees are allocated daily based upon their relative proportion of such classes’ aggregate net assets. Class R6 pays Investor Services transfer agent fees specific to that class.
For the period ended June 30, 2019, the Fund paid transfer agent fees of $411,568, of which $196,703 was retained by Investor Services.
f. Waiver and Expense Reimbursements
Investor Services has contractually agreed in advance to waive or limit its fees so that the Class R6 transfer agent fees do not exceed 0.02% based on the average net assets of the class until April 30, 2020. Prior to May 1, 2019, the Class R6 transfer agent fees were limited to 0.03%.
g. Interfund Transactions
The Fund engaged in purchases and sales of investments with funds or other accounts that have common investment managers (or affiliated investment managers), directors, trustees or officers. During the period ended June 30, 2019, these purchase and sale transactions aggregated $0 and $2,231,546, respectively.
4. Expense Offset Arrangement
The Fund has entered into an arrangement with its custodian whereby credits realized as a result of uninvested cash balances are used to reduce a portion of the Fund’s custodian expenses. During the period ended June 30, 2019, the custodian fees were reduced as noted in the Statement of Operations.
5. Independent Trustees’ Retirement Plan
On January 1, 1993, the Trust adopted an Independent Trustees’ Retirement Plan (Plan). The Plan is an unfunded defined benefit plan that provides benefit payments to Trustees whose length of service and retirement age meets the eligibility requirements of the Plan. Benefits under the Plan are based on years of service and fees paid to each trustee at the time of retirement. Effective in December 1996, the Plan was closed to new participants.
| 30 | Semiannual Report | franklintempleton.com | ||
FRANKLIN MUTUAL SERIES FUNDS
NOTES TO FINANCIAL STATEMENTS (UNAUDITED)
Franklin Mutual Financial Services Fund(continued)
During the period ended June 30, 2019, the Fund’s projected benefit obligation and benefit payments under the Plan were as follows:
aProjected benefit obligation at June 30, 2019 | $ | 37,454 | ||
bIncrease in projected benefit obligation | $ | 4,865 | ||
Benefit payments made to retired trustees | $ | (324 | ) |
aThe projected benefit obligation is included in trustees’ fees and expenses in the Statement of Assets and Liabilities.
bThe increase in projected benefit obligation is included in trustees’ fees and expenses in the Statement of Operations.
6. Income Taxes
For tax purposes, the Fund may elect to defer any portion of a post-October capital loss to the first day of the following fiscal year. At December 31, 2018, the Fund deferred post-October capital losses of $6,531,857.
At June 30, 2019, the cost of investments and net unrealized appreciation (depreciation) for income tax purposes were as follows:
Cost of investments | $505,512,271 | |||
|
| |||
Unrealized appreciation | $ 49,494,869 | |||
Unrealized depreciation | (65,846,219 | ) | ||
|
| |||
Net unrealized appreciation (depreciation) | $ (16,351,350 | ) | ||
|
| |||
Differences between income and/or capital gains as determined on a book basis and a tax basis are primarily due to differing treatments of foreign currency transactions and passive foreign investment company shares.
7. Investment Transactions
Purchases and sales of investments (excluding short term securities) for the period ended June 30, 2019, aggregated $28,929,251 and $84,814,774, respectively.
8. Concentration of Risk
Investing in foreign securities may include certain risks and considerations not typically associated with investing in U.S. securities, such as fluctuating currency values and changing local and regional economic, political and social conditions, which may result in greater market volatility. Current political and financial uncertainty surrounding the European Union may increase market volatility and the economic risk of investing in securities in Europe. In addition, certain foreign securities may not be as liquid as U.S. securities.
| franklintempleton.com | Semiannual Report | 31 | ||||
FRANKLIN MUTUAL SERIES FUNDS
NOTES TO FINANCIAL STATEMENTS (UNAUDITED)
Franklin Mutual Financial Services Fund(continued)
9. Other Derivative Information
At June 30, 2019, the investments in derivative contracts are reflected in the Statement of Assets and Liabilities as follows:
Asset Derivatives | Liability Derivatives | |||||||||||
| Derivative Contracts Not Accounted for as Hedging Instruments | Statement of Assets and Liabilities Location | Fair Value | Statement of Assets and Liabilities Location | Fair Value | ||||||||
Foreign exchange contracts | Variation margin on futures contracts | $ | 17,236 | a | Variation margin on futures contracts | $ | 64,917 | a | ||||
Unrealized appreciation on OTC forward exchange contracts | 1,365,142 | Unrealized depreciation on OTC forward exchange contracts | 757,262 | |||||||||
|
|
|
| |||||||||
Totals | $ | 1,382,378 | $ | 822,179 | ||||||||
|
|
|
| |||||||||
aThis amount reflects the cumulative appreciation (depreciation) of futures contracts as reported in the Statement of Investments. Only the variation margin receivable/payable at period end is separately reported within the Statement of Assets and Liabilities. Prior variation margin movements were recorded to cash upon receipt or payment.
For the period ended June 30, 2019, the effect of derivative contracts in the Statement of Operations was as follows:
| Derivative Contracts Not Accounted for as Hedging Instruments | Statement of Operations Location | Net Realized Gain (Loss) for the Period | Statement of Operations Location | Net Change in Unrealized Appreciation (Depreciation) for the Period | ||||||||
Net realized gain (loss) from: | Net change in unrealized appreciation (depreciation) on: | |||||||||||
Foreign exchange contracts | Forward exchange contracts | $3,610,188 | Forward exchange contracts | $ (964,477) | ||||||||
Futures contracts | 693,691 | Futures contracts | (74,350) | |||||||||
|
|
|
| |||||||||
Totals | $4,303,879 | $(1,038,827 | ) | |||||||||
|
|
|
| |||||||||
For the period ended June 30, 2019, the average month end notional amount of futures contracts represented $33,614,410. The average month end contract value of forward exchange contracts was $188,955,996.
See Note 1(c) regarding derivative financial instruments.
10. Holdings of 5% Voting Securities of Portfolio Companies
The 1940 Act defines “affiliated companies” to include investments in portfolio companies in which a fund owns 5% or more of the outstanding voting securities. During the period ended June 30, 2019, investments in “affiliated companies” were as follows:
| Name of Issuer | Value at Beginning of Period | Purchases | Sales | Realized Gain (Loss) | Net Change in Unrealized Appreciation (Depreciation) | Value at End of Period | Number of Shares Held at End of Period | Dividend Income | ||||||||||||||||||||||||
| Non-Controlled Affiliates |
| |||||||||||||||||||||||||||||||
AB&T Financial Corp. (Value is 0.0%†of Net Assets) | $126,616 | $ — | $ — | $ — | $(7,902 | ) | $118,714 | 226,100 | $287 | |||||||||||||||||||||||
|
|
|
| |||||||||||||||||||||||||||||
†Rounds to less than 0.1% of net assets.
32 | Semiannual Report | franklintempleton.com | ||
FRANKLIN MUTUAL SERIES FUNDS
NOTES TO FINANCIAL STATEMENTS (UNAUDITED)
Franklin Mutual Financial Services Fund(continued)
11. Credit Facility
The Fund, together with other U.S. registered and foreign investment funds (collectively, Borrowers), managed by Franklin Templeton, are borrowers in a joint syndicated senior unsecured credit facility totaling $2 billion (Global Credit Facility) which matures on February 7, 2020. This Global Credit Facility provides a source of funds to the Borrowers for temporary and emergency purposes, including the ability to meet future unanticipated or unusually large redemption requests.
Under the terms of the Global Credit Facility, the Fund shall, in addition to interest charged on any borrowings made by the Fund and other costs incurred by the Fund, pay its share of fees and expenses incurred in connection with the implementation and maintenance of the Global Credit Facility, based upon its relative share of the aggregate net assets of all of the Borrowers, including an annual commitment fee of 0.15% based upon the unused portion of the Global Credit Facility. These fees are reflected in other expenses in the Statement of Operations. During the period ended June 30, 2019, the Fund did not use the Global Credit Facility.
12. Fair Value Measurements
The Fund follows a fair value hierarchy that distinguishes between market data obtained from independent sources (observable inputs) and the Fund’s own market assumptions (unobservable inputs). These inputs are used in determining the value of the Fund’s financial instruments and are summarized in the following fair value hierarchy:
| • | Level 1 – quoted prices in active markets for identical financial instruments |
| • | Level 2 – other significant observable inputs (including quoted prices for similar financial instruments, interest rates, prepayment speed, credit risk, etc.) |
| • | Level 3 – significant unobservable inputs (including the Fund’s own assumptions in determining the fair value of financial instruments) |
The input levels are not necessarily an indication of the risk or liquidity associated with financial instruments at that level.
A summary of inputs used as of June 30, 2019, in valuing the Fund’s assets and liabilities carried at fair value, is as follows:
| Level 1 | Level 2 | Level 3 | Total | |||||||||||||
| Assets: | ||||||||||||||||
Investments in Securities:a | ||||||||||||||||
Equity Investments | $ | 446,659,157 | $ | — | $ | — | $ | 446,659,157 | ||||||||
Short Term Investments | 19,940,836 | 22,000,000 | — | 41,940,836 | ||||||||||||
|
| |||||||||||||||
Total Investments in Securities | $ | 466,599,993 | $ | 22,000,000 | $ | — | $ | 488,599,993 | ||||||||
|
| |||||||||||||||
Other Financial Instruments: | ||||||||||||||||
Futures Contracts | $ | 17,236 | $ | — | $ | — | $ | 17,236 | ||||||||
Forward Exchange Contracts | — | 1,365,142 | — | 1,365,142 | ||||||||||||
|
| |||||||||||||||
Total Other Financial Instruments | $ | 17,236 | $ | 1,365,142 | $ | — | $ | 1,382,378 | ||||||||
|
| |||||||||||||||
| Liabilities: | ||||||||||||||||
Other Financial Instruments: | ||||||||||||||||
Futures Contracts | $ | 64,917 | $ | — | $ | — | $ | 64,917 | ||||||||
Forward Exchange Contracts | — | 757,262 | — | 757,262 | ||||||||||||
|
| |||||||||||||||
Total Other Financial Instruments | $ | 64,917 | $ | 757,262 | $ | — | $ | 822,179 | ||||||||
|
| |||||||||||||||
aFor detailed categories, see the accompanying Statement of Investments.
| franklintempleton.com | Semiannual Report | 33 | ||||
FRANKLIN MUTUAL SERIES FUNDS
NOTES TO FINANCIAL STATEMENTS (UNAUDITED)
Franklin Mutual Financial Services Fund(continued)
13. New Accounting Pronouncements
In August 2018, the Financial Accounting Standards Board issued Accounting Standards Update (ASU)No. 2018-14, Compensation—Retirement Benefits—Defined Benefit Plans—General (Subtopic715-20): Disclosure Framework—Changes to the Disclosure Requirements for Defined Benefit Plans. The amendments in the ASU modify the disclosure requirements for employers that sponsor defined benefit pension or other postretirement plans. The ASU is effective for annual reporting periods ending after December 15, 2020. Management has reviewed the requirements and believes the adoption of this ASU will not have a material impact on the financial statements.
14. Subsequent Events
The Fund has evaluated subsequent events through the issuance of the financial statements and determined that no events have occurred that require disclosure.
Abbreviations
| Counterparty | Currency | Selected Portfolio | ||||||||
| BOFA | Bank of America Corp. | EUR | Euro | FHLB | Federal Home Loan Bank | |||||
| BONY | The Bank of New York Mellon Corp. | GBP | British Pound | |||||||
| HSBK | HSBC Bank PLC | USD | United States Dollar | |||||||
| SSBT | State Street Bank and Trust Co., N.A. | |||||||||
| UBSW | UBS AG | |||||||||
34 |
Semiannual Report |
franklintempleton.com | ||
FRANKLIN MUTUAL SERIES FUNDS
FRANKLIN MUTUAL FINANCIAL SERVICES FUND
Board Approval of Investment Management Agreements
FRANKLIN MUTUAL SERIES FUNDS
Franklin Mutual Financial Services Fund
(Fund)
The Board of Trustees (Board), including a majority of trustees that are not “interested persons” as such term is defined in section 2(a)(19) of the Investment Company Act of 1940 (hereinafter referred to as “independent trustees”), at anin-person meeting held on May 22, 2019, unanimously approved the renewal of the Fund’s investment management agreement. Prior to a meeting of all of the trustees for the purpose of considering such renewal, the independent trustees participated in two other meetings held in connection with the renewal process. Throughout the process, the independent trustees received assistance and advice from and met separately with independent counsel. The independent trustees met with and interviewed officers of the investment manager (including portfolio managers), the transfer agent and shareholder services group and the distributor. In approving the renewal of the investment management agreement for the Fund, the Board, including the independent trustees, determined that the investment management fee structure was fair and reasonable and that continuance of the agreement was in the best interests of the Fund and its shareholders.
In reaching their decision on the investment management agreement, the trustees took into account information furnished throughout the year at regular Board meetings, as well as information specifically requested and furnished for the renewal process, which culminated in the meetings referred to above for the specific purpose of considering such agreement. Information furnished throughout the year included, among others, reports on the Fund’s investment performance, expenses, portfolio composition, portfolio brokerage execution, client commission arrangements, derivatives, securities lending, asset segregation, portfolio turnover, Rule12b-1 plan, distribution, shareholder servicing, legal and compliance matters, pricing of securities, sales and redemptions, and marketing support payments made to financial intermediaries, as well as a third-party survey of transfer agent fees charged to funds within the Franklin Templeton Investments (FTI) complex in comparison with those charged to other fund complexes deemed comparable. Also, related financial statements and other information about the scope and quality of services provided by the investment manager and its affiliates and enhancements to
such services over the past year were provided. In addition, the trustees received periodic reports throughout the year and during the renewal process relating to compliance with the Fund’s investment policies and restrictions. During the renewal process, the independent trustees considered the investment manager’s methods of operation within the Franklin Templeton group and its activities on behalf of other clients. The Board also noted that it received an annual report on all payments made by FTI or the Fund to financial intermediaries engaged in the sale of Fund shares, as well as a memorandum relating to third-party servicing arrangements in response to a Guidance Update from the U.S. Securities and Exchange Commission (SEC) relating to mutual fund distribution andsub-accounting fees.
The information obtained by the trustees during the renewal process also included a special report prepared by Broadridge Financial Solutions, Inc., an independent third-party analyst that utilizes data from Lipper, Inc. (“Lipper”), comparing the Fund’s investment performance and expenses with those of other mutual funds deemed comparable to the Fund as selected by Lipper (Broadridge Section 15(c) Report). The trustees reviewed the Broadridge Section 15(c) Report and its usefulness in the renewal process with respect to matters such as comparative fees, expenses, expense ratios, performance and volatility. They concluded that the report continues to be a reliable resource in the performance of their duties.
In addition, the trustees received a Profitability Study (Profitability Study) prepared by management discussing the profitability to FTI from its overall U.S. fund operations, as well as on an individualfund-by-fund basis. Over the past year, the Board and counsel to the independent trustees continued to receive reports on management’s handling of recent regulatory inquiries and pending legal actions against the investment manager and its affiliates. The independent trustees were satisfied with the actions taken to date by management in response to such regulatory and legal matters.
The trustees reviewed the personnel, operations, financial condition, and investment management capabilities, methodologies and resources of the investment manager. As part of this review, particular attention was given to management’s diligent risk management program, including continual monitoring and management of cybersecurity, liquidity and counterparty credit risk, and attention given to derivatives and other complex instruments that are held and expected to be held by the Fund and how such instruments
franklintempleton.com |
Semiannual Report |
|
35 |
| ||
FRANKLIN MUTUAL SERIES FUNDS
FRANKLIN MUTUAL FINANCIAL SERVICES FUND
SHAREHOLDER INFORMATION
are used to carry out the Fund’s investment goal(s). The Board also took into account, among other things, management’s efforts in establishing a global credit facility for the benefit of the Fund and other accounts managed by FTI to provide a source of cash for temporary and emergency purposes or to meet unusual redemption requests as well as the strong financial position of the investment manager’s parent company and its commitment to the mutual fund business. The Board noted management’s continuing efforts and expenditures in establishing effective business continuity plans and developing strategies to address areas of heightened concern in the mutual fund industry, such as cybersecurity and liquidity risk management. The Board also recognized management’s commitment to facilitating Board oversight of particular areas, including derivatives and payments to intermediaries, by enhanced reporting.
In addition to the above and other matters considered by the trustees throughout the course of the year, the following discussion relates to certain primary factors relevant to the Board’s decision. This discussion of the information and factors considered by the Board (including the information and factors discussed above) is not intended to be exhaustive, but rather summarizes certain factors considered by the Board. In view of the wide variety of factors considered, the Board did not, unless otherwise noted, find it practicable to quantify or otherwise assign relative weights to the foregoing factors. In addition, individual trustees may have assigned different weights to various factors.
NATURE, EXTENT AND QUALITY OF SERVICES.The trustees reviewed the nature, extent and quality of the services provided, and to be provided, by the investment manager. The trustees cited the investment manager’s ability to implement the Fund’s disciplined value investment approach and its long-term relationship with the Fund as reasons that shareholders choose to invest, and remain invested, in the Fund. The trustees reviewed the Fund’s portfolio management team, including its performance, staffing, skills and compensation program. With respect to portfolio manager compensation, management assured the trustees that the Fund’s long-term performance is a significant component of incentive-based compensation and noted that a portion of a portfolio manager’s incentive-based compensation is paid in shares ofpre- designated funds from the portfolio manager’s fund management area. The trustees noted that the portfolio manager compensation program aligned the interests of the portfolio managers with that of shareholders of the Fund. The trustees discussed
with management various other products, portfolios and entities that are advised by the investment manager and the allocation of assets and expenses among and within them, as well as their relative fees and reasons for differences with respect thereto and any potential conflicts. During regular Board meetings and the aforementioned meetings of the independent trustees, the trustees received reports and presentations on the investment manager’s best execution trading policies. The trustees considered periodic reports provided to them showing that the investment manager complied with the investment policies and restrictions of the Fund as well as other reports periodically furnished to the Board covering matters such as the compliance of portfolio managers and other management personnel with the code of ethics covering the investment management personnel, the adherence to fair value pricing procedures established by the Board and the accuracy of net asset value calculations. The Board noted the extent of the benefits provided to Fund shareholders from being part of the Franklin Templeton group of funds, including the right to exchange investments between funds (same class) without a sales charge, the ability to reinvest Fund dividends into other funds and the right to combine holdings of other funds to obtain reduced sales charges. The Board considered the investment manager’s significant efforts in developing and implementing compliance procedures established in accordance with SEC and other requirements.
The Board considered the nature, extent and quality of the services to be provided under the Fund’s other service agreements to determine that, on an overall basis, Fund shareholders were well served. In this connection, the Board also took into account transfer agent and shareholder services provided to Fund shareholders by an affiliate of the investment manager, noting continuing expenditures by management to increase and improve the scope of such services and favorable periodic reports on shareholder services conducted by independent third parties. While such considerations directly affected the trustees’ decision in renewing the Fund’s transfer agent and shareholder services agreement, the Board also considered these commitments as incidental benefits to Fund shareholders deriving from the investment management relationship.
36 |
Semiannual Report | franklintempleton.com | ||
FRANKLIN MUTUAL SERIES FUNDS
FRANKLIN MUTUAL FINANCIAL SERVICES FUND
SHAREHOLDER INFORMATION
Based on their review, the trustees were satisfied with the nature and quality of the overall services provided, and to be provided, by the investment manager and its affiliates to the Fund and its shareholders and were confident in the abilities of the management team to continue the disciplined value investment approach of the Fund and to provide quality services to the Fund and its shareholders.
INVESTMENT PERFORMANCE.The trustees reviewed and placed significant emphasis on the investment performance of the Fund over theone-, three-, five- and10-year periods ended December 31, 2018. They considered the history of successful performance of the Fund relative to various benchmarks. As part of their review, they inquired of management regarding benchmarks, style drift and restrictions on permitted investments. Consideration was also given to performance in the context of available levels of cash during the periods.
The trustees had meetings during the year, including the meetings referred to above held in connection with the renewal process, with the Fund’s portfolio managers to discuss performance and the management of the Fund. In addition to the materials provided by management in connection with the renewal process, the independent trustees requested throughout the year (and received) additional presentations from the investment manager and senior management of FTI regarding the performance of the investment manager and the Fund. As part of these presentations, the investment manager and senior management of FTI reviewed enhancements that have been made, and are being made, to the investment manager’s investment process. In addition, particular attention in assessing performance was given to the Broadridge Section 15(c) Report. That report showed the investment performance of the Fund (Class A shares) in comparison to other funds determined comparable by Lipper.
The comparable funds to the Fund, as chosen by Lipper, included all retail and institutional global financial services funds. The Fund had total returns in the middle performing quintile for theone-year period ended December 31, 2018, and had annualized total returns for the three- and five-year periods in the middle and second-best performing quintiles, respectively. The trustees noted that the Fund’s total return on an annualized basis for the10-year period ended December 31, 2018 was in the middle performing quintile. The Board concluded that such comparative performance was acceptable.
The trustees also compared Fund performance to other industry benchmarks, including measures of risk-adjusted performance of a fund, as part of their evaluation of investment performance. The trustees concluded that the Fund had continued to perform well in comparison to its various benchmarks and in the context of the Fund’s goals.
COMPARATIVE EXPENSES AND MANAGEMENT PROFITABILITY.The trustees considered the cost of the services provided and to be provided and the profits realized by the investment manager and its affiliates from their respective relationships with the Fund. As part of the renewal process, the trustees explored with management the trends in expense ratios over the past three fiscal years and the reasons for any increases in the Fund’s expense ratios (or components thereof). In considering the appropriateness of the management fee and other expenses charged to the Fund, the Board took into account various factors including investment performance and matters relating to Fund operations, including, but not limited to, the quality and experience of its portfolio managers and research staff. Consideration was also given to a comparative analysis in the Broadridge Section 15(c) Report of the investment management fee and total expense ratio of the Fund in comparison with those of a group of other funds selected by Lipper as its appropriate Lipper expense group. Lipper expense data is based upon information taken from each fund’s most recent annual report, which reflects historical asset levels that may be quite different from those currently existing, particularly in a period of market volatility. While recognizing such inherent limitation and the fact that expense ratios generally increase as assets decline and decrease as assets grow, the Board believed the independent analysis conducted by Lipper to be an appropriate measure of comparative expenses.
In reviewing comparative costs, emphasis was given to the Fund’s contractual management fee in comparison with the contractual management fee that would have been charged by other funds within its Lipper expense group assuming they were similar in size to the Fund, as well as the actual total expenses of the Fund in comparison with those of its Lipper expense group. The Lipper contractual management fee analysis includes administrative charges as being part of the management fee, and total expenses, for comparative consistency, are shown by Lipper for Fund Class A shares.
franklintempleton.com |
Semiannual Report |
|
37 |
| ||
FRANKLIN MUTUAL SERIES FUNDS
FRANKLIN MUTUAL FINANCIAL SERVICES FUND
SHAREHOLDER INFORMATION
The Fund’s contractual management fee rate was in the most expensive quintile of its Lipper expense group and its total expenses were in the second-most expensive quintile of such group. The Board noted that the Fund’s total expenses were within 1 basis point of its Lipper expense group median. The Board found such comparative fees and expenses to be acceptable in view of factors relating to the Fund’s operations, such as the quality and experience of its portfolio managers.
The trustees also reviewed the Profitability Study addressing profitability of Franklin Resources, Inc., from its overall U.S. fund business, as well as profitability to the Fund’s investment manager and its affiliates, from providing investment management and other services to the Fund during the12-month period ended September 30, 2018, the most recent fiscalyear-end of Franklin Resources, Inc. The trustees reviewed the basis on which such reports are prepared and the cost allocation methodology utilized in the Profitability Study, it being recognized that allocation methodologies may each be reasonable while producing different results. In this respect, the Board noted that the reasonableness of the cost allocation methodologies was reviewed by independent accountants on an every other year basis.
The independent trustees met with management to discuss the Profitability Study. This included, among other things, a comparison of investment management income with investment management expenses of the Fund; comparison of underwriting revenues and expenses; the relative relationship of investment management and underwriting expenses; shareholder servicing profitability; economies of scale; and the relative contribution of the Fund to the profitability of the investment manager and its parent. In discussing the Profitability Study with the Board, the investment manager stated its belief that the costs incurred in establishing the infrastructure necessary to operate the type of mutual fund operations conducted by it and its affiliates may not be fully reflected in the expenses allocated to the Fund in determining its profitability.
The Board also took into account management’s expenditures in improving shareholder services provided to the Fund, as well as the need to meet additional regulatory and compliance requirements. The trustees also considered the extent to which the investment manager may derive ancillary benefits from Fund operations, including those derived from economies of scale, discussed below, the allocation of Fund brokerage and the use of commission dollars to pay for research and other similar services.
Based upon their consideration of all these factors, the trustees determined that the level of profits realized by the investment manager and its affiliates in providing services to the Fund was not excessive in view of the nature, quality and extent of services provided.
ECONOMIES OF SCALE.The Board considered economies of scale realized by the investment manager and its affiliates as the Fund grows larger and the extent to which they are shared with Fund shareholders, as for example, in the level of the investment management fee charged, in the quality and efficiency of services rendered and in increased capital commitments benefiting the Fund directly or indirectly. While recognizing that any precise determination is inherently subjective, the trustees noted that, based upon the Profitability Study, as some funds increase in size, at some point economies of scale may result in the investment manager realizing a larger profit margin on investment management services provided to such a fund. The trustees also noted that benefits of economies of scale will be shared with Fund shareholders due to the decline in the effective investment management fee rate as breakpoints are achieved by the Fund.
The trustees noted that breakpoints had been instituted as part of the Fund’s investment management fee and that the Board regularly evaluates whether additional breakpoints are appropriate. The trustees assessed the savings to shareholders resulting from such breakpoints and believed they were, and continue to be, appropriate and they agreed to continue to monitor the appropriateness of the breakpoints. The trustees also considered the effects an increase in assets under management would have on the investment management fee and expense ratio of the Fund. To the extent further economies of scale may be realized by the investment manager and its affiliates, the Board believed the investment management fees provide a sharing of benefits with the Fund and its shareholders.
38 |
Semiannual Report |
franklintempleton.com | ||
FRANKLIN MUTUAL SERIES FUNDS
FRANKLIN MUTUAL FINANCIAL SERVICES FUND
SHAREHOLDER INFORMATION
Proxy Voting Policies and Procedures
The Fund’s investment manager has established Proxy Voting Policies and Procedures (Policies) that the Fund uses to determine how to vote proxies relating to portfolio securities. Shareholders may view the Fund’s complete Policies online at franklintempleton.com. Alternatively, shareholders may request copies of the Policies free of charge by calling the Proxy Group collect at (954)527-7678 or by sending a written request to: Franklin Templeton Companies, LLC, 300 S.E. 2nd Street, Fort Lauderdale, FL 33301, Attention: Proxy Group. Copies of the Fund’s proxy voting records are also made available online at franklintempleton.com and posted on the U.S. Securities and Exchange Commission’s website at sec.gov and reflect the most recent12-month period ended June 30.
Quarterly Statement of Investments
The Trust, on behalf of the Fund, files a complete statement of investments with the U.S. Securities and Exchange Commission for the first and third quarters for each fiscal year as an exhibit to its report on FormN-PORT. Shareholders may view the filed FormN-PORT by visiting the Commission’s website at sec.gov. The filed form may also be viewed and copied at the Commission’s Public Reference Room in Washington, DC. Information regarding the operations of the Public Reference Room may be obtained by calling(800) SEC-0330.
franklintempleton.com |
Semiannual Report |
|
39 |
| ||
This page intentionally left blank.
Authorized for distribution only when accompanied or preceded by a summary prospectus and/or prospectus. Investors should carefully consider a fund’s investment goals, risks, charges and expenses before investing. A prospectus contains this and other information; please read it carefully before investing.
To help ensure we provide you with quality service, all calls to and from our service areas are monitored and/or recorded.
| Semiannual Report and Shareholder Letter | |||||
| Franklin Mutual Financial Services Fund | ||||||
Investment Manager | Distributor | Shareholder Services | ||||
| Franklin Mutual Advisers, LLC | Franklin Templeton Distributors, Inc. (800) DIAL BEN®/342-5236 franklintempleton.com | (800) 632-2301 - (Class A, C & R6) (800)448-FUND - (Class Z) | ||||
| © 2019 Franklin Templeton Investments. All rights reserved. | 479 S 08/19 |
Sign up for electronic delivery at franklintempleton.com/edelivery
Internet Delivery of Fund Reports Unless You Request Paper Copies:Effective January 1, 2021, as permitted by the SEC, paper copies of the Fund’s shareholder reports will no longer be sent by mail, unless you specifically request them from the Fund or your financial intermediary. Instead, the reports will be made available on a website, and you will be notified by mail each time a report is posted and provided with a website link to access the report.
If you already elected to receive shareholder reports electronically, you will not be affected by this change and you need not take any action. If you have not signed up for electronic delivery, we would encourage you to join fellow shareholders who have. You may elect to receive shareholder reports and other communications electronically from the Fund by calling (800)632-2301 or by contacting your financial intermediary.
You may elect to continue to receive paper copies of all your future shareholder reports free of charge by contacting your financial intermediary or, if you invest directly with a Fund, calling (800)632-2301 to let the Fund know of your request. Your election to receive reports in paper will apply to all funds held in your account.
FRANKLIN TEMPLETON
Successful investing begins with ambition. And achievement only comes when you reach for it. That’s why we continually strive to deliver better outcomes for investors. No matter what your goals are, our deep, global investment expertise allows us to offer solutions that can help.
During our more than 70 years of experience, we’ve managed through all kinds of markets—up, down and those in between. We’re always preparing for what may come next. It’s because of this, combined with our strength as one of the world’s largest asset managers that we’ve earned the trust of millions of investors around the world.
Dear Franklin Mutual International Fund Shareholder:
The markets came into 2019 in a fog of uncertainty. The outlook for economic growth had become less bright and fears were mounting that the U.S. Federal Reserve (Fed) would make a policy misstep in raising interest rates too far. Over the past six months, many of these economic concerns have eased, as the Fed and other major central banks like the European Central Bank (ECB) turned more dovish amid signs that growth was becoming a bit more sluggish. The ECB suggested it would act should growth soften and inflation not materialize. This dovishness helped propel the U.S. equity market back toward record highs in June. Bond yields, meanwhile, fell on the prospect for increased central bank-driven liquidity, with some sovereign European bonds sliding back into negative territory.
Although the prospects of a more accommodative monetary policy eased fears about the economic outlook, persistent trade tensions between the U.S. and China, among other nations, kept markets on edge. This was on full display in May when markets fell sharply on a ratcheting up of tensions and after the U.S. government threatened to place tariffs on Mexican goods. Mideast tensions also began to heat up in June with attacks on oil tankers in the Persian Gulf and greater tensions between the U.S. and Iran.
How, and even whether, the U.K. will leave the European Union has also remained unresolved. Atperiod-end, the U.K. Conservative Party was conducting a leadership contest, which has the potential to complicate future Brexit negotiations and leave markets vulnerable to increased volatility.
Despite all this uncertainty, for thesix-month period ended June 30, 2019, U.S. stocks, as measured by the Standard & Poor’s 500® Index (S&P 500®), posted a +18.54% total return, while stocks in global developed markets, as measured by the MSCI World Index, posted a +17.38% total return.1
As has been the case in recent years, growth stocks, particularly in the technology sector, have outperformed over thesix-month period. Value stocks generally have remained disfavored in this environment where, at times, economic factors and monetary policy have had greater sway on equity returns than corporate fundamentals.
We recognize the important role of financial advisors in today’s markets and encourage investors to continue to seek their advice. Amid changing markets and economic conditions, we are confident investors with a well-diversified portfolio and a patient, long-term outlook will be well positioned for the years ahead.
On the following pages, the Fund’s portfolio management team reviews investment decisions that pertain to performance during the past six months considering the economic environment and other factors. Please remember all securities markets fluctuate, as do mutual fund share prices.
As previously communicated, the Fund is proposing to reorganize into Franklin Mutual Global Discovery Fund effective February 21, 2020, subject to shareholder approval.
1. Source: Morningstar.
See www.franklintempletondatasources.com for additional data provider information.
| Not FDIC Insured | | | May Lose Value | | | No Bank Guarantee | ||||
franklintempleton.com |
Not part of the semiannual report |
|
1 |
| ||
In preparation for the proposed reorganization, the Fund will close to new investors with limited exceptions on August 27, 2019. These dates are subject to change.
We thank you for investing with Franklin Templeton, welcome your questions and comments, and look forward to continuing to serve your investment needs in the years ahead. We appreciate your trust and participation in Franklin Mutual International Fund. It has been our privilege to serve you.
Sincerely,

Peter A. Langerman
Chairman, President and Chief Executive Officer
Franklin Mutual Advisers, LLC
This letter reflects our analysis and opinions as of June 30, 2019, unless otherwise indicated. The information is not a complete analysis of every aspect of any market, country, industry, security or fund. Statements of fact are from sources considered reliable.
| Visitfranklintempleton.comfor fund updates, to access your account, or to find helpful financial planning tools. |
|
2 |
|
Not part of the semiannual report |
franklintempleton.com | ||
SEMIANNUAL REPORT
Franklin Mutual International Fund
This semiannual report for Franklin Mutual International Fund covers the period ended June 30, 2019. As previously communicated, the Fund is proposing to reorganize into Franklin Mutual Global Discovery Fund effective February 21, 2020, subject to shareholder approval. In preparation for the proposed reorganization, the Fund will close to new investors with limited exceptions on August 27, 2019. These dates are subject to change.
Your Fund’s Goal and Main Investments
The Fund seeks capital appreciation, which may occasionally be short term, with income as a secondary goal. Under normal market conditions, the Fund invests at least 80% of its net assets in securities ofnon-U.S. issuers, primarily Asian and European companies. The investment manager focuses the Fund’s investments on securities believed to be available at market prices less than their intrinsic value. The Fund invests primarily in equity securities, mainly common stocks, with a current focus onmid- andlarge-cap companies. To a lesser extent, the Fund also invests in merger arbitrage securities and the debt and equity of distressed companies. The Geographic Composition bar chart on page 4 lists the leading countries where the Fund invests.
Performance Overview
The Fund’s Class Z shares posted a +7.33% cumulative total return for the six months ended June 30, 2019. In comparison, the Fund’s benchmark, the MSCI All Country World Index (ACWI) ex USA Net Return (Local Currency), which is a free float-adjusted, market capitalization-weighted index designed to measure equity market performance in global developed and emerging markets, posted a +12.89% total return.1 Also for comparison, the Fund’s secondary benchmark, the MSCI ACWI ex USA Net Return (USD) posted a +13.60% total return.1 You can find more of the Fund’s performance data in the Performance Summary beginning on page 9.
Performance data represent past performance, which does not guarantee future results. Investment return and principal value will fluctuate, and you may have a gain or loss when you sell your shares. Current performance may differ from figures shown. For most recentmonth-end performance, go tofranklintempleton.comor call(800)342-5236.
Economic and Market Overview
The global economy expanded during the six months ended June 30, 2019 despite weakness in certain regions. Global developed and emerging market stocks were aided by upbeat economic data in some regions, encouraging corporate earnings reports and periods of optimism about a potential U.S.-China trade deal. Further supporting markets were the U.S. Federal Reserve’s (Fed’s) patient approach to its monetary policy in 2019 and recent indication it will act as appropriate to sustain U.S. economic expansion.
However, markets reflected concerns about political uncertainties in the U.S. and the European Union, geopolitical risks in certain regions, and the impact of U.S. trade disputes with China and other trading partners on global growth and corporate earnings. In this environment, global developed and emerging market stocks, as measured by the MSCI All Country World Index, posted a +16.60% total return for thesix-month period.1
The U.S. economy grew during the six months ended June 30, 2019. After moderating for two consecutive quarters, the economy grew significantly faster in 2019’s first quarter, driven by growth in consumer spending, inventory investment, exports, business investment, and state and local government spending. However, the economy moderated again in the second quarter, due to weakness in inventory investment, exports, business investment and housing investment. The unemployment rate decreased from 3.9% in December 2018 to 3.7% atperiod-end.2 The annual inflation rate, as measured by the Consumer Price Index, decreased from 1.9% in December 2018 to 1.6% atperiod-end.2
1. Source: Morningstar.
The index is unmanaged and includes reinvestment of any income or distributions. It does not reflect any fees, expenses or sales charges. One cannot invest directly in an index, and an index is not representative of the Fund’s portfolio.
2. Source: U.S. Bureau of Labor Statistics.
See www.franklintempletondatasources.com for additional data provider information.
The dollar value, number of shares or principal amount, and names of all portfolio holdings are listed in the Fund’s Statement of Investments (SOI).
The SOI begins on page 17.
| franklintempleton.com | Semiannual Report | 3 | ||||
FRANKLIN MUTUAL INTERNATIONAL FUND
The Fed held its target range for the federal funds rate unchanged, at 2.25%–2.50%, during the reporting period. In March, the Fed mentioned it would end its balance sheet normalization program by the end of September 2019. In June, the Fed indicated increased uncertainties around its views on economic activity and the labor market. With market-based inflation measures remaining low recently, the market has interpreted the Fed’s recent statements to mean it will likely cut rates in 2019’s second half to foster continued economic growth while attempting to achieve its inflation objective.
In Europe, the U.K.’s quarterly gross domestic product (GDP) growth accelerated in 2019’s first quarter, but GDP contracted in the second quarter compared with the first quarter as Brexit uncertainties weighed on business sentiment. The Bank of England left its key policy rate unchanged during the period. The eurozone’s quarterly GDP accelerated in 2019’s first quarter but moderated in the second quarter, and the bloc’s annual inflation rate marginally decreased byperiod-end. The European Central Bank (ECB) kept its benchmark interest rate unchanged for the same time. In June, the ECB mentioned it would leave interest rates unchanged through the first half of 2020, provided details of its new stimulus, and indicated its openness to cut rates or increase stimulus.
In Asia, Japan’s quarterly GDP growth accelerated in 2019’s first quarter. In June, the Bank of Japan also left its benchmark interest rate unchanged, while continuing its stimulus measures, and expressed its openness to cut interest rates or increase stimulus.
In larger emerging markets, Brazil’s quarterly GDP growth contracted in 2019’s first quarter. The Central Bank of Brazil left its benchmark interest rate unchanged during the period. Russia’s annual GDP growth moderated in 2019’s first quarter. The Bank of Russia cut its key rate once during the period. China’s annual GDP growth rate stabilized in 2019’s first quarter. The People’s Bank of China left its benchmark interest rate unchanged, but it took measures to improve financial liquidity to mitigate the effects of the U.S.-China trade dispute and support economic growth. Overall, global emerging market stocks, as measured by the MSCI Emerging Markets Index, posted a +10.78% total return during thesix-month period.1
Investment Strategy
At Franklin Mutual Series, we are committed to our distinctive value approach to investing, which we believe can generate above-average risk-adjusted returns over time for our shareholders. Our major investment strategy is investing in
Geographic Composition*
Based on Total Net Assets as of 6/30/19
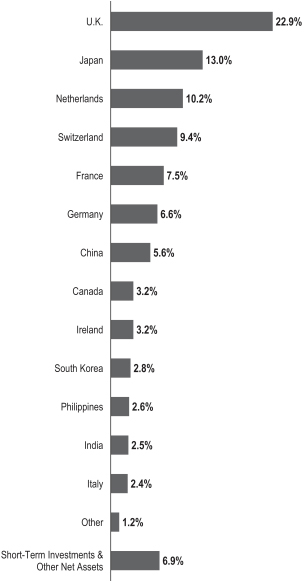
*Figures are stated as a percentage of total and may not equal 100% or may be negative due to rounding, use of any derivatives, unsettled trades or other factors.
undervalued stocks in Asia and Europe. We have the ability to invest in emerging markets, although this is unlikely to be a significant focus of our strategy. When selecting undervalued equities, we are attracted to what we believe are fundamentally strong companies with healthy balance sheets, high-quality assets, substantial free cash flow and shareholder-oriented management teams and whose stocks are trading at discounts to our assessment of the companies’ intrinsic or business value. We also look for asset-rich companies whose shares may be trading at depressed levels due to concerns over short-term earnings
| 4 | Semiannual Report | franklintempleton.com | ||
FRANKLIN MUTUAL INTERNATIONAL FUND
disappointments, litigation, management strategy or other perceived negatives. This strict value approach is not only intended to improve the likelihood of capital appreciation, but also reduces the risk of substantial declines, in our opinion. While the vast majority of our undervalued equity investments are made in publicly traded companies internationally, we may invest occasionally in privately held companies as well.
To a significantly lesser extent, we complement this more traditional investment strategy with two others. One is distressed investing, a highly specialized field that has proven quite profitable during certain periods over the years. Distressed investing is complex and can take many forms. The most common distressed investment the Fund undertakes is the purchase of financially troubled or bankrupt companies’ debt at a substantial discount to face value. After the financially distressed company is reorganized, the old debt is typically replaced with new securities issued by the financially stronger company.
The other piece of our investment strategy is participating in arbitrage situations, another highly specialized field. When companies announce proposed mergers or takeovers, commonly referred to as “deals,” the target company may trade at a discount to the bid it ultimately accepts. One form of arbitrage involves purchasing the target company’s stock when it is trading below the value we believe it would receive in a deal. In keeping with our commitment to a relatively conservative investment approach, we typically focus our arbitrage efforts on announced deals, and avoid rumored deals or other situations we consider relatively risky. In addition, it is our practice to hedge the Fund’s currency exposure when we deem it advantageous for our shareholders.
What is meant by “hedge”?
To hedge an investment is to take a position intended to offset potential losses that may be incurred by a companion financial instrument. Hedging an investment may also offset potential gains.
|
Manager’s Discussion
Franklin Mutual Series has long analyzed companies in many ways beyond just looking at the numbers. We analyze the way a company is run and how decisions are made at the executive and board levels. We look at the sustainability of a company, including the relationships with employees and customers, as well as the environmental impacts of a company’s business. In many ways this is common sense. A company that takes advantage of customers and
Top 10 Sectors/Industries
Based on Equity Securities as of 6/30/19
| % of Total Net Assets | ||||
| Insurance | 16.9% | |||
| Oil, Gas & Consumable Fuels | 11.9% | |||
| Banks | 11.6% | |||
| Pharmaceuticals | 7.2% | |||
| Automobiles | 4.4% | |||
| Capital Markets | 3.7% | |||
| Interactive Media & Services | 3.4% | |||
| Semiconductors & Semiconductor Equipment | 3.2% | |||
| Specialty Retail | 3.0% | |||
| Hotels, Restaurants & Leisure | 2.8% | |||
unsustainably produces environmental waste is worth less than one that does not do these things. Similarly, a company that iswell-run and responsive to shareholders is worth more than one whose executives manage the company for their private benefit. However, disclosure has been limited on many relevant issues, and there is disagreement among companies, shareholders and data providers about which factors should be measured and how they should be measured.
This type of analysis is labeled ESG analysis, where ESG stands for environmental, social, and governance factors. Many firms, including Franklin Templeton, are incorporating ESG factors in their investment research. In addition, there are other bodies such as the Sustainable Accounting Standards Board that are working on standardizing metrics for companies and industries to improve their reporting on these factors, particularly in the environmental and social areas. As a result, ESG analysis is improving across the market, and Franklin Mutual Series analysts are better able to analyzenon-traditional factors, including greenhouse gas emissions, water consumption, energy usage, talent management, diversity and inclusion, executive compensation, and enterprise risk management, to name a few. ESG investing should not be confused with social or exclusionary types of investing, but should rather be viewed as an additional tool analysts and portfolio managers use in the investment process to identify and measurenon-traditional, potential business risks and opportunities at a company.
Today, Franklin Mutual Series analysts review and analyze ESG reports produced by third parties or the companies themselves to assess potential risks that could have an impact on shareholder value. In addition, we have discussions with management teams around ESG risks, how
| franklintempleton.com | Semiannual Report | 5 | ||||
FRANKLIN MUTUAL INTERNATIONAL FUND
they deal with them and the potential impact on stakeholders. Our discussions have included issues such as water consumption in mining, the impact of changing carbon dioxide emission standards on the automotive industry and discussions with boards and management teams around management pay. Although more work needs to be done to standardize data from companies within industries so that comparisons can be relevant, the identification and discussion of ESG risk factors is an input we consider in helping frame the potential negative events individual companies or industries may face. In our view, solid ESG ratings are an output of fundamentally good business practices, not an input. As the data and information regarding ESG risk factors continue to evolve, we believe the increased information will highlight additional risk factors to enterprises and help us make more informed investment decisions going forward.
Mergers and Acquisitions
Merger and acquisition (M&A) activity remained healthy in the first half of 2019. The health care sector led the way, with pharmaceuticals megamergers among the biggest transactions. The pending acquisitions of Celgene and Allergan (these companies are not Fund holdings), each worth almost $90 billion, exemplify this strength. The Top 10 Sectors/Industries table on page 5 lists pharmaceuticals and other leading industries in which the Fund currently invests. Large deals have also been announced in the defense, oil and gas exploration and production, and diversified financial services industries, underlying the broad strength of the M&A boom. In addition, U.S. and foreign regulators appear to be more amenable to deals, leading markets to expect fewer regulatory surprises. We are closely monitoring the U.S.-China trade conflict, becauseflare-ups could potentially impact pending and future deals. We expect M&A activity to remain strong for as long as the equity markets remain positive, as has been the historical pattern.
Credit Markets
Opportunities to invest in mispriced risk across global fixed income markets remained limited in the first half of 2019. The low interest-rate environment kept credit widely available, and default rates are still at historically low levels. Debt covenant terms, which include restrictions on the borrower’s financial activities, remain loose or nonexistent. In such an environment, we believe it is prudent to focus our efforts on investing in short-term mispriced risk and catalyst-driven credit opportunities.
On the restructuring side, we are hopeful more opportunities may emerge as the business and economic cycles elongate
| Top 10 Equity Holdings | ||||
| 6/30/19 | ||||
Company Sector/Industry, Country | % of Total Net Assets | |||
| Novartis AG Pharmaceuticals, Switzerland | 4.0% | |||
| GlaxoSmithKline PLC Pharmaceuticals, U.K. | 3.3% | |||
| NN Group NV Insurance, Netherlands | 3.2% | |||
| RSA Insurance Group PLC Insurance, U.K. | 2.8% | |||
| Shinsei Bank Ltd. Banks, Japan | 2.8% | |||
| Samsung Electronics Co. Ltd. Technology Hardware, Storage & Peripherals, South Korea | 2.7% | |||
| BP PLC Oil, Gas & Consumable Fuels, U.K. | 2.6% | |||
| China Pacific Insurance Group Co. Ltd. Insurance, China | 2.6% | |||
| JXTG Holdings Inc. Oil, Gas & Consumable Fuels, Japan | 2.6% | |||
| Peugeot SA Automobiles, France | 2.6% | |||
amid persistent uncertainties. We will continue to seek to invest across the capital structures of companies that avail themselves of opportunities to bolster liquidity through internally generated free cash flow and corporate actions, including asset sales and debt refinancing.
Fund Performance
Top positive contributors to performance included Novartis, BE Semiconductor Industries and Shinsei Bank. Novartis and Shinsei Bank are listed among the Fund’s largest positions in the Top 10 Equity Holdings table on this page.
In March, Switzerland-based drug maker Novartis announced the official process and dates for itstax-free spinoff of the eye care device and consumer products business of Alcon (shares received by the Fund not held atperiod-end), and the U.S. Food and Drug Administration approved Mayzent, the first oral drug to treat secondary progressive multiple sclerosis. In May, Novartis won U.S. regulatory approval for gene therapy that treats spinal muscular atrophy and announced the purchase of a dry eye drug from a Japanese drug company. We believe Novartis is continuing to position itself as a more focused and innovation-driven drug company, and that the market does
| 6 | Semiannual Report | franklintempleton.com | ||
FRANKLIN MUTUAL INTERNATIONAL FUND
not fully appreciate the many innovative products it has in development.
The stock price of Netherlands-based BE Semiconductor Industries, a semiconductor equipment manufacturer, rose during the period as the outlook for spending on capital equipment, including tools made by BE Semiconductor, improved. Semiconductor manufacturers like Intel, and certain smart phone makers have indicated that upcoming features require the advanced packaging solutions that BE Semiconductor supplies.
Shares of Japan-based leading diversified financial institution Shinsei Bank rose steadily in January and February. The company’s earnings through the first three quarters of its 2018 fiscal year ending March 31, 2019, were ahead of Shinsei’s conservative guidance. Shinsei Bank’s operating costs were well contained and its unsecured loan business is close to reversing a downward trend that began at the start of the 2018 fiscal year.
During the period under review, Fund investments that detracted from performance included Indiabulls Housing Finance, Yes Bank and Baidu.
Shares of Indiabulls Housing Finance, an India-based consumer finance company, declined after a criminal writ was filed alleging financial fraud. The company described the allegations as baseless, and the writ was subsequently withdrawn. The company has continued its pursuit to merge parts of its business with a local bank. Indiabulls seeks to gain a banking license through the deal and has received some regulatory approval. The deal remains subject to the receipt of additional regulatory and shareholder approvals.
Shares of India-based Yes Bank tumbled after the bank posted an unexpected loss largely due to weaker fee income and deteriorating credit quality. However, investors favored the appointment of a new chief executive officer (CEO) from outside the bank, following the Royal Bank of India (RBI) denying a request to allow the founder to stay on as the CEO until September 2019. Investors also favorably viewed RBI’s latest risk assessment of Yes Bank that showed no issues. The bank’s new CEO is beginning a new strategy to focus more on retail and digital banking in an effort to turn the bank around after recent weakness.
Shares of China-based internet search firm Baidu slid after the company posted a loss for its fiscal first-quarter 2019. The weaker economic environment in China coupled with governmental regulation led to slower advertisement sales growth during the quarter. However, Baidu continues to
invest heavily in its video-streaming platform and other initiatives like artificial intelligence. These investments should help the company further diversify its business into new growth markets.
During the period, the Fund held currency forwards and futures seeking to hedge most of the currency risk of the portfolio’snon-U.S. dollar investments. The hedges had a positive overall impact on the Fund’s performance because of the appreciation of the U.S. dollar versus the hedged currencies.
What is a currency forward?
A currency forward is a direct agreement between the Fund and a counterparty to buy or sell a foreign currency in exchange for another currency at a specific exchange rate on a future date.
|
What is a future?
A future is an agreement between the Fund and a counterparty made through a U.S. or foreign futures exchange to buy or sell an underlying instrument or asset at a specific price on a future date.
|
As fellow shareholders, we found recent relative performance disappointing, but it is not uncommon for our strategy to lag the equity markets at times. We remain committed to our disciplined, value investment approach as we seek to generate attractive, long-term, risk-adjusted returns for shareholders.
| franklintempleton.com | Semiannual Report | 7 | ||||
FRANKLIN MUTUAL INTERNATIONAL FUND
Thank you for your participation in Franklin Mutual International Fund. It has been our privilege to serve your investment needs.
 |
Andrew Sleeman, CFA | |
 |
Timothy Rankin, CFA Co-Portfolio Manager | |


The foregoing information reflects our analysis, opinions and portfolio holdings as of June 30, 2019, the end of the reporting period. The way we implement our main investment strategies and the resulting portfolio holdings may change depending on factors such as market and economic conditions. These opinions may not be relied upon as investment advice or an offer for a particular security. The information is not a complete analysis of every aspect of any market, country, industry, security or the Fund. Statements of fact are from sources considered reliable, but the investment manager makes no representation or warranty as to their completeness or accuracy. Although historical performance is no guarantee of future results, these insights may help you understand our investment management philosophy.
CFA® is a trademark owned by CFA Institute.
| 8 | Semiannual Report | franklintempleton.com | ||
FRANKLIN MUTUAL INTERNATIONAL FUND
Performance Summary as of June 30, 2019
The performance table does not reflect any taxes that a shareholder would pay on Fund dividends, capital gain distributions, if any, or any realized gains on the sale of Fund shares. Total return reflects reinvestment of the Fund’s dividends and capital gain distributions, if any, and any unrealized gains or losses. Your dividend income will vary depending on dividends or interest paid by securities in the Fund’s portfolio, adjusted for operating expenses of each class. Capital gain distributions are net profits realized from the sale of portfolio securities.
Performance as of 6/30/191
Cumulative total return excludes sales charges. Average annual total return includes maximum sales charges. Sales charges will vary depending on the size of the investment and the class of share purchased. The maximum is 5.50% and the minimum is 0%.Class A:5.50% maximum initial sales charge. For other share classes, visitfranklintempleton.com.
| Share Class | | Cumulative Total Return | 2 | | Average Annual Total Return | 3 | ||
Z | ||||||||
6-Month
|
| +7.33%
|
|
| +7.33%
|
| ||
1-Year
|
| -8.55%
|
|
| -8.55%
|
| ||
5-Year
|
| +1.76%
|
|
| +0.35%
|
| ||
10-Year
|
| +78.47%
|
|
| +5.96%
|
| ||
A4 | ||||||||
6-Month
|
| +7.20%
|
|
| +1.33%
|
| ||
1-Year
|
| -8.82%
|
|
| -13.81%
|
| ||
5-Year
|
| +0.42%
|
|
| -1.04%
|
| ||
10-Year
|
| +73.46%
|
|
| +5.07%
|
| ||
Performance data represent past performance, which does not guarantee future results. Investment return and principal value will fluctuate, and you may have a gain or loss when you sell your shares. Current performance may differ from figures shown. For most recentmonth-end performance, go tofranklintempleton.comor call(800)342-5236.
See page 10 for Performance Summary footnotes.
| franklintempleton.com | Semiannual Report | 9 | ||||
FRANKLIN MUTUAL INTERNATIONAL FUND
PERFORMANCE SUMMARY
Total Annual Operating Expenses5
| Share Class | With Fee Waiver | Without Fee Waiver | ||||||
| Z | 0.97% | 1.21% | ||||||
| A | 1.22% | 1.46% | ||||||
Each class of shares is available to certain eligible investors and has different annual fees and expenses, as described in the prospectus.
All investments involve risks, including possible loss of principal. Value securities may not increase in price as anticipated or may decline further in value. Special risks are associated with foreign investing, including currency fluctuations, economic instability and political developments; investments in developing market countries involve heightened risks related to the same factors. Because the Fund may invest its assets in companies in a specific region, including Europe, it is subject to greater risks of adverse developments in that region and/or the surrounding regions than a fund that is more broadly diversified geographically. Current political and financial uncertainty surrounding the European Union may increase market volatility and the economic risk of investing in companies in Europe. Smaller and midsize company stocks have exhibited greater price volatility than larger-company stocks, particularly over the short term. The Fund’s investments in companies engaged in mergers, reorganizations or liquidations also involve special risks as pending deals may not be completed on time or on favorable terms. The Fund may invest in lower-rated bonds, which entail higher credit risk. The Fund is actively managed but there is no guarantee that the manager’s investment decisions will produce the desired results. The Fund’s prospectus also includes a description of the main investment risks.
1. The Fund has an expense reduction contractually guaranteed through 4/30/20. Fund investment results reflect the expense reduction; without this reduction, the results would have been lower.
2. Cumulative total return represents the change in value of an investment over the periods indicated.
3. Average annual total return represents the average annual change in value of an investment over the periods indicated. Return for less than one year, if any, has not been annualized.
4. Prior to 9/10/18, these shares were offered at a higher initial sales charge of 5.75%, thus actual returns (with sales charges) would have differed. Average annual total returns (with sales charges) have been restated to reflect the current maximum initial sales charge of 5.50%.
5. Figures are as stated in the Fund’s current prospectus and may differ from the expense ratios disclosed in the Your Fund’s Expenses and Financial Highlights sections in this report. In periods of market volatility, assets may decline significantly, causing total annual Fund operating expenses to become higher than the figures shown.
| 10 | Semiannual Report | franklintempleton.com | ||
FRANKLIN MUTUAL INTERNATIONAL FUND
As a Fund shareholder, you can incur two types of costs: (1) transaction costs, including sales charges (loads) on Fund purchases and redemptions; and (2) ongoing Fund costs, including management fees, distribution and service(12b-1) fees, and other Fund expenses. All mutual funds have ongoing costs, sometimes referred to as operating expenses. The table below shows ongoing costs of investing in the Fund and can help you understand these costs and compare them with those of other mutual funds. The table assumes a $1,000 investment held for the six months indicated.
Actual Fund Expenses
The table below provides information about actual account values and actual expenses in the columns under the heading “Actual.” In these columns the Fund’s actual return, which includes the effect of Fund expenses, is used to calculate the “Ending Account Value” for each class of shares. You can estimate the expenses you paid during the period by following these steps (of course, your account value and expenses will differ from those in this illustration): Divide your account value by $1,000 (if your account had an $8,600 value, then $8,600÷ $1,000 = 8.6). Then multiply the result by the number in the row for your class of shares under the headings “Actual” and “Expenses Paid During Period” (if Actual Expenses Paid During Period were $7.50, then 8.6 x $7.50 = $64.50). In this illustration, the actual expenses paid this period are $64.50.
Hypothetical Example for Comparison with Other Funds
Under the heading “Hypothetical” in the table, information is provided about hypothetical account values and hypothetical expenses based on the Fund’s actual expense ratio and an assumed rate of return of 5% per year before expenses, which is not the Fund’s actual return. This information may not be used to estimate the actual ending account balance or expenses you paid for the period, but it can help you compare ongoing costs of investing in the Fund with those of other funds. To do so, compare this 5% hypothetical example for the class of shares you hold with the 5% hypothetical examples that appear in the shareholder reports of other funds.
Please note that expenses shown in the table are meant to highlight ongoing costs and do not reflect any transactional costs. Therefore, information under the heading “Hypothetical” is useful in comparing ongoing costs only, and will not help you compare total costs of owning different funds. In addition, if transactional costs were included, your total costs would have been higher.
Actual (actual return after expenses) | Hypothetical (5% annual return before expenses) | |||||||||||||||||||||||||||||||||||
| Share Class | Beginning Account Value 1/1/19 | Ending Account Value 6/30/19 | Expenses Paid During Period 1/1/19–6/30/191,2 | Ending Account Value 6/30/19 | Expenses Paid During Period 1/1/19–6/30/191,2 | Net Annualized Expense Ratio2 | ||||||||||||||||||||||||||||||
Z | $1,000 | $ | 1,073.30 | $ 4.99 | $ | 1,019.98 | $4.86 | 0.97% | ||||||||||||||||||||||||||||
A | $1,000 | $ | 1,072.00 | $ 6.27 | $ | 1,018.74 | $6.11 | 1.22% | ||||||||||||||||||||||||||||
C | $1,000 | $ | 1,068.60 | $10.05 | $ | 1,015.08 | $9.79 | 1.96% | ||||||||||||||||||||||||||||
R | $1,000 | $ | 1,070.90 | $ 7.55 | $ | 1,017.50 | $7.35 | 1.47% | ||||||||||||||||||||||||||||
R6 | $1,000 | $ | 1,074.10 | $ 4.22 | $ | 1,020.73 | $4.11 | 0.82% | ||||||||||||||||||||||||||||
1. Expenses are equal to the annualized expense ratio for thesix-month period as indicated above—in the far right column—multiplied by the simple average account value over the period indicated, and then multiplied by 181/365 to reflect theone-half year period.
2. Reflects expenses after fee waivers and expense reimbursements.
| franklintempleton.com | Semiannual Report | 11 | ||||
FRANKLIN MUTUAL SERIES FUNDS
Franklin Mutual International Fund
Six Months Ended (unaudited)
| Year Ended December 31, | |||||||||||||||||||||||
2018
| 2017
| 2016
| 2015
| 2014
| ||||||||||||||||||||
| Class Z | ||||||||||||||||||||||||
| Per share operating performance (for a share outstanding throughout the period) | ||||||||||||||||||||||||
Net asset value, beginning of period | $12.82 | $15.96 | $14.32 | $14.17 | $14.59 | $15.90 | ||||||||||||||||||
| Income from investment operationsa: | ||||||||||||||||||||||||
Net investment incomeb | 0.25 | 0.31 | 0.21 | 0.27 | c | 0.18 | d | 0.30 | e | |||||||||||||||
Net realized and unrealized gains (losses) | 0.69 | (3.11 | ) | 1.78 | 0.20 | (0.17 | ) | (0.57 | ) | |||||||||||||||
Total from investment operations | 0.94 | (2.80 | ) | 1.99 | 0.47 | 0.01 | (0.27 | ) | ||||||||||||||||
| Less distributions from: | ||||||||||||||||||||||||
Net investment income | — | (0.25 | ) | (0.35 | ) | (0.27 | ) | (0.16 | ) | (0.43 | ) | |||||||||||||
Net realized gains | — | (0.09 | ) | — | (0.05 | ) | (0.27 | ) | (0.61 | ) | ||||||||||||||
Total distributions | — | (0.34 | ) | (0.35 | ) | (0.32 | ) | (0.43 | ) | (1.04 | ) | |||||||||||||
Net asset value, end of period | $13.76 | $12.82 | $15.96 | $14.32 | $14.17 | $14.59 | ||||||||||||||||||
Total returnf | 7.33% | (17.52)% | 13.99% | 3.34% | 0.15% | (1.63)% | ||||||||||||||||||
| Ratios to average net assetsg | ||||||||||||||||||||||||
Expenses before waiver and payments by affiliatesh | 1.28% | 1.21% | 1.17% | 1.22% | 1.24% | 1.39% | ||||||||||||||||||
Expenses net of waiver and payments by affiliatesh,i | 0.97% | 0.99% | 1.16% | 1.17% | 1.15% | 1.16% | ||||||||||||||||||
Expenses incurred in connection with securities sold short | —% | —% | —% | —% | —% | —% | j | |||||||||||||||||
Net investment income | 3.73% | 2.00% | 1.41% | 2.07% | c | 1.26% | d | 1.78% | e | |||||||||||||||
| Supplemental data | ||||||||||||||||||||||||
Net assets, end of period (000’s) | $51,374 | $52,271 | $86,274 | $40,875 | $49,963 | $19,940 | ||||||||||||||||||
Portfolio turnover rate | 8.74% | 28.75% | 38.77% | 24.87% | 28.64% | 54.78% | ||||||||||||||||||
aThe amount shown for a share outstanding throughout the period may not correlate with the Statement of Operations for the period due to the timing of sales and repurchases of the Fund’s shares in relation to income earned and/or fluctuating fair value of the investments of the Fund.
bBased on average daily shares outstanding.
cNet investment income per share includes approximately $0.06 per share related to income received in the form of special dividends in connection with certain Fund holdings. Excluding this amount, the ratio of net investment income to average net assets would have been 1.63%.
dNet investment income per share includes approximately $0.08 per share related to income received in the form of special dividends in connection with certain Fund holdings. Excluding this amount, the ratio of net investment income to average net assets would have been 0.71%.
eNet investment income per share includes approximately $0.08 per share related to income received in the form of special dividends in connection with certain Fund holdings. Excluding this amount, the ratio of net investment income to average net assets would have been 1.27%.
fTotal return is not annualized for periods less than one year.
gRatios are annualized for periods less than one year.
hIncludes dividend and/or interest expense on securities sold short and security borrowing fees, if any. See below for the ratios of such expenses to average net assets for the periods presented. See Note 1(d).
iBenefit of expense reduction rounds to less than 0.01%.
jRounds to less than 0.01%.
| 12 | Semiannual Report | The accompanying notes are an integral part of these financial statements. | franklintempleton.com | ||
FRANKLIN MUTUAL SERIES FUNDS
FINANCIAL HIGHLIGHTS
Franklin Mutual International Fund (continued)
Six Months Ended (unaudited)
| Year Ended December 31, | |||||||||||||||||||||||
2018
| 2017
| 2016
| 2015
| 2014
| ||||||||||||||||||||
| Class A | ||||||||||||||||||||||||
| Per share operating performance (for a share outstanding throughout the period) | ||||||||||||||||||||||||
Net asset value, beginning of period | $12.77 | $15.90 | $14.25 | $14.10 | $14.54 | $15.84 | ||||||||||||||||||
| Income from investment operationsa: | ||||||||||||||||||||||||
Net investment incomeb | 0.23 | 0.27 | 0.18 | 0.24 | c | 0.15 | d | 0.26 | e | |||||||||||||||
Net realized and unrealized gains (losses) | 0.69 | (3.10 | ) | 1.78 | 0.19 | (0.19 | ) | (0.57 | ) | |||||||||||||||
Total from investment operations | 0.92 | (2.83 | ) | 1.96 | 0.43 | (0.04 | ) | (0.31 | ) | |||||||||||||||
| Less distributions from: | ||||||||||||||||||||||||
Net investment income | — | (0.21 | ) | (0.31 | ) | (0.23 | ) | (0.13 | ) | (0.38 | ) | |||||||||||||
Net realized gains | — | (0.09 | ) | — | (0.05 | ) | (0.27 | ) | (0.61 | ) | ||||||||||||||
Total distributions | — | (0.30 | ) | (0.31 | ) | (0.28 | ) | (0.40 | ) | (0.99 | ) | |||||||||||||
Net asset value, end of period | $13.69 | $12.77 | $15.90 | $14.25 | $14.10 | $14.54 | ||||||||||||||||||
Total returnf | 7.20% | (17.73)% | 13.67% | 3.14% | (0.20)% | (1.89)% | ||||||||||||||||||
| Ratios to average net assetsg | ||||||||||||||||||||||||
Expenses before waiver and payments by affiliatesh | 1.53% | 1.46% | 1.42% | 1.47% | 1.52% | 1.69% | ||||||||||||||||||
Expenses net of waiver and payments by affiliatesh,i | 1.22% | 1.24% | 1.41% | 1.42% | 1.43% | 1.46% | ||||||||||||||||||
Expenses incurred in connection with securities sold short | —% | —% | —% | —% | —% | —% | j | |||||||||||||||||
Net investment income | 3.48% | 1.75% | 1.16% | 1.82% | c | 0.98% | d | 1.48% | e | |||||||||||||||
| Supplemental data | ||||||||||||||||||||||||
Net assets, end of period (000’s) | $48,623 | $53,082 | $82,965 | $82,626 | $110,591 | $39,810 | ||||||||||||||||||
Portfolio turnover rate | 8.74% | 28.75% | 38.77% | 24.87% | 28.64% | 54.78% | ||||||||||||||||||
aThe amount shown for a share outstanding throughout the period may not correlate with the Statement of Operations for the period due to the timing of sales and repurchases of the Fund’s shares in relation to income earned and/or fluctuating fair value of the investments of the Fund.
bBased on average daily shares outstanding.
cNet investment income per share includes approximately $0.06 per share related to income received in the form of special dividends in connection with certain Fund holdings. Excluding this amount, the ratio of net investment income to average net assets would have been 1.38%.
dNet investment income per share includes approximately $0.08 per share related to income received in the form of special dividends in connection with certain Fund holdings. Excluding this amount, the ratio of net investment income to average net assets would have been 0.43%.
eNet investment income per share includes approximately $0.08 per share related to income received in the form of special dividends in connection with certain Fund holdings. Excluding this amount, the ratio of net investment income to average net assets would have been 0.97%.
fTotal return does not reflect sales commissions or contingent deferred sales charges, if applicable, and is not annualized for periods less than one year.
gRatios are annualized for periods less than one year.
hIncludes dividend and/or interest expense on securities sold short and security borrowing fees, if any. See below for the ratios of such expenses to average net assets for the periods presented. See Note 1(d).
iBenefit of expense reduction rounds to less than 0.01%.
jRounds to less than 0.01%.
| franklintempleton.com | The accompanying notes are an integral part of these financial statements. | Semiannual Report | 13 | ||||
FRANKLIN MUTUAL SERIES FUNDS
FINANCIAL HIGHLIGHTS
Franklin Mutual International Fund (continued)
Six Months Ended (unaudited)
| Year Ended December 31, | |||||||||||||||||||||||
2018
| 2017
| 2016
| 2015
| 2014
| ||||||||||||||||||||
| Class C | ||||||||||||||||||||||||
| Per share operating performance (for a share outstanding throughout the period) | ||||||||||||||||||||||||
Net asset value, beginning of period | $12.68 | $15.69 | $14.08 | $13.92 | $14.38 | $15.68 | ||||||||||||||||||
| Income from investment operationsa: | ||||||||||||||||||||||||
Net investment incomeb | 0.18 | 0.16 | 0.08 | 0.15 | c | 0.04 | d | 0.15 | e | |||||||||||||||
Net realized and unrealized gains (losses) | 0.69 | (3.04 | ) | 1.72 | 0.18 | (0.18 | ) | (0.56 | ) | |||||||||||||||
Total from investment operations | 0.87 | (2.88 | ) | 1.80 | 0.33 | (0.14 | ) | (0.41 | ) | |||||||||||||||
| Less distributions from: | ||||||||||||||||||||||||
Net investment income | — | (0.04 | ) | (0.19 | ) | (0.12 | ) | (0.05 | ) | (0.28 | ) | |||||||||||||
Net realized gains | — | (0.09 | ) | — | (0.05 | ) | (0.27 | ) | (0.61 | ) | ||||||||||||||
Total distributions | — | (0.13 | ) | (0.19 | ) | (0.17 | ) | (0.32 | ) | (0.89 | ) | |||||||||||||
Net asset value, end of period | $13.55 | $12.68 | $15.69 | $14.08 | $13.92 | $14.38 | ||||||||||||||||||
Total returnf | 6.86% | (18.39)% | 12.79% | 2.44% | (0.93)% | (2.58)% | ||||||||||||||||||
| Ratios to average net assetsg | ||||||||||||||||||||||||
Expenses before waiver and payments by affiliatesh | 2.27% | 2.21% | 2.17% | 2.22% | 2.24% | 2.39% | ||||||||||||||||||
Expenses net of waiver and payments by affiliatesh,i | 1.96% | 1.99% | 2.16% | 2.17% | 2.15% | 2.16% | ||||||||||||||||||
Expenses incurred in connection with securities sold short | —% | —% | —% | —% | —% | —% | j | |||||||||||||||||
Net investment income | 2.74% | 1.00% | 0.41% | 1.07% | c | 0.26% | d | 0.78% | e | |||||||||||||||
| Supplemental data | ||||||||||||||||||||||||
Net assets, end of period (000’s) | $12,648 | $13,685 | $29,109 | $25,860 | $34,611 | $14,794 | ||||||||||||||||||
Portfolio turnover rate | 8.74% | 28.75% | 38.77% | 24.87% | 28.64% | 54.78% | ||||||||||||||||||
aThe amount shown for a share outstanding throughout the period may not correlate with the Statement of Operations for the period due to the timing of sales and repurchases of the Fund’s shares in relation to income earned and/or fluctuating fair value of the investments of the Fund.
bBased on average daily shares outstanding.
cNet investment income per share includes approximately $0.06 per share related to income received in the form of special dividends in connection with certain Fund holdings. Excluding this amount, the ratio of net investment income to average net assets would have been 0.63%.
dNet investment income per share includes approximately $0.08 per share related to income received in the form of special dividends in connection with certain Fund holdings. Excluding this amount, the ratio of net investment income to average net assets would have been (0.29)%.
eNet investment income per share includes approximately $0.08 per share related to income received in the form of special dividends in connection with certain Fund holdings. Excluding this amount, the ratio of net investment income to average net assets would have been 0.27%.
fTotal return does not reflect sales commissions or contingent deferred sales charges, if applicable, and is not annualized for periods less than one year.
gRatios are annualized for periods less than one year.
hIncludes dividend and/or interest expense on securities sold short and security borrowing fees, if any. See below for the ratios of such expenses to average net assets for the periods presented. See Note 1(d).
iBenefit of expense reduction rounds to less than 0.01%.
jRounds to less than 0.01%.
| 14 | Semiannual Report | The accompanying notes are an integral part of these financial statements. | franklintempleton.com | ||
FRANKLIN MUTUAL SERIES FUNDS
FINANCIAL HIGHLIGHTS
Franklin Mutual International Fund (continued)
Six Months Ended (unaudited)
| Year Ended December 31, | |||||||||||||||||||||||
2018
| 2017
| 2016
| 2015
| 2014
| ||||||||||||||||||||
| Class R | ||||||||||||||||||||||||
| Per share operating performance (for a share outstanding throughout the period) | ||||||||||||||||||||||||
Net asset value, beginning of period | $12.69 | $15.80 | $14.19 | $14.05 | $14.51 | $15.83 | ||||||||||||||||||
| Income from investment operationsa: | ||||||||||||||||||||||||
Net investment incomeb | 0.22 | 0.23 | 0.10 | 0.20 | c | 0.04 | d | 0.18 | e | |||||||||||||||
Net realized and unrealized gains (losses) | 0.68 | (3.07 | ) | 1.80 | 0.20 | (0.10 | ) | (0.52 | ) | |||||||||||||||
Total from investment operations | 0.90 | (2.84 | ) | 1.90 | 0.40 | (0.06 | ) | (0.34 | ) | |||||||||||||||
| Less distributions from: | ||||||||||||||||||||||||
Net investment income | — | (0.18 | ) | (0.29 | ) | (0.21 | ) | (0.13 | ) | (0.37 | ) | |||||||||||||
Net realized gains | — | (0.09 | ) | — | (0.05 | ) | (0.27 | ) | (0.61 | ) | ||||||||||||||
Total distributions | — | (0.27 | ) | (0.29 | ) | (0.26 | ) | (0.40 | ) | (0.98 | ) | |||||||||||||
Net asset value, end of period | $13.59 | $12.69 | $15.80 | $14.19 | $14.05 | $14.51 | ||||||||||||||||||
Total returnf | 7.09% | (17.96)% | 13.43% | 2.90% | (0.38)% | (2.13)% | ||||||||||||||||||
| Ratios to average net assetsg | ||||||||||||||||||||||||
Expenses before waiver and payments by affiliatesh | 1.78% | 1.71% | 1.64% | 1.72% | 1.74% | 1.89% | ||||||||||||||||||
Expenses net of waiver and payments by affiliatesh,i | 1.47% | 1.49% | 1.63% | 1.67% | 1.65% | 1.66% | ||||||||||||||||||
Expenses incurred in connection with securities sold short | —% | —% | —% | —% | —% | —% | j | |||||||||||||||||
Net investment income | 3.23% | 1.50% | 0.94% | 1.57% | c | 0.76% | d | 1.28% | e | |||||||||||||||
| Supplemental data | ||||||||||||||||||||||||
Net assets, end of period (000’s) | $1,667 | $1,673 | $1,867 | $694 | $662 | $112 | ||||||||||||||||||
Portfolio turnover rate | 8.74% | 28.75% | 38.77% | 24.87% | 28.64% | 54.78% | ||||||||||||||||||
aThe amount shown for a share outstanding throughout the period may not correlate with the Statement of Operations for the period due to the timing of sales and repurchases of the Fund’s shares in relation to income earned and/or fluctuating fair value of the investments of the Fund.
bBased on average daily shares outstanding.
cNet investment income per share includes approximately $0.06 per share related to income received in the form of special dividends in connection with certain Fund holdings. Excluding this amount, the ratio of net investment income to average net assets would have been 1.13%.
dNet investment income per share includes approximately $0.08 per share related to income received in the form of special dividends in connection with certain Fund holdings. Excluding this amount, the ratio of net investment income to average net assets would have been 0.21%.
eNet investment income per share includes approximately $0.08 per share related to income received in the form of special dividends in connection with certain Fund holdings. Excluding this amount, the ratio of net investment income to average net assets would have been 0.77%.
fTotal return is not annualized for periods less than one year.
gRatios are annualized for periods less than one year.
hIncludes dividend and/or interest expense on securities sold short and security borrowing fees, if any. See below for the ratios of such expenses to average net assets for the periods presented. See Note 1(d).
iBenefit of expense reduction rounds to less than 0.01%.
jRounds to less than 0.01%.
| franklintempleton.com | The accompanying notes are an integral part of these financial statements. | Semiannual Report | 15 | ||||
FRANKLIN MUTUAL SERIES FUNDS
FINANCIAL HIGHLIGHTS
Franklin Mutual International Fund (continued)
Six Months Ended (unaudited)
| Year Ended December 31, | |||||||||||||||||||||||
2018
| 2017
| 2016
| 2015
| 2014
| ||||||||||||||||||||
| Class R6 | ||||||||||||||||||||||||
| Per share operating performance (for a share outstanding throughout the period) | ||||||||||||||||||||||||
Net asset value, beginning of period | $12.82 | $15.97 | $14.32 | $14.17 | $14.59 | $15.87 | ||||||||||||||||||
| Income from investment operationsa: | ||||||||||||||||||||||||
Net investment incomeb | 0.26 | 0.33 | 0.24 | 0.33 | c | 0.22 | d | — | e,f | |||||||||||||||
Net realized and unrealized gains (losses) | 0.69 | (3.11 | ) | 1.78 | 0.17 | (0.20 | ) | (0.22 | ) | |||||||||||||||
Total from investment operations | 0.95 | (2.78 | ) | 2.02 | 0.50 | 0.02 | (0.22 | ) | ||||||||||||||||
| Less distributions from: | ||||||||||||||||||||||||
Net investment income | — | (0.28 | ) | (0.37 | ) | (0.30 | ) | (0.17 | ) | (0.45 | ) | |||||||||||||
Net realized gains | — | (0.09 | ) | — | (0.05 | ) | (0.27 | ) | (0.61 | ) | ||||||||||||||
Total distributions | — | (0.37 | ) | (0.37 | ) | (0.35 | ) | (0.44 | ) | (1.06 | ) | |||||||||||||
Net asset value, end of period | $13.77 | $12.82 | $15.97 | $14.32 | $14.17 | $14.59 | ||||||||||||||||||
Total returng | 7.41% | (17.40)% | 14.11% | 3.58% | 0.23% | (1.46)% | ||||||||||||||||||
| Ratios to average net assetsh | ||||||||||||||||||||||||
Expenses before waiver and payments by affiliates and expense reductioni | 1.15% | 1.11% | 1.03% | 1.06% | 1.06% | 1.24% | ||||||||||||||||||
Expenses net of waiver and payments by affiliates and expense reductioni,j | 0.82% | 0.85% | 1.01% | 1.00% | 1.02% | 1.00% | ||||||||||||||||||
Expenses incurred in connection with securities sold short | —% | —% | —% | —% | —% | —% | k | |||||||||||||||||
Net investment income | 3.88% | 2.14% | 1.56% | 2.24% | c | 1.39% | d | 1.94% | e | |||||||||||||||
| Supplemental data | ||||||||||||||||||||||||
Net assets, end of period (000’s) | $16,940 | $20,128 | $25,697 | $16,687 | $23,793 | $19,398 | ||||||||||||||||||
Portfolio turnover rate | 8.74% | 28.75% | 38.77% | 24.87% | 28.64% | 54.78% | ||||||||||||||||||
aThe amount shown for a share outstanding throughout the period may not correlate with the Statement of Operations for the period due to the timing of sales and repurchases of the Fund’s shares in relation to income earned and/or fluctuating fair value of the investments of the Fund.
bBased on average daily shares outstanding.
cNet investment income per share includes approximately $0.06 per share related to income received in the form of special dividends in connection with certain Fund holdings. Excluding this amount, the ratio of net investment income to average net assets would have been 1.80%.
dNet investment income per share includes approximately $0.08 per share related to income received in the form of special dividends in connection with certain Fund holdings. Excluding this amount, the ratio of net investment income to average net assets would have been 0.84%.
eNet investment income per share includes approximately $0.08 per share related to income received in the form of special dividends in connection with certain Fund holdings. Excluding this amount, the ratio of net investment income to average net assets would have been 1.42%.
fAmount rounds to less than $0.01 per share.
gTotal return is not annualized for periods less than one year.
hRatios are annualized for periods less than one year.
iIncludes dividend and/or interest expense on securities sold short and security borrowing fees, if any. See below for the ratios of such expenses to average net assets for the periods presented. See Note 1(d).
jBenefit of expense reduction rounds to less than 0.01%.
kRounds to less than 0.01%.
| 16 | Semiannual Report | The accompanying notes are an integral part of these financial statements. | franklintempleton.com | ||
FRANKLIN MUTUAL SERIES FUNDS
Statement of Investments, June 30, 2019 (unaudited)
Franklin Mutual International Fund
| Country | Shares | Value | ||||||||||||
Common Stocks 91.3% |
| |||||||||||||
| Aerospace & Defense 1.1% | ||||||||||||||
BAE Systems PLC | United Kingdom | 229,000 | $ | 1,440,715 | ||||||||||
|
| |||||||||||||
| Auto Components 2.5% | ||||||||||||||
Cie Generale des Etablissements Michelin SCA | France | 14,989 | 1,900,839 | |||||||||||
Toyo Tire Corp. | Japan | 104,311 | 1,370,884 | |||||||||||
|
| |||||||||||||
| 3,271,723 | ||||||||||||||
|
| |||||||||||||
| Automobiles 2.6% | ||||||||||||||
Peugeot SA | France | 138,705 | 3,417,072 | |||||||||||
|
| |||||||||||||
| Banks 11.6% | ||||||||||||||
AIB Group PLC | Ireland | 516,975 | 2,113,452 | |||||||||||
aCredito Valtellinese SpA | Italy | 28,038,943 | 1,800,998 | |||||||||||
ING Groep NV | Netherlands | 288,857 | 3,348,235 | |||||||||||
Shinsei Bank Ltd. | Japan | 233,500 | 3,623,127 | |||||||||||
Standard Chartered PLC | United Kingdom | 366,605 | 3,325,101 | |||||||||||
Yes Bank Ltd. | India | 651,490 | 1,027,549 | |||||||||||
|
| |||||||||||||
| 15,238,462 | ||||||||||||||
|
| |||||||||||||
| Capital Markets 3.7% | ||||||||||||||
Credit Suisse Group AG | Switzerland | 181,579 | 2,176,642 | |||||||||||
Deutsche Bank AG | Germany | 254,188 | 1,959,241 | |||||||||||
Guotai Junan Securities Co. Ltd. | China | 398,064 | 709,287 | |||||||||||
|
| |||||||||||||
|
4,845,170 |
| ||||||||||||
|
| |||||||||||||
| Chemicals 1.9% | ||||||||||||||
BASF SE | Germany | 34,111 | 2,478,759 | |||||||||||
|
| |||||||||||||
Construction Materials 2.1% | ||||||||||||||
LafargeHolcim Ltd., B | Switzerland | 57,170 | 2,791,022 | |||||||||||
|
| |||||||||||||
Consumer Finance 1.0% | ||||||||||||||
Sun Hung Kai & Co. Ltd. | Hong Kong | 2,877,748 | 1,344,544 | |||||||||||
|
| |||||||||||||
Diversified Financial Services 2.6% | ||||||||||||||
Metro Pacific Investments Corp. | Philippines | 36,164,200 | 3,388,408 | |||||||||||
|
| |||||||||||||
Diversified Telecommunication Services 1.7% | ||||||||||||||
Koninklijke KPN NV | Netherlands | 743,128 | 2,281,028 | |||||||||||
|
| |||||||||||||
Hotels, Restaurants & Leisure 2.8% | ||||||||||||||
Accor SA | France | 51,000 | 2,188,720 | |||||||||||
Sands China Ltd. | China | 312,200 | 1,492,633 | |||||||||||
|
| |||||||||||||
|
3,681,353 |
| ||||||||||||
|
| |||||||||||||
| Household Durables 1.6% | ||||||||||||||
aCairn Homes PLC | Ireland | 1,544,268 | 2,082,143 | |||||||||||
|
| |||||||||||||
Insurance 16.9% | ||||||||||||||
ASR Nederland NV | Netherlands | 54,769 | 2,226,566 | |||||||||||
China Pacific Insurance Group Co. Ltd., H | China | 879,045 | 3,437,572 | |||||||||||
Direct Line Insurance Group PLC | United Kingdom | 739,157 | 3,114,581 | |||||||||||
Lancashire Holdings Ltd. | United Kingdom | 171,764 | 1,501,837 | |||||||||||
NN Group NV | Netherlands | 103,498 | 4,165,224 | |||||||||||
RSA Insurance Group PLC | United Kingdom | 496,439 | 3,636,451 | |||||||||||
| franklintempleton.com | Semiannual Report | 17 | ||||
FRANKLIN MUTUAL SERIES FUNDS
STATEMENT OF INVESTMENTS (UNAUDITED)
Franklin Mutual International Fund(continued)
| Country | Shares | Value | ||||||||||||||
Common Stocks(continued) |
| |||||||||||||||
| Insurance(continued) | ||||||||||||||||
Sabre Insurance Group PLC | United Kingdom | 400,240 | $ | 1,387,617 | ||||||||||||
T&D Holdings Inc. | Japan | 248,433 | 2,694,699 | |||||||||||||
|
| |||||||||||||||
|
22,164,547 |
| ||||||||||||||
|
| |||||||||||||||
| Interactive Media & Services 3.4% | ||||||||||||||||
| a | Baidu Inc., ADR | China | 16,131 | 1,893,134 | ||||||||||||
Yahoo Japan Corp. | Japan | 886,800 | 2,599,043 | |||||||||||||
|
| |||||||||||||||
|
4,492,177 |
| ||||||||||||||
|
| |||||||||||||||
| Oil, Gas & Consumable Fuels 11.9% | ||||||||||||||||
BP PLC | United Kingdom | 495,900 | 3,454,908 | |||||||||||||
Caltex Australia Ltd. | Australia | 11,483 | 199,497 | |||||||||||||
Canadian Natural Resources Ltd. | Canada | 84,900 | 2,288,848 | |||||||||||||
Crescent Point Energy Corp. | Canada | 585,600 | 1,935,979 | |||||||||||||
JXTG Holdings Inc. | Japan | 693,300 | 3,436,278 | |||||||||||||
Royal Dutch Shell PLC, B | United Kingdom | 90,231 | 2,957,539 | |||||||||||||
Saras SpA | Italy | 877,091 | 1,320,188 | |||||||||||||
|
| |||||||||||||||
|
15,593,237 |
| ||||||||||||||
|
| |||||||||||||||
| Pharmaceuticals 7.2% | ||||||||||||||||
GlaxoSmithKline PLC | United Kingdom | 213,777 | 4,280,250 | |||||||||||||
Novartis AG | Switzerland | 57,144 | 5,220,180 | |||||||||||||
|
| |||||||||||||||
|
9,500,430 |
| ||||||||||||||
|
| |||||||||||||||
| Real Estate Management & Development 0.5% | ||||||||||||||||
Kenedix Inc. | Japan | 135,490 | 674,811 | |||||||||||||
|
| |||||||||||||||
Semiconductors & Semiconductor Equipment 3.2% | ||||||||||||||||
BE Semiconductor Industries NV | Netherlands | 57,268 | 1,473,980 | |||||||||||||
| a | Renesas Electronics Corp. | Japan | 552,862 | 2,743,287 | ||||||||||||
|
| |||||||||||||||
|
4,217,267 |
| ||||||||||||||
|
| |||||||||||||||
| Specialty Retail 3.0% | ||||||||||||||||
Dufry AG | Switzerland | 25,336 | 2,145,303 | |||||||||||||
Hornbach Holding AG & Co. KGaA | Germany | 31,290 | 1,776,823 | |||||||||||||
|
| |||||||||||||||
|
3,922,126 |
| ||||||||||||||
|
| |||||||||||||||
| Technology Hardware, Storage & Peripherals 2.8% | ||||||||||||||||
Samsung Electronics Co. Ltd. | South Korea | 88,900 | 3,611,510 | |||||||||||||
|
| |||||||||||||||
Thrifts & Mortgage Finance 1.7% | ||||||||||||||||
Indiabulls Housing Finance Ltd. | India | 252,641 | 2,226,685 | |||||||||||||
|
| |||||||||||||||
Tobacco 2.1% | ||||||||||||||||
British American Tobacco PLC | United Kingdom | 78,471 | 2,739,495 | |||||||||||||
|
| |||||||||||||||
Trading Companies & Distributors 1.7% | ||||||||||||||||
Rexel SA | France | 180,233 | 2,287,685 | |||||||||||||
|
| |||||||||||||||
Wireless Telecommunication Services 1.7% | ||||||||||||||||
Vodafone Group PLC | United Kingdom | 1,324,860 | 2,175,817 | |||||||||||||
|
| |||||||||||||||
Total Common Stocks (Cost $137,472,764) | 119,866,186 | |||||||||||||||
|
| |||||||||||||||
| 18 | Semiannual Report | franklintempleton.com | ||
FRANKLIN MUTUAL SERIES FUNDS
STATEMENT OF INVESTMENTS (UNAUDITED)
Franklin Mutual International Fund(continued)
| Country | Shares | Value | ||||||||||||||
Preferred Stocks (Cost $1,772,942) 1.8% |
| |||||||||||||||
| Automobiles 1.8% | ||||||||||||||||
| bVolkswagen AG, 3.279%, pfd. | Germany | 13,606 | $ | 2,292,664 | ||||||||||||
|
| |||||||||||||||
Total Investments before Short Term Investments | 122,158,850 | |||||||||||||||
|
| |||||||||||||||
| | Principal Amount | | ||||||||||||||
|
| |||||||||||||||
Short Term Investments 4.9% | ||||||||||||||||
| U.S. Government and Agency Securities 4.9% | ||||||||||||||||
| cFHLB, 7/01/19 | United States | $ | 5,000,000 | 5,000,000 | ||||||||||||
| cU.S. Treasury Bill, 8/01/19 - 10/31/19 | United States | 1,500,000 | 1,494,443 | |||||||||||||
|
| |||||||||||||||
Total U.S. Government and Agency Securities | 6,494,443 | |||||||||||||||
|
| |||||||||||||||
Total Investments (Cost $145,738,744) 98.0% | 128,653,293 | |||||||||||||||
Other Assets, less Liabilities 2.0% | 2,599,558 | |||||||||||||||
|
| |||||||||||||||
Net Assets 100.0% | $ | 131,252,851 | ||||||||||||||
|
| |||||||||||||||
aNon-income producing.
bVariable rate security. The rate shown represents the yield at period end.
cThe security was issued on a discount basis with no stated coupon rate.
At June 30, 2019, the Fund had the following futures contracts outstanding. See Note 1(c).
Futures Contracts
| Description | Type | Number of Contracts | Notional Amount* | Expiration Date | Value/ Unrealized Appreciation (Depreciation) | |||||||||||||||
Currency Contracts | ||||||||||||||||||||
EUR/USD | Short | 131 | $18,743,644 | 9/16/19 | $(51,467) | |||||||||||||||
GBP/USD | Short | 68 | 5,418,325 | 9/16/19 | 11,519 | |||||||||||||||
|
| |||||||||||||||||||
Total Futures Contracts | $(39,948) | |||||||||||||||||||
|
| |||||||||||||||||||
*As of period end.
| franklintempleton.com | Semiannual Report | 19 | ||||
FRANKLIN MUTUAL SERIES FUNDS
STATEMENT OF INVESTMENTS (UNAUDITED)
Franklin Mutual International Fund(continued)
At June 30, 2019, the Fund had the following forward exchange contracts outstanding. See Note 1(c).
Forward Exchange Contracts
| Currency | Counterpartya | Type | Quantity | Contract Amount | Settlement Date | Unrealized Appreciation | Unrealized Depreciation | |||||||||||||||||||||
| OTC Forward Exchange Contracts |
| |||||||||||||||||||||||||||
Euro | BOFA | Buy | 451,242 | $ | 505,096 | 7/15/19 | $ 8,649 | $ — | ||||||||||||||||||||
Euro | BOFA | Sell | 200,000 | 226,348 | 7/15/19 | — | (1,354 | ) | ||||||||||||||||||||
Euro | BOFA | Sell | 328,659 | 377,212 | 7/15/19 | 3,031 | — | |||||||||||||||||||||
Euro | BONY | Sell | 540,375 | 622,439 | 7/15/19 | 7,216 | — | |||||||||||||||||||||
Euro | HSBK | Buy | 213,803 | 239,186 | 7/15/19 | 4,232 | — | |||||||||||||||||||||
Euro | HSBK | Sell | 13,968,323 | 16,310,298 | 7/15/19 | 407,208 | — | |||||||||||||||||||||
Euro | SSBT | Buy | 59,642 | 66,595 | 7/15/19 | 1,309 | — | |||||||||||||||||||||
Euro | SSBT | Sell | 991,528 | 1,139,990 | 7/15/19 | 11,124 | — | |||||||||||||||||||||
Euro | UBSW | Buy | 350,744 | 392,994 | 7/15/19 | 6,331 | — | |||||||||||||||||||||
Euro | UBSW | Sell | 904,929 | 1,043,981 | 7/15/19 | 13,710 | — | |||||||||||||||||||||
Swiss Franc | HSBK | Buy | 68,181 | 67,957 | 7/15/19 | 1,985 | — | |||||||||||||||||||||
Swiss Franc | HSBK | Sell | 13,832 | 13,954 | 7/15/19 | — | (236 | ) | ||||||||||||||||||||
Swiss Franc | UBSW | Buy | 95,000 | 94,676 | 7/15/19 | 2,776 | — | |||||||||||||||||||||
Swiss Franc | UBSW | Sell | 2,251,579 | 2,237,728 | 7/15/19 | — | (71,981 | ) | ||||||||||||||||||||
British Pound | BOFA | Buy | 135,000 | 170,953 | 7/16/19 | 650 | — | |||||||||||||||||||||
British Pound | HSBK | Buy | 263,444 | 331,950 | 7/16/19 | 2,922 | — | |||||||||||||||||||||
British Pound | HSBK | Sell | 2,145,571 | 2,784,138 | 7/16/19 | 56,831 | — | |||||||||||||||||||||
British Pound | UBSW | Buy | 22,296 | 28,370 | 7/16/19 | — | (29 | ) | ||||||||||||||||||||
British Pound | UBSW | Buy | 839,939 | 1,061,559 | 7/16/19 | 6,114 | — | |||||||||||||||||||||
South Korean Won | HSBK | Sell | 987,194,457 | 838,811 | 7/19/19 | — | (14,981 | ) | ||||||||||||||||||||
South Korean Won | UBSW | Sell | 3,057,755,543 | 2,589,563 | 7/19/19 | — | (54,990 | ) | ||||||||||||||||||||
Philippine Peso | BONY | Sell | 167,801,888 | 3,194,819 | 7/30/19 | — | (76,478 | ) | ||||||||||||||||||||
British Pound | BOFA | Sell | 1,191,239 | 1,563,885 | 8/14/19 | 47,604 | — | |||||||||||||||||||||
British Pound | BONY | Sell | 5,563,272 | 7,232,969 | 8/14/19 | 151,701 | — | |||||||||||||||||||||
British Pound | HSBK | Sell | 151,013 | 196,490 | 8/14/19 | 4,272 | — | |||||||||||||||||||||
British Pound | UBSW | Sell | 132,031 | 171,144 | 8/14/19 | 3,087 | — | |||||||||||||||||||||
Australian Dollar | HSBK | Sell | 241,520 | 168,276 | 8/26/19 | — | (1,586 | ) | ||||||||||||||||||||
Japanese Yen | UBSW | Sell | 1,338,080,411 | 12,483,930 | 8/26/19 | 17,572 | — | |||||||||||||||||||||
Euro | SSBT | Sell | 156,892 | 177,531 | 10/18/19 | — | (2,417 | ) | ||||||||||||||||||||
British Pound | BONY | Sell | 3,317,958 | 4,355,799 | 10/24/19 | 120,815 | — | |||||||||||||||||||||
Euro | HSBK | Sell | 264,918 | 300,277 | 11/07/19 | — | (4,043 | ) | ||||||||||||||||||||
Euro | UBSW | Sell | 264,917 | 300,170 | 11/07/19 | — | (4,150 | ) | ||||||||||||||||||||
Euro | BOFA | Sell | 101,439 | 116,352 | 11/21/19 | — | (302 | ) | ||||||||||||||||||||
British Pound | SSBT | Sell | 6,790,428 | 8,651,854 | 11/22/19 | — | (24,864 | ) | ||||||||||||||||||||
|
| |||||||||||||||||||||||||||
Total Forward Exchange Contracts |
| $ 879,139 | $ (257,411 | ) | ||||||||||||||||||||||||
|
| |||||||||||||||||||||||||||
Net unrealized appreciation (depreciation) |
| $ 621,728 | ||||||||||||||||||||||||||
|
| |||||||||||||||||||||||||||
aMay be comprised of multiple contracts with the same counterparty, currency and settlement date.
See Note 9 regarding other derivative information.
See Abbreviations on page 35.
| 20 | Semiannual Report l The accompanying notes are an integral part of these financial statements. | franklintempleton.com | ||
FRANKLIN MUTUAL SERIES FUNDS
Statement of Assets and Liabilities
June 30, 2019 (unaudited)
Franklin Mutual International Fund
Assets: | ||||
Investments in securities: | ||||
Cost - Unaffiliated issuers | $ | 145,738,744 | ||
|
| |||
Value - Unaffiliated issuers | $ | 128,653,293 | ||
Cash | 52,575 | |||
Foreign currency, at value (cost $562,857) | 563,835 | |||
Receivables: | ||||
Investment securities sold | 1,272,449 | |||
Capital shares sold | 117,151 | |||
Dividends | 669,082 | |||
European Union tax reclaims | 48,184 | |||
Deposits with brokers for: | ||||
Futures contracts | 410,400 | |||
Unrealized appreciation on OTC forward exchange contracts | 879,139 | |||
Other assets | 103 | |||
|
| |||
Total assets | 132,666,211 | |||
|
| |||
Liabilities: | ||||
Payables: | ||||
Investment securities purchased | 721,017 | |||
Capital shares redeemed | 273,762 | |||
Management fees | 54,962 | |||
Distribution fees | 43,022 | |||
Transfer agent fees | 15,926 | |||
Trustees’ fees and expenses | 4,208 | |||
Variation margin on futures contracts | 24,006 | |||
Unrealized depreciation on OTC forward exchange contracts | 257,411 | |||
Accrued expenses and other liabilities | 19,046 | |||
|
| |||
Total liabilities | 1,413,360 | |||
|
| |||
Net assets, at value | $ | 131,252,851 | ||
|
| |||
Net assets consist of: | ||||
Paid-in capital | $ | 149,537,417 | ||
Total distributable earnings (loss) | (18,284,566 | ) | ||
|
| |||
Net assets, at value | $ | 131,252,851 | ||
|
| |||
| franklintempleton.com | The accompanying notes are an integral part of these financial statements. | Semiannual Report | 21 | ||||
FRANKLIN MUTUAL SERIES FUNDS
FINANCIAL STATEMENTS
Statement of Assets and Liabilities(continued)
June 30, 2019 (unaudited)
Franklin Mutual International Fund
| Class Z: | ||||
Net assets, at value | $51,374,335 | |||
|
| |||
Shares outstanding | 3,732,903 | |||
|
| |||
Net asset value and maximum offering price per share | $13.76 | |||
|
| |||
| Class A: | ||||
Net assets, at value | $48,623,290 | |||
|
| |||
Shares outstanding | 3,550,533 | |||
|
| |||
Net asset value per sharea | $13.69 | |||
|
| |||
Maximum offering price per share (net asset value per share ÷ 94.50%) | $14.49 | |||
|
| |||
| Class C: | ||||
Net assets, at value | $12,648,464 | |||
|
| |||
Shares outstanding | 933,508 | |||
|
| |||
Net asset value and maximum offering price per sharea | $13.55 | |||
|
| |||
| Class R: | ||||
Net assets, at value | $ 1,667,258 | |||
|
| |||
Shares outstanding | 122,705 | |||
|
| |||
Net asset value and maximum offering price per share | $13.59 | |||
|
| |||
| Class R6: | ||||
Net assets, at value | $16,939,504 | |||
|
| |||
Shares outstanding | 1,230,013 | |||
|
| |||
Net asset value and maximum offering price per share | $13.77 | |||
|
| |||
aRedemption price is equal to net asset value less contingent deferred sales charges, if applicable.
| 22 | Semiannual Report | The accompanying notes are an integral part of these financial statements. | franklintempleton.com | ||
FRANKLIN MUTUAL SERIES FUNDS
FINANCIAL STATEMENTS
Statement of Operations
for the six months ended June 30, 2019 (unaudited)
Franklin Mutual International Fund
Investment income: | ||||
Dividends: (net of foreign taxes)* | ||||
Unaffiliated issuers | $ | 3,189,887 | ||
Interest: | ||||
Unaffiliated issuers | 94,708 | |||
|
| |||
Total investment income | 3,284,595 | |||
|
| |||
Expenses: | ||||
Management fees (Note 3a) | 612,304 | |||
Distribution fees: (Note 3c) | ||||
Class A | 64,722 | |||
Class C | 66,340 | |||
Class R | 4,453 | |||
Transfer agent fees: (Note 3e) | ||||
Class Z | 58,269 | |||
Class A | 56,831 | |||
Class C | 14,660 | |||
Class R | 1,955 | |||
Class R6 | 8,780 | |||
Custodian fees (Note 4) | 10,739 | |||
Reports to shareholders | 20,903 | |||
Registration and filing fees | 39,454 | |||
Professional fees | 42,408 | |||
Trustees’ fees and expenses | 6,193 | |||
Other | 11,658 | |||
|
| |||
Total expenses | 1,019,669 | |||
Expense reductions (Note 4) | (776 | ) | ||
Expenses waived/paid by affiliates (Note 3f) | (219,503 | ) | ||
|
| |||
Net expenses | 799,390 | |||
|
| |||
Net investment income | 2,485,205 | |||
|
| |||
Realized and unrealized gains (losses): | ||||
Net realized gain (loss) from: | ||||
Investments: | ||||
Unaffiliated issuers | (2,799,203 | ) | ||
Foreign currency transactions | (16,726 | ) | ||
Forward exchange contracts | 1,194,558 | |||
Futures contracts | 540,089 | |||
|
| |||
Net realized gain (loss) | (1,081,282 | ) | ||
|
| |||
Net change in unrealized appreciation (depreciation) on: | ||||
Investments: | ||||
Unaffiliated issuers | 8,980,352 | |||
Translation of other assets and liabilities denominated in foreign currencies | 2,356 | |||
Forward exchange contracts | (268,469 | ) | ||
Futures contracts | (54,080 | ) | ||
|
| |||
Net change in unrealized appreciation (depreciation) | 8,660,159 | |||
|
| |||
Net realized and unrealized gain (loss) | 7,578,877 | |||
|
| |||
Net increase (decrease) in net assets resulting from operations | $ | 10,064,082 | ||
|
| |||
*Foreign taxes withheld on dividends | $ | 258,840 | ||
| franklintempleton.com | The accompanying notes are an integral part of these financial statements. | Semiannual Report | 23 | ||||
FRANKLIN MUTUAL SERIES FUNDS
FINANCIAL STATEMENTS
Statements of Changes in Net Assets
Franklin Mutual International Fund
| Six Months Ended June 30, 2019 (unaudited) | Year Ended December 31, 2018 | |||||||
| ||||||||
Increase (decrease) in net assets: | ||||||||
Operations: | ||||||||
Net investment income | $ 2,485,205 | $ 3,528,615 | ||||||
Net realized gain (loss) | (1,081,282 | ) | 9,920,269 | |||||
Net change in unrealized appreciation (depreciation) | 8,660,159 | (46,528,018 | ) | |||||
|
| |||||||
Net increase (decrease) in net assets resulting from operations | 10,064,082 | (33,079,134 | ) | |||||
|
| |||||||
Distributions to shareholders: | ||||||||
Class Z | — | (1,369,385 | ) | |||||
Class A | — | (1,270,437 | ) | |||||
Class C | — | (150,699 | ) | |||||
Class R | — | (35,634 | ) | |||||
Class R6 | — | (566,278 | ) | |||||
|
| |||||||
Total distributions to shareholders | — | (3,392,433 | ) | |||||
|
| |||||||
Capital share transactions: (Note 2) | ||||||||
Class Z | (4,678,287 | ) | (20,389,727 | ) | ||||
Class A | (8,248,871 | ) | (16,207,014 | ) | ||||
Class C | (1,969,510 | ) | (11,485,192 | ) | ||||
Class R | (119,873 | ) | 206,051 | |||||
Class R6 | (4,633,633 | ) | (724,964 | ) | ||||
|
| |||||||
Total capital share transactions | (19,650,174 | ) | (48,600,846 | ) | ||||
|
| |||||||
Net increase (decrease) in net assets | (9,586,092 | ) | (85,072,413 | ) | ||||
Net assets: | ||||||||
Beginning of period | 140,838,943 | 225,911,356 | ||||||
|
| |||||||
End of period | $131,252,851 | $140,838,943 | ||||||
|
| |||||||
| 24 | Semiannual Report | The accompanying notes are an integral part of these financial statements. | franklintempleton.com | ||
FRANKLIN MUTUAL SERIES FUNDS
Notes to Financial Statements (unaudited)
Franklin Mutual International Fund
1. Organization and Significant Accounting Policies
Franklin Mutual Series Funds (Trust) is registered under the Investment Company Act of 1940 (1940 Act) as anopen-end management investment company, consisting of seven separate funds and applies the specialized accounting and reporting guidance in U.S. Generally Accepted Accounting Principles (U.S. GAAP). Franklin Mutual International Fund (Fund) is included in this report. The Fund offers five classes of shares: Class Z, Class A, Class C, Class R and Class R6. Class C shares automatically convert to Class A shares after they have been held for 10 years. Each class of shares may differ by its initial sales load, contingent deferred sales charges, voting rights on matters affecting a single class, its exchange privilege and fees due to differing arrangements for distribution and transfer agent fees.
The following summarizes the Fund’s significant accounting policies.
a. Financial Instrument Valuation
The Fund’s investments in financial instruments are carried at fair value daily. Fair value is the price that would be received to sell an asset or paid to transfer a liability in an orderly transaction between market participants on the measurement date. The Fund calculates the net asset value (NAV) per share each business day as of 4 p.m. Eastern time or the regularly scheduled close of the New York Stock Exchange (NYSE), whichever is earlier. Under compliance policies and procedures approved by the Trust’s Board of Trustees (the Board), the Fund’s administrator has responsibility for oversight of valuation, including leading the cross-functional Valuation Committee (VC). The Fund may utilize independent pricing services, quotations from securities and financial instrument dealers, and other market sources to determine fair value.
Equity securities and derivative financial instruments listed on an exchange or on the NASDAQ National Market System are valued at the last quoted sale price or the official closing price of the day, respectively. Foreign equity securities are valued as of the close of trading on the foreign stock exchange on which the security is primarily traded, or as of 4 p.m. Eastern time. The value is then converted into its U.S. dollar equivalent at the foreign exchange rate in effect at 4 p.m. Eastern time on the day that the value of the security is determined.Over-the-counter (OTC) securities are valued within the range of the most recent quoted bid and ask prices. Securities that trade in multiple markets or on multiple
exchanges are valued according to the broadest and most representative market. Certain equity securities are valued based upon fundamental characteristics or relationships to similar securities.
Debt securities generally trade in the OTC market rather than on a securities exchange. The Fund’s pricing services use multiple valuation techniques to determine fair value. In instances where sufficient market activity exists, the pricing services may utilize a market-based approach through which quotes from market makers are used to determine fair value. In instances where sufficient market activity may not exist or is limited, the pricing services also utilize proprietary valuation models which may consider market characteristics such as benchmark yield curves, credit spreads, estimated default rates, anticipated market interest rate volatility, coupon rates, anticipated timing of principal repayments, underlying collateral, and other unique security features in order to estimate the relevant cash flows, which are then discounted to calculate the fair value.
Certain derivative financial instruments trade in the OTC market. The Fund’s pricing services use various techniques including industry standard option pricing models and proprietary discounted cash flow models to determine the fair value of those instruments. The Fund’s net benefit or obligation under the derivative contract, as measured by the fair value of the contract, is included in net assets.
The Fund has procedures to determine the fair value of financial instruments for which market prices are not reliable or readily available. Under these procedures, the Fund primarily employs a market-based approach which may use related or comparable assets or liabilities, recent transactions, market multiples, book values, and other relevant information for the investment to determine the fair value of the investment. An income-based valuation approach may also be used in which the anticipated future cash flows of the investment are discounted to calculate fair value. Discounts may also be applied due to the nature or duration of any restrictions on the disposition of the investments. Due to the inherent uncertainty of valuations of such investments, the fair values may differ significantly from the values that would have been used had an active market existed.
Trading in securities on foreign securities stock exchanges and OTC markets may be completed before 4 p.m. Eastern time. In addition, trading in certain foreign markets may not take place on every Fund’s business day. Occasionally,
| franklintempleton.com | Semiannual Report | 25 | ||||
FRANKLIN MUTUAL SERIES FUNDS
NOTES TO FINANCIAL STATEMENTS (UNAUDITED)
Franklin Mutual International Fund(continued)
1. Organization and Significant Accounting Policies(continued)
a. Financial Instrument Valuation(continued)
events occur between the time at which trading in a foreign security is completed and 4 p.m. Eastern time that might call into question the reliability of the value of a portfolio security held by the Fund. As a result, differences may arise between the value of the Fund’s portfolio securities as determined at the foreign market close and the latest indications of value at 4 p.m. Eastern time. In order to minimize the potential for these differences, the VC monitors price movements following the close of trading in foreign stock markets through a series of country specific market proxies (such as baskets of American Depositary Receipts, futures contracts and exchange traded funds). These price movements are measured against established trigger thresholds for each specific market proxy to assist in determining if an event has occurred that may call into question the reliability of the values of the foreign securities held by the Fund. If such an event occurs, the securities may be valued using fair value procedures, which may include the use of independent pricing services.
When the last day of the reporting period is anon-business day, certain foreign markets may be open on those days that the Fund’s NAV is not calculated, which could result in differences between the value of the Fund’s portfolio securities on the last business day and the last calendar day of the reporting period. Any significant security valuation changes due to an open foreign market are adjusted and reflected by the Fund for financial reporting purposes.
b. Foreign Currency Translation
Portfolio securities and other assets and liabilities denominated in foreign currencies are translated into U.S. dollars based on the exchange rate of such currencies against U.S. dollars on the date of valuation. The Fund may enter into foreign currency exchange contracts to facilitate transactions denominated in a foreign currency. Purchases and sales of securities, income and expense items denominated in foreign currencies are translated into U.S. dollars at the exchange rate in effect on the transaction date. Portfolio securities and assets and liabilities denominated in foreign currencies contain risks that those currencies will decline in value relative to the U.S. dollar. Occasionally, events may impact the availability or reliability of foreign exchange rates used to convert the U.S. dollar equivalent
value. If such an event occurs, the foreign exchange rate will be valued at fair value using procedures established and approved by the Board.
The Fund does not separately report the effect of changes in foreign exchange rates from changes in market prices on securities held. Such changes are included in net realized and unrealized gain or loss from investments in the Statement of Operations.
Realized foreign exchange gains or losses arise from sales of foreign currencies, currency gains or losses realized between the trade and settlement dates on securities transactions and the difference between the recorded amounts of dividends, interest, and foreign withholding taxes and the U.S. dollar equivalent of the amounts actually received or paid. Net unrealized foreign exchange gains and losses arise from changes in foreign exchange rates on foreign denominated assets and liabilities other than investments in securities held at the end of the reporting period.
c. Derivative Financial Instruments
The Fund invested in derivative financial instruments in order to manage risk or gain exposure to various other investments or markets. Derivatives are financial contracts based on an underlying or notional amount, require no initial investment or an initial net investment that is smaller than would normally be required to have a similar response to changes in market factors, and require or permit net settlement. Derivatives contain various risks including the potential inability of the counterparty to fulfill their obligations under the terms of the contract, the potential for an illiquid secondary market, and/or the potential for market movements which expose the Fund to gains or losses in excess of the amounts shown in the Statement of Assets and Liabilities. Realized gain and loss and unrealized appreciation and depreciation on these contracts for the period are included in the Statement of Operations.
Derivative counterparty credit risk is managed through a formal evaluation of the creditworthiness of all potential counterparties. The Fund attempts to reduce its exposure to counterparty credit risk on OTC derivatives, whenever possible, by entering into International Swaps and Derivatives Association (ISDA) master agreements with certain counterparties. These agreements contain various provisions, including but not limited to collateral requirements, events of default, or early termination. Termination events applicable to the counterparty include certain deteriorations in the credit
| 26 | Semiannual Report | franklintempleton.com | ||
FRANKLIN MUTUAL SERIES FUNDS
NOTES TO FINANCIAL STATEMENTS (UNAUDITED)
Franklin Mutual International Fund(continued)
quality of the counterparty. Termination events applicable to the Fund include failure of the Fund to maintain certain net asset levels and/or limit the decline in net assets over various periods of time. In the event of default or early termination, the ISDA master agreement gives thenon-defaulting party the right to net andclose-out all transactions traded, whether or not arising under the ISDA agreement, to one net amount payable by one counterparty to the other. However, absent an event of default or early termination, OTC derivative assets and liabilities are presented gross and not offset in the Statement of Assets and Liabilities. Early termination by the counterparty may result in an immediate payment by the Fund of any net liability owed to that counterparty under the ISDA agreement. At June 30, 2019, the Fund had OTC derivatives in a net liability position of $96,408.
Collateral requirements differ by type of derivative. Collateral or initial margin requirements are set by the broker or exchange clearing house for exchange traded and centrally cleared derivatives. Initial margin deposited is held at the exchange and can be in the form of cash and/or securities. For OTC derivatives traded under an ISDA master agreement, posting of collateral is required by either the Fund or the applicable counterparty if the total net exposure of all OTC derivatives with the applicable counterparty exceeds the minimum transfer amount, which typically ranges from $100,000 to $250,000, and can vary depending on the counterparty and the type of the agreement. Generally, collateral is determined at the close of Fund business each day and any additional collateral required due to changes in derivative values may be delivered by the Fund or the counterparty the next business day, or within a few business days. Collateral pledged and/or received by the Fund for OTC derivatives, if any, is held in segregated accounts with the Fund’s custodian/counterparty broker and can be in the form of cash and/or securities. Unrestricted cash may be invested according to the Fund’s investment objectives. To the extent that the amounts due to the Fund from its counterparties are not subject to collateralization or are not fully collateralized, the Fund bears the risk of loss from counterpartynon-performance.
At June 30, 2019, the Fund received $555,310 in U.K. Treasury Bonds and U.S. Treasury Bills, Bonds and Notes as collateral for derivatives.
The Fund entered into exchange traded futures contracts primarily to manage exposure to certain foreign currencies. A futures contract is an agreement between the Fund and a
counterparty to buy or sell an asset at a specified price on a future date. Required initial margins are pledged by the Fund, and the daily change in fair value is accounted for as a variation margin payable or receivable in the Statement of Assets and Liabilities.
The Fund entered into OTC forward exchange contracts primarily to manage exposure to certain foreign currencies. A forward exchange contract is an agreement between the Fund and a counterparty to buy or sell a foreign currency at a specific exchange rate on a future date.
See Note 9 regarding other derivative information.
d. Securities Sold Short
The Fund is engaged in selling securities short, which obligates the Fund to replace a borrowed security with the same security at current fair value. The Fund incurs a loss if the price of the security increases between the date of the short sale and the date on which the Fund replaces the borrowed security. The Fund realizes a gain if the price of the security declines between those dates. Gains are limited to the price at which the Fund sold the security short, while losses are potentially unlimited in size.
The Fund is required to establish a margin account with the broker lending the security sold short. While the short sale is outstanding, the broker retains the proceeds of the short sale to the extent necessary to meet margin requirements until the short position is closed out. A deposit must also be maintained with the Fund’s custodian/counterparty broker consisting of cash and/or securities having a value equal to a specified percentage of the value of the securities sold short. The Fund is obligated to pay fees for borrowing the securities sold short and is required to pay the counterparty any dividends and/or interest due on securities sold short. Such dividends and/or interest and any security borrowing fees are recorded as an expense to the Fund. At June 30, 2019, the Fund had no securities sold short.
e. Securities Lending
The Fund participates in an agency based securities lending program to earn additional income. The Fund receives cash collateral against the loaned securities in an amount equal to at least 102% of the fair value of the loaned securities. Collateral is maintained over the life of the loan in an amount not less than 100% of the fair value of loaned securities, as determined at the close of Fund business each day; any
| franklintempleton.com | Semiannual Report | 27 | ||||
FRANKLIN MUTUAL SERIES FUNDS
NOTES TO FINANCIAL STATEMENTS (UNAUDITED)
Franklin Mutual International Fund(continued)
1. Organization and Significant Accounting Policies(continued)
e. Securities Lending(continued)
additional collateral required due to changes in security values is delivered to the Fund on the next business day. The collateral is deposited into a joint cash account with other funds and is used to invest in a money market fund managed by Franklin Advisers, Inc., an affiliate of the Fund, and/or a joint repurchase agreement. The Fund may receive income from the investment of cash collateral, in addition to lending fees and rebates paid by the borrower. Income from securities loaned, net of fees paid to the securities lending agent and/or third-party vendor, is reported separately in the Statement of Operations. The Fund bears the market risk with respect to the collateral investment, securities loaned, and the risk that the agent may default on its obligations to the Fund. If the borrower defaults on its obligation to return the securities loaned, the Fund has the right to repurchase the securities in the open market using the collateral received. The securities lending agent has agreed to indemnify the Fund in the event of default by a third party borrower. At June 30, 2019, the Fund had no securities on loan.
f. Income and Deferred Taxes
It is the Fund’s policy to qualify as a regulated investment company under the Internal Revenue Code. The Fund intends to distribute to shareholders substantially all of its taxable income and net realized gains to relieve it from federal income and excise taxes. As a result, no provision for U.S. federal income taxes is required.
The Fund may be subject to foreign taxation related to income received, capital gains on the sale of securities and certain foreign currency transactions in the foreign jurisdictions in which it invests. Foreign taxes, if any, are recorded based on the tax regulations and rates that exist in the foreign markets in which the Fund invests. When a capital gain tax is determined to apply, the Fund records an estimated deferred tax liability in an amount that would be payable if the securities were disposed of on the valuation date.
As a result of several court cases, in certain countries across the European Union, the Fund filed additional tax reclaims for previously withheld taxes on dividends earned in those countries (EU reclaims). These additional filings are subject to various administrative proceedings by the local
jurisdictions’ tax authorities within the European Union, as well as a number of related judicial proceedings. Income recognized, if any, for EU reclaims is reflected as other income in the Statement of Operations and any related receivable, if any, is reflected as European Union tax reclaims in the Statement of Assets and Liabilities. When uncertainty exists as to the ultimate resolution of these proceedings, the likelihood of receipt of these EU reclaims, and the potential timing of payment, no amounts are reflected in the financial statements. For U.S. income tax purposes, EU reclaims received by the Fund, if any, reduce the amounts of foreign taxes Fund shareholders can use as tax credits in their individual income tax returns.
The Fund may recognize an income tax liability related to its uncertain tax positions under U.S. GAAP when the uncertain tax position has a less than 50% probability that it will be sustained upon examination by the tax authorities based on its technical merits. As of June 30, 2019, the Fund has determined that no tax liability is required in its financial statements related to uncertain tax positions for any open tax years (or expected to be taken in future tax years). Open tax years are those that remain subject to examination and are based on the statute of limitations in each jurisdiction in which the Fund invests.
g. Security Transactions, Investment Income, Expenses and Distributions
Security transactions are accounted for on trade date. Realized gains and losses on security transactions are determined on a specific identification basis. Interest income and estimated expenses are accrued daily. Amortization of premium and accretion of discount on debt securities are included in interest income. Dividend income is recorded on theex-dividend date except for certain dividends from securities where the dividend rate is not available. In such cases, the dividend is recorded as soon as the information is received by the Fund. Distributions to shareholders are recorded on theex-dividend date. Distributable earnings are determined according to income tax regulations (tax basis) and may differ from earnings recorded in accordance with U.S. GAAP. These differences may be permanent or temporary. Permanent differences are reclassified among capital accounts to reflect their tax character. These reclassifications have no impact on net assets or the results of operations. Temporary differences are not reclassified, as they may reverse in subsequent periods.
| 28 | Semiannual Report | franklintempleton.com | ||
FRANKLIN MUTUAL SERIES FUNDS
NOTES TO FINANCIAL STATEMENTS (UNAUDITED)
Franklin Mutual International Fund(continued)
Common expenses incurred by the Trust are allocated among the Funds based on the ratio of net assets of each Fund to the combined net assets of the Trust or based on the ratio of number of shareholders of each Fund to the combined number of shareholders of the Trust. Fund specific expenses are charged directly to the Fund that incurred the expense.
Realized and unrealized gains and losses and net investment income, excluding class specific expenses, are allocated daily to each class of shares based upon the relative proportion of net assets of each class. Differences in per share distributions by class are generally due to differences in class specific expenses.
h. Accounting Estimates
The preparation of financial statements in accordance with U.S. GAAP requires management to make estimates and assumptions that affect the reported amounts of assets and
liabilities at the date of the financial statements and the amounts of income and expenses during the reporting period. Actual results could differ from those estimates.
i. Guarantees and Indemnifications
Under the Trust’s organizational documents, its officers and trustees are indemnified by the Trust against certain liabilities arising out of the performance of their duties to the Trust. Additionally, in the normal course of business, the Trust, on behalf of the Fund, enters into contracts with service providers that contain general indemnification clauses. The Trust’s maximum exposure under these arrangements is unknown as this would involve future claims that may be made against the Trust that have not yet occurred. Currently, the Trust expects the risk of loss to be remote.
2. Shares of Beneficial Interest
At June 30, 2019, there were an unlimited number of shares authorized (without par value). Transactions in the Fund’s shares were as follows:
| Six Months Ended June 30, 2019 | Year Ended December 31, 2018 | |||||||||||||||
|
|
|
| |||||||||||||
| Shares | Amount | Shares | Amount | |||||||||||||
| ||||||||||||||||
| Class Z Shares: | ||||||||||||||||
| Shares sold | 477,898 | $ | 6,570,401 | 2,069,714 | $ | 29,602,759 | ||||||||||
| Shares issued in reinvestment of distributions | — | — | 104,086 | 1,342,966 | ||||||||||||
| Shares redeemed | (822,289 | ) | (11,248,688 | ) | (3,501,255 | ) | (51,335,452) | |||||||||
|
| |||||||||||||||
| Net increase (decrease) | (344,391 | ) | $ | (4,678,287 | ) | (1,327,455 | ) | $ | (20,389,727) | |||||||
|
| |||||||||||||||
| Class A Shares: | ||||||||||||||||
| Shares solda | 189,916 | $ | 2,587,561 | 1,021,682 | $ | 15,233,084 | ||||||||||
| Shares issued in reinvestment of distributions | — | — | 97,868 | 1,258,830 | ||||||||||||
| Shares redeemed | (795,289 | ) | (10,836,432 | ) | (2,182,962 | ) | (32,698,928) | |||||||||
|
| |||||||||||||||
| Net increase (decrease) | (605,373 | ) | $ | (8,248,871 | ) | (1,063,412 | ) | $ | (16,207,014) | |||||||
|
| |||||||||||||||
| Class C Shares: | ||||||||||||||||
| Shares sold | 42,902 | $ | 578,349 | 222,976 | $ | 3,422,701 | ||||||||||
| Shares issued in reinvestment of distributions | — | — | 11,409 | 150,533 | ||||||||||||
| Shares redeemeda | (188,344 | ) | (2,547,859 | ) | (1,010,609 | ) | (15,058,426) | |||||||||
|
| |||||||||||||||
| Net increase (decrease) | (145,442 | ) | $ | (1,969,510 | ) | (776,224 | ) | $ | (11,485,192) | |||||||
|
| |||||||||||||||
| franklintempleton.com | Semiannual Report | 29 | ||||
FRANKLIN MUTUAL SERIES FUNDS
NOTES TO FINANCIAL STATEMENTS (UNAUDITED)
Franklin Mutual International Fund(continued)
2. Shares of Beneficial Interest(continued)
| Six Months Ended June 30, 2019 | Year Ended December 31, 2018 | |||||||||||||||
| Shares | Amount | Shares | Amount | |||||||||||||
| Class R Shares: | ||||||||||||||||
| Shares sold | 13,553 | $ | 182,835 | 50,432 | $ | 776,090 | ||||||||||
| Shares issued in reinvestment of distributions | — | — | 2,782 | 35,634 | ||||||||||||
| Shares redeemed | (22,734 | ) | (302,708 | ) | (39,495 | ) | (605,673 | ) | ||||||||
|
| |||||||||||||||
| Net increase (decrease) | (9,181 | ) | $ | (119,873 | ) | 13,719 | $ | 206,051 | ||||||||
|
| |||||||||||||||
| Class R6 Shares: | ||||||||||||||||
| Shares sold | 136,447 | $ | 1,876,664 | 360,960 | $ | 5,502,994 | ||||||||||
| Shares issued in reinvestment of distributions | — | — | 44,003 | 566,278 | ||||||||||||
| Shares redeemed | (476,574 | ) | (6,510,297 | ) | (443,682 | ) | (6,794,236 | ) | ||||||||
|
| |||||||||||||||
| Net increase (decrease) | (340,127 | ) | $ | (4,633,633 | ) | (38,719 | ) | $ | (724,964 | ) | ||||||
|
| |||||||||||||||
aMay include a portion of Class C shares that were automatically converted to Class A.
3. Transactions with Affiliates
Franklin Resources, Inc. is the holding company for various subsidiaries that together are referred to as Franklin Templeton. Certain officers and trustees of the Fund are also officers and/or directors of the following subsidiaries:
| Subsidiary | Affiliation | |
Franklin Mutual Advisers, LLC (Franklin Mutual)
|
Investment manager
| |
Franklin Templeton Services, LLC (FT Services)
|
Administrative manager
| |
Franklin Templeton Distributors, Inc. (Distributors)
|
Principal underwriter
| |
Franklin Templeton Investor Services, LLC (Investor Services)
|
Transfer agent
| |
a. Management Fees
The Fund pays an investment management fee to Franklin Mutual of 0.875% per year of the average daily net assets of the Fund.
b. Administrative Fees
Under an agreement with Franklin Mutual, FT Services provides administrative services to the Fund. The fee is paid by Franklin Mutual based on the Fund’s average daily net assets, and is not an additional expense of the Fund.
c. Distribution Fees
The Board has adopted distribution plans for each share class, with the exception of Class Z and Class R6 shares, pursuant to Rule12b-1 under the 1940 Act. Under the Fund’s Class A reimbursement distribution plan, the Fund reimburses Distributors for costs incurred in connection with the servicing, sale and distribution of the Fund’s shares up to the maximum annual plan rate. Under the Class A reimbursement distribution plan, costs exceeding the maximum for the current plan year cannot be reimbursed in subsequent periods. In addition, under the Fund’s Class C and R compensation distribution plans, the Fund pays Distributors for costs incurred in connection with the servicing, sale and distribution of the Fund’s shares up to the maximum annual plan rate for each class. The plan year, for purposes of monitoring compliance with the maximum annual plan rates, is February 1 through January 31.
| 30 | Semiannual Report | franklintempleton.com | ||
FRANKLIN MUTUAL SERIES FUNDS
NOTES TO FINANCIAL STATEMENTS (UNAUDITED)
Franklin Mutual International Fund(continued)
The maximum annual plan rates, based on the average daily net assets, for each class, are as follows:
Class A | 0.35% | |||
Class C | 1.00% | |||
Class R | 0.50% |
The Board has set the current rate at 0.25% per year for Class A shares until further notice and approval by the Board.
d. Sales Charges/Underwriting Agreements
Front-end sales charges and contingent deferred sales charges (CDSC) do not represent expenses of the Fund. These charges are deducted from the proceeds of sales of Fund shares prior to investment or from redemption proceeds prior to remittance, as applicable. Distributors has advised the Fund of the following commission transactions related to the sales and redemptions of the Fund’s shares for the period:
Sales charges retained net of commissions paid to unaffiliated brokers/dealers | $ | 1,837 | ||
CDSC retained | $ | 527 |
e. Transfer Agent Fees
Each class of shares pays transfer agent fees to Investor Services for its performance of shareholder servicing obligations. The fees are based on an annualized asset based fee of 0.02% plus a transaction based fee. In addition, each class reimburses Investor Services for out of pocket expenses incurred and, except for Class R6, reimburses shareholder servicing fees paid to third parties. These fees are allocated daily based upon their relative proportion of such classes’ aggregate net assets. Class R6 pays Investor Services transfer agent fees specific to that class.
For the period ended June 30, 2019, the Fund paid transfer agent fees of $140,495, of which $74,816 was retained by Investor Services.
f. Waiver and Expense Reimbursements
Franklin Mutual and Investor Services have contractually agreed in advance to waive or limit their respective fees and to assume as their own expense certain expenses otherwise payable by the Fund so that the expenses (excluding distribution fees, acquired fund fees and expenses and certainnon-routine expenses or costs, including those relating to litigation, indemnification, reorganizations, and liquidations) for each class of the Fund do not exceed 0.97%, and Class R6 does not exceed 0.81%, based on the average net assets of each class until April 30, 2020. Total expenses waived or paid are not subject to recapture subsequent to the Fund’s fiscal year end.
Prior to May 1, 2019, the expenses (excluding certain fees and expenses as previously disclosed) for Class R6 were limited to 0.83% based on the average net assets of the class.
g. Other Affiliated Transactions
At June 30, 2019, one or more of the funds in Franklin Fund Allocator Series owned 8.2% of the Fund’s outstanding shares.
4. Expense Offset Arrangement
The Fund has entered into an arrangement with its custodian whereby credits realized as a result of uninvested cash balances are used to reduce a portion of the Fund’s custodian expenses. During the period ended June 30, 2019, the custodian fees were reduced as noted in the Statement of Operations.
| franklintempleton.com | Semiannual Report | 31 | ||||
FRANKLIN MUTUAL SERIES FUNDS
NOTES TO FINANCIAL STATEMENTS (UNAUDITED)
Franklin Mutual International Fund(continued)
5. Independent Trustees’ Retirement Plan
On January 1, 1993, the Trust adopted an Independent Trustees’ Retirement Plan (Plan). The Plan is an unfunded defined benefit plan that provides benefit payments to Trustees whose length of service and retirement age meets the eligibility requirements of the Plan. Benefits under the Plan are based on years of service and fees paid to each trustee at the time of retirement. Effective in December 1996, the Plan was closed to new participants.
During the period ended June 30, 2019, the Fund’s projected benefit obligation and benefit payments under the Plan were as follows:
aProjected benefit obligation at June 30, 2019 | $ | 4,208 | ||
bIncrease in projected benefit obligation | $ | 1,400 | ||
Benefit payments made to retired trustees | $ | (91 | ) |
aThe projected benefit obligation is included in trustees’ fees and expenses in the Statement of Assets and Liabilities.
bThe increase in projected benefit obligation is included in trustees’ fees and expenses in the Statement of Operations.
6. Income Taxes
For tax purposes, the Fund may elect to defer any portion of a post-October capital loss or late-year ordinary loss to the first day of the following fiscal year. At December 31, 2018, the Fund deferred post-October capital losses of $1,395,980 and late-year ordinary losses of $217,602.
At June 30, 2019, the cost of investments and net unrealized appreciation (depreciation) for income tax purposes were as follows:
Cost of investments | $ 147,576,584 | |||
|
| |||
Unrealized appreciation | $ 8,593,314 | |||
Unrealized depreciation | (26,934,332 | ) | ||
|
| |||
Net unrealized appreciation (depreciation) | $ (18,341,018 | ) | ||
|
| |||
Differences between income and/or capital gains as determined on a book basis and a tax basis are primarily due to differing treatments of foreign currency transactions and passive foreign investment company shares.
7. Investment Transactions
Purchases and sales of investments (excluding short term securities) for the period ended June 30, 2019, aggregated $11,387,927 and $24,817,716, respectively.
8. Concentration of Risk
Investing in foreign securities may include certain risks and considerations not typically associated with investing in U.S. securities, such as fluctuating currency values and changing local and regional economic, political and social conditions, which may result in greater market volatility. Current political and financial uncertainty surrounding the European Union may increase market volatility and the economic risk of investing in securities in Europe. In addition, certain foreign securities may not be as liquid as U.S. securities.
| 32 | Semiannual Report | franklintempleton.com | ||
FRANKLIN MUTUAL SERIES FUNDS
NOTES TO FINANCIAL STATEMENTS (UNAUDITED)
Franklin Mutual International Fund(continued)
9. Other Derivative Information
At June 30, 2019, investments in derivative contracts are reflected in the Statement of Assets and Liabilities as follows:
Asset Derivatives | Liability Derivatives | |||||||||||
Derivative Contracts Not Accounted for as Hedging Instruments | Statement of Assets and Liabilities Location | Fair Value | Statement of Assets and Liabilities Location | Fair Value | ||||||||
| Foreign exchange contracts | Variation margin on futures contracts | | $ 11,519 | a | Variation margin on futures contracts | | $ 51,467 | a | ||||
Unrealized appreciation on OTC forward exchange contracts | 879,139 | Unrealized depreciation on OTC forward exchange contracts | 257,411 | |||||||||
|
|
|
| |||||||||
| Totals | $890,658 | $308,878 | ||||||||||
|
|
|
| |||||||||
aThis amount reflects the cumulative appreciation (depreciation) of futures contracts as reported in the Statement of Investments. Only the variation margin receivable/ payable at period end is separately reported within the Statement of Assets and Liabilities. Prior variation margin movements were recorded to cash upon receipt or payment.
For the period ended June 30, 2019, the effect of derivative contracts in the Statement of Operations was as follows:
Derivative Contracts Not Accounted for as Hedging Instruments | Statement of Operations Location | Net Realized Gain (Loss) for the Period | Statement of Operations Location | Net Change in Unrealized Appreciation (Depreciation) for the Period | ||||||||
Net realized gain (loss) from: | Net change in unrealized appreciation (depreciation) on: | |||||||||||
Foreign exchange contracts | Forward exchange contracts | $1,194,558 | Forward exchange contracts | $(268,469 | ) | |||||||
Futures contracts | 540,089 | Futures contracts | (54,080 | ) | ||||||||
|
|
|
| |||||||||
| Totals | $1,734,647 | $(322,549 | ) | |||||||||
|
|
|
| |||||||||
For the period ended June 30, 2019, the average month end notional amount of futures contracts represented $24,533,813. The average month end contract value of forward exchange contracts was $75,836,937.
See Note 1(c) regarding derivative financial instruments.
10. Upcoming Acquisitions/Reorganization
On July 16, 2019, the Board approved a proposal to reorganize the Fund with and into Franklin Mutual Global Discovery Fund, subject to approval by the shareholders of the Fund.
11. Credit Facility
The Fund, together with other U.S. registered and foreign investment funds (collectively, Borrowers), managed by Franklin Templeton, are borrowers in a joint syndicated senior unsecured credit facility totaling $2 billion (Global Credit Facility) which matures on February 7, 2020. This Global Credit Facility provides a source of funds to the Borrowers for temporary and emergency purposes, including the ability to meet future unanticipated or unusually large redemption requests.
Under the terms of the Global Credit Facility, the Fund shall, in addition to interest charged on any borrowings made by the Fund and other costs incurred by the Fund, pay its share of fees and expenses incurred in connection with the implementation and maintenance of the Global Credit Facility, based upon its relative share of the aggregate net assets of all of the
| franklintempleton.com | Semiannual Report | 33 | ||||
FRANKLIN MUTUAL SERIES FUNDS
NOTES TO FINANCIAL STATEMENTS (UNAUDITED)
Franklin Mutual International Fund(continued)
11. Credit Facility(continued)
Borrowers, including an annual commitment fee of 0.15% based upon the unused portion of the Global Credit Facility. These fees are reflected in other expenses in the Statement of Operations. During the period ended June 30, 2019, the Fund did not use the Global Credit Facility.
12. Fair Value Measurements
The Fund follows a fair value hierarchy that distinguishes between market data obtained from independent sources (observable inputs) and the Fund’s own market assumptions (unobservable inputs). These inputs are used in determining the value of the Fund’s financial instruments and are summarized in the following fair value hierarchy:
| • | Level 1 – quoted prices in active markets for identical financial instruments |
| • | Level 2 – other significant observable inputs (including quoted prices for similar financial instruments, interest rates, prepayment speed, credit risk, etc.) |
| • | Level 3 – significant unobservable inputs (including the Fund’s own assumptions in determining the fair value of financial instruments) |
The input levels are not necessarily an indication of the risk or liquidity associated with financial instruments at that level.
A summary of inputs used as of June 30, 2019, in valuing the Fund’s assets and liabilities carried at fair value, is as follows:
| Level 1 | Level 2 | Level 3 | Total | |||||||||||||
| Assets: | ||||||||||||||||
Investments in Securities:a | ||||||||||||||||
Equity Investments | $ | 122,158,850 | $ | — | $ | — | $ | 122,158,850 | ||||||||
Short Term Investments | 1,494,443 | 5,000,000 | — | 6,494,443 | ||||||||||||
|
| |||||||||||||||
Total Investments in Securities | $ | 123,653,293 | $ | 5,000,000 | $ | — | $ | 128,653,293 | ||||||||
|
| |||||||||||||||
Other Financial Instruments: | ||||||||||||||||
Futures Contracts | $ | 11,519 | $ | — | $ | — | $ | 11,519 | ||||||||
Forward Exchange Contracts | — | 879,139 | — | 879,139 | ||||||||||||
|
| |||||||||||||||
Total Other Financial Instruments | $ | 11,519 | $ | 879,139 | $ | — | $ | 890,658 | ||||||||
|
| |||||||||||||||
| Liabilities: | ||||||||||||||||
Other Financial Instruments: | ||||||||||||||||
Futures Contracts | $ | 51,467 | $ | — | $ | — | $ | 51,467 | ||||||||
Forward Exchange Contracts | — | 257,411 | — | 257,411 | ||||||||||||
|
| |||||||||||||||
Total Other Financial Instruments | $ | 51,467 | $ | 257,411 | $ | — | $ | 308,878 | ||||||||
|
| |||||||||||||||
aFor detailed categories, see the accompanying Statement of Investments.
bIncludes common and preferred stocks.
13. New Accounting Pronouncements
In August 2018, the Financial Accounting Standards Board issued Accounting Standards Update (ASU)No. 2018-14, Compensation—Retirement Benefits—Defined Benefit Plans—General (Subtopic715-20): Disclosure Framework—Changes to the Disclosure Requirements for Defined Benefit Plans. The amendments in the ASU modify the disclosure requirements for
| 34 | Semiannual Report | franklintempleton.com | ||
FRANKLIN MUTUAL SERIES FUNDS
NOTES TO FINANCIAL STATEMENTS (UNAUDITED)
Franklin Mutual International Fund (continued)
employers that sponsor defined benefit pension or other postretirement plans. The ASU is effective for annual reporting periods ending after December 15, 2020. Management has reviewed the requirements and believes the adoption of this ASU will not have a material impact on the financial statements.
14. Subsequent Events
The Fund has evaluated subsequent events through the issuance of the financial statements and determined that no events have occurred that require disclosure other than those already disclosed in the financial statements.
Abbreviations
| Counterparty | Currency | Selected Portfolio | ||||||||
| BOFA | Bank of America Corp. | EUR | Euro | ADR | American Depositary Receipt | |||||
| BONY | The Bank of New York Mellon Corp. | GBP | British Pound | FHLB | Federal Home Loan Bank | |||||
| HSBK | HSBC Bank PLC | USD | United States Dollar | |||||||
| SSBT | State Street Bank and Trust Co., N.A. | |||||||||
| UBSW | UBS AG | |||||||||
| franklintempleton.com | Semiannual Report | 35 | ||||
FRANKLIN MUTUAL SERIES FUNDS
FRANKLIN MUTUAL INTERNATIONAL FUND
Board Approval of Investment
Management Agreements
FRANKLIN MUTUAL SERIES FUNDS
Franklin Mutual International Fund
(Fund)
The Board of Trustees (Board), including a majority of trustees that are not “interested persons” as such term is defined in section 2(a)(19) of the Investment Company Act of 1940 (hereinafter referred to as “independent trustees”), at anin-person meeting held on May 22, 2019, unanimously approved the renewal of the Fund’s investment management agreement. Prior to a meeting of all of the trustees for the purpose of considering such renewal, the independent trustees participated in two other meetings held in connection with the renewal process. Throughout the process, the independent trustees received assistance and advice from and met separately with independent counsel. The independent trustees met with and interviewed officers of the investment manager (including portfolio managers), the transfer agent and shareholder services group and the distributor. In approving the renewal of the investment management agreement for the Fund, the Board, including the independent trustees, determined that the investment management fee structure was fair and reasonable and that continuance of the agreement was in the best interests of the Fund and its shareholders.
In reaching their decision on the investment management agreement, the trustees took into account information furnished throughout the year at regular Board meetings, as well as information specifically requested and furnished for the renewal process, which culminated in the meetings referred to above for the specific purpose of considering such agreement. Information furnished throughout the year included, among others, reports on the Fund’s investment performance, expenses, portfolio composition, portfolio brokerage execution, client commission arrangements, derivatives, securities lending, asset segregation, portfolio turnover, Rule12b-1 plan, distribution, shareholder servicing, legal and compliance matters, pricing of securities, sales and redemptions, and marketing support payments made to financial intermediaries, as well as a third-party survey of transfer agent fees charged to funds within the Franklin Templeton Investments (FTI) complex in comparison with those charged to other fund complexes deemed comparable. Also, related financial statements and other information about the scope and quality of services provided by the investment manager and its affiliates and enhancements to
such services over the past year were provided. In addition, the trustees received periodic reports throughout the year and during the renewal process relating to compliance with the Fund’s investment policies and restrictions. During the renewal process, the independent trustees considered the investment manager’s methods of operation within the Franklin Templeton group and its activities on behalf of other clients. The Board also noted that it received an annual report on all payments made by FTI or the Fund to financial intermediaries engaged in the sale of Fund shares, as well as a memorandum relating to third-party servicing arrangements in response to a Guidance Update from the U.S. Securities and Exchange Commission (SEC) relating to mutual fund distribution andsub-accounting fees.
The information obtained by the trustees during the renewal process also included a special report prepared by Broadridge Financial Solutions, Inc., an independent third-party analyst that utilizes data from Lipper, Inc. (“Lipper”), comparing the Fund’s investment performance and expenses with those of other mutual funds deemed comparable to the Fund as selected by Lipper (Broadridge Section 15(c) Report). The trustees reviewed the Broadridge Section 15(c) Report and its usefulness in the renewal process with respect to matters such as comparative fees, expenses, expense ratios, performance and volatility. They concluded that the report continues to be a reliable resource in the performance of their duties.
In addition, the trustees received a Profitability Study (Profitability Study) prepared by management discussing the profitability to FTI from its overall U.S. fund operations, as well as on an individualfund-by-fund basis. Over the past year, the Board and counsel to the independent trustees continued to receive reports on management’s handling of recent regulatory inquiries and pending legal actions against the investment manager and its affiliates. The independent trustees were satisfied with the actions taken to date by management in response to such regulatory and legal matters.
The trustees reviewed the personnel, operations, financial condition, and investment management capabilities, methodologies and resources of the investment manager. As part of this review, particular attention was given to management’s diligent risk management program, including continual monitoring and management of cybersecurity, liquidity and counterparty credit risk, and attention given to derivatives and other complex instruments that are held and expected to be held by the Fund and how such instruments
36 |
Semiannual Report |
franklintempleton.com | ||
FRANKLIN MUTUAL SERIES FUNDS
FRANKLIN MUTUAL INTERNATIONAL FUND
SHAREHOLDER INFORMATION
are used to carry out the Fund’s investment goal(s). The Board also took into account, among other things, management’s efforts in establishing a global credit facility for the benefit of the Fund and other accounts managed by FTI to provide a source of cash for temporary and emergency purposes or to meet unusual redemption requests as well as the strong financial position of the investment manager’s parent company and its commitment to the mutual fund business. The Board noted management’s continuing efforts and expenditures in establishing effective business continuity plans and developing strategies to address areas of heightened concern in the mutual fund industry, such as cybersecurity and liquidity risk management. The Board also recognized management’s commitment to facilitating Board oversight of particular areas, including derivatives and payments to intermediaries, by enhanced reporting.
In addition to the above and other matters considered by the trustees throughout the course of the year, the following discussion relates to certain primary factors relevant to the Board’s decision. This discussion of the information and factors considered by the Board (including the information and factors discussed above) is not intended to be exhaustive, but rather summarizes certain factors considered by the Board. In view of the wide variety of factors considered, the Board did not, unless otherwise noted, find it practicable to quantify or otherwise assign relative weights to the foregoing factors. In addition, individual trustees may have assigned different weights to various factors.
NATURE, EXTENT AND QUALITY OF SERVICES. The trustees reviewed the nature, extent and quality of the services provided, and to be provided, by the investment manager. The trustees cited the investment manager’s ability to implement the Fund’s disciplined value investment approach and its long-term relationship with the Fund as reasons that shareholders choose to invest, and remain invested, in the Fund. The trustees reviewed the Fund’s portfolio management team, including its performance, staffing, skills and compensation program. With respect to portfolio manager compensation, management assured the trustees that the Fund’s long-term performance is a significant component of incentive-based compensation and noted that a portion of a portfolio manager’s incentive-based compensation is paid in shares ofpre- designated funds from the portfolio manager’s fund management area. The trustees noted that the portfolio manager compensation program aligned the interests of the portfolio managers with that of shareholders of the Fund. The trustees discussed
with management various other products, portfolios and entities that are advised by the investment manager and the allocation of assets and expenses among and within them, as well as their relative fees and reasons for differences with respect thereto and any potential conflicts. During regular Board meetings and the aforementioned meetings of the independent trustees, the trustees received reports and presentations on the investment manager’s best execution trading policies. The trustees considered periodic reports provided to them showing that the investment manager complied with the investment policies and restrictions of the Fund as well as other reports periodically furnished to the Board covering matters such as the compliance of portfolio managers and other management personnel with the code of ethics covering the investment management personnel, the adherence to fair value pricing procedures established by the Board and the accuracy of net asset value calculations. The Board noted the extent of the benefits provided to Fund shareholders from being part of the Franklin Templeton group of funds, including the right to exchange investments between funds (same class) without a sales charge, the ability to reinvest Fund dividends into other funds and the right to combine holdings of other funds to obtain reduced sales charges. The Board considered the investment manager’s significant efforts in developing and implementing compliance procedures established in accordance with SEC and other requirements.
The Board considered the nature, extent and quality of the services to be provided under the Fund’s other service agreements to determine that, on an overall basis, Fund shareholders were well served. In this connection, the Board also took into account transfer agent and shareholder services provided to Fund shareholders by an affiliate of the investment manager, noting continuing expenditures by management to increase and improve the scope of such services and favorable periodic reports on shareholder services conducted by independent third parties. While such considerations directly affected the trustees’ decision in renewing the Fund’s transfer agent and shareholder services agreement, the Board also considered these commitments as incidental benefits to Fund shareholders deriving from the investment management relationship.
Based on their review, the trustees were satisfied with the nature and quality of the overall services provided, and to be provided, by the investment manager and its affiliates to the Fund and its shareholders and were confident in the abilities of the management team to continue the disciplined value
franklintempleton.com |
Semiannual Report |
|
37 |
| ||
FRANKLIN MUTUAL SERIES FUNDS
FRANKLIN MUTUAL INTERNATIONAL FUND
SHAREHOLDER INFORMATION
investment approach of the Fund and to provide quality services to the Fund and its shareholders.
INVESTMENT PERFORMANCE. As the Fund commenced operations on May 31, 2009, the trustees reviewed the investment performance of the Fund for theone-, three- and five-year periods ended December 31, 2018. They considered the history of successful performance of the Fund relative to various benchmarks. As part of their review, they inquired of management regarding benchmarks, style drift and restrictions on permitted investments. Consideration was also given to performance in the context of available levels of cash during the periods.
The trustees had meetings during the year, including the meetings referred to above held in connection with the renewal process, with the Fund’s portfolio managers to discuss performance and the management of the Fund. In addition to the materials provided by management in connection with the renewal process, the independent trustees requested throughout the year (and received) additional presentations from the investment manager and senior management of FTI regarding the performance of the investment manager and the Fund. As part of these presentations, the investment manager and senior management of FTI reviewed enhancements that have been made, and are being made, to the investment manager’s investment process. In addition, particular attention in assessing performance was given to the Broadridge Section 15(c) Report. That report showed the investment performance of the Fund (Class A shares) in comparison to other funds determined comparable by Lipper.
The comparable funds to the Fund, as chosen by Lipper, included all retail and institutional internationalmulti-cap value funds. The Fund had total returns in the second-lowest performing quintile for theone-year period ended December 31, 2018, and had annualized total returns for the three- and five-year periods in the lowest and middle performing quintiles, respectively. The trustees also compared Fund performance to other industry benchmarks, including measures of risk-adjusted performance of a fund, as part of their evaluation of investment performance. The trustees discussed with management the reasons for the relative underperformance for theone- and three-year periods ended December 31, 2018. While the Board was disappointed in the relative underperformance, the Board concluded that further action was not warranted at the time as the Board considered a proposal to combine the Fund with and into the Franklin Mutual Global Discovery Fund.
COMPARATIVE EXPENSES AND MANAGEMENT PROFITABILITY. The trustees considered the cost of the services provided and to be provided and the profits realized by the investment manager and its affiliates from their respective relationships with the Fund. As part of the renewal process, the trustees explored with management the trends in expense ratios over the past three fiscal years and the reasons for any increases in the Fund’s expense ratios (or components thereof). In considering the appropriateness of the management fee and other expenses charged to the Fund, the Board took into account various factors including investment performance and matters relating to Fund operations, including, but not limited to, the quality and experience of its portfolio managers and research staff. As part of this discussion, the Board took into account the extension for an additional year of the fee waiver and expense limitation arrangement. Consideration was also given to a comparative analysis in the Broadridge Section 15(c) Report of the investment management fee and total expense ratio of the Fund in comparison with those of a group of other funds selected by Lipper as its appropriate Lipper expense group. Lipper expense data is based upon information taken from each fund’s most recent annual report, which reflects historical asset levels that may be quite different from those currently existing, particularly in a period of market volatility. While recognizing such inherent limitation and the fact that expense ratios generally increase as assets decline and decrease as assets grow, the Board believed the independent analysis conducted by Lipper to be an appropriate measure of comparative expenses.
In reviewing comparative costs, emphasis was given to the Fund’s contractual management fee in comparison with the contractual management fee that would have been charged by other funds within its Lipper expense group assuming they were similar in size to the Fund, as well as the actual total expenses of the Fund in comparison with those of its Lipper expense group. The Lipper contractual management fee analysis includes administrative charges as being part of the management fee, and total expenses, for comparative consistency, are shown by Lipper for Fund Class A shares.
The Fund’s contractual management fee rate was in the second-most expensive quintile of its Lipper expense group and its total expenses were in the second-least expensive quintile of such group. The Board was satisfied with such comparative fees and expenses.
The trustees also reviewed the Profitability Study addressing profitability of Franklin Resources, Inc., from its overall U.S.
38 |
Semiannual Report |
franklintempleton.com | ||
FRANKLIN MUTUAL SERIES FUNDS
FRANKLIN MUTUAL INTERNATIONAL FUND
SHAREHOLDER INFORMATION
fund business, as well as profitability to the Fund’s investment manager and its affiliates, from providing investment management and other services to the Fund during the12-month period ended September 30, 2018, the most recent fiscalyear-end of Franklin Resources, Inc. The trustees reviewed the basis on which such reports are prepared and the cost allocation methodology utilized in the Profitability Study, it being recognized that allocation methodologies may each be reasonable while producing different results. In this respect, the Board noted that the reasonableness of the cost allocation methodologies was reviewed by independent accountants on an every other year basis.
The independent trustees met with management to discuss the Profitability Study. This included, among other things, a comparison of investment management income with investment management expenses of the Fund; comparison of underwriting revenues and expenses; the relative relationship of investment management and underwriting expenses; shareholder servicing profitability; economies of scale; and the relative contribution of the Fund to the profitability of the investment manager and its parent. In discussing the Profitability Study with the Board, the investment manager stated its belief that the costs incurred in establishing the infrastructure necessary to operate the type of mutual fund operations conducted by it and its affiliates may not be fully reflected in the expenses allocated to the Fund in determining its profitability.
The Board also took into account management’s expenditures in improving shareholder services provided to the Fund, as well as the need to meet additional regulatory and compliance requirements. The trustees also considered the extent to which the investment manager may derive ancillary benefits from Fund operations, including those derived from economies of scale, discussed below, the allocation of Fund brokerage and the use of commission dollars to pay for research and other similar services.
Based upon their consideration of all these factors, the trustees determined that the level of profits realized by the investment manager and its affiliates in providing services to the Fund was not excessive in view of the nature, quality and extent of services provided.
ECONOMIES OF SCALE. The Board considered economies of scale realized by the investment manager and its affiliates as the Fund grows larger and the extent to which they are shared with Fund shareholders, as for example, in the level of the investment management fee charged, in the quality
and efficiency of services rendered and in increased capital commitments benefiting the Fund directly or indirectly. The Board also considered the fee waiver and expense limitation arrangement in effect, and the amount of Fund expenses that were absorbed since inception of the Fund by the investment manager through such waiver and arrangement. The Board concluded that economies of scale were deemed not to be a significant factor at that time in light of, among other matters, the fee waiver and expense limitation arrangement in effect and the limited size of assets under management.
Proxy Voting Policies and Procedures
The Fund’s investment manager has established Proxy Voting Policies and Procedures (Policies) that the Fund uses to determine how to vote proxies relating to portfolio securities. Shareholders may view the Fund’s complete Policies online at franklintempleton.com. Alternatively, shareholders may request copies of the Policies free of charge by calling the Proxy Group collect at (954)527-7678 or by sending a written request to: Franklin Templeton Companies, LLC, 300 S.E. 2nd Street, Fort Lauderdale, FL 33301, Attention: Proxy Group. Copies of the Fund’s proxy voting records are also made available online at franklintempleton.com and posted on the U.S. Securities and Exchange Commission’s website at sec.gov and reflect the most recent12-month period ended June 30.
Quarterly Statement of Investments
The Trust, on behalf of the Fund, files a complete statement of investments with the U.S. Securities and Exchange Commission for the first and third quarters for each fiscal year as an exhibit to its report on FormN-PORT. Shareholders may view the filed FormN-PORT by visiting the Commission’s website at sec.gov. The filed form may also be viewed and copied at the Commission’s Public Reference Room in Washington, DC. Information regarding the operations of the Public Reference Room may be obtained by calling(800) SEC-0330.
franklintempleton.com |
Semiannual Report |
|
39 |
| ||
This page intentionally left blank.
Authorized for distribution only when accompanied or preceded by a summary prospectus and/or prospectus. Investors should carefully consider a fund’s investment goals, risks, charges and expenses before investing. A prospectus contains this and other information; please read it carefully before investing.
To help ensure we provide you with quality service, all calls to and from our service areas are monitored and/or recorded.
| Semiannual Report and Shareholder Letter | |||||
| Franklin Mutual International Fund | ||||||
Investment Manager | Distributor | Shareholder Services | ||||
| Franklin Mutual Advisers, LLC | Franklin Templeton Distributors, Inc. (800) DIAL BEN®/342-5236 franklintempleton.com | (800) 632-2301 - (Class A, C, R & R6) (800)448-FUND - (Class Z) | ||||
| © 2019 Franklin Templeton Investments. All rights reserved. | 373 S 08/19 |
| Item 2. | Code of Ethics. |
(a) The Registrant has adopted a code of ethics that applies to its principal executive officers and principal financial and accounting officer.
(c) N/A
(d) N/A
(f) Pursuant to Item 13 (a) (1), the Registrant is attaching as an exhibit a copy of its code of ethics that applies to its principal executive officers and principal financial and accounting officer.
| Item 3. | Audit Committee Financial Expert. |
(a) (1) The Registrant has an audit committee financial expert serving on its audit committee.
(2) The audit committee financial experts are Edward I. Altman, Ann Torre Bates and David W. Niemiec and they are “independent” as defined under the relevant Securities and Exchange Commission Rules and Releases.
| Item 4. | Principal Accountant Fees and Services. N/A |
| Item 5. | Audit Committee of Listed Registrants. N/A |
| Item 6. | Schedule of Investments. N/A |
| Item 7. | Disclosure of Proxy Voting Policies and Procedures forClosed-End Management Investment Companies. N/A |
| Item 8. | Portfolio Managers ofClosed-End Management Investment Companies. N/A |
| Item 9. | Purchases of Equity Securities byClosed-End Management Investment Company and Affiliated Purchasers. N/A |
| Item 10. | Submission of Matters to a Vote of Security Holders. |
There have been no changes to the procedures by which shareholders may recommend nominees to the Registrant’s Board of Trustees that would require disclosure herein.
| Item 11. | Controls and Procedures. |
(a)Evaluation of Disclosure Controls and Procedures. The Registrant maintains disclosure controls and procedures that are designed to
provide reasonable assurance that information required to be disclosed in the Registrant’s filings under the Securities Exchange Act of 1934, as amended, and the Investment Company Act of 1940 is recorded, processed, summarized and reported within the periods specified in the rules and forms of the Securities and Exchange Commission. Such information is accumulated and communicated to the Registrant’s management, including its principal executive officer and principal financial officer, as appropriate, to allow timely decisions regarding required disclosure. The Registrant’s management, including the principal executive officer and the principal financial officer, recognizes that any set of controls and procedures, no matter how well designed and operated, can provide only reasonable assurance of achieving the desired control objectives.
Within 90 days prior to the filing date of this Shareholder Report onForm N-CSRS, the Registrant had carried out an evaluation, under the supervision and with the participation of the Registrant’s management, including the Registrant’s principal executive officer and the Registrant’s principal financial officer, of the effectiveness of the design and operation of the Registrant’s disclosure controls and procedures. Based on such evaluation, the Registrant’s principal executive officer and principal financial officer concluded that the Registrant’s disclosure controls and procedures are effective.
(b)Changes in Internal Controls. There have been no changes in the Registrant’s internal control over financial reporting that occurred during the period covered by this report that has materially affected, or is reasonably likely to materially affect the internal control over financial reporting.
| Item 12. | Disclosure of Securities Lending Activities forClosed-End Management Investment Company. N/A |
| Item 13. | Exhibits. |
(a) (1) Code of Ethics
(a) (2) Certifications pursuant to Section 302 of the Sarbanes-Oxley Act of 2002 of Matthew T. Hinkle, Chief Executive Officer - Finance and Administration, and Robert G. Kubilis, Chief Financial Officer and Chief Accounting Officer
(b)Certifications pursuant to Section 906 of the Sarbanes-Oxley Act of 2002 of Matthew T. Hinkle, Chief Executive Officer - Finance and Administration, and Robert G. Kubilis, Chief Financial Officer and Chief Accounting Officer
SIGNATURES
Pursuant to the requirements of the Securities Exchange Act of 1934 and the Investment Company Act of 1940, the registrant has duly caused this report to be signed on its behalf by the undersigned, thereunto duly authorized.
FRANKLIN MUTUAL SERIES FUNDS
| By | S\MATTHEW T. HINKLE | |
| Matthew T. Hinkle | ||
| Chief Executive Officer – Finance and Administration | ||
| Date August 30, 2019 | ||
Pursuant to the requirements of the Securities Exchange Act of 1934 and the Investment Company Act of 1940, this report has been signed below by the following persons on behalf of the registrant and in the capacities and on the dates indicated.
| By | S\MATTHEW T. HINKLE | |
| Matthew T. Hinkle | ||
| Chief Executive Officer – Finance and Administration | ||
| Date August 30, 2019 | ||
| By | S\ROBERT G. KUBILIS | |
| Robert G. Kubilis | ||
| Chief Financial Officer and Chief Accounting Officer | ||
| Date: August 30, 2019 | ||