UNITED STATES
SECURITIES AND EXCHANGE COMMISSION
WASHINGTON, D.C. 20549
FORMN-CSR
CERTIFIED SHAREHOLDER REPORT OF REGISTERED
MANAGEMENT INVESTMENT COMPANIES
Investment Company Act file number:811-05398
AB VARIABLE PRODUCTS SERIES FUND, INC.
(Exact name of registrant as specified in charter)
1345 Avenue of the Americas, New York, New York 10105
(Address of principal executive offices) (Zip code)
Joseph J. Mantineo
AllianceBernstein L.P.
1345 Avenue of the Americas
New York, New York 10105
(Name and address of agent for service)
Registrant’s telephone number, including area code: (800)221-5672
Date of fiscal year end: December 31, 2019
Date of reporting period: December 31, 2019
ITEM 1. REPORTS TO STOCKHOLDERS.
DEC 12.31.19

ANNUAL REPORT
AB VARIABLE PRODUCTS
SERIES FUND, INC.
| + | BALANCED WEALTH STRATEGY PORTFOLIO |
Beginning on May 1, 2021, as permitted by regulations adopted by the Securities and Exchange Commission, you may not be receiving paper copies of the Portfolio’s shareholder reports from the insurance company that offers your contract unless you specifically request paper copies from the insurance company or from your financial intermediary. Instead of delivering paper copies of the reports, the insurance company may choose to make the reports available on a website, and will notify you by mail each time a report is posted and provide you with a website link to access the report. Instructions for requesting paper copies will be provided by your insurance company.
If you already elected to receive shareholder reports electronically, you will not be affected by this change and you need not take any action. You may elect to receive shareholder reports and other communications from the insurance company or your financial intermediary electronically by following the instructions provided by the insurance company or by contacting your financial intermediary.
You may elect to receive all future reports in paper free of charge from the insurance company. You can inform the insurance company or your financial intermediary that you wish to continue receiving paper copies of your shareholder reports by following the instructions provided by the insurance company or by contacting your financial intermediary. Your election to receive reports in paper will apply to all portfolio companies available under your contract with the insurance company.
Investment Products Offered
| • | Are Not FDIC Insured |
| • | May Lose Value |
| • | Are Not Bank Guaranteed |
AllianceBernstein Investments, Inc. (ABI) is the distributor of the AB family of mutual funds. ABI is a member of FINRA and is an affiliate of AllianceBernstein L.P., the Adviser of the funds.
You may obtain a description of the Fund’s proxy voting policies and procedures, and information regarding how the Fund voted proxies relating to portfolio securities during the most recent12-month period ended June 30, without charge. Simply visit AB’s website at www.abfunds.com or go to the Securities and Exchange Commission’s (the “Commission”) website at www.sec.gov, or call AB at (800) 227 4618.
The Fund files its complete schedule of portfolio holdings with the Commission for the first and third quarters of each fiscal year as an exhibit to its reports on Form N-PORT. The Fund’s Form N-PORT reports are available on the Commission’s website at www.sec.gov. The Fund’s Forms N-PORT may also be reviewed and copied at the Commission’s Public Reference Room in Washington, DC; information on the operation of the Public Reference Room may be obtained by calling (800) SEC 0330.
The [A/B] logo is a registered service mark of AllianceBernstein and AllianceBernstein® is a registered service mark used by permission of the owner, AllianceBernstein L.P.
| BALANCED WEALTH STRATEGY | ||
| PORTFOLIO | AB Variable Products Series Fund | |
LETTER TO INVESTORS
February 14, 2020
The following is an update of AB Variable Products Series Fund—Balanced Wealth Strategy Portfolio (the “Portfolio”) for the annual reporting period ended December 31, 2019.
INVESTMENT OBJECTIVE AND POLICIES
The Portfolio’s investment objective is to maximize total return consistent with the Adviser’s determination of reasonable risk. The Portfolio invests in a portfolio of equity and fixed-income securities that is designed as a solution for investors who seek a moderate tilt toward equity returns but also want the risk diversification offered by fixed-income securities and the broad diversification of their equity risk across styles, capitalization ranges and geographic regions. Under normal circumstances, the Portfolio will invest at least 25% of its total assets in equity securities and at least 25% of its total assets in fixed-income securities with a goal of providing moderate upside potential without excessive volatility. The Portfolio also seeks exposure to real assets by investing in real estate-related equity securities (including real estate investment trusts “REITs”), natural resource equity securities and inflation-sensitive equity securities, which are equity securities of companies that the Adviser believes maintain or grow margins in rising inflation environments, including equity securities of utilities and infrastructure-related companies (“inflation-sensitive equities”). The Portfolio pursues a global strategy, typically investing in securities of issuers located in the United States and in other countries throughout the world, including emerging-market countries.
The Adviser expects that the Portfolio will normally invest a greater percentage of its total assets in equity securities than in fixed-income securities, and will generally invest in equity securities both directly and through underlying investment companies advised by the Adviser (“Underlying Portfolios”). A significant portion of the Portfolio’s assets are expected to be invested directly in USlarge-cap equity securities, primarily common stocks, in accordance with the Adviser’s US Strategic Equities investment strategy (“US Strategic Equities”). Under US Strategic Equities, portfolio managers of the Adviser that specialize in various investment disciplines identify high-convictionlarge-cap equity securities based on their fundamental investment research for potential investment by the Portfolio. These securities are then assessed in terms of both this fundamental research and quantitative analysis in creating the equity portion of the Portfolio’s portfolio. In applying the quantitative analysis, the Adviser considers a number of metrics that historically have provided some indication of favorable future returns, including metrics related to valuation, quality, investor behavior and corporate behavior.
In addition, the Portfolio seeks to achieve exposure to internationallarge-cap equity securities through investments in the International Strategic Equities Portfolio of Bernstein Fund, Inc. (“Bernstein International Strategic Equities Portfolio”) and the International Portfolio of Sanford C. Bernstein Fund, Inc. (“SCB International Portfolio”), each a registered investment company advised by the Adviser. Bernstein International Strategic Equities Portfolio and SCB International Portfolio focus on investing innon-USlarge-cap andmid-cap equity securities. Bernstein International Strategic Equities Portfolio follows a strategy similar to US Strategic Equities, but in the international context. In managing SCB International Portfolio, the Adviser selects stocks by drawing on the capabilities of its separate investment teams specializing in different investment disciplines, including value, growth, stability and others. The Portfolio also invests in other Underlying Portfolios to efficiently gain exposure to certain other types of equity securities, including small- andmid-cap and emerging-market equity securities. The Adviser selects an Underlying Portfolio based on the segment of the equity market to which the Underlying Portfolio provides exposure, its investment philosophy, and how it complements and diversifies the Portfolio’s overall portfolio.
In selecting fixed-income investments, the Adviser may draw on the capabilities of separate investment teams that specialize in different areas that are generally defined by the maturity of the debt securities and/or their ratings, and which may include subspecialties (such as inflation-indexed securities). These fixed-income teams draw on the resources and expertise of the Adviser’s internal fixed-income research staff, which includes over 50 dedicated fixed-income research analysts and economists. The Portfolio’s fixed-income securities will primarily be investment-grade debt securities, but are expected to include lower-rated securities (“junk bonds”) and preferred stock.
The Portfolio expects to enter into derivative transactions, such as options, futures contracts, forwards and swaps. Derivatives may provide a more efficient and economical exposure to market segments than direct investments, and may also be a more efficient way to alter the Portfolio’s exposure. The Portfolio may, for example, use credit default, interest rate and total return swaps to establish exposure to the fixed-income markets or particular fixed-income securities and, as noted below, may use currency derivatives to hedge foreign currency exposure.
1
| AB Variable Products Series Fund | ||
The Adviser may employ currency hedging strategies in the Portfolio or the Underlying Portfolios, including the use of currency-related derivatives, to seek to reduce currency risk in the Portfolio or the Underlying Portfolios, but it is not required to do so. The Adviser will generally employ currency-related hedging strategies more frequently in the fixed-income portion of the Portfolio than in the equity portion.
INVESTMENT RESULTS
The table on page 5 shows the Portfolio’s performance compared to its primary benchmark, the Morgan Stanley Capital International All Country World Index (“MSCI ACWI”) (net), and the Bloomberg Barclays Global Aggregate Bond Index (USD hedged), for theone-, five- and10-year periods ended December 31, 2019.
For the annual period, all share classes of the Portfolio underperformed the primary benchmark, but outperformed the Bloomberg Barclays Global Aggregate Bond Index. The Portfolio’s more diversified approach, which balances exposures to equities, bonds, commodities and alternative strategies, underperformed theall-equity benchmark. During the period, equities, fixed-income assets and alternative strategies contributed to absolute performance. Security selection within equities and alternative strategies detracted from performance, while selection within fixed income was positive.
During the annual period, the Portfolio utilized derivatives for hedging and investment purposes, including futures, forwards, credit default swaps and interest rate swaps, which detracted from absolute returns, as well as Consumer Price Index swaps, which contributed.
MARKET REVIEW AND INVESTMENT STRATEGY
US and international stocks recorded strong double-digit returns while emerging markets also rallied during the annual ended December 31, 2019. After declining sharply at the end of 2018, equity markets rebounded dramatically in January, as strong corporate earnings and optimism about a trade truce between the US and China calmed investors.Trade-war tensions resurfaced, however, and emerging geopolitical pressures drove market volatility. Tariff wars, restrictive monetary policy and a decline in industrial production stoked recessionary fears throughout the global economy. In response, the world’s central banks implemented accommodative monetary policies to help support capital markets. Late in the third quarter, equity market performance was accompanied by a sharp style rotation in the US. Quality-growth and lower-volatility stocks, which had been strong performers, lagged and value stocks outperformed. However, for the most part, growth stocks continued to outperform value over the entire period. From a market-capitalization perspective,large-cap stocks outperformed theirsmall-cap peers. In December, equity markets rallied on news that the US and China had agreed to a preliminaryphase-one trade deal due to be signed in January 2020.
Global fixed-income markets performed strongly over the annual period. Long-dated developed-market treasuries were strong performers, given their interest-rate sensitivity, despite the move higher in yields since September. Investment-grade, high-yield and emerging-market sovereign debt all posted solid returns as credit spreads tightened. In addition to lowering rates, the US Federal Reserve increased its balance sheet later in the period to manage liquidity in the repurchase agreement market, effectively capping short-term rates. The European Central Bank reduced rates to a record low in September and announced the resumption of quantitative easing. The Bank of Japan issued guidance for the continuation of low rates and the government implemented a significant fiscal stimulus program in December.
The Portfolio’s Senior Investment Management Team seeks improved equity risk control by utilizing a blend of US, emerging- and international-market equities as well as diversifiers in the form of real estate, natural resources and pricing power equities. The Portfolio also features a global fixed-income component to benefit from international bond diversification and the low correlation of fixed income and equities. The blended equity and fixed-income exposures, combined with an emphasis on companies with historical and projected stable earnings and higher profitability, offer the potential to achieve higher risk-adjusted returns.
2
| BALANCED WEALTH STRATEGY PORTFOLIO | ||
| DISCLOSURES AND RISKS | AB Variable Products Series Fund | |
Benchmark Disclosure
All indices are unmanaged and do not reflect fees and expenses associated with the active management of a mutual fund portfolio. The MSCI ACWI (net, free float-adjusted, market capitalization weighted) represents the equity market performance of developed and emerging markets. The Bloomberg Barclays Global Aggregate Bond Index (USD hedged) represents the performance of the global investment-grade developed fixed-income markets, hedged to the US dollar. MSCI makes no express or implied warranties or representations, and shall have no liability whatsoever with respect to any MSCI data contained herein. The MSCI data may not be further redistributed or used as a basis for other indices, any securities or financial products. This report is not approved, reviewed or produced by MSCI. Net returns reflect the reinvestment of dividends after deduction ofnon-US withholding tax. An investor cannot invest directly in an index, and its results are not indicative of the performance for any specific investment, including the Portfolio.
A Word About Risk
Market Risk: The value of the Portfolio’s assets will fluctuate as the stock or bond market fluctuates. The value of its investments may decline, sometimes rapidly and unpredictably, simply because of economic changes or other events that affect large portions of the market.
Allocation Risk: The allocation of investments among the different investment styles, such as growth or value, equity or debt securities, or US ornon-US securities may have a more significant effect on the Portfolio’s net asset value (“NAV”) when one of these investment strategies is performing more poorly than others.
Foreign(Non-US) Risk: Investments in securities ofnon-US issuers may involve more risk than those of US issuers. These securities may fluctuate more widely in price and may be more difficult to trade or dispose of due to adverse market, economic, political, regulatory or other factors. These risks may be heightened with respect to investments in emerging-market countries, where there may be an increased amount of economic, political and social instability.
Currency Risk: Fluctuations in currency exchange rates may negatively affect the value of the Portfolio’s investments or reduce the Portfolio’s returns.
Interest-Rate Risk: Changes in interest rates will affect the value of investments in fixed-income securities. When interest rates rise, the value of existing investments in fixed-income securities tends to fall and this decrease in value may not be offset by higher income from new investments. Interest-rate risk is generally greater for fixed-income securities with longer maturities or durations.
Credit Risk: An issuer or guarantor of a fixed-income security, or the counterparty to a derivatives or other contract, may be unable or unwilling to make timely payments of interest or principal, or to otherwise honor its obligations. The issuer or guarantor may default, causing a loss of the full principal amount of a security and accrued interest. The degree of risk for a particular security may be reflected in its credit rating. There is the possibility that the credit rating of a fixed-income security may be downgraded after purchase, which may adversely affect the value of the security.
Below Investment-Grade Security Risk: Investments in fixed-income securities with lower ratings (“junk bonds”) tend to have a higher probability that an issuer will default or fail to meet its payment obligations. These securities may be subject to greater price volatility due to such factors as specific corporate developments, interest-rate sensitivity, negative perceptions of the junk bond market generally and may be more difficult to trade or dispose of than other types of securities.
Capitalization Risk: Investments in small- andmid-capitalization companies may be more volatile than investments in large-capitalization companies. Investments in small-capitalization companies may have additional risks because these companies have limited product lines, markets or financial resources.
Investment in Other Investment Companies Risk: As with other investments, investments in other investment companies are subject to market and selection risk. In addition, Contractholders invested in the Portfolio bear both their proportionate share of expenses in the Portfolio (including management fees) and, indirectly, the expenses of the investment companies (to the extent these expenses are not waived or reimbursed by the Adviser).
Derivatives Risk: Derivatives may be difficult to price or unwind and leveraged so that small changes may produce disproportionate losses for the Portfolio. Derivatives may also be subject to counterparty risk to a greater degree than more traditional investments.
(Disclosures, Risks and Note About Historical Performance continued on next page)
3
| DISCLOSURES AND RISKS | ||
| (continued) | AB Variable Products Series Fund | |
Real Assets Risk: The Portfolio’s investments in securities linked to real assets involve significant risks, including financial, operating, and competitive risks. Investments in securities linked to real assets expose the Portfolio to adverse macroeconomic conditions, such as a rise in interest rates or a downturn in the economy in which the asset is located. Changes in inflation rates or in the market’s inflation expectations may adversely affect the market value of inflation-sensitive equities. The Portfolio’s investments in real estate securities have many of the same risks as direct ownership of real estate, including the risk that the value of real estate could decline due to a variety of factors that affect the real estate market generally. Investments in REITs may have additional risks. REITs are dependent on the capability of their managers, may have limited diversification, and could be significantly affected by changes in tax laws.
Active Trading Risk: The Portfolio expects to engage in active and frequent trading of its portfolio securities and its portfolio turnover rate is expected to exceed 100%. A higher rate of portfolio turnover increases transaction costs, which may negatively affect the Portfolio’s return.
Management Risk: The Portfolio is subject to management risk because it is an actively managed investment fund. The Adviser will apply its investment techniques and risk analyses in making investment decisions for the Portfolio, but there is no guarantee that its techniques will produce the intended results.
These risks are fully discussed in the Variable Products prospectus. As with all investments, you may lose money by investing in the Portfolio.
An Important Note About Historical Performance
The investment return and principal value of an investment in the Portfolio will fluctuate, so that shares, when redeemed, may be worth more or less than their original cost. Performance shown in this report represents past performance and does not guarantee future results. Current performance may be lower or higher than the performance information shown. Please contact your financial advisor or insurance agent representative at your financial institution to obtain portfolio performance information current to the most recent month end.
Effective May 1, 2018, the Portfolio amended its principal strategies by eliminating the static targets for allocation of investments among asset classes, changing the securities selection strategies used for the equity portion of the Portfolio, and broadening the types of real asset securities in which the Portfolio will invest. The performance shown in the report for periods prior to May 1, 2018 is based on the Portfolio’s prior principal strategies and may not be representative of the Portfolio’s performance under its current principal strategies.
Investors should consider the investment objectives, risks, charges and expenses of the Portfolio carefully before investing. For additional copies of the Portfolio’s prospectus or summary prospectus, which contains this and other information, call your financial advisor or (800) 227 4618. Please read the prospectus and/or summary prospectus carefully before investing.
All fees and expenses related to the operation of the Portfolio have been deducted, but no adjustment has been made for insurance company separate account or annuity contract charges, which would reduce total return to a contract owner. Performance assumes reinvestment of distributions and does not account for taxes.
There are additional fees and expenses associated with all Variable Products. These fees can include mortality and expense risk charges, administrative charges, and other charges that can significantly reduce investment returns. Those fees and expenses are not reflected in this annual report. You should consult your Variable Products prospectus for a description of those fees and expenses and speak to your insurance agent or financial representative if you have any questions. You should read the prospectus before investing or sending money.
4
| BALANCED WEALTH STRATEGY PORTFOLIO | ||
| HISTORICAL PERFORMANCE | AB Variable Products Series Fund | |
| THE PORTFOLIO VS. ITS BENCHMARKS | Net Asset Value Returns | |||||||||||
| PERIODS ENDED DECEMBER 31, 2019 (unaudited) | 1 Year | 5 Years1 | 10 Years1 | |||||||||
| Balanced Wealth Strategy Portfolio Class A | 18.53% | 6.51% | 7.68% | |||||||||
| Balanced Wealth Strategy Portfolio Class B | 18.20% | 6.24% | 7.41% | |||||||||
| Primary Benchmark: MSCI ACWI (net) | 26.60% | 8.41% | 8.79% | |||||||||
| Bloomberg Barclays Global Aggregate Bond Index (USD hedged) | 8.22% | 3.57% | 4.08% | |||||||||
1 Average annual returns.
Please keep in mind that high, double-digit returns are highly unusual and cannot be sustained. Investors should also be aware that these returns were primarily achieved during favorable market conditions. |
| |||||||||||
The Portfolio’s current prospectus fee table shows the Portfolio’s total annual operating expense ratios as 0.86% and 1.11% for Class A and Class B shares, respectively, gross of any fee waivers or expense reimbursements. Contractual fee waivers and/or expense reimbursements limit the Portfolio’s annual operating expense ratios to 0.77% and 1.02% for Class A and Class B shares, respectively. These waivers/reimbursements may not be terminated before May 1, 2020 and may be extended by the Adviser for additionalone-year terms. The Financial Highlights section of this report sets forth expense ratio data for the current reporting period; the expense ratios shown above may differ from the expense ratios in the Financial Highlights section since they are based on different time periods.
GROWTH OF A $10,000 INVESTMENT
12/31/2009 TO 12/31/2019 (unaudited)

This chart illustrates the total value of an assumed $10,000 investment in the Balanced Wealth Strategy Portfolio Class A shares (from 12/31/2009 to 12/31/2019) as compared to the performance of the Portfolio’s benchmarks. The chart assumes the reinvestment of dividends and capital gains distributions.
See Disclosures, Risks and Note about Historical Performance on pages 3-4.
5
| BALANCED WEALTH STRATEGY PORTFOLIO | ||
| EXPENSE EXAMPLE (unaudited) | AB Variable Products Series Fund | |
As a shareholder of the Portfolio, you incur two types of costs: (1) transaction costs, including sales charges (loads) on purchase payments, contingent deferred sales charges on redemptions and (2) ongoing costs, including management fees; distribution(12b-1) fees; and other Portfolio expenses. This example is intended to help you understand your ongoing costs (in dollars) of investing in the Portfolio and to compare these costs with the ongoing costs of investing in other mutual funds.
The Example is based on an investment of $1,000 invested at the beginning of the period and held for the entire period as indicated below.
Actual Expenses
The table below provides information about actual account values and actual expenses. You may use the information in this line, together with the amount you invested, to estimate the expenses that you paid over the period. Simply divide your account value by $1,000 (for example, an $8,600 account value divided by $1,000 = 8.6), then multiply the result by the number in the first line under the heading entitled “Expenses Paid During Period” to estimate the expenses you paid on your account during this period. The estimate of expenses does not include fees or other expenses of any variable insurance product. If such expenses were included, the estimate of expenses you paid during the period would be higher and your ending account value would be lower.
Hypothetical Example for Comparison Purposes
The table below provides information about hypothetical account values and hypothetical expenses based on the Portfolio’s actual expense ratio and an assumed annual rate of return of 5% before expenses, which is not the Portfolio’s actual return. The hypothetical account values and expenses may not be used to estimate the actual ending account balance or expenses you paid for the period. You may use this information to compare the ongoing costs of investing in the Portfolio and other funds by comparing this 5% hypothetical example with the 5% hypothetical examples that appear in the shareholder reports of other funds. The estimate of expenses does not include fees or other expenses of any variable insurance product. If such expenses were included, the estimate of expenses you paid during the period would be higher and your ending account value would be lower.
Please note that the expenses shown in the table are meant to highlight your ongoing costs only and do not reflect any transactional costs, such as sales charges (loads), or contingent deferred sales charges on redemptions. Therefore, the second line of each class’ table is useful in comparing ongoing costs only, and will not help you determine the relative total costs of owning different funds. In addition, if these transactional costs were included, your costs would have been higher.
| Beginning Account Value July 1, 2019 | Ending Account Value December 31, 2019 | Expenses Paid During Period* | Annualized Expense Ratio* | Total Expenses Paid During Period+ | Total Annualized Expense Ratio+ | |||||||||||||||||||
Class A | ||||||||||||||||||||||||
Actual | $ | 1,000 | $ | 1,059.40 | $ | 2.91 | 0.56 | % | $ | 4.05 | 0.78 | % | ||||||||||||
Hypothetical (5% annual return before expenses) | $ | 1,000 | $ | 1,022.38 | $ | 2.85 | 0.56 | % | $ | 3.97 | 0.78 | % | ||||||||||||
Class B | ||||||||||||||||||||||||
Actual | $ | 1,000 | $ | 1,058.00 | $ | 4.20 | 0.81 | % | $ | 5.34 | 1.03 | % | ||||||||||||
Hypothetical (5% annual return before expenses) | $ | 1,000 | $ | 1,021.12 | $ | 4.13 | 0.81 | % | $ | 5.24 | 1.03 | % | ||||||||||||
| * | Expenses are equal to each classes’ annualized expense ratios, multiplied by the average account value over the period, multiplied by 184/365 (to reflect theone-half year period). |
| + | In connection with the Portfolio’s investments in affiliated/unaffiliated underlying portfolios, the Portfolio incurs no direct expenses, but bears proportionate shares of the fees and expenses (i.e., operating, administrative and investment advisory fees) of the affiliated/unaffiliated underlying portfolios. The Adviser has contractually agreed to waive its fees from the Portfolio in an amount equal to the Portfolio’s pro rata share of certain acquired fund fees and expenses of the affiliated underlying portfolios. The Portfolio’s total expenses are equal to the classes’ annualized expense ratio plus the Portfolio’s pro rata share of the weighted average expense ratio of the affiliated/unaffiliated underlying portfolios in which it invests, multiplied by the average account value over the period, multiplied by 184/365 (to reflect theone-half year period). |
6
| BALANCED WEALTH STRATEGY PORTFOLIO | ||
| TEN LARGEST HOLDINGS1 | ||
| December 31, 2019 (unaudited) | AB Variable Products Series Fund | |
| SECURITY | U.S. $ VALUE | PERCENT OF NET ASSETS | ||||||
Microsoft Corp. | $ | 4,451,083 | 1.7 | % | ||||
U.S. Treasury Inflation Index, 0.125%, 7/15/24 (TIPS) | 3,630,248 | 1.4 | ||||||
Alphabet, Inc. | 3,462,958 | 1.3 | ||||||
Apple, Inc. | 3,013,436 | 1.2 | ||||||
Royal Dutch Shell PLC | 2,800,319 | 1.1 | ||||||
Roche Holding AG | 2,535,492 | 1.0 | ||||||
Republic of Austria Government Bond, 0.75%, 10/20/26—2/20/28 | 2,522,911 | 1.0 | ||||||
Facebook, Inc. | 2,300,032 | 0.9 | ||||||
Netherlands Government Bond, Zero Coupon, 1/15/24 | 2,132,011 | 0.8 | ||||||
UnitedHealth Group, Inc. | 1,943,502 | 0.8 | ||||||
|
|
|
| |||||
| $ | 28,791,992 | 11.2 | % | |||||
SECURITY TYPE BREAKDOWN2
December 31, 2019 (unaudited)
| SECURITY TYPE | U.S. $ VALUE | PERCENT OF TOTAL INVESTMENTS | ||||||
Common Stocks | $ | 166,338,774 | 64.8 | % | ||||
Governments—Treasuries | 27,748,760 | 10.8 | ||||||
Corporates—Investment Grade | 18,562,794 | 7.2 | ||||||
Inflation-Linked Securities | 9,479,202 | 3.7 | ||||||
Mortgage Pass-Throughs | 8,482,274 | 3.3 | ||||||
Collateralized Mortgage Obligations | 6,060,429 | 2.4 | ||||||
Commercial Mortgage-Backed Securities | 3,642,755 | 1.4 | ||||||
Corporates—Non-Investment Grade | 3,205,573 | 1.2 | ||||||
Covered Bonds | 2,724,766 | 1.1 | ||||||
Quasi-Sovereigns | 1,817,516 | 0.7 | ||||||
Collateralized Loan Obligations | 1,366,516 | 0.5 | ||||||
Emerging Markets—Sovereigns | 1,257,176 | 0.5 | ||||||
Emerging Markets—Treasuries | 693,608 | 0.3 | ||||||
Other3 | 1,937,436 | 0.7 | ||||||
Short-Term Investments | 3,533,841 | 1.4 | ||||||
|
|
|
| |||||
Total Investments | $ | 256,851,420 | 100.0 | % | ||||
| 1 | Long-term investments. Table shown includes investments of Underlying Portfolios. |
| 2 | The Portfolio’s security type breakdown is expressed as a percentage of total investments (excluding security lending collateral) and may vary over time. The Portfolio also enters into derivative transactions, which may be used for hedging or investment purposes (see “Portfolio of Investments” section of the report for additional details). Table shown includes investments of Underlying Portfolios. |
| 3 | “Other” represents less than 0.2% weightings in the following security types: Asset-Backed Securities, Emerging Markets—Corporate Bonds, Equity Linked Notes, Governments—Sovereign Bonds, Investment Companies, Preferred Stocks, Rights and Supranationals. |
7
| BALANCED WEALTH STRATEGY PORTFOLIO | ||
| COUNTRY BREAKDOWN1 | ||
| December 31, 2019 (unaudited) | AB Variable Products Series Fund | |
| COUNTRY | U.S. $ VALUE | PERCENT OF TOTAL INVESTMENTS | ||||||
United States | $ | 130,264,739 | 50.7 | % | ||||
Japan | 18,212,833 | 7.1 | ||||||
United Kingdom | 13,024,433 | 5.1 | ||||||
Netherlands | 7,695,631 | 3.0 | ||||||
Italy | 7,298,029 | 2.8 | ||||||
China | 7,060,264 | 2.7 | ||||||
Switzerland | 6,861,441 | 2.7 | ||||||
France | 6,048,410 | 2.4 | ||||||
Spain | 4,400,867 | 1.7 | ||||||
Germany | 4,380,433 | 1.7 | ||||||
Australia | 3,859,591 | 1.5 | ||||||
Canada | 3,377,401 | 1.3 | ||||||
Sweden | 3,216,996 | 1.3 | ||||||
Other | 37,616,511 | 14.6 | ||||||
Short-Term Investments | 3,533,841 | 1.4 | ||||||
|
|
|
| |||||
Total Investments | $ | 256,851,420 | 100.0 | % | ||||
| 1 | All data are as of December 31, 2019. The Portfolio’s country breakdown is expressed as a percentage of total investments (excluding security lending collateral) and may vary over time. Table shown includes investments of Underlying Portfolios. “Other” country weightings represent 1.2% or less in the following: Angola, Argentina, Austria, Bahrain, Belgium, Bermuda, Brazil, Cayman Islands, Chile, Colombia, Denmark, Dominican Republic, Egypt, Finland, Georgia, Greece, Hong Kong, Hungary, India, Indonesia, Ireland, Israel, Jordan, Kazakhstan, Kenya, Kuwait, Luxembourg, Malaysia, Malta, Mexico, New Zealand, Nigeria, Norway, Philippines, Poland, Portugal, Russia, Saudi Arabia, Singapore, South Africa, South Korea, Sri Lanka, Supranational, Taiwan, Thailand, Turkey, United Arab Emirates and Vietnam. |
8
| BALANCED WEALTH STRATEGY PORTFOLIO | ||
| PORTFOLIO OF INVESTMENTS | ||
| December 31, 2019 | AB Variable Products Series Fund | |
| Company | Shares | U.S. $ Value | ||||||
COMMON STOCKS–38.9% | ||||||||
INFORMATION TECHNOLOGY–7.2% | ||||||||
COMMUNICATIONS EQUIPMENT–0.5% | ||||||||
Cisco Systems, Inc. | 19,643 | $ | 942,078 | |||||
F5 Networks, Inc.(a) | 2,539 | 354,572 | ||||||
|
| |||||||
| 1,296,650 | ||||||||
|
| |||||||
ELECTRONIC EQUIPMENT, INSTRUMENTS & COMPONENTS–0.2% | ||||||||
CDW Corp./DE | 3,684 | 526,223 | ||||||
Hitachi Ltd. | 900 | 37,976 | ||||||
|
| |||||||
| 564,199 | ||||||||
|
| |||||||
IT SERVICES–1.5% | ||||||||
Accenture PLC–Class A | 440 | 92,651 | ||||||
Automatic Data Processing, Inc. | 3,615 | 616,358 | ||||||
CGI, Inc.(a) | 377 | 31,549 | ||||||
Fidelity National Information Services, Inc. | 4,214 | 586,125 | ||||||
Paychex, Inc. | 786 | 66,857 | ||||||
PayPal Holdings, Inc.(a) | 6,008 | 649,886 | ||||||
VeriSign, Inc.(a) | 277 | 53,372 | ||||||
Visa, Inc.–Class A | 9,156 | 1,720,412 | ||||||
|
| |||||||
| 3,817,210 | ||||||||
|
| |||||||
SEMICONDUCTORS & SEMICONDUCTOR EQUIPMENT–1.2% | ||||||||
Broadcom, Inc. | 2,731 | 863,051 | ||||||
Intel Corp. | 7,841 | 469,284 | ||||||
Lam Research Corp. | 264 | 77,193 | ||||||
Micron Technology, Inc.(a) | 1,570 | 84,434 | ||||||
QUALCOMM, Inc. | 429 | 37,851 | ||||||
STMicroelectronics NV | 1,541 | 41,577 | ||||||
Texas Instruments, Inc. | 8,292 | 1,063,781 | ||||||
Tokyo Electron Ltd. | 200 | 43,666 | ||||||
Xilinx, Inc. | 2,692 | 263,197 | ||||||
|
| |||||||
| 2,944,034 | ||||||||
|
| |||||||
SOFTWARE–2.6% | ||||||||
Adobe, Inc.(a) | 1,166 | 384,558 | ||||||
Cadence Design Systems, Inc.(a) | 880 | 61,037 | ||||||
Check Point Software Technologies Ltd.(a)(b) | 4,087 | 453,494 | ||||||
Citrix Systems, Inc. | 3,496 | 387,706 | ||||||
Constellation Software, Inc./Canada | 18 | 17,482 | ||||||
Intuit, Inc. | 273 | 71,507 | ||||||
Microsoft Corp. | 28,225 | 4,451,082 | ||||||
Oracle Corp. | 13,779 | 730,011 | ||||||
ServiceNow, Inc.(a) | 287 | 81,026 | ||||||
Trend Micro, Inc./Japan | 600 | 30,702 | ||||||
VMware, Inc.–Class A(a)(b) | 286 | 43,412 | ||||||
|
| |||||||
| 6,712,017 | ||||||||
|
| |||||||
TECHNOLOGY HARDWARE, STORAGE & | ||||||||
Apple, Inc. | 10,262 | $ | 3,013,436 | |||||
|
| |||||||
| 18,347,546 | ||||||||
|
| |||||||
FINANCIALS–5.2% | ||||||||
BANKS–2.7% | ||||||||
Bank of America Corp. | 50,236 | 1,769,312 | ||||||
Barclays PLC | 9,306 | 22,190 | ||||||
Canadian Imperial Bank of Commerce | 384 | 31,955 | ||||||
Citigroup, Inc. | 16,253 | 1,298,452 | ||||||
Japan Post Bank Co., Ltd. | 3,000 | 28,784 | ||||||
JPMorgan Chase & Co. | 12,007 | 1,673,775 | ||||||
Mizuho Financial Group, Inc. | 17,400 | 26,803 | ||||||
National Bank of Canada | 210 | 11,657 | ||||||
PNC Financial Services Group, Inc. (The) | 3,674 | 586,481 | ||||||
Societe Generale SA | 1,237 | 43,169 | ||||||
Wells Fargo & Co. | 29,211 | 1,571,552 | ||||||
|
| |||||||
| 7,064,130 | ||||||||
|
| |||||||
CAPITAL MARKETS–0.6% | ||||||||
Amundi SA(c) | 105 | 8,257 | ||||||
CI Financial Corp. | 1,658 | 27,720 | ||||||
Franklin Resources, Inc. | 1,240 | 32,215 | ||||||
Goldman Sachs Group, Inc. (The) | 4,820 | 1,108,262 | ||||||
Moody’s Corp. | 326 | 77,396 | ||||||
Morgan Stanley | 518 | 26,480 | ||||||
Nomura Holdings, Inc. | 1,000 | 5,146 | ||||||
S&P Global, Inc. | 269 | 73,450 | ||||||
Singapore Exchange Ltd. | 3,100 | 20,417 | ||||||
T. Rowe Price Group, Inc. | 577 | 70,302 | ||||||
|
| |||||||
| 1,449,645 | ||||||||
|
| |||||||
CONSUMER FINANCE–0.2% | ||||||||
Synchrony Financial | 15,983 | 575,548 | ||||||
|
| |||||||
DIVERSIFIED FINANCIAL SERVICES–0.6% | ||||||||
Berkshire Hathaway, Inc.–Class B(a) | 6,581 | 1,490,596 | ||||||
M&G PLC(a) | 6,781 | 21,306 | ||||||
|
| |||||||
| 1,511,902 | ||||||||
|
| |||||||
INSURANCE–1.1% | ||||||||
AIA Group Ltd. | 600 | 6,311 | ||||||
Everest Re Group Ltd. | 1,651 | 457,063 | ||||||
Fidelity National Financial, Inc. | 11,844 | 537,125 | ||||||
iA Financial Corp., Inc. | 539 | 29,608 | ||||||
Japan Post Holdings Co., Ltd. | 3,300 | 31,035 | ||||||
Legal & General Group PLC | 5,797 | 23,287 | ||||||
Manulife Financial Corp. | 1,688 | 34,266 | ||||||
MetLife, Inc. | 1,453 | 74,059 | ||||||
Progressive Corp. (The) | 14,506 | 1,050,089 | ||||||
Reinsurance Group of America, Inc.–Class A | 3,000 | 489,180 | ||||||
Sun Life Financial, Inc. | 682 | 31,097 | ||||||
|
| |||||||
| 2,763,120 | ||||||||
|
| |||||||
| 13,364,345 | ||||||||
|
| |||||||
9
| BALANCED WEALTH STRATEGY PORTFOLIO | ||
| PORTFOLIO OF INVESTMENTS | ||
| (continued) | AB Variable Products Series Fund | |
| Company | Shares | U.S. $ Value | ||||||
HEALTH CARE–5.0% | ||||||||
BIOTECHNOLOGY–0.7% | ||||||||
Alexion Pharmaceuticals, Inc.(a) | 60 | $ | 6,489 | |||||
Amgen, Inc. | 156 | 37,607 | ||||||
Gilead Sciences, Inc. | 6,923 | 449,856 | ||||||
Incyte Corp.(a) | 278 | 24,275 | ||||||
Regeneron Pharmaceuticals, Inc.(a) | 1,316 | 494,132 | ||||||
Vertex Pharmaceuticals, Inc.(a) | 3,378 | 739,613 | ||||||
|
| |||||||
| 1,751,972 | ||||||||
|
| |||||||
HEALTH CARE EQUIPMENT & SUPPLIES–0.7% | ||||||||
Baxter International, Inc. | 884 | 73,920 | ||||||
Cochlear Ltd. | 168 | 26,478 | ||||||
Coloplast A/S–Class B | 288 | 35,730 | ||||||
Edwards Lifesciences Corp.(a) | 3,073 | 716,900 | ||||||
Hoya Corp. | 300 | 28,639 | ||||||
Medtronic PLC | 7,170 | 813,436 | ||||||
Stryker Corp. | 380 | 79,777 | ||||||
|
| |||||||
| 1,774,880 | ||||||||
|
| |||||||
HEALTH CARE PROVIDERS & SERVICES–1.1% | ||||||||
Anthem, Inc. | 3,066 | 926,024 | ||||||
Centene Corp.(a)(b) | 204 | 12,825 | ||||||
UnitedHealth Group, Inc. | 6,611 | 1,943,502 | ||||||
|
| |||||||
| 2,882,351 | ||||||||
|
| |||||||
HEALTH CARE TECHNOLOGY–0.1% | ||||||||
Cerner Corp. | 1,012 | 74,271 | ||||||
Veeva Systems, Inc.–Class A(a) | 405 | 56,967 | ||||||
|
| |||||||
| 131,238 | ||||||||
|
| |||||||
LIFE SCIENCES TOOLS & SERVICES–0.0% | ||||||||
Sartorius Stedim Biotech | 185 | 30,708 | ||||||
|
| |||||||
PHARMACEUTICALS–2.4% | ||||||||
Astellas Pharma, Inc. | 2,200 | 37,554 | ||||||
Bristol-Myers Squibb Co. | 486 | 31,196 | ||||||
Eli Lilly & Co. | 198 | 26,023 | ||||||
GlaxoSmithKline PLC | 321 | 7,542 | ||||||
Johnson & Johnson | 8,181 | 1,193,363 | ||||||
Merck & Co., Inc. | 11,987 | 1,090,218 | ||||||
Novartis AG | 41 | 3,882 | ||||||
Novo Nordisk A/S (Sponsored ADR) | 8,597 | 497,594 | ||||||
Novo Nordisk A/S–Class B | 894 | 51,806 | ||||||
Pfizer, Inc. | 29,578 | 1,158,866 | ||||||
Roche Holding AG | 237 | 77,026 | ||||||
Roche Holding AG (Sponsored ADR) | 28,210 | 1,147,019 | ||||||
Shionogi & Co., Ltd. | 400 | 24,745 | ||||||
UCB SA | 408 | 32,466 | ||||||
Zoetis, Inc. | 6,802 | 900,245 | ||||||
|
| |||||||
| 6,279,545 | ||||||||
|
| |||||||
| 12,850,694 | ||||||||
|
| |||||||
REAL ESTATE–4.3% | ||||||||
DIVERSIFIED REAL ESTATE ACTIVITIES–0.2% | ||||||||
City Developments Ltd. | 5,800 | $ | 47,205 | |||||
Mitsubishi Estate Co., Ltd. | 3,300 | 63,145 | ||||||
Mitsui Fudosan Co., Ltd. | 6,800 | 166,191 | ||||||
Sun Hung Kai Properties Ltd. | 7,500 | 114,862 | ||||||
Tokyu Fudosan Holdings Corp. | 6,500 | 44,885 | ||||||
UOL Group Ltd. | 7,700 | 47,655 | ||||||
|
| |||||||
| 483,943 | ||||||||
|
| |||||||
DIVERSIFIED REITS–0.3% | ||||||||
Alexander & Baldwin, Inc. | 1,650 | 34,584 | ||||||
Armada Hoffler Properties, Inc. | 2,252 | 41,324 | ||||||
Essential Properties Realty Trust, Inc. | 2,614 | 64,853 | ||||||
Fibra Uno Administracion SA de CV | 13,590 | 21,045 | ||||||
GPT Group (The) | 25,027 | 98,583 | ||||||
Hulic Reit, Inc. | 46 | 83,486 | ||||||
ICADE | 800 | 87,110 | ||||||
Kenedix Office Investment Corp.–Class A | 6 | 46,358 | ||||||
Land Securities Group PLC | 3,310 | 43,449 | ||||||
Merlin Properties Socimi SA | 3,434 | 49,358 | ||||||
Mirvac Group | 30,588 | 68,465 | ||||||
NIPPON REIT Investment Corp. | 6 | 26,396 | ||||||
United Urban Investment Corp. | 21 | 39,439 | ||||||
|
| |||||||
| 704,450 | ||||||||
|
| |||||||
EQUITY REAL ESTATE INVESTMENT TRUSTS (REITS)–0.9% | ||||||||
CubeSmart | 19,605 | 617,166 | ||||||
Host Hotels & Resorts, Inc. | 162 | 3,005 | ||||||
Link REIT | 12,768 | 135,264 | ||||||
Mid-America Apartment Communities, Inc. | 9,229 | 1,216,936 | ||||||
Regency Centers Corp. | 7,037 | 443,964 | ||||||
Stockland | 4,037 | 13,098 | ||||||
|
| |||||||
| 2,429,433 | ||||||||
|
| |||||||
HEALTH CARE REITS–0.3% | ||||||||
Assura PLC | 57,950 | 59,720 | ||||||
Healthpeak Properties, Inc. | 4,618 | 159,182 | ||||||
Medical Properties Trust, Inc. | 6,460 | 136,371 | ||||||
Omega Healthcare Investors, Inc. | 3,081 | 130,480 | ||||||
Physicians Realty Trust | 4,473 | 84,719 | ||||||
Welltower, Inc. | 2,630 | 215,081 | ||||||
|
| |||||||
| 785,553 | ||||||||
|
| |||||||
HOTEL & RESORT REITS–0.1% | ||||||||
Japan Hotel REIT Investment Corp. | 54 | 40,355 | ||||||
Park Hotels & Resorts, Inc. | 4,581 | 118,510 | ||||||
RLJ Lodging Trust | 5,826 | 103,237 | ||||||
|
| |||||||
| 262,102 | ||||||||
|
| |||||||
10
| AB Variable Products Series Fund | ||
| Company | Shares | U.S. $ Value | ||||||
INDUSTRIAL REITS–0.4% | ||||||||
Americold Realty Trust | 4,027 | $ | 141,187 | |||||
Dream Industrial Real Estate Investment Trust | 4,045 | 40,931 | ||||||
Mitsui Fudosan Logistics Park, Inc. | 8 | 35,525 | ||||||
Nippon Prologis REIT, Inc. | 23 | 58,579 | ||||||
Prologis, Inc. | 3,768 | 335,880 | ||||||
Rexford Industrial Realty, Inc. | 1,301 | 59,417 | ||||||
Segro PLC | 8,426 | 100,332 | ||||||
STAG Industrial, Inc. | 3,309 | 104,465 | ||||||
Tritax Big Box REIT PLC | 29,120 | 57,464 | ||||||
|
| |||||||
| 933,780 | ||||||||
|
| |||||||
OFFICE REITS–0.5% | ||||||||
Alexandria Real Estate Equities, Inc. | 1,127 | 182,101 | ||||||
Allied Properties Real Estate Investment Trust | 1,685 | 67,566 | ||||||
Boston Properties, Inc. | 1,315 | 181,286 | ||||||
CapitaLand Commercial Trust | 49,000 | 72,569 | ||||||
City Office REIT, Inc. | 2,980 | 40,290 | ||||||
Cousins Properties, Inc. | 3,742 | 154,170 | ||||||
Daiwa Office Investment Corp. | 6 | 46,075 | ||||||
Easterly Government Properties, Inc. | 2,200 | 52,206 | ||||||
Great Portland Estates PLC | 4,570 | 52,161 | ||||||
Inmobiliaria Colonial Socimi SA | 4,988 | 63,663 | ||||||
Invesco OfficeJ-Reit, Inc. | 214 | 44,328 | ||||||
Japan Real Estate Investment Corp. | 7 | 46,455 | ||||||
Kilroy Realty Corp. | 1,309 | 109,825 | ||||||
Mori Hills REIT Investment Corp. | 42 | 69,805 | ||||||
|
| |||||||
| 1,182,500 | ||||||||
|
| |||||||
REAL ESTATE DEVELOPMENT–0.1% | ||||||||
CIFI Holdings Group Co., Ltd. | 46,000 | 38,895 | ||||||
CK Asset Holdings Ltd. | 22,000 | 158,757 | ||||||
Instone Real Estate Group AG(a)(c) | 2,310 | 57,134 | ||||||
|
| |||||||
| 254,786 | ||||||||
|
| |||||||
REAL ESTATE MANAGEMENT & DEVELOPMENT–0.3% | ||||||||
Aroundtown SA | 9,673 | 86,881 | ||||||
CBRE Group, Inc.–Class A(a) | 12,050 | 738,544 | ||||||
Daito Trust Construction Co., Ltd. | 200 | 24,715 | ||||||
|
| |||||||
| 850,140 | ||||||||
|
| |||||||
REAL ESTATE OPERATING COMPANIES–0.3% | ||||||||
ADO Properties SA(c) | 1,106 | 39,823 | ||||||
Azrieli Group Ltd. | 471 | 34,502 | ||||||
CA Immobilien Anlagen AG | 1,868 | 78,470 | ||||||
Entra ASA(c) | 3,440 | 56,870 | ||||||
Fabege AB | 6,792 | 112,823 | ||||||
Swire Properties Ltd. | 16,000 | 53,006 | ||||||
TLG Immobilien AG | 3,235 | $ | 103,236 | |||||
Vonovia SE | 3,753 | 201,571 | ||||||
Wharf Real Estate Investment Co., Ltd. | 16,000 | 97,625 | ||||||
Wihlborgs Fastigheter AB | 3,320 | 61,054 | ||||||
|
| |||||||
| 838,980 | ||||||||
|
| |||||||
REAL ESTATE SERVICES–0.0% | ||||||||
Unibail-Rodamco-Westfield | 787 | 124,163 | ||||||
|
| |||||||
RESIDENTIAL REITS–0.4% | ||||||||
American Campus Communities, Inc. | 1,958 | 92,085 | ||||||
American Homes 4 Rent–Class A | 4,963 | 130,080 | ||||||
Bluerock Residential Growth REIT, Inc. | 1,800 | 21,690 | ||||||
Camden Property Trust | 872 | 92,519 | ||||||
Comforia Residential REIT, Inc. | 10 | 31,660 | ||||||
Essex Property Trust, Inc. | 544 | 163,668 | ||||||
Independence Realty Trust, Inc. | 5,997 | 84,438 | ||||||
Japan Rental Housing Investments, Inc. | 36 | 35,220 | ||||||
Killam Apartment Real Estate Investment Trust | 6,391 | 93,216 | ||||||
Northview Apartment Real Estate Investment Trust | 1,815 | 41,428 | ||||||
Sun Communities, Inc. | 958 | 143,796 | ||||||
UNITE Group PLC (The) | 3,450 | 57,580 | ||||||
|
| |||||||
| 987,380 | ||||||||
|
| |||||||
RETAIL REITS–0.3% | ||||||||
AEON REIT Investment Corp. | 13 | 17,800 | ||||||
Agree Realty Corp. | 988 | 69,328 | ||||||
Brixmor Property Group, Inc. | 5,954 | 128,666 | ||||||
Japan Retail Fund Investment Corp. | 12 | 25,823 | ||||||
Realty Income Corp. | 2,740 | 201,746 | ||||||
Retail Properties of America, Inc.–Class A | 7,680 | 102,912 | ||||||
Simon Property Group, Inc. | 539 | 80,290 | ||||||
SITE Centers Corp. | 4,965 | 69,609 | ||||||
Vicinity Centres | 35,060 | 61,322 | ||||||
|
| |||||||
| 757,496 | ||||||||
|
| |||||||
SPECIALIZED REITS–0.2% | ||||||||
Digital Realty Trust, Inc.(b) | 1,520 | 182,005 | ||||||
MGM Growth Properties LLC–Class A | 2,730 | 84,548 | ||||||
National Storage Affiliates Trust | 3,512 | 118,073 | ||||||
Public Storage | 190 | 40,462 | ||||||
Safestore Holdings PLC | 3,520 | 37,581 | ||||||
|
| |||||||
| 462,669 | ||||||||
|
| |||||||
| 11,057,375 | ||||||||
|
| |||||||
COMMUNICATION SERVICES–3.9% | ||||||||
DIVERSIFIED TELECOMMUNICATION SERVICES–1.1% | ||||||||
Comcast Corp.–Class A | 35,298 | 1,587,351 | ||||||
11
| BALANCED WEALTH STRATEGY PORTFOLIO | ||
| PORTFOLIO OF INVESTMENTS | ||
| (continued) | AB Variable Products Series Fund | |
| Company | Shares | U.S. $ Value | ||||||
Elisa Oyj | 656 | $ | 36,240 | |||||
Eutelsat Communications SA | 622 | 10,110 | ||||||
Quebecor, Inc.–Class B | 245 | 6,252 | ||||||
Telecom Italia SpA/Milano(a) | 39,769 | 24,836 | ||||||
Telecom Italia SpA/Milano (Savings Shares) | 60,987 | 37,349 | ||||||
Telenor ASA | 1,723 | 30,886 | ||||||
Verizon Communications, Inc. | 17,773 | 1,091,263 | ||||||
|
| |||||||
| 2,824,287 | ||||||||
|
| |||||||
ENTERTAINMENT–0.5% | ||||||||
Activision Blizzard, Inc. | 474 | 28,165 | ||||||
Electronic Arts, Inc.(a) | 6,512 | 700,105 | ||||||
Walt Disney Co. (The) | 4,291 | 620,607 | ||||||
|
| |||||||
| 1,348,877 | ||||||||
|
| |||||||
INTERACTIVE MEDIA & SERVICES–2.3% | ||||||||
Alphabet, Inc.–Class A(a) | 32 | 42,861 | ||||||
Alphabet, Inc.–Class C(a) | 2,558 | 3,420,097 | ||||||
Facebook, Inc.–Class A(a) | 11,206 | 2,300,031 | ||||||
|
| |||||||
| 5,762,989 | ||||||||
|
| |||||||
| 9,936,153 | ||||||||
|
| |||||||
CONSUMER DISCRETIONARY–3.7% | ||||||||
AUTO COMPONENTS–0.3% | ||||||||
Magna International, Inc.–Class A (Canada) | 532 | 29,170 | ||||||
Magna International, Inc.–Class A (United States) | 13,624 | 747,140 | ||||||
|
| |||||||
| 776,310 | ||||||||
|
| |||||||
AUTOMOBILES–0.0% | ||||||||
Fiat Chrysler Automobiles NV | 2,329 | 34,531 | ||||||
Ford Motor Co. | 5,309 | 49,374 | ||||||
Nissan Motor Co., Ltd. | 3,000 | 17,384 | ||||||
|
| |||||||
| 101,289 | ||||||||
|
| |||||||
HOTELS, RESTAURANTS & LEISURE–0.3% | ||||||||
Aristocrat Leisure Ltd. | 1,362 | 32,183 | ||||||
Carnival Corp. | 447 | 22,721 | ||||||
Compass Group PLC | 403 | 10,100 | ||||||
Starbucks Corp. | 7,673 | 674,610 | ||||||
Whitbread PLC | 53 | 3,401 | ||||||
|
| |||||||
| 743,015 | ||||||||
|
| |||||||
HOUSEHOLD DURABLES–0.1% | ||||||||
Lennar Corp.–Class A | 1,931 | 107,731 | ||||||
NVR, Inc.(a) | 18 | 68,551 | ||||||
Panasonic Corp. | 3,200 | 30,013 | ||||||
|
| |||||||
| 206,295 | ||||||||
|
| |||||||
INTERNET & DIRECT MARKETING RETAIL–0.8% | ||||||||
Amazon.com, Inc.(a) | 559 | 1,032,943 | ||||||
Booking Holdings, Inc.(a) | 453 | 930,340 | ||||||
eBay, Inc. | 1,249 | 45,101 | ||||||
|
| |||||||
| 2,008,384 | ||||||||
|
| |||||||
MULTILINE RETAIL–0.2% | ||||||||
Dollar General Corp. | 3,818 | $ | 595,531 | |||||
Next PLC | 562 | 52,369 | ||||||
|
| |||||||
| 647,900 | ||||||||
|
| |||||||
SPECIALTY RETAIL–1.6% | ||||||||
AutoZone, Inc.(a) | 805 | 959,004 | ||||||
Hennes & Mauritz AB–Class B | 1,909 | 38,939 | ||||||
Home Depot, Inc. (The) | 6,331 | 1,382,564 | ||||||
Industria de Diseno Textil SA | 1,349 | 47,674 | ||||||
O’Reilly Automotive, Inc.(a) | 160 | 70,122 | ||||||
Ross Stores, Inc. | 4,868 | 566,733 | ||||||
TJX Cos., Inc. (The) | 15,885 | 969,938 | ||||||
|
| |||||||
| 4,034,974 | ||||||||
|
| |||||||
TEXTILES, APPAREL & LUXURY GOODS–0.4% | ||||||||
adidas AG | 104 | 33,807 | ||||||
Hermes International | 21 | 15,731 | ||||||
NIKE, Inc.–Class B | 9,082 | 920,098 | ||||||
Yue Yuen Industrial Holdings Ltd. | 7,000 | 20,659 | ||||||
|
| |||||||
| 990,295 | ||||||||
|
| |||||||
| 9,508,462 | ||||||||
|
| |||||||
ENERGY–3.3% | ||||||||
OIL, GAS & CONSUMABLE FUELS–3.3% | ||||||||
Aker BP ASA | 2,770 | 90,912 | ||||||
BP PLC | 76,410 | 480,680 | ||||||
Chevron Corp. | 12,889 | 1,553,254 | ||||||
Continental Resources, Inc./OK | 2,940 | 100,842 | ||||||
Enbridge, Inc. | 220 | 8,747 | ||||||
EOG Resources, Inc. | 13,969 | 1,170,043 | ||||||
Exxon Mobil Corp. | 8,338 | 581,826 | ||||||
Imperial Oil Ltd. | 721 | 19,072 | ||||||
Inpex Corp. | 6,100 | 63,194 | ||||||
JXTG Holdings, Inc. | 23,700 | 107,564 | ||||||
LUKOIL PJSC (Sponsored ADR)(b) | 1,250 | 123,388 | ||||||
Motor Oil Hellas Corinth Refineries SA | 3,030 | 70,129 | ||||||
OMV AG | 100 | 5,603 | ||||||
PetroChina Co., Ltd.–Class H | 458,000 | 230,555 | ||||||
Petroleo Brasileiro SA (Preference Shares) | 41,500 | 313,451 | ||||||
Phillips 66 | 3,922 | 436,950 | ||||||
Repsol SA | 16,671 | 261,904 | ||||||
Royal Dutch Shell PLC (Sponsored ADR)(b) | 17,462 | 1,047,196 | ||||||
Royal Dutch Shell | 316 | 9,358 | ||||||
Royal Dutch Shell | 35,660 | 1,058,520 | ||||||
S-Oil Corp. | 864 | 70,962 | ||||||
TC Energy Corp. | 675 | 35,950 | ||||||
TOTAL SA | 8,310 | 461,126 | ||||||
12
| AB Variable Products Series Fund | ||
| Company | Shares | U.S. $ Value | ||||||
Tupras Turkiye Petrol Rafinerileri AS | 2,750 | $ | 58,595 | |||||
Valero Energy Corp. | 253 | 23,693 | ||||||
|
| |||||||
| 8,383,514 | ||||||||
|
| |||||||
CONSUMER STAPLES–2.2% | ||||||||
BEVERAGES–0.5% | ||||||||
Coca-Cola Amatil Ltd. | 3,771 | 29,284 | ||||||
Coca-Cola Bottlers Japan Holdings, Inc. | 200 | 5,110 | ||||||
Monster Beverage Corp.(a) | 419 | 26,628 | ||||||
PepsiCo, Inc. | 8,911 | 1,217,866 | ||||||
|
| |||||||
| 1,278,888 | ||||||||
|
| |||||||
FOOD & STAPLES RETAILING–0.9% | ||||||||
Alimentation Couche-Tard, Inc.–Class B | 351 | 11,139 | ||||||
Casino Guichard Perrachon SA | 679 | 31,760 | ||||||
Costco Wholesale Corp. | 1,793 | 526,999 | ||||||
Empire Co., Ltd.–Class A | 515 | 12,080 | ||||||
Koninklijke Ahold Delhaize NV | 1,503 | 37,684 | ||||||
Metro, Inc./CN | 375 | 15,476 | ||||||
Sysco Corp. | 99 | 8,469 | ||||||
US Foods Holding Corp.(a) | 9,730 | 407,590 | ||||||
Walmart, Inc. | 9,591 | 1,139,794 | ||||||
Woolworths Group Ltd. | 1,261 | 31,983 | ||||||
|
| |||||||
| 2,222,974 | ||||||||
|
| |||||||
FOOD PRODUCTS–0.2% | ||||||||
Hershey Co. (The) | 425 | 62,466 | ||||||
JBS SA | 27,300 | 175,779 | ||||||
Mowi ASA | 4,390 | 114,144 | ||||||
Nestle SA | 487 | 52,725 | ||||||
Tyson Foods, Inc.–Class A | 440 | 40,058 | ||||||
|
| |||||||
| 445,172 | ||||||||
|
| |||||||
HOUSEHOLD PRODUCTS–0.4% | ||||||||
Procter & Gamble Co. (The) | 9,142 | 1,141,836 | ||||||
|
| |||||||
PERSONAL PRODUCTS–0.0% | ||||||||
Unilever NV | 802 | 46,028 | ||||||
Unilever PLC | 899 | 51,461 | ||||||
|
| |||||||
| 97,489 | ||||||||
|
| |||||||
TOBACCO–0.2% | ||||||||
Altria Group, Inc. | 8,344 | 416,449 | ||||||
|
| |||||||
| 5,602,808 | ||||||||
|
| |||||||
INDUSTRIALS–2.0% | ||||||||
AEROSPACE & DEFENSE–0.6% | ||||||||
BAE Systems PLC | 6,260 | 46,871 | ||||||
Boeing Co. (The) | 1,857 | 604,936 | ||||||
Raytheon Co. | 3,426 | 752,829 | ||||||
|
| |||||||
| 1,404,636 | ||||||||
|
| |||||||
AIR FREIGHT & LOGISTICS–0.1% | ||||||||
Expeditors International of Washington, Inc. | 815 | 63,586 | ||||||
| Company | Shares | U.S. $ Value | ||||||
Kuehne & Nagel International AG | 219 | $ | 36,938 | |||||
SG Holdings Co., Ltd. | 400 | 9,010 | ||||||
|
| |||||||
| 109,534 | ||||||||
|
| |||||||
AIRLINES–0.3% | ||||||||
Air Canada(a) | 743 | 27,756 | ||||||
Delta Air Lines, Inc. | 12,613 | 737,608 | ||||||
Japan Airlines Co., Ltd. | 400 | 12,455 | ||||||
|
| |||||||
| 777,819 | ||||||||
|
| |||||||
BUILDING PRODUCTS–0.0% | ||||||||
Cie de Saint-Gobain | 685 | 28,062 | ||||||
|
| |||||||
COMMERCIAL SERVICES & SUPPLIES–0.0% | ||||||||
Copart, Inc.(a) | 799 | 72,661 | ||||||
|
| |||||||
ELECTRICAL EQUIPMENT–0.2% | ||||||||
Acuity Brands, Inc. | 523 | 72,174 | ||||||
Eaton Corp. PLC | 5,023 | 475,779 | ||||||
Legrand SA | 478 | 39,035 | ||||||
|
| |||||||
| 586,988 | ||||||||
|
| |||||||
INDUSTRIAL CONGLOMERATES–0.4% | ||||||||
Honeywell International, Inc. | 5,686 | 1,006,422 | ||||||
Toshiba Corp. | 1,000 | 33,942 | ||||||
|
| |||||||
| 1,040,364 | ||||||||
|
| |||||||
MACHINERY–0.0% | ||||||||
Atlas Copco AB–Class A | 393 | 15,687 | ||||||
Cummins, Inc. | 187 | 33,465 | ||||||
|
| |||||||
| 49,152 | ||||||||
|
| |||||||
MARINE–0.0% | ||||||||
Mitsui OSK Lines Ltd. | 700 | 19,250 | ||||||
|
| |||||||
PROFESSIONAL SERVICES–0.1% | ||||||||
Adecco Group AG | 616 | 38,945 | ||||||
CoStar Group, Inc.(a) | 49 | 29,317 | ||||||
ManpowerGroup, Inc. | 698 | 67,776 | ||||||
Randstad NV | 197 | 12,071 | ||||||
Thomson Reuters Corp. | 432 | 30,902 | ||||||
Wolters Kluwer NV | 501 | 36,581 | ||||||
|
| |||||||
| 215,592 | ||||||||
|
| |||||||
ROAD & RAIL–0.3% | ||||||||
Central Japan Railway Co. | 200 | 40,214 | ||||||
Nippon Express Co., Ltd. | 500 | 29,309 | ||||||
Norfolk Southern Corp. | 3,227 | 626,458 | ||||||
|
| |||||||
| 695,981 | ||||||||
|
| |||||||
TRADING COMPANIES & DISTRIBUTORS–0.0% | ||||||||
AerCap Holdings NV(a) | 1,091 | 67,064 | ||||||
|
| |||||||
TRANSPORTATION INFRASTRUCTURE–0.0% | ||||||||
Aena SME SA(c) | 95 | 18,213 | ||||||
Sydney Airport | 4,628 | 28,119 | ||||||
|
| |||||||
| 46,332 | ||||||||
|
| |||||||
| 5,113,435 | ||||||||
|
| |||||||
13
| BALANCED WEALTH STRATEGY PORTFOLIO | ||
| PORTFOLIO OF INVESTMENTS | ||
| (continued) | AB Variable Products Series Fund | |
| Company | Shares | U.S. $ Value | ||||||
MATERIALS–1.2% | ||||||||
CHEMICALS–0.3% | ||||||||
Akzo Nobel NV | 387 | $ | 39,522 | |||||
Johnson Matthey PLC | 1,552 | 61,709 | ||||||
Orbia Advance Corp. SAB de CV | 43,300 | 92,337 | ||||||
Sasol Ltd. | 2,510 | 54,456 | ||||||
Westlake Chemical Corp. | 7,552 | 529,773 | ||||||
|
| |||||||
| 777,797 | ||||||||
|
| |||||||
CONSTRUCTION MATERIALS–0.0% | ||||||||
Grupo Cementos de Chihuahua SAB de CV | 3,320 | 17,726 | ||||||
|
| |||||||
METALS & MINING–0.8% | ||||||||
Agnico Eagle Mines Ltd. | 3,197 | 196,909 | ||||||
Alcoa Corp.(a) | 7,710 | 165,842 | ||||||
AngloGold Ashanti Ltd. | 3,470 | 78,824 | ||||||
Antofagasta PLC | 7,860 | 95,167 | ||||||
APERAM SA | 2,730 | 87,696 | ||||||
ArcelorMittal SA | 5,140 | 90,565 | ||||||
BHP Group Ltd. | 170 | 4,655 | ||||||
Boliden AB | 1,990 | 52,852 | ||||||
Detour Gold Corp.(a) | 4,770 | 92,347 | ||||||
First Quantum Minerals Ltd. | 10,236 | 103,814 | ||||||
Fortescue Metals Group Ltd. | 672 | 5,066 | ||||||
Glencore PLC(a) | 87,010 | 270,924 | ||||||
Industrias Penoles SAB de CV | 2,490 | 26,078 | ||||||
Kirkland Lake Gold Ltd. | 427 | 18,822 | ||||||
Korea Zinc Co., Ltd. | 200 | 73,495 | ||||||
Lundin Mining Corp. | 10,430 | 62,329 | ||||||
MMC Norilsk Nickel PJSC (ADR)(b) | 1,300 | 39,637 | ||||||
Newcrest Mining Ltd. | 2,360 | 49,841 | ||||||
Norsk Hydro ASA | 15,090 | 56,114 | ||||||
Orocobre Ltd.(a) | 5,420 | 10,103 | ||||||
OZ Minerals Ltd. | 6,050 | 44,897 | ||||||
Polyus PJSC (GDR)(c) | 730 | 41,774 | ||||||
Rio Tinto PLC | 3,360 | 198,895 | ||||||
Sumitomo Metal Mining Co., Ltd. | 1,700 | 54,740 | ||||||
Syrah Resources Ltd.(a) | 20,610 | 6,803 | ||||||
Wheaton Precious Metals Corp. | 1,023 | 30,441 | ||||||
Yamato Kogyo Co., Ltd. | 2,800 | 70,109 | ||||||
|
| |||||||
| 2,028,739 | ||||||||
|
| |||||||
PAPER & FOREST PRODUCTS–0.1% | ||||||||
Suzano SA | 11,000 | 108,903 | ||||||
|
| |||||||
| 2,933,165 | ||||||||
|
| |||||||
UTILITIES–0.9% | ||||||||
ELECTRIC UTILITIES–0.8% | ||||||||
American Electric Power Co., Inc. | 11,429 | 1,080,155 | ||||||
Endesa SA | 790 | 21,097 | ||||||
Enel SpA | 5,914 | 46,980 | ||||||
NextEra Energy, Inc. | 2,335 | 565,443 | ||||||
PPL Corp. | 2,035 | 73,016 | ||||||
Red Electrica Corp. SA | 1,728 | 34,819 | ||||||
Terna Rete Elettrica Nazionale SpA | 5,431 | 36,322 | ||||||
|
| |||||||
| 1,857,832 | ||||||||
|
| |||||||
| Shares | U.S. $ Value | ||||||
GAS UTILITIES–0.0% | ||||||||
Snam SpA | 6,804 | $ | 35,774 | |||||
|
| |||||||
INDEPENDENT POWER AND RENEWABLE ELECTRICITY PRODUCERS–0.0% | ||||||||
Uniper SE | 481 | 15,898 | ||||||
|
| |||||||
MULTI-UTILITIES–0.1% | ||||||||
Atco Ltd./Canada–Class I | 147 | 5,634 | ||||||
CenterPoint Energy, Inc. | 1,949 | 53,149 | ||||||
Consolidated Edison, Inc. | 677 | 61,248 | ||||||
Sempra Energy | 287 | 43,475 | ||||||
Suez | 2,356 | 35,701 | ||||||
Veolia Environnement SA | 1,210 | 32,196 | ||||||
|
| |||||||
| 231,403 | ||||||||
|
| |||||||
| 2,140,907 | ||||||||
|
| |||||||
TRANSPORTATION–0.0% | ||||||||
HIGHWAYS & RAILTRACKS–0.0% | ||||||||
Transurban Group | 9,298 | 97,323 | ||||||
|
| |||||||
CAPITAL GOODS–0.0% | ||||||||
CONSTRUCTION & ENGINEERING–0.0% | ||||||||
Taisei Corp. | 1,100 | 45,563 | ||||||
|
| |||||||
CONSUMER | ||||||||
LEISURE FACILITIES–0.0% | ||||||||
Planet Fitness, Inc.(a) | 575 | 42,941 | ||||||
|
| |||||||
CONSUMER DURABLES & APPAREL–0.0% | ||||||||
HOMEBUILDING–0.0% | ||||||||
Taylor Wimpey PLC | 13,030 | 33,410 | ||||||
|
| |||||||
Total Common Stocks | 99,457,641 | |||||||
|
| |||||||
INVESTMENT COMPANIES–26.5% | ||||||||
FUNDS AND INVESTMENT TRUSTS–26.5%(d)(e) | ||||||||
AB Discovery Growth Fund, Inc.–Class Z(a) | 289,037 | 3,306,587 | ||||||
AB Trust–AB Discovery Value Fund–Class Z | 168,544 | 3,318,624 | ||||||
Bernstein Fund, Inc.–International Small Cap Portfolio–Class Z | 782,446 | 8,771,224 | ||||||
Bernstein Fund, Inc.–International Strategic Equities Portfolio–Class Z | 2,318,217 | 28,722,711 | ||||||
Bernstein Fund, Inc.–Small Cap Core Portfolio–Class Z | 281,854 | 3,311,781 | ||||||
Sanford C. Bernstein Fund, Inc.–Emerging Markets Portfolio–Class Z | 143,250 | 4,115,558 | ||||||
Sanford C. Bernstein Fund, Inc.–International Portfolio–Class Z | 957,014 | 16,144,818 | ||||||
|
| |||||||
Total Investment Companies | 67,691,303 | |||||||
|
| |||||||
14
| AB Variable Products Series Fund | ||
Principal | U.S. $ Value | |||||||||||
GOVERNMENTS– | ||||||||||||
AUSTRIA–1.0% | ||||||||||||
Republic of Austria Government Bond | EUR | 2,110 | $ | 2,522,911 | ||||||||
|
| |||||||||||
BELGIUM–0.3% | ||||||||||||
Kingdom of Belgium Government Bond | 470 | 562,922 | ||||||||||
Series 87 | 240 | 289,926 | ||||||||||
|
| |||||||||||
| 852,848 | ||||||||||||
|
| |||||||||||
FINLAND–0.4% | ||||||||||||
Finland Government Bond | 750 | 896,454 | ||||||||||
|
| |||||||||||
FRANCE–0.7% | ||||||||||||
French Republic Government Bond OAT | 814 | 1,022,670 | ||||||||||
1.50%, 5/25/50(c) | 576 | 744,641 | ||||||||||
1.75%, 6/25/39(c) | 14 | 18,305 | ||||||||||
|
| |||||||||||
| 1,785,616 | ||||||||||||
|
| |||||||||||
GERMANY–0.3% | ||||||||||||
Bundesrepublik Deutschland Bundesanleihe | 519 | 730,478 | ||||||||||
Series 2007 | 43 | 86,485 | ||||||||||
|
| |||||||||||
| 816,963 | ||||||||||||
|
| |||||||||||
INDONESIA–0.2% | ||||||||||||
Indonesia Treasury Bond | IDR | 7,722,000 | 599,070 | |||||||||
|
| |||||||||||
ITALY–1.9% | ||||||||||||
Italy Buoni Poliennali Del Tesoro | EUR | 780 | 894,087 | |||||||||
1.35%, 4/15/22 | 390 | 450,062 | ||||||||||
2.45%, 9/01/33(c) | 580 | 708,430 | ||||||||||
3.35%, 3/01/35(c) | 1,070 | 1,434,850 | ||||||||||
3.85%, 9/01/49(c) | 367 | 534,051 | ||||||||||
4.50%, 5/01/23 | 695 | 888,247 | ||||||||||
|
| |||||||||||
| 4,909,727 | ||||||||||||
|
| |||||||||||
JAPAN–1.4% | ||||||||||||
Japan Government Ten Year Bond | JPY | 76,100 | 708,892 | |||||||||
Japan Government Thirty Year Bond | 69,500 | 656,199 | ||||||||||
Principal | U.S. $ Value | |||||||||||
Series 63 | JPY | 22,750 | $ | 208,802 | ||||||||
Japan Government Twenty Year Bond | 109,750 | 1,060,652 | ||||||||||
Series 159 | 53,750 | 526,993 | ||||||||||
Series 169 | 31,650 | 292,903 | ||||||||||
|
| |||||||||||
| 3,454,441 | ||||||||||||
|
| |||||||||||
MALAYSIA–1.0% | ||||||||||||
Malaysia Government Bond | MYR | 957 | 243,139 | |||||||||
Series 0119 | 1,039 | 262,998 | ||||||||||
Series 0217 | �� | 961 | 243,201 | |||||||||
Series 0218 | 1,742 | 433,864 | ||||||||||
Series 0219 | 3,007 | 769,130 | ||||||||||
Series 0310 | 1,088 | 288,437 | ||||||||||
Series 0313 | 800 | 197,541 | ||||||||||
Series 0316 | 971 | 245,374 | ||||||||||
|
| |||||||||||
| 2,683,684 | ||||||||||||
|
| |||||||||||
MEXICO–0.4% | ||||||||||||
Mexican Bonos | MXN | 17,399 | 953,703 | |||||||||
|
| |||||||||||
NETHERLANDS–1.4% | ||||||||||||
Netherlands Government Bond | EUR | 1,865 | 2,132,011 | |||||||||
0.25%, 7/15/29(c) | 1,145 | 1,322,902 | ||||||||||
|
| |||||||||||
| 3,454,913 | ||||||||||||
|
| |||||||||||
RUSSIA–0.4% | ||||||||||||
Russian Federal Bond–OFZ | ||||||||||||
Series 6212 | RUB | 8,460 | 143,960 | |||||||||
Series 6215 | 23,075 | 386,863 | ||||||||||
Series 6222 | 7,590 | 128,030 | ||||||||||
Series 6227 | 23,954 | 407,478 | ||||||||||
|
| |||||||||||
| 1,066,331 | ||||||||||||
|
| |||||||||||
15
| BALANCED WEALTH STRATEGY PORTFOLIO | ||
| PORTFOLIO OF INVESTMENTS | ||
| (continued) | AB Variable Products Series Fund | |
Principal | U.S. $ Value | |||||||||||
SPAIN–0.8% | ||||||||||||
Spain Government Bond | EUR | 215 | $ | 275,918 | ||||||||
2.35%, 7/30/33(c) | 323 | 438,209 | ||||||||||
2.90%, 10/31/46(c) | 25 | 38,293 | ||||||||||
4.20%, 1/31/37(c) | 280 | 479,434 | ||||||||||
4.40%, 10/31/23(c) | 596 | 785,961 | ||||||||||
|
| |||||||||||
| 2,017,815 | ||||||||||||
|
| |||||||||||
UNITED KINGDOM–0.7% | ||||||||||||
United Kingdom Gilt | GBP | 770 | 1,037,444 | |||||||||
1.75%, 9/07/37(c) | 486 | 696,840 | ||||||||||
|
| |||||||||||
| 1,734,284 | ||||||||||||
|
| |||||||||||
Total Governments– | 27,748,760 | |||||||||||
|
| |||||||||||
CORPORATES– | ||||||||||||
INDUSTRIAL–4.1% | ||||||||||||
BASIC–0.3% | ||||||||||||
Braskem Netherlands Finance BV | U.S.$ | 200 | 199,500 | |||||||||
Eastman Chemical Co. | 84 | 88,605 | ||||||||||
Glencore Finance Europe Ltd. | EUR | 125 | 145,553 | |||||||||
SABIC Capital II BV | U.S.$ | 335 | 352,336 | |||||||||
|
| |||||||||||
| 785,994 | ||||||||||||
|
| |||||||||||
CAPITAL GOODS–0.2% | ||||||||||||
3M Co. | 135 | 130,995 | ||||||||||
General Electric Co. | EUR | 210 | 236,803 | |||||||||
Westinghouse Air Brake Technologies Corp. | U.S.$ | 67 | 71,177 | |||||||||
|
| |||||||||||
| 438,975 | ||||||||||||
|
| |||||||||||
COMMUNICATIONS– | ||||||||||||
Charter Communications Operating LLC/Charter Communications Operating Capital | 126 | 138,875 | ||||||||||
Comcast Corp. | 80 | 88,831 | ||||||||||
Fox Corp. | 215 | 245,351 | ||||||||||
Principal | U.S. $ Value | |||||||||||
ViacomCBS, Inc. | U.S.$ | 91 | $ | 93,287 | ||||||||
3.70%, 6/01/28 | 10 | 10,482 | ||||||||||
4.00%, 1/15/26 | 30 | 32,178 | ||||||||||
4.20%, 6/01/29 | 57 | 62,092 | ||||||||||
|
| |||||||||||
| 671,096 | ||||||||||||
|
| |||||||||||
COMMUNICATIONS–TELECOMMUNICATIONS–0.6% | ||||||||||||
AT&T, Inc. | EUR | 100 | 119,816 | |||||||||
4.125%, 2/17/26 | U.S.$ | 345 | 374,063 | |||||||||
4.55%, 3/09/49 | 125 | 138,815 | ||||||||||
5.50%, 3/15/27(c) | GBP | 150 | 244,363 | |||||||||
British Telecommunications PLC | U.S.$ | 105 | 161,410 | |||||||||
Sprint Spectrum Co. LLC/Sprint Spectrum Co. II LLC/Sprint Spectrum Co. III LLC | 200 | 212,096 | ||||||||||
Verizon Communications, Inc. | 110 | 131,733 | ||||||||||
Vodafone Group PLC | 171 | 180,661 | ||||||||||
| �� |
|
| ||||||||||
| 1,562,957 | ||||||||||||
|
| |||||||||||
CONSUMER CYCLICAL–AUTOMOTIVE–0.2% | ||||||||||||
General Motors Financial Co., Inc. | 128 | 138,948 | ||||||||||
Volkswagen Bank GmbH | EUR | 200 | 230,446 | |||||||||
Volkswagen Leasing GmbH | 120 | 145,895 | ||||||||||
|
| |||||||||||
| 515,289 | ||||||||||||
|
| |||||||||||
CONSUMER CYCLICAL–ENTERTAINMENT–0.1% | ||||||||||||
Carnival PLC | 200 | 222,009 | ||||||||||
|
| |||||||||||
CONSUMER CYCLICAL– | ||||||||||||
Las Vegas Sands Corp. | U.S.$ | 89 | 92,069 | |||||||||
|
| |||||||||||
CONSUMER CYCLICAL–RESTAURANTS–0.0% | ||||||||||||
Starbucks Corp. | 75 | 86,755 | ||||||||||
|
| |||||||||||
CONSUMER CYCLICAL–RETAILERS–0.0% | ||||||||||||
Lowe’s Cos., Inc. | 75 | 88,322 | ||||||||||
|
| |||||||||||
CONSUMERNON-CYCLICAL–1.0% | ||||||||||||
Altria Group, Inc. | EUR | 265 | 308,888 | |||||||||
16
| AB Variable Products Series Fund | ||
Principal | U.S. $ Value | |||||||||||
Amgen, Inc. | U.S.$ | 115 | $ | 135,384 | ||||||||
Anheuser-Busch InBev Worldwide, Inc. | 105 | 136,426 | ||||||||||
BAT Capital Corp. | 262 | 263,852 | ||||||||||
Baxter International, Inc. | EUR | 250 | 284,390 | |||||||||
CVS Health Corp. | U.S.$ | 120 | 129,053 | |||||||||
DH Europe Finance II SARL | EUR | 143 | 158,523 | |||||||||
Kraft Heinz Foods Co. | U.S.$ | 217 | 223,679 | |||||||||
3.95%, 7/15/25 | 42 | 44,304 | ||||||||||
Mylan NV | 265 | 275,486 | ||||||||||
Reynolds American, Inc. | 145 | 156,149 | ||||||||||
Tyson Foods, Inc. | 206 | 220,288 | ||||||||||
4.00%, 3/01/26 | 65 | 70,378 | ||||||||||
Unilever PLC | GBP | 170 | 227,215 | |||||||||
|
| |||||||||||
| 2,634,015 | ||||||||||||
|
| |||||||||||
ENERGY–0.6% | ||||||||||||
Baker Hughes a GE Co. LLC/Baker HughesCo-Obligor, Inc. | U.S.$ | 140 | 143,922 | |||||||||
BG Energy Capital PLC | GBP | 140 | 224,612 | |||||||||
Energy Transfer Operating LP | U.S.$ | 111 | 124,936 | |||||||||
Eni SpA | 270 | 296,160 | ||||||||||
Hess Corp. | 199 | 211,867 | ||||||||||
Husky Energy, Inc. | 6 | 6,468 | ||||||||||
Occidental Petroleum Corp. | 21 | 21,243 | ||||||||||
ONEOK, Inc. | 155 | 170,387 | ||||||||||
Plains All American Pipeline LP/PAA Finance Corp. | 232 | 239,361 | ||||||||||
|
| |||||||||||
| 1,438,956 | ||||||||||||
|
| |||||||||||
OTHER | ||||||||||||
Alfa SAB de CV | 200 | 215,938 | ||||||||||
|
| |||||||||||
SERVICES–0.1% | ||||||||||||
eBay, Inc. | 27 | 28,253 | ||||||||||
Principal | U.S. $ Value | |||||||||||
Global Payments, Inc. | U.S.$ | 45 | $ | 46,921 | ||||||||
4.00%, 6/01/23 | 83 | 87,400 | ||||||||||
IHS Markit Ltd. | 63 | 65,616 | ||||||||||
|
| |||||||||||
| 228,190 | ||||||||||||
|
| |||||||||||
TECHNOLOGY–0.5% | ||||||||||||
Broadcom Corp./Broadcom Cayman Finance Ltd. | 42 | 43,498 | ||||||||||
3.875%, 1/15/27 | 117 | 121,550 | ||||||||||
Broadcom, Inc. | 135 | 140,223 | ||||||||||
4.25%, 4/15/26(c) | 56 | 59,616 | ||||||||||
Dell International LLC/EMC Corp. | 96 | 110,836 | ||||||||||
Fidelity National Information Services, Inc. | EUR | 200 | 237,215 | |||||||||
Fiserv, Inc. | 200 | 230,940 | ||||||||||
NXP BV/NXP Funding LLC/NXP USA, Inc. | U.S.$ | 96 | 101,684 | |||||||||
Oracle Corp. | 125 | 139,520 | ||||||||||
Seagate HDD Cayman | 63 | 67,137 | ||||||||||
|
| |||||||||||
| 1,252,219 | ||||||||||||
|
| |||||||||||
TRANSPORTATION–SERVICES–0.1% | ||||||||||||
Adani Ports & Special Economic Zone Ltd. | 200 | 204,500 | ||||||||||
|
| |||||||||||
| 10,437,284 | ||||||||||||
|
| |||||||||||
FINANCIAL INSTITUTIONS–3.0% | ||||||||||||
BANKING–2.3% | ||||||||||||
ABN AMRO Bank NV | 225 | 245,000 | ||||||||||
Australia & New Zealand Banking Group Ltd. | 215 | 229,459 | ||||||||||
Banco Santander SA | 200 | 224,662 | ||||||||||
Bank of America Corp. | 77 | 87,404 | ||||||||||
Barclays Bank PLC | 44 | 53,336 | ||||||||||
Barclays PLC | GBP | 100 | 134,906 | |||||||||
CaixaBank SA | EUR | 200 | 240,777 | |||||||||
Capital One Financial Corp. | 270 | 314,389 | ||||||||||
17
| BALANCED WEALTH STRATEGY PORTFOLIO | ||
| PORTFOLIO OF INVESTMENTS | ||
| (continued) | AB Variable Products Series Fund | |
Principal | U.S. $ Value | |||||||||||
Citigroup, Inc. | GBP | 140 | $ | 184,737 | ||||||||
Cooperatieve Rabobank UA | EUR | 200 | 224,607 | |||||||||
Credit Suisse Group AG | GBP | 170 | 228,864 | |||||||||
Credit Suisse Group Funding Guernsey Ltd. | 165 | 229,686 | ||||||||||
Danske Bank A/S | U.S.$ | 350 | 354,032 | |||||||||
5.375%, 1/12/24(c) | 200 | 219,168 | ||||||||||
Goldman Sachs Group, Inc. (The) | GBP | 150 | 224,649 | |||||||||
HSBC Holdings PLC | EUR | 240 | 303,282 | |||||||||
ING Groep NV | GBP | 200 | 282,911 | |||||||||
6.50%, 4/16/25(f) | U.S.$ | 232 | 251,834 | |||||||||
JPMorgan Chase & Co. | 265 | 274,680 | ||||||||||
Series FF | 158 | 165,191 | ||||||||||
Morgan Stanley | EUR | 182 | 216,870 | |||||||||
Nationwide Building Society | U.S.$ | 290 | 302,925 | |||||||||
Nordea Bank Abp | 240 | 250,483 | ||||||||||
Santander UK PLC | 200 | 215,572 | ||||||||||
UBS Group AG | 230 | 243,800 | ||||||||||
|
| |||||||||||
| 5,703,224 | ||||||||||||
|
| |||||||||||
FINANCE–0.0% | ||||||||||||
Synchrony Financial | 25 | 26,335 | ||||||||||
4.50%, 7/23/25 | 51 | 55,122 | ||||||||||
|
| |||||||||||
| 81,457 | ||||||||||||
|
| |||||||||||
INSURANCE–0.5% | ||||||||||||
ASR Nederland NV | EUR | 210 | 282,475 | |||||||||
Caisse Nationale de Reassurance Mutuelle Agricole Groupama | 100 | 142,897 | ||||||||||
Centene Corp. | U.S.$ | 28 | 28,835 | |||||||||
4.625%, 12/15/29(c) | 37 | 38,964 | ||||||||||
Credit Agricole Assurances SA | EUR | 200 | 276,219 | |||||||||
Principal | U.S. $ Value | |||||||||||
Muenchener Rueckversicherungs-Gesellschaft AG in Muenchen | EUR | 200 | $ | 262,139 | ||||||||
Voya Financial, Inc. | U.S.$ | 145 | 154,287 | |||||||||
|
| |||||||||||
| 1,185,816 | ||||||||||||
|
| |||||||||||
REITS–0.2% | ||||||||||||
Equinix, Inc. | EUR | 115 | 133,865 | |||||||||
Host Hotels & Resorts LP | U.S.$ | 10 | 10,472 | |||||||||
Welltower, Inc. | 238 | 256,714 | ||||||||||
WPC Eurobond BV | EUR | 148 | 175,669 | |||||||||
|
| |||||||||||
| 576,720 | ||||||||||||
|
| |||||||||||
| 7,547,217 | ||||||||||||
|
| |||||||||||
UTILITY–0.2% | ||||||||||||
ELECTRIC–0.2% | ||||||||||||
Abu Dhabi National Energy Co. PJSC | U.S.$ | 250 | 269,141 | |||||||||
Enel Finance International NV | 308 | 309,152 | ||||||||||
|
| |||||||||||
| 578,293 | ||||||||||||
|
| |||||||||||
Total Corporates–Investment Grade | 18,562,794 | |||||||||||
|
| |||||||||||
INFLATION-LINKED SECURITIES–3.7% | ||||||||||||
JAPAN–1.5% | ||||||||||||
Japanese Government CPI Linked Bond | JPY | 107,988 | 1,015,721 | |||||||||
Series 22 | 112,793 | 1,065,592 | ||||||||||
Series 23 | 190,996 | 1,808,795 | ||||||||||
|
| |||||||||||
| 3,890,108 | ||||||||||||
|
| |||||||||||
UNITED STATES–2.2% | ||||||||||||
U.S. Treasury Inflation Index | U.S.$ | 3,609 | 3,630,248 | |||||||||
0.375%, 7/15/25 (TIPS) | 1,704 | 1,738,228 | ||||||||||
2.375%, 1/15/25 (TIPS) | 198 | 220,618 | ||||||||||
|
| |||||||||||
| 5,589,094 | ||||||||||||
|
| |||||||||||
Total Inflation-Linked Securities | 9,479,202 | |||||||||||
|
| |||||||||||
18
| AB Variable Products Series Fund | ||
Principal | U.S. $ Value | |||||||||||
MORTGAGE PASS-THROUGHS–3.3% | ||||||||||||
AGENCY FIXED RATE30-YEAR–3.3% | ||||||||||||
Federal Home Loan Mortgage Corp. | U.S.$ | 1,206 | $ | 1,262,123 | ||||||||
Federal Home Loan Mortgage Corp. Gold | 534 | 565,609 | ||||||||||
Series 2019 | 291 | 312,545 | ||||||||||
Federal National Mortgage Association | 541 | 570,927 | ||||||||||
Series 2013 | 261 | 275,033 | ||||||||||
4.00%, 10/01/43 | 696 | 744,679 | ||||||||||
Series 2017 | 321 | 332,893 | ||||||||||
Series 2018 | 791 | 819,867 | ||||||||||
4.00%, 8/01/48–9/01/48 | 562 | 595,427 | ||||||||||
4.50%, 9/01/48 | 614 | 657,287 | ||||||||||
Series 2019 | 634 | 660,664 | ||||||||||
Series 2020 | 1,638 | 1,685,220 | ||||||||||
|
| |||||||||||
Total Mortgage Pass-Throughs | 8,482,274 | |||||||||||
|
| |||||||||||
COLLATERALIZED MORTGAGE OBLIGATIONS–2.4% | ||||||||||||
RISK SHARE FLOATING RATE–1.7% | ||||||||||||
Bellemeade Re Ltd. | 240 | 240,605 | ||||||||||
Series2019-1A, Class M1B | 220 | 219,484 | ||||||||||
Series2019-3A, Class M1B | 225 | 225,240 | ||||||||||
Connecticut Avenue Securities Trust | 104 | 105,064 | ||||||||||
Principal | U.S. $ Value | |||||||||||
Series2019-R03, Class 1M2 | U.S.$ | 70 | $ | 70,987 | ||||||||
Series2019-R04, Class 2M2 | 126 | 126,314 | ||||||||||
Series2019-R05, Class 1M2 | 92 | 92,472 | ||||||||||
Series2019-R06, Class 2M2 | 113 | 113,955 | ||||||||||
Series2019-R07, Class 1M2 | 70 | 70,658 | ||||||||||
Eagle RE Ltd. | 110 | 110,517 | ||||||||||
Federal Home Loan Mortgage Corp. | 31 | 31,570 | ||||||||||
Federal Home Loan Mortgage Corp. Structured Agency Credit Risk Debt Notes | 214 | 228,233 | ||||||||||
Series2014-HQ3, Class M3 | 156 | 165,037 | ||||||||||
Series 2016-DNA1, Class M3 | 250 | 275,708 | ||||||||||
Federal National Mortgage Association Connecticut Avenue Securities Series | 72 | 75,697 | ||||||||||
Series2014-C04, Class 2M2 | 37 | 40,434 | ||||||||||
Series2015-C01, Class 1M2 | 79 | 84,052 | ||||||||||
19
| BALANCED WEALTH STRATEGY PORTFOLIO | ||
| PORTFOLIO OF INVESTMENTS | ||
| (continued) | AB Variable Products Series Fund | |
Principal | U.S. $ Value | |||||||||||
Series2015-C02, Class 1M2 | U.S.$ | 108 | $ | 114,502 | ||||||||
Series2015-C02, Class 2M2 | 82 | 85,247 | ||||||||||
Series2015-C03, Class 1M2 | 52 | 57,124 | ||||||||||
Series2015-C03, Class 2M2 | 124 | 131,968 | ||||||||||
Series2015-C04, Class 1M2 | 48 | 53,445 | ||||||||||
Series2015-C04, Class 2M2 | 185 | 197,647 | ||||||||||
Series2016-C01, Class 1M2 | 165 | 183,358 | ||||||||||
Series2016-C01, Class 2M2 | 110 | 120,677 | ||||||||||
Series2016-C03, Class 2M2 | 227 | 245,682 | ||||||||||
Series2016-C05, Class 2M2 | 167 | 176,032 | ||||||||||
JP Morgan Madison Avenue Securities Trust | 23 | 25,383 | ||||||||||
PMT Credit Risk Transfer Trust | 136 | 135,626 | ||||||||||
Radnor Re Ltd. | 220 | 219,732 | ||||||||||
Series2019-2, Class M1B | 220 | 220,260 | ||||||||||
Principal | U.S. $ Value | |||||||||||
Wells Fargo Credit Risk Transfer Securities Trust | U.S.$ | 111 | $ | 124,437 | ||||||||
Series2015-WF1, Class 2M2 | 35 | 39,064 | ||||||||||
|
| |||||||||||
| 4,406,211 | ||||||||||||
|
| |||||||||||
AGENCY FLOATING | ||||||||||||
Federal Home Loan Mortgage Corp. REMICs | 535 | 100,855 | ||||||||||
Series 4693, Class SL | 517 | 105,713 | ||||||||||
Series 4719, Class JS | 435 | 72,792 | ||||||||||
Series 4727, Class SA | �� | 570 | 107,727 | |||||||||
Federal National Mortgage Association REMICs | 264 | 57,260 | ||||||||||
Series2012-70, Class SA | 475 | 105,164 | ||||||||||
Series2016-106, Class ES | 510 | 97,519 | ||||||||||
Series2017-16, Class SG | 525 | 99,810 | ||||||||||
Series2017-81, Class SA | 531 | 105,049 | ||||||||||
Series2017-97, Class LS | 414 | 91,361 | ||||||||||
Government National Mortgage Association | 381 | 59,873 | ||||||||||
Series2017-65, Class ST | 501 | 100,151 | ||||||||||
|
| |||||||||||
| 1,103,274 | ||||||||||||
|
| |||||||||||
20
| AB Variable Products Series Fund | ||
Principal | U.S. $ Value | |||||||||||
NON-AGENCY FIXED RATE–0.2% | ||||||||||||
Alternative Loan Trust | U.S.$ | 22 | $ | 20,563 | ||||||||
Series 2006-24CB, Class A16 | 103 | 83,111 | ||||||||||
Series 2006-28CB, Class A14 | 76 | 61,545 | ||||||||||
Series2006-J1, Class 1A13 | 53 | 47,310 | ||||||||||
Chase Mortgage Finance Trust | 34 | 26,710 | ||||||||||
Countrywide Home Loan Mortgage Pass-Through Trust | 50 | 38,532 | ||||||||||
Series2006-13, Class 1A19 | 27 | 20,416 | ||||||||||
First Horizon Alternative Mortgage Securities Trust | 94 | 71,229 | ||||||||||
|
| |||||||||||
| 369,416 | ||||||||||||
|
| |||||||||||
NON-AGENCY FLOATING | ||||||||||||
DeutscheAlt-A Securities Mortgage Loan Trust | 234 | 122,136 | ||||||||||
HomeBanc Mortgage Trust | 66 | 59,392 | ||||||||||
|
| |||||||||||
| 181,528 | ||||||||||||
|
| |||||||||||
Total Collateralized Mortgage Obligations | 6,060,429 | |||||||||||
|
| |||||||||||
COMMERCIAL | ||||||||||||
NON-AGENCY FIXED RATE CMBS–0.8% | ||||||||||||
CGRBS Commercial Mortgage Trust | 495 | 511,608 | ||||||||||
Commercial Mortgage Trust | U.S.$ | 93 | $ | 92,269 | ||||||||
GS Mortgage Securities Trust | 276 | 280,014 | ||||||||||
JP Morgan Chase Commercial Mortgage Securities Trust | 119 | 114,533 | ||||||||||
JPMBB Commercial Mortgage Securities Trust | 355 | 379,771 | ||||||||||
LSTAR Commercial Mortgage Trust | 161 | 159,184 | ||||||||||
Morgan Stanley Capital I Trust | 24 | 24,026 | ||||||||||
UBS Commercial Mortgage Trust | 300 | 332,292 | ||||||||||
Wells Fargo Commercial Mortgage Trust | 197 | 201,374 | ||||||||||
|
| |||||||||||
| 2,095,071 | ||||||||||||
|
| |||||||||||
NON-AGENCY FLOATING RATE CMBS–0.6% | ||||||||||||
Ashford Hospitality Trust | 200 | 199,744 | ||||||||||
BAMLL Commercial Mortgage Securities Trust | 375 | 375,264 | ||||||||||
BHMS | 158 | 157,907 | ||||||||||
BX Trust | 163 | 162,971 | ||||||||||
DBWF Mortgage Trust | 166 | 165,539 | ||||||||||
21
| BALANCED WEALTH STRATEGY PORTFOLIO | ||
| PORTFOLIO OF INVESTMENTS | ||
| (continued) | AB Variable Products Series Fund | |
Principal | U.S. $ Value | |||||||||||
Invitation Homes Trust | U.S.$ | 220 | $ | 221,540 | ||||||||
Morgan Stanley Capital I Trust | 90 | 89,521 | ||||||||||
Starwood Retail Property Trust | 175 | 174,784 | ||||||||||
|
| |||||||||||
| 1,547,270 | ||||||||||||
|
| |||||||||||
Total Commercial | 3,642,341 | |||||||||||
|
| |||||||||||
CORPORATES–NON- | ||||||||||||
INDUSTRIAL–0.8% | ||||||||||||
BASIC–0.2% | ||||||||||||
Sealed Air Corp. | 92 | 93,306 | ||||||||||
Smurfit Kappa Acquisitions ULC | EUR | 150 | 185,074 | |||||||||
SPCM SA | U.S.$ | 200 | 208,358 | |||||||||
WEPA Hygieneprodukte GmbH | EUR | 120 | 139,288 | |||||||||
|
| |||||||||||
| 626,026 | ||||||||||||
|
| |||||||||||
CAPITAL GOODS–0.1% | ||||||||||||
TransDigm, Inc. | U.S.$ | 110 | 119,271 | |||||||||
|
| |||||||||||
COMMUNICATIONS–MEDIA–0.0% | ||||||||||||
CSC Holdings LLC | 45 | 48,448 | ||||||||||
|
| |||||||||||
CONSUMER | ||||||||||||
Panther BF Aggregator 2 LP/Panther Finance Co., Inc. | EUR | 120 | 141,027 | |||||||||
Tenneco, Inc. | 100 | 116,031 | ||||||||||
|
| |||||||||||
| 257,058 | ||||||||||||
|
| |||||||||||
Principal | U.S. $ Value | |||||||||||
CONSUMER CYCLICAL– | ||||||||||||
International Game Technology PLC | U.S.$ | 200 | $ | 211,268 | ||||||||
|
| |||||||||||
CONSUMERNON-CYCLICAL–0.1% | ||||||||||||
Grifols SA | EUR | 200 | 228,851 | |||||||||
Spectrum Brands, Inc. | U.S.$ | 135 | 141,283 | |||||||||
|
| |||||||||||
| 370,134 | ||||||||||||
|
| |||||||||||
TECHNOLOGY–0.1% | ||||||||||||
CommScope, Inc. | 67 | 69,940 | ||||||||||
6.00%, 3/01/26(c) | 88 | 93,637 | ||||||||||
|
| |||||||||||
| 163,577 | ||||||||||||
|
| |||||||||||
TRANSPORTATION–SERVICES–0.1% | ||||||||||||
Chicago Parking Meters LLC | 200 | 221,035 | ||||||||||
|
| |||||||||||
| 2,016,817 | ||||||||||||
|
| |||||||||||
FINANCIAL INSTITUTIONS–0.5% | ||||||||||||
BANKING–0.3% | ||||||||||||
Citigroup, Inc. | 90 | 95,481 | ||||||||||
Danske Bank A/S | EUR | 200 | 240,324 | |||||||||
Goldman Sachs Group, Inc. (The) | U.S.$ | 61 | 61,601 | |||||||||
Morgan Stanley | 95 | 96,680 | ||||||||||
Royal Bank of Scotland Group PLC | 200 | 197,262 | ||||||||||
Standard Chartered PLC | 200 | 172,388 | ||||||||||
|
| |||||||||||
| 863,736 | ||||||||||||
|
| |||||||||||
FINANCE–0.1% | ||||||||||||
Navient Corp. | 170 | 179,782 | ||||||||||
|
| |||||||||||
22
| AB Variable Products Series Fund | ||
Principal | U.S. $ Value | |||||||||||
REITS–0.1% | ||||||||||||
MGM Growth Properties Operating Partnership LP/MGP FinanceCo-Issuer, Inc. | U.S.$ | 130 | $ | 145,276 | ||||||||
|
| |||||||||||
| 1,188,794 | ||||||||||||
|
| |||||||||||
TotalCorporates–Non-Investment Grade | 3,205,611 | |||||||||||
|
| |||||||||||
COVERED BONDS–1.1% | ||||||||||||
Danske Hypotek AB | SEK | 4,000 | 436,558 | |||||||||
Nordea Hypotek AB | 4,100 | 446,934 | ||||||||||
Skandinaviska Enskilda Banken AB | 4,000 | 436,452 | ||||||||||
Stadshypotek AB | 4,000 | 445,232 | ||||||||||
Swedbank Hypotek AB | 4,100 | 446,825 | ||||||||||
Turkiye Vakiflar Bankasi TAO | EUR | 140 | 158,067 | |||||||||
UBS AG/London | 158 | 194,260 | ||||||||||
1.375%, 4/16/21(c) | 140 | 160,438 | ||||||||||
|
| |||||||||||
Total Covered Bonds | 2,724,766 | |||||||||||
|
| |||||||||||
QUASI-SOVEREIGNS–0.7% | ||||||||||||
QUASI-SOVEREIGN BONDS–0.7% | ||||||||||||
CHINA–0.6% | ||||||||||||
China Development Bank | CNY | 10,920 | 1,555,922 | |||||||||
|
| |||||||||||
MEXICO–0.0% | ||||||||||||
Petroleos Mexicanos | U.S.$ | 55 | 58,844 | |||||||||
|
| |||||||||||
SAUDI ARABIA–0.1% | ||||||||||||
Saudi Arabian Oil Co. | 200 | 202,750 | ||||||||||
|
| |||||||||||
Total Quasi-Sovereigns | 1,817,516 | |||||||||||
|
| |||||||||||
Principal | U.S. $ Value | |||||||||||
COLLATERALIZED LOAN OBLIGATIONS–0.5% | ||||||||||||
CLO–FLOATING RATE–0.5% | ||||||||||||
ICG US CLO Ltd. | U.S.$ | 300 | $ | 299,571 | ||||||||
Octagon Loan Funding Ltd. | 320 | 317,929 | ||||||||||
TIAA CLO IV Ltd. | 250 | 250,207 | ||||||||||
Voya CLO Ltd. | 500 | 498,809 | ||||||||||
|
| |||||||||||
Total Collateralized Loan Obligations | 1,366,516 | |||||||||||
|
| |||||||||||
EMERGING | ||||||||||||
ANGOLA–0.1% | ||||||||||||
Angolan Government International Bond | 200 | 213,000 | ||||||||||
|
| |||||||||||
BAHRAIN–0.1% | ||||||||||||
Bahrain Government International Bond | 200 | 214,000 | ||||||||||
|
| |||||||||||
DOMINICAN REPUBLIC–0.1% | ||||||||||||
Dominican Republic International Bond | 190 | 210,128 | ||||||||||
|
| |||||||||||
EGYPT–0.1% | ||||||||||||
Egypt Government International Bond | 200 | 209,687 | ||||||||||
|
| |||||||||||
NIGERIA–0.1% | ||||||||||||
Nigeria Government International Bond | 200 | 207,563 | ||||||||||
|
| |||||||||||
SRI LANKA–0.0% | ||||||||||||
Sri Lanka Government International Bond | 200 | 202,798 | ||||||||||
|
| |||||||||||
Total Emerging | 1,257,176 | |||||||||||
|
| |||||||||||
23
| BALANCED WEALTH STRATEGY PORTFOLIO | ||
| PORTFOLIO OF INVESTMENTS | ||
| (continued) | AB Variable Products Series Fund | |
Principal | U.S. $ Value | |||||||||||
EMERGING MARKETS–TREASURIES–0.3% | ||||||||||||
SOUTH AFRICA–0.3% | ||||||||||||
Republic of South Africa Government Bond | ZAR | 9,331 | $ | 621,234 | ||||||||
Series 2048 | 1,158 | 72,374 | ||||||||||
|
| |||||||||||
Total Emerging Markets–Treasuries | 693,608 | |||||||||||
|
| |||||||||||
ASSET-BACKED | ||||||||||||
OTHER ABS–FIXED | ||||||||||||
Consumer Loan Underlying Bond Credit Trust | U.S.$ | 29 | 29,464 | |||||||||
SBA Tower Trust | 251 | 251,252 | ||||||||||
SoFi Consumer Loan Program LLC | 29 | 29,339 | ||||||||||
|
| |||||||||||
| 310,055 | ||||||||||||
|
| |||||||||||
AUTOS–FIXED RATE–0.1% | ||||||||||||
Exeter Automobile Receivables Trust | 140 | 144,605 | ||||||||||
Flagship Credit Auto Trust | 100 | 101,745 | ||||||||||
Series2017-4, Class A | 19 | 19,123 | ||||||||||
Series2017-3, Class A | 6 | 6,216 | ||||||||||
|
| |||||||||||
| 271,689 | ||||||||||||
|
| |||||||||||
HOME EQUITY LOANS–FIXED RATE–0.0% | ||||||||||||
Credit-Based Asset Servicing & Securitization LLC | 39 | 39,370 | ||||||||||
|
| |||||||||||
Total Asset-Backed Securities | 621,114 | |||||||||||
|
| |||||||||||
Principal | U.S. $ Value | |||||||||||
GOVERNMENTS–SOVEREIGN BONDS–0.2% | ||||||||||||
SAUDI ARABIA–0.2% | ||||||||||||
Saudi Government International Bond | U.S.$ | 200 | $ | 206,500 | ||||||||
4.00%, 4/17/25(c) | 251 | 270,452 | ||||||||||
|
| |||||||||||
Total Governments–Sovereign Bonds | 476,952 | |||||||||||
|
| |||||||||||
EMERGING | ||||||||||||
INDUSTRIAL–0.2% | ||||||||||||
CONSUMERNON-CYCLICAL–0.1% | ||||||||||||
Minerva Luxembourg SA | 200 | 212,875 | ||||||||||
|
| |||||||||||
TRANSPORTATION–SERVICES–0.1% | ||||||||||||
Rumo Luxembourg SARL | 200 | 213,813 | ||||||||||
|
| |||||||||||
| 426,688 | ||||||||||||
|
| |||||||||||
UTILITY–0.0% | ||||||||||||
ELECTRIC–0.0% | ||||||||||||
Terraform Global Operating LLC | 42 | 43,674 | ||||||||||
|
| |||||||||||
Total Emerging | 470,362 | |||||||||||
|
| |||||||||||
SUPRANATIONALS–0.1% | ||||||||||||
SUPRANATIONALS–0.1% | ||||||||||||
European Investment Bank | AUD | 217 | 174,660 | |||||||||
|
| |||||||||||
| Shares | ||||||||||||
RIGHTS–0.0% | ||||||||||||
ENERGY–0.0% | ||||||||||||
OIL, GAS & CONSUMABLE | ||||||||||||
Repsol SA, expiring 1/09/20(a) | 16,671 | 7,910 | ||||||||||
|
| |||||||||||
SHORT-TERM INVESTMENTS–1.1% | ||||||||||||
INVESTMENT COMPANIES–0.7% | ||||||||||||
AB Fixed Income Shares, | 1,822,274 | 1,822,274 | ||||||||||
|
| |||||||||||
24
| AB Variable Products Series Fund | ||
Principal | U.S. $ Value | |||||||||||
GOVERNMENTS–TREASURIES–0.4% | ||||||||||||
Japan Treasury Discount Bill | JPY | 118,200 | $ | 1,088,211 | ||||||||
|
| |||||||||||
Total Short-Term Investments | 2,910,485 | |||||||||||
|
| |||||||||||
TOTAL INVESTMENTS BEFORE SECURITY LENDING COLLATERAL FOR SECURITIES LOANED–100.6% | 256,851,420 | |||||||||||
|
| |||||||||||
| Shares | ||||||||||||
INVESTMENTS OF CASH COLLATERAL FOR SECURITIES | ||||||||||||
INVESTMENT | ||||||||||||
AB Fixed Income Shares, | 258,450 | 258,450 | ||||||||||
|
| |||||||||||
TOTAL INVESTMENTS–100.7%(cost $232,740,438) | $ | 257,109,870 | ||||||||||
Other assets less liabilities–(0.7)% | (1,692,347 | ) | ||||||||||
|
| |||||||||||
NET ASSETS–100.0% | $ | 255,417,523 | ||||||||||
|
| |||||||||||
FUTURES (see Note D)
| Description | Number of Contracts | Expiration Month | Current Notional | Value and Unrealized Appreciation/ (Depreciation) | ||||||||||||
Purchased Contracts | ||||||||||||||||
3 Yr Australian Bond Futures | 24 | March 2020 | $ | 1,937,060 | $ | (12,621 | ) | |||||||||
10 Yr Canadian Bond Futures | 10 | March 2020 | 1,058,719 | (1,093 | ) | |||||||||||
10 Yr Mini Japan Government Bond Futures | 1 | March 2020 | 1,400,580 | 3,584 | ||||||||||||
Euro Buxl 30 Yr Bond Futures | 4 | March 2020 | 890,091 | (27,465 | ) | |||||||||||
Euro-Schatz Futures | 9 | March 2020 | 1,129,715 | (363 | ) | |||||||||||
U.S. Long Bond (CBT) Futures | 9 | March 2020 | 1,403,156 | (27,200 | ) | |||||||||||
U.S. Ultra Bond (CBT) Futures | 34 | March 2020 | 6,176,313 | (174,541 | ) | |||||||||||
Sold Contracts | ||||||||||||||||
Euro-OAT Futures | 5 | March 2020 | 912,896 | 11,436 | ||||||||||||
Euro-BOBL Futures | 7 | March 2020 | 1,049,249 | 2,718 | ||||||||||||
U.S. 10 Yr Ultra Futures | 15 | March 2020 | 2,110,547 | 31,792 | ||||||||||||
U.S.T-Note 2 Yr (CBT) Futures | 1 | March 2020 | 215,500 | 93 | ||||||||||||
U.S.T-Note 5 Yr (CBT) Futures | 24 | March 2020 | 2,846,625 | 6,431 | ||||||||||||
U.S.T-Note 10 Yr (CBT) Futures | 22 | March 2020 | 2,825,281 | 24,875 | ||||||||||||
|
| |||||||||||||||
| $ | (162,354 | ) | ||||||||||||||
|
| |||||||||||||||
25
| BALANCED WEALTH STRATEGY PORTFOLIO | ||
| PORTFOLIO OF INVESTMENTS | ||
| (continued) | AB Variable Products Series Fund | |
FORWARD CURRENCY EXCHANGE CONTRACTS (see Note D)
| Counterparty | Contracts to Deliver (000) | In Exchange For (000) | Settlement Date | Unrealized Appreciation/ (Depreciation) | ||||||||||||||||||||
Bank of America, NA | JPY | 214,341 | USD | 1,973 | 1/15/20 | $ | (676 | ) | ||||||||||||||||
Bank of America, NA | RUB | 66,414 | USD | 1,033 | 1/17/20 | (35,824 | ) | |||||||||||||||||
Bank of America, NA | USD | 405 | RUB | 26,007 | 1/17/20 | 13,393 | ||||||||||||||||||
Barclays Bank PLC | MYR | 480 | USD | 114 | 2/13/20 | (3,582 | ) | |||||||||||||||||
Barclays Bank PLC | CNY | 114 | USD | 16 | 2/13/20 | (353 | ) | |||||||||||||||||
BNP Paribas SA | EUR | 531 | PLN | 2,280 | 1/16/20 | 4,205 | ||||||||||||||||||
BNP Paribas SA | USD | 895 | SGD | 1,216 | 1/16/20 | 9,185 | ||||||||||||||||||
Brown Brothers Harriman & Co. | USD | 888 | JPY | 96,101 | 1/15/20 | (2,760 | ) | |||||||||||||||||
Citibank, NA | IDR | 8,456,369 | USD | 596 | 2/27/20 | (12,566 | ) | |||||||||||||||||
Citibank, NA | BRL | 3,967 | USD | 972 | 1/03/20 | (14,396 | ) | |||||||||||||||||
Citibank, NA | CHF | 437 | USD | 442 | 1/10/20 | (9,738 | ) | |||||||||||||||||
Citibank, NA | USD | 984 | BRL | 3,967 | 1/03/20 | 1,957 | ||||||||||||||||||
Citibank, NA | USD | 230 | IDR | 3,234,331 | 2/27/20 | 2,389 | ||||||||||||||||||
Credit Suisse International | BRL | 5,769 | USD | 1,431 | 1/03/20 | (2,846 | ) | |||||||||||||||||
Credit Suisse International | USD | 1,367 | BRL | 5,769 | 1/03/20 | 66,948 | ||||||||||||||||||
Goldman Sachs Bank USA | JPY | 755,354 | USD | 6,989 | 1/30/20 | 28,746 | ||||||||||||||||||
Goldman Sachs Bank USA | MXN | 18,273 | USD | 945 | 1/07/20 | (20,478 | ) | |||||||||||||||||
Goldman Sachs Bank USA | MYR | 7,379 | USD | 1,753 | 2/13/20 | (54,546 | ) | |||||||||||||||||
Goldman Sachs Bank USA | USD | 1,106 | EUR | 995 | 1/16/20 | 10,829 | ||||||||||||||||||
Morgan Stanley & Co., Inc. | ZAR | 9,214 | USD | 618 | 1/23/20 | (38,145 | ) | |||||||||||||||||
Morgan Stanley & Co., Inc. | EUR | 3,473 | USD | 3,845 | 1/16/20 | (54,331 | ) | |||||||||||||||||
Morgan Stanley & Co., Inc. | MYR | 1,222 | USD | 290 | 2/13/20 | (9,183 | ) | |||||||||||||||||
Morgan Stanley & Co., Inc. | USD | 2,067 | EUR | 1,863 | 1/16/20 | 24,250 | ||||||||||||||||||
Natwest Markets PLC | EUR | 21,522 | USD | 23,723 | 1/16/20 | (438,237 | ) | |||||||||||||||||
Standard Chartered Bank | GBP | 2,903 | USD | 3,742 | 1/10/20 | (104,329 | ) | |||||||||||||||||
Standard Chartered Bank | EUR | 955 | USD | 1,062 | 1/16/20 | (10,388 | ) | |||||||||||||||||
Standard Chartered Bank | USD | 663 | GBP | 509 | 1/10/20 | 11,424 | ||||||||||||||||||
Standard Chartered Bank | USD | 721 | EUR | 648 | 1/16/20 | 6,602 | ||||||||||||||||||
State Street Bank & Trust Co. | SEK | 21,242 | USD | 2,208 | 1/08/20 | (60,125 | ) | |||||||||||||||||
State Street Bank & Trust Co. | CNY | 18,775 | USD | 2,680 | 2/20/20 | (12,990 | ) | |||||||||||||||||
State Street Bank & Trust Co. | MYR | 2,052 | USD | 489 | 2/13/20 | (13,737 | ) | |||||||||||||||||
State Street Bank & Trust Co. | SGD | 1,215 | USD | 893 | 1/16/20 | (10,994 | ) | |||||||||||||||||
State Street Bank & Trust Co. | MXN | 553 | USD | 29 | 3/17/20 | (212 | ) | |||||||||||||||||
State Street Bank & Trust Co. | GBP | 425 | USD | 548 | 1/10/20 | (15,630 | ) | |||||||||||||||||
State Street Bank & Trust Co. | AUD | 255 | USD | 174 | 1/23/20 | (5,791 | ) | |||||||||||||||||
State Street Bank & Trust Co. | EUR | 379 | USD | 421 | 1/16/20 | (4,144 | ) | |||||||||||||||||
State Street Bank & Trust Co. | SEK | 216 | USD | 23 | 3/16/20 | (174 | ) | |||||||||||||||||
State Street Bank & Trust Co. | ILS | 77 | USD | 22 | 3/16/20 | (160 | ) | |||||||||||||||||
State Street Bank & Trust Co. | AUD | 105 | USD | 72 | 3/16/20 | (1,590 | ) | |||||||||||||||||
State Street Bank & Trust Co. | CAD | 71 | USD | 54 | 1/23/20 | (1,332 | ) | |||||||||||||||||
State Street Bank & Trust Co. | CAD | 100 | USD | 76 | 3/16/20 | (950 | ) | |||||||||||||||||
State Street Bank & Trust Co. | USD | 46 | AUD | 66 | 3/16/20 | 693 | ||||||||||||||||||
State Street Bank & Trust Co. | USD | 82 | SGD | 111 | 3/16/20 | 846 | ||||||||||||||||||
State Street Bank & Trust Co. | USD | 29 | CAD | 38 | 1/23/20 | 696 | ||||||||||||||||||
State Street Bank & Trust Co. | USD | 36 | CAD | 48 | 3/16/20 | 826 | ||||||||||||||||||
State Street Bank & Trust Co. | USD | 54 | CHF | 52 | 3/16/20 | 444 | ||||||||||||||||||
State Street Bank & Trust Co. | USD | 8 | SEK | 80 | 1/08/20 | 58 | ||||||||||||||||||
State Street Bank & Trust Co. | USD | 1,595 | EUR | 1,434 | 1/16/20 | 14,371 | ||||||||||||||||||
State Street Bank & Trust Co. | USD | 23 | SEK | 216 | 3/16/20 | 506 | ||||||||||||||||||
26
| AB Variable Products Series Fund | ||
| Counterparty | Contracts to Deliver (000) | In Exchange For (000) | Settlement Date | Unrealized Appreciation/ (Depreciation) | ||||||||||||||||||||
State Street Bank & Trust Co. | USD | 298 | JPY | 32,488 | 1/30/20 | $ | 1,676 | |||||||||||||||||
State Street Bank & Trust Co. | EUR | 347 | PLN | 1,486 | 1/16/20 | 2,152 | ||||||||||||||||||
State Street Bank & Trust Co. | USD | 34 | MXN | 656 | 1/07/20 | 413 | ||||||||||||||||||
State Street Bank & Trust Co. | USD | 40 | JPY | 4,310 | 3/16/20 | 144 | ||||||||||||||||||
State Street Bank & Trust Co. | USD | 340 | JPY | 36,764 | 1/30/20 | (1,135 | ) | |||||||||||||||||
UBS AG | BRL | 1,802 | USD | 442 | 1/03/20 | (6,075 | ) | |||||||||||||||||
UBS AG | USD | 441 | BRL | 1,802 | 2/04/20 | 6,209 | ||||||||||||||||||
UBS AG | USD | 447 | BRL | 1,802 | 1/03/20 | 889 | ||||||||||||||||||
|
| |||||||||||||||||||||||
| $ | (737,566 | ) | ||||||||||||||||||||||
|
| |||||||||||||||||||||||
CENTRALLY CLEARED CREDIT DEFAULT SWAPS (see Note D)
| Fixed Rate (Pay) Receive | Payment Frequency | Implied Credit Spread at December 31, 2019 | Notional Amount (000) | Market Value | Upfront Premiums Paid (Received) | Unrealized Appreciation/ (Depreciation) | |||||||||||||||||||||||||
Buy Contracts | ||||||||||||||||||||||||||||||||
CDX-NAHY Series 33, | (5.00 | )% | Quarterly | 2.80 | % | USD | 1,732 | $ | (169,888 | ) | $ | (113,632 | ) | $ | (56,256 | ) | ||||||||||||||||
| * | Termination date |
CENTRALLY CLEARED INTEREST RATE SWAPS (see Note D)
| Rate Type | ||||||||||||||||||||||||||||||
| Notional Amount (000) | Termination Date | Payments made by the Fund | Payments received by the Fund | Payment Frequency Paid/ Received | Market Value | Upfront Premiums Paid (Received) | Unrealized Appreciation/ (Depreciation) | |||||||||||||||||||||||
| USD | 3,470 | 5/24/21 | 2.288% | 3 Month LIBOR | Semi-Annual/ Quarterly | $ | (27,644 | ) | $ | –0 | – | $ | (27,644 | ) | ||||||||||||||||
| CAD | 3,780 | 5/22/24 | 3 Month CDOR | 1.980% | Semi-Annual/ Semi-Annual | (7,815 | ) | 2 | (7,817 | ) | ||||||||||||||||||||
| USD | 1,420 | 5/24/24 | 2.200% | 3 Month LIBOR | Semi-Annual/ Quarterly | (29,549 | ) | –0 | – | (29,549 | ) | |||||||||||||||||||
| USD | 295 | 11/08/26 | 1.657% | 3 Month LIBOR | Semi-Annual/ Quarterly | 2,724 | –0 | – | 2,724 | |||||||||||||||||||||
| USD | 1,870 | 9/10/48 | 2.980% | 3 Month LIBOR | Semi-Annual/ Quarterly | (385,697 | ) | –0 | – | (385,697 | ) | |||||||||||||||||||
|
|
|
|
|
| |||||||||||||||||||||||||
| $ | (447,981 | ) | $ | 2 | $ | (447,983 | ) | |||||||||||||||||||||||
|
|
|
|
|
| |||||||||||||||||||||||||
CREDIT DEFAULT SWAPS (see Note D)
| Swap Counterparty & Referenced Obligation | Fixed Rate (Pay) Receive | Payment Frequency | Implied Credit Spread at December 31, 2019 | Notional Amount (000) | Market Value | Upfront Premiums Paid (Received) | Unrealized Appreciation/ (Depreciation) | |||||||||||||||||||||||||
Sale Contracts | ||||||||||||||||||||||||||||||||
Citigroup Global Markets, Inc. | ||||||||||||||||||||||||||||||||
CDX-CMBX.NA.A | 2.00 | % | Monthly | 1.41 | % | USD | 450 | $ | 7,150 | $ | (8,853 | ) | $ | 16,003 | ||||||||||||||||||
CDX-CMBX.NA.BBB- | 3.00 | Monthly | 5.13 | USD | 60 | (3,036 | ) | (7,953 | ) | 4,917 | ||||||||||||||||||||||
27
| BALANCED WEALTH STRATEGY PORTFOLIO | ||
| PORTFOLIO OF INVESTMENTS | ||
| (continued) | AB Variable Products Series Fund | |
| Swap Counterparty & Referenced Obligation | Fixed Rate (Pay) Receive | Payment Frequency | Implied Credit Spread at December 31, 2019 | Notional Amount (000) | Market Value | Upfront Premiums Paid (Received) | Unrealized Appreciation/ (Depreciation) | |||||||||||||||||||||||||
CDX-CMBX.NA.BBB- | 3.00 | % | Monthly | 5.13 | % | USD | 55 | $ | (2,783 | ) | $ | (7,464 | ) | $ | 4,681 | |||||||||||||||||
CDX-CMBX.NA.BBB- | 3.00 | Monthly | 5.13 | USD | 69 | (3,486 | ) | (10,587 | ) | 7,101 | ||||||||||||||||||||||
CDX-CMBX.NA.BBB- | 3.00 | Monthly | 5.13 | USD | 11 | (556 | ) | (1,771 | ) | 1,215 | ||||||||||||||||||||||
CDX-CMBX.NA.BBB- | 3.00 | Monthly | 5.13 | USD | 70 | (3,536 | ) | (10,427 | ) | 6,891 | ||||||||||||||||||||||
Credit Suisse International | ||||||||||||||||||||||||||||||||
CDX-CMBX.NA.BBB- | 3.00 | Monthly | 5.13 | USD | 165 | (8,349 | ) | (10,668 | ) | 2,319 | ||||||||||||||||||||||
CDX-CMBX.NA.BBB- | 3.00 | Monthly | 5.13 | USD | 75 | (3,789 | ) | (11,121 | ) | 7,332 | ||||||||||||||||||||||
Deutsche Bank AG | ||||||||||||||||||||||||||||||||
CDX-CMBX.NA.BBB- | 3.00 | Monthly | 5.13 | USD | 9 | (455 | ) | (516 | ) | 61 | ||||||||||||||||||||||
CDX-CMBX.NA.BBB- | 3.00 | Monthly | 5.13 | USD | 8 | (404 | ) | (937 | ) | 533 | ||||||||||||||||||||||
CDX-CMBX.NA.BBB- | 3.00 | Monthly | 5.13 | USD | 48 | (2,428 | ) | (6,045 | ) | 3,617 | ||||||||||||||||||||||
CDX-CMBX.NA.BBB- | 3.00 | Monthly | 5.13 | USD | 53 | (2,682 | ) | (6,059 | ) | 3,377 | ||||||||||||||||||||||
CDX-CMBX.NA.BBB- | 3.00 | Monthly | 5.13 | USD | 52 | (2,632 | ) | (5,943 | ) | 3,311 | ||||||||||||||||||||||
CDX-CMBX.NA.BBB- | 3.00 | Monthly | 5.13 | USD | 79 | (3,997 | ) | (8,506 | ) | 4,509 | ||||||||||||||||||||||
Goldman Sachs International | ||||||||||||||||||||||||||||||||
CDX-CMBX.NA.BBB- | 3.00 | Monthly | 5.13 | USD | 64 | (3,239 | ) | (4,241 | ) | 1,002 | ||||||||||||||||||||||
CDX-CMBX.NA.BBB- | 3.00 | Monthly | 5.13 | USD | 47 | (2,378 | ) | (4,059 | ) | 1,681 | ||||||||||||||||||||||
CDX-CMBX.NA.BBB- | 3.00 | Monthly | 5.13 | USD | 4 | (202 | ) | (358 | ) | 156 | ||||||||||||||||||||||
CDX-CMBX.NA.BBB- | 3.00 | Monthly | 5.13 | USD | 8 | (405 | ) | (730 | ) | 325 | ||||||||||||||||||||||
CDX-CMBX.NA.BBB- | 3.00 | Monthly | 5.13 | USD | 8 | (405 | ) | (790 | ) | 385 | ||||||||||||||||||||||
CDX-CMBX.NA.BBB- | 3.00 | Monthly | 5.13 | USD | 15 | (759 | ) | (1,619 | ) | 860 | ||||||||||||||||||||||
CDX-CMBX.NA.BBB- | 3.00 | Monthly | 5.13 | USD | 78 | (3,947 | ) | (10,610 | ) | 6,663 | ||||||||||||||||||||||
CDX-CMBX.NA.BBB- | 3.00 | Monthly | 5.13 | USD | 53 | (2,682 | ) | (5,644 | ) | 2,962 | ||||||||||||||||||||||
CDX-CMBX.NA.BBB- | 3.00 | Monthly | 5.13 | USD | �� | 75 | (3,789 | ) | (11,523 | ) | 7,734 | |||||||||||||||||||||
CDX-CMBX.NA.BBB- | 3.00 | Monthly | 5.13 | USD | 58 | (2,930 | ) | (9,475 | ) | 6,545 | ||||||||||||||||||||||
CDX-CMBX.NA.BBB- | 3.00 | Monthly | 5.13 | USD | 82 | (4,142 | ) | (13,588 | ) | 9,446 | ||||||||||||||||||||||
CDX-CMBX.NA.BBB- Series 6, 5/11/63* | 3.00 | Monthly | 5.13 | USD | 5 | (253 | ) | (759 | ) | 506 | ||||||||||||||||||||||
|
|
|
|
|
| |||||||||||||||||||||||||||
| $ | (56,114 | ) | $ | (160,246 | ) | $ | 104,132 | |||||||||||||||||||||||||
|
|
|
|
|
| |||||||||||||||||||||||||||
| * | Termination date |
28
| AB Variable Products Series Fund | ||
INFLATION (CPI) SWAPS (see Note D)
| Rate Type | ||||||||||||||||||||||||||||||
Swap Counterparty | Notional (000) | Termination Date | Payments made by the Fund | Payments received by the Fund | Payment Frequency Paid/ Received | Market Value | Upfront Premiums Paid (Received) | Unrealized Appreciation/ (Depreciation) | ||||||||||||||||||||||
Bank of America, NA | USD | 10,000 | 7/11/24 | 2.416% | CPI# | Maturity | $ | (297,162 | ) | $ | –0 | – | $ | (297,162 | ) | |||||||||||||||
| # | Variable interest rate based on the rate of inflation as determined by the Consumer Price Index (CPI). |
| (a) | Non-income producing security. |
| (b) | Represents entire or partial securities out on loan. See Note E for securities lending information. |
| (c) | Security is exempt from registration under Rule 144A of the Securities Act of 1933. These securities are considered restricted, but liquid and may be resold in transactions exempt from registration, normally to qualified institutional buyers. At December 31, 2019, the aggregate market value of these securities amounted to $39,907,941 or 15.6% of net assets. |
| (d) | Affiliated investments. |
| (e) | To obtain a copy of the fund’s shareholder report, please go to the Securities and Exchange Commission’s website at www.sec.gov, or call AB at (800)227-4618. |
| (f) | Securities are perpetual and, thus, do not have a predetermined maturity date. The date shown, if applicable, reflects the next call date. |
| (g) | Floating Rate Security. Stated interest/floor/ceiling rate was in effect at December 31, 2019. |
| (h) | Security is exempt from registration under Rule 144A of the Securities Act of 1933. These securities, which represent 0.19% of net assets as of December 31, 2019, are considered illiquid and restricted. Additional information regarding such securities follows: |
| 144A/Restricted & Illiquid Securities | Acquisition Date | Cost | Market Value | Percentage of Net Assets | ||||||||||||
JP Morgan Madison Avenue Securities Trust | 11/06/15 | $ | 23,044 | $ | 25,383 | 0.01 | % | |||||||||
Morgan Stanley Capital I Trust | 11/16/15 | 89,627 | 89,521 | 0.04 | % | |||||||||||
PMT Credit Risk Transfer Trust | 3/21/19 | 135,750 | 135,626 | 0.05 | % | |||||||||||
Terraform Global Operating LLC | �� | 2/08/18 | 42,000 | 43,674 | 0.02 | % | ||||||||||
Wells Fargo Credit Risk Transfer Securities Trust | 9/28/15 | 110,892 | 124,437 | 0.05 | % | |||||||||||
Wells Fargo Credit Risk Transfer Securities Trust | 9/28/15 | 34,370 | 39,064 | 0.02 | % | |||||||||||
| (i) | Inverse interest only security. |
| (j) | Illiquid security. |
| (k) | Fair valued by the Adviser. |
| (l) | The rate shown represents the7-day yield as of period end. |
29
| BALANCED WEALTH STRATEGY PORTFOLIO | ||
| PORTFOLIO OF INVESTMENTS | ||
| (continued) | AB Variable Products Series Fund | |
Currency Abbreviations:
AUD—Australian Dollar
BRL—Brazilian Real
CAD—Canadian Dollar
CHF—Swiss Franc
CNY—Chinese Yuan Renminbi
EUR—Euro
GBP—Great British Pound
IDR—Indonesian Rupiah
ILS—Israeli Shekel
JPY—Japanese Yen
MXN—Mexican Peso
MYR—Malaysian Ringgit
PLN—Polish Zloty
RUB—Russian Ruble
SEK—Swedish Krona
SGD—Singapore Dollar
USD—United States Dollar
ZAR—South African Rand
Glossary:
ABS—Asset-Backed Securities
ADR—American Depositary Receipt
BOBL—Bundesobligationen
CBT—Chicago Board of Trade
CDOR—Canadian Dealer Offered Rate
CDX-CMBX.NA—North American Commercial Mortgage-Backed Index
CDX-NAHY—North American High Yield Credit Default Swap Index
CLO—Collateralized Loan Obligations
CMBS—Commercial Mortgage-Backed Securities
CPI—Consumer Price Index
GDR—Global Depositary Receipt
LIBOR—London Interbank Offered Rates
OAT—Obligations Assimilables du Trésor
PJSC—Public Joint Stock Company
REIT—Real Estate Investment Trust
REMICs—Real Estate Mortgage Investment Conduits
TBA—To Be Announced
TIPS—Treasury Inflation Protected Security
See notes to financial statements.
30
| BALANCED WEALTH STRATEGY PORTFOLIO | ||
| STATEMENT OF ASSETS & LIABILITIES | ||
| December 31, 2019 | AB Variable Products Series Fund | |
ASSETS | ||||
Investments in securities, at value | ||||
Unaffiliated issuers (cost $160,347,049) | $ | 187,337,843 | (a) | |
Affiliated issuers (cost $72,393,389—including investment of cash collateral for securities loaned of $258,450) | 69,772,027 | |||
Cash | 4,371 | |||
Cash collateral due from broker | 768,723 | |||
Foreign currencies, at value (cost $205,866) | 208,871 | |||
Unaffiliated interest and dividends receivable | 761,784 | |||
Unrealized appreciation on forward currency exchange contracts | 209,851 | |||
Receivable for variation margin on centrally cleared swaps | 21,255 | |||
Market value on credit default swaps (net premiums received $8,853) | 7,150 | |||
Affiliated dividends receivable | 560 | |||
Receivable for capital stock sold | 120 | |||
Other assets | 4,406 | |||
|
| |||
Total assets | 259,096,961 | |||
|
| |||
LIABILITIES | ||||
Payable for investment securities purchased | 1,680,345 | |||
Unrealized depreciation on forward currency exchange contracts | 947,417 | |||
Unrealized depreciation on inflation swaps | 297,162 | |||
Payable for collateral received on securities loaned | 258,450 | |||
Advisory fee payable | 71,774 | |||
Payable for capital stock redeemed | 68,672 | |||
Market value on credit default swaps (net premiums received $151,393) | 63,264 | |||
Distribution fee payable | 47,204 | |||
Payable for variation margin on futures | 46,747 | |||
Administrative fee payable | 21,886 | |||
Transfer Agent fee payable | 132 | |||
Accrued expenses and other liabilities | 176,385 | |||
|
| |||
Total liabilities | 3,679,438 | |||
|
| |||
NET ASSETS | $ | 255,417,523 | ||
|
| |||
COMPOSITION OF NET ASSETS | ||||
Capital stock, at par | $ | 25,257 | ||
Additionalpaid-in capital | 220,410,634 | |||
Distributable earnings | 34,981,632 | |||
|
| |||
| $ | 255,417,523 | |||
|
|
Net Asset Value Per Share—1 billion shares of capital stock authorized, $.001 par value
| Class | Net Assets | Shares Outstanding | Net Asset Value | |||||||||
| A | $ | 24,347,005 | 2,378,095 | $ | 10.24 | |||||||
| B | $ | 231,070,518 | 22,879,212 | $ | 10.10 | |||||||
| (a) | Includes securities on loan with a value of $2,136,974 (see Note E). |
See notes to financial statements.
31
| BALANCED WEALTH STRATEGY PORTFOLIO | ||
| STATEMENT OF OPERATIONS | ||
| Year Ended December 31, 2019 | AB Variable Products Series Fund | |
INVESTMENT INCOME | ||||
Dividends | ||||
Unaffiliated issuers (net of foreign taxes withheld of $41,217) | $ | 2,122,033 | ||
Affiliated issuers | 1,221,131 | |||
Interest | 2,690,818 | |||
Securities lending income | 2,393 | |||
Other income | 1,500 | |||
|
| |||
| 6,037,875 | ||||
|
| |||
EXPENSES | ||||
Advisory fee (see Note B) | 1,401,098 | |||
Distribution fee—Class B | 575,471 | |||
Transfer agency—Class A | 550 | |||
Transfer agency—Class B | 5,159 | |||
Custodian | 175,845 | |||
Audit and tax | 101,208 | |||
Administrative | 79,715 | |||
Printing | 55,040 | |||
Legal | 41,178 | |||
Directors’ fees | 22,925 | |||
Miscellaneous | 20,022 | |||
|
| |||
Total expenses before bank overdraft expense | 2,478,211 | |||
Bank overdraft expense | 15,664 | |||
|
| |||
Total expenses | 2,493,875 | |||
Less: expenses waived and reimbursed by the Adviser (see Notes B & E) | (519,721 | ) | ||
|
| |||
Net expenses | 1,974,154 | |||
|
| |||
Net investment income | 4,063,721 | |||
|
| |||
REALIZED AND UNREALIZED GAIN (LOSS) ON INVESTMENT AND FOREIGN CURRENCY TRANSACTIONS | ||||
Net realized gain (loss) on: | ||||
Affiliated Underlying Portfolios | (509,273 | ) | ||
Investment transactions(a) | 7,965,002 | |||
Forward currency exchange contracts | (523,566 | ) | ||
Futures | 213,449 | |||
Swaps | 396,201 | |||
Foreign currency transactions | 679,050 | |||
Net realized gain distributions from Affiliated Underlying Portfolios | 303,518 | |||
Net change in unrealized appreciation/depreciation of: | ||||
Affiliated Underlying Portfolios | 11,889,821 | |||
Investments(b) | 19,491,767 | |||
Forward currency exchange contracts | (607,777 | ) | ||
Futures | (499,006 | ) | ||
Swaps | (405,783 | ) | ||
Foreign currency denominated assets and liabilities | 7,551 | |||
|
| |||
Net gain on investment and foreign currency transactions | 38,400,954 | |||
|
| |||
NET INCREASE IN NET ASSETS FROM OPERATIONS | $ | 42,464,675 | ||
|
|
| (a) | Net of foreign capital gains taxes of $8,003. |
| (b) | Net of increase in accrued foreign capital gains taxes of $9,464. |
See notes to financial statements.
32
| BALANCED WEALTH STRATEGY PORTFOLIO | ||
| STATEMENT OF CHANGES IN NET ASSETS | AB Variable Products Series Fund | |
| Year Ended December 31, 2019 | Year Ended December 31, 2018 | |||||||
INCREASE (DECREASE) IN NET ASSETS FROM OPERATIONS | ||||||||
Net investment income | $ | 4,063,721 | $ | 5,105,776 | ||||
Net realized gain on investment and foreign currency transactions | 8,220,863 | 30,548,043 | ||||||
Net realized gain distributions from Affiliated Underlying Portfolios | 303,518 | 2,347,246 | ||||||
Net change in unrealized appreciation/depreciation of investments and foreign currency denominated assets and liabilities | 29,876,573 | (54,922,332 | ) | |||||
Contributions from Affiliates (see Note B) | –0 | – | 3,140 | |||||
|
|
|
| |||||
Net increase (decrease) in net assets from operations | 42,464,675 | (16,918,127 | ) | |||||
Distributions to Shareholders | ||||||||
Class A | (3,532,547 | ) | (2,582,061 | ) | ||||
Class B | (32,838,881 | ) | (23,104,999 | ) | ||||
CAPITAL STOCK TRANSACTIONS | ||||||||
Net increase (decrease) | 5,082,781 | (16,551,330 | ) | |||||
|
|
|
| |||||
Total increase (decrease) | 11,176,028 | (59,156,517 | ) | |||||
NET ASSETS | ||||||||
Beginning of period | 244,241,495 | 303,398,012 | ||||||
|
|
|
| |||||
End of period | $ | 255,417,523 | $ | 244,241,495 | ||||
|
|
|
| |||||
See notes to financial statements.
33
| BALANCED WEALTH STRATEGY PORTFOLIO | ||
| NOTES TO FINANCIAL STATEMENTS | ||
| December 31, 2019 | AB Variable Products Series Fund | |
NOTE A: Significant Accounting Policies
The AB Balanced Wealth Strategy Portfolio (the “Portfolio”) is a series of AB Variable Products Series Fund, Inc. (the “Fund”). The Portfolio’s investment objective is to maximize total return consistent with the determination of AllianceBernstein L.P. (the “Adviser”) of reasonable risk. The Portfolio is diversified as defined under the Investment Company Act of 1940. The Fund was incorporated in the State of Maryland on November 17, 1987, as anopen-end series investment company. The Fund offers eleven separately managed pools of assets which have differing investment objectives and policies. The Portfolio offers Class A and Class B shares. Both classes of shares have identical voting, dividend, liquidating and other rights, except that Class B shares bear a distribution expense and have exclusive voting rights with respect to the Class B distribution plan.
The Portfolio offers and sells its shares only to separate accounts of certain life insurance companies for the purpose of funding variable annuity contracts and variable life insurance policies. Sales are made without a sales charge at the Portfolio’s net asset value per share.
The financial statements have been prepared in conformity with U.S. generally accepted accounting principles (“U.S. GAAP”) which require management to make certain estimates and assumptions that affect the reported amounts of assets and liabilities in the financial statements and amounts of income and expenses during the reporting period. Actual results could differ from those estimates. The Portfolio is an investment company under U.S. GAAP and follows the accounting and reporting guidance applicable to investment companies. The following is a summary of significant accounting policies followed by the Portfolio.
1. Security Valuation
Portfolio securities are valued at their current market value determined on the basis of market quotations or, if market quotations are not readily available or are deemed unreliable, at “fair value” as determined in accordance with procedures established by and under the general supervision of the Fund’s Board of Directors (the “Board”).
In general, the market values of securities which are readily available and deemed reliable are determined as follows: securities listed on a national securities exchange (other than securities listed on the NASDAQ Stock Market, Inc. (“NASDAQ”)) or on a foreign securities exchange are valued at the last sale price at the close of the exchange or foreign securities exchange. If there has been no sale on such day, the securities are valued at the last traded price from the previous day. Securities listed on more than one exchange are valued by reference to the principal exchange on which the securities are traded; securities listed only on NASDAQ are valued in accordance with the NASDAQ Official Closing Price; listed or over the counter (“OTC”) market put or call options are valued at the mid level between the current bid and ask prices. If either a current bid or current ask price is unavailable, the Adviser will have discretion to determine the best valuation (e.g., last trade price in the case of listed options); open futures are valued using the closing settlement price or, in the absence of such a price, the most recent quoted bid price. If there are no quotations available for the day of valuation, the last available closing settlement price is used; U.S. Government securities and any other debt instruments having 60 days or less remaining until maturity are generally valued at market by an independent pricing vendor, if a market price is available. If a market price is not available, the securities are valued at amortized cost. This methodology is commonly used for short term securities that have an original maturity of 60 days or less, as well as short term securities that had an original term to maturity that exceeded 60 days. In instances when amortized cost is utilized, the Valuation Committee (the “Committee”) must reasonably conclude that the utilization of amortized cost is approximately the same as the fair value of the security. Such factors the Committee will consider include, but are not limited to, an impairment of the creditworthiness of the issuer or material changes in interest rates. Fixed-income securities, including mortgage-backed and asset-backed securities, may be valued on the basis of prices provided by a pricing service or at a price obtained from one or more of the major broker-dealers. In cases where broker-dealer quotes are obtained, the Adviser may establish procedures whereby changes in market yields or spreads are used to adjust, on a daily basis, a recently obtained quoted price on a security. Swaps and other derivatives are valued daily, primarily using independent pricing services, independent pricing models using market inputs, as well as third party broker-dealers or counterparties. Open end mutual funds are valued at the closing net asset value per share, while exchange traded funds are valued at the closing market price per share.
Securities for which market quotations are not readily available (including restricted securities) or are deemed unreliable are valued at fair value as deemed appropriate by the Adviser. Factors considered in making this determination may include, but are not limited to, information obtained by contacting the issuer, analysts, analysis of the issuer’s financial statements or
34
| AB Variable Products Series Fund | ||
other available documents. In addition, the Portfolio may use fair value pricing for securities primarily traded innon-U.S. markets because most foreign markets close well before the Portfolio values its securities at 4:00 p.m., Eastern Time. The earlier close of these foreign markets gives rise to the possibility that significant events, including broad market moves, may have occurred in the interim and may materially affect the value of those securities. To account for this, the Portfolio generally values many of its foreign equity securities using fair value prices based on third party vendor modeling tools to the extent available.
2. Fair Value Measurements
In accordance with U.S. GAAP regarding fair value measurements, fair value is defined as the price that the Portfolio would receive to sell an asset or pay to transfer a liability in an orderly transaction between market participants at the measurement date. U.S. GAAP establishes a framework for measuring fair value, and a three-level hierarchy for fair value measurements based upon the transparency of inputs to the valuation of an asset or liability (including those valued based on their market values as described in Note A.1 above). Inputs may be observable or unobservable and refer broadly to the assumptions that market participants would use in pricing the asset or liability. Observable inputs reflect the assumptions market participants would use in pricing the asset or liability based on market data obtained from sources independent of the Portfolio. Unobservable inputs reflect the Portfolio’s own assumptions about the assumptions that market participants would use in pricing the asset or liability based on the best information available in the circumstances. Each investment is assigned a level based upon the observability of the inputs which are significant to the overall valuation. The three-tier hierarchy of inputs is summarized below.
| • | Level 1—quoted prices in active markets for identical investments |
| • | Level 2—other significant observable inputs (including quoted prices for similar investments, interest rates, prepayment speeds, credit risk, etc.) |
| • | Level 3—significant unobservable inputs (including the Portfolio’s own assumptions in determining the fair value of investments) |
The fair value of debt instruments, such as bonds, andover-the-counter derivatives is generally based on market price quotations, recently executed market transactions (where observable) or industry recognized modeling techniques and are generally classified as Level 2. Pricing vendor inputs to Level 2 valuations may include quoted prices for similar investments in active markets, interest rate curves, coupon rates, currency rates, yield curves, option adjusted spreads, default rates, credit spreads and other unique security features in order to estimate the relevant cash flows which are then discounted to calculate fair values. If these inputs are unobservable and significant to the fair value, these investments will be classified as Level 3.
Where readily available market prices or relevant bid prices are not available for certain equity investments, such investments may be valued based on similar publicly traded investments, movements in relevant indices since last available prices or based upon underlying company fundamentals and comparable company data (such as multiples to earnings or other multiples to equity). Where an investment is valued using an observable input, such as another publicly traded security, the investment will be classified as Level 2. If management determines that an adjustment is appropriate based on restrictions on resale, illiquidity or uncertainty, and such adjustment is a significant component of the valuation, the investment will be classified as Level 3. An investment will also be classified as Level 3 where management uses company fundamentals and other significant inputs to determine the valuation.
Valuations of mortgage-backed or other asset-backed securities, by pricing vendors, are based on both proprietary and industry recognized models and discounted cash flow techniques. Significant inputs to the valuation of these instruments are value of the collateral, the rates and timing of delinquencies, the rates and timing of prepayments, and default and loss expectations, which are driven in part by housing prices for residential mortgages. Significant inputs are determined based on relative value analyses, which incorporate comparisons to instruments with similar collateral and risk profiles, including relevant indices. Mortgage and asset-backed securities for which management has collected current observable data through pricing services are generally categorized within Level 2. Those investments for which current observable data has not been provided are classified as Level 3.
Other fixed income investments, includingnon-U.S. government and corporate debt, are generally valued using quoted market prices, if available, which are typically impacted by current interest rates, maturity dates and any perceived credit risk of the issuer. Additionally, in the absence of quoted market prices, these inputs are used by pricing vendors to derive a valuation based upon industry or proprietary models which incorporate issuer specific data with relevant yield/spread comparisons with more widely quoted bonds with similar key characteristics. Those investments for which there are observable inputs are classified as Level 2. Where the inputs are not observable, the investments are classified as Level 3.
35
| BALANCED WEALTH STRATEGY PORTFOLIO | ||
| NOTES TO FINANCIAL STATEMENTS | ||
| (continued) | AB Variable Products Series Fund | |
The following table summarizes the valuation of the Portfolio’s investments by the above fair value hierarchy levels as of December 31, 2019:
| Level 1 | Level 2 | Level 3 | Total | |||||||||||||
Investments in Securities: | ||||||||||||||||
Assets: | ||||||||||||||||
Common Stocks: | ||||||||||||||||
Information Technology | $ | 18,193,625 | $ | 153,921 | $ | –0 | – | $ | 18,347,546 | |||||||
Financials | 13,148,946 | 215,399 | –0 | – | 13,364,345 | |||||||||||
Health Care | 12,494,118 | 356,576 | –0 | – | 12,850,694 | |||||||||||
Real Estate | 8,349,233 | 2,708,142 | –0 | – | 11,057,375 | |||||||||||
Communication Services | 9,843,082 | 93,071 | –0 | – | 9,936,153 | |||||||||||
Consumer Discretionary | 9,205,478 | 302,984 | –0 | – | 9,508,462 | |||||||||||
Energy | 5,100,961 | 3,282,553 | –0 | – | 8,383,514 | |||||||||||
Consumer Staples | 5,058,610 | 544,198 | –0 | – | 5,602,808 | |||||||||||
Industrials | 4,668,733 | 444,702 | –0 | – | 5,113,435 | |||||||||||
Materials | 1,417,829 | 1,515,336 | –0 | – | 2,933,165 | |||||||||||
Utilities | 1,882,120 | 258,787 | –0 | – | 2,140,907 | |||||||||||
Transportation | –0 | – | 97,323 | –0 | – | 97,323 | ||||||||||
Capital Goods | –0 | – | 45,563 | –0 | – | 45,563 | ||||||||||
Consumer Services | 42,941 | –0 | – | –0 | – | 42,941 | ||||||||||
Consumer Durables & Apparel | –0 | – | 33,410 | –0 | – | 33,410 | ||||||||||
Investment Companies | 67,691,303 | –0 | – | –0 | – | 67,691,303 | ||||||||||
Governments—Treasuries | –0 | – | 27,748,760 | –0 | – | 27,748,760 | ||||||||||
Corporates—Investment Grade | –0 | – | 18,562,794 | –0 | – | 18,562,794 | ||||||||||
Inflation-Linked Securities | –0 | – | 9,479,202 | –0 | – | 9,479,202 | ||||||||||
Mortgage Pass-Throughs | –0 | – | 8,482,274 | –0 | – | 8,482,274 | ||||||||||
Collateralized Mortgage Obligations | –0 | – | 6,060,429 | –0 | – | 6,060,429 | ||||||||||
Commercial Mortgage-Backed Securities | –0 | – | 3,642,341 | –0 | – | 3,642,341 | ||||||||||
Corporates—Non-Investment Grade | –0 | – | 3,205,611 | –0 | – | 3,205,611 | ||||||||||
Covered Bonds | –0 | – | 2,724,766 | –0 | – | 2,724,766 | ||||||||||
Quasi-Sovereigns | –0 | – | 1,817,516 | –0 | – | 1,817,516 | ||||||||||
Collateralized Loan Obligations | –0 | – | 1,366,516 | –0 | – | 1,366,516 | ||||||||||
Emerging Markets—Sovereigns | –0 | – | 1,257,176 | –0 | – | 1,257,176 | ||||||||||
Emerging Market—Treasuries | –0 | – | 693,608 | –0 | – | 693,608 | ||||||||||
Asset-Backed Securities | –0 | – | 621,114 | –0 | – | 621,114 | ||||||||||
Governments—Sovereign Bonds | –0 | – | 476,952 | –0 | – | 476,952 | ||||||||||
Emerging Markets—Corporate Bonds | –0 | – | 470,362 | –0 | – | 470,362 | ||||||||||
Supranationals | –0 | – | 174,660 | –0 | – | 174,660 | ||||||||||
Rights | 7,910 | –0 | – | –0 | – | 7,910 | ||||||||||
Short-Term Investments: | ||||||||||||||||
Investment Companies | 1,822,274 | –0 | – | –0 | – | 1,822,274 | ||||||||||
Governments—Treasuries | –0 | – | 1,088,211 | –0 | – | 1,088,211 | ||||||||||
Investments of Cash Collateral for Securities Loaned in Affiliated Money Market Fund | 258,450 | –0 | – | –0 | – | 258,450 | ||||||||||
|
|
|
|
|
|
|
| |||||||||
Total Investments in Securities | 159,185,613 | 97,924,257 | –0 | – | 257,109,870 | |||||||||||
Other Financial Instruments(a): | ||||||||||||||||
Assets: | ||||||||||||||||
Futures | 80,929 | –0 | – | –0 | – | 80,929 | (b) | |||||||||
Forward Currency Exchange Contracts | –0 | – | 209,851 | –0 | – | 209,851 | ||||||||||
Centrally Cleared Interest Rate Swaps | –0 | – | 2,724 | –0 | – | 2,724 | (b) | |||||||||
Credit Default Swaps | –0 | – | 7,150 | –0 | – | 7,150 | ||||||||||
36
| AB Variable Products Series Fund | ||
| Level 1 | Level 2 | Level 3 | Total | |||||||||||||
Liabilities: | ||||||||||||||||
Futures | $ | (243,283 | ) | $ | –0 | – | $ | –0 | – | $ | (243,283 | )(b) | ||||
Forward Currency Exchange Contracts | –0 | – | (947,417 | ) | –0 | – | (947,417 | ) | ||||||||
Centrally Cleared Credit Default Swaps | –0 | – | (169,888 | ) | –0 | – | (169,888 | )(b) | ||||||||
Centrally Cleared Interest Rate Swaps | –0 | – | (450,705 | ) | –0 | – | (450,705 | )(b) | ||||||||
Credit Default Swaps | –0 | – | (63,264 | ) | –0 | – | (63,264 | ) | ||||||||
Inflation (CPI) Swaps | –0 | – | (297,162 | ) | –0 | – | (297,162 | ) | ||||||||
|
|
|
|
|
|
|
| |||||||||
Total | $ | 159,023,259 | $ | 96,215,546 | $ | –0 | – | $ | 255,238,805 | (c) | ||||||
|
|
|
|
|
|
|
| |||||||||
| (a) | Other financial instruments are derivative instruments, such as futures, forwards and swaps, which are valued at the unrealized appreciation/(depreciation) on the instrument. Other financial instruments may also include swaps with upfront premiums, options written and swaptions written which are valued at market value. |
| (b) | Only variation margin receivable/(payable) at period end is reported within the statement of assets and liabilities. This amount reflects cumulative unrealized appreciation/(depreciation) on futures and centrally cleared swaps as reported in the portfolio of investments. Where applicable, centrally cleared swaps with upfront premiums are presented here at market value. |
| (c) | Amounts of $449,187, $1,355,132 and $938,551 for Asset-Backed Securities, Collateralized Loan Obligations and Commercial Mortgage-Backed Securities, respectively, were transferred out of Level 3 into Level 2 as improved transparency of price inputs received from pricing vendors has increased the observability during the reporting period. |
3. Currency Translation
Assets and liabilities denominated in foreign currencies and commitments under forward currency exchange contracts are translated into U.S. dollars at the mean of the quoted bid and ask prices of such currencies against the U.S. dollar. Purchases and sales of portfolio securities are translated into U.S. dollars at the rates of exchange prevailing when such securities were acquired or sold. Income and expenses are translated into U.S. dollars at rates of exchange prevailing when accrued.
Net realized gain or loss on foreign currency transactions represents foreign exchange gains and losses from sales and maturities of foreign fixed income investments, holding of foreign currencies, currency gains or losses realized between the trade and settlement dates on foreign investment transactions, and the difference between the amounts of dividends, interest and foreign withholding taxes recorded on the Portfolio’s books and the U.S. dollar equivalent amounts actually received or paid. Net unrealized currency gains and losses from valuing foreign currency denominated assets and liabilities at period end exchange rates are reflected as a component of net unrealized appreciation or depreciation of foreign currency denominated assets and liabilities.
4. Taxes
It is the Portfolio’s policy to meet the requirements of the Internal Revenue Code applicable to regulated investment companies and to distribute all of its investment company taxable income and net realized gains, if any, to shareholders. Therefore, no provisions for federal income or excise taxes are required. The Portfolio may be subject to taxes imposed by countries in which it invests. Such taxes are generally based on income and/or capital gains earned or repatriated. Taxes are accrued and applied to net investment income, net realized gains and net unrealized appreciation/depreciation as such income and/or gains are earned.
In accordance with U.S. GAAP requirements regarding accounting for uncertainties in income taxes, management has analyzed the Portfolio’s tax positions taken or expected to be taken on federal and state income tax returns for all open tax years (the current and the prior three tax years) and has concluded that no provision for income tax is required in the Portfolio’s financial statements.
5. Investment Income and Investment Transactions
Dividend income is recorded on theex-dividend date or as soon as the Portfolio is informed of the dividend. Interest income is accrued daily. Investment transactions are accounted for on the date the securities are purchased or sold. Investment gains or losses are determined on the identified cost basis. The Portfolio amortizes premiums and accretes discounts as adjustments to interest income.
6. Class Allocations
All income earned and expenses incurred by the Portfolio are borne on apro-rata basis by each outstanding class of shares, based on the proportionate interest in the Portfolio represented by the net assets of such class, except for class specific
37
| BALANCED WEALTH STRATEGY PORTFOLIO | ||
| NOTES TO FINANCIAL STATEMENTS | ||
| (continued) | AB Variable Products Series Fund | |
expenses which are allocated to the respective class. Expenses of the Fund are charged proportionately to each portfolio or based on other appropriate methods. Realized and unrealized gains and losses are allocated among the various share classes based on respective net assets.
7. Dividends and Distributions
Dividends and distributions to shareholders, if any, are recorded on theex-dividend date. Income dividends and capital gains distributions are determined in accordance with federal tax regulations and may differ from those determined in accordance with U.S. GAAP. To the extent these differences are permanent, such amounts are reclassified within the capital accounts based on their federal tax basis treatment; temporary differences do not require such reclassification.
NOTE B: Advisory Fee and Other Transactions with Affiliates
Under the terms of the investment advisory agreement, the Portfolio pays the Adviser an advisory fee at an annual rate of .55% of the first $2.5 billion, .45% of the next $2.5 billion and .40% in excess of $5 billion, of the Portfolio’s average daily net assets. The fee is accrued daily and paid monthly. The Adviser has agreed to waive its fees and bear certain expenses to the extent necessary to limit total operating expenses on an annual basis (the “Expense Caps”) to .75% and 1.00% of daily average net assets for Class A and Class B shares, respectively. For the year ended December 31, 2019, there were no expenses waived by the Adviser.
Pursuant to the investment advisory agreement, the Portfolio may reimburse the Adviser for certain legal and accounting services provided to the Portfolio by the Adviser. For the year ended December 31, 2019, the reimbursement for such services amounted to $79,715.
The Portfolio compensates AllianceBernstein Investor Services, Inc. (“ABIS”), a wholly-owned subsidiary of the Adviser, under a Transfer Agency Agreement for providing personnel and facilities to perform transfer agency services for the Portfolio. Such compensation retained by ABIS amounted to $1,491 for the year ended December 31, 2019.
The Portfolio may invest in AB Government Money Market Portfolio (the “Government Money Market Portfolio”) which has a contractual annual advisory fee rate of .20% of the portfolio’s average daily net assets and bears its own expenses. The Adviser has contractually agreed to waive .10% of the advisory fee of Government Money Market Portfolio (resulting in a net advisory fee of ..10%) until August 31, 2020. In connection with the investment by the Portfolio in Government Money Market Portfolio, the Adviser has contractually agreed to waive its advisory fee from the Portfolio in an amount equal to the Portfolio’s pro rata share of the effective advisory fee of Government Money Market Portfolio, as borne indirectly by the Portfolio as an acquired fund fee and expense. For the year ended December 31, 2019, such waiver amounted to $1,007.
In connection with the Portfolio’s investments in other AB mutual funds, the Adviser has contractually agreed to waive fees and/or reimburse the expenses payable to the Adviser by the Portfolio in an amount equal to the Portfolio’s pro rata share of the effective advisory fees of AB mutual funds, as paid by the Portfolio as an acquired fund fee and expense. These fee waivers and/or expense reimbursements will remain in effect until December 31, 2019. For the year ended December 31, 2019, such waivers and/or reimbursements amounted to $518,640.
A summary of the Portfolio’s transactions in AB mutual funds for the year ended December 31, 2019 is as follows:
| Distributions | ||||||||||||||||||||||||||||||||
Fund | Market Value 12/31/18 (000) | Purchases at Cost (000) | Sales Proceeds (000) | Realized Gain (Loss) (000) | Change in Unrealized Appr./(Depr.) (000) | Market Value 12/31/19 (000) | Dividend Income (000) | Realized Gains (000) | ||||||||||||||||||||||||
Government Money Market Portfolio | $ | 241 | $ | 56,356 | $ | 54,776 | $ | 0 | $ | 0 | $ | 1,821 | $ | 23 | $ | 0 | ||||||||||||||||
AB Discovery Growth Fund, Inc. | 2,778 | 198 | 326 | (34 | ) | 691 | 3,307 | 0 | 198 | |||||||||||||||||||||||
AB Discovery Value Fund, Inc. | 2,913 | 142 | 179 | (28 | ) | 471 | 3,319 | 35 | 106 | |||||||||||||||||||||||
Bernstein Fund, Inc.: | ||||||||||||||||||||||||||||||||
International Small Cap Portfolio | 7,778 | 173 | 500 | (76 | ) | 1,396 | 8,771 | 173 | 0 | |||||||||||||||||||||||
International Strategic Equities Portfolio | 27,139 | 595 | 3,615 | (189 | ) | 4,793 | 28,723 | 595 | 0 | |||||||||||||||||||||||
Small Cap Core Portfolio | 2,801 | 16 | 166 | (15 | ) | 676 | 3,312 | 16 | 0 | |||||||||||||||||||||||
38
| AB Variable Products Series Fund | ||
| Distributions | ||||||||||||||||||||||||||||||||
Fund | Market Value 12/31/18 (000) | Purchases at Cost (000) | Sales Proceeds (000) | Realized Gain (Loss) (000) | Change in Unrealized Appr./(Depr.) (000) | Market Value 12/31/19 (000) | Dividend Income (000) | Realized Gains (000) | ||||||||||||||||||||||||
Sanford C. Bernstein Fund, Inc.: | ||||||||||||||||||||||||||||||||
Emerging Markets Portfolio | $ | 3,686 | $ | 74 | $ | 471 | $ | (39 | ) | $ | 866 | $ | 4,116 | $ | 74 | $ | 0 | |||||||||||||||
International Portfolio | 14,880 | 303 | 1,907 | (128 | ) | 2,997 | 16,145 | 303 | 0 | |||||||||||||||||||||||
Government Money Market Portfolio* | 155 | 9,032 | 8,929 | 0 | 0 | 258 | 2 | 0 | ||||||||||||||||||||||||
|
|
|
|
|
|
|
|
|
| |||||||||||||||||||||||
Total | $ | (509 | ) | $ | 11,890 | $ | 69,772 | $ | 1,221 | $ | 304 | |||||||||||||||||||||
|
|
|
|
|
|
|
|
|
| |||||||||||||||||||||||
| * | Investments of cash collateral for securities lending transactions (see Note E). |
During the year ended December 31, 2018, the Adviser reimbursed the Portfolio $3,140 for trading losses incurred due to a trade entry error.
Brokerage commissions paid on investment transactions for the year ended December 31, 2019 amounted to $17,083, of which $211 and $0, respectively, was paid to Sanford C. Bernstein & Co. LLC and Sanford C. Bernstein Limited, affiliates of the Adviser.
During the second quarter of 2018, AXA S.A. (“AXA”), a French holding company for the AXA Group, a worldwide leader in life, property and casualty and health insurance and asset management, completed the sale of a minority stake in its subsidiary, AXA Equitable Holdings, Inc. (now named Equitable Holdings, Inc.)(“Equitable”), through an initial public offering. Equitable is the holding company for a diverse group of financial services companies, including an approximately 65.3% economic interest in the Adviser and a 100% interest in AllianceBernstein Corporation, the general partner of the Adviser. Since the initial sale, AXA has completed additional offerings, most recently during the fourth quarter of 2019. As a result, AXA currently owns 10.1% of the outstanding shares of common stock of Equitable, and no longer owns a controlling interest in Equitable. AXA previously announced its intention to sell its entire interest in Equitable over time, subject to market conditions and other factors (the “Plan”). Most of AXA’s remaining Equitable shares are to be delivered on redemption of AXA bonds mandatorily exchangeable into Equitable shares and maturing in May 2021. AXA retains sole discretion to determine the timing of any future sales of its remaining shares of Equitable common stock.
The latest transaction under the Plan, which occurred on November 13, 2019, resulted in the indirect transfer of a “controlling block” of voting securities of the Adviser (a “Change of Control Event”) and was deemed an “assignment” causing a termination of the Portfolio’s investment advisory agreement. In order to ensure that investment advisory services could continue uninterrupted in the event of a Change of Control Event, the Board previously approved a new investment advisory agreement with the Adviser, and shareholders of the Portfolio subsequently approved the new investment advisory agreement. This agreement became effective on November 13, 2019.
NOTE C: Distribution Plan
The Portfolio has adopted a Distribution Plan (the “Plan”) for Class B shares pursuant to Rule12b-1 under the Investment Company Act of 1940. Under the Plan, the Portfolio pays distribution and servicing fees to AllianceBernstein Investments, Inc. (the “Distributor”), a wholly-owned subsidiary of the Adviser, at an annual rate of up to .50% of the Portfolio’s average daily net assets attributable to Class B shares. The fees are accrued daily and paid monthly. The Board currently limits payments under the Plan to .25% of the Portfolio’s average daily net assets attributable to Class B shares. The Plan provides that the Distributor will use such payments in their entirety for distribution assistance and promotional activities.
The Portfolio is not obligated under the Plan to pay any distribution and servicing fees in excess of the amounts set forth above. The purpose of the payments to the Distributor under the Plan is to compensate the Distributor for its distribution services with respect to the sale of the Portfolio’s Class B shares. Since the Distributor’s compensation is not directly tied to its expenses, the amount of compensation received by it under the Plan during any year may be more or less than its actual expenses. For this reason, the Plan is characterized by the staff of the Securities and Exchange Commission as being of the “compensation” variety.
In the event that the Plan is terminated or not continued, no distribution or servicing fees (other than current amounts accrued but not yet paid) would be owed by the Portfolio to the Distributor.
39
| BALANCED WEALTH STRATEGY PORTFOLIO | ||
| NOTES TO FINANCIAL STATEMENTS | ||
| (continued) | AB Variable Products Series Fund | |
The Plan also provides that the Adviser may use its own resources to finance the distribution of the Portfolio’s shares.
NOTE D: Investment Transactions
Purchases and sales of investment securities (excluding short-term investments) for the year ended December 31, 2019 were as follows:
| Purchases | Sales | |||||||
Investment securities (excluding U.S. government securities) | $ | 124,300,391 | $ | 143,077,522 | ||||
U.S. government securities | 31,781,685 | 29,018,244 | ||||||
The cost of investments for federal income tax purposes, gross unrealized appreciation and unrealized depreciation are as follows:
Cost | $ | 233,292,505 | ||
|
| |||
Gross unrealized appreciation | 29,268,810 | |||
Gross unrealized depreciation | (6,282,749 | ) | ||
|
| |||
Net unrealized appreciation | $ | 22,986,061 | ||
|
|
1. Derivative Financial Instruments
The Portfolio may use derivatives in an effort to earn income and enhance returns, to replace more traditional direct investments, to obtain exposure to otherwise inaccessible markets (collectively, “investment purposes”), or to hedge or adjust the risk profile of its portfolio.
The principal types of derivatives utilized by the Portfolio, as well as the methods in which they may be used are:
| • | Futures |
The Portfolio may buy or sell futures for investment purposes or for the purpose of hedging its portfolio against adverse effects of potential movements in the market. The Portfolio bears the market risk that arises from changes in the value of these instruments and the imperfect correlation between movements in the price of the futures and movements in the price of the assets, reference rates or indices which they are designed to track. Among other things, the Portfolio may purchase or sell futures for foreign currencies or options thereon fornon-hedging purposes as a means of making direct investment in foreign currencies, as described below under “Currency Transactions”.
At the time the Portfolio enters into futures, the Portfolio deposits and maintains as collateral an initial margin with the broker, as required by the exchange on which the transaction is effected. Such amount is shown as cash collateral due from broker on the statement of assets and liabilities. Pursuant to the contract, the Portfolio agrees to receive from or pay to the broker an amount of cash equal to the daily fluctuation in the value of the contract. Such receipts or payments are known as variation margin and are recorded by the Portfolio as unrealized gains or losses. Risks may arise from the potential inability of a counterparty to meet the terms of the contract. The credit/counterparty risk for exchange-traded futures is generally less than privately negotiated futures, since the clearinghouse, which is the issuer or counterparty to each exchange-traded future, has robust risk mitigation standards, including the requirement to provide initial and variation margin. When the contract is closed, the Portfolio records a realized gain or loss equal to the difference between the value of the contract at the time it was opened and the time it was closed.
Use of long futures subjects the Portfolio to risk of loss in excess of the amounts shown on the statement of assets and liabilities, up to the notional value of the futures. Use of short futures subjects the Portfolio to unlimited risk of loss. Under some circumstances, futures exchanges may establish daily limits on the amount that the price of futures can vary from the previous day’s settlement price, which could effectively prevent liquidation of unfavorable positions.
During the year ended December 31, 2019, the Portfolio held futures for hedging andnon-hedging purposes.
| • | Forward Currency Exchange Contracts |
The Portfolio may enter into forward currency exchange contracts in order to hedge its exposure to changes in foreign currency exchange rates on its foreign portfolio holdings, to hedge certain firm purchase and sale commitments denominated in foreign currencies and fornon-hedging purposes as a means of making direct investments in foreign currencies, as described below under “Currency Transactions”.
40
| AB Variable Products Series Fund | ||
A forward currency exchange contract is a commitment to purchase or sell a foreign currency at a future date at a negotiated forward rate. The gain or loss arising from the difference between the original contract and the closing of such contract would be included in net realized gain or loss on forward currency exchange contracts. Fluctuations in the value of open forward currency exchange contracts are recorded for financial reporting purposes as unrealized appreciation and/or depreciation by the Portfolio. Risks may arise from the potential inability of a counterparty to meet the terms of a contract and from unanticipated movements in the value of a foreign currency relative to the U.S. dollar.
During the year ended December 31, 2019, the Portfolio held forward currency exchange contracts for hedging andnon-hedging purposes.
| • | Swaps |
The Portfolio may enter into swaps to hedge its exposure to interest rates, credit risk or currencies. The Portfolio may also enter into swaps fornon-hedging purposes as a means of gaining market exposures, making direct investments in foreign currencies, as described below under “Currency Transactions.” A swap is an agreement that obligates two parties to exchange a series of cash flows at specified intervals based upon or calculated by reference to changes in specified prices or rates for a specified amount of an underlying asset. The payment flows are usually netted against each other, with the difference being paid by one party to the other. In addition, collateral may be pledged or received by the Portfolio in accordance with the terms of the respective swaps to provide value and recourse to the Portfolio or its counterparties in the event of default, bankruptcy or insolvency by one of the parties to the swap.
Risks may arise as a result of the failure of the counterparty to the swap to comply with the terms of the swap. The loss incurred by the failure of a counterparty is generally limited to the net interim payment to be received by the Portfolio, and/or the termination value at the end of the contract. Therefore, the Portfolio considers the creditworthiness of each counterparty to a swap in evaluating potential counterparty risk. This risk is mitigated by having a netting arrangement between the Portfolio and the counterparty and by the posting of collateral by the counterparty to the Portfolio to cover the Portfolio’s exposure to the counterparty. Additionally, risks may arise from unanticipated movements in interest rates or in the value of the underlying securities. The Portfolio accrues for the interim payments on swaps on a daily basis, with the net amount recorded within unrealized appreciation/depreciation of swaps on the statement of assets and liabilities, where applicable. Once the interim payments are settled in cash, the net amount is recorded as realized gain/(loss) on swaps on the statement of operations, in addition to any realized gain/(loss) recorded upon the termination of swaps. Upfront premiums paid or received for OTC swaps are recognized as cost or proceeds on the statement of assets and liabilities and are amortized on a straight line basis over the life of the contract. Amortized upfront premiums are included in net realized gain/(loss) from swaps on the statement of operations. Fluctuations in the value of swaps are recorded as a component of net change in unrealized appreciation/depreciation of swaps on the statement of operations.
Certain standardized swaps, including certain interest rate swaps and credit default swaps, are (or soon will be) subject to mandatory central clearing. Cleared swaps are transacted through futures commission merchants (“FCMs”) that are members of central clearinghouses, with the clearinghouse serving as central counterparty, similar to transactions in futures contracts. Centralized clearing will be required for additional categories of swaps on aphased-in basis based on requirements published by the Securities and Exchange Commission and Commodity Futures Trading Commission.
At the time the Portfolio enters into a centrally cleared swap, the Portfolio deposits and maintains as collateral an initial margin with the broker, as required by the clearinghouse on which the transaction is effected. Such amount is shown as cash collateral due from broker on the statement of assets and liabilities. Pursuant to the contract, the Portfolio agrees to receive from or pay to the broker an amount of cash equal to the daily fluctuation in the value of the contract. Such receipts or payments are known as variation margin and are recorded by the Portfolio as unrealized gains or losses. Risks may arise from the potential inability of a counterparty to meet the terms of the contract. The credit/counterparty risk for centrally cleared swaps is generally less thannon-centrally cleared swaps, since the clearinghouse, which is the issuer or counterparty to each centrally cleared swap, has robust risk mitigation standards, including the requirement to provide initial and variation margin. When the contract is closed, the Portfolio records a realized gain or loss equal to the difference between the value of the contract at the time it was opened and the time it was closed.
41
| BALANCED WEALTH STRATEGY PORTFOLIO | ||
| NOTES TO FINANCIAL STATEMENTS | ||
| (continued) | AB Variable Products Series Fund | |
Interest Rate Swaps:
The Portfolio is subject to interest rate risk exposure in the normal course of pursuing its investment objectives. Because the Portfolio holds fixed rate bonds, the value of these bonds may decrease if interest rates rise. To help hedge against this risk and to maintain its ability to generate income at prevailing market rates, the Portfolio may enter into interest rate swaps. Interest rate swaps are agreements between two parties to exchange cash flows based on a notional amount. The Portfolio may elect to pay a fixed rate and receive a floating rate, or, receive a fixed rate and pay a floating rate on a notional amount.
In addition, the Portfolio may also enter into interest rate swap transactions to preserve a return or spread on a particular investment or portion of its portfolio, or protecting against an increase in the price of securities the Portfolio anticipates purchasing at a later date. Interest rate swaps involve the exchange by a Portfolio with another party of their respective commitments to pay or receive interest (e.g., an exchange of floating rate payments for fixed rate payments) computed based on a contractually-based principal (or “notional”) amount. Interest rate swaps are entered into on a net basis (i.e., the two payment streams are netted out, with the Portfolio receiving or paying, as the case may be, only the net amount of the two payments).
During the year ended December 31, 2019, the Portfolio held interest rate swaps for hedging andnon-hedging purposes.
Inflation (CPI) Swaps:
Inflation swap agreements are contracts in which one party agrees to pay the cumulative percentage increase in a price index (the Consumer Price Index with respect to CPI swaps) over the term of the swap (with some lag on the inflation index), and the other pays a compounded fixed rate. Inflation swaps may be used to protect the net asset value, or NAV, of a Portfolio against an unexpected change in the rate of inflation measured by an inflation index since the value of these agreements is expected to increase if there are unexpected inflation increases.
During the year ended December 31, 2019, the Portfolio held inflation (CPI) swaps for hedging andnon-hedging purposes.
Credit Default Swaps:
The Portfolio may enter into credit default swaps, including to manage its exposure to the market or certain sectors of the market, to reduce its risk exposure to defaults by corporate and sovereign issuers held by the Portfolio, or to create exposure to corporate or sovereign issuers to which it is not otherwise exposed. The Portfolio may purchase credit protection (“Buy Contract”) or provide credit protection (“Sale Contract”) on the referenced obligation of the credit default swap. During the term of the swap, the Portfolio receives/(pays) fixed payments from/(to) the respective counterparty, calculated at the agreed upon rate applied to the notional amount. If the Portfolio is a buyer/(seller) of protection and a credit event occurs, as defined under the terms of the swap, the Portfolio will either (i) receive from the seller/(pay to the buyer) of protection an amount equal to the notional amount of the swap (the “Maximum Payout Amount”) and deliver/(take delivery of) the referenced obligation or (ii) receive/(pay) a net settlement amount in the form of cash or securities equal to the notional amount of the swap less the recovery value of the referenced obligation. In certain circumstances Maximum Payout Amounts may be partially offset by recovery values of the respective referenced obligations, upfront premium received upon entering into the agreement, or net amounts received from settlement of buy protection credit default swaps entered into by the Portfolio for the same referenced obligations with the same counterparty.
Credit default swaps may involve greater risks than if a Portfolio had invested in the referenced obligation directly. Credit default swaps are subject to general market risk, liquidity risk, counterparty risk and credit risk. If the Portfolio is a buyer of protection and no credit event occurs, it will lose the payments it made to its counterparty. If the Portfolio is a seller of protection and a credit event occurs, the value of the referenced obligation received by the Portfolio coupled with the periodic payments previously received, may be less than the Maximum Payout Amount it pays to the buyer, resulting in a net loss to the Portfolio.
Implied credit spreads over U.S. Treasuries of comparable maturity utilized in determining the market value of credit default swaps on issuers as of period end are disclosed in the portfolio of investments. The implied spreads serve as an indicator of the current status of the payment/performance risk and typically reflect the likelihood of default by the issuer of the referenced obligation. The implied credit spread of a particular reference obligation also
42
| AB Variable Products Series Fund | ||
reflects the cost of buying/selling protection and may reflect upfront payments required to be made to enter into the agreement. Widening credit spreads typically represent a deterioration of the referenced obligation’s credit soundness and greater likelihood of default or other credit event occurring as defined under the terms of the agreement. A credit spread identified as “Defaulted” indicates a credit event has occurred for the referenced obligation.
During the year ended December 31, 2019, the Portfolio held credit default swaps for hedging andnon-hedging purposes.
The Portfolio typically enters into International Swaps and Derivatives Association, Inc. Master Agreements (“ISDA Master Agreement”) with its OTC derivative contract counterparties in order to, among other things, reduce its credit risk to OTC counterparties. ISDA Master Agreements include provisions for general obligations, representations, collateral and events of default or termination. Under an ISDA Master Agreement, the Portfolio typically may offset with the OTC counterparty certain derivative financial instruments’ payables and/or receivables with collateral held and/or posted and create one single net payment(close-out netting) in the event of default or termination. In the event of a default by an OTC counterparty, the return of collateral with market value in excess of the Portfolio’s net liability, held by the defaulting party, may be delayed or denied.
The Portfolio’s ISDA Master Agreements may contain provisions for early termination of OTC derivative transactions in the event the net assets of the Portfolio decline below specific levels (“net asset contingent features”). If these levels are triggered, the Portfolio’s OTC counterparty has the right to terminate such transaction and require the Portfolio to pay or receive a settlement amount in connection with the terminated transaction. If OTC derivatives were held at period end, please refer to netting arrangements by the OTC counterparty table below for additional details.
During the year ended December 31, 2019, the Portfolio had entered into the following derivatives:
Asset Derivatives | Liability Derivatives | |||||||||||
Derivative Type | Statement of | Fair Value | Statement of | Fair Value | ||||||||
Interest rate contracts | Receivable/Payable for variation margin on futures | $ | 80,929 | * | Receivable/Payable for variation margin on futures | $ | 243,283 | * | ||||
Credit contracts | Receivable/Payable for variation margin on centrally cleared swaps | 56,256 | * | |||||||||
Interest rate contracts | Receivable/Payable for variation margin on centrally cleared swaps | 2,724 | * | Receivable/Payable for variation margin on centrally cleared swaps | 450,707 | * | ||||||
Foreign currency contracts | Unrealized appreciation on forward currency exchange contracts | 209,851 | Unrealized depreciation on forward currency exchange contracts | 947,417 | ||||||||
Interest rate contracts | Unrealized depreciation on inflation swaps | 297,162 | ||||||||||
Credit contracts | Market value on credit default swaps | 7,150 | Market value on credit default swaps | 63,264 | ||||||||
|
|
|
| |||||||||
Total | $ | 300,654 | $ | 2,058,089 | ||||||||
|
|
|
| |||||||||
| * | Only variation margin receivable/payable at period end is reported within the statement of assets and liabilities. This amount reflects cumulative unrealized appreciation/(depreciation) on futures and centrally cleared swaps as reported in the portfolio of investments. |
43
| BALANCED WEALTH STRATEGY PORTFOLIO | ||
| NOTES TO FINANCIAL STATEMENTS | ||
| (continued) | AB Variable Products Series Fund | |
Derivative Type | Location of Gain or (Loss) on Derivatives | Realized Gain or (Loss) on Derivatives | Change in Unrealized Appreciation or (Depreciation) | |||||||||
Interest rate contracts | Net realized gain (loss) on futures; Net change in unrealized appreciation/depreciation of futures | $ | 213,449 | $ | (499,006 | ) | ||||||
Foreign currency contracts | Net realized gain (loss) on forward currency exchange contracts; Net change in unrealized appreciation/depreciation of forward currency exchange contracts | (523,566 | ) | (607,777 | ) | |||||||
Interest rate contracts | Net realized gain (loss) on swaps; Net change in unrealized appreciation/depreciation of swaps | 548,770 | (635,492 | ) | ||||||||
Credit contracts | Net realized gain (loss) on swaps; Net change in unrealized appreciation/depreciation of swaps | (152,569 | ) | 229,709 | ||||||||
|
|
|
| |||||||||
Total | $ | 86,084 | $ | (1,512,566 | ) | |||||||
|
|
|
| |||||||||
The following table represents the average monthly volume of the Portfolio’s derivative transactions during the year ended December 31, 2019:
Futures: | ||||
Average notional amount of buy contracts | $ | 24,083,015 | ||
Average notional amount of sale contracts | $ | 17,238,201 | ||
Forward Currency Exchange Contracts: | ||||
Average principal amount of buy contracts | $ | 16,962,526 | ||
Average principal amount of sale contracts | $ | 57,860,216 | ||
Inflation Swaps: | ||||
Average notional amount | $ | 10,000,000 | ||
Centrally Cleared Interest Rate Swaps: | ||||
Average notional amount | $ | 22,441,598 | ||
Credit Default Swaps: | ||||
Average notional amount of buy contracts | $ | 1,081,333 | (a) | |
Average notional amount of sale contracts | $ | 1,934,077 | ||
Centrally Cleared Credit Default Swaps: | ||||
Average notional amount of buy contracts | $ | 4,236,663 | (b) | |
Average notional amount of sale contracts | $ | 2,594,425 | (c) |
| (a) | Positions were open for five months during the year. |
| (b) | Positions were open for ten months during the year. |
| (c) | Positions were open for two months during the year. |
For financial reporting purposes, the Portfolio does not offset derivative assets and derivative liabilities that are subject to netting arrangements in the statement of assets and liabilities.
44
| AB Variable Products Series Fund | ||
All OTC derivatives held at period end were subject to netting arrangements. The following table presents the Portfolio’s derivative assets and liabilities by OTC counterparty net of amounts available for offset under ISDA Master Agreements (“MA”) and net of the related collateral received/pledged by the Portfolio as of December 31, 2019. Exchange-traded derivatives and centrally cleared swaps are not subject to netting arrangements and as such are excluded from the table.
Counterparty | Derivative Assets Subject to a MA | Derivatives Available for Offset | Cash Collateral Received* | Security Collateral Received* | Net Amount of Derivative Assets | |||||||||||||||
Bank of America, NA | $ | 13,393 | $ | (13,393 | ) | $ | –0 | – | $ | –0 | – | $ | –0 | – | ||||||
BNP Paribas SA | 13,390 | –0 | – | –0 | – | –0 | – | 13,390 | ||||||||||||
Citibank, NA | 4,346 | (4,346 | ) | –0 | – | –0 | – | –0 | – | |||||||||||
Citigroup Global Markets, Inc. | 7,150 | (7,150 | ) | –0 | – | –0 | – | –0 | – | |||||||||||
Credit Suisse International | 66,948 | (14,984 | ) | –0 | – | –0 | – | 51,964 | ||||||||||||
Goldman Sachs Bank USA/Goldman Sachs International | 39,575 | (39,575 | ) | –0 | – | –0 | – | –0 | – | |||||||||||
Morgan Stanley & Co., Inc. | 24,250 | (24,250 | ) | –0 | – | –0 | – | –0 | – | |||||||||||
Standard Chartered Bank | 18,026 | (18,026 | ) | –0 | – | –0 | – | –0 | – | |||||||||||
State Street Bank & Trust Co. | 22,825 | (22,825 | ) | –0 | – | –0 | – | –0 | – | |||||||||||
UBS AG | 7,098 | (6,075 | ) | –0 | – | –0 | – | 1,023 | ||||||||||||
|
|
|
|
|
|
| �� |
|
| |||||||||||
Total | $ | 217,001 | $ | (150,624 | ) | $ | –0 | – | $ | –0 | – | $ | 66,377 | ^ | ||||||
|
|
|
|
|
|
|
|
|
| |||||||||||
Counterparty | Derivative Liabilities Subject to a MA | Derivatives Available for Offset | Cash Collateral Pledged* | Security Collateral Pledged* | Net Amount of Derivative Liabilities | |||||||||||||||
Bank of America, NA | $ | 333,662 | $ | (13,393 | ) | $ | (274,000 | ) | $ | –0 | – | $ | 46,269 | |||||||
Barclays Bank PLC | 3,935 | –0 | – | –0 | – | –0 | – | 3,935 | ||||||||||||
Brown Brothers Harriman & Co. | 2,760 | –0 | – | –0 | – | –0 | – | 2,760 | ||||||||||||
Citibank, NA | 36,700 | (4,346 | ) | –0 | – | –0 | – | 32,354 | ||||||||||||
Citigroup Global Markets, Inc. | 13,397 | (7,150 | ) | –0 | – | –0 | – | 6,247 | ||||||||||||
Credit Suisse International | 14,984 | (14,984 | ) | –0 | – | –0 | – | –0 | – | |||||||||||
Deutsche Bank AG | 12,598 | –0 | – | –0 | – | –0 | – | 12,598 | ||||||||||||
Goldman Sachs Bank USA/Goldman Sachs International | 100,155 | (39,575 | ) | –0 | – | –0 | – | 60,580 | ||||||||||||
Morgan Stanley & Co., Inc. | 101,659 | (24,250 | ) | –0 | – | –0 | – | 77,409 | ||||||||||||
Natwest Markets PLC | 438,237 | –0 | – | –0 | – | –0 | – | 438,237 | ||||||||||||
Standard Chartered Bank | 114,717 | (18,026 | ) | –0 | – | –0 | – | 96,691 | ||||||||||||
State Street Bank & Trust Co. | 128,964 | (22,825 | ) | –0 | – | –0 | – | 106,139 | ||||||||||||
UBS AG | 6,075 | (6,075 | ) | –0 | – | –0 | – | –0 | – | |||||||||||
|
|
|
|
|
|
|
|
|
| |||||||||||
Total | $ | 1,307,843 | $ | (150,624 | ) | $ | (274,000 | ) | $ | –0 | – | $ | 883,219 | ^ | ||||||
|
|
|
|
|
|
|
|
|
| |||||||||||
| * | The actual collateral received/pledged may be more than the amount reported due to over-collateralization. |
| ^ | Net amount represents the net receivable/payable that would be due from/to the counterparty in the event of default or termination. The net amount from OTC financial derivative instruments can only be netted across transactions governed under the same master agreement with the same counterparty. |
2. Currency Transactions
The Portfolio may invest innon-U.S. Dollar-denominated securities on a currency hedged or unhedged basis. The Portfolio may seek investment opportunities by taking long or short positions in currencies through the use of currency-related derivatives, including forward currency exchange contracts, futures and options on futures, swaps, and other options. The Portfolio may enter into transactions for investment opportunities when it anticipates that a foreign currency will appreciate or depreciate in value but securities denominated in that currency are not held by the Portfolio and do not present attractive investment opportunities. Such transactions may also be used when the Adviser believes that it may be more efficient than a direct investment in a foreign currency-denominated security. The Portfolio may also conduct currency exchange contracts on a spot basis (i.e., for cash at the spot rate prevailing in the currency exchange market for buying or selling currencies).
45
| BALANCED WEALTH STRATEGY PORTFOLIO | ||
| NOTES TO FINANCIAL STATEMENTS | ||
| (continued) | AB Variable Products Series Fund | |
3. TBA and Dollar Rolls
The Portfolio may invest in TBA mortgage-backed securities. A TBA, or “To Be Announced”, trade represents a contract for the purchase or sale of mortgage-backed securities to be delivered at a future agree-upon date; however, the specific mortgage pool numbers or the number of pools that will be delivered to fulfill the trade obligation or terms of the contract are unknown at the time of the trade. Mortgage pools (including fixed-rate or variable-rate mortgages) guaranteed by the Government National Mortgage Association, or GNMA, the Federal National Mortgage Association, or FNMA, or the Federal Home Loan Mortgage Corporation, or FHLMC, are subsequently allocated to the TBA transactions.
The Portfolio may enter into certain TBA transactions known as dollar rolls. Dollar rolls involve sales by the Portfolio of securities for delivery in the current month and the Portfolio’s simultaneously contracting to repurchase substantially similar (same type and coupon) securities on a specified future date. During the roll period, the Portfolio forgoes principal and interest paid on the securities. The Portfolio is compensated by the difference between the current sales price and the lower forward price for the future purchase (often referred to as the “drop”) as well as by the interest earned on the cash proceeds of the initial sale. Dollar rolls involve the risk that the market value of the securities the Portfolio is obligated to repurchase under the agreement may decline below the repurchase price. Dollar rolls are speculative techniques. For the year ended December 31, 2019, the Portfolio earned drop income of $8,272 which is included in interest income in the accompanying statement of operations.
NOTE E: Securities Lending
The Portfolio may enter into securities lending transactions. Under the Portfolio’s securities lending program, all loans of securities will be collateralized continually by cash collateral and/ornon-cash collateral.Non-cash collateral will include only securities issued or guaranteed by the U.S. government or its agencies or instrumentalities. The Portfolio cannot sell or repledge anynon-cash collateral, such collateral will not be reflected in the portfolio of investments. If a loan is collateralized by cash, the Portfolio will be compensated for the loan from a portion of the net return from the income earned on cash collateral after a rebate is paid to the borrower (in some cases, this rebate may be a “negative rebate” or fee paid by the borrower to the Portfolio in connection with the loan), and payments are made for fees of the securities lending agent and for certain other administrative expenses. If the Portfolio receivesnon-cash collateral, the Portfolio will receive a fee from the borrower generally equal to a negotiated percentage of the market value of the loaned securities. The Portfolio will have the right to call a loan and obtain the securities loaned at any time on notice to the borrower within the normal and customary settlement time for the securities. While the securities are on loan, the borrower is obligated to pay the Portfolio amounts equal to any income or other distributions from the securities. The Portfolio will not be able to exercise voting rights with respect to any securities during the existence of a loan, but will have the right to regain ownership of loaned securities in order to exercise voting or other ownership rights. Collateral received and securities loaned are marked to market daily to ensure that the securities loaned are secured by collateral. The lending agent currently invests the cash collateral received in Government Money Market Portfolio, an eligible money market vehicle, in accordance with the investment restrictions of the Portfolio, and as approved by the Board. The collateral received on securities loaned is recorded as an asset as well as a corresponding liability in the statement of assets and liabilities. The collateral will be adjusted the next business day to maintain the required collateral amount. The amounts of securities lending income from the borrowers and Government Money Market Portfolio are reflected in the statement of operations. When the Portfolio earns net securities lending income from Government Money Market Portfolio, the income is inclusive of a rebate expense paid to the borrower. In connection with the cash collateral investment by the Portfolio in Government Money Market Portfolio, the Adviser has agreed to waive a portion of the Portfolio’s share of the advisory fees of Government Money Market Portfolio, as borne indirectly by the Portfolio as an acquired fund fee and expense. When the Portfolio lends securities, its investment performance will continue to reflect changes in the value of the securities loaned. A principal risk of lending portfolio securities is that the borrower may fail to return the loaned securities upon termination of the loan and that the collateral will not be sufficient to replace the loaned securities. The lending agent has agreed to indemnify the Portfolio in the case of default of any securities borrower.
A summary of the Portfolio’s transactions surrounding securities lending for the year ended December 31, 2019 is as follows:
| Government Money Market Portfolio | ||||||||||||||||||||||
| Market Value of Securities on Loan* | Cash Collateral* | Market Value of Non-Cash Collateral* | Income from Borrowers | Income Earned | Advisory Fee Waived | |||||||||||||||||
| $ | 2,136,974 | $ | 258,450 | $ | 1,922,290 | $ | 2,393 | $ | 1,523 | $ | 74 | |||||||||||
| * | As of December 31, 2019. |
46
| AB Variable Products Series Fund | ||
NOTE F: Capital Stock
Each class consists of 500,000,000 authorized shares. Transactions in capital shares for each class were as follows:
| SHARES | AMOUNT | |||||||||||||||||||
| Year Ended December 31, 2019 | Year Ended December 31, 2018 | Year Ended December 31, 2019 | Year Ended December 31, 2018 | |||||||||||||||||
Class A | ||||||||||||||||||||
Shares sold | 78,265 | 69,093 | $ | 848,106 | $ | 811,711 | ||||||||||||||
Shares issued in reinvestment of dividends and distributions | 367,208 | 235,375 | 3,532,547 | 2,582,059 | ||||||||||||||||
Shares redeemed | (441,090 | ) | (402,656 | ) | (4,638,019 | ) | (4,591,886 | ) | ||||||||||||
|
|
|
|
|
|
|
| |||||||||||||
Net increase (decrease) | 4,383 | (98,188 | ) | $ | (257,366 | ) | $ | (1,198,116 | ) | |||||||||||
|
|
|
|
|
|
|
| |||||||||||||
Class B | ||||||||||||||||||||
Shares sold | 1,141,276 | 894,991 | $ | 12,135,176 | $ | 10,112,751 | ||||||||||||||
Shares issued in reinvestment of dividends | 3,456,725 | 2,129,493 | 32,838,881 | 23,105,000 | ||||||||||||||||
Shares redeemed | (3,799,936 | ) | (4,303,899 | ) | (39,633,910 | ) | (48,570,965 | ) | ||||||||||||
|
|
|
|
|
|
|
| |||||||||||||
Net increase (decrease) | 798,065 | (1,279,415 | ) | $ | 5,340,147 | $ | (15,353,214 | ) | ||||||||||||
|
|
|
|
|
|
|
| |||||||||||||
At December 31, 2019, certain shareholders of the Portfolio owned 64% in aggregate of the Portfolio’s outstanding shares. Significant transactions by such shareholders, if any, may impact the Portfolio’s performance.
NOTE G: Risks Involved in Investing in the Portfolio
Allocation Risk—The allocation of investments among the different investment styles, such as growth or value, equity or debt securities, or U.S. ornon-U.S. securities may have a more significant effect on the Portfolio’s net asset value, or NAV, when one of these investment strategies is performing more poorly than others.
Foreign (Non-U.S.) Risk—Investments in securities ofnon-U.S. issuers may involve more risk than those of U.S. issuers. These securities may fluctuate more widely in price and may be more difficult to trade or dispose of due to adverse market, economic, political, regulatory or other factors. These risks may be heightened with respect to investments in emerging market countries, where there may be an increased amount of economic, political and social instability.
Currency Risk—Fluctuations in currency exchange rates may negatively affect the value of the Portfolio’s investments or reduce the Portfolio’s returns.
Interest Rate Risk—Changes in interest rates will affect the value of investments in fixed-income securities. When interest rates rise, the value of existing investments in fixed-income securities tends to fall and this decrease in value may not be offset by higher income from new investments. Interest rate risk is generally greater for fixed-income securities with longer maturities or durations.
Credit Risk—An issuer or guarantor of a fixed-income security, or the counterparty to a derivatives or other contract, may be unable or unwilling to make timely payments of interest or principal, or to otherwise honor its obligations. The issuer or guarantor may default, causing a loss of the full principal amount of a security and accrued interest. The degree of risk for a particular security may be reflected in its credit rating. There is the possibility that the credit rating of a fixed-income security may be downgraded after purchase, which may adversely affect the value of the security.
Below Investment Grade Securities Risk—Investments in fixed-income securities with lower ratings (“junk bonds”) tend to have a higher probability that an issuer will default or fail to meet its payment obligations. These securities may be subject to greater price volatility due to such factors as specific corporate developments, interest rate sensitivity, negative perceptions of the junk bond market generally and may be more difficult to trade or dispose of than other types of securities.
Capitalization Risk—Investments in small- and mid-capitalization companies may be more volatile than investments in large-capitalization companies. Investments in small-capitalization companies may have additional risks because these companies have limited product lines, markets or financial resources.
Investment in Other Investment Companies Risk—As with other investments, investments in other investment companies are subject to market and selection risk. In addition, shareholders invested in the Portfolio bear both their proportionate share
47
| BALANCED WEALTH STRATEGY PORTFOLIO | ||
| NOTES TO FINANCIAL STATEMENTS | ||
| (continued) | AB Variable Products Series Fund | |
of expenses in the Portfolio (including advisory fees) and, indirectly, the expenses of the investment companies (to the extent these expenses are not waived or reimbursed by the Adviser).
Derivatives Risk—The Portfolio may enter into derivative transactions such as forwards, options, futures and swaps. Derivatives may be illiquid, difficult to price, and leveraged so that small changes may produce disproportionate losses for the Portfolio, and subject to counterparty risk to a greater degree than more traditional investments. Derivatives may result in significant losses, including losses that are far greater than the value of the derivatives reflected on the statement of assets and liabilities.
Real Asset Risk—The Portfolio’s investments in securities linked to real assets involve significant risks, including financial, operating, and competitive risks. Investments in securities linked to real assets expose the Portfolio to adverse macroeconomic conditions, such as a rise in interest rates or a downturn in the economy in which the asset is located. Changes in inflation rates or in the market’s inflation expectations may adversely affect the market value of inflation-sensitive equities. The Portfolio’s investments in real estate securities have many of the same risks as direct ownership of real estate, including the risk that the value of real estate could decline due to a variety of factors that affect the real estate market generally. Investments in real estate investment trusts (“REITs”) may have additional risks. REITs are dependent on the capability of their managers, may have limited diversification, and could be significantly affected by changes in tax laws.
Active Trading Risk—The Portfolio expects to engage in active and frequent trading of its portfolio securities and its portfolio turnover rate is expected to exceed 100%. A higher rate of portfolio turnover increases transaction costs, which may negatively affect the Portfolio’s return.
LIBOR Risk—The Portfolio may invest in certain debt securities, derivatives or other financial instruments that utilize the London Interbank Offered Rate, or “LIBOR,” as a “benchmark” or “reference rate” for various interest rate calculations. In July 2017, the United Kingdom Financial Conduct Authority, which regulates LIBOR, announced a desire to phase out the use of LIBOR by the end of 2021. Although financial regulators and industry working groups have suggested alternative reference rates, such as European Interbank Offer Rate (“EURIBOR”), Sterling Overnight Interbank Average Rate (“SONIA”) and Secured Overnight Financing Rate (“SOFR”), global consensus on alternative rates is lacking and the process for amending existing contracts or instruments to transition away from LIBOR remains unclear. The elimination of LIBOR or changes to other reference rates or any other changes or reforms to the determination or supervision of reference rates could have an adverse impact on the market for, or value of, any securities or payments linked to those reference rates, which may adversely affect the Portfolio’s performance and/or net asset value. Uncertainty and risk also remain regarding the willingness and ability of issuers and lenders to include revised provisions in new and existing contracts or instruments. Consequently, the transition away from LIBOR to other reference rates may lead to increased volatility and illiquidity in markets that are tied to LIBOR, fluctuations in values of LIBOR-related investments or investments in issuers that utilize LIBOR, increased difficulty in borrowing or refinancing and diminished effectiveness of hedging strategies, adversely affecting the Portfolio’s performance. Furthermore, the risks associated with the expected discontinuation of LIBOR and transition may be exacerbated if the work necessary to effect an orderly transition to an alternative reference rate is not completed in a timely manner. Because the usefulness of LIBOR as a benchmark could deteriorate during the transition period, these effects could occur prior to the end of 2021.
Indemnification Risk—In the ordinary course of business, the Portfolio enters into contracts that contain a variety of indemnifications. The Portfolio’s maximum exposure under these arrangements is unknown. However, the Portfolio has not had prior claims or losses pursuant to these indemnification provisions and expects the risk of loss thereunder to be remote. Therefore, the Portfolio has not accrued any liability in connection with these indemnification provisions.
NOTE H: Joint Credit Facility
A number ofopen-end mutual funds managed by the Adviser, including the Portfolio, participate in a $325 million revolving credit facility (the “Facility”) intended to provide short-term financing, if necessary, subject to certain restrictions in connection with abnormal redemption activity. Commitment fees related to the Facility are paid by the participating funds and are included in miscellaneous expenses in the statement of operations. The Portfolio did not utilize the Facility during the year ended December 31, 2019.
48
| AB Variable Products Series Fund | ||
NOTE I: Distributions to Shareholders
The tax character of distributions paid during the fiscal years ended December 31, 2019 and December 31, 2018 were as follows:
| 2019 | 2018 | |||||||
Distributions paid from: | ||||||||
Ordinary income | $ | 5,933,950 | $ | 6,160,964 | ||||
Net long-term capital gains | 30,437,478 | 19,526,096 | ||||||
|
|
|
| |||||
Total taxable distributions paid | $ | 36,371,428 | $ | 25,687,060 | ||||
|
|
|
| |||||
As of December 31, 2019, the components of accumulated earnings/(deficit) on a tax basis were as follows:
Undistributed ordinary income | $ | 5,215,391 | ||
Undistributed capital gains | 6,836,715 | |||
Other losses | (8,642 | )(a) | ||
Unrealized appreciation/(depreciation) | 22,955,217 | (b) | ||
|
| |||
Total accumulated earnings/(deficit) | $ | 34,998,681 | (c) | |
|
|
| (a) | As of December 31, 2019, the cumulative deferred loss on straddles was $8,642. |
| (b) | The differences between book-basis and tax-basis unrealized appreciation/(depreciation) are attributable primarily to the recognition for tax purposes of unrealized gains/losses on certain derivative instruments, the tax treatment of passive foreign investment companies (PFICs), the tax treatment of Treasury inflation-protected securities, the tax treatment of swaps, the tax deferral of losses on wash sales, and the tax treatment of partnership investments. |
| (c) | The differences between book-basis andtax-basis components of accumulated earnings/(deficit) is attributable primarily to the accrual of foreign capital gains tax. |
For tax purposes, net realized capital losses may be carried over to offset future capital gains, if any. Funds are permitted to carry forward capital losses for an indefinite period, and such losses will retain their character as either short-term or long-term capital losses. As of December 31, 2019, the Portfolio did not have any capital loss carryforwards.
During the current fiscal year, there were no permanent differences that resulted in adjustments to distributable earnings or additional paid-in capital.
NOTE J: Recent Accounting Pronouncements
In March 2017, the Financial Accounting Standards Board issued an Accounting Standards Update, ASU2017-08, Receivables—Nonrefundable Fees and Other Costs (Subtopic310-20), Premium Amortization on Purchased Callable Debt Securities which amends the amortization period for certain purchased callable debt securities held at a premium, shortening such period to the earliest call date. ASU2017-08 does not require any accounting change for debt securities held at a discount; the discount continues to be amortized to maturity. ASU2017-08 is effective for fiscal years, and interim periods within those fiscal years, beginning after December 15, 2018. At this time, management is evaluating the implications of these changes on the financial statements.
In August 2018, the Financial Accounting Standards Board issued an Accounting Standards Update, ASU2018-13, Fair Value Measurement (Topic 820), Disclosure Framework—Changes to the Disclosure Requirements for Fair Value Measurement which removes, modifies and adds disclosures to Topic 820. The amendments in this ASU2018-13 (“ASU”) apply to all entities that are required, under existing U.S. GAAP, to make disclosures about recurring or nonrecurring fair value measurements. The amendments in this ASU are effective for all entities for fiscal years, and interim periods within those fiscal years, beginning after December 15, 2019. Management has evaluated the impact of the amendments and elected to early adopt the ASU. The adoption of this ASU did not have a material impact on the disclosure and presentation of the financial statements of the Portfolio.
NOTE K: Subsequent Events
Management has evaluated subsequent events for possible recognition or disclosure in the financial statements through the date the financial statements are issued. Management has determined that there are no material events that would require disclosure in the Portfolio’s financial statements through this date.
49
| BALANCED WEALTH STRATEGY PORTFOLIO | ||
| FINANCIAL HIGHLIGHTS | AB Variable Products Series Fund | |
Selected Data For A Share Of Capital Stock Outstanding Throughout Each Period
| CLASS A | ||||||||||||||||||||
| Year Ended December 31, | ||||||||||||||||||||
| 2019 | 2018 | 2017 | 2016 | 2015 | ||||||||||||||||
Net asset value, beginning of period | $10.10 | $11.86 | $10.54 | $10.99 | $12.16 | |||||||||||||||
|
|
|
|
|
|
|
|
|
| |||||||||||
Income From Investment Operations | ||||||||||||||||||||
Net investment income (a) | .19 | (b) | .23 | (b) | .17 | (b) | .19 | (b)† | .20 | |||||||||||
Net realized and unrealized gain (loss) on investment and foreign currency transactions | 1.58 | (.87 | ) | 1.48 | .34 | .02 | (c) | |||||||||||||
Contributions from Affiliates | –0 | – | .00 | (d) | .00 | (d) | .00 | (d) | –0 | – | ||||||||||
|
|
|
|
|
|
|
|
|
| |||||||||||
Net increase (decrease) in net asset value from operations | 1.77 | (.64 | ) | 1.65 | .53 | .22 | ||||||||||||||
|
|
|
|
|
|
|
|
|
| |||||||||||
Less: Dividends and Distributions | ||||||||||||||||||||
Dividends from net investment income | (.29 | ) | (.23 | ) | (.24 | ) | (.24 | ) | (.27 | ) | ||||||||||
Distributions from net realized gain on investment transactions | (1.34 | ) | (.89 | ) | (.09 | ) | (.74 | ) | (1.12 | ) | ||||||||||
|
|
|
|
|
|
|
|
|
| |||||||||||
Total dividends and distributions | (1.63 | ) | (1.12 | ) | (.33 | ) | (.98 | ) | (1.39 | ) | ||||||||||
|
|
|
|
|
|
|
|
|
| |||||||||||
Net asset value, end of period | $10.24 | $10.10 | $11.86 | $10.54 | $10.99 | |||||||||||||||
|
|
|
|
|
|
|
|
|
| |||||||||||
Total Return | ||||||||||||||||||||
Total investment return based on net asset value (e)* | 18.53 | % | (6.17 | )% | 15.84 | % | 4.69 | %† | 1.65 | % | ||||||||||
Ratios/Supplemental Data | ||||||||||||||||||||
Net assets, end of period (000’s omitted) | $24,347 | $23,967 | $29,328 | $30,132 | $33,409 | |||||||||||||||
Ratio to average net assets of: | ||||||||||||||||||||
Expenses, net of waivers/reimbursements (f)(g)‡ | .55 | % | .66 | % | .73 | % | .73 | % | .70 | % | ||||||||||
Expenses, before waivers/reimbursements (f)(g)‡ | .75 | % | .75 | % | .73 | % | .73 | % | .70 | % | ||||||||||
Net investment income | 1.81 | %(b) | 2.05 | %(b) | 1.51 | %(b) | 1.74 | %(b)† | 1.71 | % | ||||||||||
Portfolio turnover rate** | 63 | % | 150 | % | 108 | % | 106 | % | 132 | % | ||||||||||
‡ Expense ratios exclude the estimated acquired fund fees of the affiliated/unaffiliated underlying |
| |||||||||||||||||||
portfolios | .22 | % | .11 | % | .00 | % | .00 | % | .00 | % | ||||||||||
| See | footnote summary on page 52. |
50
| AB Variable Products Series Fund | ||
Selected Data For A Share Of Capital Stock Outstanding Throughout Each Period
| CLASS B | ||||||||||||||||||||
| Year Ended December 31, | ||||||||||||||||||||
| 2019 | 2018 | 2017 | 2016 | 2015 | ||||||||||||||||
Net asset value, beginning of period | $9.98 | $11.73 | $10.42 | $10.87 | $12.05 | |||||||||||||||
|
|
|
|
|
|
|
|
|
| |||||||||||
Income From Investment Operations | ||||||||||||||||||||
Net investment income (a) | .16 | (b) | .20 | (b) | .14 | (b) | .16 | (b)† | .17 | |||||||||||
Net realized and unrealized gain (loss) on investment and foreign currency transactions | 1.56 | (.86 | ) | 1.47 | .33 | .01 | (c) | |||||||||||||
Contributions from Affiliates | –0 | – | .00 | (d) | .00 | (d) | .00 | (d) | –0 | – | ||||||||||
|
|
|
|
|
|
|
|
|
| |||||||||||
Net increase (decrease) in net asset value from operations | 1.72 | (.66 | ) | 1.61 | .49 | .18 | ||||||||||||||
|
|
|
|
|
|
|
|
|
| |||||||||||
Less: Dividends and Distributions | ||||||||||||||||||||
Dividends from net investment income | (.26 | ) | (.20 | ) | (.21 | ) | (.20 | ) | (.24 | ) | ||||||||||
Distributions from net realized gain on investment transactions | (1.34 | ) | (.89 | ) | (.09 | ) | (.74 | ) | (1.12 | ) | ||||||||||
|
|
|
|
|
|
|
|
|
| |||||||||||
Total dividends and distributions | (1.60 | ) | (1.09 | ) | (.30 | ) | (.94 | ) | (1.36 | ) | ||||||||||
|
|
|
|
|
|
|
|
|
| |||||||||||
Net asset value, end of period | $10.10 | $9.98 | $11.73 | $10.42 | $10.87 | |||||||||||||||
|
|
|
|
|
|
|
|
|
| |||||||||||
Total Return | ||||||||||||||||||||
Total investment return based on net asset value (e)* | 18.20 | % | (6.41 | )% | 15.62 | % | 4.44 | %† | 1.29 | % | ||||||||||
Ratios/Supplemental Data | ||||||||||||||||||||
Net assets, end of period (000’s omitted) | $231,071 | $220,274 | $274,070 | $272,733 | $298,233 | |||||||||||||||
Ratio to average net assets of: | ||||||||||||||||||||
Expenses, net of waivers/reimbursements (f)(g)‡ | .80 | % | .91 | % | .98 | % | .98 | % | .95 | % | ||||||||||
Expenses, before waivers/reimbursements (f)(g)‡ | 1.00 | % | 1.00 | % | .98 | % | .98 | % | .95 | % | ||||||||||
Net investment income | 1.57 | %(b) | 1.79 | %(b) | 1.26 | %(b) | 1.49 | %(b)† | 1.46 | % | ||||||||||
Portfolio turnover rate** | 63 | % | 150 | % | 108 | % | 106 | % | 132 | % | ||||||||||
‡ Expense ratios exclude the estimated acquired fund fees of the affiliated/unaffiliated underlying |
| |||||||||||||||||||
portfolios | .22 | % | .11 | % | .00 | % | .00 | % | .00 | % | ||||||||||
| See | footnote summary on page 52. |
51
| BALANCED WEALTH STRATEGY PORTFOLIO | ||
| FINANCIAL HIGHLIGHTS | ||
| (continued) | AB Variable Products Series Fund | |
| (a) | Based on average shares outstanding. |
| (b) | Net of expenses waived/reimbursed by the Adviser. |
| (c) | Due to timing of sales and repurchase of capital shares, the net realized and unrealized gain (loss) per share is not in accordance with the Portfolio’s change in net realized and unrealized gain (loss) on investment transactions for the period. |
| (d) | Amount is less than $.005. |
| (e) | Total investment return is calculated assuming an initial investment made at the net asset value at the beginning of the period, reinvestment of all dividends and distributions at net asset value during the period, and redemption on the last day of the period. Total return does not reflect (i) insurance company’s separate account related expense charges and (ii) the deductions of taxes that a shareholder would pay on Portfolio distributions or the redemption of Portfolio shares. Total investment return calculated for a period of less than one year is not annualized. |
| (f) | In connection with the Portfolio’s investments in affiliated underlying portfolios, the Portfolio incurs no direct expenses, but bears proportionate shares of the fees and expenses (i.e., operating, administrative and investment advisory fees) of the affiliated underlying portfolios. The Adviser has contractually agreed to waive its fees from the Portfolio in an amount equal to the Portfolio’s pro rata share of certain acquired fund fees and expenses, and for the years ended December 31, 2019 and December 31, 2018, such waiver amounted to .20% and .09%, respectively. |
| (g) | The expense ratios presented below exclude bank overdraft expense: |
| Year Ended December 31, | ||||||||||||||||||||
| 2019 | 2018 | 2017 | 2016 | 2015 | ||||||||||||||||
Class A | ||||||||||||||||||||
Net of waivers/reimbursements | .54 | % | N/A | N/A | N/A | N/A | ||||||||||||||
Before waivers | .75 | % | N/A | N/A | N/A | N/A | ||||||||||||||
Class B | ||||||||||||||||||||
Net of waivers | .79 | % | N/A | N/A | N/A | N/A | ||||||||||||||
Before waivers | 1.00 | % | N/A | N/A | N/A | N/A | ||||||||||||||
| † | For the year ended December 31, 2016, the amount includes a refund for overbilling of prior years’ custody out of pocket fees as follows: |
Net Investment | Net Investment | Total | ||
| $.001 | .01% | .01% |
| * | Includes the impact of proceeds received and credited to the Portfolio resulting from class action settlements, which enhanced the Portfolio’s performance for the years ended December 31, 2017 and December 31, 2015 by .02% and .03%, respectively. |
| ** | The Portfolio accounts for dollar roll transactions as purchases and sales. |
See notes to financial statements.
52
| REPORT OF INDEPENDENT REGISTERED | ||
| PUBLIC ACCOUNTING FIRM | AB Variable Products Series Fund | |
To the Shareholders and the Board of Directors of AB Balanced Wealth Strategy Portfolio:
Opinion on the Financial Statements
We have audited the accompanying statement of assets and liabilities of AB Balanced Wealth Strategy Portfolio (the “Portfolio”) (one of the portfolios constituting AB Variable Products Series Fund, Inc. (the “Fund”)), including the portfolio of investments, as of December 31, 2019, and the related statement of operations for the year then ended, the statements of changes in net assets for each of the two years in the period then ended, the financial highlights for each of the five years in the period then ended and the related notes (collectively referred to as the “financial statements”). In our opinion, the financial statements present fairly, in all material respects, the financial position of the Portfolio (one of the portfolios constituting AB Variable Products Series Fund, Inc.) at December 31, 2019, the results of its operations for the year then ended, the changes in its net assets for each of the two years in the period then ended and its financial highlights for each of the five years in the period then ended, in conformity with U.S. generally accepted accounting principles.
Basis for Opinion
These financial statements are the responsibility of the Fund’s management. Our responsibility is to express an opinion on the Portfolio’s financial statements based on our audits. We are a public accounting firm registered with the Public Company Accounting Oversight Board (United States) (“PCAOB”) and are required to be independent with respect to the Fund in accordance with the U.S. federal securities laws and the applicable rules and regulations of the Securities and Exchange Commission and the PCAOB.
We conducted our audits in accordance with the standards of the PCAOB. Those standards require that we plan and perform the audit to obtain reasonable assurance about whether the financial statements are free of material misstatement, whether due to error or fraud. The Fund is not required to have, nor were we engaged to perform, an audit of the Fund’s internal control over financial reporting. As part of our audits, we are required to obtain an understanding of internal control over financial reporting, but not for the purpose of expressing an opinion on the effectiveness of the Fund’s internal control over financial reporting. Accordingly, we express no such opinion.
Our audits included performing procedures to assess the risks of material misstatement of the financial statements, whether due to error or fraud, and performing procedures that respond to those risks. Such procedures included examining, on a test basis, evidence regarding the amounts and disclosures in the financial statements. Our procedures included confirmation of securities owned as of December 31, 2019, by correspondence with the custodian and others or by other appropriate auditing procedures where replies from others were not received. Our audits also included evaluating the accounting principles used and significant estimates made by management, as well as evaluating the overall presentation of the financial statements. We believe that our audits provide a reasonable basis for our opinion.

We have served as the auditor of one or more of the AB investment companies since 1968.
New York, New York
February 14, 2020
53
| 2019 TAX INFORMATION (unaudited) | AB Variable Products Series Fund | |
For Federal income tax purposes, the following information is furnished with respect to the distributions paid by the Portfolio during the taxable year ended December 31, 2019. For corporate shareholders, 24.09% of dividends paid qualify for the dividends received deduction.
54
| BALANCED WEALTH STRATEGY | ||
| PORTFOLIO | AB Variable Products Series Fund | |
| BOARD OF DIRECTORS | ||
Marshall C. Turner, Jr.(1),Chairman Jorge A. Bermudez^ Michael J. Downey^ Nancy P. Jacklin(1) | Robert M. Keith,President and Carol C. McMullen(1) Garry L. Moody(1) Earl D. Weiner(1) | |
| OFFICERS | ||
Daniel J. Loewy(2),Vice President Jess Gaspar(2),Vice President Emilie D. Wrapp,Secretary Michael B. Reyes,Senior Analyst | Joseph J. Mantineo,Treasurer and Phyllis J. Clarke,Controller Vincent S. Noto,Chief Compliance Officer | |
CUSTODIAN AND ACCOUNTING AGENT State Street Bank and Trust Company State Street Corporation CCB/5 1 Iron Street Boston, MA 02210 | LEGAL COUNSEL Seward & Kissel LLP One Battery Park Plaza New York, NY 10004 | |
DISTRIBUTOR AllianceBernstein Investments, Inc. 1345 Avenue of the Americas New York, NY 10105 | TRANSFER AGENT AllianceBernstein Investor Services, Inc. P.O. Box 786003 San Antonio, TX 78278-6003 Toll-Free (800) 221-5672 | |
INDEPENDENT REGISTERED PUBLIC ACCOUNTING FIRM Ernst & Young LLP 5 Times Square New York, NY 10036 |
| (1) | Member of the Audit Committee, the Governance and Nominating Committee, and the Independent Directors Committee. |
| (2) | The day-to-day management of, and investment decisions for, the Portfolio’s portfolio are made by the Adviser’s Multi-Asset Solutions Team. Messrs. Loewy and Gaspar are the investment professionals with the most significant responsibility for the day-to-day management of the Portfolio’s portfolio. |
| ^ | Mr. Bermudez will be a member of the Audit Committee, the Governance, and Nominating Committee and the Independent Directors Committee when he joins the Board on January 1, 2020. |
55
| BALANCED WEALTH STRATEGY PORTFOLIO | ||
| MANAGEMENT OF THE FUND | AB Variable Products Series Fund | |
Board of Directors Information
The business and affairs of the Fund are managed under the direction of the Board of Directors. Certain information concerning the Fund’s Directors is set forth below.
NAME, ADDRESS*, AGE AND (YEAR FIRST ELECTED)** | PRINCIPAL DURING PAST FIVE YEARS AND OTHER INFORMATION*** | PORTFOLIOS IN AB FUND COMPLEX OVERSEEN BY DIRECTOR | OTHER PUBLIC COMPANY DIRECTORSHIPS CURRENTLY HELD BY DIRECTOR | |||||
| INTERESTED DIRECTOR | ||||||||
Robert M. Keith,# 1345 Avenue of the Americas New York, NY 10105 59 (2010) | Senior Vice President of AllianceBernstein L.P. (the “Adviser”) and the head of AllianceBernstein Investments, Inc. (“ABI”) since July 2008; Director of ABI and President of the AB Mutual Funds. Previously, he served as Executive Managing Director of ABI from December 2006 to June 2008. Prior to joining ABI in 2006, Executive Managing Director of Bernstein Global Wealth Management, and prior thereto, Senior Managing Director and Global Head of Client Service and Sales of the Adviser’s institutional investment management business since 2004. Prior thereto, he was Managing Director and Head of North American Client Service and Sales in the Adviser’s institutional investment management business with which he had been associated since prior to 2004. | 91 | None | |||||
| INDEPENDENT DIRECTORS | ||||||||
Marshall C. Turner, Jr.,## Chairman of the Board 78 (2005) | Private Investor since prior to 2015. Former Chairman and CEO of Dupont Photomasks, Inc. (components of semi-conductor manufacturing). He has extensive operating leadership, and venture capital investing experience, including five interim or full-time CEO roles, and prior service as general partner of institutional venture capital partnerships. He also has extensivenon-profit board leadership experience, and currently serves on the boards of two education and science-related non-profit organizations. He has served as a director of one AB Fund since 1992, and director or trustee of all AB Funds since 2005. He has been Chairman of the AB Funds since January 2014, and the Chairman of the Independent Directors Committees of such AB Funds since February 2014. | 91 | Xilinx, Inc. (programmable logic semi-conductors) since 2007 | |||||
Jorge A. Bermudez,^ 68 (2020) | Private investor since prior to 2015. Former Chief Risk Officer of Citigroup, Inc., a global financial services company, from November 2007 to March 2008, Chief Executive Officer of Citigroup’s Commercial Business Group in North America and Citibank Texas from 2005 to 2007, and a variety of other executive and leadership roles at various businesses within Citigroup prior to then; Chairman (2018) of the Texas A&M Foundation Board of Trustees (Trustee since 2013) and Chairman of the Smart Grid Center Board at Texas A&M University since 2012; director of, among others, Citibank N.A. from 2005 to 2008, the Federal Reserve Bank of Dallas, Houston Branch from 2009 to 2011, the Federal Reserve Bank of Dallas from 2011 to 2017, and the Electric Reliability Council of Texas from 2010 to 2016. He has served as director or trustee of the AB Funds since 2020. | 91 | Moody’s Corporation since April 2011 | |||||
56
| AB Variable Products Series Fund | ||
NAME, ADDRESS*, AGE AND (YEAR FIRST ELECTED)** | PRINCIPAL DURING PAST FIVE YEARS AND OTHER INFORMATION*** | PORTFOLIOS IN AB FUND COMPLEX OVERSEEN BY DIRECTOR | OTHER PUBLIC COMPANY DIRECTORSHIPS CURRENTLY HELD BY DIRECTOR | |||||
INDEPENDENT DIRECTORS (continued) | ||||||||
Michael J. Downey,## 76 (2005) | Private Investor since prior to 2015. Formerly, Chairman of The Asia Pacific Fund, Inc. (registered investment company) since prior to 2015 until January 2019. From 1987 until 1993, Chairman and CEO of Prudential Mutual Fund Management, director of the Prudential mutual funds, and member of the Executive Committee of Prudential Securities, Inc. He has served as a director or trustee of the AB Funds since 2005. | 91 | None | |||||
Nancy P. Jacklin,## 71 (2006) | Private Investor since prior to 2015. Professorial Lecturer at the Johns Hopkins School of Advanced International Studies (2008–2015). U.S. Executive Director of the International Monetary Fund (which is responsible for ensuring the stability of the international monetary system), (December 2002–May 2006); Partner, Clifford Chance (1992–2002); Sector Counsel, International Banking and Finance, and Associate General Counsel, Citicorp (1985–1992); Assistant General Counsel (International), Federal Reserve Board of Governors (1982–1985); and Attorney Advisor, U.S. Department of the Treasury (1973–1982). Member of the Bar of the District of Columbia and of New York; and member of the Council on Foreign Relations. She has served as a director or trustee of the AB Funds since 2006 and has been Chair of the Governance and Nominating Committees of the AB Funds since August 2014. | 91 | None | |||||
Carol C . McMullen,## 64 (2016) | Managing Director of Slalom Consulting (consulting) since 2014, private investor and member of the Advisory Board of Butcher Box (since 2018). Formerly, member, Partners Healthcare Investment Committee (2010–2019); Director of Norfolk & Dedham Group (mutual property and casualty insurance) from 2011 until November 2016; Director of Partners Community Physicians Organization (healthcare) from 2014 until December 2016; and Managing Director of The Crossland Group (consulting) from 2012 until 2013. She has held a number of senior positions in the asset and wealth management industries, including at Eastern Bank (where her roles included President of Eastern Wealth Management), Thomson Financial (Global Head of Sales for Investment Management), and Putnam Investments (where her roles included Chief Investment Officer, Core and Growth and Head of Global Investment Research). She has served on a number of private company andnon-profit boards, and as a director or trustee of the AB Funds since June 2016. | 91 | None | |||||
57
| BALANCED WEALTH STRATEGY PORTFOLIO | ||
| MANAGEMENT OF THE FUND | ||
| (continued) | AB Variable Products Series Fund | |
NAME, ADDRESS*, AGE AND (YEAR FIRST ELECTED)** | PRINCIPAL OCCUPATION(S), DURING PAST FIVE YEARS AND OTHER INFORMATION*** | PORTFOLIOS IN AB FUND COMPLEX OVERSEEN BY DIRECTOR | OTHER PUBLIC COMPANY DIRECTORSHIPS CURRENTLY HELD BY DIRECTOR | |||||
INDEPENDENT DIRECTORS (continued) | ||||||||
Garry L. Moody,## 67 (2008) | Formerly, Partner, Deloitte & Touche LLP (1995–2008) where he held a number of senior positions, including Vice Chairman, and U.S . and Global Investment Management Practice Managing Partner; President, Fidelity Accounting and Custody Services Company (1993–1995), where he was responsible for accounting, pricing, custody and reporting for the Fidelity mutual funds; and Partner, Ernst & Young LLP (1975–1993), where he served as the National Director of Mutual Fund Tax Services and Managing Partner of its Chicago Office Tax department. He is a member of the Trustee Advisory Board of BoardIQ, a biweekly publication focused on issues and news affecting directors of mutual funds. He is also a member of the Investment Company Institute’s Board of Governors and the Independent Directors Council Governing Council. He has served as a director or trustee, and as Chairman of the Audit Committees, of the AB Funds since 2008. | 91 | None | |||||
Earl D. Weiner,## 80 (2007) | Senior Counsel since 2017, Of Counsel from 2007 to 2016, and Partner prior to then, of the law firm Sullivan & Cromwell LLP. He is a former member of the ABA Federal Regulation of Securities Committee Task Force to draft editions of the Fund Director’s Guidebook. He also serves as a director or trustee of variousnon-profit organizations and has served as Chairman or Vice Chairman of a number of them. He has served as a director or trustee of the AB Funds since 2007 and served as Chairman of the Governance and Nominating Committees of the AB Funds from 2007 until August 2014. | 91 | None | |||||
| * | The address for each of the Company’s Directors is c/o AllianceBernstein L.P., Attention: Legal and Compliance Department—Mutual Fund Legal, 1345 Avenue of the Americas, New York, NY 10105. |
| ** | There is no stated term of office for the Fund’s Directors. |
| *** | The information above includes each Director’s principal occupation during the last five years and other information relating to the experience, attributes and skills relevant to each Director’s qualifications to serve as a Director, which led to the conclusion that each Director should serve as a Director for the Fund. |
| # | Mr. Keith is an “interested person”, as defined in the 1940 Act, due to his position as a Senior Vice President of the Adviser. |
| ## | Member of the Audit Committee, the Governance and Nominating Committee, and the Independent Directors Committee. |
| ^ | Mr. Bermudez will be a member of the Audit Committee, the Governance and Nominating Committee, and the Independent Directors Committee when he joins the Board on January 1, 2020. |
58
| AB Variable Products Series Fund | ||
Officer Information
Certain information concerning the Portfolio’s Officers is listed below.
| NAME, ADDRESS* AND AGE | PRINCIPAL POSITION(S) HELD WITH FUND | PRINCIPAL OCCUPATION DURING PAST FIVE YEARS | ||
Robert M. Keith 59 | President and Chief Executive Officer | See biography above. | ||
Daniel J. Loewy 45 | Vice President | Senior Vice President of the Adviser**, with which he has been associated since prior to 2015. He is also Chief Investment Officer and Head of Multi-Asset Solutions and Chief Investment Officer for Dynamic Asset Allocation. | ||
Jess Gaspar 51 | Vice President | Senior Vice President of the Adviser**, with which he has been associated since December 2016. Prior thereto, he was Managing Director and head of asset allocation and research at Commonfund from prior to 2015 until 2016. | ||
Emilie D. Wrapp 64 | Secretary | Senior Vice President, Assistant General Counsel and Assistant Secretary of ABI**, with which she has been associated since prior to 2015. | ||
Michael B. Reyes 43 | Senior Analyst | Vice President of the Adviser**, with which he has been associated since prior to 2015. | ||
Joseph J. Mantineo 60 | Treasurer and Chief Financial Officer | Senior Vice President of AllianceBernstein Investor Services, Inc. (“ABIS”)**, with which he has been associated since prior to 2015. | ||
Phyllis J. Clarke 59 | Controller | Vice President of the ABIS**, with which she has been associated since prior to 2015. | ||
Vincent S. Noto 55 | Chief Compliance Officer | Senior Vice President since 2015 and Mutual Fund Chief Compliance Officer of the Adviser** since prior to 2015. . |
| * | The address for each of the Portfolio’s Officers is 1345 Avenue of the Americas, New York, NY 10105. |
| ** | The Adviser, ABI, and ABIS are affiliates of the Fund. |
| The Fund’s Statement of Additional Information (“SAI”) has additional information about the Fund’s Directors and Officers and is available without charge upon request. Contact your financial representative or the Adviser at(800) 227-4618, or visit www.abfunds.com, for a free prospectus or SAI. |
59
| BALANCED WEALTH STRATEGY PORTFOLIO | ||
| CONTINUANCE DISCLOSURE | AB Variable Products Series Fund | |
INFORMATION REGARDING THE REVIEW AND APPROVAL OF THE FUND’S ADVISORY AGREEMENT
The disinterested directors (the “directors”) of AB Variable Products Series Fund, Inc. (the “Company”) unanimously approved the continuance of the Company’s Advisory Agreement with the Adviser in respect of AB Balanced Wealth Strategy Portfolio (the “Fund”) at a meeting held onJuly 30-31, 2019 (the “Meeting”).
Prior to approval of the continuance of the Advisory Agreement, the directors had requested from the Adviser, and received and evaluated, extensive materials. They reviewed the proposed continuance of the Advisory Agreement with the Adviser and with experienced counsel who are independent of the Adviser, who advised on the relevant legal standards. The directors also reviewed additional materials, including comparative analytical data prepared by the Senior Analyst for the Fund. The directors also discussed the proposed continuance in private sessions with counsel.
The directors considered their knowledge of the nature and quality of the services provided by the Adviser to the Fund gained from their experience as directors or trustees of most of the registered investment companies advised by the Adviser, their overall confidence in the Adviser’s integrity and competence they have gained from that experience, the Adviser’s initiative in identifying and raising potential issues with the directors and its responsiveness, frankness and attention to concerns raised by the directors in the past, including the Adviser’s willingness to consider and implement organizational and operational changes designed to improve investment results and the services provided to the AB Funds. The directors noted that they have four regular meetings each year, at each of which they review extensive materials and information from the Adviser, including information on the investment performance of the Fund.
The directors also considered all factors they believed relevant, including the specific matters discussed below. During the course of their deliberations, the directors evaluated, among other things, the reasonableness of the advisory fee. The directors did not identify any particular information that wasall-important or controlling, and different directors may have attributed different weights to the various factors. The directors determined that the selection of the Adviser to manage the Fund and the overall arrangements between the Fund and the Adviser, as provided in the Advisory Agreement, including the advisory fee, were fair and reasonable in light of the services performed, expenses incurred and such other matters as the directors considered relevant in the exercise of their business judgment. The material factors and conclusions that formed the basis for the directors’ determinations included the following:
Nature, Extent and Quality of Services Provided
The directors considered the scope and quality of services provided by the Adviser under the Advisory Agreement, including the quality of the investment research capabilities of the Adviser and the other resources it has dedicated to performing services for the Fund. The directors noted that the Adviser from time to time reviews the Fund’s investment strategies and from time to time proposes changes intended to improve the Fund’s relative or absolute performance for the directors’ consideration. They also noted the professional experience and qualifications of the Fund’s portfolio management team and other senior personnel of the Adviser. The directors also considered that the Advisory Agreement provides that the Fund will reimburse the Adviser for the cost to it of providing certain clerical, accounting, administrative and other services to the Fund by employees of the Adviser or its affiliates. Requests for these reimbursements are made on a quarterly basis and subject to approval by the directors. Reimbursements, to the extent requested and paid, result in a higher rate of total compensation from the Fund to the Adviser than the fee rate stated in the Advisory Agreement. The directors noted that the methodology used to determine the reimbursement amounts had been reviewed by an independent consultant retained by the Fund’s former Senior Officer/Independent Compliance Officer. The quality of administrative and other services, including the Adviser’s role in coordinating the activities of the Fund’s other service providers, also was considered. The directors concluded that, overall, they were satisfied with the nature, extent and quality of services provided to the Fund under the Advisory Agreement.
Costs of Services Provided and Profitability
The directors reviewed a schedule of the revenues and expenses and related notes indicating the profitability of the Fund to the Adviser for calendar years 2017 and 2018 that had been prepared with an expense allocation methodology arrived at in consultation with an independent consultant retained by the Fund’s former Senior Officer/Independent Compliance Officer. The directors noted the assumptions and methods of allocation used by the Adviser in preparing fund-specific profitability data and understood that there are a number of potentially acceptable allocation methodologies for information of this type. The directors noted that the profitability information reflected all revenues and expenses of the Adviser’s relationship with the Fund, including those relating to its subsidiaries that provide transfer agency, distribution and brokerage services to the Fund. The directors recognized that it is difficult to make comparisons of the profitability of the Advisory Agreement with
60
| AB Variable Products Series Fund | ||
the profitability of fund advisory contracts for unaffiliated funds because comparative information is not generally publicly available and is affected by numerous factors. The directors focused on the profitability of the Adviser’s relationship with the Fund before taxes and distribution expenses. The directors concluded that the Adviser’s level of profitability from its relationship with the Fund was not unreasonable.
Fall-Out Benefits
The directors considered the other benefits to the Adviser and its affiliates from their relationships with the Fund, including, but not limited to, benefits relating to soft dollar arrangements (whereby investment advisers receive brokerage and research services from brokers that execute agency transactions for their clients);12b-1 fees and sales charges received by the Fund’s principal underwriter (which is a wholly owned subsidiary of the Adviser) in respect of the Fund’s Class B shares; brokerage commissions paid by the Fund to brokers affiliated with the Adviser; and transfer agency fees paid by the Fund to a wholly owned subsidiary of the Adviser. The directors recognized that the Adviser’s profitability would be somewhat lower without these benefits. The directors understood that the Adviser also might derive reputational and other benefits from its association with the Fund.
Investment Results
In addition to the information reviewed by the directors in connection with the Meeting, the directors receive detailed performance information for the Fund at each regular Board meeting during the year.
At the Meeting, the directors reviewed performance information prepared by an independent service provider (the “15(c) service provider”), showing the performance of the Class A Shares of the Fund against a group of similar funds (“peer group”) and a larger group of similar funds (“peer universe”), each selected by the 15(c) service provider, and information prepared by the Adviser showing performance of the Class A Shares against a broad-based securities market index, in each case for the1-,3-,5- and10-year periods ended May 31, 2019 and (in the case of comparisons with the broad-based securities market index) for the period from inception. Based on their review, the directors concluded that the Fund’s investment performance was acceptable.
Advisory Fees and Other Expenses
The directors considered the advisory fee rate payable by the Fund to the Adviser and information prepared by the 15(c) service provider concerning advisory fee rates payable by other funds in the same category as the Fund. The directors recognized that it is difficult to make comparisons of advisory fees because there are variations in the services that are included in the fees paid by other funds. The directors compared the Fund’s contractual effective advisory fee rate with a peer group median and took into account the impact on the advisory fee rate of the administrative expense reimbursement paid to the Adviser in the latest fiscal year.
The Adviser informed the directors that there were no institutional products managed by it that utilize investment strategies similar to the Fund’s.
The directors noted that the Fund may invest in shares of exchange-traded funds (“ETFs”), subject to the restrictions and limitations of the Investment Company Act of 1940 as these may be varied as a result of exemptive orders issued by the SEC. The directors also noted that ETFs pay advisory fees pursuant to their advisory contracts. The directors concluded, based on the Adviser’s explanation of how it uses ETFs when they are the most cost-effective way to obtain desired exposures, in some cases pending purchases of underlying securities, that the advisory fee for the Fund would be for services that would be in addition to, rather than duplicative of, the services provided under the advisory contracts of the ETFs.
In connection with their review of the Fund’s advisory fee, the directors also considered the total expense ratio of the Class A shares of the Fund in comparison to a peer group and a peer universe selected by the 15(c) service provider. The Class A expense ratio of the Fund was based on the Fund’s latest fiscal year and the directors considered the Adviser’s expense cap for the Fund. The directors noted that it was likely that the expense ratios of some of the other funds in the Fund’s category were lowered by waivers or reimbursements by those funds’ investment advisers, which in some cases might be voluntary or temporary. The directors view expense ratio information as relevant to their evaluation of the Adviser’s services because the Adviser is responsible for coordinating services provided to the Fund by others. Based on their review, the directors concluded that the Fund’s expense ratio was acceptable.
61
| BALANCED WEALTH STRATEGY PORTFOLIO | ||
| CONTINUANCE DISCLOSURE | ||
| (continued) | AB Variable Products Series Fund | |
Economies of Scale
The directors noted that the advisory fee schedule for the Fund contains breakpoints that reduce the fee rates on assets above specified levels. The directors took into consideration prior presentations by an independent consultant on economies of scale in the mutual fund industry and for the AB Funds, and presentations from time to time by the Adviser concerning certain of its views on economies of scale. The directors also previously discussed economies of scale with an independent fee consultant. The directors also had requested and received from the Adviser certain updates on economies of scale in advance of the Meeting. The directors believe that economies of scale may be realized (if at all) by the Adviser across a variety of products and services, and not only in respect of a single fund. The directors noted that there is no established methodology for setting breakpoints that give effect to the fund-specific services provided by a fund’s adviser and to the economies of scale that an adviser may realize in its overall mutual fund business or those components of it which directly or indirectly affect a fund’s operations. The directors observed that in the mutual fund industry as a whole, as well as among funds similar to the Fund, there is no uniformity or pattern in the fees and asset levels at which breakpoints (if any) apply. The directors also noted that the advisory agreements for many funds do not have breakpoints at all. Having taken these factors into account, the directors concluded that the Fund’s shareholders would benefit from a sharing of economies of scale in the event the Fund’s net assets exceed a breakpoint in the future.
62
VPS-BW-0151-1219
DEC 12.31.19

ANNUAL REPORT
AB VARIABLE PRODUCTS SERIES FUND, INC.
| + | DYNAMIC ASSET ALLOCATION PORTFOLIO |
Beginning on May 1, 2021, as permitted by regulations adopted by the Securities and Exchange Commission, you may not be receiving paper copies of the Portfolio’s shareholder reports from the insurance company that offers your contract unless you specifically request paper copies from the insurance company or from your financial intermediary. Instead of delivering paper copies of the reports, the insurance company may choose to make the reports available on a website, and will notify you by mail each time a report is posted and provide you with a website link to access the report. Instructions for requesting paper copies will be provided by your insurance company.
If you already elected to receive shareholder reports electronically, you will not be affected by this change and you need not take any action. You may elect to receive shareholder reports and other communications from the insurance company or your financial intermediary electronically by following the instructions provided by the insurance company or by contacting your financial intermediary.
You may elect to receive all future reports in paper free of charge from the insurance company. You can inform the insurance company or your financial intermediary that you wish to continue receiving paper copies of your shareholder reports by following the instructions provided by the insurance company or by contacting your financial intermediary. Your election to receive reports in paper will apply to all portfolio companies available under your contract with the insurance company.
Investment Products Offered
| • | Are Not FDIC Insured |
| • | May Lose Value |
| • | Are Not Bank Guaranteed |
AllianceBernstein Investments, Inc. (ABI) is the distributor of the AB family of mutual funds. ABI is a member of FINRA and is an affiliate of AllianceBernstein L.P., the Adviser of the funds.
You may obtain a description of the Fund’s proxy voting policies and procedures, and information regarding how the Fund voted proxies relating to portfolio securities during the most recent12-month period ended June 30, without charge. Simply visit AB’s website at www.abfunds.com or go to the Securities and Exchange Commission’s (the “Commission”) website at www.sec.gov, or call AB at (800) 227 4618.
The Fund files its complete schedule of portfolio holdings with the Commission for the first and third quarters of each fiscal year as an exhibit to its reports on Form N-PORT. The Fund’s Form N-PORT reports are available on the Commission’s website at www.sec.gov. The Fund’s Forms N-PORT may also be reviewed and copied at the Commission’s Public Reference Room in Washington, DC; information on the operation of the Public Reference Room may be obtained by calling (800) SEC 0330.
The [A/B] logo is a registered service mark of AllianceBernstein and AllianceBernstein® is a registered service mark used by permission of the owner, AllianceBernstein L.P.
| DYNAMIC ASSET ALLOCATION | ||
| PORTFOLIO | AB Variable Products Series Fund | |
LETTER TO INVESTORS
February 14, 2020
The following is an update of AB Variable Products Series Fund—Dynamic Asset Allocation Portfolio (the “Portfolio”) for the annual reporting period ended December 31, 2019.
INVESTMENT OBJECTIVE AND POLICIES
The Portfolio’s investment objective is to maximize total return consistent with the Adviser’s determination of reasonable risk. The Portfolio invests in a globally diversified portfolio of equity and debt securities, including exchange-traded funds (“ETFs”) and other financial instruments, and expects to enter into derivatives transactions, such as options, futures contracts, forwards and swaps to achieve market exposure. The Portfolio’s neutral weighting, from which it will make its tactical asset allocations, is 60% equity exposure and 40% debt exposure. Within these broad components, the Portfolio may invest in any type of security, including common and preferred stocks, warrants and convertible securities, government and corporate fixed-income securities, commodities, currencies, real estate-related securities and inflation-indexed securities. The Portfolio may invest in US,non-US and emerging-market issuers. The Portfolio may invest in securities of companies across the capitalization spectrum, including smaller capitalization companies. The Portfolio expects its investments in fixed-income securities to have a broad range of maturities and quality levels. The Portfolio is expected to be highly diversified across industries, sectors and countries, and will choose its positions from several market indices worldwide in a manner that is intended to track the performance (before fees and expenses) of those indices.
The Adviser will continuously monitor the risks presented by the Portfolio’s asset allocation and may make frequent adjustments to the Portfolio’s exposures to different asset classes. Using its proprietary Dynamic Asset Allocation (“DAA”) techniques, the Adviser will adjust the Portfolio’s exposure to the equity and debt markets, and to segments within those markets, in response to the Adviser’s assessment of the relative risks and returns of those segments. For example, when the Adviser determines that equity market volatility is particularly low and that, therefore, the equity markets present reasonable return opportunities, the Adviser may increase the Portfolio’s equity exposure to as much as 80%. Conversely, when the Adviser determines that the risks in the equity markets are disproportionately greater than the potential returns offered, the Adviser may reduce the Portfolio’s equity exposure significantly below the target percentage or may even decide to eliminate equity exposure altogether by increasing the Portfolio’s fixed-income exposure to 100%. This investment strategy is intended to reduce the Portfolio’s overall investment risk, but may at times result in the Portfolio underperforming the markets.
The Portfolio expects to utilize derivatives and to invest in ETFs to a significant extent. Derivatives and ETFs may provide more efficient and economical exposure to market segments than direct investments, and the Portfolio’s market exposures may at times be achieved almost entirely through the use of derivatives or through the investments in ETFs. Derivatives transactions and ETFs may also be a quicker and more efficient way to alter the Portfolio’s exposure than buying and selling direct investments. As a result, the Adviser expects to use derivatives as one of the primary tools for adjusting the Portfolio’s exposure levels from its neutral weighting. The Adviser also expects to use direct investments and ETFs to adjust the Portfolio’s exposure levels. In determining when and to what extent to enter into derivatives transactions or to invest in ETFs, the Adviser will consider factors such as the relative risks and returns expected of potential investments and the cost of such transactions. The Adviser will consider the impact of derivatives and ETFs in making its assessment of the Portfolio’s risks.
Currency exchange rate fluctuations can have a dramatic impact on returns, significantly adding to returns in some years and greatly diminishing them in others. To the extent that the Portfolio invests innon-US dollar-denominated investments, the Adviser will integrate the risks of foreign currency exposures into its investment and asset allocation decision making. The Adviser may seek to hedge all or a portion of the currency exposure resulting from the Portfolio’s investments. The Adviser may also seek investment opportunities through currencies and currency-related derivatives.
INVESTMENT RESULTS
The table on page 5 shows the Portfolio’s performance compared to its primary benchmark, the Morgan Stanley Capital International (“MSCI”) World Index, the Bloomberg Barclays US Treasury Index and its blended benchmark, a 60% / 40% blend of the MSCI World Index and the Bloomberg Barclays US Treasury Index, respectively, for theone- and five-year periods ended December 31, 2019, and since the Portfolio’s inception on April 1, 2011.
All share classes of the Portfolio underperformed the primary and blended benchmarks for the annual period, but outperformed the Bloomberg Barclays US Treasury Index. Throughout most of 2019, the Portfolio maintained a modest underweight to risk assets. The Portfolio started
1
| AB Variable Products Series Fund | ||
the year significantly underweight equities, which was gradually brought to an overweight in the first quarter, as the broad risks subsided and the near-term outlook for risk assets became stable. The Portfolio’s Senior Investment Management Team (the “Team”) reduced the equity overweight to neutral at the end of April, taking advantage of equity market strength. In May, the Portfolio moved to a modest equity underweight on the Team’s expectation for increased volatility and range-bound markets as trade negotiations continued between the US and China. Other than a brief period in June, the Portfolio continued to maintain a modest underweight to risk assets. The Team’s defensive position was driven by ongoing risks from the trade war and slowing global growth, partially offset by the pivot of global central banks to more accommodative monetary policies, as well as growing defensiveness among investors. Bond duration remained close to neutral and the Portfolio maintained an allocation to high-yield bonds as a diversifier. In December, the Portfolio increased its exposure to risk assets to an overweight, as market dynamics and economic data trends improved. The Portfolio’s equity timing detracted from performance, specifically in the month of January, as equity markets performed strongly and advanced, following a meaningfulsell-off at the end of 2018.
The Portfolio’s equity position was characterized by a regional bias toward internationallarge-cap and emerging-market equities. The Team saw more pronounced headwinds for US equity markets relative tonon-US developed markets, driven by relative valuations and expectations of increased volatility and range-bound markets from trade negotiations. The Portfolio’s underweight to US equities detracted from relative performance. The Portfolio’s overweight tonon-US developed markets contributed to performance.
In fixed income, the Portfolio was underweight to the US, which contributed to performance. The Portfolio ended the annual period with an overweight to duration. In currency management, the Portfolio held a modest underweight to the US dollar, relative to the Portfolio’s strategic asset allocation, for most of the year. The Portfolio also ended the year with a modest underweight to the US dollar.
During the annual period, the Portfolio utilized derivatives for hedging and investment purposes in the form of futures, currency forwards, total return swaps and written options, which detracted from absolute returns, while credit default swaps, inflation swaps and purchased options added.
MARKET REVIEW AND INVESTMENT STRATEGY
US and international stocks recorded strong double-digit returns while emerging markets also rallied during the annual period ended December 31, 2019. After declining sharply at the end of 2018, equity markets rebounded dramatically in January, as strong corporate earnings and optimism about a trade truce between the US and China calmed investors.Trade-war tensions resurfaced, however, and emerging geopolitical pressures drove market volatility. Tariff wars, restrictive monetary policy and a decline in industrial production stoked recessionary fears throughout the global economy. In response, the world’s central banks implemented accommodative monetary policies to help support capital markets. Late in the third quarter, equity market performance was accompanied by a sharp style rotation in the US. Quality-growth and lower-volatility stocks, which had been strong performers, lagged and value stocks outperformed. However, for the most part, growth stocks continued to outperform value over the entire period. From a market-capitalization perspective,large-cap stocks outperformed theirsmall-cap peers. In December, equity markets rallied on news that the US and China had agreed to a preliminaryphase-one trade deal due to be signed in January 2020.
Global fixed-income markets performed strongly over the annual period. Long-dated developed-market treasuries were strong performers, given their interest-rate sensitivity, despite the move higher in yields since September. Investment-grade, high-yield and emerging-market sovereign debt all posted solid returns as credit spreads tightened. In addition to lowering rates, the US Federal Reserve increased its balance sheet later in the period to manage liquidity in the repurchase agreement market, effectively capping short-term rates. The European Central Bank reduced rates to a record low in September and announced the resumption of quantitative easing. The Bank of Japan issued guidance for the continuation of low rates and the government implemented a significant fiscal stimulus program in December.
2
| DYNAMIC ASSET ALLOCATION PORTFOLIO | ||
| DISCLOSURES AND RISKS | AB Variable Products Series Fund | |
Benchmark Disclosure
The MSCI World Index and the Bloomberg Barclays US Treasury Index are unmanaged and do not reflect fees and expenses associated with the active management of a mutual fund portfolio.The MSCI World Index (free float-adjusted, market capitalization weighted) represents the equity market performance of developed markets. The Bloomberg Barclays US Treasury Index represents the performance of US Treasuries within the US government fixed-income market. MSCI makes no express or implied warranties or representations, and shall have no liability whatsoever with respect to any MSCI data contained herein. The MSCI data may not be further redistributed or used as a basis for other indices, any securities or financial products. This report is not approved, reviewed or produced by MSCI. An investor cannot invest directly in an index, and its results are not indicative of the performance for any specific investment, including the Portfolio.
A Word About Risk
Market Risk: The value of the Portfolio’s assets will fluctuate as the stock or bond market fluctuates. The value of its investments may decline, sometimes rapidly and unpredictably, simply because of economic changes or other events that affect large portions of the market.
Interest-Rate Risk: Changes in interest rates will affect the value of investments in fixed-income securities. When interest rates rise, the value of existing investments in fixed-income securities tends to fall and this decrease in value may not be offset by higher income from new investments. Interest-rate risk is generally greater for fixed-income securities with longer maturities or durations.
Credit Risk: An issuer or guarantor of a fixed-income security, or the counterparty to a derivatives or other contract, may be unable or unwilling to make timely payments of interest or principal, or to otherwise honor its obligations. The issuer or guarantor may default, causing a loss of the full principal amount of a security and accrued interest. The degree of risk for a particular security may be reflected in its credit rating. There is the possibility that the credit rating of a fixed-income security may be downgraded after purchase, which may adversely affect the value of the security. Investments in fixed-income securities with lower ratings tend to have a higher probability that an issuer will default or fail to meet its payment obligations.
Allocation Risk: The allocation of investments among different global asset classes may have a significant effect on the Portfolio’s net asset value (“NAV”) when one of these asset classes is performing more poorly than others. As both the direct investments and derivatives positions will be periodically adjusted to reflect the Adviser’s view of market and economic conditions, there will be transaction costs that may be, over time, significant. In addition, there is a risk that certain asset allocation decisions may not achieve the desired results and, as a result, the Portfolio may incur significant losses.
Foreign(Non-US) Risk: The Portfolio’s investments in securities ofnon-US issuers may involve more risk than those of US issuers. These securities may fluctuate more widely in price and may be more difficult to trade or dispose of due to adverse market, economic, political, regulatory or other factors.
Emerging-Market Risk: Investments in emerging-market countries may have more risk because the markets are less developed and less liquid, and because these investments may be subject to increased economic, political, regulatory or other uncertainties.
Currency Risk: Fluctuations in currency exchange rates may negatively affect the value of the Portfolio’s investments or reduce its returns.
ETF Risk: ETFs are investment companies. When the Portfolio invests in an ETF, the Portfolio bears its share of the ETF’s expenses and runs the risk that the ETF may not achieve its investment objective.
Derivatives Risk: Derivatives may be difficult to price or unwind and leveraged so that small changes may produce disproportionate losses for the Portfolio. Derivatives may also be subject to counterparty risk to a greater degree than more traditional investments.
Leverage Risk: When the Portfolio borrows money or otherwise leverages its portfolio, its NAV may be more volatile because leverage tends to exaggerate the effect of changes in interest rates and any increase or decrease in the value of the Portfolio’s investments. The Portfolio may create leverage through the use of reverse repurchase agreements, forward commitments, or by borrowing money.
(Disclosures, Risks and Note About Historical Performance continued on next page)
3
| DISCLOSURES AND RISKS | ||
| (continued) | AB Variable Products Series Fund | |
Illiquid Investments Risk: Illiquid investments risk exists when certain investments are or become difficult to purchase or sell. Difficulty in selling such investments may result in sales at disadvantageous prices affecting the value of your investment in the Portfolio. Causes of illiquid investments risk may include low trading volumes, large positions and heavy redemptions of Portfolio shares.
Capitalization Risk: Investments in small- andmid-capitalization companies may be more volatile than investments in large-capitalization companies. Investments in small-capitalization companies may have additional risks because these companies have limited product lines, markets or financial resources.
Real Estate Risk:The Portfolio’s investments in real estate securities have many of the same risks as direct ownership of real estate, including the risk that the value of real estate could decline due to a variety of factors that affect the real estate market generally. Investments in real estate investment trusts (“REITs”) may have additional risks. REITs are dependent on the capability of their managers, may have limited diversification, and could be significantly affected by changes in taxes.
Management Risk: The Portfolio is subject to management risk because it is an actively managed investment fund. The Adviser will apply its investment techniques and risk analyses in making investment decisions for the Portfolio, but there is no guarantee that its techniques will produce the intended results.
These risks are fully discussed in the Variable Products prospectus. As with all investments, you may lose money by investing in the Portfolio.
An Important Note About Historical Performance
The investment return and principal value of an investment in the Portfolio will fluctuate, so that shares, when redeemed, may be worth more or less than their original cost. Performance shown in this report represents past performance and does not guarantee future results. Current performance may be lower or higher than the performance information shown. Please contact your financial advisor or insurance agent representative at your financial institution to obtain portfolio performance information current to the most recent month end.
Investors should consider the investment objectives, risks, charges and expenses of the Portfolio carefully before investing. For additional copies of the Portfolio’s prospectus or summary prospectus, which contains this and other information, call your financial advisor or (800) 227 4618. Please read the prospectus and/or summary prospectus carefully before investing.
All fees and expenses related to the operation of the Portfolio have been deducted, but no adjustment has been made for insurance company separate account or annuity contract charges, which would reduce total return to a contract owner. Performance assumes reinvestment of distributions and does not account for taxes.
There are additional fees and expenses associated with all Variable Products. These fees can include mortality and expense risk charges, administrative charges, and other charges that can significantly reduce investment returns. Those fees and expenses are not reflected in this annual report. You should consult your Variable Products prospectus for a description of those fees and expenses and speak to your insurance agent or financial representative if you have any questions. You should read the prospectus before investing or sending money.
4
| DYNAMIC ASSET ALLOCATION PORTFOLIO | ||
| HISTORICAL PERFORMANCE | AB Variable Products Series Fund | |
| THE PORTFOLIO VS. ITS BENCHMARKS | Net Asset Value Returns | |||||||||||
| PERIODS ENDED DECEMBER 31, 2019 (unaudited) | 1 Year | 5 Years | Since Inception1 | |||||||||
| Dynamic Asset Allocation Portfolio Class A | 15.51% | 4.75% | 5.22% | |||||||||
| Dynamic Asset Allocation Portfolio Class B | 15.24% | 4.49% | 4.96% | |||||||||
| Primary Benchmark: MSCI World Index | 27.67% | 8.74% | 8.84% | |||||||||
| Bloomberg Barclays US Treasury Index | 6.86% | 2.36% | 2.93% | |||||||||
| Blended Benchmark: 60% MSCI World Index / 40% Bloomberg Barclays US Treasury Index | 19.24% | 6.37% | 6.68% | |||||||||
1 Inception date: 4/1/2011.
Please keep in mind that high, double-digit returns are highly unusual and cannot be sustained. Investors should also be aware that these returns were primarily achieved during favorable market conditions.
|
| |||||||||||
The Portfolio’s current prospectus fee table shows the Portfolio’s total annual operating expense ratios as 0.82% and 1.07% for Class A and Class B shares, respectively. The Financial Highlights section of this report sets forth expense ratio data for the current reporting period; the expense ratios shown above may differ from the expense ratios in the Financial Highlights section since they are based on different time periods.
GROWTH OF A $10,000 INVESTMENT
4/1/20111 TO 12/31/2019 (unaudited)
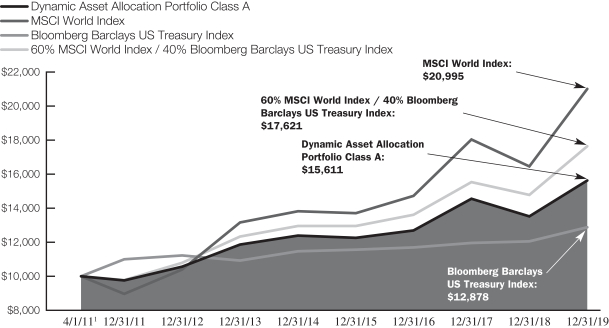
This chart illustrates the total value of an assumed $10,000 investment in Dynamic Asset Allocation Portfolio Class A shares (from 4/1/20111 to 12/31/2019) as compared to the performance of the Portfolio’s benchmarks. The chart assumes the reinvestment of dividends and capital gains distributions.
| 1 | Inception date: 4/1/2011. |
See Disclosures, Risks and Note about Historical Performance on pages 3-4.
5
| DYNAMIC ASSET ALLOCATION PORTFOLIO | ||
| EXPENSE EXAMPLE (unaudited) | AB Variable Products Series Fund | |
As a shareholder of the Portfolio, you incur two types of costs: (1) transaction costs, including sales charges (loads) on purchase payments, contingent deferred sales charges on redemptions and (2) ongoing costs, including management fees; distribution(12b-1) fees; and other Portfolio expenses. This example is intended to help you understand your ongoing costs (in dollars) of investing in the Portfolio and to compare these costs with the ongoing costs of investing in other mutual funds.
The Example is based on an investment of $1,000 invested at the beginning of the period and held for the entire period as indicated below.
Actual Expenses
The table below provides information about actual account values and actual expenses. You may use the information in this line, together with the amount you invested, to estimate the expenses that you paid over the period. Simply divide your account value by $1,000 (for example, an $8,600 account value divided by $1,000 = 8.6), then multiply the result by the number in the first line under the heading entitled “Expenses Paid During Period” to estimate the expenses you paid on your account during this period. The estimate of expenses does not include fees or other expenses of any variable insurance product. If such expenses were included, the estimate of expenses you paid during the period would be higher and your ending account value would be lower.
Hypothetical Example for Comparison Purposes
The table below provides information about hypothetical account values and hypothetical expenses based on the Portfolio’s actual expense ratio and an assumed annual rate of return of 5% before expenses, which is not the Portfolio’s actual return. The hypothetical account values and expenses may not be used to estimate the actual ending account balance or expenses you paid for the period. You may use this information to compare the ongoing costs of investing in the Portfolio and other funds by comparing this 5% hypothetical example with the 5% hypothetical examples that appear in the shareholder reports of other funds. The estimate of expenses does not include fees or other expenses of any variable insurance product. If such expenses were included, the estimate of expenses you paid during the period would be higher and your ending account value would be lower.
Please note that the expenses shown in the table are meant to highlight your ongoing costs only and do not reflect any transactional costs, such as sales charges (loads), or contingent deferred sales charges on redemptions. Therefore, the second line of each class’ table is useful in comparing ongoing costs only, and will not help you determine the relative total costs of owning different funds. In addition, if these transactional costs were included, your costs would have been higher.
| Beginning Account Value July 1, 2019 | Ending Account Value December 31, 2019 | Expenses Paid During Period* | Annualized Expense Ratio* | Total Expenses Paid During Period+ | Total Annualized Expense Ratio+ | |||||||||||||||||||
Class A | ||||||||||||||||||||||||
Actual | $ | 1,000 | $ | 1,047.00 | $ | 4.18 | 0.81 | % | $ | 4.23 | 0.82 | % | ||||||||||||
Hypothetical (5% annual return before expenses) | $ | 1,000 | $ | 1,021.12 | $ | 4.13 | 0.81 | % | $ | 4.18 | 0.82 | % | ||||||||||||
Class B | ||||||||||||||||||||||||
Actual | $ | 1,000 | $ | 1,045.40 | $ | 5.46 | 1.06 | % | $ | 5.52 | 1.07 | % | ||||||||||||
Hypothetical (5% annual return before expenses) | $ | 1,000 | $ | 1,019.86 | $ | 5.40 | 1.06 | % | $ | 5.45 | 1.07 | % | ||||||||||||
| * | Expenses are equal to each classes’ annualized expense ratios, multiplied by the average account value over the period, multiplied by 184/365 (to reflect the one-half year period). |
| + | In connection with the Portfolio’s investments in affiliated/unaffiliated underlying portfolios, the Portfolio incurs no direct expenses, but bears proportionate shares of the fees and expenses (i.e., operating, administrative and investment advisory fees) of the affiliated/unaffiliated underlying portfolios. The Adviser has contractually agreed to waive its fees from the Portfolio in an amount equal to the Portfolio’s pro rata share of certain acquired fund fees and expenses of the affiliated underlying portfolios. The Portfolio’s total expenses are equal to the classes’ annualized expense ratio plus the Portfolio’s pro rata share of the weighted average expense ratio of the affiliated/unaffiliated underlying portfolios in which it invests, multiplied by the average account value over the period, multiplied by 184/365 (to reflect the one-half year period). |
6
| DYNAMIC ASSET ALLOCATION PORTFOLIO | ||
| TEN LARGEST HOLDINGS1 | ||
| December 31, 2019 (unaudited) | AB Variable Products Series Fund | |
| SECURITY | U.S. $ VALUE | PERCENT OF NET ASSETS | ||||||
U.S. Treasury Bonds & Notes | $ | 183,330,320 | 32.2 | % | ||||
Vanguard Real Estate ETF | 16,758,524 | 2.9 | ||||||
Vanguard Globalex-U.S. Real Estate ETF | 11,278,863 | 2.0 | ||||||
Apple, Inc. | 7,098,695 | 1.2 | ||||||
Microsoft Corp. | 6,871,462 | 1.2 | ||||||
Alphabet, Inc. | 4,620,781 | 0.8 | ||||||
Amazon.com, Inc. | 4,379,381 | 0.8 | ||||||
Nestle SA | 3,757,885 | 0.7 | ||||||
iShares Core MSCI Emerging Markets ETF | 3,306,616 | 0.6 | ||||||
Facebook, Inc. | 2,805,152 | 0.5 | ||||||
|
|
|
| |||||
| $ | 244,207,679 | 42.9 | % | |||||
PORTFOLIO BREAKDOWN2
December 31, 2019 (unaudited)
| ASSET CLASSES | ALLOCATION | |||
Equities | ||||
International Large-Cap | 25.9 | % | ||
U.S. Large-Cap | 21.9 | |||
Emerging-Market Equities | 6.1 | |||
Real Estate Equities | 4.9 | |||
U.S.Mid-Cap | 2.7 | |||
U.S.Small-Cap | 2.6 | |||
|
| |||
Subtotal | 64.1 | |||
|
| |||
Fixed Income | ||||
U.S. Bonds | 29.2 | |||
International Bonds | 6.7 | |||
|
| |||
Subtotal | 35.9 | |||
|
| |||
Total | 100.0 | % | ||
SECURITY TYPE BREAKDOWN3
December 31, 2019 (unaudited)
| SECURITY TYPE | U.S. $ VALUE | PERCENT OF TOTAL INVESTMENTS | ||||||
Common Stocks | $ | 323,354,044 | 57.3 | % | ||||
Governments—Treasuries | 183,330,320 | 32.5 | ||||||
Investment Companies | 31,344,003 | 5.6 | ||||||
Rights | 7,806 | 0.0 | ||||||
Short-Term Investments | 26,016,155 | 4.6 | ||||||
|
|
|
| |||||
Total Investments | $ | 564,052,328 | 100.0 | % | ||||
| 1 | Long-term investments. |
| 2 | All data are as of December 31, 2019. The Portfolio breakdown is expressed as an approximate percentage of the Portfolio’s total investments inclusive of derivative exposure, based on the Adviser’s internal classification guidelines. |
| 3 | The Portfolio’s security type breakdown is expressed as a percentage of total investments and may vary over time. The Portfolio also enters into derivative transactions, which may be used for hedging or investment purposes (see “Portfolio of Investments” section of the report for additional details). |
7
| DYNAMIC ASSET ALLOCATION PORTFOLIO | ||
| PORTFOLIO OF INVESTMENTS | ||
| December 31, 2019 | AB Variable Products Series Fund | |
Company | Shares | U.S. $ Value | ||||||
COMMON STOCKS–56.8% |
| |||||||
FINANCIALS–9.1% |
| |||||||
BANKS–4.4% |
| |||||||
AIB Group PLC | 5,844 | $ | 20,360 | |||||
Aozora Bank Ltd. | 2,000 | 52,837 | ||||||
Australia & New Zealand Banking Group Ltd. | 31,095 | 536,264 | ||||||
Banco Bilbao Vizcaya Argentaria SA | 73,153 | 410,705 | ||||||
Banco de Sabadell SA | 69,405 | 81,267 | ||||||
Banco Santander SA | 190,461 | 798,555 | ||||||
Bank Hapoalim BM | 14,749 | 122,487 | ||||||
Bank LeumiLe-Israel BM | 16,778 | 122,361 | ||||||
Bank of America Corp. | 46,856 | 1,650,268 | ||||||
Bank of East Asia Ltd. (The) | 41,231 | 92,054 | ||||||
Bank of Ireland Group PLC | 11,605 | 63,869 | ||||||
Bank of Kyoto Ltd. (The) | 400 | 17,056 | �� | |||||
Bankia SA | 10,832 | 23,193 | ||||||
Bankinter SA | 7,353 | 54,009 | ||||||
Barclays PLC | 188,978 | 450,613 | ||||||
Bendigo & Adelaide Bank Ltd. | 9,233 | 63,355 | ||||||
BNP Paribas SA | 13,908 | 826,665 | ||||||
BOC Hong Kong Holdings Ltd. | 39,500 | 137,121 | ||||||
CaixaBank SA | 42,465 | 133,725 | ||||||
Chiba Bank Ltd. (The) | 11,000 | 63,249 | ||||||
Citigroup, Inc. | 13,149 | 1,050,474 | ||||||
Citizens Financial Group, Inc. | 2,179 | 88,489 | ||||||
Comerica, Inc. | 950 | 68,162 | ||||||
Commerzbank AG | 15,814 | 97,668 | ||||||
Commonwealth Bank of Australia | 20,060 | 1,125,322 | ||||||
Concordia Financial Group Ltd. | 11,221 | 46,081 | ||||||
Credit Agricole SA | 14,327 | 208,477 | ||||||
Danske Bank A/S | 7,940 | 128,456 | ||||||
DBS Group Holdings Ltd. | 21,665 | 417,728 | ||||||
DNB ASA | 9,303 | 174,086 | ||||||
Erste Group Bank AG(a) | 3,207 | 120,462 | ||||||
Fifth Third Bancorp | 3,690 | 113,431 | ||||||
First Republic Bank/CA | 1,023 | 120,151 | ||||||
Fukuoka Financial Group, Inc. | 1,800 | 34,391 | ||||||
Hang Seng Bank Ltd. | 8,100 | 167,427 | ||||||
HSBC Holdings PLC | 231,396 | 1,811,469 | ||||||
Huntington Bancshares, Inc./OH | 4,845 | 73,063 | ||||||
ING Groep NV | 36,740 | 441,703 | ||||||
Intesa Sanpaolo SpA | 165,706 | 436,501 | ||||||
Israel Discount Bank Ltd.–Class A | 13,191 | 61,262 | ||||||
Japan Post Bank Co., Ltd. | 3,855 | 36,988 | ||||||
JPMorgan Chase & Co. | 18,455 | 2,572,627 | ||||||
KBC Group NV | 3,064 | 231,009 | ||||||
KeyCorp | 4,965 | 100,492 | ||||||
Lloyds Banking Group PLC | 821,886 | 680,867 | ||||||
Company | Shares | U.S. $ Value | ||||||
M&T Bank Corp. | 865 | $ | 146,834 | |||||
Mebuki Financial Group, Inc. | 16,800 | 42,833 | ||||||
Mediobanca Banca di Credito Finanziario SpA | 12,965 | 142,752 | ||||||
Mitsubishi UFJ Financial Group, Inc. | 135,900 | 734,721 | ||||||
Mizrahi Tefahot Bank Ltd. | 1,057 | 28,195 | ||||||
Mizuho Financial Group, Inc. | 273,362 | 421,092 | ||||||
National Australia Bank Ltd. | 33,042 | 571,762 | ||||||
Nordea Bank Abp | 29,390 | 237,770 | ||||||
Oversea-Chinese Banking Corp., Ltd. | 37,153 | 303,932 | ||||||
People’s United Financial, Inc. | 975 | 16,478 | ||||||
PNC Financial Services Group, Inc. (The) | 2,580 | 411,845 | ||||||
Raiffeisen Bank International AG | 1,307 | 32,713 | ||||||
Regions Financial Corp. | 4,815 | 82,625 | ||||||
Resona Holdings, Inc. | 21,000 | 91,529 | ||||||
Royal Bank of Scotland Group PLC | 53,666 | 172,157 | ||||||
Seven Bank Ltd. | 16,218 | 53,132 | ||||||
Shinsei Bank Ltd. | 3,700 | 56,452 | ||||||
Shizuoka Bank Ltd. (The) | 4,000 | 29,753 | ||||||
Skandinaviska Enskilda Banken AB–Class A | 16,190 | 152,249 | ||||||
Societe Generale SA | 9,446 | 329,646 | ||||||
Standard Chartered PLC | 34,982 | 329,638 | ||||||
Sumitomo Mitsui Financial Group, Inc. | 15,240 | 562,895 | ||||||
Sumitomo Mitsui Trust Holdings, Inc. | 3,200 | 126,499 | ||||||
SVB Financial Group(a) | 336 | 84,349 | ||||||
Svenska Handelsbanken AB–Class A | 14,254 | 153,519 | ||||||
Swedbank AB–Class A | 8,621 | 128,160 | ||||||
Truist Financial Corp. | 7,398 | 416,655 | ||||||
UniCredit SpA | 17,422 | 254,657 | ||||||
United Overseas Bank Ltd. | 12,000 | 235,999 | ||||||
US Bancorp | 8,505 | 504,261 | ||||||
Wells Fargo & Co. | 22,995 | 1,237,131 | ||||||
Westpac Banking Corp. | 38,249 | 653,168 | ||||||
Zions Bancorp NA | 630 | 32,710 | ||||||
|
| |||||||
| 24,904,910 | ||||||||
|
| |||||||
CAPITAL MARKETS–1.5% | ||||||||
3i Group PLC | 9,721 | 141,457 | ||||||
Ameriprise Financial, Inc. | 845 | 140,760 | ||||||
Amundi SA(b) | 1,517 | 119,292 | ||||||
ASX Ltd. | 2,413 | 132,860 | ||||||
Bank of New York Mellon Corp. (The) | 4,915 | 247,372 | ||||||
BlackRock, Inc.–Class A | 677 | 340,328 | ||||||
Cboe Global Markets, Inc. | 696 | 83,520 | ||||||
Charles Schwab Corp. (The) | 6,740 | 320,554 | ||||||
CME Group, Inc.–Class A | 2,050 | 411,476 | ||||||
Credit Suisse Group AG(a) | 28,090 | 379,711 | ||||||
8
| AB Variable Products Series Fund | ||
Company | Shares | U.S. $ Value | ||||||
Daiwa Securities Group, Inc. | 16,000 | $ | 80,775 | |||||
Deutsche Bank AG | 19,693 | 152,592 | ||||||
Deutsche Boerse AG | 2,077 | 325,700 | ||||||
E*TRADE Financial Corp. | 1,470 | 66,694 | ||||||
Franklin Resources, Inc. | 1,040 | 27,019 | ||||||
Goldman Sachs Group, Inc. (The) | 1,938 | 445,604 | ||||||
Hargreaves Lansdown PLC | 4,023 | 103,195 | ||||||
Hong Kong Exchanges & Clearing Ltd. | 13,451 | 436,992 | ||||||
Intercontinental Exchange, Inc. | 3,200 | 296,160 | ||||||
Invesco Ltd. | 1,180 | 21,216 | ||||||
Japan Exchange Group, Inc. | 4,965 | 87,409 | ||||||
Julius Baer Group Ltd.(a) | 2,130 | 109,808 | ||||||
London Stock Exchange Group PLC | 3,987 | 409,752 | ||||||
Macquarie Group Ltd. | 3,705 | 358,808 | ||||||
Magellan Financial Group Ltd. | 1,420 | 56,892 | ||||||
MarketAxess Holdings, Inc. | 260 | 98,569 | ||||||
Moody’s Corp. | 945 | 224,352 | ||||||
Morgan Stanley | 7,260 | 371,131 | ||||||
MSCI, Inc.–Class A | 557 | 143,806 | ||||||
Nasdaq, Inc. | 710 | 76,041 | ||||||
Natixis SA | 21,759 | 96,926 | ||||||
Nomura Holdings, Inc. | 38,855 | 199,939 | ||||||
Northern Trust Corp. | 1,310 | 139,174 | ||||||
Partners Group Holding AG | 231 | 211,718 | ||||||
Raymond James Financial, Inc. | 759 | 67,900 | ||||||
S&P Global, Inc. | 1,400 | 382,270 | ||||||
SBI Holdings, Inc./Japan | 2,468 | 52,105 | ||||||
Schroders PLC | 1,291 | 57,006 | ||||||
Singapore Exchange Ltd. | 21,000 | 138,309 | ||||||
St. James’s Place PLC | 4,994 | 76,981 | ||||||
Standard Life Aberdeen PLC | 24,984 | 108,696 | ||||||
State Street Corp. | 1,865 | 147,522 | ||||||
T. Rowe Price Group, Inc. | 1,475 | 179,714 | ||||||
UBS Group AG(a) | 42,353 | 534,469 | ||||||
|
| |||||||
| 8,602,574 | ||||||||
|
| |||||||
CONSUMER FINANCE–0.2% | ||||||||
Acom Co., Ltd. | 13,014 | 59,047 | ||||||
American Express Co. | 3,900 | 485,511 | ||||||
Capital One Financial Corp. | 2,653 | 273,020 | ||||||
Credit Saison Co., Ltd. | 3,500 | 60,703 | ||||||
Discover Financial Services | 1,960 | 166,247 | ||||||
Synchrony Financial | 3,278 | 118,041 | ||||||
|
| |||||||
| 1,162,569 | ||||||||
|
| |||||||
DIVERSIFIED FINANCIAL SERVICES–0.8% | ||||||||
AMP Ltd. | 67,589 | 90,921 | ||||||
Berkshire Hathaway, Inc.–Class B(a) | 11,034 | 2,499,201 | ||||||
Challenger Ltd. | 12,809 | 72,890 | ||||||
EXOR NV | 3,679 | 285,238 | ||||||
Company | Shares | U.S. $ Value | ||||||
Groupe Bruxelles Lambert SA | 768 | $ | 81,040 | |||||
IHS Markit Ltd.(a) | 2,211 | 166,599 | ||||||
Industrivarden AB–Class C | 4,979 | 120,071 | ||||||
Investor AB–Class B | 4,336 | 236,719 | ||||||
Kinnevik AB–Class B | 4,676 | 114,586 | ||||||
M&G PLC(a) | 30,322 | 95,270 | ||||||
Mitsubishi UFJ Lease & Finance Co., Ltd. | 7,362 | 47,394 | ||||||
ORIX Corp. | 14,110 | 233,822 | ||||||
Pargesa Holding SA | 1,023 | 84,992 | ||||||
Wendel SA | 844 | 112,427 | ||||||
|
| |||||||
| 4,241,170 | ||||||||
|
| |||||||
INSURANCE–2.2% | ||||||||
Admiral Group PLC | 2,010 | 61,422 | ||||||
Aegon NV | 38,312 | 175,377 | ||||||
Aflac, Inc. | 4,190 | 221,651 | ||||||
Ageas | 2,085 | 123,291 | ||||||
AIA Group Ltd. | 138,549 | 1,457,253 | ||||||
Allianz SE | 4,871 | 1,193,530 | ||||||
Allstate Corp. (The) | 1,850 | 208,033 | ||||||
American International Group, Inc. | 4,933 | 253,211 | ||||||
Aon PLC | 1,375 | 286,399 | ||||||
Arthur J Gallagher & Co. | 1,152 | 109,705 | ||||||
Assicurazioni Generali SpA | 11,115 | 229,467 | ||||||
Assurant, Inc. | 360 | 47,189 | ||||||
Aviva PLC | 43,251 | 240,067 | ||||||
Baloise Holding AG | 926 | 167,592 | ||||||
Chubb Ltd. | 2,612 | 406,584 | ||||||
Cincinnati Financial Corp. | 910 | 95,687 | ||||||
CNP Assurances | 8,285 | 165,080 | ||||||
Dai-ichi Life Holdings, Inc. | 11,850 | 195,291 | ||||||
Direct Line Insurance Group PLC | 13,089 | 54,156 | ||||||
Everest Re Group Ltd. | 244 | 67,549 | ||||||
Gjensidige Forsikring ASA | 3,690 | 77,456 | ||||||
Globe Life, Inc. | 652 | 68,623 | ||||||
Hannover Rueck SE | 795 | 153,288 | ||||||
Hartford Financial Services Group, Inc. (The) | 1,865 | 113,336 | ||||||
Insurance Australia Group Ltd. | 22,589 | 121,373 | ||||||
Japan Post Holdings Co., Ltd. | 16,700 | 157,054 | ||||||
Japan Post Insurance Co., Ltd. | 1,829 | 31,178 | ||||||
Legal & General Group PLC | 63,405 | 254,702 | ||||||
Lincoln National Corp. | 1,240 | 73,172 | ||||||
Loews Corp. | 1,640 | 86,084 | ||||||
Mapfre SA | 17,737 | 47,030 | ||||||
Marsh & McLennan Cos., Inc. | 2,920 | 325,317 | ||||||
Medibank Pvt Ltd. | 39,307 | 87,113 | ||||||
MetLife, Inc. | 5,390 | 274,728 | ||||||
MS&AD Insurance Group Holdings, Inc. | 4,800 | 158,442 | ||||||
9
| DYNAMIC ASSET ALLOCATION PORTFOLIO | ||
| PORTFOLIO OF INVESTMENTS | ||
| (continued) | AB Variable Products Series Fund | |
Company | Shares | U.S. $ Value | ||||||
Muenchener Rueckversicherungs-Gesellschaft AG in Muenchen | 1,588 | $ | 468,608 | |||||
NN Group NV | 7,137 | 271,368 | ||||||
Principal Financial Group, Inc. | 1,590 | 87,450 | ||||||
Progressive Corp. (The) | 3,315 | 239,973 | ||||||
Prudential Financial, Inc. | 2,255 | 211,384 | ||||||
Prudential PLC | 30,322 | 580,989 | ||||||
QBE Insurance Group Ltd. | 13,053 | 117,953 | ||||||
RSA Insurance Group PLC | 10,859 | 81,385 | ||||||
Sampo Oyj–Class A | 4,765 | 208,055 | ||||||
SCOR SE | 3,333 | 140,305 | ||||||
Sompo Holdings, Inc. | 4,000 | 157,078 | ||||||
Sony Financial Holdings, Inc. | 4,130 | 99,140 | ||||||
Suncorp Group Ltd. | 11,891 | 108,016 | ||||||
Swiss Life Holding AG | 342 | 171,571 | ||||||
Swiss Re AG | 3,176 | 356,800 | ||||||
T&D Holdings, Inc. | 5,500 | 69,551 | ||||||
Tokio Marine Holdings, Inc. | 7,300 | 408,718 | ||||||
Travelers Cos., Inc. (The) | 1,490 | 204,056 | ||||||
Tryg A/S | 1,821 | 53,986 | ||||||
Unum Group | 490 | 14,288 | ||||||
Willis Towers Watson PLC | 787 | 158,927 | ||||||
WR Berkley Corp. | 834 | 57,629 | ||||||
Zurich Insurance Group AG | 1,604 | 657,960 | ||||||
|
| |||||||
| 12,712,620 | ||||||||
|
| |||||||
| 51,623,843 | ||||||||
|
| |||||||
INFORMATION TECHNOLOGY–8.3% | ||||||||
COMMUNICATIONS EQUIPMENT–0.3% | ||||||||
Arista Networks, Inc.(a) | 335 | 68,139 | ||||||
Cisco Systems, Inc. | 24,340 | 1,167,346 | ||||||
F5 Networks, Inc.(a) | 380 | 53,067 | ||||||
Juniper Networks, Inc. | 1,210 | 29,802 | ||||||
Motorola Solutions, Inc. | 925 | 149,055 | ||||||
Nokia Oyj | 62,192 | 230,040 | ||||||
Telefonaktiebolaget LM Ericsson–Class B | 28,969 | 253,126 | ||||||
|
| |||||||
| 1,950,575 | ||||||||
|
| |||||||
ELECTRONIC EQUIPMENT, INSTRUMENTS & | ||||||||
Alps Alpine Co., Ltd. | 2,053 | 46,602 | ||||||
Amphenol Corp.–Class A | 1,610 | 174,250 | ||||||
CDW Corp./DE | 832 | 118,843 | ||||||
Corning, Inc. | 4,115 | 119,788 | ||||||
FLIR Systems, Inc. | 810 | 42,177 | ||||||
Halma PLC | 4,302 | 120,467 | ||||||
Hamamatsu Photonics KK | 1,600 | 65,569 | ||||||
Hexagon AB–Class B | 4,263 | 238,946 | ||||||
Hirose Electric Co., Ltd. | 315 | 40,267 | ||||||
Hitachi High-Technologies Corp. | 1,881 | 133,211 | ||||||
Company | Shares | U.S. $ Value | ||||||
Hitachi Ltd. | 10,400 | $ | 438,836 | |||||
Ingenico Group SA | 930 | 101,164 | ||||||
IPG Photonics Corp.(a) | 223 | 32,317 | ||||||
Keyence Corp. | 2,108 | 740,200 | ||||||
Keysight Technologies, Inc.(a) | 1,128 | 115,767 | ||||||
Kyocera Corp. | 3,637 | 247,882 | ||||||
Murata Manufacturing Co., Ltd. | 6,584 | 405,236 | ||||||
Omron Corp. | 1,800 | 104,919 | ||||||
Shimadzu Corp. | 2,000 | 62,546 | ||||||
TDK Corp. | 1,200 | 134,855 | ||||||
TE Connectivity Ltd. | 2,060 | 197,430 | ||||||
Venture Corp., Ltd. | 4,005 | 48,315 | ||||||
Yaskawa Electric Corp. | 2,723 | 102,578 | ||||||
Yokogawa Electric Corp. | 4,500 | 79,025 | ||||||
Zebra Technologies Corp.–Class A(a) | 312 | 79,697 | ||||||
|
| |||||||
| 3,990,887 | ||||||||
|
| |||||||
IT SERVICES–1.8% | ||||||||
Accenture PLC–Class A | 3,625 | 763,316 | ||||||
Adyen NV(a)(b) | 83 | 68,275 | ||||||
Akamai Technologies, Inc.(a) | 1,005 | 86,812 | ||||||
Alliance Data Systems Corp. | 280 | 31,416 | ||||||
Amadeus IT Group SA–Class A | 4,973 | 407,272 | ||||||
Atos SE | 677 | 56,572 | ||||||
Automatic Data Processing, Inc. | 2,480 | 422,840 | ||||||
Broadridge Financial Solutions, Inc. | 719 | 88,825 | ||||||
Capgemini SE | 1,557 | 190,429 | ||||||
Cognizant Technology Solutions Corp.–Class A | 3,190 | 197,844 | ||||||
Computershare Ltd. | 3,663 | 43,186 | ||||||
DXC Technology Co. | 1,018 | 38,267 | ||||||
Fidelity National Information Services, Inc. | 3,499 | 486,676 | ||||||
Fiserv, Inc.(a) | 3,238 | 374,410 | ||||||
FleetCor Technologies, Inc.(a) | 561 | 161,411 | ||||||
Fujitsu Ltd. | 2,228 | 209,556 | ||||||
Gartner, Inc.(a) | 540 | 83,214 | ||||||
Global Payments, Inc. | 1,777 | 324,409 | ||||||
GMO Payment Gateway, Inc. | 913 | 62,523 | ||||||
International Business Machines Corp. | 5,038 | 675,294 | ||||||
Itochu Techno-Solutions Corp. | 1,463 | 41,201 | ||||||
Jack Henry & Associates, Inc. | 497 | 72,398 | ||||||
Leidos Holdings, Inc. | 895 | 87,612 | ||||||
Mastercard, Inc.–Class A | 5,110 | 1,525,795 | ||||||
NEC Corp. | 2,500 | 103,461 | ||||||
Nomura Research Institute Ltd. | 3,900 | 83,406 | ||||||
10
| AB Variable Products Series Fund | ||
Company | Shares | U.S. $ Value | ||||||
NTT Data Corp. | 6,010 | $ | 80,378 | |||||
Obic Co., Ltd. | 730 | 98,332 | ||||||
Otsuka Corp. | 1,200 | 47,922 | ||||||
Paychex, Inc. | 1,945 | 165,442 | ||||||
PayPal Holdings, Inc.(a) | 6,685 | 723,116 | ||||||
VeriSign, Inc.(a) | 675 | 130,059 | ||||||
Visa, Inc.–Class A | 9,900 | 1,860,210 | ||||||
Western Union Co. (The)–Class W(c) | 1,690 | 45,258 | ||||||
Wirecard AG | 1,262 | 152,175 | ||||||
Wix.com Ltd.(a) | 543 | 66,452 | ||||||
Worldline SA/France(a)(b) | 270 | 19,141 | ||||||
|
| |||||||
| 10,074,905 | ||||||||
|
| |||||||
SEMICONDUCTORS & SEMICONDUCTOR EQUIPMENT–1.7% | ||||||||
Advanced Micro Devices, Inc.(a) | 4,803 | 220,266 | ||||||
Advantest Corp. | 2,262 | 127,573 | ||||||
Analog Devices, Inc. | 2,060 | 244,810 | ||||||
Applied Materials, Inc. | 5,325 | 325,038 | ||||||
ASM Pacific Technology Ltd. | 900 | 12,492 | ||||||
ASML Holding NV | 4,875 | 1,443,275 | ||||||
Broadcom, Inc. | 2,259 | 713,889 | ||||||
Disco Corp. | 309 | 72,561 | ||||||
Infineon Technologies AG | 14,329 | 323,754 | ||||||
Intel Corp. | 25,460 | 1,523,781 | ||||||
KLA Corp. | 1,010 | 179,952 | ||||||
Lam Research Corp. | 929 | 271,640 | ||||||
Maxim Integrated Products, Inc. | 1,675 | 103,029 | ||||||
Microchip Technology, Inc.(c) | 1,445 | 151,320 | ||||||
Micron Technology, Inc.(a) | 6,280 | 337,738 | ||||||
NVIDIA Corp. | 3,465 | 815,315 | ||||||
NXP Semiconductors NV | 3,195 | 406,596 | ||||||
Qorvo, Inc.(a) | 718 | 83,453 | ||||||
QUALCOMM, Inc. | 6,914 | 610,022 | ||||||
Renesas Electronics Corp.(a) | 9,161 | 62,588 | ||||||
Rohm Co., Ltd. | 1,300 | 103,726 | ||||||
Skyworks Solutions, Inc. | 1,024 | 123,781 | ||||||
STMicroelectronics NV | 12,251 | 330,539 | ||||||
SUMCO Corp. | 2,522 | 41,787 | ||||||
Texas Instruments, Inc. | 5,345 | 685,710 | ||||||
Tokyo Electron Ltd. | 1,689 | 368,759 | ||||||
Xilinx, Inc. | 1,385 | 135,411 | ||||||
|
| |||||||
| 9,818,805 | ||||||||
|
| |||||||
SOFTWARE–2.3% | ||||||||
Adobe, Inc.(a) | 2,780 | 916,872 | ||||||
ANSYS, Inc.(a) | 512 | 131,794 | ||||||
Autodesk, Inc.(a) | 1,235 | 226,573 | ||||||
AVEVA Group PLC | 740 | 45,653 | ||||||
Cadence Design Systems, Inc.(a) | 1,714 | 118,883 | ||||||
Check Point Software Technologies Ltd.(a)(c) | 1,396 | 154,900 | ||||||
Company | Shares | U.S. $ Value | ||||||
Citrix Systems, Inc. | 780 | $ | 86,502 | |||||
CyberArk Software Ltd.(a) | 439 | 51,179 | ||||||
Dassault Systemes SE | 1,424 | 234,854 | ||||||
Fortinet, Inc.(a) | 869 | 92,775 | ||||||
Intuit, Inc. | 1,480 | 387,656 | ||||||
Micro Focus International PLC | 3,943 | 55,342 | ||||||
Microsoft Corp. | 43,573 | 6,871,462 | ||||||
Nice Ltd.(a) | 690 | 106,991 | ||||||
NortonLifeLock, Inc. | 2,925 | 74,646 | ||||||
Oracle Corp. | 12,661 | 670,780 | ||||||
Oracle Corp. Japan | 500 | 45,379 | ||||||
Sage Group PLC (The) | 12,240 | 121,429 | ||||||
salesforce.com, Inc.(a) | 4,853 | 789,292 | ||||||
SAP SE | 11,137 | 1,499,019 | ||||||
ServiceNow, Inc.(a) | 1,079 | 304,623 | ||||||
Synopsys, Inc.(a) | 922 | 128,342 | ||||||
Temenos AG(a) | 662 | 104,721 | ||||||
Trend Micro, Inc./Japan | 1,600 | 81,872 | ||||||
WiseTech Global Ltd. | 2,856 | 46,902 | ||||||
|
| |||||||
| 13,348,441 | ||||||||
|
| |||||||
TECHNOLOGY HARDWARE, STORAGE & PERIPHERALS–1.5% | ||||||||
Apple, Inc. | 24,174 | 7,098,695 | ||||||
Brother Industries Ltd. | 2,200 | 45,437 | ||||||
Canon, Inc. | 11,400 | 312,001 | ||||||
FUJIFILM Holdings Corp. | 4,200 | 200,575 | ||||||
Hewlett Packard Enterprise Co. | 6,680 | 105,945 | ||||||
HP, Inc. | 8,170 | 167,893 | ||||||
Konica Minolta, Inc. | 6,000 | 39,085 | ||||||
NetApp, Inc. | 1,490 | 92,752 | ||||||
Ricoh Co., Ltd. | 6,000 | 65,289 | ||||||
Seagate Technology PLC | 1,550 | 92,225 | ||||||
Seiko Epson Corp. | 2,700 | 40,767 | ||||||
Western Digital Corp. | 1,813 | 115,071 | ||||||
Xerox Holdings Corp.(a) | 466 | 17,181 | ||||||
|
| |||||||
| 8,392,916 | ||||||||
|
| |||||||
| 47,576,529 | ||||||||
|
| |||||||
HEALTH CARE–7.5% | ||||||||
BIOTECHNOLOGY–0.8% | ||||||||
AbbVie, Inc. | 8,402 | 743,913 | ||||||
Alexion Pharmaceuticals, Inc.(a) | 1,380 | 149,247 | ||||||
Amgen, Inc. | 3,478 | 838,441 | ||||||
BeiGene Ltd. (Sponsored ADR)(a) | 415 | 68,790 | ||||||
Biogen, Inc.(a) | 1,115 | 330,854 | ||||||
CSL Ltd. | 5,165 | 1,001,401 | ||||||
Genmab A/S(a) | 745 | 165,691 | ||||||
Gilead Sciences, Inc. | 7,225 | 469,480 | ||||||
Grifols SA | 3,644 | 128,748 | ||||||
Incyte Corp.(a) | 1,090 | 95,179 | ||||||
PeptiDream, Inc.(a) | 1,023 | 52,279 | ||||||
11
| DYNAMIC ASSET ALLOCATION PORTFOLIO | ||
| PORTFOLIO OF INVESTMENTS | ||
| (continued) | AB Variable Products Series Fund | |
Company | Shares | U.S. $ Value | ||||||
Regeneron Pharmaceuticals, Inc.(a) | 490 | $ | 183,985 | |||||
Vertex Pharmaceuticals, Inc.(a) | 1,467 | 321,200 | ||||||
|
| |||||||
| 4,549,208 | ||||||||
|
| |||||||
HEALTH CARE EQUIPMENT & | ||||||||
Abbott Laboratories | 10,026 | 870,858 | ||||||
ABIOMED, Inc.(a) | 308 | 52,542 | ||||||
Alcon, Inc.(a) | 4,817 | 272,843 | ||||||
Align Technology, Inc.(a) | 440 | 122,778 | ||||||
Asahi Intecc Co., Ltd. | 1,468 | 42,985 | ||||||
Baxter International, Inc. | 2,690 | 224,938 | ||||||
Becton Dickinson and Co. | 1,538 | 418,290 | ||||||
BioMerieux | 788 | 70,254 | ||||||
Boston Scientific Corp.(a) | 7,910 | 357,690 | ||||||
Carl Zeiss Meditec AG | 488 | 62,039 | ||||||
Cochlear Ltd. | 682 | 107,487 | ||||||
Coloplast A/S–Class B | 1,154 | 143,167 | ||||||
Cooper Cos., Inc. (The) | 311 | 99,921 | ||||||
Danaher Corp. | 3,590 | 550,993 | ||||||
Demant A/S(a) | 2,050 | 64,560 | ||||||
DENTSPLY SIRONA, Inc. | 1,446 | 81,829 | ||||||
Edwards Lifesciences Corp.(a) | 1,190 | 277,615 | ||||||
Fisher & Paykel Healthcare Corp., Ltd. | 6,133 | 91,786 | ||||||
Hologic, Inc.(a) | 1,620 | 84,580 | ||||||
Hoya Corp. | 4,322 | 412,587 | ||||||
IDEXX Laboratories, Inc.(a) | 533 | 139,182 | ||||||
Intuitive Surgical, Inc.(a) | 655 | 387,203 | ||||||
Koninklijke Philips NV | 14,135 | 690,971 | ||||||
Medtronic PLC | 7,629 | 865,510 | ||||||
Olympus Corp. | 13,355 | 205,837 | ||||||
ResMed, Inc. | 866 | 134,204 | ||||||
Sartorius AG (Preference Shares) | 812 | 173,575 | ||||||
Siemens Healthineers AG(b) | 1,618 | 77,562 | ||||||
Smith & Nephew PLC | 9,779 | 235,681 | ||||||
Sonova Holding AG | 666 | 152,253 | ||||||
STERIS PLC | 491 | 74,838 | ||||||
Straumann Holding AG | 145 | 142,235 | ||||||
Stryker Corp. | 1,765 | 370,544 | ||||||
Sysmex Corp. | 1,836 | 125,004 | ||||||
Teleflex, Inc. | 311 | 117,073 | ||||||
Terumo Corp. | 6,600 | 234,130 | ||||||
Varian Medical Systems, Inc.(a) | 545 | 77,396 | ||||||
Zimmer Biomet Holdings, Inc. | 1,125 | 168,390 | ||||||
|
| |||||||
| 8,781,330 | ||||||||
|
| |||||||
HEALTH CARE PROVIDERS & SERVICES–0.9% | ||||||||
Alfresa Holdings Corp. | 2,700 | 54,850 | ||||||
AmerisourceBergen Corp.–Class A | 935 | 79,494 | ||||||
Company | Shares | U.S. $ Value | ||||||
Anthem, Inc. | 1,460 | $ | 440,964 | |||||
Cardinal Health, Inc. | 1,365 | 69,042 | ||||||
Centene Corp.(a) | 2,064 | 129,764 | ||||||
Cigna Corp.(a) | 2,161 | 441,903 | ||||||
CVS Health Corp. | 7,389 | 548,929 | ||||||
DaVita, Inc.(a) | 750 | 56,272 | ||||||
Fresenius Medical Care AG & Co. KGaA | 2,085 | 153,514 | ||||||
Fresenius SE & Co. KGaA | 4,696 | 264,260 | ||||||
HCA Healthcare, Inc. | 1,470 | 217,281 | ||||||
Henry Schein, Inc.(a) | 890 | 59,381 | ||||||
Humana, Inc. | 785 | 287,718 | ||||||
Laboratory Corp. of America Holdings(a) | 625 | 105,731 | ||||||
McKesson Corp. | 1,165 | 161,143 | ||||||
Medipal Holdings Corp. | 3,900 | 86,074 | ||||||
NMC Health PLC | 1,143 | 26,780 | ||||||
Quest Diagnostics, Inc. | 800 | 85,432 | ||||||
Ramsay Health Care Ltd. | 1,156 | 58,815 | ||||||
Ryman Healthcare Ltd. | 5,937 | 65,251 | ||||||
Sonic Healthcare Ltd. | 5,598 | 112,872 | ||||||
Suzuken Co., Ltd./Aichi Japan | 1,200 | 48,909 | ||||||
UnitedHealth Group, Inc. | 5,405 | 1,588,962 | ||||||
Universal Health Services, Inc.–Class B | 500 | 71,730 | ||||||
WellCare Health Plans, Inc.(a) | 347 | 114,583 | ||||||
|
| |||||||
| 5,329,654 | ||||||||
|
| |||||||
HEALTH CARE TECHNOLOGY–0.1% | ||||||||
Cerner Corp. | 1,980 | 145,312 | ||||||
M3, Inc. | 4,140 | 124,844 | ||||||
|
| |||||||
| 270,156 | ||||||||
|
| |||||||
LIFE SCIENCES TOOLS & SERVICES–0.4% | ||||||||
Agilent Technologies, Inc. | 1,945 | 165,928 | ||||||
Illumina, Inc.(a) | 831 | 275,676 | ||||||
IQVIA Holdings, Inc.(a) | 996 | 153,892 | ||||||
Lonza Group AG(a) | 779 | 284,185 | ||||||
Mettler-Toledo International, Inc.(a) | 170 | 134,858 | ||||||
PerkinElmer, Inc. | 655 | 63,600 | ||||||
QIAGEN NV(a) | 2,703 | 92,100 | ||||||
Sartorius Stedim Biotech | 712 | 118,183 | ||||||
Thermo Fisher Scientific, Inc. | 2,285 | 742,328 | ||||||
Waters Corp.(a) | 445 | 103,974 | ||||||
|
| |||||||
| 2,134,724 | ||||||||
|
| |||||||
PHARMACEUTICALS–3.8% | ||||||||
Allergan PLC | 1,760 | 336,459 | ||||||
Astellas Pharma, Inc. | 22,500 | 384,075 | ||||||
AstraZeneca PLC | 15,028 | 1,504,182 | ||||||
Bayer AG | 10,385 | 844,265 | ||||||
Bristol-Myers Squibb Co. | 13,315 | 854,690 | ||||||
12
| AB Variable Products Series Fund | ||
Company | Shares | U.S. $ Value | ||||||
Chugai Pharmaceutical Co., Ltd. | 2,537 | $ | 233,646 | |||||
Daiichi Sankyo Co., Ltd. | 6,428 | 424,532 | ||||||
Eisai Co., Ltd. | 2,933 | 219,464 | ||||||
Eli Lilly & Co. | 4,923 | 647,030 | ||||||
GlaxoSmithKline PLC | 57,174 | 1,343,419 | ||||||
Hisamitsu Pharmaceutical Co., Inc. | 1,000 | 48,701 | ||||||
Ipsen SA | 880 | 78,115 | ||||||
Johnson & Johnson | 15,095 | 2,201,908 | ||||||
Kyowa Kirin Co., Ltd. | 2,152 | 50,702 | ||||||
Merck & Co., Inc. | 14,635 | 1,331,053 | ||||||
Merck KGaA | 1,230 | 145,009 | ||||||
Mitsubishi Tanabe Pharma Corp. | 3,000 | 55,035 | ||||||
Mylan NV(a) | 2,055 | 41,305 | ||||||
Nippon Shinyaku Co., Ltd. | 701 | 60,702 | ||||||
Novartis AG | 24,523 | 2,322,072 | ||||||
Novo Nordisk A/S–Class B | 20,377 | 1,180,823 | ||||||
Ono Pharmaceutical Co., Ltd. | 3,900 | 89,038 | ||||||
Orion Oyj–Class B | 974 | 45,108 | ||||||
Otsuka Holdings Co., Ltd. | 4,348 | 193,809 | ||||||
Perrigo Co. PLC | 772 | 39,882 | ||||||
Pfizer, Inc. | 31,554 | 1,236,286 | ||||||
Recordati SpA | 2,055 | 86,628 | ||||||
Roche Holding AG | 7,961 | 2,587,346 | ||||||
Sanofi | 12,344 | 1,239,676 | ||||||
Santen Pharmaceutical Co., Ltd. | 4,389 | 83,580 | ||||||
Shionogi & Co., Ltd. | 2,800 | 173,212 | ||||||
Sumitomo Dainippon Pharma Co., Ltd. | 2,900 | 56,188 | ||||||
Taisho Pharmaceutical Holdings Co., Ltd. | 567 | 41,842 | ||||||
Takeda Pharmaceutical Co., Ltd. | 16,445 | 650,436 | ||||||
Teva Pharmaceutical Industries Ltd. (Sponsored ADR)(a)(c) | 12,347 | 121,001 | ||||||
UCB SA | 1,519 | 120,874 | ||||||
Vifor Pharma AG | 802 | 146,369 | ||||||
Zoetis, Inc. | 2,726 | 360,786 | ||||||
|
| |||||||
| 21,579,248 | ||||||||
|
| |||||||
| 42,644,320 | ||||||||
|
| |||||||
INDUSTRIALS–6.9% | ||||||||
AEROSPACE & DEFENSE–1.1% | ||||||||
Airbus SE | 6,243 | 916,255 | ||||||
Arconic, Inc. | 1,616 | 49,724 | ||||||
BAE Systems PLC | 36,720 | 274,934 | ||||||
Boeing Co. (The) | 2,980 | 970,765 | ||||||
Dassault Aviation SA | 41 | 53,808 | ||||||
Elbit Systems Ltd. | 250 | 38,953 | ||||||
General Dynamics Corp. | 1,550 | 273,342 | ||||||
Huntington Ingalls Industries, Inc. | 279 | 69,995 | ||||||
L3Harris Technologies, Inc. | 1,257 | 248,723 | ||||||
Company | Shares | U.S. $ Value | ||||||
Leonardo SpA | 5,271 | $ | 61,815 | |||||
Lockheed Martin Corp. | 1,410 | 549,026 | ||||||
Meggitt PLC | 10,854 | 94,538 | ||||||
MTU Aero Engines AG | 579 | 164,972 | ||||||
Northrop Grumman Corp. | 970 | 333,651 | ||||||
Raytheon Co. | 1,590 | 349,387 | ||||||
Rolls-Royce Holdings PLC(a) | 19,591 | 177,064 | ||||||
Safran SA | 3,586 | 553,891 | ||||||
Singapore Technologies Engineering Ltd. | 43,000 | 125,931 | ||||||
Textron, Inc. | 1,405 | 62,663 | ||||||
Thales SA | 1,184 | 123,201 | ||||||
TransDigm Group, Inc.(c) | 313 | 175,280 | ||||||
United Technologies Corp. | 4,625 | 692,640 | ||||||
|
| |||||||
| 6,360,558 | ||||||||
|
| |||||||
AIR FREIGHT & LOGISTICS–0.3% | ||||||||
Bollore SA | 25,929 | 113,307 | ||||||
CH Robinson Worldwide, Inc. | 815 | 63,733 | ||||||
Deutsche Post AG | 10,803 | 410,775 | ||||||
DSV PANALPINA A/S | 2,516 | 289,977 | ||||||
Expeditors International of Washington, Inc. | 1,020 | 79,580 | ||||||
FedEx Corp. | 1,465 | 221,523 | ||||||
Kuehne & Nagel International AG | 477 | 80,454 | ||||||
SG Holdings Co., Ltd. | 2,174 | 48,971 | ||||||
United Parcel Service, Inc.–Class B | 3,965 | 464,143 | ||||||
Yamato Holdings Co., Ltd. | 3,400 | 57,969 | ||||||
|
| |||||||
| 1,830,432 | ||||||||
|
| |||||||
AIRLINES–0.2% | ||||||||
Alaska Air Group, Inc. | 743 | 50,338 | ||||||
American Airlines Group, Inc.(c) | 1,632 | 46,806 | ||||||
ANA Holdings, Inc. | 1,007 | 33,617 | ||||||
Delta Air Lines, Inc. | 3,292 | 192,516 | ||||||
Deutsche Lufthansa AG | 3,330 | 61,296 | ||||||
easyJet PLC | 2,320 | 43,702 | ||||||
Japan Airlines Co., Ltd. | 2,921 | 90,948 | ||||||
Qantas Airways Ltd. | 11,303 | 56,340 | ||||||
Singapore Airlines Ltd. | 14,000 | 94,126 | ||||||
Southwest Airlines Co. | 2,605 | 140,618 | ||||||
United Airlines Holdings, Inc.(a) | 1,372 | 120,859 | ||||||
|
| |||||||
| 931,166 | ||||||||
|
| |||||||
BUILDING PRODUCTS–0.3% | ||||||||
AGC, Inc./Japan | 2,000 | 71,516 | ||||||
Allegion PLC | 585 | 72,856 | ||||||
AO Smith Corp. | 855 | 40,732 | ||||||
Assa Abloy AB–Class B | 9,541 | 223,025 | ||||||
Cie de Saint-Gobain | 4,539 | 185,944 | ||||||
Daikin Industries Ltd. | 2,774 | 391,383 | ||||||
13
| DYNAMIC ASSET ALLOCATION PORTFOLIO | ||
| PORTFOLIO OF INVESTMENTS | ||
| (continued) | AB Variable Products Series Fund | |
Company | Shares | U.S. $ Value | ||||||
Fortune Brands Home & Security, Inc. | 821 | $ | 53,644 | |||||
Geberit AG | 360 | 202,061 | ||||||
Johnson Controls International PLC | 4,392 | 178,799 | ||||||
Kingspan Group PLC | 1,858 | 113,480 | ||||||
LIXIL Group Corp. | 2,500 | 43,142 | ||||||
Masco Corp. | 1,285 | 61,667 | ||||||
TOTO Ltd. | 1,522 | 64,270 | ||||||
|
| |||||||
| 1,702,519 | ||||||||
|
| |||||||
COMMERCIAL SERVICES & SUPPLIES–0.3% | ||||||||
Brambles Ltd. | 15,030 | 123,707 | ||||||
Cintas Corp. | 535 | 143,958 | ||||||
Copart, Inc.(a) | 1,241 | 112,856 | ||||||
Dai Nippon Printing Co., Ltd. | 2,500 | 67,619 | ||||||
Edenred | 2,787 | 144,435 | ||||||
G4S PLC | 17,154 | 49,607 | ||||||
Park24 Co., Ltd. | 1,300 | 31,832 | ||||||
Rentokil Initial PLC | 20,957 | 125,607 | ||||||
Republic Services, Inc.–Class A | 1,300 | 116,519 | ||||||
Rollins, Inc.(c) | 254 | 8,423 | ||||||
Secom Co., Ltd. | 2,338 | 208,649 | ||||||
Sohgo Security Services Co., Ltd. | 1,000 | 54,125 | ||||||
Toppan Printing Co., Ltd. | 2,500 | 51,646 | ||||||
Waste Management, Inc. | 2,215 | 252,421 | ||||||
|
| |||||||
| 1,491,404 | ||||||||
|
| |||||||
CONSTRUCTION & ENGINEERING–0.4% | ||||||||
ACS Actividades de Construccion y Servicios SA | 2,778 | 111,437 | ||||||
Bouygues SA | 1,739 | 74,128 | ||||||
CIMIC Group Ltd. | 2,988 | 69,470 | ||||||
Eiffage SA | 1,102 | 126,429 | ||||||
Epiroc AB–Class A | 16,027 | 195,998 | ||||||
Epiroc AB–Class B | 3,579 | 42,536 | ||||||
Ferrovial SA | 4,946 | 149,850 | ||||||
HOCHTIEF AG | 422 | 53,727 | ||||||
Jacobs Engineering Group, Inc. | 665 | 59,737 | ||||||
JGC Holdings Corp. | 4,000 | 63,664 | ||||||
Kajima Corp. | 3,500 | 46,533 | ||||||
Obayashi Corp. | 6,000 | 66,640 | ||||||
Quanta Services, Inc. | 265 | 10,788 | ||||||
Shimizu Corp. | 4,000 | 40,747 | ||||||
Skanska AB–Class B | 8,587 | 194,252 | ||||||
Taisei Corp. | 2,000 | 82,842 | ||||||
Vinci SA | 5,456 | 607,654 | ||||||
|
| |||||||
| 1,996,432 | ||||||||
|
| |||||||
ELECTRICAL EQUIPMENT–0.6% | ||||||||
ABB Ltd. | 20,970 | 505,862 | ||||||
AMETEK, Inc. | 1,399 | 139,536 | ||||||
Eaton Corp. PLC | 2,314 | 219,182 | ||||||
Company | Shares | U.S. $ Value | ||||||
Emerson Electric Co. | 3,440 | $ | 262,334 | |||||
Fuji Electric Co., Ltd. | 2,800 | 85,056 | ||||||
Legrand SA | 2,541 | 207,508 | ||||||
Melrose Industries PLC | 52,623 | 167,616 | ||||||
Mitsubishi Electric Corp. | 21,000 | 285,929 | ||||||
Nidec Corp. | 2,567 | 350,610 | ||||||
Prysmian SpA | 1,074 | 25,926 | ||||||
Rockwell Automation, Inc. | 730 | 147,949 | ||||||
Schneider Electric SE | 6,098 | 626,507 | ||||||
Siemens Gamesa Renewable Energy SA | 2,259 | 39,783 | ||||||
Vestas Wind Systems A/S | 2,133 | 215,447 | ||||||
|
| |||||||
| 3,279,245 | ||||||||
|
| |||||||
INDUSTRIAL CONGLOMERATES–0.7% | ||||||||
3M Co. | 3,275 | 577,775 | ||||||
CK Hutchison Holdings Ltd. | 25,840 | 246,397 | ||||||
DCC PLC | 1,216 | 105,475 | ||||||
General Electric Co. | 49,579 | 553,302 | ||||||
Honeywell International, Inc. | 4,145 | 733,665 | ||||||
Jardine Matheson Holdings Ltd. | 2,300 | 127,990 | ||||||
Jardine Strategic Holdings Ltd. | 2,005 | 61,490 | ||||||
Keihan Holdings Co., Ltd. | 1,000 | 48,557 | ||||||
Keppel Corp., Ltd. | 13,000 | 65,501 | ||||||
NWS Holdings Ltd. | 37,000 | 51,858 | ||||||
Roper Technologies, Inc. | 595 | 210,767 | ||||||
Siemens AG | 8,669 | 1,132,098 | ||||||
Smiths Group PLC | 3,761 | 84,002 | ||||||
Toshiba Corp. | 7,200 | 244,380 | ||||||
|
| |||||||
| 4,243,257 | ||||||||
|
| |||||||
MACHINERY–1.3% | ||||||||
Alfa Laval AB | 3,778 | 95,146 | ||||||
Alstom SA | 3,502 | 166,412 | ||||||
Amada Holdings Co., Ltd. | 3,000 | 34,121 | ||||||
ANDRITZ AG | 693 | 29,792 | ||||||
Atlas Copco AB–Class A | 6,392 | 255,141 | ||||||
Atlas Copco AB–Class B SHS | 3,579 | 124,267 | ||||||
Caterpillar, Inc. | 3,255 | 480,698 | ||||||
CNH Industrial NV | 22,634 | 248,519 | ||||||
Cummins, Inc. | 900 | 161,064 | ||||||
Daifuku Co., Ltd. | 1,030 | 62,248 | ||||||
Deere & Co. | 1,805 | 312,734 | ||||||
Dover Corp. | 885 | 102,005 | ||||||
FANUC Corp. | 2,100 | 387,796 | ||||||
Flowserve Corp. | 810 | 40,314 | ||||||
Fortive Corp. | 1,820 | 139,030 | ||||||
GEA Group AG | 1,741 | 57,571 | ||||||
Hino Motors Ltd. | 6,000 | 63,453 | ||||||
Hitachi Construction Machinery Co., Ltd. | 3,000 | 89,362 | ||||||
Hoshizaki Corp. | 400 | 35,664 | ||||||
IDEX Corp. | 472 | 81,184 | ||||||
IHI Corp. | 2,600 | 60,842 | ||||||
Illinois Tool Works, Inc. | 1,715 | 308,065 | ||||||
14
| AB Variable Products Series Fund | ||
Company | Shares | U.S. $ Value | ||||||
Ingersoll-Rand PLC | 1,325 | $ | 176,119 | |||||
JTEKT Corp. | 4,300 | 50,796 | ||||||
Kawasaki Heavy Industries Ltd. | 3,337 | 72,936 | ||||||
KION Group AG | 1,747 | 120,136 | ||||||
Knorr-Bremse AG | 473 | 48,149 | ||||||
Komatsu Ltd. | 9,800 | 235,214 | ||||||
Kone Oyj–Class B | 3,896 | 254,751 | ||||||
Kubota Corp. | 11,872 | 186,429 | ||||||
Kurita Water Industries Ltd. | 1,200 | 35,610 | ||||||
Makita Corp. | 2,200 | 75,977 | ||||||
Metso Oyj | 1,073 | 42,389 | ||||||
MINEBEA MITSUMI, Inc. | 4,131 | 85,330 | ||||||
MISUMI Group, Inc. | 2,900 | 71,775 | ||||||
Mitsubishi Heavy Industries Ltd. | 3,100 | 120,208 | ||||||
Nabtesco Corp. | 1,000 | 29,467 | ||||||
NGK Insulators Ltd. | 2,000 | 34,792 | ||||||
NSK Ltd. | 4,719 | 44,610 | ||||||
PACCAR, Inc. | 2,110 | 166,901 | ||||||
Parker-Hannifin Corp. | 795 | 163,627 | ||||||
Pentair PLC | 380 | 17,431 | ||||||
Sandvik AB | 12,165 | 236,942 | ||||||
Schindler Holding AG | 413 | 105,026 | ||||||
Schindler Holding AG (REG) | 575 | 140,813 | ||||||
SKF AB–Class B | 4,700 | 95,158 | ||||||
SMC Corp./Japan | 600 | 274,389 | ||||||
Snap-on, Inc. | 320 | 54,208 | ||||||
Spirax-Sarco Engineering PLC | 834 | 98,173 | ||||||
Stanley Black & Decker, Inc. | 915 | 151,652 | ||||||
Sumitomo Heavy Industries Ltd. | 1,200 | 34,086 | ||||||
Techtronic Industries Co., Ltd. | 13,454 | 109,807 | ||||||
THK Co., Ltd. | 1,531 | 41,105 | ||||||
Volvo AB–Class B | 14,676 | 245,694 | ||||||
Wartsila Oyj Abp | 4,224 | 46,690 | ||||||
Weir Group PLC (The) | 2,037 | 40,740 | ||||||
Westinghouse Air Brake Technologies Corp. | 1,115 | 86,747 | ||||||
Xylem, Inc./NY | 1,085 | 85,487 | ||||||
Yangzijiang Shipbuilding Holdings Ltd. | 56,331 | 46,956 | ||||||
|
| |||||||
| 7,261,748 | ||||||||
|
| |||||||
MARINE–0.0% | ||||||||
AP Moller–Maersk A/S–Class A | 70 | 94,884 | ||||||
AP Moller–Maersk A/S–Class B | 68 | 98,072 | ||||||
Mitsui OSK Lines Ltd. | 1,200 | 33,001 | ||||||
Nippon Yusen KK | 3,100 | 55,873 | ||||||
|
| |||||||
| 281,830 | ||||||||
|
| |||||||
PROFESSIONAL SERVICES–0.5% | ||||||||
Adecco Group AG | 1,673 | 105,771 | ||||||
Bureau Veritas SA | 3,094 | 80,883 | ||||||
Company | Shares | U.S. $ Value | ||||||
Equifax, Inc. | 755 | $ | 105,791 | |||||
Experian PLC | 10,230 | 346,791 | ||||||
Intertek Group PLC | 1,990 | 154,201 | ||||||
Nielsen Holdings PLC | 1,166 | 23,670 | ||||||
Persol Holdings Co., Ltd. | 2,583 | 48,408 | ||||||
Randstad NV | 1,613 | 98,837 | ||||||
Recruit Holdings Co., Ltd. | 15,153 | 567,561 | ||||||
RELX PLC (London) | 22,241 | 561,437 | ||||||
Robert Half International, Inc. | 685 | 43,258 | ||||||
SEEK Ltd. | 4,101 | 64,909 | ||||||
SGS SA | 52 | 142,411 | ||||||
Teleperformance | 655 | 160,028 | ||||||
Verisk Analytics, Inc.–Class A | 1,000 | 149,340 | ||||||
Wolters Kluwer NV | 5,568 | 406,550 | ||||||
|
| |||||||
| 3,059,846 | ||||||||
|
| |||||||
ROAD & RAIL–0.6% | ||||||||
Aurizon Holdings Ltd. | 22,082 | 81,039 | ||||||
Central Japan Railway Co. | 1,537 | 309,043 | ||||||
CSX Corp. | 4,380 | 316,937 | ||||||
East Japan Railway Co. | 3,600 | 324,943 | ||||||
Hankyu Hanshin Holdings, Inc. | 2,200 | 94,106 | ||||||
JB Hunt Transport Services, Inc. | 503 | 58,740 | ||||||
Kansas City Southern | 620 | 94,959 | ||||||
Keikyu Corp. | 2,000 | 38,558 | ||||||
Keio Corp. | 1,200 | 72,611 | ||||||
Keisei Electric Railway Co., Ltd. | 1,465 | 56,768 | ||||||
Kintetsu Group Holdings Co., Ltd. | 1,700 | 92,208 | ||||||
Kyushu Railway Co. | 1,722 | 57,648 | ||||||
MTR Corp., Ltd. | 15,500 | 91,597 | ||||||
Nagoya Railroad Co., Ltd. | 1,800 | 55,895 | ||||||
Nippon Express Co., Ltd. | 1,200 | 70,343 | ||||||
Norfolk Southern Corp. | 1,520 | 295,078 | ||||||
Odakyu Electric Railway Co., Ltd. | 3,000 | 69,987 | ||||||
Old Dominion Freight Line, Inc. | 369 | 70,029 | ||||||
Seibu Holdings, Inc. | 3,142 | 51,685 | ||||||
Tobu Railway Co., Ltd. | 2,165 | 78,375 | ||||||
Tokyu Corp. | 5,000 | 92,463 | ||||||
Union Pacific Corp. | 4,040 | 730,392 | ||||||
West Japan Railway Co. | 1,568 | 135,622 | ||||||
|
| |||||||
| 3,339,026 | ||||||||
|
| |||||||
TRADING COMPANIES & DISTRIBUTORS–0.4% | ||||||||
AerCap Holdings NV(a) | 1,409 | 86,611 | ||||||
Ashtead Group PLC | 5,697 | 182,160 | ||||||
Brenntag AG | 1,471 | 79,812 | ||||||
Bunzl PLC | 3,191 | 87,276 | ||||||
Fastenal Co. | 2,830 | 104,568 | ||||||
Ferguson PLC | 2,936 | 267,196 | ||||||
ITOCHU Corp. | 16,000 | 370,827 | ||||||
15
| DYNAMIC ASSET ALLOCATION PORTFOLIO | ||
| PORTFOLIO OF INVESTMENTS | ||
| (continued) | AB Variable Products Series Fund | |
Company | Shares | U.S. $ Value | ||||||
Marubeni Corp. | 16,000 | $ | 118,214 | |||||
Mitsubishi Corp. | 16,100 | 426,511 | ||||||
Mitsui & Co., Ltd. | 18,200 | 323,514 | ||||||
MonotaRO Co., Ltd. | 2,090 | 55,638 | ||||||
Sumitomo Corp. | 13,465 | 200,000 | ||||||
Toyota Tsusho Corp. | 2,300 | 80,794 | ||||||
United Rentals, Inc.(a) | 500 | 83,385 | ||||||
WW Grainger, Inc. | 280 | 94,786 | ||||||
|
| |||||||
| 2,561,292 | ||||||||
|
| |||||||
TRANSPORTATION INFRASTRUCTURE–0.2% | ||||||||
Aena SME SA(b) | 780 | 149,540 | ||||||
Aeroports de Paris | 1,000 | 197,994 | ||||||
Atlantia SpA | 3,639 | 84,930 | ||||||
Auckland International Airport Ltd. | 10,521 | 62,015 | ||||||
Getlink SE | 6,892 | 120,161 | ||||||
Japan Airport Terminal Co., Ltd. | 1,196 | 66,360 | ||||||
Kamigumi Co., Ltd. | 1,500 | 32,973 | ||||||
Sydney Airport | 8,828 | 53,637 | ||||||
Transurban Group | 30,317 | 317,329 | ||||||
|
| |||||||
| 1,084,939 | ||||||||
|
| |||||||
| 39,423,694 | ||||||||
|
| |||||||
CONSUMER DISCRETIONARY–6.1% | ||||||||
AUTO COMPONENTS–0.3% | ||||||||
Aisin Seiki Co., Ltd. | 1,800 | 66,672 | ||||||
Aptiv PLC | 1,591 | 151,097 | ||||||
BorgWarner, Inc. | 620 | 26,896 | ||||||
Bridgestone Corp. | 6,900 | 256,336 | ||||||
Cie Generale des Etablissements Michelin SCA–Class B | 1,732 | 213,138 | ||||||
Continental AG | 1,047 | 135,304 | ||||||
Denso Corp. | 5,200 | 234,844 | ||||||
Faurecia SE | 1,635 | 88,760 | ||||||
Koito Manufacturing Co., Ltd. | 1,000 | 46,306 | ||||||
NGK Spark Plug Co., Ltd. | 3,000 | 58,152 | ||||||
Nokian Renkaat Oyj | 1,090 | 31,351 | ||||||
Stanley Electric Co., Ltd. | 1,600 | 46,210 | ||||||
Sumitomo Electric Industries Ltd. | 7,200 | 108,131 | ||||||
Sumitomo Rubber Industries Ltd. | 4,100 | 49,994 | ||||||
Toyota Industries Corp. | 1,600 | 92,064 | ||||||
Valeo SA | 2,277 | 80,704 | ||||||
Yokohama Rubber Co., Ltd. (The) | 1,000 | 19,395 | ||||||
|
| |||||||
| 1,705,354 | ||||||||
|
| |||||||
AUTOMOBILES–1.0% | ||||||||
Bayerische Motoren Werke AG | 3,152 | 258,167 | ||||||
Bayerische Motoren Werke AG (Preference Shares) | 885 | 54,482 | ||||||
Company | Shares | U.S. $ Value | ||||||
Daimler AG | 10,262 | $ | 567,327 | |||||
Ferrari NV | 1,527 | 253,536 | ||||||
Fiat Chrysler Automobiles NV | 14,140 | 209,647 | ||||||
Ford Motor Co. | 21,970 | 204,321 | ||||||
General Motors Co. | 7,486 | 273,988 | ||||||
Harley-Davidson, Inc.(c) | 290 | 10,785 | ||||||
Honda Motor Co., Ltd. | 18,521 | 524,173 | ||||||
Isuzu Motors Ltd. | 5,500 | 65,014 | ||||||
Mazda Motor Corp. | 5,200 | 44,311 | ||||||
Mitsubishi Motors Corp. | 11,400 | 47,518 | ||||||
Nissan Motor Co., Ltd. | 26,300 | 152,402 | ||||||
Peugeot SA | 7,475 | 179,977 | ||||||
Porsche Automobil Holding SE (Preference Shares) | 1,458 | 108,181 | ||||||
Renault SA | 1,830 | 86,902 | ||||||
Subaru Corp. | 6,000 | 148,619 | ||||||
Suzuki Motor Corp. | 4,173 | 174,189 | ||||||
Toyota Motor Corp. | 25,884 | 1,823,825 | ||||||
Volkswagen AG | 630 | 122,022 | ||||||
Volkswagen AG (Preference Shares) | 2,067 | 406,865 | ||||||
Yamaha Motor Co., Ltd. | 2,700 | 54,089 | ||||||
|
| |||||||
| 5,770,340 | ||||||||
|
| |||||||
DISTRIBUTORS–0.0% | ||||||||
Genuine Parts Co. | 910 | 96,669 | ||||||
LKQ Corp.(a) | 1,114 | 39,770 | ||||||
|
| |||||||
| 136,439 | ||||||||
|
| |||||||
DIVERSIFIED CONSUMER SERVICES–0.0% | ||||||||
Benesse Holdings, Inc. | 300 | 7,885 | ||||||
H&R Block, Inc.(c) | 460 | 10,801 | ||||||
|
| |||||||
| 18,686 | ||||||||
|
| |||||||
HOTELS, RESTAURANTS & LEISURE–1.0% | ||||||||
Accor SA | 2,705 | 126,969 | ||||||
Aristocrat Leisure Ltd. | 4,876 | 115,216 | ||||||
Carnival Corp. | 1,955 | 99,373 | ||||||
Carnival PLC | 2,273 | 108,953 | ||||||
Chipotle Mexican Grill, Inc.–Class A(a) | 154 | 128,915 | ||||||
Compass Group PLC | 17,973 | 450,435 | ||||||
Crown Resorts Ltd. | 9,430 | 79,506 | ||||||
Darden Restaurants, Inc. | 770 | 83,938 | ||||||
Flutter Entertainment PLC | 1,060 | 128,828 | ||||||
Galaxy Entertainment Group Ltd. | 20,155 | 148,373 | ||||||
Genting Singapore Ltd. | 92,000 | 63,000 | ||||||
GVC Holdings PLC | 5,872 | 68,773 | ||||||
Hilton Worldwide Holdings, Inc. | 1,766 | 195,867 | ||||||
InterContinental Hotels Group PLC | 1,950 | 133,994 | ||||||
Las Vegas Sands Corp. | 1,947 | 134,421 | ||||||
Marriott International, Inc./MD–Class A | 1,571 | 237,897 | ||||||
16
| AB Variable Products Series Fund | ||
Company | Shares | U.S. $ Value | ||||||
McDonald’s Corp. | 4,350 | $ | 859,603 | |||||
McDonald’s Holdings Co. Japan Ltd. | 2,200 | 105,993 | ||||||
Melco Resorts & Entertainment Ltd. (ADR) | 2,438 | 58,926 | ||||||
MGM Resorts International | 2,440 | 81,179 | ||||||
Norwegian Cruise Line Holdings Ltd.(a) | 1,331 | 77,744 | ||||||
Oriental Land Co., Ltd./Japan | 2,100 | 286,527 | ||||||
Royal Caribbean Cruises Ltd. | 1,077 | 143,790 | ||||||
Sands China Ltd. | 39,744 | 212,355 | ||||||
Sodexo SA | 1,005 | 119,100 | ||||||
Starbucks Corp. | 6,891 | 605,857 | ||||||
Tabcorp Holdings Ltd. | 26,623 | 84,637 | ||||||
TUI AG | 4,841 | 61,095 | ||||||
Whitbread PLC | 2,125 | 136,380 | ||||||
Wynn Macau Ltd. | 77,455 | 190,859 | ||||||
Wynn Resorts Ltd. | 610 | 84,711 | ||||||
Yum! Brands, Inc. | 1,715 | 172,752 | ||||||
|
| |||||||
| 5,585,966 | ||||||||
|
| |||||||
HOUSEHOLD DURABLES–0.5% | ||||||||
Auto Trader Group PLC | 9,529 | 75,252 | ||||||
Barratt Developments PLC | 11,885 | 117,678 | ||||||
Berkeley Group Holdings PLC | 1,236 | 79,552 | ||||||
Casio Computer Co., Ltd. | 3,415 | 68,244 | ||||||
DR Horton, Inc. | 1,685 | 88,884 | ||||||
Electrolux AB–Class B | 2,430 | 59,738 | ||||||
Garmin Ltd. | 720 | 70,243 | ||||||
Husqvarna AB–Class B | 8,194 | 65,664 | ||||||
Iida Group Holdings Co., Ltd. | 2,902 | 50,859 | ||||||
Leggett & Platt, Inc. | 775 | 39,393 | ||||||
Lennar Corp.–Class A | 1,750 | 97,633 | ||||||
Mohawk Industries, Inc.(a) | 350 | 47,733 | ||||||
Newell Brands, Inc. | 1,125 | 21,623 | ||||||
Nikon Corp. | 3,200 | 39,135 | ||||||
NVR, Inc.(a) | 20 | 76,168 | ||||||
Panasonic Corp. | 23,500 | 220,411 | ||||||
Persimmon PLC | 3,527 | 125,981 | ||||||
PulteGroup, Inc. | 915 | 35,502 | ||||||
Rinnai Corp. | 700 | 54,704 | ||||||
SEB SA | 568 | 84,477 | ||||||
Sekisui Chemical Co., Ltd. | 4,000 | 69,400 | ||||||
Sekisui House Ltd. | 6,000 | 128,129 | ||||||
Sharp Corp./Japan | 4,999 | 76,397 | ||||||
Sony Corp. | 14,135 | 959,733 | ||||||
Taylor Wimpey PLC | 31,025 | 79,550 | ||||||
Whirlpool Corp.(c) | 400 | 59,012 | ||||||
|
| |||||||
| 2,891,095 | ||||||||
|
| |||||||
INTERNET & DIRECT MARKETING RETAIL–1.1% | ||||||||
Amazon.com, Inc.(a) | 2,370 | 4,379,381 | ||||||
Booking Holdings, Inc.(a) | 257 | 527,809 | ||||||
Delivery Hero SE(a)(b) | 1,586 | 125,705 | ||||||
Company | Shares | U.S. $ Value | ||||||
eBay, Inc. | 4,515 | $ | 163,037 | |||||
Expedia Group, Inc. | 832 | 89,972 | ||||||
Ocado Group PLC(a) | 5,151 | 87,397 | ||||||
Prosus NV(a) | 5,572 | 417,017 | ||||||
Rakuten, Inc. | 8,852 | 75,624 | ||||||
Zalando SE(a)(b) | 2,021 | 101,919 | ||||||
ZOZO, Inc. | 2,592 | 49,572 | ||||||
|
| |||||||
| 6,017,433 | ||||||||
|
| |||||||
LEISURE PRODUCTS–0.1% | ||||||||
Bandai Namco Holdings, Inc. | 1,900 | 115,581 | ||||||
Hasbro, Inc. | 700 | 73,927 | ||||||
Sankyo Co., Ltd. | 300 | 9,964 | ||||||
Shimano, Inc. | 700 | 113,562 | ||||||
Yamaha Corp. | 1,600 | 88,709 | ||||||
|
| |||||||
| 401,743 | ||||||||
|
| |||||||
MULTILINE RETAIL–0.3% | ||||||||
Dollar General Corp. | 1,460 | 227,731 | ||||||
Dollar Tree, Inc.(a) | 1,438 | 135,244 | ||||||
Harvey Norman Holdings Ltd. | 14,257 | 40,720 | ||||||
Isetan Mitsukoshi Holdings Ltd. | 2,200 | 19,755 | ||||||
J Front Retailing Co., Ltd. | 3,500 | 48,816 | ||||||
Kohl’s Corp. | 980 | 49,931 | ||||||
Macy’s, Inc.(c) | 565 | 9,605 | ||||||
Marks & Spencer Group PLC | 15,442 | 43,785 | ||||||
Marui Group Co., Ltd. | 3,300 | 80,462 | ||||||
Next PLC | 1,643 | 153,099 | ||||||
Nordstrom, Inc. | 620 | 25,377 | ||||||
Pan Pacific International Holdings Corp. | 4,000 | 66,365 | ||||||
Ryohin Keikaku Co., Ltd. | 2,570 | 59,897 | ||||||
Target Corp. | 2,915 | 373,732 | ||||||
Wesfarmers Ltd. | 12,002 | 348,799 | ||||||
|
| |||||||
| 1,683,318 | ||||||||
|
| |||||||
SPECIALTY RETAIL–0.9% | ||||||||
ABC-Mart, Inc. | 500 | 34,131 | ||||||
Advance Auto Parts, Inc. | 431 | 69,029 | ||||||
AutoZone, Inc.(a) | 155 | 184,653 | ||||||
Best Buy Co., Inc. | 1,400 | 122,920 | ||||||
CarMax, Inc.(a) | 1,020 | 89,423 | ||||||
Fast Retailing Co., Ltd. | 641 | 380,801 | ||||||
Gap, Inc. (The) | 105 | 1,856 | ||||||
Hennes & Mauritz AB–Class B | 9,038 | 184,353 | ||||||
Hikari Tsushin, Inc. | 500 | 125,649 | ||||||
Home Depot, Inc. (The) | 6,270 | 1,369,243 | ||||||
Industria de Diseno Textil SA | 12,502 | 441,827 | ||||||
JD Sports Fashion PLC | 5,019 | 55,749 | ||||||
Kingfisher PLC | 29,522 | 84,986 | ||||||
L Brands, Inc. | 225 | 4,077 | ||||||
Lowe’s Cos., Inc. | 4,460 | 534,130 | ||||||
Nitori Holdings Co., Ltd. | 750 | 118,388 | ||||||
O’Reilly Automotive, Inc.(a) | 490 | 214,747 | ||||||
17
| DYNAMIC ASSET ALLOCATION PORTFOLIO | ||
| PORTFOLIO OF INVESTMENTS | ||
| (continued) | AB Variable Products Series Fund | |
Company | Shares | U.S. $ Value | ||||||
Ross Stores, Inc. | 2,050 | $ | 238,661 | |||||
Shimamura Co., Ltd. | 200 | 15,205 | ||||||
Tiffany & Co. | 655 | 87,541 | ||||||
TJX Cos., Inc. (The) | 6,890 | 420,703 | ||||||
Tractor Supply Co. | 715 | 66,810 | ||||||
Ulta Salon Cosmetics & Fragrance, Inc.(a) | 352 | 89,105 | ||||||
USS Co., Ltd. | 4,120 | 77,882 | ||||||
Yamada Denki Co., Ltd. | 10,990 | 58,313 | ||||||
|
| |||||||
| 5,070,182 | ||||||||
|
| |||||||
TEXTILES, APPAREL & LUXURY GOODS–0.9% | ||||||||
adidas AG | 2,040 | 663,140 | ||||||
Burberry Group PLC | 4,236 | 123,672 | ||||||
Capri Holdings Ltd.(a) | 149 | 5,684 | ||||||
Cie Financiere Richemont SA | 5,585 | 436,473 | ||||||
EssilorLuxottica SA | 3,192 | 487,998 | ||||||
Hanesbrands, Inc. | 747 | 11,093 | ||||||
Hermes International | 281 | 210,499 | ||||||
Kering SA | 859 | 566,008 | ||||||
LVMH Moet Hennessy Louis Vuitton SE | 3,148 | 1,466,822 | ||||||
Moncler SpA | 2,123 | 95,551 | ||||||
NIKE, Inc.–Class B | 7,150 | 724,366 | ||||||
Pandora A/S | 1,106 | 48,113 | ||||||
Puma SE | 1,420 | 108,888 | ||||||
PVH Corp. | 445 | 46,792 | ||||||
Ralph Lauren Corp. | 290 | 33,994 | ||||||
Swatch Group AG (The) | 294 | 82,086 | ||||||
Swatch Group AG (The) (REG) | 1,834 | 97,018 | ||||||
Tapestry, Inc. | 780 | 21,037 | ||||||
Under Armour, Inc.–Class A(a)(c) | 27 | 583 | ||||||
Under Armour, Inc.–Class C(a)(c) | 1,204 | 23,093 | ||||||
VF Corp. | 1,750 | 174,405 | ||||||
|
| |||||||
| 5,427,315 | ||||||||
|
| |||||||
| 34,707,871 | ||||||||
|
| |||||||
CONSUMER STAPLES–5.3% | ||||||||
BEVERAGES–1.2% | ||||||||
Anheuser-Busch InBev SA/NV | 8,733 | 715,236 | ||||||
Asahi Group Holdings Ltd. | 3,700 | 168,796 | ||||||
Brown-Forman Corp.–Class B(c) | 992 | 67,059 | ||||||
Budweiser Brewing Co. APAC Ltd.(a)(b) | 14,000 | 47,252 | ||||||
Carlsberg A/S–Class B | 1,051 | 156,847 | ||||||
Coca-Cola Amatil Ltd. | 14,439 | 112,128 | ||||||
Coca-Cola Bottlers Japan Holdings, Inc. | 1,300 | 33,215 | ||||||
Coca-Cola Co. (The) | 21,820 | 1,207,737 | ||||||
Coca-Cola European Partners PLC | 2,647 | 134,679 | ||||||
Company | Shares | U.S. $ Value | ||||||
Coca-Cola HBC AG(a) | 1,928 | $ | 65,533 | |||||
Constellation Brands, Inc.–Class A | 1,020 | 193,545 | ||||||
Diageo PLC | 27,623 | 1,163,941 | ||||||
Heineken Holding NV | 1,000 | 97,193 | ||||||
Heineken NV | 2,500 | 266,820 | ||||||
Kirin Holdings Co., Ltd. | 9,345 | 203,969 | ||||||
Molson Coors Brewing Co.–Class B(c) | 1,150 | 61,985 | ||||||
Monster Beverage Corp.(a) | 2,020 | 128,371 | ||||||
PepsiCo, Inc. | 7,975 | 1,089,943 | ||||||
Pernod Ricard SA | 2,406 | 430,524 | ||||||
Remy Cointreau SA | 1,062 | 130,441 | ||||||
Suntory Beverage & Food Ltd. | 1,324 | 55,275 | ||||||
Treasury Wine Estates Ltd. | 6,024 | 68,618 | ||||||
|
| |||||||
| 6,599,107 | ||||||||
|
| |||||||
FOOD & STAPLES RETAILING–0.8% | ||||||||
Aeon Co., Ltd. | 6,200 | 127,946 | ||||||
Carrefour SA | 5,903 | 99,280 | ||||||
Casino Guichard Perrachon SA | 1,228 | 57,440 | ||||||
Coles Group Ltd. | 12,002 | 124,938 | ||||||
Colruyt SA | 417 | 21,741 | ||||||
Costco Wholesale Corp. | 2,515 | 739,209 | ||||||
Dairy Farm International Holdings Ltd. | 7,381 | 42,146 | ||||||
FamilyMart Co., Ltd. | 3,200 | 76,639 | ||||||
ICA Gruppen AB | 2,462 | 115,005 | ||||||
J Sainsbury PLC | 18,022 | 54,954 | ||||||
Jeronimo Martins SGPS SA | 2,405 | 39,633 | ||||||
Koninklijke Ahold Delhaize NV | 9,852 | 247,013 | ||||||
Kroger Co. (The) | 4,120 | 119,439 | ||||||
Lawson, Inc. | 600 | 34,058 | ||||||
METRO AG | 7,593 | 122,180 | ||||||
Seven & i Holdings Co., Ltd. | 8,000 | 293,243 | ||||||
Sundrug Co., Ltd. | 1,000 | 36,182 | ||||||
Sysco Corp. | 2,625 | 224,542 | ||||||
Tesco PLC | 116,321 | 393,122 | ||||||
Tsuruha Holdings, Inc. | 600 | 77,039 | ||||||
Walgreens Boots Alliance, Inc. | 4,375 | 257,950 | ||||||
Walmart, Inc. | 7,963 | 946,323 | ||||||
Welcia Holdings Co., Ltd. | 796 | 50,569 | ||||||
Wm Morrison Supermarkets PLC | 31,098 | 82,302 | ||||||
Woolworths Group Ltd. | 14,003 | 355,164 | ||||||
|
| |||||||
| 4,738,057 | ||||||||
|
| |||||||
FOOD PRODUCTS–1.4% | ||||||||
a2 Milk Co., Ltd.(a) | 8,040 | 81,408 | ||||||
Ajinomoto Co., Inc. | 5,000 | 83,237 | ||||||
Archer-Daniels-Midland Co. | 2,925 | 135,574 | ||||||
Associated British Foods PLC | 3,965 | 136,399 | ||||||
Barry Callebaut AG | 91 | 200,881 | ||||||
18
| AB Variable Products Series Fund | ||
Company | Shares | U.S. $ Value | ||||||
Calbee, Inc. | 1,315 | $ | 42,844 | |||||
Campbell Soup Co. | 1,175 | 58,068 | ||||||
Chocoladefabriken Lindt & Spruengli AG (REG) | 1 | 88,345 | ||||||
Conagra Brands, Inc. | 2,265 | 77,554 | ||||||
Danone SA | 6,291 | 522,442 | ||||||
General Mills, Inc. | 3,305 | 177,016 | ||||||
Hershey Co. (The) | 850 | 124,933 | ||||||
Hormel Foods Corp. | 1,650 | 74,431 | ||||||
JM Smucker Co. (The) | 695 | 72,370 | ||||||
Kellogg Co. | 1,515 | 104,777 | ||||||
Kerry Group PLC–Class A | 1,906 | 237,527 | ||||||
Kikkoman Corp. | 1,619 | 79,258 | ||||||
Kraft Heinz Co. (The) | 3,028 | 97,290 | ||||||
Lamb Weston Holdings, Inc. | 890 | 76,567 | ||||||
McCormick & Co., Inc./MD | 775 | 131,541 | ||||||
MEIJI Holdings Co., Ltd. | 1,100 | 74,338 | ||||||
Mondelez International, Inc.–Class A | 8,195 | 451,381 | ||||||
Mowi ASA | 4,327 | 112,506 | ||||||
Nestle SA | 34,710 | 3,757,885 | ||||||
NH Foods Ltd. | 933 | 38,648 | ||||||
Nisshin Seifun Group, Inc. | 4,000 | 69,790 | ||||||
Nissin Foods Holdings Co., Ltd. | 1,200 | 89,127 | ||||||
Orkla ASA | 10,095 | 102,371 | ||||||
Toyo Suisan Kaisha Ltd. | 1,000 | 42,466 | ||||||
Tyson Foods, Inc.–Class A | 1,825 | 166,148 | ||||||
WH Group Ltd.(b) | 157,321 | 162,666 | ||||||
Wilmar International Ltd. | 26,000 | 79,656 | ||||||
Yakult Honsha Co., Ltd. | 1,333 | 73,465 | ||||||
Yamazaki Baking Co., Ltd. | 59 | 1,054 | ||||||
|
| |||||||
| 7,823,963 | ||||||||
|
| |||||||
HOUSEHOLD PRODUCTS–0.7% | ||||||||
Church & Dwight Co., Inc. | 1,526 | 107,339 | ||||||
Clorox Co. (The) | 770 | 118,226 | ||||||
Colgate-Palmolive Co. | 4,880 | 335,939 | ||||||
Essity AB–Class B | 4,979 | 160,355 | ||||||
Henkel AG & Co. KGaA | 989 | 92,959 | ||||||
Henkel AG & Co. KGaA (Preference Shares) | 1,696 | 175,198 | ||||||
Kimberly-Clark Corp. | 1,955 | 268,910 | ||||||
Lion Corp. | 2,000 | 38,877 | ||||||
Pigeon Corp. | 1,287 | 47,125 | ||||||
Procter & Gamble Co. (The) | 14,270 | 1,782,323 | ||||||
Reckitt Benckiser Group PLC | 8,017 | 651,209 | ||||||
Unicharm Corp. | 3,800 | 128,315 | ||||||
|
| |||||||
| 3,906,775 | ||||||||
|
| |||||||
PERSONAL PRODUCTS–0.7% | ||||||||
Beiersdorf AG | 1,051 | 125,730 | ||||||
Coty, Inc.–Class A | 1,862 | 20,948 | ||||||
Estee Lauder Cos., Inc. (The)–Class A | 1,340 | 276,764 | ||||||
Kao Corp. | 5,400 | 445,365 | ||||||
Company | Shares | U.S. $ Value | ||||||
Kobayashi Pharmaceutical Co., Ltd. | 809 | $ | 68,523 | |||||
Kose Corp. | 500 | 72,882 | ||||||
L’Oreal SA | 2,700 | 798,410 | ||||||
Pola Orbis Holdings, Inc. | 1,800 | 42,874 | ||||||
Shiseido Co., Ltd. | 4,533 | 321,888 | ||||||
Unilever NV | 15,507 | 889,957 | ||||||
Unilever PLC | 12,594 | 720,914 | ||||||
|
| |||||||
| 3,784,255 | ||||||||
|
| |||||||
TOBACCO–0.5% | ||||||||
Altria Group, Inc. | 10,640 | 531,042 | ||||||
British American Tobacco PLC | 26,574 | 1,129,450 | ||||||
Imperial Brands PLC | 10,218 | 252,796 | ||||||
Japan Tobacco, Inc. | 13,598 | 303,189 | ||||||
Philip Morris International, Inc. | 8,850 | 753,047 | ||||||
Swedish Match AB | 2,884 | 148,574 | ||||||
|
| |||||||
| 3,118,098 | ||||||||
|
| |||||||
| 29,970,255 | ||||||||
|
| |||||||
COMMUNICATION SERVICES–4.3% | ||||||||
DIVERSIFIED TELECOMMUNICATION SERVICES–1.5% | ||||||||
AT&T, Inc. | 41,477 | 1,620,921 | ||||||
BT Group PLC | 101,334 | 258,218 | ||||||
Cellnex Telecom SA(b) | 2,840 | 122,505 | ||||||
CenturyLink, Inc. | 4,112 | 54,320 | ||||||
Charter Communications, Inc.–Class A(a) | 993 | 481,684 | ||||||
Comcast Corp.–Class A | 25,752 | 1,158,068 | ||||||
Deutsche Telekom AG | 37,770 | 617,244 | ||||||
Elisa Oyj | 1,354 | 74,800 | ||||||
Eurazeo SE | 1,509 | 103,579 | ||||||
Eutelsat Communications SA | 3,140 | 51,036 | ||||||
HKT Trust & HKT Ltd.–Class SS | 55,098 | 77,649 | ||||||
Iliad SA | 714 | 92,871 | ||||||
Koninklijke KPN NV | 28,755 | 85,097 | ||||||
Nippon Telegraph & Telephone Corp. | 14,800 | 374,051 | ||||||
Orange SA | 18,911 | 277,920 | ||||||
Proximus SADP | 1,568 | 44,929 | ||||||
Singapore Telecommunications Ltd. | 76,000 | 189,193 | ||||||
Spark New Zealand Ltd. | 17,417 | 50,788 | ||||||
Swisscom AG | 247 | 130,756 | ||||||
Telecom Italia SpA/Milano(a) | 150,129 | 93,757 | ||||||
Telefonica Deutschland Holding AG | 17,113 | 49,602 | ||||||
Telefonica SA | 52,707 | 368,585 | ||||||
Telenet Group Holding NV | 715 | 32,141 | ||||||
Telenor ASA | 7,146 | 128,097 | ||||||
19
| DYNAMIC ASSET ALLOCATION PORTFOLIO | ||
| PORTFOLIO OF INVESTMENTS | ||
| (continued) | AB Variable Products Series Fund | |
Company | Shares | U.S. $ Value | ||||||
Telia Co. AB | 24,258 | $ | 104,225 | |||||
Telstra Corp., Ltd. | 40,732 | 101,178 | ||||||
TPG Telecom Ltd. | 8,880 | 41,840 | ||||||
United Internet AG | 2,321 | 76,011 | ||||||
Verizon Communications, Inc. | 23,505 | 1,443,207 | ||||||
Washington H Soul Pattinson & Co., Ltd. | 3,258 | 49,150 | ||||||
|
| |||||||
| 8,353,422 | ||||||||
|
| |||||||
ENTERTAINMENT–0.7% | ||||||||
Activision Blizzard, Inc. | 4,265 | 253,426 | ||||||
Electronic Arts, Inc.(a) | 1,615 | 173,629 | ||||||
Konami Holdings Corp. | 1,300 | 53,420 | ||||||
Live Nation Entertainment, Inc.(a) | 816 | 58,319 | ||||||
Netflix, Inc.(a) | 2,492 | 806,336 | ||||||
Nexon Co., Ltd.(a) | 5,190 | 68,847 | ||||||
Nintendo Co., Ltd. | 1,284 | 513,549 | ||||||
Square Enix Holdings Co., Ltd. | 633 | 31,519 | ||||||
Take-Two Interactive Software, Inc.(a) | 685 | 83,865 | ||||||
Toho Co., Ltd./Tokyo | 1,000 | 41,672 | ||||||
Ubisoft Entertainment SA(a) | 804 | 55,704 | ||||||
Vivendi SA | 11,072 | 320,618 | ||||||
Walt Disney Co. (The) | 10,359 | 1,498,222 | ||||||
|
| |||||||
| 3,959,126 | ||||||||
|
| |||||||
INTERACTIVE MEDIA & SERVICES–1.4% | ||||||||
Alphabet, Inc.–Class A(a) | 1,709 | 2,289,018 | ||||||
Alphabet, Inc.–Class C(a) | 1,744 | 2,331,763 | ||||||
Facebook, Inc.–Class A(a) | 13,667 | 2,805,152 | ||||||
Kakaku.com, Inc. | 3,799 | 97,000 | ||||||
LINE Corp.(a) | 933 | 45,840 | ||||||
REA Group Ltd. | 1,002 | 72,792 | ||||||
Twitter, Inc.(a) | 3,986 | 127,751 | ||||||
Z Holdings Corp. | 32,653 | 137,865 | ||||||
|
| |||||||
| 7,907,181 | ||||||||
|
| |||||||
MEDIA–0.2% | ||||||||
CyberAgent, Inc. | 1,112 | 38,737 | ||||||
Dentsu, Inc. | 2,100 | 72,357 | ||||||
Discovery, Inc.–Class A(a)(c) | 185 | 6,057 | ||||||
Discovery, Inc.–Class C(a) | 1,404 | 42,808 | ||||||
DISH Network Corp.–Class A(a) | 806 | 28,589 | ||||||
Fox Corp.–Class A | 1,550 | 57,458 | ||||||
Fox Corp.–Class B(a) | 332 | 12,085 | ||||||
Hakuhodo DY Holdings, Inc. | 2,490 | 40,067 | ||||||
Informa PLC | 13,755 | 156,444 | ||||||
Interpublic Group of Cos., Inc. (The) | 1,375 | 31,762 | ||||||
ITV PLC | 44,429 | 88,892 | ||||||
JCDecaux SA | 1,905 | 58,861 | ||||||
News Corp.–Class A | 878 | 12,415 | ||||||
News Corp.–Class B(c) | 767 | 11,129 | ||||||
Company | Shares | U.S. $ Value | ||||||
Omnicom Group, Inc.(c) | 1,360 | $ | 110,187 | |||||
Pearson PLC | 7,821 | 66,073 | ||||||
Publicis Groupe SA | 1,801 | 81,660 | ||||||
Schibsted ASA–Class B | 2,252 | 64,356 | ||||||
SES SA | 4,651 | 65,213 | ||||||
Singapore Press Holdings Ltd. | 29,528 | 47,832 | ||||||
ViacomCBS, Inc.–Class B | 2,438 | 102,323 | ||||||
WPP PLC | 13,761 | 193,648 | ||||||
|
| |||||||
| 1,388,953 | ||||||||
|
| |||||||
WIRELESS TELECOMMUNICATION SERVICES–0.5% | ||||||||
KDDI Corp. | 19,550 | 583,301 | ||||||
NTT DOCOMO, Inc. | 14,767 | 411,351 | ||||||
Softbank Corp. | 19,000 | 254,784 | ||||||
SoftBank Group Corp. | 18,384 | 798,178 | ||||||
T-Mobile US, Inc.(a) | 1,935 | 151,743 | ||||||
Tele2 AB–Class B | 9,542 | 138,493 | ||||||
Vodafone Group PLC | 306,793 | 595,600 | ||||||
|
| |||||||
| 2,933,450 | ||||||||
|
| |||||||
| 24,542,132 | ||||||||
|
| |||||||
MATERIALS–2.9% | ||||||||
CHEMICALS–1.6% | ||||||||
Air Liquide SA | 5,012 | 710,555 | ||||||
Air Products & Chemicals, Inc. | 1,250 | 293,738 | ||||||
Akzo Nobel NV | 3,226 | 329,452 | ||||||
Albemarle Corp. | 611 | 44,627 | ||||||
Arkema SA | 1,159 | 123,929 | ||||||
Asahi Kasei Corp. | 12,000 | 134,741 | ||||||
BASF SE | 10,527 | 793,069 | ||||||
Celanese Corp.–Class A | 758 | 93,325 | ||||||
CF Industries Holdings, Inc. | 1,350 | 64,449 | ||||||
Chr Hansen Holding A/S | 1,460 | 116,022 | ||||||
Clariant AG(a) | 4,702 | 105,082 | ||||||
Corteva, Inc.(a) | 3,906 | 115,461 | ||||||
Covestro AG(b) | 1,766 | 82,172 | ||||||
Croda International PLC | 1,648 | 111,946 | ||||||
Daicel Corp. | 3,000 | 28,681 | ||||||
Dow, Inc.(a) | 4,106 | 224,721 | ||||||
DuPont de Nemours, Inc. | 4,266 | 273,877 | ||||||
Eastman Chemical Co. | 830 | 65,786 | ||||||
Ecolab, Inc. | 1,450 | 279,836 | ||||||
EMS-Chemie Holding AG | 203 | 133,459 | ||||||
Evonik Industries AG | 2,574 | 78,616 | ||||||
FMC Corp. | 780 | 77,860 | ||||||
FUCHS PETROLUB SE (Preference Shares) | 2,420 | 120,234 | ||||||
Givaudan SA | 88 | 275,704 | ||||||
Hitachi Chemical Co., Ltd. | 3,000 | 125,687 | ||||||
Incitec Pivot Ltd. | 32,013 | 71,520 | ||||||
International Flavors & Fragrances, Inc.(c) | 601 | 77,502 | ||||||
Israel Chemicals Ltd. | 9,886 | 46,687 | ||||||
Johnson Matthey PLC | 1,842 | 73,240 | ||||||
20
| AB Variable Products Series Fund | ||
Company | Shares | U.S. $ Value | ||||||
JSR Corp. | 800 | $ | 14,634 | |||||
Kansai Paint Co., Ltd. | 3,000 | 73,287 | ||||||
Koninklijke DSM NV | 2,026 | 264,891 | ||||||
Kuraray Co., Ltd. | 3,000 | 36,354 | ||||||
LANXESS AG | 1,767 | 118,642 | ||||||
Linde PLC | 3,090 | 657,861 | ||||||
LyondellBasell Industries NV–Class A | 1,699 | 160,522 | ||||||
Mitsubishi Chemical Holdings Corp. | 13,000 | 96,865 | ||||||
Mitsubishi Gas Chemical Co., Inc. | 2,500 | 38,085 | ||||||
Mitsui Chemicals, Inc. | 1,600 | 38,975 | ||||||
Mosaic Co. (The) | 1,060 | 22,938 | ||||||
Nippon Paint Holdings Co., Ltd. | 2,000 | 102,963 | ||||||
Nissan Chemical Corp. | 1,000 | 41,878 | ||||||
Nitto Denko Corp. | 1,600 | 89,965 | ||||||
Novozymes A/S–Class B | 2,458 | 120,283 | ||||||
Orica Ltd. | 7,662 | 118,152 | ||||||
PPG Industries, Inc. | 1,450 | 193,561 | ||||||
Sherwin-Williams Co. (The) | 475 | 277,182 | ||||||
Shin-Etsu Chemical Co., Ltd. | 4,100 | 450,890 | ||||||
Showa Denko KK | 1,500 | 39,533 | ||||||
Sika AG | 1,200 | 225,354 | ||||||
Solvay SA | 927 | 107,896 | ||||||
Sumitomo Chemical Co., Ltd. | 15,000 | 68,109 | ||||||
Symrise AG | 1,178 | 123,818 | ||||||
Taiyo Nippon Sanso Corp. | 3,206 | 70,961 | ||||||
Teijin Ltd. | 3,000 | 56,046 | ||||||
Toray Industries, Inc. | 14,000 | 94,857 | ||||||
Tosoh Corp. | 3,149 | 48,513 | ||||||
Umicore SA | 2,002 | 97,565 | ||||||
Yara International ASA | 1,297 | 54,038 | ||||||
|
| |||||||
| 8,976,596 | ||||||||
|
| |||||||
CONSTRUCTION MATERIALS–0.2% | ||||||||
Boral Ltd. | 17,642 | 55,503 | ||||||
CRH PLC(a) | 8,841 | 354,603 | ||||||
Fletcher Building Ltd. | 8,637 | 29,605 | ||||||
HeidelbergCement AG | 1,342 | 97,516 | ||||||
James Hardie Industries PLC | 3,449 | 67,409 | ||||||
LafargeHolcim Ltd.(a) | 5,336 | 296,028 | ||||||
Martin Marietta Materials, Inc. | 377 | 105,424 | ||||||
Taiheiyo Cement Corp. | 1,304 | 38,276 | ||||||
Vulcan Materials Co. | 815 | 117,352 | ||||||
|
| |||||||
| 1,161,716 | ||||||||
|
| |||||||
CONTAINERS & PACKAGING–0.1% | ||||||||
AMCOR PLC(a) | 7,943 | 86,102 | ||||||
Avery Dennison Corp. | 535 | 69,989 | ||||||
Ball Corp. | 1,810 | 117,053 | ||||||
International Paper Co. | 1,875 | 86,344 | ||||||
Packaging Corp. of America | 575 | 64,394 | ||||||
Sealed Air Corp. | 940 | 37,440 | ||||||
Company | Shares | U.S. $ Value | ||||||
Smurfit Kappa Group PLC | 2,476 | $ | 95,467 | |||||
Toyo Seikan Group Holdings Ltd. | 1,700 | 29,264 | ||||||
Westrock Co. | 927 | 39,778 | ||||||
|
| |||||||
| 625,831 | ||||||||
|
| |||||||
METALS & MINING–0.9% | ||||||||
Alumina Ltd. | 28,452 | 45,956 | ||||||
Anglo American PLC | 11,577 | 332,583 | ||||||
Antofagasta PLC | 6,389 | 77,356 | ||||||
ArcelorMittal SA | 12,535 | 220,863 | ||||||
BHP Group Ltd. | 32,976 | 902,959 | ||||||
BHP Group PLC | 23,519 | 551,142 | ||||||
BlueScope Steel Ltd. | 6,941 | 73,516 | ||||||
Boliden AB | 4,189 | 111,254 | ||||||
Evraz PLC | 5,725 | 30,656 | ||||||
Fortescue Metals Group Ltd. | 18,067 | 136,195 | ||||||
Freeport-McMoRan, Inc. | 6,695 | 87,838 | ||||||
Glencore PLC(a) | 130,406 | 406,047 | ||||||
Hitachi Metals Ltd. | 5,000 | 73,599 | ||||||
JFE Holdings, Inc. | 5,000 | 64,157 | ||||||
Mitsubishi Materials Corp. | 2,700 | 73,277 | ||||||
Newcrest Mining Ltd. | 7,017 | 148,192 | ||||||
Newmont Goldcorp Corp. | 4,531 | 196,872 | ||||||
Nippon Steel Corp. | 8,643 | 130,275 | ||||||
Norsk Hydro ASA | 16,444 | 61,149 | ||||||
Nucor Corp. | 1,860 | 104,681 | ||||||
Rio Tinto Ltd. | 4,038 | 285,689 | ||||||
Rio Tinto PLC | 13,185 | 780,486 | ||||||
South32 Ltd. | 56,741 | 107,134 | ||||||
Sumitomo Metal Mining Co., Ltd. | 2,500 | 80,500 | ||||||
thyssenkrupp AG | 3,919 | 52,660 | ||||||
voestalpine AG | 1,082 | 30,010 | ||||||
|
| |||||||
| 5,165,046 | ||||||||
|
| |||||||
PAPER & FOREST PRODUCTS–0.1% | ||||||||
Mondi PLC | 5,565 | 130,495 | ||||||
Oji Holdings Corp. | 14,000 | 75,712 | ||||||
Stora Enso Oyj–Class R | 6,056 | 88,119 | ||||||
UPM-Kymmene Oyj | 5,689 | 197,377 | ||||||
|
| |||||||
| 491,703 | ||||||||
|
| |||||||
| 16,420,892 | ||||||||
|
| |||||||
ENERGY–2.6% | ||||||||
ENERGY EQUIPMENT & SERVICES–0.1% | ||||||||
Baker Hughes Co.–Class A | 2,200 | 56,386 | ||||||
Halliburton Co. | 4,250 | 103,997 | ||||||
Helmerich & Payne, Inc. | 685 | 31,120 | ||||||
National Oilwell Varco, Inc. | 1,275 | 31,939 | ||||||
Schlumberger Ltd. | 7,870 | 316,374 | ||||||
TechnipFMC PLC | 1,688 | 36,191 | ||||||
Tenaris SA | 10,900 | 123,496 | ||||||
Worley Ltd. | 4,472 | 48,309 | ||||||
|
| |||||||
| 747,812 | ||||||||
|
| |||||||
21
| DYNAMIC ASSET ALLOCATION PORTFOLIO | ||
| PORTFOLIO OF INVESTMENTS | ||
| (continued) | AB Variable Products Series Fund | |
Company | Shares | U.S. $ Value | ||||||
OIL, GAS & CONSUMABLE FUELS–2.5% | ||||||||
Aker BP ASA | 1,570 | $ | 51,528 | |||||
Apache Corp. | 1,315 | 33,651 | ||||||
BP PLC | 233,480 | 1,468,777 | ||||||
Cabot Oil & Gas Corp. | 1,390 | 24,200 | ||||||
Caltex Australia Ltd. | 3,100 | 73,917 | ||||||
Chevron Corp. | 10,830 | 1,305,123 | ||||||
Cimarex Energy Co. | 627 | 32,911 | ||||||
Concho Resources, Inc. | 1,207 | 105,697 | ||||||
ConocoPhillips | 6,430 | 418,143 | ||||||
Devon Energy Corp. | 1,630 | 42,331 | ||||||
Diamondback Energy, Inc. | 928 | 86,174 | ||||||
Eni SpA | 24,216 | 376,104 | ||||||
EOG Resources, Inc. | 3,280 | 274,733 | ||||||
Equinor ASA | 12,989 | 259,030 | ||||||
Exxon Mobil Corp. | 24,050 | 1,678,209 | ||||||
Galp Energia SGPS SA | 5,341 | 89,665 | ||||||
Hess Corp. | 1,540 | 102,887 | ||||||
HollyFrontier Corp. | 950 | 48,175 | ||||||
Idemitsu Kosan Co., Ltd. | 2,956 | 81,679 | ||||||
Inpex Corp. | 11,643 | 120,618 | ||||||
JXTG Holdings, Inc. | 32,750 | 148,638 | ||||||
Kinder Morgan, Inc./DE | 10,999 | 232,849 | ||||||
Koninklijke Vopak NV | 502 | 27,279 | ||||||
Lundin Petroleum AB | 3,430 | 116,464 | ||||||
Marathon Oil Corp. | 3,335 | 45,289 | ||||||
Marathon Petroleum Corp. | 3,651 | 219,973 | ||||||
Neste Oyj | 4,795 | 166,843 | ||||||
Noble Energy, Inc. | 2,010 | 49,928 | ||||||
Occidental Petroleum Corp. | 5,086 | 209,594 | ||||||
Oil Search Ltd. | 18,278 | 93,200 | ||||||
OMV AG | 1,688 | 94,570 | ||||||
ONEOK, Inc. | 2,218 | 167,836 | ||||||
Origin Energy Ltd. | 16,658 | 98,769 | ||||||
Phillips 66 | 2,340 | 260,699 | ||||||
Pioneer Natural Resources Co. | 1,015 | 153,641 | ||||||
Repsol SA | 16,453 | 258,479 | ||||||
Royal Dutch Shell PLC–Class A | 49,037 | 1,452,193 | ||||||
Royal Dutch Shell PLC–Class B | 42,444 | 1,259,893 | ||||||
Santos Ltd. | 18,468 | 106,246 | ||||||
TOTAL SA | 27,758 | 1,540,306 | ||||||
Valero Energy Corp. | 2,295 | 214,927 | ||||||
Williams Cos., Inc. (The) | 6,628 | 157,216 | ||||||
Woodside Petroleum Ltd. | 10,061 | 243,261 | ||||||
|
| |||||||
| 13,991,645 | ||||||||
|
| |||||||
| 14,739,457 | ||||||||
|
| |||||||
UTILITIES–2.0% | ||||||||
ELECTRIC UTILITIES–1.2% | ||||||||
Alliant Energy Corp. | 1,438 | 78,687 | ||||||
American Electric Power Co., Inc. | 2,785 | 263,210 | ||||||
AusNet Services | 37,398 | 44,597 | ||||||
Company | Shares | U.S. $ Value | ||||||
Chubu Electric Power Co., Inc. | 6,100 | $ | 86,229 | |||||
Chugoku Electric Power Co., Inc. (The) | 4,000 | 52,580 | ||||||
CK Infrastructure Holdings Ltd. | 15,000 | 106,750 | ||||||
CLP Holdings Ltd. | 12,500 | 131,218 | ||||||
Duke Energy Corp. | 4,142 | 377,792 | ||||||
Edison International | 1,885 | 142,148 | ||||||
EDP–Energias de Portugal SA | 29,006 | 125,868 | ||||||
Electricite de France SA | 11,071 | 123,533 | ||||||
Endesa SA | 3,024 | 80,755 | ||||||
Enel SpA | 88,110 | 699,930 | ||||||
Entergy Corp. | 1,175 | 140,765 | ||||||
Evergy, Inc. | 1,485 | 96,659 | ||||||
Eversource Energy(c) | 1,960 | 166,737 | ||||||
Exelon Corp. | 5,517 | 251,520 | ||||||
FirstEnergy Corp. | 2,625 | 127,575 | ||||||
Fortum Oyj | 4,947 | 122,109 | ||||||
HK Electric Investments & HK Electric Investments Ltd.–Class SS(b) | 104,180 | 102,679 | ||||||
Iberdrola SA | 70,792 | 729,552 | ||||||
Kansai Electric Power Co., Inc. (The) | 8,491 | 98,367 | ||||||
Kyushu Electric Power Co., Inc. | 4,100 | 35,571 | ||||||
Mercury NZ Ltd. | 10,827 | 36,830 | ||||||
NextEra Energy, Inc. | 2,735 | 662,308 | ||||||
Orsted A/S(b) | 2,499 | 258,458 | ||||||
Pinnacle West Capital Corp. | 685 | 61,602 | ||||||
Power Assets Holdings Ltd. | 8,500 | 62,183 | ||||||
PPL Corp. | 3,765 | 135,088 | ||||||
Red Electrica Corp. SA | 5,707 | 114,995 | ||||||
Southern Co. (The) | 5,910 | 376,467 | ||||||
SSE PLC | 13,094 | 249,732 | ||||||
Terna Rete Elettrica Nazionale SpA | 23,069 | 154,283 | ||||||
Tohoku Electric Power Co., Inc. | 4,300 | 42,628 | ||||||
Tokyo Electric Power Co. Holdings, Inc.(a) | 13,800 | 59,072 | ||||||
Verbund AG | 759 | 38,090 | ||||||
Xcel Energy, Inc. | 2,830 | 179,677 | ||||||
|
| |||||||
| 6,616,244 | ||||||||
|
| |||||||
GAS UTILITIES–0.1% | ||||||||
APA Group | 13,346 | 103,891 | ||||||
Atmos Energy Corp. | 692 | 77,407 | ||||||
Enagas SA | 2,159 | 55,071 | ||||||
Hong Kong & China Gas Co., Ltd. | 96,005 | 187,581 | ||||||
Naturgy Energy Group SA | 4,316 | 108,681 | ||||||
Osaka Gas Co., Ltd. | 3,600 | 68,843 | ||||||
Snam SpA | 26,833 | 141,083 | ||||||
Toho Gas Co., Ltd. | 2,017 | 82,359 | ||||||
Tokyo Gas Co., Ltd. | 3,800 | 92,336 | ||||||
|
| |||||||
| 917,252 | ||||||||
|
| |||||||
22
| AB Variable Products Series Fund | ||
Company | Shares | U.S. $ Value | ||||||
INDEPENDENT POWER AND RENEWABLE ELECTRICITY PRODUCERS–0.1% | ||||||||
AES Corp./VA | 2,725 | $ | 54,227 | |||||
Electric Power Development Co., Ltd. | 1,600 | 38,836 | ||||||
Meridian Energy Ltd. | 18,542 | 62,459 | ||||||
NRG Energy, Inc. | 1,060 | 42,135 | ||||||
Uniper SE | 3,660 | 120,969 | ||||||
|
| |||||||
| 318,626 | ||||||||
|
| |||||||
MULTI-UTILITIES–0.6% | ||||||||
AGL Energy Ltd. | 6,423 | 92,450 | ||||||
Ameren Corp. | 1,510 | 115,968 | ||||||
CenterPoint Energy, Inc. | 2,355 | 64,221 | ||||||
Centrica PLC | 64,140 | 75,869 | ||||||
CMS Energy Corp. | 1,720 | 108,085 | ||||||
Consolidated Edison, Inc. | 1,790 | 161,941 | ||||||
Dominion Energy, Inc. | 4,570 | 378,488 | ||||||
DTE Energy Co. | 1,120 | 145,454 | ||||||
E.ON SE | 23,845 | 254,829 | ||||||
Engie SA | 18,347 | 297,191 | ||||||
National Grid PLC | 38,933 | 486,552 | ||||||
NiSource, Inc. | 1,605 | 44,683 | ||||||
Public Service Enterprise Group, Inc. | 2,745 | 162,092 | ||||||
RWE AG | 5,973 | 183,025 | ||||||
Sempra Energy | 1,550 | 234,794 | ||||||
Suez | 5,769 | 87,419 | ||||||
United Utilities Group PLC | 8,008 | 100,211 | ||||||
Veolia Environnement SA | 5,882 | 156,510 | ||||||
WEC Energy Group, Inc. | 1,718 | 158,451 | ||||||
|
| |||||||
| 3,308,233 | ||||||||
|
| |||||||
WATER UTILITIES–0.0% | ||||||||
American Water Works Co., Inc. | 1,121 | 137,715 | ||||||
Severn Trent PLC | 2,239 | 74,589 | ||||||
|
| |||||||
| 212,304 | ||||||||
|
| |||||||
| 11,372,659 | ||||||||
|
| |||||||
REAL ESTATE–1.8% | ||||||||
EQUITY REAL ESTATE INVESTMENT TRUSTS (REITS)–1.2% | ||||||||
Alexandria Real Estate Equities, Inc. | 682 | 110,198 | ||||||
American Tower Corp. | 2,525 | 580,295 | ||||||
Apartment Investment & Management Co.–Class A | 874 | 45,142 | ||||||
Ascendas Real Estate Investment Trust(d) | 67,621 | 149,399 | ||||||
AvalonBay Communities, Inc. | 795 | 166,711 | ||||||
Boston Properties, Inc. | 950 | 130,967 | ||||||
British Land Co. PLC (The) | 9,308 | 78,760 | ||||||
Crown Castle International Corp. | 2,370 | 336,895 | ||||||
Company | Shares | U.S. $ Value | ||||||
Daiwa House REIT Investment Corp. | 13 | $ | 33,993 | |||||
Dexus | 13,420 | 110,470 | ||||||
Digital Realty Trust, Inc.(c) | 1,280 | 153,267 | ||||||
Duke Realty Corp. | 1,578 | 54,709 | ||||||
Equinix, Inc. | 480 | 280,176 | ||||||
Equity Residential | 2,030 | 164,268 | ||||||
Essex Property Trust, Inc. | 428 | 128,768 | ||||||
Extra Space Storage, Inc. | 783 | 82,700 | ||||||
Federal Realty Investment Trust | 472 | 60,761 | ||||||
Gecina SA | 408 | 73,042 | ||||||
Goodman Group | 16,928 | 159,076 | ||||||
GPT Group (The) | 17,105 | 67,377 | ||||||
Healthpeak Properties, Inc. | 2,330 | 80,315 | ||||||
Host Hotels & Resorts, Inc. | 3,270 | 60,658 | ||||||
ICADE | 1,592 | 173,348 | ||||||
Iron Mountain, Inc.(c) | 1,098 | 34,993 | ||||||
Japan Prime Realty Investment Corp. | 15 | 65,953 | ||||||
Japan Real Estate Investment Corp. | 12 | 79,638 | ||||||
Japan Retail Fund Investment Corp. | 24 | 51,646 | ||||||
Kimco Realty Corp. | 1,460 | 30,237 | ||||||
Klepierre SA | 2,231 | 84,876 | ||||||
Land Securities Group PLC | 9,736 | 127,800 | ||||||
Link REIT | 21,500 | 227,770 | ||||||
Mid-America Apartment Communities, Inc. | 696 | 91,775 | ||||||
Mirvac Group | 40,488 | 90,624 | ||||||
Nippon Building Fund, Inc. | 13 | 95,293 | ||||||
Nippon Prologis REIT, Inc. | 14 | 35,657 | ||||||
Nomura Real Estate Master Fund, Inc. | 34 | 58,158 | ||||||
Orix JREIT, Inc. | 30 | 65,026 | ||||||
Prologis, Inc. | 3,590 | 320,013 | ||||||
Public Storage | 850 | 181,016 | ||||||
Realty Income Corp. | 1,908 | 140,486 | ||||||
Regency Centers Corp. | 1,033 | 65,172 | ||||||
SBA Communications Corp. | 640 | 154,234 | ||||||
Scentre Group | 50,683 | 136,401 | ||||||
Segro PLC | 11,022 | 131,244 | ||||||
Simon Property Group, Inc. | 1,756 | 261,574 | ||||||
SL Green Realty Corp. | 476 | 43,735 | ||||||
Stockland | 23,010 | 74,657 | ||||||
UDR, Inc. | 1,728 | 80,698 | ||||||
United Urban Investment Corp. | 26 | 48,830 | ||||||
Ventas, Inc. | 2,011 | 116,115 | ||||||
Vicinity Centres | 39,646 | 69,343 | ||||||
Vornado Realty Trust | 1,035 | 68,827 | ||||||
Welltower, Inc. | 2,235 | 182,778 | ||||||
Weyerhaeuser Co. | 3,798 | 114,700 | ||||||
|
| |||||||
| 6,610,564 | ||||||||
|
| |||||||
23
| DYNAMIC ASSET ALLOCATION PORTFOLIO | ||
| PORTFOLIO OF INVESTMENTS | ||
| (continued) | AB Variable Products Series Fund | |
Company | Shares | U.S. $ Value | ||||||
REAL ESTATE MANAGEMENT & DEVELOPMENT–0.6% | ||||||||
Aeon Mall Co., Ltd. | 3,541 | $ | 62,809 | |||||
Aroundtown SA | 11,635 | 104,503 | ||||||
Azrieli Group Ltd. | 387 | 28,349 | ||||||
CapitaLand Ltd. | 35,000 | 97,668 | ||||||
CBRE Group, Inc.–Class A(a) | 1,915 | 117,370 | ||||||
City Developments Ltd. | 11,000 | 89,527 | ||||||
CK Asset Holdings Ltd. | 25,719 | 185,594 | ||||||
Daito Trust Construction Co., Ltd. | 700 | 86,503 | ||||||
Daiwa House Industry Co., Ltd. | 6,000 | 185,741 | ||||||
Deutsche Wohnen SE | 3,212 | 130,654 | ||||||
Henderson Land Development Co., Ltd. | 30,420 | 149,273 | ||||||
Hongkong Land Holdings Ltd. | 14,000 | 80,529 | ||||||
Hulic Co., Ltd. | 6,591 | 79,357 | ||||||
Kerry Properties Ltd. | 8,500 | 26,997 | ||||||
Lendlease Group | 10,380 | 128,333 | ||||||
Mitsubishi Estate Co., Ltd. | 13,000 | 248,753 | ||||||
Mitsui Fudosan Co., Ltd. | 10,000 | 244,399 | ||||||
New World Development Co., Ltd. | 82,122 | 112,568 | ||||||
Nomura Real Estate Holdings, Inc. | 3,600 | 86,347 | ||||||
Sino Land Co., Ltd. | 63,328 | 91,921 | ||||||
Sumitomo Realty & Development Co., Ltd. | 3,843 | 134,080 | ||||||
Sun Hung Kai Properties Ltd. | 15,000 | 229,723 | ||||||
Swire Properties Ltd. | 25,389 | 84,110 | ||||||
Swiss Prime Site AG(a) | 976 | 112,918 | ||||||
Tokyu Fudosan Holdings Corp. | 7,989 | 55,167 | ||||||
Unibail-Rodamco-Westfield | 1,707 | 269,308 | ||||||
Vonovia SE | 5,710 | 306,680 | ||||||
Wharf Real Estate Investment Co., Ltd. | 13,000 | 79,320 | ||||||
Wheelock & Co., Ltd. | 17,000 | 113,327 | ||||||
|
| |||||||
| 3,721,828 | ||||||||
|
| |||||||
| 10,332,392 | ||||||||
|
| |||||||
Total Common Stocks | 323,354,044 | |||||||
|
| |||||||
| Principal Amount (000) | ||||||||
GOVERNMENTS– | ||||||||
UNITED STATES–32.2% | ||||||||
U.S. Treasury Bonds | $ | 6,373 | 6,208,090 | |||||
2.375%, 11/15/49 | 585 | 585,026 | ||||||
2.50%, 2/15/45–5/15/46 | 598 | 611,667 | ||||||
Principal | U.S. $ Value | |||||||
2.75%, 8/15/42–8/15/47 | $ | 1,177 | $ | 1,260,101 | ||||
2.875%, 5/15/43–5/15/49 | 6,862 | 7,520,836 | ||||||
3.00%, 5/15/45–2/15/49 | 4,289 | 4,834,272 | ||||||
3.125%, 11/15/41–2/15/43 | 2,825 | 3,209,678 | ||||||
3.50%, 2/15/39 | 23 | 27,604 | ||||||
3.625%, 8/15/43 | 3,658 | 4,495,339 | ||||||
3.75%, 8/15/41–11/15/43 | 399 | 497,809 | ||||||
3.875%, 8/15/40 | 280 | 353,413 | ||||||
4.25%, 5/15/39 | 240 | 316,275 | ||||||
4.375%, 11/15/39–5/15/41 | 1,258 | 1,688,628 | ||||||
4.50%, 8/15/39 | 317 | 430,773 | ||||||
4.75%, 2/15/37–2/15/41 | 1,127 | 1,562,684 | ||||||
5.25%, 11/15/28 | 690 | 878,672 | ||||||
5.375%, 2/15/31 | 650 | 872,828 | ||||||
5.50%, 8/15/28 | 1,383 | 1,780,180 | ||||||
6.00%, 2/15/26 | 2,846 | 3,542,381 | ||||||
6.125%, 11/15/27 | 732 | 961,665 | ||||||
6.25%, 8/15/23–5/15/30 | 724 | 988,139 | ||||||
6.875%, 8/15/25 | 849 | 1,081,679 | ||||||
7.25%, 8/15/22 | 775 | 886,891 | ||||||
7.625%, 2/15/25 | 55 | 70,881 | ||||||
8.00%, 11/15/21 | 9,123 | 10,184,974 | ||||||
U.S. Treasury Notes | 2,905 | 2,885,323 | ||||||
1.25%, 3/31/21–8/31/24 | 8,437 | 8,363,814 | ||||||
1.375%, 10/31/20–8/31/23 | 2,898 | 2,878,931 | ||||||
1.50%, 9/30/24–8/15/26 | 8,580 | 8,485,517 | ||||||
1.625%, 8/15/22–8/15/29 | 15,079 | 15,000,217 | ||||||
1.75%, 3/31/22–11/15/29 | 15,097 | 15,130,966 | ||||||
1.875%, 11/30/21–10/31/22 | 6,713 | 6,759,549 | ||||||
2.00%, 11/15/21–11/15/26 | 24,668 | 24,942,481 | ||||||
2.125%, 8/15/21–5/15/25 | 13,382 | 13,607,876 | ||||||
2.25%, 4/30/24–8/15/49 | 9,110 | 9,319,071 | ||||||
2.375%, 8/15/24–5/15/29 | 3,578 | 3,709,713 | ||||||
2.50%, 8/15/23–5/15/24 | 5,883 | 6,076,864 | ||||||
2.625%, 2/15/29 | 821 | 870,645 | ||||||
2.75%, 11/15/23–2/15/28 | 3,400 | 3,544,613 | ||||||
2.875%, 10/31/23–8/15/28 | 2,906 | 3,081,356 | ||||||
3.125%, 5/15/21–11/15/28 | 2,049 | 2,223,154 | ||||||
3.625%, 2/15/21 | 1,566 | 1,599,745 | ||||||
|
| |||||||
Total Governments–Treasuries | 183,330,320 | |||||||
|
| |||||||
| Shares | ||||||||
INVESTMENT COMPANIES–5.5% | ||||||||
FUNDS AND INVESTMENT TRUSTS–5.5%(e) | ||||||||
iShares Core MSCI Emerging Markets ETF | 61,507 | 3,306,616 | ||||||
Vanguard Globalex-U.S. Real Estate ETF(c) | 190,876 | 11,278,863 | ||||||
Vanguard Real Estate ETF(c) | 180,607 | 16,758,524 | ||||||
|
| |||||||
Total Investment Companies | 31,344,003 | |||||||
|
| |||||||
24
| AB Variable Products Series Fund | ||
| Company | Shares | U.S. $ Value | ||||||||||
RIGHTS–0.0% | ||||||||||||
ENERGY–0.0% | ||||||||||||
OIL, GAS & CONSUMABLE FUELS–0.0% | ||||||||||||
Repsol SA, expiring 1/09/20(a) | 16,453 | $ | 7,806 | |||||||||
|
| |||||||||||
SHORT-TERM INVESTMENTS–4.6% | ||||||||||||
INVESTMENT COMPANIES–2.3% | ||||||||||||
AB Fixed Income Shares, Inc.–Government Money Market Portfolio–Class AB, 1.53%(e)(f)(g) | 12,784,259 | 12,784,259 | ||||||||||
|
| |||||||||||
| Principal Amount (000) | ||||||||||||
GOVERNMENTS– | ||||||||||||
JAPAN–1.8% | ||||||||||||
Japan Treasury Discount Bill | ||||||||||||
Series 860 | JPY | 555,100 | 5,108,946 | |||||||||
| Principal | U.S. $ Value | ||||||||||
Series 863 | JPY | 555,100 | $ | 5,109,206 | ||||||||
|
| |||||||||||
Total Governments–Treasuries | 10,218,152 | |||||||||||
|
| |||||||||||
U.S. TREASURY BILLS–0.5% | ||||||||||||
UNITED STATES–0.5% | ||||||||||||
U.S. Treasury Bill | $ | 3,016 | 3,013,744 | |||||||||
|
| |||||||||||
Total Short-Term Investments | 26,016,155 | |||||||||||
|
| |||||||||||
TOTAL INVESTMENTS–99.1% | 564,052,328 | |||||||||||
Other assets less liabilities–0.9% | 5,315,949 | |||||||||||
|
| |||||||||||
NET ASSETS–100.0% | $ | 569,368,277 | ||||||||||
|
| |||||||||||
FUTURES (see Note D)
| Description | Number of Contracts | Expiration Month | Current Notional | Value and Unrealized Appreciation/ (Depreciation) | ||||||||||||
Purchased Contracts | ||||||||||||||||
10 Yr Canadian Bond Futures | 14 | March 2020 | $ | 1,482,207 | $ | (11,528 | ) | |||||||||
10 Yr Mini Japan Government Bond Futures | 209 | March 2020 | 29,224,030 | (47,165 | ) | |||||||||||
E-Mini Russell 2000 Futures | 178 | March 2020 | 14,868,340 | 294,670 | ||||||||||||
Euro-Bund Futures | 73 | March 2020 | 13,960,419 | (180,224 | ) | |||||||||||
Mini MSCI EAFE Futures | 8 | March 2020 | 814,600 | 11,810 | ||||||||||||
MSCI Emerging Market Futures | 567 | March 2020 | 31,757,670 | 892,592 | ||||||||||||
S&P Mid 400E-Mini Futures | 74 | March 2020 | 15,279,520 | 331,205 | ||||||||||||
U.S.T-Note 10 Yr (CBT) Futures | 205 | March 2020 | 26,326,484 | (192,541 | ) | |||||||||||
U.S. Ultra Bond (CBT) Futures | 23 | March 2020 | 4,178,094 | (94,159 | ) | |||||||||||
Sold Contracts | ||||||||||||||||
Euro STOXX 50 Index Futures | 49 | March 2020 | 2,049,581 | 8,170 | ||||||||||||
FTSE 100 Index Futures | 75 | March 2020 | 7,449,880 | (38,964 | ) | |||||||||||
Hang Seng Index Futures | 33 | January 2020 | 5,986,102 | (36,689 | ) | |||||||||||
S&P 500E-Mini Futures | 178 | March 2020 | 28,756,790 | (715,098 | ) | |||||||||||
SPI 200 Futures | 59 | March 2020 | 6,834,641 | 196,420 | ||||||||||||
TOPIX Index Futures | 9 | March 2020 | 1,425,521 | (3,704 | ) | |||||||||||
|
| |||||||||||||||
| $ | 414,795 | |||||||||||||||
|
| |||||||||||||||
25
| DYNAMIC ASSET ALLOCATION PORTFOLIO | ||
| PORTFOLIO OF INVESTMENTS | ||
| (continued) | AB Variable Products Series Fund | |
FORWARD CURRENCY EXCHANGE CONTRACTS (see Note D)
| Counterparty | Contracts to Deliver (000) | In Exchange For (000) | Settlement Date | Unrealized Appreciation/ (Depreciation) | ||||||||||||||||||||
Bank of America, NA | CHF | 8,945 | USD | 9,153 | 3/16/20 | $ | (135,668 | ) | ||||||||||||||||
Bank of America, NA | EUR | 568 | USD | 636 | 3/16/20 | (3,821 | ) | |||||||||||||||||
Barclays Bank PLC | JPY | 1,110,750 | USD | 10,287 | 3/16/20 | 24,918 | ||||||||||||||||||
Barclays Bank PLC | JPY | 314,787 | USD | 2,907 | 3/16/20 | (1,341 | ) | |||||||||||||||||
BNP Paribas SA | AUD | 8,622 | USD | 5,915 | 3/16/20 | (146,105 | ) | |||||||||||||||||
BNP Paribas SA | CAD | 1,091 | USD | 824 | 3/16/20 | (15,881 | ) | |||||||||||||||||
BNP Paribas SA | NOK | 30,683 | USD | 3,349 | 3/16/20 | (146,888 | ) | |||||||||||||||||
BNP Paribas SA | SEK | 23,956 | USD | 2,537 | 3/16/20 | (29,555 | ) | |||||||||||||||||
BNP Paribas SA | USD | 3,362 | NOK | 30,683 | 3/16/20 | 133,659 | ||||||||||||||||||
BNP Paribas SA | USD | 830 | NZD | 1,266 | 3/16/20 | 22,919 | ||||||||||||||||||
BNP Paribas SA | USD | 1,388 | SEK | 13,397 | 3/16/20 | 47,558 | ||||||||||||||||||
Citibank, NA | EUR | 11,454 | USD | 12,808 | 3/16/20 | (98,507 | ) | |||||||||||||||||
Citibank, NA | GBP | 3,466 | USD | 4,554 | 3/16/20 | (45,651 | ) | |||||||||||||||||
Credit Suisse International | AUD | 1,341 | USD | 916 | 3/16/20 | (26,967 | ) | |||||||||||||||||
Goldman Sachs Bank USA | JPY | 257,260 | USD | 2,361 | 3/16/20 | (15,403 | ) | |||||||||||||||||
Goldman Sachs Bank USA | NZD | 5,048 | USD | 3,316 | 3/16/20 | (85,965 | ) | |||||||||||||||||
HSBC Bank USA | USD | 2,511 | NZD | 3,789 | 3/16/20 | 42,491 | ||||||||||||||||||
JPMorgan Chase Bank, NA | USD | 3,776 | AUD | 5,443 | 3/16/20 | 50,616 | ||||||||||||||||||
JPMorgan Chase Bank, NA | USD | 3,078 | NZD | 4,718 | 3/16/20 | 100,915 | ||||||||||||||||||
JPMorgan Chase Bank, NA | USD | 7,686 | SEK | 71,985 | 3/16/20 | 26,163 | ||||||||||||||||||
Morgan Stanley Capital Services, Inc. | USD | 3,644 | JPY | 396,587 | 3/16/20 | 19,616 | ||||||||||||||||||
Natwest Markets PLC | JPY | 155,836 | USD | 1,442 | 3/16/20 | 2,508 | ||||||||||||||||||
State Street Bank & Trust Co. | EUR | 358 | USD | 401 | 3/16/20 | (2,666 | ) | |||||||||||||||||
State Street Bank & Trust Co. | NOK | 3,038 | USD | 332 | 3/16/20 | (14,454 | ) | |||||||||||||||||
UBS AG | GBP | 5,459 | USD | 7,197 | 3/16/20 | (49,271 | ) | |||||||||||||||||
|
| |||||||||||||||||||||||
| $ | (346,780 | ) | ||||||||||||||||||||||
|
| |||||||||||||||||||||||
| (a) | Non-income producing security. |
| (b) | Security is exempt from registration under Rule 144A of the Securities Act of 1933. These securities are considered restricted, but liquid and may be resold in transactions exempt from registration, normally to qualified institutional buyers. At December 31, 2019, the aggregate market value of these securities amounted to $1,437,166 or 0.3% of net assets. |
| (c) | Represents entire or partial securities out on loan. See Note E for securities lending information. |
| (d) | Illiquid security. |
| (e) | Affiliated investments. |
| (f) | To obtain a copy of the fund’s shareholder report, please go to the Securities and Exchange Commission’s website at www.sec.gov. Additionally, shareholder reports for AB funds can be obtained by calling AB at (800)227-4618. |
| (g) | The rate shown represents the7-day yield as of period end. |
Currency Abbreviations:
AUD—Australian Dollar
CAD—Canadian Dollar
CHF—Swiss Franc
EUR—Euro
GBP—Great British Pound
JPY—Japanese Yen
NOK—Norwegian Krone
NZD—New Zealand Dollar
SEK—Swedish Krona
USD—United States Dollar
26
| AB Variable Products Series Fund | ||
Glossary:
ADR—American Depositary Receipt
CBT—Chicago Board of Trade
EAFE—Europe, Australia, and Far East
ETF—Exchange Traded Fund
FTSE—Financial Times Stock Exchange
MSCI—Morgan Stanley Capital International
REG—Registered Shares
REIT—Real Estate Investment Trust
SPI—Share Price Index
TOPIX—Tokyo Price Index
See notes to financial statements.
27
| DYNAMIC ASSET ALLOCATION PORTFOLIO | ||
| STATEMENT OF ASSETS & LIABILITIES | ||
| December 31, 2019 | AB Variable Products Series Fund | |
ASSETS | ||||
Investments in securities, at value | ||||
Unaffiliated issuers (cost $439,560,196) | $ | 551,268,069 | (a) | |
Affiliated issuers (cost $12,784,259) | 12,784,259 | |||
Cash collateral due from broker | 4,127,878 | |||
Foreign currencies, at value (cost $990,872) | 1,002,527 | |||
Unaffiliated interest and dividends receivable | 1,772,619 | |||
Receivable for investment securities sold | 759,630 | |||
Unrealized appreciation on forward currency exchange contracts | 471,363 | |||
Receivable for capital stock sold | 335,472 | |||
Receivable for variation margin on futures | 188,591 | |||
Affiliated dividends receivable | 7,932 | |||
|
| |||
Total assets | 572,718,340 | |||
|
| |||
LIABILITIES | ||||
Payable for investment securities purchased | 1,739,303 | |||
Unrealized depreciation on forward currency exchange contracts | 818,143 | |||
Advisory fee payable | 324,782 | |||
Payable for capital stock redeemed | 162,998 | |||
Distribution fee payable | 116,100 | |||
Administrative fee payable | 22,033 | |||
Transfer Agent fee payable | 132 | |||
Accrued expenses and other liabilities | 166,572 | |||
|
| |||
Total liabilities | 3,350,063 | |||
|
| |||
NET ASSETS | $ | 569,368,277 | ||
|
| |||
COMPOSITION OF NET ASSETS | ||||
Capital stock, at par | $ | 42,613 | ||
Additionalpaid-in capital | 453,267,976 | |||
Distributable earnings | 116,057,688 | |||
|
| |||
| $ | 569,368,277 | |||
|
|
Net Asset Value Per Share—1 billion shares of capital stock authorized, $.001 par value
| Class | Net Assets | Shares Outstanding | Net Asset Value | |||||||||
| A | $ | 383,101 | 28,470 | $ | 13.46 | |||||||
| B | $ | 568,985,176 | 42,584,208 | $ | 13.36 | |||||||
| (a) | Includes securities on loan with a value of $15,541,169 (see Note E). |
See notes to financial statements.
28
| DYNAMIC ASSET ALLOCATION PORTFOLIO | ||
| STATEMENT OF OPERATIONS | ||
| Year Ended December 31, 2019 | AB Variable Products Series Fund | |
INVESTMENT INCOME | ||||
Dividends | ||||
Unaffiliated issuers (net of foreign taxes withheld of $469,470) | $ | 10,174,681 | ||
Affiliated issuers | 185,257 | |||
Interest | 3,873,505 | |||
Securities lending income | 7,586 | |||
|
| |||
| 14,241,029 | ||||
|
| |||
EXPENSES | ||||
Advisory fee (see Note B) | 3,896,044 | |||
Distribution fee—Class B | 1,390,499 | |||
Transfer agency—Class A | 2 | |||
Transfer agency—Class B | 4,698 | |||
Custodian | 183,372 | |||
Audit and tax | 112,804 | |||
Administrative | 79,950 | |||
Legal | 56,900 | |||
Printing | 39,440 | |||
Directors’ fees | 22,925 | |||
Miscellaneous | 61,458 | |||
|
| |||
Total expenses | 5,848,092 | |||
Less: expenses waived and reimbursed by the Adviser (see Notes B & E) | (8,745 | ) | ||
|
| |||
Net expenses | 5,839,347 | |||
|
| |||
Net investment income | 8,401,682 | |||
|
| |||
REALIZED AND UNREALIZED GAIN (LOSS) ON INVESTMENT AND FOREIGN CURRENCY TRANSACTIONS | ||||
Net realized gain (loss) on: | ||||
Investment transactions(a) | 5,003,697 | |||
Forward currency exchange contracts | (199,861 | ) | ||
Futures | (8,296,514 | ) | ||
Options written | (175,686 | ) | ||
Swaps | 539,107 | |||
Foreign currency transactions | (102,496 | ) | ||
Net change in unrealized appreciation/depreciation of: | ||||
Investments(b) | 74,594,338 | |||
Forward currency exchange contracts | (38,136 | ) | ||
Futures | (274,725 | ) | ||
Swaps | (1,028,560 | ) | ||
Foreign currency denominated assets and liabilities | 23,704 | |||
|
| |||
Net gain on investment and foreign currency transactions | 70,044,868 | |||
|
| |||
NET INCREASE IN NET ASSETS FROM OPERATIONS | $ | 78,446,550 | ||
|
|
| (a) | Net of foreign capital gains taxes of $92. |
| (b) | Net of increase in accrued foreign capital gains taxes of $4,724. |
See notes to financial statements.
29
| DYNAMIC ASSET ALLOCATION PORTFOLIO | ||
| STATEMENT OF CHANGES IN NET ASSETS | AB Variable Products Series Fund | |
| Year Ended December 31, 2019 | Year Ended December 31, 2018 | |||||||
INCREASE (DECREASE) IN NET ASSETS FROM OPERATIONS | ||||||||
Net investment income | $ | 8,401,682 | $ | 7,918,692 | ||||
Net realized gain (loss) on investment and foreign currency transactions | (3,231,753 | ) | 3,954,193 | |||||
Net change in unrealized appreciation/depreciation of investments and foreign currency denominated assets and liabilities | 73,276,621 | (54,832,789 | ) | |||||
|
|
|
| |||||
Net increase (decrease) in net assets from operations | 78,446,550 | (42,959,904 | ) | |||||
Distributions to Shareholders | ||||||||
Class A | (7,906 | ) | (7,345 | ) | ||||
Class B | (10,638,376 | ) | (10,143,788 | ) | ||||
CAPITAL STOCK TRANSACTIONS |
| |||||||
Net decrease | (32,253,889 | ) | (18,098,509 | ) | ||||
|
|
|
| |||||
Total increase (decrease) | 35,546,379 | (71,209,546 | ) | |||||
NET ASSETS | ||||||||
Beginning of period | 533,821,898 | 605,031,444 | ||||||
|
|
|
| |||||
End of period | $ | 569,368,277 | $ | 533,821,898 | ||||
|
|
|
| |||||
See notes to financial statements.
30
| DYNAMIC ASSET ALLOCATION PORTFOLIO | ||
| NOTES TO FINANCIAL STATEMENTS | ||
| December 31, 2019 | AB Variable Products Series Fund | |
NOTE A: Significant Accounting Policies
The AB Dynamic Asset Allocation Portfolio (the “Portfolio”) is a series of AB Variable Products Series Fund, Inc. (the “Fund”). The Portfolio’s investment objective is to maximize total return consistent with the determination of AllianceBernstein L.P. (the “Adviser”) of reasonable risk. The Portfolio is diversified as defined under the Investment Company Act of 1940. The Fund was incorporated in the State of Maryland on November 17, 1987, as anopen-end series investment company. The Fund offers eleven separately managed pools of assets which have differing investment objectives and policies. The Portfolio offers Class A and Class B shares. Both classes of shares have identical voting, dividend, liquidating and other rights, except that Class B shares bear a distribution expense and have exclusive voting rights with respect to the Class B distribution plan.
The Portfolio offers and sells its shares only to separate accounts of certain life insurance companies for the purpose of funding variable annuity contracts and variable life insurance policies. Sales are made without a sales charge at the Portfolio’s net asset value per share.
The financial statements have been prepared in conformity with U.S. generally accepted accounting principles (“U.S. GAAP”) which require management to make certain estimates and assumptions that affect the reported amounts of assets and liabilities in the financial statements and amounts of income and expenses during the reporting period. Actual results could differ from those estimates. The Portfolio is an investment company under U.S. GAAP and follows the accounting and reporting guidance applicable to investment companies. The following is a summary of significant accounting policies followed by the Portfolio.
1. Security Valuation
Portfolio securities are valued at their current market value determined on the basis of market quotations or, if market quotations are not readily available or are deemed unreliable, at “fair value” as determined in accordance with procedures established by and under the general supervision of the Fund’s Board of Directors (the “Board”).
In general, the market values of securities which are readily available and deemed reliable are determined as follows: securities listed on a national securities exchange (other than securities listed on the NASDAQ Stock Market, Inc. (“NASDAQ”)) or on a foreign securities exchange are valued at the last sale price at the close of the exchange or foreign securities exchange. If there has been no sale on such day, the securities are valued at the last traded price from the previous day. Securities listed on more than one exchange are valued by reference to the principal exchange on which the securities are traded; securities listed only on NASDAQ are valued in accordance with the NASDAQ Official Closing Price; listed or over the counter (“OTC”) market put or call options are valued at the mid level between the current bid and ask prices. If either a current bid or current ask price is unavailable, the Adviser will have discretion to determine the best valuation (e.g., last trade price in the case of listed options); open futures are valued using the closing settlement price or, in the absence of such a price, the most recent quoted bid price. If there are no quotations available for the day of valuation, the last available closing settlement price is used; U.S. Government securities and any other debt instruments having 60 days or less remaining until maturity are generally valued at market by an independent pricing vendor, if a market price is available. If a market price is not available, the securities are valued at amortized cost. This methodology is commonly used for short term securities that have an original maturity of 60 days or less, as well as short term securities that had an original term to maturity that exceeded 60 days. In instances when amortized cost is utilized, the Valuation Committee (the “Committee”) must reasonably conclude that the utilization of amortized cost is approximately the same as the fair value of the security. Such factors the Committee will consider include, but are not limited to, an impairment of the creditworthiness of the issuer or material changes in interest rates. Fixed-income securities, including mortgage-backed and asset-backed securities, may be valued on the basis of prices provided by a pricing service or at a price obtained from one or more of the major broker-dealers. In cases where broker-dealer quotes are obtained, the Adviser may establish procedures whereby changes in market yields or spreads are used to adjust, on a daily basis, a recently obtained quoted price on a security. Swaps and other derivatives are valued daily, primarily using independent pricing services, independent pricing models using market inputs, as well as third party broker-dealers or counterparties. Open end mutual funds are valued at the closing net asset value per share, while exchange traded funds are valued at the closing market price per share.
Securities for which market quotations are not readily available (including restricted securities) or are deemed unreliable are valued at fair value as deemed appropriate by the Adviser. Factors considered in making this determination may include, but are not limited to, information obtained by contacting the issuer, analysts, analysis of the issuer’s financial statements or other available documents. In addition, the Portfolio may use fair value pricing for securities primarily traded innon-U.S.
31
| DYNAMIC ASSET ALLOCATION PORTFOLIO | ||
| NOTES TO FINANCIAL STATEMENTS | ||
| (continued) | AB Variable Products Series Fund | |
markets because most foreign markets close well before the Portfolio values its securities at 4:00 p.m., Eastern Time. The earlier close of these foreign markets gives rise to the possibility that significant events, including broad market moves, may have occurred in the interim and may materially affect the value of those securities. To account for this, the Portfolio generally values many of its foreign equity securities using fair value prices based on third party vendor modeling tools to the extent available.
2. Fair Value Measurements
In accordance with U.S. GAAP regarding fair value measurements, fair value is defined as the price that the Portfolio would receive to sell an asset or pay to transfer a liability in an orderly transaction between market participants at the measurement date. U.S. GAAP establishes a framework for measuring fair value, and a three-level hierarchy for fair value measurements based upon the transparency of inputs to the valuation of an asset or liability (including those valued based on their market values as described in Note A.1 above). Inputs may be observable or unobservable and refer broadly to the assumptions that market participants would use in pricing the asset or liability. Observable inputs reflect the assumptions market participants would use in pricing the asset or liability based on market data obtained from sources independent of the Portfolio. Unobservable inputs reflect the Portfolio’s own assumptions about the assumptions that market participants would use in pricing the asset or liability based on the best information available in the circumstances. Each investment is assigned a level based upon the observability of the inputs which are significant to the overall valuation. The three-tier hierarchy of inputs is summarized below.
| • | Level 1—quoted prices in active markets for identical investments |
| • | Level 2—other significant observable inputs (including quoted prices for similar investments, interest rates, prepayment speeds, credit risk, etc.) |
| • | Level 3—significant unobservable inputs (including the Portfolio’s own assumptions in determining the fair value of investments) |
The fair value of debt instruments, such as bonds, andover-the-counter derivatives is generally based on market price quotations, recently executed market transactions (where observable) or industry recognized modeling techniques and are generally classified as Level 2. Pricing vendor inputs to Level 2 valuations may include quoted prices for similar investments in active markets, interest rate curves, coupon rates, currency rates, yield curves, option adjusted spreads, default rates, credit spreads and other unique security features in order to estimate the relevant cash flows which are then discounted to calculate fair values. If these inputs are unobservable and significant to the fair value, these investments will be classified as Level 3.
Where readily available market prices or relevant bid prices are not available for certain equity investments, such investments may be valued based on similar publicly traded investments, movements in relevant indices since last available prices or based upon underlying company fundamentals and comparable company data (such as multiples to earnings or other multiples to equity). Where an investment is valued using an observable input, such as another publicly traded security, the investment will be classified as Level 2. If management determines that an adjustment is appropriate based on restrictions on resale, illiquidity or uncertainty, and such adjustment is a significant component of the valuation, the investment will be classified as Level 3. An investment will also be classified as Level 3 where management uses company fundamentals and other significant inputs to determine the valuation.
Options are valued using market-based inputs to models, broker or dealer quotations, or alternative pricing sources with reasonable levels of price transparency, where such inputs and models are available. Alternatively, the values may be obtained through unobservable management determined inputs and/or management’s proprietary models. Where models are used, the selection of a particular model to value an option depends upon the contractual terms of, and specific risks inherent in, the option as well as the availability of pricing information in the market. Valuation models require a variety of inputs, including contractual terms, market prices, measures of volatility and correlations of such inputs. Exchange traded options generally will be classified as Level 2. For options that do not trade on exchange but trade in liquid markets, inputs can generally be verified and model selection does not involve significant management judgment. Options are classified within Level 2 on the fair value hierarchy when all of the significant inputs can be corroborated to market evidence. Otherwise such instruments are classified as Level 3.
Other fixed income investments, includingnon-U.S. government and corporate debt, are generally valued using quoted market prices, if available, which are typically impacted by current interest rates, maturity dates and any perceived credit risk of the issuer. Additionally, in the absence of quoted market prices, these inputs are used by pricing vendors to derive a valuation
32
| AB Variable Products Series Fund | ||
based upon industry or proprietary models which incorporate issuer specific data with relevant yield/spread comparisons with more widely quoted bonds with similar key characteristics. Those investments for which there are observable inputs are classified as Level 2. Where the inputs are not observable, the investments are classified as Level 3.
The following table summarizes the valuation of the Portfolio’s investments by the above fair value hierarchy levels as of December 31, 2019:
| Level 1 | Level 2 | Level 3 | Total | |||||||||||||
Investments in Securities: | ||||||||||||||||
Assets: | ||||||||||||||||
Common Stocks: | ||||||||||||||||
Financials | $ | 20,642,686 | $ | 30,981,157 | $ | –0 | – | $ | 51,623,843 | |||||||
Information Technology | 36,538,721 | 11,037,808 | –0 | – | 47,576,529 | |||||||||||
Health Care | 22,156,320 | 20,488,000 | –0 | – | 42,644,320 | |||||||||||
Industrials | 14,714,269 | 24,709,425 | –0 | – | 39,423,694 | |||||||||||
Consumer Discretionary | 16,012,688 | 18,695,183 | –0 | – | 34,707,871 | |||||||||||
Consumer Staples | 11,945,894 | 18,024,361 | –0 | – | 29,970,255 | |||||||||||
Communication Services | 15,992,888 | 8,549,244 | –0 | – | 24,542,132 | |||||||||||
Materials | 4,272,728 | 12,148,164 | –0 | – | 16,420,892 | |||||||||||
Energy | 6,607,036 | 8,132,421 | –0 | – | 14,739,457 | |||||||||||
Utilities | 5,550,652 | 5,822,007 | –0 | – | 11,372,659 | |||||||||||
Real Estate | 4,860,663 | 5,471,729 | –0 | – | 10,332,392 | |||||||||||
Governments—Treasuries | –0 | – | 183,330,320 | –0 | – | 183,330,320 | ||||||||||
Investment Companies | 31,344,003 | –0 | – | –0 | – | 31,344,003 | ||||||||||
Rights | 7,806 | –0 | – | –0 | – | 7,806 | ||||||||||
Short-Term Investments: | ||||||||||||||||
Investment Companies | 12,784,259 | –0 | – | –0 | – | 12,784,259 | ||||||||||
Governments—Treasuries | –0 | – | 10,218,152 | –0 | – | 10,218,152 | ||||||||||
U.S. Treasury Bills | –0 | – | 3,013,744 | –0 | – | 3,013,744 | ||||||||||
|
|
|
|
|
|
|
| |||||||||
Total Investments in Securities | 203,430,613 | 360,621,715 | –0 | – | 564,052,328 | |||||||||||
Other Financial Instruments(a): | ||||||||||||||||
Assets: | ||||||||||||||||
Futures | 1,530,277 | 204,590 | –0 | – | 1,734,867 | (b) | ||||||||||
Forward Currency Exchange Contracts | –0 | – | 471,363 | –0 | – | 471,363 | ||||||||||
Liabilities: | ||||||||||||||||
Futures | (1,240,715 | ) | (79,357 | ) | –0 | – | (1,320,072 | )(b) | ||||||||
Forward Currency Exchange Contracts | –0 | – | (818,143 | ) | –0 | – | (818,143 | ) | ||||||||
|
|
|
|
|
|
|
| |||||||||
Total | $ | 203,720,175 | $ | 360,400,168 | $ | –0 | – | $ | 564,120,343 | |||||||
|
|
|
|
|
|
|
| |||||||||
| (a) | Other financial instruments are derivative instruments, such as futures, forwards and swaps, which are valued at the unrealized appreciation/(depreciation) on the instrument. Other financial instruments may also include swaps with upfront premiums, options written and swaptions written which are valued at market value. |
| (b) | Only variation margin receivable/(payable) at period end is reported within the statement of assets and liabilities. This amount reflects cumulative unrealized appreciation/(depreciation) on futures and centrally cleared swaps as reported in the portfolio of investments. Where applicable, centrally cleared swaps with upfront premiums are presented here at market value. |
3. Currency Translation
Assets and liabilities denominated in foreign currencies and commitments under forward currency exchange contracts are translated into U.S. dollars at the mean of the quoted bid and ask prices of such currencies against the U.S. dollar. Purchases and sales of portfolio securities are translated into U.S. dollars at the rates of exchange prevailing when such securities were acquired or sold. Income and expenses are translated into U.S. dollars at rates of exchange prevailing when accrued.
Net realized gain or loss on foreign currency transactions represents foreign exchange gains and losses from sales and maturities of foreign fixed income investments, holding of foreign currencies, currency gains or losses realized between the trade
33
| DYNAMIC ASSET ALLOCATION PORTFOLIO | ||
| NOTES TO FINANCIAL STATEMENTS | ||
| (continued) | AB Variable Products Series Fund | |
and settlement dates on foreign investment transactions, and the difference between the amounts of dividends, interest and foreign withholding taxes recorded on the Portfolio’s books and the U.S. dollar equivalent amounts actually received or paid. Net unrealized currency gains and losses from valuing foreign currency denominated assets and liabilities at period end exchange rates are reflected as a component of net unrealized appreciation or depreciation of foreign currency denominated assets and liabilities.
4. Taxes
It is the Portfolio’s policy to meet the requirements of the Internal Revenue Code applicable to regulated investment companies and to distribute all of its investment company taxable income and net realized gains, if any, to shareholders. Therefore, no provisions for federal income or excise taxes are required. The Portfolio may be subject to taxes imposed by countries in which it invests. Such taxes are generally based on income and/or capital gains earned or repatriated. Taxes are accrued and applied to net investment income, net realized gains and net unrealized appreciation/depreciation as such income and/or gains are earned.
In accordance with U.S. GAAP requirements regarding accounting for uncertainties in income taxes, management has analyzed the Portfolio’s tax positions taken or expected to be taken on federal and state income tax returns for all open tax years (the current and the prior three tax years) and has concluded that no provision for income tax is required in the Portfolio’s financial statements.
5. Investment Income and Investment Transactions
Dividend income is recorded on theex-dividend date or as soon as the Portfolio is informed of the dividend. Interest income is accrued daily. Investment transactions are accounted for on the date the securities are purchased or sold. Investment gains or losses are determined on the identified cost basis. The Portfolio amortizes premiums and accretes discounts as adjustments to interest income.
6. Class Allocations
All income earned and expenses incurred by the Portfolio are borne on apro-rata basis by each outstanding class of shares, based on the proportionate interest in the Portfolio represented by the net assets of such class, except for class specific expenses which are allocated to the respective class. Expenses of the Fund are charged proportionately to the portfolio or based on other appropriate methods. Realized and unrealized gains and losses are allocated among the various share classes based on respective net assets.
7. Dividends and Distributions
Dividends and distributions to shareholders, if any, are recorded on theex-dividend date. Income dividends and capital gains distributions are determined in accordance with federal tax regulations and may differ from those determined in accordance with U.S. GAAP. To the extent these differences are permanent, such amounts are reclassified within the capital accounts based on their federal tax basis treatment; temporary differences do not require such reclassification.
NOTE B: Advisory Fee and Other Transactions with Affiliates
Under the terms of the investment advisory agreement, the Portfolio pays the Adviser an advisory fee at an annual rate of .70% of the Portfolio’s average daily net assets. The Adviser has agreed to waive its fees and bear certain expenses to the extent necessary to limit total operating expenses on an annual basis (the “Expense Caps”) to .85% and 1.10% of daily average net assets for Class A and Class B shares, respectively. The Expense Caps will remain in effect until May 1, 2020 and then may be extended by the Adviser for additionalone-year terms. For the year ended December 31, 2019, there were no expenses waived by the Adviser.
Pursuant to the investment advisory agreement, the Portfolio may reimburse the Adviser for certain legal and accounting services provided to the Portfolio by the Adviser. For the year ended December 31, 2019, the reimbursement for such services amounted to $79,950.
The Portfolio compensates AllianceBernstein Investor Services, Inc. (“ABIS”), a wholly-owned subsidiary of the Adviser, under a Transfer Agency Agreement for providing personnel and facilities to perform transfer agency services for the Portfolio. Such compensation retained by ABIS amounted to $1,491 for the year ended December 31, 2019.
The Portfolio may invest in AB Government Money Market Portfolio (the “Government Money Market Portfolio”) which has a contractual annual advisory fee rate of .20% of the portfolio’s average daily net assets and bears its own expenses. The Adviser has contractually agreed to waive .10% of the advisory fee of Government Money Market Portfolio (resulting in a
34
| AB Variable Products Series Fund | ||
net advisory fee of .10%) until August 31, 2020. In connection with the investment by the Portfolio in Government Money Market Portfolio, the Adviser has contractually agreed to waive its advisory fee from the Portfolio in an amount equal to the Portfolio’s pro rata share of the effective advisory fee of Government Money Market Portfolio, as borne indirectly by the Portfolio as an acquired fund fee and expense. For the year ended December 31, 2019, such waiver amounted to $8,131.
A summary of the Portfolio’s transactions in AB mutual funds for the year ended December 31, 2019 is as follows:
Fund | Market Value 12/31/18 (000) | Purchases at Cost (000) | Sales Proceeds (000) | Market Value 12/31/19 (000) | Dividend Income (000) | |||||||||||||||
Government Money Market Portfolio | $ | 14,797 | $ | 161,137 | $ | 163,150 | $ | 12,784 | $ | 173 | ||||||||||
Government Money Market Portfolio* | 869 | 143,962 | 144,831 | 0 | 12 | |||||||||||||||
|
|
|
| |||||||||||||||||
Total | $ | 12,784 | $ | 185 | ||||||||||||||||
|
|
|
| |||||||||||||||||
| * | Investments of cash collateral for securities lending transactions (see Note E). |
During the second quarter of 2018, AXA S.A. (“AXA”), a French holding company for the AXA Group, a worldwide leader in life, property and casualty and health insurance and asset management, completed the sale of a minority stake in its subsidiary, AXA Equitable Holdings, Inc. (now named Equitable Holdings, Inc.)(“Equitable”), through an initial public offering. Equitable is the holding company for a diverse group of financial services companies, including an approximately 65.3% economic interest in the Adviser and a 100% interest in AllianceBernstein Corporation, the general partner of the Adviser. Since the initial sale, AXA has completed additional offerings, most recently during the fourth quarter of 2019. As a result, AXA currently owns 10.1% of the outstanding shares of common stock of Equitable, and no longer owns a controlling interest in Equitable. AXA previously announced its intention to sell its entire interest in Equitable over time, subject to market conditions and other factors (the “Plan”). Most of AXA’s remaining Equitable shares are to be delivered on redemption of AXA bonds mandatorily exchangeable into Equitable shares and maturing in May 2021. AXA retains sole discretion to determine the timing of any future sales of its remaining shares of Equitable common stock.
The latest transaction under the Plan, which occurred on November 13, 2019, resulted in the indirect transfer of a “controlling block” of voting securities of the Adviser (a “Change of Control Event”) and was deemed an “assignment” causing a termination of the Portfolio’s investment advisory agreement. In order to ensure that investment advisory services could continue uninterrupted in the event of a Change of Control Event, the Board previously approved a new investment advisory agreement with the Adviser, and shareholders of the Portfolio subsequently approved the new investment advisory agreement. This agreement became effective on November 13, 2019.
NOTE C: Distribution Plan
The Portfolio has adopted a Distribution Plan (the “Plan”) for Class B shares pursuant to Rule12b-1 under the Investment Company Act of 1940. Under the Plan, the Portfolio pays distribution and servicing fees to AllianceBernstein Investments, Inc. (the “Distributor”), a wholly-owned subsidiary of the Adviser, at an annual rate of up to .50% of the Portfolio’s average daily net assets attributable to Class B shares. The fees are accrued daily and paid monthly. The Board currently limits payments under the Plan to .25% of the Portfolio’s average daily net assets attributable to Class B shares. The Plan provides that the Distributor will use such payments in their entirety for distribution assistance and promotional activities.
The Portfolio is not obligated under the Plan to pay any distribution and servicing fees in excess of the amounts set forth above. The purpose of the payments to the Distributor under the Plan is to compensate the Distributor for its distribution services with respect to the sale of the Portfolio’s Class B shares. Since the Distributor’s compensation is not directly tied to its expenses, the amount of compensation received by it under the Plan during any year may be more or less than its actual expenses. For this reason, the Plan is characterized by the staff of the Securities and Exchange Commission as being of the “compensation” variety.
In the event that the Plan is terminated or not continued, no distribution or servicing fees (other than current amounts accrued but not yet paid) would be owed by the Portfolio to the Distributor.
The Plan also provides that the Adviser may use its own resources to finance the distribution of the Portfolio’s shares.
35
| DYNAMIC ASSET ALLOCATION PORTFOLIO | ||
| NOTES TO FINANCIAL STATEMENTS | ||
| (continued) | AB Variable Products Series Fund | |
NOTE D: Investment Transactions
Purchases and sales of investment securities (excluding short-term investments) for the year ended December 31, 2019 were as follows:
| Purchases | Sales | |||||||
Investment securities (excluding U.S. government securities) | $ | 69,189,256 | $ | 129,558,608 | ||||
U.S. government securities | 33,328,811 | 27,640,467 | ||||||
The cost of investments for federal income tax purposes, gross unrealized appreciation and unrealized depreciation are as follows:
Cost | $ | 453,804,870 | ||
|
| |||
Gross unrealized appreciation | 127,212,850 | |||
Gross unrealized depreciation | (16,868,058 | ) | ||
|
| |||
Net unrealized appreciation | $ | 110,344,792 | ||
|
|
1. Derivative Financial Instruments
The Portfolio may use derivatives in an effort to earn income and enhance returns, to replace more traditional direct investments, to obtain exposure to otherwise inaccessible markets (collectively, “investment purposes”), or to hedge or adjust the risk profile of its portfolio.
The principal types of derivatives utilized by the Portfolio, as well as the methods in which they may be used are:
| • | Futures |
The Portfolio may buy or sell futures for investment purposes or for the purpose of hedging its portfolio against adverse effects of potential movements in the market. The Portfolio bears the market risk that arises from changes in the value of these instruments and the imperfect correlation between movements in the price of the futures and movements in the price of the assets, reference rates or indices which they are designed to track. Among other things, the Portfolio may purchase or sell futures for foreign currencies or options thereon fornon-hedging purposes as a means of making direct investment in foreign currencies, as described below under “Currency Transactions”.
At the time the Portfolio enters into futures, the Portfolio deposits and maintains as collateral an initial margin with the broker, as required by the exchange on which the transaction is effected. Such amount is shown as cash collateral due from broker on the statement of assets and liabilities. Pursuant to the contract, the Portfolio agrees to receive from or pay to the broker an amount of cash equal to the daily fluctuation in the value of the contract. Such receipts or payments are known as variation margin and are recorded by the Portfolio as unrealized gains or losses. Risks may arise from the potential inability of a counterparty to meet the terms of the contract. The credit/counterparty risk for exchange-traded futures is generally less than privately negotiated futures, since the clearinghouse, which is the issuer or counterparty to each exchange-traded future, has robust risk mitigation standards, including the requirement to provide initial and variation margin. When the contract is closed, the Portfolio records a realized gain or loss equal to the difference between the value of the contract at the time it was opened and the time it was closed.
Use of long futures subjects the Portfolio to risk of loss in excess of the amounts shown on the statement of assets and liabilities, up to the notional value of the futures. Use of short futures subjects the Portfolio to unlimited risk of loss. Under some circumstances, futures exchanges may establish daily limits on the amount that the price of futures can vary from the previous day’s settlement price, which could effectively prevent liquidation of unfavorable positions.
During the year ended December 31, 2019, the Portfolio held futures for hedging andnon-hedging purposes.
| • | Forward Currency Exchange Contracts |
The Portfolio may enter into forward currency exchange contracts in order to hedge its exposure to changes in foreign currency exchange rates on its foreign portfolio holdings, to hedge certain firm purchase and sale commitments denominated in foreign currencies and fornon-hedging purposes as a means of making direct investments in foreign currencies, as described below under “Currency Transactions”.
36
| AB Variable Products Series Fund | ||
A forward currency exchange contract is a commitment to purchase or sell a foreign currency at a future date at a negotiated forward rate. The gain or loss arising from the difference between the original contract and the closing of such contract would be included in net realized gain or loss on forward currency exchange contracts. Fluctuations in the value of open forward currency exchange contracts are recorded for financial reporting purposes as unrealized appreciation and/or depreciation by the Portfolio. Risks may arise from the potential inability of a counterparty to meet the terms of a contract and from unanticipated movements in the value of a foreign currency relative to the U.S. dollar.
During the year ended December 31, 2019, the Portfolio held forward currency exchange contracts for hedging andnon-hedging purposes.
| • | Option Transactions |
For hedging and investment purposes, the Portfolio may purchase and write (sell) put and call options on U.S. and foreign securities, including government securities, and foreign currencies that are traded on U.S. and foreign securities exchanges andover-the-counter markets. Among other things, the Portfolio may use options transactions fornon-hedging purposes as a means of making direct investments in foreign currencies, as described below under “Currency Transactions” and may use options strategies involving the purchase and/or writing of various combinations of call and/or put options, for hedging and investment purposes.
The risk associated with purchasing an option is that the Portfolio pays a premium whether or not the option is exercised. Additionally, the Portfolio bears the risk of loss of the premium and change in market value should the counterparty not perform under the contract. If a put or call option purchased by the Portfolio were permitted to expire without being sold or exercised, its premium would represent a loss to the Portfolio. Put and call options purchased are accounted for in the same manner as portfolio securities. The cost of securities acquired through the exercise of call options is increased by premiums paid. The proceeds from securities sold through the exercise of put options are decreased by the premiums paid.
When the Portfolio writes an option, the premium received by the Portfolio is recorded as a liability and is subsequently adjusted to the current market value of the option written. The Portfolio’s maximum payment for written put options equates to the number of shares multiplied by the strike price. In certain circumstances maximum payout amounts may be partially offset by recovery values of the respective referenced assets and upfront premium received upon entering into the contract. Premiums received from written options which expire unexercised are recorded by the Portfolio on the expiration date as realized gains from options written. The difference between the premium received and the amount paid on effecting a closing purchase transaction, including brokerage commissions, is also treated as a realized gain, or if the premium received is less than the amount paid for the closing purchase transaction, as a realized loss. If a call option is exercised, the premium received is added to the proceeds from the sale of the underlying security or currency in determining whether the Portfolio has realized a gain or loss. If a put option is exercised, the premium received reduces the cost basis of the security or currency purchased by the Portfolio. In writing an option, the Portfolio bears the market risk of an unfavorable change in the price of the security or currency underlying the written option. Exercise of an option written by the Portfolio could result in the Portfolio selling or buying a security or currency at a price different from the current market value.
During the year ended December 31, 2019, the Portfolio held purchased options for hedging andnon-hedging purposes. During the year ended December 31, 2019, the Portfolio held written options for hedging andnon-hedging purposes.
| • | Swaps |
The Portfolio may enter into swaps to hedge its exposure to interest rates, credit risk, equity markets or currencies. The Portfolio may also enter into swaps fornon-hedging purposes as a means of gaining market exposures, making direct investments in foreign currencies, as described below under “Currency Transactions” or in order to take a “long” or “short” position with respect to an underlying referenced asset described below under “Total Return Swaps”. A swap is an agreement that obligates two parties to exchange a series of cash flows at specified intervals based upon or calculated by reference to changes in specified prices or rates for a specified amount of an underlying asset. The payment flows are usually netted against each other, with the difference being paid by one party to the
37
| DYNAMIC ASSET ALLOCATION PORTFOLIO | ||
| NOTES TO FINANCIAL STATEMENTS | ||
| (continued) | AB Variable Products Series Fund | |
other. In addition, collateral may be pledged or received by the Portfolio in accordance with the terms of the respective swaps to provide value and recourse to the Portfolio or its counterparties in the event of default, bankruptcy or insolvency by one of the parties to the swap.
Risks may arise as a result of the failure of the counterparty to the swap to comply with the terms of the swap. The loss incurred by the failure of a counterparty is generally limited to the net interim payment to be received by the Portfolio, and/or the termination value at the end of the contract. Therefore, the Portfolio considers the creditworthiness of each counterparty to a swap in evaluating potential counterparty risk. This risk is mitigated by having a netting arrangement between the Portfolio and the counterparty and by the posting of collateral by the counterparty to the Portfolio to cover the Portfolio’s exposure to the counterparty. Additionally, risks may arise from unanticipated movements in interest rates or in the value of the underlying securities. The Portfolio accrues for the interim payments on swaps on a daily basis, with the net amount recorded within unrealized appreciation/depreciation of swaps on the statement of assets and liabilities, where applicable. Once the interim payments are settled in cash, the net amount is recorded as realized gain/(loss) on swaps on the statement of operations, in addition to any realized gain/(loss) recorded upon the termination of swaps. Upfront premiums paid or received for OTC swaps are recognized as cost or proceeds on the statement of assets and liabilities and are amortized on a straight line basis over the life of the contract. Amortized upfront premiums are included in net realized gain/(loss) from swaps on the statement of operations. Fluctuations in the value of swaps are recorded as a component of net change in unrealized appreciation/depreciation of swaps on the statement of operations.
Certain standardized swaps, including certain interest rate swaps and credit default swaps, are (or soon will be) subject to mandatory central clearing. Cleared swaps are transacted through futures commission merchants (“FCMs”) that are members of central clearinghouses, with the clearinghouse serving as central counterparty, similar to transactions in futures contracts. Centralized clearing will be required for additional categories of swaps on aphased-in basis based on requirements published by the Securities and Exchange Commission and Commodity Futures Trading Commission.
At the time the Portfolio enters into a centrally cleared swap, the Portfolio deposits and maintains as collateral an initial margin with the broker, as required by the clearinghouse on which the transaction is effected. Such amount is shown as cash collateral due from broker on the statement of assets and liabilities. Pursuant to the contract, the Portfolio agrees to receive from or pay to the broker an amount of cash equal to the daily fluctuation in the value of the contract. Such receipts or payments are known as variation margin and are recorded by the Portfolio as unrealized gains or losses. Risks may arise from the potential inability of a counterparty to meet the terms of the contract. The credit/counterparty risk for centrally cleared swaps is generally less thannon-centrally cleared swaps, since the clearinghouse, which is the issuer or counterparty to each centrally cleared swap, has robust risk mitigation standards, including the requirement to provide initial and variation margin. When the contract is closed, the Portfolio records a realized gain or loss equal to the difference between the value of the contract at the time it was opened and the time it was closed.
Inflation (CPI) Swaps:
Inflation swap agreements are contracts in which one party agrees to pay the cumulative percentage increase in a price index (the Consumer Price Index with respect to CPI swaps) over the term of the swap (with some lag on the inflation index), and the other pays a compounded fixed rate. Inflation swaps may be used to protect the net asset value, or NAV, of a Portfolio against an unexpected change in the rate of inflation measured by an inflation index since the value of these agreements is expected to increase if there are unexpected inflation increases.
During the year ended December 31, 2019, the Portfolio held inflation (CPI) swaps for hedging andnon-hedging purposes.
Credit Default Swaps:
The Portfolio may enter into credit default swaps, including to manage its exposure to the market or certain sectors of the market, to reduce its risk exposure to defaults by corporate and sovereign issuers held by the Portfolio, or to create exposure to corporate or sovereign issuers to which it is not otherwise exposed. The Portfolio may purchase credit protection (“Buy Contract”) or provide credit protection (“Sale Contract”) on the referenced obligation of the credit default swap. During the term of the swap, the Portfolio receives/(pays) fixed payments from/(to) the
38
| AB Variable Products Series Fund | ||
respective counterparty, calculated at the agreed upon rate applied to the notional amount. If the Portfolio is a buyer/(seller) of protection and a credit event occurs, as defined under the terms of the swap, the Portfolio will either (i) receive from the seller/(pay to the buyer) of protection an amount equal to the notional amount of the swap (the “Maximum Payout Amount”) and deliver/(take delivery of) the referenced obligation or (ii) receive/(pay) a net settlement amount in the form of cash or securities equal to the notional amount of the swap less the recovery value of the referenced obligation. In certain circumstances Maximum Payout Amounts may be partially offset by recovery values of the respective referenced obligations, upfront premium received upon entering into the agreement, or net amounts received from settlement of buy protection credit default swaps entered into by the Portfolio for the same referenced obligations with the same counterparty.
Credit default swaps may involve greater risks than if a Portfolio had invested in the referenced obligation directly. Credit default swaps are subject to general market risk, liquidity risk, counterparty risk and credit risk. If the Portfolio is a buyer of protection and no credit event occurs, it will lose the payments it made to its counterparty. If the Portfolio is a seller of protection and a credit event occurs, the value of the referenced obligation received by the Portfolio coupled with the periodic payments previously received, may be less than the Maximum Payout Amount it pays to the buyer, resulting in a net loss to the Portfolio.
Implied credit spreads over U.S. Treasuries of comparable maturity utilized in determining the market value of credit default swaps on issuers as of period end are disclosed in the portfolio of investments. The implied spreads serve as an indicator of the current status of the payment/performance risk and typically reflect the likelihood of default by the issuer of the referenced obligation. The implied credit spread of a particular reference obligation also reflects the cost of buying/selling protection and may reflect upfront payments required to be made to enter into the agreement. Widening credit spreads typically represent a deterioration of the referenced obligation’s credit soundness and greater likelihood of default or other credit event occurring as defined under the terms of the agreement. A credit spread identified as “Defaulted” indicates a credit event has occurred for the referenced obligation.
During the year ended December 31, 2019, the Portfolio held credit default swaps for hedging andnon-hedging purposes.
Total Return Swaps:
The Portfolio may enter into total return swaps in order to take a “long” or “short” position with respect to an underlying referenced asset. The Portfolio is subject to market price volatility of the underlying referenced asset. A total return swap involves commitments to pay interest in exchange for a market linked return based on a notional amount. To the extent that the total return of the security, group of securities or index underlying the transaction exceeds or falls short of the offsetting interest obligation, the Portfolio will receive a payment from or make a payment to the counterparty.
During the year ended December 31, 2019, the Portfolio held total return swaps for hedging andnon-hedging purposes.
The Portfolio typically enters into International Swaps and Derivatives Association, Inc. Master Agreements (“ISDA Master Agreement”) with its OTC derivative contract counterparties in order to, among other things, reduce its credit risk to OTC counterparties. ISDA Master Agreements include provisions for general obligations, representations, collateral and events of default or termination. Under an ISDA Master Agreement, the Portfolio typically may offset with the OTC counterparty certain derivative financial instruments’ payables and/or receivables with collateral held and/or posted and create one single net payment(close-out netting) in the event of default or termination. In the event of a default by an OTC counterparty, the return of collateral with market value in excess of the Portfolio’s net liability, held by the defaulting party, may be delayed or denied.
The Portfolio’s ISDA Master Agreements may contain provisions for early termination of OTC derivative transactions in the event the net assets of the Portfolio decline below specific levels (“net asset contingent features”). If these levels are triggered, the Portfolio’s OTC counterparty has the right to terminate such transaction and require the Portfolio to pay or receive a settlement amount in connection with the terminated transaction. If OTC derivatives were held at period end, please refer to netting arrangements by the OTC counterparty table below for additional details.
39
| DYNAMIC ASSET ALLOCATION PORTFOLIO | ||
| NOTES TO FINANCIAL STATEMENTS | ||
| (continued) | AB Variable Products Series Fund | |
During the year ended December 31, 2019, the Portfolio had entered into the following derivatives:
Asset Derivatives | Liability Derivatives | |||||||||||
Derivative Type | Statement of | Fair Value | Statement of | Fair Value | ||||||||
Interest rate contracts | Receivable/Payable for variation margin on futures | $ | 525,617 | * | ||||||||
Equity contracts | Receivable/Payable for variation margin on futures | $ | 1,734,867 | * | Receivable/Payable for variation margin on futures | 794,455 | * | |||||
Foreign currency contracts | Unrealized appreciation on forward currency exchange contracts | 471,363 | Unrealized depreciation on forward currency exchange contracts | 818,143 | ||||||||
|
|
|
| |||||||||
Total | $ | 2,206,230 | $ | 2,138,215 | ||||||||
|
|
|
| |||||||||
| * | Only variation margin receivable/payable at period end is reported within the statement of assets and liabilities. This amount reflects cumulative unrealized appreciation/(depreciation) on futures and centrally cleared swaps as reported in the portfolio of investments. |
Derivative Type | Location of Gain or (Loss) on Derivatives | Realized Gain or (Loss) on Derivatives | Change in Unrealized Appreciation or (Depreciation) | |||||||
Interest rate contracts | Net realized gain (loss) on futures; Net change in unrealized appreciation/depreciation of futures | $ | 1,055,610 | $ | (1,111,761 | ) | ||||
Equity contracts | Net realized gain (loss) on futures; Net change in unrealized appreciation/depreciation of futures | (9,352,124 | ) | 837,036 | ||||||
Foreign currency contracts | Net realized gain (loss) on forward currency exchange contracts; Net change in unrealized appreciation/depreciation of forward currency exchange contracts | (199,861 | ) | (38,136 | ) | |||||
Equity contracts | Net realized gain (loss) on investment transactions; Net change in unrealized appreciation/depreciation of investments | 165,664 | –0 | – | ||||||
Equity contracts | Net realized gain (loss) on options written; Net change in unrealized appreciation/depreciation of options written | (175,686 | ) | –0 | – | |||||
Interest rate contracts | Net realized gain (loss) on swaps; Net change in unrealized appreciation/depreciation of swaps | (789,390 | ) | 1,087,901 | ||||||
Credit contracts | Net realized gain (loss) on swaps; Net change in unrealized appreciation/depreciation of swaps | 177,081 | –0 | – | ||||||
Equity contracts | Net realized gain (loss) on swaps; Net change in unrealized appreciation/depreciation of swaps | 1,151,416 | (2,116,461 | ) | ||||||
|
|
|
| |||||||
Total | $ | (7,967,290 | ) | $ | (1,341,421 | ) | ||||
|
|
|
| |||||||
40
| AB Variable Products Series Fund | ||
The following table represents the average monthly volume of the Portfolio’s derivative transactions during the year ended December 31, 2019:
Futures: | ||||
Average notional amount of buy contracts | $ | 87,953,988 | ||
Average notional amount of sale contracts | $ | 74,923,760 | ||
Forward Currency Exchange Contracts: | ||||
Average principal amount of buy contracts | $ | 61,818,788 | ||
Average principal amount of sale contracts | $ | 87,015,192 | ||
Purchased Options: | ||||
Average notional amount | $ | 48,217,500 | (a) | |
Options Written: | ||||
Average notional amount | $ | 46,000,000 | (b) | |
Inflation Swaps: | ||||
Average notional amount | $ | 56,430,000 | (c) | |
Centrally Cleared Credit Default Swaps: | ||||
Average notional amount of buy contracts | $ | 559,350 | (d) | |
Average notional amount of sale contracts | $ | 11,906,530 | (e) | |
Total Return Swaps: | ||||
Average notional amount | $ | 29,221,611 | (c) |
| (a) | Positions were open for four months during the year. |
| (b) | Positions were open for less than one month during the year. |
| (c) | Positions were open for two months during the year. |
| (d) | Positions were open for one month during the year. |
| (e) | Positions were open for three months during the year. |
For financial reporting purposes, the Portfolio does not offset derivative assets and derivative liabilities that are subject to netting arrangements in the statement of assets and liabilities.
All OTC derivatives held at period end were subject to netting arrangements. The following table presents the Portfolio’s derivative assets and liabilities by OTC counterparty net of amounts available for offset under ISDA Master Agreements (“MA”) and net of the related collateral received/pledged by the Portfolio as of December 31, 2019. Exchange-traded derivatives and centrally cleared swaps are not subject to netting arrangements and as such are excluded from the table.
Counterparty | Derivative Assets Subject to a MA | Derivatives Available for Offset | Cash Collateral Received* | Security Collateral Received* | Net Amount of Derivative Assets | |||||||||||||||
Barclays Bank PLC | $ | 24,918 | $ | (1,341 | ) | $ | –0 | – | $ | –0 | – | $ | 23,577 | |||||||
BNP Paribas SA | 204,136 | (204,136 | ) | –0 | – | –0 | – | –0 | – | |||||||||||
HSBC Bank USA | 42,491 | –0 | – | –0 | – | –0 | – | 42,491 | ||||||||||||
JPMorgan Chase Bank, NA | 177,694 | –0 | – | –0 | – | –0 | – | 177,694 | ||||||||||||
Morgan Stanley Capital Services, Inc. | 19,616 | –0 | – | –0 | – | –0 | – | 19,616 | ||||||||||||
Natwest Markets PLC | 2,508 | –0 | – | –0 | – | –0 | – | 2,508 | ||||||||||||
|
|
|
|
|
|
|
|
|
| |||||||||||
Total | $ | 471,363 | $ | (205,477 | ) | $ | –0 | – | $ | –0 | – | $ | 265,886 | ^ | ||||||
|
|
|
|
|
|
|
|
|
| |||||||||||
Counterparty | Derivative Liabilities Subject to a MA | Derivatives Available for Offset | Cash Collateral Pledged* | Security Collateral Pledged* | Net Amount of Derivative Liabilities | |||||||||||||||
Bank of America, NA | $ | 139,489 | $ | –0 | – | $ | –0 | – | $ | –0 | – | $ | 139,489 | |||||||
Barclays Bank PLC | 1,341 | (1,341 | ) | –0 | – | –0 | – | –0 | – | |||||||||||
BNP Paribas SA | 338,429 | (204,136 | ) | –0 | – | –0 | – | 134,293 | ||||||||||||
Citibank, NA | 144,158 | –0 | – | –0 | – | –0 | – | 144,158 | ||||||||||||
Credit Suisse International | 26,967 | –0 | – | –0 | – | –0 | – | 26,967 | ||||||||||||
Goldman Sachs Bank USA | 101,368 | –0 | – | –0 | – | –0 | – | 101,368 | ||||||||||||
State Street Bank & Trust Co. | 17,120 | –0 | – | –0 | – | –0 | – | 17,120 | ||||||||||||
UBS AG | 49,271 | –0 | – | –0 | – | –0 | – | 49,271 | ||||||||||||
|
|
|
|
|
|
|
|
|
| |||||||||||
Total | $ | 818,143 | $ | (205,477 | ) | $ | –0 | – | $ | –0 | – | $ | 612,666 | ^ | ||||||
|
|
|
|
|
|
|
|
|
| |||||||||||
| * | The actual collateral received/pledged may be more than the amount reported due to over-collateralization. |
| ^ | Net amount represents the net receivable/payable that would be due from/to the counterparty in the event of default or termination. The net amount from OTC financial derivative instruments can only be netted across transactions governed under the same master agreement with the same counterparty. |
41
| DYNAMIC ASSET ALLOCATION PORTFOLIO | ||
| NOTES TO FINANCIAL STATEMENTS | ||
| (continued) | AB Variable Products Series Fund | |
2. Currency Transactions
The Portfolio may invest innon-U.S. Dollar-denominated securities on a currency hedged or unhedged basis. The Portfolio may seek investment opportunities by taking long or short positions in currencies through the use of currency-related derivatives, including forward currency exchange contracts, futures and options on futures, swaps, and other options. The Portfolio may enter into transactions for investment opportunities when it anticipates that a foreign currency will appreciate or depreciate in value but securities denominated in that currency are not held by the Portfolio and do not present attractive investment opportunities. Such transactions may also be used when the Adviser believes that it may be more efficient than a direct investment in a foreign currency-denominated security. The Portfolio may also conduct currency exchange contracts on a spot basis (i.e., for cash at the spot rate prevailing in the currency exchange market for buying or selling currencies).
NOTE E: Securities Lending
The Portfolio may enter into securities lending transactions. Under the Portfolio’s securities lending program, all loans of securities will be collateralized continually by cash collateral and/ornon-cash collateral.Non-cash collateral will include only securities issued or guaranteed by the U.S. government or its agencies or instrumentalities. The Portfolio cannot sell or repledge anynon-cash collateral, such collateral will not be reflected in the portfolio of investments. If a loan is collateralized by cash, the Portfolio will be compensated for the loan from a portion of the net return from the income earned on cash collateral after a rebate is paid to the borrower (in some cases, this rebate may be a “negative rebate” or fee paid by the borrower to the Portfolio in connection with the loan), and payments are made for fees of the securities lending agent and for certain other administrative expenses. If the Portfolio receivesnon-cash collateral, the Portfolio will receive a fee from the borrower generally equal to a negotiated percentage of the market value of the loaned securities. The Portfolio will have the right to call a loan and obtain the securities loaned at any time on notice to the borrower within the normal and customary settlement time for the securities. While the securities are on loan, the borrower is obligated to pay the Portfolio amounts equal to any income or other distributions from the securities. The Portfolio will not be able to exercise voting rights with respect to any securities during the existence of a loan, but will have the right to regain ownership of loaned securities in order to exercise voting or other ownership rights. Collateral received and securities loaned are marked to market daily to ensure that the securities loaned are secured by collateral. The lending agent currently invests the cash collateral received in Government Money Market Portfolio, an eligible money market vehicle, in accordance with the investment restrictions of the Portfolio, and as approved by the Board. The collateral received on securities loaned is recorded as an asset as well as a corresponding liability in the statement of assets and liabilities. The collateral will be adjusted the next business day to maintain the required collateral amount. The amounts of securities lending income from the borrowers and Government Money Market Portfolio are reflected in the statement of operations. When the Portfolio earns net securities lending income from Government Money Market Portfolio, the income is inclusive of a rebate expense paid to the borrower. In connection with the cash collateral investment by the Portfolio in Government Money Market Portfolio, the Adviser has agreed to waive a portion of the Portfolio’s share of the advisory fees of Government Money Market Portfolio, as borne indirectly by the Portfolio as an acquired fund fee and expense. When the Portfolio lends securities, its investment performance will continue to reflect changes in the value of the securities loaned. A principal risk of lending portfolio securities is that the borrower may fail to return the loaned securities upon termination of the loan and that the collateral will not be sufficient to replace the loaned securities. The lending agent has agreed to indemnify the Portfolio in the case of default of any securities borrower.
A summary of the Portfolio’s transactions surrounding securities lending for the year ended December 31, 2019 is as follows:
| Government Money Market Portfolio | ||||||||||||||||||||||
| Market Value of Securities on Loan* | Cash Collateral* | Market Value of Non-Cash Collateral* | Income from Borrowers | Income Earned | Advisory Fee Waived | |||||||||||||||||
| $ | 15,541,169 | $ | 0 | $ | 15,829,445 | $ | 7,586 | $ | 11,923 | $ | 614 | |||||||||||
| * | As of December 31, 2019. |
42
| AB Variable Products Series Fund | ||
NOTE F: Capital Stock
Each class consists of 500,000,000 authorized shares. Transactions in capital shares for each class were as follows:
| SHARES | AMOUNT | |||||||||||||||||||
| Year Ended December 31, 2019 | Year Ended December 31, 2018 | Year Ended December 31, 2019 | Year Ended December 31, 2018 | |||||||||||||||||
Class A | ||||||||||||||||||||
Shares sold | 3,650 | 5,972 | $ | 46,170 | $ | 76,807 | ||||||||||||||
Shares issued in reinvestment of dividends and distributions | 618 | 573 | 7,906 | 7,345 | ||||||||||||||||
Shares redeemed | (5,604 | ) | (1,907 | ) | (71,327 | ) | (24,051 | ) | ||||||||||||
|
|
|
|
|
|
|
| |||||||||||||
Net increase (decrease) | (1,336 | ) | 4,638 | $ | (17,251 | ) | $ | 60,101 | ||||||||||||
|
|
|
|
|
|
|
| |||||||||||||
Class B | ||||||||||||||||||||
Shares sold | 2,194,218 | 3,742,997 | $ | 28,084,156 | $ | 47,716,084 | ||||||||||||||
Shares issued in reinvestment of dividends and distributions | 837,008 | 797,468 | 10,638,376 | 10,143,788 | ||||||||||||||||
Shares redeemed | (5,568,513 | ) | (6,011,432 | ) | (70,959,170 | ) | (76,018,482 | ) | ||||||||||||
|
|
|
|
|
|
|
| |||||||||||||
Net decrease | (2,537,287 | ) | (1,470,967 | ) | $ | (32,236,638 | ) | $ | (18,158,610 | ) | ||||||||||
|
|
|
|
|
|
|
| |||||||||||||
At December 31, 2019, certain shareholders of the Portfolio owned 91% in aggregate of the Portfolio’s outstanding shares. Significant transactions by such shareholders, if any, may impact the Portfolio’s performance.
NOTE G: Risks Involved in Investing in the Portfolio
Interest Rate Risk—Changes in interest rates will affect the value of investments in fixed-income securities. When interest rates rise, the value of existing investments in fixed-income securities tends to fall and this decrease in value may not be offset by higher income from new investments. Interest rate risk is generally greater for fixed-income securities with longer maturities or durations.
Credit Risk—An issuer or guarantor of a fixed-income security, or the counterparty to a derivatives or other contract, may be unable or unwilling to make timely payments of interest or principal, or to otherwise honor its obligations. The issuer or guarantor may default, causing a loss of the full principal amount of a security and accrued interest. The degree of risk for a particular security may be reflected in its credit rating. There is the possibility that the credit rating of a fixed-income security may be downgraded after purchase, which may adversely affect the value of the security. Investments in fixed-income securities with lower ratings tend to have a higher probability that an issuer will default or fail to meet its payment obligations.
Allocation Risk—The allocation of investments among different global asset classes may have a significant effect on the Portfolio’s net asset value, or NAV, when one of these asset classes is performing more poorly than others. As both the direct investments and derivatives positions will be periodically adjusted to reflect the Adviser’s view of market and economic conditions, there will be transaction costs that may be, over time, significant. In addition, there is a risk that certain asset allocation decisions may not achieve the desired results and, as a result, the Portfolio may incur significant losses.
Foreign(Non-U.S.) Risk—Investments in securities ofnon-U.S. issuers may involve more risk than those of U.S. issuers. These securities may fluctuate more widely in price and may be more difficult to trade or dispose of due to adverse market, economic, political, regulatory or other factors.
Emerging Market Risk—Investments in emerging market countries may have more risk because the markets are less developed and less liquid, and because these investments may be subject to increased economic, political, regulatory or other uncertainties.
Currency Risk—Fluctuations in currency exchange rates may negatively affect the value of the Portfolio’s investments or reduce its returns.
ETF Risk—Exchange-traded funds, or ETFs, are investment companies. When the Portfolio invests in an ETF, the Portfolio bears its share of the ETF’s expenses and runs the risk that the ETF may not achieve its investment objective.
43
| DYNAMIC ASSET ALLOCATION PORTFOLIO | ||
| NOTES TO FINANCIAL STATEMENTS | ||
| (continued) | AB Variable Products Series Fund | |
Derivatives Risk—The Portfolio may enter into derivative transactions such as forwards, options, futures and swaps. Derivatives may be illiquid, difficult to price, and leveraged so that small changes may produce disproportionate losses for the Portfolio, and subject to counterparty risk to a greater degree than more traditional investments. Derivatives may result in significant losses, including losses that are far greater than the value of the derivatives reflected on the statement of assets and liabilities.
Leverage Risk—When the Portfolio borrows money or otherwise leverages its investments, its performance may be volatile because leverage tends to exaggerate the effect of any increase or decrease in the value of the Portfolio’s investments. The Portfolio may create leverage through the use of reverse repurchase arrangements, forward currency exchange contracts, forward commitments, dollar rolls or futures or by borrowing money. The use of other types of derivative instruments by the Portfolio, such as options and swaps, may also result in a form of leverage. Leverage may result in higher returns to the Portfolio than if the Portfolio were not leveraged, but may also adversely affect returns, particularly if the market is declining.
Illiquid Investments Risk—Illiquid investment risk exists when certain investments are or become difficult to purchase or sell. Difficulty in selling such investments may result in sales at disadvantageous prices affecting the value of your investment in the Portfolio. Causes of illiquid investments risk may include low trading volumes, large positions and heavy redemptions of Portfolio shares.
Capitalization Risk—Investments in small- andmid-capitalization companies may be more volatile than investments in large-capitalization companies. Investments in small-capitalization companies may have additional risks because these companies have limited product lines, markets or financial resources.
Real Estate Risk—The Portfolio’s investments in the real estate securities have many of the same risks as direct ownership of real estate, including the risk that the value of real estate could decline due to a variety of factors that affect the real estate market generally. Investments in real estate investment trusts, or “REITs”, may have additional risks. REITs are dependent on the capability of their managers, may have limited diversification, and could be significantly affected by changes in taxes.
LIBOR Risk—The Portfolio may invest in certain debt securities, derivatives or other financial instruments that utilize the London Interbank Offered Rate, or “LIBOR,” as a “benchmark” or “reference rate” for various interest rate calculations. In July 2017, the United Kingdom Financial Conduct Authority, which regulates LIBOR, announced a desire to phase out the use of LIBOR by the end of 2021. Although financial regulators and industry working groups have suggested alternative reference rates, such as European Interbank Offer Rate (“EURIBOR”), Sterling Overnight Interbank Average Rate (“SONIA”) and Secured Overnight Financing Rate (“SOFR”), global consensus on alternative rates is lacking and the process for amending existing contracts or instruments to transition away from LIBOR remains unclear. The elimination of LIBOR or changes to other reference rates or any other changes or reforms to the determination or supervision of reference rates could have an adverse impact on the market for, or value of, any securities or payments linked to those reference rates, which may adversely affect the Portfolio’s performance and/or net asset value. Uncertainty and risk also remain regarding the willingness and ability of issuers and lenders to include revised provisions in new and existing contracts or instruments. Consequently, the transition away from LIBOR to other reference rates may lead to increased volatility and illiquidity in markets that are tied to LIBOR, fluctuations in values of LIBOR-related investments or investments in issuers that utilize LIBOR, increased difficulty in borrowing or refinancing and diminished effectiveness of hedging strategies, adversely affecting the Portfolio’s performance. Furthermore, the risks associated with the expected discontinuation of LIBOR and transition may be exacerbated if the work necessary to effect an orderly transition to an alternative reference rate is not completed in a timely manner. Because the usefulness of LIBOR as a benchmark could deteriorate during the transition period, these effects could occur prior to the end of 2021.
Indemnification Risk—In the ordinary course of business, the Portfolio enters into contracts that contain a variety of indemnifications. The Portfolio’s maximum exposure under these arrangements is unknown. However, the Portfolio has not had prior claims or losses pursuant to these indemnification provisions and expects the risk of loss thereunder to be remote. Therefore, the Portfolio has not accrued any liability in connection with these indemnification provisions.
NOTE H: Joint Credit Facility
A number ofopen-end mutual funds managed by the Adviser, including the Portfolio, participate in a $325 million revolving credit facility (the “Facility”) intended to provide short-term financing, if necessary, subject to certain restrictions in connection with abnormal redemption activity. Commitment fees related to the Facility are paid by the participating funds and are included in miscellaneous expenses in the statement of operations. The Portfolio did not utilize the Facility during the year ended December 31, 2019.
44
| AB Variable Products Series Fund | ||
NOTE I: Distributions to Shareholders
The tax character of distributions paid during the fiscal years ended December 31, 2019 and December 31, 2018 were as follows:
| 2019 | 2018 | |||||||
Distributions paid from: | ||||||||
Ordinary income | $ | 10,014,238 | $ | 9,401,635 | ||||
|
|
|
| |||||
Net long-term capital gains | 632,044 | 749,498 | ||||||
|
|
|
| |||||
Total taxable distributions paid | $ | 10,646,282 | $ | 10,151,133 | ||||
|
|
|
| |||||
As of December 31, 2019, the components of accumulated earnings/(deficit) on a tax basis were as follows:
Undistributed ordinary income | $ | 8,086,969 | ||
Accumulated capital and other losses | (2,402,670 | )(a) | ||
Unrealized appreciation/(depreciation) | 110,373,391 | (b) | ||
|
| |||
Total accumulated earnings/(deficit) | $ | 116,057,690 | ||
|
|
| (a) | As of December 31, 2019, the Portfolio had a net capital loss carryforward of $1,502,089. As of December 31, 2019, the cumulative deferred loss on straddles was $900,581. |
| (b) | The differences between book-basis and tax-basis unrealized appreciation/(depreciation) are attributable primarily to the recognition for tax purposes of unrealized gains/losses on certain derivative instruments, return of capital distributions received from underlying securities, the tax treatment of passive foreign investment companies (PFICs), the tax deferral of losses on wash sales, the tax treatment of partnership investments, and corporate restructuring. |
For tax purposes, net realized capital losses may be carried over to offset future capital gains, if any. Funds are permitted to carry forward capital losses for an indefinite period, and such losses will retain their character as either short-term or long-term capital losses. As of December 31, 2019, the Portfolio had a net short-term capital loss carryforward of $1,502,089, which may be carried forward for an indefinite period.
During the current fiscal year, there were no permanent differences that resulted in adjustments to distributable earnings or additional paid-in capital.
NOTE J: Recent Accounting Pronouncements
In March 2017, the Financial Accounting Standards Board issued an Accounting Standards Update, ASU2017-08, Receivables—Nonrefundable Fees and Other Costs (Subtopic310-20), Premium Amortization on Purchased Callable Debt Securities which amends the amortization period for certain purchased callable debt securities held at a premium, shortening such period to the earliest call date. ASU2017-08 does not require any accounting change for debt securities held at a discount; the discount continues to be amortized to maturity. ASU2017-08 is effective for fiscal years, and interim periods within those fiscal years, beginning after December 15, 2018. The Portfolio has adopted ASU2017-08, which did not have a material impact on the Portfolio’s financial position or the results of its operations, and had no impact on the Portfolio’s net assets.
In August 2018, the Financial Accounting Standards Board issued an Accounting Standards Update, ASU2018-13, Fair Value Measurement (Topic 820), Disclosure Framework—Changes to the Disclosure Requirements for Fair Value Measurement which removes, modifies and adds disclosures to Topic 820. The amendments in this ASU2018-13 (“ASU”) apply to all entities that are required, under existing U.S. GAAP, to make disclosures about recurring or nonrecurring fair value measurements. The amendments in this ASU are effective for all entities for fiscal years, and interim periods within those fiscal years, beginning after December 15, 2019. Management has evaluated the impact of the amendments and elected to early adopt the ASU. The adoption of this ASU did not have a material impact on the disclosure and presentation of the financial statements of the Portfolio.
NOTE K: Subsequent Events
Management has evaluated subsequent events for possible recognition or disclosure in the financial statements through the date the financial statements are issued. Management has determined that there are no material events that would require disclosure in the Portfolio’s financial statements through this date.
45
| DYNAMIC ASSET ALLOCATION PORTFOLIO | ||
| FINANCIAL HIGHLIGHTS | AB Variable Products Series Fund | |
Selected Data For A Share Of Capital Stock Outstanding Throughout Each Period
| CLASS A | ||||||||||||||||||||
| Year Ended December 31, | ||||||||||||||||||||
| 2019 | 2018 | 2017 | 2016 | 2015 | ||||||||||||||||
Net asset value, beginning of period | $11.91 | $13.07 | $11.63 | $11.33 | $11.74 | |||||||||||||||
|
|
|
|
|
|
|
|
|
| |||||||||||
Income From Investment Operations | ||||||||||||||||||||
Net investment income (a) | .23 | (b) | .20 | (b) | .17 | (b) | .13 | (b)† | .08 | |||||||||||
Net realized and unrealized gain (loss) on investment and foreign currency transactions | 1.60 | (1.11 | ) | 1.52 | .27 | (.19 | ) | |||||||||||||
Contributions from Affiliates | –0 | – | –0 | – | .00 | (c) | –0 | – | –0 | – | ||||||||||
|
|
|
|
|
|
|
|
|
| |||||||||||
Net increase (decrease) in net asset value from operations | 1.83 | (.91 | ) | 1.69 | .40 | (.11 | ) | |||||||||||||
|
|
|
|
|
|
|
|
|
| |||||||||||
Less: Dividends and Distributions | ||||||||||||||||||||
Dividends from net investment income | (.27 | ) | (.23 | ) | (.25 | ) | (.10 | ) | (.10 | ) | ||||||||||
Distributions from net realized gain on investment transactions | (.01 | ) | (.02 | ) | –0 | – | (.00 | )(c) | (.20 | ) | ||||||||||
|
|
|
|
|
|
|
|
|
| |||||||||||
Total dividends and distributions | (.28 | ) | (.25 | ) | (.25 | ) | (.10 | ) | (.30 | ) | ||||||||||
|
|
|
|
|
|
|
|
|
| |||||||||||
Net asset value, end of period | $13.46 | $11.91 | $13.07 | $11.63 | $11.33 | |||||||||||||||
|
|
|
|
|
|
|
|
|
| |||||||||||
Total Return | ||||||||||||||||||||
Total investment return based on net asset value (d) | 15.51 | % | (7.07 | )% | 14.67 | % | 3.59 | %† | (1.09 | )% | ||||||||||
Ratios/Supplemental Data | ||||||||||||||||||||
Net assets, end of period (000’s omitted) | $383 | $355 | $328 | $303 | $400 | |||||||||||||||
Ratio to average net assets of: | ||||||||||||||||||||
Expenses, net of waivers/reimbursements (e)‡ | .80 | % | .78 | % | .77 | % | .79 | % | .83 | % | ||||||||||
Expenses, before waivers/reimbursements (e)‡ | .80 | % | .79 | % | .78 | % | .81 | % | .83 | % | ||||||||||
Net investment income | 1.78 | %(b) | 1.60 | %(b) | 1.39 | %(b) | 1.11 | %(b)† | .67 | % | ||||||||||
Portfolio turnover rate | 19 | % | 24 | % | 20 | % | 64 | % | 93 | % | ||||||||||
‡ Expense ratios exclude the estimated acquired fund fees of the affiliated/unaffiliated underlying |
| |||||||||||||||||||
portfolios | .02 | % | .03 | % | .04 | % | .04 | % | .03 | % | ||||||||||
See footnote summary on page 47.
46
| AB Variable Products Series Fund | ||
Selected Data For A Share Of Capital Stock Outstanding Throughout Each Period
| CLASS B | ||||||||||||||||||||
| Year Ended December 31, | ||||||||||||||||||||
| 2019 | 2018 | 2017 | 2016 | 2015 | ||||||||||||||||
Net asset value, beginning of period | $11.82 | $12.98 | $11.56 | $11.26 | $11.68 | |||||||||||||||
|
|
|
|
|
|
|
|
|
| |||||||||||
Income From Investment Operations | ||||||||||||||||||||
Net investment income (a) | .19 | (b) | .17 | (b) | .14 | (b) | .10 | (b)† | .05 | |||||||||||
Net realized and unrealized gain (loss) on investment and foreign currency transactions | 1.60 | (1.11 | ) | 1.50 | .27 | (.19 | ) | |||||||||||||
Contributions from Affiliates | –0 | – | –0 | – | .00 | (c) | –0 | – | –0 | – | ||||||||||
|
|
|
|
|
|
|
|
|
| |||||||||||
Net increase (decrease) in net asset value from operations | 1.79 | (.94 | ) | 1.64 | .37 | (.14 | ) | |||||||||||||
|
|
|
|
|
|
|
|
|
| |||||||||||
Less: Dividends and Distributions | ||||||||||||||||||||
Dividends from net investment income | (.24 | ) | (.20 | ) | (.22 | ) | (.07 | ) | (.08 | ) | ||||||||||
Distributions from net realized gain on investment transactions | (.01 | ) | (.02 | ) | –0 | – | (.00 | )(c) | (.20 | ) | ||||||||||
|
|
|
|
|
|
|
|
|
| |||||||||||
Total dividends and distributions | (.25 | ) | (.22 | ) | (.22 | ) | (.07 | ) | (.28 | ) | ||||||||||
|
|
|
|
|
|
|
|
|
| |||||||||||
Net asset value, end of period | $13.36 | $11.82 | $12.98 | $11.56 | $11.26 | |||||||||||||||
|
|
|
|
|
|
|
|
|
| |||||||||||
Total Return | ||||||||||||||||||||
Total investment return based on net asset value (d) | 15.24 | % | (7.35 | )% | 14.32 | % | 3.37 | %† | (1.30 | )% | ||||||||||
Ratios/Supplemental Data | ||||||||||||||||||||
Net assets, end of period (000’s omitted) | $568,985 | $533,467 | $604,703 | $558,725 | $511,164 | |||||||||||||||
Ratio to average net assets of: | ||||||||||||||||||||
Expenses, net of waivers/reimbursements (e)‡ | 1.05 | % | 1.03 | % | 1.03 | % | 1.05 | % | 1.08 | % | ||||||||||
Expenses, before waivers/reimbursements (e)‡ | 1.05 | % | 1.04 | % | 1.04 | % | 1.07 | % | 1.08 | % | ||||||||||
Net investment income | 1.51 | %(b) | 1.35 | %(b) | 1.15 | %(b) | .89 | %(b)† | .43 | % | ||||||||||
Portfolio turnover rate | 19 | % | 24 | % | 20 | % | 64 | % | 93 | % | ||||||||||
‡ Expense ratios exclude the estimated acquired fund fees of the affiliated/unaffiliated underlying |
| |||||||||||||||||||
portfolios | .02 | % | .03 | % | .04 | % | .04 | % | .03 | % | ||||||||||
| (a) | Based on average shares outstanding. |
| (b) | Net of expenses waived/reimbursed by the Adviser. |
| (c) | Amount is less than $.005. |
| (d) | Total investment return is calculated assuming an initial investment made at the net asset value at the beginning of the period, reinvestment of all dividends and distributions at net asset value during the period, and redemption on the last day of the period. Total return does not reflect (i) insurance company’s separate account related expense charges and (ii) the deductions of taxes that a shareholder would pay on Portfolio distributions or the redemption of Portfolio shares. Total investment return calculated for a period of less than one year is not annualized. |
| (e) | In connection with the Portfolio’s investments in affiliated underlying portfolios, the Portfolio incurs no direct expenses, but bears proportionate shares of the fees and expenses (i.e., operating, administrative and investment advisory fees) of the affiliated underlying portfolios. The Adviser has contractually agreed to waive its fees from the Portfolio in an amount equal to the Portfolio’s pro rata share of certain acquired fund fees and expenses, and for the years ended December 31, 2018, December 31, 2017 and December 31, 2016, such waiver amounted to .01%, .01% and .02%, respectively. |
| † | For the year ended December 31, 2016, the amount includes a refund for overbilling of prior years’ custody out of pocket fees as follows: |
Net Investment | Net Investment | Total | ||
| $.00005 | .0004% | .0004% |
See notes to financial statements.
47
| REPORT OF INDEPENDENT REGISTERED | ||
| PUBLIC ACCOUNTING FIRM | AB Variable Products Series Fund | |
To the Shareholders and the Board of Directors of AB Dynamic Asset Allocation Portfolio:
Opinion on the Financial Statements
We have audited the accompanying statement of assets and liabilities of AB Dynamic Asset Allocation Portfolio (the “Portfolio”) (one of the portfolios constituting AB Variable Products Series Fund, Inc. (the “Fund”)), including the portfolio of investments, as of December 31, 2019, and the related statement of operations for the year then ended, the statements of changes in net assets for each of the two years in the period then ended, the financial highlights for each of the five years in the period then ended and the related notes (collectively referred to as the “financial statements”). In our opinion, the financial statements present fairly, in all material respects, the financial position of the Portfolio (one of the portfolios constituting AB Variable Products Series Fund, Inc.) at December 31, 2019, the results of its operations for the year then ended, the changes in its net assets for each of the two years in the period then ended and its financial highlights for each of the five years in the period then ended, in conformity with U.S. generally accepted accounting principles.
Basis for Opinion
These financial statements are the responsibility of the Fund’s management. Our responsibility is to express an opinion on the Portfolio’s financial statements based on our audits. We are a public accounting firm registered with the Public Company Accounting Oversight Board (United States) (“PCAOB”) and are required to be independent with respect to the Fund in accordance with the U.S. federal securities laws and the applicable rules and regulations of the Securities and Exchange Commission and the PCAOB.
We conducted our audits in accordance with the standards of the PCAOB. Those standards require that we plan and perform the audit to obtain reasonable assurance about whether the financial statements are free of material misstatement, whether due to error or fraud. The Fund is not required to have, nor were we engaged to perform, an audit of the Fund’s internal control over financial reporting. As part of our audits, we are required to obtain an understanding of internal control over financial reporting, but not for the purpose of expressing an opinion on the effectiveness of the Fund’s internal control over financial reporting. Accordingly, we express no such opinion.
Our audits included performing procedures to assess the risks of material misstatement of the financial statements, whether due to error or fraud, and performing procedures that respond to those risks. Such procedures included examining, on a test basis, evidence regarding the amounts and disclosures in the financial statements. Our procedures included confirmation of securities owned as of December 31, 2019, by correspondence with the custodian and others or by other appropriate auditing procedures where replies from others were not received. Our audits also included evaluating the accounting principles used and significant estimates made by management, as well as evaluating the overall presentation of the financial statements. We believe that our audits provide a reasonable basis for our opinion.

We have served as the auditor of one or more of the AB investment companies since 1968.
New York, New York
February 14, 2020
48
| 2019 FEDERAL TAX INFORMATION (unaudited) | AB Variable Products Series Fund | |
For Federal income tax purposes, the following information is furnished with respect to the distributions paid by the Portfolio during the taxable year ended December 31, 2019. For corporate shareholders, 28.86% of dividends paid qualify for the dividends received deduction.
49
DYNAMIC ASSET ALLOCATION | ||
| PORTFOLIO | AB Variable Products Series Fund | |
| BOARD OF DIRECTORS | ||
Marshall C. Turner, Jr.(1),Chairman Jorge A. Bermudez^ Michael J. Downey(1) Nancy P. Jacklin(1) | Robert M. Keith,President and Carol C. McMullen(1) Garry L. Moody(1) Earl D. Weiner(1) | |
| OFFICERS | ||
Brian T. Brugman(2),Vice President Daniel J. Loewy(2),Vice President Emilie D. Wrapp,Secretary Michael B. Reyes,Senior Analyst | Joseph J. Mantineo,Treasurerand Phyllis J. Clarke,Controller Vincent S. Noto,Chief Compliance Officer | |
| CUSTODIAN AND ACCOUNTING AGENT | LEGAL COUNSEL | |
| State Street Bank and Trust Company | Seward & Kissel LLP | |
State Street Corporation CCB/5 1 Iron Street | One Battery Park Plaza New York, NY 10004 | |
| Boston, MA 02210 | ||
| DISTRIBUTOR | TRANSFER AGENT | |
| AllianceBernstein Investments, Inc. | AllianceBernstein Investor Services, Inc. | |
| 1345 Avenue of the Americas | P.O. Box 786003 | |
| New York, NY 10105 | San Antonio, TX 78278-6003 | |
| Toll-Free (800) 221-5672 | ||
| INDEPENDENT REGISTERED PUBLIC ACCOUNTING FIRM | ||
| Ernst & Young LLP | ||
| 5 Times Square | ||
| New York, NY 10036 |
| (1) | Member of the Audit Committee, the Governance and Nominating Committee, and the Independent Directors Committee. |
| (2) | The day-to-day management of, and investment decisions for, the Portfolio’s portfolio are made by the Adviser’s Dynamic Asset Allocation Team. Messrs. Brugman and Loewy are the investment professionals primarily responsible for the day-to-day management of the Portfolio’s portfolio. |
| ^ | Mr. Bermudez will be a member of the Audit Committee, the Governance and Nominating Committee, and the Independent Directors Committee when he joins the Board on January 1, 2020. |
50
| DYNAMIC ASSET ALLOCATION PORTFOLIO | ||
| MANAGEMENT OF THE FUND | AB Variable Products Series Fund | |
Board of Directors Information
The business and affairs of the Fund are managed under the direction of the Board of Directors. Certain information concerning the Fund’s Directors is set forth below.
| NAME, ADDRESS*, AGE, (YEAR FIRST ELECTED**) | PRINCIPAL OCCUPATION(S) DURING PAST FIVE YEARS AND OTHER INFORMATION*** | PORTFOLIOS DIRECTOR | OTHER PUBLIC DIRECTOR | |||||
| INTERESTED DIRECTOR | ||||||||
| Robert M. Keith,# 1345 Avenue of the Americas New York, NY 10105 59 (2010) | Senior Vice President of AllianceBernstein L.P. (the “Adviser”) and the head of AllianceBernstein Investments, Inc. (“ABI”) since July 2008; Director of ABI and President of the AB Mutual Funds. Previously, he served as Executive Managing Director of ABI from December 2006 to June 2008. Prior to joining ABI in 2006, Executive Managing Director of Bernstein Global Wealth Management, and prior thereto, Senior Managing Director and Global Head of Client Service and Sales of the Adviser’s institutional investment management business since 2004 . Prior thereto, he was Managing Director and Head of North American Client Service and Sales in the Adviser’s institutional investment management business with which he had been associated since prior to 2004 . | 91 | None | |||||
| INDEPENDENT DIRECTORS | ||||||||
| Marshall C. Turner, Jr.,## Chairman of the Board 78 (2005) | Private Investor since prior to 2015. Former Chairman and CEO of Dupont Photomasks, Inc. (components of semi-conductor manufacturing). He has extensive operating leadership, and venture capital investing experience, including five interim or full-time CEO roles, and prior service as general partner of institutional venture capital partnerships. He also has extensivenon-profit board leadership experience, and currently serves on the boards of two education and science-related non-profit organizations. He has served as a director of one AB Fund since 1992, and director or trustee of all AB Funds since 2005. He has been Chairman of the AB Funds since January 2014, and the Chairman of the Independent Directors Committees of such AB Funds since February 2014. | 91 | Xilinx, Inc. (programmable logic semi-conductors) since 2007 | |||||
| Jorge A. Bermudez^ 68 (2020) | Private investor since prior to 2015. Former Chief Risk Officer of Citigroup, Inc., a global financial services company, from November 2007 to March 2008, Chief Executive Officer of Citigroup’s Commercial Business Group in North America and Citibank Texas from 2005 to 2007, and a variety of other executive and leadership roles at various businesses within Citigroup prior to then; Chairman (2018) of the Texas A&M Foundation Board of Trustees (Trustee since 2013) and Chairman of the Smart Grid Center Board at Texas A&M University since 2012; director of, among others, Citibank N.A. from 2005 to 2008, the Federal Reserve Bank of Dallas, Houston Branch from 2009 to 2011, the Federal Reserve Bank of Dallas from 2011 to 2017, and the Electric Reliability Council of Texas from 2010 to 2016. He has served as director or trustee of the AB Funds since 2020. | 91 | Moody’s Corporation since April 2011 | |||||
51
| DYNAMIC ASSET ALLOCATION PORTFOLIO | ||
| MANAGEMENT OF THE FUND | ||
| (continued) | AB Variable Products Series Fund | |
| NAME, ADDRESS*, AGE, (YEAR FIRST ELECTED**) | PRINCIPAL OCCUPATION(S) DURING PAST FIVE YEARS AND OTHER INFORMATION*** | PORTFOLIOS DIRECTOR | OTHER PUBLIC DIRECTOR | |||||
INDEPENDENT DIRECTORS (continued) | ||||||||
| Michael J. Downey,## 76 (2005) | Private Investor since prior to 2015. Formerly, Chairman of The Asia Pacific Fund, Inc. (registered investment company) since prior to 2015 until January 2019. From 1987 until 1993, Chairman and CEO of Prudential Mutual Fund Management, director of the Prudential mutual funds, and member of the Executive Committee of Prudential Securities, Inc. He has served as a director or trustee of the AB Funds since 2005. | 91 | None | |||||
| Nancy P. Jacklin,## 71 (2006) | Private Investor since prior to 2015. Professorial Lecturer at the Johns Hopkins School of Advanced International Studies (2008–2015). U.S. Executive Director of the International Monetary Fund (which is responsible for ensuring the stability of the international monetary system), (December 2002–May 2006); Partner, Clifford Chance (1992–2002); Sector Counsel, International Banking and Finance, and Associate General Counsel, Citicorp (1985–1992); Assistant General Counsel (International), Federal Reserve Board of Governors (1982–1985); and Attorney Advisor, U.S. Department of the Treasury (1973–1982). Member of the Bar of the District of Columbia and of New York; and member of the Council on Foreign Relations. She has served as a director or trustee of the AB Funds since 2006 and has been Chair of the Governance and Nominating Committees of the AB Funds since August 2014. | 91 | None | |||||
| Carol C. McMullen,## 64 (2016) | Managing Director of Slalom Consulting (consulting) since 2014, private investor and member of the Advisory Board of Butcher Box (since 2018). Formerly, member, Partners Healthcare Investment Committee (2010–2019); Director of Norfolk & Dedham Group (mutual property and casualty insurance) from 2011 until November 2016; Director of Partners Community Physicians Organization (healthcare) from 2014 until December 2016; and Managing Director of The Crossland Group (consulting) from 2012 until 2013. She has held a number of senior positions in the asset and wealth management industries, including at Eastern Bank (where her roles included President of Eastern Wealth Management), Thomson Financial (Global Head of Sales for Investment Management), and Putnam Investments (where her roles included Chief Investment Officer, Core and Growth and Head of Global Investment Research). She has served on a number of private company andnon-profit boards, and as a director or trustee of the AB Funds since June 2016. | 91 | None | |||||
52
| AB Variable Products Series Fund | ||
| NAME, ADDRESS*, AGE, (YEAR FIRST ELECTED**) | PRINCIPAL OCCUPATION(S) DURING PAST FIVE YEARS AND OTHER INFORMATION*** | PORTFOLIOS DIRECTOR | OTHER PUBLIC DIRECTOR | |||||
INDEPENDENT DIRECTORS (continued) | ||||||||
| Garry L. Moody,## 67 (2008) | Formerly, Partner, Deloitte & Touche LLP (1995–2008) where he held a number of senior positions, including Vice Chairman, and U.S. and Global Investment Management Practice Managing Partner; President, Fidelity Accounting and Custody Services Company (1993–1995), where he was responsible for accounting, pricing, custody and reporting for the Fidelity mutual funds; and Partner, Ernst & Young LLP (1975–1993), where he served as the National Director of Mutual Fund Tax Services and Managing Partner of its Chicago Office Tax department. He is a member of the Trustee Advisory Board of BoardIQ, a biweekly publication focused on issues and news affecting directors of mutual funds. He is also a member of the Investment Company Institute’s Board of Governors and the Independent Directors Council Governing Council. He has served as a director or trustee, and as Chairman of the Audit Committees, of the AB Funds since 2008. | 91 | None | |||||
| Earl D. Weiner,## 80 (2007) | Senior Counsel since 2017, Of Counsel from 2007 to 2016, and Partner prior to then, of the law firm Sullivan & Cromwell LLP. He is a former member of the ABA Federal Regulation of Securities Committee Task Force to draft editions of the Fund Director’s Guidebook. He also serves as a director or trustee of variousnon-profit organizations and has served as Chairman or Vice Chairman of a number of them. He has served as a director or trustee of the AB Funds since 2007 and served as Chairman of the Governance and Nominating Committees of the AB Funds from 2007 until August 2014. | 91 | None | |||||
| * | The address for each of the Fund’s disinterested Directors is c/o AllianceBernstein L.P., Attention: Legal & Compliance Department—Mutual Fund Legal, 1345 Avenue of the Americas, New York, NY 10105. |
| ** | There is no stated term of office for the Fund’s Directors. |
| *** | The information above includes each Director’s principal occupation during the last five years and other information relating to the experience, attributes and skills relevant to each Director’s qualifications to serve as a Director, which led to the conclusion that each Director should serve as a Director for the Fund. |
| # | Mr. Keith is an “interested person” of the Fund, as defined in the 1940 Act, due to his position as a Senior Vice President of the Adviser. |
| ## | Member of the Audit Committee, the Governance and Nominating Committee, and the Independent Directors Committee. |
| ^ | Mr. Bermudez will be a member of the Audit Committee, the Governance and Nominating Committee, and the Independent Directors Committee when he joins the Board on January 1, 2020. |
53
| DYNAMIC ASSET ALLOCATION PORTFOLIO | ||
| MANAGEMENT OF THE FUND | ||
| (continued) | AB Variable Products Series Fund | |
Officer Information
Certain information concerning the Portfolio’s Officers is listed below.
| NAME, ADDRESS* AND AGE | PRINCIPAL POSITION(S) HELD WITH FUND | PRINCIPAL OCCUPATION DURING PAST FIVE (5) YEARS | ||
Robert M. Keith 59 | President and Chief Executive Officer | See biography above. | ||
Brian T. Brugman 39 | Vice President | Senior Vice President of the Adviser**, with which he has been associated since prior to 2015. | ||
Daniel J. Loewy 45 | Vice President | Senior Vice President of the Adviser**, with which he has been associated since prior to 2015. He is also Chief Investment Officer and Head of Multi-Asset Solutions and Chief Investment Officer for Dynamic Asset Allocation. | ||
Emilie D. Wrapp 64 | Secretary | Senior Vice President, Assistant General Counsel, and Assistant Secretary of ABI**, with which she has been associated since prior to 2015. | ||
Michael B. Reyes 43 | Senior Analyst | Vice President of the Adviser**, with which he has been associated since prior to 2015. | ||
Joseph J. Mantineo 60 | Treasurer and Chief Financial Officer | Senior Vice President of AllianceBernstein Investor Services, Inc. (“ABIS”)**, with which he has been associated since prior to 2015. | ||
Phyllis J. Clarke 59 | Controller | Vice President of ABIS**, with which she has been associated since prior to 2015. | ||
Vincent S. Noto 55 | Chief Compliance Officer | Senior Vice President since 2015 and Mutual Fund Chief Compliance Officer of the Adviser** since prior to 2015. |
| * | The address for each of the Portfolio’s Officers is 1345 Avenue of the Americas, New York, NY 10105. |
| ** | The Adviser, ABIS and ABI are affiliates of the Fund. |
| The Fund’s Statement of Additional Information (“SAI”) has additional information about the Fund’s Directors and Officers and is available without charge upon request. Contact your financial representative or the Adviser at(800) 227-4618, or visit www.abfunds.com, for a free prospectus or SAI. |
54
| DYNAMIC ASSET ALLOCATION PORTFOLIO | ||
| CONTINUANCE DISCLOSURE | AB Variable Products Series Fund | |
INFORMATION REGARDING THE REVIEW AND APPROVAL OF THE FUND’S ADVISORY AGREEMENT
The disinterested directors (the “directors”) of AB Variable Products Series Fund, Inc. (the “Company”) unanimously approved the continuance of the Company’s Advisory Agreement with the Adviser in respect of AB Dynamic Asset Allocation Portfolio (the “Fund”) at a meeting held onJuly 30-31, 2019 (the “Meeting”).
Prior to approval of the continuance of the Advisory Agreement, the directors had requested from the Adviser, and received and evaluated, extensive materials. They reviewed the proposed continuance of the Advisory Agreement with the Adviser and with experienced counsel who are independent of the Adviser, who advised on the relevant legal standards. The directors also reviewed additional materials, including comparative analytical data prepared by the Senior Analyst for the Fund. The directors also discussed the proposed continuance in private sessions with counsel.
The directors considered their knowledge of the nature and quality of the services provided by the Adviser to the Fund gained from their experience as directors or trustees of most of the registered investment companies advised by the Adviser, their overall confidence in the Adviser’s integrity and competence they have gained from that experience, the Adviser’s initiative in identifying and raising potential issues with the directors and its responsiveness, frankness and attention to concerns raised by the directors in the past, including the Adviser’s willingness to consider and implement organizational and operational changes designed to improve investment results and the services provided to the AB Funds. The directors noted that they have four regular meetings each year, at each of which they review extensive materials and information from the Adviser, including information on the investment performance of the Fund and the underlying fund advised by the Adviser in which the Fund invests.
The directors also considered all factors they believed relevant, including the specific matters discussed below. During the course of their deliberations, the directors evaluated, among other things, the reasonableness of the advisory fee. The directors did not identify any particular information that wasall-important or controlling, and different directors may have attributed different weights to the various factors. The directors determined that the selection of the Adviser to manage the Fund and the overall arrangements between the Fund and the Adviser, as provided in the Advisory Agreement, including the advisory fee, were fair and reasonable in light of the services performed, expenses incurred and such other matters as the directors considered relevant in the exercise of their business judgment. The material factors and conclusions that formed the basis for the directors’ determinations included the following:
Nature, Extent and Quality of Services Provided
The directors considered the scope and quality of services provided by the Adviser under the Advisory Agreement, including the quality of the investment research capabilities of the Adviser and the other resources it has dedicated to performing services for the Fund. The directors noted that the Adviser from time to time reviews the Fund’s investment strategies and from time to time proposes changes intended to improve the Fund’s relative or absolute performance for the directors’ consideration. They also noted the professional experience and qualifications of the Fund’s portfolio management team and other senior personnel of the Adviser. The directors also considered that the Advisory Agreement provides that the Fund will reimburse the Adviser for the cost to it of providing certain clerical, accounting, administrative and other services to the Fund by employees of the Adviser or its affiliates. Requests for these reimbursements are made on a quarterly basis and subject to approval by the directors. Reimbursements, to the extent requested and paid, result in a higher rate of total compensation from the Fund to the Adviser than the fee rate stated in the Advisory Agreement. The directors noted that the methodology used to determine the reimbursement amounts had been reviewed by an independent consultant retained by the Fund’s former Senior Officer/Independent Compliance Officer. The quality of administrative and other services, including the Adviser’s role in coordinating the activities of the Fund’s other service providers, also was considered. The directors concluded that, overall, they were satisfied with the nature, extent and quality of services provided to the Fund under the Advisory Agreement.
Costs of Services Provided and Profitability
The directors reviewed a schedule of the revenues and expenses and related notes indicating the profitability of the Fund to the Adviser for calendar years 2017 and 2018 that had been prepared with an expense allocation methodology arrived at in consultation with an independent consultant retained by the Fund’s former Senior Officer/Independent Compliance Officer. The directors noted the assumptions and methods of allocation used by the Adviser in preparing fund-specific profitability data and understood that there are a number of potentially acceptable allocation methodologies for information of this type. The directors noted that the profitability information reflected all revenues and expenses of the Adviser’s relationship with the Fund, including those relating to its subsidiaries that provide transfer agency, distribution and brokerage services to the
55
| DYNAMIC ASSET ALLOCATION PORTFOLIO | ||
| CONTINUANCE DISCLOSURE | ||
| (continued) | AB Variable Products Series Fund | |
Fund. The directors recognized that it is difficult to make comparisons of the profitability of the Advisory Agreement with the profitability of fund advisory contracts for unaffiliated funds because comparative information is not generally publicly available and is affected by numerous factors. The directors focused on the profitability of the Adviser’s relationship with the Fund before taxes and distribution expenses. The directors concluded that the Adviser’s level of profitability from its relationship with the Fund was not unreasonable.
Fall-Out Benefits
The directors considered the other benefits to the Adviser and its affiliates from their relationships with the Fund and the underlying fund advised by the Adviser in which the Fund invests, including, but not limited to, benefits relating to soft dollar arrangements (whereby investment advisers receive brokerage and research services from brokers that execute agency transactions for their clients);12b-1 fees and sales charges received by the Fund’s principal underwriter (which is a wholly owned subsidiary of the Adviser) in respect of the Fund’s Class B shares; brokerage commissions paid by the Fund to brokers affiliated with the Adviser; and transfer agency fees paid by the Fund to a wholly owned subsidiary of the Adviser. The directors recognized that the Adviser’s profitability would be somewhat lower without these benefits. The directors understood that the Adviser also might derive reputational and other benefits from its association with the Fund.
Investment Results
In addition to the information reviewed by the directors in connection with the Meeting, the directors receive detailed performance information for the Fund at each regular Board meeting during the year.
At the Meeting, the directors reviewed performance information prepared by an independent service provider (the “15(c) service provider”), showing the performance of the Class A Shares of the Fund against a group of similar funds (“peer group”) and a larger group of similar funds (“peer universe”), each selected by the 15(c) service provider, and information prepared by the Adviser showing performance of the Class A Shares against a broad-based securities market index, in each case for the1-,3- and5-year periods ended May 31, 2019 and (in the case of comparisons with the broad-based securities market index) for the period from inception. Based on their review and their discussion with the Adviser of the reasons for the Fund’s underperformance in the periods reviewed, the directors concluded that the Fund’s investment performance was acceptable.
Advisory Fees and Other Expenses
The directors considered the advisory fee rate payable by the Fund to the Adviser and information prepared by the 15(c) service provider concerning advisory fee rates payable by other funds in the same category as the Fund. The directors recognized that it is difficult to make comparisons of advisory fees because there are variations in the services that are included in the fees paid by other funds. The directors compared the Fund’s contractual advisory fee rate with a peer group median and noted that it was above the median. The directors also took into account the impact on the advisory fee rate of the administrative expense reimbursement paid to the Adviser in the latest fiscal year.
The directors also considered the Adviser’s fee schedule for other clients utilizing investment strategies similar to the Fund’s. For this purpose, they reviewed the relevant advisory fee information from the Adviser’s Form ADV and in a report from the Fund’s Senior Analyst and noted the differences between the Fund’s fee schedule, on the one hand, and the Adviser’s institutional fee schedule and the schedule of fees charged by the Adviser to any offshore funds and for services to anysub-advised funds utilizing investment strategies similar to the Fund’s, on the other. The directors noted that the Adviser may, in some cases, agree to fee rates with large institutional clients that are lower than those reviewed by the directors and that they had previously discussed with the Adviser its policies in respect of such arrangements. The directors previously discussed these matters with an independent fee consultant.
The Adviser reviewed with the directors the significantly greater scope of the services it provides to the Fund relative to institutional, offshore fund andsub-advised fund clients. In this regard, the Adviser noted, among other things, that, compared to institutional and offshore orsub-advisory accounts, the Fund (i) demands considerably more portfolio management, research and trading resources due to significantly higher daily cash flows; (ii) has more tax and regulatory restrictions and compliance obligations; (iii) must prepare and file or distribute regulatory and other communications about fund operations; and (iv) must provide shareholder servicing to retail investors. The Adviser also reviewed the greater legal risks presented by the large and changing population of Fund shareholders who may assert claims against the Adviser in individual or class actions, and the greater entrepreneurial risk in offering new fund products, which require substantial investment to launch, may not succeed, and generally must be priced to compete with larger, more established funds resulting in lack of profitability to the Adviser until a new fund achieves scale. In light of the substantial differences in services rendered by the
56
| AB Variable Products Series Fund | ||
Adviser to institutional, offshore fund andsub-advised fund clients as compared to the Fund, and the different risk profile, the directors considered these fee comparisons inapt and did not place significant weight on them in their deliberations.
The directors noted that the Fund invests in shares of exchange-traded funds (“ETFs”), subject to the restrictions and limitations of the Investment Company Act of 1940 as these may be varied as a result of exemptive orders issued by the SEC. The directors also noted that ETFs pay advisory fees pursuant to their advisory contracts, and that the Adviser had provided, and they had reviewed, information about the expense ratios of the relevant ETFs. The directors concluded, based on the Adviser’s explanation of how it uses ETFs when they are the most cost-effective way to obtain desired exposures, in some cases pending purchases of underlying securities, that the advisory fee for the Fund is for services that are in addition to, rather than duplicative of, the services provided under the advisory contracts of the ETFs.
In connection with their review of the Fund’s advisory fee, the directors also considered the total expense ratio of the Class A shares of the Fund in comparison to a peer group and a peer universe selected by the 15(c) service provider. The Class A expense ratio of the Fund was based on the Fund’s latest fiscal year and the directors considered the Adviser’s expense cap for the Fund. The directors noted that it was likely that the expense ratios of some of the other funds in the Fund’s category were lowered by waivers or reimbursements by those funds’ investment advisers, which in some cases might be voluntary or temporary. The directors view expense ratio information as relevant to their evaluation of the Adviser’s services because the Adviser is responsible for coordinating services provided to the Fund by others. The directors noted that the Fund’s expense ratio was above the medians. After reviewing and discussing the Adviser’s explanations of the reasons for this, the directors concluded that the Fund’s expense ratio was acceptable.
Economies of Scale
The directors noted that the advisory fee schedule for the Fund does not contain breakpoints and that they had previously discussed their strong preference for breakpoints in advisory contracts with the Adviser. The directors took into consideration prior presentations by an independent consultant on economies of scale in the mutual fund industry and for the AB Funds, and presentations from time to time by the Adviser concerning certain of its views on economies of scale. The directors also previously discussed economies of scale with an independent fee consultant. The directors also had requested and received from the Adviser certain updates on economies of scale in advance of the Meeting. The directors believe that economies of scale may be realized (if at all) by the Adviser across a variety of products and services, and not only in respect of a single fund. The directors noted that there is no established methodology for setting breakpoints that give effect to the fund-specific services provided by a fund’s adviser and to the economies of scale that an adviser may realize in its overall mutual fund business or those components of it which directly or indirectly affect a fund’s operations. The directors observed that in the mutual fund industry as a whole, as well as among funds similar to the Fund, there is no uniformity or pattern in the fees and asset levels at which breakpoints (if any) apply. The directors also noted that the advisory agreements for many funds do not have breakpoints at all. The directors informed the Adviser that they would monitor the Fund’s asset level (which was well below the level at which they would anticipate adding an initial breakpoint) and its profitability to the Adviser and anticipated revisiting the question of breakpoints in the future if circumstances warranted doing so.
57
VPS-DAA-0151-1219
DEC 12.31.19

ANNUAL REPORT
AB VARIABLE PRODUCTS SERIES FUND, INC.
| + | GLOBAL RISK ALLOCATION—MODERATE PORTFOLIO |
Beginning on May 1, 2021, as permitted by regulations adopted by the Securities and Exchange Commission, you may not be receiving paper copies of the Portfolio’s shareholder reports from the insurance company that offers your contract unless you specifically request paper copies from the insurance company or from your financial intermediary. Instead of delivering paper copies of the reports, the insurance company may choose to make the reports available on a website, and will notify you by mail each time a report is posted and provide you with a website link to access the report. Instructions for requesting paper copies will be provided by your insurance company.
If you already elected to receive shareholder reports electronically, you will not be affected by this change and you need not take any action. You may elect to receive shareholder reports and other communications from the insurance company or your financial intermediary electronically by following the instructions provided by the insurance company or by contacting your financial intermediary.
You may elect to receive all future reports in paper free of charge from the insurance company. You can inform the insurance company or your financial intermediary that you wish to continue receiving paper copies of your shareholder reports by following the instructions provided by the insurance company or by contacting your financial intermediary. Your election to receive reports in paper will apply to all portfolio companies available under your contract with the insurance company.
Investment Products Offered
| • | Are Not FDIC Insured |
| • | May Lose Value |
| • | Are Not Bank Guaranteed |
AllianceBernstein Investments, Inc. (ABI) is the distributor of the AB family of mutual funds. ABI is a member of FINRA and is an affiliate of AllianceBernstein L.P., the Adviser of the funds.
You may obtain a description of the Fund’s proxy voting policies and procedures, and information regarding how the Fund voted proxies relating to portfolio securities during the most recent12-month period ended June 30, without charge. Simply visit AB’s website at www.abfunds.com or go to the Securities and Exchange Commission’s (the “Commission”) website at www.sec.gov, or call AB at (800) 227 4618.
The Fund files its complete schedule of portfolio holdings with the Commission for the first and third quarters of each fiscal year as an exhibit to its reports on Form N-PORT. The Fund’s Form N-PORT reports are available on the Commission’s website at www.sec.gov. The Fund’s Forms N-PORT may also be reviewed and copied at the Commission’s Public Reference Room in Washington, DC; information on the operation of the Public Reference Room may be obtained by calling (800) SEC 0330.
The [A/B] logo is a registered service mark of AllianceBernstein and AllianceBernstein® is a registered service mark used by permission of the owner, AllianceBernstein L.P.
| GLOBAL RISK ALLOCATION—MODERATE PORTFOLIO | AB Variable Products Series Fund | |
LETTER TO INVESTORS
February 14, 2020
The following is an update of AB Variable Products Series Fund—Global Risk Allocation–Moderate Portfolio (the “Portfolio”) for the annual reporting period ended December 31, 2019.
INVESTMENT OBJECTIVE AND POLICIES
The Portfolio’s investment objective is to seek long-term growth of capital while seeking to limit volatility. In making decisions on the allocation of assets among “growth assets” and “safety assets”, the Adviser will use a risk-weighted allocation methodology based on the expected “tail risk” of each asset class. For purposes of the Portfolio, growth assets include global equities and, at times, high-yield fixed-income securities (commonly known as “junk bonds”), and safety assets include government securities of developed countries. This strategy attempts to provide investors with favorable long-term total return while minimizing exposure to material or “tail” losses. To execute this strategy, the percentage loss that will constitute a tail loss is calculated for each asset class based on historical market behavior and on a forward-looking basis through options prices. Portfolio assets are then allocated among asset classes so that growth assets contribute the majority of the expected risk of tail loss (“tail risk”) of the Portfolio, and safety assets contribute a lesser amount of tail risk. The Adviser will make frequent adjustments to the Portfolio’s asset class exposures based on these tail risk determinations. To help limit tail risk, the Portfolio will utilize a risk management strategy involving the purchase of put options and sale of call options on equity indices, equity index futures or exchange-traded funds (“ETFs”). The Adviser will on a best efforts basis seek to limit the volatility of the Portfolio to no more than 10% on an annualized basis. Actual results may vary.
The Adviser will also assess tail risk on a security, sector and country basis, and make adjustments to the Portfolio’s allocations within each asset class when practicable. The Portfolio may invest in fixed-income securities with a range of maturities from short- to long-term. The Adviser expects that the Portfolio’s investments in high-yield fixed-income securities will not exceed 10% of the Portfolio’s net assets. The Portfolio’s investments in each asset class will generally be global in nature.
The Adviser expects to utilize a variety of derivatives in its management of the Portfolio, including futures contracts, options, swaps and forwards. Derivatives often provide more efficient and economical exposure to market segments than direct investments, and the Portfolio may utilize derivatives and ETFs to gain exposure to equity and fixed-income asset classes. Because derivatives transactions frequently require cash outlays that are only a small portion of the amount of exposure obtained through the derivative, a portion of the Portfolio’s assets may be held in cash or invested in cash equivalents to cover the Portfolio’s derivatives obligations, such as short-term US government and agency securities, repurchase agreements and money market funds. At times, a combination of direct securities investments and derivatives will be used to gain asset class exposure so that the Portfolio’s aggregate exposure will substantially exceed its net assets (i.e., so that the Portfolio is effectively leveraged).
Currency exchange rate fluctuations can have a dramatic impact on returns. The Adviser may seek to hedge all or a portion of the currency exposure resulting from Portfolio investments through currency-related derivatives, or decide not to hedge this exposure.
INVESTMENT RESULTS
The table on page 5 shows the Portfolio’s performance compared to its primary benchmark, the Morgan Stanley Capital International (“MSCI”) World Index (net, USD hedged) and a 60% / 40% blend of the MSCI World Index (net, USD hedged) and the Bloomberg Barclays Global G7 Treasury Index (USD hedged), for theone-year period ended December 31, 2019, and the period since the Portfolio’s inception on April 28, 2015.
All share classes of the Portfolio underperformed the primary and blended benchmarks over the annual period. The Portfolio’s underperformance versus the primary benchmark is because the Portfolio is diversified in multi-asset exposures and therefore is not 100% invested in global equity, which strongly outperformed all other asset classes over the period.
Relative to the blended benchmark, the Portfolio was overweight equity, which contributed to performance. Within equity investments, an overweight to Europe relative to developed Asia-Pacific ex Japan contributed to performance. Within fixed-income investments, the Portfolio’s duration underweight detracted. The Portfolio’s systematic equity downside protection strategy detracted from performance in a strong equity market period.
During the annual period, the Portfolio utilized derivatives for hedging and investment purposes, including purchased options, written options and written swaptions, which added to absolute returns, while purchased swaptions and variance swaps detracted.
MARKET REVIEW AND INVESTMENT STRATEGY
US and international stocks recorded strong double-digit returns while emerging markets also rallied during the
1
| AB Variable Products Series Fund | ||
annual period ended December 31, 2019. After declining sharply at the end of 2018, equity markets rebounded dramatically in January as strong corporate earnings and optimism about a trade truce between the US and China calmed investors.Trade-war tensions resurfaced, however, and emerging geopolitical pressures drove market volatility. Tariff wars, restrictive monetary policy and a decline in industrial production stoked recessionary fears throughout the global economy. In response, the world’s central banks implemented accommodative monetary policies to help support capital markets. Late in the third quarter, equity market performance was accompanied by a sharp style rotation in the US. Quality-growth and lower-volatility stocks, which had been strong performers, lagged and value stocks outperformed. However, for the most part, growth stocks continued to outperform value over the entire period. From a market-capitalization perspective,large-cap stocks outperformed theirsmall-cap peers. In December, equity markets rallied on news that the US and China had agreed to a preliminaryphase-one trade deal due to be signed in January 2020.
Global fixed-income markets performed strongly over the annual period. The US Federal Reserve lowered interest rates three times beginning in July and increased its balance sheet later in the period to manage liquidity in the repurchase agreement market, effectively capping short-term rates. The European Central Bank reduced rates to a record low in September and announced the resumption of quantitative easing. The Bank of Japan issued guidance for the continuation of low rates and the government implemented a significant fiscal stimulus program in December. Central bankers in numerous other developed and emerging markets lowered interest rates and signaled potential fiscal stimulus measures to boost economic growth. Investor confidence increased after the announcement of aUS-China phase-one trade agreement and indications that the UK would leave the European Union with a clear path for Brexit.
The Portfolio’s Senior Investment Management Team (the “Team”) seeks to allocate a substantial portion of its risk to equity, and the balance to government bonds over time. Within global equity exposure, the Portfolio had overweight positions in European, Japanese and emerging markets, and underweight positions to Asia ex Japan, Canada and US equities, relative to amarket-cap weighted equity index. The Team saw more pronounced headwinds to US equity markets, relative tonon-US developed markets, which was driven by relative valuations and a strong dollar.
For fixed-income investments, the Portfolio had overweight positions in inflation-protected bonds over nominal bonds and underweights in Japanese and European government bonds. The Portfolio hedged most of the foreign currency exposures and adopted explicit downside hedges via option positions.
2
GLOBAL RISK ALLOCATION—MODERATE PORTFOLIO | ||
| DISCLOSURES AND RISKS | AB Variable Products Series Fund | |
Benchmark Disclosure
The MSCI World Index and Bloomberg Barclays Global G7 Treasury Index are unmanaged and do not reflect fees and expenses associated with the active management of a mutual fund portfolio. The MSCI World Index (net, free float-adjusted, market capitalization weighted) represents the equity market performance of developed markets, hedged to the US dollar. The Bloomberg Barclays Global G7 Treasury Index tracks fixed-rate local-currency government debt of investment-grade G7 countries. MSCI makes no express or implied warranties or representations, and shall have no liability whatsoever with respect to any MSCI data contained herein. The MSCI data may not be further redistributed or used as a basis for other indices, any securities or financial products. This report is not approved, reviewed or produced by MSCI. Net returns reflect the reinvestment of dividends after deduction ofnon-US withholding tax. An investor cannot invest directly in an index, and its results are not indicative of the performance for any specific investment, including the Portfolio.
A Word About Risk
Market Risk:The value of the Portfolio’s investments will fluctuate as the stock or bond market fluctuates. The value of its investments may decline, sometimes rapidly and unpredictably, simply because of economic changes or other events that affect large portions of the market.
Allocation Risk:The allocation of investments among asset classes may have a significant effect on the Portfolio’s net asset value (“NAV”) when the asset classes in which the Portfolio has invested more heavily perform worse than the asset classes invested in less heavily.
Interest-Rate Risk:Changes in interest rates will affect the value of investments in fixed-income securities. When interest rates rise, the value of existing investments in fixed-income securities tends to fall and this decrease in value may not be offset by higher income from new investments. Interest-rate risk is generally greater for fixed-income securities with longer maturities or durations.
Credit Risk:An issuer or guarantor of a fixed-income security, or the counterparty to a derivatives or other contract, may be unable or unwilling to make timely payments of interest or principal, or to otherwise honor its obligations. The issuer or guarantor may default, causing a loss of the full principal amount of a security and accrued interest. The degree of risk for a particular security may be reflected in its credit rating. There is the possibility that the credit rating of a fixed-income security may be downgraded after purchase, which may adversely affect the value of the security.
High-Yield Securities Risk:Investments in fixed-income securities with ratings below investment-grade (commonly known as “junk bonds”) tend to have a higher probability that an issuer will default or fail to meet its payment obligations. These securities may be subject to greater price volatility due to such factors as specific corporate developments, interest-rate sensitivity, negative perceptions of the junk bond market generally and less secondary market liquidity.
Foreign(Non-US) Risk:Investments in securities ofnon-US issuers may involve more risk than those of US issuers. These securities may fluctuate more widely in price and may be difficult to trade or dispose of due to adverse market, economic, political, regulatory or other factors.
Currency Risk:Fluctuations in currency exchange rates may negatively affect the value of the Portfolio’s investments or reduce its returns.
Investment in Other Investment Companies Risk: As with other investments, investments in other investment companies, including ETFs, are subject to market and selection risk. In addition, Contractholders of the Portfolio bear both their proportionate share of expenses in the Portfolio (including management fees) and, indirectly, the expenses of the investment companies.
Derivatives Risk:Derivatives may be difficult to price or unwind and leveraged so that small changes may produce disproportionate losses for the Portfolio. Derivatives may also be subject to counterparty risk to a greater degree than more traditional investments. Transactions intended to hedge fluctuations in the values of the Portfolio’s positions will typically limit the opportunity for gain.
Leverage Risk:Because the Portfolio uses leveraging techniques, its NAV may be more volatile because leverage tends to exaggerate the effect of changes in interest rates and any increase or decrease in the value of the Portfolio’s investments.
(Disclosures, Risks and Note about Historical Performance continued on next page)
3
| DISCLOSURES AND RISKS | ||
| (continued) | AB Variable Products Series Fund | |
Illiquid Investments Risk:Illiquid investments risk exists when certain investments are or become difficult to purchase or sell. Difficulty in selling such investments may result in sales at disadvantageous prices affecting the value of your investment in the Portfolio. Causes of illiquid investments risk may include low trading volumes and large positions. Foreign fixed-income securities may have more illiquid investments risk because secondary trading markets for these securities may be smaller and less well-developed and the securities may trade less frequently. Illiquid investments risk may be higher in a rising interest-rate environment, when the value and liquidity of fixed-income securities generally decline.
Non-Diversification Risk:The Portfolio may have more risk because it is“non-diversified”, meaning that it can invest more of its assets in a smaller number of issuers. Accordingly, changes in the value of a single security may have a more significant effect, either negative or positive, on the Portfolio’s NAV.
Management Risk:The Portfolio is subject to management risk because it is an actively managed investment fund. The Adviser will apply its investment techniques and risk analyses in making investment decisions for the Portfolio, but there is no guarantee that its techniques will produce the intended results.
These risks are fully discussed in the Variable Products prospectus. As with all investments, you may lose money by investing in the Portfolio.
An Important Note About Historical Performance
The investment return and principal value of an investment in the Portfolio will fluctuate, so that shares, when redeemed, may be worth more or less than their original cost. Performance shown in this report represents past performance and does not guarantee future results. Current performance may be lower or higher than the performance information shown. Please contact your financial advisor or insurance agent representative at your financial institution to obtain portfolio performance information current to the most recent month end.
Investors should consider the investment objectives, risks, charges and expenses of the Portfolio carefully before investing. For additional copies of the Portfolio’s prospectus or summary prospectus, which contains this and other information, call your financial advisor or (800) 227 4618. Please read the prospectus and/or summary prospectus carefully before investing.
All fees and expenses related to the operation of the Portfolio have been deducted, but no adjustment has been made for insurance company separate account or annuity contract charges, which would reduce total return to a contract owner. Performance assumes reinvestment of distributions and does not account for taxes.
There are additional fees and expenses associated with all Variable Products. These fees can include mortality and expense risk charges, administrative charges, and other charges that can significantly reduce investment returns. Those fees and expenses are not reflected in this annual report. You should consult your Variable Products prospectus for a description of those fees and expenses and speak to your insurance agent or financial representative if you have any questions. You should read the prospectus before investing or sending money.
4
| GLOBAL RISK ALLOCATION—MODERATE PORTFOLIO | ||
| HISTORICAL PERFORMANCE | AB Variable Products Series Fund | |
THE PORTFOLIO VS. ITS BENCHMARKS PERIODS ENDED DECEMBER 31, 2019 (unaudited) | Net Asset Value Returns | |||||||
| 1 Year | Since Inception1 | |||||||
| Global Risk Allocation—Moderate Portfolio Class A | 17.61% | 4.55% | ||||||
| Global Risk Allocation—Moderate Portfolio Class B | 17.32% | 4.29% | ||||||
| Primary Benchmark: MSCI World Index (net, USD hedged) | 28.43% | 8.77% | ||||||
| Blended Benchmark: 60% MSCI World Index (net, USD hedged) / 40% Bloomberg Barclays Global G7 Treasury Index (USD hedged) | 19.58% | 6.70% | ||||||
1 Inception date: 4/28/2015.
Please keep in mind that high, double-digit returns are highly unusual and cannot be sustained. Investors should also be aware that these returns were primarily achieved during favorable market conditions. |
| |||||||
The Portfolio’s current prospectus fee table shows the Portfolio’s total annual expense ratios as 1.00% and 1.24% for Class A and Class B shares, respectively, gross of any fee waivers or expense reimbursements. Contractual fee waivers and/or expense reimbursements limit the Portfolio’s annual operating expense ratios exclusive of interest expense, taxes, extraordinary expenses, expenses associated with securities sold short, and brokerage commissions and other transaction costs to 0.75% and 1.00% for Class A and Class B shares, respectively. These waivers/reimbursements may not be terminated before May 1, 2020 and may be extended by the Adviser for additionalone-year terms. Any fees waived and expenses borne by the Adviser through April 27, 2016 may be reimbursed by the Portfolio until the end of the third fiscal year after the fiscal period in which the fee was waived or the expense was borne, provided that no reimbursement payment will be made that would cause the Portfolio’s total annual operating expenses to exceed the expense limitation. Absent reimbursements or waivers, performance would have been lower. The Financial Highlights section of this report sets forth expense ratio data for the current reporting period; the expense ratios shown above may differ from the expense ratios in the Financial Highlights section since they are based on different time periods.
GROWTH OF A $10,000 INVESTMENT
4/28/20151 to 12/31/2019 (unaudited)
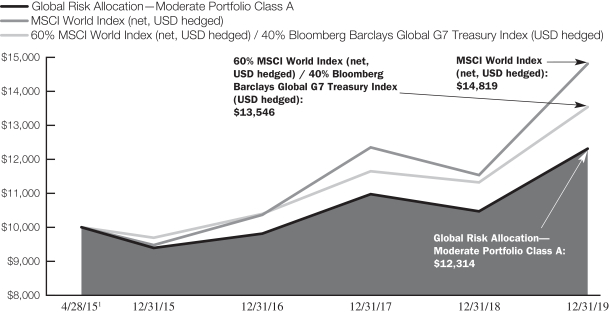
This chart illustrates the total value of an assumed $10,000 investment in Global Risk Allocation—Moderate Portfolio Class A shares (from 4/28/20151 to 12/31/2019) as compared to the performance of the Portfolio’s benchmarks. The chart assumes the reinvestment of dividends and capital gains distributions.
| 1 | Inception date: 4/28/2015. |
See Disclosures, Risks and Note about Historical Performance on pages3-4.
5
| GLOBAL RISK ALLOCATION—MODERATE PORTFOLIO | ||
| EXPENSE EXAMPLE (unaudited) | AB Variable Products Series Fund | |
As a shareholder of the Portfolio, you incur two types of costs: (1) transaction costs, including sales charges (loads) on purchase payments, contingent deferred sales charges on redemptions and (2) ongoing costs, including management fees; distribution(12b-1) fees; and other Portfolio expenses. This example is intended to help you understand your ongoing costs (in dollars) of investing in the Portfolio and to compare these costs with the ongoing costs of investing in other mutual funds.
The Example is based on an investment of $1,000 invested at the beginning of the period and held for the entire period as indicated below.
Actual Expenses
The table below provides information about actual account values and actual expenses. You may use the information in this line, together with the amount you invested, to estimate the expenses that you paid over the period. Simply divide your account value by $1,000 (for example, an $8,600 account value divided by $1,000 = 8.6), then multiply the result by the number in the first line under the heading entitled “Expenses Paid During Period” to estimate the expenses you paid on your account during this period. The estimate of expenses does not include fees or other expenses of any variable insurance product. If such expenses were included, the estimate of expenses you paid during the period would be higher and your ending account value would be lower.
Hypothetical Example for Comparison Purposes
The table below provides information about hypothetical account values and hypothetical expenses based on the Portfolio’s actual expense ratio and an assumed annual rate of return of 5% before expenses, which is not the Portfolio’s actual return. The hypothetical account values and expenses may not be used to estimate the actual ending account balance or expenses you paid for the period. You may use this information to compare the ongoing costs of investing in the Portfolio and other funds by comparing this 5% hypothetical example with the 5% hypothetical examples that appear in the shareholder reports of other funds. The estimate of expenses does not include fees or other expenses of any variable insurance product. If such expenses were included, the estimate of expenses you paid during the period would be higher and your ending account value would be lower.
Please note that the expenses shown in the table are meant to highlight your ongoing costs only and do not reflect any transactional costs, such as sales charges (loads), or contingent deferred sales charges on redemptions. Therefore, the second line of each classes’ table is useful in comparing ongoing costs only, and will not help you determine the relative total costs of owning different funds. In addition, if these transactional costs were included, your costs would have been higher.
| Beginning Account Value July 1, 2019 | Ending Account Value December 31, 2019 | Expenses Paid During Period* | Annualized Expense Ratio* | Total Expenses Paid During Period+ | Total Annualized Expense Ratio+ | |||||||||||||||||||
Class A | ||||||||||||||||||||||||
Actual | $ | 1,000 | $ | 1,057.30 | $ | 3.53 | 0.68 | % | $ | 3.89 | 0.75 | % | ||||||||||||
Hypothetical (5% annual return before expenses) | $ | 1,000 | $ | 1,021.78 | $ | 3.47 | 0.68 | % | $ | 3.82 | 0.75 | % | ||||||||||||
Class B | ||||||||||||||||||||||||
Actual | $ | 1,000 | $ | 1,055.90 | $ | 4.87 | 0.94 | % | $ | 5.23 | 1.01 | % | ||||||||||||
Hypothetical (5% annual return before expenses) | $ | 1,000 | $ | 1,020.47 | $ | 4.79 | 0.94 | % | $ | 5.14 | 1.01 | % | ||||||||||||
| * | Expenses are equal to each classes’ annualized expense ratios, multiplied by the average account value over the period, multiplied by 184/365 (to reflect theone-half year period). |
| + | In connection with the Portfolio’s investments in affiliated/unaffiliated underlying portfolios, the Portfolio incurs no direct expenses, but bears proportionate shares of the fund fees and expenses (i.e., operating, administrative and investment advisory fees) of the affiliated/unaffiliated underlying portfolios. The Adviser has contractually agreed to waive its fees and expenses from the Portfolio in an amount equal to the Portfolio’s pro rata share of certain affiliated/unaffiliated underlying portfolios acquired fund fees and expenses. The Portfolio’s total expenses are equal to the classes’ annualized expense ratio plus the Portfolio’spro-rata share of the weighted average expense ratio of the affiliated/unaffiliated underlying portfolios in which it invests, multiplied by the average account value over the period, multiplied by 184/365 (to reflect theone-half year period). |
6
| GLOBAL RISK ALLOCATION—MODERATE PORTFOLIO | ||
| SECURITY TYPE BREAKDOWN1 | ||
| December 31, 2019 (unaudited) | AB Variable Products Series Fund | |
| SECURITY TYPE | U.S. $ VALUE | PERCENT OF TOTAL INVESTMENTS | ||||||
Investment Companies | $ | 48,266,162 | 52.2 | % | ||||
Inflation-Linked Securities | 18,807,147 | 20.3 | ||||||
Options Purchased—Puts | 84,043 | 0.1 | ||||||
Short-Term Investments | 25,387,772 | 27.4 | ||||||
|
|
|
| |||||
Total Investments | $ | 92,545,124 | 100.0 | % | ||||
COUNTRY BREAKDOWN2
December 31, 2019 (unaudited)
| COUNTRY | U.S. $ VALUE | PERCENT OF TOTAL INVESTMENTS | ||||||
United States | $ | 52,345,829 | 56.6 | % | ||||
Japan | 14,805,459 | 16.0 | ||||||
United Kingdom | 6,064 | 0.0 | ||||||
Short-Term Investments | 25,387,772 | 27.4 | ||||||
|
|
|
| |||||
Total Investments | $ | 92,545,124 | 100.0 | % | ||||
| 1 | All data are as of December 31, 2019. The Portfolio’s security type breakdown is expressed as a percentage of total investments (excluding security lending collateral) and may vary over time.The Portfolio also enters into derivatives transactions, which may be used for hedging or investment purposes (see “Portfolio of Investments” section of the report for additional details). |
| 2 | All data are as of December 31, 2019. The Portfolio’s country breakdown is expressed as a percentage of total investments (excluding security lending collateral) and may vary over time. |
7
| GLOBAL RISK ALLOCATION—MODERATE PORTFOLIO | ||
| PORTFOLIO OF INVESTMENTS | ||
| December 31, 2019 | AB Variable Products Series Fund | |
Company | Shares | U.S. $ Value | ||||||||||
INVESTMENT COMPANIES–50.6% | ||||||||||||
FUNDS AND INVESTMENT TRUSTS–50.6%(a) | ||||||||||||
iShares Core MSCI EAFE ETF | 76,670 | $ | 5,001,951 | |||||||||
iShares Core S&P 500 ETF | 43,375 | 14,020,535 | ||||||||||
iShares MSCI EAFE ETF | 75,980 | 5,276,051 | ||||||||||
iShares MSCI Emerging Markets ETF(b) | 64,570 | 2,897,256 | ||||||||||
iShares Russell 2000 ETF(b) | 11,040 | 1,828,997 | ||||||||||
SPDR S&P 500 ETF Trust | 14,581 | 4,693,041 | ||||||||||
Vanguard S&P 500 ETF | 49,183 | 14,548,331 | ||||||||||
|
| |||||||||||
Total Investment Companies | 48,266,162 | |||||||||||
|
| |||||||||||
| Principal Amount (000) | ||||||||||||
INFLATION-LINKED SECURITIES–19.7% | ||||||||||||
JAPAN–15.5% | ||||||||||||
Japanese Government CPI Linked Bond | JPY | 1,567,157 | 14,805,459 | |||||||||
|
| |||||||||||
United States–4.2% | ||||||||||||
U.S. Treasury Inflation Index | $ | 3,922 | 4,001,688 | |||||||||
|
| |||||||||||
Total Inflation-Linked Securities | 18,807,147 | |||||||||||
|
| |||||||||||
| Notional Amount | ||||||||||||
OPTIONS PURCHASED– | ||||||||||||
OPTIONS ON FUNDS AND INVESTMENT TRUSTS–0.1% | ||||||||||||
SPDR S&P 500 ETF Trust | USD | 13,545,000 | 51,385 | |||||||||
|
| |||||||||||
OPTIONS ON | ||||||||||||
FTSE 100 Index | GBP | 1,036,000 | $ | 5,035 | ||||||||
Nikkei 225 Index | JPY | 209,250,000 | 6,064 | |||||||||
Euro STOXX 50 Index | EUR | 3,528,000 | 21,559 | |||||||||
|
| |||||||||||
| 32,658 | ||||||||||||
|
| |||||||||||
Total Options Purchased–Puts | 84,043 | |||||||||||
|
| |||||||||||
| Shares | ||||||||||||
SHORT-TERM | ||||||||||||
INVESTMENT COMPANIES–16.0% | ||||||||||||
AB Fixed Income Shares, Inc.–Government Money Market Portfolio–Class AB, 1.53%(a)(e)(f) | 15,287,134 | 15,287,134 | ||||||||||
|
| |||||||||||
| Principal Amount (000) | ||||||||||||
U.S. TREASURY BILLS–5.4% |
| |||||||||||
U.S. Treasury Bill | $ | 5,134 | 5,129,123 | |||||||||
|
| |||||||||||
GOVERNMENTS– | ||||||||||||
JAPAN–5.2% | ||||||||||||
Japan Treasury Discount Bill | JPY | 540,100 | 4,971,515 | |||||||||
|
| |||||||||||
Total Short-Term Investments (cost $25,371,194) | 25,387,772 | |||||||||||
|
| |||||||||||
Total Investments Before Security Lending Collateral for Securities Loaned–97.0% | 92,545,124 | |||||||||||
|
| |||||||||||
8
| AB Variable Products Series Fund | ||
Company | Shares | U.S. $ Value | ||||||||||
INVESTMENTS OF CASH COLLATERAL FOR SECURITIES | ||||||||||||
INVESTMENT | ||||||||||||
AB Fixed Income Shares, Inc.–Government Money Market Portfolio–Class AB, | 1,039,838 | $ | 1,039,838 | |||||||||
|
| |||||||||||
TOTAL INVESTMENTS–98.1% | 93,584,962 | |||||||||||
Other assets less liabilities–1.9% | 1,776,767 | |||||||||||
|
| |||||||||||
NET ASSETS–100.0% | $ | 95,361,729 | ||||||||||
|
| |||||||||||
FUTURES (see Note D)
| Description | Number of Contracts | Expiration Month | Current Notional | Value and Unrealized Appreciation/ (Depreciation) | ||||||||||||
Purchased Contracts |
| |||||||||||||||
10 Yr Mini Japan Government Bond Futures | 44 | March 2020 | $ | 6,152,427 | $ | (5,852 | ) | |||||||||
Euro STOXX 50 Index Futures | 177 | March 2020 | 7,403,590 | (8,210 | ) | |||||||||||
Euro-BOBL Futures | 11 | March 2020 | 1,648,820 | (9,019 | ) | |||||||||||
Euro-BTP Futures | 15 | March 2020 | 2,396,961 | 10,595 | ||||||||||||
Euro-OAT Futures | 13 | March 2020 | 2,373,528 | (30,199 | ) | |||||||||||
FTSE 100 Index Futures | 23 | March 2020 | 2,284,630 | 12,308 | ||||||||||||
Long Gilt Futures | 20 | March 2020 | 3,480,518 | (37,455 | ) | |||||||||||
Mini MSCI Emerging Market Futures | 19 | March 2020 | 1,064,190 | 43,748 | ||||||||||||
Nikkei 225 (CME) Futures | 20 | March 2020 | 2,345,500 | 2,641 | ||||||||||||
S&P 500E-Mini Futures | 22 | March 2020 | 3,554,210 | 35,700 | ||||||||||||
S&P/TSX 60 Index Futures | 5 | March 2020 | 779,639 | 3,561 | ||||||||||||
SPI 200 Futures | 5 | March 2020 | 579,207 | (16,413 | ) | |||||||||||
TOPIX Index Futures | 11 | March 2020 | 1,742,304 | 1,090 | ||||||||||||
U.S.T-Note 5 Yr (CBT) Futures | 35 | March 2020 | 4,151,328 | (14,584 | ) | |||||||||||
U.S. Ultra Bond (CBT) Futures | 10 | March 2020 | 1,816,563 | (51,327 | ) | |||||||||||
Sold Contracts |
| |||||||||||||||
10 Yr Mini Japan Government Bond Futures | 107 | March 2020 | 14,961,585 | 9,000 | ||||||||||||
|
| |||||||||||||||
| $ | (54,416 | ) | ||||||||||||||
|
| |||||||||||||||
9
| GLOBAL RISK ALLOCATION—MODERATE PORTFOLIO | ||
| PORTFOLIO OF INVESTMENTS | ||
| (continued) | AB Variable Products Series Fund | |
FORWARD CURRENCY EXCHANGE CONTRACTS (see Note D)
| Counterparty | Contracts to Deliver (000) | In Exchange For (000) | Settlement Date | Unrealized Appreciation/ (Depreciation) | ||||||||||||||||||||
Citibank, NA | JPY | 2,390,091 | USD | 21,950 | 1/30/20 | $ | (75,003 | ) | ||||||||||||||||
Morgan Stanley Capital Services, Inc. | EUR | 1,329 | USD | 1,482 | 1/16/20 | (10,813 | ) | |||||||||||||||||
Standard Chartered Bank | AUD | 1,080 | USD | 746 | 1/23/20 | (12,287 | ) | |||||||||||||||||
State Street Bank & Trust Co. | CHF | 866 | USD | 881 | 1/10/20 | (14,342 | ) | |||||||||||||||||
State Street Bank & Trust Co. | GBP | 217 | USD | 284 | 1/10/20 | (3,371 | ) | |||||||||||||||||
State Street Bank & Trust Co. | USD | 1,217 | GBP | 922 | 1/10/20 | 4,371 | ||||||||||||||||||
State Street Bank & Trust Co. | JPY | 4,778 | USD | 44 | �� | 1/30/20 | (86 | ) | ||||||||||||||||
State Street Bank & Trust Co. | JPY | 207,354 | USD | 1,905 | 3/16/20 | (10,327 | ) | |||||||||||||||||
|
| |||||||||||||||||||||||
| $ | (121,858 | ) | ||||||||||||||||||||||
|
| |||||||||||||||||||||||
PUT OPTIONS WRITTEN (see Note D)
| Description | Counterparty | Contracts | Exercise Price | Expiration Month | Notional (000) | Premiums Received | U.S. $ Value | |||||||||||||||||||||||
Euro STOXX 50 | Bank of America, NA | 960 | EUR | 3,525.00 | January 2020 | EUR | 3,384 | $ | 3,722 | $ | (5,538 | ) | ||||||||||||||||||
FTSE 100 | Bank of America, NA | 140 | GBP | 7,100.00 | January 2020 | GBP | 994 | 1,820 | (1,190 | ) | ||||||||||||||||||||
Nikkei 225 | Goldman Sachs International | 9,000 | JPY | 22,000.00 | January 2020 | JPY | 198,000 | 3,306 | (396 | ) | ||||||||||||||||||||
SPDR S&P 500 ETF Trust(h) | Morgan Stanley & Co., Inc. | 430 | USD | 300.00 | January 2020 | USD | 12,900 | 24,493 | (14,405 | ) | ||||||||||||||||||||
|
|
|
| |||||||||||||||||||||||||||
| $ | 33,341 | $ | (21,529 | ) | ||||||||||||||||||||||||||
|
|
|
| |||||||||||||||||||||||||||
VARIANCE SWAPS (see Note D)
| Swap Counterparty & Referenced Obligation | Volatility Strike Rate | Payment Frequency | Notional Amount (000) | Market Value | Upfront Premiums (Paid) Received | Unrealized Appreciation/ (Depreciation) | ||||||||||||||||||||||
Buy Contracts |
| |||||||||||||||||||||||||||
Barclays Bank PLC |
| |||||||||||||||||||||||||||
USD/JPY 5/27/20* | 5.88 | % | Maturity | USD | 278 | $ | (12,695 | ) | $ | –0– | $ | (12,695 | ) | |||||||||||||||
| * | Termination date |
| (a) | To obtain a copy of the fund’s shareholder report, please go to the Securities and Exchange Commission’s website at www.sec.gov. Additionally, shareholder reports for AB funds can be obtained by calling AB at (800)227-4618. |
| (b) | Represents entire or partial securities out on loan. See Note E for securities lending information. |
| (c) | Position, or a portion thereof, has been segregated to collateralize margin requirements for open exchange-traded derivatives. |
| (d) | Non-income producing security. |
| (e) | Affiliated investments. |
| (f) | The rate shown represents the7-day yield as of period end. |
| (g) | One contract relates to 1 share. |
| (h) | One contract relates to 100 shares. |
10
| AB Variable Products Series Fund | ||
Currency Abbreviations:
AUD—Australian Dollar
CHF—Swiss Franc
EUR—Euro
GBP—Great British Pound
JPY—Japanese Yen
USD—United States Dollar
Glossary:
BOBL—Bundesobligationen
BTP—Buoni del Tesoro Poliennali
CBT—Chicago Board of Trade
CME—Chicago Mercantile Exchange
CPI—Consumer Price Index
EAFE—Europe, Australia, and Far East
ETF—Exchange Traded Fund
FTSE—Financial Times Stock Exchange
MSCI—Morgan Stanley Capital International
OAT—Obligations Assimilables du Trésor
SPDR—Standard & Poor’s Depository Receipt
SPI—Share Price Index
TIPS—Treasury Inflation Protected Security
TOPIX—Tokyo Price Index
TSX—Toronto Stock Exchange
See notes to financial statements.
11
| GLOBAL RISK ALLOCATION—MODERATE PORTFOLIO | ||
| STATEMENT OF ASSETS & LIABILITIES | ||
| December 31, 2019 | AB Variable Products Series Fund | |
ASSETS |
| |||
Investments in securities, at value | ||||
Unaffiliated issuers (cost $66,283,968) | $ | 77,257,990 | (a) | |
Affiliated issuers (cost $16,326,972—including investment of cash collateral for securities loaned of $1,039,838) | 16,326,972 | |||
Cash | 684 | |||
Cash collateral due from broker | 1,319,357 | |||
Foreign currencies, at value (cost $1,650,691) | 1,657,883 | |||
Receivable for capital stock sold | 220,743 | |||
Unaffiliated dividends and interest receivable | 34,560 | |||
Affiliated dividends receivable | 21,041 | |||
Unrealized appreciation on forward currency exchange contracts | 4,371 | |||
|
| |||
Total assets | 96,843,601 | |||
|
| |||
LIABILITIES |
| |||
Options written, at value (premiums received $33,341) | 21,529 | |||
Payable for collateral received on securities loaned | 1,039,838 | |||
Unrealized depreciation on forward currency exchange contracts | 126,229 | |||
Payable for variation margin on futures | 64,177 | |||
Payable for capital stock redeemed | 42,240 | |||
Payable for investment securities purchased | 39,754 | |||
Administrative fee payable | 21,886 | |||
Distribution fee payable | 19,463 | |||
Advisory fee payable | 13,765 | |||
Unrealized depreciation on variance swaps | 12,695 | |||
Transfer Agent fee payable | 132 | |||
Accrued expenses | 80,164 | |||
|
| |||
Total liabilities | 1,481,872 | |||
|
| |||
NET ASSETS | $ | 95,361,729 | ||
|
| |||
COMPOSITION OF NET ASSETS |
| |||
Capital stock, at par | $ | 8,524 | ||
Additionalpaid-in capital | 80,794,861 | |||
Distributable earnings | 14,558,344 | |||
|
| |||
| $ | 95,361,729 | |||
|
| |||
Net Asset Value Per Share—1 billion shares of capital stock authorized, $.001 par value
| Class | Net Assets | Shares Outstanding | Net Asset Value | |||||||||
| A | $ | 12,393 | 1,100 | $ | 11.27 | |||||||
| B | $ | 95,349,336 | 8,523,161 | $ | 11.19 | |||||||
| (a) | Includes securities on loan with a value of $3,781,575 (see Note E). |
See notes to financial statements.
12
| GLOBAL RISK ALLOCATION—MODERATE PORTFOLIO | ||
| STATEMENT OF OPERATIONS | ||
| Year Ended December 31, 2019 | AB Variable Products Series Fund | |
INVESTMENT INCOME | ||||
Dividends | ||||
Unaffiliated issuers | $ | 1,043,439 | ||
Affiliated issuers | 407,722 | |||
Interest | 154,018 | |||
Securities lending income | 1,818 | |||
|
| |||
| 1,606,997 | ||||
|
| |||
EXPENSES | ||||
Advisory fee (see Note B) | 562,282 | |||
Distribution fee—Class B | 234,255 | |||
Transfer agency—Class B | 3,992 | |||
Custodian | 81,629 | |||
Administrative | 80,258 | |||
Audit and tax | 50,036 | |||
Legal | 38,971 | |||
Directors’ fees | 22,925 | |||
Printing | 15,282 | |||
Miscellaneous | 24,647 | |||
|
| |||
Total expenses before bank overdraft expense | 1,114,277 | |||
Bank overdraft expense | 7,108 | |||
|
| |||
Total expenses | 1,121,385 | |||
Less: expenses waived and reimbursed by the Adviser (see Notes B & E) | (241,878 | ) | ||
|
| |||
Net expenses | 879,507 | |||
|
| |||
Net investment income | 727,490 | |||
|
| |||
REALIZED AND UNREALIZED GAIN (LOSS) ON INVESTMENT AND FOREIGN CURRENCY TRANSACTIONS | ||||
Net realized gain (loss) on: | ||||
Investment transactions | (1,794,866 | ) | ||
Forward currency exchange contracts | (220,094 | ) | ||
Futures | 4,500,308 | |||
Options written | 840,360 | |||
Swaptions written | 69,145 | |||
Foreign currency transactions | 192,283 | |||
Net change in unrealized appreciation/depreciation of: | ||||
Investments | 9,821,365 | |||
Forward currency exchange contracts | 537,857 | |||
Futures | 302,024 | |||
Options written | 64,506 | |||
Swaps | (12,695 | ) | ||
Foreign currency denominated assets and liabilities | (66,560 | ) | ||
|
| |||
Net gain on investment and foreign currency transactions | 14,233,633 | |||
|
| |||
NET INCREASE IN NET ASSETS FROM OPERATIONS | $ | 14,961,123 | ||
|
|
See notes to financial statements.
13
| GLOBAL RISK ALLOCATION—MODERATE PORTFOLIO | ||
| STATEMENT OF CHANGES IN NET ASSETS | AB Variable Products Series Fund | |
| Year Ended December 31, 2019 | Year Ended December 31, 2018 | |||||||
INCREASE (DECREASE) IN NET ASSETS FROM OPERATIONS | ||||||||
Net investment income | $ | 727,490 | $ | 620,131 | ||||
Net realized gain on investment transactions and foreign currency transactions | 3,587,136 | 349,613 | ||||||
Net change in unrealized appreciation/depreciation of investments and foreign currency denominated assets and liabilities | 10,646,497 | (5,596,012 | ) | |||||
|
|
|
| |||||
Net increase (decrease) in net assets from operations | 14,961,123 | (4,626,268 | ) | |||||
Distributions to Shareholders | ||||||||
Class A | (263 | ) | (638 | ) | ||||
Class B | (1,823,657 | ) | (5,168,376 | ) | ||||
CAPITAL STOCK TRANSACTIONS | ||||||||
Net increase (decrease) | (6,913,088 | ) | 418,910 | |||||
|
|
|
| |||||
Total increase (decrease) | 6,224,115 | (9,376,372 | ) | |||||
NET ASSETS | ||||||||
Beginning of period | 89,137,614 | 98,513,986 | ||||||
|
|
|
| |||||
End of period | $ | 95,361,729 | $ | 89,137,614 | ||||
|
|
|
| |||||
See notes to financial statements.
14
| GLOBAL RISK ALLOCATION—MODERATE PORTFOLIO | ||
| NOTES TO FINANCIAL STATEMENTS | ||
| December 31, 2019 | AB Variable Products Series Fund | |
NOTE A : Significant Accounting Policies
The AB Global Risk Allocation—Moderate Portfolio (the “Portfolio”), is a series of AB Variable Products Series Fund, Inc. (the “Fund”). The Portfolio’s investment objective is to generate income and price appreciation without assuming what AllianceBernstein L.P. (the “Adviser”) considers undue risk. The Portfolio isnon-diversified as defined under the Investment Company Act of 1940. The Fund was incorporated in the State of Maryland on November 17, 1987, as anopen-end series investment company. The Fund offers eleven separately managed pools of assets which have differing investment objectives and policies. The Portfolio offers Class A and Class B shares. At December 31, 2019 the Adviser was the sole shareholder of Class A shares. Both classes of shares have identical voting, dividend, liquidating and other rights, except that Class B shares bear a distribution expense and have exclusive voting rights with respect to the Class B distribution plan.
The Portfolio offers and sells its shares only to separate accounts of certain life insurance companies for the purpose of funding variable annuity contracts and variable life insurance policies. Sales are made without a sales charge at the Portfolio’s net asset value per share.
The financial statements have been prepared in conformity with U.S. generally accepted accounting principles (“U.S. GAAP”) which require management to make certain estimates and assumptions that affect the reported amounts of assets and liabilities in the financial statements and amounts of income and expenses during the reporting period. Actual results could differ from those estimates. The Portfolio is an investment company under U.S. GAAP and follows the accounting and reporting guidance applicable to investment companies. The following is a summary of significant accounting policies followed by the Portfolio.
1. Security Valuation
Portfolio securities are valued at their current market value determined on the basis of market quotations or, if market quotations are not readily available or are deemed unreliable, at “fair value” as determined in accordance with procedures established by and under the general supervision of the Portfolio’s Board of Directors (the “Board”).
In general, the market values of securities which are readily available and deemed reliable are determined as follows: securities listed on a national securities exchange (other than securities listed on the NASDAQ Stock Market, Inc. (“NASDAQ”)) or on a foreign securities exchange are valued at the last sale price at the close of the exchange or foreign securities exchange. If there has been no sale on such day, the securities are valued at the last traded price from the previous day. Securities listed on more than one exchange are valued by reference to the principal exchange on which the securities are traded; securities listed only on NASDAQ are valued in accordance with the NASDAQ Official Closing Price; listed or over the counter (“OTC”) market put or call options are valued at the mid level between the current bid and ask prices. If either a current bid or current ask price is unavailable, the Adviser will have discretion to determine the best valuation (e.g., last trade price in the case of listed options); open futures are valued using the closing settlement price or, in the absence of such a price, the most recent quoted bid price. If there are no quotations available for the day of valuation, the last available closing settlement price is used; U.S. Government securities and any other debt instruments having 60 days or less remaining until maturity are generally valued at market by an independent pricing vendor, if a market price is available. If a market price is not available, the securities are valued at amortized cost. This methodology is commonly used for short term securities that have an original maturity of 60 days or less, as well as short term securities that had an original term to maturity that exceeded 60 days. In instances when amortized cost is utilized, the Valuation Committee (the “Committee”) must reasonably conclude that the utilization of amortized cost is approximately the same as the fair value of the security. Such factors the Committee will consider include, but are not limited to, an impairment of the creditworthiness of the issuer or material changes in interest rates. Fixed-income securities, including mortgage-backed and asset-backed securities, may be valued on the basis of prices provided by a pricing service or at a price obtained from one or more of the major broker-dealers. In cases where broker-dealer quotes are obtained, the Adviser may establish procedures whereby changes in market yields or spreads are used to adjust, on a daily basis, a recently obtained quoted price on a security. Swaps and other derivatives are valued daily, primarily using independent pricing services, independent pricing models using market inputs, as well as third party broker-dealers or counterparties. Open end mutual funds are valued at the closing net asset value per share, while exchange traded funds are valued at the closing market price per share.
Securities for which market quotations are not readily available (including restricted securities) or are deemed unreliable are valued at fair value as deemed appropriate by the Adviser. Factors considered in making this determination may include, but are not limited to, information obtained by contacting the issuer, analysts, analysis of the issuer’s financial statements or other available documents. In addition, the Portfolio may use fair value pricing for securities primarily traded innon-U.S. markets
15
| GLOBAL RISK ALLOCATION—MODERATE PORTFOLIO | ||
| NOTES TO FINANCIAL STATEMENTS | ||
| (continued) | AB Variable Products Series Fund | |
because most foreign markets close well before the Portfolio values its securities at 4:00 p.m., Eastern Time. The earlier close of these foreign markets gives rise to the possibility that significant events, including broad market moves, may have occurred in the interim and may materially affect the value of those securities. To account for this, the Portfolio generally values many of its foreign equity securities using fair value prices based on third party vendor modeling tools to the extent available.
2. Fair Value Measurements
In accordance with U.S. GAAP regarding fair value measurements, fair value is defined as the price that the Portfolio would receive to sell an asset or pay to transfer a liability in an orderly transaction between market participants at the measurement date. U.S. GAAP establishes a framework for measuring fair value, and a three-level hierarchy for fair value measurements based upon the transparency of inputs to the valuation of an asset or liability (including those valued based on their market values as described in Note A.1 above). Inputs may be observable or unobservable and refer broadly to the assumptions that market participants would use in pricing the asset or liability. Observable inputs reflect the assumptions market participants would use in pricing the asset or liability based on market data obtained from sources independent of the Portfolio. Unobservable inputs reflect the Portfolio’s own assumptions about the assumptions that market participants would use in pricing the asset or liability based on the best information available in the circumstances. Each investment is assigned a level based upon the observability of the inputs which are significant to the overall valuation. The three-tier hierarchy of inputs is summarized below.
| • | Level 1—quoted prices in active markets for identical investments |
| • | Level 2—other significant observable inputs (including quoted prices for similar investments, interest rates, prepayment speeds, credit risk, etc.) |
| • | Level 3—significant unobservable inputs (including the Portfolio’s own assumptions in determining the fair value of investments) |
The fair value of debt instruments, such as bonds, andover-the-counter derivatives is generally based on market price quotations, recently executed market transactions (where observable) or industry recognized modeling techniques and are generally classified as Level 2. Pricing vendor inputs to Level 2 valuations may include quoted prices for similar investments in active markets, interest rate curves, coupon rates, currency rates, yield curves, option adjusted spreads, default rates, credit spreads and other unique security features in order to estimate the relevant cash flows which are then discounted to calculate fair values. If these inputs are unobservable and significant to the fair value, these investments will be classified as Level 3.
Where readily available market prices or relevant bid prices are not available for certain equity investments, such investments may be valued based on similar publicly traded investments, movements in relevant indices since last available prices or based upon underlying company fundamentals and comparable company data (such as multiples to earnings or other multiples to equity). Where an investment is valued using an observable input, such as another publicly traded security, the investment will be classified as Level 2. If management determines that an adjustment is appropriate based on restrictions on resale, illiquidity or uncertainty, and such adjustment is a significant component of the valuation, the investment will be classified as Level 3. An investment will also be classified as Level 3 where management uses company fundamentals and other significant inputs to determine the valuation.
Options are valued using market-based inputs to models, broker or dealer quotations, or alternative pricing sources with reasonable levels of price transparency, where such inputs and models are available. Alternatively, the values may be obtained through unobservable management determined inputs and/or management’s proprietary models. Where models are used, the selection of a particular model to value an option depends upon the contractual terms of, and specific risks inherent in, the option as well as the availability of pricing information in the market. Valuation models require a variety of inputs, including contractual terms, market prices, measures of volatility and correlations of such inputs. Exchange traded options generally will be classified as Level 2. For options that do not trade on exchange but trade in liquid markets, inputs can generally be verified and model selection does not involve significant management judgment. Options are classified within Level 2 on the fair value hierarchy when all of the significant inputs can be corroborated to market evidence. Otherwise such instruments are classified as Level 3.
Other fixed income investments, includingnon-U.S. government and corporate debt, are generally valued using quoted market prices, if available, which are typically impacted by current interest rates, maturity dates and any perceived credit risk of the issuer. Additionally, in the absence of quoted market prices, these inputs are used by pricing vendors to derive a valuation based upon industry or proprietary models which incorporate issuer specific data with relevant yield/spread comparisons with more widely quoted bonds with similar key characteristics. Those investments for which there are observable inputs are classified as Level 2. Where the inputs are not observable, the investments are classified as Level 3.
16
| AB Variable Products Series Fund | ||
The following table summarizes the valuation of the Portfolio’s investments by the above fair value hierarchy levels as of December 31, 2019:
| Level 1 | Level 2 | Level 3 | Total | |||||||||||||
Investments in Securities: | ||||||||||||||||
Assets: |
| |||||||||||||||
Investment Companies | $ | 48,266,162 | $ | –0 | – | $ | –0 | – | $ | 48,266,162 | ||||||
Inflation-Linked Securities | –0 | – | 18,807,147 | –0 | – | 18,807,147 | ||||||||||
Options Purchased—Puts | –0 | – | 84,043 | –0 | – | 84,043 | ||||||||||
Short-Term Investments: | ||||||||||||||||
Investment Companies | 15,287,134 | –0 | – | –0 | – | 15,287,134 | ||||||||||
U.S. Treasury Bills | –0 | – | 5,129,123 | –0 | – | 5,129,123 | ||||||||||
Governments—Treasuries | –0 | – | 4,971,515 | –0 | – | 4,971,515 | ||||||||||
Investments of Cash Collateral for Securities Loaned in Affiliated Money Market Fund | 1,039,838 | –0 | – | –0 | – | 1,039,838 | ||||||||||
|
|
|
|
|
|
|
| |||||||||
Total Investments in Securities | 64,593,134 | 28,991,828 | –0 | – | 93,584,962 | |||||||||||
Other Financial Instruments(a): | ||||||||||||||||
Assets: |
| |||||||||||||||
Futures | 102,604 | 16,039 | –0 | – | 118,643 | (b) | ||||||||||
Forward Currency Exchange Contracts | –0 | – | 4,371 | –0 | – | 4,371 | ||||||||||
Liabilities: |
| |||||||||||||||
Futures | (148,436 | ) | (24,623 | ) | –0 | – | (173,059 | )(b) | ||||||||
Forward Currency Exchange Contracts | –0 | – | (126,229 | ) | –0 | – | (126,229 | ) | ||||||||
Put Options Written | –0 | – | (21,529 | ) | –0 | – | (21,529 | ) | ||||||||
Variance Swaps | –0 | – | (12,695 | ) | –0 | – | (12,695 | ) | ||||||||
|
|
|
|
|
|
|
| |||||||||
Total | $ | 64,547,302 | $ | 28,827,162 | $ | –0 | – | $ | 93,374,464 | |||||||
|
|
|
|
|
|
|
| |||||||||
| (a) | Other financial instruments are derivative instruments, such as futures, forwards and swaps, which are valued at the unrealized appreciation/(depreciation) on the instrument. Other financial instruments may also include swaps with upfront premiums, options written and swaptions written which are valued at market value. |
| (b) | Only variation margin receivable/(payable) at period end is reported within the statement of assets and liabilities. This amount reflects cumulative unrealized appreciation/(depreciation) on futures and centrally cleared swaps as reported in the portfolio of investments. Where applicable, centrally cleared swaps with upfront premiums are presented here at market value. |
3. Currency Translation
Assets and liabilities denominated in foreign currencies and commitments under forward currency exchange contracts are translated into U.S. dollars at the mean of the quoted bid and ask prices of such currencies against the U.S. dollar. Purchases and sales of portfolio securities are translated into U.S. dollars at the rates of exchange prevailing when such securities were acquired or sold. Income and expenses are translated into U.S. dollars at rates of exchange prevailing when accrued.
Net realized gain or loss on foreign currency transactions represents foreign exchange gains and losses from sales and maturities of foreign fixed income investments, holding of foreign currencies, currency gains or losses realized between the trade and settlement dates on foreign investment transactions, and the difference between the amounts of dividends, interest and foreign withholding taxes recorded on the Portfolio’s books and the U.S. dollar equivalent amounts actually received or paid. Net unrealized currency gains and losses from valuing foreign currency denominated assets and liabilities at period end exchange rates are reflected as a component of net unrealized appreciation or depreciation of foreign currency denominated assets and liabilities.
4. Taxes
It is the Portfolio’s policy to meet the requirements of the Internal Revenue Code applicable to regulated investment companies and to distribute all of its investment company taxable income and net realized gains, if any, to shareholders. Therefore, no provisions for federal income or excise taxes are required. The Portfolio may be subject to taxes imposed by countries in which it invests. Such taxes are generally based on income and/or capital gains earned or repatriated. Taxes are accrued and applied to net investment income, net realized gains and net unrealized appreciation/depreciation as such income and/or gains are earned.
17
| GLOBAL RISK ALLOCATION—MODERATE PORTFOLIO | ||
| NOTES TO FINANCIAL STATEMENTS | ||
| (continued) | AB Variable Products Series Fund | |
In accordance with U.S. GAAP requirements regarding accounting for uncertainties in income taxes, management has analyzed the Portfolio’s tax positions taken or expected to be taken on federal and state income tax returns for all open tax years (the current and the prior three tax years) and has concluded that no provision for income tax is required in the Portfolio’s financial statements.
5. Investment Income and Investment Transactions
Dividend income is recorded on theex-dividend date or as soon as the Portfolio is informed of the dividend. Interest income is accrued daily. Investment transactions are accounted for on the date the securities are purchased or sold. Investment gains or losses are determined on the identified cost basis. The Portfolio amortizes premiums and accretes discounts as adjustments to interest income.
6. Class Allocations
All income earned and expenses incurred by the Portfolio are borne on apro-rata basis by each outstanding class of shares, based on the proportionate interest in the Portfolio represented by the net assets of such class, except for class specific expenses which are allocated to the respective class. Expenses of the Portfolio are charged proportionately to each portfolio or based on other appropriate methods. Realized and unrealized gains and losses are allocated among the various share classes based on respective net assets.
7. Dividends and Distributions
Dividends and distributions to shareholders, if any, are recorded on theex-dividend date. Income dividends and capital gains distributions are determined in accordance with federal tax regulations and may differ from those determined in accordance with U.S. GAAP. To the extent these differences are permanent, such amounts are reclassified within the capital accounts based on their federal tax basis treatment; temporary differences do not require such reclassification.
NOTE B : Advisory Fee and Other Transactions with Affiliates
Under the terms of the investment advisory agreement, the Portfolio pays the Adviser an advisory fee at an annual rate of .60% of the Portfolio’s average daily net assets. The fee is accrued daily and paid monthly. The Adviser has agreed to waive its fees and bear certain expenses, to the extent necessary to limit total operating expenses (excluding interest expense, taxes, extraordinary expenses, expenses associated with securities sold short, and brokerage commissions and other transaction costs), inclusive of the Portfolio’s proportionate share of fees and expenses of registered investment companies or series thereof in which the Portfolio invests (“Acquired Fund Expenses”) on an annual basis (the “Expense Caps”) to .75% and 1.00% of daily average net assets for Class A and Class B, respectively. The Expense Caps may not be terminated by the Adviser before May 1, 2020. For the year ended December 31, 2019, the reimbursements/waivers, exclusive of Acquired Fund Expenses, amounted to $177,170. Any fees waived and expenses borne by the Adviser through April 27, 2016 were subject to repayment by the Portfolio until the end of the third fiscal year after the fiscal period in which the fee was waived or the expense was borne; such waivers that were subject to repayment amounted to $70,109 for the year ended December 31, 2016. In any case, no reimbursement payment will be made that would cause the Portfolio’s total annual fund operating expenses to exceed the Expense Caps’ net fee percentage set forth above. For the year ended December 31, 2019, such waiver for Acquired Fund Expenses for both affiliated and unaffiliated underlying portfolios amounted to $20,518 and $43,888, respectively.
A summary of the Portfolio’s transactions in AB mutual funds for the year ended December 31, 2019 is as follows:
Fund | Market Value 12/31/18 (000) | Purchases at Cost (000) | Sales Proceeds (000) | Market Value 12/31/19 (000) | Dividend Income (000) | |||||||||||||||
AB Government Money Market Portfolio | $ | 17,872 | $ | 18,196 | $ | 20,781 | $ | 15,287 | $ | 405 | ||||||||||
AB Government Money Market Portfolio* | 0 | 50,811 | 49,771 | 1,040 | 3 | |||||||||||||||
|
|
|
| |||||||||||||||||
Total | $ | 16,327 | $ | 408 | ||||||||||||||||
|
|
|
| |||||||||||||||||
| * | Investments of cash collateral for securities lending transactions (see Note E). |
Pursuant to the investment advisory agreement, the Portfolio may reimburse the Adviser for certain legal and accounting services provided to the Portfolio by the Adviser. For the year ended December 31, 2019, the reimbursement for such services amounted to $80,258.
18
| AB Variable Products Series Fund | ||
The Portfolio compensates AllianceBernstein Investor Services, Inc. (“ABIS”), a wholly-owned subsidiary of the Adviser, under a Transfer Agency Agreement for providing personnel and facilities to perform transfer agency services for the Portfolio. Such compensation retained by ABIS amounted to $1,491 for the year ended December 31, 2019.
During the second quarter of 2018, AXA S.A. (“AXA”), a French holding company for the AXA Group, a worldwide leader in life, property and casualty and health insurance and asset management, completed the sale of a minority stake in its subsidiary, AXA Equitable Holdings, Inc. (now named Equitable Holdings, Inc.)(“Equitable”), through an initial public offering. Equitable is the holding company for a diverse group of financial services companies, including an approximately 65.3% economic interest in the Adviser and a 100% interest in AllianceBernstein Corporation, the general partner of the Adviser. Since the initial sale, AXA has completed additional offerings, most recently during the fourth quarter of 2019. As a result, AXA currently owns 10.1% of the outstanding shares of common stock of Equitable, and no longer owns a controlling interest in Equitable. AXA previously announced its intention to sell its entire interest in Equitable over time, subject to market conditions and other factors (the “Plan”). Most of AXA’s remaining Equitable shares are to be delivered on redemption of AXA bonds mandatorily exchangeable into Equitable shares and maturing in May 2021. AXA retains sole discretion to determine the timing of any future sales of its remaining shares of Equitable common stock.
The latest transaction under the Plan, which occurred on November 13, 2019, resulted in the indirect transfer of a “controlling block” of voting securities of the Adviser (a “Change of Control Event”) and was deemed an “assignment” causing a termination of the Portfolio’s investment advisory agreement. In order to ensure that investment advisory services could continue uninterrupted in the event of a Change of Control Event, the Board previously approved a new investment advisory agreement with the Adviser, and shareholders of the Portfolio subsequently approved the new investment advisory agreement. This agreement became effective on November 13, 2019.
NOTE C : Distribution Plan
The Portfolio has adopted a Distribution Plan (the “Plan”) for Class B shares pursuant to Rule12b-1 under the Investment Company Act of 1940. Under the Plan, the Portfolio pays distribution and servicing fees to AllianceBernstein Investments, Inc. (the “Distributor”), a wholly-owned subsidiary of the Adviser, at an annual rate of up to .5% of the Portfolio’s average daily net assets attributable to Class B shares. The fees are accrued daily and paid monthly. The Board currently limits payments under the Plan to .25% of the Portfolio’s average daily net assets attributable to Class B shares. The Plan provides that the Distributor will use such payments in their entirety for distribution assistance and promotional activities.
The Portfolio is not obligated under the Plan to pay any distribution and servicing fees in excess of the amounts set forth above. The purpose of the payments to the Distributor under the Plan is to compensate the Distributor for its distribution services with respect to the sale of the Portfolio’s Class B shares. Since the Distributor’s compensation is not directly tied to its expenses, the amount of compensation received by it under the Plan during any year may be more or less than its actual expenses. For this reason, the Plan is characterized by the staff of the Securities and Exchange Commission as being of the “compensation” variety.
In the event that the Plan is terminated or not continued, no distribution or servicing fees (other than current amounts accrued but not yet paid) would be owed by the Portfolio to the Distributor.
The Plan also provides that the Adviser may use its own resources to finance the distribution of the Portfolio’s shares.
NOTE D : Investment Transactions
Purchases and sales of investment securities (excluding short-term investments) for the year ended December 31, 2019 were as follows:
| Purchases | Sales | |||||||
Investment securities (excluding U.S. government securities) | $ | 17,917,525 | $ | 19,984,121 | ||||
U.S. government securities | –0 | – | –0 | – | ||||
The cost of investments for federal income tax purposes, gross unrealized appreciation and unrealized depreciation are as follows:
Cost | $ | 82,930,721 | ||
|
| |||
Gross unrealized appreciation | $ | 11,260,788 | ||
Gross unrealized depreciation | (616,044 | ) | ||
|
| |||
Net unrealized appreciation | $ | 10,644,744 | ||
|
|
19
| GLOBAL RISK ALLOCATION—MODERATE PORTFOLIO | ||
| NOTES TO FINANCIAL STATEMENTS | ||
| (continued) | AB Variable Products Series Fund | |
1. Derivative Financial Instruments
The Portfolio may use derivatives in an effort to earn income and enhance returns, to replace more traditional direct investments, to obtain exposure to otherwise inaccessible markets (collectively, “investment purposes”), or to hedge or adjust the risk profile of its portfolio.
The principal types of derivatives utilized by the Portfolio, as well as the methods in which they may be used are:
| • | Futures |
The Portfolio may buy or sell futures for investment purposes or for the purpose of hedging its portfolio against adverse effects of potential movements in the market. The Portfolio bears the market risk that arises from changes in the value of these instruments and the imperfect correlation between movements in the price of the futures and movements in the price of the assets, reference rates or indices which they are designed to track. Among other things, the Portfolio may purchase or sell futures for foreign currencies or options thereon fornon-hedging purposes as a means of making direct investment in foreign currencies, as described below under “Currency Transactions”.
At the time the Portfolio enters into futures, the Portfolio deposits and maintains as collateral an initial margin with the broker, as required by the exchange on which the transaction is effected. Such amount is shown as cash collateral due from broker on the statement of assets and liabilities. Pursuant to the contract, the Portfolio agrees to receive from or pay to the broker an amount of cash equal to the daily fluctuation in the value of the contract. Such receipts or payments are known as variation margin and are recorded by the Portfolio as unrealized gains or losses. Risks may arise from the potential inability of a counterparty to meet the terms of the contract. The credit/counterparty risk for exchange-traded futures is generally less than privately negotiated futures, since the clearinghouse, which is the issuer or counterparty to each exchange-traded future, has robust risk mitigation standards, including the requirement to provide initial and variation margin. When the contract is closed, the Portfolio records a realized gain or loss equal to the difference between the value of the contract at the time it was opened and the time it was closed.
Use of long futures subjects the Portfolio to risk of loss in excess of the amounts shown on the statement of assets and liabilities, up to the notional value of the futures. Use of short futures subjects the Portfolio to unlimited risk of loss. Under some circumstances, futures exchanges may establish daily limits on the amount that the price of futures can vary from the previous day’s settlement price, which could effectively prevent liquidation of unfavorable positions.
During the year ended December 31, 2019, the Portfolio held futures for hedging andnon-hedging purposes.
| • | Forward Currency Exchange Contracts |
The Portfolio may enter into forward currency exchange contracts in order to hedge its exposure to changes in foreign currency exchange rates on its foreign portfolio holdings, to hedge certain firm purchase and sale commitments denominated in foreign currencies and fornon-hedging purposes as a means of making direct investments in foreign currencies, as described below under “Currency Transactions”.
A forward currency exchange contract is a commitment to purchase or sell a foreign currency at a future date at a negotiated forward rate. The gain or loss arising from the difference between the original contract and the closing of such contract would be included in net realized gain or loss on forward currency exchange contracts. Fluctuations in the value of open forward currency exchange contracts are recorded for financial reporting purposes as unrealized appreciation and/or depreciation by the Portfolio. Risks may arise from the potential inability of a counterparty to meet the terms of a contract and from unanticipated movements in the value of a foreign currency relative to the U.S. dollar.
During the year ended December 31, 2019, the Portfolio held forward currency exchange contracts for hedging andnon-hedging purposes.
| • | Option Transactions |
For hedging and investment purposes, the Portfolio may purchase and write (sell) put and call options on U.S. and foreign securities, including government securities, and foreign currencies that are traded on U.S. and foreign securities exchanges andover-the-counter markets. Among other things, the Portfolio may use options transactions fornon-hedging purposes as a means of making direct investments in foreign currencies, as described below under “Currency Transactions” and may use options strategies involving the purchase and/or writing of various combinations of call and/or put options, for hedging and investment purposes.
20
| AB Variable Products Series Fund | ||
The risk associated with purchasing an option is that the Portfolio pays a premium whether or not the option is exercised. Additionally, the Portfolio bears the risk of loss of the premium and change in market value should the counterparty not perform under the contract. If a put or call option purchased by the Portfolio were permitted to expire without being sold or exercised, its premium would represent a loss to the Portfolio. Put and call options purchased are accounted for in the same manner as portfolio securities. The cost of securities acquired through the exercise of call options is increased by premiums paid. The proceeds from securities sold through the exercise of put options are decreased by the premiums paid.
When the Portfolio writes an option, the premium received by the Portfolio is recorded as a liability and is subsequently adjusted to the current market value of the option written. The Portfolio’s maximum payment for written put options equates to the number of shares multiplied by the strike price. In certain circumstances maximum payout amounts may be partially offset by recovery values of the respective referenced assets and upfront premium received upon entering into the contract. Premiums received from written options which expire unexercised are recorded by the Portfolio on the expiration date as realized gains from options written. The difference between the premium received and the amount paid on effecting a closing purchase transaction, including brokerage commissions, is also treated as a realized gain, or if the premium received is less than the amount paid for the closing purchase transaction, as a realized loss. If a call option is exercised, the premium received is added to the proceeds from the sale of the underlying security or currency in determining whether the Portfolio has realized a gain or loss. If a put option is exercised, the premium received reduces the cost basis of the security or currency purchased by the Portfolio. In writing an option, the Portfolio bears the market risk of an unfavorable change in the price of the security or currency underlying the written option. Exercise of an option written by the Portfolio could result in the Portfolio selling or buying a security or currency at a price different from the current market value.
The Portfolio may also invest in options on swap agreements, also called “swaptions”. A swaption is an option that gives the buyer the right, but not the obligation, to enter into a swap on a future date in exchange for paying a market-based “premium”. A receiver swaption gives the owner the right to receive the total return of a specified asset, reference rate, or index. A payer swaption gives the owner the right to pay the total return on a specified asset, reference rate, or index. Swaptions also include options that allow an existing swap to be terminated or extended by one of the counterparties. The Portfolio’s maximum payment for written put swaptions equates to the notional amount of the underlying swap. In certain circumstances maximum payout amounts may be partially offset by recovery values of the respective referenced assets and upfront premium received upon entering into the contract.
During the year ended December 31, 2019, the Portfolio held purchased options for hedging andnon-hedging purposes. During the year ended December 31, 2019, the Portfolio held purchased swaptions for hedging andnon-hedging purposes.
During the year ended December 31, 2019, the Portfolio held written options for hedging andnon-hedging purposes. During the year ended December 31, 2019, the Portfolio held written swaptions for hedging andnon-hedging purposes.
| • | Swaps |
The Portfolio may enter into swaps to hedge its exposure to interest rates, credit risk, equity markets or currencies. The Portfolio may also enter into swaps fornon-hedging purposes as a means of gaining market exposures, making direct investments in foreign currencies, as described below under “Currency Transactions.”
A swap is an agreement that obligates two parties to exchange a series of cash flows at specified intervals based upon or calculated by reference to changes in specified prices or rates for a specified amount of an underlying asset. The payment flows are usually netted against each other, with the difference being paid by one party to the other. In addition, collateral may be pledged or received by the Portfolio in accordance with the terms of the respective swaps to provide value and recourse to the Portfolio or its counterparties in the event of default, bankruptcy or insolvency by one of the parties to the swap.
Risks may arise as a result of the failure of the counterparty to the swap to comply with the terms of the swap. The loss incurred by the failure of a counterparty is generally limited to the net interim payment to be received by the Portfolio, and/or the termination value at the end of the contract. Therefore, the Portfolio considers the creditworthiness of each counterparty to a swap in evaluating potential counterparty risk. This risk is mitigated by
21
| GLOBAL RISK ALLOCATION—MODERATE PORTFOLIO | ||
| NOTES TO FINANCIAL STATEMENTS | ||
| (continued) | AB Variable Products Series Fund | |
having a netting arrangement between the Portfolio and the counterparty and by the posting of collateral by the counterparty to the Portfolio to cover the Portfolio’s exposure to the counterparty. Additionally, risks may arise from unanticipated movements in interest rates or in the value of the underlying securities. The Portfolio accrues for the interim payments on swaps on a daily basis, with the net amount recorded within unrealized appreciation/depreciation of swaps on the statement of assets and liabilities, where applicable. Once the interim payments are settled in cash, the net amount is recorded as realized gain/(loss) on swaps on the statement of operations, in addition to any realized gain/(loss) recorded upon the termination of swaps. Upfront premiums paid or received for OTC swaps are recognized as cost or proceeds on the statement of assets and liabilities and are amortized on a straight line basis over the life of the contract. Amortized upfront premiums are included in net realized gain/(loss) from swaps on the statement of operations. Fluctuations in the value of swaps are recorded as a component of net change in unrealized appreciation/depreciation of swaps on the statement of operations.
Variance Swaps:
The Portfolio may enter into variance swaps to hedge equity market risk or adjust exposure to the equity markets. Variance swaps are contracts in which two parties agree to exchange cash payments based on the difference between the stated level of variance and the actual variance realized on underlying asset(s) or index(es). Actual “variance” as used here is defined as the sum of the square of the returns on the reference asset(s) or index(es) (which in effect is a measure of its “volatility”) over the length of the contract term. So the parties to a variance swap can be said to exchange actual volatility for a contractually stated rate of volatility.
During the year ended December 31, 2019, the Portfolio held variance swaps for hedging andnon-hedging purposes.
The Portfolio typically enters into International Swaps and Derivatives Association, Inc. Master Agreements (“ISDA Master Agreement”) with its OTC derivative contract counterparties in order to, among other things, reduce its credit risk to OTC counterparties. ISDA Master Agreements include provisions for general obligations, representations, collateral and events of default or termination. Under an ISDA Master Agreement, the Portfolio typically may offset with the OTC counterparty certain derivative financial instruments’ payables and/or receivables with collateral held and/or posted and create one single net payment(close-out netting) in the event of default or termination. In the event of a default by an OTC counterparty, the return of collateral with market value in excess of the Portfolio’s net liability, held by the defaulting party, may be delayed or denied.
The Portfolio’s ISDA Master Agreements may contain provisions for early termination of OTC derivative transactions in the event the net assets of the Portfolio decline below specific levels (“net asset contingent features”). If these levels are triggered, the Portfolio’s OTC counterparty has the right to terminate such transaction and require the Portfolio to pay or receive a settlement amount in connection with the terminated transaction. If OTC derivatives were held at period end, please refer to netting arrangements by the OTC counterparty table below for additional details.
During the year ended December 31, 2019, the Portfolio had entered into the following derivatives:
Asset Derivatives | Liability Derivatives | |||||||||||
Derivative Type | Statement of Assets and Liabilities Location | Fair Value | Statement of Assets and Liabilities Location | Fair Value | ||||||||
Interest rate contracts | Receivable/Payable for variation margin on futures | $ | 19,595 | * | Receivable/Payable for variation margin on futures | $ | 148,436 | * | ||||
Equity contracts | Receivable/Payable for variation margin on futures | 99,048 | * | Receivable/Payable for variation margin on futures | 24,623 | * | ||||||
Foreign currency contracts | Unrealized appreciation on forward currency exchange contracts | 4,371 | Unrealized depreciation on forward currency exchange contracts | 126,229 | ||||||||
Equity contracts | Investments in securities, at value | 84,043 | ||||||||||
Equity contracts | Options written, at value | 21,529 | ||||||||||
Foreign currency contracts | Unrealized depreciation on variance swaps | 12,695 | ||||||||||
|
|
|
| |||||||||
Total | $ | 207,057 | $ | 333,512 | ||||||||
|
|
|
| |||||||||
| * | Only variation margin receivable/payable at period end is reported within the statement of assets and liabilities. This amount reflects cumulative unrealized appreciation/(depreciation) on futures and centrally cleared swaps as reported in the portfolio of investments. |
22
| AB Variable Products Series Fund | ||
Derivative Type | Location of Gain or (Loss) on Derivatives Within Statement of Operations | Realized Gain or (Loss) on Derivatives | Change in Unrealized Appreciation or (Depreciation) | |||||||
Interest rate contracts | Net realized gain (loss) on futures; Net change in unrealized appreciation/depreciation of futures | $ | 1,416,556 | $ | (364,010 | ) | ||||
Equity contracts | Net realized gain (loss) on futures; Net change in unrealized appreciation/depreciation of futures | 3,083,752 | 666,034 | |||||||
Foreign currency contracts | Net realized gain (loss) on forward currency exchange contracts; Net change in unrealized appreciation/depreciation of forward currency exchange contracts | (220,094 | ) | 537,857 | ||||||
Interest rate contracts | Net realized gain (loss) on investment transactions; Net change in unrealized appreciation/depreciation of investments | (137,886 | ) | –0 | – | |||||
Equity contracts | Net realized gain (loss) on investment transactions; Net change in unrealized appreciation/depreciation of investments | (1,801,178 | ) | (139,005 | ) | |||||
Equity contracts | Net realized gain (loss) on options written; Net change in unrealized appreciation/depreciation of options written | 840,360 | 64,506 | |||||||
Interest rate contracts | Net realized gain (loss) on swaptions written; Net change in unrealized appreciation/depreciation of swaptions written | 69,145 | –0 | – | ||||||
Foreign exchange contracts | Net realized gain (loss) on swaps; Net change in unrealized appreciation/depreciation of swaps | –0 | – | (12,695 | ) | |||||
|
|
|
| |||||||
Total | $ | 3,250,655 | $ | 752,687 | ||||||
|
|
|
| |||||||
The following table represents the average monthly volume of the Portfolio’s derivative transactions during the year ended December 31, 2019:
Futures: | ||||
Average notional amount of buy contracts | $ | 35,274,304 | ||
Average notional amount of sale contracts | $ | 20,449,754 | ||
Forward Currency Exchange Contracts: | ||||
Average principal amount of buy contracts | $ | 3,649,486 | (a) | |
Average principal amount of sale contracts | $ | 29,464,202 | ||
Purchased Options: | ||||
Average notional amount | $ | 21,591,727 | ||
Purchased Swaptions: | ||||
Average notional amount | $ | 14,043,667 | (b) | |
Options Written: | ||||
Average notional amount | $ | 21,467,931 | ||
Swaptions Written: | ||||
Average notional amount | $ | 20,150,333 | (b) | |
Variance Swaps: | ||||
Average notional amount | $ | 278,475 | (c) |
| (a) | Positions were open for eleven months during the year. |
| (b) | Positions were open for three months during the year. |
| (c) | Positions were open for two months during the year. |
For financial reporting purposes, the Portfolio does not offset derivative assets and derivative liabilities that are subject to netting arrangements in the statement of assets and liabilities.
23
| GLOBAL RISK ALLOCATION—MODERATE PORTFOLIO | ||
| NOTES TO FINANCIAL STATEMENTS | ||
| (continued) | AB Variable Products Series Fund | |
All OTC derivatives held at period end were subject to netting arrangements. The following table presents the Portfolio’s derivative assets and liabilities by OTC counterparty net of amounts available for offset under ISDA Master Agreements (“MA”) and net of the related collateral received/pledged by the Portfolio as of December 31, 2019. Exchange-traded derivatives and centrally cleared swaps are not subject to netting arrangements and as such are excluded from the table.
Counterparty | Derivative Assets Subject to a MA | Derivatives Available for Offset | Cash Collateral Received* | Security Collateral Received* | Net Amount of Derivative Assets | |||||||||||||||
Bank of America, NA | $ | 26,594 | $ | (6,728 | ) | $ | –0 | – | $ | –0 | – | $ | 19,866 | |||||||
Goldman Sachs International | 6,064 | (396 | ) | –0 | – | –0 | – | 5,668 | ||||||||||||
State Street Bank & Trust Co. | 4,371 | (4,371 | ) | –0 | – | –0 | – | –0 | – | |||||||||||
|
|
|
|
|
|
|
|
|
| |||||||||||
Total | $ | 37,029 | $ | (11,495 | ) | $ | –0 | – | $ | –0 | – | $ | 25,534 | ^ | ||||||
|
|
|
|
|
|
|
|
|
| |||||||||||
Counterparty | Derivative Liabilities Subject to a MA | Derivatives Available for Offset | Cash Collateral Pledged* | Security Collateral Pledged* | Net Amount of Derivative Liabilities | |||||||||||||||
Bank of America, NA | $ | 6,728 | $ | (6,728 | ) | $ | –0 | – | $ | –0 | – | $ | –0 | – | ||||||
Barclays Bank PLC | 12,695 | 0 | –0 | – | –0 | – | 12,695 | |||||||||||||
Citibank, NA | 75,003 | 0 | –0 | – | –0 | – | 75,003 | |||||||||||||
Goldman Sachs International | 396 | (396 | ) | –0 | – | –0 | – | –0 | – | |||||||||||
Morgan Stanley Capital Services, Inc. | 10,813 | 0 | –0 | – | –0 | – | 10,813 | |||||||||||||
Standard Chartered Bank | 12,287 | 0 | –0 | – | –0 | – | 12,287 | |||||||||||||
State Street Bank & Trust Co. | 28,126 | (4,371 | ) | –0 | – | –0 | – | 23,755 | ||||||||||||
|
|
|
|
|
|
|
|
|
| |||||||||||
Total | $ | 146,048 | $ | (11,495 | ) | $ | –0 | – | $ | –0 | – | $ | 134,553 | ^ | ||||||
|
|
|
|
|
|
|
|
|
| |||||||||||
| * | The actual collateral received/pledged may be more than the amount reported due to over-collateralization. |
| ^ | Net amount represents the net receivable/payable that would be due from/to the counterparty in the event of default or termination. The net amount from OTC financial derivative instruments can only be netted across transactions governed under the same master agreement with the same counterparty. |
2. Currency Transactions
The Portfolio may invest innon-U.S. Dollar-denominated securities on a currency hedged or unhedged basis. The Portfolio may seek investment opportunities by taking long or short positions in currencies through the use of currency-related derivatives, including forward currency exchange contracts, futures and options on futures, swaps, and other options. The Portfolio may enter into transactions for investment opportunities when it anticipates that a foreign currency will appreciate or depreciate in value but securities denominated in that currency are not held by the Portfolio and do not present attractive investment opportunities. Such transactions may also be used when the Adviser believes that it may be more efficient than a direct investment in a foreign currency-denominated security. The Portfolio may also conduct currency exchange contracts on a spot basis (i.e., for cash at the spot rate prevailing in the currency exchange market for buying or selling currencies).
NOTE E : Securities Lending
The Portfolio may enter into securities lending transactions. Under the Portfolio’s securities lending program, all loans of securities will be collateralized continually by cash collateral and/ornon-cash collateral.Non-cash collateral will include only securities issued or guaranteed by the U.S. government or its agencies or instrumentalities. The Portfolio cannot sell or repledge anynon-cash collateral, such collateral will not be reflected in the portfolio of investments. If a loan is collateralized by cash, the Portfolio will be compensated for the loan from a portion of the net return from the income earned on cash collateral after a rebate is paid to the borrower (in some cases, this rebate may be a “negative rebate” or fee paid by the borrower to the Portfolio in connection with the loan), and payments are made for fees of the securities lending agent and for certain other administrative expenses. If the Portfolio receivesnon-cash collateral, the Portfolio will receive a fee from the borrower generally equal to a negotiated percentage of the market value of the loaned securities. The Portfolio will have the right to call a loan and obtain the securities loaned at any time on notice to the borrower within the normal and customary settlement time for the securities. While the securities are on loan, the borrower is obligated to pay the Portfolio amounts equal to any income or other distributions from the securities. The Portfolio will not be able to exercise voting rights with respect to any securities during the existence of a loan, but will have the right to regain ownership of loaned securities in order to exercise voting or other ownership rights. Collateral received and securities loaned are marked to market daily to
24
| AB Variable Products Series Fund | ||
ensure that the securities loaned are secured by collateral. The lending agent currently invests the cash collateral received in AB Government Money Market Portfolio, an eligible money market vehicle, in accordance with the investment restrictions of the Portfolio, and as approved by the Board. The collateral received on securities loaned is recorded as an asset as well as a corresponding liability in the statement of assets and liabilities. The collateral will be adjusted the next business day to maintain the required collateral amount. The amounts of securities lending income from the borrowers and AB Government Money Market Portfolio are reflected in the statement of operations. When the Portfolio earns net securities lending income from AB Government Money Market Portfolio, the income is inclusive of a rebate expense paid to the borrower. In connection with the cash collateral investment by the Portfolio in AB Government Money Market Portfolio, the Adviser has agreed to waive a portion of the Portfolio’s share of the advisory fees of AB Government Money Market Portfolio, as borne indirectly by the Portfolio as an acquired fund fee and expense. When the Portfolio lends securities, its investment performance will continue to reflect changes in the value of the securities loaned. A principal risk of lending portfolio securities is that the borrower may fail to return the loaned securities upon termination of the loan and that the collateral will not be sufficient to replace the loaned securities. The lending agent has agreed to indemnify the Portfolio in the case of default of any securities borrower.
A summary of the Portfolio’s transactions surrounding securities lending for the year ended December 31, 2019 is as follows:
Market Value on Loan* | Cash | Market Value | Income from | AB Government Money Market Portfolio | ||||||||||||||||||
Income Earned | Advisory Fee | |||||||||||||||||||||
| $ | 3,781,575 | $ | 1,039,838 | $ | 2,816,090 | $ | 1,818 | $ | 2,985 | $ | 302 | |||||||||||
| * | As of December 31, 2019. |
NOTE F : Capital Stock
Each class consists of 500,000,000 authorized shares. Transactions in capital shares for each class were as follows:
| SHARES | AMOUNT | |||||||||||||||||||
| Year Ended December 31, 2019 | Year Ended December 31, 2018 | Year Ended December 31, 2019 | Year Ended December 31, 2018 | |||||||||||||||||
Class B |
| |||||||||||||||||||
Shares sold | 655,805 | 1,135,018 | $ | 6,900,710 | $ | 12,083,758 | ||||||||||||||
Shares issued in reinvestment of dividends and distributions | 173,003 | 493,581 | 1,823,446 | 5,167,796 | ||||||||||||||||
Shares redeemed | (1,475,145 | ) | (1,593,282 | ) | (15,637,244 | ) | (16,832,644 | ) | ||||||||||||
|
|
|
|
|
|
|
| |||||||||||||
Net increase (decrease) | (646,337 | ) | 35,317 | $ | (6,913,088 | ) | $ | 418,910 | ||||||||||||
|
|
|
|
|
|
|
| |||||||||||||
There were no transactions in capital shares for Class A for the year ended December 31, 2019 and the year ended December 31, 2018.
At December 31, 2019, a shareholder of the Portfolio owned 98% of the Portfolio’s outstanding shares. Significant transactions by such shareholder, if any, may impact the Portfolio’s performance.
NOTE G : Risks Involved in Investing in the Portfolio
Allocation Risk—The allocation of investments among asset classes may have a significant effect on the Portfolio’s net asset value, or NAV, when the asset classes in which the Portfolio has invested more heavily perform worse than the asset classes invested in less heavily.
Interest Rate Risk—Changes in interest rates will affect the value of investments in fixed-income securities. When interest rates rise, the value of existing investments in fixed-income securities tends to fall and this decrease in value may not be offset by higher income from new investments. Interest rate risk is generally greater for fixed-income securities with longer maturities or durations.
25
| GLOBAL RISK ALLOCATION—MODERATE PORTFOLIO | ||
| NOTES TO FINANCIAL STATEMENTS | ||
| (continued) | AB Variable Products Series Fund | |
Credit Risk—An issuer or guarantor of a fixed-income security, or the counterparty to a derivatives or other contract, may be unable or unwilling to make timely payments of interest or principal, or to otherwise honor its obligations. The issuer or guarantor may default, causing a loss of the full principal amount of a security and accrued interest. The degree of risk for a particular security may be reflected in its credit rating. There is the possibility that the credit rating of a fixed-income security may be downgraded after purchase, which may adversely affect the value of the security.
High Yield Securities Risk—Investments in fixed-income securities with ratings below investment grade (commonly known as “junk bonds”) tend to have a higher probability that an issuer will default or fail to meet its payment obligations. These securities may be subject to greater price volatility due to such factors as specific corporate developments, interest rate sensitivity, negative perceptions of the junk bond market generally and less secondary market liquidity.
Foreign(Non-U.S.) Risk—Investments in securities ofnon-U.S. issuers may involve more risk than those of U.S. issuers. These securities may fluctuate more widely in price and may be more difficult to trade or dispose of due to adverse market, economic, political, regulatory or other factors.
Currency Risk—Fluctuations in currency exchange rates may negatively affect the value of the Portfolio’s investments or reduce its returns.
Investment in Other Investment Companies Risk—As with other investments, investments in other investment companies, including exchange-traded funds, or ETFs, are subject to market and selection risk. In addition, shareholders of the Portfolio bear both their proportionate share of expenses in the Portfolio (including advisory fees) and, indirectly, the expenses of the investment companies.
Derivatives Risk—The Portfolio may enter into derivative transactions such as forwards, options, futures and swaps. Derivatives may be illiquid, difficult to price, and leveraged so that small changes may produce disproportionate losses for the Portfolio, and subject to counterparty risk to a greater degree than more traditional investments. Derivatives may result in significant losses, including losses that are far greater than the value of the derivatives reflected on the statement of assets and liabilities.
Leverage Risk—When the Portfolio borrows money or otherwise leverages its investments, its performance may be volatile because leverage tends to exaggerate the effect of any increase or decrease in the value of the Portfolio’s investments. The Portfolio may create leverage through the use of reverse repurchase arrangements, forward currency exchange contracts, forward commitments, dollar rolls or futures or by borrowing money. The use of other types of derivative instruments by the Portfolio, such as options and swaps, may also result in a form of leverage. Leverage may result in higher returns to the Portfolio than if the Portfolio were not leveraged, but may also adversely affect returns, particularly if the market is declining.
Illiquidity Investment Risk—Illiquid investments risk exists when certain investments are or become difficult to purchase or sell. Difficulty in selling such investments may result in sales at disadvantageous prices affecting the value of your investment in the Portfolio. Causes of illiquid investments risk may include low trading volumes and large positions. Foreign fixed-income securities may have more illiquid investments risk because secondary trading markets for these securities may be smaller and less well developed and the securities may trade less frequently. Illiquid investments risk may be higher in a rising interest rate environment, when the value and liquidity of fixed-income securities generally decline.
Non-Diversification Risk—The Portfolio may have more risk because it is“non-diversified”, meaning that it can invest more of its assets in a smaller number of issuers. Accordingly, changes in the value of a single security may have a more significant effect, either negative or positive, on the Portfolio’s net asset value, or NAV.
LIBOR Risk—The Portfolio may invest in certain debt securities, derivatives or other financial instruments that utilize the London Interbank Offered Rate, or “LIBOR,” as a “benchmark” or “reference rate” for various interest rate calculations. In July 2017, the United Kingdom Financial Conduct Authority, which regulates LIBOR, announced a desire to phase out the use of LIBOR by the end of 2021. Although financial regulators and industry working groups have suggested alternative reference rates, such as European Interbank Offer Rate (“EURIBOR”), Sterling Overnight Interbank Average Rate (“SONIA”) and Secured Overnight Financing Rate (“SOFR”), global consensus on alternative rates is lacking and the process for amending existing contracts or instruments to transition away from LIBOR remains unclear. The elimination of LIBOR or changes to other reference rates or any other changes or reforms to the determination or supervision of reference rates could have an adverse impact on the market for, or value of, any securities or payments linked to those reference rates, which may adversely affect the Portfolio’s performance and/or net asset value. Uncertainty and risk also remain regarding
26
| AB Variable Products Series Fund | ||
the willingness and ability of issuers and lenders to include revised provisions in new and existing contracts or instruments. Consequently, the transition away from LIBOR to other reference rates may lead to increased volatility and illiquidity in markets that are tied to LIBOR, fluctuations in values of LIBOR-related investments or investments in issuers that utilize LIBOR, increased difficulty in borrowing or refinancing and diminished effectiveness of hedging strategies, adversely affecting the Portfolio’s performance. Furthermore, the risks associated with the expected discontinuation of LIBOR and transition may be exacerbated if the work necessary to effect an orderly transition to an alternative reference rate is not completed in a timely manner. Because the usefulness of LIBOR as a benchmark could deteriorate during the transition period, these effects could occur prior to the end of 2021.
Indemnification Risk—In the ordinary course of business, the Portfolio enters into contracts that contain a variety of indemnifications. The Portfolio’s maximum exposure under these arrangements is unknown. However, the Portfolio has not had prior claims or losses pursuant to these indemnification provisions and expects the risk of loss thereunder to be remote. Therefore, the Portfolio has not accrued any liability in connection with these indemnification provisions.
NOTE H : Joint Credit Facility
A number ofopen-end mutual funds managed by the Adviser, including the Portfolio, participate in a $325 million revolving credit facility (the “Facility”) intended to provide short-term financing, if necessary, subject to certain restrictions in connection with abnormal redemption activity. Commitment fees related to the Facility are paid by the participating funds and are included in miscellaneous expenses in the statement of operations. The Portfolio did not utilize the Facility during the year ended December 31, 2019.
NOTE I : Distributions to Shareholders
The tax character of distributions paid during the fiscal years ended December 31, 2019 and December 31, 2018 were as follows:
| 2019 | 2018 | |||||||
Distributions paid from: | ||||||||
Ordinary income | $ | 1,823,920 | $ | 3,216,260 | ||||
Net long-term capital gains | –0 | – | 1,952,754 | |||||
|
|
|
| |||||
Total taxable distributions | $ | 1,823,920 | $ | 5,169,014 | ||||
|
|
|
| |||||
As of December 31, 2019, the components of accumulated earnings/(deficit) on a tax basis were as follows:
Undistributed ordinary income | $ | 1,702,204 | ||
Undistributed capital gains | 2,253,707 | (a) | ||
Other losses | (59,206 | )(b) | ||
Unrealized appreciation/(depreciation) | 10,661,639 | (c) | ||
|
| |||
Total accumulated earnings/(deficit) | $ | 14,558,344 | ||
|
|
| (a) | During the fiscal year, the Portfolio utilized $717,270 of capital loss carry forwards to offset current year net realized gains. |
| (b) | As of December 31, 2019, the cumulative deferred loss on straddles was $59,206. |
| (c) | The differences between book-basis and tax-basis unrealized appreciation/(depreciation) are attributable primarily to the recognition for tax purposes of unrealized gains/losses on certain derivative instruments, the tax treatment of Treasury inflation-protected securities, and the tax deferral of losses on wash sales. |
For tax purposes, net realized capital losses may be carried over to offset future capital gains, if any. Funds are permitted to carry forward capital losses for an indefinite period, and such losses will retain their character as either short-term or long-term capital losses. As of December 31, 2019, the Portfolio did not have any capital loss carryforwards.
During the current fiscal year, there were no permanent differences that resulted in adjustments to distributable earnings or additional paid-in capital.
NOTE J : Recent Accounting Pronouncements
In March 2017, the Financial Accounting Standards Board issued an Accounting Standards Update, ASU2017-08, Receivables—Nonrefundable Fees and Other Costs (Subtopic310-20), Premium Amortization on Purchased Callable Debt Securities which amends the amortization period for certain purchased callable debt securities held at a premium, shortening such
27
| GLOBAL RISK ALLOCATION—MODERATE PORTFOLIO | ||
| NOTES TO FINANCIAL STATEMENTS | ||
| (continued) | AB Variable Products Series Fund | |
period to the earliest call date. ASU2017-08 does not require any accounting change for debt securities held at a discount; the discount continues to be amortized to maturity. ASU2017-08 is effective for fiscal years, and interim periods within those fiscal years, beginning after December 15, 2018. The Portfolio has adopted ASU2017-08, which did not have a material impact on the Portfolio’s financial position or the results of its operations, and had no impact on the Portfolio’s net assets.
In August 2018, the Financial Accounting Standards Board issued an Accounting Standards Update, ASU2018-13, Fair Value Measurement (Topic 820), Disclosure Framework—Changes to the Disclosure Requirements for Fair Value Measurement which removes, modifies and adds disclosures to Topic 820. The amendments in this ASU2018-13 (“ASU”) apply to all entities that are required, under existing U.S. GAAP, to make disclosures about recurring or nonrecurring fair value measurements. The amendments in this ASU are effective for all entities for fiscal years, and interim periods within those fiscal years, beginning after December 15, 2019. Management has evaluated the impact of the amendments and elected to early adopt the ASU. The adoption of this ASU did not have a material impact on the disclosure and presentation of the financial statements of the Portfolio.
NOTE K : Subsequent Events
Management has evaluated subsequent events for possible recognition or disclosure in the financial statements through the date the financial statements are issued. Management has determined that there are no material events that would require disclosure in the Portfolio’s financial statements through this date.
28
| GLOBAL RISK ALLOCATION—MODERATE PORTFOLIO | ||
| FINANCIAL HIGHLIGHTS | AB Variable Products Series Fund | |
Selected Data For A Share Of Capital Stock Outstanding Throughout Each Period
| CLASS A | ||||||||||||||||||||
| Year Ended December 31, | April 28, 2015(a) to December 31, 2015 | |||||||||||||||||||
| 2019 | 2018 | 2017 | 2016 | |||||||||||||||||
Net asset value, beginning of period | $9.79 | $10.83 | $9.78 | $9.40 | $10.00 | |||||||||||||||
|
|
|
|
|
|
|
|
|
| |||||||||||
Income From Investment Operations | ||||||||||||||||||||
Net investment income (b)(c) | .11 | .09 | .06 | .04 | .05 | |||||||||||||||
Net realized and unrealized gain (loss) on investment transactions and foreign currency transactions | 1.61 | (.55 | ) | 1.09 | .37 | (.65 | ) | |||||||||||||
Contributions from Affiliates | –0 | – | –0 | – | .00 | (d) | –0 | – | –0 | – | ||||||||||
|
|
|
|
|
|
|
|
|
| |||||||||||
Net increase (decrease) in net asset value from operations | 1.72 | (.46 | ) | 1.15 | .41 | (.60 | ) | |||||||||||||
|
|
|
|
|
|
|
|
|
| |||||||||||
Less: Dividends and Distributions | ||||||||||||||||||||
Dividends from net investment income | (.24 | ) | –0 | – | (.05 | ) | (.03 | ) | –0 | – | ||||||||||
Distributions from net realized gain on investment transactions | –0 | – | (.58 | ) | (.05 | ) | –0 | – | –0 | – | ||||||||||
|
|
|
|
|
|
|
|
|
| |||||||||||
Total dividends and distributions | (.24 | ) | (.58 | ) | (.10 | ) | (.03 | ) | –0 | – | ||||||||||
|
|
|
|
|
|
|
|
|
| |||||||||||
Net asset value, end of period | $11.27 | $9.79 | $10.83 | $9.78 | $9.40 | |||||||||||||||
|
|
|
|
|
|
|
|
|
| |||||||||||
Total Return | ||||||||||||||||||||
Total investment return based on net asset value (e) | 17.61 | % | (4.62 | )% | 11.87 | % | 4.39 | % | (6.00 | )% | ||||||||||
Ratios/Supplemental Data | ||||||||||||||||||||
Net assets, end of period (000’s omitted) | $12 | $11 | $12 | $11 | $10 | |||||||||||||||
Ratio to average net assets of: | ||||||||||||||||||||
Expenses, net of waivers/reimbursements (f)(g)‡ | .68 | % | .67 | % | .63 | % | .63 | % | .69 | %^ | ||||||||||
Expenses, before waivers/reimbursements (f)(g)‡ | .95 | % | .92 | % | .94 | % | 1.08 | % | 3.21 | %^ | ||||||||||
Net investment income (c) | 1.05 | % | .88 | % | .55 | % | .46 | % | .82 | %^ | ||||||||||
Portfolio turnover rate | 29 | % | 67 | % | 59 | % | 79 | % | 111 | % | ||||||||||
‡ Expense ratios exclude the estimated acquired fund fees of the affiliated/unaffiliated underlying |
| |||||||||||||||||||
portfolios | .07 | % | .08 | % | .11 | % | .12 | % | .06 | % | ||||||||||
See footnote summary on page 31.
29
| GLOBAL RISK ALLOCATION—MODERATE PORTFOLIO | ||
| FINANCIAL HIGHLIGHTS | ||
| (continued) | AB Variable Products Series Fund | |
Selected Data For A Share Of Capital Stock Outstanding Throughout Each Period
| CLASS B | ||||||||||||||||||||
| Year Ended December 31, | April 28, 2015(a) to December 31, 2015 | |||||||||||||||||||
| 2019 | 2018 | 2017 | 2016 | |||||||||||||||||
Net asset value, beginning of period | $9.72 | $10.78 | $9.75 | $9.39 | $10.00 | |||||||||||||||
|
|
|
|
|
|
|
|
|
| |||||||||||
Income From Investment Operations | ||||||||||||||||||||
Net investment income (b)(c) | .08 | .07 | .03 | .02 | .01 | |||||||||||||||
Net realized and unrealized gain (loss) on investment transactions and foreign currency transactions | 1.60 | (.55 | ) | 1.09 | .37 | (.62 | ) | |||||||||||||
Contributions from Affiliates | –0 | – | –0 | – | .00 | (d) | –0 | – | –0 | – | ||||||||||
|
|
|
|
|
|
|
|
|
| |||||||||||
Net increase (decrease) in net asset value from operations | 1.68 | (.48 | ) | 1.12 | .39 | (.61 | ) | |||||||||||||
|
|
|
|
|
|
|
|
|
| |||||||||||
Less: Dividends and Distributions | ||||||||||||||||||||
Dividends from net investment income | (.21 | ) | –0 | – | (.04 | ) | (.03 | ) | –0 | – | ||||||||||
Distributions from net realized gain on investment transactions | –0 | – | (.58 | ) | (.05 | ) | –0 | – | –0 | – | ||||||||||
|
|
|
|
|
|
|
|
|
| |||||||||||
Total dividends and distributions | (.21 | ) | (.58 | ) | (.09 | ) | (.03 | ) | –0 | – | ||||||||||
|
|
|
|
|
|
|
|
|
| |||||||||||
Net asset value, end of period | $11.19 | $9.72 | $10.78 | $9.75 | $9.39 | |||||||||||||||
|
|
|
|
|
|
|
|
|
| |||||||||||
Total Return | ||||||||||||||||||||
Total investment return based on net asset value (e) | 17.32 | % | (4.84 | )% | 11.50 | % | 4.24 | % | (6.20 | )% | ||||||||||
Ratios/Supplemental Data | ||||||||||||||||||||
Net assets, end of period (000’s omitted) | $95,350 | $89,127 | $98,502 | $79,298 | $51,115 | |||||||||||||||
Ratio to average net assets of: | ||||||||||||||||||||
Expenses, net of waivers/reimbursements (f)(g)‡ | .94 | % | .92 | % | .89 | % | .88 | % | .94 | %^ | ||||||||||
Expenses, before waivers/reimbursements (f)(g)‡ | 1.20 | % | 1.16 | % | 1.17 | % | 1.33 | % | 1.62 | %^ | ||||||||||
Net investment income (c) | .78 | % | .64 | % | .31 | % | .24 | % | .19 | %^ | ||||||||||
Portfolio turnover rate | 29 | % | 67 | % | 59 | % | 79 | % | 111 | % | ||||||||||
‡ Expense ratios exclude the estimated acquired fund fees of the affiliated/unaffiliated underlying |
| |||||||||||||||||||
portfolios | .07 | % | .08 | % | .11 | % | .12 | % | .06 | % | ||||||||||
See footnote summary on page 31.
30
| AB Variable Products Series Fund | ||
| (a) | Commencement of operations. |
| (b) | Based on average shares outstanding. |
| (c) | Net of expenses waived/reimbursed by the Adviser. |
| (d) | Amount is less than $.005. |
| (e) | Total investment return is calculated assuming an initial investment made at the net asset value at the beginning of the period, reinvestment of all dividends and distributions at net asset value during the period, and redemption on the last day of the period. Total return does not reflect (i) insurance company’s separate account related expense charges and (ii) the deductions of taxes that a shareholder would pay on Portfolio distributions or the redemption of Portfolio shares. Total investment return calculated for a period of less than one year is not annualized. |
| (f) | In connection with the Portfolio’s investments in affiliated/unaffiliated underlying portfolios, the Portfolio incurs no direct expenses, but bears proportionate shares of the fees and expenses (i.e., operating, administrative and investment advisory fees) of the affiliated/unaffiliated underlying portfolios. The Adviser has contractually agreed to waive its fees from the Portfolio in an amount equal to the Portfolio’s pro rata share of affiliated/unaffiliated acquired fund fees and expenses, and for the year ended December 31, 2019, December 31, 2018, December 31, 2017 December 31, 2016 and December 31, 2015, such waiver amounted to .07%, .08%, .11%, .12% and .06%, respectively. |
| (g) | The expense ratios presented below exclude interest/bank overdraft expense: |
| Year Ended December 31, | April 28, 2015(a) to December 31, 2015 | |||||||||||||||||||
| 2019 | 2018 | 2017 | 2016 | |||||||||||||||||
Class A | ||||||||||||||||||||
Net of waivers/reimbursements | .68 | % | N/A | N/A | N/A | N/A | ||||||||||||||
Before waivers/reimbursements | .94 | % | N/A | N/A | N/A | N/A | ||||||||||||||
Class B | ||||||||||||||||||||
Net of waivers/reimbursements | .93 | % | N/A | N/A | N/A | N/A | ||||||||||||||
Before waivers/reimbursements | 1.19 | % | N/A | N/A | N/A | N/A | ||||||||||||||
| ^ | Annualized. |
See notes to financial statements.
31
| REPORT OF INDEPENDENT REGISTERED | ||
| PUBLIC ACCOUNTING FIRM | AB Variable Products Series Fund | |
To the Shareholders and the Board of Directors of AB Global Risk Allocation-Moderate Portfolio:
Opinion on the Financial Statements
We have audited the accompanying statement of assets and liabilities of AB Global Risk Allocation-Moderate Portfolio (the “Portfolio”) (one of the portfolios constituting AB Variable Products Series Fund, Inc. (the “Fund”)), including the portfolio of investments, as of December 31, 2019, and the related statement of operations for the year then ended, the statements of changes in net assets for each of the two years in the period then ended, the financial highlights for each of the four years in the period then ended and the period from April 28, 2015 (commencement of operations) to December 31, 2015 and the related notes (collectively referred to as the “financial statements”). In our opinion, the financial statements present fairly, in all material respects, the financial position of the Portfolio (one of the portfolios constituting AB Variable Products Series Fund, Inc.) at December 31, 2019, the results of its operations for the year then ended, the changes in its net assets for each of the two years in the period then ended and its financial highlights for each of the four years in the period then ended and the period from April 28, 2015 to December 31, 2015, in conformity with U.S. generally accepted accounting principles.
Basis for Opinion
These financial statements are the responsibility of the Fund’s management. Our responsibility is to express an opinion on the Portfolio’s financial statements based on our audits. We are a public accounting firm registered with the Public Company Accounting Oversight Board (United States) (“PCAOB”) and are required to be independent with respect to the Fund in accordance with the U.S. federal securities laws and the applicable rules and regulations of the Securities and Exchange Commission and the PCAOB.
We conducted our audits in accordance with the standards of the PCAOB. Those standards require that we plan and perform the audit to obtain reasonable assurance about whether the financial statements are free of material misstatement, whether due to error or fraud. The Fund is not required to have, nor were we engaged to perform, an audit of the Fund’s internal control over financial reporting. As part of our audits, we are required to obtain an understanding of internal control over financial reporting, but not for the purpose of expressing an opinion on the effectiveness of the Fund’s internal control over financial reporting. Accordingly, we express no such opinion.
Our audits included performing procedures to assess the risks of material misstatement of the financial statements, whether due to error or fraud, and performing procedures that respond to those risks. Such procedures included examining, on a test basis, evidence regarding the amounts and disclosures in the financial statements. Our procedures included confirmation of securities owned as of December 31, 2019, by correspondence with the custodian and others or by other appropriate auditing procedures where replies from others were not received. Our audits also included evaluating the accounting principles used and significant estimates made by management, as well as evaluating the overall presentation of the financial statements. We believe that our audits provide a reasonable basis for our opinion.

We have served as the auditor of one or more of the AB investment companies since 1968.
New York, New York
February 14, 2020
32
| 2019 FEDERAL TAX INFORMATION (unaudited) | AB Variable Products Series Fund | |
For Federal income tax purposes, the following information is furnished with respect to the distributions paid by the Portfolio during the taxable year ended December 31, 2019. For corporate shareholders, 27.95% of dividends paid qualify for the dividends received deduction.
33
| GLOBAL RISK ALLOCATION— | ||
| MODERATE PORTFOLIO | AB Variable Products Series Fund | |
| BOARD OF DIRECTORS | ||
| Marshall C. Turner, Jr.(1),Chairman | Robert M. Keith,President and Chief Executive Officer | |
| Jorge A. Bermudez^ | Carol C. McMullen(1) | |
| Michael J. Downey(1) | Garry L. Moody(1) | |
| Nancy P. Jacklin(1) | Earl D. Weiner(1) | |
| OFFICERS | ||
Daniel J. Loewy(2),Vice President Leon Zhu(2),Vice President Emilie D. Wrapp,Secretary Michael B. Reyes,Senior Analyst | Joseph J. Mantineo,Treasurer and Phyllis J. Clarke,Controller Vincent S. Noto,Chief Compliance Officer | |
CUSTODIAN AND ACCOUNTING AGENT State Street Bank and Trust Company State Street Corporation CCB/5 1 Iron Street Boston, MA 02210 | INDEPENDENT REGISTERED PUBLIC ACCOUNTING FIRM Ernst & Young LLP 5 Times Square New York, NY 10036 | |
PRINCIPAL UNDERWRITER AllianceBernstein Investments, Inc. 1345 Avenue of the Americas New York, NY 10105 | LEGAL COUNSEL Seward & Kissel LLP One Battery Park Plaza New York, NY 10004 | |
TRANSFER AGENT AllianceBernstein Investor Services, Inc. P.O. Box 786003 San Antonio, TX 78278-6003 Toll-Free (800) 221-5672 |
| (1) | Member of the Audit Committee, the Governance and Nominating Committee, and the Independent Directors Committee. |
| (2) | The day-to-day management of, and investment decisions for, the Fund are made by the Adviser’s Quantitative Investment Team. Messrs. Loewy and Zhu are the investment professionals with the most significant responsibility for the day-to-day management of the Fund’s portfolio. |
| ^ | Mr. Bermudez will be a member of the Audit Committee, the Governance and Nominating Committee, and the Independent Directors Committee when he joins the Board on January 1, 2020. |
34
| GLOBAL RISK ALLOCATION—MODERATE PORTFOLIO | ||
| MANAGEMENT OF THE FUND | AB Variable Products Series Fund | |
NAME, ADDRESS*, AGE, (YEAR FIRST ELECTED**) | PRINCIPAL OCCUPATION(S) DURING PAST FIVE YEARS AND OTHER INFORMATION*** | PORTFOLIOS IN AB FUND COMPLEX OVERSEEN BY DIRECTOR | OTHER PUBLIC COMPANY DIRECTORSHIPS CURRENTLY HELD BY DIRECTOR | |||||
| INTERESTED DIRECTOR | ||||||||
Robert M. Keith, # 1345 Avenue of the Americas New York, NY 10105 59 (2010) | Senior Vice President of AllianceBernstein L.P. (the “Adviser”) and the head of AllianceBernstein Investments, Inc. (“ABI”) since July 2008; Director of ABI and President of the AB Mutual Funds. Previously, he served as Executive Managing Director of ABI from December 2006 to June 2008. Prior to joining ABI in 2006, Executive Managing Director of Bernstein Global Wealth Management, and prior thereto, Senior Managing Director and Global Head of Client Service and Sales of the Adviser’s institutional investment management business since 2004. Prior thereto, he was Managing Director and Head of North American Client Service and Sales in the Adviser’s institutional investment management business, with which he had been associated since prior to 2004. | 91 | None | |||||
| DISINTERESTED DIRECTORS | ||||||||
Marshall C. Turner, Jr., ## Chairman of the Board 78 (2005) | Private Investor since prior to 2015. Former Chairman and CEO of Dupont Photomasks, Inc. (components of semi-conductor manufacturing). He has extensive operating leadership and venture capital investing experience, including five interim or full-time CEO roles, and prior service as general partner of institutional venture capital partnerships. He also has extensive non-profit board leadership experience, and currently serves on the boards of two education and science-related non-profit organizations. He has served as a director of one AB Fund since 1992, and director or trustee of all AB Funds since 2005. He has been Chairman of the AB Funds since January 2014, and the Chairman of the Independent Directors Committees of such AB Funds since February 2014. | 91 | Xilinx, Inc. (programmable logic semi-conductors) since 2007 | |||||
Jorge A. Bermudez,^ 68 (2020) | Private investor since prior to 2015. Former Chief Risk Officer of Citigroup, Inc., a global financial services company, from November 2007 to March 2008, Chief Executive Officer of Citigroup’s Commercial Business Group in North America and Citibank Texas from 2005 to 2007, and a variety of other executive and leadership roles at various businesses within Citigroup prior to then; Chairman (2018) of the Texas A&M Foundation Board of Trustees (Trustee since 2013) and Chairman of the Smart Grid Center Board at Texas A&M University since 2012; director of, among others, Citibank N.A. from 2005 to 2008, the Federal Reserve Bank of Dallas, Houston Branch from 2009 to 2011, the Federal Reserve Bank of Dallas from 2011 to 2017, and the Electric Reliability Council of Texas from 2010 to 2016. He has served as director or trustee of the AB Funds since 2020. | 91 | Moody’s Corporation since April 2011 | |||||
35
| GLOBAL RISK ALLOCATION—MODERATE PORTFOLIO | ||
| MANAGEMENT OF THE FUND | ||
| (continued) | AB Variable Products Series Fund | |
NAME, ADDRESS*, AGE, (YEAR FIRST ELECTED**) | PRINCIPAL OCCUPATION(S) DURING PAST FIVE YEARS AND OTHER INFORMATION*** | PORTFOLIOS IN AB FUND COMPLEX OVERSEEN BY DIRECTOR | OTHER PUBLIC COMPANY DIRECTORSHIPS CURRENTLY HELD BY DIRECTOR | |||||
DISINTERESTED DIRECTORS (continued) | ||||||||
Michael J. Downey, ## 76 (2005) | Private Investor since prior to 2015. Formerly, Chairman of The Asia Pacific Fund, Inc. (registered investment company) since prior to 2015 until January 2019. From 1987 until 1993, Chairman and CEO of Prudential Mutual Fund Management, director of the Prudential mutual funds, and member of the Executive Committee of Prudential Securities, Inc. He has served as a director or trustee of the AB Funds since 2005. | 91 | None | |||||
Nancy P. Jacklin, ## 71 (2006) | Private Investor since prior to 2015. Professorial Lecturer at the Johns Hopkins School of Advanced International Studies (2008–2015). U.S. Executive Director of the International Monetary Fund (which is responsible for ensuring the stability of the international monetary system), (December 2002–May 2006); Partner, Clifford Chance (1992–2002); Sector Counsel, International Banking and Finance, and Associate General Counsel, Citicorp (1985–1992); Assistant General Counsel (International), Federal Reserve Board of Governors (1982–1985); and Attorney Advisor, U.S. Department of the Treasury (1973–1982). Member of the Bar of the District of Columbia and of New York; and member of the Council on Foreign Relations. She has served as a director or trustee of the AB Funds since 2006 and has been Chair of the Governance and Nominating Committees of the AB Funds since August 2014. | 91 | None | |||||
Carol C. McMullen, ## 64 (2016) | Managing Director of Slalom Consulting (consulting) since 2014, private investor and member of the Advisory Board of Butcher Box (since 2018). Formerly, member, Partners Healthcare Investment Committee (2010–2019); Director of Norfolk & Dedham Group (mutual property and casualty insurance) from 2011 until November 2016; Director of Partners Community Physicians Organization (healthcare) from 2014 until December 2016; and Managing Director of The Crossland Group (consulting) from 2012 until 2013. She has held a number of senior positions in the asset and wealth management industries, including at Eastern Bank (where her roles included President of Eastern Wealth Management), Thomson Financial (Global Head of Sales for Investment Management), and Putnam Investments (where her roles included Chief Investment Officer, Core and Growth and Head of Global Investment Research). She has served on a number of private company and non-profit boards, and as a director or trustee of the AB Funds since June 2016. | 91 | None | |||||
36
| AB Variable Products Series Fund | ||
NAME, ADDRESS*, AGE, (YEAR FIRST ELECTED**) | PRINCIPAL OCCUPATION(S) DURING PAST FIVE YEARS AND OTHER INFORMATION*** | PORTFOLIOS IN AB FUND COMPLEX OVERSEEN BY DIRECTOR | OTHER PUBLIC COMPANY DIRECTORSHIPS CURRENTLY HELD BY DIRECTOR | |||||
DISINTERESTED DIRECTORS (continued) | ||||||||
Garry L. Moody, ## 67 (2008) | Formerly, Partner, Deloitte & Touche LLP (1995–2008) where he held a number of senior positions, including Vice Chairman, and U.S. and Global Investment Management Practice Managing Partner; President, Fidelity Accounting and Custody Services Company (1993–1995), where he was responsible for accounting, pricing, custody, and reporting for the Fidelity mutual funds; and Partner, Ernst & Young LLP (1975–1993), where he served as the National Director of Mutual Fund Tax Services and Managing Partner of its Chicago Office Tax department. He is a member of the Trustee Advisory Board of BoardIQ, a biweekly publication focused on issues and news affecting directors of mutual funds. He is also a member of the Investment Company Institute’s Board of Governors and the Independent Directors Council Governing Council. He has served as a director or trustee, and as Chairman of the Audit Committees of the AB Funds since 2008. | 91 | None | |||||
Earl D. Weiner, ## 80 (2007) | Senior Counsel since 2017, Of Counsel from 2007 to 2016, and Partner prior to then, of the law firm Sullivan & Cromwell LLP. He is a former member of the ABA Federal Regulation of Securities Committee Task Force to draft editions of the Fund Director’s Guidebook. He also serves as a director or trustee of various non-profit organizations and has served as Chairman or Vice Chairman of a number of them. He has served as a director or trustee of the AB Funds since 2007 and served as Chairman of the Governance and Nominating Committees of the AB Funds from 2007 until August 2014. | 91 | None | |||||
| * | The address for each of the Fund’s disinterested Directors is c/o AllianceBernstein L.P., Attention: Legal & Compliance Department—Mutual Fund Legal, 1345 Avenue of the Americas, New York, NY 10105 |
| ** | There is no stated term of office for the Fund’s Directors. |
| *** | The information above includes each Director’s principal occupation during the last five years and other information relating to the experience, attributes, and skills relevant to each Director’s qualifications to serve as a Director, which led to the conclusion that each Director should serve as a Director for the Fund. |
| # | Mr. Keith is an “interested person” of the Fund, as defined in the 1940 Act, due to this position as a Senior Vice President of the Adviser. |
| ## | Member of the Audit Committee, the Governance and Nominating Committee, and the Independent Directors Committee. |
| ^ | Mr. Bermudez will be a member of the Audit Committee, the Governance and Nominating Committee, and the Independent Directors Committee when he joins the Board on January 1, 2020. |
37
| GLOBAL RISK ALLOCATION—MODERATE PORTFOLIO | ||
| MANAGEMENT OF THE FUND | ||
| (continued) | AB Variable Products Series Fund | |
Officer Information
Robert M. Keith 59 | President and Chief Executive Officer | See biography above. | ||
Daniel J. Loewy 45 | Vice President | Senior Vice President of the Adviser**, with which he has been associated since prior to 2015. He is also Chief Investment Officer and Head of Multi-Asset Solutions and Chief Investment Officer for Dynamic Asset Allocation. | ||
Leon Zhu 52 | Vice President | Senior Vice President of the Adviser**, with which he has been associated since prior to 2015. | ||
Emilie D. Wrapp 64 | Secretary | Senior Vice President, Assistant General Counsel and Assistant Secretary of ABI**, with which she has been associated since prior to 2015. | ||
Michael B. Reyes | Senior Analyst | Vice President of the Adviser**, with which he has been associated since prior to 2015. | ||
Joseph J. Mantineo 60 | Treasurer and Chief Financial Officer | Senior Vice President of AllianceBernstein Investor Services (“ABIS”)**, with which he has been associated since prior to 2015. | ||
Phyllis J. Clarke 59 | Controller | Vice President of ABIS**, with which she has been associated since prior to 2015. | ||
Vincent S. Noto 55 | Chief Compliance Officer | Senior Vice President since 2015 and Mutual Fund Chief Compliance Officer since prior to 2015. |
| * | The address for each of the Fund’s Officers is 1345 Avenue of the Americas, New York, NY 10105. |
| ** | The Adviser, ABI and ABIS are affiliates of the Fund. |
| The Fund’s Statement of Additional Information (“SAI”) has additional information about the Fund’s Directors and Officers and is available without charge upon request. Contact your financial representative or AB at (800) 227-4618, or visit www.abfunds.com, for a free prospectus or SAI. |
38
| GLOBAL RISK ALLOCATION—MODERATE PORTFOLIO | ||
| CONTINUANCE DISCLOSURE | AB Variable Products Series Fund | |
INFORMATION REGARDING THE REVIEW AND APPROVAL OF THE FUND’S ADVISORY AGREEMENT
At a meeting of the Board of Directors of AB Variable Products Series Fund, Inc. (the “Company”) held onNovember 4-6, 2019 (the “November 2019 Meeting”), the Adviser recommended an amendment to the Company’s current Advisory Agreement with the Adviser in respect of AB Global Risk Allocation—Moderate Portfolio (the “Fund”) to reflect the addition of breakpoints to the Fund’s current flat advisory fee schedule (the “Amended Agreement”) effective January 1, 2020. The Adviser explained that the proposed breakpoints were in connection with changes in the business model of the Fund’s sole investor (the “Sole Investor”) and its plan to transfer a significant amount of assets from two other investment funds to the Fund in late 2020 or early 2021 (the “substitution transaction”). The Adviser noted that the proposed changes to the Fund’s advisory fee schedule are specifically linked to the Sole Investor’s substitution transaction and the associated significant asset increase.
At the recommendation of the Adviser, the disinterested directors (the “directors”) unanimously approved the Amended Agreement. The amendment to the Fund’s current advisory agreement to reflect the addition of breakpoints does not require shareholder approval.
The directors approved the continuance of the Fund’s current advisory agreement at a meeting held onJuly 30-31, 2019 (the “July 2019 Meeting”).
Prior to approval of the Amended Advisory Agreement, the directors had requested from the Adviser, and received and evaluated, extensive materials. They reviewed the proposed Amended Advisory Agreement with the Adviser and with experienced counsel who are independent of the Adviser, who advised on the relevant legal standards. The directors also reviewed additional materials, including materials prepared by the Senior Analyst for the Fund. The directors also discussed the proposed approval in private sessions with counsel.
The directors considered their knowledge of the nature and quality of the services provided by the Adviser to the Fund gained from their experience as directors or trustees of most of the registered investment companies advised by the Adviser, their overall confidence in the Adviser’s integrity and competence they have gained from that experience, the Adviser’s initiative in identifying and raising potential issues with the directors and its responsiveness, frankness and attention to concerns raised by the directors in the past, including the Adviser’s willingness to consider and implement organizational and operational changes designed to improve investment results and the services provided to the AB Funds. The directors noted that they have four regular meetings each year, at each of which they review extensive materials and information from the Adviser, including information on the investment performance of the Fund and the underlying fund advised by the Adviser in which the Fund invests.
The directors also considered all factors they believed relevant, including the specific matters discussed below. During the course of their deliberations, the directors evaluated, among other things, the reasonableness of the proposed advisory fee. The directors did not identify any particular information that wasall-important or controlling, and different directors may have attributed different weights to the various factors. The directors determined that the selection of the Adviser to manage the Fund and the overall arrangements between the Fund and the Adviser, as provided in the Amended Advisory Agreement, including the proposed advisory fee, were fair and reasonable in light of the services performed, expenses incurred and such other matters as the directors considered relevant in the exercise of their business judgment. The material factors and conclusions that formed the basis for the directors’ determinations included the following:
Nature, Extent and Quality of Services Provided
The directors considered the scope and quality of services provided by the Adviser under the Amended Advisory Agreement, including the quality of the investment research capabilities of the Adviser and the other resources it has dedicated to performing services for the Fund. The directors noted that the Adviser from time to time reviews the Fund’s investment strategies and from time to time proposes changes intended to improve the Fund’s relative or absolute performance for the directors’ consideration. They also noted the professional experience and qualifications of the Fund’s portfolio management team and other senior personnel of the Adviser. The directors also considered that the Amended Advisory Agreement provides that the Fund will reimburse the Adviser for the cost to it of providing certain clerical, accounting, administrative and other services to the Fund by employees of the Adviser or its affiliates. Requests for these reimbursements are made on a quarterly basis and subject to approval by the directors. Reimbursements, to the extent requested and paid, result in a higher rate of total compensation from the Fund to the Adviser than the fee rate stated in the Amended Advisory Agreement. The directors noted that the methodology used to determine the reimbursement amounts had been reviewed by an independent
39
| GLOBAL RISK ALLOCATION—MODERATE PORTFOLIO | ||
| CONTINUANCE DISCLOSURE | ||
| (continued) | AB Variable Products Series Fund | |
consultant retained by the Fund’s former Senior Officer/Independent Compliance Officer. The quality of administrative and other services, including the Adviser’s role in coordinating the activities of the Fund’s other service providers, also was considered. The directors concluded that, overall, they were satisfied with the nature, extent and quality of services provided to the Fund under the Amended Advisory Agreement.
Costs of Services Provided and Profitability
In connection with their approval of the continuance of the Fund’s current advisory agreement at the July 2019 Meeting, the directors reviewed a schedule of the revenues and expenses and related notes indicating the profitability of the Fund to the Adviser for calendar years 2017 and 2018 that had been prepared with an expense allocation methodology arrived at in consultation with an independent consultant retained by the Fund’s former Senior Officer/Independent Compliance Officer. The Adviser agreed to provide the directors with profitability information in connection with future proposed continuances of the Amended Agreement.
Fall-Out Benefits
The directors considered the other benefits to the Adviser and its affiliates from their relationships with the Fund and the underlying fund advised by the Adviser in which the Fund invests, including, but not limited to, benefits relating to soft dollar arrangements (whereby investment advisers receive brokerage and research services from brokers that execute agency transactions for their clients);12b-1 fees and sales charges received by the Fund’s principal underwriter (which is a wholly owned subsidiary of the Adviser) in respect of the Fund’s Class B shares; brokerage commissions paid by the Fund to brokers affiliated with the Adviser; and transfer agency fees paid by the Fund to a wholly owned subsidiary of the Adviser. The directors recognized that the Adviser’s future profitability would be somewhat lower without these benefits. The directors understood that the Adviser also might derive reputational and other benefits from its association with the Fund.
Investment Results
In addition to the information reviewed by the directors in connection with the November 2019 Meeting, the directors receive detailed performance information for the Fund at each regular Board meeting during the year.
At the July 2019 Meeting, the directors reviewed performance information prepared by an independent service provider (the “15(c) service provider”), showing the performance of the Class A Shares of the Fund against a group of similar funds (“peer group”) and a larger group of similar funds (“peer universe”), each selected by the 15(c) service provider, and information prepared by the Adviser showing performance of the Class A Shares against a broad-based securities market index, in each case for the1- and3-year periods ended May 31, 2019 and (in the case of comparisons with the broad-based securities market index) for the period from inception. At the November 2019 Meeting, the directors reviewed updated performance information of the Class A Shares. Based on their review, the directors concluded that the Fund’s investment performance was acceptable.
Advisory Fees and Other Expenses
The directors considered the proposed advisory fee rate payable by the Fund to the Adviser and updated pro forma information from the Fund’s Senior Analyst based on information prepared by the 15(c) service provider concerning advisory fee rates payable by other funds in the same category as the Fund for the July 2019 Meeting. The directors recognized that it is difficult to make comparisons of advisory fees because there are variations in the services that are included in the fees paid by other funds. The directors compared the Fund’s pro forma effective contractual advisory fee rate (based on projected net assets of $1.09 billion) with a peer group median and took into account the impact on the proposed advisory fee rate of the administrative expense reimbursement payable to the Adviser pursuant to the expense reimbursement provision in the Amended Advisory Agreement.
At the July 2019 Meeting, the directors also considered the Adviser’s fee schedule for other clients utilizing investment strategies similar to those of the Fund. For this purpose, they reviewed the relevant advisory fee information from the Adviser’s Form ADV and in a report from the Fund’s Senior Analyst and noted the differences between the Fund’s fee schedule, on the one hand, and the Adviser’s institutional fee schedule and the schedule of fees charged by the Adviser to any offshore funds and for services to anysub-advised funds utilizing investment strategies similar to those of the Fund, on the other. The directors noted that the Adviser may, in some cases, agree to fee rates with large institutional clients that are lower than those reviewed by the directors and that they had previously discussed with the Adviser its policies in respect of such arrangements. The directors previously discussed these matters with an independent fee consultant. The directors also compared the advisory fee rate for the Fund with that for another fund advised by the Adviser with similar investment strategies.
40
| AB Variable Products Series Fund | ||
At the July 2019 Meeting, the Adviser reviewed with the directors the significantly greater scope of the services it provides to the Fund relative to institutional, offshore fund andsub-advised fund clients. In this regard, the Adviser noted, among other things, that, compared to institutional and offshore orsub-advisory accounts, the Fund (i) demands considerably more portfolio management, research and trading resources due to significantly higher daily cash flows; (ii) has more tax and regulatory restrictions and compliance obligations; (iii) must prepare and file or distribute regulatory and other communications about fund operations; and (iv) must provide shareholder servicing to retail investors. The Adviser also reviewed the greater legal risks presented by the large and changing population of Fund shareholders who may assert claims against the Adviser in individual or class actions, and the greater entrepreneurial risk in offering new fund products, which require substantial investment to launch, may not succeed, and generally must be priced to compete with larger, more established funds resulting in lack of profitability to the Adviser until a new fund achieves scale. In light of the substantial differences in services rendered by the Adviser to institutional, offshore fund andsub-advised fund clients as compared to the Fund, and the different risk profile, the directors considered these fee comparisons inapt and did not place significant weight on them in their deliberations.
At the July 2019 Meeting, the directors noted that the Fund invests in shares of exchange-traded funds (“ETFs”), subject to the restrictions and limitations of the Investment Company Act of 1940 as these may be varied as a result of exemptive orders issued by the SEC. The directors also noted that ETFs pay advisory fees pursuant to their advisory contracts, and that the Adviser had provided, and they had reviewed, information about the expense ratios of the relevant ETFs. The directors concluded, based on the Adviser’s explanation of how it uses ETFs when they are the most cost-effective way to obtain desired exposures, in some cases pending purchases of underlying securities, that the advisory fee for the Fund is for services that are in addition to, rather than duplicative of, the services provided under the advisory contracts of the ETFs.
In connection with their review of the Fund’s proposed advisory fee, the directors also considered the pro forma total expense ratio of the Class B shares of the Fund (the pro forma information assumes $1.09 billion in Class B Shares) in comparison to a peer group and a peer universe selected by the 15(c) service provider for the July 2019 Meeting. The pro forma Class B expense ratio of the Fund was based on the Fund’s projected net assets of $1.09 billion and the directors considered the Adviser’s expense cap for the Class B Shares of the Fund. The directors noted that it was likely that the expense ratios of some of the other funds in the Fund’s category were lowered by waivers or reimbursements by those funds’ investment advisers, which in some cases might be voluntary or temporary. The directors view expense ratio information as relevant to their evaluation of the Adviser’s services because the Adviser is responsible for coordinating services provided to the Fund by others. Based on their review, the directors concluded that the Fund’s pro forma expense ratio was acceptable.
Economies of Scale
The directors noted that the proposed advisory fee schedule for the Fund contains breakpoints that reduce the fee rates on assets above specified levels. The directors took into consideration prior presentations by an independent consultant on economies of scale in the mutual fund industry and for the AB Funds, and presentations from time to time by the Adviser concerning certain of its views on economies of scale. The directors also previously discussed economies of scale with an independent fee consultant. The directors also had requested and received from the Adviser certain updates on economies of scale in advance of the November 2019 Meeting. The directors believe that economies of scale may be realized (if at all) by the Adviser across a variety of products and services, and not only in respect of a single fund. The directors noted that there is no established methodology for setting breakpoints that give effect to the fund-specific services provided by a fund’s adviser and to the economies of scale that an adviser may realize in its overall mutual fund business or those components of it which directly or indirectly affect a fund’s operations. The directors observed that in the mutual fund industry as a whole, as well as among funds similar to the Fund, there is no uniformity or pattern in the fees and asset levels at which breakpoints (if any) apply. The directors also noted that the advisory agreements for many funds do not have breakpoints at all. Having taken these factors into account, the directors concluded that the Fund’s shareholders would benefit from a sharing of economies of scale in the event the Fund’s net assets exceed a breakpoint in the future.
41
VPS-GRA-0151-1219
DEC 12.31.19

ANNUAL REPORT
AB VARIABLE PRODUCTS
SERIES FUND, INC.
| + | GLOBAL THEMATIC GROWTH PORTFOLIO |
Beginning on May 1, 2021, as permitted by regulations adopted by the Securities and Exchange Commission, you may not be receiving paper copies of the Portfolio’s shareholder reports from the insurance company that offers your contract unless you specifically request paper copies from the insurance company or from your financial intermediary. Instead of delivering paper copies of the reports, the insurance company may choose to make the reports available on a website, and will notify you by mail each time a report is posted and provide you with a website link to access the report. Instructions for requesting paper copies will be provided by your insurance company.
If you already elected to receive shareholder reports electronically, you will not be affected by this change and you need not take any action. You may elect to receive shareholder reports and other communications from the insurance company or your financial intermediary electronically by following the instructions provided by the insurance company or by contacting your financial intermediary.
You may elect to receive all future reports in paper free of charge from the insurance company. You can inform the insurance company or your financial intermediary that you wish to continue receiving paper copies of your shareholder reports by following the instructions provided by the insurance company or by contacting your financial intermediary. Your election to receive reports in paper will apply to all portfolio companies available under your contract with the insurance company.
Investment Products Offered
| • | Are Not FDIC Insured |
| • | May Lose Value |
| • | Are Not Bank Guaranteed |
AllianceBernstein Investments, Inc. (ABI) is the distributor of the AB family of mutual funds. ABI is a member of FINRA and is an affiliate of AllianceBernstein L.P., the Adviser of the funds.
You may obtain a description of the Fund’s proxy voting policies and procedures, and information regarding how the Fund voted proxies relating to portfolio securities during the most recent12-month period ended June 30, without charge. Simply visit AB’s website at www.abfunds.com or go to the Securities and Exchange Commission’s (the “Commission”) website at www.sec.gov, or call AB at (800) 227 4618.
The Fund files its complete schedule of portfolio holdings with the Commission for the first and third quarters of each fiscal year as an exhibit to its reports on Form N-PORT. The Fund’s Form N-PORT reports are available on the Commission’s website at www.sec.gov. The Fund’s Forms N-PORT may also be reviewed and copied at the Commission’s Public Reference Room in Washington, DC; information on the operation of the Public Reference Room may be obtained by calling (800) SEC 0330.
The [A/B] logo is a registered service mark of AllianceBernstein and AllianceBernstein® is a registered service mark used by permission of the owner, AllianceBernstein L.P.
| GLOBAL THEMATIC GROWTH | ||
| PORTFOLIO | AB Variable Products Series Fund | |
LETTER TO INVESTORS
February 14, 2020
The following is an update of AB Variable Products Series Fund—Global Thematic Growth Portfolio (the “Portfolio”) for the annual reporting period ended December 31, 2019.
INVESTMENT OBJECTIVE AND POLICIES
The Portfolio’s investment objective is long-term growth of capital. The Portfolio pursues opportunistic growth by investing in a global universe of companies in multiple industries that may benefit from innovation. The Adviser employs a combination of “top-down” and “bottom-up” investment processes with the goal of identifying the most attractive securities worldwide, fitting into broader themes, which are developments that have broad effects across industries and companies. Drawing on its global fundamental research capabilities, the Adviser seeks to identify long-term secular growth trends that will affect multiple industries. The Adviser will assess the effects of these trends on entire industries and on individual companies. Through this process, the Adviser intends to identify key investment themes, which will be the focus of the Portfolio’s investments and which are expected to change over time based on the Adviser’s research.
In addition to this “top-down” thematic approach, the Adviser will also use a “bottom-up” analysis of individual companies that focuses on prospective earnings growth, valuation and quality of company management. The Adviser normally considers a large universe of mid- to large-capitalization companies worldwide for investment.
The Portfolio invests in securities issued by US and non-US companies from multiple industry sectors in an attempt to maximize opportunity, which should also tend to reduce risk. The Portfolio invests in both developed- and emerging-market countries. Under normal market conditions, the Portfolio invests significantly (at least 40%—unless market conditions are not deemed favorable by the Adviser) in securities of non-US companies. In addition, the Portfolio invests, under normal circumstances, in the equity securities of companies located in at least three countries. The percentage of the Portfolio’s assets invested in securities of companies in a particular country or denominated in a particular currency varies in accordance with the Adviser’s assessment of the appreciation potential of such securities.
The Portfolio may invest in any company and industry and in any type of equity security, listed and unlisted, with potential for capital appreciation. It invests in well-known, established companies as well as new, smaller or less-seasoned companies. Investments in new, smaller or less-seasoned companies may offer more reward but may also entail more risk than is generally true of larger, established companies. The Portfolio may also invest in synthetic foreign equity securities, which are various types of warrants used internationally that entitle a holder to buy or sell underlying securities, real estate investment trusts and zero-coupon bonds.
The Portfolio may, at times, invest in shares of exchange-traded funds (“ETFs”) in lieu of making direct investments in equity securities. ETFs may provide more efficient and economical exposure to the type of companies and geographic locations in which the Portfolio seeks to invest than direct investments.
Currencies can have a dramatic impact on equity returns, significantly adding to returns in some years and greatly diminishing them in others. Currency and equity positions are evaluated separately. The Adviser may seek to hedge the currency exposure resulting from securities positions when it finds the currency exposure unattractive. To hedge all or a portion of its currency risk, the Portfolio may, from time to time, invest in currency-related derivatives, including forward currency exchange contracts, futures contracts, options on futures contracts, swaps and options. The Adviser may also seek investment opportunities by taking long or short positions in currencies through the use of currency-related derivatives.
The Portfolio may enter into other derivatives transactions, such as options, futures contracts, forwards and swaps. The Portfolio may use options strategies involving the purchase and/or writing of various combinations of call and/or put options, including on individual securities and stock indices, futures contracts (including futures contracts on individual securities and stock indices) or shares of ETFs. These transactions may be used, for example, to earn extra income, to adjust exposure to individual securities or markets, or to protect all or a portion of the Portfolio’s portfolio from a decline in value, sometimes within certain ranges.
INVESTMENT RESULTS
The table on page 5 shows the Portfolio’s performance compared to its benchmark, the Morgan Stanley Capital International All Country World Index (“MSCI ACWI”) (net), for the one-, five- and 10-year periods ended December 31, 2019.
All share classes of the Portfolio outperformed the benchmark for the annual period. Stock selection within the health care, industrials and materials sectors contributed, relative to the benchmark. Stock selection within the technology sector was the main detractor; communication services and financials also detracted modestly. In terms of sector allocation, an underweight to energy and
1
| AB Variable Products Series Fund | ||
an overweight to technology contributed, while overweights to utilities and health care detracted. An overweight to Ireland contributed to performance, while an underweight to India detracted.
The Portfolio used derivatives in the form of currency forwards for hedging purposes, which added to absolute returns for the annual period.
MARKET REVIEW AND INVESTMENT STRATEGY
Global stocks recorded strong double-digit returns while emerging markets also rallied during the annual period ended December 31, 2019. After declining sharply at the end of 2018, equity markets rebounded dramatically in January as strong corporate earnings and optimism about a trade truce between the US and China calmed investors. Trade-war tensions resurfaced, however, and emerging geopolitical pressures drove market volatility. Tariff wars, restrictive monetary policy and a decline in industrial production stoked recessionary fears throughout the global economy. In response, the world’s central banks implemented accommodative monetary policies to help support capital markets. Late in the third quarter, equity market performance was accompanied by a sharp style rotation in the US. Quality-growth and lower-volatility stocks, which had been strong performers, lagged and value stocks outperformed. However, for the most part, growth stocks continued to outperform value over the entire period. From a market-capitalization perspective, large-cap stocks outperformed their small-cap peers. In December, equity markets rallied on news that the US and China had agreed to a preliminary phase-one trade deal due to be signed in January 2020.
The Portfolio’s exposures remain focused on secular growth themes, particularly those promoting social and environmental sustainability. This has helped the Portfolio’s Senior Investment Management Team (the “Team”) to identify companies with strong competitive advantages and high returns on invested capital that the Team believes are more likely to sustain higher-than-average growth over the long term. The Team believes organic sales and earnings growth will be a key driver of returns going forward. The Portfolio is positioned particularly well in this regard.
2
| GLOBAL THEMATIC GROWTH PORTFOLIO | ||
| DISCLOSURES AND RISKS | AB Variable Products Series Fund | |
Benchmark Disclosure
The MSCI ACWI is unmanaged and does not reflect fees and expenses associated with the active management of a mutual fund portfolio. The MSCI ACWI (net, free float-adjusted, market capitalization weighted) represents the equity market performance of developed and emerging markets. MSCI makes no express or implied warranties or representations, and shall have no liability whatsoever with respect to any MSCI data contained herein. The MSCI data may not be further redistributed or used as a basis for other indices, any securities or financial products. This report is not approved, reviewed or produced by MSCI. Net returns reflect the reinvestment of dividends after deduction of non-US withholding tax. An investor cannot invest directly in an index, and its results are not indicative of the performance for any specific investment, including the Portfolio.
A Word About Risk
Market Risk: The value of the Portfolio’s assets will fluctuate as the stock or bond market fluctuates. The value of its investments may decline, sometimes rapidly and unpredictably, simply because of economic changes or other events that affect large portions of the market. It includes the risk that a particular style of investing, such as the Portfolio’s growth approach, may underperform the market generally.
Foreign (Non-US) Risk: Investments in securities of non-US issuers may involve more risk than those of US issuers. These securities may fluctuate more widely in price and may be more difficult to trade or dispose of due to adverse market, economic, political, regulatory or other factors.
Emerging-Market Risk: Investments in emerging-market countries may have more risk because the markets are less developed and less liquid, and because these investments may be subject to increased economic, political, regulatory or other uncertainties.
Currency Risk: Fluctuations in currency exchange rates may negatively affect the value of the Portfolio’s investments or reduce its returns.
Capitalization Risk: Investments in mid-capitalization companies may be more volatile than investments in large-capitalization companies. Investments in mid-capitalization companies may have additional risks because these companies may have limited product lines, markets or financial resources.
Derivatives Risk: Derivatives may be difficult to price or unwind and leveraged so that small changes may produce disproportionate losses for the Portfolio. Derivatives may also be subject to counterparty risk to a greater degree than more traditional investments.
Focused Portfolio Risk: Investments in a limited number of companies may have more risk because changes in the value of a single security may have a more significant effect, either negative or positive, on the Portfolio’s net asset value (“NAV”).
Leverage Risk: To the extent the Portfolio uses leveraging techniques, its NAV may be more volatile because leverage tends to exaggerate the effect of changes in interest rates and any increase or decrease in the value of the Portfolio’s investments.
Management Risk: The Portfolio is subject to management risk because it is an actively managed investment fund. The Adviser will apply its investment techniques and risk analyses in making investment decisions for the Portfolio, but there is no guarantee that its techniques will produce the intended results.
These risks are fully discussed in the Variable Products prospectus. As with all investments, you may lose money by investing in the Portfolio.
An Important Note About Historical Performance
The investment return and principal value of an investment in the Portfolio will fluctuate, so that shares, when redeemed, may be worth more or less than their original cost. Performance shown in this report represents past performance and does not guarantee future results. Current performance may be lower or higher than the performance information shown. Please contact your financial advisor or insurance agent representative at your financial institution to obtain portfolio performance information current to the most recent month end.
(Disclosures, Risks and Note About Historical Performance continued on next page)
3
| DISCLOSURES AND RISKS | ||
| (continued) | AB Variable Products Series Fund | |
Investors should consider the investment objectives, risks, charges and expenses of the Portfolio carefully before investing. For additional copies of the Portfolio’s prospectus or summary prospectus, which contains this and other information, call your financial advisor or (800) 227 4618. Please read the prospectus and/or summary prospectus carefully before investing.
All fees and expenses related to the operation of the Portfolio have been deducted, but no adjustment has been made for insurance company separate account or annuity contract charges, which would reduce total return to a contract owner. Performance assumes reinvestment of distributions and does not account for taxes.
There are additional fees and expenses associated with all Variable Products. These fees can include mortality and expense risk charges, administrative charges, and other charges that can significantly reduce investment returns. Those fees and expenses are not reflected in this annual report. You should consult your Variable Products prospectus for a description of those fees and expenses and speak to your insurance agent or financial representative if you have any questions. You should read the prospectus before investing or sending money.
4
| GLOBAL THEMATIC GROWTH PORTFOLIO | ||
| HISTORICAL PERFORMANCE | AB Variable Products Series Fund | |
THE PORTFOLIO VS. ITS BENCHMARK | Net Asset Value Returns | |||||||||||
| PERIODS ENDED DECEMBER 31, 2019 (unaudited) | 1 Year | 5 Years1 | 10 Years1 | |||||||||
| Global Thematic Growth Portfolio Class A | 30.16% | 10.41% | 8.21% | |||||||||
| Global Thematic Growth Portfolio Class B | 29.78% | 10.13% | 7.94% | |||||||||
| MSCI ACWI (net) | 26.60% | 8.41% | 8.79% | |||||||||
1 Average annual returns.
Please keep in mind that high, double-digit returns are highly unusual and cannot be sustained. Investors should also be aware that these returns were primarily achieved during favorable market conditions. |
| |||||||||||
The Portfolio’s current prospectus fee table shows the Portfolio’s total annual operating expense ratios as 1.01% and 1.25% for Class A and Class B shares, respectively, gross of any fee waivers or expense reimbursements. Contractual fee waivers and/or expense reimbursements limit the Portfolio’s annual operating expense ratios to 0.96% and 1.20% for Class A and Class B shares, respectively. These waivers/reimbursements may not be terminated before May 1, 2020 and may be extended by the Adviser for additional one-year terms. Absent reimbursements or waivers, performance would have been lower. The Financial Highlights section of this report sets forth expense ratio data for the current reporting period; the expense ratios shown above may differ from the expense ratios in the Financial Highlights section since they are based on different time periods.
GROWTH OF A $10,000 INVESTMENT
12/31/2009 to 12/31/2019 (unaudited)
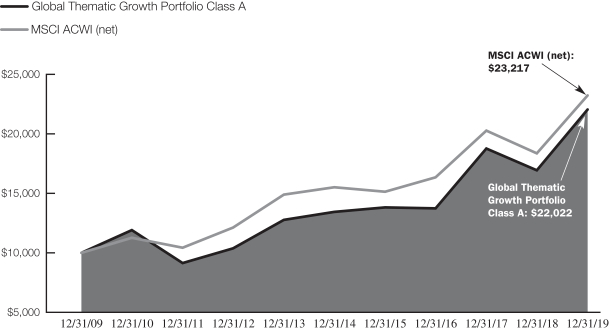
This chart illustrates the total value of an assumed $10,000 investment in Global Thematic Growth Portfolio Class A shares (from 12/31/2009 to 12/31/2019) as compared to the performance of the Portfolio’s benchmark. The chart assumes the reinvestment of dividends and capital gains distributions.
See Disclosures, Risks and Note about Historical Performance on pages 3-4.
5
| GLOBAL THEMATIC GROWTH PORTFOLIO | ||
| EXPENSE EXAMPLE (unaudited) | AB Variable Products Series Fund | |
As a shareholder of the Portfolio, you incur two types of costs: (1) transaction costs, including sales charges (loads) on purchase payments, contingent deferred sales charges on redemptions and (2) ongoing costs, including management fees; distribution(12b-1) fees; and other Portfolio expenses. This example is intended to help you understand your ongoing costs (in dollars) of investing in the Portfolio and to compare these costs with the ongoing costs of investing in other mutual funds.
The Example is based on an investment of $1,000 invested at the beginning of the period and held for the entire period as indicated below.
Actual Expenses
The first line of each class’ table below provides information about actual account values and actual expenses. You may use the information in this line, together with the amount you invested, to estimate the expenses that you paid over the period. Simply divide your account value by $1,000 (for example, an $8,600 account value divided by $1,000 = 8.6), then multiply the result by the number in the first line under the heading entitled “Expenses Paid During Period” to estimate the expenses you paid on your account during this period. The estimate of expenses does not include fees or other expenses of any variable insurance product. If such expenses were included, the estimate of expenses you paid during the period would be higher and your ending account value would be lower.
Hypothetical Example for Comparison Purposes
The second line of each class’ table below provides information about hypothetical account values and hypothetical expenses based on the Portfolio’s actual expense ratio and an assumed annual rate of return of 5% before expenses, which is not the Portfolio’s actual return. The hypothetical account values and expenses may not be used to estimate the actual ending account balance or expenses you paid for the period. You may use this information to compare the ongoing costs of investing in the Portfolio and other funds by comparing this 5% hypothetical example with the 5% hypothetical examples that appear in the shareholder reports of other funds. The estimate of expenses does not include fees or other expenses of any variable insurance product. If such expenses were included, the estimate of expenses you paid during the period would be higher and your ending account value would be lower.
Please note that the expenses shown in the table are meant to highlight your ongoing costs only and do not reflect any transactional costs, such as sales charges (loads), or contingent deferred sales charges on redemptions. Therefore, the second line of each classes’ table is useful in comparing ongoing costs only, and will not help you determine the relative total costs of owning different funds. In addition, if these transactional costs were included, your costs would have been higher.
| Beginning Account Value July 1, 2019 | Ending Account Value December 31, 2019 | Expenses Paid During Period* | Annualized Expense Ratio* | |||||||||||||
Class A | ||||||||||||||||
Actual | $ | 1,000 | $ | 1,073.50 | $ | 5.23 | 1.00 | % | ||||||||
Hypothetical (5% annual return before expenses) | $ | 1,000 | $ | 1,020.16 | $ | 5.09 | 1.00 | % | ||||||||
Class B | ||||||||||||||||
Actual | $ | 1,000 | $ | 1,072.20 | $ | 6.53 | 1.25 | % | ||||||||
Hypothetical (5% annual return before expenses) | $ | 1,000 | $ | 1,018.90 | $ | 6.36 | 1.25 | % | ||||||||
| * | Expenses are equal to each classes’ annualized expense ratios, multiplied by the average account value over the period, multiplied by 184/365 (to reflect the one-half year period). |
6
| GLOBAL THEMATIC GROWTH PORTFOLIO | ||
| TEN LARGEST HOLDINGS1 | ||
| December 31, 2019 (unaudited) | AB Variable Products Series Fund | |
| COMPANY | U.S. $ VALUE | PERCENT OF NET ASSETS | ||||||
Nike, Inc.—Class B | $ | 3,854,845 | 2.8 | % | ||||
Koninklijke Philips NV | 3,787,020 | 2.8 | ||||||
HDFC Bank Ltd. | 3,423,416 | 2.5 | ||||||
American Water Works Co., Inc. | 3,384,395 | 2.5 | ||||||
Vestas Wind Systems A/S | 3,318,061 | 2.4 | ||||||
Bio-Rad Laboratories, Inc.—Class A | 3,174,857 | 2.3 | ||||||
Erste Group Bank AG | 3,131,932 | 2.3 | ||||||
West Pharmaceutical Services, Inc. | 3,117,844 | 2.3 | ||||||
Kingspan Group PLC | 3,068,487 | 2.2 | ||||||
Xylem, Inc./NY | 3,049,961 | 2.2 | ||||||
|
|
|
| |||||
| $ | 33,310,818 | 24.3 | % | |||||
SECTOR BREAKDOWN2
December 31, 2019 (unaudited)
| SECTOR | U.S. $ VALUE | PERCENT OF TOTAL INVESTMENTS | ||||||
Information Technology | $ | 33,983,258 | 24.9 | % | ||||
Health Care | 30,002,847 | 21.9 | ||||||
Industrials | 17,495,105 | 12.8 | ||||||
Financials | 16,674,127 | 12.2 | ||||||
Consumer Discretionary | 11,024,144 | 8.1 | ||||||
Consumer Staples | 8,244,782 | 6.0 | ||||||
Materials | 8,011,596 | 5.8 | ||||||
Utilities | 3,673,705 | 2.7 | ||||||
Communication Services | 1,719,888 | 1.3 | ||||||
Short-Term Investments | 5,816,019 | 4.3 | ||||||
|
|
|
| |||||
Total Investments | $ | 136,645,471 | 100.0 | % | ||||
| 1 | Long-term investments. |
| 2 | The Portfolio’s sector breakdown is expressed as a percentage of total investments and may vary over time. The Portfolio also enters into derivative transactions, which may be used for hedging or investment purposes (see “Portfolio of Investments” section of the report for additional details). |
Please note: The sector classifications presented herein are based on the Global Industry Classification Standard (GICS) which was developed by Morgan Stanley Capital International and Standard & Poor’s. The components are divided into sector, industry group, and industry sub-indices as classified by the GICS for each of the market capitalization indices in the broad market. These sector classifications are broadly defined. The “Portfolio of Investments” section of the report reflects more specific industry information and is consistent with the investment restrictions discussed in the Portfolio’s prospectus.
7
| GLOBAL THEMATIC GROWTH PORTFOLIO | ||
| COUNTRY BREAKDOWN1 | ||
| December 31, 2019 (unaudited) | AB Variable Products Series Fund | |
| COUNTRY | U.S. $ VALUE | PERCENT OF TOTAL INVESTMENTS | ||||||
United States | $ | 59,738,518 | 43.7 | % | ||||
Netherlands | 11,066,056 | 8.1 | ||||||
Japan | 8,755,650 | 6.4 | ||||||
Ireland | 7,603,032 | 5.6 | ||||||
India | 6,266,214 | 4.6 | ||||||
Denmark | 6,049,356 | 4.4 | ||||||
China | 5,411,200 | 4.0 | ||||||
Switzerland | 5,357,633 | 3.9 | ||||||
France | 5,280,677 | 3.9 | ||||||
Germany | 5,127,230 | 3.7 | ||||||
Austria | 3,131,932 | 2.3 | ||||||
Hong Kong | 2,520,103 | 1.8 | ||||||
Brazil | 2,262,861 | 1.7 | ||||||
United Kingdom | 2,258,990 | 1.6 | ||||||
Short-Term Investments | 5,816,019 | 4.3 | ||||||
|
|
|
| |||||
Total Investments | $ | 136,645,471 | 100.0 | % | ||||
| 1 | All data are as of December 31, 2019. The Portfolio’s country breakdown is expressed as a percentage of total investments and may vary over time. |
8
| GLOBAL THEMATIC GROWTH PORTFOLIO | ||
| PORTFOLIO OF INVESTMENTS | ||
| December 31, 2019 | AB Variable Products Series Fund | |
| Company | Shares | U.S. $ Value | ||||||
COMMON STOCKS–95.6% |
| |||||||
INFORMATION TECHNOLOGY–24.8% | ||||||||
ELECTRONIC EQUIPMENT, INSTRUMENTS & COMPONENTS–4.4% | ||||||||
Flex Ltd.(a) | 217,890 | $ | 2,749,772 | |||||
Horiba Ltd. | 14,900 | 993,441 | ||||||
Keyence Corp. | 6,600 | 2,317,513 | ||||||
|
| |||||||
| 6,060,726 | ||||||||
|
| |||||||
IT SERVICES–6.9% | ||||||||
Adyen NV(a)(b) | 2,980 | 2,451,335 | ||||||
Pagseguro Digital Ltd.(a)(c) | 66,243 | 2,262,861 | ||||||
Square, Inc.–Class A(a)(c) | 31,141 | 1,948,181 | ||||||
Visa, Inc.–Class A | 14,530 | 2,730,187 | ||||||
|
| |||||||
| 9,392,564 | ||||||||
|
| |||||||
SEMICONDUCTORS & SEMICONDUCTOR EQUIPMENT–4.8% | ||||||||
Infineon Technologies AG | 107,320 | 2,424,825 | ||||||
NVIDIA Corp. | 8,668 | 2,039,580 | ||||||
NXP Semiconductors NV | 16,340 | 2,079,429 | ||||||
|
| |||||||
| 6,543,834 | ||||||||
|
| |||||||
SOFTWARE–6.6% | ||||||||
Dassault Systemes SE | 17,180 | 2,833,417 | ||||||
Microsoft Corp. | 15,660 | 2,469,582 | ||||||
Proofpoint, Inc.(a) | 17,614 | 2,021,735 | ||||||
Zendesk, Inc.(a) | 23,410 | 1,793,908 | ||||||
|
| |||||||
| 9,118,642 | ||||||||
|
| |||||||
TECHNOLOGY HARDWARE, STORAGE & PERIPHERALS–2.1% | ||||||||
Apple, Inc. | 9,765 | 2,867,492 | ||||||
|
| |||||||
| 33,983,258 | ||||||||
|
| |||||||
HEALTH CARE–21.9% | ||||||||
BIOTECHNOLOGY–1.6% | ||||||||
Abcam PLC | 126,140 | 2,258,990 | ||||||
|
| |||||||
HEALTH CARE EQUIPMENT & SUPPLIES–7.1% | ||||||||
Danaher Corp. | 18,430 | 2,828,637 | ||||||
Koninklijke Philips NV | 77,470 | 3,787,020 | ||||||
West Pharmaceutical Services, Inc. | 20,740 | 3,117,844 | ||||||
|
| |||||||
| 9,733,501 | ||||||||
|
| |||||||
HEALTH CARE PROVIDERS & SERVICES–4.1% | ||||||||
Apollo Hospitals Enterprise Ltd. | 140,867 | 2,842,798 | ||||||
UnitedHealth Group, Inc. | 9,280 | 2,728,134 | ||||||
|
| |||||||
| 5,570,932 | ||||||||
|
| |||||||
LIFE SCIENCES TOOLS & SERVICES–9.1% | ||||||||
Bio-Rad Laboratories, Inc.–Class A(a) | 8,580 | $ | 3,174,857 | |||||
Bruker Corp. | 44,010 | 2,243,190 | ||||||
Gerresheimer AG | 34,941 | 2,702,405 | ||||||
ICON PLC(a) | 10,200 | 1,756,746 | ||||||
Tecan Group AG | 9,120 | 2,562,226 | ||||||
|
| |||||||
| 12,439,424 | ||||||||
|
| |||||||
| 30,002,847 | ||||||||
|
| |||||||
INDUSTRIALS–12.8% | ||||||||
AEROSPACE & DEFENSE–1.4% | ||||||||
Hexcel Corp. | 26,039 | 1,908,919 | ||||||
|
| |||||||
BUILDING PRODUCTS–2.3% | ||||||||
Kingspan Group PLC | 50,240 | 3,068,487 | ||||||
|
| |||||||
COMMERCIAL SERVICES & SUPPLIES–0.7% | ||||||||
China Everbright International Ltd. | 1,263,407 | 1,013,125 | ||||||
|
| |||||||
ELECTRICAL EQUIPMENT–4.2% | ||||||||
Schneider Electric SE | 23,820 | 2,447,260 | ||||||
Vestas Wind Systems A/S | 32,850 | 3,318,061 | ||||||
|
| |||||||
| 5,765,321 | ||||||||
|
| |||||||
MACHINERY–2.2% | ||||||||
Xylem, Inc./NY | 38,710 | 3,049,961 | ||||||
|
| |||||||
PROFESSIONAL SERVICES–2.0% | ||||||||
Recruit Holdings Co., Ltd. | 71,800 | 2,689,292 | ||||||
|
| |||||||
| 17,495,105 | ||||||||
|
| |||||||
FINANCIALS–12.2% | ||||||||
BANKS–4.8% | ||||||||
Erste Group Bank AG(a) | 83,380 | 3,131,932 | ||||||
HDFC Bank Ltd. | 191,346 | 3,423,416 | ||||||
|
| |||||||
| 6,555,348 | ||||||||
|
| |||||||
CAPITAL MARKETS–5.6% | ||||||||
Charles Schwab Corp. (The) | 37,426 | 1,779,981 | ||||||
MSCI, Inc.–Class A | 11,710 | 3,023,288 | ||||||
Partners Group Holding AG | 3,050 | 2,795,407 | ||||||
|
| |||||||
| 7,598,676 | ||||||||
|
| |||||||
INSURANCE–1.8% | ||||||||
AIA Group Ltd. | 239,600 | 2,520,103 | ||||||
|
| |||||||
| 16,674,127 | ||||||||
|
| |||||||
CONSUMER DISCRETIONARY–8.1% | ||||||||
AUTO COMPONENTS–1.8% | ||||||||
Aptiv PLC | 25,570 | 2,428,383 | ||||||
|
| |||||||
DIVERSIFIED CONSUMER SERVICES–1.7% | ||||||||
Bright Horizons Family Solutions, Inc.(a) | 15,650 | 2,352,039 | ||||||
|
| |||||||
9
| GLOBAL THEMATIC GROWTH PORTFOLIO | ||
| PORTFOLIO OF INVESTMENTS | ||
| (continued) | AB Variable Products Series Fund | |
| Company | Shares | U.S. $ Value | ||||||
INTERNET & DIRECT MARKETING RETAIL–1.8% | ||||||||
Alibaba Group Holding Ltd.(a) | 89,840 | $ | 2,388,877 | |||||
|
| |||||||
TEXTILES, APPAREL & LUXURY GOODS–2.8% | ||||||||
NIKE, Inc.–Class B | 38,050 | 3,854,845 | ||||||
|
| |||||||
| 11,024,144 | ||||||||
|
| |||||||
CONSUMER STAPLES–6.0% | ||||||||
FOOD PRODUCTS–2.0% | ||||||||
Kerry Group PLC–Class A | 22,290 | 2,777,799 | ||||||
|
| |||||||
HOUSEHOLD PRODUCTS–4.0% | ||||||||
Procter & Gamble Co. (The) | 21,710 | 2,711,579 | ||||||
Unicharm Corp. | 81,600 | 2,755,404 | ||||||
|
| |||||||
| 5,466,983 | ||||||||
|
| |||||||
| 8,244,782 | ||||||||
|
| |||||||
MATERIALS–5.8% | ||||||||
CHEMICALS–5.8% | ||||||||
Chr Hansen Holding A/S | 34,370 | 2,731,295 | ||||||
Ecolab, Inc. | 13,120 | 2,532,029 | ||||||
Koninklijke DSM NV | 21,020 | 2,748,272 | ||||||
|
| |||||||
| 8,011,596 | ||||||||
|
| |||||||
UTILITIES–2.7% | ||||||||
WATER UTILITIES–2.7% | ||||||||
American Water Works Co., Inc. | 27,549 | 3,384,395 | ||||||
Beijing Enterprises Water Group Ltd.(a) | 572,000 | 289,310 | ||||||
|
| |||||||
| 3,673,705 | ||||||||
|
| |||||||
COMMUNICATION SERVICES–1.3% | ||||||||
INTERACTIVE MEDIA & SERVICES–1.3% | ||||||||
Tencent Holdings Ltd. | 35,700 | $ | 1,719,888 | |||||
|
| |||||||
Total Common Stocks | 130,829,452 | |||||||
|
| |||||||
SHORT-TERM INVESTMENTS–4.2% | ||||||||
INVESTMENT COMPANIES–4.2% | ||||||||
AB Fixed Income Shares, Inc.–Government Money Market Portfolio–Class AB, 1.53%(d)(e)(f) | 5,816,019 | 5,816,019 | ||||||
|
| |||||||
TOTAL INVESTMENTS–99.8% | 136,645,471 | |||||||
Other assets less liabilities–0.2% | 236,469 | |||||||
|
| |||||||
NET ASSETS–100.0% | $ | 136,881,940 | ||||||
|
| |||||||
FORWARD CURRENCY EXCHANGE CONTRACTS (see Note D)
| Counterparty | Contracts to Deliver (000) | In Exchange For (000) | Settlement Date | Unrealized Appreciation/ (Depreciation) | ||||||||||||||||||||
Bank of America, NA | USD | 546 | RUB | 35,119 | 1/17/20 | $ | 18,943 | |||||||||||||||||
Bank of America, NA | CHF | 335 | USD | 345 | 3/16/20 | (3,072 | ) | |||||||||||||||||
Bank of America, NA | USD | 2,570 | AUD | 3,717 | 3/16/20 | 43,590 | ||||||||||||||||||
Barclays Bank PLC | INR | 387,459 | USD | 5,380 | 1/16/20 | (54,771 | ) | |||||||||||||||||
Barclays Bank PLC | USD | 1,303 | INR | 93,189 | 1/16/20 | 4,157 | ||||||||||||||||||
Barclays Bank PLC | USD | 1,577 | KRW | 1,843,952 | 2/06/20 | 19,252 | ||||||||||||||||||
Barclays Bank PLC | CNY | 11,921 | USD | 1,674 | 2/13/20 | (36,938 | ) | |||||||||||||||||
Barclays Bank PLC | USD | 1,058 | CNY | 7,426 | 2/13/20 | 8,037 | ||||||||||||||||||
Barclays Bank PLC | USD | 1,744 | TWD | 52,811 | 2/20/20 | 27,923 | ||||||||||||||||||
Barclays Bank PLC | EUR | 455 | USD | 507 | 3/16/20 | (6,078 | ) | |||||||||||||||||
Barclays Bank PLC | USD | 1,775 | EUR | 1,582 | 3/16/20 | 7,642 | ||||||||||||||||||
Barclays Bank PLC | USD | 206 | HKD | 1,607 | 3/16/20 | (57 | ) | |||||||||||||||||
Citibank, NA | BRL | 2,105 | USD | 522 | 1/03/20 | (1,039 | ) | |||||||||||||||||
10
| AB Variable Products Series Fund | ||
| Counterparty | Contracts to Deliver (000) | In Exchange For (000) | Settlement Date | Unrealized Appreciation/ (Depreciation) | ||||||||||||||||||||
Citibank, NA | USD | 508 | BRL | 2,105 | 1/03/20 | $ | 15,623 | |||||||||||||||||
Citibank, NA | BRL | 2,379 | USD | 585 | 2/04/20 | (6,043 | ) | |||||||||||||||||
Citibank, NA | EUR | 3,294 | USD | 3,681 | 3/16/20 | (31,210 | ) | |||||||||||||||||
Citibank, NA | HKD | 6,468 | USD | 828 | 3/16/20 | (1,391 | ) | |||||||||||||||||
Citibank, NA | USD | 2,723 | CAD | 3,588 | 3/16/20 | 41,168 | ||||||||||||||||||
JPMorgan Chase Bank, NA | INR | 50,733 | USD | 710 | 1/16/20 | (1,519 | ) | |||||||||||||||||
JPMorgan Chase Bank, NA | GBP | 232 | USD | 304 | 3/16/20 | (3,470 | ) | |||||||||||||||||
JPMorgan Chase Bank, NA | USD | 664 | JPY | 71,725 | 3/16/20 | (1,799 | ) | |||||||||||||||||
Morgan Stanley & Co., Inc. | JPY | 71,725 | USD | 663 | 3/16/20 | 472 | ||||||||||||||||||
Natwest Markets PLC | INR | 33,810 | USD | 467 | 1/16/20 | (6,998 | ) | |||||||||||||||||
Natwest Markets PLC | EUR | 1,901 | USD | 2,111 | 3/16/20 | (30,668 | ) | |||||||||||||||||
Natwest Markets PLC | USD | 1,007 | EUR | 901 | 3/16/20 | 7,926 | ||||||||||||||||||
Standard Chartered Bank | USD | 872 | INR | 62,317 | 1/16/20 | 1,919 | ||||||||||||||||||
Standard Chartered Bank | USD | 1,010 | INR | 71,946 | 1/16/20 | (531 | ) | |||||||||||||||||
Standard Chartered Bank | USD | 200 | KRW | 232,336 | 2/06/20 | 999 | ||||||||||||||||||
Standard Chartered Bank | USD | 1,413 | CNY | 9,948 | 2/13/20 | 14,706 | ||||||||||||||||||
State Street Bank & Trust Co. | CHF | 970 | USD | 992 | 3/16/20 | (15,470 | ) | |||||||||||||||||
State Street Bank & Trust Co. | EUR | 1,343 | USD | 1,493 | 3/16/20 | (20,499 | ) | |||||||||||||||||
State Street Bank & Trust Co. | GBP | 262 | USD | 343 | 3/16/20 | (4,768 | ) | |||||||||||||||||
State Street Bank & Trust Co. | HKD | 17,661 | USD | 2,265 | 3/16/20 | (270 | ) | |||||||||||||||||
State Street Bank & Trust Co. | JPY | 37,395 | USD | 344 | 3/16/20 | (1,711 | ) | |||||||||||||||||
State Street Bank & Trust Co. | USD | 947 | GBP | 735 | 3/16/20 | 28,495 | ||||||||||||||||||
State Street Bank & Trust Co. | USD | 343 | HKD | 2,677 | 3/16/20 | (83 | ) | |||||||||||||||||
State Street Bank & Trust Co. | USD | 344 | JPY | 37,395 | 3/16/20 | 1,404 | ||||||||||||||||||
State Street Bank & Trust Co. | USD | 243 | NOK | 2,208 | 3/16/20 | 8,665 | ||||||||||||||||||
State Street Bank & Trust Co. | USD | 823 | SEK | 7,682 | 3/16/20 | (350 | ) | |||||||||||||||||
State Street Bank & Trust Co. | USD | 473 | ZAR | 6,997 | 3/16/20 | 21,353 | ||||||||||||||||||
State Street Bank & Trust Co. | USD | 292 | MXN | 5,632 | �� | 3/17/20 | 2,156 | |||||||||||||||||
UBS AG | BRL | 2,105 | USD | 498 | 1/03/20 | (24,912 | ) | |||||||||||||||||
UBS AG | USD | 522 | BRL | 2,105 | 1/03/20 | 1,039 | ||||||||||||||||||
UBS AG | EUR | 14,099 | USD | 15,774 | 3/16/20 | (113,154 | ) | |||||||||||||||||
UBS AG | USD | 3,978 | GBP | 3,018 | 3/16/20 | 27,237 | ||||||||||||||||||
|
| |||||||||||||||||||||||
| $ | (64,095 | ) | ||||||||||||||||||||||
|
| |||||||||||||||||||||||
| (a) | Non-income producing security. |
| (b) | Security is exempt from registration under Rule 144A of the Securities Act of 1933. This security is considered restricted, but liquid and may be resold in transactions exempt from registration, normally to qualified institutional buyers. At December 31, 2019, the market value of this security amounted to $2,451,335 or 1.8% of net assets. |
| (c) | Represents entire or partial securities out on loan. See Note E for securities lending information. |
| (d) | Affiliated investments. |
| (e) | The rate shown represents the 7-day yield as of period end. |
| (f) | To obtain a copy of the fund’s shareholder report, please go to the Securities and Exchange Commission’s website at www.sec.gov, or call AB at (800) 227-4618. |
11
| GLOBAL THEMATIC GROWTH PORTFOLIO | ||
| PORTFOLIO OF INVESTMENTS | ||
| (continued) | AB Variable Products Series Fund | |
Currency Abbreviations:
AUD—Australian Dollar
BRL—Brazilian Real
CAD—Canadian Dollar
CHF—Swiss Franc
CNY—Chinese Yuan Renminbi
EUR—Euro
GBP—Great British Pound
HKD—Hong Kong Dollar
INR—Indian Rupee
JPY—Japanese Yen
KRW—South Korean Won
MXN—Mexican Peso
NOK—Norwegian Krone
RUB—Russian Ruble
SEK—Swedish Krona
TWD—New Taiwan Dollar
USD—United States Dollar
ZAR—South African Rand
See notes to financial statements.
12
| GLOBAL THEMATIC GROWTH PORTFOLIO | ||
| STATEMENT OF ASSETS & LIABILITIES | ||
| December 31, 2019 | AB Variable Products Series Fund | |
ASSETS | ||||
Investments in securities, at value | ||||
Unaffiliated issuers (cost $93,431,784) | $ | 130,829,452 | (a) | |
Affiliated issuers (cost $5,816,019) | 5,816,019 | |||
Foreign currencies, at value (cost $236,160) | 237,426 | |||
Receivable for investment securities sold and foreign currency transactions | 355,214 | |||
Unrealized appreciation on forward currency exchange contracts | 302,706 | |||
Unaffiliated dividends receivable | 150,083 | |||
Receivable for capital stock sold | 9,047 | |||
Affiliated dividends receivable | 7,358 | |||
|
| |||
Total assets | 137,707,305 | |||
|
| |||
LIABILITIES | ||||
Unrealized depreciation on forward currency exchange contracts | 366,801 | |||
Payable for capital stock redeemed | 212,388 | |||
Advisory fee payable | 77,632 | |||
Audit and tax fee payable | 51,784 | |||
Payable for investment securities purchased and foreign currency transactions | 29,553 | |||
Administrative fee payable | 21,213 | |||
Distribution fee payable | 19,042 | |||
Transfer Agent fee payable | 132 | |||
Accrued expenses | 46,820 | |||
|
| |||
Total liabilities | 825,365 | |||
|
| |||
NET ASSETS | $ | 136,881,940 | ||
|
| |||
COMPOSITION OF NET ASSETS | ||||
Capital stock, at par | $ | 4,199 | ||
Additional paid-in capital | 85,337,050 | |||
Distributable earnings | 51,540,691 | |||
|
| |||
| $ | 136,881,940 | |||
|
|
Net Asset Value Per Share—1 billion shares of capital stock authorized, $.001 par value
| Class | Net Assets | Shares Outstanding | Net Asset Value | |||||||||
| A | $ | 43,236,623 | 1,289,900 | $ | 33.52 | |||||||
| B | $ | 93,645,317 | 2,909,012 | $ | 32.19 | |||||||
| (a) | Includes securities on loan with a value of $3,452,188 (see Note E). |
See notes to financial statements.
13
| GLOBAL THEMATIC GROWTH PORTFOLIO | ||
| STATEMENT OF OPERATIONS | ||
| Year Ended December 31, 2019 | AB Variable Products Series Fund | |
INVESTMENT INCOME | ||||
Dividends | ||||
Unaffiliated issuers (net of foreign taxes withheld of $98,986) | $ | 1,500,170 | ||
Affiliated issuers | 131,709 | |||
Securities lending income | 4,721 | |||
|
| |||
| 1,636,600 | ||||
|
| |||
EXPENSES | ||||
Advisory fee (see Note B) | 974,806 | |||
Distribution fee—Class B | 223,964 | |||
Transfer agency—Class A | 1,988 | |||
Transfer agency—Class B | 4,409 | |||
Custodian | 105,366 | |||
Administrative | 77,506 | |||
Audit and tax | 62,132 | |||
Printing | 53,586 | |||
Legal | 35,421 | |||
Directors’ fees | 22,925 | |||
Miscellaneous | 18,023 | |||
|
| |||
Total expenses | 1,580,126 | |||
Less: expenses waived and reimbursed by the Adviser (see Notes B & E) | (70,942 | ) | ||
|
| |||
Net expenses | 1,509,184 | |||
|
| |||
Net investment income | 127,416 | |||
|
| |||
REALIZED AND UNREALIZED GAIN ON INVESTMENT AND FOREIGN CURRENCY TRANSACTIONS | ||||
Net realized gain on: | ||||
Investment transactions | 13,595,317 | |||
Forward currency exchange contracts | 520,603 | |||
Foreign currency transactions | 47,851 | |||
Net change in unrealized appreciation/depreciation of: | ||||
Investments(a) | 19,085,358 | |||
Forward currency exchange contracts | 79,286 | |||
Foreign currency denominated assets and liabilities | 4,363 | |||
|
| |||
Net gain on investment and foreign currency transactions | 33,332,778 | |||
|
| |||
NET INCREASE IN NET ASSETS FROM OPERATIONS | $ | 33,460,194 | ||
|
|
| (a) | Net of decrease in accrued foreign capital gains taxes of $8,092. |
See notes to financial statements.
14
| GLOBAL THEMATIC GROWTH PORTFOLIO | ||
| STATEMENT OF CHANGES IN NET ASSETS | AB Variable Products Series Fund | |
| Year Ended December 31, 2019 | Year Ended December 31, 2018 | |||||||
INCREASE (DECREASE) IN NET ASSETS FROM OPERATIONS | ||||||||
Net investment income | $ | 127,416 | $ | 277,413 | ||||
Net realized gain on investment and foreign currency transactions | 14,163,771 | 7,396,267 | ||||||
Net change in unrealized appreciation/depreciation of investments and foreign currency denominated assets and liabilities | 19,169,007 | (20,681,230 | ) | |||||
|
|
|
| |||||
Net increase (decrease) in net assets from operations | 33,460,194 | (13,007,550 | ) | |||||
Distributions to Shareholders | ||||||||
Class A | (2,381,432 | ) | –0 | – | ||||
Class B | (5,188,929 | ) | –0 | – | ||||
CAPITAL STOCK TRANSACTIONS | ||||||||
Net decrease | (5,755,781 | ) | (16,696,371 | ) | ||||
|
|
|
| |||||
Total increase (decrease) | 20,134,052 | (29,703,921 | ) | |||||
NET ASSETS | ||||||||
Beginning of period | 116,747,888 | 146,451,809 | ||||||
|
|
|
| |||||
End of period | $ | 136,881,940 | $ | 116,747,888 | ||||
|
|
|
| |||||
See notes to financial statements.
15
| GLOBAL THEMATIC GROWTH PORTFOLIO | ||
| NOTES TO FINANCIAL STATEMENTS | ||
| December 31, 2019 | AB Variable Products Series Fund | |
NOTE A: Significant Accounting Policies
The AB Global Thematic Growth Portfolio (the “Portfolio”) is a series of AB Variable Products Series Fund, Inc. (the “Fund”). The Portfolio’s investment objective is long-term growth of capital. The Portfolio is diversified as defined under the Investment Company Act of 1940. The Fund was incorporated in the State of Maryland on November 17, 1987, as an open-end series investment company. The Fund offers eleven separately managed pools of assets which have differing investment objectives and policies. The Portfolio offers Class A and Class B shares. Both classes of shares have identical voting, dividend, liquidating and other rights, except that Class B shares bear a distribution expense and have exclusive voting rights with respect to the Class B distribution plan.
The Portfolio offers and sells its shares only to separate accounts of certain life insurance companies for the purpose of funding variable annuity contracts and variable life insurance policies. Sales are made without a sales charge at the Portfolio’s net asset value per share.
The financial statements have been prepared in conformity with U.S. generally accepted accounting principles (“U.S. GAAP”) which require management to make certain estimates and assumptions that affect the reported amounts of assets and liabilities in the financial statements and amounts of income and expenses during the reporting period. Actual results could differ from those estimates. The Portfolio is an investment company under U.S. GAAP and follows the accounting and reporting guidance applicable to investment companies. The following is a summary of significant accounting policies followed by the Portfolio.
1. Security Valuation
Portfolio securities are valued at their current market value determined on the basis of market quotations or, if market quotations are not readily available or are deemed unreliable, at “fair value” as determined in accordance with procedures established by and under the general supervision of the Fund’s Board of Directors (the “Board”).
In general, the market values of securities which are readily available and deemed reliable are determined as follows: securities listed on a national securities exchange (other than securities listed on the NASDAQ Stock Market, Inc. (“NASDAQ”)) or on a foreign securities exchange are valued at the last sale price at the close of the exchange or foreign securities exchange. If there has been no sale on such day, the securities are valued at the last traded price from the previous day. Securities listed on more than one exchange are valued by reference to the principal exchange on which the securities are traded; securities listed only on NASDAQ are valued in accordance with the NASDAQ Official Closing Price; listed or over the counter (“OTC”) market put or call options are valued at the mid level between the current bid and ask prices. If either a current bid or current ask price is unavailable, AllianceBernstein L.P. (the “Adviser”) will have discretion to determine the best valuation (e.g., last trade price in the case of listed options); open futures are valued using the closing settlement price or, in the absence of such a price, the most recent quoted bid price. If there are no quotations available for the day of valuation, the last available closing settlement price is used; U.S. Government securities and any other debt instruments having 60 days or less remaining until maturity are generally valued at market by an independent pricing vendor, if a market price is available. If a market price is not available, the securities are valued at amortized cost. This methodology is commonly used for short term securities that have an original maturity of 60 days or less, as well as short term securities that had an original term to maturity that exceeded 60 days. In instances when amortized cost is utilized, the Valuation Committee (the “Committee”) must reasonably conclude that the utilization of amortized cost is approximately the same as the fair value of the security. Such factors the Committee will consider include, but are not limited to, an impairment of the creditworthiness of the issuer or material changes in interest rates. Fixed-income securities, including mortgage-backed and asset-backed securities, may be valued on the basis of prices provided by a pricing service or at a price obtained from one or more of the major broker-dealers. In cases where broker-dealer quotes are obtained, the Adviser may establish procedures whereby changes in market yields or spreads are used to adjust, on a daily basis, a recently obtained quoted price on a security. Swaps and other derivatives are valued daily, primarily using independent pricing services, independent pricing models using market inputs, as well as third party broker-dealers or counterparties. Open end mutual funds are valued at the closing net asset value per share, while exchange traded funds are valued at the closing market price per share.
Securities for which market quotations are not readily available (including restricted securities) or are deemed unreliable are valued at fair value as deemed appropriate by the Adviser. Factors considered in making this determination may include, but are not limited to, information obtained by contacting the issuer, analysts, analysis of the issuer’s financial statements or other available documents. In addition, the Portfolio may use fair value pricing for securities primarily traded in non-U.S. markets because most foreign markets close well before the Portfolio values its securities at 4:00 p.m., Eastern Time. The earlier close of these foreign markets gives rise to the possibility that significant events, including broad market moves, may have occurred in the interim and may materially affect the value of those securities. To account for this, the Portfolio generally values many of its foreign equity securities using fair value prices based on third party vendor modeling tools to the extent available.
16
| AB Variable Products Series Fund | ||
2. Fair Value Measurements
In accordance with U.S. GAAP regarding fair value measurements, fair value is defined as the price that the Portfolio would receive to sell an asset or pay to transfer a liability in an orderly transaction between market participants at the measurement date. U.S. GAAP establishes a framework for measuring fair value, and a three-level hierarchy for fair value measurements based upon the transparency of inputs to the valuation of an asset or liability (including those valued based on their market values as described in Note A.1 above). Inputs may be observable or unobservable and refer broadly to the assumptions that market participants would use in pricing the asset or liability. Observable inputs reflect the assumptions market participants would use in pricing the asset or liability based on market data obtained from sources independent of the Portfolio. Unobservable inputs reflect the Portfolio’s own assumptions about the assumptions that market participants would use in pricing the asset or liability based on the best information available in the circumstances. Each investment is assigned a level based upon the observability of the inputs which are significant to the overall valuation. The three-tier hierarchy of inputs is summarized below.
| • | Level 1—quoted prices in active markets for identical investments |
| • | Level 2—other significant observable inputs (including quoted prices for similar investments, interest rates, prepayment speeds, credit risk, etc.) |
| • | Level 3—significant unobservable inputs (including the Portfolio’s own assumptions in determining the fair value of investments) |
Where readily available market prices or relevant bid prices are not available for certain equity investments, such investments may be valued based on similar publicly traded investments, movements in relevant indices since last available prices or based upon underlying company fundamentals and comparable company data (such as multiples to earnings or other multiples to equity). Where an investment is valued using an observable input, such as another publicly traded security, the investment will be classified as Level 2. If management determines that an adjustment is appropriate based on restrictions on resale, illiquidity or uncertainty, and such adjustment is a significant component of the valuation, the investment will be classified as Level 3. An investment will also be classified as Level 3 where management uses company fundamentals and other significant inputs to determine the valuation.
The following table summarizes the valuation of the Portfolio’s investments by the above fair value hierarchy levels as of December 31, 2019:
| Level 1 | Level 2 | Level 3 | Total | |||||||||||||
Investments in Securities: | ||||||||||||||||
Assets: | ||||||||||||||||
Common Stocks: | ||||||||||||||||
Information Technology | $ | 22,962,727 | $ | 11,020,531 | $ | –0 | – | $ | 33,983,258 | |||||||
Health Care | 18,108,398 | 11,894,449 | –0 | – | 30,002,847 | |||||||||||
Industrials | 8,027,367 | 9,467,738 | –0 | – | 17,495,105 | |||||||||||
Financials | 4,803,269 | 11,870,858 | –0 | – | 16,674,127 | |||||||||||
Consumer Discretionary | 11,024,144 | –0 | – | –0 | – | 11,024,144 | ||||||||||
Consumer Staples | 5,489,378 | 2,755,404 | –0 | – | 8,244,782 | |||||||||||
Materials | 5,263,324 | 2,748,272 | –0 | – | 8,011,596 | |||||||||||
Utilities | 3,384,395 | 289,310 | –0 | – | 3,673,705 | |||||||||||
Communication Services | –0 | – | 1,719,888 | –0 | – | 1,719,888 | ||||||||||
Short-Term Investments | 5,816,019 | –0 | – | –0 | – | 5,816,019 | ||||||||||
|
|
|
|
|
|
|
| |||||||||
Total Investments in Securities | 84,879,021 | 51,766,450 | (a) | –0 | – | 136,645,471 | ||||||||||
Other Financial Instruments(b): | ||||||||||||||||
Assets: | ||||||||||||||||
Forward Currency Exchange Contracts | –0 | – | 302,706 | –0 | – | 302,706 | ||||||||||
Liabilities: | ||||||||||||||||
Forward Currency Exchange Contracts | –0 | – | (366,801 | ) | –0 | – | (366,801 | ) | ||||||||
|
|
|
|
|
|
|
| |||||||||
Total | $ | 84,879,021 | $ | 51,702,355 | $ | –0 | – | $ | 136,581,376 | |||||||
|
|
|
|
|
|
|
| |||||||||
| (a) | A significant portion of the Portfolio’s foreign equity investments are categorized as Level 2 investments since they are valued using fair value prices based on third party vendor modeling tools to the extent available, see Note A.1. |
| (b) | Other financial instruments are derivative instruments, such as futures, forwards and swaps, which are valued at the unrealized appreciation/(depreciation) on the instrument. Other financial instruments may also include swaps with upfront premiums, options written and swaptions written which are valued at market value. |
17
| GLOBAL THEMATIC GROWTH PORTFOLIO | ||
| NOTES TO FINANCIAL STATEMENTS | ||
| (continued) | AB Variable Products Series Fund | |
3. Currency Translation
Assets and liabilities denominated in foreign currencies and commitments under forward currency exchange contracts are translated into U.S. dollars at the mean of the quoted bid and ask prices of such currencies against the U.S. dollar. Purchases and sales of portfolio securities are translated into U.S. dollars at the rates of exchange prevailing when such securities were acquired or sold. Income and expenses are translated into U.S. dollars at rates of exchange prevailing when accrued.
Net realized gain or loss on foreign currency transactions represents foreign exchange gains and losses from sales and maturities of foreign fixed income investments, holding of foreign currencies, currency gains or losses realized between the trade and settlement dates on foreign investment transactions, and the difference between the amounts of dividends, interest and foreign withholding taxes recorded on the Portfolio’s books and the U.S. dollar equivalent amounts actually received or paid. Net unrealized currency gains and losses from valuing foreign currency denominated assets and liabilities at period end exchange rates are reflected as a component of net unrealized appreciation or depreciation of foreign currency denominated assets and liabilities.
4. Taxes
It is the Portfolio’s policy to meet the requirements of the Internal Revenue Code applicable to regulated investment companies and to distribute all of its investment company taxable income and net realized gains, if any, to shareholders. Therefore, no provisions for federal income or excise taxes are required. The Portfolio may be subject to taxes imposed by countries in which it invests. Such taxes are generally based on income and/or capital gains earned or repatriated. Taxes are accrued and applied to net investment income, net realized gains and net unrealized appreciation/depreciation as such income and/or gains are earned.
In accordance with U.S. GAAP requirements regarding accounting for uncertainties in income taxes, management has analyzed the Portfolio’s tax positions taken or expected to be taken on federal and state income tax returns for all open tax years (the current and the prior three tax years) and has concluded that no provision for income tax is required in the Portfolio’s financial statements.
5. Investment Income and Investment Transactions
Dividend income is recorded on the ex-dividend date or as soon as the Portfolio is informed of the dividend. Interest income is accrued daily. Investment transactions are accounted for on the date the securities are purchased or sold. Investment gains or losses are determined on the identified cost basis. The Portfolio amortizes premiums and accretes discounts as adjustments to interest income.
6. Class Allocations
All income earned and expenses incurred by the Portfolio are borne on a pro-rata basis by each outstanding class of shares, based on the proportionate interest in the Portfolio represented by the net assets of such class, except for class specific expenses which are allocated to the respective class. Expenses of the Fund are charged proportionately to each portfolio or based on other appropriate methods. Realized and unrealized gains and losses are allocated among the various share classes based on respective net assets.
7. Dividends and Distributions
Dividends and distributions to shareholders, if any, are recorded on the ex-dividend date. Income dividends and capital gains distributions are determined in accordance with federal tax regulations and may differ from those determined in accordance with U.S. GAAP. To the extent these differences are permanent, such amounts are reclassified within the capital accounts based on their federal tax basis treatment; temporary differences do not require such reclassification.
NOTE B: Advisory Fee and Other Transactions with Affiliates
Under the terms of the investment advisory agreement, the Portfolio pays the Adviser an advisory fee at an annual rate of .75% of the first $2.5 billion, .65% of the next $2.5 billion and .60% in excess of $5 billion, of the Portfolio’s average daily net assets. The fee is accrued daily and paid monthly. Effective September 4, 2018, the Adviser has contractually agreed to waive its management fee and/or bear expenses of the Portfolio in order to reduce the Portfolio’s total operating expenses by an amount equal to .05% on an annual basis of the average net assets for Class A and Class B. For the year ended December 31, 2019, such reimbursements/waivers amounted to $64,987. This fee waiver and/or expense reimbursement agreement extends through May 1, 2020 and then may be extended by the Adviser for additional one-year terms.
18
| AB Variable Products Series Fund | ||
Pursuant to the investment advisory agreement, the Portfolio may reimburse the Adviser for certain legal and accounting services provided to the Portfolio by the Adviser. For the year ended December 31, 2019, the reimbursement for such services amounted to $77,506.
The Portfolio compensates AllianceBernstein Investor Services, Inc. (“ABIS”), a wholly-owned subsidiary of the Adviser, under a Transfer Agency Agreement for providing personnel and facilities to perform transfer agency services for the Portfolio. Such compensation retained by ABIS amounted to $1,491 for the year ended December 31, 2019.
The Portfolio may invest in AB Government Money Market Portfolio (the “Government Money Market Portfolio”) which has a contractual annual advisory fee rate of .20% of the portfolio’s average daily net assets and bears its own expenses. The Adviser has contractually agreed to waive .10% of the advisory fee of Government Money Market Portfolio (resulting in a net advisory fee of ..10%) until August 31, 2020. In connection with the investment by the Portfolio in Government Money Market Portfolio, the Adviser has contractually agreed to waive its advisory fee from the Portfolio in an amount equal to the Portfolio’s pro rata share of the effective advisory fee of Government Money Market Portfolio, as borne indirectly by the Portfolio as an acquired fund fee and expense. For the year ended December 31, 2019, such waiver amounted to $5,896.
A summary of the Portfolio’s transactions in AB mutual funds for the year ended December 31, 2019 is as follows:
Fund | Market Value 12/31/18 (000) | Purchases at Cost (000) | Sales Proceeds (000) | Market Value 12/31/19 (000) | Dividend Income (000) | |||||||||||||||
Government Money Market Portfolio | $ | 2,718 | $ | 38,720 | $ | 35,622 | $ | 5,816 | $ | 126 | ||||||||||
Government Money Market Portfolio* | 1,997 | 3,420 | 5,417 | 0 | 6 | |||||||||||||||
|
|
|
| |||||||||||||||||
Total | $ | 5,816 | $ | 132 | ||||||||||||||||
|
|
|
| |||||||||||||||||
| * | Investments of cash collateral for securities lending transactions (see Note E). |
During the second quarter of 2018, AXA S.A. (“AXA”), a French holding company for the AXA Group, a worldwide leader in life, property and casualty and health insurance and asset management, completed the sale of a minority stake in its subsidiary, AXA Equitable Holdings, Inc. (now named Equitable Holdings, Inc.)(“Equitable”), through an initial public offering. Equitable is the holding company for a diverse group of financial services companies, including an approximately 65.3% economic interest in the Adviser and a 100% interest in AllianceBernstein Corporation, the general partner of the Adviser. Since the initial sale, AXA has completed additional offerings, most recently during the fourth quarter of 2019. As a result, AXA currently owns 10.1% of the outstanding shares of common stock of Equitable, and no longer owns a controlling interest in Equitable. AXA previously announced its intention to sell its entire interest in Equitable over time, subject to market conditions and other factors (the “Plan”). Most of AXA’s remaining Equitable shares are to be delivered on redemption of AXA bonds mandatorily exchangeable into Equitable shares and maturing in May 2021. AXA retains sole discretion to determine the timing of any future sales of its remaining shares of Equitable common stock.
The latest transaction under the Plan, which occurred on November 13, 2019, resulted in the indirect transfer of a “controlling block” of voting securities of the Adviser (a “Change of Control Event”) and was deemed an “assignment” causing a termination of the Portfolio’s investment advisory agreement. In order to ensure that investment advisory services could continue uninterrupted in the event of a Change of Control Event, the Board previously approved a new investment advisory agreement with the Adviser, and shareholders of the Portfolio subsequently approved the new investment advisory agreement. This agreement became effective on November 13, 2019.
NOTE C: Distribution Plan
The Portfolio has adopted a Distribution Plan (the “Plan”) for Class B shares pursuant to Rule 12b-1 under the Investment Company Act of 1940. Under the Plan, the Portfolio pays distribution and servicing fees to AllianceBernstein Investments, Inc. (the “Distributor”), a wholly-owned subsidiary of the Adviser, at an annual rate of up to .50% of the Portfolio’s average daily net assets attributable to Class B shares. The fees are accrued daily and paid monthly. The Board currently limits payments under the Plan to .25% of the Portfolio’s average daily net assets attributable to Class B shares. The Plan provides that the Distributor will use such payments in their entirety for distribution assistance and promotional activities.
The Portfolio is not obligated under the Plan to pay any distribution and servicing fees in excess of the amounts set forth above. The purpose of the payments to the Distributor under the Plan is to compensate the Distributor for its distribution services with respect to the sale of the Portfolio’s Class B shares. Since the Distributor’s compensation is not directly tied to
19
| GLOBAL THEMATIC GROWTH PORTFOLIO | ||
| NOTES TO FINANCIAL STATEMENTS | ||
| (continued) | AB Variable Products Series Fund | |
its expenses, the amount of compensation received by it under the Plan during any year may be more or less than its actual expenses. For this reason, the Plan is characterized by the staff of the Securities and Exchange Commission as being of the “compensation” variety.
In the event that the Plan is terminated or not continued, no distribution or servicing fees (other than current amounts accrued but not yet paid) would be owed by the Portfolio to the Distributor.
The Plan also provides that the Adviser may use its own resources to finance the distribution of the Portfolio’s shares.
NOTE D: Investment Transactions
Purchases and sales of investment securities (excluding short-term investments) for the year ended December 31, 2019 were as follows:
| Purchases | Sales | |||||||
Investment securities (excluding U.S. government securities) | $ | 52,798,226 | $ | 68,702,988 | ||||
U.S. government securities | –0 | – | –0 | – | ||||
The cost of investments for federal income tax purposes, gross unrealized appreciation and unrealized depreciation are as follows:
Cost | $ | 99,586,045 | ||
|
| |||
Gross unrealized appreciation | $ | 39,063,003 | ||
Gross unrealized depreciation | (1,977,403 | ) | ||
|
| |||
Net unrealized appreciation | $ | 37,085,600 | ||
|
|
1. Derivative Financial Instruments
The Portfolio may use derivatives in an effort to earn income and enhance returns, to replace more traditional direct investments, to obtain exposure to otherwise inaccessible markets (collectively, “investment purposes”), or to hedge or adjust the risk profile of its portfolio.
The principal type of derivative utilized by the Portfolio, as well as the methods in which they may be used are:
| • | Forward Currency Exchange Contracts |
The Portfolio may enter into forward currency exchange contracts in order to hedge its exposure to changes in foreign currency exchange rates on its foreign portfolio holdings, to hedge certain firm purchase and sale commitments denominated in foreign currencies and for non-hedging purposes as a means of making direct investments in foreign currencies, as described below under “Currency Transactions”.
A forward currency exchange contract is a commitment to purchase or sell a foreign currency at a future date at a negotiated forward rate. The gain or loss arising from the difference between the original contract and the closing of such contract would be included in net realized gain or loss on forward currency exchange contracts. Fluctuations in the value of open forward currency exchange contracts are recorded for financial reporting purposes as unrealized appreciation and/or depreciation by the Portfolio. Risks may arise from the potential inability of a counterparty to meet the terms of a contract and from unanticipated movements in the value of a foreign currency relative to the U.S. dollar.
During the year ended December 31, 2019, the Portfolio held forward currency exchange contracts for hedging purposes.
The Portfolio typically enters into International Swaps and Derivatives Association, Inc. Master Agreements (“ISDA Master Agreement”) with its OTC derivative contract counterparties in order to, among other things, reduce its credit risk to OTC counterparties. ISDA Master Agreements include provisions for general obligations, representations, collateral and events of default or termination. Under an ISDA Master Agreement, the Portfolio typically may offset with the OTC counterparty certain derivative financial instruments’ payables and/or receivables with collateral held and/or posted and create one single net payment (close-out netting) in the event of default or termination. In the event of a default by an OTC counterparty, the return of collateral with market value in excess of the Portfolio’s net liability, held by the defaulting party, may be delayed or denied.
20
| AB Variable Products Series Fund | ||
The Portfolio’s ISDA Master Agreements may contain provisions for early termination of OTC derivative transactions in the event the net assets of the Portfolio decline below specific levels (“net asset contingent features”). If these levels are triggered, the Portfolio’s OTC counterparty has the right to terminate such transaction and require the Portfolio to pay or receive a settlement amount in connection with the terminated transaction. If OTC derivatives were held at period end, please refer to netting arrangements by the OTC counterparty table below for additional details.
During the year ended December 31, 2019, the Portfolio had entered into the following derivatives:
Asset Derivatives | Liability Derivatives | |||||||||||
Derivative Type | Statement of | Fair Value | Statement of | Fair Value | ||||||||
Foreign currency contracts | Unrealized appreciation on forward currency exchange contracts | $ | 302,706 | Unrealized depreciation on forward currency exchange contracts | $ | 366,801 | ||||||
|
|
|
| |||||||||
Total | $ | 302,706 | $ | 366,801 | ||||||||
|
|
|
| |||||||||
Derivative Type | Location of Gain or (Loss) on Derivatives Within Statement of Operations | Realized Gain or (Loss) on Derivatives | Change in Unrealized Appreciation or (Depreciation) | |||||||||
Foreign currency contracts | Net realized gain (loss) on forward currency exchange contracts; Net change in unrealized appreciation/depreciation of forward currency exchange contracts | $ | 520,603 | $ | 79,286 | |||||||
|
|
|
| |||||||||
Total | $ | 520,603 | $ | 79,286 | ||||||||
|
|
|
| |||||||||
The following table represents the average monthly volume of the Portfolio’s derivative transactions during the year ended December 31, 2019:
Forward Currency Exchange Contracts: | ||||
Average principal amount of buy contracts | $ | 26,914,022 | ||
Average principal amount of sale contracts | $ | 36,095,233 |
For financial reporting purposes, the Portfolio does not offset derivative assets and derivative liabilities that are subject to netting arrangements in the statement of assets and liabilities.
All OTC derivatives held at period end were subject to netting arrangements. The following table presents the Portfolio’s derivative assets and liabilities by OTC counterparty net of amounts available for offset under ISDA Master Agreements (“MA”) and net of the related collateral received/pledged by the Portfolio as of December 31, 2019. Exchange-traded derivatives and centrally cleared swaps are not subject to netting arrangements and as such are excluded from the table.
Counterparty | Derivative Assets Subject to a MA | Derivatives Available for Offset | Cash Collateral Received* | Security Collateral Received* | Net Amount of Derivative Assets | |||||||||||||||
Bank of America, NA | $ | 62,533 | $ | (3,072 | ) | $ | –0 | – | $ | –0 | – | $ | 59,461 | |||||||
Barclays Bank PLC | 67,011 | (67,011 | ) | –0 | – | –0 | – | –0 | – | |||||||||||
Citibank, NA | 56,791 | (39,683 | ) | –0 | – | –0 | – | 17,108 | ||||||||||||
Morgan Stanley & Co., Inc. | 472 | –0 | – | –0 | – | –0 | – | 472 | ||||||||||||
Natwest Markets PLC | 7,926 | (7,926 | ) | –0 | – | –0 | – | –0 | – | |||||||||||
Standard Chartered Bank | 17,624 | (531 | ) | –0 | – | –0 | – | 17,093 | ||||||||||||
State Street Bank & Trust Co. | 62,073 | (43,151 | ) | –0 | – | –0 | – | 18,922 | ||||||||||||
UBS AG | 28,276 | (28,276 | ) | –0 | – | –0 | – | –0 | – | |||||||||||
|
|
|
|
|
|
|
|
|
| |||||||||||
Total | $ | 302,706 | $ | (189,650 | ) | $ | –0 | – | $ | –0 | – | $ | 113,056 | ^ | ||||||
|
|
|
|
|
|
|
|
|
| |||||||||||
21
| GLOBAL THEMATIC GROWTH PORTFOLIO | ||
| NOTES TO FINANCIAL STATEMENTS | ||
| (continued) | AB Variable Products Series Fund | |
Counterparty | Derivative Liabilities Subject to a MA | Derivatives Available for Offset | Cash Collateral Pledged* | Security Collateral Pledged* | Net Amount of Derivative Liabilities | |||||||||||||||
Bank of America, NA | $ | 3,072 | $ | (3,072 | ) | $ | –0 | – | $ | –0 | – | $ | –0 | – | ||||||
Barclays Bank PLC | 97,844 | (67,011 | ) | –0 | – | –0 | – | 30,833 | ||||||||||||
Citibank, NA | 39,683 | (39,683 | ) | –0 | – | –0 | – | –0 | – | |||||||||||
JPMorgan Chase Bank, NA | 6,788 | –0 | – | –0 | – | –0 | – | 6,788 | ||||||||||||
Natwest Markets PLC | 37,666 | (7,926 | ) | –0 | – | –0 | – | 29,740 | ||||||||||||
Standard Chartered Bank | 531 | (531 | ) | –0 | – | –0 | – | –0 | – | |||||||||||
State Street Bank & Trust Co. | 43,151 | (43,151 | ) | –0 | – | –0 | – | –0 | – | |||||||||||
UBS AG | 138,066 | (28,276 | ) | –0 | – | –0 | – | 109,790 | ||||||||||||
|
|
|
|
|
|
|
|
|
| |||||||||||
Total | $ | 366,801 | $ | (189,650 | ) | $ | –0 | – | $ | –0 | – | $ | 177,151 | ^ | ||||||
|
|
|
|
|
|
|
|
|
| |||||||||||
| * | The actual collateral received/pledged may be more than the amount reported due to over-collateralization. |
| ^ | Net amount represents the net receivable/payable that would be due from/to the counterparty in the event of default or termination. The net amount from OTC financial derivative instruments can only be netted across transactions governed under the same master agreement with the same counterparty. |
2. Currency Transactions
The Portfolio may invest in non-U.S. Dollar-denominated securities on a currency hedged or unhedged basis. The Portfolio may seek investment opportunities by taking long or short positions in currencies through the use of currency-related derivatives, including forward currency exchange contracts, futures and options on futures, swaps, and other options. The Portfolio may enter into transactions for investment opportunities when it anticipates that a foreign currency will appreciate or depreciate in value but securities denominated in that currency are not held by the Portfolio and do not present attractive investment opportunities. Such transactions may also be used when the Adviser believes that it may be more efficient than a direct investment in a foreign currency-denominated security. The Portfolio may also conduct currency exchange contracts on a spot basis (i.e., for cash at the spot rate prevailing in the currency exchange market for buying or selling currencies).
NOTE E: Securities Lending
The Portfolio may enter into securities lending transactions. Under the Portfolio’s securities lending program, all loans of securities will be collateralized continually by cash collateral and/or non-cash collateral. Non-cash collateral will include only securities issued or guaranteed by the U.S. government or its agencies or instrumentalities. The Portfolio cannot sell or repledge any non-cash collateral, such collateral will not be reflected in the portfolio of investments. If a loan is collateralized by cash, the Portfolio will be compensated for the loan from a portion of the net return from the income earned on cash collateral after a rebate is paid to the borrower (in some cases, this rebate may be a “negative rebate” or fee paid by the borrower to the Portfolio in connection with the loan), and payments are made for fees of the securities lending agent and for certain other administrative expenses. If the Portfolio receives non-cash collateral, the Portfolio will receive a fee from the borrower generally equal to a negotiated percentage of the market value of the loaned securities. The Portfolio will have the right to call a loan and obtain the securities loaned at any time on notice to the borrower within the normal and customary settlement time for the securities. While the securities are on loan, the borrower is obligated to pay the Portfolio amounts equal to any income or other distributions from the securities. The Portfolio will not be able to exercise voting rights with respect to any securities during the existence of a loan, but will have the right to regain ownership of loaned securities in order to exercise voting or other ownership rights. Collateral received and securities loaned are marked to market daily to ensure that the securities loaned are secured by collateral. The lending agent currently invests the cash collateral received in Government Money Market Portfolio, an eligible money market vehicle, in accordance with the investment restrictions of the Portfolio, and as approved by the Board. The collateral received on securities loaned is recorded as an asset as well as a corresponding liability in the statement of assets and liabilities. The collateral will be adjusted the next business day to maintain the required collateral amount. The amounts of securities lending income from the borrowers and Government Money Market Portfolio are reflected in the statement of operations. When the Portfolio earns net securities lending income from Government Money Market Portfolio, the income is inclusive of a rebate expense paid to the borrower. In connection with the cash collateral investment by the Portfolio in Government Money Market Portfolio, the Adviser has agreed to waive a portion of the Portfolio’s share of the advisory fees of Government Money Market Portfolio, as borne indirectly by the Portfolio as an acquired fund fee and expense. When the Portfolio lends securities, its investment performance will continue to reflect changes in the value of the securities loaned. A principal risk of lending portfolio securities is that the borrower may
22
| AB Variable Products Series Fund | ||
fail to return the loaned securities upon termination of the loan and that the collateral will not be sufficient to replace the loaned securities. The lending agent has agreed to indemnify the Portfolio in the case of default of any securities borrower.
A summary of the Portfolio’s transactions surrounding securities lending for the year ended December 31, 2019 is as follows:
| Market Value of Securities on Loan* | Cash | Market Value | Income from | Government Money Market Portfolio | ||||||||||||||||||
Income | Advisory Fee | |||||||||||||||||||||
| $ | 3,452,188 | $ | 0 | $ | 3,459,978 | $ | 4,721 | $ | 5,554 | $ | 59 | |||||||||||
| * | As of December 31, 2019. |
NOTE F: Capital Stock
Each class consists of 500,000,000 authorized shares. Transactions in capital shares for each class were as follows:
| SHARES | AMOUNT | |||||||||||||||||||
| Year Ended December 31, 2019 | Year Ended December 31, 2018 | Year Ended December 31, 2019 | Year Ended December 31, 2018 | |||||||||||||||||
Class A |
| |||||||||||||||||||
Shares sold | 114,338 | 216,094 | $ | 3,589,027 | $ | 6,612,541 | ||||||||||||||
Shares issued in reinvestment of dividends | 77,119 | –0 | – | 2,381,432 | –0 | – | ||||||||||||||
Shares redeemed | (210,261 | ) | (230,647 | ) | (6,622,981 | ) | (7,032,186 | ) | ||||||||||||
|
|
|
|
|
|
|
| |||||||||||||
Net decrease | (18,804 | ) | (14,553 | ) | $ | (652,522 | ) | $ | (419,645 | ) | ||||||||||
|
|
|
|
|
|
|
| |||||||||||||
Class B | ||||||||||||||||||||
Shares sold | 303,140 | 353,636 | $ | 9,139,286 | $ | 10,398,435 | ||||||||||||||
Shares issued in reinvestment of dividends | 174,829 | –0 | – | 5,188,929 | –0 | – | ||||||||||||||
Shares redeemed | (643,894 | ) | (913,680 | ) | (19,431,474 | ) | (26,675,161 | ) | ||||||||||||
|
|
|
|
|
|
|
| |||||||||||||
Net decrease | (165,925 | ) | (560,044 | ) | $ | (5,103,259 | ) | $ | (16,276,726 | ) | ||||||||||
|
|
|
|
|
|
|
| |||||||||||||
At December 31, 2019, certain shareholders of the Portfolio owned 67% in aggregate of the Portfolio’s outstanding shares. Significant transactions by such shareholders, if any, may impact the Portfolio’s performance.
NOTE G : Risks Involved in Investing in the Portfolio
Foreign (Non-U.S.) Risk—Investments in securities of non-U.S. issuers may involve more risk than those of U.S. issuers. These securities may fluctuate more widely in price and may be more difficult to trade or dispose of due to adverse market, economic, political, regulatory or other factors.
Emerging Market Risk—Investments in emerging market countries may have more risk because the markets are less developed and less liquid, and because these investments may be subject to increased economic, political, regulatory or other uncertainties.
Currency Risk—Fluctuations in currency exchange rates may negatively affect the value of the Portfolio’s investments or reduce its returns.
Capitalization Risk—Investments in mid-capitalization companies may be more volatile than investments in large-capitalization companies. Investments in mid-capitalization companies may have additional risks because these companies may have limited product lines, markets or financial resources.
Derivatives Risk—The Portfolio may enter into derivative transactions such as forwards, options, futures and swaps. Derivatives may be illiquid, difficult to price, and leveraged so that small changes may produce disproportionate losses for the Portfolio, and subject to counterparty risk to a greater degree than more traditional investments. Derivatives may result in significant losses, including losses that are far greater than the value of the derivatives reflected on the statement of assets and liabilities.
Focused Portfolio Risk—Investments in a limited number of companies may have more risk because changes in the value of a single security may have a more significant effect, either negative or positive, on the Portfolio’s net asset value, or NAV.
23
| GLOBAL THEMATIC GROWTH PORTFOLIO | ||
| NOTES TO FINANCIAL STATEMENTS | ||
| (continued) | AB Variable Products Series Fund | |
Leverage Risk—When the Portfolio borrows money or otherwise leverages its investments, its performance may be volatile because leverage tends to exaggerate the effect of any increase or decrease in the value of the Portfolio’s investments. The Portfolio may create leverage through the use of reverse repurchase arrangements, forward currency exchange contracts, forward commitments, dollar rolls or futures or by borrowing money. The use of other types of derivative instruments by the Portfolio, such as options and swaps, may also result in a form of leverage. Leverage may result in higher returns to the Portfolio than if the Portfolio were not leveraged, but may also adversely affect returns, particularly if the market is declining.
LIBOR Risk—The Portfolio may invest in certain debt securities, derivatives or other financial instruments that utilize the London Interbank Offered Rate, or “LIBOR,” as a “benchmark” or “reference rate” for various interest rate calculations. In July 2017, the United Kingdom Financial Conduct Authority, which regulates LIBOR, announced a desire to phase out the use of LIBOR by the end of 2021. Although financial regulators and industry working groups have suggested alternative reference rates, such as European Interbank Offer Rate (“EURIBOR”), Sterling Overnight Interbank Average Rate (“SONIA”) and Secured Overnight Financing Rate (“SOFR”), global consensus on alternative rates is lacking and the process for amending existing contracts or instruments to transition away from LIBOR remains unclear. The elimination of LIBOR or changes to other reference rates or any other changes or reforms to the determination or supervision of reference rates could have an adverse impact on the market for, or value of, any securities or payments linked to those reference rates, which may adversely affect the Portfolio’s performance and/or net asset value. Uncertainty and risk also remain regarding the willingness and ability of issuers and lenders to include revised provisions in new and existing contracts or instruments. Consequently, the transition away from LIBOR to other reference rates may lead to increased volatility and illiquidity in markets that are tied to LIBOR, fluctuations in values of LIBOR-related investments or investments in issuers that utilize LIBOR, increased difficulty in borrowing or refinancing and diminished effectiveness of hedging strategies, adversely affecting the Portfolio’s performance. Furthermore, the risks associated with the expected discontinuation of LIBOR and transition may be exacerbated if the work necessary to effect an orderly transition to an alternative reference rate is not completed in a timely manner. Because the usefulness of LIBOR as a benchmark could deteriorate during the transition period, these effects could occur prior to the end of 2021.
Indemnification Risk—In the ordinary course of business, the Portfolio enters into contracts that contain a variety of indemnifications. The Portfolio’s maximum exposure under these arrangements is unknown. However, the Portfolio has not had prior claims or losses pursuant to these indemnification provisions and expects the risk of loss thereunder to be remote. Therefore, the Portfolio has not accrued any liability in connection with these indemnification provisions.
NOTE H: Joint Credit Facility
A number of open-end mutual funds managed by the Adviser, including the Portfolio, participate in a $325 million revolving credit facility (the “Facility”) intended to provide short-term financing, if necessary, subject to certain restrictions in connection with abnormal redemption activity. Commitment fees related to the Facility are paid by the participating funds and are included in miscellaneous expenses in the statement of operations. The Portfolio did not utilize the Facility during the year ended December 31, 2019.
NOTE I: Components of Accumulated Earnings (Deficit)
The tax character of distributions paid during the fiscal years ended December 31, 2019 and December 31, 2018 were as follows:
| 2019 | 2018 | |||||||
Distributions paid from: | ||||||||
Ordinary income | $ | 316,132 | $ | –0 | – | |||
Net long-term capital gains | 7,254,229 | –0 | – | |||||
|
|
|
| |||||
Total taxable distributions paid | $ | 7,570,361 | $ | –0 | – | |||
|
|
|
| |||||
As of December 31, 2019, the components of accumulated earnings/(deficit) on a tax basis were as follows:
Undistributed ordinary income | $ | 1,035,104 | ||
Undistributed capital gains | 13,419,311 | |||
Unrealized appreciation/(depreciation) | 37,086,276 | (a) | ||
|
| |||
Total accumulated earnings/(deficit) | $ | 51,540,691 | ||
|
|
| (a) | The differences between book-basis and tax-basis unrealized appreciation/(depreciation) are attributable primarily to the recognition for tax purposes of unrealized gains/losses on certain derivative instruments, return of capital distributions received from underlying securities, and the tax deferral of losses on wash sales. |
24
| AB Variable Products Series Fund | ||
For tax purposes, net realized capital losses may be carried over to offset future capital gains, if any. Funds are permitted to carry forward capital losses for an indefinite period, and such losses will retain their character as either short-term or long-term capital losses. As of December 31, 2019, the Portfolio did not have any capital loss carryforwards.
During the current fiscal year, there were no permanent differences that resulted in adjustments to distributable earnings or additional paid-in capital.
NOTE J: Recent Accounting Pronouncements
In August 2018, the Financial Accounting Standards Board issued an Accounting Standards Update, ASU 2018-13, Fair Value Measurement (Topic 820), Disclosure Framework—Changes to the Disclosure Requirements for Fair Value Measurement which removes, modifies and adds disclosures to Topic 820. The amendments in this ASU 2018-13 (“ASU”) apply to all entities that are required, under existing U.S. GAAP, to make disclosures about recurring or nonrecurring fair value measurements. The amendments in this ASU are effective for all entities for fiscal years, and interim periods within those fiscal years, beginning after December 15, 2019. Management has evaluated the impact of the amendments and elected to early adopt the ASU. The adoption of this ASU did not have a material impact on the disclosure and presentation of the financial statements of the Portfolio.
NOTE K: Subsequent Events
Management has evaluated subsequent events for possible recognition or disclosure in the financial statements through the date the financial statements are issued. Management has determined that there are no material events that would require disclosure in the Portfolio’s financial statements through this date.
25
| GLOBAL THEMATIC GROWTH PORTFOLIO | ||
| FINANCIAL HIGHLIGHTS | AB Variable Products Series Fund | |
Selected Data For A Share Of Capital Stock Outstanding Throughout Each Period
| CLASS A | ||||||||||||||||||||
| Year Ended December 31, | ||||||||||||||||||||
| 2019 | 2018 | 2017 | 2016 | 2015 | ||||||||||||||||
Net asset value, beginning of period | $27.35 | $30.32 | $22.29 | $22.43 | $21.80 | |||||||||||||||
|
|
|
|
|
|
|
|
|
| |||||||||||
Income From Investment Operations | ||||||||||||||||||||
Net investment income (a) | .08 | (b) | .11 | (b) | .03 | (b) | .04 | (b)† | .02 | |||||||||||
Net realized and unrealized gain (loss) on investment and foreign currency transactions | 8.00 | (3.08 | ) | 8.13 | (.18 | ) | .60 | |||||||||||||
Contributions from Affiliates | –0 | – | –0 | – | –0 | – | –0 | – | .01 | |||||||||||
|
|
|
|
|
|
|
|
|
| |||||||||||
Net increase (decrease) in net asset value from operations | 8.08 | (2.97 | ) | 8.16 | (.14 | ) | .63 | |||||||||||||
|
|
|
|
|
|
|
|
|
| |||||||||||
Less: Dividends and Distributions | ||||||||||||||||||||
Dividends from net investment income | (.13 | ) | –0 | – | (.13 | ) | –0 | – | –0 | – | ||||||||||
Distributions from net realized gain on investment transactions | (1.78 | ) | –0 | – | –0 | – | –0 | – | –0 | – | ||||||||||
|
|
|
|
|
|
|
|
|
| |||||||||||
Total dividends and distributions | (1.91 | ) | –0 | – | (.13 | ) | –0 | – | –0 | – | ||||||||||
|
|
|
|
|
|
|
|
|
| |||||||||||
Net asset value, end of period | $33.52 | $27.35 | $30.32 | $22.29 | $22.43 | |||||||||||||||
|
|
|
|
|
|
|
|
|
| |||||||||||
Total Return | ||||||||||||||||||||
Total investment return based on net asset value (c)* | 30.16 | % | (9.79 | )% | 36.66 | % | (.62 | )%† | 2.89 | % | ||||||||||
Ratios/Supplemental Data | ||||||||||||||||||||
Net assets, end of period (000’s omitted) | $43,237 | $35,799 | $40,121 | $28,458 | $31,534 | |||||||||||||||
Ratio to average net assets of: | ||||||||||||||||||||
Expenses, net of waivers/reimbursements | .99 | % | .99 | % | 1.02 | % | 1.06 | % | 1.01 | % | ||||||||||
Expenses, before waivers/reimbursements | 1.04 | % | 1.01 | % | 1.02 | % | 1.06 | % | 1.01 | % | ||||||||||
Net investment income | .27 | %(b) | .37 | %(b) | .09 | %(b) | .17 | %(b)† | .07 | % | ||||||||||
Portfolio turnover rate | 43 | % | 32 | % | 40 | % | 54 | % | 47 | % | ||||||||||
See footnote summary on page 27.
26
| AB Variable Products Series Fund | ||
Selected Data For A Share Of Capital Stock Outstanding Throughout Each Period
| CLASS B | ||||||||||||||||||||
| Year Ended December 31, | ||||||||||||||||||||
| 2019 | 2018 | 2017 | 2016 | 2015 | ||||||||||||||||
Net asset value, beginning of period | $26.33 | $29.25 | $21.52 | $21.71 | $21.15 | |||||||||||||||
|
|
|
|
|
|
|
|
|
| |||||||||||
Income From Investment Operations | ||||||||||||||||||||
Net investment income (loss) (a) | .01 | (b) | .04 | (b) | (.04 | )(b) | (.02 | )(b)† | (.04 | ) | ||||||||||
Net realized and unrealized gain (loss) on investment and foreign currency transactions | 7.68 | (2.96 | ) | 7.84 | (.17 | ) | .59 | |||||||||||||
Contributions from Affiliates | –0 | – | –0 | – | –0 | – | –0 | – | .01 | |||||||||||
|
|
|
|
|
|
|
|
|
| |||||||||||
Net increase (decrease) in net asset value from operations | 7.69 | (2.92 | ) | 7.80 | (.19 | ) | .56 | |||||||||||||
|
|
|
|
|
|
|
|
|
| |||||||||||
Less: Dividends and Distributions | ||||||||||||||||||||
Dividends from net investment income | (.05 | ) | –0 | – | (.07 | ) | –0 | – | –0 | – | ||||||||||
Distributions from net realized gain on investment transactions | (1.78 | ) | –0 | – | –0 | – | –0 | – | –0 | – | ||||||||||
|
|
|
|
|
|
|
|
|
| |||||||||||
Total dividends and distributions | (1.83 | ) | –0 | – | (.07 | ) | –0 | – | –0 | – | ||||||||||
|
|
|
|
|
|
|
|
|
| |||||||||||
Net asset value, end of period | $32.19 | $26.33 | $29.25 | $21.52 | $21.71 | |||||||||||||||
|
|
|
|
|
|
|
|
|
| |||||||||||
Total Return | ||||||||||||||||||||
Total investment return based on net asset value (c)* | 29.78 | % | (9.98 | )% | 36.30 | % | (.87 | )%† | 2.65 | % | ||||||||||
Ratios/Supplemental Data | ||||||||||||||||||||
Net assets, end of period (000’s omitted) | $93,645 | $80,949 | $106,331 | $78,625 | $92,298 | |||||||||||||||
Ratio to average net assets of: | ||||||||||||||||||||
Expenses, net of waivers/reimbursements | 1.24 | % | 1.24 | % | 1.26 | % | 1.31 | % | 1.26 | % | ||||||||||
Expenses, before waivers/reimbursements | 1.29 | % | 1.25 | % | 1.27 | % | 1.31 | % | 1.26 | % | ||||||||||
Net investment income (loss) | .02 | %(b) | .13 | %(b) | (.15 | )%(b) | (.07 | )%(b)† | (.17 | )% | ||||||||||
Portfolio turnover rate | 43 | % | 32 | % | 40 | % | 54 | % | 47 | % | ||||||||||
| (a) | Based on average shares outstanding. |
| (b) | Net of expenses waived/reimbursed by the Adviser. |
| (c) | Total investment return is calculated assuming an initial investment made at the net asset value at the beginning of the period, reinvestment of all dividends and distributions at net asset value during the period, and redemption on the last day of the period. Total return does not reflect (i) insurance company’s separate account related expense charges and (ii) the deductions of taxes that a shareholder would pay on Portfolio distributions or the redemption of Portfolio shares. Total investment return calculated for a period of less than one year is not annualized. |
| † | For the year ended December 31, 2016, the amount includes a refund for overbilling of prior years’ custody out of pocket fees as follows: |
Net Investment Income Per Share | Net Investment Income Ratio | Total Return | ||
| $.004 | .02% | .02% |
| * | Includes the impact of proceeds received and credited to the Portfolio resulting from class action settlements, which enhanced the Portfolio’s performance for the years ended December 31, 2017, December 31, 2016 and December 31, 2015 by .04%, .28% and .01%, respectively. |
See notes to financial statements.
27
| REPORT OF INDEPENDENT REGISTERED | ||
| PUBLIC ACCOUNTING FIRM | AB Variable Products Series Fund | |
To the Shareholders and the Board of Directors of AB Global Thematic Growth Portfolio:
Opinion on the Financial Statements
We have audited the accompanying statement of assets and liabilities of AB Global Thematic Growth Portfolio (the “Portfolio”) (one of the portfolios constituting AB Variable Products Series Fund, Inc. (the “Fund”)), including the portfolio of investments, as of December 31, 2019, and the related statement of operations for the year then ended, the statements of changes in net assets for each of the two years in the period then ended, the financial highlights for each of the five years in the period then ended and the related notes (collectively referred to as the “financial statements”). In our opinion, the financial statements present fairly, in all material respects, the financial position of the Portfolio (one of the portfolios constituting AB Variable Products Series Fund, Inc.) at December 31, 2019, the results of its operations for the year then ended, the changes in its net assets for each of the two years in the period then ended and its financial highlights for each of the five years in the period then ended, in conformity with U.S. generally accepted accounting principles.
Basis for Opinion
These financial statements are the responsibility of the Fund’s management. Our responsibility is to express an opinion on the Portfolio’s financial statements based on our audits. We are a public accounting firm registered with the Public Company Accounting Oversight Board (United States) (“PCAOB”) and are required to be independent with respect to the Fund in accordance with the U.S. federal securities laws and the applicable rules and regulations of the Securities and Exchange Commission and the PCAOB.
We conducted our audits in accordance with the standards of the PCAOB. Those standards require that we plan and perform the audit to obtain reasonable assurance about whether the financial statements are free of material misstatement, whether due to error or fraud. The Fund is not required to have, nor were we engaged to perform, an audit of the Fund’s internal control over financial reporting. As part of our audits, we are required to obtain an understanding of internal control over financial reporting, but not for the purpose of expressing an opinion on the effectiveness of the Fund’s internal control over financial reporting. Accordingly, we express no such opinion.
Our audits included performing procedures to assess the risks of material misstatement of the financial statements, whether due to error or fraud, and performing procedures that respond to those risks. Such procedures included examining, on a test basis, evidence regarding the amounts and disclosures in the financial statements. Our procedures included confirmation of securities owned as of December 31, 2019, by correspondence with the custodian and others or by other appropriate auditing procedures where replies from others were not received. Our audits also included evaluating the accounting principles used and significant estimates made by management, as well as evaluating the overall presentation of the financial statements. We believe that our audits provide a reasonable basis for our opinion.

We have served as the auditor of one or more of the AB investment companies since 1968.
New York, New York
February 14, 2020
28
| 2019 FEDERAL TAX INFORMATION (unaudited) | AB Variable Products Series Fund | |
For Federal income tax purposes, the following information is furnished with respect to the distributions paid by the Portfolio during the taxable year ended December 31, 2019. For corporate shareholders, 99.95% of dividends paid qualify for the dividends received deduction.
29
| GLOBAL THEMATIC GROWTH | ||
| PORTFOLIO | AB Variable Products Series Fund | |
| BOARD OF DIRECTORS | ||
Marshall C. Turner, Jr.(1),Chairman Jorge A. Bermudez^ Michael J. Downey(1) Nancy P. Jacklin(1) | Robert M. Keith,President and Chief Carol C. McMullen(1) Garry L. Moody(1) Earl D. Weiner(1) | |
| OFFICERS | ||
Daniel C. Roarty(2),Vice President Emilie D. Wrapp,Secretary Michael B. Reyes,Senior Analyst | Joseph J. Mantineo,Treasurer and Phyllis J. Clarke,Controller Vincent S. Noto,Chief Compliance Officer | |
| CUSTODIANAND ACCOUNTING AGENT | LEGAL COUNSEL | |
| State Street Bank and Trust Company | Seward & Kissel LLP | |
State Street Corporation CCB/5 1 Iron Street Boston, MA 02210 | One Battery Park Plaza New York, NY 10004 | |
| DISTRIBUTOR | TRANSFER AGENT | |
| AllianceBernstein Investments, Inc. | AllianceBernstein Investor Services, Inc. | |
1345 Avenue of the Americas New York, NY 10105 | P.O. Box 786003 San Antonio, TX 78278-6003 Toll-Free (800) 221-5672 | |
| INDEPENDENT REGISTERED PUBLIC | ||
| ACCOUNTING FIRM | ||
| Ernst & Young LLP | ||
5 Times Square New York, NY 10036 |
| (1) | Member of the Audit Committee, the Governance and Nominating Committee, and the Independent Directors Committee. |
| (2) | Theday-to-day management of, and investment decisions for, the Portfolio’s portfolio are made by the Adviser’s Thematic and Sustainable Equities Investment Team. Mr. Roarty is the investment professional with the most significant responsibility for the day-to-day management of the Portfolio’s portfolio. |
| ^ | Mr. Bermudez will be a member of the Audit Committee, the Governance and Nominating Committee, and the Independent Directors Committee when he joins the Board on January 1, 2020. |
30
| GLOBAL THEMATIC GROWTH PORTFOLIO | ||
| MANAGEMENT OF THE FUND | AB Variable Products Series Fund | |
Board of Directors Information
The business and affairs of the Fund are managed under the direction of the Board of Directors. Certain information concerning the Fund’s Directors is set forth below.
| NAME, ADDRESS*, AGE, (YEAR FIRST ELECTED**) | PRINCIPAL OCCUPATION(S) DURING PAST FIVE YEARS AND OTHER INFORMATION*** | PORTFOLIOS IN AB FUND COMPLEX OVERSEEN BY DIRECTOR | OTHER PUBLIC COMPANY | |||||
| INTERESTED DIRECTOR | ||||||||
Robert M. Keith, # 1345 Avenue of the Americas New York, NY 10105 59 (2010) | Senior Vice President of AllianceBernstein L.P. (the “Adviser”) and the head of AllianceBernstein Investments, Inc. (“ABI”) since July 2008; Director of ABI and President of the AB Mutual Funds. Previously, he served as Executive Managing Director of ABI from December 2006 to June 2008. Prior to joining ABI in 2006, Executive Managing Director of Bernstein Global Wealth Management, and prior thereto, Senior Managing Director and Global Head of Client Service and Sales of the Adviser’s institutional investment management business since 2004. Prior thereto, he was Managing Director and Head of North American Client Service and Sales in the Adviser’s institutional investment management business, with which he had been associated since prior to 2004. | 91 | None | |||||
| DISINTERESTED DIRECTORS | ||||||||
Marshall C. Turner, Jr., ## Chairman of the Board 78 (2005) | Private Investor since prior to 2015. Former Chairman and CEO of Dupont Photomasks, Inc. (components of semi-conductor manufacturing). He has extensive operating leadership and venture capital investing experience, including five interim or full-time CEO roles, and prior service as general partner of institutional venture capital partnerships. He also has extensive non-profit board leadership experience, and currently serves on the boards of two education and science-related non-profit organizations. He has served as a director of one AB Fund since 1992, and director or trustee of all AB Funds since 2005. He has been Chairman of the AB Funds since January 2014, and the Chairman of the Independent Directors Committees of such AB Funds since February 2014. | 91 | Xilinx, Inc. (programmable logic semi-conductors) since 2007 | |||||
Jorge A. Bermudez,^ 68 (2020) | Private investor since prior to 2015. Former Chief Risk Officer of Citigroup, Inc., a global financial services company, from November 2007 to March 2008, Chief Executive Officer of Citigroup’s Commercial Business Group in North America and Citibank Texas from 2005 to 2007, and a variety of other executive and leadership roles at various businesses within Citigroup prior to then; Chairman (2018) of the Texas A&M Foundation Board of Trustees (Trustee since 2013) and Chairman of the Smart Grid Center Board at Texas A&M University since 2012; director of, among others, Citibank N.A. from 2005 to 2008, the Federal Reserve Bank of Dallas, Houston Branch from 2009 to 2011, the Federal Reserve Bank of Dallas from 2011 to 2017, and the Electric Reliability Council of Texas from 2010 to 2016. He has served as director or trustee of the AB Funds since 2020. | 91 | Moody’s Corporation since April 2011 | |||||
31
| GLOBAL THEMATIC GROWTH PORTFOLIO | ||
| MANAGEMENT OF THE FUND | ||
| (continued) | AB Variable Products Series Fund | |
| NAME, ADDRESS*, AGE, (YEAR FIRST ELECTED**) | PRINCIPAL OCCUPATION(S) DURING PAST FIVE YEARS AND OTHER INFORMATION*** | PORTFOLIOS IN AB FUND COMPLEX OVERSEEN BY DIRECTOR | OTHER PUBLIC COMPANY | |||||
| DISINTERESTED DIRECTORS (continued) | ||||||||
Michael J. Downey,## 76 (2005) | Private Investor since prior to 2015. Formerly, Chairman of The Asia Pacific Fund, Inc. (registered investment company) since prior to 2015 until January 2019. From 1987 until 1993, Chairman and CEO of Prudential Mutual Fund Management, director of the Prudential mutual funds, and member of the Executive Committee of Prudential Securities, Inc. He has served as a director or trustee of the AB Funds since 2005. | 91 | None | |||||
Nancy P. Jacklin, ## 71 (2006) | Private Investor since prior to 2015. Professorial Lecturer at the Johns Hopkins School of Advanced International Studies (2008–2015). U.S. Executive Director of the International Monetary Fund (which is responsible for ensuring the stability of the international monetary system), (December 2002–May 2006); Partner, Clifford Chance (1992–2002); Sector Counsel, International Banking and Finance, and Associate General Counsel, Citicorp (1985–1992); Assistant General Counsel (International), Federal Reserve Board of Governors (1982–1985); and Attorney Advisor, U.S. Department of the Treasury (1973–1982). Member of the Bar of the District of Columbia and of New York; and member of the Council on Foreign Relations. She has served as a director or trustee of the AB Funds since 2006 and has been Chair of the Governance and Nominating Committees of the AB Funds since August 2014. | 91 | None | |||||
Carol C. McMullen, ## 64 (2016) | Managing Director of Slalom Consulting (consulting) since 2014, private investor and member of the Advisory Board of Butcher Box (since 2018). Formerly, member, Partners Healthcare Investment Committee (2010–2019); Director of Norfolk & Dedham Group (mutual property and casualty insurance) from 2011 until November 2016; Director of Partners Community Physicians Organization (healthcare) from 2014 until December 2016; and Managing Director of The Crossland Group (consulting) from 2012 until 2013. She has held a number of senior positions in the asset and wealth management industries, including at Eastern Bank (where her roles included President of Eastern Wealth Management), Thomson Financial (Global Head of Sales for Investment Management), and Putnam Investments (where her roles included Chief Investment Officer, Core and Growth and Head of Global Investment Research). She has served on a number of private company and non-profit boards, and as a director or trustee of the AB Funds since June 2016. | 91 | None | |||||
32
| AB Variable Products Series Fund | ||
| NAME, ADDRESS*, AGE, (YEAR FIRST ELECTED**) | PRINCIPAL OCCUPATION(S) DURING PAST FIVE YEARS AND OTHER INFORMATION*** | PORTFOLIOS IN AB FUND COMPLEX OVERSEEN BY DIRECTOR | OTHER PUBLIC COMPANY | |||||
| DISINTERESTED DIRECTORS (continued) | ||||||||
Garry L. Moody, ## 67 (2008) | Formerly, Partner, Deloitte & Touche LLP (1995–2008) where he held a number of senior positions, including Vice Chairman, and U.S. and Global Investment Management Practice Managing Partner; President, Fidelity Accounting and Custody Services Company (1993–1995) where he was responsible for accounting, pricing, custody and reporting for the Fidelity Mutual funds; and Partner, Ernst & Young LLP (1975–1993), where he served as the National Director of Mutual Fund Tax Services and Managing Partner of its Chicago Office Tax department. He is a member of the Trustee Advisory Board of BoardIQ, a biweekly publication focused on issues and news affecting directors of mutual funds. He is also a member of the Investment Company Institute’s Board of Governors and the Independent Directors Council Governing Council. He has served as a director or trustee, and as Chairman of the Audit Committees of the AB Funds since 2008. | 91 | None | |||||
Earl D. Weiner, ## 80 (2007) | Senior Counsel since 2017, Of Counsel from 2007 to 2016, and Partner prior to then, of the law firm Sullivan & Cromwell LLP. He is a former member of the ABA Federal Regulation of Securities Committee Task Force to draft editions of the Fund Director’s Guidebook. He also serves as a director or trustee of various non-profit organizations and has served as Chairman or Vice Chairman of a number of them. He has served as a director or trustee of the AB Funds since 2007 and served as Chairman of the Governance and Nominating Committees of the AB Funds from 2007 until August 2014. | 91 | None | |||||
| * | The address for each of the Fund’s disinterested Directors is c/o AllianceBernstein L.P., Attention: Legal & Compliance Department—Mutual Fund Legal, 1345 Avenue of the Americas, New York, NY 10105 |
| ** | There is no stated term of office for the Fund’s Directors. |
| *** | The information above includes each Director’s principal occupation during the last five years and other information relating to the experience, attributes, and skills relevant to each Director’s qualifications to serve as a Director, which led to the conclusion that each Director should serve as a Director for the Fund. |
| # | Mr. Keith is an “interested person” of the Fund, as defined in the 1940 Act, due to this position as a Senior Vice President of the Adviser. |
| ## | Member of the Audit Committee, the Governance and Nominating Committee, and the Independent Directors Committee. |
| ^ | Mr. Bermudez will be a member of the Audit Committee, the Governance and Nominating Committee, and the Independent Directors Committee when he joins the Board on January 1, 2020. |
33
| GLOBAL THEMATIC GROWTH PORTFOLIO | ||
| MANAGEMENT OF THE FUND | ||
| (continued) | AB Variable Products Series Fund | |
Officer Information
Certain information concerning the Portfolio’s Officers is listed below.
NAME, ADDRESS,* AGE | PRINCIPAL POSITION(S) HELD WITH FUND | PRINCIPAL OCCUPATION DURING PAST FIVE YEARS | ||
Robert M. Keith 59 | President and Chief Executive Officer | See biography above. | ||
| Daniel C. Roarty 48 | Vice President | Senior Vice President of the Adviser**, with which he has been associated since prior to 2015. He is also Chief Investment Officer of Thematic and Sustainable Equities. | ||
| Emilie D. Wrapp 64 | Secretary | Senior Vice President, Assistant General Counsel and Assistant Secretary of ABI**, with which she has been associated since prior to 2015. | ||
| Michael B. Reyes 43 | Senior Analyst | Vice President of the Adviser**, with which he has been associated since prior to 2015. | ||
| Joseph J. Mantineo 60 | Treasurer and Chief Financial Officer | Senior Vice President of AllianceBernstein Investor Services, Inc. (“ABIS”)**, with which he has been associated since prior to 2015. | ||
| Phyllis J. Clarke 59 | Controller | Vice President of ABIS**, with which she has been associated since prior to 2015. | ||
| Vincent S. Noto 55 | Chief Compliance Officer | Senior Vice President since 2015 and Mutual Fund Chief Compliance Officer of the Adviser** since prior to 2015. |
| * | The address for each of the Portfolio’s Officers is 1345 Avenue of the Americas, New York, NY 10105. |
| ** | The Adviser, ABI and ABIS are affiliates of the Fund. |
| The Fund’s Statement of Additional Information (“SAI”) has additional information about the Fund’s Directors and Officers and is available without charge upon request. Contact your financial representative or the Adviser at(800) 227-4618, or visit www.abfunds.com, for a free prospectus or SAI. |
34
| GLOBAL THEMATIC GROWTH PORTFOLIO | ||
| CONTINUANCE DISCLOSURE | AB Variable Products Series Fund | |
INFORMATION REGARDING THE REVIEW AND APPROVAL OF THE FUND’S ADVISORY AGREEMENT
The disinterested directors (the “directors”) of AB Variable Products Series Fund, Inc. (the “Company”) unanimously approved the continuance of the Company’s Advisory Agreement with the Adviser in respect of AB Global Thematic Growth Portfolio (the “Fund”) at a meeting held on May 7-9, 2019 (the “Meeting”).
Prior to approval of the continuance of the Advisory Agreement, the directors had requested from the Adviser, and received and evaluated, extensive materials. They reviewed the proposed continuance of the Advisory Agreement with the Adviser and with experienced counsel who are independent of the Adviser, who advised on the relevant legal standards. The directors also reviewed additional materials, including comparative analytical data prepared by the Senior Analyst for the Fund. The directors also discussed the proposed continuance in private sessions with counsel.
The directors considered their knowledge of the nature and quality of the services provided by the Adviser to the Fund gained from their experience as directors or trustees of most of the registered investment companies advised by the Adviser, their overall confidence in the Adviser’s integrity and competence they have gained from that experience, the Adviser’s initiative in identifying and raising potential issues with the directors and its responsiveness, frankness and attention to concerns raised by the directors in the past, including the Adviser’s willingness to consider and implement organizational and operational changes designed to improve investment results and the services provided to the AB Funds. The directors noted that they have four regular meetings each year, at each of which they review extensive materials and information from the Adviser, including information on the investment performance of the Fund.
The directors also considered all factors they believed relevant, including the specific matters discussed below. During the course of their deliberations, the directors evaluated, among other things, the reasonableness of the advisory fee. The directors did not identify any particular information that was all-important or controlling, and different directors may have attributed different weights to the various factors. The directors determined that the selection of the Adviser to manage the Fund and the overall arrangements between the Fund and the Adviser, as provided in the Advisory Agreement, including the advisory fee, were fair and reasonable in light of the services performed, expenses incurred and such other matters as the directors considered relevant in the exercise of their business judgment. The material factors and conclusions that formed the basis for the directors’ determinations included the following:
Nature, Extent and Quality of Services Provided
The directors considered the scope and quality of services provided by the Adviser under the Advisory Agreement, including the quality of the investment research capabilities of the Adviser and the other resources it has dedicated to performing services for the Fund. The directors noted that the Adviser from time to time reviews the Fund’s investment strategies and from time to time proposes changes intended to improve the Fund’s relative or absolute performance for the directors’ consideration. They also noted the professional experience and qualifications of the Fund’s portfolio management team and other senior personnel of the Adviser. The directors also considered that the Advisory Agreement provides that the Fund will reimburse the Adviser for the cost to it of providing certain clerical, accounting, administrative and other services to the Fund by employees of the Adviser or its affiliates. Requests for these reimbursements are made on a quarterly basis and subject to approval by the directors. Reimbursements, to the extent requested and paid, result in a higher rate of total compensation from the Fund to the Adviser than the fee rate stated in the Advisory Agreement. The directors noted that the methodology used to determine the reimbursement amounts had been reviewed by an independent consultant retained by the Fund’s former Senior Officer/Independent Compliance Officer. The quality of administrative and other services, including the Adviser’s role in coordinating the activities of the Fund’s other service providers, also was considered. The directors concluded that, overall, they were satisfied with the nature, extent and quality of services provided to the Fund under the Advisory Agreement.
Costs of Services Provided and Profitability
The directors reviewed a schedule of the revenues and expenses and related notes indicating the profitability of the Fund to the Adviser for calendar years 2017 and 2018 that had been prepared with an expense allocation methodology arrived at in consultation with an independent consultant retained by the Fund’s former Senior Officer/Independent Compliance Officer. The directors noted the assumptions and methods of allocation used by the Adviser in preparing fund-specific profitability data and understood that there are a number of potentially acceptable allocation methodologies for information of this type. The directors noted that the profitability information reflected all revenues and expenses of the Adviser’s relationship with the Fund, including those relating to its subsidiaries that provide transfer agency, distribution and brokerage services to the Fund. The directors recognized that it is difficult to make comparisons of the profitability of the Advisory Agreement with
35
| GLOBAL THEMATIC GROWTH PORTFOLIO | ||
| CONTINUANCE DISCLOSURE | ||
| (continued) | AB Variable Products Series Fund | |
the profitability of advisory contracts for unaffiliated funds because comparative information is not generally publicly available and is affected by numerous factors. The directors focused on the profitability of the Adviser’s relationship with the Fund before taxes and distribution expenses. The directors concluded that the Adviser’s level of profitability from its relationship with the Fund was not unreasonable.
Fall-Out Benefits
The directors considered the other benefits to the Adviser and its affiliates from their relationships with the Fund and the underlying fund advised by the Adviser in which the Fund invests, including, but not limited to, benefits relating to soft dollar arrangements (whereby investment advisers receive brokerage and research services from brokers that execute agency transactions for their clients); 12b-1 fees and sales charges received by the Fund’s principal underwriter (which is a wholly owned subsidiary of the Adviser) in respect of the Fund’s Class B shares; brokerage commissions paid by the Fund to brokers affiliated with the Adviser; and transfer agency fees paid by the Fund to a wholly owned subsidiary of the Adviser. The directors recognized that the Adviser’s profitability would be somewhat lower without these benefits. The directors understood that the Adviser also might derive reputational and other benefits from its association with the Fund.
Investment Results
In addition to the information reviewed by the directors in connection with the Meeting, the directors receive detailed performance information for the Fund at each regular Board meeting during the year.
At the Meeting, the directors reviewed performance information prepared by an independent service provider (the “15(c) service provider”), showing the performance of the Class A Shares of the Fund against a group of similar funds (“peer group”) and a larger group of similar funds (“peer universe”), each selected by the 15(c) service provider, and information prepared by the Adviser showing performance of the Class A Shares against a broad-based securities market index, in each case for the 1-, 3-, 5- and 10-year periods ended February 28, 2019. Based on their review, the directors concluded that the Fund’s investment performance was acceptable.
Advisory Fees and Other Expenses
The directors considered the advisory fee rate payable by the Fund to the Adviser and information prepared by the 15(c) service provider concerning advisory fee rates payable by other funds in the same category as the Fund. The directors recognized that it is difficult to make comparisons of advisory fees because there are variations in the services that are included in the fees paid by other funds. The directors compared the Fund’s contractual effective advisory fee rate with a peer group median and noted that it was above the median. The directors also took into account the impact on the advisory fee rate of the administrative expense reimbursement paid to the Adviser in the latest fiscal year.
The directors also considered the Adviser’s fee schedule for other clients pursuing an investment strategy similar to the Fund’s. For this purpose, they reviewed the relevant advisory fee information from the Adviser’s Form ADV and in a report from the Fund’s Senior Analyst and noted the differences between the Fund’s fee schedule, on the one hand, and the Adviser’s institutional fee schedule and the schedule of fees charged by the Adviser to any offshore funds and for services to any sub-advised funds pursuing an investment strategy similar to the Fund’s, on the other. The directors noted that the Adviser may, in some cases, agree to fee rates with large institutional clients that are lower than those reviewed by the directors and that they had previously discussed with the Adviser its policies in respect of such arrangements. The directors previously discussed these matters with an independent fee consultant. The directors also compared the advisory fee rate for the Fund with those for two other funds advised by the Adviser with a similar investment strategy.
The Adviser reviewed with the directors the significantly greater scope of the services it provides to the Fund relative to institutional, offshore fund and sub-advised fund clients. In this regard, the Adviser noted, among other things, that, compared to institutional and offshore or sub-advisory accounts, the Fund (i) demands considerably more portfolio management, research and trading resources due to significantly higher daily cash flows; (ii) has more tax and regulatory restrictions and compliance obligations; (iii) must prepare and file or distribute regulatory and other communications about fund operations; and (iv) must provide shareholder servicing to retail investors. The Adviser also reviewed the greater legal risks presented by the large and changing population of Fund shareholders who may assert claims against the Adviser in individual or class actions, and the greater entrepreneurial risk in offering new fund products, which require substantial investment to launch, may not succeed, and generally must be priced to compete with larger, more established funds resulting in lack of profitability to the Adviser until a new fund achieves scale. In light of the substantial differences in services rendered by the Adviser to institutional, offshore fund and sub-advised fund clients as compared to funds such as the Fund, and the different risk profile, the directors considered these fee comparisons inapt and did not place significant weight on them in their deliberations.
36
| AB Variable Products Series Fund | ||
In connection with their review of the Fund’s advisory fee, the directors also considered the total expense ratio of the Class A shares of the Fund in comparison to a peer group and a peer universe selected by the 15(c) service provider. The Class A expense ratio of the Fund was based on the Fund’s latest fiscal year. The directors noted that it was likely that the expense ratios of some of the other funds in the Fund’s category were lowered by waivers or reimbursements by those funds’ investment advisers, which in some cases might be voluntary or temporary. The directors view expense ratio information as relevant to their evaluation of the Adviser’s services because the Adviser is responsible for coordinating services provided to the Fund by others. The directors noted that the Fund’s expense ratio was above the peer group median. After reviewing and discussing the Adviser’s explanations of the reasons for this, the directors concluded that the Fund’s expense ratio was acceptable.
Economies of Scale
The directors noted that the advisory fee schedule for the Fund contains breakpoints that reduce the fee rates on assets above specified levels. The directors took into consideration prior presentations by an independent consultant on economies of scale in the mutual fund industry and for the AB Funds, and presentations from time to time by the Adviser concerning certain of its views on economies of scale. The directors also previously discussed economies of scale with an independent fee consultant. The directors also had requested and received from the Adviser certain updates on economies of scale in advance of the Meeting. The directors believe that economies of scale may be realized (if at all) by the Adviser across a variety of products and services, and not only in respect of a single fund. The directors noted that there is no established methodology for setting breakpoints that give effect to the fund-specific services provided by a fund’s adviser and to the economies of scale that an adviser may realize in its overall mutual fund business or those components of it which directly or indirectly affect a fund’s operations. The directors observed that in the mutual fund industry as a whole, as well as among funds similar to the Fund, there is no uniformity or pattern in the fees and asset levels at which breakpoints (if any) apply. The directors also noted that the advisory agreements for many funds do not have breakpoints at all. Having taken these factors into account, the directors concluded that the Fund’s shareholders would benefit from a sharing of economies of scale in the event the Fund’s net assets exceed a breakpoint in the future.
37
VPS-GTG-0151-1219
DEC 12.31.19

ANNUAL REPORT
AB VARIABLE PRODUCTS SERIES FUND, INC.
| + | GROWTH AND INCOME PORTFOLIO |
Beginning on May 1, 2021, as permitted by regulations adopted by the Securities and Exchange Commission, you may not be receiving paper copies of the Portfolio’s shareholder reports from the insurance company that offers your contract unless you specifically request paper copies from the insurance company or from your financial intermediary. Instead of delivering paper copies of the reports, the insurance company may choose to make the reports available on a website, and will notify you by mail each time a report is posted and provide you with a website link to access the report. Instructions for requesting paper copies will be provided by your insurance company.
If you already elected to receive shareholder reports electronically, you will not be affected by this change and you need not take any action. You may elect to receive shareholder reports and other communications from the insurance company or your financial intermediary electronically by following the instructions provided by the insurance company or by contacting your financial intermediary.
You may elect to receive all future reports in paper free of charge from the insurance company. You can inform the insurance company or your financial intermediary that you wish to continue receiving paper copies of your shareholder reports by following the instructions provided by the insurance company or by contacting your financial intermediary. Your election to receive reports in paper will apply to all portfolio companies available under your contract with the insurance company.
Investment Products Offered
| • | Are Not FDIC Insured |
| • | May Lose Value |
| • | Are Not Bank Guaranteed |
AllianceBernstein Investments, Inc. (ABI) is the distributor of the AB family of mutual funds. ABI is a member of FINRA and is an affiliate of AllianceBernstein L.P., the Adviser of the funds.
You may obtain a description of the Fund’s proxy voting policies and procedures, and information regarding how the Fund voted proxies relating to portfolio securities during the most recent12-month period ended June 30, without charge. Simply visit AB’s website at www.abfunds.com or go to the Securities and Exchange Commission’s (the “Commission”) website at www.sec.gov, or call AB at (800) 227 4618.
The Fund files its complete schedule of portfolio holdings with the Commission for the first and third quarters of each fiscal year as an exhibit to its reports on Form N-PORT. The Fund’s Form N-PORT reports are available on the Commission’s website at www.sec.gov. The Fund’s Forms N-PORT may also be reviewed and copied at the Commission’s Public Reference Room in Washington, DC; information on the operation of the Public Reference Room may be obtained by calling (800) SEC 0330.
The [A/B] logo is a registered service mark of AllianceBernstein and AllianceBernstein® is a registered service mark used by permission of the owner, AllianceBernstein L.P.
| GROWTH AND INCOME PORTFOLIO | AB Variable Products Series Fund | |
LETTER TO INVESTORS
February 14, 2020
The following is an update of AB Variable Products Series Fund—Growth and Income Portfolio (the “Portfolio”) for the annual reporting period ended December 31, 2019.
INVESTMENT OBJECTIVE AND POLICIES
The Portfolio’s investment objective is long-term growth of capital. The Portfolio invests primarily in the equity securities of US companies that the Adviser believes are undervalued.
The Portfolio may enter into derivatives transactions, such as options, futures contracts, forwards and swaps. The Portfolio may use options strategies involving the purchase and/or writing of various combinations of call and/or put options, including on individual securities and stock indices, futures contracts (including futures contracts on individual securities and stock indices) or shares of exchange-traded funds (“ETFs”). These transactions may be used, for example, to earn extra income, to adjust exposure to individual securities or markets, or to protect all or a portion of the Portfolio’s portfolio from a decline in value, sometimes within certain ranges.
The Portfolio may, at times, invest in shares of ETFs in lieu of making direct investments in equity securities. ETFs may provide more efficient and economical exposure to the types of companies and geographic locations in which the Portfolio seeks to invest than direct investments.
INVESTMENT RESULTS
The table on page 3 shows the Portfolio’s performance compared to its benchmark, the Russell 1000 Value Index, for theone-, five- and10-year periods ended December 31, 2019.
All share classes of the Portfolio underperformed the benchmark for the annual period. Sector selection detracted most, relative to the benchmark, due to underweights in financials and consumer staples, while an overweight in industrials and an underweight in the energy sector contributed. Stock selection also detracted from performance, led by selection within health care and technology. Selection within energy and financials contributed.
The Portfolio did not utilize derivatives during the annual period.
MARKET REVIEW AND INVESTMENT STRATEGY
Global equities recorded strong double-digit returns while emerging markets also rallied during the annual period ended December 31, 2019. After declining sharply at the end of 2018, equity markets rebounded dramatically in January as strong corporate earnings and optimism about a trade truce between the US and China calmed investors.Trade-war tensions resurfaced, however, and emerging geopolitical pressures drove market volatility. Tariff wars, restrictive monetary policy and a decline in industrial production stoked recessionary fears throughout the global economy. In response, the world’s central banks implemented accommodative monetary policies to help support capital markets. Late in the third quarter, equity market performance was accompanied by a sharp style rotation in the US. Quality-growth and lower-volatility stocks, which had been strong performers, lagged and value stocks outperformed. However, for the most part, growth stocks continued to outperform value over the entire period. From a market-capitalization perspective,large-cap stocks outperformed theirsmall-cap peers. In December, equity markets rallied on news that the US and China had agreed to a preliminaryphase-one trade deal due to be signed in January 2020.
The Portfolio’s Senior Investment Management Team (the “Team”) remains committed to usingbottom-up research to build a Portfolio composed of well-managed companies that are attractively valued relative to their long-term earnings power. The Team’s objective is to find companies that stand out and deploy capital wisely, allowing these companies to grow dividends and enhance the long-term value of their shares.
1
GROWTH AND INCOME PORTFOLIO | ||
| DISCLOSURES AND RISKS | AB Variable Products Series Fund | |
Benchmark Disclosure
The Russell 1000® Value Index is unmanaged and does not reflect fees and expenses associated with the active management of a mutual fund portfolio.The Russell 1000 Value Index represents the performance oflarge-cap value companies within the US. An investor cannot invest directly in an index, and its results are not indicative of the performance for any specific investment, including the Portfolio.
A Word About Risk
Market Risk: The value of the Portfolio’s assets will fluctuate as the stock or bond market fluctuates. The value of its investments may decline, sometimes rapidly and unpredictably, simply because of economic changes or other events that affect large portions of the market. It includes the risk that a particular style of investing, such as the Portfolio’s value approach, may be underperforming the market generally.
Foreign(Non-US) Risk: Investments in securities ofnon-US issuers may involve more risk than those of US issuers. These securities may fluctuate more widely in price and may be more difficult to trade or dispose of due to adverse market, economic, political, regulatory or other factors.
Currency Risk: Fluctuations in currency exchange rates may negatively affect the value of the Portfolio’s investments or reduce its returns.
Derivatives Risk: Derivatives may be difficult to price or unwind and leveraged so that small changes may produce disproportionate losses for the Portfolio. Derivatives may also be subject to counterparty risk to a greater degree than more traditional investments.
Industry/Sector Risk: Investments in a particular industry or group of related industries may have more risk because market or economic factors affecting that industry could have a significant effect on the value of the Portfolio’s investments.
Management Risk: The Portfolio is subject to management risk because it is an actively managed investment fund. The Adviser will apply its investment techniques and risk analyses in making investment decisions for the Portfolio, but there is no guarantee that its techniques will produce the intended results.
These risks are fully discussed in the Variable Products prospectus. As with all investments, you may lose money by investing in the Portfolio.
An Important Note About Historical Performance
The investment return and principal value of an investment in the Portfolio will fluctuate, so that shares, when redeemed, may be worth more or less than their original cost. Performance shown in this report represents past performance and does not guarantee future results. Current performance may be lower or higher than the performance information shown. Please contact your financial advisor or insurance agent representative at your financial institution to obtain portfolio performance information current to the most recent month end.
Investors should consider the investment objectives, risks, charges and expenses of the Portfolio carefully before investing. For additional copies of the Portfolio’s prospectus or summary prospectus, which contains this and other information, call your financial advisor or (800) 227 4618. Please read the prospectus and/or summary prospectus carefully before investing.
All fees and expenses related to the operation of the Portfolio have been deducted, but no adjustment has been made for insurance company separate account or annuity contract charges, which would reduce total return to a contract owner. Performance assumes reinvestment of distributions and does not account for taxes.
There are additional fees and expenses associated with all Variable Products. These fees can include mortality and expense risk charges, administrative charges, and other charges that can significantly reduce investment returns. Those fees and expenses are not reflected in this annual report. You should consult your Variable Products prospectus for a description of those fees and expenses and speak to your insurance agent or financial representative if you have any questions. You should read the prospectus before investing or sending money.
2
GROWTH AND INCOME PORTFOLIO | ||
| HISTORICAL PERFORMANCE | AB Variable Products Series Fund | |
| THE PORTFOLIO VS. ITS BENCHMARK | Net Asset Value Returns | |||||||||||
| PERIODS ENDED DECEMBER 31, 2019 (unaudited) | 1 Year | 5 Years1 | 10 Years1 | |||||||||
| Growth and Income Portfolio Class A2 | 23.91% | 9.50% | 12.64% | |||||||||
| Growth and Income Portfolio Class B2 | 23.61% | 9.23% | 12.36% | |||||||||
| Russell 1000 Value Index | 26.54% | 8.29% | 11.80% | |||||||||
1 Average annual returns. |
| |||||||||||
2 Includes the impact of proceeds received and credited to the Portfolio resulting from class-action settlements, which enhanced the performance of all share classes of the Portfolio for the annual period ended December 31, 2019 by 0.16%.
|
| |||||||||||
| Please keep in mind that high, double-digit returns are highly unusual and cannot be sustained. Investors should also be aware that these returns were primarily achieved during favorable market conditions. |
| |||||||||||
The Portfolio’s current prospectus fee table shows the Portfolio’s total annual operating expense ratios as 0.61% and 0.86% for Class A and Class B shares, respectively. The Financial Highlights section of this report sets forth expense ratio data for the current reporting period; the expense ratios shown above may differ from the expense ratios in the Financial Highlights section since they are based on different time periods.
GROWTH OF A $10,000 INVESTMENT
12/31/2009 TO 12/31/2019 (unaudited)
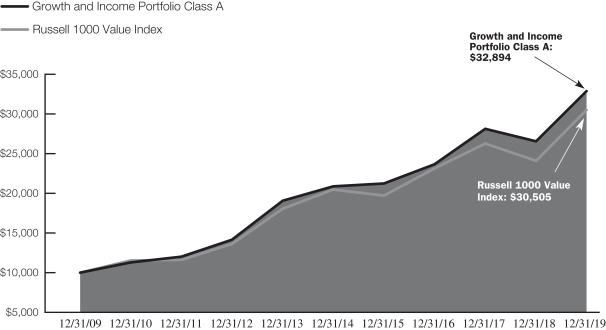
This chart illustrates the total value of an assumed $10,000 investment in the Growth and Income Portfolio Class A shares (from 12/31/2009 to 12/31/2019) as compared to the performance of the Portfolio’s benchmark. The chart assumes the reinvestment of dividends and capital gains distributions.
See Disclosures, Risks and Note about Historical Performance on page 2.
3
| GROWTH AND INCOME PORTFOLIO | ||
| EXPENSE EXAMPLE (unaudited) | AB Variable Products Series Fund | |
As a shareholder of the Portfolio, you incur two types of costs: (1) transaction costs, including sales charges (loads) on purchase payments, contingent deferred sales charges on redemptions and (2) ongoing costs, including management fees; distribution(12b-1) fees; and other Portfolio expenses. This example is intended to help you understand your ongoing costs (in dollars) of investing in the Portfolio and to compare these costs with the ongoing costs of investing in other mutual funds.
The Example is based on an investment of $1,000 invested at the beginning of the period and held for the entire period as indicated below.
Actual Expenses
The table below provides information about actual account values and actual expenses. You may use the information in this line, together with the amount you invested, to estimate the expenses that you paid over the period. Simply divide your account value by $1,000 (for example, an $8,600 account value divided by $1,000 = 8.6), then multiply the result by the number in the first line under the heading entitled “Expenses Paid During Period” to estimate the expenses you paid on your account during this period. The estimate of expenses does not include fees or other expenses of any variable insurance product. If such expenses were included, the estimate of expenses you paid during the period would be higher and your ending account value would be lower.
Hypothetical Example for Comparison Purposes
The table below provides information about hypothetical account values and hypothetical expenses based on the Portfolio’s actual expense ratio and an assumed annual rate of return of 5% before expenses, which is not the Portfolio’s actual return. The hypothetical account values and expenses may not be used to estimate the actual ending account balance or expenses you paid for the period. You may use this information to compare the ongoing costs of investing in the Portfolio and other funds by comparing this 5% hypothetical example with the 5% hypothetical examples that appear in the shareholder reports of other funds. The estimate of expenses does not include fees or other expenses of any variable insurance product. If such expenses were included, the estimate of expenses you paid during the period would be higher and your ending account value would be lower.
Please note that the expenses shown in the table are meant to highlight your ongoing costs only and do not reflect any transactional costs, such as sales charges (loads), or contingent deferred sales charges on redemptions. Therefore, the second line of each classes’ table is useful in comparing ongoing costs only, and will not help you determine the relative total costs of owning different funds. In addition, if these transactional costs were included, your costs would have been higher.
| Beginning Account Value July 1, 2019 | Ending Account Value December 31, 2019 | Expenses Paid During Period* | Annualized Expense Ratio* | Total Expenses Paid During Period+ | Total Annualized Expense Ratio+ | |||||||||||||||||||
Class A | ||||||||||||||||||||||||
Actual | $ | 1,000 | $ | 1,085.60 | $ | 3.26 | 0.62 | % | $ | 3.31 | 0.63 | % | ||||||||||||
Hypothetical (5% annual return before expenses) | $ | 1,000 | $ | 1,022.08 | $ | 3.16 | 0.62 | % | $ | 3.21 | 0.63 | % | ||||||||||||
Class B | ||||||||||||||||||||||||
Actual | $ | 1,000 | $ | 1,083.90 | $ | 4.57 | 0.87 | % | $ | 4.62 | 0.88 | % | ||||||||||||
Hypothetical (5% annual return before expenses) | $ | 1,000 | $ | 1,020.82 | $ | 4.43 | 0.87 | % | $ | 4.48 | 0.88 | % | ||||||||||||
| * | Expenses are equal to the classes’ annualized expense ratios, multiplied by the average account value over the period, multiplied by 184/365 (to reflect the one-half year period). |
| + | In connection with the Portfolio’s investments in affiliated/unaffiliated underlying portfolios, the Portfolio incurs no direct expenses, but bears proportionate shares of the fees and expenses (i.e., operating, administrative and investment advisory fees) of the affiliated/unaffiliated underlying portfolios. The Adviser has contractually agreed to waive its fees from the Portfolio in an amount equal to the Portfolio’s pro rata share of certain acquired fund fees and expenses of the affiliated underlying portfolios. The Portfolio’s total expenses are equal to the classes’ annualized expense ratio plus the Portfolio’s pro rata share of the weighted average expense ratio of the affiliated/unaffiliated underlying portfolios in which it invests, multiplied by the average account value over the period, multiplied by 184/365 (to reflect the one-half year period). |
4
| GROWTH AND INCOME PORTFOLIO | ||
| TEN LARGEST HOLDINGS1 | ||
| December 31, 2019 (unaudited) | AB Variable Products Series Fund | |
| COMPANY | U.S. $ VALUE | PERCENT OF NET ASSETS | ||||||
Pfizer, Inc. | $ | 47,794,742 | 4.4 | % | ||||
Verizon Communications, Inc. | 43,948,278 | 4.1 | ||||||
JPMorgan Chase & Co. | 39,906,038 | 3.7 | ||||||
Wells Fargo & Co. | 39,494,042 | 3.6 | ||||||
Berkshire Hathaway, Inc.—Class B | 35,474,883 | 3.3 | ||||||
Walmart, Inc. | 33,796,551 | 3.1 | ||||||
Roche Holding AG (Sponsored ADR) | 33,289,155 | 3.1 | ||||||
Comcast Corp.—Class A | 32,084,746 | 3.0 | ||||||
Raytheon Co. | 30,106,797 | 2.8 | ||||||
Citigroup, Inc. | 27,854,447 | 2.6 | ||||||
|
|
|
| |||||
| $ | 363,749,679 | 33.7 | % | |||||
SECTOR BREAKDOWN2
December 31, 2019 (unaudited)
| SECTOR | U.S. $ VALUE | PERCENT OF TOTAL INVESTMENTS | ||||||
Financials | $ | 224,259,139 | 20.8 | % | ||||
Health Care | 175,024,843 | 16.2 | ||||||
Industrials | 114,400,606 | 10.6 | ||||||
Information Technology | 95,543,554 | 8.9 | ||||||
Communication Services | 89,777,079 | 8.3 | ||||||
Energy | 73,709,230 | 6.8 | ||||||
Consumer Discretionary | 65,024,258 | 6.0 | ||||||
Consumer Staples | 54,396,840 | 5.1 | ||||||
Real Estate | 49,891,346 | 4.6 | ||||||
Materials | 8,264,589 | 0.8 | ||||||
Short-Term Investments | 128,696,502 | 11.9 | ||||||
|
|
|
| |||||
Total Investments | $ | 1,078,987,986 | 100.0 | % | ||||
| 1 | Long-term investments. |
| 2 | The Portfolio’s sector breakdown is expressed as a percentage of total investments (excluding security lending collateral) and may vary over time. |
Please note: The sector classifications presented herein are based on the Global Industry Classification Standard (GICS) which was developed by Morgan Stanley Capital International and Standard & Poor’s. The components are divided into sector, industry group, and industrysub-indices as classified by the GICS for each of the market capitalization indices in the broad market. These sector classifications are broadly defined. The “Portfolio of Investments” section of the report reflects more specific industry information and is consistent with the investment restrictions discussed in the Portfolio’s prospectus.
5
| GROWTH AND INCOME PORTFOLIO | ||
| PORTFOLIO OF INVESTMENTS | ||
| December 31, 2019 | AB Variable Products Series Fund | |
| Company | Shares | U.S. $ Value | ||||||
COMMON STOCKS–88.1% | ||||||||
FINANCIALS–20.8% | ||||||||
BANKS–9.9% | ||||||||
Citigroup, Inc. | 348,660 | $ | 27,854,447 | |||||
JPMorgan Chase & Co. | 286,270 | 39,906,038 | ||||||
Wells Fargo & Co. | 734,090 | 39,494,042 | ||||||
|
| |||||||
| 107,254,527 | ||||||||
|
| |||||||
CONSUMER | ||||||||
Capital One Financial Corp. | 216,366 | 22,266,225 | ||||||
|
| |||||||
DIVERSIFIED FINANCIAL SERVICES–3.3% | ||||||||
Berkshire Hathaway, | 156,622 | 35,474,883 | ||||||
|
| |||||||
INSURANCE–5.5% | ||||||||
Aflac, Inc. | 177,040 | 9,365,416 | ||||||
Allstate Corp. (The) | 170,900 | 19,217,705 | ||||||
Fidelity National Financial, Inc. | 357,930 | 16,232,126 | ||||||
Reinsurance Group of America, Inc.–Class A | 88,607 | 14,448,257 | ||||||
|
| |||||||
| 59,263,504 | ||||||||
|
| |||||||
| 224,259,139 | ||||||||
|
| |||||||
HEALTH CARE–16.2% | ||||||||
BIOTECHNOLOGY–3.6% | ||||||||
Alexion Pharmaceuticals, Inc.(a) | 149,970 | 16,219,256 | ||||||
Amgen, Inc. | 58,320 | 14,059,202 | ||||||
Gilead Sciences, Inc. | 139,763 | 9,081,800 | ||||||
|
| |||||||
| 39,360,258 | ||||||||
|
| |||||||
HEALTH CARE PROVIDERS & SERVICES–5.1% | ||||||||
Anthem, Inc. | 66,970 | 20,226,949 | ||||||
Cigna Corp.(a) | 84,911 | 17,363,450 | ||||||
Quest Diagnostics, Inc. | 159,100 | 16,990,289 | ||||||
|
| |||||||
| 54,580,688 | ||||||||
|
| |||||||
PHARMACEUTICALS–7.5% | ||||||||
Pfizer, Inc. | 1,219,876 | 47,794,742 | ||||||
Roche Holding AG (Sponsored ADR) | 818,720 | 33,289,155 | ||||||
|
| |||||||
| 81,083,897 | ||||||||
|
| |||||||
| 175,024,843 | ||||||||
|
| |||||||
INDUSTRIALS–10.6% | ||||||||
AEROSPACE & | ||||||||
Curtiss-Wright Corp. | 44,100 | 6,213,249 | ||||||
Hexcel Corp. | 83,700 | 6,136,047 | ||||||
Raytheon Co. | 137,011 | 30,106,797 | ||||||
|
| |||||||
| 42,456,093 | ||||||||
|
| |||||||
AIRLINES–2.2% | ||||||||
Alaska Air Group, Inc. | 187,170 | 12,680,768 | ||||||
Delta Air Lines, Inc. | 71,130 | 4,159,682 | ||||||
Southwest Airlines Co.(b) | 136,910 | 7,390,402 | ||||||
|
| |||||||
| 24,230,852 | ||||||||
|
| |||||||
CONSTRUCTION & ENGINEERING–0.8% | ||||||||
EMCOR Group, Inc. | 100,790 | $ | 8,698,177 | |||||
|
| |||||||
ELECTRICAL | ||||||||
Hubbell, Inc.(b) | 27,920 | 4,127,134 | ||||||
|
| |||||||
MACHINERY–1.7% | ||||||||
Altra Industrial Motion Corp. | 248,750 | 9,007,237 | ||||||
Crane Co. | 103,260 | 8,919,599 | ||||||
|
| |||||||
| 17,926,836 | ||||||||
|
| |||||||
PROFESSIONAL | ||||||||
Robert Half International, Inc. | 66,650 | 4,208,948 | ||||||
|
| |||||||
ROAD & RAIL–1.2% | ||||||||
Kansas City Southern(b) | 54,250 | 8,308,930 | ||||||
Norfolk Southern Corp. | 22,890 | 4,443,636 | ||||||
|
| |||||||
| 12,752,566 | ||||||||
|
| |||||||
| 114,400,606 | ||||||||
|
| |||||||
INFORMATION TECHNOLOGY–8.9% | ||||||||
COMMUNICATIONS EQUIPMENT–2.7% | ||||||||
Cisco Systems, Inc. | 261,160 | 12,525,234 | ||||||
F5 Networks, Inc.(a) | 116,630 | 16,287,379 | ||||||
|
| |||||||
| 28,812,613 | ||||||||
|
| |||||||
ELECTRONIC EQUIPMENT, INSTRUMENTS & COMPONENTS–2.0% | ||||||||
Dolby Laboratories, | 254,438 | 17,505,335 | ||||||
Littelfuse, Inc. | 21,264 | 4,067,803 | ||||||
|
| |||||||
| 21,573,138 | ||||||||
|
| |||||||
IT SERVICES–4.2% | ||||||||
Akamai Technologies, Inc.(a) | 124,970 | 10,794,909 | ||||||
Cognizant Technology Solutions Corp.–Class A | 201,480 | 12,495,789 | ||||||
Leidos Holdings, Inc. | 119,012 | 11,650,085 | ||||||
MAXIMUS, Inc. | 137,344 | 10,217,020 | ||||||
|
| |||||||
| 45,157,803 | ||||||||
|
| |||||||
| 95,543,554 | ||||||||
|
| |||||||
COMMUNICATION SERVICES–8.3% | ||||||||
DIVERSIFIED TELECOMMUNICATION SERVICES–7.0% | ||||||||
Comcast Corp.–Class A | 713,470 | 32,084,746 | ||||||
Verizon Communications, Inc. | 715,770 | 43,948,278 | ||||||
|
| |||||||
| 76,033,024 | ||||||||
|
| |||||||
MEDIA–1.3% | ||||||||
Discovery, Inc.–Class A(a)(b) | 419,794 | 13,744,055 | ||||||
|
| |||||||
| 89,777,079 | ||||||||
|
| |||||||
ENERGY–6.8% | ||||||||
ENERGY EQUIPMENT & SERVICES–0.3% | ||||||||
Dril-Quip, Inc.(a) | 80,590 | 3,780,477 | ||||||
|
| |||||||
6
| AB Variable Products Series Fund | ||
| Company | Shares | U.S. $ Value | ||||||
OIL, GAS & CONSUMABLE FUELS–6.5% | ||||||||
Chevron Corp. | 121,350 | $ | 14,623,889 | |||||
ConocoPhillips | 238,060 | 15,481,042 | ||||||
Exxon Mobil Corp. | 182,830 | 12,757,877 | ||||||
Phillips 66 | 242,940 | 27,065,945 | ||||||
|
| |||||||
| 69,928,753 | ||||||||
|
| |||||||
| 73,709,230 | ||||||||
|
| |||||||
CONSUMER DISCRETIONARY–6.0% | ||||||||
AUTO COMPONENTS–1.6% | ||||||||
BorgWarner, Inc. | 172,830 | 7,497,366 | ||||||
Gentex Corp.(b) | 342,440 | 9,923,911 | ||||||
|
| |||||||
| 17,421,277 | ||||||||
|
| |||||||
DISTRIBUTORS–0.6% | ||||||||
LKQ Corp.(a) | 173,780 | 6,203,946 | ||||||
|
| |||||||
HOUSEHOLD | ||||||||
DR Horton, Inc.(b) | 217,380 | 11,466,795 | ||||||
Garmin Ltd. | 87,590 | 8,545,280 | ||||||
|
| |||||||
| 20,012,075 | ||||||||
|
| |||||||
SPECIALTY RETAIL–2.0% | ||||||||
Advance Auto Parts, Inc. | 81,690 | 13,083,470 | ||||||
Murphy USA, Inc.(a)(b) | 70,970 | 8,303,490 | ||||||
|
| |||||||
| 21,386,960 | ||||||||
|
| |||||||
| 65,024,258 | ||||||||
|
| |||||||
CONSUMER | ||||||||
FOOD & STAPLES RETAILING–3.2% | ||||||||
Walmart, Inc. | 284,387 | 33,796,551 | ||||||
|
| |||||||
TOBACCO–1.9% | ||||||||
Philip Morris International, Inc. | 242,100 | 20,600,289 | ||||||
|
| |||||||
| 54,396,840 | ||||||||
|
| |||||||
REAL ESTATE–4.6% | ||||||||
EQUITY REAL ESTATE INVESTMENT TRUSTS (REITs)–2.1% | ||||||||
Mid-America Apartment Communities, Inc. | 60,150 | 7,931,379 | ||||||
Regency Centers Corp. | 243,920 | 15,388,913 | ||||||
|
| |||||||
| 23,320,292 | ||||||||
|
| |||||||
REAL ESTATE MANAGEMENT & DEVELOPMENT–2.5% | ||||||||
CBRE Group, Inc.–Class A(a) | 433,530 | 26,571,054 | ||||||
|
| |||||||
| 49,891,346 | ||||||||
|
| |||||||
MATERIALS–0.8% | ||||||||
CHEMICALS–0.4% | ||||||||
LyondellBasell Industries | 41,850 | 3,953,988 | ||||||
|
| |||||||
| Company | Shares | U.S. $ Value | ||||||
METALS & MINING–0.4% | ||||||||
BHP Group Ltd. (Sponsored ADR)(b) | 78,790 | $ | 4,310,601 | |||||
|
| |||||||
| 8,264,589 | ||||||||
|
| |||||||
Total Common Stocks | 950,291,484 | |||||||
|
| |||||||
SHORT-TERM INVESTMENTS –12.0% | ||||||||
INVESTMENT COMPANIES–12.0% | ||||||||
AB Fixed Income Shares, Inc.–Government | 128,696,502 | 128,696,502 | ||||||
|
| |||||||
TOTAL INVESTMENTS BEFORE SECURITY LENDING COLLATERAL FOR SECURITIES | 1,078,987,986 | |||||||
|
| |||||||
INVESTMENTS OF CASH COLLATERAL FOR SECURITIES | ||||||||
INVESTMENT COMPANIES–0.3% | ||||||||
AB Fixed Income Shares, Inc.–Government Money Market Portfolio–Class AB, 1.53%(c)(d)(e) | 3,696,960 | 3,696,960 | ||||||
|
| |||||||
TOTAL | 1,082,684,946 | |||||||
Other assets less | (4,316,494 | ) | ||||||
|
| |||||||
NET ASSETS–100.0% | $ | 1,078,368,452 | ||||||
|
| |||||||
| (a) | Non-income producing security. |
| (b) | Represents entire or partial securities out on loan. See Note E for securities lending information. |
| (c) | Affiliated investments. |
| (d) | The rate shown represents the7-day yield as of period end. |
| (e) | To obtain a copy of the fund’s shareholder report, please go to the Securities and Exchange Commission’s website at www.sec.gov, or call AB at (800)227-4618. |
Glossary:
ADR—American Depositary Receipt
See notes to financial statements.
7
| GROWTH AND INCOME PORTFOLIO | ||
| STATEMENT OF ASSETS & LIABILITIES | ||
| December 31, 2019 | AB Variable Products Series Fund | |
ASSETS | ||||
Investments in securities, at value | ||||
Unaffiliated issuers (cost $780,370,725) | $ | 950,291,484 | (a) | |
Affiliated issuers (cost $132,393,462—including investment of cash collateral for securities loaned of $3,696,960) | 132,393,462 | |||
Unaffiliated dividends receivable | 728,279 | |||
Receivable for capital stock sold | 207,375 | |||
Affiliated dividends receivable | 161,173 | |||
Other assets | 14,816 | |||
|
| |||
Total assets | 1,083,796,589 | |||
|
| |||
LIABILITIES | ||||
Payable for collateral received on securities loaned | 3,696,960 | |||
Payable for capital stock redeemed | 770,267 | |||
Advisory fee payable | 475,709 | |||
Distribution fee payable | 188,690 | |||
Administrative fee payable | 37,353 | |||
Transfer Agent fee payable | 132 | |||
Accrued expenses and other liabilities | 259,026 | |||
|
| |||
Total liabilities | 5,428,137 | |||
|
| |||
NET ASSETS | $ | 1,078,368,452 | ||
|
| |||
COMPOSITION OF NET ASSETS | ||||
Capital stock, at par | $ | 36,137 | ||
Additionalpaid-in capital | 855,130,562 | |||
Distributable earnings | 223,201,753 | |||
|
| |||
| $ | 1,078,368,452 | |||
|
|
Net Asset Value Per Share—1 billion shares of capital stock authorized, $.001 par value
| Class | Net Assets | Shares Outstanding | Net Asset Value | |||||||||
| A | $ | 155,765,423 | 5,140,223 | $ | 30.30 | |||||||
| B | $ | 922,603,029 | 30,996,455 | $ | 29.76 | |||||||
| (a) | Includes securities on loan with a value of $32,243,429 (see Note E). |
See notes to financial statements.
8
| GROWTH AND INCOME PORTFOLIO | ||
| STATEMENT OF OPERATIONS | ||
| Year Ended December 31, 2019 | AB Variable Products Series Fund | |
INVESTMENT INCOME | ||||
Dividends | ||||
Unaffiliated issuers (net of foreign taxes withheld of $16,227) | $ | 18,459,946 | ||
Affiliated issuers | 2,371,868 | |||
Interest | 635 | |||
Securities lending income | 49,069 | |||
|
| |||
| 20,881,518 | ||||
|
| |||
EXPENSES | ||||
Advisory fee (see Note B) | 5,627,613 | |||
Distribution fee—Class B | 2,194,789 | |||
Transfer agency—Class A | 1,276 | |||
Transfer agency—Class B | 7,703 | |||
Legal | 180,556 | |||
Custodian | 178,551 | |||
Printing | 127,430 | |||
Administrative | 95,657 | |||
Audit and tax | 44,096 | |||
Directors’ fees | 22,925 | |||
Miscellaneous | 37,172 | |||
|
| |||
Total expenses | 8,517,768 | |||
Less: expenses waived and reimbursed by the Adviser (see Notes B & E) | (109,770 | ) | ||
|
| |||
Net expenses | 8,407,998 | |||
|
| |||
Net investment income | 12,473,520 | |||
|
| |||
REALIZED AND UNREALIZED GAIN ON INVESTMENT TRANSACTIONS | ||||
Net realized gain on investment transactions | 40,276,635 | |||
Net change in unrealized appreciation/depreciation of investments | 159,345,540 | |||
|
| |||
Net gain on investment transactions | 199,622,175 | |||
|
| |||
NET INCREASE IN NET ASSETS FROM OPERATIONS | $ | 212,095,695 | ||
|
|
See notes to financial statements.
9
| GROWTH AND INCOME PORTFOLIO | ||
| STATEMENT OF CHANGES IN NET ASSETS | AB Variable Products Series Fund | |
| Year Ended December 31, 2019 | Year Ended December 31, 2018 | |||||||
INCREASE (DECREASE) IN NET ASSETS FROM OPERATIONS | ||||||||
Net investment income | $ | 12,473,520 | $ | 10,908,094 | ||||
Net realized gain on investment transactions | 40,276,635 | 111,242,634 | ||||||
Net change in unrealized appreciation/depreciation of investments | 159,345,540 | (176,425,722 | ) | |||||
|
|
|
| |||||
Net increase (decrease) in net assets from operations | 212,095,695 | (54,274,994 | ) | |||||
Distributions to Shareholders | ||||||||
Class A | (17,238,473 | ) | (18,264,930 | ) | ||||
Class B | (105,878,573 | ) | (104,977,978 | ) | ||||
CAPITAL STOCK TRANSACTIONS | ||||||||
Net increase | 83,297,353 | 17,496,207 | ||||||
|
|
|
| |||||
Total increase (decrease) | 172,276,002 | (160,021,695 | ) | |||||
NET ASSETS | ||||||||
Beginning of period | 906,092,450 | 1,066,114,145 | ||||||
|
|
|
| |||||
End of period | $ | 1,078,368,452 | $ | 906,092,450 | ||||
|
|
|
| |||||
See notes to financial statements.
10
| GROWTH AND INCOME PORTFOLIO | ||
| NOTES TO FINANCIAL STATEMENTS | ||
| December 31, 2019 | AB Variable Products Series Fund | |
NOTE A: Significant Accounting Policies
The AB Growth and Income Portfolio (the “Portfolio”) is a series of AB Variable Products Series Fund, Inc. (the “Fund”). The Portfolio’s investment objective is long-term growth of capital. The Portfolio is diversified as defined under the Investment Company Act of 1940. The Fund was incorporated in the State of Maryland on November 17, 1987, as anopen-end series investment company. The Portfolio acquired the assets and liabilities of AB Value Portfolio (the “Acquired Portfolio”) a reorganization that was effective at the close of business April 26, 2019 (the “Reorganization”). The Reorganization was approved by the Fund’s Board of Directors pursuant to a Plan of Acquisition and Liquidation (the “Reorganization Agreement”) (see Note J for additional information). The Fund offers eleven separately managed pools of assets which have differing investment objectives and policies. The Portfolio offers Class A and Class B shares. Both classes of shares have identical voting, dividend, liquidating and other rights, except that Class B shares bear a distribution expense and have exclusive voting rights with respect to the Class B distribution plan.
The Portfolio offers and sells its shares only to separate accounts of certain life insurance companies for the purpose of funding variable annuity contracts and variable life insurance policies. Sales are made without a sales charge at the Portfolio’s net asset value per share.
The financial statements have been prepared in conformity with U.S. generally accepted accounting principles (“U.S. GAAP”) which require management to make certain estimates and assumptions that affect the reported amounts of assets and liabilities in the financial statements and amounts of income and expenses during the reporting period. Actual results could differ from those estimates. The Portfolio is an investment company under U.S. GAAP and follows the accounting and reporting guidance applicable to investment companies. The following is a summary of significant accounting policies followed by the Portfolio.
1. Security Valuation
Portfolio securities are valued at their current market value determined on the basis of market quotations or, if market quotations are not readily available or are deemed unreliable, at “fair value” as determined in accordance with procedures established by and under the general supervision of the Fund’s Board of Directors (the “Board”).
In general, the market values of securities which are readily available and deemed reliable are determined as follows: securities listed on a national securities exchange (other than securities listed on the NASDAQ Stock Market, Inc. (“NASDAQ”)) or on a foreign securities exchange are valued at the last sale price at the close of the exchange or foreign securities exchange. If there has been no sale on such day, the securities are valued at the last traded price from the previous day. Securities listed on more than one exchange are valued by reference to the principal exchange on which the securities are traded; securities listed only on NASDAQ are valued in accordance with the NASDAQ Official Closing Price; listed or over the counter (“OTC”) market put or call options are valued at the mid level between the current bid and ask prices. If either a current bid or current ask price is unavailable, AllianceBernstein L.P. (the “Adviser”) will have discretion to determine the best valuation (e.g., last trade price in the case of listed options); open futures are valued using the closing settlement price or, in the absence of such a price, the most recent quoted bid price. If there are no quotations available for the day of valuation, the last available closing settlement price is used; U.S. Government securities and any other debt instruments having 60 days or less remaining until maturity are generally valued at market by an independent pricing vendor, if a market price is available. If a market price is not available, the securities are valued at amortized cost. This methodology is commonly used for short term securities that have an original maturity of 60 days or less, as well as short term securities that had an original term to maturity that exceeded 60 days. In instances when amortized cost is utilized, the Valuation Committee (the “Committee”) must reasonably conclude that the utilization of amortized cost is approximately the same as the fair value of the security. Such factors the Committee will consider include, but are not limited to, an impairment of the creditworthiness of the issuer or material changes in interest rates. Fixed-income securities, including mortgage-backed and asset-backed securities, may be valued on the basis of prices provided by a pricing service or at a price obtained from one or more of the major broker-dealers. In cases where broker-dealer quotes are obtained, the Adviser may establish procedures whereby changes in market yields or spreads are used to adjust, on a daily basis, a recently obtained quoted price on a security. Swaps and other derivatives are valued daily, primarily using independent pricing services, independent pricing models using market inputs, as well as third party broker-dealers or counterparties. Open end mutual funds are valued at the closing net asset value per share, while exchange traded funds are valued at the closing market price per share.
11
| GROWTH AND INCOME PORTFOLIO | ||
| NOTES TO FINANCIAL STATEMENTS | ||
| (continued) | AB Variable Products Series Fund | |
Securities for which market quotations are not readily available (including restricted securities) or are deemed unreliable are valued at fair value as deemed appropriate by the Adviser. Factors considered in making this determination may include, but are not limited to, information obtained by contacting the issuer, analysts, analysis of the issuer’s financial statements or other available documents. In addition, the Portfolio may use fair value pricing for securities primarily traded innon-U.S. markets because most foreign markets close well before the Portfolio values its securities at 4:00 p.m., Eastern Time. The earlier close of these foreign markets gives rise to the possibility that significant events, including broad market moves, may have occurred in the interim and may materially affect the value of those securities. To account for this, the Portfolio generally values many of its foreign equity securities using fair value prices based on third party vendor modeling tools to the extent available.
2. Fair Value Measurements
In accordance with U.S. GAAP regarding fair value measurements, fair value is defined as the price that the Portfolio would receive to sell an asset or pay to transfer a liability in an orderly transaction between market participants at the measurement date. U.S. GAAP establishes a framework for measuring fair value, and a three-level hierarchy for fair value measurements based upon the transparency of inputs to the valuation of an asset or liability (including those valued based on their market values as described in Note A.1 above). Inputs may be observable or unobservable and refer broadly to the assumptions that market participants would use in pricing the asset or liability. Observable inputs reflect the assumptions market participants would use in pricing the asset or liability based on market data obtained from sources independent of the Portfolio. Unobservable inputs reflect the Portfolio’s own assumptions about the assumptions that market participants would use in pricing the asset or liability based on the best information available in the circumstances. Each investment is assigned a level based upon the observability of the inputs which are significant to the overall valuation. The three-tier hierarchy of inputs is summarized below.
| • | Level 1—quoted prices in active markets for identical investments |
| • | Level 2—other significant observable inputs (including quoted prices for similar investments, interest rates, prepayment speeds, credit risk, etc.) |
| • | Level 3—significant unobservable inputs (including the Portfolio’s own assumptions in determining the fair value of investments) |
Where readily available market prices or relevant bid prices are not available for certain equity investments, such investments may be valued based on similar publicly traded investments, movements in relevant indices since last available prices or based upon underlying company fundamentals and comparable company data (such as multiples to earnings or other multiples to equity). Where an investment is valued using an observable input, such as another publicly traded security, the investment will be classified as Level 2. If management determines that an adjustment is appropriate based on restrictions on resale, illiquidity or uncertainty, and such adjustment is a significant component of the valuation, the investment will be classified as Level 3. An investment will also be classified as Level 3 where management uses company fundamentals and other significant inputs to determine the valuation.
The following table summarizes the valuation of the Portfolio’s investments by the above fair value hierarchy levels as of December 31, 2019:
| Level 1 | Level 2 | Level 3 | Total | |||||||||||||
Investments in Securities: | ||||||||||||||||
Assets: | ||||||||||||||||
Common Stocks(a) | $ | 950,291,484 | $ | –0 | – | $ | –0 | – | $ | 950,291,484 | ||||||
Short-Term Investments | 128,696,502 | –0 | – | –0 | – | 128,696,502 | ||||||||||
Investments of Cash Collateral for Securities Loaned in Affiliated Money Market Fund | 3,696,960 | –0 | – | –0 | – | 3,696,960 | ||||||||||
|
|
|
|
|
|
|
| |||||||||
Total Investments in Securities | 1,082,684,946 | –0 | – | –0 | – | 1,082,684,946 | ||||||||||
Other Financial Instruments(b) | –0 | – | –0 | – | –0 | – | –0 | – | ||||||||
|
|
|
|
|
|
|
| |||||||||
Total | $ | 1,082,684,946 | $ | –0 | – | $ | –0 | – | $ | 1,082,684,946 | ||||||
|
|
|
|
|
|
|
| |||||||||
| (a) | See Portfolio of Investments for sector classifications. |
| (b) | Other financial instruments are derivative instruments, such as futures, forwards and swaps, which are valued at the unrealized appreciation/(depreciation) on the instrument. Other financial instruments may also include swaps with upfront premiums, options written and swaptions written which are valued at market value. |
12
| AB Variable Products Series Fund | ||
3. Currency Translation
Assets and liabilities denominated in foreign currencies and commitments under forward currency exchange contracts are translated into U.S. dollars at the mean of the quoted bid and ask prices of such currencies against the U.S. dollar. Purchases and sales of portfolio securities are translated into U.S. dollars at the rates of exchange prevailing when such securities were acquired or sold. Income and expenses are translated into U.S. dollars at rates of exchange prevailing when accrued.
Net realized gain or loss on foreign currency transactions represents foreign exchange gains and losses from sales and maturities of foreign fixed income investments, holding of foreign currencies, currency gains or losses realized between the trade and settlement dates on foreign investment transactions, and the difference between the amounts of dividends, interest and foreign withholding taxes recorded on the Portfolio’s books and the U.S. dollar equivalent amounts actually received or paid. Net unrealized currency gains and losses from valuing foreign currency denominated assets and liabilities at period end exchange rates are reflected as a component of net unrealized appreciation or depreciation of foreign currency denominated assets and liabilities.
4. Taxes
It is the Portfolio’s policy to meet the requirements of the Internal Revenue Code applicable to regulated investment companies and to distribute all of its investment company taxable income and net realized gains, if any, to shareholders. Therefore, no provisions for federal income or excise taxes are required. The Portfolio may be subject to taxes imposed by countries in which it invests. Such taxes are generally based on income and/or capital gains earned or repatriated. Taxes are accrued and applied to net investment income, net realized gains and net unrealized appreciation/depreciation as such income and/or gains are earned.
In accordance with U.S. GAAP requirements regarding accounting for uncertainties in income taxes, management has analyzed the Portfolio’s tax positions taken or expected to be taken on federal and state income tax returns for all open tax years (the current and the prior three tax years) and has concluded that no provision for income tax is required in the Portfolio’s financial statements.
5. Investment Income and Investment Transactions
Dividend income is recorded on theex-dividend date or as soon as the Portfolio is informed of the dividend. Interest income is accrued daily. Investment transactions are accounted for on the date the securities are purchased or sold. Investment gains or losses are determined on the identified cost basis. The Portfolio amortizes premiums and accretes discounts as adjustments to interest income.
6. Class Allocations
All income earned and expenses incurred by the Portfolio are borne on apro-rata basis by each outstanding class of shares, based on the proportionate interest in the Portfolio represented by the net assets of such class, except for class specific expenses which are allocated to the respective class. Expenses of the Fund are charged proportionately to each portfolio or based on other appropriate methods. Realized and unrealized gains and losses are allocated among the various share classes based on respective net assets.
7. Dividends and Distributions
Dividends and distributions to shareholders, if any, are recorded on theex-dividend date. Income dividends and capital gains distributions are determined in accordance with federal tax regulations and may differ from those determined in accordance with U.S. GAAP. To the extent these differences are permanent, such amounts are reclassified within the capital accounts based on their federal tax basis treatment; temporary differences do not require such reclassification.
NOTE B: Advisory Fee and Other Transactions with Affiliates
Under the terms of the investment advisory agreement, the Portfolio pays the Adviser an advisory fee at an annual rate of .55% of the first $2.5 billion, .45% of the next $2.5 billion and .40% in excess of $5 billion, of the Portfolio’s average daily net assets. The fee is accrued daily and paid monthly.
Pursuant to the investment advisory agreement, the Portfolio may reimburse the Adviser for certain legal and accounting services provided to the Portfolio by the Adviser. For the year ended December 31, 2019, the reimbursement for such services amounted to $95,657.
The Portfolio compensates AllianceBernstein Investor Services, Inc. (“ABIS”), a wholly-owned subsidiary of the Adviser, under a Transfer Agency Agreement for providing personnel and facilities to perform transfer agency services for the Portfolio. Such compensation retained by ABIS amounted to $1,491 for the year ended December 31, 2019.
13
| GROWTH AND INCOME PORTFOLIO | ||
| NOTES TO FINANCIAL STATEMENTS | ||
| (continued) | AB Variable Products Series Fund | |
The Portfolio may invest in AB Government Money Market Portfolio (the “Government Money Market Portfolio”) which has a contractual annual advisory fee rate of .20% of the portfolio’s average daily net assets and bears its own expenses. The Adviser has contractually agreed to waive .10% of the advisory fee of Government Money Market Portfolio (resulting in a net advisory fee of .10%) until August 31, 2020. In connection with the investment by the Portfolio in Government Money Market Portfolio, the Adviser has contractually agreed to waive its advisory fee from the Portfolio in an amount equal to the Portfolio’s pro rata share of the effective advisory fee of Government Money Market Portfolio, as borne indirectly by the Portfolio as an acquired fund fee and expense. For the year ended December 31, 2019, such waiver amounted to $108,395.
A summary of the Portfolio’s transactions in AB mutual funds for the year ended December 31, 2019 is as follows:
Fund | Market Value 12/31/18 (000) | Purchases at Cost (000) | Sales Proceeds (000) | Market Value 12/31/19 (000) | Dividend Income (000) | |||||||||||||||
Government Money Market Portfolio | $ | 64,547 | $ | 416,836 | $ | 352,687 | $ | 128,696 | $ | 2,339 | ||||||||||
Government Money Market Portfolio* | 0 | 99,389 | 95,692 | 3,697 | 33 | |||||||||||||||
|
|
|
| |||||||||||||||||
Total | $ | 132,393 | $ | 2,372 | ||||||||||||||||
|
|
|
| |||||||||||||||||
| * | Investments of cash collateral for securities lending transactions (see Note E). |
During the second quarter of 2018, AXA S.A. (“AXA”), a French holding company for the AXA Group, a worldwide leader in life, property and casualty and health insurance and asset management, completed the sale of a minority stake in its subsidiary, AXA Equitable Holdings, Inc. (now named Equitable Holdings, Inc.)(“Equitable”), through an initial public offering. Equitable is the holding company for a diverse group of financial services companies, including an approximately 65.3% economic interest in the Adviser and a 100% interest in AllianceBernstein Corporation, the general partner of the Adviser Since the initial sale, AXA has completed additional offerings, most recently during the fourth quarter of 2019. As a result, AXA currently owns 10.1% of the outstanding shares of common stock of Equitable, and no longer owns a controlling interest in Equitable. AXA previously announced its intention to sell its entire interest in Equitable over time, subject to market conditions and other factors (the “Plan”). Most of AXA’s remaining Equitable shares are to be delivered on redemption of AXA bonds mandatorily exchangeable into Equitable shares and maturing in May 2021. AXA retains sole discretion to determine the timing of any future sales of its remaining shares of Equitable common stock. The latest transaction under the Plan, which occurred on November 13, 2019, resulted in the indirect transfer of a “controlling block” of voting securities of the Adviser (a “Change of Control Event”) and was deemed an “assignment” causing a termination of the Portfolio’s investment advisory agreement. In order to ensure that investment advisory services could continue uninterrupted in the event of a Change of Control Event, the Board previously approved a new investment advisory agreement with the Adviser, and shareholders of the Fund subsequently approved the new investment advisory agreement. This agreement became effective on November 13, 2019.
The latest transaction under the Plan, which occurred on November 13, 2019, resulted in the indirect transfer of a “controlling block” of voting securities of the Adviser (a “Change of Control Event”) and was deemed an “assignment” causing a termination of the Portfolio’s investment advisory agreement. In order to ensure that investment advisory services could continue uninterrupted in the event of a Change of Control Event, the Board previously approved a new investment advisory agreement with the Adviser. Shareholders of the Portfolio subsequently approved the new investment advisory agreement, which became effective on November 13, 2019.
NOTE C: Distribution Plan
The Portfolio has adopted a Distribution Plan (the “Plan”) for Class B shares pursuant to Rule12b-1 under the Investment Company Act of 1940. Under the Plan, the Portfolio pays distribution and servicing fees to AllianceBernstein Investments, Inc. (the “Distributor”), a wholly-owned subsidiary of the Adviser, at an annual rate of up to .50% of the Portfolio’s average daily net assets attributable to Class B shares. The fees are accrued daily and paid monthly. The Board currently limits payments under the Plan to .25% of the Portfolio’s average daily net assets attributable to Class B shares. The Plan provides that the Distributor will use such payments in their entirety for distribution assistance and promotional activities.
The Portfolio is not obligated under the Plan to pay any distribution and servicing fees in excess of the amounts set forth above. The purpose of the payments to the Distributor under the Plan is to compensate the Distributor for its distribution services with respect to the sale of the Portfolio’s Class B shares. Since the Distributor’s compensation is not directly tied to its expenses, the amount of compensation received by it under the Plan during any year may be more or less than its actual expenses. For this reason, the Plan is characterized by the staff of the Securities and Exchange Commission as being of the “compensation” variety.
14
| AB Variable Products Series Fund | ||
In the event that the Plan is terminated or not continued, no distribution or servicing fees (other than current amounts accrued but not yet paid) would be owed by the Portfolio to the Distributor.
The Plan also provides that the Adviser may use its own resources to finance the distribution of the Portfolio’s shares.
NOTE D: Investment Transactions
Purchases and sales of investment securities (excluding short-term investments) for the year ended December 31, 2019 were as follows:
| Purchases | Sales | |||||||
Investment securities (excluding U.S. government securities) | $ | 605,064,848 | $ | 695,251,870 | ||||
U.S. government securities | –0 | – | –0 | – | ||||
The cost of investments for federal income tax purposes, gross unrealized appreciation and unrealized depreciation are as follows:
Cost | $ | 917,047,943 | ||
|
| |||
Gross unrealized appreciation | $ | 172,391,910 | ||
Gross unrealized depreciation | (6,754,907 | ) | ||
|
| |||
Net unrealized appreciation | $ | 165,637,003 | ||
|
|
1. Derivative Financial Instruments
The Portfolio may use derivatives in an effort to earn income and enhance returns, to replace more traditional direct investments, to obtain exposure to otherwise inaccessible markets (collectively, “investment purposes”), or to hedge or adjust the risk profile of its portfolio.
The Portfolio did not engage in derivatives transactions for the year ended December 31, 2019.
2. Currency Transactions
The Portfolio may invest innon-U.S. Dollar-denominated securities on a currency hedged or unhedged basis. The Portfolio may seek investment opportunities by taking long or short positions in currencies through the use of currency-related derivatives, including forward currency exchange contracts, futures and options on futures, swaps, and other options. The Portfolio may enter into transactions for investment opportunities when it anticipates that a foreign currency will appreciate or depreciate in value but securities denominated in that currency are not held by the Portfolio and do not present attractive investment opportunities. Such transactions may also be used when the Adviser believes that it may be more efficient than a direct investment in a foreign currency-denominated security. The Portfolio may also conduct currency exchange contracts on a spot basis (i.e., for cash at the spot rate prevailing in the currency exchange market for buying or selling currencies).
NOTE E: Securities Lending
The Portfolio may enter into securities lending transactions. Under the Portfolio’s securities lending program, all loans of securities will be collateralized continually by cash collateral and/ornon-cash collateral.Non-cash collateral will include only securities issued or guaranteed by the U.S. government or its agencies or instrumentalities. The Portfolio cannot sell or repledge anynon-cash collateral, such collateral will not be reflected in the portfolio of investments. If a loan is collateralized by cash, the Portfolio will be compensated for the loan from a portion of the net return from the income earned on cash collateral after a rebate is paid to the borrower (in some cases, this rebate may be a “negative rebate” or fee paid by the borrower to the Portfolio in connection with the loan), and payments are made for fees of the securities lending agent and for certain other administrative expenses. If the Portfolio receivesnon-cash collateral, the Portfolio will receive a fee from the borrower generally equal to a negotiated percentage of the market value of the loaned securities. The Portfolio will have the right to call a loan and obtain the securities loaned at any time on notice to the borrower within the normal and customary settlement time for the securities. While the securities are on loan, the borrower is obligated to pay the Portfolio amounts equal to any income or other distributions from the securities. The Portfolio will not be able to exercise voting rights with respect to any securities during the existence of a loan, but will have the right to regain ownership of loaned securities in order to exercise voting or other ownership rights. Collateral received and securities loaned are marked to market daily to ensure that the securities loaned are secured by collateral. The lending agent currently invests the cash collateral received in Government Money Market Portfolio, an eligible money market vehicle, in accordance with the investment restrictions of the Portfolio, and as approved by the Board. The collateral received on securities loaned is recorded as an asset as well as a
15
| GROWTH AND INCOME PORTFOLIO | ||
| NOTES TO FINANCIAL STATEMENTS | ||
| (continued) | AB Variable Products Series Fund | |
corresponding liability in the statement of assets and liabilities. The collateral will be adjusted the next business day to maintain the required collateral amount. The amounts of securities lending income from the borrowers and Government Money Market Portfolio are reflected in the statement of operations. When the Portfolio earns net securities lending income from Government Money Market Portfolio, the income is inclusive of a rebate expense paid to the borrower. In connection with the cash collateral investment by the Portfolio in Government Money Market Portfolio, the Adviser has agreed to waive a portion of the Portfolio’s share of the advisory fees of Government Money Market Portfolio, as borne indirectly by the Portfolio as an acquired fund fee and expense. When the Portfolio lends securities, its investment performance will continue to reflect changes in the value of the securities loaned. A principal risk of lending portfolio securities is that the borrower may fail to return the loaned securities upon termination of the loan and that the collateral will not be sufficient to replace the loaned securities. The lending agent has agreed to indemnify the Portfolio in the case of default of any securities borrower.
A summary of the Portfolio’s transactions surrounding securities lending for the year ended December 31, 2019 is as follows:
Market Value of | Cash Collateral* | Market Value of Non-Cash Collateral* | Income from Borrowers | Government Money Market Portfolio | ||||||||||||||||||
Income | Advisory Fee | |||||||||||||||||||||
| $ | 32,243,429 | $ | 3,696,960 | $ | 29,302,798 | $ | 49,069 | $ | 32,546 | $ | 1,375 | |||||||||||
| * | As of December 31, 2019. |
NOTE F: Capital Stock
Each class consists of 500,000,000 authorized shares. Transactions in capital shares for each class were as follows:
| SHARES | AMOUNT | |||||||||||||||||||
| Year Ended December 31, 2019 | Year Ended December 31, 2018 | Year Ended December 31, 2019 | Year Ended December 31, 2018 | |||||||||||||||||
Class A | ||||||||||||||||||||
Shares sold | 661,146 | 577,389 | $ | 19,709,589 | $ | 18,280,433 | ||||||||||||||
Shares issued in reinvestment of dividends and distributions | 625,489 | 587,297 | 17,238,473 | 18,264,931 | ||||||||||||||||
Shares issued in connection with the Reorganization | 34,530 | –0 | – | 1,088,086 | –0 | – | ||||||||||||||
Shares redeemed | (976,078 | ) | (1,146,686 | ) | (29,114,576 | ) | (36,663,199 | ) | ||||||||||||
|
|
|
|
|
|
|
| |||||||||||||
Net increase (decrease) | 345,087 | 18,000 | $ | 8,921,572 | $ | (117,835 | ) | |||||||||||||
|
|
|
|
|
|
|
| |||||||||||||
Class B | ||||||||||||||||||||
Shares sold | 1,565,254 | 1,754,622 | $ | 46,221,157 | $ | 54,964,533 | ||||||||||||||
Shares issued in reinvestment of dividends and distributions | 3,906,958 | 3,426,174 | 105,878,573 | 104,977,978 | ||||||||||||||||
Share issued in connection with the Reorganization | 1,788,938 | –0 | – | 55,438,527 | –0 | – | ||||||||||||||
Shares redeemed | (4,537,077 | ) | (4,484,525 | ) | (133,162,476 | ) | (142,328,469 | ) | ||||||||||||
|
|
|
|
|
|
|
| |||||||||||||
Net increase | 2,724,073 | 696,271 | $ | 74,375,781 | $ | 17,614,042 | ||||||||||||||
|
|
|
|
|
|
|
| |||||||||||||
At December 31, 2019, certain shareholders of the Portfolio owned 58% in aggregate of the Portfolio’s outstanding shares. Significant transactions by such shareholders, if any, may impact the Portfolio’s performance.
NOTE G: Risks Involved in Investing in the Portfolio
Foreign(Non-U.S.) Risk—Investments in securities ofnon-U.S. issuers may involve more risk than those of U.S. issuers. These securities may fluctuate more widely in price and may be more difficult to trade or dispose of due to adverse market, economic, political, regulatory or other factors.
Currency Risk—Fluctuations in currency exchange rates may negatively affect the value of the Portfolio’s investments or reduce its returns.
16
| AB Variable Products Series Fund | ||
Derivatives Risk—The Portfolio may enter into derivative transactions such as forwards, options, futures and swaps. Derivatives may be illiquid, difficult to price, and leveraged so that small changes may produce disproportionate losses for the Portfolio, and subject to counterparty risk to a greater degree than more traditional investments. Derivatives may result in significant losses, including losses that are far greater than the value of the derivatives reflected on the statement of assets and liabilities.
Industry/Sector Risk—Investments in a particular industry or group of related industries may have more risk because market or economic factors affecting that industry could have a significant effect on the value of the Portfolio’s investments.
LIBOR Risk—The Portfolio may invest in certain debt securities, derivatives or other financial instruments that utilize the London Interbank Offered Rate, or “LIBOR,” as a “benchmark” or “reference rate” for various interest rate calculations. In July 2017, the United Kingdom Financial Conduct Authority, which regulates LIBOR, announced a desire to phase out the use of LIBOR by the end of 2021. Although financial regulators and industry working groups have suggested alternative reference rates, such as European Interbank Offer Rate (“EURIBOR”), Sterling Overnight Interbank Average Rate (“SONIA”) and Secured Overnight Financing Rate (“SOFR”), global consensus on alternative rates is lacking and the process for amending existing contracts or instruments to transition away from LIBOR remains unclear. The elimination of LIBOR or changes to other reference rates or any other changes or reforms to the determination or supervision of reference rates could have an adverse impact on the market for, or value of, any securities or payments linked to those reference rates, which may adversely affect the Portfolio’s performance and/or net asset value. Uncertainty and risk also remain regarding the willingness and ability of issuers and lenders to include revised provisions in new and existing contracts or instruments. Consequently, the transition away from LIBOR to other reference rates may lead to increased volatility and illiquidity in markets that are tied to LIBOR, fluctuations in values of LIBOR-related investments or investments in issuers that utilize LIBOR, increased difficulty in borrowing or refinancing and diminished effectiveness of hedging strategies, adversely affecting the Portfolio’s performance. Furthermore, the risks associated with the expected discontinuation of LIBOR and transition may be exacerbated if the work necessary to effect an orderly transition to an alternative reference rate is not completed in a timely manner. Because the usefulness of LIBOR as a benchmark could deteriorate during the transition period, these effects could occur prior to the end of 2021.
Indemnification Risk—In the ordinary course of business, the Portfolio enters into contracts that contain a variety of indemnifications. The Portfolio’s maximum exposure under these arrangements is unknown. However, the Portfolio has not had prior claims or losses pursuant to these indemnification provisions and expects the risk of loss thereunder to be remote. Therefore, the Portfolio has not accrued any liability in connection with these indemnification provisions.
NOTE H: Joint Credit Facility
A number ofopen-end mutual funds managed by the Adviser, including the Portfolio, participate in a $325 million revolving credit facility (the “Facility”) intended to provide short-term financing, if necessary, subject to certain restrictions in connection with abnormal redemption activity. Commitment fees related to the Facility are paid by the participating funds and are included in miscellaneous expenses in the statement of operations. The Portfolio did not utilize the Facility during the year ended December 31, 2019.
NOTE I: Distributions to Shareholders
The tax character of distributions paid during the fiscal years ended December 31, 2019 and December 31, 2018 were as follows:
| 2019 | 2018 | |||||||
Distributions paid from: | ||||||||
Ordinary income | $ | 32,357,161 | $ | 37,164,764 | ||||
Net long-term capital gains | 90,759,885 | 86,078,144 | ||||||
|
|
|
| |||||
Total taxable distributions paid | $ | 123,117,046 | $ | 123,242,908 | ||||
|
|
|
| |||||
As of December 31, 2019, the components of accumulated earnings/(deficit) on a tax basis were as follows:
Undistributed ordinary income | $ | 12,473,045 | ||
Undistributed capital gains | 45,091,707 | |||
Unrealized appreciation/(depreciation) | 165,637,003 | (a) | ||
|
| |||
Total accumulated earnings/(deficit) | $ | 223,201,755 | ||
|
|
| (a) | The difference between book-basis andtax-basis unrealized appreciation/(depreciation) is attributable primarily to the tax deferral of losses on wash sales. |
17
| GROWTH AND INCOME PORTFOLIO | ||
| NOTES TO FINANCIAL STATEMENTS | ||
| (continued) | AB Variable Products Series Fund | |
For tax purposes, net realized capital losses may be carried over to offset future capital gains, if any. Funds are permitted to carry forward capital losses for an indefinite period, and such losses will retain their character as either short-term or long-term capital losses. As of December 31, 2019, the Portfolio did not have any capital loss carryforwards.
During the current fiscal year, permanent differences primarily due to the tax treatment of the Reorganization described in Note J resulted in a net increase in distributable earnings and a net decrease in additionalpaid-in capital. These reclassifications had no effect on net assets.
NOTE J: Reorganization
At a meeting held on November6-8, 2018, the Board of the Fund approved the acquisition of the assets and assumption of the liabilities of the Acquired Portfolio by the Portfolio, each a series of the Fund. The Portfolios have the same investment objective and certain similarities in investment strategies, as both Portfolios seek long-term growth of capital and invest in the securities of U.S. companies, using a value approach to investing. The Reorganization was completed at the close of business April 26, 2019. Pursuant to the Reorganization, the assets and liabilities of the Acquired Portfolio shares were transferred in exchange for the shares of the same class of the Portfolio, in atax-free exchange as follows:
| Shares outstanding before the Reorganization | Shares outstanding immediately after the Reorganization | Aggregate net assets before the Reorganization | Aggregate net assets immediately after the Reorganization | |||||||||||||
The Acquired Portfolio | 3,830,499 | –0– | $ | 56,526,613 | + | $ | –0 | – | ||||||||
The Portfolio | 32,453,079 | 34,276,547 | $ | 1,008,129,745 | ++ | $ | 1,064,656,358 | |||||||||
| + | Includes distributions in excess of net investment income of $9,338, accumulated realized gain on investments of $4,555,184 and unrealized appreciation on investments of $1,082,388, with a fair value of $49,044,206 and identified cost of $47,961,818. |
| ++ | Includes undistributed net investment income of $15,078,001, accumulated realized gain on investments of $114,156,821 and unrealized appreciation on investments of $119,935,920, with a fair value of $1,011,419,058 and identified cost of $891,483,138. |
Assuming the acquisition of the Acquired Portfolio had been completed on January 1, 2019, the Portfolio’s pro forma results of operations for the year ended December 31, 2019, are as follows:
Net investment income | $ | 12,576,934 | ||
Net realized and unrealized gain on investments | 206,217,063 | |||
|
| |||
Net increase in net assets resulting from operations | $ | 218,793,997 | ||
|
|
Because the combined investment portfolios have been managed as a single integrated portfolio since the acquisition was completed, it is not practicable to separate the amounts of revenue and earnings of the Portfolio that have been included in the Portfolio’s Statement of Operations since April 26, 2019.
For financial reporting purposes, assets received and shares issued by the Portfolio were recorded at fair value; however, the cost basis of the investments received from the Acquired Portfolio was carried forward to align ongoing reporting of the Portfolio’s realized and unrealized gains and losses with amounts distributable to shareholders for tax purposes.
NOTE K: Recent Accounting Pronouncements
In August 2018, the Financial Accounting Standards Board issued an Accounting Standards Update, ASU2018-13, Fair Value Measurement (Topic 820), Disclosure Framework—Changes to the Disclosure Requirements for Fair Value Measurement which removes, modifies and adds disclosures to Topic 820. The amendments in this ASU2018-13 (“ASU”) apply to all entities that are required, under existing U.S. GAAP, to make disclosures about recurring or nonrecurring fair value measurements. The amendments in this ASU are effective for all entities for fiscal years, and interim periods within those fiscal years, beginning after December 15, 2019. Management has evaluated the impact of the amendments and elected to early adopt the ASU. The adoption of this ASU did not have a material impact on the disclosure and presentation of the financial statements of the Portfolio.
NOTE L: Subsequent Events
Management has evaluated subsequent events for possible recognition or disclosure in the financial statements through the date the financial statements are issued. Management has determined that there are no material events that would require disclosure in the Portfolio’s financial statements through this date.
18
| GROWTH AND INCOME PORTFOLIO | ||
| FINANCIAL HIGHLIGHTS | AB Variable Products Series Fund | |
Selected Data For A Share Of Capital Stock Outstanding Throughout Each Period
| CLASS A | ||||||||||||||||||||
| Year Ended December 31, | ||||||||||||||||||||
| 2019 | 2018 | 2017 | 2016 | 2015 | ||||||||||||||||
Net asset value, beginning of period | $27.78 | $33.35 | $31.21 | $30.12 | $30.04 | |||||||||||||||
|
|
|
|
|
|
|
|
|
| |||||||||||
Income From Investment Operations | ||||||||||||||||||||
Net investment income (a) | .43 | (b) | .41 | (b) | .31 | (b) | .43 | (b)† | .37 | |||||||||||
Net realized and unrealized gain (loss) on investment transactions | 5.84 | (1.84 | ) | 5.21 | 2.84 | .14 | ||||||||||||||
Contributions from Affiliates | –0 | – | –0 | – | .00 | (c) | –0 | – | –0 | – | ||||||||||
|
|
|
|
|
|
|
|
|
| |||||||||||
Net increase (decrease) in net asset value from operations | 6.27 | (1.43 | ) | 5.52 | 3.27 | .51 | ||||||||||||||
|
|
|
|
|
|
|
|
|
| |||||||||||
Less: Dividends and Distributions | ||||||||||||||||||||
Dividends from net investment income | (.39 | ) | (.34 | ) | (.49 | ) | (.32 | ) | (.43 | ) | ||||||||||
Distributions from net realized gain on investment transactions | (3.36 | ) | (3.80 | ) | (2.89 | ) | (1.86 | ) | –0 | – | ||||||||||
|
|
|
|
|
|
|
|
|
| |||||||||||
Total dividends and distributions | (3.75 | ) | (4.14 | ) | (3.38 | ) | (2.18 | ) | (.43 | ) | ||||||||||
|
|
|
|
|
|
|
|
|
| |||||||||||
Net asset value, end of period | $30.30 | $27.78 | $33.35 | $31.21 | $30.12 | |||||||||||||||
|
|
|
|
|
|
|
|
|
| |||||||||||
Total Return | ||||||||||||||||||||
Total investment return based on net asset value (d)* | 23.91 | % | (5.61 | )% | 18.93 | % | 11.30 | %† | 1.70 | % | ||||||||||
Ratios/Supplemental Data | ||||||||||||||||||||
Net assets, end of period (000’s omitted) | $155,765 | $133,188 | $159,324 | $155,924 | $150,801 | |||||||||||||||
Ratio to average net assets of: | ||||||||||||||||||||
Expenses, net of waivers/reimbursements (e)‡ | .61 | % | .59 | % | .60 | % | .61 | % | .60 | % | ||||||||||
Expenses, before waivers/reimbursements (e)‡ | .62 | % | .60 | % | .60 | % | .61 | % | .60 | % | ||||||||||
Net investment income | 1.43 | %(b) | 1.28 | %(b) | .97 | %(b) | 1.46 | %(b)† | 1.21 | % | ||||||||||
Portfolio turnover rate | 66 | % | 96 | % | 85 | % | 101 | % | 73 | % | ||||||||||
‡ Expense ratios exclude the estimated acquired fund fees of the affiliated/unaffiliated underlying |
| |||||||||||||||||||
portfolios | .01 | % | .01 | % | .00 | % | .00 | % | .00 | % | ||||||||||
See footnote summary on page 21.
19
| GROWTH AND INCOME PORTFOLIO | ||
| FINANCIAL HIGHLIGHTS | ||
| (continued) | AB Variable Products Series Fund | |
Selected Data For A Share Of Capital Stock Outstanding Throughout Each Period
| CLASS B | ||||||||||||||||||||
| Year Ended December 31, | ||||||||||||||||||||
| 2019 | 2018 | 2017 | 2016 | 2015 | ||||||||||||||||
Net asset value, beginning of period | $27.34 | $32.88 | $30.82 | $29.78 | $29.71 | |||||||||||||||
|
|
|
|
|
|
|
|
|
| |||||||||||
Income From Investment Operations | ||||||||||||||||||||
Net investment income (a) | .35 | (b) | .33 | (b) | .23 | (b) | .36 | (b)† | .29 | |||||||||||
Net realized and unrealized gain (loss) on investment transactions | 5.74 | (1.81 | ) | 5.14 | 2.79 | .14 | ||||||||||||||
Contributions from Affiliates | –0 | – | –0 | – | .00 | (c) | –0 | – | –0 | – | ||||||||||
|
|
|
|
|
|
|
|
|
| |||||||||||
Net increase (decrease) in net asset value from operations | 6.09 | (1.48 | ) | 5.37 | 3.15 | .43 | ||||||||||||||
|
|
|
|
|
|
|
|
|
| |||||||||||
Less: Dividends and Distributions | ||||||||||||||||||||
Dividends from net investment income | (.31 | ) | (.26 | ) | (.42 | ) | (.25 | ) | (.36 | ) | ||||||||||
Distributions from net realized gain on investment transactions | (3.36 | ) | (3.80 | ) | (2.89 | ) | (1.86 | ) | –0 | – | ||||||||||
|
|
|
|
|
|
|
|
|
| |||||||||||
Total dividends and distributions | (3.67 | ) | (4.06 | ) | (3.31 | ) | (2.11 | ) | (.36 | ) | ||||||||||
|
|
|
|
|
|
|
|
|
| |||||||||||
Net asset value, end of period | $29.76 | $27.34 | $32.88 | $30.82 | $29.78 | |||||||||||||||
|
|
|
|
|
|
|
|
|
| |||||||||||
Total Return | ||||||||||||||||||||
Total investment return based on net asset value (d)* | 23.61 | % | (5.84 | )% | 18.59 | % | 11.07 | %† | 1.43 | % | ||||||||||
Ratios/Supplemental Data | ||||||||||||||||||||
Net assets, end of period (000’s omitted) | $922,603 | $772,904 | $906,790 | $886,666 | $646,424 | |||||||||||||||
Ratio to average net assets of: | ||||||||||||||||||||
Expenses, net of waivers/reimbursements (e)‡ | .86 | % | .84 | % | .85 | % | .86 | % | .85 | % | ||||||||||
Expenses, before waivers/reimbursements (e)‡ | .87 | % | .85 | % | .85 | % | .86 | % | .85 | % | ||||||||||
Net investment income | 1.18 | %(b) | 1.03 | %(b) | .72 | %(b) | 1.21 | %(b)† | .96 | % | ||||||||||
Portfolio turnover rate | 66 | % | 96 | % | 85 | % | 101 | % | 73 | % | ||||||||||
‡ Expense ratios exclude the estimated acquired fund fees of the affiliated/unaffiliated underlying |
| |||||||||||||||||||
portfolios | .01 | % | .01 | % | .00 | % | .00 | % | .00 | % | ||||||||||
See footnote summary on page 21.
20
| AB Variable Products Series Fund | ||
| (a) | Based on average shares outstanding. |
| (b) | Net of expenses waived/reimbursed by the Adviser. |
| (c) | Amount is less than $.005. |
| (d) | Total investment return is calculated assuming an initial investment made at the net asset value at the beginning of the period, reinvestment of all dividends and distributions at net asset value during the period, and redemption on the last day of the period. Total return does not reflect (i) insurance company’s separate account related expense charges and (ii) the deductions of taxes that a shareholder would pay on Portfolio distributions or the redemption of Portfolio shares. Total investment return calculated for a period of less than one year is not annualized. |
| (e) | In connection with the Portfolio’s investments in affiliated underlying portfolios, the Portfolio incurs no direct expenses, but bears proportionate shares of the fees and expenses (i.e., operating, administrative and investment advisory fees) of the affiliated underlying portfolios. The Adviser has contractually agreed to waive its fees from the Portfolio in an amount equal to the Portfolio’s pro rata share of certain acquired fund fees and expenses, and for the years ended December 31, 2019 and December 31, 2018, such waiver amounted to .01% and .01%, respectively. |
| † | For the year ended December 31, 2016, the amount includes a refund for overbilling of prior years’ custody out of pocket fees as follows: |
Net Investment | Net Investment | Total | ||
| $.002 | .01% | .01% |
| * | Includes the impact of proceeds received and credited to the Portfolio resulting from class action settlements, which enhanced the Portfolio’s performance for the years ended December 31, 2019, December 31, 2018, December 31, 2017, December 31, 2016 and December 31, 2015 by .15%, .02%, .68%, .03% and .14%, respectively. |
Includes the impact of a reimbursement from the Adviser as a result of an error made by the Adviser in processing a claim for class action settlement, which enhanced the Portfolio’s performance for the year ended December 31, 2017 by .01%.
See notes to financial statements.
21
| REPORT OF INDEPENDENT REGISTERED | ||
| PUBLIC ACCOUNTING FIRM | AB Variable Products Series Fund | |
To the Shareholders and the Board of Directors of AB Growth and Income Portfolio:
Opinion on the Financial Statements
We have audited the accompanying statement of assets and liabilities of AB Growth and Income Portfolio (the “Portfolio”) (one of the portfolios constituting AB Variable Products Series Fund, Inc. (the “Fund”)), including the portfolio of investments, as of December 31, 2019, and the related statement of operations for the year then ended, the statements of changes in net assets for each of the two years in the period then ended, the financial highlights for each of the five years in the period then ended and the related notes (collectively referred to as the “financial statements”). In our opinion, the financial statements present fairly, in all material respects, the financial position of the Portfolio (one of the portfolios constituting AB Variable Products Series Fund, Inc.) at December 31, 2019, the results of its operations for the year then ended, the changes in its net assets for each of the two years in the period then ended and its financial highlights for each of the five years in the period then ended, in conformity with U.S. generally accepted accounting principles.
Basis for Opinion
These financial statements are the responsibility of the Fund’s management. Our responsibility is to express an opinion on the Portfolio’s financial statements based on our audits. We are a public accounting firm registered with the Public Company Accounting Oversight Board (United States) (“PCAOB”) and are required to be independent with respect to the Fund in accordance with the U.S. federal securities laws and the applicable rules and regulations of the Securities and Exchange Commission and the PCAOB.
We conducted our audits in accordance with the standards of the PCAOB. Those standards require that we plan and perform the audit to obtain reasonable assurance about whether the financial statements are free of material misstatement, whether due to error or fraud. The Fund is not required to have, nor were we engaged to perform, an audit of the Fund’s internal control over financial reporting. As part of our audits, we are required to obtain an understanding of internal control over financial reporting, but not for the purpose of expressing an opinion on the effectiveness of the Fund’s internal control over financial reporting. Accordingly, we express no such opinion.
Our audits included performing procedures to assess the risks of material misstatement of the financial statements, whether due to error or fraud, and performing procedures that respond to those risks. Such procedures included examining, on a test basis, evidence regarding the amounts and disclosures in the financial statements. Our procedures included confirmation of securities owned as of December 31, 2019, by correspondence with the custodian and others or by other appropriate auditing procedures where replies from others were not received. Our audits also included evaluating the accounting principles used and significant estimates made by management, as well as evaluating the overall presentation of the financial statements. We believe that our audits provide a reasonable basis for our opinion.

We have served as the auditor of one or more of the AB investment companies since 1968.
New York, New York
February 14, 2020
22
| 2019 FEDERAL TAX INFORMATION (unaudited) | AB Variable Products Series Fund | |
For Federal income tax purposes, the following information is furnished with respect to the distributions paid by the Portfolio during the taxable year ended December 31, 2019. For corporate shareholders, 48.04% of dividends paid qualify for the dividends received deduction.
23
| GROWTH AND INCOME PORTFOLIO | AB Variable Products Series Fund | |
| BOARD OF DIRECTORS | ||
Marshall C. Turner, Jr.(1),Chairman Jorge A. Bermudez^ Michael J. Downey(1) Nancy P. Jacklin(1) | Robert M. Keith,President and Carol C. McMullen(1) Garry L. Moody(1) Earl D. Weiner(1) | |
| OFFICERS | ||
Frank V. Caruso(2),Vice President John H. Fogarty(2),Vice President Vinay Thapar(2), Vice President Emilie D. Wrapp,Secretary Michael B. Reyes,Senior Analyst | Joseph J. Mantineo,Treasurer and Phyllis J. Clarke,Controller Vincent S. Noto,Chief Compliance Officer | |
CUSTODIANAND ACCOUNTING AGENT State Street Bank and Trust Company State Street Corporation CCB/5 1 Iron Street Boston, MA 02210 | LEGAL COUNSEL Seward & Kissel LLP One Battery Park Plaza New York, NY 10004 | |
DISTRIBUTOR AllianceBernstein Investments, Inc. 1345 Avenue of the Americas New York, NY 10105 | TRANSFER AGENT AllianceBernstein Investor Services, Inc. P.O. Box 786003 Toll-Free (800) 221-5672 | |
INDEPENDENT REGISTERED PUBLIC ACCOUNTING FIRM Ernst & Young LLP 5 Times Square New York, NY 10036 |
| (1) | Member of the Audit Committee, the Governance and Nominating Committee, and the Independent Directors Committee. |
| (2) | The day-to-day management of, and investment decisions for, the Portfolio’s portfolio are made by the Adviser’s Relative Value Investment Team. Messrs. Caruso, Fogarty and Thapar are the investment professionals with the most significant responsibility for the day-to-day management of the Portfolio’s portfolio. |
| ^ | Mr. Bermudez will be a member of the Audit Committee, the Governance and Nominating Committee, and the Independent Directors Committee when he joins the Board on January 1, 2020. |
24
| GROWTH AND INCOME PORTFOLIO | ||
| MANAGEMENT OF THE FUND | AB Variable Products Series Fund | |
Board of Directors Information
The business and affairs of the Fund are managed under the direction of the Board of Directors. Certain information concerning the Fund’s Directors is set forth below.
| NAME, ADDRESS*, AGE, (YEAR FIRST ELECTED**) | PRINCIPAL OCCUPATION(S) DURING PAST FIVE YEARS AND OTHER INFORMATION*** | PORTFOLIOS IN AB FUND COMPLEX OVERSEEN BY DIRECTOR | OTHER PUBLIC COMPANY DIRECTORSHIPS CURRENTLY HELD BY DIRECTOR | |||||
| INTERESTED DIRECTOR | ||||||||
Robert M. Keith,# 1345 Avenue of the Americas New York, NY 10105 59 (2010) | Senior Vice President of AllianceBernstein L.P. (the “Adviser”) and the head of AllianceBernstein Investments, Inc. (“ABI”) since July 2008; Director of ABI and President of the AB Mutual Funds. Previously, he served as Executive Managing Director of ABI from December 2006 to June 2008. Prior to joining ABI in 2006, Executive Managing Director of Bernstein Global Wealth Management, and prior thereto, Senior Managing Director and Global Head of Client Service and Sales of the Adviser’s institutional investment management business since 2004. Prior thereto, he was Managing Director and Head of North American Client Service and Sales in the Adviser’s institutional investment management business with which he had been associated since prior to 2004. | 91 | None | |||||
| INDEPENDENT DIRECTORS | ||||||||
Marshall C. Turner, Jr.,## Chairman of the Board 78 (2005) | Private Investor since prior to 2015. Former Chairman and CEO of Dupont Photomasks, Inc. (components of semi-conductor manufacturing). He has extensive operating leadership, and venture capital investing experience, including five interim or full-time CEO roles, and prior service as general partner of institutional venture capital partnerships. He also has extensive non-profit board leadership experience, and currently serves on the boards of two education and science-related non-profit organizations. He has served as a director of one AB Fund since 1992, and director or trustee of all AB Funds since 2005. He has been Chairman of the AB Funds since January 2014, and the Chairman of the Independent Directors Committees of such AB Funds since February 2014. | 91 | Xilinx, Inc. (programmable logic semi-conductors) since 2007 | |||||
25
| GROWTH AND INCOME PORTFOLIO | ||
| MANAGEMENT OF THE FUND | ||
| (continued) | AB Variable Products Series Fund | |
| NAME, ADDRESS*, AGE, (YEAR FIRST ELECTED**) | PRINCIPAL OCCUPATION(S) DURING PAST FIVE YEARS AND OTHER INFORMATION*** | PORTFOLIOS IN AB FUND COMPLEX OVERSEEN BY DIRECTOR | OTHER PUBLIC COMPANY DIRECTORSHIPS CURRENTLY HELD BY DIRECTOR | |||||
| INDEPENDENT DIRECTORS (continued) | ||||||||
Jorge A. Bermudez,^ 68 (2020) | Private investor since prior to 2015. Former Chief Risk Officer of Citigroup, Inc., a global financial services company, from November 2007 to March 2008, Chief Executive Officer of Citigroup’s Commercial Business Group in North America and Citibank Texas from 2005 to 2007, and a variety of other executive and leadership roles at various businesses within Citigroup prior to then; Chairman (2018) of the Texas A&M Foundation Board of Trustees (Trustee since 2013) and Chairman of the Smart Grid Center Board at Texas A&M University since 2012; director of, among others, Citibank N.A. from 2005 to 2008, the Federal Reserve Bank of Dallas, Houston Branch from 2009 to 2011, the Federal Reserve Bank of Dallas from 2011 to 2017, and the Electric Reliability Council of Texas from 2010 to 2016. He has served as director or trustee of the AB Funds since 2020. | 91 | Moody’s Corporation since April 2011 | |||||
Michael J. Downey,## 76 (2005) | Private Investor since prior to 2015. Formerly, Chairman of The Asia Pacific Fund, Inc. (registered investment company) since prior to 2015 until January 2019. From 1987 until 1993, Chairman and CEO of Prudential Mutual Fund Management, director of the Prudential mutual funds, and member of the Executive Committee of Prudential Securities, Inc. He has served as a director or trustee of the AB Funds since 2005. | 91 | None | |||||
Nancy P. Jacklin,## 71 (2006) | Private Investor since prior to 2015. Professorial Lecturer at the Johns Hopkins School of Advanced International Studies (2008-2015). U.S. Executive Director of the International Monetary Fund (which is responsible for ensuring the stability of the international monetary system), (December 2002-May 2006); Partner, Clifford Chance (1992-2002); Sector Counsel, International Banking and Finance, and Associate General Counsel, Citicorp (1985-1992); Assistant General Counsel (International), Federal Reserve Board of Governors (1982-1985); and Attorney Advisor, U.S. Department of the Treasury (1973-1982). Member of the Bar of the District of Columbia and of New York; and member of the Council on Foreign Relations. She has served as a director or trustee of the AB Funds since 2006 and has been Chair of the Governance and Nominating Committees of the AB Funds since August 2014. | 91 | None | |||||
26
| AB Variable Products Series Fund | ||
| NAME, ADDRESS*, AGE, (YEAR FIRST ELECTED**) | PRINCIPAL OCCUPATION(S) DURING PAST FIVE YEARS AND OTHER INFORMATION*** | PORTFOLIOS IN AB FUND COMPLEX OVERSEEN BY DIRECTOR | OTHER PUBLIC COMPANY DIRECTORSHIPS CURRENTLY HELD BY DIRECTOR | |||||
INDEPENDENT DIRECTORS | ||||||||
Carol C. McMullen,## 64 (2016) | Managing Director of Slalom Consulting (consulting) since 2014, private investor and member of the Advisory Board of Butcher Box (since 2018). Formerly, member, Partners Healthcare Investment Committee (2010-2019); Director of Norfolk & Dedham Group (mutual property and casualty insurance) from 2011 until November 2016; Director of Partners Community Physicians Organization (healthcare) from 2014 until December 2016; and Managing Director of The Crossland Group (consulting) from 2012 until 2013. She has held a number of senior positions in the asset and wealth management industries, including at Eastern Bank (where her roles included President of Eastern Wealth Management), Thomson Financial (Global Head of Sales for Investment Management), and Putnam Investments (where her roles included Chief Investment Officer, Core and Growth and Head of Global Investment Research). She has served on a number of private company and non-profit boards, and as a director or trustee of the AB Funds since June 2016. | 91 | None | |||||
Garry L. Moody,## 67 (2008) | Formerly, Partner, Deloitte & Touche LLP(1995-2008) where he held a number of senior positions, including Vice Chairman, and U.S. and Global Investment Management Practice Managing Partner; President, Fidelity Accounting and Custody Services Company (1993-1995), where he was responsible for accounting, pricing, custody and reporting for the Fidelity mutual funds; and Partner, Ernst & Young LLP(1975-1993), where he served as the National Director of Mutual Fund Tax Services and Managing Partner of its Chicago Office Tax department. He is a member of the Trustee Advisory Board of BoardIQ, a biweekly publication focused on issues and news affecting directors of mutual funds. He is also a member of the Investment Company Institute’s Board of Governors and the Independent Directors Council Governing Council. He has served as a director or trustee, and as Chairman of the Audit Committees, of the AB Funds since 2008. | 91 | None | |||||
27
| GROWTH AND INCOME PORTFOLIO | ||
| MANAGEMENT OF THE FUND | ||
| (continued) | AB Variable Products Series Fund | |
| NAME, ADDRESS*, AGE, (YEAR FIRST ELECTED**) | PRINCIPAL OCCUPATION(S) DURING PAST FIVE YEARS AND OTHER INFORMATION*** | PORTFOLIOS IN AB FUND COMPLEX OVERSEEN BY DIRECTOR | OTHER PUBLIC COMPANY DIRECTORSHIPS CURRENTLY HELD BY DIRECTOR | |||||
| INDEPENDENT DIRECTORS (continued) | ||||||||
Earl D. Weiner,## 80 (2007) | Senior Counsel since 2017, Of Counsel from 2007 to 2016, and Partner prior to then, of the law firm Sullivan & Cromwell LLP. He is a former member of the ABA Federal Regulation of Securities Committee Task Force to draft editions of the Fund Director’s Guidebook. He also serves as a director or trustee of various non-profit organizations and has served as Chairman or Vice Chairman of a number of them. He has served as a director or trustee of the AB Funds since 2007 and served as Chairman of the Governance and Nominating Committees of the AB Funds from 2007 until August 2014. | 91 | None | |||||
| * | The address for each of the Fund’s disinterested Directors is c/o AllianceBernstein L.P., Attention: Legal & Compliance Department—Mutual Fund Legal, 1345 Avenue of the Americas, New York, NY 10105. |
| ** | There is no stated term of office for the Fund’s Directors. |
| *** | The information above includes each Director’s principal occupation during the last five years and other information relating to the experience, attributes, and skills relevant to each Director’s qualifications to serve as a Director, which led to the conclusion that each Director should serve as a Director for the Fund. |
| # | Mr. Keith is an “interested person” of the Fund, as defined in the 1940 Act, due to his position as a Senior Vice President of the Adviser. |
| ## | Member of the Audit Committee, the Governance and Nominating Committee, and the Independent Directors Committee. |
| ^ | Mr. Bermudez will be a member of the Audit Committee, the Governance and Nominating Committee, and the Independent Directors Committee when he joins the Board on January 1, 2020. |
28
| AB Variable Products Series Fund | ||
Officer Information
Certain information concerning the Portfolio’s Officers is listed below.
NAME, ADDRESS,* AND AGE | PRINCIPAL POSITION(S) HELD WITH FUND | PRINCIPAL OCCUPATION DURING PAST FIVE YEARS | ||
| Robert M. Keith 59 | President and Chief Executive Officer | See biography above. | ||
| Frank V. Caruso 63 | Vice President | Senior Vice President of the Adviser**, with which he has been associated since prior to 2015. He is also Chief Investment Officer of US Growth Equities. | ||
| John H. Fogarty 50 | Vice President | Senior Vice President of the Adviser**, with which he has been associated since prior to 2015. | ||
| Vinay Thapar 41 | Vice President | Senior Vice President of the Adviser**, with which he has been associated since prior to 2015. | ||
| Emilie D. Wrapp 64 | Secretary | Senior Vice President, Assistant General Counsel and Assistant Secretary of ABI**, with which she has been associated since prior to 2015. | ||
| Michael B. Reyes 43 | Senior Analyst | Vice President of the Adviser**, with which he has been associated since prior to 2015. | ||
| Joseph J. Mantineo 60 | Treasurer and Chief Financial Officer | Senior Vice President of AllianceBernstein Investor Services, Inc. (“ABIS”)**, with which he has been associated since prior to 2015. | ||
| Phyllis J. Clarke 59 | Controller | Vice President of ABIS**, with which she has been associated since prior to 2015. | ||
| Vincent S. Noto 55 | Chief Compliance Officer | Senior Vice President since 2015 and Mutual Fund Chief Compliance Officer of the Adviser** since prior to 2015. |
| * | The address for each of the Portfolio’s Officers is 1345 Avenue of the Americas, New York, NY 10105. |
| ** | The Adviser, ABIS and ABI are affiliates of the Fund. |
| The Fund’s Statement of Additional Information (“SAI”) has additional information about the Fund’s Directors and Officers and is available without charge upon request. Contact your financial representative or the Adviser at(800) 227-4618, or visit www.abfunds.com, for a free prospectus or SAI. |
29
| GROWTH AND INCOME PORTFOLIO | ||
| CONTINUANCE DISCLOSURE | AB Variable Products Series Fund | |
INFORMATION REGARDING THE REVIEW AND APPROVAL OF THE FUND’S ADVISORY AGREEMENT
The disinterested directors (the “directors”) of AB Variable Products Series Fund, Inc. (the “Company”) unanimously approved the continuance of the Company’s Advisory Agreement with the Adviser in respect of AB Growth and Income Portfolio (the “Fund”) at a meeting held on May7-9, 2019 (the “Meeting”).
Prior to approval of the continuance of the Advisory Agreement, the directors had requested from the Adviser, and received and evaluated, extensive materials. They reviewed the proposed continuance of the Advisory Agreement with the Adviser and with experienced counsel who are independent of the Adviser, who advised on the relevant legal standards. The directors also reviewed additional materials, including comparative analytical data prepared by the Senior Analyst for the Fund. The directors also discussed the proposed continuance in private sessions with counsel.
The directors considered their knowledge of the nature and quality of the services provided by the Adviser to the Fund gained from their experience as directors or trustees of most of the registered investment companies advised by the Adviser, their overall confidence in the Adviser’s integrity and competence they have gained from that experience, the Adviser’s initiative in identifying and raising potential issues with the directors and its responsiveness, frankness and attention to concerns raised by the directors in the past, including the Adviser’s willingness to consider and implement organizational and operational changes designed to improve investment results and the services provided to the AB Funds. The directors noted that they have four regular meetings each year, at each of which they review extensive materials and information from the Adviser, including information on the investment performance of the Fund.
The directors also considered all factors they believed relevant, including the specific matters discussed below. During the course of their deliberations, the directors evaluated, among other things, the reasonableness of the advisory fee. The directors did not identify any particular information that wasall-important or controlling, and different directors may have attributed different weights to the various factors. The directors determined that the selection of the Adviser to manage the Fund and the overall arrangements between the Fund and the Adviser, as provided in the Advisory Agreement, including the advisory fee, were fair and reasonable in light of the services performed, expenses incurred and such other matters as the directors considered relevant in the exercise of their business judgment. The material factors and conclusions that formed the basis for the directors’ determinations included the following:
Nature, Extent and Quality of Services Provided
The directors considered the scope and quality of services provided by the Adviser under the Advisory Agreement, including the quality of the investment research capabilities of the Adviser and the other resources it has dedicated to performing services for the Fund. The directors noted that the Adviser from time to time reviews the Fund’s investment strategies and from time to time proposes changes intended to improve the Fund’s relative or absolute performance for the directors’ consideration. They also noted the professional experience and qualifications of the Fund’s portfolio management team and other senior personnel of the Adviser. The directors also considered that the Advisory Agreement provides that the Fund will reimburse the Adviser for the cost to it of providing certain clerical, accounting, administrative and other services to the Fund by employees of the Adviser or its affiliates. Requests for these reimbursements are made on a quarterly basis and subject to approval by the directors. Reimbursements, to the extent requested and paid, result in a higher rate of total compensation from the Fund to the Adviser than the fee rate stated in the Advisory Agreement. The directors noted that the methodology used to determine the reimbursement amounts had been reviewed by an independent consultant retained by the Fund’s former Senior Officer/Independent Compliance Officer. The quality of administrative and other services, including the Adviser’s role in coordinating the activities of the Fund’s other service providers, also was considered. The directors concluded that, overall, they were satisfied with the nature, extent and quality of services provided to the Fund under the Advisory Agreement.
Costs of Services Provided and Profitability
The directors reviewed a schedule of the revenues and expenses and related notes indicating the profitability of the Fund to the Adviser for calendar years 2017 and 2018 that had been prepared with an expense allocation methodology arrived at in consultation with an independent consultant retained by the Fund’s former Senior Officer/Independent Compliance Officer. The directors noted the assumptions and methods of allocation used by the Adviser in preparing fund-specific profitability data and understood that there are a number of potentially acceptable allocation methodologies for information of this type. The directors noted that the profitability information reflected all revenues and expenses of the Adviser’s relationship with the Fund, including those relating to its subsidiaries that provide transfer agency, distribution and brokerage services to the Fund. The directors recognized that it is difficult to make comparisons of the profitability of the Advisory Agreement with
30
| AB Variable Products Series Fund | ||
the profitability of advisory contracts for unaffiliated funds because comparative information is not generally publicly available and is affected by numerous factors. The directors focused on the profitability of the Adviser’s relationship with the Fund before taxes and distribution expenses. The directors noted that the Fund was not profitable to the Adviser in the periods reviewed.
Fall-Out Benefits
The directors considered the other benefits to the Adviser and its affiliates from their relationships with the Fund and the underlying fund advised by the Adviser in which the Fund invests, including, but not limited to, benefits relating to soft dollar arrangements (whereby investment advisers receive brokerage and research services from brokers that execute agency transactions for their clients);12b-1 fees and sales charges received by the Fund’s principal underwriter (which is a wholly owned subsidiary of the Adviser) in respect of the Fund’s Class B shares; brokerage commissions paid by the Fund to brokers affiliated with the Adviser; and transfer agency fees paid by the Fund to a wholly owned subsidiary of the Adviser. The directors recognized that the Fund’s unprofitability to the Adviser would be exacerbated without these benefits. The directors understood that the Adviser also might derive reputational and other benefits from its association with the Fund.
Investment Results
In addition to the information reviewed by the directors in connection with the Meeting, the directors receive detailed performance information for the Fund at each regular Board meeting during the year.
At the Meeting, the directors reviewed performance information prepared by an independent service provider (the “15(c) service provider”), showing the performance of the Class A Shares of the Fund against a group of similar funds (“peer group”) and a larger group of similar funds (“peer universe”), each selected by the 15(c) service provider, and information prepared by the Adviser showing performance of the Class A Shares against a broad-based securities market index, in each case for the1-,3-,5- and10-year periods ended February 28, 2019 and (in the case of comparisons with the broad-based securities market index) for the period from inception. Based on their review, the directors concluded that the Fund’s investment performance was acceptable.
Advisory Fees and Other Expenses
The directors considered the advisory fee rate payable by the Fund to the Adviser and information prepared by the 15(c) service provider concerning advisory fee rates payable by other funds in the same category as the Fund. The directors recognized that it is difficult to make comparisons of advisory fees because there are variations in the services that are included in the fees paid by other funds. The directors compared the Fund’s contractual effective advisory fee rate with a peer group median and took into account the impact on the advisory fee rate of the administrative expense reimbursement paid to the Adviser in the latest fiscal year.
The directors also considered the Adviser’s fee schedule for other clients pursuing an investment strategy similar to the Fund’s. For this purpose, they reviewed the relevant advisory fee information from the Adviser’s Form ADV and in a report from the Fund’s Senior Analyst and noted the differences between the Fund’s fee schedule, on the one hand, and the Adviser’s institutional fee schedule and the schedule of fees charged by the Adviser to any offshore funds and for services to anysub-advised funds pursuing an investment strategy similar to the Fund’s, on the other. The directors noted that the Adviser may, in some cases, agree to fee rates with large institutional clients that are lower than those reviewed by the directors and that they had previously discussed with the Adviser its policies in respect of such arrangements. The directors previously discussed these matters with an independent fee consultant. The directors also compared the advisory fee rate for the Fund with that for another fund advised by the Adviser with a similar investment strategy.
The Adviser reviewed with the directors the significantly greater scope of the services it provides to the Fund relative to institutional, offshore fund andsub-advised fund clients. In this regard, the Adviser noted, among other things, that, compared to institutional and offshore orsub-advisory accounts, the Fund (i) demands considerably more portfolio management, research and trading resources due to significantly higher daily cash flows; (ii) has more tax and regulatory restrictions and compliance obligations; (iii) must prepare and file or distribute regulatory and other communications about fund operations; and (iv) must provide shareholder servicing to retail investors. The Adviser also reviewed the greater legal risks presented by the large and changing population of Fund shareholders who may assert claims against the Adviser in individual or class actions, and the greater entrepreneurial risk in offering new fund products, which require substantial investment to launch, may not succeed, and generally must be priced to compete with larger, more established funds resulting in lack of profitability to the Adviser until a new fund achieves scale. In light of the substantial differences in services rendered by the Adviser to institutional, offshore fund andsub-advised fund clients as compared to the Fund, and the different risk profile, the directors considered these fee comparisons inapt and did not place significant weight on them in their deliberations.
31
| GROWTH AND INCOME PORTFOLIO | ||
| CONTINUANCE DISCLOSURE | ||
| (continued) | AB Variable Products Series Fund | |
In connection with their review of the Fund’s advisory fee, the directors also considered the total expense ratio of the Class A shares of the Fund in comparison to a peer group and a peer universe selected by the 15(c) service provider. The Class A expense ratio of the Fund was based on the Fund’s latest fiscal year. The directors noted that it was likely that the expense ratios of some of the other funds in the Fund’s category were lowered by waivers or reimbursements by those funds’ investment advisers, which in some cases might be voluntary or temporary. The directors view expense ratio information as relevant to their evaluation of the Adviser’s services because the Adviser is responsible for coordinating services provided to the Fund by others. Based on their review, the directors concluded that the Fund’s expense ratio was acceptable.
Economies of Scale
The directors noted that the advisory fee schedule for the Fund contains breakpoints that reduce the fee rates on assets above specified levels. The directors took into consideration prior presentations by an independent consultant on economies of scale in the mutual fund industry and for the AB Funds, and presentations from time to time by the Adviser concerning certain of its views on economies of scale. The directors also previously discussed economies of scale with an independent fee consultant. The directors also had requested and received from the Adviser certain updates on economies of scale in advance of the Meeting. The directors believe that economies of scale may be realized (if at all) by the Adviser across a variety of products and services, and not only in respect of a single fund. The directors noted that there is no established methodology for setting breakpoints that give effect to the fund-specific services provided by a fund’s adviser and to the economies of scale that an adviser may realize in its overall mutual fund business or those components of it which directly or indirectly affect a fund’s operations. The directors observed that in the mutual fund industry as a whole, as well as among funds similar to the Fund, there is no uniformity or pattern in the fees and asset levels at which breakpoints (if any) apply. The directors also noted that the advisory agreements for many funds do not have breakpoints at all. Having taken these factors into account, the directors concluded that the Fund’s shareholders would benefit from a sharing of economies of scale in the event the Fund’s net assets exceed a breakpoint in the future.
32
VPS-GI-0151-1219
DEC 12.31.19

ANNUAL REPORT
AB VARIABLE PRODUCTS SERIES FUND, INC.
| + | INTERMEDIATE BOND PORTFOLIO |
Beginning on May 1, 2021, as permitted by regulations adopted by the Securities and Exchange Commission, you may not be receiving paper copies of the Portfolio’s shareholder reports from the insurance company that offers your contract unless you specifically request paper copies from the insurance company or from your financial intermediary. Instead of delivering paper copies of the reports, the insurance company may choose to make the reports available on a website, and will notify you by mail each time a report is posted and provide you with a website link to access the report. Instructions for requesting paper copies will be provided by your insurance company.
If you already elected to receive shareholder reports electronically, you will not be affected by this change and you need not take any action. You may elect to receive shareholder reports and other communications from the insurance company or your financial intermediary electronically by following the instructions provided by the insurance company or by contacting your financial intermediary.
You may elect to receive all future reports in paper free of charge from the insurance company. You can inform the insurance company or your financial intermediary that you wish to continue receiving paper copies of your shareholder reports by following the instructions provided by the insurance company or by contacting your financial intermediary. Your election to receive reports in paper will apply to all portfolio companies available under your contract with the insurance company.
Investment Products Offered
| • | Are Not FDIC Insured |
| • | May Lose Value |
| • | Are Not Bank Guaranteed |
AllianceBernstein Investments, Inc. (ABI) is the distributor of the AB family of mutual funds. ABI is a member of FINRA and is an affiliate of AllianceBernstein L.P., the Adviser of the funds.
You may obtain a description of the Fund’s proxy voting policies and procedures, and information regarding how the Fund voted proxies relating to portfolio securities during the most recent12-month period ended June 30, without charge. Simply visit AB’s website at www.abfunds.com or go to the Securities and Exchange Commission’s (the “Commission”) website at www.sec.gov, or call AB at (800) 227 4618.
The Fund files its complete schedule of portfolio holdings with the Commission for the first and third quarters of each fiscal year as an exhibit to its reports on Form N-PORT. The Fund’s Form N-PORT reports are available on the Commission’s website at www.sec.gov. The Fund’s Forms N-PORT may also be reviewed and copied at the Commission’s Public Reference Room in Washington, DC; information on the operation of the Public Reference Room may be obtained by calling (800) SEC 0330.
The [A/B] logo is a registered service mark of AllianceBernstein and AllianceBernstein® is a registered service mark used by permission of the owner, AllianceBernstein L.P.
| INTERMEDIATE BOND PORTFOLIO | AB Variable Products Series Fund | |
LETTER TO INVESTORS
February 14, 2020
The following is an update of AB Variable Products Series Fund—Intermediate Bond Portfolio (the “Portfolio”) for the annual reporting period ended December 31, 2019.
INVESTMENT OBJECTIVE AND POLICIES
The Portfolio’s investment objective is to generate income and price appreciation without assuming what the Adviser considers undue risk. The Portfolio invests, under normal circumstances, at least 80% of its net assets in fixed-income securities. The Portfolio expects to invest in readily marketable fixed-income securities with a range of maturities from short- to long-term and relatively attractive yields that do not involve undue risk of loss of capital. The Portfolio expects to invest in fixed-income securities with a dollar-weighted average maturity of between three and 10 years and an average duration of three to six years. The Portfolio may invest up to 25% of its net assets in below investment-grade bonds (commonly known as “junk bonds”). The Portfolio may use leverage for investment purposes.
The Portfolio may invest without limit in US dollar-denominated foreign fixed-income securities and may invest up to 25% of its assets innon-US dollar-denominated foreign fixed-income securities. These investments may include, in each case, developed- and emerging-market debt securities.
The Portfolio may invest in mortgage-related and other asset-backed securities, loan participations, inflation-indexed securities, structured securities, variable, floating and inverse floating-rate instruments, and preferred stock, and may use other investment techniques. The Portfolio intends, among other things, to enter into transactions such as reverse repurchase agreements and dollar rolls. The Portfolio may invest, without limit, in derivatives, such as options, futures contracts, forwards and swaps.
INVESTMENT RESULTS
The table on page 4 shows the Portfolio’s performance compared to its benchmark, the Bloomberg Barclays US Aggregate Bond Index, for theone-, five- and10-year periods ended December 31, 2019.
During the annual period, all share classes of the Portfolio underperformed the benchmark. The Portfolio’s shorter-than-benchmark duration positioning in longer10- to20-year maturities was the largest detractor, relative to the benchmark, as US yields fell. Currency selection was a minor detractor due to a long position in the Brazilian real. Security decisions added to returns, primarily from selections within commercial mortgage-backed securities and, to a lesser extent, US agencies. Sector allocation also contributed, mostly from an underweight in US Treasuries and exposure tonon-investment-grade corporates, which were partially offset by losses in inflation-linked securities in the US. Country exposure to Japan was a minor contributor to relative performance.
During the annual period, the Portfolio utilized currency forwards to hedge currency risk and actively manage currency positions. Credit default swaps were utilized in the corporate and commercial mortgage-backed securities sectors for hedging and investment purposes. Treasury futures and interest rate swaps were utilized to manage duration, country exposure and yield-curve positioning. Variance swaps were used for hedging purposes and had no material impact on absolute returns.
MARKET REVIEW AND INVESTMENT STRATEGY
Global fixed-income markets performed strongly over the annual period ended December 31, 2019. The US Federal Reserve lowered interest rates three times beginning in July, and increased its balance sheet later in the period to manage liquidity in the repurchase agreement market, effectively capping short-term rates. The European Central Bank reduced rates to a record low in September and announced the resumption of quantitative easing. The Bank of Japan issued guidance for the continuation of low rates and the government implemented a significant fiscal stimulus program in December. Central bankers in numerous other developed and emerging markets lowered interest rates and signaled potential fiscal stimulus measures to boost economic growth. Investor confidence increased after the announcement of a partialUS-China phase-one trade agreement and indications that the UK would leave the European Union with a clear path for Brexit.
Long-dated developed-market treasuries were strong performers, given their interest-rate sensitivity, despite the move higher in yields since September. Investment-grade, high-yield and emerging-market sovereign debt all posted solid returns as credit spreads tightened. The US dollar was persistently firm as a safe haven currency until the fourth quarter, when renewed optimism led investors to increase growth (risk) investments. Overall, the US dollar was mixed relative to developed- and emerging-market currencies, gaining versus the euro and Latin American currencies, while falling against the pound, Swiss franc and yen. Inflation remained below target in most developed countries and fell in emerging markets, even as oil prices rebounded.
1
| INTERMEDIATE BOND PORTFOLIO | ||
| DISCLOSURES AND RISKS | AB Variable Products Series Fund | |
Benchmark Disclosure
The Bloomberg Barclays US Aggregate Bond Index is unmanaged and does not reflect fees and expenses associated with the active management of a mutual fund portfolio.The Bloomberg Barclays US Aggregate Bond Index represents the performance of securities within the US investment-grade fixed-rate bond market, with index components for government and corporate securities, mortgage pass-through securities, asset-backed securities and commercial mortgage-backed securities. An investor cannot invest directly in an index, and its results are not indicative of the performance for any specific investment, including the Portfolio.
A Word About Risk
Market Risk: The value of the Portfolio’s assets will fluctuate as the stock or bond market fluctuates. The value of its investments may decline, sometimes rapidly and unpredictably, simply because of economic changes or other events that affect large portions of the market.
Interest-Rate Risk: Changes in interest rates will affect the value of investments in fixed-income securities. When interest rates rise, the value of existing investments in fixed-income securities tends to fall and this decrease in value may not be offset by higher income from new investments. Interest-rate risk is generally greater for fixed-income securities with longer maturities or durations.
Credit Risk: An issuer or guarantor of a fixed-income security, or the counterparty to a derivatives or other contract, may be unable or unwilling to make timely payments of interest or principal, or to otherwise honor its obligations. The issuer or guarantor may default, causing a loss of the full principal amount of a security and accrued interest. The degree of risk for a particular security may be reflected in its credit rating. There is the possibility that the credit rating of a fixed-income security may be downgraded after purchase, which may adversely affect the value of the security.
Below Investment-Grade Security Risk:Investments in fixed-income securities with lower ratings (“junk bonds”) tend to have a higher probability that an issuer will default or fail to meet its payment obligations. These securities may be subject to greater price volatility due to such factors as specific corporate developments, interest-rate sensitivity, negative perceptions of the junk bond market generally and may be more difficult to trade or dispose of than other types of securities.
Duration Risk: Duration is a measure that relates the expected price volatility of a fixed-income security to changes in interest rates. The duration of a fixed-income security may be shorter than or equal to full maturity of a fixed-income security. Fixed-income securities with longer durations have more risk and will decrease in price as interest rates rise.
Inflation Risk:This is the risk that the value of assets or income from investments will be less in the future as inflation decreases the value of money. As inflation increases, the value of the Portfolio’s assets can decline as can the value of the Portfolio’s distributions. This risk is significantly greater if the Portfolio invests a significant portion of its assets in fixed-income securities with longer maturities.
Foreign(Non-US) Risk:Investments in securities ofnon-US issuers may involve more risk than those of US issuers. These securities may fluctuate more widely in price and may be more difficult to trade or dispose of due to adverse market, economic, political, regulatory or other factors.
Emerging-Market Risk:Investments in emerging-market countries may have more risk because the markets are less developed and less liquid, and because these investments may be subject to increased economic, political, regulatory or other uncertainties.
Currency Risk:Fluctuations in currency exchange rates may negatively affect the value of the Portfolio’s investments or reduce its returns.
Mortgage-Related and/or Other Asset-Backed Securities Risk:Investments in mortgage-related and other asset-backed securities are subject to certain additional risks. The value of these securities may be particularly sensitive to changes in interest rates. These risks include “extension risk”, which is the risk that, in periods of rising interest rates, issuers may delay the payment of principal, and “prepayment risk”, which is the risk that in periods of falling interest rates, issuers may pay
principal sooner than expected, exposing the Portfolio to a lower rate of return upon reinvestment of principal. Mortgage-backed securities offered by nongovernmental issuers and other asset-backed securities may be subject to other risks, such as higher rates of default in the mortgages or assets backing the securities or risks associated with the nature and servicing of mortgages or assets backing the securities.
(Disclosures, Risks and Note About Historical Performance continued on next page)
2
| AB Variable Products Series Fund | ||
Leverage Risk:To the extent the Portfolio uses leveraging techniques, its net asset value (“NAV”) may be more volatile because leverage tends to exaggerate the effect of changes in interest rates and any increase or decrease in the value of the Portfolio’s investments.
Illiquid Investments Risk:Illiquid investments risk exists when certain investments are or become difficult to purchase or sell. Difficulty in selling such investments may result in sales at disadvantageous prices affecting the value of your investment in the Portfolio. Causes of illiquid investments risk may include low trading volumes, large positions and heavy redemptions of Portfolio shares. Over recent years illiquid investments risk has also increased because the capacity of dealers in the secondary market for fixed-income securities to make markets in these securities has decreased, even as the overall bond market has grown significantly, due to, among other things, structural changes, additional regulatory requirements and capital and risk restraints that have led to reduced inventories. Illiquid investments risk may be higher in a rising interest-rate environment, when the value and liquidity of fixed-income securities generally decline.
Derivatives Risk:Derivatives may be difficult to price or unwind and leveraged so that small changes may produce disproportionate losses for the Portfolio. Derivatives may also be subject to counterparty risk to a greater degree than more traditional investments.
Active Trading Risk: The Portfolio expects to engage in active and frequent trading of its portfolio securities and its portfolio turnover rate is expected to exceed 100%. A higher rate of portfolio turnover increases transaction costs, which may negatively affect the Portfolio’s return.
Management Risk:The Portfolio is subject to management risk because it is an actively managed investment fund. The Adviser will apply its investment techniques and risk analyses in making investment decisions for the Portfolio, but there is no guarantee that its techniques will produce the intended results.
These risks are fully discussed in the Variable Products prospectus. As with all investments, you may lose money by investing in the Portfolio.
An Important Note About Historical Performance
The investment return and principal value of an investment in the Portfolio will fluctuate, so that shares, when redeemed, may be worth more or less than their original cost. Performance shown in this report represents past performance and does not guarantee future results. Current performance may be lower or higher than the performance information shown. Please contact your financial advisor or insurance agent representative at your financial institution to obtain portfolio performance information current to the most recent month end.
Investors should consider the investment objectives, risks, charges and expenses of the Portfolio carefully before investing. For additional copies of the Portfolio’s prospectus or summary prospectus, which contains this and other information, call your financial advisor or (800) 227 4618. Please read the prospectus and/or summary prospectus carefully before investing.
All fees and expenses related to the operation of the Portfolio have been deducted, but no adjustment has been made for insurance company separate account or annuity contract charges, which would reduce total return to a contract owner. Performance assumes reinvestment of distributions and does not account for taxes.
There are additional fees and expenses associated with all Variable Products. These fees can include mortality and expense risk charges, administrative charges, and other charges that can significantly reduce investment returns. Those fees and expenses are not reflected in this annual report. You should consult your Variable Products prospectus for a description of those fees and expenses and speak to your insurance agent or financial representative if you have any questions. You should read the prospectus before investing or sending money.
3
| INTERMEDIATE BOND PORTFOLIO | ||
| HISTORICAL PERFORMANCE | AB Variable Products Series Fund | |
THE PORTFOLIO VS. ITS BENCHMARK | Net Asset Value Returns | |||||||||||
| PERIODS ENDED DECEMBER 31, 2019 (unaudited) | 1 Year | 5 Years1 | 10 Years1 | |||||||||
| Intermediate Bond Portfolio Class A2 | 8.20% | 3.09% | 4.13% | |||||||||
| Intermediate Bond Portfolio Class B2 | 7.99% | 2.83% | 3.87% | |||||||||
| Bloomberg Barclays US Aggregate Bond Index | 8.72% | 3.05% | 3.75% | |||||||||
1 Average annual returns. | ||||||||||||
2 Includes the impact of proceeds received and credited to the Portfolio resulting from class-action settlements, which enhanced the performance of all share classes of the Portfolio for the annual period ended December 31, 2019 by 0.03%. |
| |||||||||||
The Portfolio’s current prospectus fee table shows the Portfolio’s total annual expense ratios as 1.16% and 1.41% for Class A and Class B shares, respectively. The Financial Highlights section of this report sets forth expense ratio data for the current reporting period; the expense ratios shown above may differ from the expense ratios in the Financial Highlights section since they are based on different time periods.
GROWTH OF A $10,000 INVESTMENT
12/31/2009 TO 12/31/2019 (unaudited)
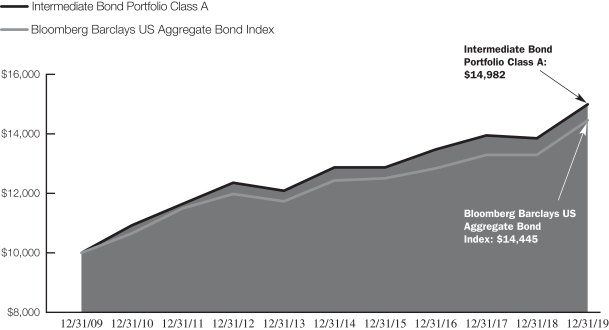
This chart illustrates the total value of an assumed $10,000 investment in Intermediate Bond Portfolio Class A shares (from 12/31/2009 to 12/31/2019) as compared to the performance of the Portfolio’s benchmark. The chart assumes the reinvestment of dividends and capital gains distributions.
See Disclosures, Risks and Note about Historical Performance on pages2-3.
4
| INTERMEDIATE BOND PORTFOLIO | ||
| EXPENSE EXAMPLE (unaudited) | AB Variable Products Series Fund | |
As a shareholder of the Portfolio, you incur two types of costs: (1) transaction costs, including sales charges (loads) on purchase payments, contingent deferred sales charges on redemptions and (2) ongoing costs, including management fees; distribution(12b-1) fees; and other Portfolio expenses. This example is intended to help you understand your ongoing costs (in dollars) of investing in the Portfolio and to compare these costs with the ongoing costs of investing in other mutual funds.
The Example is based on an investment of $1,000 invested at the beginning of the period and held for the entire period as indicated below.
Actual Expenses
The table below provides information about actual account values and actual expenses. You may use the information in this line, together with the amount you invested, to estimate the expenses that you paid over the period. Simply divide your account value by $1,000 (for example, an $8,600 account value divided by $1,000 = 8.6), then multiply the result by the number in the first line under the heading entitled “Expenses Paid During Period” to estimate the expenses you paid on your account during this period. The estimate of expenses does not include fees of other expenses of any variable insurance product. If such expenses were included, the estimate of expenses you paid during the period would be higher and your ending account value would be lower.
Hypothetical Example for Comparison Purposes
The table below provides information about hypothetical account values and hypothetical expenses based on the Portfolio’s actual expense ratio and an assumed annual rate of return of 5% before expenses, which is not the Portfolio’s actual return. The hypothetical account values and expenses may not be used to estimate the actual ending account balance or expenses you paid for the period. You may use this information to compare the ongoing costs of investing in the Portfolio and other funds by comparing this 5% hypothetical example with the 5% hypothetical examples that appear in the shareholder reports of other funds. The estimate of expenses does not include fees of other expenses of any variable insurance product. If such expenses were included, the estimate of expenses you paid during the period would be higher and your ending account value would be lower.
Please note that the expenses shown in the table are meant to highlight your ongoing costs only and do not reflect any transactional costs, such as sales charges (loads), or contingent deferred sales charges on redemptions. Therefore, the second line of each class’ table is useful in comparing ongoing costs only, and will not help you determine the relative total costs of owning different funds. In addition, if these transactional costs were included, your costs would have been higher.
| Beginning Account Value July 1, 2019 | Ending Account Value December 31, 2019 | Expenses Paid During Period* | Annualized Expense Ratio* | |||||||||||||
Class A | ||||||||||||||||
Actual | $ | 1,000 | $ | 1,021.00 | $ | 6.67 | 1.31 | % | ||||||||
Hypothetical (5% annual return before expenses) | $ | 1,000 | $ | 1,018.60 | $ | 6.67 | 1.31 | % | ||||||||
Class B | ||||||||||||||||
Actual | $ | 1,000 | $ | 1,020.30 | $ | 7.94 | 1.56 | % | ||||||||
Hypothetical (5% annual return before expenses) | $ | 1,000 | $ | 1,017.34 | $ | 7.93 | 1.56 | % | ||||||||
| * | Expenses are equal to each classes’ annualized expense ratios, multiplied by the average account value over the period, multiplied by 184/365 (to reflect theone-half year period). |
5
| INTERMEDIATE BOND PORTFOLIO | ||
| TOP TEN SECTORS (including derivatives)1 | ||
| December 31, 2019 (unaudited) | AB Variable Products Series Fund | |
Corporates—Investment Grade2 | 27.3 | % | ||
Mortgage Pass-Throughs | 20.7 | |||
Commercial Mortgage-Backed Securities2 | 19.8 | |||
Interest Rate Swaps3 | 11.9 | |||
Interest Rate Futures | 11.5 | |||
Collateralized Mortgage Obligations | 10.2 | |||
Governments—Treasuries | 9.5 | |||
Inflation-Linked Securities | 8.1 | |||
Asset-Backed Securities | 5.5 | |||
Corporates—Non-Investment Grade | 2.5 |
SECTOR BREAKDOWN (excluding derivatives)4
December 31, 2019 (unaudited)
Corporates—Investment Grade | 28.8 | % | ||
Mortgage Pass-Throughs | 20.5 | |||
Commercial Mortgage-Backed Securities | 12.6 | |||
Collateralized Mortgage Obligations | 10.1 | |||
Inflation-Linked Securities | 8.1 | |||
Governments—Treasuries | 7.4 | |||
Asset-Backed Securities | 5.5 | |||
Corporates—Non-Investment Grade | 2.5 | |||
Emerging Markets—Treasuries | 0.8 | |||
Local Governments—US Municipal Bonds | 0.7 | |||
Preferred Stocks | 0.2 | |||
Quasi-Sovereigns | 0.1 | |||
Emerging Markets—Corporate Bonds | 0.1 | |||
Short-Term Investments | 2.6 |
| 1 | All data are as of December 31, 2019. The Portfolio’s sectors include derivative exposure and are expressed as approximate percentages of the Portfolio’s total net assets, based on the Adviser’s internal classification. The percentages will vary over time. |
| 2 | Includes Credit Default Swaps. |
| 3 | Represents the exposure of the Portfolio’s fixed-rate payments on the Interest Rate Swaps. Interest Rate Swaps involve the exchange by a fund with another party of payments calculated by reference to specified interest rates (e.g., an exchange of floating-rate payments for fixed-rate payments). |
| 4 | All data are as of December 31, 2019. The Portfolio’s sector breakdown is expressed as a percentage of total investments and may vary over time. The Portfolio also enters into derivative transactions, which may be used for hedging or investment purposes (see “Portfolio of Investments” section of the report for additional details). |
6
| INTERMEDIATE BOND PORTFOLIO | ||
| PORTFOLIO OF INVESTMENTS | ||
| December 31, 2019 | AB Variable Products Series Fund | |
Principal Amount (000) | U.S. $ Value | |||||||||||
CORPORATES–INVESTMENT |
| |||||||||||
INDUSTRIAL–14.9% |
| |||||||||||
BASIC–1.5% | ||||||||||||
Alpek SAB de CV | U.S.$ | 200 | $ | 204,000 | ||||||||
Braskem Netherlands Finance BV | 200 | 199,500 | ||||||||||
DuPont de Nemours, Inc. | 65 | 69,519 | ||||||||||
4.493%, 11/15/25 | 65 | 71,596 | ||||||||||
Eastman Chemical Co. | 50 | 52,741 | ||||||||||
Glencore Funding LLC | 58 | 60,552 | ||||||||||
|
| |||||||||||
| 657,908 | ||||||||||||
|
| |||||||||||
CAPITAL GOODS–0.7% | ||||||||||||
Embraer Netherlands Finance BV | 85 | 95,784 | ||||||||||
General Electric Co. | EUR | 100 | 112,764 | |||||||||
United Technologies Corp. | U.S.$ | 90 | 98,207 | |||||||||
|
| |||||||||||
| 306,755 | ||||||||||||
|
| |||||||||||
COMMUNICATIONS– |
| |||||||||||
Charter Communications Operating LLC/Charter | ||||||||||||
4.908%, 7/23/25 | 135 | 148,794 | ||||||||||
5.05%, 3/30/29 | 90 | 101,918 | ||||||||||
Comcast Corp. | 95 | 106,956 | ||||||||||
Cox Communications, Inc. | 51 | 51,888 | ||||||||||
|
| |||||||||||
| 409,556 | ||||||||||||
|
| |||||||||||
COMMUNICATIONS– |
| |||||||||||
AT&T, Inc. | 310 | 325,094 | ||||||||||
4.125%, 2/17/26 | 147 | 159,383 | ||||||||||
4.55%, 3/09/49 | 64 | 71,073 | ||||||||||
Verizon Communications, Inc. | 75 | 93,131 | ||||||||||
5.012%, 4/15/49 | 28 | 35,838 | ||||||||||
Vodafone Group PLC | 168 | 177,492 | ||||||||||
|
| |||||||||||
| 862,011 | ||||||||||||
|
| |||||||||||
CONSUMER CYCLICAL– |
| |||||||||||
General Motors Financial Co., Inc. | 30 | 32,033 | ||||||||||
5.10%, 1/17/24 | U.S.$ | 109 | $ | 118,323 | ||||||||
5.25%, 3/01/26 | 21 | 23,297 | ||||||||||
|
| |||||||||||
| 173,653 | ||||||||||||
|
| |||||||||||
CONSUMER CYCLICAL–RESTAURANTS–0.1% |
| |||||||||||
Starbucks Corp. | 31 | 35,859 | ||||||||||
|
| |||||||||||
CONSUMER |
| |||||||||||
AbbVie, Inc. | 67 | 68,126 | ||||||||||
4.875%, 11/14/48 | 47 | 54,220 | ||||||||||
AmerisourceBergen Corp. | 50 | 51,799 | ||||||||||
Anheuser-Busch InBev Worldwide, Inc. | 120 | 155,915 | ||||||||||
BAT Capital Corp. | 92 | 92,650 | ||||||||||
Becton Dickinson and Co. | 40 | 42,482 | ||||||||||
Biogen, Inc. | 144 | 156,686 | ||||||||||
Cigna Corp. | 37 | 38,841 | ||||||||||
4.125%, 11/15/25 | 45 | 48,859 | ||||||||||
4.375%, 10/15/28 | 58 | 64,362 | ||||||||||
CVS Health Corp. | 24 | 24,483 | ||||||||||
4.10%, 3/25/25 | 60 | 64,526 | ||||||||||
4.30%, 3/25/28 | 60 | 65,644 | ||||||||||
Kraft Heinz Foods Co. | 73 | 75,247 | ||||||||||
3.95%, 7/15/25 | 13 | 13,713 | ||||||||||
Mylan NV | 85 | 88,364 | ||||||||||
Reynolds American, Inc. | 50 | 50,794 | ||||||||||
Takeda Pharmaceutical Co., Ltd. | 200 | 214,904 | ||||||||||
Tyson Foods, Inc. | 48 | 51,329 | ||||||||||
4.00%, 3/01/26 | 12 | 12,993 | ||||||||||
Zimmer Biomet Holdings, Inc. | 51 | 51,049 | ||||||||||
Zoetis, Inc. | 45 | 45,506 | ||||||||||
|
| |||||||||||
| 1,532,492 | ||||||||||||
|
| |||||||||||
ENERGY–4.3% | ||||||||||||
Baker Hughes a GE Co. LLC/Baker HughesCo-Obligor, Inc. | 20 | 20,560 | ||||||||||
7
| INTERMEDIATE BOND PORTFOLIO | ||
| PORTFOLIO OF INVESTMENTS | ||
| (continued) | AB Variable Products Series Fund | |
Principal Amount (000) | U.S. $ Value | |||||||||||
Baker Hughes a GE Co. LLC/Baker HughesCo-Obligor, Inc. | U.S.$ | 58 | $ | 60,516 | ||||||||
Cenovus Energy, Inc. | 12 | 12,160 | ||||||||||
Energy Transfer Operating LP | 175 | 189,131 | ||||||||||
Enterprise Products Operating LLC | 161 | 171,491 | ||||||||||
5.20%, 9/01/20 | 55 | 56,147 | ||||||||||
Hess Corp. | 109 | 116,048 | ||||||||||
Kinder Morgan, Inc./DE | 150 | 153,642 | ||||||||||
Marathon Oil Corp. | 19 | 20,103 | ||||||||||
6.80%, 3/15/32 | 100 | 126,502 | ||||||||||
Newfield Exploration Co. | 40 | 44,119 | ||||||||||
Noble Energy, Inc. | 30 | 31,650 | ||||||||||
3.90%, 11/15/24 | 107 | 113,260 | ||||||||||
Occidental Petroleum Corp. | 75 | 76,187 | ||||||||||
3.20%, 8/15/26 | 15 | 15,174 | ||||||||||
ONEOK, Inc. | 87 | 92,369 | ||||||||||
4.35%, 3/15/29 | 57 | 61,898 | ||||||||||
Plains All American Pipeline LP/PAA Finance Corp. | 137 | 141,347 | ||||||||||
Sabine Pass Liquefaction LLC | 80 | 88,203 | ||||||||||
5.625%, 3/01/25 | 36 | 40,470 | ||||||||||
TransCanada PipeLines Ltd. | 108 | 116,094 | ||||||||||
Western Midstream Operating LP | 30 | 29,252 | ||||||||||
4.75%, 8/15/28 | 20 | 19,916 | ||||||||||
Williams Cos., Inc. (The) | 97 | 98,162 | ||||||||||
|
| |||||||||||
| 1,894,401 | ||||||||||||
|
| |||||||||||
SERVICES–0.6% | ||||||||||||
Expedia Group, Inc. | 94 | 95,906 | ||||||||||
Global Payments, Inc. | 43 | 45,280 | ||||||||||
S&P Global, Inc. | 127 | 141,037 | ||||||||||
|
| |||||||||||
| 282,223 | ||||||||||||
|
| |||||||||||
Principal Amount (000) | U.S. $ Value | |||||||||||
TECHNOLOGY–1.1% | ||||||||||||
Broadcom Corp./Broadcom Cayman Finance Ltd. | U.S.$ | 22 | $ | 22,785 | ||||||||
3.875%, 1/15/27 | 62 | 64,411 | ||||||||||
Broadcom, Inc. | 35 | 36,354 | ||||||||||
4.25%, 4/15/26(a) | 42 | 44,712 | ||||||||||
Dell International LLC/EMC Corp. | 78 | 90,054 | ||||||||||
KLA Corp. | 134 | 147,744 | ||||||||||
Lam Research Corp. | 39 | 39,467 | ||||||||||
Seagate HDD Cayman | 37 | 39,430 | ||||||||||
|
| |||||||||||
| 484,957 | ||||||||||||
|
| |||||||||||
| 6,639,815 | ||||||||||||
|
| |||||||||||
FINANCIAL |
| |||||||||||
BANKING–12.0% | ||||||||||||
American Express Co. | 15 | 15,076 | ||||||||||
Australia & New Zealand Banking Group Ltd. | 200 | 213,450 | ||||||||||
Banco Santander SA | 200 | 205,296 | ||||||||||
Bank of America Corp. | ||||||||||||
Series DD | 27 | 31,300 | ||||||||||
Series L | 360 | 384,012 | ||||||||||
Series Z | 41 | 46,540 | ||||||||||
Banque Federative du Credit Mutuel SA | 200 | 201,174 | ||||||||||
Barclays Bank PLC | 29 | 35,153 | ||||||||||
BBVA USA | 250 | 252,018 | ||||||||||
BNP Paribas SA | 200 | 214,392 | ||||||||||
Capital One Financial Corp. | 135 | 140,563 | ||||||||||
CIT Group, Inc. | 56 | 61,958 | ||||||||||
Citigroup, Inc. | 165 | 174,702 | ||||||||||
Commonwealth Bank of Australia | 52 | 52,037 | ||||||||||
Cooperatieve Rabobank UA | 250 | 271,667 | ||||||||||
8
| AB Variable Products Series Fund | ||
Principal Amount (000) | U.S. $ Value | |||||||||||
Credit Suisse Group Funding Guernsey Ltd. | U.S.$ | 265 | $ | 277,542 | ||||||||
Goldman Sachs Group, Inc. (The) | ||||||||||||
2.35%, 11/15/21 | 118 | 118,398 | ||||||||||
3.75%, 5/22/25 | 53 | 56,261 | ||||||||||
3.85%, 7/08/24 | 100 | 105,835 | ||||||||||
Series D | 195 | 198,526 | ||||||||||
HSBC Holdings PLC | 203 | 217,634 | ||||||||||
ING Groep NV | 200 | 209,592 | ||||||||||
JPMorgan Chase & Co. 3.22%, 3/01/25 | 140 | 145,114 | ||||||||||
3.54%, 5/01/28 | 105 | 111,369 | ||||||||||
Series FF | 68 | 71,095 | ||||||||||
Series Z | 22 | 22,206 | ||||||||||
Manufacturers & Traders Trust Co. | 250 | 251,710 | ||||||||||
Morgan Stanley | ||||||||||||
3.737%, 4/24/24 | 75 | 78,362 | ||||||||||
5.00%, 11/24/25 | 60 | 67,597 | ||||||||||
Series G | 186 | 203,404 | ||||||||||
MUFG Bank Ltd. | 200 | 200,076 | ||||||||||
Santander Holdings USA, Inc. | 140 | 151,347 | ||||||||||
Truist Financial Corp. | 45 | 45,167 | ||||||||||
UBS Group AG | 200 | 217,620 | ||||||||||
US Bancorp | 63 | 69,335 | ||||||||||
Wells Fargo & Co. | ||||||||||||
3.069%, 1/24/23 | 113 | 115,320 | ||||||||||
3.75%, 1/24/24 | 110 | 116,339 | ||||||||||
|
| |||||||||||
| 5,349,187 | ||||||||||||
|
| |||||||||||
FINANCE–0.4% | ||||||||||||
Synchrony Financial | 147 | 158,881 | ||||||||||
|
| |||||||||||
INSURANCE–0.3% | ||||||||||||
Centene Corp. | ||||||||||||
4.25%, 12/15/27(a) | 14 | 14,418 | ||||||||||
4.625%, 12/15/29(a) | 16 | 16,849 | ||||||||||
Hartford Financial Services Group, Inc. (The) | 31 | 31,259 | ||||||||||
Nationwide Mutual Insurance Co. | 35 | 59,697 | ||||||||||
Voya Financial, Inc. | U.S.$ | 31 | $ | 32,986 | ||||||||
|
| |||||||||||
| 155,209 | ||||||||||||
|
| |||||||||||
REITS–0.4% | ||||||||||||
Host Hotels & Resorts LP | 6 | 6,283 | ||||||||||
Welltower, Inc. | 146 | 157,480 | ||||||||||
|
| |||||||||||
| 163,763 | ||||||||||||
|
| |||||||||||
| 5,827,040 | ||||||||||||
|
| |||||||||||
UTILITY–1.0% | ||||||||||||
ELECTRIC–1.0% | ||||||||||||
AES Corp./VA | 49 | 49,779 | ||||||||||
Enel Chile SA | 68 | 75,523 | ||||||||||
Exelon Generation Co. LLC | 81 | 81,019 | ||||||||||
Israel Electric Corp., Ltd. | 200 | 219,688 | ||||||||||
|
| |||||||||||
| 426,009 | ||||||||||||
|
| |||||||||||
Total Corporates– | 12,892,864 | |||||||||||
|
| |||||||||||
MORTGAGE PASS-THROUGHS–20.6% |
| |||||||||||
AGENCY FIXED RATE30-YEAR–18.4% |
| |||||||||||
Federal Home Loan Mortgage Corp. | 501 | 524,372 | ||||||||||
Federal Home Loan Mortgage Corp. Gold | ||||||||||||
Series 2005 | 61 | 68,244 | ||||||||||
Series 2007 | 18 | 19,780 | ||||||||||
Series 2016 | 192 | 205,604 | ||||||||||
Series 2017 | 150 | 160,392 | ||||||||||
Series 2018 | 184 | 195,382 | ||||||||||
4.50%, 10/01/48–11/01/48 | 365 | 391,071 | ||||||||||
5.00%, 11/01/48 | 96 | 104,529 | ||||||||||
Federal National Mortgage Association | 56 | 62,627 | ||||||||||
Series 2004 | 50 | 56,212 | ||||||||||
Series 2005 | 58 | 65,188 | ||||||||||
9
| INTERMEDIATE BOND PORTFOLIO | ||
| PORTFOLIO OF INVESTMENTS | ||
| (continued) | AB Variable Products Series Fund | |
Principal Amount (000) | U.S. $ Value | |||||||||||
Series 2010 | U.S.$ | 89 | $ | 95,477 | ||||||||
Series 2012 | 226 | 238,241 | ||||||||||
Series 2013 | 110 | 115,837 | ||||||||||
4.00%, 10/01/43 | 346 | 370,370 | ||||||||||
Series 2017 | 288 | 299,227 | ||||||||||
Series 2018 | 2,746 | 2,867,986 | ||||||||||
4.00%, 8/01/48–12/01/48 | 405 | 428,761 | ||||||||||
4.50%, 9/01/48 | 327 | 349,606 | ||||||||||
Series 2019 | 694 | 724,353 | ||||||||||
4.00%, 6/01/49 | 226 | 239,687 | ||||||||||
Series 2020 | 225 | 231,486 | ||||||||||
Government National Mortgage Association | 1 | 903 | ||||||||||
Series 2016 | 212 | 219,046 | ||||||||||
Series 2020 | 150 | 154,125 | ||||||||||
|
| |||||||||||
| 8,188,506 | ||||||||||||
|
| |||||||||||
AGENCY FIXED RATE |
| |||||||||||
Federal National Mortgage Association | 966 | 977,799 | ||||||||||
|
| |||||||||||
Total Mortgage Pass-Throughs | 9,166,305 | |||||||||||
|
| |||||||||||
COMMERCIAL MORTGAGE-BACKED |
| |||||||||||
NON-AGENCY FIXED RATE CMBS–10.0% |
| |||||||||||
CCUBS Commercial Mortgage Trust | 155 | 164,940 | ||||||||||
CFCRE Commercial Mortgage Trust | 115 | 119,556 | ||||||||||
CGRBS Commercial Mortgage Trust | 260 | 268,723 | ||||||||||
Citigroup Commercial Mortgage Trust | ||||||||||||
Series 2015-GC27, Class A5 | 144 | 148,494 | ||||||||||
Series 2015-GC35, Class A4 | 55 | 59,018 | ||||||||||
Series2016-C1, Class A4 | U.S.$ | 192 | $ | 200,101 | ||||||||
Series 2016-GC36, Class A5 | 65 | 69,153 | ||||||||||
Commercial Mortgage Trust | 48 | 48,105 | ||||||||||
Series 2014-UBS3, Class A4 | 130 | 137,703 | ||||||||||
Series 2014-UBS5, Class A4 | 130 | 136,985 | ||||||||||
Series 2015-CR24, Class A5 | 65 | 69,133 | ||||||||||
Series2015-DC1, Class A5 | 80 | 83,314 | ||||||||||
CSAIL Commercial Mortgage Trust | 100 | 104,547 | ||||||||||
Series2015-C3, Class A4 | 117 | 123,226 | ||||||||||
Series2015-C4, Class A4 | 215 | 229,234 | ||||||||||
GS Mortgage Securities Trust | 136 | 138,488 | ||||||||||
Series 2015-GC28, Class A5 | 95 | 99,296 | ||||||||||
Series2018-GS9, Class A4 | 75 | 82,235 | ||||||||||
JP Morgan Chase Commercial Mortgage Securities Trust | ||||||||||||
Series2012-C6, Class D | 110 | 111,327 | ||||||||||
Series2012-C6, Class E | 132 | 126,887 | ||||||||||
JPMBB Commercial Mortgage Securities Trust | ||||||||||||
Series2014-C21, Class A5 | 100 | 105,993 | ||||||||||
Series2014-C22, Class XA | 2,571 | 84,737 | ||||||||||
Series2014-C24, Class C | 110 | 112,941 | ||||||||||
Series2015-C30, Class A5 | 65 | 69,576 | ||||||||||
Series2015-C31, Class A3 | 195 | 208,884 | ||||||||||
LB-UBS Commercial Mortgage Trust | 25 | 13,086 | ||||||||||
LSTAR Commercial Mortgage Trust | 159 | 157,653 | ||||||||||
10
| AB Variable Products Series Fund | ||
Principal Amount (000) | U.S. $ Value | |||||||||||
Morgan Stanley Capital I Trust | U.S.$ | 100 | $ | 106,527 | ||||||||
UBS Commercial Mortgage Trust | ||||||||||||
Series2018-C10, Class A4 | 125 | 140,512 | ||||||||||
Series2018-C8, Class A4 | 100 | 109,633 | ||||||||||
Series2018-C9, Class A4 | 125 | 138,455 | ||||||||||
UBS-Barclays Commercial Mortgage Trust | 112 | 113,915 | ||||||||||
Wells Fargo Commercial Mortgage Trust | ||||||||||||
Series2015-SG1, Class A4 | 95 | 101,299 | ||||||||||
Series2016-C35, Class XA | 958 | 93,036 | ||||||||||
Series 2016-LC25, Class C | 85 | 88,553 | ||||||||||
Series 2016-NXS6, Class C | 100 | 105,810 | ||||||||||
WF-RBS Commercial Mortgage Trust | ||||||||||||
Series2013-C11, Class XA | 1,266 | 39,137 | ||||||||||
Series2014-C19, Class A5 | 130 | 138,904 | ||||||||||
|
| |||||||||||
| 4,449,116 | ||||||||||||
|
| |||||||||||
NON-AGENCY FLOATING RATE CMBS – 2.7% | ||||||||||||
Ashford Hospitality Trust | 100 | 99,872 | ||||||||||
Atrium Hotel Portfolio Trust | 100 | 99,782 | ||||||||||
BAMLL Commercial Mortgage Securities Trust | 185 | 185,131 | ||||||||||
BFLD Trust | 70 | 69,888 | ||||||||||
BHMS | U.S.$ | 81 | $ | 80,978 | ||||||||
BX Trust | 86 | 86,012 | ||||||||||
CLNY Trust | 65 | 64,391 | ||||||||||
DBWF Mortgage Trust | 100 | 99,950 | ||||||||||
GS Mortgage Securities Corp. Trust | ||||||||||||
Series 2019-BOCA, Class A 2.94% (LIBOR 1 Month + 1.20%), 6/15/38(a)(d) | 115 | 114,963 | ||||||||||
Series2019-SMP, Class A 2.89% (LIBOR 1 Month + 1.15%), 8/15/32(a)(d) | 100 | 100,006 | ||||||||||
Starwood Retail Property Trust | 173 | 172,781 | ||||||||||
|
| |||||||||||
| 1,173,754 | ||||||||||||
|
| |||||||||||
Total Commercial Mortgage-Backed Securities | 5,622,870 | |||||||||||
|
| |||||||||||
COLLATERALIZED MORTGAGE OBLIGATIONS–10.2% | �� | |||||||||||
RISK SHARE FLOATING RATE–7.9% | ||||||||||||
Bellemeade Re Ltd.Series 2017-1, Class M1 | ||||||||||||
3.492% (LIBOR 1 Month + 1.70%), 10/25/27(a)(d) | 33 | 33,452 | ||||||||||
Series2018-2A, Class M1B | 150 | 150,378 | ||||||||||
Series2018-3A, Class M1B | 150 | 150,284 | ||||||||||
Series2019-4A, Class M1B | 150 | 149,921 | ||||||||||
11
| INTERMEDIATE BOND PORTFOLIO | ||
| PORTFOLIO OF INVESTMENTS | ||
| (continued) | AB Variable Products Series Fund | |
Principal Amount (000) | U.S. $ Value | |||||||||||
Connecticut Avenue Securities Trust |
| |||||||||||
Series2018-R07, Class 1M2 | U.S.$ | 50 | $ | 50,910 | ||||||||
Series 2019-HRP1, Class M2 | 116 | 116,381 | ||||||||||
Series2019-R02, Class 1M2 | 70 | 70,646 | ||||||||||
Series2019-R03, Class 1M2 | 110 | 110,828 | ||||||||||
Series2019-R04, Class 2M2 | 115 | 115,684 | ||||||||||
Series2019-R05, Class 1M2 | 120 | 120,606 | ||||||||||
Series2019-R06, Class 2M2 | 115 | 116,085 | ||||||||||
Series2019-R07, Class 1M2 | 110 | 111,033 | ||||||||||
Eagle RE Ltd. | 102 | 102,275 | ||||||||||
Federal Home Loan Mortgage Corp. |
| |||||||||||
Series 2019-DNA3, Class M2 | 115 | 115,533 | ||||||||||
Series 2019-DNA4, Class M2 | 110 | 110,159 | ||||||||||
Series 2019-FTR2, Class M2 | 115 | 115,216 | ||||||||||
Series 2019-HQA1, Class M2 | 90 | 90,923 | ||||||||||
Federal Home Loan Mortgage Corp. Structured Agency Credit Risk Debt Notes | 12 | 12,499 | ||||||||||
Federal National Mortgage | ||||||||||||
Series2014-C03, Class 1M2 | U.S.$ | 38 | $ | 39,840 | ||||||||
Series2014-C04, Class 2M2 | 32 | 35,043 | ||||||||||
Series2015-C01, Class 1M2 | 48 | 51,516 | ||||||||||
Series2015-C01, Class 2M2 | 33 | 34,023 | ||||||||||
Series2015-C02, Class 1M2 | 61 | 65,019 | ||||||||||
Series2015-C02, Class 2M2 | 58 | 59,903 | ||||||||||
Series2015-C03, Class 1M2 | 76 | 82,513 | ||||||||||
Series2015-C03, Class 2M2 | 53 | 56,790 | ||||||||||
Series2015-C04, Class 1M2 | 94 | 104,633 | ||||||||||
Series2015-C04, Class 2M2 | 77 | 81,816 | ||||||||||
Series2016-C01, Class 1M2 | 129 | 143,275 | ||||||||||
Series2016-C01, Class 2M2 | 64 | 69,957 | ||||||||||
Series2016-C02, Class 1M2 | 106 | 116,934 | ||||||||||
Series2016-C03, Class 2M2 | 131 | 141,676 | ||||||||||
12
| AB Variable Products Series Fund | ||
Principal Amount (000) | U.S. $ Value | |||||||||||
Series2016-C05, Class 2M2 | U.S.$ | 88 | $ | 92,417 | ||||||||
Series2017-C04, Class 2M2 | ||||||||||||
4.642% (LIBOR 1 Month + 2.85%), 11/25/29(d) | 45 | 46,536 | ||||||||||
Home Re Ltd. | 98 | 98,238 | ||||||||||
PMT Credit Risk Transfer Trust |
| |||||||||||
Series2019-1R, Class A 3.70% (LIBOR 1 Month + 2.00%), 3/27/24(d)(e) | 91 | 90,501 | ||||||||||
Series2019-2R, Class A 4.45% (LIBOR 1 Month + 2.75%), 5/27/23(d)(e) | 113 | 114,184 | ||||||||||
Series2019-3R, Class A 4.614% (LIBOR 1 Month + 2.70%), 10/27/22(d)(e) | 95 | 95,064 | ||||||||||
Wells Fargo Credit Risk Transfer Securities Trust | ||||||||||||
Series2015-WF1, Class 1M2 7.042% (LIBOR 1 Month + 5.25%), 11/25/25(d)(e) | 37 | 41,479 | ||||||||||
Series2015-WF1, Class 2M2 | ||||||||||||
7.292% (LIBOR 1 Month + 5.50%), 11/25/25(d)(e) | 17 | 19,674 | ||||||||||
|
| |||||||||||
| 3,523,844 | ||||||||||||
|
| |||||||||||
AGENCY FLOATING RATE–1.3% | ||||||||||||
Federal National Mortgage Association REMICs | 140 | 30,221 | ||||||||||
Series2012-70, Class SA | 254 | 56,338 | ||||||||||
Series2015-90, Class SL | 272 | 53,081 | ||||||||||
Series2016-77, Class DS | 268 | 49,868 | ||||||||||
Series2017-16, Class SG | 280 | 53,232 | ||||||||||
Series2017-26, Class TS | U.S.$ | 264 | $ | 52,123 | ||||||||
Series2017-62, Class AS | 276 | 50,068 | ||||||||||
Series2017-81, Class SA | 274 | 54,249 | ||||||||||
Series2017-97, Class LS | 279 | 61,461 | ||||||||||
Government National Mortgage Association | 229 | 35,924 | ||||||||||
Series2017-65, Class ST | 261 | 52,133 | ||||||||||
|
| |||||||||||
| 548,698 | ||||||||||||
|
| |||||||||||
NON-AGENCY FIXED RATE–0.7% | ||||||||||||
Alternative Loan Trust | 15 | 13,709 | ||||||||||
Series 2006-24CB, Class A16 | 61 | 49,340 | ||||||||||
Series 2006-28CB, Class A14 | 45 | 36,368 | ||||||||||
Series2006-J1, Class 1A13 | 31 | 28,185 | ||||||||||
Chase Mortgage Finance Trust | 21 | 16,377 | ||||||||||
Countrywide Home Loan Mortgage Pass-Through Trust | 30 | 23,119 | ||||||||||
Series2006-13, Class 1A19 | 16 | 12,116 | ||||||||||
First Horizon Alternative Mortgage Securities Trust | 47 | 36,015 | ||||||||||
13
| INTERMEDIATE BOND PORTFOLIO | ||
| PORTFOLIO OF INVESTMENTS | ||
| (continued) | AB Variable Products Series Fund | |
Principal Amount (000) | U.S. $ Value | |||||||||||
JP Morgan Alternative Loan Trust | U.S.$ | 103 | $ | 90,618 | ||||||||
|
| |||||||||||
| 305,847 | ||||||||||||
|
| |||||||||||
NON-AGENCY FLOATING RATE–0.2% | ||||||||||||
DeutscheAlt-A Securities Mortgage Loan Trust | 118 | 61,542 | ||||||||||
HomeBanc Mortgage Trust | 33 | 29,848 | ||||||||||
|
| |||||||||||
| 91,390 | ||||||||||||
|
| |||||||||||
AGENCY FIXED | ||||||||||||
Federal National Mortgage Association Grantor Trust | 50 | 48,359 | ||||||||||
|
| |||||||||||
Total Collateralized Mortgage Obligations | 4,518,138 | |||||||||||
|
| |||||||||||
INFLATION-LINKED SECURITIES–8.1% |
| |||||||||||
JAPAN–1.3% | ||||||||||||
Japanese Government CPI Linked Bond | JPY | 60,735 | 573,780 | |||||||||
|
| |||||||||||
UNITED STATES–6.8% | ||||||||||||
U.S. Treasury Inflation Index | U.S.$ | 2,264 | 2,268,534 | |||||||||
0.375%, 7/15/25 (TIPS) | 663 | 676,137 | ||||||||||
0.75%, 7/15/28 (TIPS) | 92 | 97,049 | ||||||||||
|
| |||||||||||
| 3,041,720 | ||||||||||||
|
| |||||||||||
Total Inflation-Linked Securities | 3,615,500 | |||||||||||
|
| |||||||||||
GOVERNMENTS–TREASURIES–7.5% |
| |||||||||||
MALAYSIA–0.3% | ||||||||||||
Malaysia Government Bond | MYR | 474 | 117,979 | |||||||||
|
| |||||||||||
UNITED STATES–7.2% | ||||||||||||
U.S. Treasury Bonds | U.S.$ | 45 | 44,979 | |||||||||
2.875%, 5/15/49 | 65 | 71,825 | ||||||||||
3.00%, 11/15/45 | 1,538 | 1,723,794 | ||||||||||
4.375%, 11/15/39 | 610 | 817,400 | ||||||||||
Principal Amount (000) | U.S. $ Value | |||||||||||
U.S. Treasury Notes | U.S.$ | 547 | $ | 546,889 | ||||||||
|
| |||||||||||
| 3,204,887 | ||||||||||||
|
| |||||||||||
Total Governments–Treasuries | 3,322,866 | |||||||||||
|
| |||||||||||
ASSET-BACKED SECURITIES–5.5% | ||||||||||||
AUTOS–FIXED RATE–3.3% | ||||||||||||
Avis Budget Rental Car Funding AESOP LLC | 100 | 101,060 | ||||||||||
Series2018-2A, Class A | 105 | 110,902 | ||||||||||
Exeter Automobile Receivables Trust | 100 | 104,193 | ||||||||||
Series2017-1A, Class D | 100 | 104,839 | ||||||||||
Series2017-3A, Class C | 60 | 60,926 | ||||||||||
Flagship Credit Auto Trust | 125 | 127,181 | ||||||||||
Series2017-3, Class A | 3 | 3,281 | ||||||||||
Series2018-3, Class B | 75 | 76,193 | ||||||||||
Ford Credit Floorplan Master Owner Trust | 198 | 197,982 | ||||||||||
Series2017-1, Class A1 | 115 | 115,019 | ||||||||||
Hertz Vehicle Financing II LP | 115 | 115,249 | ||||||||||
Series2017-1A, Class A | 125 | 125,639 | ||||||||||
Series2019-1A, Class A | 100 | 102,609 | ||||||||||
Hertz Vehicle Financing LLC | 125 | 127,342 | ||||||||||
|
| |||||||||||
| 1,472,415 | ||||||||||||
|
| |||||||||||
OTHER ABS–FIXED RATE–1.4% | ||||||||||||
CLUB Credit Trust | 1 | 1,282 | ||||||||||
Consumer Loan Underlying Bond Credit Trust | 3 | 2,561 | ||||||||||
Series2018-P1, Class A | 23 | 23,571 | ||||||||||
14
| AB Variable Products Series Fund | ||
Principal Amount (000) | U.S. $ Value | |||||||||||
Marlette Funding Trust | U.S.$ | 35 | $ | 34,644 | ||||||||
Series2018-3A, Class A | 28 | 27,643 | ||||||||||
Series2018-4A, Class A | 28 | 27,717 | ||||||||||
Series2019-3A, Class A | 75 | 75,289 | ||||||||||
SBA Tower Trust | 147 | 147,148 | ||||||||||
SoFi Consumer Loan Program LLC | 11 | 10,630 | ||||||||||
Series2016-3, Class A | 13 | 13,440 | ||||||||||
Series2017-1, Class A | 16 | 15,742 | ||||||||||
Series2017-2, Class A | 20 | 19,847 | ||||||||||
Series2017-3, Class A | 26 | 26,070 | ||||||||||
Series2017-4, Class B | 130 | 132,518 | ||||||||||
Series2017-5, Class A2 | 82 | 82,169 | ||||||||||
|
| |||||||||||
| 640,271 | ||||||||||||
|
| |||||||||||
CREDIT CARDS–FIXED RATE–0.6% | ||||||||||||
World Financial Network Credit Card Master Trust | 130 | 131,442 | ||||||||||
Series2018-B, Class M | 70 | 71,593 | ||||||||||
Series2019-B, Class M | 80 | 80,008 | ||||||||||
|
| |||||||||||
| 283,043 | ||||||||||||
|
| |||||||||||
HOME EQUITY LOANS–FIXED RATE–0.1% | ||||||||||||
Credit-Based Asset Servicing & Securitization LLC | 44 | 45,279 | ||||||||||
|
| |||||||||||
HOME EQUITY LOANS–FLOATING RATE–0.1% | ||||||||||||
ABFC Trust | 19 | 18,792 | ||||||||||
|
| |||||||||||
Total Asset-Backed Securities | 2,459,800 | |||||||||||
|
| |||||||||||
CORPORATES–NON-INVESTMENT GRADE–2.5% | ||||||||||||
FINANCIAL INSTITUTIONS–1.6% | ||||||||||||
BANKING–1.4% | ||||||||||||
Citigroup, Inc. | U.S.$ | 55 | $ | 58,349 | ||||||||
Series O | 46 | 46,359 | ||||||||||
Series Q | 90 | 91,804 | ||||||||||
Credit Suisse Group AG | 200 | 219,166 | ||||||||||
Goldman Sachs Group, Inc. (The) | 6 | 6,041 | ||||||||||
Series M | 45 | 45,470 | ||||||||||
Series P | 31 | 31,305 | ||||||||||
Morgan Stanley | 20 | 20,354 | ||||||||||
Standard Chartered PLC | 100 | 86,194 | ||||||||||
|
| |||||||||||
| 605,042 | ||||||||||||
|
| |||||||||||
FINANCE–0.2% | ||||||||||||
Navient Corp. | 95 | 100,467 | ||||||||||
|
| |||||||||||
| 705,509 | ||||||||||||
|
| |||||||||||
INDUSTRIAL–0.9% | ||||||||||||
BASIC–0.1% | ||||||||||||
Sealed Air Corp. | 47 | 47,667 | ||||||||||
|
| |||||||||||
CAPITAL GOODS–0.1% | ||||||||||||
TransDigm, Inc. | 50 | 54,214 | ||||||||||
|
| |||||||||||
COMMUNICATIONS– | ||||||||||||
CSC Holdings LLC | 30 | 32,298 | ||||||||||
Diamond Sports Group LLC/Diamond Sports Finance Co. | 30 | 30,395 | ||||||||||
|
| |||||||||||
| 62,693 | ||||||||||||
|
| |||||||||||
CONSUMER CYCLICAL–AUTOMOTIVE–0.1% |
| |||||||||||
Panther BF Aggregator 2 LP/Panther Finance Co., Inc. | 20 | 21,614 | ||||||||||
|
| |||||||||||
CONSUMERNON-CYCLICAL–0.2% | ||||||||||||
Spectrum Brands, Inc. | 69 | 72,211 | ||||||||||
|
| |||||||||||
15
| INTERMEDIATE BOND PORTFOLIO | ||
| PORTFOLIO OF INVESTMENTS | ||
| (continued) | AB Variable Products Series Fund | |
Principal Amount (000) | U.S. $ Value | |||||||||||
ENERGY–0.2% |
| |||||||||||
Sunoco LP/Sunoco Finance Corp. | U.S.$ | 69 | $ | 70,672 | ||||||||
Transocean Poseidon Ltd. | 33 | 34,915 | ||||||||||
|
| |||||||||||
| 105,587 | ||||||||||||
|
| |||||||||||
TECHNOLOGY–0.1% |
| |||||||||||
CommScope, Inc. | 26 | 27,141 | ||||||||||
6.00%, 3/01/26(a) | 30 | 31,922 | ||||||||||
|
| |||||||||||
| 59,063 | ||||||||||||
|
| |||||||||||
| 423,049 | ||||||||||||
|
| |||||||||||
TotalCorporates–Non-Investment Grade | 1,128,558 | |||||||||||
|
| |||||||||||
EMERGING MARKETS–TREASURIES–0.8% |
| |||||||||||
SOUTH AFRICA–0.8% |
| |||||||||||
Republic of South Africa Government Bond | ZAR | 5,122 | 341,008 | |||||||||
|
| |||||||||||
LOCAL GOVERNMENTS–US MUNICIPAL BONDS–0.7% | ||||||||||||
UNITED STATES–0.7% |
| |||||||||||
State of California | U.S.$ | 200 | 320,246 | |||||||||
|
| |||||||||||
Shares | ||||||||||||
PREFERRED STOCKS–0.2% | ||||||||||||
FINANCIAL |
| |||||||||||
REITS–0.2% |
| |||||||||||
Sovereign Real Estate Investment Trust | 93 | 97,883 | ||||||||||
|
| |||||||||||
| Principal Amount (000) | ||||||||||||
QUASI-SOVEREIGNS–0.2% |
| |||||||||||
QUASI-SOVEREIGN BONDS–0.2% |
| |||||||||||
MEXICO–0.2% |
| |||||||||||
Petroleos Mexicanos | U.S.$ | 50 | 50,438 | |||||||||
6.84%, 1/23/30(a) | 17 | 18,188 | ||||||||||
|
| |||||||||||
Total Quasi-Sovereigns | 68,626 | |||||||||||
|
| |||||||||||
EMERGING MARKETS–CORPORATE BONDS–0.1% |
| |||||||||||
UTILITY–0.1% |
| |||||||||||
ELECTRIC–0.1% |
| |||||||||||
Terraform Global Operating LLC | U.S.$ | 21 | $ | 21,837 | ||||||||
|
| |||||||||||
SHORT-TERM |
| |||||||||||
GOVERNMENTS–TREASURIES–2.0% |
| |||||||||||
JAPAN–2.0% |
| |||||||||||
Japan Treasury Discount Bill | ||||||||||||
Series 863 | JPY | 22,500 | 207,093 | |||||||||
Series 869 | 29,700 | 273,398 | ||||||||||
Series 874 | 45,100 | 415,208 | ||||||||||
|
| |||||||||||
Total Governments–Treasuries | 895,699 | |||||||||||
|
| |||||||||||
| Shares | |||||||||||
INVESTMENT COMPANIES–0.6% |
| |||||||||||
AB Fixed Income Shares, Inc.–Government Money Market Portfolio–Class AB, | 263,950 | 263,950 | ||||||||||
|
| |||||||||||
Total Short-Term Investments | 1,159,649 | |||||||||||
|
| |||||||||||
TOTAL | 44,736,150 | |||||||||||
Other assets less | (321,026 | ) | ||||||||||
|
| |||||||||||
NET ASSETS–100.0% | $ | 44,415,124 | ||||||||||
|
| |||||||||||
16
| AB Variable Products Series Fund | ||
FUTURES (see Note D)
| Description | Number of Contracts | Expiration Month | Current Notional | Value and Unrealized Appreciation/ (Depreciation) | ||||||||||||
Purchased Contracts |
| |||||||||||||||
Euro-Bund Futures | 3 | March 2020 | $ | 573,716 | $ | (4,838 | ) | |||||||||
U.S. 10 Yr Ultra Futures | 7 | March 2020 | 984,922 | (12,212 | ) | |||||||||||
U.S.T-Note 10 Yr (CBT) Futures | 1 | March 2020 | 128,422 | 186 | ||||||||||||
U.S.T-Note 2 Yr (CBT) Futures | 20 | March 2020 | 4,310,000 | (1,579 | ) | |||||||||||
U.S. Ultra Bond (CBT) Futures | 12 | March 2020 | 2,179,875 | (54,447 | ) | |||||||||||
Sold Contracts | ||||||||||||||||
10 Yr Mini Japan Government Bond Futures | 5 | March 2020 | 699,139 | 421 | ||||||||||||
Long Gilt Futures | 2 | March 2020 | 348,052 | 1,998 | ||||||||||||
U.S.T-Note 5 Yr (CBT) Futures | 17 | March 2020 | 2,016,359 | 3,768 | ||||||||||||
|
| |||||||||||||||
| $ | (66,703 | ) | ||||||||||||||
|
| |||||||||||||||
FORWARD CURRENCY EXCHANGE CONTRACTS (see Note D)
| Counterparty | Contracts to Deliver (000) | In Exchange For (000) | Settlement Date | Unrealized Appreciation/ (Depreciation) | ||||||||||||||||||||
Bank of America, NA | USD | 66 | RUB | 4,251 | 1/17/20 | $ | 2,189 | |||||||||||||||||
Barclays Bank PLC | RUB | 4,233 | USD | 67 | 1/17/20 | (928 | ) | |||||||||||||||||
Citibank, NA | BRL | 269 | USD | 66 | 1/03/20 | (1,203 | ) | |||||||||||||||||
Citibank, NA | USD | 67 | BRL | 269 | 1/03/20 | 133 | ||||||||||||||||||
Citibank, NA | JPY | 91,991 | USD | 851 | 1/30/20 | 3,517 | ||||||||||||||||||
Credit Suisse International | BRL | 269 | USD | 67 | 1/03/20 | (133 | ) | |||||||||||||||||
Credit Suisse International | USD | 64 | BRL | 269 | 1/03/20 | 3,120 | ||||||||||||||||||
State Street Bank & Trust Co. | PLN | 446 | USD | 116 | 1/09/20 | (1,207 | ) | |||||||||||||||||
State Street Bank & Trust Co. | USD | 113 | PLN | 446 | 1/09/20 | 4,087 | ||||||||||||||||||
State Street Bank & Trust Co. | USD | 51 | GBP | 39 | 1/10/20 | 1,401 | ||||||||||||||||||
State Street Bank & Trust Co. | EUR | 188 | USD | 207 | 1/16/20 | (3,731 | ) | |||||||||||||||||
State Street Bank & Trust Co. | USD | 101 | EUR | 90 | 1/16/20 | 558 | ||||||||||||||||||
State Street Bank & Trust Co. | NZD | 247 | USD | 158 | 1/17/20 | (8,654 | ) | |||||||||||||||||
State Street Bank & Trust Co. | USD | 163 | NZD | 248 | 1/17/20 | 3,398 | ||||||||||||||||||
State Street Bank & Trust Co. | ZAR | 4,715 | USD | 317 | 1/23/20 | (18,697 | ) | |||||||||||||||||
State Street Bank & Trust Co. | JPY | 69,663 | USD | 645 | 1/30/20 | 3,192 | ||||||||||||||||||
State Street Bank & Trust Co. | MYR | 491 | USD | 117 | 2/13/20 | (3,289 | ) | |||||||||||||||||
|
| |||||||||||||||||||||||
| $ | (16,247 | ) | ||||||||||||||||||||||
|
| |||||||||||||||||||||||
CENTRALLY CLEARED CREDIT DEFAULT SWAPS (see Note D)
Description | Fixed Rate (Pay) Receive | Payment Frequency | Implied Credit Spread at December 31, 2019 | Notional | Market Value | Upfront Premiums Paid (Received) | Unrealized Appreciation/ (Depreciation) | |||||||||||||||||||||||||
Buy Contracts |
| |||||||||||||||||||||||||||||||
CDX-NAIG Series 32, 5 Year Index, 6/20/24* | (1.00 | )% | Quarterly | 0.39 | % | USD | 760 | $ | (20,081) | $ | (12,418) | $ | (7,663) | |||||||||||||||||||
| * | Termination date |
17
| INTERMEDIATE BOND PORTFOLIO | ||
| PORTFOLIO OF INVESTMENTS | ||
| (continued) | AB Variable Products Series Fund | |
CENTRALLY CLEARED INTEREST RATE SWAPS (see Note D)
| Rate Type | ||||||||||||||||||||||||||||||
Notional Amount (000) | Termination Date | Payments made by the Fund | Payments received by the Fund | Payment Frequency Paid/ Received | Market Value | Upfront Premiums Paid (Received) | Unrealized Appreciation/ (Depreciation) | |||||||||||||||||||||||
| CAD | 3,550 | 8/27/21 | 3 Month CDOR | 1.623% | Semi-Annual/ Semi-Annual | $ | (19,586 | ) | $ | 20 | $ | (19,606 | ) | |||||||||||||||||
| SEK | 15,600 | 8/30/24 | 3 Month STIBOR | (0.165)% | Quarterly/Annual | (41,890 | ) | –0 | – | (41,890 | ) | |||||||||||||||||||
| USD | 130 | 9/27/29 | 1.593% | 3 Month LIBOR | Semi-Annual/Quarterly | 3,091 | –0 | – | 3,091 | |||||||||||||||||||||
| JPY | 142,860 | 12/13/29 | 6 Month LIBOR | 0.080% | Semi-Annual/ Semi-Annual | (5,593 | ) | –0 | – | (5,593 | ) | |||||||||||||||||||
| USD | 250 | 12/13/29 | 1.764% | 3 Month LIBOR | Semi-Annual/ Quarterly | 3,293 | –0 | – | 3,293 | |||||||||||||||||||||
|
|
|
|
|
| |||||||||||||||||||||||||
| $ | (60,685 | ) | $ | 20 | $ | (60,705 | ) | |||||||||||||||||||||||
|
|
|
|
|
| |||||||||||||||||||||||||
CREDIT DEFAULT SWAPS (see Note D)
| Swap Counterparty & Referenced Obligation | Fixed Rate (Pay) Receive | Payment Frequency | Implied Credit Spread at December 31, 2019 | Notional Amount (000) | Market Value | Upfront Premiums Paid (Received) | Unrealized Appreciation/ (Depreciation) | |||||||||||||||||||||||||
Sale Contracts | ||||||||||||||||||||||||||||||||
Citigroup Global Markets, Inc. | ||||||||||||||||||||||||||||||||
CDX-CMBX.NA.BB | 5.00 | % | Monthly | 9.98 | % | USD | 166 | $ | (18,630 | ) | $ | (26,751 | ) | $ | 8,121 | |||||||||||||||||
CDX-CMBX.NA.BB | 5.00 | Monthly | 9.98 | USD | 19 | (2,133 | ) | (3,082 | ) | 949 | ||||||||||||||||||||||
CDX-CMBX.NA.BB | 5.00 | Monthly | 9.98 | USD | 2 | (224 | ) | (321 | ) | 97 | ||||||||||||||||||||||
CDX-CMBX.NA.BB | 5.00 | Monthly | 9.98 | USD | 3 | (337 | ) | (480 | ) | 143 | ||||||||||||||||||||||
CDX-CMBX.NA.BB | 5.00 |
| Monthly |
| 9.98 | USD | 38 | (4,265 | ) | (5,938 | ) | 1,673 | ||||||||||||||||||||
CDX-CMBX.NA.BB | 5.00 | Monthly | 9.98 | USD | 19 | (2,132 | ) | (2,934 | ) | 802 | ||||||||||||||||||||||
CDX-CMBX.NA.BBB- | 3.00 | Monthly | 5.13 | USD | 22 | (1,113 | ) | (2,790 | ) | 1,677 | ||||||||||||||||||||||
CDX-CMBX.NA.BBB- | 3.00 | Monthly | 5.13 | USD | 37 | (1,873 | ) | (4,234 | ) | 2,361 | ||||||||||||||||||||||
CDX-CMBX.NA.BBB- | 3.00 | Monthly | 5.13 | USD | 54 | (2,733 | ) | (6,179 | ) | 3,446 | ||||||||||||||||||||||
CDX-CMBX.NA.BBB- | 3.00 | Monthly | 5.13 | USD | 73 | (3,694 | ) | (8,168 | ) | 4,474 | ||||||||||||||||||||||
CDX-CMBX.NA.BBB- | 3.00 | Monthly | 5.13 | USD | 107 | (5,414 | ) | (11,973 | ) | 6,559 | ||||||||||||||||||||||
CDX-CMBX.NA.BBB- | 3.00 | Monthly | 5.13 | USD | 73 | (3,694 | ) | (8,008 | ) | 4,314 | ||||||||||||||||||||||
CDX-CMBX.NA.BBB- | 3.00 | Monthly | 5.13 | USD | 91 | (4,604 | ) | (9,749 | ) | 5,145 | ||||||||||||||||||||||
18
| AB Variable Products Series Fund | ||
| Swap Counterparty & Referenced Obligation | Fixed Rate (Pay) Receive | Payment Frequency | Implied Credit Spread at December 31, 2019 | Notional Amount (000) | Market Value | Upfront Premiums Paid (Received) | Unrealized Appreciation/ (Depreciation) | |||||||||||||||||||||||||
Sale Contracts (continued) | ||||||||||||||||||||||||||||||||
CDX-CMBX.NA.BBB- | 3.00 | % | Monthly | 5.13 | % | USD | 78 | $ | (3,947 | ) | $ | (8,399 | ) | $ | 4,452 | |||||||||||||||||
CDX-CMBX.NA.BBB- | 3.00 | Monthly | 5.13 | USD | 29 | (1,468 | ) | (3,119 | ) | 1,651 | ||||||||||||||||||||||
CDX-CMBX.NA.BBB- | 3.00 | Monthly | 5.13 | USD | 44 | (2,227 | ) | (5,580 | ) | 3,353 | ||||||||||||||||||||||
CDX-CMBX.NA.BBB- | 3.00 | Monthly | 5.13 | USD | 62 | (3,137 | ) | (7,862 | ) | 4,725 | ||||||||||||||||||||||
CDX-CMBX.NA.BBB- | 3.00 | Monthly | 5.13 | USD | 44 | (2,226 | ) | (5,763 | ) | 3,537 | ||||||||||||||||||||||
CDX-CMBX.NA.BBB- | 3.00 | Monthly | 5.13 | USD | 5 | (253 | ) | (644 | ) | 391 | ||||||||||||||||||||||
CDX-CMBX.NA.BBB- | 3.00 | Monthly | 5.13 | USD | 47 | (2,382 | ) | (5,665 | ) | 3,283 | ||||||||||||||||||||||
CDX-CMBX.NA.BBB- | 3.00 | Monthly | 5.13 | USD | 14 | (709 | ) | (1,687 | ) | 978 | ||||||||||||||||||||||
CDX-CMBX.NA.BBB- | 3.00 | Monthly | 5.13 | USD | 32 | (1,619 | ) | (4,242 | ) | 2,623 | ||||||||||||||||||||||
CDX-CMBX.NA.BBB- | 3.00 | Monthly | 5.13 | USD | 60 | (3,036 | ) | (8,142 | ) | 5,106 | ||||||||||||||||||||||
CDX-CMBX.NA.BBB- | 3.00 | Monthly | 5.13 | USD | 31 | (1,566 | ) | (4,757 | ) | 3,191 | ||||||||||||||||||||||
CDX-CMBX.NA.BBB- | 3.00 | Monthly | 5.13 | USD | 5 | (253 | ) | (805 | ) | 552 | ||||||||||||||||||||||
CDX-CMBX.NA.BBB- | 3.00 | Monthly | 5.13 | USD | 52 | (2,627 | ) | (7,746 | ) | 5,119 | ||||||||||||||||||||||
Credit Suisse International |
| |||||||||||||||||||||||||||||||
CDX-CMBX.NA.BBB- | 3.00 | Monthly | 5.13 | USD | 28 | (1,417 | ) | (1,935 | ) | 518 | ||||||||||||||||||||||
CDX-CMBX.NA.BBB- | 3.00 | Monthly | 5.13 | USD | 318 | (16,101 | ) | (13,003 | ) | (3,098 | ) | |||||||||||||||||||||
CDX-CMBX.NA.BBB- | 3.00 | Monthly | 5.13 | USD | 350 | (17,710 | ) | (20,245 | ) | 2,535 | ||||||||||||||||||||||
CDX-CMBX.NA.BBB- | 3.00 | Monthly | 5.13 | USD | 56 | (2,828 | ) | (8,303 | ) | 5,475 | ||||||||||||||||||||||
CDX-CMBX.NA.BBB- | 3.00 | Monthly | 5.13 | USD | 94 | (4,757 | ) | (6,078 | ) | 1,321 | ||||||||||||||||||||||
Deutsche Bank AG |
| |||||||||||||||||||||||||||||||
CDX-CMBX.NA.A | 2.00 | Monthly | 1.41 | USD | 135 | 2,138 | (2,639 | ) | 4,777 | |||||||||||||||||||||||
CDX-CMBX.NA.BBB- | 3.00 | Monthly | 5.13 | USD | 132 | (6,679 | ) | (9,246 | ) | 2,567 | ||||||||||||||||||||||
CDX-CMBX.NA.BBB- | 3.00 | Monthly | 5.13 | USD | 85 | (4,301 | ) | (6,988 | ) | 2,687 | ||||||||||||||||||||||
CDX-CMBX.NA.BBB- | 3.00 | Monthly | 5.13 | USD | 8 | (405 | ) | (937 | ) | 532 | ||||||||||||||||||||||
CDX-CMBX.NA.BBB- | 3.00 | Monthly | 5.13 | USD | 51 | (2,580 | ) | (6,423 | ) | 3,843 | ||||||||||||||||||||||
CDX-CMBX.NA.BBB- | 3.00 | Monthly | 5.13 | USD | 28 | (1,417 | ) | (3,201 | ) | 1,784 | ||||||||||||||||||||||
19
| INTERMEDIATE BOND PORTFOLIO | ||
| PORTFOLIO OF INVESTMENTS | ||
| (continued) | AB Variable Products Series Fund | |
| Swap Counterparty & Referenced Obligation | Fixed Rate (Pay) Receive | Payment Frequency | Implied Credit Spread at December 31, 2019 | Notional Amount (000) | Market Value | Upfront Premiums Paid (Received) | Unrealized Appreciation/ (Depreciation) | |||||||||||||||||||||||||
Sale Contracts (continued) | ||||||||||||||||||||||||||||||||
CDX-CMBX.NA.BBB- Series 6, 5/11/63* | 3.00 | % | Monthly | 5.13 | % | USD | 27 | $ | (1,367 | ) | $ | (3,086 | ) | $ | 1,719 | |||||||||||||||||
CDX-CMBX.NA.BBB- Series 6, 5/11/63* | 3.00 | Monthly | 5.13 | USD | 84 | (4,251 | ) | (9,045 | ) | 4,794 | ||||||||||||||||||||||
CDX-CMBX.NA.BBB- Series 6, 5/11/63* | 3.00 | Monthly | 5.13 | USD | 8 | (405 | ) | (459 | ) | 54 | ||||||||||||||||||||||
Goldman Sachs International |
| |||||||||||||||||||||||||||||||
CDX-CMBX.NA.BBB- Series 6, 5/11/63* | 3.00 | Monthly | 5.13 | USD | 92 | (4,655 | ) | (12,191 | ) | 7,536 | ||||||||||||||||||||||
CDX-CMBX.NA.BBB- Series 6, 5/11/63* | 3.00 | Monthly | 5.13 | USD | 14 | (708 | ) | (1,794 | ) | 1,086 | ||||||||||||||||||||||
CDX-CMBX.NA.BBB- Series 6, 5/11/63* | 3.00 | Monthly | 5.13 | USD | 246 | (12,447 | ) | (12,024 | ) | (423 | ) | |||||||||||||||||||||
CDX-CMBX.NA.BBB- Series 6, 5/11/63* | 3.00 | Monthly | 5.13 | USD | 49 | (2,479 | ) | (4,232 | ) | 1,753 | ||||||||||||||||||||||
CDX-CMBX.NA.BBB- Series 6, 5/11/63* | 3.00 | Monthly | 5.13 | USD | 4 | (202 | ) | (358 | ) | 156 | ||||||||||||||||||||||
CDX-CMBX.NA.BBB- Series 6, 5/11/63* | 3.00 | Monthly | 5.13 | USD | 8 | (405 | ) | (730 | ) | 325 | ||||||||||||||||||||||
CDX-CMBX.NA.BBB- Series 6, 5/11/63* | 3.00 | Monthly | 5.13 | USD | 8 | (405 | ) | (790 | ) | 385 | ||||||||||||||||||||||
CDX-CMBX.NA.BBB- Series 6, 5/11/63* | 3.00 | Monthly | 5.13 | USD | 16 | (809 | ) | (1,726 | ) | 917 | ||||||||||||||||||||||
CDX-CMBX.NA.BBB- Series 6, 5/11/63* | 3.00 | Monthly | 5.13 | USD | 41 | (2,075 | ) | (5,577 | ) | 3,502 | ||||||||||||||||||||||
CDX-CMBX.NA.BBB- Series 6, 5/11/63* | 3.00 | Monthly | 5.13 | USD | 57 | (2,885 | ) | (6,070 | ) | 3,185 | ||||||||||||||||||||||
CDX-CMBX.NA.BBB- Series 6, 5/11/63* | 3.00 | Monthly | 5.13 | USD | 34 | (1,718 | ) | (5,224 | ) | 3,506 | ||||||||||||||||||||||
CDX-CMBX.NA.BBB- Series 6, 5/11/63* | 3.00 | Monthly | 5.13 | USD | 28 | (1,414 | ) | (4,574 | ) | 3,160 | ||||||||||||||||||||||
CDX-CMBX.NA.BBB- Series 6, 5/11/63* | 3.00 | Monthly | 5.13 | USD | 39 | (1,970 | ) | (6,463 | ) | 4,493 | ||||||||||||||||||||||
CDX-CMBX.NA.BBB- Series 6, 5/11/63* | 3.00 | Monthly | 5.13 | USD | 4 | (202 | ) | (607 | ) | 405 | ||||||||||||||||||||||
JPMorgan Securities, LLC |
| |||||||||||||||||||||||||||||||
CDX-CMBX.NA.BBB- Series 6, 5/11/63* | 3.00 | Monthly | 5.13 | USD | 51 | (2,576 | ) | (6,251 | ) | 3,675 | ||||||||||||||||||||||
CDX-CMBX.NA.BBB- Series 6, 5/11/63* | 3.00 | Monthly | 5.13 | USD | 18 | (909 | ) | (2,226 | ) | 1,317 | ||||||||||||||||||||||
CDX-CMBX.NA.BBB- Series 6, 5/11/63* | 3.00 | Monthly | 5.13 | USD | 9 | (455 | ) | (1,148 | ) | 693 | ||||||||||||||||||||||
Morgan Stanley Capital Services LLC | ||||||||||||||||||||||||||||||||
CDX-CMBX.NA.BBB- Series 6, 5/11/63* | 3.00 | Monthly | 5.13 | USD | 35 | (1,771 | ) | (2,467 | ) | 696 | ||||||||||||||||||||||
|
|
|
|
|
| |||||||||||||||||||||||||||
| $ | (176,461 | ) | $ | (321,058 | ) | $ | 144,597 | |||||||||||||||||||||||||
|
|
|
|
|
| |||||||||||||||||||||||||||
| * | Termination date |
20
| AB Variable Products Series Fund | ||
| (a) | Security is exempt from registration under Rule 144A of the Securities Act of 1933. These securities are considered restricted, but liquid and may be resold in transactions exempt from registration, normally to qualified institutional buyers. At December 31, 2019, the aggregate market value of these securities amounted to $8,625,270 or 19.4% of net assets. |
| (b) | Securities are perpetual and, thus, do not have a predetermined maturity date. The date shown, if applicable, reflects the next call date. |
| (c) | IO—Interest Only. |
| (d) | Floating Rate Security. Stated interest/floor/ceiling rate was in effect at December 31, 2019. |
| (e) | Security is exempt from registration under Rule 144A of the Securities Act of 1933. These securities, which represent 0.85% of net assets as of December 31, 2019, are considered illiquid and restricted. Additional information regarding such securities follows: |
| 144A/Restricted & Illiquid Securities | Acquisition Date | Cost | Market Value | Percentage of Net Assets | ||||||||||||
PMT Credit Risk Transfer Trust Series2019-1R, Class A | 3/21/19 | $ | 90,584 | $ | 90,501 | 0.20 | % | |||||||||
PMT Credit Risk Transfer Trust Series2019-2R, Class A | 6/07/19 | 113,476 | 114,184 | 0.26 | % | |||||||||||
PMT Credit Risk Transfer Trust Series2019-3R, Class A | 10/11/19 | 94,622 | 95,064 | 0.21 | % | |||||||||||
Terraform Global Operating LLC | 2/08/18 | 21,000 | 21,837 | 0.05 | % | |||||||||||
Wells Fargo Credit Risk Transfer Securities Trust Series2015-WF1, Class 1M2 | 9/28/15 | 36,964 | 41,479 | 0.09 | % | |||||||||||
Wells Fargo Credit Risk Transfer Securities Trust Series2015-WF1, Class 2M2 | 9/28/15 | 17,310 | 19,674 | 0.04 | % | |||||||||||
| (f) | Inverse interest only security. |
| (g) | Affiliated investments. |
| (h) | To obtain a copy of the fund’s shareholder report, please go to the Securities and Exchange Commission’s website at www.sec.gov, or call AB at (800)227-4618. |
| (i) | The rate shown represents the7-day yield as of period end. |
Currency Abbreviations:
BRL—Brazilian Real
CAD—Canadian Dollar
EUR—Euro
GBP—Great British Pound
JPY—Japanese Yen
MYR—Malaysian Ringgit
NZD—New Zealand Dollar
PLN—Polish Zloty
RUB—Russian Ruble
SEK—Swedish Krona
USD—United States Dollar
ZAR—South African Rand
Glossary:
ABS—Asset-Backed Securities
CBT—Chicago Board of Trade
CDOR—Canadian Dealer Offered Rate
CDX-CMBX.NA—North American Commercial Mortgage-Backed Index
21
| INTERMEDIATE BOND PORTFOLIO | ||
| PORTFOLIO OF INVESTMENTS | ||
| (continued) | AB Variable Products Series Fund | |
CDX-NAIG—North American Investment Grade Credit Default Swap Index
CMBS—Commercial Mortgage-Backed Securities
CPI—Consumer Price Index
LIBOR—London Interbank Offered Rates
REIT—Real Estate Investment Trust
REMICs—Real Estate Mortgage Investment Conduits
STIBOR—Stockholm Interbank Offered Rate
TBA—To Be Announced
TIPS—Treasury Inflation Protected Security
See notes to financial statements.
22
| INTERMEDIATE BOND PORTFOLIO | ||
| STATEMENT OF ASSETS & LIABILITIES | ||
| December 31, 2019 | AB Variable Products Series Fund | |
ASSETS |
| |||||||
Investments in securities, at value |
| |||||||
Unaffiliated issuers (cost $43,209,535) | $ | 44,472,200 | ||||||
Affiliated issuers (cost $263,950) | 263,950 | |||||||
Cash collateral due from broker | 152,786 | |||||||
Foreign currencies, at value (cost $20) | 20 | |||||||
Interest receivable | 245,731 | |||||||
Unrealized appreciation on forward currency exchange contracts | 21,595 | |||||||
Receivable for capital stock sold | 20,616 | |||||||
Market value on credit default swaps (net premiums received $2,639) | 2,138 | |||||||
Receivable for variation margin on centrally cleared swaps | 1,527 | |||||||
Receivable for investment securities sold | 1,346 | |||||||
Affiliated dividends receivable | 368 | |||||||
|
| |||||||
Total assets | 45,182,277 | |||||||
|
| |||||||
LIABILITIES |
| |||||||
Due to custodian | 608 | |||||||
Payable for investment securities purchased | 384,609 | |||||||
Market value on credit default swaps (net premiums received $318,419) | 178,599 | |||||||
Audit and tax fee payable | 78,304 | |||||||
Unrealized depreciation on forward currency exchange contracts | 37,842 | |||||||
Administrative fee payable | 21,941 | |||||||
Payable for variation margin on futures | 17,533 | |||||||
Advisory fee payable | 16,425 | |||||||
Distribution fee payable | 2,403 | |||||||
Payable for capital stock redeemed | 2,364 | |||||||
Transfer Agent fee payable | 132 | |||||||
Accrued expenses and other liabilities | 26,393 | |||||||
|
| |||||||
Total liabilities | 767,153 | |||||||
|
| |||||||
NET ASSETS | $ | 44,415,124 | ||||||
|
| |||||||
COMPOSITION OF NET ASSETS |
| |||||||
Capital stock, at par | $ | 4,150 | ||||||
Additionalpaid-in capital | 41,976,825 | |||||||
Distributable earnings | 2,434,149 | |||||||
|
| |||||||
| $ | 44,415,124 | |||||||
|
| |||||||
Net Asset Value Per Share—1 billion shares of capital stock authorized, $.001 par value
| Class | Net Assets | Shares Outstanding | Net Asset Value | |||||||||
| A | $ | 32,763,038 | 3,052,919 | $ | 10.73 | |||||||
| B | $ | 11,652,086 | 1,097,383 | $ | 10.62 | |||||||
See notes to financial statements.
23
| INTERMEDIATE BOND PORTFOLIO | ||
| STATEMENT OF OPERATIONS | ||
| Year Ended December 31, 2019 | AB Variable Products Series Fund | |
INVESTMENT INCOME | ||||
Interest | $ | 1,670,108 | ||
Dividends | ||||
Unaffiliated issuers | 12,575 | |||
Affiliated issuers | 11,146 | |||
|
| |||
| 1,693,829 | ||||
|
| |||
EXPENSES | ||||
Advisory fee (see Note B) | 203,678 | |||
Distribution fee—Class B | 29,987 | |||
Transfer agency—Class A | 3,506 | |||
Transfer agency—Class B | 1,265 | |||
Custodian | 118,441 | |||
Audit and tax | 81,365 | |||
Administrative | 80,075 | |||
Legal | 32,261 | |||
Directors’ fees | 22,925 | |||
Printing | 21,794 | |||
Miscellaneous | 7,444 | |||
|
| |||
Total expenses | 602,741 | |||
Less: expenses waived and reimbursed by the Adviser (see Note B) | (500 | ) | ||
|
| |||
Net expenses | 602,241 | |||
|
| |||
Net investment income | 1,091,588 | |||
|
| |||
REALIZED AND UNREALIZED GAIN (LOSS) ON INVESTMENT AND FOREIGN CURRENCY TRANSACTIONS | ||||
Net realized gain (loss) on: | ||||
Investment transactions | 561,577 | |||
Forward currency exchange contracts | (39,263 | ) | ||
Futures | 90,898 | |||
Swaps | (2,910 | ) | ||
Foreign currency transactions | 917 | |||
Net change in unrealized appreciation/depreciation of: | ||||
Investments | 1,754,114 | |||
Forward currency exchange contracts | 48,350 | |||
Futures | (129,452 | ) | ||
Swaps | 199,398 | |||
Foreign currency denominated assets and liabilities | (4,153 | ) | ||
|
| |||
Net gain on investment and foreign currency transactions | 2,479,476 | |||
|
| |||
Contributions from Affiliates (see Note B) | 355 | |||
|
| |||
NET INCREASE IN NET ASSETS FROM OPERATIONS | $ | 3,571,419 | ||
|
|
See notes to financial statements.
24
| INTERMEDIATE BOND PORTFOLIO | ||
| STATEMENT OF CHANGES IN NET ASSETS | AB Variable Products Series Fund | |
| Year Ended December 31, 2019 | Year Ended December 31, 2018 | |||||||
INCREASE (DECREASE) IN NET ASSETS FROM OPERATIONS |
| |||||||
Net investment income | $ | 1,091,588 | $ | 1,040,060 | ||||
Net realized gain (loss) on investment and foreign currency transactions | 611,219 | (464,207 | ) | |||||
Net change in unrealized appreciation/depreciation of investments and foreign currency denominated assets and liabilities | 1,868,257 | (1,067,366 | ) | |||||
Contributions from Affiliates (see Note B) | 355 | –0 | – | |||||
|
|
|
| |||||
Net increase (decrease) in net assets from operations | 3,571,419 | (491,513 | ) | |||||
Distributions to Shareholders |
| |||||||
Class A | (961,173 | ) | (921,149 | ) | ||||
Class B | (324,304 | ) | (318,391 | ) | ||||
CAPITAL STOCK TRANSACTIONS |
| |||||||
Net decrease | (3,191,422 | ) | (5,906,625 | ) | ||||
|
|
|
| |||||
Total decrease | (905,480 | ) | (7,637,678 | ) | ||||
NET ASSETS |
| |||||||
Beginning of period | 45,320,604 | 52,958,282 | ||||||
|
|
|
| |||||
End of period | $ | 44,415,124 | $ | 45,320,604 | ||||
|
|
|
| |||||
See notes to financial statements.
25
| INTERMEDIATE BOND PORTFOLIO | ||
| NOTES TO FINANCIAL STATEMENTS | ||
| December 31, 2019 | AB Variable Products Series Fund | |
NOTE A: Significant Accounting Policies
The AB Intermediate Bond Portfolio (the “Portfolio”), is a series of AB Variable Products Series Fund, Inc. (the “Fund”). The Portfolio’s investment objective is to generate income and price appreciation without assuming what AllianceBernstein L.P. (the “Adviser”) considers undue risk. The Portfolio is diversified as defined under the Investment Company Act of 1940. The Fund was incorporated in the State of Maryland on November 17, 1987, as anopen-end series investment company. The Fund offers eleven separately managed pools of assets which have differing investment objectives and policies. The Portfolio offers Class A and Class B shares. Both classes of shares have identical voting, dividend, liquidating and other rights, except that Class B shares bear a distribution expense and have exclusive voting rights with respect to the Class B distribution plan.
The Portfolio offers and sells its shares only to separate accounts of certain life insurance companies for the purpose of funding variable annuity contracts and variable life insurance policies. Sales are made without a sales charge at the Portfolio’s net asset value per share.
The financial statements have been prepared in conformity with U.S. generally accepted accounting principles (“U.S. GAAP”) which require management to make certain estimates and assumptions that affect the reported amounts of assets and liabilities in the financial statements and amounts of income and expenses during the reporting period. Actual results could differ from those estimates. The Portfolio is an investment company under U.S. GAAP and follows the accounting and reporting guidance applicable to investment companies. The following is a summary of significant accounting policies followed by the Portfolio.
1. Security Valuation
Portfolio securities are valued at their current market value determined on the basis of market quotations or, if market quotations are not readily available or are deemed unreliable, at “fair value” as determined in accordance with procedures established by and under the general supervision of the Fund’s Board of Directors (the “Board”).
In general, the market values of securities which are readily available and deemed reliable are determined as follows: securities listed on a national securities exchange (other than securities listed on the NASDAQ Stock Market, Inc. (“NASDAQ”)) or on a foreign securities exchange are valued at the last sale price at the close of the exchange or foreign securities exchange. If there has been no sale on such day, the securities are valued at the last traded price from the previous day. Securities listed on more than one exchange are valued by reference to the principal exchange on which the securities are traded; securities listed only on NASDAQ are valued in accordance with the NASDAQ Official Closing Price; listed or over the counter (“OTC”) market put or call options are valued at the mid level between the current bid and ask prices. If either a current bid or current ask price is unavailable, the Adviser will have discretion to determine the best valuation (e.g., last trade price in the case of listed options); open futures are valued using the closing settlement price or, in the absence of such a price, the most recent quoted bid price. If there are no quotations available for the day of valuation, the last available closing settlement price is used; U.S. Government securities and any other debt instruments having 60 days or less remaining until maturity are generally valued at market by an independent pricing vendor, if a market price is available. If a market price is not available, the securities are valued at amortized cost. This methodology is commonly used for short term securities that have an original maturity of 60 days or less, as well as short term securities that had an original term to maturity that exceeded 60 days. In instances when amortized cost is utilized, the Valuation Committee (the “Committee”) must reasonably conclude that the utilization of amortized cost is approximately the same as the fair value of the security. Such factors the Committee will consider include, but are not limited to, an impairment of the creditworthiness of the issuer or material changes in interest rates. Fixed-income securities, including mortgage-backed and asset-backed securities, may be valued on the basis of prices provided by a pricing service or at a price obtained from one or more of the major broker-dealers. In cases where broker-dealer quotes are obtained, the Adviser may establish procedures whereby changes in market yields or spreads are used to adjust, on a daily basis, a recently obtained quoted price on a security. Swaps and other derivatives are valued daily, primarily using independent pricing services, independent pricing models using market inputs, as well as third party broker-dealers or counterparties. Open end mutual funds are valued at the closing net asset value per share, while exchange traded funds are valued at the closing market price per share.
Securities for which market quotations are not readily available (including restricted securities) or are deemed unreliable are valued at fair value as deemed appropriate by the Adviser. Factors considered in making this determination may include, but are not limited to, information obtained by contacting the issuer, analysts, analysis of the issuer’s financial statements or other available documents. In addition, the Portfolio may use fair value pricing for securities primarily traded innon-U.S.
26
| AB Variable Products Series Fund | ||
markets because most foreign markets close well before the Portfolio values its securities at 4:00 p.m., Eastern Time. The earlier close of these foreign markets gives rise to the possibility that significant events, including broad market moves, may have occurred in the interim and may materially affect the value of those securities. To account for this, the Portfolio generally values many of its foreign equity securities using fair value prices based on third party vendor modeling tools to the extent available.
2. Fair Value Measurements
In accordance with U.S. GAAP regarding fair value measurements, fair value is defined as the price that the Portfolio would receive to sell an asset or pay to transfer a liability in an orderly transaction between market participants at the measurement date. U.S. GAAP establishes a framework for measuring fair value, and a three-level hierarchy for fair value measurements based upon the transparency of inputs to the valuation of an asset or liability (including those valued based on their market values as described in Note A.1 above). Inputs may be observable or unobservable and refer broadly to the assumptions that market participants would use in pricing the asset or liability. Observable inputs reflect the assumptions market participants would use in pricing the asset or liability based on market data obtained from sources independent of the Portfolio. Unobservable inputs reflect the Portfolio’s own assumptions about the assumptions that market participants would use in pricing the asset or liability based on the best information available in the circumstances. Each investment is assigned a level based upon the observability of the inputs which are significant to the overall valuation. The three-tier hierarchy of inputs is summarized below.
| • | Level 1—quoted prices in active markets for identical investments |
| • | Level 2—other significant observable inputs (including quoted prices for similar investments, interest rates, prepayment speeds, credit risk, etc.) |
| • | Level 3—significant unobservable inputs (including the Portfolio’s own assumptions in determining the fair value of investments) |
The fair value of debt instruments, such as bonds, andover-the-counter derivatives is generally based on market price quotations, recently executed market transactions (where observable) or industry recognized modeling techniques and are generally classified as Level 2. Pricing vendor inputs to Level 2 valuations may include quoted prices for similar investments in active markets, interest rate curves, coupon rates, currency rates, yield curves, option adjusted spreads, default rates, credit spreads and other unique security features in order to estimate the relevant cash flows which are then discounted to calculate fair values. If these inputs are unobservable and significant to the fair value, these investments will be classified as Level 3.
Where readily available market prices or relevant bid prices are not available for certain equity investments, such investments may be valued based on similar publicly traded investments, movements in relevant indices since last available prices or based upon underlying company fundamentals and comparable company data (such as multiples to earnings or other multiples to equity). Where an investment is valued using an observable input, such as another publicly traded security, the investment will be classified as Level 2. If management determines that an adjustment is appropriate based on restrictions on resale, illiquidity or uncertainty, and such adjustment is a significant component of the valuation, the investment will be classified as Level 3. An investment will also be classified as Level 3 where management uses company fundamentals and other significant inputs to determine the valuation.
Valuations of mortgage-backed or other asset-backed securities, by pricing vendors, are based on both proprietary and industry recognized models and discounted cash flow techniques. Significant inputs to the valuation of these instruments are value of the collateral, the rates and timing of delinquencies, the rates and timing of prepayments, and default and loss expectations, which are driven in part by housing prices for residential mortgages. Significant inputs are determined based on relative value analyses, which incorporate comparisons to instruments with similar collateral and risk profiles, including relevant indices. Mortgage and asset-backed securities for which management has collected current observable data through pricing services are generally categorized within Level 2. Those investments for which current observable data has not been provided are classified as Level 3.
Other fixed income investments, includingnon-U.S. government and corporate debt, are generally valued using quoted market prices, if available, which are typically impacted by current interest rates, maturity dates and any perceived credit risk of the issuer. Additionally, in the absence of quoted market prices, these inputs are used by pricing vendors to derive a valuation based upon industry or proprietary models which incorporate issuer specific data with relevant yield/spread comparisons with more widely quoted bonds with similar key characteristics. Those investments for which there are observable inputs are classified as Level 2. Where the inputs are not observable, the investments are classified as Level 3.
27
| INTERMEDIATE BOND PORTFOLIO | ||
| NOTES TO FINANCIAL STATEMENTS | ||
| (continued) | AB Variable Products Series Fund | |
The following table summarizes the valuation of the Portfolio’s investments by the above fair value hierarchy levels as of December 31, 2019:
| Level 1 | Level 2 | Level 3 | Total | |||||||||||||
Investments in Securities: | ||||||||||||||||
Assets: | ||||||||||||||||
Corporates—Investment Grade | $ | –0 | – | $ | 12,892,864 | $ | –0 | – | $ | 12,892,864 | ||||||
Mortgage Pass-Throughs | –0 | – | 9,166,305 | –0 | – | 9,166,305 | ||||||||||
Commercial Mortgage-Backed Securities | –0 | – | 5,622,870 | –0 | – | 5,622,870 | ||||||||||
Collateralized Mortgage Obligations | –0 | – | 4,518,138 | –0 | – | 4,518,138 | ||||||||||
Inflation-Linked Securities | –0 | – | 3,615,500 | –0 | – | 3,615,500 | ||||||||||
Governments—Treasuries | –0 | – | 3,322,866 | –0 | – | 3,322,866 | ||||||||||
Asset-Backed Securities | –0 | – | 2,459,800 | –0 | – | 2,459,800 | ||||||||||
Corporates—Non-Investment Grade | –0 | – | 1,128,558 | –0 | – | 1,128,558 | ||||||||||
Emerging Markets—Treasuries | –0 | – | 341,008 | –0 | – | 341,008 | ||||||||||
Local Governments—US Municipal Bonds | –0 | – | 320,246 | –0 | – | 320,246 | ||||||||||
Preferred Stocks | –0 | – | 97,883 | –0 | – | 97,883 | ||||||||||
Quasi-Sovereigns | –0 | – | 68,626 | –0 | – | 68,626 | ||||||||||
Emerging Markets—Corporate Bonds | –0 | – | 21,837 | –0 | – | 21,837 | ||||||||||
Short-Term Investments: | ||||||||||||||||
Governments—Treasuries | –0 | – | 895,699 | –0 | – | 895,699 | ||||||||||
Investment Companies | 263,950 | –0 | – | –0 | – | 263,950 | ||||||||||
|
|
|
|
|
|
|
| |||||||||
Total Investments in Securities | 263,950 | 44,472,200 | –0 | – | 44,736,150 | |||||||||||
Other Financial Instruments(a): | ||||||||||||||||
Assets: | ||||||||||||||||
Futures | 6,373 | –0 | – | –0 | – | 6,373 | (b) | |||||||||
Forward Currency Exchange Contracts | –0 | – | 21,595 | –0 | – | 21,595 | ||||||||||
Centrally Cleared Interest Rate Swaps | –0 | – | 6,384 | –0 | – | 6,384 | (b) | |||||||||
Credit Default Swaps | –0 | – | 2,138 | –0 | – | 2,138 | ||||||||||
Liabilities: | ||||||||||||||||
Futures | (73,076 | ) | –0 | – | –0 | – | (73,076 | )(b) | ||||||||
Forward Currency Exchange Contracts | –0 | – | (37,842 | ) | –0 | – | (37,842 | ) | ||||||||
Centrally Cleared Credit Default Swaps | –0 | – | (20,081 | ) | –0 | – | (20,081 | )(b) | ||||||||
Centrally Cleared Interest Rate Swaps | –0 | – | (67,069 | ) | –0 | – | (67,069 | )(b) | ||||||||
Credit Default Swaps | –0 | – | (178,599 | ) | –0 | – | (178,599 | ) | ||||||||
|
|
|
|
|
|
|
| |||||||||
Total | $ | 197,247 | $ | 44,198,726 | $ | –0 | – | $ | 44,395,973 | (c) | ||||||
|
|
|
|
|
|
|
| |||||||||
| (a) | Other financial instruments are derivative instruments, such as futures, forwards and swaps, which are valued at the unrealized appreciation/(depreciation) on the instrument. Other financial instruments may also include swaps with upfront premiums, options written and swaptions written which are valued at market value. |
| (b) | Only variation margin receivable/(payable) at period end is reported within the statement of assets and liabilities. This amount reflects cumulative unrealized appreciation/(depreciation) on futures and centrally cleared swaps as reported in the portfolio of investments. Where applicable, centrally cleared swaps with upfront premiums are presented here at market value. |
| (c) | Amounts of $1,128,669, $46,888 and $712,881 for Asset-Backed Securities, Collateralized Mortgage Obligations and Commercial Mortgage-Backed Securities, respectively, were transferred out of Level 3 into Level 2 as improved transparency of price inputs received from pricing vendors has increased the observability during the reporting period. |
3. Currency Translation
Assets and liabilities denominated in foreign currencies and commitments under forward currency exchange contracts are translated into U.S. dollars at the mean of the quoted bid and ask prices of such currencies against the U.S. dollar. Purchases and sales of portfolio securities are translated into U.S. dollars at the rates of exchange prevailing when such securities were acquired or sold. Income and expenses are translated into U.S. dollars at rates of exchange prevailing when accrued.
Net realized gain or loss on foreign currency transactions represents foreign exchange gains and losses from sales and maturities of foreign fixed income investments, holding of foreign currencies, currency gains or losses realized between the trade
28
| AB Variable Products Series Fund | ||
and settlement dates on foreign investment transactions, and the difference between the amounts of dividends, interest and foreign withholding taxes recorded on the Portfolio’s books and the U.S. dollar equivalent amounts actually received or paid. Net unrealized currency gains and losses from valuing foreign currency denominated assets and liabilities at period end exchange rates are reflected as a component of net unrealized appreciation or depreciation of foreign currency denominated assets and liabilities.
4. Taxes
It is the Portfolio’s policy to meet the requirements of the Internal Revenue Code applicable to regulated investment companies and to distribute all of its investment company taxable income and net realized gains, if any, to shareholders. Therefore, no provisions for federal income or excise taxes are required. The Portfolio may be subject to taxes imposed by countries in which it invests. Such taxes are generally based on income and/or capital gains earned or repatriated. Taxes are accrued and applied to net investment income, net realized gains and net unrealized appreciation/depreciation as such income and/or gains are earned.
In accordance with U.S. GAAP requirements regarding accounting for uncertainties in income taxes, management has analyzed the Portfolio’s tax positions taken or expected to be taken on federal and state income tax returns for all open tax years (the current and the prior three tax years) and has concluded that no provision for income tax is required in the Portfolio’s financial statements.
5. Investment Income and Investment Transactions
Dividend income is recorded on theex-dividend date or as soon as the Portfolio is informed of the dividend. Interest income is accrued daily. Investment transactions are accounted for on the date the securities are purchased or sold. Investment gains or losses are determined on the identified cost basis. The Portfolio amortizes premiums and accretes discounts as adjustments to interest income.
6. Class Allocations
All income earned and expenses incurred by the Portfolio are borne on apro-rata basis by each outstanding class of shares, based on the proportionate interest in the Portfolio represented by the net assets of such class, except for class specific expenses which are allocated to the respective class. Expenses of the Fund are charged proportionately to each portfolio or based on other appropriate methods. Realized and unrealized gains and losses are allocated among the various share classes based on respective net assets.
7. Dividends and Distributions
Dividends and distributions to shareholders, if any, are recorded on theex-dividend date. Income dividends and capital gains distributions are determined in accordance with federal tax regulations and may differ from those determined in accordance with U.S. GAAP. To the extent these differences are permanent, such amounts are reclassified within the capital accounts based on their federal tax basis treatment; temporary differences do not require such reclassification.
NOTE B: Advisory Fee and Other Transactions with Affiliates
Under the terms of the investment advisory agreement, the Portfolio pays the Adviser an advisory fee at an annual rate of .45% of the first $2.5 billion, .40% of the next $2.5 billion up to $5 billion, .35% of the excess over $5 billion up to $8 billion and .30% in excess of $8 billion, of the Portfolio’s average daily net assets. Effective January 30, 2018, the investment advisory agreement was amended to implement the final advisory fee breakpoint for assets in excess of $8 billion of the Portfolio’s average daily net assets. The fee is accrued daily and paid monthly.
Pursuant to the investment advisory agreement, the Portfolio may reimburse the Adviser for certain legal and accounting services provided to the Portfolio by the Adviser. For the year ended December 31, 2019, the reimbursement for such services amounted to $80,075.
The Portfolio compensates AllianceBernstein Investor Services, Inc. (“ABIS”), a wholly-owned subsidiary of the Adviser, under a Transfer Agency Agreement for providing personnel and facilities to perform transfer agency services for the Portfolio. Such compensation retained by ABIS amounted to $1,491 for the year ended December 31, 2019.
The Portfolio may invest in AB Government Money Market Portfolio (the “Government Money Market Portfolio”) which has a contractual annual advisory fee rate of .20% of the portfolio’s average daily net assets and bears its own expenses. The Adviser has contractually agreed to waive .10% of the advisory fee of Government Money Market Portfolio (resulting in a net advisory fee of .10%) until August 31, 2020. In connection with the investment by the Portfolio in Government Money
29
| INTERMEDIATE BOND PORTFOLIO | ||
| NOTES TO FINANCIAL STATEMENTS | ||
| (continued) | AB Variable Products Series Fund | |
Market Portfolio, the Adviser has contractually agreed to waive its advisory fee from the Portfolio in an amount equal to the Portfolio’s pro rata share of the effective advisory fee of Government Money Market Portfolio, as borne indirectly by the Portfolio as an acquired fund fee and expense. For the year ended December 31, 2019, such waiver amounted to $500.
A summary of the Portfolio’s transactions in AB mutual funds for the year ended December 31, 2019 is as follows:
Fund | Market Value 12/31/18 (000) | Purchases at Cost (000) | Sales Proceeds (000) | Market Value 12/31/19 (000) | Dividend Income (000) | |||||||||||||||
Government Money Market Portfolio | $ | 938 | $ | 18,976 | $ | 19,650 | $ | 264 | $ | 11 | ||||||||||
During the year ended December 31, 2019, the Adviser reimbursed the Portfolio $355 for trading losses incurred due to a trade entry error.
During the second quarter of 2018, AXA S.A. (“AXA”), a French holding company for the AXA Group, a worldwide leader in life, property and casualty and health insurance and asset management, completed the sale of a minority stake in its subsidiary, AXA Equitable Holdings, Inc. (now named Equitable Holdings, Inc.)(“Equitable”), through an initial public offering. Equitable is the holding company for a diverse group of financial services companies, including an approximately 65.3% economic interest in the Adviser and a 100% interest in AllianceBernstein Corporation, the general partner of the Adviser. Since the initial sale, AXA has completed additional offerings, most recently during the fourth quarter of 2019. As a result, AXA currently owns 10.1% of the outstanding shares of common stock of Equitable, and no longer owns a controlling interest in Equitable. AXA previously announced its intention to sell its entire interest in Equitable over time, subject to market conditions and other factors (the “Plan”). Most of AXA’s remaining Equitable shares are to be delivered on redemption of AXA bonds mandatorily exchangeable into Equitable shares and maturing in May 2021. AXA retains sole discretion to determine the timing of any future sales of its remaining shares of Equitable common stock.
The latest transaction under the Plan, which occurred on November 13, 2019, resulted in the indirect transfer of a “controlling block” of voting securities of the Adviser (a “Change of Control Event”) and was deemed an “assignment” causing a termination of the Portfolio’s investment advisory agreement. In order to ensure that investment advisory services could continue uninterrupted in the event of a Change of Control Event, the Board previously approved a new investment advisory agreement with the Adviser, and shareholders of the Portfolio subsequently approved the new investment advisory agreement. This agreement became effective on November 13, 2019.
NOTE C: Distribution Plan
The Portfolio has adopted a Distribution Plan (the “Plan”) for Class B shares pursuant to Rule12b-1 under the Investment Company Act of 1940. Under the Plan, the Portfolio pays distribution and servicing fees to AllianceBernstein Investments, Inc. (the “Distributor”), a wholly-owned subsidiary of the Adviser, at an annual rate of up to .50% of the Portfolio’s average daily net assets attributable to Class B shares. The fees are accrued daily and paid monthly. The Board currently limits payments under the Plan to .25% of the Portfolio’s average daily net assets attributable to Class B shares. The Plan provides that the Distributor will use such payments in their entirety for distribution assistance and promotional activities.
The Portfolio is not obligated under the Plan to pay any distribution and servicing fees in excess of the amounts set forth above. The purpose of the payments to the Distributor under the Plan is to compensate the Distributor for its distribution services with respect to the sale of the Portfolio’s Class B shares. Since the Distributor’s compensation is not directly tied to its expenses, the amount of compensation received by it under the Plan during any year may be more or less than its actual expenses. For this reason, the Plan is characterized by the staff of the Securities and Exchange Commission as being of the “compensation” variety.
In the event that the Plan is terminated or not continued, no distribution or servicing fees (other than current amounts accrued but not yet paid) would be owed by the Portfolio to the Distributor.
The Plan also provides that the Adviser may use its own resources to finance the distribution of the Portfolio’s shares.
30
| AB Variable Products Series Fund | ||
NOTE D: Investment Transactions
Purchases and sales of investment securities (excluding short-term investments) for the year ended December 31, 2019 were as follows:
| Purchases | Sales | |||||||
Investment securities (excluding U.S. government securities) | $ | 7,905,387 | $ | 8,356,050 | ||||
U.S. government securities | 25,730,842 | 24,944,143 | ||||||
The cost of investments for federal income tax purposes, gross unrealized appreciation and unrealized depreciation are as follows:
Cost | $ | 43,474,550 | ||
|
| |||
Gross unrealized appreciation | 1,652,703 | |||
Gross unrealized depreciation | (449,971 | ) | ||
|
| |||
Net unrealized appreciation | $ | 1,202,732 | ||
|
|
1. Derivative Financial Instruments
The Portfolio may use derivatives in an effort to earn income and enhance returns, to replace more traditional direct investments, to obtain exposure to otherwise inaccessible markets (collectively, “investment purposes”), or to hedge or adjust the risk profile of its portfolio.
The principal types of derivatives utilized by the Portfolio, as well as the methods in which they may be used are:
| • | Futures |
The Portfolio may buy or sell futures for investment purposes or for the purpose of hedging its portfolio against adverse effects of potential movements in the market. The Portfolio bears the market risk that arises from changes in the value of these instruments and the imperfect correlation between movements in the price of the futures and movements in the price of the assets, reference rates or indices which they are designed to track. Among other things, the Portfolio may purchase or sell futures for foreign currencies or options thereon fornon-hedging purposes as a means of making direct investment in foreign currencies, as described below under “Currency Transactions”.
At the time the Portfolio enters into futures, the Portfolio deposits and maintains as collateral an initial margin with the broker, as required by the exchange on which the transaction is effected. Such amount is shown as cash collateral due from broker on the statement of assets and liabilities. Pursuant to the contract, the Portfolio agrees to receive from or pay to the broker an amount of cash equal to the daily fluctuation in the value of the contract. Such receipts or payments are known as variation margin and are recorded by the Portfolio as unrealized gains or losses. Risks may arise from the potential inability of a counterparty to meet the terms of the contract. The credit/counterparty risk for exchange-traded futures is generally less than privately negotiated futures, since the clearinghouse, which is the issuer or counterparty to each exchange-traded future, has robust risk mitigation standards, including the requirement to provide initial and variation margin. When the contract is closed, the Portfolio records a realized gain or loss equal to the difference between the value of the contract at the time it was opened and the time it was closed.
Use of long futures subjects the Portfolio to risk of loss in excess of the amounts shown on the statement of assets and liabilities, up to the notional value of the futures. Use of short futures subjects the Portfolio to unlimited risk of loss. Under some circumstances, futures exchanges may establish daily limits on the amount that the price of futures can vary from the previous day’s settlement price, which could effectively prevent liquidation of unfavorable positions.
During the year ended December 31, 2019, the Portfolio held futures for hedging andnon-hedging purposes.
| • | Forward Currency Exchange Contracts |
The Portfolio may enter into forward currency exchange contracts in order to hedge its exposure to changes in foreign currency exchange rates on its foreign portfolio holdings, to hedge certain firm purchase and sale commitments denominated in foreign currencies and fornon-hedging purposes as a means of making direct investments in foreign currencies, as described below under “Currency Transactions”.
31
| INTERMEDIATE BOND PORTFOLIO | ||
| NOTES TO FINANCIAL STATEMENTS | ||
| (continued) | AB Variable Products Series Fund | |
A forward currency exchange contract is a commitment to purchase or sell a foreign currency at a future date at a negotiated forward rate. The gain or loss arising from the difference between the original contract and the closing of such contract would be included in net realized gain or loss on forward currency exchange contracts. Fluctuations in the value of open forward currency exchange contracts are recorded for financial reporting purposes as unrealized appreciation and/or depreciation by the Portfolio. Risks may arise from the potential inability of a counterparty to meet the terms of a contract and from unanticipated movements in the value of a foreign currency relative to the U.S. dollar.
During the year ended December 31, 2019, the Portfolio held forward currency exchange contracts for hedging andnon-hedging purposes.
| • | Swaps |
The Portfolio may enter into swaps to hedge its exposure to interest rates, credit risk or currencies. The Portfolio may also enter into swaps fornon-hedging purposes as a means of gaining market exposures, making direct investments in foreign currencies, as described below under “Currency Transactions.” A swap is an agreement that obligates two parties to exchange a series of cash flows at specified intervals based upon or calculated by reference to changes in specified prices or rates for a specified amount of an underlying asset. The payment flows are usually netted against each other, with the difference being paid by one party to the other. In addition, collateral may be pledged or received by the Portfolio in accordance with the terms of the respective swaps to provide value and recourse to the Portfolio or its counterparties in the event of default, bankruptcy or insolvency by one of the parties to the swap.
Risks may arise as a result of the failure of the counterparty to the swap to comply with the terms of the swap. The loss incurred by the failure of a counterparty is generally limited to the net interim payment to be received by the Portfolio, and/or the termination value at the end of the contract. Therefore, the Portfolio considers the creditworthiness of each counterparty to a swap in evaluating potential counterparty risk. This risk is mitigated by having a netting arrangement between the Portfolio and the counterparty and by the posting of collateral by the counterparty to the Portfolio to cover the Portfolio’s exposure to the counterparty. Additionally, risks may arise from unanticipated movements in interest rates or in the value of the underlying securities. The Portfolio accrues for the interim payments on swaps on a daily basis, with the net amount recorded within unrealized appreciation/depreciation of swaps on the statement of assets and liabilities, where applicable. Once the interim payments are settled in cash, the net amount is recorded as realized gain/(loss) on swaps on the statement of operations, in addition to any realized gain/(loss) recorded upon the termination of swaps. Upfront premiums paid or received for OTC swaps are recognized as cost or proceeds on the statement of assets and liabilities and are amortized on a straight line basis over the life of the contract. Amortized upfront premiums are included in net realized gain/(loss) from swaps on the statement of operations. Fluctuations in the value of swaps are recorded as a component of net change in unrealized appreciation/depreciation of swaps on the statement of operations.
Certain standardized swaps, including certain interest rate swaps and credit default swaps, are (or soon will be) subject to mandatory central clearing. Cleared swaps are transacted through futures commission merchants (“FCMs”) that are members of central clearinghouses, with the clearinghouse serving as central counterparty, similar to transactions in futures contracts. Centralized clearing will be required for additional categories of swaps on aphased-in basis based on requirements published by the Securities and Exchange Commission and Commodity Futures Trading Commission.
At the time the Portfolio enters into a centrally cleared swap, the Portfolio deposits and maintains as collateral an initial margin with the broker, as required by the clearinghouse on which the transaction is effected. Such amount is shown as cash collateral due from broker on the statement of assets and liabilities. Pursuant to the contract, the Portfolio agrees to receive from or pay to the broker an amount of cash equal to the daily fluctuation in the value of the contract. Such receipts or payments are known as variation margin and are recorded by the Portfolio as unrealized gains or losses. Risks may arise from the potential inability of a counterparty to meet the terms of the contract. The credit/counterparty risk for centrally cleared swaps is generally less thannon-centrally cleared swaps, since the clearinghouse, which is the issuer or counterparty to each centrally cleared swap, has robust risk mitigation standards, including the requirement to provide initial and variation margin. When the contract is closed, the Portfolio records a realized gain or loss equal to the difference between the value of the contract at the time it was opened and the time it was closed.
32
| AB Variable Products Series Fund | ||
Interest Rate Swaps:
The Portfolio is subject to interest rate risk exposure in the normal course of pursuing its investment objectives. Because the Portfolio holds fixed rate bonds, the value of these bonds may decrease if interest rates rise. To help hedge against this risk and to maintain its ability to generate income at prevailing market rates, the Portfolio may enter into interest rate swaps. Interest rate swaps are agreements between two parties to exchange cash flows based on a notional amount. The Portfolio may elect to pay a fixed rate and receive a floating rate, or, receive a fixed rate and pay a floating rate on a notional amount.
In addition, the Portfolio may also enter into interest rate swap transactions to preserve a return or spread on a particular investment or portion of its portfolio, or protecting against an increase in the price of securities the Portfolio anticipates purchasing at a later date. Interest rate swaps involve the exchange by a Portfolio with another party of their respective commitments to pay or receive interest (e.g., an exchange of floating rate payments for fixed rate payments) computed based on a contractually-based principal (or “notional”) amount. Interest rate swaps are entered into on a net basis (i.e., the two payment streams are netted out, with the Portfolio receiving or paying, as the case may be, only the net amount of the two payments).
During the year ended December 31, 2019, the Portfolio held interest rate swaps for hedging andnon-hedging purposes.
Credit Default Swaps:
The Portfolio may enter into credit default swaps, including to manage its exposure to the market or certain sectors of the market, to reduce its risk exposure to defaults by corporate and sovereign issuers held by the Portfolio, or to create exposure to corporate or sovereign issuers to which it is not otherwise exposed. The Portfolio may purchase credit protection (“Buy Contract”) or provide credit protection (“Sale Contract”) on the referenced obligation of the credit default swap. During the term of the swap, the Portfolio receives/(pays) fixed payments from/(to) the respective counterparty, calculated at the agreed upon rate applied to the notional amount. If the Portfolio is a buyer/(seller) of protection and a credit event occurs, as defined under the terms of the swap, the Portfolio will either (i) receive from the seller/(pay to the buyer) of protection an amount equal to the notional amount of the swap (the “Maximum Payout Amount”) and deliver/(take delivery of) the referenced obligation or (ii) receive/(pay) a net settlement amount in the form of cash or securities equal to the notional amount of the swap less the recovery value of the referenced obligation. In certain circumstances Maximum Payout Amounts may be partially offset by recovery values of the respective referenced obligations, upfront premium received upon entering into the agreement, or net amounts received from settlement of buy protection credit default swaps entered into by the Portfolio for the same referenced obligations with the same counterparty.
Credit default swaps may involve greater risks than if a Portfolio had invested in the referenced obligation directly. Credit default swaps are subject to general market risk, liquidity risk, counterparty risk and credit risk. If the Portfolio is a buyer of protection and no credit event occurs, it will lose the payments it made to its counterparty. If the Portfolio is a seller of protection and a credit event occurs, the value of the referenced obligation received by the Portfolio coupled with the periodic payments previously received, may be less than the Maximum Payout Amount it pays to the buyer, resulting in a net loss to the Portfolio.
Implied credit spreads over U.S. Treasuries of comparable maturity utilized in determining the market value of credit default swaps on issuers as of period end are disclosed in the portfolio of investments. The implied spreads serve as an indicator of the current status of the payment/performance risk and typically reflect the likelihood of default by the issuer of the referenced obligation. The implied credit spread of a particular reference obligation also reflects the cost of buying/selling protection and may reflect upfront payments required to be made to enter into the agreement. Widening credit spreads typically represent a deterioration of the referenced obligation’s credit soundness and greater likelihood of default or other credit event occurring as defined under the terms of the agreement. A credit spread identified as “Defaulted” indicates a credit event has occurred for the referenced obligation.
During the year ended December 31, 2019, the Portfolio held credit default swaps for hedging andnon-hedging purposes.
33
| INTERMEDIATE BOND PORTFOLIO | ||
| NOTES TO FINANCIAL STATEMENTS | ||
| (continued) | AB Variable Products Series Fund | |
Variance Swaps:
The Portfolio may enter into variance swaps to hedge equity market risk or adjust exposure to the equity markets. Variance swaps are contracts in which two parties agree to exchange cash payments based on the difference between the stated level of variance and the actual variance realized on underlying asset(s) or index(es). Actual “variance” as used here is defined as the sum of the square of the returns on the reference asset(s) or index(es) (which in effect is a measure of its “volatility”) over the length of the contract term. So the parties to a variance swap can be said to exchange actual volatility for a contractually stated rate of volatility.
During the year ended December 31, 2019, the Portfolio held variance swaps for hedging purposes.
The Portfolio typically enters into International Swaps and Derivatives Association, Inc. Master Agreements (“ISDA Master Agreement”) with its OTC derivative contract counterparties in order to, among other things, reduce its credit risk to OTC counterparties. ISDA Master Agreements include provisions for general obligations, representations, collateral and events of default or termination. Under an ISDA Master Agreement, the Portfolio typically may offset with the OTC counterparty certain derivative financial instruments’ payables and/or receivables with collateral held and/or posted and create one single net payment(close-out netting) in the event of default or termination. In the event of a default by an OTC counterparty, the return of collateral with market value in excess of the Portfolio’s net liability, held by the defaulting party, may be delayed or denied.
The Portfolio’s ISDA Master Agreements may contain provisions for early termination of OTC derivative transactions in the event the net assets of the Portfolio decline below specific levels (“net asset contingent features”). If these levels are triggered, the Portfolio’s OTC counterparty has the right to terminate such transaction and require the Portfolio to pay or receive a settlement amount in connection with the terminated transaction. If OTC derivatives were held at period end, please refer to netting arrangements by the OTC counterparty table below for additional details.
During the year ended December 31, 2019, the Portfolio had entered into the following derivatives:
Asset Derivatives | Liability Derivatives | |||||||||||
Derivative Type | Statement of Location | Fair Value | Statement of Location | Fair Value | ||||||||
Interest rate contracts | Receivable/Payable for variation margin on futures | $ | 6,373 | * | Receivable/Payable for variation margin on futures | $ | 73,076 | * | ||||
Credit contracts | Receivable/Payable for variation margin on centrally cleared swaps | 7,663 | * | |||||||||
Interest rate contracts | Receivable/Payable for variation margin on centrally cleared swaps | 6,384 | * | Receivable/Payable for variation margin on centrally cleared swaps | 67,089 | * | ||||||
Foreign currency contracts | Unrealized appreciation on forward currency exchange contracts | 21,595 | Unrealized depreciation on forward currency exchange contracts | 37,842 | ||||||||
Credit contracts | Market value on credit default swaps | 2,138 | Market value on credit default swaps | 178,599 | ||||||||
|
|
|
| |||||||||
Total | $ | 36,490 | $ | 364,269 | ||||||||
|
|
|
| |||||||||
| * | Only variation margin receivable/payable at period end is reported within the statement of assets and liabilities. This amount reflects cumulative unrealized appreciation/(depreciation) on futures and centrally cleared swaps as reported in the portfolio of investments. |
Derivative Type | Location of Gain or (Loss) on Derivatives Within Statement of Operations | Realized Gain or (Loss) on Derivatives | Change in Unrealized Appreciation or (Depreciation) | |||||||
Interest rate contracts | Net realized gain (loss) on futures; Net change in unrealized appreciation/depreciation of futures | $ | 90,898 | $ | (129,452 | ) | ||||
34
| AB Variable Products Series Fund | ||
Derivative Type | Location of Gain or (Loss) on Derivatives Within Statement of Operations | Realized Gain or (Loss) on Derivatives | Change in Unrealized Appreciation or (Depreciation) | |||||||
Foreign currency contracts | Net realized gain (loss) on forward currency exchange contracts; Net change in unrealized appreciation/depreciation of forward currency exchange contracts | $ | (39,263 | ) | $ | 48,350 | ||||
Interest rate contracts | Net realized gain (loss) on swaps; Net change in unrealized appreciation/depreciation of swaps | (538 | ) | (115,456 | ) | |||||
Foreign exchange contracts | Net realized gain (loss) on swaps; Net change in unrealized appreciation/depreciation of swaps | (2,313 | ) | (34 | ) | |||||
Credit contracts | Net realized gain (loss) on swaps; Net change in unrealized appreciation/depreciation of swaps | (59 | ) | 314,888 | ||||||
|
|
|
| |||||||
Total | $ | 48,725 | $ | 118,296 | ||||||
|
|
|
| |||||||
The following table represents the average monthly volume of the Portfolio’s derivative transactions during the year ended December 31, 2019:
Futures: |
| |||
Average notional amount of buy contracts | $ | 5,365,048 | ||
Average notional amount of sale contracts | $ | 2,288,771 | ||
Forward Currency Exchange Contracts: |
| |||
Average principal amount of buy contracts | $ | 1,341,990 | ||
Average principal amount of sale contracts | $ | 3,543,445 | ||
Centrally Cleared Interest Rate Swaps: |
| |||
Average notional amount | $ | 12,198,075 | ||
Credit Default Swaps: |
| |||
Average notional amount of buy contracts | $ | 1,919,333 | (a) | |
Average notional amount of sale contracts | $ | 3,189,724 | ||
Centrally Cleared Credit Default Swaps: |
| |||
Average notional amount of buy contracts | $ | 760,000 | ||
Variance Swaps: |
| |||
Average notional amount | $ | 70,377 | (b) | |
| (a) | Positions were open for eleven months during the year. |
| (b) | Positions were open for two months during the year. |
For financial reporting purposes, the Portfolio does not offset derivative assets and derivative liabilities that are subject to netting arrangements in the statement of assets and liabilities.
All OTC derivatives held at period end were subject to netting arrangements. The following table presents the Portfolio’s derivative assets and liabilities by OTC counterparty net of amounts available for offset under ISDA Master Agreements (“MA”) and net of the related collateral received/pledged by the Portfolio as of December 31, 2019. Exchange-traded derivatives and centrally cleared swaps are not subject to netting arrangements and as such are excluded from the table.
35
| INTERMEDIATE BOND PORTFOLIO | ||
| NOTES TO FINANCIAL STATEMENTS | ||
| (continued) | AB Variable Products Series Fund | |
Counterparty | Derivative Assets Subject to a MA | Derivatives Available for Offset | Cash Collateral Received* | Security Collateral Received* | Net Amount of Derivative Assets | |||||||||||||||
Bank of America, NA | $ | 2,189 | $ | –0 | – | $ | –0 | – | $ | –0 | – | $ | 2,189 | |||||||
Citibank, NA | 3,650 | (1,203 | ) | –0 | – | –0 | – | 2,447 | ||||||||||||
Credit Suisse International | 3,120 | (3,120 | ) | –0 | – | –0 | – | –0 | – | |||||||||||
Deutsche Bank AG | 2,138 | (2,138 | ) | –0 | – | –0 | – | –0 | – | |||||||||||
State Street Bank & Trust Co. | 12,636 | (12,636 | ) | –0 | – | –0 | – | –0 | – | |||||||||||
|
|
|
|
|
|
|
|
|
| |||||||||||
Total | $ | 23,733 | $ | (19,097 | ) | $ | –0 | – | $ | –0 | – | $ | 4,636 | ^ | ||||||
|
|
|
|
|
|
|
|
|
| |||||||||||
Counterparty | Derivative Liabilities Subject to a MA | Derivatives Available for Offset | Cash Collateral Pledged* | Security Collateral Pledged* | Net Amount of Derivative Liabilities | |||||||||||||||
Barclays Bank PLC | $ | 928 | $ | –0 | – | $ | –0 | – | $ | –0 | – | $ | 928 | |||||||
Citibank, NA | 1,203 | (1,203 | ) | –0 | – | –0 | – | –0 | – | |||||||||||
Citigroup Global Markets, Inc. | 76,296 | –0 | – | –0 | – | –0 | – | 76,296 | ||||||||||||
Credit Suisse International | 42,946 | (3,120 | ) | –0 | – | –0 | – | 39,826 | ||||||||||||
Deutsche Bank AG | 21,405 | (2,138 | ) | –0 | – | –0 | – | 19,267 | ||||||||||||
Goldman Sachs International | 32,374 | –0 | – | –0 | – | –0 | – | 32,374 | ||||||||||||
JPMorgan Securities, LLC | 3,940 | –0 | – | –0 | – | –0 | – | 3,940 | ||||||||||||
Morgan Stanley Capital Services LLC | 1,771 | –0 | – | –0 | – | –0 | – | 1,771 | ||||||||||||
State Street Bank & Trust Co. | 35,578 | (12,636 | ) | –0 | – | –0 | – | 22,942 | ||||||||||||
|
|
|
|
|
|
|
|
|
| |||||||||||
Total | $ | 216,441 | $ | (19,097 | ) | $ | –0 | – | $ | –0 | – | $ | 197,344 | ^ | ||||||
|
|
|
|
|
|
|
|
|
| |||||||||||
| * | The actual collateral received/pledged may be more than the amount reported due to over-collateralization. |
| ^ | Net amount represents the net receivable/payable that would be due from/to the counterparty in the event of default or termination. The net amount from OTC financial derivative instruments can only be netted across transactions governed under the same master agreement with the same counterparty. |
2. Currency Transactions
The Portfolio may invest innon-U.S. Dollar-denominated securities on a currency hedged or unhedged basis. The Portfolio may seek investment opportunities by taking long or short positions in currencies through the use of currency-related derivatives, including forward currency exchange contracts, futures and options on futures, swaps, and other options. The Portfolio may enter into transactions for investment opportunities when it anticipates that a foreign currency will appreciate or depreciate in value but securities denominated in that currency are not held by the Portfolio and do not present attractive investment opportunities. Such transactions may also be used when the Adviser believes that it may be more efficient than a direct investment in a foreign currency-denominated security. The Portfolio may also conduct currency exchange contracts on a spot basis (i.e., for cash at the spot rate prevailing in the currency exchange market for buying or selling currencies).
3. TBA and Dollar Rolls
The Portfolio may invest in TBA mortgage-backed securities. A TBA, or “To Be Announced”, trade represents a contract for the purchase or sale of mortgage-backed securities to be delivered at a future agree-upon date; however, the specific mortgage pool numbers or the number of pools that will be delivered to fulfill the trade obligation or terms of the contract are unknown at the time of the trade. Mortgage pools (including fixed-rate or variable-rate mortgages) guaranteed by the Government National Mortgage Association, or GNMA, the Federal National Mortgage Association, or FNMA, or the Federal Home Loan Mortgage Corporation, or FHLMC, are subsequently allocated to the TBA transactions.
The Portfolio may enter into certain TBA transactions known as dollar rolls. Dollar rolls involve sales by the Portfolio of securities for delivery in the current month and the Portfolio’s simultaneously contracting to repurchase substantially similar (same type and coupon) securities on a specified future date. During the roll period, the Portfolio forgoes principal and interest paid on the securities. The Portfolio is compensated by the difference between the current sales price and the lower forward price for the future purchase (often referred to as the “drop”) as well as by the interest earned on the cash proceeds of the initial sale. Dollar rolls involve the risk that the market value of the securities the Portfolio is obligated to repurchase under the agreement may decline below the repurchase price. Dollar rolls are speculative techniques. For the year ended December 31, 2019, the Portfolio earned drop income of $1,794 which is included in interest income in the accompanying statement of operations.
36
| AB Variable Products Series Fund | ||
NOTE E: Capital Stock
Each class consists of 500,000,000 authorized shares. Transactions in capital shares for each class were as follows:
| SHARES | AMOUNT | |||||||||||||||||||
| Year Ended December 31, 2019 | Year Ended December 31, 2018 | Year Ended December 31, 2019 | Year Ended December 31, 2018 | |||||||||||||||||
Class A | ||||||||||||||||||||
Shares sold | 208,310 | 157,318 | $ | 2,214,654 | $ | 1,619,528 | ||||||||||||||
Shares issued in reinvestment of dividends and distributions | 90,336 | 90,575 | 961,173 | 921,149 | ||||||||||||||||
Shares redeemed | (504,296 | ) | (603,884 | ) | (5,367,537 | ) | (6,197,517 | ) | ||||||||||||
|
|
|
|
|
|
|
| |||||||||||||
Net decrease | (205,650 | ) | (355,991 | ) | $ | (2,191,710 | ) | $ | (3,656,840 | ) | ||||||||||
|
|
|
|
|
|
|
| |||||||||||||
Class B | ||||||||||||||||||||
Shares sold | 112,389 | 83,073 | $ | 1,181,651 | $ | 850,206 | ||||||||||||||
Shares issued in reinvestment of dividends and distributions | 30,769 | 31,618 | 324,304 | 318,391 | ||||||||||||||||
Shares redeemed | (239,084 | ) | (336,571 | ) | (2,505,667 | ) | (3,418,382 | ) | ||||||||||||
|
|
|
|
|
|
|
| |||||||||||||
Net decrease | (95,926 | ) | (221,880 | ) | $ | (999,712 | ) | $ | (2,249,785 | ) | ||||||||||
|
|
|
|
|
|
|
| |||||||||||||
At December 31, 2019, certain shareholders of the Portfolio owned 81% in aggregate of the Portfolio’s outstanding shares. Significant transactions by such shareholders, if any, may impact the Portfolio’s performance.
NOTE F: Risks Involved in Investing in the Portfolio
Interest Rate Risk—Changes in interest rates will affect the value of investments in fixed-income securities. When interest rates rise, the value of existing investments in fixed-income securities tends to fall and this decrease in value may not be offset by higher income from new investments. Interest rate risk is generally greater for fixed-income securities with longer maturities or durations.
Credit Risk—An issuer or guarantor of a fixed-income security, or the counterparty to a derivatives or other contract, may be unable or unwilling to make timely payments of interest or principal, or to otherwise honor its obligations. The issuer or guarantor may default, causing a loss of the full principal amount of a security and accrued interest. The degree of risk for a particular security may be reflected in its credit rating. There is the possibility that the credit rating of a fixed-income security may be downgraded after purchase, which may adversely affect the value of the security.
Below Investment Grade Securities Risk—Investments in fixed-income securities with lower ratings (“junk bonds”) tend to have a higher probability that an issuer will default or fail to meet its payment obligations. These securities may be subject to greater price volatility due to such factors as specific corporate developments, interest rate sensitivity, negative perceptions of the junk bond market generally and may be more difficult to trade or dispose of than other types of securities.
Duration Risk—Duration is a measure that relates the expected price volatility of a fixed-income security to changes in interest rates. The duration of a fixed-income security may be shorter than or equal to full maturity of a fixed-income security. Fixed-income securities with longer durations have more risk and will decrease in price as interest rates rise.
Inflation Risk—This is the risk that the value of assets or income from investments will be less in the future as inflation decreases the value of money. As inflation increases, the value of the Portfolio’s assets can decline as can the value of the Portfolio’s distributions. This risk is significantly greater if the Portfolio invests a significant portion of its assets in fixed-income securities with longer maturities.
Foreign(Non-U.S.) Risk—Investments in securities ofnon-U.S. issuers may involve more risk than those of U.S. issuers. These securities may fluctuate more widely in price and may be more difficult to trade or dispose of due to adverse market, economic, political, regulatory or other factors.
Emerging Market Risk—Investments in emerging market countries may have more risk because the markets are less developed and less liquid, and because these investments may be subject to increased economic, political, regulatory or other uncertainties.
37
| INTERMEDIATE BOND PORTFOLIO | ||
| NOTES TO FINANCIAL STATEMENTS | ||
| (continued) | AB Variable Products Series Fund | |
Currency Risk—Fluctuations in currency exchange rates may negatively affect the value of the Portfolio’s investments or reduce its returns.
Mortgage-Related and/or Other Asset-Backed Securities Risk-Investments in mortgage-related and other asset-backed securities are subject to certain additional risks. The value of these securities may be particularly sensitive to changes in interest rates. These risks include “extension risk”, which is the risk that, in periods of rising interest rates, issuers may delay the payment of principal, and “prepayment risk”, which is the risk that in periods of falling interest rates, issuers may pay principal sooner than expected, exposing the Portfolio to a lower rate of return upon reinvestment of principal. Mortgage-backed securities offered bynon-governmental issuers and other asset-backed securities may be subject to other risks, such as higher rates of default in the mortgages or assets backing the securities or risks associated with the nature and servicing of mortgages or assets backing the securities.
Leverage Risk—When the Portfolio borrows money or otherwise leverages its investments, its performance may be volatile because leverage tends to exaggerate the effect of any increase or decrease in the value of the Portfolio’s investments. The Portfolio may create leverage through the use of reverse repurchase arrangements, forward currency exchange contracts, forward commitments, dollar rolls or futures or by borrowing money. The use of other types of derivative instruments by the Portfolio, such as options and swaps, may also result in a form of leverage. Leverage may result in higher returns to the Portfolio than if the Portfolio were not leveraged, but may also adversely affect returns, particularly if the market is declining.
Illiquid Investments Risk—Illiquid investments risk exists when certain investments are or become difficult to purchase or sell. Difficulty in selling such investments may result in sales at disadvantageous prices affecting the value of your investment in the Portfolio. Causes of illiquid investments risk may include low trading volumes, large positions and heavy redemptions of Portfolio shares. Over recent years illiquid investments risk has also increased because the capacity of dealers in the secondary market for fixed-income securities to make markets in these securities has decreased, even as the overall bond market has grown significantly, due to, among other things, structural changes, additional regulatory requirements and capital and risk restraints that have led to reduced inventories. Illiquid investments risk may be higher in a rising interest rate environment, when the value and liquidity of fixed-income securities generally decline.
Derivatives Risk—The Portfolio may enter into derivative transactions such as forwards, options, futures and swaps. Derivatives may be illiquid, difficult to price, and leveraged so that small changes may produce disproportionate losses for the Portfolio, and subject to counterparty risk to a greater degree than more traditional investments. Derivatives may result in significant losses, including losses that are far greater than the value of the derivatives reflected on the statement of assets and liabilities.
Active Trading Risk—The Portfolio expects to engage in active and frequent trading of its portfolio securities and its portfolio turnover rate is expected to exceed 100%. A higher rate of portfolio turnover increases transaction costs, which may negatively affect the Portfolio’s return.
LIBOR Risk—The Portfolio may invest in certain debt securities, derivatives or other financial instruments that utilize the London Interbank Offered Rate, or “LIBOR,” as a “benchmark” or “reference rate” for various interest rate calculations. In July 2017, the United Kingdom Financial Conduct Authority, which regulates LIBOR, announced a desire to phase out the use of LIBOR by the end of 2021. Although financial regulators and industry working groups have suggested alternative reference rates, such as European Interbank Offer Rate (“EURIBOR”), Sterling Overnight Interbank Average Rate (“SONIA”) and Secured Overnight Financing Rate (“SOFR”), global consensus on alternative rates is lacking and the process for amending existing contracts or instruments to transition away from LIBOR remains unclear. The elimination of LIBOR or changes to other reference rates or any other changes or reforms to the determination or supervision of reference rates could have an adverse impact on the market for, or value of, any securities or payments linked to those reference rates, which may adversely affect the Portfolio’s performance and/or net asset value. Uncertainty and risk also remain regarding the willingness and ability of issuers and lenders to include revised provisions in new and existing contracts or instruments. Consequently, the transition away from LIBOR to other reference rates may lead to increased volatility and illiquidity in markets that are tied to LIBOR, fluctuations in values of LIBOR-related investments or investments in issuers that utilize LIBOR, increased difficulty in borrowing or refinancing and diminished effectiveness of hedging strategies, adversely affecting the Portfolio’s performance. Furthermore, the risks associated with the expected discontinuation of LIBOR and transition may be exacerbated if the work necessary to effect an orderly transition to an alternative reference rate is not completed in a timely manner. Because the usefulness of LIBOR as a benchmark could deteriorate during the transition period, these effects could occur prior to the end of 2021.
38
| AB Variable Products Series Fund | ||
Indemnification Risk—In the ordinary course of business, the Portfolio enters into contracts that contain a variety of indemnifications. The Portfolio’s maximum exposure under these arrangements is unknown. However, the Portfolio has not had prior claims or losses pursuant to these indemnification provisions and expects the risk of loss thereunder to be remote. Therefore, the Portfolio has not accrued any liability in connection with these indemnification provisions.
NOTE G: Joint Credit Facility
A number ofopen-end mutual funds managed by the Adviser, including the Portfolio, participate in a $325 million revolving credit facility (the “Facility”) intended to provide short-term financing, if necessary, subject to certain restrictions in connection with abnormal redemption activity. Commitment fees related to the Facility are paid by the participating funds and are included in miscellaneous expenses in the statement of operations. The Portfolio did not utilize the Facility during the year ended December 31, 2019.
NOTE H: Distributions to Shareholders
The tax character of distributions paid during the fiscal years ended December 31, 2019 and December 31, 2018 were as follows:
| 2019 | 2018 | |||||||
Distributions paid from: | ||||||||
Ordinary income | $ | 1,285,477 | $ | 794,650 | ||||
Net long-term capital gains | –0 | – | 444,890 | |||||
|
|
|
| |||||
Total taxable distributions paid | $ | 1,285,477 | $ | 1,239,540 | ||||
|
|
|
| |||||
As of December 31, 2019, the components of accumulated earnings/(deficit) on a tax basis were as follows:
Undistributed ordinary income | $ | 1,411,082 | ||
Accumulated capital and other losses | (174,092 | )(a) | ||
Unrealized appreciation/(depreciation) | 1,197,159 | (b) | ||
|
| |||
Total accumulated earnings/(deficit) | $ | 2,434,149 | ||
|
|
| (a) | As of December 31, 2019, the Portfolio had a net capital loss carryforward of $164,413. During the fiscal year, the Portfolio utilized $417,190 of capital loss carry forwards to offset current year net realized gains. As of December 31, 2019, the cumulative deferred loss on straddles was $9,679. |
| (b) | The differences between book-basis and tax-basis unrealized appreciation/(depreciation) are attributable primarily to the recognition for tax purposes of unrealized gains/losses on certain derivative instruments, the tax treatment of swaps, and the tax deferral of losses on wash sales. |
For tax purposes, net realized capital losses may be carried over to offset future capital gains, if any. Funds are permitted to carry forward capital losses for an indefinite period, and such losses will retain their character as either short-term or long-term capital losses. As of December 31, 2019, the Portfolio had a net long-term capital loss carryforward of $164,413, which may be carried forward for an indefinite period.
During the current fiscal year, there were no permanent differences that resulted in adjustments to distributable earnings or additionalpaid-in capital.
NOTE I: Recent Accounting Pronouncements
In March 2017, the Financial Accounting Standards Board issued an Accounting Standards Update, ASU2017-08, Receivables—Nonrefundable Fees and Other Costs (Subtopic310-20), Premium Amortization on Purchased Callable Debt Securities which amends the amortization period for certain purchased callable debt securities held at a premium, shortening such period to the earliest call date. ASU2017-08 does not require any accounting change for debt securities held at a discount; the discount continues to be amortized to maturity. ASU2017-08 is effective for fiscal years, and interim periods within those fiscal years, beginning after December 15, 2018. The Portfolio has adopted ASU2017-08, which did not have a material impact on the Portfolio’s financial position or the results of its operations, and had no impact on the Portfolio’s net assets.
In August 2018, the Financial Accounting Standards Board issued an Accounting Standards Update, ASU2018-13, Fair Value Measurement (Topic 820), Disclosure Framework—Changes to the Disclosure Requirements for Fair Value Measurement which removes, modifies and adds disclosures to Topic 820. The amendments in this ASU2018-13 (“ASU”)
39
| INTERMEDIATE BOND PORTFOLIO | ||
| NOTES TO FINANCIAL STATEMENTS | ||
| (continued) | AB Variable Products Series Fund | |
apply to all entities that are required, under existing U.S. GAAP, to make disclosures about recurring or nonrecurring fair value measurements. The amendments in this ASU are effective for all entities for fiscal years, and interim periods within those fiscal years, beginning after December 15, 2019. Management has evaluated the impact of the amendments and elected to early adopt the ASU. The adoption of this ASU did not have a material impact on the disclosure and presentation of the financial statements of the Portfolio.
NOTE J: Subsequent Events
Management has evaluated subsequent events for possible recognition or disclosure in the financial statements through the date the financial statements are issued. Management has determined that there are no material events that would require disclosure in the Portfolio’s financial statements through this date.
40
| INTERMEDIATE BOND PORTFOLIO | ||
| FINANCIAL HIGHLIGHTS | AB Variable Products Series Fund | |
Selected Data For A Share Of Capital Stock Outstanding Throughout Each Period
| CLASS A | ||||||||||||||||||||
| Year Ended December 31, | ||||||||||||||||||||
| 2019 | 2018 | 2017 | 2016 | 2015 | ||||||||||||||||
Net asset value, beginning of period | $10.21 | $10.56 | $10.65 | $10.63 | $11.37 | |||||||||||||||
|
|
|
|
|
|
|
|
|
| |||||||||||
Income From Investment Operations | ||||||||||||||||||||
Net investment income (a) | .26 | (b) | .23 | (b) | .23 | .28 | † | .27 | ||||||||||||
Net realized and unrealized gain (loss) on investment and foreign currency transactions | .57 | (.31 | ) | .14 | .23 | (.27 | ) | |||||||||||||
Contributions from Affiliates | .00 | (c) | –0 | – | .00 | (c) | –0 | – | –0 | – | ||||||||||
|
|
|
|
|
|
|
|
|
| |||||||||||
Net increase (decrease) in net asset value from operations | .83 | (.08 | ) | .37 | .51 | –0 | – | |||||||||||||
|
|
|
|
|
|
|
|
|
| |||||||||||
Less: Dividends and Distributions | ||||||||||||||||||||
Dividends from net investment income | (.31 | ) | (.13 | ) | (.36 | ) | (.35 | ) | (.40 | ) | ||||||||||
Distributions from net realized gain on investment transactions | –0 | – | (.14 | ) | (.10 | ) | (.14 | ) | (.34 | ) | ||||||||||
|
|
|
|
|
|
|
|
|
| |||||||||||
Total dividends and distributions | (.31 | ) | (.27 | ) | (.46 | ) | (.49 | ) | (.74 | ) | ||||||||||
|
|
|
|
|
|
|
|
|
| |||||||||||
Net asset value, end of period | $10.73 | $10.21 | $10.56 | $10.65 | $10.63 | |||||||||||||||
|
|
|
|
|
|
|
|
|
| |||||||||||
Total Return | ||||||||||||||||||||
Total investment return based on net asset value (d)• | 8.20 | % | (.72 | )% | 3.52 | % | 4.71 | %† | .01 | % | ||||||||||
Ratios/Supplemental Data | ||||||||||||||||||||
Net assets, end of period (000’s omitted) | $32,763 | $33,267 | $38,172 | $42,183 | $47,554 | |||||||||||||||
Ratio to average net assets of: | ||||||||||||||||||||
Expenses, net of waivers/reimbursements | 1.26 | % | 1.16 | % | 1.11 | % | 1.06 | % | .96 | % | ||||||||||
Expenses, before waivers/reimbursements | 1.27 | % | 1.16 | % | 1.11 | % | 1.06 | % | .96 | % | ||||||||||
Net investment income | 2.48 | %(b) | 2.20 | %(b) | 2.11 | % | 2.60 | %† | 2.44 | % | ||||||||||
Portfolio turnover rate** | 75 | % | 155 | % | 216 | % | 156 | % | 230 | % | ||||||||||
See footnote summary on page 42.
41
| INTERMEDIATE BOND PORTFOLIO | ||
| FINANCIAL HIGHLIGHTS | ||
| (continued) | AB Variable Products Series Fund | |
Selected Data For A Share Of Capital Stock Outstanding Throughout Each Period
| CLASS B | ||||||||||||||||||||
| Year Ended December 31, | ||||||||||||||||||||
| 2019 | 2018 | 2017 | 2016 | 2015 | ||||||||||||||||
Net asset value, beginning of period | $10.10 | $10.45 | $10.54 | $10.53 | $11.26 | |||||||||||||||
|
|
|
|
|
|
|
|
|
| |||||||||||
Income From Investment Operations | ||||||||||||||||||||
Net investment income (a) | .23 | (b) | .20 | (b) | .20 | .25 | † | .24 | ||||||||||||
Net realized and unrealized gain (loss) on investment and foreign currency transactions | .58 | (.31 | ) | .14 | .22 | (.26 | ) | |||||||||||||
Contributions from Affiliates | .00 | (c) | –0 | – | .00 | (c) | –0 | – | –0 | – | ||||||||||
|
|
|
|
|
|
|
|
|
| |||||||||||
Net increase (decrease) in net asset value from operations | .81 | (.11 | ) | .34 | .47 | (.02 | ) | |||||||||||||
|
|
|
|
|
|
|
|
|
| |||||||||||
Less: Dividends and Distributions | ||||||||||||||||||||
Dividends from net investment income | (.29 | ) | (.10 | ) | (.33 | ) | (.32 | ) | (.37 | ) | ||||||||||
Distributions from net realized gain on investment transactions | –0 | – | (.14 | ) | (.10 | ) | (.14 | ) | (.34 | ) | ||||||||||
|
|
|
|
|
|
|
|
|
| |||||||||||
Total dividends and distributions | (.29 | ) | (.24 | ) | (.43 | ) | (.46 | ) | (.71 | ) | ||||||||||
|
|
|
|
|
|
|
|
|
| |||||||||||
Net asset value, end of period | $10.62 | $10.10 | $10.45 | $10.54 | $10.53 | |||||||||||||||
|
|
|
|
|
|
|
|
|
| |||||||||||
Total Return | ||||||||||||||||||||
Total investment return based on net asset value (d)• | 7.99 | % | (1.01 | )% | 3.28 | % | 4.36 | %† | (.18 | )% | ||||||||||
Ratios/Supplemental Data | ||||||||||||||||||||
Net assets, end of period (000’s omitted) | $11,652 | $12,054 | $14,786 | $16,029 | $17,681 | |||||||||||||||
Ratio to average net assets of: | ||||||||||||||||||||
Expenses, net of waivers/reimbursements | 1.51 | % | 1.41 | % | 1.36 | % | 1.32 | % | 1.21 | % | ||||||||||
Expenses, before waivers/reimbursements | 1.52 | % | 1.41 | % | 1.36 | % | 1.32 | % | 1.21 | % | ||||||||||
Net investment income | 2.23 | %(b) | 1.95 | %(b) | 1.87 | % | 2.36 | %† | 2.19 | % | ||||||||||
Portfolio turnover rate** | 75 | % | 155 | % | 216 | % | 156 | % | 230 | % | ||||||||||
| (a) | Based on average shares outstanding. |
| (b) | Net of expenses waived/reimbursed by the Adviser. |
| (c) | Amount is less than $.005. |
| (d) | Total investment return is calculated assuming an initial investment made at the net asset value at the beginning of the period, reinvestment of all dividends and distributions at net asset value during the period, and redemption on the last day of the period. Total return does not reflect (i) insurance company’s separate account related expense charges and (ii) the deductions of taxes that a shareholder would pay on Portfolio distributions or the redemption of Portfolio shares. Total investment return calculated for a period of less than one year is not annualized. |
| † | For the year ended December 31, 2016, the amount includes a refund for overbilling of prior years’ custody out of pocket fees as follows: |
Net Investment Income Per Share | Net Investment Income Ratio | Total Return | ||
| $.03 | .28% | .29% |
| • | Includes the impact of proceeds received and credited to the Portfolio resulting from class action settlements, which enhanced the Portfolio’s performance for the years ended December 31, 2019, December 31, 2017, December 31, 2016 and December 31, 2015 by .03%, .03%, .03% and .03%, respectively. |
| ** | The Portfolio accounts for dollar roll transactions as purchases and sales. |
See notes to financial statements.
42
| REPORT OF INDEPENDENT REGISTERED | ||
| PUBLIC ACCOUNTING FIRM | AB Variable Products Series Fund | |
To the Shareholders and the Board of Directors of AB Intermediate Bond Portfolio:
Opinion on the Financial Statements
We have audited the accompanying statement of assets and liabilities of AB Intermediate Bond Portfolio (the “Portfolio”) (one of the portfolios constituting AB Variable Products Series Fund, Inc. (the “Fund”)), including the portfolio of investments, as of December 31, 2019, and the related statement of operations for the year then ended, the statements of changes in net assets for each of the two years in the period then ended, the financial highlights for each of the five years in the period then ended and the related notes (collectively referred to as the “financial statements”). In our opinion, the financial statements present fairly, in all material respects, the financial position of the Portfolio (one of the portfolios constituting AB Variable Products Series Fund, Inc.) at December 31, 2019, the results of its operations for the year then ended, the changes in its net assets for each of the two years in the period then ended and its financial highlights for each of the five years in the period then ended, in conformity with U.S. generally accepted accounting principles.
Basis for Opinion
These financial statements are the responsibility of the Fund’s management. Our responsibility is to express an opinion on the Portfolio’s financial statements based on our audits. We are a public accounting firm registered with the Public Company Accounting Oversight Board (United States) (“PCAOB”) and are required to be independent with respect to the Fund in accordance with the U.S. federal securities laws and the applicable rules and regulations of the Securities and Exchange Commission and the PCAOB.
We conducted our audits in accordance with the standards of the PCAOB. Those standards require that we plan and perform the audit to obtain reasonable assurance about whether the financial statements are free of material misstatement, whether due to error or fraud. The Fund is not required to have, nor were we engaged to perform, an audit of the Fund’s internal control over financial reporting. As part of our audits, we are required to obtain an understanding of internal control over financial reporting, but not for the purpose of expressing an opinion on the effectiveness of the Fund’s internal control over financial reporting. Accordingly, we express no such opinion.
Our audits included performing procedures to assess the risks of material misstatement of the financial statements, whether due to error or fraud, and performing procedures that respond to those risks. Such procedures included examining, on a test basis, evidence regarding the amounts and disclosures in the financial statements. Our procedures included confirmation of securities owned as of December 31, 2019, by correspondence with the custodian and others or by other appropriate auditing procedures where replies from others were not received. Our audits also included evaluating the accounting principles used and significant estimates made by management, as well as evaluating the overall presentation of the financial statements. We believe that our audits provide a reasonable basis for our opinion.

We have served as the auditor of one or more of the AB investment companies since 1968.
New York, New York
February 14, 2020
43
| INTERMEDIATE BOND PORTFOLIO | AB Variable Products Series Fund | |
| BOARD OF DIRECTORS | ||
Marshall C. Turner, Jr.(1),Chairman Jorge A. Bermudez^ Michael J. Downey(1) Nancy P. Jacklin(1) | Robert M. Keith,President and Chief Executive Officer Carol C. McMullen(1) Garry L. Moody(1) Earl D. Weiner(1) | |
| OFFICERS | ||
Michael Canter(2),Vice President Shawn E. Keegan(2),Vice President Douglas J. Peebles(2)*,Vice President Janaki Rao(2),Vice President Dimitra Silva(2),Vice President Emilie D. Wrapp,Secretary | Michael B. Reyes,Senior Analyst Joseph J. Mantineo,Treasurer and Phyllis J. Clarke,Controller Vincent S. Noto,Chief Compliance Officer | |
CUSTODIANAND ACCOUNTING AGENT State Street Bank and Trust Company State Street Corporation CCB/5 1 Iron Street Boston, MA 02210 | LEGAL COUNSEL Seward & Kissel LLP One Battery Park Plaza New York, NY 10004 | |
DISTRIBUTOR AllianceBernstein Investments, Inc. 1345 Avenue of the Americas New York, NY 10105 | TRANSFER AGENT AllianceBernstein Investor Services, Inc. P.O. Box 786003 San Antonio, TX 78278-6003 Toll-Free (800) 221-5672 | |
INDEPENDENT REGISTERED PUBLIC ACCOUNTING FIRM Ernst & Young LLP 5 Times Square New York, NY 10036 |
| (1) | Member of the Audit Committee, the Governance and Nominating Committee, and the Independent Directors Committee. |
| (2) | The day-to-day management of, and investment decisions for, the Portfolio’s portfolio are made by the Adviser’s U.S. Core Fixed Income Investment Team. Messrs. Canter, Keegan, Peebles, Rao and Silva are the investment professionals with the most significant responsibility for theday-to-day management of the Portfolio’s portfolio. |
| ^ | Mr. Bermudez will be a member of the Audit Committee, the Governance and Nominating Committee, and the Independent Directors Committee when he joins the Board on January 1, 2020. |
| * | Mr. Peebles is expected to retire from the Adviser effective December 30, 2020. |
44
| INTERMEDIATE BOND PORTFOLIO | ||
| MANAGEMENT OF THE FUND | AB Variable Products Series Fund | |
Board of Directors Information
The business and affairs of the Fund are managed under the direction of the Board of Directors. Certain information concerning the Fund’s Directors is set forth below.
NAME, ADDRESS*, AGE, (YEAR FIRST ELECTED**) | PRINCIPAL OCCUPATION(S) DURING PAST FIVE YEARS | PORTFOLIOS IN AB FUND COMPLEX OVERSEEN BY DIRECTOR | OTHER PUBLIC COMPANY DIRECTORSHIPS CURRENTLY HELD BY DIRECTOR | |||||
| INTERESTED DIRECTOR | ||||||||
Robert M. Keith,# 1345 Avenue of the Americas New York, NY 10105 59 (2010) | Senior Vice President of AllianceBernstein L.P. (the “Adviser”) and the head of AllianceBernstein Investments, Inc. (“ABI”) since July 2008; Director of ABI and President of the AB Mutual Funds. Previously, he served as Executive Managing Director of ABI from December 2006 to June 2008. Prior to joining ABI in 2006, Executive Managing Director of Bernstein Global Wealth Management, and prior thereto, Senior Managing Director and Global Head of Client Service and Sales of the Adviser’s institutional investment management business since 2004. Prior thereto, he was Managing Director and Head of North American Client Service and Sales in the Adviser’s institutional investment management business, with which he had been associated since prior to 2004. | 91 | None | |||||
| DISINTERESTED DIRECTORS | ||||||||
Marshall C. Turner, Jr.,## Chairman of the Board 78 (2005) | Private Investor since prior to 2015. Former Chairman and CEO of Dupont Photomasks, Inc. (components of semi-conductor manufacturing). He has extensive operating leadership and venture capital investing experience, including five interim or full-time CEO roles, and prior service as general partner of institutional venture capital partnerships. He also has extensive non-profit board leadership experience, and currently serves on the boards of two education and science-related non-profit organizations. He has served as a director of one AB Fund since 1992, and director or trustee of all AB Funds since 2005. He has been Chairman of the AB Funds since January 2014, and the Chairman of the Independent Directors Committees of such AB Funds since February 2014. | 91 | Xilinx, Inc. (programmable logic semi-conductors) since 2007 | |||||
Jorge A. Bermudez,^ 68 (2020) | Private investor since prior to 2015. Former Chief Risk Officer of Citigroup, Inc., a global financial services company, from November 2007 to March 2008, Chief Executive Officer of Citigroup’s Commercial Business Group in North America and Citibank Texas from 2005 to 2007, and a variety of other executive and leadership roles at various businesses within Citigroup prior to then; Chairman (2018) of the Texas A&M Foundation Board of Trustees (Trustee since 2013) and Chairman of the Smart Grid Center Board at Texas A&M University since 2012; director of, among others, Citibank N.A. from 2005 to 2008, the Federal Reserve Bank of Dallas, Houston Branch from 2009 to 2011, the Federal Reserve Bank of Dallas from 2011 to 2017, and the Electric Reliability Council of Texas from 2010 to 2016. He has served as director or trustee of the AB Funds since 2020. | 91 | Moody’s Corporation since April 2011 | |||||
45
| INTERMEDIATE BOND PORTFOLIO | ||
| MANAGEMENT OF THE FUND | ||
| (continued) | AB Variable Products Series Fund | |
NAME, ADDRESS*, AGE, (YEAR FIRST ELECTED**) | PRINCIPAL OCCUPATION(S) DURING PAST FIVE YEARS | PORTFOLIOS IN AB FUND COMPLEX OVERSEEN BY DIRECTOR | OTHER PUBLIC COMPANY DIRECTORSHIPS CURRENTLY HELD BY DIRECTOR | |||||
| DISINTERESTED DIRECTORS (continued) | ||||||||
Michael J. Downey,## 76 (2005) | Private Investor since prior to 2015. Formerly, Chairman of The Asia Pacific Fund, Inc. (registered investment company) since prior to 2015 until January 2019. From 1987 until 1993, Chairman and CEO of Prudential Mutual Fund Management, director of the Prudential mutual funds, and member of the Executive Committee of Prudential Securities, Inc. He has served as a director or trustee of the AB Funds since 2005. | 91 | None | |||||
Nancy P. Jacklin,## 71 (2006) | Private Investor since prior to 2015. Professorial Lecturer at the Johns Hopkins School of Advanced International Studies (2008–2015). U.S. Executive Director of the International Monetary Fund (which is responsible for ensuring the stability of the international monetary system), (December 2002–May 2006); Partner, Clifford Chance (1992–2002); Sector Counsel, International Banking and Finance, and Associate General Counsel, Citicorp (1985–1992); Assistant General Counsel (International), Federal Reserve Board of Governors (1982–1985); and Attorney Advisor, U.S. Department of the Treasury (1973–1982). Member of the Bar of the District of Columbia and of New York; and member of the Council on Foreign Relations. She has served as a director or trustee of the AB Funds since 2006 and has been Chair of the Governance and Nominating Committees of the AB Funds since August 2014. | 91 | None | |||||
Carol C. McMullen,## 64 (2016) | Managing Director of Slalom Consulting (consulting) since 2014, private investor and member of the Advisory Board of Butcher Box (since 2018). Formerly, member, Partners Healthcare Investment Committee (2010–2019); Director of Norfolk & Dedham Group (mutual property and casualty insurance) from 2011 until November 2016; Director of Partners Community Physicians Organization (healthcare) from 2014 until December 2016; and Managing Director of The Crossland Group (consulting) from 2012 until 2013. She has held a number of senior positions in the asset and wealth management industries, including at Eastern Bank (where her roles included President of Eastern Wealth Management), Thomson Financial (Global Head of Sales for Investment Management), and Putnam Investments (where her roles included Chief Investment Officer, Core and Growth and Head of Global Investment Research). She has served on a number of private company and non-profit boards, and as a director or trustee of the AB Funds since June 2016. | 91 | None | |||||
46
| AB Variable Products Series Fund | ||
NAME, ADDRESS*, AGE, (YEAR FIRST ELECTED**) | PRINCIPAL OCCUPATION(S) DURING PAST FIVE YEARS | PORTFOLIOS IN AB FUND COMPLEX OVERSEEN BY DIRECTOR | OTHER PUBLIC COMPANY DIRECTORSHIPS CURRENTLY HELD BY DIRECTOR | |||||
| DISINTERESTED DIRECTORS (continued) | ||||||||
Garry L. Moody,## 67 (2008) | Formerly, Partner, Deloitte & Touche LLP (1995-2008) where he held a number of senior positions, including Vice Chairman, and U.S. and Global Investment Management Practice Managing Partner; President, Fidelity Accounting and Custody Services Company (1993-1995), where he was responsible for accounting, pricing, custody and reporting for the Fidelity mutual funds; and Partner, Ernst & Young LLP (1975-1993), where he served as the National Director of Mutual Fund Tax Services and Managing Partner of its Chicago Office Tax department. He is a member of the Trustee Advisory Board of BoardIQ, a biweekly publication focused on issues and news affecting directors of mutual funds. He is also a member of the Investment Company Institute’s Board of Governors and the Independent Directors Council Governing Council. He has served as a director or trustee, and as Chairman of the Audit Committees, of the AB Funds since 2008. | 91 | None | |||||
Earl D. Weiner,## 80 (2007) | Senior Counsel since 2017, Of Counsel from 2007 to 2016, and Partner prior to then, of the law firm Sullivan & Cromwell LLP. He is a former member of the ABA Federal Regulation of Securities Committee Task Force to draft editions of the Fund Director’s Guidebook. He also serves as a director or trustee of various non-profit organizations and has served as Chairman or Vice Chairman of a number of them. He has served as a director or trustee of the AB Funds since 2007 and served as Chairman of the Governance and Nominating Committees of the AB Funds from 2007 until August 2014. | 91 | None | |||||
| * | The address for the Fund’s disinterested Directors is c/o AllianceBernstein L.P., Attention: Legal & Compliance Department—Mutual Fund Legal, 1345 Avenue of the Americas, New York, NY 10105. |
| ** | There is no stated term of office for the Fund’s Directors. |
| *** | The information above includes each Director’s principal occupation during the last five years and other information relating to the experience, attributes and skills relevant to each Director’s qualifications to serve as a Director, which led to the conclusion that each Director should serve as a Director for the Fund. |
| # | Mr. Keith is an “interested person” of the Fund as defined in the “1940 Act”, due to his position as a Senior Vice President of the Adviser. |
| ## | Member of the Audit Committee, the Governance and Nominating Committee, and the Independent Directors Committee. |
| ^ | Mr. Bermudez will be a member of the Audit Committee, the Governance and Nominating Committee, and the Independent Directors Committee when he joins the Board on January 1, 2020. |
47
| INTERMEDIATE BOND PORTFOLIO | ||
| MANAGEMENT OF THE FUND | ||
| (continued) | AB Variable Products Series Fund | |
Officer Information
Certain information concerning the Portfolio’s Officers is listed below.
NAME, ADDRESS*, AGE | PRINCIPAL POSITION(S) HELD WITH FUND | PRINCIPAL OCCUPATION DURING PAST FIVE YEARS | ||
Robert M. Keith 59 | President and Chief Executive Officer | See biography above. | ||
Michael Canter 50 | Vice President | Senior Vice President of the Adviser**, with which she has been associated since prior to 2015. He is also the Director of Securitized Assets and US Multi-Sector Fixed-Income. | ||
Shawn E. Keegan 48 | Vice President | Senior Vice President of the Adviser**, with which he has been associated since prior to 2015. | ||
Douglas J. Peebles^ 54 | Vice President | Senior Vice President of the Adviser**, with which he has been associated since prior to 2015. He is also Chief Investment Officer of Fixed Income. | ||
Janaki Rao 49 | Vice President | Senior Vice President of the Adviser**, with which he has been associated since prior to 2015. | ||
Dimitra Silva 37 | Vice President | Vice President of the Adviser**, with which he has been associated since prior to 2015. | ||
Emilie D. Wrapp 64 | Secretary | Senior Vice President, Assistant General Counsel and Assistant Secretary of ABI**, with which she has been associated since prior to 2015. | ||
Michael B. Reyes 43 | Senior Analyst | Vice President of the Adviser**, with which he has been associated since prior to 2015. | ||
Joseph J. Mantineo 60 | Treasurer and Chief Financial Officer | Senior Vice President of AllianceBernstein Investor Services, Inc. (“ABIS”)**, with which he has been associated since prior to 2015. | ||
Phyllis J. Clarke 59 | Controller | Vice President of ABIS**, with which she has been associated since prior to 2015. | ||
Vincent S. Noto 55 | Chief Compliance Officer | Senior Vice President since 2015 and Mutual Fund Chief Compliance Officer of the Adviser** since prior to 2015. |
| * | The address for each of the Portfolio’s Officers is 1345 Avenue of the Americas, New York, NY 10105. |
| ** | The Adviser, ABI and ABIS are affiliates of the Fund. |
| ^ | Mr. Peebles is expected to retire from the Adviser effective December 30, 2020. |
| The Fund’s Statement of Additional Information (“SAI”) has additional information about the Directors and Officers and is available without charge upon request. Contact your financial representative or the Adviser at(800) 227-4618, or visit www.abfunds.com, for a free prospectus or SAI. |
48
| INTERMEDIATE BOND PORTFOLIO | ||
| CONTINUANCE DISCLOSURE | AB Variable Products Series Fund | |
INFORMATION REGARDING THE REVIEW AND APPROVAL OF THE FUND’S ADVISORY AGREEMENT
The disinterested directors (the “directors”) of AB Variable Products Series Fund, Inc. (the “Company”) approved the continuance of the Company’s Advisory Agreement with the Adviser in respect of AB Intermediate Bond Portfolio (the “Fund”) at a meeting held onNovember 4-6, 2019 (the “Meeting”).
Prior to approval of the continuance of the Advisory Agreement, the directors had requested from the Adviser, and received and evaluated, extensive materials. They reviewed the proposed continuance of the Advisory Agreement with the Adviser and with experienced counsel who are independent of the Adviser, who advised on the relevant legal standards. The directors also reviewed additional materials, including comparative analytical data prepared by the Senior Analyst for the Fund. The directors also discussed the proposed continuance in private sessions with counsel.
The directors considered their knowledge of the nature and quality of the services provided by the Adviser to the Fund gained from their experience as directors or trustees of most of the registered investment companies advised by the Adviser, their overall confidence in the Adviser’s integrity and competence they have gained from that experience, the Adviser’s initiative in identifying and raising potential issues with the directors and its responsiveness, frankness and attention to concerns raised by the directors in the past, including the Adviser’s willingness to consider and implement organizational and operational changes designed to improve investment results and the services provided to the AB Funds. The directors noted that they have four regular meetings each year, at each of which they review extensive materials and information from the Adviser, including information on the investment performance of the Fund and the underlying fund advised by the Adviser in which the Fund invests.
The directors also considered all factors they believed relevant, including the specific matters discussed below. During the course of their deliberations, the directors evaluated, among other things, the reasonableness of the advisory fee. The directors did not identify any particular information that wasall-important or controlling, and different directors may have attributed different weights to the various factors. The directors determined that the selection of the Adviser to manage the Fund and the overall arrangements between the Fund and the Adviser, as provided in the Advisory Agreement, including the advisory fee, were fair and reasonable in light of the services performed, expenses incurred and such other matters as the directors considered relevant in the exercise of their business judgment. The material factors and conclusions that formed the basis for the directors’ determinations included the following:
Nature, Extent and Quality of Services Provided
The directors considered the scope and quality of services provided by the Adviser under the Advisory Agreement, including the quality of the investment research capabilities of the Adviser and the other resources it has dedicated to performing services for the Fund. The directors noted that the Adviser from time to time reviews the Fund’s investment strategies and from time to time proposes changes intended to improve the Fund’s relative or absolute performance for the directors’ consideration. They also noted the professional experience and qualifications of the Fund’s portfolio management team and other senior personnel of the Adviser. The directors also considered that the Advisory Agreement provides that the Fund will reimburse the Adviser for the cost to it of providing certain clerical, accounting, administrative and other services to the Fund by employees of the Adviser or its affiliates. Requests for these reimbursements are made on a quarterly basis and subject to approval by the directors. Reimbursements, to the extent requested and paid, result in a higher rate of total compensation from the Fund to the Adviser than the fee rate stated in the Advisory Agreement. The directors noted that the methodology used to determine the reimbursement amounts had been reviewed by an independent consultant retained by the Fund’s former Senior Officer/Independent Compliance Officer. The quality of administrative and other services, including the Adviser’s role in coordinating the activities of the Fund’s other service providers, also was considered. The directors concluded that, overall, they were satisfied with the nature, extent and quality of services provided to the Fund under the Advisory Agreement.
Costs of Services Provided and Profitability
The directors reviewed a schedule of the revenues and expenses and related notes indicating the profitability of the Fund to the Adviser for calendar years 2017 and 2018 that had been prepared with an expense allocation methodology arrived at in consultation with an independent consultant retained by the Fund’s former Senior Officer/Independent Compliance Officer. The directors noted the assumptions and methods of allocation used by the Adviser in preparing fund-specific profitability data and understood that there are a number of potentially acceptable allocation methodologies for information of this type. The directors noted that the profitability information reflected all revenues and expenses of the Adviser’s relationship with the Fund, including those relating to its subsidiaries that provide transfer agency and distribution services to the Fund. The
49
| INTERMEDIATE BOND PORTFOLIO | ||
| CONTINUANCE DISCLOSURE | ||
| (continued) | AB Variable Products Series Fund | |
directors recognized that it is difficult to make comparisons of the profitability of the Advisory Agreement with the profitability of fund advisory contracts for unaffiliated funds because comparative information is not generally publicly available and is affected by numerous factors. The directors focused on the profitability of the Adviser’s relationship with the Fund before taxes and distribution expenses. The directors concluded that the Adviser’s level of profitability from its relationship with the Fund was not unreasonable.
Fall-Out Benefits
The directors considered the other benefits to the Adviser and its affiliates from their relationships with the Fund and the underlying fund advised by the Adviser in which the Fund invests, including, but not limited to, benefits relating to12b-1 fees and sales charges received by the Fund’s principal underwriter (which is a wholly owned subsidiary of the Adviser) in respect of the Fund’s Class B shares; and transfer agency fees paid by the Fund to a wholly owned subsidiary of the Adviser. The directors recognized that the Adviser’s profitability would be somewhat lower without these benefits. The directors understood that the Adviser also might derive reputational and other benefits from its association with the Fund.
Investment Results
In addition to the information reviewed by the directors in connection with the Meeting, the directors receive detailed performance information for the Fund at each regular Board meeting during the year.
At the Meeting, the directors reviewed performance information prepared by an independent service provider (the “15(c) service provider”), showing the performance of the Class A Shares of the Fund against a group of similar funds (“peer group”) and a larger group of similar funds (“peer universe”), each selected by the 15(c) service provider, and information prepared by the Adviser showing performance of the Class A Shares against a broad-based securities market index, in each case for the1-,3-,5- and10-year periods ended July 31, 2019 and (in the case of comparisons with the broad-based securities market index) for the period from inception. Based on their review, the directors concluded that the Fund’s investment performance was acceptable.
Advisory Fees and Other Expenses
The directors considered the advisory fee rate payable by the Fund to the Adviser and information prepared by the 15(c) service provider concerning advisory fee rates payable by other funds in the same category as the Fund. The directors recognized that it is difficult to make comparisons of advisory fees because there are variations in the services that are included in the fees payable by other funds. The directors compared the Fund’s contractual effective advisory fee rate with a peer group median and noted that it was above the median. The directors took into account the impact on the advisory fee rate of the administrative expense reimbursement paid to the Adviser in the latest fiscal year.
The directors also considered the Adviser’s fee schedule for other clients utilizing investment strategies similar to those of the Fund. For this purpose, they reviewed the relevant advisory fee information from the Adviser’s Form ADV and in a report from the Fund’s Senior Analyst and noted the differences between the Fund’s fee schedule, on the one hand, and the Adviser’s institutional fee schedule and the schedule of fees charged by the Adviser to any offshore funds and for services to anysub-advised funds utilizing investment strategies similar to those of the Fund, on the other. The directors noted that the Adviser may, in some cases, agree to fee rates with large institutional clients that are lower than those reviewed by the directors and that they had previously discussed with the Adviser its policies in respect of such arrangements. The directors previously discussed these matters with an independent fee consultant. The directors also compared the advisory fee rate for the Fund with that for another fund advised by the Adviser utilizing similar investment strategies.
The Adviser reviewed with the directors the significantly greater scope of the services it provides to the Fund relative to institutional, offshore fund andsub-advised fund clients. In this regard, the Adviser noted, among other things, that, compared to institutional and offshore orsub-advisory accounts, the Fund (i) demands considerably more portfolio management, research and trading resources due to significantly higher daily cash flows; (ii) has more tax and regulatory restrictions and compliance obligations; (iii) must prepare and file or distribute regulatory and other communications about fund operations; and (iv) must provide shareholder servicing to retail investors. The Adviser also reviewed the greater legal risks presented by the large and changing population of Fund shareholders who may assert claims against the Adviser in individual or class actions, and the greater entrepreneurial risk in offering new fund products, which require substantial investment to launch, may not succeed, and generally must be priced to compete with larger, more established funds resulting in lack of profitability to the Adviser until a new fund achieves scale. In light of the substantial differences in services rendered by the Adviser to institutional, offshore fund andsub-advised fund clients as compared to the Fund, and the different risk profile, the directors considered these fee comparisons inapt and did not place significant weight on them in their deliberations.
50
| AB Variable Products Series Fund | ||
In connection with their review of the Fund’s advisory fee, the directors also considered the total expense ratio of the Class A shares of the Fund in comparison to a peer group and a peer universe selected by the 15(c) service provider. The Class A expense ratio of the Fund was based on the Fund’s latest fiscal year. The directors noted that it was likely that the expense ratios of some of the other funds in the Fund’s category were lowered by waivers or reimbursements by those funds’ investment advisers, which in some cases might be voluntary or temporary. The directors view expense ratio information as relevant to their evaluation of the Adviser’s services because the Adviser is responsible for coordinating services provided to the Fund by others. The directors noted that the Fund’s expense ratio was above the medians. After reviewing and discussing the Adviser’s explanations of the reasons for this, the directors concluded that the Fund’s expense ratio was acceptable.
Economies of Scale
The directors noted that the advisory fee schedule for the Fund contains breakpoints that reduce the fee rates on assets above specified levels. The directors took into consideration prior presentations by an independent consultant on economies of scale in the mutual fund industry and for the AB Funds, and presentations from time to time by the Adviser concerning certain of its views on economies of scale. The directors also previously discussed economies of scale with an independent fee consultant. The directors also had requested and received from the Adviser certain updates on economies of scale in advance of the Meeting. The directors believe that economies of scale may be realized (if at all) by the Adviser across a variety of products and services, and not only in respect of a single fund. The directors noted that there is no established methodology for setting breakpoints that give effect to the fund-specific services provided by a fund’s adviser and to the economies of scale that an adviser may realize in its overall mutual fund business or those components of it which directly or indirectly affect a fund’s operations. The directors observed that in the mutual fund industry as a whole, as well as among funds similar to the Fund, there is no uniformity or pattern in the fees and asset levels at which breakpoints (if any) apply. The directors also noted that the advisory agreements for many funds do not have breakpoints at all. Having taken these factors into account, the directors concluded that the Fund’s shareholders would benefit from a sharing of economies of scale in the event the Fund’s net assets exceed a breakpoint in the future.
51
VPS-IB-0151-1219
DEC 12.31.19

ANNUAL REPORT
AB VARIABLE PRODUCTS
SERIES FUND, INC.
| + | INTERNATIONAL GROWTH PORTFOLIO |
Beginning on May 1, 2021, as permitted by regulations adopted by the Securities and Exchange Commission, you may not be receiving paper copies of the Portfolio’s shareholder reports from the insurance company that offers your contract unless you specifically request paper copies from the insurance company or from your financial intermediary. Instead of delivering paper copies of the reports, the insurance company may choose to make the reports available on a website, and will notify you by mail each time a report is posted and provide you with a website link to access the report. Instructions for requesting paper copies will be provided by your insurance company.
If you already elected to receive shareholder reports electronically, you will not be affected by this change and you need not take any action. You may elect to receive shareholder reports and other communications from the insurance company or your financial intermediary electronically by following the instructions provided by the insurance company or by contacting your financial intermediary.
You may elect to receive all future reports in paper free of charge from the insurance company. You can inform the insurance company or your financial intermediary that you wish to continue receiving paper copies of your shareholder reports by following the instructions provided by the insurance company or by contacting your financial intermediary. Your election to receive reports in paper will apply to all portfolio companies available under your contract with the insurance company.
Investment Products Offered
| • | Are Not FDIC Insured |
| • | May Lose Value |
| • | Are Not Bank Guaranteed |
AllianceBernstein Investments, Inc. (ABI) is the distributor of the AB family of mutual funds. ABI is a member of FINRA and is an affiliate of AllianceBernstein L.P., the Adviser of the funds.
You may obtain a description of the Fund’s proxy voting policies and procedures, and information regarding how the Fund voted proxies relating to portfolio securities during the most recent12-month period ended June 30, without charge. Simply visit AB’s website at www.abfunds.com or go to the Securities and Exchange Commission’s (the “Commission”) website at www.sec.gov, or call AB at (800) 227 4618.
The Fund files its complete schedule of portfolio holdings with the Commission for the first and third quarters of each fiscal year as an exhibit to its reports on Form N-PORT. The Fund’s Form N-PORT reports are available on the Commission’s website at www.sec.gov. The Fund’s Forms N-PORT may also be reviewed and copied at the Commission’s Public Reference Room in Washington, DC; information on the operation of the Public Reference Room may be obtained by calling (800) SEC 0330.
The [A/B] logo is a registered service mark of AllianceBernstein and AllianceBernstein® is a registered service mark used by permission of the owner, AllianceBernstein L.P.
| INTERNATIONAL GROWTH PORTFOLIO | AB Variable Products Series Fund | |
LETTER TO INVESTORS
February 14, 2020
The following is an update of AB Variable Products Series Fund—International Growth Portfolio (the “Portfolio”) for the annual reporting period ended December 31, 2019.
INVESTMENT OBJECTIVE AND POLICIES
The Portfolio’s investment objective is long-term growth of capital. The Portfolio invests primarily in an international portfolio of equity securities of companies selected by the Adviser for their growth potential within various market sectors. Examples of the types of market sectors in which the Portfolio may invest include, but are not limited to, information technology (which includes telecommunications), health care, financial services, infrastructure, energy and natural resources, and consumer groups.
The Portfolio invests, under normal circumstances, in the equity securities of companies located in at least three countries (and normally substantially more) other than the United States. The Portfolio invests in securities of companies in both developed- and emerging-market countries. Geographic distribution of the Portfolio’s investments among countries or regions also will be a product of the stock selection process rather than a predetermined allocation.
The Portfolio may also invest in synthetic foreign equity securities, which are various types of warrants used internationally that entitle a holder to buy or sell underlying securities. The Adviser expects that normally the Portfolio’s portfolio will tend to emphasize investments in larger capitalization companies, although the Portfolio may invest in smaller or medium capitalization companies.
The Portfolio may, at times, invest in shares of exchange-traded funds (“ETFs”) in lieu of making direct investments in equity securities. ETFs may provide more efficient and economical exposure to the type of companies and geographic locations in which the Portfolio seeks to invest than direct investments.
Currencies can have a dramatic impact on equity returns, significantly adding to returns in some years and greatly diminishing them in others. Currency and equity positions are evaluated separately. The Adviser may seek to hedge the currency exposure resulting from securities positions when it finds the currency exposure unattractive. To hedge all or a portion of its currency risk, the Portfolio may, from time to time, invest in currency-related derivatives, including forward currency exchange contracts, futures contracts, options on futures contracts, swaps and options. The Adviser may also seek investment opportunities by taking long or short positions in currencies through the use of currency-related derivatives.
The Portfolio may enter into other derivatives transactions, such as options, futures contracts, forwards and swaps. The Portfolio may use options strategies involving the purchase and/or writing of various combinations of call and/or put options, including on individual securities and stock indices, futures contracts (including futures contracts on individual securities and stock indices) or shares of ETFs. These transactions may be used, for example, in an effort to earn extra income, to adjust exposure to individual securities or markets, or to protect all or a portion of the Portfolio’s portfolio from a decline in value, sometimes within certain ranges.
INVESTMENT RESULTS
The table on page 5 shows the Portfolio’s performance compared to its primary benchmark, the Morgan Stanley Capital International (“MSCI”) World Index ex USA (net), and the Morgan Stanley Capital International All Country World Index (“MSCI ACWI”) ex USA (net) for theone-, five- and10-year periods ended December 31, 2019.
All share classes outperformed the primary benchmark and the MSCI ACWIex-US (net) for the annual period. Relative to the primary benchmark, security selection contributed, particularly in the industrials and financials sectors. Selection in technology and utilities detracted from performance. Sector selection also contributed to performance, led by an overweight to technology and an underweight to energy. An underweight to consumer discretionary and an overweight to consumer staples offset gains slightly. Country selection contributed, mainly because of overweights to Ireland and the Netherlands, while overweights to India and Peru detracted.
The Portfolio used derivatives in the form of currency forwards for hedging purposes, which added to absolute returns for the annual period.
MARKET REVIEW AND INVESTMENT STRATEGY
Global equities recorded strong double-digit returns while emerging markets also rallied during the annual period ended December 31, 2019. After declining sharply at the end of 2018, equity markets rebounded dramatically in January as strong corporate earnings and optimism about a trade truce between the US and China calmed investors.Trade-war tensions resurfaced, however, and emerging geopolitical pressures drove market volatility. Tariff wars, restrictive monetary policy and a decline in industrial production stoked recessionary fears throughout the global economy. In response, the world’s central banks implemented accommodative monetary policies to help support capital markets. Late in the third quarter, equity market performance was accompanied by a sharp style rotation in the US. Quality-growth and lower-volatility
1
| AB Variable Products Series Fund | ||
stocks, which had been strong performers, lagged and value stocks outperformed. However, for the most part, growth stocks continued to outperform value over the entire period. From a market-capitalization perspective,large-cap stocks outperformed theirsmall-cap peers. In December, equity markets rallied on news that the US and China had agreed to a preliminaryphase-one trade deal due to be signed in January 2020.
The Portfolio’s exposures remain focused on secular growth themes, particularly those promoting social and environmental sustainability. This has helped the Portfolio’s Senior Investment Management Team (the “Team”) to identify companies with strong competitive advantages and high returns on invested capital that the Team believes are more likely to sustain higher-than-average growth over the long term. The Team believes organic sales and earnings growth will be a key driver of returns going forward. The Portfolio is positioned particularly well in this regard.
2
| INTERNATIONAL GROWTH PORTFOLIO | ||
| DISCLOSURES AND RISKS | AB Variable Products Series Fund | |
Benchmark Disclosure
The MSCI World Index ex USA and the MSCI ACWI ex USA are unmanaged and do not reflect fees and expenses associated with the active management of a mutual fund portfolio.The MSCI World Index ex USA (net, free float-adjusted, market capitalization weighted) represents the equity market performance of developed markets, excluding the US. The MSCI ACWI ex USA (net, free float-adjusted, market capitalization weighted) represents the equity market performance of developed and emerging markets, excluding the US. MSCI makes no express or implied warranties or representations, and shall have no liability whatsoever with respect to any MSCI data contained herein. The MSCI data may not be further redistributed or used as a basis for other indices, any securities or financial products. This report is not approved, reviewed or produced by MSCI. Net returns include the reinvestment of dividends after deduction ofnon-US withholding tax. An investor cannot invest directly in an index, and its results are not indicative of the performance for any specific investment, including the Portfolio.
A Word About Risk
Market Risk: The value of the Portfolio’s assets will fluctuate as the stock or bond market fluctuates. The value of its investments may decline, sometimes rapidly and unpredictably, simply because of economic changes or other events that affect large portions of the market. It includes the risk that a particular style of investing, such as the Portfolio’s growth approach, may underperform the market generally.
Foreign(Non-US) Risk: Investments in securities ofnon-US issuers may involve more risk than those of US issuers. These securities may fluctuate more widely in price and may be more difficult to trade or dispose of due to adverse market, economic, political, regulatory or other factors.
Emerging-Market Risk: Investments in emerging-market countries may have more risk because the markets are less developed and less liquid, and because these investments may be subject to increased economic, political, regulatory or other uncertainties.
Currency Risk: Fluctuations in currency exchange rates may negatively affect the value of the Portfolio’s investments or reduce its returns.
Capitalization Risk: Investments in small- andmid-capitalization companies may be more volatile than investments in large-capitalization companies. Investments in small-capitalization companies may have additional risks because these companies have limited product lines, markets or financial resources.
Derivatives Risk: Derivatives may be difficult to price or unwind and leveraged so that small changes may produce disproportionate losses for the Portfolio. Derivatives may also be subject to counterparty risk to a greater degree than more traditional investments.
Leverage Risk: To the extent the Portfolio uses leveraging techniques, its net asset value (“NAV”) may be more volatile because leverage tends to exaggerate the effect of changes in interest rates and any increase or decrease in the value of the Portfolio’s investments.
Management Risk: The Portfolio is subject to management risk because it is an actively managed investment fund. The Adviser will apply its investment techniques and risk analyses in making investment decisions for the Portfolio, but there is no guarantee that its techniques will produce the intended results.
These risks are fully discussed in the Variable Products prospectus. As with all investments, you may lose money by investing in the Portfolio.
An Important Note About Historical Performance
The investment return and principal value of an investment in the Portfolio will fluctuate, so that shares, when redeemed, may be worth more or less than their original cost. Performance shown in this report represents past performance and does not guarantee future results. Current performance may be lower or higher than the
(Disclosures, Risks and Note About Historical Performance continued on next page)
3
| DISCLOSURES AND RISKS | ||
| (continued) | AB Variable Products Series Fund | |
performance information shown. Please contact your financial advisor or insurance agent representative at your financial institution to obtain portfolio performance information current to the most recent month end.
Investors should consider the investment objectives, risks, charges and expenses of the Portfolio carefully before investing. For additional copies of the Portfolio’s prospectus or summary prospectus, which contains this and other information, call your financial advisor or (800) 227 4618. Please read the prospectus and/or summary prospectus carefully before investing.
All fees and expenses related to the operation of the Portfolio have been deducted, but no adjustment has been made for insurance company separate account or annuity contract charges, which would reduce total return to a contract owner. Performance assumes reinvestment of distributions and does not account for taxes.
There are additional fees and expenses associated with all Variable Products. These fees can include mortality and expense risk charges, administrative charges, and other charges that can significantly reduce investment returns. Those fees and expenses are not reflected in this annual report. You should consult your Variable Products prospectus for a description of those fees and expenses and speak to your insurance agent or financial representative if you have any questions. You should read the prospectus before investing or sending money.
4
| INTERNATIONAL GROWTH PORTFOLIO | ||
| HISTORICAL PERFORMANCE | AB Variable Products Series Fund | |
| THE PORTFOLIO VS. ITS BENCHMARKS | Net Asset Value Returns | |||||||||||
PERIODS ENDED DECEMBER 31, 2019 (unaudited) | 1 Year | 5 Years1 | 10 Years1 | |||||||||
| International Growth Portfolio Class A | 27.53% | 5.38% | 4.82% | |||||||||
| International Growth Portfolio Class B | 27.23% | 5.11% | 4.56% | |||||||||
| Primary Benchmark: MSCI World Index ex USA (net) | 22.49% | 5.42% | 5.32% | |||||||||
| MSCI ACWI ex USA (net) | 21.51% | 5.51% | 4.97% | |||||||||
1 Average annual returns.
Please keep in mind that high, double-digit returns are highly unusual and cannot be sustained. Investors should also be aware that these returns were primarily achieved during favorable market conditions. |
| |||||||||||
The Portfolio’s current prospectus fee table shows the Portfolio’s total annual operating expense ratios as 1.29% and 1.54% for Class A and Class B shares, respectively, gross of any fee waivers or expense reimbursements. Contractual fee waivers and/or expense reimbursements limit the Portfolio’s annual operating expense ratios to 1.24% and 1.49% for Class A and Class B shares, respectively. These waivers/reimbursements may not be terminated before May 1, 2020 and may be extended by the Adviser for additionalone-year terms. Absent reimbursements or waivers, performance would have been lower. The Financial Highlights section of this report sets forth expense ratio data for the current reporting period; the expense ratios shown above may differ from the expense ratios in the Financial Highlights section since they are based on different time periods.
GROWTH OF A $10,000 INVESTMENT
12/31/2009 TO 12/31/2019 (unaudited)
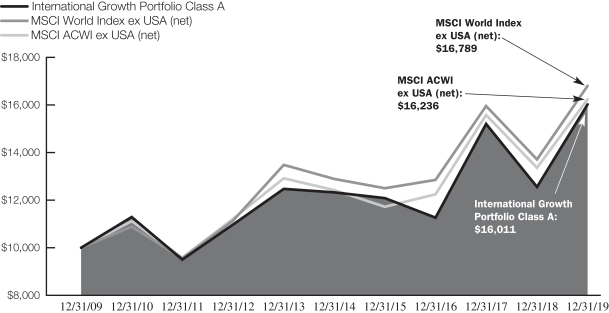
This chart illustrates the total value of an assumed $10,000 investment in International Growth Portfolio Class A shares (from 12/31/2009 to 12/31/2019) as compared to the performance of the Portfolio’s benchmarks. The chart assumes the reinvestment of dividends and capital gains distributions.
See Disclosures, Risks and Note about Historical Performance on pages3-4.
5
| INTERNATIONAL GROWTH PORTFOLIO | ||
| EXPENSE EXAMPLE (unaudited) | AB Variable Products Series Fund | |
As a shareholder of the Portfolio, you incur two types of costs: (1) transaction costs, including sales charges (loads) on purchase payments, contingent deferred sales charges on redemptions and (2) ongoing costs, including management fees; distribution(12b-1) fees; and other Portfolio expenses. This example is intended to help you understand your ongoing costs (in dollars) of investing in the Portfolio and to compare these costs with the ongoing costs of investing in other mutual funds.
The Example is based on an investment of $1,000 invested at the beginning of the period and held for the entire period as indicated below.
Actual Expenses
The table below provides information about actual account values and actual expenses. You may use the information in this line, together with the amount you invested, to estimate the expenses that you paid over the period. Simply divide your account value by $1,000 (for example, an $8,600 account value divided by $1,000 = 8.6), then multiply the result by the number in the first line under the heading entitled “Expenses Paid During Period” to estimate the expenses you paid on your account during this period. The estimate of expenses does not include fees or other expenses of any variable insurance product. If such expenses were included, the estimate of expenses you paid during the period would be higher and your ending account value would be lower.
Hypothetical Example for Comparison Purposes
The table below provides information about hypothetical account values and hypothetical expenses based on the Portfolio’s actual expense ratio and an assumed annual rate of return of 5% before expenses, which is not the Portfolio’s actual return. The hypothetical account values and expenses may not be used to estimate the actual ending account balance or expenses you paid for the period. You may use this information to compare the ongoing costs of investing in the Portfolio and other funds by comparing this 5% hypothetical example with the 5% hypothetical examples that appear in the shareholder reports of other funds. The estimate of expenses does not include fees or other expenses of any variable insurance product. If such expenses were included, the estimate of expenses you paid during the period would be higher and your ending account value would be lower.
Please note that the expenses shown in the table are meant to highlight your ongoing costs only and do not reflect any transactional costs, such as sales charges (loads), or contingent deferred sales charges on redemptions. Therefore, the second line of each class’ table is useful in comparing ongoing costs only, and will not help you determine the relative total costs of owning different funds. In addition, if these transactional costs were included, your costs would have been higher.
| Beginning Account Value July 1, 2019 | Ending Account Value December 31, 2019 | Expenses Paid During Period* | Annualized Expense Ratio* | |||||||||||||
Class A | ||||||||||||||||
Actual | $ | 1,000 | $ | 1,090.90 | $ | 7.33 | 1.39 | % | ||||||||
Hypothetical (5% annual return before expenses) | $ | 1,000 | $ | 1,018.20 | $ | 7.07 | 1.39 | % | ||||||||
Class B | ||||||||||||||||
Actual | $ | 1,000 | $ | 1,089.50 | $ | 8.64 | 1.64 | % | ||||||||
Hypothetical (5% annual return before expenses) | $ | 1,000 | $ | 1,016.94 | $ | 8.34 | 1.64 | % | ||||||||
| * | Expenses are equal to each classes’ annualized expense ratios, multiplied by the average account value over the period, multiplied by 184/365 (to reflect theone-half year period). |
6
| INTERNATIONAL GROWTH PORTFOLIO | ||
| TEN LARGEST HOLDINGS1 | ||
| December 31, 2019 (unaudited) | AB Variable Products Series Fund | |
| COMPANY | U.S. $ VALUE | PERCENT OF NET ASSETS | ||||||
London Stock Exchange Group PLC | $ | 1,648,771 | 3.1 | % | ||||
Partners Group Holding AG | 1,520,518 | 2.8 | ||||||
Koninklijke Philips NV | 1,504,982 | 2.8 | ||||||
HDFC Bank Ltd. | 1,472,664 | 2.7 | ||||||
Schneider Electric SE | 1,451,096 | 2.7 | ||||||
Recruit Holdings Co., Ltd. | 1,445,776 | 2.7 | ||||||
Svenska Handelsbanken AB—Class A | 1,332,215 | 2.5 | ||||||
Gerresheimer AG | 1,307,002 | 2.4 | ||||||
Vestas Wind Systems A/S | 1,253,692 | 2.3 | ||||||
Kingspan Group PLC | 1,224,646 | 2.3 | ||||||
|
|
|
| |||||
| $ | 14,161,362 | 26.3 | % | |||||
SECTOR BREAKDOWN2
December 31, 2019 (unaudited)
| SECTOR | U.S. $ VALUE | PERCENT OF TOTAL INVESTMENTS | ||||||
Information Technology | $ | 10,646,939 | 19.8 | % | ||||
Financials | 9,000,111 | 16.8 | ||||||
Health Care | 7,945,570 | 14.8 | ||||||
Industrials | 7,690,222 | 14.3 | ||||||
Consumer Staples | 6,799,974 | 12.7 | ||||||
Consumer Discretionary | 4,564,363 | 8.5 | ||||||
Materials | 2,141,738 | 4.0 | ||||||
Communication Services | 1,495,719 | 2.8 | ||||||
Energy | 1,045,489 | 1.9 | ||||||
Utilities | 601,887 | 1.1 | ||||||
Short-Term Investments | 1,750,153 | 3.3 | ||||||
|
|
|
| |||||
Total Investments | $ | 53,682,165 | 100.0 | % | ||||
| 1 | Long-term investments. |
| 2 | The Portfolio’s sector breakdown is expressed as a percentage of total investments (excluding security lending collateral) and may vary over time. The Portfolio also enters into derivative transactions, which may be used for hedging or investment purposes (see “Portfolio of Investments” section of the report for additional details). |
Please note: The sector classifications presented herein are based on the Global Industry Classification Standard (GICS) which was developed by Morgan Stanley Capital International and Standard & Poor’s. The components are divided into sector, industry group, and industrysub-indices as classified by the GICS for each of the market capitalization indices in the broad market. These sector classifications are broadly defined. The “Portfolio of Investments” section of the report reflects more specific industry information and is consistent with the investment restrictions discussed in the Portfolio’s prospectus.
7
| INTERNATIONAL GROWTH PORTFOLIO | ||
| COUNTRY BREAKDOWN1 | ||
| December 31, 2019 (unaudited) | AB Variable Products Series Fund | |
| COUNTRY | U.S.$ VALUE | PERCENT OF TOTAL INVESTMENTS | ||||||
Japan | $ | 5,937,496 | 11.1 | % | ||||
Netherlands | 5,497,284 | 10.2 | ||||||
United Kingdom | 4,682,327 | 8.7 | ||||||
Switzerland | 4,601,584 | 8.6 | ||||||
France | 4,495,432 | 8.4 | ||||||
China | 4,004,468 | 7.5 | ||||||
Germany | 3,647,958 | 6.8 | ||||||
United States | 3,270,155 | 6.1 | ||||||
Ireland | 3,074,755 | 5.7 | ||||||
India | 2,655,497 | 4.9 | ||||||
Denmark | 2,316,648 | 4.3 | ||||||
Sweden | 2,154,440 | 4.0 | ||||||
Hong Kong | 1,163,286 | 2.2 | ||||||
Other | 4,430,682 | 8.2 | ||||||
Short-Term Investments | 1,750,153 | 3.3 | ||||||
|
|
|
| |||||
Total Investments | $ | 53,682,165 | 100.0 | % | ||||
| 1 | All data are as of December 31, 2019. The Portfolio’s country breakdown is expressed as a percentage of total investments and may vary over time. “Other” country weightings represent 2.0% or less in the following countries: Austria, Brazil, Finland, Norway and Spain. |
8
| INTERNATIONAL GROWTH PORTFOLIO | ||
| PORTFOLIO OF INVESTMENTS | ||
| December 31, 2019 | AB Variable Products Series Fund | |
| Company | Shares | U.S. $ Value | ||||||
COMMON STOCKS–96.4% | ||||||||
INFORMATION TECHNOLOGY–19.8% | ||||||||
ELECTRONIC EQUIPMENT, INSTRUMENTS & COMPONENTS–3.1% | ||||||||
Horiba Ltd. | 11,100 | $ | 740,080 | |||||
Keyence Corp. | 2,600 | 912,960 | ||||||
|
| |||||||
| 1,653,040 | ||||||||
|
| |||||||
IT SERVICES–4.4% | ||||||||
Adyen NV(a)(b)(c) | 1,020 | 839,048 | ||||||
GMO Payment Gateway, Inc.(c) | 11,300 | 773,839 | ||||||
Pagseguro Digital Ltd.(b)(c) | 23,033 | 786,807 | ||||||
|
| |||||||
| 2,399,694 | ||||||||
|
| |||||||
SEMICONDUCTORS & SEMICONDUCTOR EQUIPMENT–7.3% | ||||||||
ASML Holding NV | 3,306 | 978,763 | ||||||
Infineon Technologies AG | 48,225 | 1,089,612 | ||||||
NXP Semiconductors NV | 8,610 | 1,095,709 | ||||||
STMicroelectronics NV | 27,877 | 752,138 | ||||||
|
| |||||||
| 3,916,222 | ||||||||
|
| |||||||
SOFTWARE–5.0% | ||||||||
AVEVA Group PLC | 13,237 | 816,625 | ||||||
Dassault Systemes SE | 7,363 | 1,214,345 | ||||||
SAP SE | 4,807 | 647,013 | ||||||
|
| |||||||
| 2,677,983 | ||||||||
|
| |||||||
| 10,646,939 | ||||||||
|
| |||||||
FINANCIALS–16.7% | ||||||||
BANKS–7.2% | ||||||||
Erste Group Bank AG(b) | 29,210 | 1,097,190 | ||||||
HDFC Bank Ltd. | 82,312 | 1,472,664 | ||||||
Svenska Handelsbanken AB–Class A | 123,694 | 1,332,215 | ||||||
|
| |||||||
| 3,902,069 | ||||||||
|
| |||||||
CAPITAL MARKETS–5.9% | ||||||||
London Stock Exchange Group PLC | 16,043 | 1,648,771 | ||||||
Partners Group Holding AG(c) | 1,659 | 1,520,518 | ||||||
|
| |||||||
| 3,169,289 | ||||||||
|
| |||||||
INSURANCE–3.6% | ||||||||
AIA Group Ltd. | 110,600 | 1,163,286 | ||||||
Prudential PLC | 39,950 | 765,467 | ||||||
|
| |||||||
| 1,928,753 | ||||||||
|
| |||||||
| 9,000,111 | ||||||||
|
| |||||||
HEALTH CARE–14.7% | ||||||||
BIOTECHNOLOGY–1.2% | ||||||||
Abcam PLC | 36,101 | 646,518 | ||||||
|
| |||||||
HEALTH CARE EQUIPMENT & SUPPLIES–2.8% | ||||||||
Koninklijke Philips NV | 30,787 | 1,504,982 | ||||||
|
| |||||||
HEALTH CARE PROVIDERS & SERVICES–2.2% | ||||||||
Apollo Hospitals Enterprise Ltd. | 58,612 | $ | 1,182,833 | |||||
|
| |||||||
LIFE SCIENCES TOOLS & SERVICES–7.0% | ||||||||
Bio-Rad Laboratories, Inc.–Class A(b) | 1,717 | 635,341 | ||||||
Gerresheimer AG | 16,899 | 1,307,002 | ||||||
ICON PLC(b) | 4,057 | 698,737 | ||||||
Tecan Group AG | 4,028 | 1,131,650 | ||||||
|
| |||||||
| 3,772,730 | ||||||||
|
| |||||||
PHARMACEUTICALS–1.5% | ||||||||
Roche Holding AG | 2,580 | 838,507 | ||||||
|
| |||||||
| 7,945,570 | ||||||||
|
| |||||||
INDUSTRIALS–14.3% | ||||||||
BUILDING PRODUCTS–2.3% | ||||||||
Kingspan Group PLC | 20,051 | 1,224,646 | ||||||
|
| |||||||
COMMERCIAL SERVICES & SUPPLIES–0.9% | ||||||||
China Everbright International Ltd. | 635,148 | 509,324 | ||||||
|
| |||||||
ELECTRICAL EQUIPMENT–5.0% | ||||||||
Schneider Electric SE | 14,124 | 1,451,096 | ||||||
Vestas Wind Systems A/S | 12,412 | 1,253,692 | ||||||
|
| |||||||
| 2,704,788 | ||||||||
|
| |||||||
MACHINERY–3.4% | ||||||||
SMC Corp./Japan | 2,300 | 1,051,825 | ||||||
Xylem, Inc./NY | 9,568 | 753,863 | ||||||
|
| |||||||
| 1,805,688 | ||||||||
|
| |||||||
PROFESSIONAL SERVICES–2.7% | ||||||||
Recruit Holdings Co., Ltd. | 38,600 | 1,445,776 | ||||||
|
| |||||||
| 7,690,222 | ||||||||
|
| |||||||
CONSUMER STAPLES–12.6% | ||||||||
FOOD PRODUCTS–7.7% | ||||||||
Danone SA | 12,979 | 1,077,853 | ||||||
Kerry Group PLC–Class A | 9,239 | 1,151,372 | ||||||
Mowi ASA(c) | 31,524 | 819,653 | ||||||
Nestle SA | 10,261 | 1,110,909 | ||||||
|
| |||||||
| 4,159,787 | ||||||||
|
| |||||||
HOUSEHOLD PRODUCTS–3.4% | ||||||||
Essity AB–Class B | 25,530 | 822,225 | ||||||
Unicharm Corp. | 30,000 | 1,013,016 | ||||||
|
| |||||||
| 1,835,241 | ||||||||
|
| |||||||
PERSONAL PRODUCTS–1.5% | ||||||||
Unilever PLC | 14,062 | 804,946 | ||||||
|
| |||||||
| 6,799,974 | ||||||||
|
| |||||||
9
| INTERNATIONAL GROWTH PORTFOLIO | ||
| PORTFOLIO OF INVESTMENTS | ||
| (continued) | AB Variable Products Series Fund | |
| Company | Shares | U.S. $ Value | ||||||
CONSUMER DISCRETIONARY–8.5% | ||||||||
AUTO COMPONENTS–2.0% | ||||||||
Aptiv PLC | 11,133 | $ | 1,057,301 | |||||
|
| |||||||
INTERNET & DIRECT MARKETING RETAIL–2.0% | ||||||||
Alibaba Group Holding Ltd.(b) | 40,704 | 1,082,334 | ||||||
|
| |||||||
TEXTILES, APPAREL & LUXURY GOODS–4.5% | ||||||||
NIKE, Inc.–Class B | 8,130 | 823,650 | ||||||
Puma SE | 7,881 | 604,331 | ||||||
Shenzhou International Group Holdings Ltd. | 68,200 | 996,747 | ||||||
|
| |||||||
| 2,424,728 | ||||||||
|
| |||||||
| 4,564,363 | ||||||||
|
| |||||||
MATERIALS–4.0% | ||||||||
CHEMICALS–4.0% | ||||||||
Chr Hansen Holding A/S | 13,376 | 1,062,956 | ||||||
Koninklijke DSM NV | 8,251 | 1,078,782 | ||||||
|
| |||||||
| 2,141,738 | ||||||||
|
| |||||||
COMMUNICATION SERVICES–2.8% | ||||||||
DIVERSIFIED TELECOMMUNICATION SERVICES–1.3% | ||||||||
Cellnex Telecom SA(a) | 15,800 | 681,543 | ||||||
|
| |||||||
INTERACTIVE MEDIA & SERVICES–1.5% | ||||||||
Tencent Holdings Ltd. | 16,900 | 814,176 | ||||||
|
| |||||||
| 1,495,719 | ||||||||
|
| |||||||
ENERGY–1.9% | ||||||||
OIL, GAS & CONSUMABLE FUELS–1.9% | ||||||||
Neste Oyj | 30,047 | 1,045,489 | ||||||
|
| |||||||
UTILITIES–1.1% | ||||||||
WATER UTILITIES–1.1% | ||||||||
Beijing Enterprises Water Group Ltd.(b)(c) | 1,190,000 | $ | 601,887 | |||||
|
| |||||||
Total Common Stocks | 51,932,012 | |||||||
|
| |||||||
SHORT-TERM INVESTMENTS–3.3% | ||||||||
INVESTMENT COMPANIES–3.3% | ||||||||
AB Fixed Income Shares, Inc.–Government Money Market Portfolio–Class AB, 1.53%(d)(e)(f) | 1,750,153 | 1,750,153 | ||||||
|
| |||||||
TOTAL INVESTMENTS BEFORE SECURITY LENDING COLLATERAL FOR SECURITIES LOANED–99.7% | 53,682,165 | |||||||
|
| |||||||
INVESTMENTS OF CASH COLLATERAL FOR SECURITIES | ||||||||
INVESTMENT COMPANIES–3.3% | ||||||||
AB Fixed Income Shares, Inc.–Government Money Market Portfolio–Class AB, 1.53%(d)(e)(f) | 1,786,500 | 1,786,500 | ||||||
|
| |||||||
TOTAL INVESTMENTS–103.0% | 55,468,665 | |||||||
|
| |||||||
Other assets less | (1,589,798 | ) | ||||||
|
| |||||||
NET ASSETS–100.0% | $ | 53,878,867 | ||||||
|
| |||||||
FORWARD CURRENCY EXCHANGE CONTRACTS (see Note D)
| Counterparty | Contracts to Deliver (000) | In Exchange For (000) | Settlement Date | Unrealized Appreciation/ (Depreciation) | ||||||||||||||||||||
Bank of America, NA | USD | 519 | RUB | 33,356 | 1/17/20 | $ | 17,992 | |||||||||||||||||
Bank of America, NA | CHF | 216 | USD | 222 | 2/14/20 | (1,968 | ) | |||||||||||||||||
Barclays Bank PLC | INR | 163,554 | USD | 2,271 | 1/16/20 | (22,962 | ) | |||||||||||||||||
Barclays Bank PLC | USD | 479 | INR | 34,249 | 1/16/20 | 1,528 | ||||||||||||||||||
Barclays Bank PLC | USD | 1,526 | KRW | 1,784,423 | 2/06/20 | 18,630 | ||||||||||||||||||
Barclays Bank PLC | USD | 794 | CNY | 5,577 | 2/13/20 | 6,107 | ||||||||||||||||||
Barclays Bank PLC | USD | 744 | EUR | 664 | 2/14/20 | 3,195 | ||||||||||||||||||
Barclays Bank PLC | USD | 86 | HKD | 671 | 2/14/20 | (22 | ) | |||||||||||||||||
Barclays Bank PLC | USD | 571 | ZAR | 8,669 | 2/14/20 | 44,162 | ||||||||||||||||||
Barclays Bank PLC | TWD | 2,387 | USD | 80 | 2/20/20 | (524 | ) | |||||||||||||||||
10
| AB Variable Products Series Fund | ||
| Counterparty | Contracts to Deliver (000) | In Exchange For (000) | Settlement Date | Unrealized Appreciation/ (Depreciation) | ||||||||||||||||||||
Barclays Bank PLC | USD | 650 | TWD | 19,582 | 2/20/20 | $ | 6,889 | |||||||||||||||||
Citibank, NA | EUR | 546 | USD | 608 | 2/14/20 | (5,721 | ) | |||||||||||||||||
Citibank, NA | USD | 2,314 | AUD | 3,383 | 2/14/20 | 62,023 | ||||||||||||||||||
Credit Suisse International | BRL | 1,181 | USD | 289 | 1/03/20 | (4,336 | ) | |||||||||||||||||
Credit Suisse International | USD | 293 | BRL | 1,181 | 1/03/20 | 583 | ||||||||||||||||||
Credit Suisse International | USD | 289 | BRL | 1,181 | 2/04/20 | 4,425 | ||||||||||||||||||
Deutsche Bank AG | EUR | 5,790 | USD | 6,413 | 2/14/20 | (98,412 | ) | |||||||||||||||||
Goldman Sachs Bank USA | USD | 1,084 | TWD | 32,458 | 2/20/20 | 4,844 | ||||||||||||||||||
JPMorgan Chase Bank, NA | BRL | 1,181 | USD | 293 | 1/03/20 | (583 | ) | |||||||||||||||||
JPMorgan Chase Bank, NA | USD | 281 | BRL | 1,181 | 1/03/20 | 12,843 | ||||||||||||||||||
JPMorgan Chase Bank, NA | INR | 14,125 | USD | 198 | 1/16/20 | (423 | ) | |||||||||||||||||
JPMorgan Chase Bank, NA | USD | 3,353 | CAD | 4,440 | 2/14/20 | 67,162 | ||||||||||||||||||
Morgan Stanley & Co., Inc. | USD | 92 | INR | 6,592 | 1/16/20 | 328 | ||||||||||||||||||
Morgan Stanley & Co., Inc. | HKD | 4,313 | USD | 553 | 2/14/20 | (168 | ) | |||||||||||||||||
Morgan Stanley & Co., Inc. | USD | 1,781 | JPY | 192,525 | 2/14/20 | (5,080 | ) | |||||||||||||||||
Natwest Markets PLC | USD | 84 | INR | 5,952 | 1/16/20 | (312 | ) | |||||||||||||||||
Natwest Markets PLC | EUR | 771 | USD | 860 | 2/14/20 | (6,772 | ) | |||||||||||||||||
Natwest Markets PLC | USD | 576 | GBP | 445 | 2/14/20 | 14,169 | ||||||||||||||||||
Standard Chartered Bank | USD | 523 | INR | 37,346 | 1/16/20 | 507 | ||||||||||||||||||
Standard Chartered Bank | USD | 99 | KRW | 114,755 | 2/06/20 | 494 | ||||||||||||||||||
Standard Chartered Bank | USD | 156 | CNY | 1,100 | 2/13/20 | 1,676 | ||||||||||||||||||
State Street Bank & Trust Co. | AUD | 467 | USD | 317 | 2/14/20 | (11,247 | ) | |||||||||||||||||
State Street Bank & Trust Co. | CHF | 978 | USD | 995 | 2/14/20 | (18,136 | ) | |||||||||||||||||
State Street Bank & Trust Co. | EUR | 1,944 | USD | 2,169 | 2/14/20 | (17,591 | ) | |||||||||||||||||
State Street Bank & Trust Co. | GBP | 331 | USD | 434 | 2/14/20 | (4,760 | ) | |||||||||||||||||
State Street Bank & Trust Co. | JPY | 37,010 | USD | 343 | 2/14/20 | 1,209 | ||||||||||||||||||
State Street Bank & Trust Co. | JPY | 26,859 | USD | 246 | 2/14/20 | (1,618 | ) | |||||||||||||||||
State Street Bank & Trust Co. | NOK | 2,375 | USD | 263 | 2/14/20 | (7,449 | ) | |||||||||||||||||
State Street Bank & Trust Co. | SEK | 11,668 | USD | 1,211 | 2/14/20 | (36,785 | ) | |||||||||||||||||
State Street Bank & Trust Co. | USD | 307 | AUD | 445 | 2/14/20 | 5,861 | ||||||||||||||||||
State Street Bank & Trust Co. | USD | 104 | CAD | 137 | 2/14/20 | 1,725 | ||||||||||||||||||
State Street Bank & Trust Co. | USD | 903 | EUR | 812 | 2/14/20 | 10,434 | ||||||||||||||||||
State Street Bank & Trust Co. | USD | 902 | GBP | 698 | 2/14/20 | 23,390 | ||||||||||||||||||
State Street Bank & Trust Co. | USD | 490 | JPY | 53,219 | 2/14/20 | 662 | ||||||||||||||||||
State Street Bank & Trust Co. | USD | 621 | JPY | 67,141 | 2/14/20 | (1,751 | ) | |||||||||||||||||
State Street Bank & Trust Co. | USD | 272 | MXN | 5,349 | 2/14/20 | 9,275 | ||||||||||||||||||
State Street Bank & Trust Co. | USD | 65 | NZD | 102 | 2/14/20 | 3,377 | ||||||||||||||||||
State Street Bank & Trust Co. | USD | 79 | SEK | 741 | 2/14/20 | 455 | ||||||||||||||||||
|
| |||||||||||||||||||||||
| $ | 77,325 | |||||||||||||||||||||||
|
| |||||||||||||||||||||||
| (a) | Security is exempt from registration under Rule 144A of the Securities Act of 1933. These securities are considered restricted, but liquid and may be resold in transactions exempt from registration, normally to qualified institutional buyers. At December 31, 2019, the aggregate market value of these securities amounted to $1,520,591 or 2.8% of net assets. |
| (b) | Non-income producing security. |
| (c) | Represents entire or partial securities out on loan. See Note E for securities lending information. |
| (d) | Affiliated investments. |
| (e) | The rate shown represents the7-day yield as of period end. |
| (f) | To obtain a copy of the fund’s shareholder report, please go to the Securities and Exchange Commission’s website at www.sec.gov, or call AB at (800)227-4618. |
11
| INTERNATIONAL GROWTH PORTFOLIO | ||
| PORTFOLIO OF INVESTMENTS | ||
| (continued) | AB Variable Products Series Fund | |
Currency Abbreviations:
AUD—Australian Dollar
BRL—Brazilian Real
CAD—Canadian Dollar
CHF—Swiss Franc
CNY—Chinese Yuan Renminbi
EUR—Euro
GBP—Great British Pound
HKD—Hong Kong Dollar
INR—Indian Rupee
JPY—Japanese Yen
KRW—South Korean Won
MXN—Mexican Peso
NOK—Norwegian Krone
NZD—New Zealand Dollar
RUB—Russian Ruble
SEK—Swedish Krona
TWD—New Taiwan Dollar
USD—United States Dollar
ZAR—South African Rand
See notes to financial statements.
12
| INTERNATIONAL GROWTH PORTFOLIO | ||
| STATEMENT OF ASSETS & LIABILITIES | ||
| December 31, 2019 | AB Variable Products Series Fund | |
ASSETS |
| |||
Investments in securities, at value | ||||
Unaffiliated issuers (cost $39,487,365) | $ | 51,932,012 | (a) | |
Affiliated issuers (cost $3,536,653—including investment of cash collateral for securities loaned of $1,786,500) | 3,536,653 | |||
Foreign currencies, at value (cost $146,084) | 147,686 | |||
Unrealized appreciation on forward currency exchange contracts | 323,945 | |||
Unaffiliated dividends receivable | 106,607 | |||
Receivable for investment securities sold | 58,503 | |||
Affiliated dividends receivable | 2,604 | |||
Receivable for capital stock sold | 1,714 | |||
|
| |||
Total assets | 56,109,724 | |||
|
| |||
LIABILITIES |
| |||
Payable for collateral received on securities loaned | 1,786,500 | |||
Unrealized depreciation on forward currency exchange contracts | 246,620 | |||
Advisory fee payable | 30,368 | |||
Payable for investment securities purchased | 29,915 | |||
Payable for capital stock redeemed | 22,476 | |||
Administrative fee payable | 21,213 | |||
Distribution fee payable | 6,041 | |||
Transfer Agent fee payable | 132 | |||
Accrued expenses | 87,592 | |||
|
| |||
Total liabilities | 2,230,857 | |||
|
| |||
NET ASSETS | $ | 53,878,867 | ||
|
| |||
COMPOSITION OF NET ASSETS |
| |||
Capital stock, at par | $ | 2,313 | ||
Additionalpaid-in capital | 36,412,220 | |||
Distributable earnings | 17,464,334 | |||
|
| |||
| $ | 53,878,867 | |||
|
| |||
Net Asset Value Per Share—1 billion shares of capital stock authorized, $.001 par value
| Class | Net Assets | Shares Outstanding | Net Asset Value | |||||||||
| A | $ | 24,122,845 | 1,027,053 | $ | 23.49 | |||||||
| B | $ | 29,756,022 | 1,285,533 | $ | 23.15 | |||||||
| (a) | Includes securities on loan with a value of $3,983,027 (see Note E). |
See notes to financial statements.
13
| INTERNATIONAL GROWTH PORTFOLIO | ||
| STATEMENT OF OPERATIONS | ||
| Year Ended December 31, 2019 | AB Variable Products Series Fund | |
INVESTMENT INCOME | ||||
Dividends | ||||
Unaffiliated issuers (net of foreign taxes withheld of $91,544) | $ | 859,461 | ||
Affiliated issuers | 53,189 | |||
Securities lending income | 2,814 | |||
|
| |||
| 915,464 | ||||
|
| |||
EXPENSES | ||||
Advisory fee (see Note B) | 390,662 | |||
Distribution fee—Class B | 72,838 | |||
Transfer agency—Class A | 2,597 | |||
Transfer agency—Class B | 3,278 | |||
Custodian | 98,056 | |||
Administrative | 77,520 | |||
Audit and tax | 65,909 | |||
Printing | 32,027 | |||
Legal | 31,790 | |||
Directors’ fees | 22,925 | |||
Miscellaneous | 11,360 | |||
|
| |||
Total expenses | 808,962 | |||
Less: expenses waived and reimbursed by the Adviser (see Notes B & E) | (28,238 | ) | ||
|
| |||
Net expenses | 780,724 | |||
|
| |||
Net investment income | 134,740 | |||
|
| |||
REALIZED AND UNREALIZED GAIN ON INVESTMENT AND FOREIGN CURRENCY TRANSACTIONS | ||||
Net realized gain on: | ||||
Investment transactions | 4,401,745 | |||
Forward currency exchange contracts | 114,978 | |||
Foreign currency transactions | 175,775 | |||
Net change in unrealized appreciation/depreciation of: | ||||
Investments | 7,508,235 | |||
Forward currency exchange contracts | 229,914 | |||
Foreign currency denominated assets and liabilities | 2,788 | |||
|
| |||
Net gain on investment and foreign currency transactions | 12,433,435 | |||
|
| |||
NET INCREASE IN NET ASSETS FROM OPERATIONS | $ | 12,568,175 | ||
|
|
See notes to financial statements.
14
| INTERNATIONAL GROWTH PORTFOLIO | ||
| STATEMENT OF CHANGES IN NET ASSETS | AB Variable Products Series Fund | |
| Year Ended December 31, 2019 | Year Ended December 31, 2018 | |||||||
INCREASE (DECREASE) IN NET ASSETS FROM OPERATIONS |
| |||||||
Net investment income | $ | 134,740 | $ | 320,481 | ||||
Net realized gain on investment and foreign currency transactions | 4,692,498 | 1,370,202 | ||||||
Net change in unrealized appreciation/depreciation of investments and foreign currency denominated assets and liabilities | 7,740,937 | (12,501,104 | ) | |||||
|
|
|
| |||||
Net increase (decrease) in net assets from operations | 12,568,175 | (10,810,421 | ) | |||||
Distributions to Shareholders |
| |||||||
Class A | (688,238 | ) | (178,413 | ) | ||||
Class B | (794,928 | ) | (140,185 | ) | ||||
CAPITAL STOCK TRANSACTIONS |
| |||||||
Net decrease | (6,897,421 | ) | (10,504,589 | ) | ||||
|
|
|
| |||||
Total increase (decrease) | 4,187,588 | (21,633,608 | ) | |||||
NET ASSETS |
| |||||||
Beginning of period | 49,691,279 | 71,324,887 | ||||||
|
|
|
| |||||
End of period | $ | 53,878,867 | $ | 49,691,279 | ||||
|
|
|
| |||||
See notes to financial statements.
15
| INTERNATIONAL GROWTH PORTFOLIO | ||
| NOTES TO FINANCIAL STATEMENTS | ||
| December 31, 2019 | AB Variable Products Series Fund | |
NOTE A: Significant Accounting Policies
The AB International Growth Portfolio (the “Portfolio”) is a series of AB Variable Products Series Fund, Inc. (the “Fund”). The Portfolio’s investment objective is long-term growth of capital. The Portfolio is diversified as defined under the Investment Company Act of 1940. The Fund was incorporated in the State of Maryland on November 17, 1987, as anopen-end series investment company. The Fund offers eleven separately managed pools of assets which have differing investment objectives and policies. The Portfolio offers Class A and Class B shares. Both classes of shares have identical voting, dividend, liquidating and other rights, except that Class B shares bear a distribution expense and have exclusive voting rights with respect to the Class B distribution plan.
The Portfolio offers and sells its shares only to separate accounts of certain life insurance companies for the purpose of funding variable annuity contracts and variable life insurance policies. Sales are made without a sales charge at the Portfolio’s net asset value per share.
The financial statements have been prepared in conformity with U.S. generally accepted accounting principles (“U.S. GAAP”) which require management to make certain estimates and assumptions that affect the reported amounts of assets and liabilities in the financial statements and amounts of income and expenses during the reporting period. Actual results could differ from those estimates. The Portfolio is an investment company under U.S. GAAP and follows the accounting and reporting guidance applicable to investment companies. The following is a summary of significant accounting policies followed by the Portfolio.
1. Security Valuation
Portfolio securities are valued at their current market value determined on the basis of market quotations or, if market quotations are not readily available or are deemed unreliable, at “fair value” as determined in accordance with procedures established by and under the general supervision of the Fund’s Board of Directors (the “Board”).
In general, the market values of securities which are readily available and deemed reliable are determined as follows: securities listed on a national securities exchange (other than securities listed on the NASDAQ Stock Market, Inc. (“NASDAQ”)) or on a foreign securities exchange are valued at the last sale price at the close of the exchange or foreign securities exchange. If there has been no sale on such day, the securities are valued at the last traded price from the previous day. Securities listed on more than one exchange are valued by reference to the principal exchange on which the securities are traded; securities listed only on NASDAQ are valued in accordance with the NASDAQ Official Closing Price; listed or over the counter (“OTC”) market put or call options are valued at the mid level between the current bid and ask prices. If either a current bid or current ask price is unavailable, AllianceBernstein L.P. (the “Adviser”) will have discretion to determine the best valuation (e.g., last trade price in the case of listed options); open futures are valued using the closing settlement price or, in the absence of such a price, the most recent quoted bid price. If there are no quotations available for the day of valuation, the last available closing settlement price is used; U.S. Government securities and any other debt instruments having 60 days or less remaining until maturity are generally valued at market by an independent pricing vendor, if a market price is available. If a market price is not available, the securities are valued at amortized cost. This methodology is commonly used for short term securities that have an original maturity of 60 days or less, as well as short term securities that had an original term to maturity that exceeded 60 days. In instances when amortized cost is utilized, the Valuation Committee (the “Committee”) must reasonably conclude that the utilization of amortized cost is approximately the same as the fair value of the security. Such factors the Committee will consider include, but are not limited to, an impairment of the creditworthiness of the issuer or material changes in interest rates. Fixed-income securities, including mortgage-backed and asset-backed securities, may be valued on the basis of prices provided by a pricing service or at a price obtained from one or more of the major broker-dealers. In cases where broker-dealer quotes are obtained, the Adviser may establish procedures whereby changes in market yields or spreads are used to adjust, on a daily basis, a recently obtained quoted price on a security. Swaps and other derivatives are valued daily, primarily using independent pricing services, independent pricing models using market inputs, as well as third party broker-dealers or counterparties. Open end mutual funds are valued at the closing net asset value per share, while exchange traded funds are valued at the closing market price per share.
Securities for which market quotations are not readily available (including restricted securities) or are deemed unreliable are valued at fair value as deemed appropriate by the Adviser. Factors considered in making this determination may include, but are not limited to, information obtained by contacting the issuer, analysts, analysis of the issuer’s financial statements or other available documents. In addition, the Portfolio may use fair value pricing for securities primarily traded innon-U.S. markets because most foreign markets close well before the Portfolio values its securities at 4:00 p.m., Eastern Time. The
16
| AB Variable Products Series Fund | ||
earlier close of these foreign markets gives rise to the possibility that significant events, including broad market moves, may have occurred in the interim and may materially affect the value of those securities. To account for this, the Portfolio generally values many of its foreign equity securities using fair value prices based on third party vendor modeling tools to the extent available.
2. Fair Value Measurements
In accordance with U.S. GAAP regarding fair value measurements, fair value is defined as the price that the Portfolio would receive to sell an asset or pay to transfer a liability in an orderly transaction between market participants at the measurement date. U.S. GAAP establishes a framework for measuring fair value, and a three-level hierarchy for fair value measurements based upon the transparency of inputs to the valuation of an asset or liability (including those valued based on their market values as described in Note A.1 above). Inputs may be observable or unobservable and refer broadly to the assumptions that market participants would use in pricing the asset or liability. Observable inputs reflect the assumptions market participants would use in pricing the asset or liability based on market data obtained from sources independent of the Portfolio. Unobservable inputs reflect the Portfolio’s own assumptions about the assumptions that market participants would use in pricing the asset or liability based on the best information available in the circumstances. Each investment is assigned a level based upon the observability of the inputs which are significant to the overall valuation. The three-tier hierarchy of inputs is summarized below.
| • | Level 1—quoted prices in active markets for identical investments |
| • | Level 2—other significant observable inputs (including quoted prices for similar investments, interest rates, prepayment speeds, credit risk, etc.) |
| • | Level 3—significant unobservable inputs (including the Portfolio’s own assumptions in determining the fair value of investments) |
Where readily available market prices or relevant bid prices are not available for certain equity investments, such investments may be valued based on similar publicly traded investments, movements in relevant indices since last available prices or based upon underlying company fundamentals and comparable company data (such as multiples to earnings or other multiples to equity). Where an investment is valued using an observable input, such as another publicly traded security, the investment will be classified as Level 2. If management determines that an adjustment is appropriate based on restrictions on resale, illiquidity or uncertainty, and such adjustment is a significant component of the valuation, the investment will be classified as Level 3. An investment will also be classified as Level 3 where management uses company fundamentals and other significant inputs to determine the valuation.
The following table summarizes the valuation of the Portfolio’s investments by the above fair value hierarchy levels as of December 31, 2019:
| Level 1 | Level 2 | Level 3 | Total | |||||||||||||
Investments in Securities: | ||||||||||||||||
Assets: | ||||||||||||||||
Common Stocks: | ||||||||||||||||
Information Technology | $ | 1,882,516 | $ | 8,764,423 | $ | –0 | – | $ | 10,646,939 | |||||||
Financials | –0 | – | 9,000,111 | –0 | – | 9,000,111 | ||||||||||
Health Care | 1,980,596 | 5,964,974 | –0 | – | 7,945,570 | |||||||||||
Industrials | 1,978,509 | 5,711,713 | –0 | – | 7,690,222 | |||||||||||
Consumer Staples | 1,151,372 | 5,648,602 | –0 | – | 6,799,974 | |||||||||||
Consumer Discretionary | 2,963,285 | 1,601,078 | –0 | – | 4,564,363 | |||||||||||
Materials | 1,062,956 | 1,078,782 | –0 | – | 2,141,738 | |||||||||||
Communication Services | –0 | – | 1,495,719 | –0 | – | 1,495,719 | ||||||||||
Energy | 1,045,489 | –0 | – | –0 | – | 1,045,489 | ||||||||||
Utilities | –0 | – | 601,887 | –0 | – | 601,887 | ||||||||||
Short-Term Investments | 1,750,153 | –0 | – | –0 | – | 1,750,153 | ||||||||||
Investments of Cash Collateral for Securities Loaned in Affiliated Money Market Fund | 1,786,500 | –0 | – | –0 | – | 1,786,500 | ||||||||||
|
|
|
|
|
|
|
| |||||||||
Total Investments in Securities | 15,601,376 | 39,867,289 | (a) | –0 | – | 55,468,665 | ||||||||||
17
| INTERNATIONAL GROWTH PORTFOLIO | ||
| NOTES TO FINANCIAL STATEMENTS | ||
| (continued) | AB Variable Products Series Fund | |
| Level 1 | Level 2 | Level 3 | Total | |||||||||||||
Other Financial Instruments(b): | ||||||||||||||||
Assets: | ||||||||||||||||
Forward Currency Exchange Contracts | $ | –0 | – | $ | 323,945 | $ | –0 | – | $ | 323,945 | ||||||
Liabilities: | ||||||||||||||||
Forward Currency Exchange Contracts | –0 | – | (246,620 | ) | –0 | – | (246,620 | ) | ||||||||
|
|
|
|
|
|
|
| |||||||||
Total | $ | 15,601,376 | $ | 39,944,614 | $ | –0 | – | $ | 55,545,990 | |||||||
|
|
|
|
|
|
|
| |||||||||
| (a) | A significant portion of the Portfolio’s foreign equity investments are categorized as Level 2 investments since they are valued using fair value prices based on third party vendor modeling tools to the extent available, see Note A.1. |
| (b) | Other financial instruments are derivative instruments, such as futures, forwards and swaps, which are valued at the unrealized appreciation/(depreciation) on the instrument. Other financial instruments may also include swaps with upfront premiums, options written and swaptions written which are valued at market value. |
3. Currency Translation
Assets and liabilities denominated in foreign currencies and commitments under forward currency exchange contracts are translated into U.S. dollars at the mean of the quoted bid and ask prices of such currencies against the U.S. dollar. Purchases and sales of portfolio securities are translated into U.S. dollars at the rates of exchange prevailing when such securities were acquired or sold. Income and expenses are translated into U.S. dollars at rates of exchange prevailing when accrued.
Net realized gain or loss on foreign currency transactions represents foreign exchange gains and losses from sales and maturities of foreign fixed income investments, holding of foreign currencies, currency gains or losses realized between the trade and settlement dates on foreign investment transactions, and the difference between the amounts of dividends, interest and foreign withholding taxes recorded on the Portfolio’s books and the U.S. dollar equivalent amounts actually received or paid. Net unrealized currency gains and losses from valuing foreign currency denominated assets and liabilities at period end exchange rates are reflected as a component of net unrealized appreciation or depreciation of foreign currency denominated assets and liabilities.
4. Taxes
It is the Portfolio’s policy to meet the requirements of the Internal Revenue Code applicable to regulated investment companies and to distribute all of its investment company taxable income and net realized gains, if any, to shareholders. Therefore, no provisions for federal income or excise taxes are required. The Portfolio may be subject to taxes imposed by countries in which it invests. Such taxes are generally based on income and/or capital gains earned or repatriated. Taxes are accrued and applied to net investment income, net realized gains and net unrealized appreciation/depreciation as such income and/or gains are earned.
In accordance with U.S. GAAP requirements regarding accounting for uncertainties in income taxes, management has analyzed the Portfolio’s tax positions taken or expected to be taken on federal and state income tax returns for all open tax years (the current and the prior three tax years) and has concluded that no provision for income tax is required in the Portfolio’s financial statements.
5. Investment Income and Investment Transactions
Dividend income is recorded on theex-dividend date or as soon as the Portfolio is informed of the dividend. Interest income is accrued daily. Investment transactions are accounted for on the date the securities are purchased or sold. Investment gains or losses are determined on the identified cost basis. The Portfolio amortizes premiums and accretes discounts as adjustments to interest income.
6. Class Allocations
All income earned and expenses incurred by the Portfolio are borne on apro-rata basis by each outstanding class of shares, based on the proportionate interest in the Portfolio represented by the net assets of such class, except for class specific expenses which are allocated to the respective class. Expenses of the Fund are charged proportionately to each portfolio or based on other appropriate methods. Realized and unrealized gains and losses are allocated among the various share classes based on respective net assets.
18
| AB Variable Products Series Fund | ||
7. Dividends and Distributions
Dividends and distributions to shareholders, if any, are recorded on theex-dividend date. Income dividends and capital gains distributions are determined in accordance with federal tax regulations and may differ from those determined in accordance with U.S. GAAP. To the extent these differences are permanent, such amounts are reclassified within the capital accounts based on their federal tax basis treatment; temporary differences do not require such reclassification.
NOTE B: Advisory Fee and Other Transactions with Affiliates
Under the terms of the investment advisory agreement, the Portfolio pays the Adviser an advisory fee at an annual rate of .75% of the first $2.5 billion, .65% of the next $2.5 billion and .60% in excess of $5 billion, of the Portfolio’s average daily net assets. The fee is accrued daily and paid monthly. Effective September 4, 2018, the Adviser has contractually agreed to waive its management fee and/or bear expenses of the Portfolio in order to reduce the Portfolio’s total operating expenses by an amount equal to 0.05% on an annual basis of the average net assets for Class A and Class B. For the year ended December 31, 2019, such reimbursements/waivers amounted to $26,044. This fee waiver and/or expense reimbursement agreement extends through May 1, 2020 and then may be extended by the Adviser for additionalone-year terms.
Pursuant to the investment advisory agreement, the Portfolio may reimburse the Adviser for certain legal and accounting services provided to the Portfolio by the Adviser. For the year ended December 31, 2019, the reimbursement for such services amounted to $77,520.
The Portfolio compensates AllianceBernstein Investor Services, Inc. (“ABIS”), a wholly-owned subsidiary of the Adviser, under a Transfer Agency Agreement for providing personnel and facilities to perform transfer agency services for the Portfolio. Such compensation retained by ABIS amounted to $1,491 for the year ended December 31, 2019.
The Portfolio may invest in AB Government Money Market Portfolio (the “Government Money Market Portfolio”) which has a contractual annual advisory fee rate of .20% of the portfolio’s average daily net assets and bears its own expenses. The Adviser has contractually agreed to waive .10% of the advisory fee of Government Money Market Portfolio (resulting in a net advisory fee of ..10%) until August 31, 2020. In connection with the investment by the Portfolio in Government Money Market Portfolio, the Adviser has contractually agreed to waive its advisory fee from the Portfolio in an amount equal to the Portfolio’s pro rata share of the effective advisory fee of Government Money Market Portfolio, as borne indirectly by the Portfolio as an acquired fund fee and expense. For the year ended December 31, 2019, such waiver amounted to $2,019.
A summary of the Portfolio’s transactions in AB mutual funds for the year ended December 31, 2019 is as follows:
Fund | Market Value 12/31/18 (000) | Purchases at Cost (000) | Sales Proceeds (000) | Market Value 12/31/19 (000) | Dividend Income (000) | |||||||||||||||
Government Money Market Portfolio | $ | 2,555 | $ | 15,262 | $ | 16,067 | $ | 1,750 | $ | 43 | ||||||||||
Government Money Market Portfolio* | 1,517 | 11,247 | 10,977 | 1,787 | 10 | |||||||||||||||
|
|
|
| |||||||||||||||||
Total | $ | 3,537 | $ | 53 | ||||||||||||||||
|
|
|
| |||||||||||||||||
| * | Investments of cash collateral for securities lending transactions (see Note E). |
During the second quarter of 2018, AXA S.A. (“AXA”), a French holding company for the AXA Group, a worldwide leader in life, property and casualty and health insurance and asset management, completed the sale of a minority stake in its subsidiary, AXA Equitable Holdings, Inc. (now named Equitable Holdings, Inc.) (“Equitable”), through an initial public offering. Equitable is the holding company for a diverse group of financial services companies, including an approximately 65.3% economic interest in the Adviser and a 100% interest in AllianceBernstein Corporation, the general partner of the Adviser. Since the initial sale, AXA has completed additional offerings, most recently during the fourth quarter of 2019. As a result, AXA currently owns 10.1% of the outstanding shares of common stock of Equitable, and no longer owns a controlling interest in Equitable. AXA previously announced its intention to sell its entire interest in Equitable over time, subject to market conditions and other factors (the “Plan”). Most of AXA’s remaining Equitable shares are to be delivered on redemption of AXA bonds mandatorily exchangeable into Equitable shares and maturing in May 2021. AXA retains sole discretion to determine the timing of any future sales of its remaining shares of Equitable common stock.
The latest transaction under the Plan, which occurred on November 13, 2019, resulted in the indirect transfer of a “controlling block” of voting securities of the Adviser (a “Change of Control Event”) and was deemed an “assignment” causing a termination of the Portfolio’s investment advisory agreement. In order to ensure that investment advisory services
19
| INTERNATIONAL GROWTH PORTFOLIO | ||
| NOTES TO FINANCIAL STATEMENTS | ||
| (continued) | AB Variable Products Series Fund | |
could continue uninterrupted in the event of a Change of Control Event, the Board previously approved a new investment advisory agreement with the Adviser, and shareholders of the Portfolio subsequently approved the new investment advisory agreement. This agreement became effective on November 13, 2019.
NOTE C: Distribution Plan
The Portfolio has adopted a Distribution Plan (the “Plan”) for Class B shares pursuant to Rule12b-1 under the Investment Company Act of 1940. Under the Plan, the Portfolio pays distribution and servicing fees to AllianceBernstein Investments, Inc. (the “Distributor”), a wholly-owned subsidiary of the Adviser, at an annual rate of up to .50% of the Portfolio’s average daily net assets attributable to Class B shares. The fees are accrued daily and paid monthly. The Board currently limits payments under the Plan to .25% of the Portfolio’s average daily net assets attributable to Class B shares. The Plan provides that the Distributor will use such payments in their entirety for distribution assistance and promotional activities.
The Portfolio is not obligated under the Plan to pay any distribution and servicing fees in excess of the amounts set forth above. The purpose of the payments to the Distributor under the Plan is to compensate the Distributor for its distribution services with respect to the sale of the Portfolio’s Class B shares. Since the Distributor’s compensation is not directly tied to its expenses, the amount of compensation received by it under the Plan during any year may be more or less than its actual expenses. For this reason, the Plan is characterized by the staff of the Securities and Exchange Commission as being of the “compensation” variety.
In the event that the Plan is terminated or not continued, no distribution or servicing fees (other than current amounts accrued but not yet paid) would be owed by the Portfolio to the Distributor.
The Plan also provides that the Adviser may use its own resources to finance the distribution of the Portfolio’s shares.
NOTE D: Investment Transactions
Purchases and sales of investment securities (excluding short-term investments) for the year ended December 31, 2019 were as follows:
| Purchases | Sales | |||||||
Investment securities (excluding U.S. government securities) | $ | 24,479,872 | $ | 31,433,217 | ||||
U.S. government securities | –0 | – | –0 | – | ||||
The cost of investments for federal income tax purposes, gross unrealized appreciation and unrealized depreciation are as follows:
Cost | $ | 43,117,061 | ||
|
| |||
Gross unrealized appreciation | $ | 13,338,058 | ||
Gross unrealized depreciation | (975,434 | ) | ||
|
| |||
Net unrealized appreciation | $ | 12,362,624 | ||
|
|
1. Derivative Financial Instruments
The Portfolio may use derivatives in an effort to earn income and enhance returns, to replace more traditional direct investments, to obtain exposure to otherwise inaccessible markets (collectively, “investment purposes”), or to hedge or adjust the risk profile of its portfolio.
The principal type of derivative utilized by the Portfolio, as well as the methods in which they may be used are:
| • | Forward Currency Exchange Contracts |
The Portfolio may enter into forward currency exchange contracts in order to hedge its exposure to changes in foreign currency exchange rates on its foreign portfolio holdings, to hedge certain firm purchase and sale commitments denominated in foreign currencies and fornon-hedging purposes as a means of making direct investments in foreign currencies, as described below under “Currency Transactions”.
A forward currency exchange contract is a commitment to purchase or sell a foreign currency at a future date at a negotiated forward rate. The gain or loss arising from the difference between the original contract and the closing of such contract would be included in net realized gain or loss on forward currency exchange contracts. Fluctuations in the value of open forward currency exchange contracts are recorded for financial reporting purposes as unrealized
20
| AB Variable Products Series Fund | ||
appreciation and/or depreciation by the Portfolio. Risks may arise from the potential inability of a counterparty to meet the terms of a contract and from unanticipated movements in the value of a foreign currency relative to the U.S. dollar.
During the year ended December 31, 2019, the Portfolio held forward currency exchange contracts for hedging purposes.
The Portfolio typically enters into International Swaps and Derivatives Association, Inc. Master Agreements (“ISDA Master Agreement”) with its OTC derivative contract counterparties in order to, among other things, reduce its credit risk to OTC counterparties. ISDA Master Agreements include provisions for general obligations, representations, collateral and events of default or termination. Under an ISDA Master Agreement, the Portfolio typically may offset with the OTC counterparty certain derivative financial instruments’ payables and/or receivables with collateral held and/or posted and create one single net payment(close-out netting) in the event of default or termination. In the event of a default by an OTC counterparty, the return of collateral with market value in excess of the Portfolio’s net liability, held by the defaulting party, may be delayed or denied.
The Portfolio’s ISDA Master Agreements may contain provisions for early termination of OTC derivative transactions in the event the net assets of the Portfolio decline below specific levels (“net asset contingent features”). If these levels are triggered, the Portfolio’s OTC counterparty has the right to terminate such transaction and require the Portfolio to pay or receive a settlement amount in connection with the terminated transaction. If OTC derivatives were held at period end, please refer to netting arrangements by the OTC counterparty table below for additional details.
During the year ended December 31, 2019, the Portfolio had entered into the following derivatives:
Asset Derivatives | Liability Derivatives | |||||||||||
Derivative Type | Statement of | Fair Value | Statement of | Fair Value | ||||||||
Foreign currency contracts | Unrealized appreciation on forward currency exchange contracts | $ | 323,945 | Unrealized depreciation on forward currency exchange contracts | $ | 246,620 | ||||||
|
|
|
| |||||||||
Total | $ | 323,945 | $ | 246,620 | ||||||||
|
|
|
| |||||||||
Derivative Type | Location of Gain or (Loss) on Derivatives | Realized Gain or (Loss) on Derivatives | Change in Unrealized Appreciation or (Depreciation) | |||||||
Foreign currency contracts | Net realized gain (loss) on forward currency exchange contracts; Net change in unrealized appreciation/depreciation of forward currency exchange contracts | $ | 114,978 | $ | 229,914 | |||||
|
|
|
| |||||||
Total | $ | 114,978 | $ | 229,914 | ||||||
|
|
|
| |||||||
The following table represents the average monthly volume of the Portfolio’s derivative transactions during the year ended December 31, 2019:
Forward Currency Exchange Contracts: | ||||
Average principal amount of buy contracts | $ | 21,999,708 | ||
Average principal amount of sale contracts | $ | 19,920,232 |
For financial reporting purposes, the Portfolio does not offset derivative assets and derivative liabilities that are subject to netting arrangements in the statement of assets and liabilities.
21
| INTERNATIONAL GROWTH PORTFOLIO | ||
| NOTES TO FINANCIAL STATEMENTS | ||
| (continued) | AB Variable Products Series Fund | |
All OTC derivatives held at period end were subject to netting arrangements. The following table presents the Portfolio’s derivative assets and liabilities by OTC counterparty net of amounts available for offset under ISDA Master Agreements (“MA”) and net of the related collateral received/pledged by the Portfolio as of December 31, 2019. Exchange-traded derivatives and centrally cleared swaps are not subject to netting arrangements and as such are excluded from the table.
Counterparty | Derivative Assets Subject to a MA | Derivatives Available for Offset | Cash Collateral Received* | Security Collateral Received* | Net Amount of Derivative Assets | |||||||||||||||
Bank of America, NA | $ | 17,992 | $ | (1,968 | ) | $ | –0 | – | $ | –0 | – | $ | 16,024 | |||||||
Barclays Bank PLC | 80,511 | (23,508 | ) | –0 | – | –0 | – | 57,003 | ||||||||||||
Citibank, NA | 62,023 | (5,721 | ) | –0 | – | –0 | – | 56,302 | ||||||||||||
Credit Suisse International | 5,008 | (4,336 | ) | –0 | – | –0 | – | 672 | ||||||||||||
Goldman Sachs Bank USA | 4,844 | –0 | – | –0 | – | –0 | – | 4,844 | ||||||||||||
JPMorgan Chase Bank, NA | 80,005 | (1,006 | ) | –0 | – | –0 | – | 78,999 | ||||||||||||
Morgan Stanley & Co., Inc. | 328 | (328 | ) | –0 | – | –0 | – | –0 | – | |||||||||||
Natwest Markets PLC | 14,169 | (7,084 | ) | –0 | – | –0 | – | 7,085 | ||||||||||||
Standard Chartered Bank | 2,677 | –0 | – | –0 | – | –0 | – | 2,677 | ||||||||||||
State Street Bank & Trust Co. | 56,388 | (56,388 | ) | –0 | – | –0 | – | –0 | – | |||||||||||
|
|
|
|
|
|
|
|
|
| |||||||||||
Total | $ | 323,945 | $ | (100,339 | ) | $ | –0 | – | $ | –0 | – | $ | 223,606 | ^ | ||||||
|
|
|
|
|
|
|
|
|
| |||||||||||
Counterparty | Derivative Liabilities Subject to a MA | Derivatives Available for Offset | Cash Collateral Pledged* | Security Collateral Pledged* | Net Amount of Derivative Liabilities | |||||||||||||||
Bank of America, NA | $ | 1,968 | $ | (1,968 | ) | $ | –0 | – | $ | –0 | – | $ | –0 | – | ||||||
Barclays Bank PLC | 23,508 | (23,508 | ) | –0 | – | –0 | – | –0 | – | |||||||||||
Citibank, NA | 5,721 | (5,721 | ) | –0 | – | –0 | – | –0 | – | |||||||||||
Credit Suisse International | 4,336 | (4,336 | ) | –0 | – | –0 | – | –0 | – | |||||||||||
Deutsche Bank AG | 98,412 | –0 | – | –0 | – | –0 | – | 98,412 | ||||||||||||
JPMorgan Chase Bank, NA | 1,006 | (1,006 | ) | –0 | – | –0 | – | –0 | – | |||||||||||
Morgan Stanley & Co., Inc. | 5,248 | (328 | ) | –0 | – | –0 | – | 4,920 | ||||||||||||
Natwest Markets PLC | 7,084 | (7,084 | ) | –0 | – | –0 | – | –0 | – | |||||||||||
State Street Bank & Trust Co. | 99,337 | (56,388 | ) | –0 | – | –0 | – | 42,949 | ||||||||||||
|
|
|
|
|
|
|
|
|
| |||||||||||
Total | $ | 246,620 | $ | (100,339 | ) | $ | –0 | – | $ | –0 | – | $ | 146,281 | ^ | ||||||
|
|
|
|
|
|
|
|
|
| |||||||||||
| * | The actual collateral received/pledged may be more than the amount reported due to over-collateralization. |
| ^ | Net amount represents the net receivable/payable that would be due from/to the counterparty in the event of default or termination. The net amount from OTC financial derivative instruments can only be netted across transactions governed under the same master agreement with the same counterparty. |
2. Currency Transactions
The Portfolio may invest innon-U.S. Dollar-denominated securities on a currency hedged or unhedged basis. The Portfolio may seek investment opportunities by taking long or short positions in currencies through the use of currency-related derivatives, including forward currency exchange contracts, futures and options on futures, swaps, and other options. The Portfolio may enter into transactions for investment opportunities when it anticipates that a foreign currency will appreciate or depreciate in value but securities denominated in that currency are not held by the Portfolio and do not present attractive investment opportunities. Such transactions may also be used when the Adviser believes that it may be more efficient than a direct investment in a foreign currency-denominated security. The Portfolio may also conduct currency exchange contracts on a spot basis (i.e., for cash at the spot rate prevailing in the currency exchange market for buying or selling currencies).
NOTE E: Securities Lending
The Portfolio may enter into securities lending transactions. Under the Portfolio’s securities lending program, all loans of securities will be collateralized continually by cash collateral and/ornon-cash collateral.Non-cash collateral will include only securities issued or guaranteed by the U.S. government or its agencies or instrumentalities. The Portfolio cannot sell or repledge anynon-cash collateral, such collateral will not be reflected in the portfolio of investments. If a loan is collateralized by cash, the Portfolio will be compensated for the loan from a portion of the net return from the income earned on cash collateral after a rebate is paid to the borrower (in some cases, this rebate may be a “negative rebate” or fee paid by the
22
| AB Variable Products Series Fund | ||
borrower to the Portfolio in connection with the loan), and payments are made for fees of the securities lending agent and for certain other administrative expenses. If the Portfolio receivesnon-cash collateral, the Portfolio will receive a fee from the borrower generally equal to a negotiated percentage of the market value of the loaned securities. The Portfolio will have the right to call a loan and obtain the securities loaned at any time on notice to the borrower within the normal and customary settlement time for the securities. While the securities are on loan, the borrower is obligated to pay the Portfolio amounts equal to any income or other distributions from the securities. The Portfolio will not be able to exercise voting rights with respect to any securities during the existence of a loan, but will have the right to regain ownership of loaned securities in order to exercise voting or other ownership rights. Collateral received and securities loaned are marked to market daily to ensure that the securities loaned are secured by collateral. The lending agent currently invests the cash collateral received in Government Money Market Portfolio, an eligible money market vehicle, in accordance with the investment restrictions of the Portfolio, and as approved by the Board. The collateral received on securities loaned is recorded as an asset as well as a corresponding liability in the statement of assets and liabilities. The collateral will be adjusted the next business day to maintain the required collateral amount. The amounts of securities lending income from the borrowers and Government Money Market Portfolio are reflected in the statement of operations. When the Portfolio earns net securities lending income from Government Money Market Portfolio, the income is inclusive of a rebate expense paid to the borrower. In connection with the cash collateral investment by the Portfolio in Government Money Market Portfolio, the Adviser has agreed to waive a portion of the Portfolio’s share of the advisory fees of Government Money Market Portfolio, as borne indirectly by the Portfolio as an acquired fund fee and expense. When the Portfolio lends securities, its investment performance will continue to reflect changes in the value of the securities loaned. A principal risk of lending portfolio securities is that the borrower may fail to return the loaned securities upon termination of the loan and that the collateral will not be sufficient to replace the loaned securities. The lending agent has agreed to indemnify the Portfolio in the case of default of any securities borrower.
A summary of the Portfolio’s transactions surrounding securities lending for the year ended December 31, 2019 is as follows:
Government Money Market | ||||||||||
Market Value of on Loan* | Cash | Market Value of | Income from | Income Earned | Advisory Fee | |||||
| $3,983,027 | $1,786,500 | $2,379,621 | $2,814 | $9,672 | $175 | |||||
| * | As of December 31, 2019. |
NOTE F: Capital Stock
Each class consists of 500,000,000 authorized shares. Transactions in capital shares for each class were as follows:
| SHARES | AMOUNT | |||||||||||||||||||
| Year Ended December 31, 2019 | Year Ended December 31, 2018 | Year Ended December 31, 2019 | Year Ended December 31, 2018 | |||||||||||||||||
Class A | ||||||||||||||||||||
Shares sold | 25,049 | 74,551 | $ | 530,484 | $ | 1,661,704 | ||||||||||||||
Shares issued in reinvestment of dividends | 32,449 | 8,058 | 688,237 | 178,413 | ||||||||||||||||
Shares redeemed | (163,992 | ) | (258,862 | ) | (3,492,546 | ) | (5,757,016 | ) | ||||||||||||
|
|
|
|
|
|
|
| |||||||||||||
Net decrease | (106,494 | ) | (176,253 | ) | $ | (2,273,825 | ) | $ | (3,916,899 | ) | ||||||||||
|
|
|
|
|
|
|
| |||||||||||||
Class B |
| |||||||||||||||||||
Shares sold | 52,238 | 209,646 | $ | 1,106,667 | $ | 4,614,692 | ||||||||||||||
Shares issued in reinvestment of dividends | 37,998 | 6,419 | 794,929 | 140,185 | ||||||||||||||||
Shares redeemed | (310,416 | ) | (508,518 | ) | (6,525,192 | ) | (11,342,567 | ) | ||||||||||||
|
|
|
|
|
|
|
| |||||||||||||
Net decrease | (220,180 | ) | (292,453 | ) | $ | (4,623,596 | ) | $ | (6,587,690 | ) | ||||||||||
|
|
|
|
|
|
|
| |||||||||||||
At December 31, 2019, certain shareholders of the Portfolio owned 81% in aggregate of the Portfolio’s outstanding shares. Significant transactions by such shareholders, if any, may impact the Portfolio’s performance.
23
| INTERNATIONAL GROWTH PORTFOLIO | ||
| NOTES TO FINANCIAL STATEMENTS | ||
| (continued) | AB Variable Products Series Fund | |
NOTE G: Risks Involved in Investing in the Portfolio
Foreign (Non-U.S.) Risk—Investments in securities ofnon-U.S. issuers may involve more risk than those of U.S. issuers. These securities may fluctuate more widely in price and may be more difficult to trade or dispose of due to adverse market, economic, political, regulatory or other factors.
Emerging Market Risk—Investments in emerging market countries may have more risk because the markets are less developed and less liquid, and because these investments may be subject to increased economic, political, regulatory or other uncertainties.
Currency Risk—Fluctuations in currency exchange rates may negatively affect the value of the Portfolio’s investments or reduce its returns.
Capitalization Risk—Investments in small- andmid-capitalization companies may be more volatile than investments in large-capitalization companies. Investments in small-capitalization companies may have additional risks because these companies have limited product lines, markets or financial resources.
Derivatives Risk—The Portfolio may enter into derivative transactions such as forwards, options, futures and swaps. Derivatives may be illiquid, difficult to price, and leveraged so that small changes may produce disproportionate losses for the Portfolio, and subject to counterparty risk to a greater degree than more traditional investments. Derivatives may result in significant losses, including losses that are far greater than the value of the derivatives reflected on the statement of assets and liabilities.
Leverage Risk—When the Portfolio borrows money or otherwise leverages its investments, its performance may be volatile because leverage tends to exaggerate the effect of any increase or decrease in the value of the Portfolio’s investments. The Portfolio may create leverage through the use of reverse repurchase arrangements, forward currency exchange contracts, forward commitments, dollar rolls or futures or by borrowing money. The use of other types of derivative instruments by the Portfolio, such as options and swaps, may also result in a form of leverage. Leverage may result in higher returns to the Portfolio than if the Portfolio were not leveraged, but may also adversely affect returns, particularly if the market is declining.
LIBOR Risk—The Portfolio may invest in certain debt securities, derivatives or other financial instruments that utilize the London Interbank Offered Rate, or “LIBOR,” as a “benchmark” or “reference rate” for various interest rate calculations. In July 2017, the United Kingdom Financial Conduct Authority, which regulates LIBOR, announced a desire to phase out the use of LIBOR by the end of 2021. Although financial regulators and industry working groups have suggested alternative reference rates, such as European Interbank Offer Rate (“EURIBOR”), Sterling Overnight Interbank Average Rate (“SONIA”) and Secured Overnight Financing Rate (“SOFR”), global consensus on alternative rates is lacking and the process for amending existing contracts or instruments to transition away from LIBOR remains unclear. The elimination of LIBOR or changes to other reference rates or any other changes or reforms to the determination or supervision of reference rates could have an adverse impact on the market for, or value of, any securities or payments linked to those reference rates, which may adversely affect the Portfolio’s performance and/or net asset value. Uncertainty and risk also remain regarding the willingness and ability of issuers and lenders to include revised provisions in new and existing contracts or instruments. Consequently, the transition away from LIBOR to other reference rates may lead to increased volatility and illiquidity in markets that are tied to LIBOR, fluctuations in values of LIBOR-related investments or investments in issuers that utilize LIBOR, increased difficulty in borrowing or refinancing and diminished effectiveness of hedging strategies, adversely affecting the Portfolio’s performance. Furthermore, the risks associated with the expected discontinuation of LIBOR and transition may be exacerbated if the work necessary to effect an orderly transition to an alternative reference rate is not completed in a timely manner. Because the usefulness of LIBOR as a benchmark could deteriorate during the transition period, these effects could occur prior to the end of 2021.
Indemnification Risk—In the ordinary course of business, the Portfolio enters into contracts that contain a variety of indemnifications. The Portfolio’s maximum exposure under these arrangements is unknown. However, the Portfolio has not had prior claims or losses pursuant to these indemnification provisions and expects the risk of loss thereunder to be remote. Therefore, the Portfolio has not accrued any liability in connection with these indemnification provisions.
24
| AB Variable Products Series Fund | ||
NOTE H: Joint Credit Facility
A number ofopen-end mutual funds managed by the Adviser, including the Portfolio, participate in a $325 million revolving credit facility (the “Facility”) intended to provide short-term financing, if necessary, subject to certain restrictions in connection with abnormal redemption activity. Commitment fees related to the Facility are paid by the participating funds and are included in miscellaneous expenses in the statement of operations. The Portfolio did not utilize the Facility during the year ended December 31, 2019.
NOTE I: Distributions to Shareholders
The tax character of distributions paid during the fiscal years ended December 31, 2019 and December 31, 2018 were as follows:
| 2019 | 2018 | |||||||
Distributions paid from: | ||||||||
Ordinary income | $ | 211,048 | $ | 318,598 | ||||
Net long-term capital gains | 1,272,118 | –0 | – | |||||
|
|
|
| |||||
Total taxable distributions paid | $ | 1,483,166 | $ | 318,598 | ||||
|
|
|
| |||||
As of December 31, 2019, the components of accumulated earnings/(deficit) on a tax basis were as follows:
Undistributed ordinary income | $ | 1,009,224 | ||
Undistributed capital gains | 4,091,291 | |||
Unrealized appreciation/(depreciation) | 12,363,819 | (a) | ||
|
| |||
Total accumulated earnings/(deficit) | $ | 17,464,334 | ||
|
|
| (a) | The differences between book-basis and tax-basis unrealized appreciation/(depreciation) are attributable primarily to the recognition for tax purposes of unrealized gains/losses on certain derivative instruments and the tax deferral of losses on wash sales. |
For tax purposes, net realized capital losses may be carried over to offset future capital gains, if any. Funds are permitted to carry forward capital losses for an indefinite period, and such losses will retain their character as either short-term or long-term capital losses. As of December 31, 2019, the Portfolio did not have any capital loss carryforwards.
During the current fiscal year, there were no permanent differences that resulted in adjustments to distributable earnings or additional paid-in capital.
NOTE J: Recent Accounting Pronouncements
In August 2018, the Financial Accounting Standards Board issued an Accounting Standards Update, ASU2018-13, Fair Value Measurement (Topic 820), Disclosure Framework—Changes to the Disclosure Requirements for Fair Value Measurement which removes, modifies and adds disclosures to Topic 820. The amendments in this ASU2018-13 (“ASU”) apply to all entities that are required, under existing U.S. GAAP, to make disclosures about recurring or nonrecurring fair value measurements. The amendments in this ASU are effective for all entities for fiscal years, and interim periods within those fiscal years, beginning after December 15, 2019. Management has evaluated the impact of the amendments and elected to early adopt the ASU. The adoption of this ASU did not have a material impact on the disclosure and presentation of the financial statements of the Portfolio.
NOTE K: Subsequent Events
Management has evaluated subsequent events for possible recognition or disclosure in the financial statements through the date the financial statements are issued. Management has determined that there are no material events that would require disclosure in the Portfolio’s financial statements through this date.
25
| INTERNATIONAL GROWTH PORTFOLIO | ||
| FINANCIAL HIGHLIGHTS | AB Variable Products Series Fund | |
Selected Data For A Share Of Capital Stock Outstanding Throughout Each Period
| CLASS A | ||||||||||||||||||||
| Year Ended December 31, | ||||||||||||||||||||
| 2019 | 2018 | 2017 | 2016 | 2015 | ||||||||||||||||
Net asset value, beginning of period | $18.99 | $23.15 | $17.34 | $18.62 | $19.04 | |||||||||||||||
|
|
|
|
|
|
|
|
|
| |||||||||||
Income From Investment Operations | ||||||||||||||||||||
Net investment income (a) | .08 | (b) | .15 | (b) | .06 | (b) | .11 | (b)† | .15 | |||||||||||
Net realized and unrealized gain (loss) on investment and foreign currency transactions | 5.08 | (4.16 | ) | 6.00 | (1.39 | ) | (.50 | ) | ||||||||||||
|
|
|
|
|
|
|
|
|
| |||||||||||
Net increase (decrease) in net asset value from operations | 5.16 | (4.01 | ) | 6.06 | (1.28 | ) | (.35 | ) | ||||||||||||
|
|
|
|
|
|
|
|
|
| |||||||||||
Less: Dividends and Distributions | ||||||||||||||||||||
Dividends from net investment income | (.13 | ) | (.15 | ) | (.25 | ) | –0 | – | (.07 | ) | ||||||||||
Distributions from net realized gain on investment transactions | (.53 | ) | –0 | – | –0 | – | –0 | – | –0 | – | ||||||||||
|
|
|
|
|
|
|
|
|
| |||||||||||
Total dividends and distributions | (.66 | ) | (.15 | ) | (.25 | ) | –0 | – | (.07 | ) | ||||||||||
|
|
|
|
|
|
|
|
|
| |||||||||||
Net asset value, end of period | $23.49 | $18.99 | $23.15 | $17.34 | $18.62 | |||||||||||||||
|
|
|
|
|
|
|
|
|
| |||||||||||
Total Return | ||||||||||||||||||||
Total investment return based on net asset value (c)* | 27.53 | % | (17.41 | )% | 35.02 | % | (6.87 | )%† | (1.87 | )% | ||||||||||
Ratios/Supplemental Data | ||||||||||||||||||||
Net assets, end of period (000’s omitted) | $24,123 | $21,528 | $30,318 | $26,045 | $33,090 | |||||||||||||||
Ratio to average net assets of: | ||||||||||||||||||||
Expenses, net of waivers/reimbursements | 1.36 | % | 1.27 | % | 1.24 | % | 1.27 | % | 1.11 | % | ||||||||||
Expenses, before waivers/reimbursements | 1.41 | % | 1.29 | % | 1.24 | % | 1.27 | % | 1.11 | % | ||||||||||
Net investment income | .40 | %(b) | .69 | %(b) | .30 | %(b) | .60 | %(b)† | .78 | % | ||||||||||
Portfolio turnover rate | 49 | % | 33 | % | 52 | % | 52 | % | 17 | % | ||||||||||
See footnote summary on page 27.
26
| AB Variable Products Series Fund | ||
Selected Data For A Share Of Capital Stock Outstanding Throughout Each Period
| CLASS B | ||||||||||||||||||||
| Year Ended December 31, | ||||||||||||||||||||
| 2019 | 2018 | 2017 | 2016 | 2015 | ||||||||||||||||
Net asset value, beginning of period | $18.71 | $22.80 | $17.09 | $18.39 | $18.81 | |||||||||||||||
|
|
|
|
|
|
|
|
|
| |||||||||||
Income From Investment Operations | ||||||||||||||||||||
Net investment income (a) | .03 | (b) | .09 | (b) | .01 | (b) | .07 | (b)† | .10 | |||||||||||
Net realized and unrealized gain (loss) on investment and foreign currency transactions | 5.00 | (4.09 | ) | 5.90 | (1.37 | ) | (.51 | ) | ||||||||||||
|
|
|
|
|
|
|
|
|
| |||||||||||
Net increase (decrease) in net asset value from operations | 5.03 | (4.00 | ) | 5.91 | (1.30 | ) | (.41 | ) | ||||||||||||
|
|
|
|
|
|
|
|
|
| |||||||||||
Less: Dividends and Distributions | ||||||||||||||||||||
Dividends from net investment income | (.06 | ) | (.09 | ) | (.20 | ) | –0 | – | (.01 | ) | ||||||||||
Distributions from net realized gain on investment transactions | (.53 | ) | –0 | – | –0 | – | –0 | – | –0 | – | ||||||||||
|
|
|
|
|
|
|
|
|
| |||||||||||
Total dividends and distributions | (.59 | ) | (.09 | ) | (.20 | ) | –0 | – | (.01 | ) | ||||||||||
|
|
|
|
|
|
|
|
|
| |||||||||||
Net asset value, end of period | $23.15 | $18.71 | $22.80 | $17.09 | $18.39 | |||||||||||||||
|
|
|
|
|
|
|
|
|
| |||||||||||
Total Return | ||||||||||||||||||||
Total investment return based on net asset value (c)* | 27.23 | % | (17.60 | )% | 34.63 | % | (7.07 | )%† | (2.17 | )% | ||||||||||
Ratios/Supplemental Data | ||||||||||||||||||||
Net assets, end of period (000’s omitted) | $29,756 | $28,177 | $41,007 | $32,843 | $40,566 | |||||||||||||||
Ratio to average net assets of: | ||||||||||||||||||||
Expenses, net of waivers/reimbursements | 1.61 | % | 1.52 | % | 1.49 | % | 1.52 | % | 1.36 | % | ||||||||||
Expenses, before waivers/reimbursements | 1.66 | % | 1.54 | % | 1.49 | % | 1.52 | % | 1.36 | % | ||||||||||
Net investment income | .15 | %(b) | .43 | %(b) | .04 | %(b) | .37 | %(b)† | .52 | % | ||||||||||
Portfolio turnover rate | 49 | % | 33 | % | 52 | % | 52 | % | 17 | % | ||||||||||
| (a) | Based on average shares outstanding. |
| (b) | Net of expenses waived/reimbursed by the Adviser. |
| (c) | Total investment return is calculated assuming an initial investment made at the net asset value at the beginning of the period, reinvestment of all dividends and distributions at net asset value during the period, and redemption on the last day of the period. Total return does not reflect (i) insurance company’s separate account related expense charges and (ii) the deductions of taxes that a shareholder would pay on Portfolio distributions or the redemption of Portfolio shares. Total investment return calculated for a period of less than one year is not annualized. |
| † | For the year ended December 31, 2016, the amount includes a refund for overbilling of prior years’ custody out of pocket fees as follows: |
Net Investment | Net Investment | Total | ||
| $.04 | .22% | .23% |
| * | Includes the impact of proceeds received and credited to the Portfolio resulting from class action settlements, which enhanced the Portfolio’s performance for the years ended December 31, 2017 and December 31, 2016 by .01% and .09%, respectively. |
See notes to financial statements.
27
| REPORT OF INDEPENDENT REGISTERED | ||
| PUBLIC ACCOUNTING FIRM | AB Variable Products Series Fund | |
To the Shareholders and the Board of Directors of AB International Growth Portfolio:
Opinion on the Financial Statements
We have audited the accompanying statement of assets and liabilities of AB International Growth Portfolio (the “Portfolio”) (one of the portfolios constituting AB Variable Products Series Fund, Inc. (the “Fund”)), including the portfolio of investments, as of December 31, 2019, and the related statement of operations for the year then ended, the statements of changes in net assets for each of the two years in the period then ended, the financial highlights for each of the five years in the period then ended and the related notes (collectively referred to as the “financial statements”). In our opinion, the financial statements present fairly, in all material respects, the financial position of the Portfolio (one of the portfolios constituting AB Variable Products Series Fund, Inc.) at December 31, 2019, the results of its operations for the year then ended, the changes in its net assets for each of the two years in the period then ended and its financial highlights for each of the five years in the period then ended, in conformity with U.S. generally accepted accounting principles.
Basis for Opinion
These financial statements are the responsibility of the Fund’s management. Our responsibility is to express an opinion on the Portfolio’s financial statements based on our audits. We are a public accounting firm registered with the Public Company Accounting Oversight Board (United States) (“PCAOB”) and are required to be independent with respect to the Fund in accordance with the U.S. federal securities laws and the applicable rules and regulations of the Securities and Exchange Commission and the PCAOB.
We conducted our audits in accordance with the standards of the PCAOB. Those standards require that we plan and perform the audit to obtain reasonable assurance about whether the financial statements are free of material misstatement, whether due to error or fraud. The Fund is not required to have, nor were we engaged to perform, an audit of the Fund’s internal control over financial reporting. As part of our audits, we are required to obtain an understanding of internal control over financial reporting, but not for the purpose of expressing an opinion on the effectiveness of the Fund’s internal control over financial reporting. Accordingly, we express no such opinion.
Our audits included performing procedures to assess the risks of material misstatement of the financial statements, whether due to error or fraud, and performing procedures that respond to those risks. Such procedures included examining, on a test basis, evidence regarding the amounts and disclosures in the financial statements. Our procedures included confirmation of securities owned as of December 31, 2019, by correspondence with the custodian and others or by other appropriate auditing procedures where replies from others were not received. Our audits also included evaluating the accounting principles used and significant estimates made by management, as well as evaluating the overall presentation of the financial statements. We believe that our audits provide a reasonable basis for our opinion.

We have served as the auditor of one or more of the AB investment companies since 1968.
New York, New York
February 14, 2020
28
| 2019 TAX INFORMATION (unaudited) | AB Variable Products Series Fund | |
For Federal income tax purposes, the following information is furnished with respect to the earnings of the Portfolio for the taxable year ended December 31, 2019.
The Portfolio intends to make an election to pass through foreign taxes to its shareholders. For the taxable year ended December 31, 2019, $35,270 of foreign taxes may be passed through and the associated foreign source income for information reporting purposes is $525,914.
29
| INTERNATIONAL GROWTH PORTFOLIO | AB Variable Products Series Fund | |
| BOARD OF DIRECTORS | ||
Marshall C. Turner, Jr.(1),Chairman Jorge A. Bermudez^ Michael J. Downey(1) Nancy P. Jacklin(1) | Robert M. Keith,President and Carol C. McMullen(1) Garry L. Moody(1) | |
| Earl D. Weiner(1) | ||
| OFFICERS | ||
Daniel C. Roarty(2),Vice President Emilie D. Wrapp,Secretary Michael B. Reyes,Senior Analyst | Joseph J. Mantineo,Treasurer and Phyllis J. Clarke,Controller Vincent S. Noto,Chief Compliance Officer | |
CUSTODIAN AND ACCOUNTING AGENT State Street Bank and Trust Company State Street Corporation CCB/5 1 Iron Street Boston, MA 02210 | LEGAL COUNSEL Seward & Kissel LLP One Battery Park Plaza New York, NY 10004 | |
DISTRIBUTOR AllianceBernstein Investments, Inc. 1345 Avenue of the Americas New York, NY 10105 | TRANSFER AGENT AllianceBernstein Investor Services, Inc. P.O. Box 786003 San Antonio, TX 78278-6003 Toll-Free (800) 221-5672 | |
INDEPENDENT REGISTERED PUBLIC ACCOUNTING FIRM Ernst & Young LLP 5 Times Square New York, NY 10036 |
| (1) | Member of the Audit Committee, the Governance and Nominating Committee, and the Independent Directors Committee. |
| (2) | Theday-to-day management of, and investment decisions for, the Portfolio’s portfolio are made by the Adviser’s Thematic and Sustainable Equities Investment Team. Mr. Roarty is the investment professional with the most significant responsibility for theday-to-day management of the Portfolio’s portfolio. |
| ^ | Mr. Bermudez will be a member of the Audit Committee, the Governance and Nominating Committee, and the Independent Directors Committee when he joins the Board on January 1, 2020. |
30
| INTERNATIONAL GROWTH PORTFOLIO | ||
| MANAGEMENT OF THE FUND | AB Variable Products Series Fund | |
Board of Directors Information
The business and affairs of the Fund are managed under the direction of the Board of Directors. Certain information concerning the Fund’s Directors is set forth below.
| NAME, ADDRESS*, AGE, (YEAR FIRST ELECTED**) | PRINCIPAL OCCUPATION(S) DURING PAST FIVE YEARS AND OTHER INFORMATION*** | PORTFOLIOS IN AB FUND COMPLEX OVERSEEN BY DIRECTOR | OTHER PUBLIC COMPANY DIRECTORSHIPS CURRENTLY HELD BY DIRECTOR | |||||
| INTERESTED DIRECTOR | ||||||||
| Robert M. Keith,# 1345 Avenue of the Americas New York, NY 10105 59 (2010) | Senior Vice President of AllianceBernstein L.P. (the “Adviser”) and the head of AllianceBernstein Investments, Inc. (“ABI”) since July 2008; Director of ABI and President of the AB Mutual Funds. Previously, he served as Executive Managing Director of ABI from December 2006 to June 2008. Prior to joining ABI in 2006, Executive Managing Director of Bernstein Global Wealth Management, and prior thereto, Senior Managing Director and Global Head of Client Service and Sales of the Adviser’s institutional investment management business since 2004. Prior thereto, he was Managing Director and Head of North American Client Service and Sales in the Adviser’s institutional investment management business, with which he had been associated since prior to 2004. | 91 | None | |||||
| DISINTERESTED DIRECTORS | ||||||||
| Marshall C. Turner, Jr.,## Chairman of the Board 78 (2005) | Private Investor since prior to 2015. Former Chairman and CEO of Dupont Photomasks, Inc. (components of semi-conductor manufacturing). He has extensive operating leadership experience and venture capital investing experience, including five interim or full-time CEO roles, and prior service as general partner of institutional venture capital partnerships. He also has extensivenon-profit board leadership experience, and currently serves on the boards of two education and science-relatednon-profit organizations. He has served as a director of one AB Fund since 1992, and director or trustee of all AB Funds since 2005. He has been Chairman of the AB Funds since January 2014, and the Chairman of the Independent Directors Committees of such AB Funds since February 2014. | 91 | Xilinx, Inc. (programmable logic semi- conductors) since 2007 | |||||
| Jorge A. Bermudez,^ 68 (2020) | Private investor since prior to 2015. Former Chief Risk Officer of Citigroup, Inc., a global financial services company, from November 2007 to March 2008, Chief Executive Officer of Citigroup’s Commercial Business Group in North America and Citibank Texas from 2005 to 2007, and a variety of other executive and leadership roles at various businesses within Citigroup prior to then; Chairman (2018) of the Texas A&M Foundation Board of Trustees (Trustee since 2013) and Chairman of the Smart Grid Center Board at Texas A&M University since 2012; director of, among others, Citibank N.A. from 2005 to 2008, the Federal Reserve Bank of Dallas, Houston Branch from 2009 to 2011, the Federal Reserve Bank of Dallas from 2011 to 2017, and the Electric Reliability Council of Texas from 2010 to 2016. He has served as director or trustee of the AB Funds since 2020. | 91 | Moody’s Corporation since April 2011 | |||||
31
| INTERNATIONAL GROWTH PORTFOLIO | ||
| MANAGEMENT OF THE FUND | ||
| (continued) | AB Variable Products Series Fund | |
| NAME, ADDRESS*, AGE, (YEAR FIRST ELECTED**) | PRINCIPAL OCCUPATION(S) DURING PAST FIVE YEARS AND OTHER INFORMATION*** | PORTFOLIOS IN AB FUND COMPLEX OVERSEEN BY DIRECTOR | OTHER PUBLIC COMPANY DIRECTORSHIPS CURRENTLY HELD BY DIRECTOR | |||||
| DISINTERESTED DIRECTORS (continued) | ||||||||
| Michael J. Downey,## 76 (2005) | Private Investor since prior to 2015. Formerly, Chairman of The Asia Pacific Fund, Inc. (registered investment company) since prior to 2015 until January 2019. From 1987 until 1993, Chairman and CEO of Prudential Mutual Fund Management, director of the Prudential mutual funds, and member of the Executive Committee of Prudential Securities, Inc. He has served as a director or trustee of the AB Funds since 2005. | 91 | None | |||||
| Nancy P. Jacklin,## 71 (2006) | Private Investor since prior to 2015. Professorial Lecturer at the Johns Hopkins School of Advanced International Studies (2008–2015). U.S. Executive Director of the International Monetary Fund (which is responsible for ensuring the stability of the international monetary system), (December 2002–May 2006); Partner, Clifford Chance (1992–2002); Sector Counsel, International Banking and Finance, and Associate General Counsel, Citicorp (1985–1992); Assistant General Counsel (International), Federal Reserve Board of Governors (1982–1985); and Attorney Advisor, U.S. Department of the Treasury (1973–1982). Member of the Bar of the District of Columbia and of New York; and member of the Council on Foreign Relations. She has served as a director or trustee of the AB Funds since 2006 and has been Chair of the Governance and Nominating Committees of the AB Funds since August 2014. | 91 | None | |||||
| Carol C. McMullen,## 64 (2016) | Managing Director of Slalom Consulting (consulting) since 2014, private investor and member of the Advisory Board of Butcher Box (since 2018). Formerly, member, Partners Healthcare Investment Committee (2010–2019); Director of Norfolk & Dedham Group (mutual property and casualty insurance) from 2011 until November 2016; Director of Partners Community Physicians Organization (healthcare) from 2014 until December 2016; and Managing Director of The Crossland Group (consulting) from 2012 until 2013. She has held a number of senior positions in the asset and wealth management industries, including at Eastern Bank (where her roles included President of Eastern Wealth Management), Thomson Financial (Global Head of Sales for Investment Management), and Putnam Investments (where her roles included Chief Investment Officer, Core and Growth and Head of Global Investment Research). She has served on a number of private company and non-profit boards, and as a director or trustee of the AB Funds since June 2016. | 91 | None | |||||
32
| AB Variable Products Series Fund | ||
| NAME, ADDRESS*, AGE, (YEAR FIRST ELECTED**) | PRINCIPAL OCCUPATION(S) DURING PAST FIVE YEARS AND OTHER INFORMATION*** | PORTFOLIOS IN AB FUND COMPLEX OVERSEEN BY DIRECTOR | OTHER PUBLIC COMPANY DIRECTORSHIPS CURRENTLY HELD BY DIRECTOR | |||||
| DISINTERESTED DIRECTORS (continued) | ||||||||
| Garry L. Moody,## 67 (2008) | Formerly, Partner, Deloitte & Touche LLP (1995–2008) where he held a number of senior positions, including Vice Chairman, and U.S. and Global Investment Management Practice Managing Partner; President, Fidelity Accounting and Custody Services Company (1993–1995), where he was responsible for accounting, pricing, custody and reporting for the Fidelity mutual funds; and Partner, Ernst & Young LLP (1975–1993), where he served as the National Director of Mutual Fund Tax Services and Managing Partner of its Chicago Office Tax department. He is a member of the Trustee Advisory Board of BoardIQ, a biweekly publication focused on issues and news affecting directors of mutual funds. He is also a member of the Investment Company Institute’s Board of Governors and the Independent Directors Council Governing Council. He has served as a director or trustee, and as Chairman of the Audit Committees, of the AB Funds since 2008. | 91 | None | |||||
| Earl D. Weiner,## 80 (2007) | Senior Counsel since 2017, Of Counsel from 2007 to 2016, and Partner prior to then, of the law firm Sullivan & Cromwell LLP. He is a former member of the ABA Federal Regulation of Securities Committee Task Force to draft editions of the Fund Director’s Guidebook. He also serves as a director or trustee of variousnon-profit organizations and has served as Chairman or Vice Chairman of a number of them. He has served as a director or trustee of the AB Funds since 2007 and served as Chairman of the Governance and Nominating Committees of the AB Funds from 2007 until August 2014. | 91 | None | |||||
| * | The address for the Portfolio’s disinterested Directors is c/o AllianceBernstein L.P., Attention: Legal & Compliance Department—Mutual Fund Legal, 1345 Avenue of the Americas, New York, NY 10105. |
| ** | There is no stated term of office for the Fund’s Directors. |
| *** | The information above includes each Director’s principal occupation during the last five years and other information relating to the experience, attributes and skills relevant to each Director’s qualifications to serve as a Director, which led to the conclusion that each Director should serve as a Director for the Fund. |
| # | Mr. Keith is an “interested person” of the Fund, as defined in the “1940 Act”, due to his position as a Senior Vice President of the Adviser. |
| ## | Member of the Audit Committee, the Governance and Nominating Committee, and the Independent Directors Committee. |
| ^ | Mr. Bermudez will be a member of the Audit Committee, the Governance and Nominating Committee, and the Independent Directors Committee when he joins the Board on January 1, 2020. |
33
| INTERNATIONAL GROWTH PORTFOLIO | ||
| MANAGEMENT OF THE FUND | ||
| (continued) | AB Variable Products Series Fund | |
Officer Information
Certain information concerning the Portfolio’s Officers is listed below.
| NAME, ADDRESS* AND AGE | PRINCIPAL POSITION(S) HELD WITH FUND | PRINCIPAL OCCUPATION DURING PAST FIVE YEARS | ||
| Robert M. Keith 59 | President and Chief Executive Officer | See biography above. | ||
| Daniel C. Roarty 48 | Vice President | Senior Vice President of the Adviser**, with which he has been associated since prior to 2015. He is also Chief Investment Officer of Thematic and Sustainable Equities. | ||
| Emilie D. Wrapp 64 | Secretary | Senior Vice President, Assistant General Counsel and Assistant Secretary of ABI**, with which she has been associated since prior to 2015. | ||
Michael B. Reyes 43 | Senior Analyst | Vice President of the Adviser**, with which he has been associated since prior to 2015. | ||
| Joseph J. Mantineo 60 | Treasurer and Chief Financial Officer | Senior Vice President of AllianceBernstein Investor Services, Inc. (“ABIS”)**, with which he has been associated since prior to 2015. | ||
| Phyllis J. Clarke 59 | Controller | Vice President of ABIS**, with which she has been associated since prior to 2015. | ||
| Vincent S. Noto 55 | Chief Compliance Officer | Senior Vice President since 2015 and Mutual Fund Chief Compliance Officer of the Adviser** since prior to 2015. |
| * | The address for each of the Portfolio’s Officers is 1345 Avenue of the Americas, New York, NY 10105. |
| ** | The Adviser, ABIS and ABI are affiliates of the Fund. |
| The Fund’s Statement of Additional Information (“SAI”) has additional information about the Fund’s Directors and Officers and is available without charge upon request. Contact your financial representative or the Adviser at (800)227-4618, or visit www.abfunds.com, for a free prospectus or SAI. |
34
| INTERNATIONAL GROWTH PORTFOLIO | ||
| CONTINUANCE DISCLOSURE | AB Variable Products Series Fund | |
INFORMATION REGARDING THE REVIEW AND APPROVAL OF THE FUND’S ADVISORY AGREEMENT
The disinterested directors (the “directors”) of AB Variable Products Series Fund, Inc. (the “Company”) unanimously approved the continuance of the Company’s Advisory Agreement with the Adviser in respect of AB International Growth Portfolio (the “Fund”) at a meeting held on May7-9, 2019 (the “Meeting”).
Prior to approval of the continuance of the Advisory Agreement, the directors had requested from the Adviser, and received and evaluated, extensive materials. They reviewed the proposed continuance of the Advisory Agreement with the Adviser and with experienced counsel who are independent of the Adviser, who advised on the relevant legal standards. The directors also reviewed additional materials, including comparative analytical data prepared by the Senior Analyst for the Fund. The directors also discussed the proposed continuance in private sessions with counsel.
The directors considered their knowledge of the nature and quality of the services provided by the Adviser to the Fund gained from their experience as directors or trustees of most of the registered investment companies advised by the Adviser, their overall confidence in the Adviser’s integrity and competence they have gained from that experience, the Adviser’s initiative in identifying and raising potential issues with the directors and its responsiveness, frankness and attention to concerns raised by the directors in the past, including the Adviser’s willingness to consider and implement organizational and operational changes designed to improve investment results and the services provided to the AB Funds. The directors noted that they have four regular meetings each year, at each of which they review extensive materials and information from the Adviser, including information on the investment performance of the Fund.
The directors also considered all factors they believed relevant, including the specific matters discussed below. During the course of their deliberations, the directors evaluated, among other things, the reasonableness of the advisory fee. The directors did not identify any particular information that wasall-important or controlling, and different directors may have attributed different weights to the various factors. The directors determined that the selection of the Adviser to manage the Fund and the overall arrangements between the Fund and the Adviser, as provided in the Advisory Agreement, including the advisory fee, were fair and reasonable in light of the services performed, expenses incurred and such other matters as the directors considered relevant in the exercise of their business judgment. The material factors and conclusions that formed the basis for the directors’ determinations included the following:
Nature, Extent and Quality of Services Provided
The directors considered the scope and quality of services provided by the Adviser under the Advisory Agreement, including the quality of the investment research capabilities of the Adviser and the other resources it has dedicated to performing services for the Fund. The directors noted that the Adviser from time to time reviews the Fund’s investment strategies and from time to time proposes changes intended to improve the Fund’s relative or absolute performance for the directors’ consideration. They also noted the professional experience and qualifications of the Fund’s portfolio management team and other senior personnel of the Adviser. The directors also considered that the Advisory Agreement provides that the Fund will reimburse the Adviser for the cost to it of providing certain clerical, accounting, administrative and other services to the Fund by employees of the Adviser or its affiliates. Requests for these reimbursements are made on a quarterly basis and subject to approval by the directors. Reimbursements, to the extent requested and paid, result in a higher rate of total compensation from the Fund to the Adviser than the fee rate stated in the Advisory Agreement. The directors noted that the methodology used to determine the reimbursement amounts had been reviewed by an independent consultant retained by the Fund’s former Senior Officer/Independent Compliance Officer. The quality of administrative and other services, including the Adviser’s role in coordinating the activities of the Fund’s other service providers, also was considered. The directors concluded that, overall, they were satisfied with the nature, extent and quality of services provided to the Fund under the Advisory Agreement.
Costs of Services Provided and Profitability
The directors reviewed a schedule of the revenues and expenses and related notes indicating the profitability of the Fund to the Adviser for calendar years 2017 and 2018 that had been prepared with an expense allocation methodology arrived at in consultation with an independent consultant retained by the Fund’s former Senior Officer/Independent Compliance Officer. The directors noted the assumptions and methods of allocation used by the Adviser in preparing fund-specific profitability data and understood that there are a number of potentially acceptable allocation methodologies for information of this type. The directors noted that the profitability information reflected all revenues and expenses of the Adviser’s relationship with the Fund, including those relating to its subsidiaries that provide transfer agency, distribution and brokerage services to the Fund. The directors recognized that it is difficult to make comparisons of the profitability of the Advisory Agreement with
35
| INTERNATIONAL GROWTH PORTFOLIO | ||
| CONTINUANCE DISCLOSURE | ||
| (continued) | AB Variable Products Series Fund | |
the profitability of advisory contracts for unaffiliated funds because comparative information is not generally publicly available and is affected by numerous factors. The directors focused on the profitability of the Adviser’s relationship with the Fund before taxes and distribution expenses. The directors concluded that the Adviser’s level of profitability from its relationship with the Fund was not unreasonable.
Fall-Out Benefits
The directors considered the other benefits to the Adviser and its affiliates from their relationships with the Fund and the underlying fund advised by the Adviser in which the Fund invests, including, but not limited to, benefits relating to soft dollar arrangements (whereby investment advisers receive brokerage and research services from brokers that execute agency transactions for their clients);12b-1 fees and sales charges received by the Fund’s principal underwriter (which is a wholly owned subsidiary of the Adviser) in respect of the Fund’s Class B shares; brokerage commissions paid by the Fund to brokers affiliated with the Adviser; and transfer agency fees paid by the Fund to a wholly owned subsidiary of the Adviser. The directors recognized that the Adviser’s profitability would be somewhat lower without these benefits. The directors understood that the Adviser also might derive reputational and other benefits from its association with the Fund.
Investment Results
In addition to the information reviewed by the directors in connection with the Meeting, the directors receive detailed performance information for the Fund at each regular Board meeting during the year.
At the Meeting, the directors reviewed performance information prepared by an independent service provider (the “15(c) service provider”), showing the performance of the Class A Shares of the Fund against a group of similar funds (“peer group”) and a larger group of similar funds (“peer universe”), each selected by the 15(c) service provider, and information prepared by the Adviser showing performance of the Class A Shares against a broad-based securities market index, in each case for the1-,3-,5- and10-year periods ended February 28, 2019 and (in the case of comparisons with the broad-based securities market index) for the period from inception. Based on their review and their discussion with the Adviser of the reasons for the Fund’s underperformance in certain periods, the directors concluded that the Fund’s investment performance was acceptable.
Advisory Fees and Other Expenses
The directors considered the advisory fee rate payable by the Fund to the Adviser and information prepared by the 15(c) service provider concerning advisory fee rates payable by other funds in the same category as the Fund. The directors recognized that it is difficult to make comparisons of advisory fees because there are variations in the services that are included in the fees paid by other funds. The directors compared the Fund’s contractual effective advisory fee rate with a peer group median and took into account the impact on the advisory fee rate of the administrative expense reimbursement paid to the Adviser in the latest fiscal year.
The directors also considered the Adviser’s fee schedule for other clients pursuing an investment strategy similar to the Fund’s. For this purpose, they reviewed the relevant advisory fee information from the Adviser’s Form ADV and in a report from the Fund’s Senior Analyst and noted the differences between the Fund’s fee schedule, on the one hand, and the Adviser’s institutional fee schedule, on the other. The directors noted that the Adviser may, in some cases, agree to fee rates with large institutional clients that are lower than those reviewed by the directors and that they had previously discussed with the Adviser its policies in respect of such arrangements. The directors previously discussed these matters with an independent fee consultant. The directors also compared the advisory fee rate for the Fund with that for another fund advised by the Adviser with a similar investment strategy.
The Adviser reviewed with the directors the significantly greater scope of the services it provides to the Fund relative to institutional clients. In this regard, the Adviser noted, among other things, that, compared to institutional accounts, the Fund (i) demands considerably more portfolio management, research and trading resources due to significantly higher daily cash flows; (ii) has more tax and regulatory restrictions and compliance obligations; (iii) must prepare and file or distribute regulatory and other communications about fund operations; and (iv) must provide shareholder servicing to retail investors. The Adviser also reviewed the greater legal risks presented by the large and changing population of Fund shareholders who may assert claims against the Adviser in individual or class actions, and the greater entrepreneurial risk in offering new fund products, which require substantial investment to launch, may not succeed, and generally must be priced to compete with larger, more established funds resulting in lack of profitability to the Adviser until a new fund achieves scale. In light of the substantial differences in services rendered by the Adviser to institutional clients as compared to the Fund, and the different risk profile, the directors considered these fee comparisons inapt and did not place significant weight on them in their deliberations.
36
| AB Variable Products Series Fund | ||
In connection with their review of the Fund’s advisory fee, the directors also considered the total expense ratio of the Class A shares of the Fund in comparison to a peer group and a peer universe selected by the 15(c) service provider. The Class A expense ratio of the Fund was based on the Fund’s latest fiscal year. The directors noted that it was likely that the expense ratios of some of the other funds in the Fund’s category were lowered by waivers or reimbursements by those funds’ investment advisers, which in some cases might be voluntary or temporary. The directors view expense ratio information as relevant to their evaluation of the Adviser’s services because the Adviser is responsible for coordinating services provided to the Fund by others. The directors noted that the Fund’s expense ratio was above the medians. After reviewing and discussing the Adviser’s explanations of the reasons for this, the directors concluded that the Fund’s expense ratio was acceptable.
Economies of Scale
The directors noted that the advisory fee schedule for the Fund contains breakpoints that reduce the fee rates on assets above specified levels. The directors took into consideration prior presentations by an independent consultant on economies of scale in the mutual fund industry and for the AB Funds, and presentations from time to time by the Adviser concerning certain of its views on economies of scale. The directors also previously discussed economies of scale with an independent fee consultant. The directors also had requested and received from the Adviser certain updates on economies of scale in advance of the Meeting. The directors believe that economies of scale may be realized (if at all) by the Adviser across a variety of products and services, and not only in respect of a single fund. The directors noted that there is no established methodology for setting breakpoints that give effect to the fund-specific services provided by a fund’s adviser and to the economies of scale that an adviser may realize in its overall mutual fund business or those components of it which directly or indirectly affect a fund’s operations. The directors observed that in the mutual fund industry as a whole, as well as among funds similar to the Fund, there is no uniformity or pattern in the fees and asset levels at which breakpoints (if any) apply. The directors also noted that the advisory agreements for many funds do not have breakpoints at all. Having taken these factors into account, the directors concluded that the Fund’s shareholders would benefit from a sharing of economies of scale in the event the Fund’s net assets exceed a breakpoint in the future.
37
VPS-IG-0151-1219
DEC 12.31.19

ANNUAL REPORT
AB VARIABLE PRODUCTS SERIES FUND, INC.
| + | INTERNATIONAL VALUE PORTFOLIO |
Beginning on May 1, 2021, as permitted by regulations adopted by the Securities and Exchange Commission, you may not be receiving paper copies of the Portfolio’s shareholder reports from the insurance company that offers your contract unless you specifically request paper copies from the insurance company or from your financial intermediary. Instead of delivering paper copies of the reports, the insurance company may choose to make the reports available on a website, and will notify you by mail each time a report is posted and provide you with a website link to access the report. Instructions for requesting paper copies will be provided by your insurance company.
If you already elected to receive shareholder reports electronically, you will not be affected by this change and you need not take any action. You may elect to receive shareholder reports and other communications from the insurance company or your financial intermediary electronically by following the instructions provided by the insurance company or by contacting your financial intermediary.
You may elect to receive all future reports in paper free of charge from the insurance company. You can inform the insurance company or your financial intermediary that you wish to continue receiving paper copies of your shareholder reports by following the instructions provided by the insurance company or by contacting your financial intermediary. Your election to receive reports in paper will apply to all portfolio companies available under your contract with the insurance company.
Investment Products Offered
| • | Are Not FDIC Insured |
| • | May Lose Value |
| • | Are Not Bank Guaranteed |
AllianceBernstein Investments, Inc. (ABI) is the distributor of the AB family of mutual funds. ABI is a member of FINRA and is an affiliate of AllianceBernstein L.P., the Adviser of the funds.
You may obtain a description of the Fund’s proxy voting policies and procedures, and information regarding how the Fund voted proxies relating to portfolio securities during the most recent12-month period ended June 30, without charge. Simply visit AB’s website at www.abfunds.com or go to the Securities and Exchange Commission’s (the “Commission”) website at www.sec.gov, or call AB at (800) 227 4618.
The Fund files its complete schedule of portfolio holdings with the Commission for the first and third quarters of each fiscal year as an exhibit to its reports on Form N-PORT. The Fund’s Form N-PORT reports are available on the Commission’s website at www.sec.gov. The Fund’s Forms N-PORT may also be reviewed and copied at the Commission’s Public Reference Room in Washington, DC; information on the operation of the Public Reference Room may be obtained by calling (800) SEC 0330.
The [A/B] logo is a registered service mark of AllianceBernstein and AllianceBernstein® is a registered service mark used by permission of the owner, AllianceBernstein L.P.
| INTERNATIONAL VALUE PORTFOLIO | AB Variable Products Series Fund | |
LETTER TO INVESTORS
February 14, 2020
The following is an update of AB Variable Products Series Fund—International Value Portfolio (the “Portfolio”) for the annual reporting period ended December 31, 2019.
INVESTMENT OBJECTIVE AND POLICIES
The Portfolio’s investment objective is long-term growth of capital. The Portfolio invests primarily in a diversified portfolio of equity securities of established companies selected from more than 40 industries and more than 40 developed- and emerging-market countries. These countries currently include the developed nations in Europe and the Far East, Canada, Australia and emerging-market countries worldwide. Under normal market conditions, the Portfolio invests significantly, at least 40%—unless market conditions are not deemed favorable by the Adviser—in securities ofnon-US companies. In addition, the Portfolio invests, under normal circumstances, in the equity securities of companies located in at least three countries.
The Portfolio invests in companies that are determined by the Adviser to be undervalued, using a fundamental value approach. In selecting securities for the Portfolio, the Adviser uses its fundamental and quantitative research to identify companies whose stocks are priced low in relation to their perceived long-term earnings power.
Currencies can have a dramatic impact on equity returns, significantly adding to returns in some years and greatly diminishing them in others. The Adviser evaluates currency and equity positions separately and may seek to hedge the currency exposure resulting from securities positions when it finds the currency exposure unattractive. To hedge a portion of its currency risk, the Portfolio may from time to time invest in currency-related derivatives, including forward currency exchange contracts, futures, options on futures, swaps and options. The Adviser may also seek investment opportunities by taking long or short positions in currencies through the use of currency-related derivatives.
The Portfolio may enter into other derivatives transactions, such as options, futures contracts, forwards and swaps. The Portfolio may use options strategies involving the purchase and/or writing of various combinations of call and/or put options, including on individual securities and stock indices, futures contracts (including futures contracts on individual securities and stock indices) or shares of exchange-traded funds (“ETFs”). The Portfolio may, at times, invest in shares of ETFs in lieu of making direct investments in equity securities. ETFs may provide more efficient and economical exposure to the type of companies and geographic locations in which the Portfolio seeks to invest than direct investments. The Portfolio may invest in depositary receipts, instruments of supranational entities denominated in the currency of any country, securities of multinational companies and “semi-governmental securities,” and enter into forward commitments.
INVESTMENT RESULTS
The table on page 4 shows the Portfolio’s performance compared to its benchmark, the Morgan Stanley Capital International Europe, Australasia and the Far East (“MSCI EAFE”) Index (net), for theone-, five- and10-year periods ended December 31, 2019.
During the annual period, all share classes of the Portfolio underperformed the benchmark. Security selection drove underperformance, relative to the benchmark, led by selection within the consumer discretionary and materials sectors. Selection within utilities and communications services was positive. Sector selection also detracted. Losses from an overweight to energy and an underweight to health care detracted and partially offset gains from an underweight to real estate and an overweight to technology. In terms of country positioning (a result ofbottom-up security analysis driven by fundamental research), an underweight weight to France detracted while an overweight to Ireland added.
The Portfolio used derivatives in the form of forwards for hedging and investment purposes, which detracted from absolute returns during the annual period.
MARKET REVIEW AND INVESTMENT STRATEGY
Non-US equities recorded strong double-digit returns during the annual period ended December 31, 2019. After declining sharply at the end of 2018, equity markets rebounded dramatically in January as strong corporate earnings and optimism about a trade truce between the US and China calmed investors.Trade-war tensions resurfaced, however, and emerging geopolitical pressures drove market volatility. Tariff wars, restrictive monetary policy and a decline in industrial production stoked recessionary fears throughout the global economy. In response, the world’s central banks implemented accommodative monetary policies to help support capital markets. Late in the third quarter, equity market performance was accompanied by a sharp style rotation in the US. Quality-growth and lower-volatility stocks, which had been strong performers, lagged and value stocks outperformed. However, for the most part, growth stocks continued to outperform value over the entire period. In December, equity markets rallied on news that the US and China had agreed to a preliminaryphase-one trade deal due to be signed in January 2020.
The Portfolio’s Senior Investment Management Team (the “Team”) has continued to identify opportunities against a changing market backdrop. The Team has flexibility to adjust the Portfolio’s positions in real time when warranted, and to maintain conviction through short-term volatility. As markets face new uncertainties, the Team believes that this disciplined approach is the best way to capture the long-term potential for equities.
1
| INTERNATIONAL VALUE PORTFOLIO | ||
| DISCLOSURES AND RISKS | AB Variable Products Series Fund | |
Benchmark Disclosure
The MSCI EAFE Index is unmanaged and does not reflect fees and expenses associated with the active management of a mutual fund portfolio.The MSCI EAFE Index (net, free float-adjusted, market capitalization weighted) represents the equity market performance of developed markets, excluding the US and Canada. MSCI makes no express or implied warranties or representations, and shall have no liability whatsoever with respect to any MSCI data contained herein. The MSCI data may not be further redistributed or used as a basis for other indices, any securities or financial products. This report is not approved, reviewed or produced by MSCI. Net returns reflect the reinvestment of dividends after the deduction ofnon-US withholding tax. An investor cannot invest directly in an index, and its results are not indicative of the performance for any specific investment, including the Portfolio.
A Word About Risk
Market Risk:The value of the Portfolio’s assets will fluctuate as the stock or bond market fluctuates. The value of its investments may decline, sometimes rapidly and unpredictably, simply because of economic changes or other events that affect large portions of the market. It includes the risk that a particular style of investing, such as the Portfolio’s value approach, may underperform the market generally.
Foreign(Non-US) Risk:Investments in securities ofnon-US issuers may involve more risk than those of US issuers. These securities may fluctuate more widely in price and may be more difficult to trade or dispose of due to adverse market, economic, political, regulatory or other factors.
Emerging-Market Risk:Investments in emerging-market countries may have more risk because the markets are less developed and less liquid, and because these investments may be subject to increased economic, political, regulatory or other uncertainties.
Currency Risk:Fluctuations in currency exchange rates may negatively affect the value of the Portfolio’s investments or reduce its returns.
Derivatives Risk:Derivatives may be difficult to price or unwind and leveraged so that small changes may produce disproportionate losses for the Portfolio. Derivatives may also be subject to counterparty risk to a greater degree than more traditional investments.
Leverage Risk:When the Portfolio borrows money or otherwise leverages its portfolio, its net asset value (“NAV”) may be more volatile because leverage tends to exaggerate the effect of changes in interest rates and any increase or decrease in the value of the Portfolio’s investments. The Portfolio may create leverage through the use of reverse repurchase agreements, forward commitments, or by borrowing money.
Management Risk:The Portfolio is subject to management risk because it is an actively managed investment fund. The Adviser will apply its investment techniques and risk analyses in making investment decisions for the Portfolio, but there is no guarantee that its techniques will produce the intended results.
These risks are fully discussed in the Variable Products prospectus. As with all investments, you may lose money by investing in the Portfolio.
An Important Note About Historical Performance
The investment return and principal value of an investment in the Portfolio will fluctuate, so that shares, when redeemed, may be worth more or less than their original cost. Performance shown in this report represents past performance and does not guarantee future results. Current performance may be lower or higher than the performance information shown. Please contact your financial advisor or insurance agent representative at your financial institution to obtain portfolio performance information current to the most recent month end.
Investors should consider the investment objectives, risks, charges and expenses of the Portfolio carefully before investing. For additional copies of the Portfolio’s prospectus or summary prospectus, which contains this and other information, call your financial advisor or (800) 227 4618. Please read the prospectus and/or summary prospectus carefully before investing.
(Disclosures, Risks and Note About Historical Performance continued on next page)
2
| AB Variable Products Series Fund | ||
All fees and expenses related to the operation of the Portfolio have been deducted, but no adjustment has been made for insurance company separate account or annuity contract charges, which would reduce total return to a contract owner. Performance assumes reinvestment of distributions and does not account for taxes.
There are additional fees and expenses associated with all Variable Products. These fees can include mortality and expense risk charges, administrative charges, and other charges that can significantly reduce investment returns. Those fees and expenses are not reflected in this annual report. You should consult your Variable Products prospectus for a description of those fees and expenses and speak to your insurance agent or financial representative if you have any questions. You should read the prospectus before investing or sending money.
3
| INTERNATIONAL VALUE PORTFOLIO | ||
| HISTORICAL PERFORMANCE | AB Variable Products Series Fund | |
THE PORTFOLIO VS. ITS BENCHMARK PERIODS ENDED DECEMBER 31, 2019 (unaudited) | Net Asset Value Returns | |||||||||||
| 1 Year | 5 Years1 | 10 Years1 | ||||||||||
| International Value Portfolio Class A2 | 17.14% | 2.98% | 2.60% | |||||||||
| International Value Portfolio Class B2 | 16.79% | 2.71% | 2.33% | |||||||||
| MSCI EAFE Index (net) | 22.01% | 5.67% | 5.50% | |||||||||
1 Average annual returns. | ||||||||||||
2 Includes the impact of proceeds received and credited to the Portfolio resulting from class-action settlements, which enhanced the performance of all share classes of the Portfolio for the annual period ended December 31, 2019 by 0.18%. |
| |||||||||||
Please keep in mind that high, double-digit returns are highly unusual and cannot be sustained. Investors should also be aware that these returns were primarily achieved during favorable market conditions. |
| |||||||||||
The Portfolio’s current prospectus fee table shows the Portfolio’s total annual expense ratios as 0.87% and 1.11% for Class A and Class B shares, respectively. The Financial Highlights section of this report sets forth expense ratio data for the current reporting period; the expense ratios shown above may differ from the expense ratios in the Financial Highlights section since they are based on different time periods.
GROWTH OF A $10,000 INVESTMENT
12/31/2009 TO 12/31/2019 (unaudited)
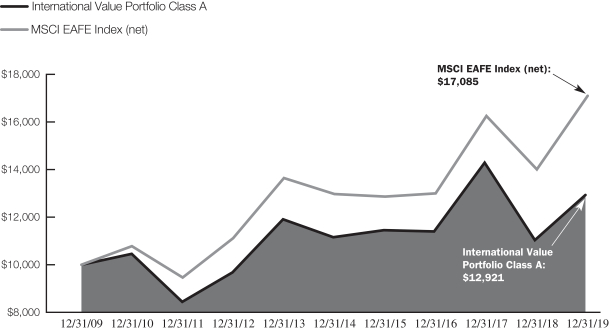
This chart illustrates the total value of an assumed $10,000 investment in the International Value Portfolio Class A shares (from 12/31/2009 to 12/31/2019) as compared to the performance of the Portfolio’s benchmark. The chart assumes the reinvestment of dividends and capital gains distributions.
See Disclosures, Risks and Note about Historical Performance on pages 2-3.
4
| INTERNATIONAL VALUE PORTFOLIO | ||
| EXPENSE EXAMPLE (unaudited) | AB Variable Products Series Fund | |
As a shareholder of the Portfolio, you incur two types of costs: (1) transaction costs, including sales charges (loads) on purchase payments, contingent deferred sales charges on redemptions and (2) ongoing costs, including management fees; distribution(12b-1) fees; and other Portfolio expenses. This example is intended to help you understand your ongoing costs (in dollars) of investing in the Portfolio and to compare these costs with the ongoing costs of investing in other mutual funds.
The Example is based on an investment of $1,000 invested at the beginning of the period and held for the entire period as indicated below.
Actual Expenses
The table below provides information about actual account values and actual expenses. You may use the information in this line, together with the amount you invested, to estimate the expenses that you paid over the period. Simply divide your account value by $1,000 (for example, an $8,600 account value divided by $1,000 = 8.6), then multiply the result by the number in the first line under the heading entitled “Expenses Paid During Period” to estimate the expenses you paid on your account during this period. The estimate of expenses does not include fees or other expenses of any variable insurance product. If such expenses were included, the estimate of expenses you paid during the period would be higher and your ending account value would be lower.
Hypothetical Example for Comparison Purposes
The table below provides information about hypothetical account values and hypothetical expenses based on the Portfolio’s actual expense ratio and an assumed annual rate of return of 5% before expenses, which is not the Portfolio’s actual return. The hypothetical account values and expenses may not be used to estimate the actual ending account balance or expenses you paid for the period. You may use this information to compare the ongoing costs of investing in the Portfolio and other funds by comparing this 5% hypothetical example with the 5% hypothetical examples that appear in the shareholder reports of other funds. The estimate of expenses does not include fees or other expenses of any variable insurance product. If such expenses were included, the estimate of expenses you paid during the period would be higher and your ending account value would be lower.
Please note that the expenses shown in the table are meant to highlight your ongoing costs only and do not reflect any transactional costs, such as sales charges (loads), or contingent deferred sales charges on redemptions. Therefore, the second line of each class’ table is useful in comparing ongoing costs only, and will not help you determine the relative total costs of owning different funds. In addition, if these transactional costs were included, your costs would have been higher.
| Beginning Account Value July 1, 2019 | Ending Account Value December 31, 2019 | Expenses Paid During Period* | Annualized Expense Ratio* | |||||||||||||
Class A | ||||||||||||||||
Actual | $ | 1,000 | $ | 1,075.80 | $ | 4.76 | 0.91 | % | ||||||||
Hypothetical (5% annual return before expenses) | $ | 1,000 | $ | 1,020.62 | $ | 4.63 | 0.91 | % | ||||||||
Class B | ||||||||||||||||
Actual | $ | 1,000 | $ | 1,073.60 | $ | 6.06 | 1.16 | % | ||||||||
Hypothetical (5% annual return before expenses) | $ | 1,000 | $ | 1,019.36 | $ | 5.90 | 1.16 | % | ||||||||
| * | Expenses are equal to each classes’ annualized expense ratios, multiplied by the average account value over the period, multiplied by 184/365 (to reflect theone-half year period). |
5
| INTERNATIONAL VALUE PORTFOLIO | ||
| TEN LARGEST HOLDINGS1 | ||
| December 31, 2019 (unaudited) | AB Variable Products Series Fund | |
| COMPANY | U.S. $ VALUE | PERCENT OF NET ASSETS | ||||||
Royal Dutch Shell PLC—Class A | $ | 14,189,967 | 3.8 | % | ||||
Roche Holding AG | 11,794,346 | 3.1 | ||||||
Airbus SE | 9,134,661 | 2.4 | ||||||
Repsol SA | 8,460,048 | 2.2 | ||||||
Coca-Cola European Partners PLC | 8,366,707 | 2.2 | ||||||
Samsung Electronics Co., Ltd. | 8,151,286 | 2.2 | ||||||
AerCap Holdings NV | 8,010,155 | 2.1 | ||||||
British American Tobacco PLC | 7,991,240 | 2.1 | ||||||
Novo Nordisk A/S—Class B | 7,877,565 | 2.1 | ||||||
EDP—Energias de Portugal SA | 7,821,061 | 2.1 | ||||||
|
|
|
| |||||
| $ | 91,797,036 | 24.3 | % | |||||
SECTOR BREAKDOWN2
December 31, 2019 (unaudited)
| SECTOR | U.S. $ VALUE | PERCENT OF TOTAL INVESTMENTS | ||||||
Financials | $ | 67,104,194 | 17.9 | % | ||||
Industrials | 48,933,711 | 13.0 | ||||||
Consumer Staples | 43,174,774 | 11.5 | ||||||
Information Technology | 38,479,337 | 10.2 | ||||||
Energy | 37,585,425 | 10.0 | ||||||
Materials | 36,752,603 | 9.8 | ||||||
Consumer Discretionary | 33,252,635 | 8.9 | ||||||
Health Care | 30,986,365 | 8.2 | ||||||
Utilities | 18,293,317 | 4.9 | ||||||
Communication Services | 12,573,351 | 3.3 | ||||||
Real Estate | 5,453,285 | 1.5 | ||||||
Short-Term Investments | 3,053,304 | 0.8 | ||||||
|
|
|
| |||||
Total Investments | $ | 375,642,301 | 100.0 | % | ||||
| 1 | Long-term investments. |
| 2 | The Portfolio’s sector breakdown is expressed as a percentage of total investments (excluding security lending collateral) and may vary over time. |
Please note: The sector classifications presented herein are based on the Global Industry Classification Standard (GICS) which was developed by Morgan Stanley Capital International and Standard & Poor’s. The components are divided into sector, industry group, and industrysub-indices as classified by the GICS for each of the market capitalization indices in the broad market. These sector classifications are broadly defined. The “Portfolio of Investments” section of the report reflects more specific industry information and is consistent with the investment restrictions discussed in the Portfolio’s prospectus.
6
| INTERNATIONAL VALUE PORTFOLIO | ||
| COUNTRY BREAKDOWN1 | ||
| December 31, 2019 (unaudited) | AB Variable Products Series Fund | |
| COUNTRY | U.S. $ VALUE | PERCENT OF TOTAL INVESTMENTS | ||||||
Japan | $ | 67,405,115 | 18.0 | % | ||||
United Kingdom | 57,126,111 | 15.2 | ||||||
Switzerland | 32,228,091 | 8.6 | ||||||
Germany | 26,607,302 | 7.1 | ||||||
France | 19,352,993 | 5.2 | ||||||
Italy | 15,938,513 | 4.2 | ||||||
South Korea | 14,409,411 | 3.8 | ||||||
Ireland | 13,869,086 | 3.7 | ||||||
Portugal | 11,374,216 | 3.0 | ||||||
Denmark | 11,236,745 | 3.0 | ||||||
Norway | 10,951,619 | 2.9 | ||||||
Canada | 9,883,695 | 2.6 | ||||||
Netherlands | 9,480,213 | 2.5 | ||||||
Other | 72,725,887 | 19.4 | ||||||
Short-Term Investments | 3,053,304 | 0.8 | ||||||
|
|
|
| |||||
Total Investments | $ | 375,642,301 | 100.0 | % | ||||
| 1 | All data are as of December 31, 2019. The Portfolio’s country breakdown is expressed as a percentage of total investments (excluding security lending collateral) and may vary over time. “Other” country weightings represent 2.5% or less in the following countries: Australia, Austria, Belgium, Brazil, China, Hong Kong, India, Israel, Spain, Sweden and Taiwan. |
7
| INTERNATIONAL VALUE PORTFOLIO | ||
| PORTFOLIO OF INVESTMENTS | ||
| December 31, 2019 | AB Variable Products Series Fund | |
| Company | Shares | U.S. $ Value | ||||||
COMMON STOCKS–98.6% | ||||||||
FINANCIALS–17.8% | ||||||||
BANKS–10.5% | ||||||||
Banco Comercial Portugues SA | 15,570,220 | $ | 3,553,155 | |||||
Bank Hapoalim BM | 476,890 | 3,960,468 | ||||||
Bank LeumiLe-Israel BM | 522,080 | 3,807,493 | ||||||
Bank of Ireland Group PLC | 1,064,563 | 5,858,931 | ||||||
Erste Group Bank AG(a) | 176,310 | 6,622,582 | ||||||
ICICI Bank Ltd. | 560,043 | 4,245,262 | ||||||
KBC Group NV | 76,670 | 5,780,503 | ||||||
Mediobanca Banca di Credito Finanziario SpA | 520,900 | 5,735,386 | ||||||
|
| |||||||
| 39,563,780 | ||||||||
|
| |||||||
CAPITAL MARKETS–1.7% | ||||||||
Credit Suisse Group AG(a) | 471,317 | 6,371,110 | ||||||
|
| |||||||
DIVERSIFIED FINANCIAL SERVICES–1.0% | ||||||||
ORIX Corp. | 225,200 | 3,731,871 | ||||||
|
| |||||||
INSURANCE–4.6% | ||||||||
Allianz SE | 27,420 | 6,718,661 | ||||||
Swiss Re AG | 34,690 | 3,897,159 | ||||||
Zurich Insurance Group AG | 16,630 | 6,821,613 | ||||||
|
| |||||||
| 17,437,433 | ||||||||
|
| |||||||
| 67,104,194 | ||||||||
|
| |||||||
INDUSTRIALS–13.0% | ||||||||
AEROSPACE & DEFENSE–6.2% | ||||||||
Airbus SE | 62,240 | 9,134,661 | ||||||
BAE Systems PLC | 761,410 | 5,700,918 | ||||||
Leonardo SpA | 308,701 | 3,620,239 | ||||||
MTU Aero Engines AG | 16,680 | 4,752,560 | ||||||
|
| |||||||
| 23,208,378 | ||||||||
|
| |||||||
AIRLINES–3.7% | ||||||||
Japan Airlines Co., Ltd. | 192,100 | 5,981,202 | ||||||
Qantas Airways Ltd. | 944,860 | 4,709,652 | ||||||
Wizz Air Holdings PLC(a)(b) | 64,690 | 3,343,863 | ||||||
|
| |||||||
| 14,034,717 | ||||||||
|
| |||||||
PROFESSIONAL SERVICES–1.0% | ||||||||
UT Group Co., Ltd.(c) | 123,500 | 3,680,461 | ||||||
|
| |||||||
TRADING COMPANIES & DISTRIBUTORS–2.1% | ||||||||
AerCap Holdings NV(a) | 130,310 | 8,010,155 | ||||||
|
| |||||||
| 48,933,711 | ||||||||
|
| |||||||
CONSUMER STAPLES–11.4% | ||||||||
BEVERAGES–3.0% | ||||||||
Coca-Cola Bottlers Japan Holdings, Inc.(c) | 119,700 | 3,058,369 | ||||||
Coca-Cola European Partners PLC | 164,440 | 8,366,707 | ||||||
|
| |||||||
| 11,425,076 | ||||||||
|
| |||||||
| Company | Shares | U.S. $ Value | ||||||
FOOD & STAPLES RETAILING–1.4% | ||||||||
Koninklijke Ahold Delhaize NV | 207,570 | $ | 5,204,277 | |||||
|
| |||||||
FOOD PRODUCTS–4.9% | ||||||||
Morinaga & Co., Ltd./Japan | 34,800 | 1,671,170 | ||||||
Orkla ASA | 692,860 | 7,026,161 | ||||||
Salmar ASA | 76,600 | 3,925,458 | ||||||
WH Group Ltd.(b) | 5,736,500 | 5,931,392 | ||||||
|
| |||||||
| 18,554,181 | ||||||||
|
| |||||||
TOBACCO–2.1% | ||||||||
British American Tobacco PLC | 188,020 | 7,991,240 | ||||||
|
| |||||||
| 43,174,774 | ||||||||
|
| |||||||
INFORMATION TECHNOLOGY–10.2% | ||||||||
ELECTRONIC EQUIPMENT, INSTRUMENTS & COMPONENTS–0.9% | ||||||||
Zhen Ding Technology Holding Ltd. | 689,000 | 3,305,872 | ||||||
|
| |||||||
SEMICONDUCTORS & SEMICONDUCTOR EQUIPMENT–6.2% | ||||||||
NXP Semiconductors NV | 33,600 | 4,275,936 | ||||||
SCREEN Holdings Co., Ltd. | 99,400 | 6,778,962 | ||||||
SK Hynix, Inc. | 76,940 | 6,258,125 | ||||||
Taiwan Semiconductor Manufacturing Co., Ltd. | 540,000 | 5,976,625 | ||||||
|
| |||||||
| 23,289,648 | ||||||||
|
| |||||||
SOFTWARE–1.0% | ||||||||
Open Text Corp. | 84,706 | 3,732,531 | ||||||
|
| |||||||
TECHNOLOGY HARDWARE, STORAGE & PERIPHERALS–2.1% | ||||||||
Samsung Electronics Co., Ltd. | 169,160 | 8,151,286 | ||||||
|
| |||||||
| 38,479,337 | ||||||||
|
| |||||||
ENERGY–9.9% | ||||||||
OIL, GAS & CONSUMABLE FUELS–9.9% | ||||||||
JXTG Holdings, Inc. | 1,321,900 | 5,999,545 | ||||||
PetroChina Co., Ltd.–Class H | 8,090,000 | 4,072,466 | ||||||
Petroleo Brasileiro SA (Preference Shares) | 643,900 | 4,863,399 | ||||||
Repsol SA | 522,721 | 8,212,028 | ||||||
Royal Dutch Shell PLC (Euronext Amsterdam)–Class A | 408,410 | 12,041,929 | ||||||
Royal Dutch Shell PLC–Class A | 72,534 | 2,148,038 | ||||||
|
| |||||||
| 37,337,405 | ||||||||
|
| |||||||
8
| AB Variable Products Series Fund | ||
| Company | Shares | U.S. $ Value | ||||||
MATERIALS–9.7% | ||||||||
CHEMICALS–6.2% | ||||||||
Air Water, Inc. | 197,600 | $ | 2,883,305 | |||||
Covestro AG(b) | 107,360 | 4,995,469 | ||||||
Evonik Industries AG | 153,470 | 4,687,327 | ||||||
Johnson Matthey PLC(c) | 142,650 | 5,671,958 | ||||||
Tosoh Corp. | 346,400 | 5,336,565 | ||||||
|
| |||||||
| 23,574,624 | ||||||||
|
| |||||||
CONTAINERS & PACKAGING–0.9% | ||||||||
BillerudKorsnas AB | 291,510 | 3,444,634 | ||||||
|
| |||||||
METALS & MINING–2.6% | ||||||||
BlueScope Steel Ltd. | 345,191 | 3,656,123 | ||||||
First Quantum Minerals Ltd. | 264,930 | 2,686,942 | ||||||
Yamato Kogyo Co., Ltd. | 135,400 | 3,390,280 | ||||||
|
| |||||||
| 9,733,345 | ||||||||
|
| |||||||
| 36,752,603 | ||||||||
|
| |||||||
CONSUMER DISCRETIONARY–8.8% | ||||||||
AUTO COMPONENTS–2.2% | ||||||||
NGK Spark Plug Co., Ltd. | 229,500 | 4,448,628 | ||||||
Valeo SA | 105,210 | 3,728,984 | ||||||
|
| |||||||
| 8,177,612 | ||||||||
|
| |||||||
AUTOMOBILES–2.8% | ||||||||
Peugeot SA | 269,523 | 6,489,348 | ||||||
Subaru Corp. | 174,800 | 4,329,767 | ||||||
|
| |||||||
| 10,819,115 | ||||||||
|
| |||||||
HOTELS, RESTAURANTS & LEISURE–2.0% | ||||||||
GVC Holdings PLC | 634,600 | 7,432,506 | ||||||
|
| |||||||
LEISURE PRODUCTS–0.9% | ||||||||
Spin Master Corp.(a)(b)(c) | 113,770 | 3,464,222 | ||||||
|
| |||||||
TEXTILES, APPAREL & LUXURY GOODS–0.9% | ||||||||
Pandora A/S | 77,220 | 3,359,180 | ||||||
|
| |||||||
| 33,252,635 | ||||||||
|
| |||||||
HEALTH CARE–8.2% | ||||||||
HEALTH CARE EQUIPMENT & SUPPLIES–0.9% | ||||||||
Hoya Corp. | 37,100 | 3,541,639 | ||||||
|
| |||||||
PHARMACEUTICALS–7.3% | ||||||||
GlaxoSmithKline PLC | 330,800 | 7,772,815 | ||||||
Novo Nordisk A/S–Class B | 135,940 | 7,877,565 | ||||||
Roche Holding AG | 36,290 | 11,794,346 | ||||||
|
| |||||||
| 27,444,726 | ||||||||
|
| |||||||
| 30,986,365 | ||||||||
|
| |||||||
UTILITIES–4.9% | ||||||||
ELECTRIC UTILITIES–3.8% | ||||||||
EDP–Energias de Portugal SA | 1,802,340 | 7,821,061 | ||||||
Enel SpA | 828,680 | 6,582,888 | ||||||
|
| |||||||
| 14,403,949 | ||||||||
|
| |||||||
GAS UTILITIES–1.1% | ||||||||
ENN Energy Holdings Ltd. | 356,000 | 3,889,368 | ||||||
|
| |||||||
| 18,293,317 | ||||||||
|
| |||||||
| Company | Shares | U.S. $ Value | ||||||
COMMUNICATION SERVICES–3.3% | ||||||||
DIVERSIFIED TELECOMMUNICATION SERVICES–1.4% | ||||||||
Nippon Telegraph & Telephone Corp. | 215,800 | $ | 5,454,062 | |||||
|
| |||||||
ENTERTAINMENT–1.9% | ||||||||
Nintendo Co., Ltd. | 17,800 | 7,119,289 | ||||||
|
| |||||||
| 12,573,351 | ||||||||
|
| |||||||
REAL ESTATE–1.4% | ||||||||
REAL ESTATE MANAGEMENT & DEVELOPMENT–1.4% | ||||||||
Aroundtown SA | 607,150 | 5,453,284 | ||||||
|
| |||||||
Total Common Stocks | 372,340,976 | |||||||
|
| |||||||
RIGHTS–0.1% | ||||||||
ENERGY–0.1% | ||||||||
OIL, GAS & CONSUMABLE FUELS–0.1% | ||||||||
Repsol SA, expiring 1/09/20(a) | 522,721 | 248,020 | ||||||
|
| |||||||
SHORT-TERM INVESTMENTS–0.8% | ||||||||
INVESTMENT COMPANIES–0.8% | ||||||||
AB Fixed Income Shares, Inc.–Government Money Market Portfolio–Class AB, 1.53%(d)(e)(f) | 3,053,305 | 3,053,305 | ||||||
|
| |||||||
TOTAL INVESTMENTS BEFORE SECURITY LENDING COLLATERAL FOR SECURITIES LOANED–99.5% | 375,642,301 | |||||||
|
| |||||||
INVESTMENTS OF CASH COLLATERAL FOR SECURITIES | ||||||||
INVESTMENT COMPANIES–1.0% | ||||||||
AB Fixed Income Shares, Inc.–Government Money Market Portfolio–Class AB, 1.53%(d)(e)(f) | 3,845,627 | 3,845,627 | ||||||
|
| |||||||
TOTAL INVESTMENTS–100.5% | 379,487,928 | |||||||
Other assets less | (1,864,271 | ) | ||||||
|
| |||||||
NET ASSETS–100.0% | $ | 377,623,657 | ||||||
|
| |||||||
9
| INTERNATIONAL VALUE PORTFOLIO | ||
| PORTFOLIO OF INVESTMENTS | ||
| (continued) | AB Variable Products Series Fund | |
FORWARD CURRENCY EXCHANGE CONTRACTS (see Note D)
| Counterparty | Contracts to Deliver (000) | In Exchange For (000) | Settlement Date | Unrealized Appreciation/ (Depreciation) | ||||||||||||||||||||
Bank of America, NA | GBP | 1,547 | USD | 2,002 | 1/03/20 | $ | (46,785) | |||||||||||||||||
Bank of America, NA | ILS | 1,445 | USD | 413 | 1/03/20 | (5,293) | ||||||||||||||||||
Bank of America, NA | USD | 4,589 | SGD | 6,296 | 1/15/20 | 92,826 | ||||||||||||||||||
Bank of America, NA | USD | 1,935 | RUB | 124,395 | 1/17/20 | 67,098 | ||||||||||||||||||
Bank of America, NA | USD | 2,008 | GBP | 1,547 | 4/17/20 | 46,831 | ||||||||||||||||||
Barclays Bank PLC | CHF | 1,034 | USD | 1,056 | 1/03/20 | (12,762) | ||||||||||||||||||
Barclays Bank PLC | NOK | 4,076 | USD | 452 | 1/03/20 | (12,708) | ||||||||||||||||||
Barclays Bank PLC | USD | 3,772 | AUD | 5,496 | 1/03/20 | 84,375 | ||||||||||||||||||
Barclays Bank PLC | AUD | 6,272 | USD | 4,255 | 1/15/20 | (147,705) | ||||||||||||||||||
Barclays Bank PLC | CAD | 6,153 | USD | 4,634 | 1/15/20 | (104,480) | ||||||||||||||||||
Barclays Bank PLC | JPY | 103,897 | USD | 959 | 1/15/20 | 2,557 | ||||||||||||||||||
Barclays Bank PLC | USD | 1,814 | EUR | 1,634 | 1/15/20 | 20,696 | ||||||||||||||||||
Barclays Bank PLC | USD | 2,258 | GBP | 1,749 | 1/15/20 | 59,730 | ||||||||||||||||||
Barclays Bank PLC | USD | 1,210 | JPY | 128,620 | 1/15/20 | (25,750) | ||||||||||||||||||
Barclays Bank PLC | USD | 714 | NZD | 1,124 | 1/15/20 | 42,492 | ||||||||||||||||||
Barclays Bank PLC | USD | 5,365 | SEK | 52,310 | 1/15/20 | 223,673 | ||||||||||||||||||
Barclays Bank PLC | INR | 233,089 | USD | 3,236 | 1/16/20 | (33,695) | ||||||||||||||||||
Barclays Bank PLC | RUB | 61,930 | USD | 962 | 1/17/20 | (35,317) | ||||||||||||||||||
Barclays Bank PLC | KRW | 15,810,098 | USD | 13,528 | 2/06/20 | (161,368) | ||||||||||||||||||
Barclays Bank PLC | CNY | 56,861 | USD | 7,983 | 2/13/20 | (176,188) | ||||||||||||||||||
Barclays Bank PLC | USD | 414 | CNY | 2,902 | 2/13/20 | 2,424 | ||||||||||||||||||
Barclays Bank PLC | TWD | 275,885 | USD | 9,119 | 2/20/20 | (138,032) | ||||||||||||||||||
Barclays Bank PLC | IDR | 12,724,938 | USD | 906 | 2/27/20 | (10,160) | ||||||||||||||||||
Barclays Bank PLC | USD | 1,804 | IDR | 25,789,603 | 2/27/20 | 52,690 | ||||||||||||||||||
BNP Paribas SA | CAD | 1,041 | USD | 785 | 1/15/20 | (17,158) | ||||||||||||||||||
BNP Paribas SA | NOK | 37,336 | USD | 4,083 | 1/15/20 | (169,761) | ||||||||||||||||||
Citibank, NA | CAD | 1,133 | USD | 851 | 1/15/20 | (21,227) | ||||||||||||||||||
Citibank, NA | EUR | 926 | USD | 1,026 | 1/15/20 | (13,727) | ||||||||||||||||||
Citibank, NA | USD | 836 | CHF | 827 | 1/15/20 | 18,762 | ||||||||||||||||||
Citibank, NA | USD | 1,866 | EUR | 1,667 | 1/15/20 | 5,314 | ||||||||||||||||||
Citibank, NA | USD | 5,670 | GBP | 4,468 | 1/15/20 | 250,448 | ||||||||||||||||||
Citibank, NA | USD | 919 | MXN | 17,970 | 1/15/20 | 29,370 | ||||||||||||||||||
Credit Suisse International | BRL | 29,468 | USD | 7,171 | 1/03/20 | (154,431) | ||||||||||||||||||
Credit Suisse International | USD | 7,257 | BRL | 29,468 | 1/03/20 | 68,179 | ||||||||||||||||||
Credit Suisse International | CHF | 8,197 | USD | 8,334 | 1/15/20 | (141,547) | ||||||||||||||||||
Credit Suisse International | BRL | 16,879 | USD | 4,129 | 2/04/20 | (63,238) | ||||||||||||||||||
Goldman Sachs Bank USA | BRL | 4,290 | USD | 1,058 | 1/03/20 | (8,677) | ||||||||||||||||||
Goldman Sachs Bank USA | USD | 1,064 | BRL | 4,290 | 1/03/20 | 2,117 | ||||||||||||||||||
Goldman Sachs Bank USA | CAD | 778 | USD | 589 | 1/15/20 | (9,860) | ||||||||||||||||||
Goldman Sachs Bank USA | ILS | 18,066 | USD | 5,184 | 1/15/20 | (50,089) | ||||||||||||||||||
Goldman Sachs Bank USA | USD | 2,793 | GBP | 2,229 | 1/15/20 | 160,613 | ||||||||||||||||||
Goldman Sachs Bank USA | USD | 19,545 | JPY | 2,107,439 | 1/15/20 | (139,904) | ||||||||||||||||||
JPMorgan Chase Bank, NA | EUR | 16,442 | USD | 18,273 | 1/15/20 | (183,498) | ||||||||||||||||||
JPMorgan Chase Bank, NA | JPY | 203,105 | USD | 1,872 | 1/15/20 | 1,587 | ||||||||||||||||||
JPMorgan Chase Bank, NA | USD | 14,698 | AUD | 21,586 | 1/15/20 | 454,178 | ||||||||||||||||||
JPMorgan Chase Bank, NA | USD | 1,235 | GBP | 954 | 1/15/20 | 29,312 | ||||||||||||||||||
JPMorgan Chase Bank, NA | USD | 910 | TRY | 5,291 | 1/15/20 | (23,384) | ||||||||||||||||||
Morgan Stanley & Co., Inc. | AUD | 5,496 | USD | 3,800 | 1/03/20 | (57,268) | ||||||||||||||||||
10
| AB Variable Products Series Fund | ||
| Counterparty | Contracts to Deliver (000) | In Exchange For (000) | Settlement Date | Unrealized Appreciation/ (Depreciation) | ||||||||||||||||||||
Morgan Stanley & Co., Inc. | USD | 1,055 | CHF | 1,034 | 1/03/20 | $ | 13,623 | |||||||||||||||||
Morgan Stanley & Co., Inc. | USD | 526 | GBP | 402 | 1/03/20 | 6,601 | ||||||||||||||||||
Morgan Stanley & Co., Inc. | USD | 761 | GBP | 571 | 1/03/20 | (5,154) | ||||||||||||||||||
Morgan Stanley & Co., Inc. | CAD | 740 | USD | 559 | 1/15/20 | (10,446) | ||||||||||||||||||
Morgan Stanley & Co., Inc. | EUR | 2,319 | USD | 2,588 | 1/15/20 | (15,238) | ||||||||||||||||||
Morgan Stanley & Co., Inc. | GBP | 873 | USD | 1,145 | 1/15/20 | (11,940) | ||||||||||||||||||
Morgan Stanley & Co., Inc. | USD | 1,709 | CHF | 1,687 | 1/15/20 | 35,581 | ||||||||||||||||||
Morgan Stanley & Co., Inc. | USD | 1,772 | GBP | 1,369 | 1/15/20 | 42,369 | ||||||||||||||||||
Morgan Stanley & Co., Inc. | USD | 732 | JPY | 79,346 | 1/15/20 | (1,582) | ||||||||||||||||||
Morgan Stanley & Co., Inc. | CHF | 1,034 | USD | 1,063 | 4/17/20 | (13,580) | ||||||||||||||||||
Morgan Stanley & Co., Inc. | USD | 3,809 | AUD | 5,496 | 4/17/20 | 57,713 | ||||||||||||||||||
Natwest Markets PLC | USD | 769 | GBP | 574 | 1/03/20 | (8,881) | ||||||||||||||||||
Natwest Markets PLC | CAD | 737 | USD | 558 | 1/15/20 | (9,801) | ||||||||||||||||||
Natwest Markets PLC | EUR | 986 | USD | 1,099 | 1/15/20 | (8,208) | ||||||||||||||||||
Natwest Markets PLC | GBP | 1,139 | USD | 1,471 | 1/15/20 | (37,765) | ||||||||||||||||||
Natwest Markets PLC | JPY | 482,364 | USD | 4,470 | 1/15/20 | 28,287 | ||||||||||||||||||
Natwest Markets PLC | USD | 2,920 | AUD | 4,236 | 1/15/20 | 53,946 | ||||||||||||||||||
Natwest Markets PLC | USD | 13,713 | EUR | 12,257 | 1/15/20 | 45,859 | ||||||||||||||||||
Natwest Markets PLC | USD | 1,558 | GBP | 1,207 | 1/15/20 | 40,857 | ||||||||||||||||||
Natwest Markets PLC | USD | 1,478 | JPY | 159,696 | 1/15/20 | (7,541) | ||||||||||||||||||
Natwest Markets PLC | USD | 481 | KRW | 566,263 | 2/06/20 | 9,658 | ||||||||||||||||||
Societe Generale | USD | 1,322 | JPY | 139,944 | 1/15/20 | (33,009) | ||||||||||||||||||
Standard Chartered Bank | HKD | 39,249 | USD | 5,007 | 1/15/20 | (29,038) | ||||||||||||||||||
Standard Chartered Bank | USD | 3,527 | JPY | 382,645 | 1/15/20 | (3,670) | ||||||||||||||||||
Standard Chartered Bank | INR | 52,520 | USD | 732 | 1/16/20 | (4,299) | ||||||||||||||||||
Standard Chartered Bank | USD | 1,007 | CNY | 7,090 | 2/13/20 | 10,232 | ||||||||||||||||||
State Street Bank & Trust Co. | SEK | 6,354 | USD | 675 | 1/03/20 | (3,454) | ||||||||||||||||||
State Street Bank & Trust Co. | USD | 417 | ILS | 1,445 | 1/03/20 | 1,851 | ||||||||||||||||||
State Street Bank & Trust Co. | USD | 456 | NOK | 4,076 | 1/03/20 | 8,506 | ||||||||||||||||||
State Street Bank & Trust Co. | USD | 677 | SEK | 6,354 | 1/03/20 | 1,718 | ||||||||||||||||||
State Street Bank & Trust Co. | CAD | 1,745 | USD | 1,319 | 1/15/20 | (25,215) | ||||||||||||||||||
State Street Bank & Trust Co. | EUR | 3,130 | USD | 3,462 | 1/15/20 | (51,087) | ||||||||||||||||||
State Street Bank & Trust Co. | JPY | 28,125 | USD | 259 | 1/15/20 | 155 | ||||||||||||||||||
State Street Bank & Trust Co. | USD | 2,178 | CHF | 2,144 | 1/15/20 | 38,799 | ||||||||||||||||||
State Street Bank & Trust Co. | USD | 3,471 | EUR | 3,126 | 1/15/20 | 37,490 | ||||||||||||||||||
State Street Bank & Trust Co. | USD | 780 | GBP | 603 | 1/15/20 | 18,833 | ||||||||||||||||||
State Street Bank & Trust Co. | USD | 244 | JPY | 26,417 | 1/15/20 | (635) | ||||||||||||||||||
State Street Bank & Trust Co. | USD | 374 | SEK | 3,563 | 1/15/20 | 6,852 | ||||||||||||||||||
State Street Bank & Trust Co. | KRW | 698,454 | USD | 599 | 2/06/20 | (5,410) | ||||||||||||||||||
State Street Bank & Trust Co. | ILS | 1,445 | USD | 418 | 4/17/20 | (2,533) | ||||||||||||||||||
State Street Bank & Trust Co. | NOK | 4,076 | USD | 456 | 4/17/20 | (8,710) | ||||||||||||||||||
State Street Bank & Trust Co. | USD | 678 | SEK | 6,354 | 4/17/20 | 3,353 | ||||||||||||||||||
UBS AG | JPY | 115,264 | USD | 1,069 | 1/15/20 | 7,213 | ||||||||||||||||||
UBS AG | USD | 912 | JPY | 97,846 | 1/15/20 | (10,950) | ||||||||||||||||||
UBS AG | USD | 489 | TWD | 14,675 | 2/20/20 | 3,057 | ||||||||||||||||||
|
| |||||||||||||||||||||||
| $ | (84,333) | |||||||||||||||||||||||
|
| |||||||||||||||||||||||
| (a) | Non-income producing security. |
| (b) | Security is exempt from registration under Rule 144A of the Securities Act of 1933. These securities are considered restricted, but liquid and may be resold in transactions exempt from registration, normally to qualified institutional buyers. At December 31, 2019, the aggregate market value of these securities amounted to $17,734,946 or 4.7% of net assets. |
11
| INTERNATIONAL VALUE PORTFOLIO | ||
| PORTFOLIO OF INVESTMENTS | ||
| (continued) | AB Variable Products Series Fund | |
| (c) | Represents entire or partial securities out on loan. See Note E for securities lending information. |
| (d) | Affiliated investments. |
| (e) | The rate shown represents the7-day yield as of period end. |
| (f) | To obtain a copy of the fund’s shareholder report, please go to the Securities and Exchange Commission’s website at www.sec.gov, or call AB at (800)227-4618. |
Currency Abbreviations:
AUD—Australian Dollar
BRL—Brazilian Real
CAD—Canadian Dollar
CHF—Swiss Franc
CNY—Chinese Yuan Renminbi
DKK—Danish Krone
EUR—Euro
GBP—Great British Pound
HKD—Hong Kong Dollar
IDR—Indonesian Rupiah
ILS—Israeli Shekel
INR—Indian Rupee
JPY—Japanese Yen
KRW—South Korean Won
MXN—Mexican Peso
NOK—Norwegian Krone
NZD—New Zealand Dollar
RUB—Russian Ruble
SEK—Swedish Krona
SGD—Singapore Dollar
TRY—Turkish Lira
TWD—New Taiwan Dollar
USD—United States Dollar
See notes to financial statements.
12
| INTERNATIONAL VALUE PORTFOLIO | ||
| STATEMENT OF ASSETS & LIABILITIES | ||
| December 31, 2019 | AB Variable Products Series Fund | |
ASSETS |
| |||
Investments in securities, at value | ||||
Unaffiliated issuers (cost $337,855,913) | $ | 372,588,996 | (a) | |
Affiliated issuers (cost $6,898,932—including investment of cash collateral for securities loaned of $3,845,627) | 6,898,932 | |||
Cash collateral due from broker | 280,000 | |||
Foreign currencies, at value (cost $1,333,506) | 1,343,253 | |||
Unrealized appreciation on forward currency exchange contracts | 2,187,825 | |||
Unaffiliated dividends receivable | 1,243,546 | |||
Receivable for capital stock sold | 35,705 | |||
Receivable for investment securities sold | 28,922 | |||
Affiliated dividends receivable | 4,190 | |||
|
| |||
Total assets | 384,611,369 | |||
|
| |||
LIABILITIES |
| |||
Payable for collateral received on securities loaned | 3,845,627 | |||
Unrealized depreciation on forward currency exchange contracts | 2,272,158 | |||
Advisory fee payable | 230,134 | |||
Payable for capital stock redeemed | 226,615 | |||
Payable for investment securities purchased | 78,103 | |||
Distribution fee payable | 65,895 | |||
Administrative fee payable | 21,886 | |||
Transfer Agent fee payable | 132 | |||
Accrued expenses and other liabilities | 247,162 | |||
|
| |||
Total liabilities | 6,987,712 | |||
|
| |||
NET ASSETS | $ | 377,623,657 | ||
|
| |||
COMPOSITION OF NET ASSETS |
| |||
Capital stock, at par | $ | 26,482 | ||
Additionalpaid-in capital | 367,968,424 | |||
Distributable earnings | 9,628,751 | |||
|
| |||
| $ | 377,623,657 | |||
|
| |||
Net Asset Value Per Share—1 billion shares of capital stock authorized, $.001 par value
| Class | Net Assets | Shares Outstanding | Net Asset Value | |||||||||
| A | $ | 54,042,441 | 3,761,984 | $ | 14.37 | |||||||
| B | $ | 323,581,216 | 22,720,397 | $ | 14.24 | |||||||
| (a) | Includes securities on loan with a value of $7,089,072 (see Note E). |
See notes to financial statements.
13
| INTERNATIONAL VALUE PORTFOLIO | ||
| STATEMENT OF OPERATIONS | ||
| Year Ended December 31, 2019 | AB Variable Products Series Fund | |
INVESTMENT INCOME | ||||
Dividends | ||||
Unaffiliated issuers (net of foreign taxes withheld of $1,281,627) | $ | 11,010,043 | ||
Affiliated issuers | 207,319 | |||
Securities lending income | 8,498 | |||
|
| |||
| 11,225,860 | ||||
|
| |||
EXPENSES | ||||
Advisory fee (see Note B) | 2,819,506 | |||
Distribution fee—Class B | 802,310 | |||
Transfer agency—Class A | 974 | |||
Transfer agency—Class B | 5,712 | |||
Custodian | 177,474 | |||
Printing | 137,736 | |||
Administrative | 79,692 | |||
Audit and tax | 64,450 | |||
Legal | 47,471 | |||
Directors’ fees | 22,925 | |||
Miscellaneous | 21,991 | |||
|
| |||
Total expenses | 4,180,241 | |||
Less: expenses waived and reimbursed by the Adviser (see Notes B & E) | (7,022 | ) | ||
|
| |||
Net expenses | 4,173,219 | |||
|
| |||
Net investment income | 7,052,641 | |||
|
| |||
REALIZED AND UNREALIZED GAIN (LOSS) ON INVESTMENT AND FOREIGN CURRENCY TRANSACTIONS | ||||
Net realized loss on: | ||||
Investment transactions | (23,567,827 | ) | ||
Forward currency exchange contracts | (2,331,047 | ) | ||
Foreign currency transactions | (122,804 | ) | ||
Net change in unrealized appreciation/depreciation of: | ||||
Investments | 76,133,659 | |||
Forward currency exchange contracts | 1,239,568 | |||
Foreign currency denominated assets and liabilities | 18,541 | |||
|
| |||
Net gain on investment and foreign currency transactions | 51,370,090 | |||
|
| |||
NET INCREASE IN NET ASSETS FROM OPERATIONS | $ | 58,422,731 | ||
|
|
See notes to financial statements.
14
| INTERNATIONAL VALUE PORTFOLIO | ||
| STATEMENT OF CHANGES IN NET ASSETS | AB Variable Products Series Fund | |
| Year Ended December 31, 2019 | Year Ended December 31, 2018 | |||||||
INCREASE (DECREASE) IN NET ASSETS FROM OPERATIONS |
| |||||||
Net investment income | $ | 7,052,641 | $ | 6,877,447 | ||||
Net realized gain (loss) on investment and foreign currency transactions | (26,021,678 | ) | 6,436,057 | |||||
Net change in unrealized appreciation/depreciation of investments and foreign currency denominated assets and liabilities | 77,391,768 | (122,451,058 | ) | |||||
|
|
|
| |||||
Net increase (decrease) in net assets from operations | 58,422,731 | (109,137,554 | ) | |||||
Distributions to Shareholders |
| |||||||
Class A | (479,446 | ) | (1,075,905 | ) | ||||
Class B | (2,522,410 | ) | (4,249,239 | ) | ||||
CAPITAL STOCK TRANSACTIONS |
| |||||||
Net decrease | (44,607,256 | ) | (4,626,158 | ) | ||||
|
|
|
| |||||
Total increase (decrease) | 10,813,619 | (119,088,856 | ) | |||||
NET ASSETS |
| |||||||
Beginning of period | 366,810,038 | 485,898,894 | ||||||
|
|
|
| |||||
End of period | $ | 377,623,657 | $ | 366,810,038 | ||||
|
|
|
| |||||
See notes to financial statements.
15
| INTERNATIONAL VALUE PORTFOLIO | ||
| NOTES TO FINANCIAL STATEMENTS | ||
| December 31, 2019 | AB Variable Products Series Fund | |
NOTE A: Significant Accounting Policies
The AB International Value Portfolio (the “Portfolio”) is a series of AB Variable Products Series Fund, Inc. (the “Fund”). The Portfolio’s investment objective is long-term growth of capital. The Portfolio is diversified as defined under the Investment Company Act of 1940. The Fund was incorporated in the State of Maryland on November 17, 1987, as anopen-end series investment company. The Fund offers eleven separately managed pools of assets which have differing investment objectives and policies. The Portfolio offers Class A and Class B shares. Both classes of shares have identical voting, dividend, liquidating and other rights, except that Class B shares bear a distribution expense and have exclusive voting rights with respect to the Class B distribution plan.
The Portfolio offers and sells its shares only to separate accounts of certain life insurance companies for the purpose of funding variable annuity contracts and variable life insurance policies. Sales are made without a sales charge at the Portfolio’s net asset value per share.
The financial statements have been prepared in conformity with U.S. generally accepted accounting principles (“U.S. GAAP”) which require management to make certain estimates and assumptions that affect the reported amounts of assets and liabilities in the financial statements and amounts of income and expenses during the reporting period. Actual results could differ from those estimates. The Portfolio is an investment company under U.S. GAAP and follows the accounting and reporting guidance applicable to investment companies. The following is a summary of significant accounting policies followed by the Portfolio.
1. Security Valuation
Portfolio securities are valued at their current market value determined on the basis of market quotations or, if market quotations are not readily available or are deemed unreliable, at “fair value” as determined in accordance with procedures established by and under the general supervision of the Fund’s Board of Directors (the “Board”).
In general, the market values of securities which are readily available and deemed reliable are determined as follows: securities listed on a national securities exchange (other than securities listed on the NASDAQ Stock Market, Inc. (“NASDAQ”)) or on a foreign securities exchange are valued at the last sale price at the close of the exchange or foreign securities exchange. If there has been no sale on such day, the securities are valued at the last traded price from the previous day. Securities listed on more than one exchange are valued by reference to the principal exchange on which the securities are traded; securities listed only on NASDAQ are valued in accordance with the NASDAQ Official Closing Price; listed or over the counter (“OTC”) market put or call options are valued at the mid level between the current bid and ask prices. If either a current bid or current ask price is unavailable, AllianceBernstein L.P. (the “Adviser”) will have discretion to determine the best valuation (e.g., last trade price in the case of listed options); open futures are valued using the closing settlement price or, in the absence of such a price, the most recent quoted bid price. If there are no quotations available for the day of valuation, the last available closing settlement price is used; U.S. Government securities and any other debt instruments having 60 days or less remaining until maturity are generally valued at market by an independent pricing vendor, if a market price is available. If a market price is not available, the securities are valued at amortized cost. This methodology is commonly used for short term securities that have an original maturity of 60 days or less, as well as short term securities that had an original term to maturity that exceeded 60 days. In instances when amortized cost is utilized, the Valuation Committee (the “Committee”) must reasonably conclude that the utilization of amortized cost is approximately the same as the fair value of the security. Such factors the Committee will consider include, but are not limited to, an impairment of the creditworthiness of the issuer or material changes in interest rates. Fixed-income securities, including mortgage-backed and asset-backed securities, may be valued on the basis of prices provided by a pricing service or at a price obtained from one or more of the major broker-dealers. In cases where broker-dealer quotes are obtained, the Adviser may establish procedures whereby changes in market yields or spreads are used to adjust, on a daily basis, a recently obtained quoted price on a security. Swaps and other derivatives are valued daily, primarily using independent pricing services, independent pricing models using market inputs, as well as third party broker-dealers or counterparties. Open end mutual funds are valued at the closing net asset value per share, while exchange traded funds are valued at the closing market price per share.
Securities for which market quotations are not readily available (including restricted securities) or are deemed unreliable are valued at fair value as deemed appropriate by the Adviser. Factors considered in making this determination may include, but are not limited to, information obtained by contacting the issuer, analysts, analysis of the issuer’s financial statements or other available documents. In addition, the Portfolio may use fair value pricing for securities primarily traded innon-U.S. markets because most foreign markets close well before the Portfolio values its securities at 4:00 p.m., Eastern Time. The
16
| AB Variable Products Series Fund | ||
earlier close of these foreign markets gives rise to the possibility that significant events, including broad market moves, may have occurred in the interim and may materially affect the value of those securities. To account for this, the Portfolio generally values many of its foreign equity securities using fair value prices based on third party vendor modeling tools to the extent available.
2. Fair Value Measurements
In accordance with U.S. GAAP regarding fair value measurements, fair value is defined as the price that the Portfolio would receive to sell an asset or pay to transfer a liability in an orderly transaction between market participants at the measurement date. U.S. GAAP establishes a framework for measuring fair value, and a three-level hierarchy for fair value measurements based upon the transparency of inputs to the valuation of an asset or liability (including those valued based on their market values as described in Note A.1 above). Inputs may be observable or unobservable and refer broadly to the assumptions that market participants would use in pricing the asset or liability. Observable inputs reflect the assumptions market participants would use in pricing the asset or liability based on market data obtained from sources independent of the Portfolio. Unobservable inputs reflect the Portfolio’s own assumptions about the assumptions that market participants would use in pricing the asset or liability based on the best information available in the circumstances. Each investment is assigned a level based upon the observability of the inputs which are significant to the overall valuation. The three-tier hierarchy of inputs is summarized below.
| • | Level 1—quoted prices in active markets for identical investments |
| • | Level 2—other significant observable inputs (including quoted prices for similar investments, interest rates, prepayment speeds, credit risk, etc.) |
| • | Level 3—significant unobservable inputs (including the Portfolio’s own assumptions in determining the fair value of investments) |
Where readily available market prices or relevant bid prices are not available for certain equity investments, such investments may be valued based on similar publicly traded investments, movements in relevant indices since last available prices or based upon underlying company fundamentals and comparable company data (such as multiples to earnings or other multiples to equity). Where an investment is valued using an observable input, such as another publicly traded security, the investment will be classified as Level 2. If management determines that an adjustment is appropriate based on restrictions on resale, illiquidity or uncertainty, and such adjustment is a significant component of the valuation, the investment will be classified as Level 3. An investment will also be classified as Level 3 where management uses company fundamentals and other significant inputs to determine the valuation.
The following table summarizes the valuation of the Portfolio’s investments by the above fair value hierarchy levels as of December 31, 2019:
| Level 1 | Level 2 | Level 3 | Total | |||||||||||||
Investments in Securities: | ||||||||||||||||
Assets: | ||||||||||||||||
Common Stocks: | ||||||||||||||||
Financials | $ | –0 | – | $ | 67,104,194 | $ | –0 | – | $ | 67,104,194 | ||||||
Industrials | 8,010,155 | 40,923,556 | –0 | – | 48,933,711 | |||||||||||
Consumer Staples | 8,366,707 | 34,808,067 | –0 | – | 43,174,774 | |||||||||||
Information Technology | 8,008,467 | 30,470,870 | –0 | – | 38,479,337 | |||||||||||
Energy | –0 | – | 37,337,405 | –0 | – | 37,337,405 | ||||||||||
Materials | 2,686,942 | 34,065,661 | –0 | – | 36,752,603 | |||||||||||
Consumer Discretionary | 14,255,908 | 18,996,727 | –0 | – | 33,252,635 | |||||||||||
Health Care | –0 | – | 30,986,365 | –0 | – | 30,986,365 | ||||||||||
Utilities | –0 | – | 18,293,317 | –0 | – | 18,293,317 | ||||||||||
Communication Services | –0 | – | 12,573,351 | –0 | – | 12,573,351 | ||||||||||
Real Estate | –0 | – | 5,453,284 | –0 | – | 5,453,284 | ||||||||||
Rights | 248,020 | –0 | – | –0 | – | 248,020 | ||||||||||
Short-Term Investments | 3,053,305 | –0 | – | –0 | – | 3,053,305 | ||||||||||
Investments of Cash Collateral for Securities Loaned in Affiliated Money Market Fund | 3,845,627 | –0 | – | –0 | – | 3,845,627 | ||||||||||
|
|
|
|
|
|
|
| |||||||||
Total Investments in Securities | 48,475,131 | 331,012,797 | (a) | –0 | – | 379,487,928 | ||||||||||
17
| INTERNATIONAL VALUE PORTFOLIO | ||
| NOTES TO FINANCIAL STATEMENTS | ||
| (continued) | AB Variable Products Series Fund | |
| Level 1 | Level 2 | Level 3 | Total | |||||||||||||
Other Financial Instruments(b): | ||||||||||||||||
Assets: | ||||||||||||||||
Forward Currency Exchange Contracts | $ | –0 | – | $ | 2,187,825 | $ | –0 | – | $ | 2,187,825 | ||||||
Liabilities: | ||||||||||||||||
Forward Currency Exchange Contracts | –0 | – | (2,272,158 | ) | –0 | – | (2,272,158 | ) | ||||||||
|
|
|
|
|
|
|
| |||||||||
Total | $ | 48,475,131 | $ | 330,928,464 | $ | –0 | – | $ | 379,403,595 | |||||||
|
|
|
|
|
|
|
| |||||||||
| (a) | A significant portion of the Portfolio’s foreign equity investments are categorized as Level 2 investments since they are valued using fair value prices based on third party vendor modeling tools to the extent available, see Note A.1. |
| (b) | Other financial instruments are derivative instruments, such as futures, forwards and swaps, which are valued at the unrealized appreciation/(depreciation) on the instrument. Other financial instruments may also include swaps with upfront premiums, options written and swaptions written which are valued at market value. |
3. Currency Translation
Assets and liabilities denominated in foreign currencies and commitments under forward currency exchange contracts are translated into U.S. dollars at the mean of the quoted bid and ask prices of such currencies against the U.S. dollar. Purchases and sales of portfolio securities are translated into U.S. dollars at the rates of exchange prevailing when such securities were acquired or sold. Income and expenses are translated into U.S. dollars at rates of exchange prevailing when accrued.
Net realized gain or loss on foreign currency transactions represents foreign exchange gains and losses from sales and maturities of foreign fixed income investments, holding of foreign currencies, currency gains or losses realized between the trade and settlement dates on foreign investment transactions, and the difference between the amounts of dividends, interest and foreign withholding taxes recorded on the Portfolio’s books and the U.S. dollar equivalent amounts actually received or paid. Net unrealized currency gains and losses from valuing foreign currency denominated assets and liabilities at period end exchange rates are reflected as a component of net unrealized appreciation or depreciation of foreign currency denominated assets and liabilities.
4. Taxes
It is the Portfolio’s policy to meet the requirements of the Internal Revenue Code applicable to regulated investment companies and to distribute all of its investment company taxable income and net realized gains, if any, to shareholders. Therefore, no provisions for federal income or excise taxes are required. The Portfolio may be subject to taxes imposed by countries in which it invests. Such taxes are generally based on income and/or capital gains earned or repatriated. Taxes are accrued and applied to net investment income, net realized gains and net unrealized appreciation/depreciation as such income and/or gains are earned.
In accordance with U.S. GAAP requirements regarding accounting for uncertainties in income taxes, management has analyzed the Portfolio’s tax positions taken or expected to be taken on federal and state income tax returns for all open tax years (the current and the prior three tax years) and has concluded that no provision for income tax is required in the Portfolio’s financial statements.
5. Investment Income and Investment Transactions
Dividend income is recorded on theex-dividend date or as soon as the Portfolio is informed of the dividend. Interest income is accrued daily. Investment transactions are accounted for on the date the securities are purchased or sold. Investment gains or losses are determined on the identified cost basis. The Portfolio amortizes premiums and accretes discounts as adjustments to interest income.
6. Class Allocations
All income earned and expenses incurred by the Portfolio are borne on apro-rata basis by each outstanding class of shares, based on the proportionate interest in the Portfolio represented by the net assets of such class, except for class specific expenses which are allocated to the respective class. Expenses of the Fund are charged proportionately to each portfolio or based on other appropriate methods. Realized and unrealized gains and losses are allocated among the various share classes based on respective net assets.
18
| AB Variable Products Series Fund | ||
7. Dividends and Distributions
Dividends and distributions to shareholders, if any, are recorded on theex-dividend date. Income dividends and capital gains distributions are determined in accordance with federal tax regulations and may differ from those determined in accordance with U.S. GAAP. To the extent these differences are permanent, such amounts are reclassified within the capital accounts based on their federal tax basis treatment; temporary differences do not require such reclassification.
NOTE B: Advisory Fee and Other Transactions with Affiliates
Under the terms of the investment advisory agreement, the Portfolio pays the Adviser an advisory fee at an annual rate of .75% of the first $2.5 billion, .65% of the next $2.5 billion and .60% in excess of $5 billion, of the Portfolio’s average daily net assets. The fee is accrued daily and paid monthly. The Adviser has agreed to waive its fees and bear certain expenses to the extent necessary to limit total operating expenses on an annual basis (the “Expense Caps”) to 1.20% and 1.45% of daily average net assets for Class A and Class B shares, respectively. For the year ended December 31, 2019, there were no expenses waived by the Adviser.
Pursuant to the investment advisory agreement, the Portfolio may reimburse the Adviser for certain legal and accounting services provided to the Portfolio by the Adviser. For the year ended December 31, 2019, the reimbursement for such services amounted to $79,692.
The Portfolio compensates AllianceBernstein Investor Services, Inc. (“ABIS”), a wholly-owned subsidiary of the Adviser, under a Transfer Agency Agreement for providing personnel and facilities to perform transfer agency services for the Portfolio. Such compensation retained by ABIS amounted to $1,491 for the year ended December 31, 2019.
The Portfolio may invest in AB Government Money Market Portfolio (the “Government Money Market Portfolio”) which has a contractual annual advisory fee rate of .20% of the portfolio’s average daily net assets and bears its own expenses. The Adviser has contractually agreed to waive .10% of the advisory fee of Government Money Market Portfolio (resulting in a net advisory fee of ..10%) until August 31, 2020. In connection with the investment by the Portfolio in Government Money Market Portfolio, the Adviser has contractually agreed to waive its advisory fee from the Portfolio in an amount equal to the Portfolio’s pro rata share of the effective advisory fee of Government Money Market Portfolio, as borne indirectly by the Portfolio as an acquired fund fee and expense. For the year ended December 31, 2019, such waiver amounted to $4,402.
A summary of the Portfolio’s transactions in AB mutual funds for the year ended December 31, 2019 is as follows:
Fund | Market Value 12/31/18 (000) | Purchases at Cost (000) | Sales Proceeds (000) | Market Value 12/31/19 (000) | Dividend Income (000) | |||||||||||||||
Government Money Market Portfolio | $ | 4,030 | $ | 103,833 | $ | 104,810 | $ | 3,053 | $ | 94 | ||||||||||
Government Money Market Portfolio* | 5,149 | 126,133 | 127,436 | 3,846 | 113 | |||||||||||||||
|
|
|
| |||||||||||||||||
Total | $ | 6,899 | $ | 207 | ||||||||||||||||
|
|
|
| |||||||||||||||||
| * | Investments of cash collateral for securities lending transactions (see Note E). |
During the second quarter of 2018, AXA S.A. (“AXA”), a French holding company for the AXA Group, a worldwide leader in life, property and casualty and health insurance and asset management, completed the sale of a minority stake in its subsidiary, AXA Equitable Holdings, Inc. (now named Equitable Holdings, Inc.)(“Equitable”), through an initial public offering. Equitable is the holding company for a diverse group of financial services companies, including an approximately 65.3% economic interest in the Adviser and a 100% interest in AllianceBernstein Corporation, the general partner of the Adviser. Since the initial sale, AXA has completed additional offerings, most recently during the fourth quarter of 2019. As a result, AXA currently owns 10.1% of the outstanding shares of common stock of Equitable, and no longer owns a controlling interest in Equitable. AXA previously announced its intention to sell its entire interest in Equitable over time, subject to market conditions and other factors (the “Plan”). Most of AXA’s remaining Equitable shares are to be delivered on redemption of AXA bonds mandatorily exchangeable into Equitable shares and maturing in May 2021. AXA retains sole discretion to determine the timing of any future sales of its remaining shares of Equitable common stock.
The latest transaction under the Plan, which occurred on November 13, 2019, resulted in the indirect transfer of a “controlling block” of voting securities of the Adviser (a “Change of Control Event”) and was deemed an “assignment” causing a termination of the Portfolio’s investment advisory agreement. In order to ensure that investment advisory services
19
| INTERNATIONAL VALUE PORTFOLIO | ||
| NOTES TO FINANCIAL STATEMENTS | ||
| (continued) | AB Variable Products Series Fund | |
could continue uninterrupted in the event of a Change of Control Event, the Board previously approved a new investment advisory agreement with the Adviser, and shareholders of the Portfolio subsequently approved the new investment advisory agreement. This agreement became effective on November 13, 2019.
NOTE C: Distribution Plan
The Portfolio has adopted a Distribution Plan (the “Plan”) for Class B shares pursuant to Rule12b-1 under the Investment Company Act of 1940. Under the Plan, the Portfolio pays distribution and servicing fees to AllianceBernstein Investments, Inc. (the “Distributor”), a wholly-owned subsidiary of the Adviser, at an annual rate of up to .50% of the Portfolio’s average daily net assets attributable to Class B shares. The fees are accrued daily and paid monthly. The Board currently limits payments under the Plan to .25% of the Portfolio’s average daily net assets attributable to Class B shares. The Plan provides that the Distributor will use such payments in their entirety for distribution assistance and promotional activities.
The Portfolio is not obligated under the Plan to pay any distribution and servicing fees in excess of the amounts set forth above. The purpose of the payments to the Distributor under the Plan is to compensate the Distributor for its distribution services with respect to the sale of the Portfolio’s Class B shares. Since the Distributor’s compensation is not directly tied to its expenses, the amount of compensation received by it under the Plan during any year may be more or less than its actual expenses. For this reason, the Plan is characterized by the staff of the Securities and Exchange Commission as being of the “compensation” variety.
In the event that the Plan is terminated or not continued, no distribution or servicing fees (other than current amounts accrued but not yet paid) would be owed by the Portfolio to the Distributor.
The Plan also provides that the Adviser may use its own resources to finance the distribution of the Portfolio’s shares.
NOTE D: Investment Transactions
Purchases and sales of investment securities (excluding short-term investments) for the year ended December 31, 2019 were as follows:
| Purchases | Sales | |||||||
Investment securities (excluding U.S. government securities) | $ | 161,160,993 | $ | 200,683,632 | ||||
U.S. government securities | –0 | – | –0 | – | ||||
The cost of investments for federal income tax purposes, gross unrealized appreciation and unrealized depreciation are as follows:
Cost | $ | 347,064,197 | ||
|
| |||
Gross unrealized appreciation | $ | 59,485,869 | ||
Gross unrealized depreciation | (27,090,794 | ) | ||
|
| |||
Net unrealized appreciation | $ | 32,395,075 | ||
|
|
1. Derivative Financial Instruments
The Portfolio may use derivatives in an effort to earn income and enhance returns, to replace more traditional direct investments, to obtain exposure to otherwise inaccessible markets (collectively, “investment purposes”), or to hedge or adjust the risk profile of its portfolio.
The principal type of derivative utilized by the Portfolio, as well as the methods in which they may be used are:
| • | Forward Currency Exchange Contracts |
The Portfolio may enter into forward currency exchange contracts in order to hedge its exposure to changes in foreign currency exchange rates on its foreign portfolio holdings, to hedge certain firm purchase and sale commitments denominated in foreign currencies and fornon-hedging purposes as a means of making direct investments in foreign currencies, as described below under “Currency Transactions”.
A forward currency exchange contract is a commitment to purchase or sell a foreign currency at a future date at a negotiated forward rate. The gain or loss arising from the difference between the original contract and the closing of such contract would be included in net realized gain or loss on forward currency exchange contracts. Fluctuations in the value of open forward currency exchange contracts are recorded for financial reporting purposes as unrealized
20
| AB Variable Products Series Fund | ||
appreciation and/or depreciation by the Portfolio. Risks may arise from the potential inability of a counterparty to meet the terms of a contract and from unanticipated movements in the value of a foreign currency relative to the U.S. dollar.
During the year ended December 31, 2019, the Portfolio held forward currency exchange contracts for hedging andnon-hedging purposes.
The Portfolio typically enters into International Swaps and Derivatives Association, Inc. Master Agreements (“ISDA Master Agreement”) with its OTC derivative contract counterparties in order to, among other things, reduce its credit risk to OTC counterparties. ISDA Master Agreements include provisions for general obligations, representations, collateral and events of default or termination. Under an ISDA Master Agreement, the Portfolio typically may offset with the OTC counterparty certain derivative financial instruments’ payables and/or receivables with collateral held and/or posted and create one single net payment(close-out netting) in the event of default or termination. In the event of a default by an OTC counterparty, the return of collateral with market value in excess of the Portfolio’s net liability, held by the defaulting party, may be delayed or denied.
The Portfolio’s ISDA Master Agreements may contain provisions for early termination of OTC derivative transactions in the event the net assets of the Portfolio decline below specific levels (“net asset contingent features”). If these levels are triggered, the Portfolio’s OTC counterparty has the right to terminate such transaction and require the Portfolio to pay or receive a settlement amount in connection with the terminated transaction. If OTC derivatives were held at period end, please refer to netting arrangements by the OTC counterparty table below for additional details.
During the year ended December 31, 2019, the Portfolio had entered into the following derivatives:
Asset Derivatives | Liability Derivatives | |||||||||||
Derivative Type | Statement of | Fair Value | Statement of | Fair Value | ||||||||
Foreign currency contracts | Unrealized appreciation on forward currency exchange contracts | $ | 2,187,825 | Unrealized depreciation on forward currency exchange contracts | $ | 2,272,158 | ||||||
|
|
|
| |||||||||
Total | $ | 2,187,825 | $ | 2,272,158 | ||||||||
|
|
|
| |||||||||
Derivative Type | Location of Gain | Realized Gain or (Loss) on Derivatives | Change in Unrealized Appreciation or (Depreciation) | |||||||
Foreign currency contracts | Net realized gain (loss) on forward currency exchange contracts; Net change in unrealized appreciation/depreciation of forward currency exchange contracts | $ | (2,331,047 | ) | $ | 1,239,568 | ||||
|
|
|
| |||||||
Total | $ | (2,331,047 | ) | $ | 1,239,568 | |||||
|
|
|
| |||||||
The following table represents the average monthly volume of the Portfolio’s derivative transactions during the year ended December 31, 2019:
Forward Currency Exchange Contracts: | ||||
Average principal amount of buy contracts | $ | 131,563,363 | ||
Average principal amount of sale contracts | $ | 132,440,702 |
For financial reporting purposes, the Portfolio does not offset derivative assets and derivative liabilities that are subject to netting arrangements in the statement of assets and liabilities.
21
| INTERNATIONAL VALUE PORTFOLIO | ||
| NOTES TO FINANCIAL STATEMENTS | ||
| (continued) | AB Variable Products Series Fund | |
All OTC derivatives held at period end were subject to netting arrangements. The following table presents the Portfolio’s derivative assets and liabilities by OTC counterparty net of amounts available for offset under ISDA Master Agreements (“MA”) and net of the related collateral received/pledged by the Portfolio as of December 31, 2019. Exchange-traded derivatives and centrally cleared swaps are not subject to netting arrangements and as such are excluded from the table.
Counterparty | Derivative Assets Subject to a MA | Derivatives Available for Offset | Cash Collateral Received* | Security Collateral Received* | Net Amount of Derivative Assets | |||||||||||||||
Bank of America, NA | $ | 206,755 | $ | (52,078 | ) | $ | –0 | – | $ | –0 | – | $ | 154,677 | |||||||
Barclays Bank PLC | 488,637 | (488,637 | ) | –0 | – | –0 | – | –0 | – | |||||||||||
Citibank, NA | 303,894 | (34,954 | ) | –0 | – | –0 | – | 268,940 | ||||||||||||
Credit Suisse International | 68,179 | (68,179 | ) | –0 | – | –0 | – | –0 | – | |||||||||||
Goldman Sachs Bank USA | 162,730 | (162,730 | ) | –0 | – | –0 | – | –0 | – | |||||||||||
JPMorgan Chase Bank, NA | 485,077 | (206,882 | ) | –0 | – | –0 | – | 278,195 | ||||||||||||
Morgan Stanley & Co., Inc. | 155,887 | (115,208 | ) | –0 | – | –0 | – | 40,679 | ||||||||||||
Natwest Markets PLC | 178,607 | (72,196 | ) | –0 | – | –0 | – | 106,411 | ||||||||||||
Standard Chartered Bank | 10,232 | (10,232 | ) | –0 | – | –0 | – | –0 | – | |||||||||||
State Street Bank & Trust Co. | 117,557 | (97,044 | ) | –0 | – | –0 | – | 20,513 | ||||||||||||
UBS AG | 10,270 | (10,270 | ) | –0 | – | –0 | – | –0 | – | |||||||||||
|
|
|
|
|
|
|
|
|
| |||||||||||
Total | $ | 2,187,825 | $ | (1,318,410 | ) | $ | –0 | – | $ | –0 | – | $ | 869,415 | ^ | ||||||
|
|
|
|
|
|
|
|
|
| |||||||||||
Counterparty | Derivative Liabilities Subject to a MA | Derivatives Available for Offset | Cash Collateral Pledged* | Security Collateral Pledged* | Net Amount of Derivative Liabilities | |||||||||||||||
Bank of America, NA | $ | 52,078 | $ | (52,078 | ) | $ | –0 | – | $ | –0 | – | $ | –0 | – | ||||||
Barclays Bank PLC | 858,165 | (488,637 | ) | (280,000 | ) | –0 | – | 89,528 | ||||||||||||
BNP Paribas SA | 186,919 | –0 | – | –0 | – | –0 | – | 186,919 | ||||||||||||
Citibank, NA | 34,954 | (34,954 | ) | –0 | – | –0 | – | –0 | – | |||||||||||
Credit Suisse International | 359,216 | (68,179 | ) | –0 | – | –0 | – | 291,037 | ||||||||||||
Goldman Sachs Bank USA | 208,530 | (162,730 | ) | –0 | – | –0 | – | 45,800 | ||||||||||||
JPMorgan Chase Bank, NA | 206,882 | (206,882 | ) | –0 | – | –0 | – | –0 | – | |||||||||||
Morgan Stanley & Co., Inc. | 115,208 | (115,208 | ) | –0 | – | –0 | – | –0 | – | |||||||||||
Natwest Markets PLC | 72,196 | (72,196 | ) | –0 | – | –0 | – | –0 | – | |||||||||||
Societe Generale | 33,009 | –0 | – | –0 | – | –0 | – | 33,009 | ||||||||||||
Standard Chartered Bank | 37,007 | (10,232 | ) | –0 | – | –0 | – | 26,775 | ||||||||||||
State Street Bank & Trust Co. | 97,044 | (97,044 | ) | –0 | – | –0 | – | –0 | – | |||||||||||
UBS AG | 10,950 | (10,270 | ) | –0 | – | –0 | – | 680 | ||||||||||||
|
|
|
|
|
|
|
|
|
| |||||||||||
Total | $ | 2,272,158 | $ | (1,318,410 | ) | $ | (280,000 | ) | $ | –0 | – | $ | 673,748 | ^ | ||||||
|
|
|
|
|
|
|
|
|
| |||||||||||
| * | The actual collateral received/pledged may be more than the amount reported due to over-collateralization. |
| ^ | Net amount represents the net receivable/payable that would be due from/to the counterparty in the event of default or termination. The net amount from OTC financial derivative instruments can only be netted across transactions governed under the same master agreement with the same counterparty. |
2. Currency Transactions
The Portfolio may invest innon-U.S. Dollar-denominated securities on a currency hedged or unhedged basis. The Portfolio may seek investment opportunities by taking long or short positions in currencies through the use of currency-related derivatives, including forward currency exchange contracts, futures and options on futures, swaps, and other options. The Portfolio may enter into transactions for investment opportunities when it anticipates that a foreign currency will appreciate or depreciate in value but securities denominated in that currency are not held by the Portfolio and do not present attractive investment opportunities. Such transactions may also be used when the Adviser believes that it may be more efficient than a direct investment in a foreign currency-denominated security. The Portfolio may also conduct currency exchange contracts on a spot basis (i.e., for cash at the spot rate prevailing in the currency exchange market for buying or selling currencies).
22
| AB Variable Products Series Fund | ||
NOTE E: Securities Lending
The Portfolio may enter into securities lending transactions. Under the Portfolio’s securities lending program, all loans of securities will be collateralized continually by cash collateral and/ornon-cash collateral.Non-cash collateral will include only securities issued or guaranteed by the U.S. government or its agencies or instrumentalities. The Portfolio cannot sell or repledge anynon-cash collateral, such collateral will not be reflected in the portfolio of investments. If a loan is collateralized by cash, the Portfolio will be compensated for the loan from a portion of the net return from the income earned on cash collateral after a rebate is paid to the borrower (in some cases, this rebate may be a “negative rebate” or fee paid by the borrower to the Portfolio in connection with the loan), and payments are made for fees of the securities lending agent and for certain other administrative expenses. If the Portfolio receivesnon-cash collateral, the Portfolio will receive a fee from the borrower generally equal to a negotiated percentage of the market value of the loaned securities. The Portfolio will have the right to call a loan and obtain the securities loaned at any time on notice to the borrower within the normal and customary settlement time for the securities. While the securities are on loan, the borrower is obligated to pay the Portfolio amounts equal to any income or other distributions from the securities. The Portfolio will not be able to exercise voting rights with respect to any securities during the existence of a loan, but will have the right to regain ownership of loaned securities in order to exercise voting or other ownership rights. Collateral received and securities loaned are marked to market daily to ensure that the securities loaned are secured by collateral. The lending agent currently invests the cash collateral received in Government Money Market Portfolio, an eligible money market vehicle, in accordance with the investment restrictions of the Portfolio, and as approved by the Board. The collateral received on securities loaned is recorded as an asset as well as a corresponding liability in the statement of assets and liabilities. The collateral will be adjusted the next business day to maintain the required collateral amount. The amounts of securities lending income from the borrowers and Government Money Market Portfolio are reflected in the statement of operations. When the Portfolio earns net securities lending income from Government Money Market Portfolio, the income is inclusive of a rebate expense paid to the borrower. In connection with the cash collateral investment by the Portfolio in Government Money Market Portfolio, the Adviser has agreed to waive a portion of the Portfolio’s share of the advisory fees of Government Money Market Portfolio, as borne indirectly by the Portfolio as an acquired fund fee and expense. When the Portfolio lends securities, its investment performance will continue to reflect changes in the value of the securities loaned. A principal risk of lending portfolio securities is that the borrower may fail to return the loaned securities upon termination of the loan and that the collateral will not be sufficient to replace the loaned securities. The lending agent has agreed to indemnify the Portfolio in the case of default of any securities borrower.
A summary of the Portfolio’s transactions surrounding securities lending for the year ended December 31, 2019 is as follows:
| Government Money Market Portfolio | ||||||||||||||||||||||
Market Value of on Loan* | Cash Collateral* | Market Value of | Income from | Income Earned | Advisory Fee | |||||||||||||||||
| $ | 7,089,072 | $ | 3,845,627 | $ | 3,656,605 | $ | 8,498 | $ | 112,579 | $ | 2,620 | |||||||||||
| * | As of December 31, 2019. |
NOTE F: Capital Stock
Each class consists of 500,000,000 authorized shares. Transactions in capital shares for each class were as follows:
| SHARES | AMOUNT | |||||||||||||||||||
| Year Ended December 31, 2019 | Year Ended December 31, 2018 | Year Ended December 31, 2019 | Year Ended December 31, 2018 | |||||||||||||||||
Class A |
| |||||||||||||||||||
Shares sold | 269,460 | 1,917,576 | $ | 3,601,306 | $ | 30,564,317 | ||||||||||||||
Shares issued in reinvestment of dividends | 34,173 | 76,053 | 479,446 | 1,075,905 | ||||||||||||||||
Shares redeemed | (1,163,389 | ) | (624,835 | ) | (15,571,410 | ) | (9,705,915 | ) | ||||||||||||
|
|
|
|
|
|
|
| |||||||||||||
Net increase (decrease) | (859,756 | ) | 1,368,794 | $ | (11,490,658 | ) | $ | 21,934,307 | ||||||||||||
|
|
|
|
|
|
|
| |||||||||||||
Class B |
| |||||||||||||||||||
Shares sold | 1,317,796 | 2,042,981 | $ | 17,290,885 | $ | 30,014,125 | ||||||||||||||
Shares issued in reinvestment of dividends | 181,338 | 304,899 | 2,522,410 | 4,249,239 | ||||||||||||||||
Shares redeemed | (3,961,184 | ) | (3,972,067 | ) | (52,929,893 | ) | (60,823,829 | ) | ||||||||||||
|
|
|
|
|
|
|
| |||||||||||||
Net decrease | (2,462,050 | ) | (1,624,187 | ) | $ | (33,116,598 | ) | $ | (26,560,465 | ) | ||||||||||
|
|
|
|
|
|
|
| |||||||||||||
23
| INTERNATIONAL VALUE PORTFOLIO | ||
| NOTES TO FINANCIAL STATEMENTS | ||
| (continued) | AB Variable Products Series Fund | |
At December 31, 2019, certain shareholders of the Portfolio owned 51% in aggregate of the Portfolio’s outstanding shares. Significant transactions by such shareholders, if any, may impact the Portfolio’s performance.
NOTE G: Risks Involved in Investing in the Portfolio
Foreign(Non-U.S.) Risk—Investments in securities ofnon-U.S. issuers may involve more risk than those of U.S. issuers. These securities may fluctuate more widely in price and may be more difficult to trade or dispose of due to adverse market, economic, political, regulatory or other factors.
Emerging Market Risk—Investments in emerging market countries may have more risk because the markets are less developed and less liquid, and because these investments may be subject to increased economic, political, regulatory or other uncertainties.
Currency Risk—Fluctuations in currency exchange rates may negatively affect the value of the Portfolio’s investments or reduce its returns.
Derivatives Risk—The Portfolio may enter into derivative transactions such as forwards, options, futures and swaps. Derivatives may be illiquid, difficult to price, and leveraged so that small changes may produce disproportionate losses for the Portfolio, and subject to counterparty risk to a greater degree than more traditional investments. Derivatives may result in significant losses, including losses that are far greater than the value of the derivatives reflected on the statement of assets and liabilities.
Leverage Risk—When the Portfolio borrows money or otherwise leverages its investments, its performance may be volatile because leverage tends to exaggerate the effect of any increase or decrease in the value of the Portfolio’s investments. The Portfolio may create leverage through the use of reverse repurchase arrangements, forward currency exchange contracts, forward commitments, dollar rolls or futures or by borrowing money. The use of other types of derivative instruments by the Portfolio, such as options and swaps, may also result in a form of leverage. Leverage may result in higher returns to the Portfolio than if the Portfolio were not leveraged, but may also adversely affect returns, particularly if the market is declining.
LIBOR Risk—The Portfolio may invest in certain debt securities, derivatives or other financial instruments that utilize the London Interbank Offered Rate, or “LIBOR,” as a “benchmark” or “reference rate” for various interest rate calculations. In July 2017, the United Kingdom Financial Conduct Authority, which regulates LIBOR, announced a desire to phase out the use of LIBOR by the end of 2021. Although financial regulators and industry working groups have suggested alternative reference rates, such as European Interbank Offer Rate (“EURIBOR”), Sterling Overnight Interbank Average Rate (“SONIA”) and Secured Overnight Financing Rate (“SOFR”), global consensus on alternative rates is lacking and the process for amending existing contracts or instruments to transition away from LIBOR remains unclear. The elimination of LIBOR or changes to other reference rates or any other changes or reforms to the determination or supervision of reference rates could have an adverse impact on the market for, or value of, any securities or payments linked to those reference rates, which may adversely affect the Portfolio’s performance and/or net asset value. Uncertainty and risk also remain regarding the willingness and ability of issuers and lenders to include revised provisions in new and existing contracts or instruments. Consequently, the transition away from LIBOR to other reference rates may lead to increased volatility and illiquidity in markets that are tied to LIBOR, fluctuations in values of LIBOR-related investments or investments in issuers that utilize LIBOR, increased difficulty in borrowing or refinancing and diminished effectiveness of hedging strategies, adversely affecting the Portfolio’s performance. Furthermore, the risks associated with the expected discontinuation of LIBOR and transition may be exacerbated if the work necessary to effect an orderly transition to an alternative reference rate is not completed in a timely manner. Because the usefulness of LIBOR as a benchmark could deteriorate during the transition period, these effects could occur prior to the end of 2021.
Indemnification Risk—In the ordinary course of business, the Portfolio enters into contracts that contain a variety of indemnifications. The Portfolio’s maximum exposure under these arrangements is unknown. However, the Portfolio has not had prior claims or losses pursuant to these indemnification provisions and expects the risk of loss thereunder to be remote. Therefore, the Portfolio has not accrued any liability in connection with these indemnification provisions.
NOTE H: Joint Credit Facility
A number ofopen-end mutual funds managed by the Adviser, including the Portfolio, participate in a $325 million revolving credit facility (the “Facility”) intended to provide short-term financing, if necessary, subject to certain restrictions in connection with abnormal redemption activity. Commitment fees related to the Facility are paid by the participating funds and are included in miscellaneous expenses in the statement of operations. The Portfolio did not utilize the Facility during the year ended December 31, 2019.
24
| AB Variable Products Series Fund | ||
NOTE I: Distributions to Shareholders
The tax character of distributions paid during the fiscal years ended December 31, 2019 and December 31, 2018 were as follows:
| 2019 | 2018 | |||||||
Distributions paid from: | ||||||||
Ordinary income | $ | 3,001,856 | $ | 5,325,144 | ||||
|
|
|
| |||||
Total taxable distributions paid | $ | 3,001,856 | $ | 5,325,144 | ||||
|
|
|
| |||||
As of December 31, 2019, the components of accumulated earnings/(deficit) on a tax basis were as follows:
Undistributed ordinary income | $ | 3,055,604 | ||
Accumulated capital and other losses | (25,817,258 | )(a) | ||
Unrealized appreciation/(depreciation) | 32,390,405 | (b) | ||
|
| |||
Total accumulated earnings/(deficit) | $ | 9,628,751 | ||
|
|
| (a) | As of December 31, 2019, the Portfolio had a net capital loss carryforward of $25,817,258. |
| (b) | The differences between book-basis and tax-basis unrealized appreciation/(depreciation) are attributable primarily to the recognition for tax purposes of unrealized gains/losses on certain derivative instruments, the tax treatment of passive foreign investment companies (PFICs), and the tax deferral of losses on wash sales. |
For tax purposes, net realized capital losses may be carried over to offset future capital gains, if any. Funds are permitted to carry forward capital losses for an indefinite period, and such losses will retain their character as either short-term or long-term capital losses. As of December 31, 2019, the Portfolio had a net short-term capital loss carryforward of $2,480,617 and a net long-term capital loss carryforward of $23,336,641, which may be carried forward for an indefinite period.
During the current fiscal year, there were no permanent differences that resulted in adjustments to distributable earnings or additional paid-in capital.
NOTE J: Recent Accounting Pronouncements
In August 2018, the Financial Accounting Standards Board issued an Accounting Standards Update, ASU2018-13, Fair Value Measurement (Topic 820), Disclosure Framework—Changes to the Disclosure Requirements for Fair Value Measurement which removes, modifies and adds disclosures to Topic 820. The amendments in this ASU2018-13 (“ASU”) apply to all entities that are required, under existing U.S. GAAP, to make disclosures about recurring or nonrecurring fair value measurements. The amendments in this ASU are effective for all entities for fiscal years, and interim periods within those fiscal years, beginning after December 15, 2019. Management has evaluated the impact of the amendments and elected to early adopt the ASU. The adoption of this ASU did not have a material impact on the disclosure and presentation of the financial statements of the Portfolio.
NOTE K: Subsequent Events
Management has evaluated subsequent events for possible recognition or disclosure in the financial statements through the date the financial statements are issued. Management has determined that there are no material events that would require disclosure in the Portfolio’s financial statements through this date.
25
| INTERNATIONAL VALUE PORTFOLIO | ||
| FINANCIAL HIGHLIGHTS | AB Variable Products Series Fund | |
Selected Data For A Share Of Capital Stock Outstanding Throughout Each Period
| CLASS A | ||||||||||||||||||||
| Year Ended December 31, | ||||||||||||||||||||
| 2019 | 2018 | 2017 | 2016 | 2015 | ||||||||||||||||
Net asset value, beginning of period | $12.38 | $16.30 | $13.28 | $13.52 | $13.53 | |||||||||||||||
|
|
|
|
|
|
|
|
|
| |||||||||||
Income From Investment Operations | ||||||||||||||||||||
Net investment income (a) | .28 | (b) | .25 | (b) | .31 | (b) | .30 | (b)† | .30 | |||||||||||
Net realized and unrealized gain (loss) on investment and foreign currency transactions | 1.84 | (3.94 | ) | 3.06 | (.37 | ) | .05 | |||||||||||||
|
|
|
|
|
|
|
|
|
| |||||||||||
Net increase (decrease) in net asset value from operations | 2.12 | (3.69 | ) | 3.37 | (.07 | ) | .35 | |||||||||||||
|
|
|
|
|
|
|
|
|
| |||||||||||
Less: Dividends | ||||||||||||||||||||
Dividends from net investment income | (.13 | ) | (.23 | ) | (.35 | ) | (.17 | ) | (.36 | ) | ||||||||||
|
|
|
|
|
|
|
|
|
| |||||||||||
Net asset value, end of period | $14.37 | $12.38 | $16.30 | $13.28 | $13.52 | |||||||||||||||
|
|
|
|
|
|
|
|
|
| |||||||||||
Total Return | ||||||||||||||||||||
Total investment return based on net asset value (c)* | 17.14 | % | (22.79 | )% | 25.42 | % | (.50 | )%† | 2.59 | % | ||||||||||
Ratios/Supplemental Data | ||||||||||||||||||||
Net assets, end of period (000’s omitted) | $54,042 | $57,234 | $53,014 | $47,385 | $48,665 | |||||||||||||||
Ratio to average net assets of: | ||||||||||||||||||||
Expenses, net of waivers/reimbursements | .90 | % | .86 | % | .85 | % | .86 | % | .85 | % | ||||||||||
Expenses, before waivers/reimbursements | .90 | % | .87 | % | .86 | % | .86 | % | .85 | % | ||||||||||
Net investment income | 2.10 | %(b) | 1.65 | %(b) | 2.05 | %(b) | 2.27 | %(b)† | 2.09 | % | ||||||||||
Portfolio turnover rate | 44 | % | 42 | % | 45 | % | 64 | % | 74 | % | ||||||||||
See footnote summary on page 27.
26
| AB Variable Products Series Fund | ||
Selected Data For A Share Of Capital Stock Outstanding Throughout Each Period
| CLASS B | ||||||||||||||||||||
| Year Ended December 31, | ||||||||||||||||||||
| 2019 | 2018 | 2017 | 2016 | 2015 | ||||||||||||||||
Net asset value, beginning of period | $12.29 | $16.15 | $13.16 | $13.41 | $13.41 | |||||||||||||||
|
|
|
|
|
|
|
|
|
| |||||||||||
Income From Investment Operations | ||||||||||||||||||||
Net investment income (a) | .24 | (b) | .23 | (b) | .27 | (b) | .27 | (b)† | .26 | |||||||||||
Net realized and unrealized gain (loss) on investment and foreign currency transactions | 1.82 | (3.92 | ) | 3.02 | (.38 | ) | .06 | |||||||||||||
|
|
|
|
|
|
|
|
|
| |||||||||||
Net increase (decrease) in net asset value from operations | 2.06 | (3.69 | ) | 3.29 | (.11 | ) | .32 | |||||||||||||
|
|
|
|
|
|
|
|
|
| |||||||||||
Less: Dividends | ||||||||||||||||||||
Dividends from net investment income | (.11 | ) | (.17 | ) | (.30 | ) | (.14 | ) | (.32 | ) | ||||||||||
|
|
|
|
|
|
|
|
|
| |||||||||||
Net asset value, end of period | $14.24 | $12.29 | $16.15 | $13.16 | $13.41 | |||||||||||||||
|
|
|
|
|
|
|
|
|
| |||||||||||
Total Return | ||||||||||||||||||||
Total investment return based on net asset value (c)* | 16.79 | % | (22.98 | )% | 25.09 | % | (.80 | )%† | 2.40 | % | ||||||||||
Ratios/Supplemental Data | ||||||||||||||||||||
Net assets, end of period (000’s omitted) | $323,582 | $309,576 | $432,885 | $460,086 | $550,746 | |||||||||||||||
Ratio to average net assets of: | ||||||||||||||||||||
Expenses, net of waivers/reimbursements | 1.15 | % | 1.11 | % | 1.10 | % | 1.11 | % | 1.10 | % | ||||||||||
Expenses, before waivers/reimbursements | 1.15 | % | 1.11 | % | 1.11 | % | 1.11 | % | 1.10 | % | ||||||||||
Net investment income | 1.84 | %(b) | 1.50 | %(b) | 1.83 | %(b) | 2.04 | %(b)† | 1.85 | % | ||||||||||
Portfolio turnover rate | 44 | % | 42 | % | 45 | % | 64 | % | 74 | % | ||||||||||
| (a) | Based on average shares outstanding. |
| (b) | Net of expenses waived/reimbursed by the Adviser. |
| (c) | Total investment return is calculated assuming an initial investment made at the net asset value at the beginning of the period, reinvestment of all dividends and distributions at net asset value during the period, and redemption on the last day of the period. Total return does not reflect (i) insurance company’s separate account related expense charges and (ii) the deductions of taxes that a shareholder would pay on Portfolio distributions or the redemption of Portfolio shares. Total investment return calculated for a period of less than one year is not annualized. |
| † | For the year ended December 31, 2016, the amount includes a refund for overbilling of prior years’ custody out of pocket fees as follows: |
Net Investment | Net Investment | Total | ||
| $.002 | .01% | .01% |
| * | Includes the impact of proceeds received and credited to the Portfolio resulting from class action settlements, which enhanced the Portfolio’s performance for the years ended December 31, 2019, December 31, 2017 and December 31, 2016 by .18%, .01% and .07%, respectively. |
See notes to financial statements.
27
| REPORT OF INDEPENDENT REGISTERED | ||
| PUBLIC ACCOUNTING FIRM | AB Variable Products Series Fund | |
To the Shareholders and the Board of Directors of AB International Value Portfolio:
Opinion on the Financial Statements
We have audited the accompanying statement of assets and liabilities of AB International Value Portfolio (the “Portfolio”) (one of the portfolios constituting AB Variable Products Series Fund, Inc. (the “Fund”)), including the portfolio of investments, as of December 31, 2019, and the related statement of operations for the year then ended, the statements of changes in net assets for each of the two years in the period then ended, the financial highlights for each of the five years in the period then ended and the related notes (collectively referred to as the “financial statements”). In our opinion, the financial statements present fairly, in all material respects, the financial position of the Portfolio (one of the portfolios constituting AB Variable Products Series Fund, Inc.) at December 31, 2019, the results of its operations for the year then ended, the changes in its net assets for each of the two years in the period then ended and its financial highlights for each of the five years in the period then ended, in conformity with U.S. generally accepted accounting principles.
Basis for Opinion
These financial statements are the responsibility of the Fund’s management. Our responsibility is to express an opinion on the Portfolio’s financial statements based on our audits. We are a public accounting firm registered with the Public Company Accounting Oversight Board (United States) (“PCAOB”) and are required to be independent with respect to the Fund in accordance with the U.S. federal securities laws and the applicable rules and regulations of the Securities and Exchange Commission and the PCAOB.
We conducted our audits in accordance with the standards of the PCAOB. Those standards require that we plan and perform the audit to obtain reasonable assurance about whether the financial statements are free of material misstatement, whether due to error or fraud. The Fund is not required to have, nor were we engaged to perform, an audit of the Fund’s internal control over financial reporting. As part of our audits, we are required to obtain an understanding of internal control over financial reporting, but not for the purpose of expressing an opinion on the effectiveness of the Fund’s internal control over financial reporting. Accordingly, we express no such opinion.
Our audits included performing procedures to assess the risks of material misstatement of the financial statements, whether due to error or fraud, and performing procedures that respond to those risks. Such procedures included examining, on a test basis, evidence regarding the amounts and disclosures in the financial statements. Our procedures included confirmation of securities owned as of December 31, 2019, by correspondence with the custodian and others or by other appropriate auditing procedures where replies from others were not received. Our audits also included evaluating the accounting principles used and significant estimates made by management, as well as evaluating the overall presentation of the financial statements. We believe that our audits provide a reasonable basis for our opinion.

We have served as the auditor of one or more of the AB investment companies since 1968.
New York, New York
February 14, 2020
28
| 2019 TAX INFORMATION (unaudited) | AB Variable Products Series Fund | |
For Federal income tax purposes, the following information is furnished with respect to the earnings of the Portfolio for the taxable year ended December 31, 2019.
The Portfolio intends to make an election to pass through foreign taxes to its shareholders. For the taxable year ended December 31, 2019, $985,420 of foreign taxes may be passed through and the associated foreign source income for information reporting purposes is $7,523,262.
29
| INTERNATIONAL VALUE PORTFOLIO | AB Variable Products Series Fund | |
| BOARD OF DIRECTORS | ||
| Marshall C. Turner, Jr.(1),Chairman | Robert M. Keith, President and Chief Executive Officer | |
| Jorge A. Bermudez^ | Carol C. McMullen(1) | |
| Michael J. Downey(1) | Garry L. Moody(1) | |
| Nancy P. Jacklin(1) | Earl D. Weiner(1) | |
| OFFICERS | ||
Tawhid Ali(2),Vice President Avi Lavi(2),Vice President Emilie D. Wrapp,Secretary Michael B. Reyes,Senior Analyst | Joseph J. Mantineo,Treasurer and Phyllis J. Clarke,Controller Vincent S. Noto,Chief Compliance Officer | |
CUSTODIAN AND ACCOUNTING AGENT State Street Bank and Trust Company State Street Corporation CCB/5 1 Iron Street Boston, MA 02210 | LEGAL COUNSEL Seward & Kissel LLP One Battery Park Plaza New York, NY 10004 | |
DISTRIBUTOR AllianceBernstein Investments, Inc. 1345 Avenue of the Americas New York, NY 10105 | TRANSFER AGENT AllianceBernstein Investor Services, Inc. P.O. Box 786003 San Antonio, TX 78278-6003 Toll-Free (800) 221-5672 | |
INDEPENDENT REGISTERED PUBLIC ACCOUNTING FIRM Ernst & Young LLP 5 Times Square New York, NY 10036 |
| (1) | Member of the Audit Committee, the Governance and Nominating Committee, and the Independent Directors Committee. |
| (2) | The day-to-day management of, and investment decisions for, the Portfolio’s portfolio are made by the Adviser’s International Value Senior Investment Management Team.Messrs. Ali and Lavi are the investment professionals with the most significant responsibility for theday-to-day management of the Portfolio’s portfolio. |
| ^ | Mr. Bermudez will be a member of the Audit Committee, the Governance and Nominating Committee, and the Independent Directors Committee when he joins the Board on January 1, 2020. |
30
| INTERNATIONAL VALUE PORTFOLIO | ||
| MANAGEMENT OF THE FUND | AB Variable Products Series Fund | |
Board of Directors Information
The business and affairs of the Fund are managed under the direction of the Board of Directors. Certain information concerning the Fund’s Directors is set forth below.
NAME, ADDRESS*, AGE AND (YEAR FIRST ELECTED)** | PRINCIPAL OCCUPATION(S), DURING PAST FIVE YEARS AND OTHER INFORMATION*** | PORTFOLIOS IN AB FUND COMPLEX OVERSEEN BY DIRECTOR | OTHER PUBLIC COMPANY DIRECTORSHIPS CURRENTLY HELD BY DIRECTOR | |||||
| INTERESTED DIRECTOR | ||||||||
Robert M. Keith,# New York, NY 10105 59 (2010) | Senior Vice President of AllianceBernstein L.P. (the “Adviser”) and the head of AllianceBernstein Investments, Inc. (“ABI”) since July 2008; Director of ABI and President of the AB Mutual Funds. Previously, he served as Executive Managing Director of ABI from December 2006 to June 2008. Prior to joining ABI in 2006, Executive Managing Director of Bernstein Global Wealth Management, and prior thereto, Senior Managing Director and Global Head of Client Service and Sales of the Adviser’s institutional investment management business since 2004. Prior thereto, he was Managing Director and Head of North American Client Service and Sales in the Adviser’s institutional investment management business with which he had been associated since prior to 2004. | 91 | None | |||||
| INDEPENDENT DIRECTORS | ||||||||
| Marshall C. Turner, Jr.,## Chairman of the Board 78 (2005) | Private Investor since prior to 2015. Former Chairman and CEO of Dupont Photomasks, Inc. (components of semi-conductor manufacturing). He has extensive operating leadership, and venture capital investing experience, including five interim or full-time CEO roles, and prior service as general partner of institutional venture capital partnerships. He also has extensivenon-profit board leadership experience, and currently serves on the boards of two education and science-relatednon-profit organizations. He has served as a director of one AB Fund since 1992, and director or trustee of all AB Funds since 2005. He has been Chairman of the AB Funds since January 2014, and the Chairman of the Independent Directors Committees of such AB Funds since February 2014. | 91 | Xilinx, Inc. (programmable logic semi-conductors) since 2007 | |||||
Jorge A. Bermudez,^ (2020) | Private investor since prior to 2015. Former Chief Risk Officer of Citigroup, Inc., a global financial services company, from November 2007 to March 2008, Chief Executive Officer of Citigroup’s Commercial Business Group in North America and Citibank Texas from 2005 to 2007, and a variety of other executive and leadership roles at various businesses within Citigroup prior to then; Chairman (2018) of the Texas A&M Foundation Board of Trustees (Trustee since 2013) and Chairman of the Smart Grid Center Board at Texas A&M University since 2012; director of, among others, Citibank N.A. from 2005 to 2008, the Federal Reserve Bank of Dallas, Houston Branch from 2009 to 2011, the Federal Reserve Bank of Dallas from 2011 to 2017, and the Electric Reliability Council of Texas from 2010 to 2016. He has served as director or trustee of the AB Funds since 2020. | 91 | Moody’s Corporation since April 2011 | |||||
31
| INTERNATIONAL VALUE PORTFOLIO | ||
| MANAGEMENT OF THE FUND | ||
| (continued) | AB Variable Products Series Fund | |
NAME, ADDRESS*, AGE AND (YEAR FIRST ELECTED)** | PRINCIPAL OCCUPATION(S), DURING PAST FIVE YEARS AND OTHER INFORMATION*** | PORTFOLIOS IN AB FUND COMPLEX OVERSEEN BY DIRECTOR | OTHER PUBLIC COMPANY DIRECTORSHIPS CURRENTLY HELD BY DIRECTOR | |||||
INDEPENDENT DIRECTORS (continued) | ||||||||
Michael J. Downey,## (2005) | Private Investor since prior to 2015. Formerly, Chairman of The Asia Pacific Fund, Inc. (registered investment company) since prior to 2015 until January 2019. From 1987 until 1993, Chairman and CEO of Prudential Mutual Fund Management, director of the Prudential mutual funds, and member of the Executive Committee of Prudential Securities, Inc. He has served as a director or trustee of the AB Funds since 2005. | 91 | None | |||||
Nancy P. Jacklin,## (2006) | Private Investor since prior to 2015. Professorial Lecturer at the Johns Hopkins School of Advanced International Studies (2008–2015). U.S. Executive Director of the International Monetary Fund (which is responsible for ensuring the stability of the international monetary system), (December 2002–May 2006); Partner, Clifford Chance (1992–2002); Sector Counsel, International Banking and Finance, and Associate General Counsel, Citicorp (1985–1992); Assistant General Counsel (International), Federal Reserve Board of Governors (1982–1985); and Attorney Advisor, U.S. Department of the Treasury (1973–1982). Member of the Bar of the District of Columbia and of New York; and member of the Council on Foreign Relations. She has served as a director or trustee of the AB Funds since 2006 and has been Chair of the Governance and Nominating Committees of the AB Funds since August 2014. | 91 | None | |||||
Carol C. McMullen,## (2016) | Managing Director of Slalom Consulting (consulting) since 2014, private investor and member of the Advisory Board of Butcher Box (since 2018). Formerly, member, Partners Healthcare Investment Committee (2010–2019); Director of Norfolk & Dedham Group (mutual property and casualty insurance) from 2011 until November 2016; Director of Partners Community Physicians Organization (healthcare) from 2014 until December 2016; and Managing Director of The Crossland Group (consulting) from 2012 until 2013. She has held a number of senior positions in the asset and wealth management industries, including at Eastern Bank (where her roles included President of Eastern Wealth Management), Thomson Financial (Global Head of Sales for Investment Management), and Putnam Investments (where her roles included Chief Investment Officer, Core and Growth and Head of Global Investment Research). She has served on a number of private company andnon-profit boards, and as a director or trustee of the AB Funds since June 2016. | 91 | None | |||||
32
| AB Variable Products Series Fund | ||
NAME, ADDRESS*, AGE AND (YEAR FIRST ELECTED)** | PRINCIPAL OCCUPATION(S), DURING PAST FIVE YEARS AND OTHER INFORMATION*** | PORTFOLIOS IN AB FUND COMPLEX OVERSEEN BY DIRECTOR | OTHER PUBLIC COMPANY DIRECTORSHIPS CURRENTLY HELD BY DIRECTOR | |||||
INDEPENDENT DIRECTORS (continued) | ||||||||
Garry L. Moody,## (2008) | Formerly, Partner, Deloitte & Touche LLP (1995–2008) where he held a number of senior positions, including Vice Chairman, and U.S. and Global Investment Management Practice Managing Partner; President, Fidelity Accounting and Custody Services Company (1993–1995), where he was responsible for accounting, pricing, custody and reporting for the Fidelity mutual funds; and Partner, Ernst & Young LLP (1975–1993), where he served as the National Director of Mutual Fund Tax Services and Managing Partner of its Chicago Office Tax department. He is a member of the Trustee Advisory Board of BoardIQ, a biweekly publication focused on issues and news affecting directors of mutual funds. He is also a member of the Investment Company Institute’s Board of Governors and the Independent Directors Council Governing Council. He has served as a director or trustee, and as Chairman of the Audit Committees, of the AB Funds since 2008. | 91 | None | |||||
| Earl D. Weiner,## 80 (2007) | Senior Counsel since 2017, Of Counsel from 2007 to 2016, and Partner prior to then, of the law firm Sullivan & Cromwell LLP. He is a former member of the ABA Federal Regulation of Securities Committee Task Force to draft editions of the Fund Director’s Guidebook. He also serves as a director or trustee of variousnon-profit organizations and has served as Chairman or Vice Chairman of a number of them. He has served as a director or trustee of the AB Funds since 2007 and served as Chairman of the Governance and Nominating Committees of the AB Funds from 2007 until August 2014. | 91 | None | |||||
| * | The address for each of the Fund’s disinterested Directors is c/o AllianceBernstein L.P., Attention: Legal and Compliance Department—Mutual Fund Legal, 1345 Avenue of the Americas, New York, NY 10105. |
| ** | There is no stated term of office for the Fund’s Directors. |
| *** | The information above includes each Director’s principal occupation during the last five years and other information relating to the experience, attributes and skills relevant to each Director’s qualifications to serve as a Director, which led to the conclusion that each Director should serve as a Director for the Fund. |
| # | Mr. Keith is an “interested person” of the Fund, as defined in the 1940 Act, due to his position as a Senior Vice President of the Adviser. |
| ## | Member of the Audit Committee, the Governance and Nominating Committee, and the Independent Directors Committee. |
| ^ | Mr. Bermudez will be a member of the Audit Committee, the Governance, and Nominating Committee, and the Independent Directors Committee when he joins the Board on January 1, 2020. |
33
| INTERNATIONAL VALUE PORTFOLIO | ||
| MANAGEMENT OF THE FUND | ||
| (continued) | AB Variable Products Series Fund | |
Officer Information
Certain information concerning the Portfolio’s Officers is listed below.
| NAME, ADDRESS* AND AGE | PRINCIPAL POSITION(S) HELD WITH FUND | PRINCIPAL OCCUPATION DURING PAST FIVE YEARS | ||
| Robert M. Keith 59 | President and Chief Executive Officer | See biography above. | ||
| Tawhid Ali 48 | Vice President | Senior Vice President of the Adviser**, with which he has been associated since prior to 2015. He is also Chief Investment Officer of European Value Equities. | ||
| Avi Lavi 53 | Vice President | Senior Vice President of the Adviser**, with which he has been associated since prior to 2015. He is also Chief Investment Officer of Global and International Value Equities. | ||
| Emilie D. Wrapp 64 | Secretary | Senior Vice President, Assistant General Counsel and Assistant Secretary of ABI**, with which she has been associated since prior to 2015. | ||
| Michael B. Reyes 43 | Senior Analyst | Vice President of the Adviser**, with which he has been associated since prior to 2015. | ||
| Joseph J. Mantineo 60 | Treasurer and Chief Financial Officer | Senior Vice President of AllianceBernstein Investor Services, Inc. (“ABIS”)**, with which he has been associated since prior to 2015. | ||
| Phyllis J. Clarke 59 | Controller | Vice President of ABIS**, with which she has been associated since prior to 2015. | ||
Vincent S. Noto 55 | Chief Compliance Officer | Senior Vice President since 2015 and Mutual Fund Chief Compliance Officer of the Adviser** since prior to 2015. |
| * | The address for each of the Portfolio Officers is 1345 Avenue of the Americas, New York, NY 10105. |
| ** | The Adviser, ABI and ABIS are affiliates of the Fund. |
| The Fund’s Statement of Additional Information (“SAI”) has additional information about the Fund’s Directors and Officers and is available without charge upon request. Contact your financial representative or the Adviser at(800) 227-4618, or visit www.abfunds.com, for a free prospectus or SAI. |
34
| INTERNATIONAL VALUE PORTFOLIO | ||
| CONTINUANCE DISCLOSURE | AB Variable Products Series Fund | |
INFORMATION REGARDING THE REVIEW AND APPROVAL OF THE FUND’S ADVISORY AGREEMENT
The disinterested directors (the “directors”) of AB Variable Products Series Fund, Inc. (the “Company”) unanimously approved the continuance of the Company’s Advisory Agreement with the Adviser in respect of AB International Value Portfolio (the “Fund”) at a meeting held on May7-9, 2019 (the “Meeting”).
Prior to approval of the continuance of the Advisory Agreement, the directors had requested from the Adviser, and received and evaluated, extensive materials. They reviewed the proposed continuance of the Advisory Agreement with the Adviser and with experienced counsel who are independent of the Adviser, who advised on the relevant legal standards. The directors also reviewed additional materials, including comparative analytical data prepared by the Senior Analyst for the Fund. The directors also discussed the proposed continuance in private sessions with counsel.
The directors considered their knowledge of the nature and quality of the services provided by the Adviser to the Fund gained from their experience as directors or trustees of most of the registered investment companies advised by the Adviser, their overall confidence in the Adviser’s integrity and competence they have gained from that experience, the Adviser’s initiative in identifying and raising potential issues with the directors and its responsiveness, frankness and attention to concerns raised by the directors in the past, including the Adviser’s willingness to consider and implement organizational and operational changes designed to improve investment results and the services provided to the AB Funds. The directors noted that they have four regular meetings each year, at each of which they review extensive materials and information from the Adviser, including information on the investment performance of the Fund.
The directors also considered all factors they believed relevant, including the specific matters discussed below. During the course of their deliberations, the directors evaluated, among other things, the reasonableness of the advisory fee. The directors did not identify any particular information that wasall-important or controlling, and different directors may have attributed different weights to the various factors. The directors determined that the selection of the Adviser to manage the Fund and the overall arrangements between the Fund and the Adviser, as provided in the Advisory Agreement, including the advisory fee, were fair and reasonable in light of the services performed, expenses incurred and such other matters as the directors considered relevant in the exercise of their business judgment. The material factors and conclusions that formed the basis for the directors’ determinations included the following:
Nature, Extent and Quality of Services Provided
The directors considered the scope and quality of services provided by the Adviser under the Advisory Agreement, including the quality of the investment research capabilities of the Adviser and the other resources it has dedicated to performing services for the Fund. The directors noted that the Adviser from time to time reviews the Fund’s investment strategies and from time to time proposes changes intended to improve the Fund’s relative or absolute performance for the directors’ consideration. They also noted the professional experience and qualifications of the Fund’s portfolio management team and other senior personnel of the Adviser. The directors also considered that the Advisory Agreement provides that the Fund will reimburse the Adviser for the cost to it of providing certain clerical, accounting, administrative and other services to the Fund by employees of the Adviser or its affiliates. Requests for these reimbursements are made on a quarterly basis and subject to approval by the directors. Reimbursements, to the extent requested and paid, result in a higher rate of total compensation from the Fund to the Adviser than the fee rate stated in the Advisory Agreement. The directors noted that the methodology used to determine the reimbursement amounts had been reviewed by an independent consultant retained by the Fund’s former Senior Officer/Independent Compliance Officer. The quality of administrative and other services, including the Adviser’s role in coordinating the activities of the Fund’s other service providers, also was considered. The directors concluded that, overall, they were satisfied with the nature, extent and quality of services provided to the Fund under the Advisory Agreement.
Costs of Services Provided and Profitability
The directors reviewed a schedule of the revenues and expenses and related notes indicating the profitability of the Fund to the Adviser for calendar years 2017 and 2018 that had been prepared with an expense allocation methodology arrived at in consultation with an independent consultant retained by the Fund’s former Senior Officer/Independent Compliance Officer. The directors noted the assumptions and methods of allocation used by the Adviser in preparing fund-specific profitability data and understood that there are a number of potentially acceptable allocation methodologies for information of this type. The directors noted that the profitability information reflected all revenues and expenses of the Adviser’s relationship with the Fund, including those relating to its subsidiaries that provide transfer agency, distribution and brokerage services to the Fund. The directors recognized that it is difficult to make comparisons of the profitability of the Advisory Agreement with
35
| INTERNATIONAL VALUE PORTFOLIO | ||
| CONTINUANCE DISCLOSURE | ||
| (continued) | AB Variable Products Series Fund | |
the profitability of advisory contracts for unaffiliated funds because comparative information is not generally publicly available and is affected by numerous factors. The directors focused on the profitability of the Adviser’s relationship with the Fund before taxes and distribution expenses. The directors concluded that the Adviser’s level of profitability from its relationship with the Fund was not unreasonable.
Fall-Out Benefits
The directors considered the other benefits to the Adviser and its affiliates from their relationships with the Fund and the underlying fund advised by the Adviser in which the Fund invests, including, but not limited to, benefits relating to soft dollar arrangements (whereby investment advisers receive brokerage and research services from brokers that execute agency transactions for their clients);12b-1 fees and sales charges received by the Fund’s principal underwriter (which is a wholly owned subsidiary of the Adviser) in respect of the Fund’s Class B shares; brokerage commissions paid by the Fund to brokers affiliated with the Adviser; and transfer agency fees paid by the Fund to a wholly owned subsidiary of the Adviser. The directors recognized that the Adviser’s profitability would be somewhat lower without these benefits. The directors understood that the Adviser also might derive reputational and other benefits from its association with the Fund.
Investment Results
In addition to the information reviewed by the directors in connection with the Meeting, the directors receive detailed performance information for the Fund at each regular Board meeting during the year.
At the Meeting, the directors reviewed performance information prepared by an independent service provider (the “15(c) service provider”), showing the performance of the Class A Shares of the Fund against a group of similar funds (“peer group”) and a larger group of similar funds (“peer universe”), each selected by the 15(c) service provider, and information prepared by the Adviser showing performance of the Class A Shares against a broad-based securities market index, in each case for the1-,3-,5- and10-year periods ended February 28, 2019 and (in the case of comparisons with the broad-based securities market index) for the period from inception. Based on their review and their discussion with the Adviser of the reasons for the Fund’s underperformance in the periods reviewed, the directors concluded that the Fund’s investment performance was acceptable.
Advisory Fees and Other Expenses
The directors considered the advisory fee rate payable by the Fund to the Adviser and information prepared by the 15(c) service provider concerning advisory fee rates payable by other funds in the same category as the Fund. The directors recognized that it is difficult to make comparisons of advisory fees because there are variations in the services that are included in the fees paid by other funds. The directors compared the Fund’s contractual effective advisory fee rate with a peer group median and took into account the impact on the advisory fee rate of the administrative expense reimbursement paid to the Adviser in the latest fiscal year.
The directors also considered the Adviser’s fee schedule for other clients pursuing an investment strategy similar to the Fund’s. For this purpose, they reviewed the relevant advisory fee information from the Adviser’s Form ADV and in a report from the Fund’s Senior Analyst and noted the differences between the Fund’s fee schedule, on the one hand, and the Adviser’s institutional fee schedule and the schedule of fees charged by the Adviser to any offshore funds and for services to anysub-advised funds pursuing an investment strategy similar to the Fund’s, on the other. The directors noted that the Adviser may, in some cases, agree to fee rates with large institutional clients that are lower than those reviewed by the directors and that they had previously discussed with the Adviser its policies in respect of such arrangements. The directors previously discussed these matters with an independent fee consultant. The directors also compared the advisory fee rate for the Fund with those for two other funds advised by the Adviser with a similar investment strategy.
The Adviser reviewed with the directors the significantly greater scope of the services it provides to the Fund relative to institutional, offshore fund andsub-advised fund clients. In this regard, the Adviser noted, among other things, that, compared to institutional and offshore orsub-advisory accounts, the Fund (i) demands considerably more portfolio management, research and trading resources due to significantly higher daily cash flows; (ii) has more tax and regulatory restrictions and compliance obligations; (iii) must prepare and file or distribute regulatory and other communications about fund operations; and (iv) must provide shareholder servicing to retail investors. The Adviser also reviewed the greater legal risks presented by the large and changing population of Fund shareholders who may assert claims against the Adviser in individual or class actions, and the greater entrepreneurial risk in offering new fund products, which require substantial investment to launch, may not succeed, and generally must be priced to compete with larger, more
36
| AB Variable Products Series Fund | ||
established funds resulting in lack of profitability to the Adviser until a new fund achieves scale. In light of the substantial differences in services rendered by the Adviser to institutional, offshore fund andsub-advised fund clients as compared to the Fund, and the different risk profile, the directors considered these fee comparisons inapt and did not place significant weight on them in their deliberations.
In connection with their review of the Fund’s advisory fee, the directors also considered the total expense ratio of the Class A shares of the Fund in comparison to a peer group and a peer universe selected by the 15(c) service provider. The Class A expense ratio of the Fund was based on the Fund’s latest fiscal year and the directors considered the Adviser’s expense cap for the Fund (although the directors noted that the Fund’s expense ratio was currently below the Adviser’s expense cap). The directors noted that it was likely that the expense ratios of some of the other funds in the Fund’s category were lowered by waivers or reimbursements by those funds’ investment advisers, which in some cases might be voluntary or temporary. The directors view expense ratio information as relevant to their evaluation of the Adviser’s services because the Adviser is responsible for coordinating services provided to the Fund by others. The directors noted that the Fund’s expense ratio was above the peer group median. After reviewing and discussing the Adviser’s explanations of the reasons for this, the directors concluded that the Fund’s expense ratio was acceptable.
Economies of Scale
The directors noted that the advisory fee schedule for the Fund contains breakpoints that reduce the fee rates on assets above specified levels. The directors took into consideration prior presentations by an independent consultant on economies of scale in the mutual fund industry and for the AB Funds, and presentations from time to time by the Adviser concerning certain of its views on economies of scale. The directors also previously discussed economies of scale with an independent fee consultant. The directors also had requested and received from the Adviser certain updates on economies of scale in advance of the Meeting. The directors believe that economies of scale may be realized (if at all) by the Adviser across a variety of products and services, and not only in respect of a single fund. The directors noted that there is no established methodology for setting breakpoints that give effect to the fund-specific services provided by a fund’s adviser and to the economies of scale that an adviser may realize in its overall mutual fund business or those components of it which directly or indirectly affect a fund’s operations. The directors observed that in the mutual fund industry as a whole, as well as among funds similar to the Fund, there is no uniformity or pattern in the fees and asset levels at which breakpoints (if any) apply. The directors also noted that the advisory agreements for many funds do not have breakpoints at all. Having taken these factors into account, the directors concluded that the Fund’s shareholders would benefit from a sharing of economies of scale in the event the Fund’s net assets exceed a breakpoint in the future.
37
VPS-IV-0151-1219
DEC 12.31.19

ANNUAL REPORT
AB VARIABLE PRODUCTS
SERIES FUND, INC.
| + | LARGE CAP GROWTH PORTFOLIO |
Beginning on May 1, 2021, as permitted by regulations adopted by the Securities and Exchange Commission, you may not be receiving paper copies of the Portfolio’s shareholder reports from the insurance company that offers your contract unless you specifically request paper copies from the insurance company or from your financial intermediary. Instead of delivering paper copies of the reports, the insurance company may choose to make the reports available on a website, and will notify you by mail each time a report is posted and provide you with a website link to access the report. Instructions for requesting paper copies will be provided by your insurance company.
If you already elected to receive shareholder reports electronically, you will not be affected by this change and you need not take any action. You may elect to receive shareholder reports and other communications from the insurance company or your financial intermediary electronically by following the instructions provided by the insurance company or by contacting your financial intermediary.
You may elect to receive all future reports in paper free of charge from the insurance company. You can inform the insurance company or your financial intermediary that you wish to continue receiving paper copies of your shareholder reports by following the instructions provided by the insurance company or by contacting your financial intermediary. Your election to receive reports in paper will apply to all portfolio companies available under your contract with the insurance company.
Investment Products Offered
| • | Are Not FDIC Insured |
| • | May Lose Value |
| • | Are Not Bank Guaranteed |
AllianceBernstein Investments, Inc. (ABI) is the distributor of the AB family of mutual funds. ABI is a member of FINRA and is an affiliate of AllianceBernstein L.P., the Adviser of the funds.
You may obtain a description of the Fund’s proxy voting policies and procedures, and information regarding how the Fund voted proxies relating to portfolio securities during the most recent12-month period ended June 30, without charge. Simply visit AB’s website at www.abfunds.com or go to the Securities and Exchange Commission’s (the “Commission”) website at www.sec.gov, or call AB at (800) 227 4618.
The Fund files its complete schedule of portfolio holdings with the Commission for the first and third quarters of each fiscal year as an exhibit to its reports on Form N-PORT. The Fund’s Form N-PORT reports are available on the Commission’s website at www.sec.gov. The Fund’s Forms N-PORT may also be reviewed and copied at the Commission’s Public Reference Room in Washington, DC; information on the operation of the Public Reference Room may be obtained by calling (800) SEC 0330.
The [A/B] logo is a registered service mark of AllianceBernstein and AllianceBernstein® is a registered service mark used by permission of the owner, AllianceBernstein L.P.
| LARGE CAP GROWTH PORTFOLIO | AB Variable Products Series Fund | |
LETTER TO INVESTORS
February 14, 2020
The following is an update of AB Variable Products Series Fund—Large Cap Growth Portfolio (the “Portfolio”) for the annual reporting period ended December 31, 2019.
INVESTMENT OBJECTIVE AND POLICIES
The Portfolio’s investment objective is long-term growth of capital. The Portfolio invests primarily in equity securities of a limited number of large, carefully selected, high-quality US companies. The Portfolio invests primarily in the domestic equity securities of companies selected by the Adviser for their growth potential within various market sectors. The Portfolio emphasizes investments in large, seasoned companies. Under normal circumstances, the Portfolio will invest at least 80% of its net assets in common stocks of large-capitalization companies.
The Adviser expects that normally the Portfolio’s portfolio will tend to emphasize investments in securities issued by US companies, although it may invest in foreign securities. The Adviser’s research focus is on companies with high sustainable growth prospects, high or improving return on invested capital, transparent business models, and strong and lasting competitive advantages.
The Portfolio may, at times, invest in shares of exchange-traded funds (“ETFs”) in lieu of making direct investments in securities. ETFs may provide more efficient and economical exposure to the types of companies and geographic locations in which the Portfolio seeks to invest than direct investments.
The Portfolio may enter into derivatives transactions, such as options, futures contracts, forwards and swaps. The Portfolio may use options strategies involving the purchase and/or writing of various combinations of call and/or put options, including on individual securities and stock indices, futures contracts (including futures contracts on individual securities and stock indices) or shares of ETFs. These transactions may be used, for example, in an effort to earn extra income, to adjust exposure to individual securities or markets, or to protect all or a portion of the Portfolio’s portfolio from a decline in value, sometimes within certain ranges.
INVESTMENT RESULTS
The table on page 3 shows the Portfolio’s performance compared to its benchmark, the Russell 1000 Growth Index, in addition to the broad market as measured by the Standard & Poor’s (“S&P”) 500 Index, for theone-, five- and10-year periods ended December 31, 2019.
All share classes of the Portfolio underperformed the primary benchmark and outperformed the S&P 500 Index for the annual period. Sector selection detracted, relative to the primary benchmark, led by an underweight to the technology sector and an overweight to health care. Underweights to industrials and energy offset losses somewhat. Stock selection in health care was positive and offset losses in technology.
The Portfolio did not utilize derivatives during the annual period.
MARKET REVIEW AND INVESTMENT STRATEGY
Global equities recorded strong double-digit returns, while emerging markets also rallied during the annual period ended December 31, 2019. After declining sharply at the end of 2018, equity markets rebounded dramatically in January as strong corporate earnings and optimism about a trade truce between the US and China calmed investors.Trade-war tensions resurfaced, however, and emerging geopolitical pressures drove market volatility. Tariff wars, restrictive monetary policy and a decline in industrial production stoked recessionary fears throughout the global economy. In response, the world’s central banks implemented accommodative monetary policies to help support capital markets. Late in the third quarter, equity market performance was accompanied by a sharp style rotation in the US. Quality-growth and lower-volatility stocks, which had been strong performers, lagged and value stocks outperformed. However, for the most part, growth stocks continued to outperform value over the entire period. From a market-capitalization perspective,large-cap stocks outperformed theirsmall-cap peers. In December, equity markets rallied on news that the US and China had agreed to a preliminaryphase-one trade deal due to be signed in January 2020.
The Portfolio’s Senior Investment Management Team (the “Team”) follows abottom-up stock picking methodology that seeks to identify companies that meet its investment criteria of healthy balance sheets, competitive advantages, strong cash-flow generation, transparent business models and sustainable growth. The Portfolio is conservatively positioned amid the current uncertainty in the global macro environment. The Team remains laser-focused in identifying companies that generate high return on assets with high reinvestment rate opportunities.
1
| LARGE CAP GROWTH PORTFOLIO | ||
| DISCLOSURES AND RISKS | AB Variable Products Series Fund | |
Benchmark Disclosure
The Russell 1000® Growth Index and the S&P 500® Index are unmanaged and do not reflect fees and expenses associated with the active management of a mutual fund portfolio. The Russell 1000 Growth Index represents the performance oflarge-cap growth companies within the US. The S&P 500 Index includes 500 US stocks and is a common representation of the performance of the overall US stock market. An investor cannot invest directly in an index, and its results are not indicative of the performance for any specific investment, including the Portfolio.
A Word About Risk
Market Risk: The value of the Portfolio’s assets will fluctuate as the stock or bond market fluctuates. The value of its investments may decline, sometimes rapidly and unpredictably, simply because of economic changes or other events that affect large portions of the market. It includes the risk that a particular style of investing, such as the Portfolio’s growth approach, may underperform the market generally.
Focused Portfolio Risk: Investments in a limited number of companies may have more risk because changes in the value of a single security may have a more significant effect, either negative or positive, on the Portfolio’s net asset value (“NAV”).
Foreign(Non-US) Risk: Investments in securities ofnon-US issuers may involve more risk than those of US issuers. These securities may fluctuate more widely in price and may be more difficult to trade or dispose of due to adverse market, economic, political, regulatory or other factors.
Derivatives Risk: Derivatives may be difficult to price or unwind and leveraged so that small changes may produce disproportionate losses for the Portfolio. Derivatives may also be subject to counterparty risk to a greater degree than more traditional investments.
Management Risk: The Portfolio is subject to management risk because it is an actively managed investment fund. The Adviser will apply its investment techniques and risk analyses in making investment decisions for the Portfolio, but there is no guarantee that its techniques will produce the intended results.
These risks are fully discussed in the Variable Products prospectus. As with all investments, you may lose money by investing in the Portfolio.
An Important Note About Historical Performance
The investment return and principal value of an investment in the Portfolio will fluctuate, so that shares, when redeemed, may be worth more or less than their original cost. Performance shown in this report represents past performance and does not guarantee future results. Current performance may be lower or higher than the performance information shown. Please contact your financial advisor or insurance agent representative at your financial institution to obtain portfolio performance information current to the most recent month end.
Investors should consider the investment objectives, risks, charges and expenses of the Portfolio carefully before investing. For additional copies of the Portfolio’s prospectus or summary prospectus, which contains this and other information, call your financial advisor or (800) 227 4618. Please read the prospectus and/or summary prospectus carefully before investing.
All fees and expenses related to the operation of the Portfolio have been deducted, but no adjustment has been made for insurance company separate account or annuity contract charges, which would reduce total return to a contract owner. Performance assumes reinvestment of distributions and does not account for taxes.
There are additional fees and expenses associated with all Variable Products. These fees can include mortality and expense risk charges, administrative charges, and other charges that can significantly reduce investment returns. Those fees and expenses are not reflected in this annual report. You should consult your Variable Products prospectus for a description of those fees and expenses and speak to your insurance agent or financial representative if you have any questions. You should read the prospectus before investing or sending money.
2
| LARGE CAP GROWTH PORTFOLIO | ||
| HISTORICAL PERFORMANCE | AB Variable Products Series Fund | |
| THE PORTFOLIO VS. ITS BENCHMARKS | Net Asset Value Returns | |||||||||||
| PERIODS ENDED DECEMBER 31, 2019 (unaudited) | 1 Year | 5 Years1 | 10 Years1 | |||||||||
| Large Cap Growth Portfolio Class A2 | 34.70% | 15.77% | 15.01% | |||||||||
| Large Cap Growth Portfolio Class B2 | 34.37% | 15.48% | 14.73% | |||||||||
| Primary Benchmark: Russell 1000 Growth Index | 36.39% | 14.63% | 15.22% | |||||||||
| S&P 500 Index | 31.49% | 11.70% | 13.56% | |||||||||
1 Average annual returns. |
| |||||||||||
2 Includes the impact of proceeds received and credited to the Portfolio resulting from class-action settlements, which enhanced the performance of all share classes of the Portfolio for the annual period ended December 31, 2019 by 0.04%.
|
| |||||||||||
| Please keep in mind that high, double-digit returns are highly unusual and cannot be sustained. Investors should also be aware that these returns were primarily achieved during favorable market conditions. |
| |||||||||||
The Portfolio’s current prospectus fee table shows the Portfolio’s total annual operating expense ratios as 0.68% and 0.93% for Class A and Class B shares, respectively. The Financial Highlights section of this report sets forth expense ratio data for the current reporting period; the expense ratios shown above may differ from the expense ratios in the Financial Highlights section since they are based on different time periods.
GROWTH OF A $10,000 INVESTMENT
12/31/2009 TO 12/31/2019 (unaudited)
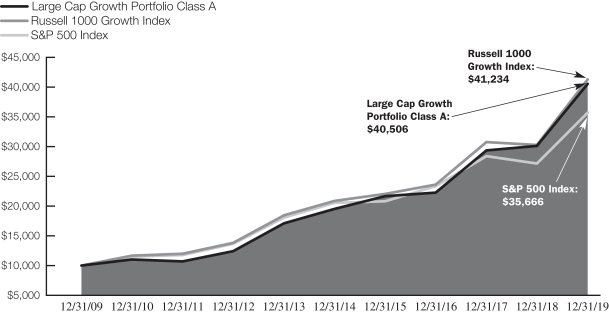
This chart illustrates the total value of an assumed $10,000 investment in Large Cap Growth Portfolio Class A shares (from 12/31/2009 to 12/31/2019) as compared to the performance of the Portfolio’s benchmarks. The chart assumes the reinvestment of dividends and capital gains distributions.
See Disclosures, Risks and Note about Historical Performance on page 2.
3
| LARGE CAP GROWTH PORTFOLIO | ||
| EXPENSE EXAMPLE (unaudited) | AB Variable Products Series Fund | |
As a shareholder of the Portfolio, you incur two types of costs: (1) transaction costs, including sales charges (loads) on purchase payments, contingent deferred sales charges on redemptions and (2) ongoing costs, including management fees; distribution(12b-1) fees; and other Portfolio expenses. This example is intended to help you understand your ongoing costs (in dollars) of investing in the Portfolio and to compare these costs with the ongoing costs of investing in other mutual funds.
The Example is based on an investment of $1,000 invested at the beginning of the period and held for the entire period as indicated below.
Actual Expenses
The table below provides information about actual account values and actual expenses. You may use the information in this line, together with the amount you invested, to estimate the expenses that you paid over the period. Simply divide your account value by $1,000 (for example, an $8,600 account value divided by $1,000 = 8.6), then multiply the result by the number in the first line under the heading entitled “Expenses Paid During Period” to estimate the expenses you paid on your account during this period. The estimate of expenses does not include fees or other expenses of any variable insurance product. If such expenses were included, the estimate of expenses you paid during the period would be higher and your ending account value would be lower.
Hypothetical Example for Comparison Purposes
The table below provides information about hypothetical account values and hypothetical expenses based on the Portfolio’s actual expense ratio and an assumed annual rate of return of 5% before expenses, which is not the Portfolio’s actual return. The hypothetical account values and expenses may not be used to estimate the actual ending account balance or expenses you paid for the period. You may use this information to compare the ongoing costs of investing in the Portfolio and other funds by comparing this 5% hypothetical example with the 5% hypothetical examples that appear in the shareholder reports of other funds. The estimate of expenses does not include fees or other expenses of any variable insurance product. If such expenses were included, the estimate of expenses you paid during the period would be higher and your ending account value would be lower.
Please note that the expenses shown in the table are meant to highlight your ongoing costs only and do not reflect any transactional costs, such as sales charges (loads), or contingent deferred sales charges on redemptions. Therefore, the second line of each class’ table is useful in comparing ongoing costs only, and will not help you determine the relative total costs of owning different funds. In addition, if these transactional costs were included, your costs would have been higher.
| Beginning Account Value July 1, 2019 | Ending Account Value December 31, 2019 | Expenses Paid During Period* | Annualized Expense Ratio* | Total Expenses Paid During Period+ | Total Annualized Expense Ratio+ | |||||||||||||||||||
Class A | ||||||||||||||||||||||||
Actual | $ | 1,000 | $ | 1,111.00 | $ | 3.56 | 0.67 | % | $ | 3.62 | 0.68 | % | ||||||||||||
Hypothetical (5% annual return before expenses) | $ | 1,000 | $ | 1,021.83 | $ | 3.41 | 0.67 | % | $ | 3.47 | 0.68 | % | ||||||||||||
Class B | ||||||||||||||||||||||||
Actual | $ | 1,000 | $ | 1,109.50 | $ | 4.89 | 0.92 | % | $ | 4.94 | 0.93 | % | ||||||||||||
Hypothetical (5% annual return before expenses) | $ | 1,000 | $ | 1,020.57 | $ | 4.69 | 0.92 | % | $ | 4.74 | 0.93 | % | ||||||||||||
| * | Expenses are equal to each classes’ annualized expense ratios, multiplied by the average account value over the period, multiplied by 184/365 (to reflect theone-half year period). |
| + | In connection with the Portfolio’s investments in affiliated/unaffiliated underlying portfolios, the Portfolio incurs no direct expenses, but bears proportionate shares of the fees and expenses (i.e., operating, administrative and investment advisory fees) of the affiliated/unaffiliated underlying portfolios. The Adviser has contractually agreed to waive its fees from the Portfolio in an amount equal to the Portfolio’s pro rata share of certain acquired fund fees and expenses of the affiliated underlying portfolios. The Portfolio’s total expenses are equal to the classes’ annualized expense ratio plus the Portfolio’s pro rata share of the weighted average expense ratio of the affiliated/unaffiliated underlying portfolios in which it invests, multiplied by the average account value over the period, multiplied by 184/365 (to reflect theone-half year period). |
4
| LARGE CAP GROWTH PORTFOLIO | ||
| TEN LARGEST HOLDINGS1 | ||
| December 31, 2019 (unaudited) | AB Variable Products Series Fund | |
| COMPANY | U.S. $ VALUE | PERCENT OF NET ASSETS | ||||||
Alphabet, Inc.—Class C | $ | 43,311,426 | 7.4 | % | ||||
Microsoft Corp. | 40,513,446 | 6.9 | ||||||
UnitedHealth Group, Inc. | 31,905,355 | 5.4 | ||||||
Facebook, Inc.—Class A | 30,216,084 | 5.2 | ||||||
Visa, Inc.—Class A | 28,693,457 | 4.9 | ||||||
Zoetis, Inc. | 22,451,590 | 3.8 | ||||||
Monster Beverage Corp. | 21,962,626 | 3.7 | ||||||
Vertex Pharmaceuticals, Inc. | 21,350,690 | 3.6 | ||||||
Intuitive Surgical, Inc. | 18,676,202 | 3.2 | ||||||
Nike, Inc.—Class B | 17,579,919 | 3.0 | ||||||
|
|
|
| |||||
| $ | 276,660,795 | 47.1 | % | |||||
SECTOR BREAKDOWN2
December 31, 2019 (unaudited)
| SECTOR | U.S. $ VALUE | PERCENT OF TOTAL INVESTMENTS | ||||||
Health Care | $ | 146,053,678 | 24.9 | % | ||||
Information Technology | 140,378,904 | 23.9 | ||||||
Communication Services | 85,476,386 | 14.5 | ||||||
Consumer Discretionary | 78,112,725 | 13.3 | ||||||
Consumer Staples | 37,805,872 | 6.4 | ||||||
Industrials | 35,989,292 | 6.1 | ||||||
Materials | 11,693,558 | 2.0 | ||||||
Financials | 2,905,252 | 0.5 | ||||||
Short-Term Investments | 49,147,041 | 8.4 | ||||||
|
|
|
| |||||
Total Investments | $ | 587,562,708 | 100.0 | % | ||||
| 1 | Long-term investments. |
| 2 | The Portfolio’s sector breakdown is expressed as a percentage of total investments (excluding security lending collateral) and may vary over time. |
Please note: The sector classifications presented herein are based on the Global Industry Classification Standard (GICS) which was developed by Morgan Stanley Capital International and Standard & Poor’s. The components are divided into sector, industry group, and industrysub-indices as classified by the GICS for each of the market capitalization indices in the broad market. These sector classifications are broadly defined. The “Portfolio of Investments” section of the report reflects more specific industry information and is consistent with the investment restrictions discussed in the Portfolio’s prospectus.
5
| LARGE CAP GROWTH PORTFOLIO | ||
| PORTFOLIO OF INVESTMENTS | ||
| December 31, 2019 | AB Variable Products Series Fund | |
| Company | Shares | U.S. $ Value | ||||||
COMMON STOCKS–91.7% | ||||||||
HEALTH CARE–24.9% | ||||||||
BIOTECHNOLOGY–5.5% | ||||||||
Regeneron Pharmaceuticals, Inc.(a) | 29,154 | $ | 10,946,744 | |||||
Vertex Pharmaceuticals, Inc.(a) | 97,514 | 21,350,690 | ||||||
|
| |||||||
| 32,297,434 | ||||||||
|
| |||||||
HEALTH CARE EQUIPMENT & | ||||||||
ABIOMED, Inc.(a) | 17,660 | 3,012,619 | ||||||
Align Technology, Inc.(a) | 17,200 | 4,799,488 | ||||||
Edwards Lifesciences Corp.(a) | 49,747 | 11,605,478 | ||||||
Intuitive Surgical, Inc.(a) | 31,593 | 18,676,202 | ||||||
Stryker Corp. | 33,004 | 6,928,860 | ||||||
|
| |||||||
| 45,022,647 | ||||||||
|
| |||||||
HEALTH CARE PROVIDERS & | ||||||||
UnitedHealth Group, Inc. | 108,529 | 31,905,355 | ||||||
|
| |||||||
HEALTH CARE TECHNOLOGY–0.2% | ||||||||
Veeva Systems, Inc.–Class A(a) | 6,816 | 958,739 | ||||||
|
| |||||||
LIFE SCIENCES TOOLS & SERVICES–2.3% | ||||||||
Illumina, Inc.(a) | 33,620 | 11,153,099 | ||||||
Mettler-Toledo International, Inc.(a) | 2,855 | 2,264,814 | ||||||
|
| |||||||
| 13,417,913 | ||||||||
|
| |||||||
PHARMACEUTICALS–3.8% | ||||||||
Zoetis, Inc. | 169,638 | 22,451,589 | ||||||
|
| |||||||
| 146,053,677 | ||||||||
|
| |||||||
INFORMATION TECHNOLOGY–23.9% | ||||||||
COMMUNICATIONS EQUIPMENT–0.9% | ||||||||
Arista Networks, Inc.(a) | 25,913 | 5,270,704 | ||||||
|
| |||||||
ELECTRONIC EQUIPMENT, INSTRUMENTS & | ||||||||
Amphenol Corp.–Class A | 20,946 | 2,266,985 | ||||||
Cognex Corp. | 39,022 | 2,186,793 | ||||||
IPG Photonics Corp.(a)(b) | 13,889 | 2,012,794 | ||||||
|
| |||||||
| 6,466,572 | ||||||||
|
| |||||||
IT SERVICES–8.1% | ||||||||
Euronet Worldwide, Inc.(a) | 11,849 | 1,866,929 | ||||||
PayPal Holdings, Inc.(a) | 156,542 | 16,933,148 | ||||||
Visa, Inc.–Class A(b) | 152,706 | 28,693,457 | ||||||
|
| |||||||
| 47,493,534 | ||||||||
|
| |||||||
| Company | Shares | U.S. $ Value | ||||||
SEMICONDUCTORS & SEMICONDUCTOR | ||||||||
ASML Holding NV ADR(b) | 7,580 | $ | 2,243,225 | |||||
QUALCOMM, Inc. | 46,330 | 4,087,696 | ||||||
Texas Instruments, Inc. | 21,070 | 2,703,070 | ||||||
Xilinx, Inc. | 82,090 | 8,025,940 | ||||||
|
| |||||||
| 17,059,931 | ||||||||
|
| |||||||
SOFTWARE–10.1% | ||||||||
Adobe, Inc.(a) | 31,520 | 10,395,611 | ||||||
ANSYS, Inc.(a) | 1,159 | 298,338 | ||||||
Aspen Technology, Inc.(a) | 2,570 | 310,790 | ||||||
Microsoft Corp. | 256,902 | 40,513,446 | ||||||
Paycom Software, Inc.(a) | 10,009 | 2,649,983 | ||||||
Slack Technologies, Inc.–Class A(a)(b) | 108,862 | 2,447,218 | ||||||
Tyler Technologies, Inc.(a) | 8,570 | 2,571,171 | ||||||
|
| |||||||
| 59,186,557 | ||||||||
|
| |||||||
TECHNOLOGY HARDWARE, STORAGE & | ||||||||
Apple, Inc. | 16,692 | 4,901,606 | ||||||
|
| |||||||
| 140,378,904 | ||||||||
|
| |||||||
COMMUNICATION SERVICES–14.6% | ||||||||
ENTERTAINMENT–2.1% | ||||||||
Electronic Arts, Inc.(a) | 111,142 | 11,948,876 | ||||||
|
| |||||||
INTERACTIVE MEDIA & SERVICES–12.5% | ||||||||
Alphabet, Inc.–Class C(a) | 32,394 | 43,311,426 | ||||||
Facebook, Inc.–Class A(a) | 147,216 | 30,216,084 | ||||||
|
| |||||||
| 73,527,510 | ||||||||
|
| |||||||
| 85,476,386 | ||||||||
|
| |||||||
CONSUMER |
| |||||||
DIVERSIFIED CONSUMER SERVICES–0.3% | ||||||||
Bright Horizons Family Solutions, Inc.(a) | 9,700 | 1,457,813 | ||||||
|
| |||||||
HOTELS, RESTAURANTS & LEISURE–0.4% | ||||||||
Domino’s Pizza, Inc. | 7,680 | 2,256,230 | ||||||
|
| |||||||
INTERNET & DIRECT MARKETING | ||||||||
Booking Holdings, Inc.(a) | 5,677 | 11,659,025 | ||||||
Etsy, Inc.(a) | 7,098 | 314,442 | ||||||
|
| |||||||
| 11,973,467 | ||||||||
|
| |||||||
SPECIALTY RETAIL–7.6% | ||||||||
Burlington Stores, Inc.(a) | 41,087 | 9,369,069 | ||||||
Five Below, Inc.(a) | 32,305 | 4,130,517 | ||||||
Home Depot, Inc. (The) | 75,600 | 16,509,528 | ||||||
6
| AB Variable Products Series Fund | ||
| Company | Shares | U.S. $ Value | ||||||
TJX Cos., Inc. (The) | 130,938 | $ | 7,995,074 | |||||
Ulta Salon Cosmetics & Fragrance, Inc.(a) | 27,025 | 6,841,109 | ||||||
|
| |||||||
| 44,845,297 | ||||||||
|
| |||||||
TEXTILES, APPAREL & LUXURY GOODS–3.0% | ||||||||
NIKE, Inc.–Class B | 173,526 | 17,579,919 | ||||||
|
| |||||||
| 78,112,726 | ||||||||
|
| |||||||
CONSUMER | ||||||||
BEVERAGES–4.1% | ||||||||
Constellation Brands, Inc.–Class A | 11,150 | 2,115,712 | ||||||
Monster Beverage Corp.(a) | 345,596 | 21,962,626 | ||||||
|
| |||||||
| 24,078,338 | ||||||||
|
| |||||||
FOOD & STAPLES | ||||||||
Costco Wholesale Corp. | 46,705 | 13,727,534 | ||||||
|
| |||||||
| 37,805,872 | ||||||||
|
| |||||||
INDUSTRIALS–6.1% | ||||||||
BUILDING PRODUCTS–1.9% | ||||||||
Allegion PLC(b) | 75,449 | 9,396,418 | ||||||
AO Smith Corp. | 41,445 | 1,974,440 | ||||||
|
| |||||||
| 11,370,858 | ||||||||
|
| |||||||
COMMERCIAL SERVICES & SUPPLIES–1.2% | ||||||||
Copart, Inc.(a) | 77,768 | 7,072,222 | ||||||
|
| |||||||
ELECTRICAL | ||||||||
AMETEK, Inc. | 43,560 | 4,344,675 | ||||||
|
| |||||||
INDUSTRIAL CONGLOMERATES–1.7% | ||||||||
Roper Technologies, Inc. | 27,744 | 9,827,757 | ||||||
|
| |||||||
MACHINERY–0.6% | ||||||||
IDEX Corp. | 19,615 | 3,373,780 | ||||||
|
| |||||||
| 35,989,292 | ||||||||
|
| |||||||
MATERIALS–2.0% | ||||||||
CHEMICALS–2.0% | ||||||||
Sherwin-Williams Co. (The) | 20,039 | 11,693,558 | ||||||
|
| |||||||
FINANCIALS–0.5% | ||||||||
CAPITAL MARKETS–0.5% | ||||||||
S&P Global, Inc. | 10,640 | 2,905,252 | ||||||
|
| |||||||
Total Common Stocks | 538,415,667 | |||||||
|
| |||||||
| Company | Shares | U.S. $ Value | ||||||
SHORT-TERM INVESTMENTS–8.4% | ||||||||
INVESTMENT | ||||||||
AB Fixed Income Shares, Inc.–Government Money Market Portfolio–Class AB, 1.53%(c)(d)(e) | 49,147,041 | $ | 49,147,041 | |||||
|
| |||||||
TOTAL INVESTMENTS BEFORE SECURITY LENDING COLLATERAL FOR SECURITIES LOANED–100.1% | 587,562,708 | |||||||
|
| |||||||
INVESTMENTS OF CASH COLLATERAL FOR SECURITIES | ||||||||
INVESTMENT | ||||||||
AB Fixed Income Shares, Inc.–Government Money Market Portfolio–Class AB, 1.53%(c)(d)(e) | 2,476,611 | 2,476,611 | ||||||
|
| |||||||
TOTAL | 590,039,319 | |||||||
Other assets less | (3,117,757 | ) | ||||||
|
| |||||||
NET ASSETS–100.0% | $ | 586,921,562 | ||||||
|
| |||||||
| (a) | Non-income producing security. |
| (b) | Represents entire or partial securities out on loan. See Note E for securities lending information. |
| (c) | Affiliated investments. |
| (d) | The rate shown represents the7-day yield as of period end. |
| (e) | To obtain a copy of the fund’s shareholder report, please go to the Securities and Exchange Commission’s website at www.sec.gov, or call AB at (800)227-4618. |
Glossary:
ADR—American Depositary Receipt
See notes to financial statements.
7
| LARGE CAP GROWTH PORTFOLIO | ||
| STATEMENT OF ASSETS & LIABILITIES | ||
| December 31, 2019 | AB Variable Products Series Fund | |
ASSETS |
| |||||||
Investments in securities, at value |
| |||||||
Unaffiliated issuers (cost $323,020,069) | $ | 538,415,667 | (a) | |||||
Affiliated issuers (cost $51,623,652—including investment of cash collateral for securities loaned of $2,476,611) | 51,623,652 | |||||||
Unaffiliated dividends receivable | 70,660 | |||||||
Affiliated dividends receivable | 61,200 | |||||||
Receivable for capital stock sold | 30,568 | |||||||
|
| |||||||
Total assets | 590,201,747 | |||||||
|
| |||||||
LIABILITIES |
| |||||||
Payable for collateral received on securities loaned | 2,476,611 | |||||||
Payable for capital stock redeemed | 319,904 | |||||||
Advisory fee payable | 282,804 | |||||||
Distribution fee payable | 65,572 | |||||||
Administrative fee payable | 21,941 | |||||||
Transfer Agent fee payable | 132 | |||||||
Accrued expenses and other liabilities | 113,221 | |||||||
|
| |||||||
Total liabilities | 3,280,185 | |||||||
|
| |||||||
NET ASSETS | $ | 586,921,562 | ||||||
|
| |||||||
COMPOSITION OF NET ASSETS |
| |||||||
Capital stock, at par | $ | 9,946 | ||||||
Additionalpaid-in capital | 323,071,100 | |||||||
Distributable earnings | 263,840,516 | |||||||
|
| |||||||
| $ | 586,921,562 | |||||||
|
| |||||||
Net Asset Value Per Share—1 billion shares of capital stock authorized, $.001 par value
| Class | Net Assets | Shares Outstanding | Net Asset Value | |||||||||
| A | $ | 264,234,276 | 4,313,012 | $ | 61.26 | |||||||
| B | $ | 322,687,286 | 5,633,114 | $ | 57.28 | |||||||
| (a) | Includes securities on loan with a value of $41,535,589 (see Note E). |
See notes to financial statements.
8
| LARGE CAP GROWTH PORTFOLIO | ||
| STATEMENT OF OPERATIONS | ||
| Year Ended December 31, 2019 | AB Variable Products Series Fund | |
INVESTMENT INCOME | ||||
Dividends | ||||
Unaffiliated issuers (net of foreign taxes withheld of $4,577) | $ | 3,068,627 | ||
Affiliated issuers | 877,842 | |||
Interest | 481 | |||
Securities lending income | 28,941 | |||
|
| |||
| 3,975,891 | ||||
|
| |||
EXPENSES | ||||
Advisory fee (see Note B) | 3,120,010 | |||
Distribution fee—Class B | 708,349 | |||
Transfer agency—Class A | 4,217 | |||
Transfer agency—Class B | 5,055 | |||
Custodian | 115,887 | |||
Administrative | 80,245 | |||
Printing | 61,472 | |||
Legal | 60,932 | |||
Audit and tax | 42,633 | |||
Directors’ fees | 22,925 | |||
Miscellaneous | 21,861 | |||
|
| |||
Total expenses | 4,243,586 | |||
Less: expenses waived and reimbursed by the Adviser (see Notes B & E) | (41,109 | ) | ||
|
| |||
Net expenses | 4,202,477 | |||
|
| |||
Net investment loss | (226,586 | ) | ||
|
| |||
REALIZED AND UNREALIZED GAIN ON INVESTMENT TRANSACTIONS | ||||
Net realized gain on investment transactions | 47,852,291 | |||
Net change in unrealized appreciation/depreciation of investments | 97,257,200 | |||
|
| |||
Net gain on investment transactions | 145,109,491 | |||
|
| |||
NET INCREASE IN NET ASSETS FROM OPERATIONS | $ | 144,882,905 | ||
|
|
See notes to financial statements.
9
| LARGE CAP GROWTH PORTFOLIO | ||
| STATEMENT OF CHANGES IN NET ASSETS | AB Variable Products Series Fund | |
| Year Ended December 31,2019 | Year Ended December 31,2018 | |||||||
INCREASE (DECREASE) IN NET ASSETS FROM OPERATIONS | ||||||||
Net investment loss | $ | (226,586 | ) | $ | (406,254 | ) | ||
Net realized gain on investment transactions | 47,852,291 | 70,143,110 | ||||||
Net change in unrealized appreciation/depreciation of investments | 97,257,200 | (58,055,525 | ) | |||||
|
|
|
| |||||
Net increase in net assets from operations | 144,882,905 | 11,681,331 | ||||||
Distributions to Shareholders | ||||||||
Class A | (30,469,954 | ) | (23,052,799 | ) | ||||
Class B | (39,025,095 | ) | (27,070,582 | ) | ||||
CAPITAL STOCK TRANSACTIONS | ||||||||
Net increase | 102,607,285 | 18,042,010 | ||||||
|
|
|
| |||||
Total increase (decrease) | 177,995,141 | (20,400,040 | ) | |||||
NET ASSETS | ||||||||
Beginning of period | 408,926,421 | 429,326,461 | ||||||
|
|
|
| |||||
End of period | $ | 586,921,562 | $ | 408,926,421 | ||||
|
|
|
| |||||
See notes to financial statements.
10
| LARGE CAP GROWTH PORTFOLIO | ||
| NOTES TO FINANCIAL STATEMENTS | ||
| December 31, 2019 | AB Variable Products Series Fund | |
NOTE A: Significant Accounting Policies
The AB Large Cap Growth Portfolio (the “Portfolio”) is a series of AB Variable Products Series Fund, Inc. (the “Fund”). The Portfolio’s investment objective is long-term growth of capital. The Portfolio is diversified as defined under the Investment Company Act of 1940. The Fund was incorporated in the State of Maryland on November 17, 1987, as anopen-end series investment company. The Portfolio acquired the assets and liabilities of AB Growth Portfolio (the “Acquired Portfolio”) a reorganization that was effective at the close of business April 26, 2019 (the “Reorganization”). The Reorganization was approved by the Fund’s Board of Directors pursuant to a Plan of Acquisition and Liquidation (the “Reorganization Agreement”) (see Note J for additional information). The Fund offers eleven separately managed pools of assets which have differing investment objectives and policies. The Portfolio offers Class A and Class B shares. Both classes of shares have identical voting, dividend, liquidating and other rights, except that Class B shares bear a distribution expense and have exclusive voting rights with respect to the Class B distribution plan.
The Portfolio offers and sells its shares only to separate accounts of certain life insurance companies for the purpose of funding variable annuity contracts and variable life insurance policies. Sales are made without a sales charge at the Portfolio’s net asset value per share.
The financial statements have been prepared in conformity with U.S. generally accepted accounting principles (“U.S. GAAP”) which require management to make certain estimates and assumptions that affect the reported amounts of assets and liabilities in the financial statements and amounts of income and expenses during the reporting period. Actual results could differ from those estimates. The Portfolio is an investment company under U.S. GAAP and follows the accounting and reporting guidance applicable to investment companies. The following is a summary of significant accounting policies followed by the Portfolio.
1. Security Valuation
Portfolio securities are valued at their current market value determined on the basis of market quotations or, if market quotations are not readily available or are deemed unreliable, at “fair value” as determined in accordance with procedures established by and under the general supervision of the Fund’s Board of Directors (the “Board”).
In general, the market values of securities which are readily available and deemed reliable are determined as follows: securities listed on a national securities exchange (other than securities listed on the NASDAQ Stock Market, Inc. (“NASDAQ”)) or on a foreign securities exchange are valued at the last sale price at the close of the exchange or foreign securities exchange. If there has been no sale on such day, the securities are valued at the last traded price from the previous day. Securities listed on more than one exchange are valued by reference to the principal exchange on which the securities are traded; securities listed only on NASDAQ are valued in accordance with the NASDAQ Official Closing Price; listed or over the counter (“OTC”) market put or call options are valued at the mid level between the current bid and ask prices. If either a current bid or current ask price is unavailable, AllianceBernstein L.P. (the “Adviser”) will have discretion to determine the best valuation (e.g., last trade price in the case of listed options); open futures are valued using the closing settlement price or, in the absence of such a price, the most recent quoted bid price. If there are no quotations available for the day of valuation, the last available closing settlement price is used; U.S. Government securities and any other debt instruments having 60 days or less remaining until maturity are generally valued at market by an independent pricing vendor, if a market price is available. If a market price is not available, the securities are valued at amortized cost. This methodology is commonly used for short term securities that have an original maturity of 60 days or less, as well as short term securities that had an original term to maturity that exceeded 60 days. In instances when amortized cost is utilized, the Valuation Committee (the “Committee”) must reasonably conclude that the utilization of amortized cost is approximately the same as the fair value of the security. Such factors the Committee will consider include, but are not limited to, an impairment of the creditworthiness of the issuer or material changes in interest rates. Fixed-income securities, including mortgage-backed and asset-backed securities, may be valued on the basis of prices provided by a pricing service or at a price obtained from one or more of the major broker-dealers. In cases where broker-dealer quotes are obtained, the Adviser may establish procedures whereby changes in market yields or spreads are used to adjust, on a daily basis, a recently obtained quoted price on a security. Swaps and other derivatives are valued daily, primarily using independent pricing services, independent pricing models using market inputs, as well as third party broker-dealers or counterparties. Open end mutual funds are valued at the closing net asset value per share, while exchange traded funds are valued at the closing market price per share.
Securities for which market quotations are not readily available (including restricted securities) or are deemed unreliable are valued at fair value as deemed appropriate by the Adviser. Factors considered in making this determination may include, but
11
| LARGE CAP GROWTH PORTFOLIO | ||
| NOTES TO FINANCIAL STATEMENTS | ||
| (continued) | AB Variable Products Series Fund | |
are not limited to, information obtained by contacting the issuer, analysts, analysis of the issuer’s financial statements or other available documents. In addition, the Portfolio may use fair value pricing for securities primarily traded innon-U.S. markets because most foreign markets close well before the Portfolio values its securities at 4:00 p.m., Eastern Time. The earlier close of these foreign markets gives rise to the possibility that significant events, including broad market moves, may have occurred in the interim and may materially affect the value of those securities. To account for this, the Portfolio generally values many of its foreign equity securities using fair value prices based on third party vendor modeling tools to the extent available.
2. Fair Value Measurements
In accordance with U.S. GAAP regarding fair value measurements, fair value is defined as the price that the Portfolio would receive to sell an asset or pay to transfer a liability in an orderly transaction between market participants at the measurement date. U.S. GAAP establishes a framework for measuring fair value, and a three-level hierarchy for fair value measurements based upon the transparency of inputs to the valuation of an asset or liability (including those valued based on their market values as described in Note A.1 above). Inputs may be observable or unobservable and refer broadly to the assumptions that market participants would use in pricing the asset or liability. Observable inputs reflect the assumptions market participants would use in pricing the asset or liability based on market data obtained from sources independent of the Portfolio. Unobservable inputs reflect the Portfolio’s own assumptions about the assumptions that market participants would use in pricing the asset or liability based on the best information available in the circumstances. Each investment is assigned a level based upon the observability of the inputs which are significant to the overall valuation. The three-tier hierarchy of inputs is summarized below.
| • | Level 1—quoted prices in active markets for identical investments |
| • | Level 2—other significant observable inputs (including quoted prices for similar investments, interest rates, prepayment speeds, credit risk, etc.) |
| • | Level 3—significant unobservable inputs (including the Portfolio’s own assumptions in determining the fair value of investments) |
Where readily available market prices or relevant bid prices are not available for certain equity investments, such investments may be valued based on similar publicly traded investments, movements in relevant indices since last available prices or based upon underlying company fundamentals and comparable company data (such as multiples to earnings or other multiples to equity). Where an investment is valued using an observable input, such as another publicly traded security, the investment will be classified as Level 2. If management determines that an adjustment is appropriate based on restrictions on resale, illiquidity or uncertainty, and such adjustment is a significant component of the valuation, the investment will be classified as Level 3. An investment will also be classified as Level 3 where management uses company fundamentals and other significant inputs to determine the valuation.
The following table summarizes the valuation of the Portfolio’s investments by the above fair value hierarchy levels as of December 31, 2019:
| Level 1 | Level 2 | Level 3 | Total | |||||||||||||
Investments in Securities: | ||||||||||||||||
Assets: | ||||||||||||||||
Common Stocks(a) | $ | 538,415,667 | $ | –0 | – | $ | –0 | – | $ | 538,415,667 | ||||||
Short-Term Investments | 49,147,041 | –0 | – | –0 | – | 49,147,041 | ||||||||||
Investments of Cash Collateral for Securities Loaned in Affiliated Money Market Fund | 2,476,611 | –0 | – | –0 | – | 2,476,611 | ||||||||||
|
|
|
|
|
|
|
| |||||||||
Total Investments in Securities | 590,039,319 | –0 | – | –0 | – | 590,039,319 | ||||||||||
Other Financial Instruments(b) | –0 | – | –0 | – | –0 | – | –0 | – | ||||||||
|
|
|
|
|
|
|
| |||||||||
Total | $ | 590,039,319 | $ | –0 | – | $ | –0 | – | $ | 590,039,319 | ||||||
|
|
|
|
|
|
|
| |||||||||
| (a) | See Portfolio of Investments for sector classifications. |
| (b) | Other financial instruments are derivative instruments, such as futures, forwards and swaps, which are valued at the unrealized appreciation/(depreciation) on the instrument. Other financial instruments may also include swaps with upfront premiums, options written and swaptions written which are valued at market value. |
12
| AB Variable Products Series Fund | ||
3. Currency Translation
Assets and liabilities denominated in foreign currencies and commitments under forward currency exchange contracts are translated into U.S. dollars at the mean of the quoted bid and ask prices of such currencies against the U.S. dollar. Purchases and sales of portfolio securities are translated into U.S. dollars at the rates of exchange prevailing when such securities were acquired or sold. Income and expenses are translated into U.S. dollars at rates of exchange prevailing when accrued.
Net realized gain or loss on foreign currency transactions represents foreign exchange gains and losses from sales and maturities of foreign fixed income investments, holding of foreign currencies, currency gains or losses realized between the trade and settlement dates on foreign investment transactions, and the difference between the amounts of dividends, interest and foreign withholding taxes recorded on the Portfolio’s books and the U.S. dollar equivalent amounts actually received or paid. Net unrealized currency gains and losses from valuing foreign currency denominated assets and liabilities at period end exchange rates are reflected as a component of net unrealized appreciation or depreciation of foreign currency denominated assets and liabilities.
4. Taxes
It is the Portfolio’s policy to meet the requirements of the Internal Revenue Code applicable to regulated investment companies and to distribute all of its investment company taxable income and net realized gains, if any, to shareholders. Therefore, no provisions for federal income or excise taxes are required. The Portfolio may be subject to taxes imposed by countries in which it invests. Such taxes are generally based on income and/or capital gains earned or repatriated. Taxes are accrued and applied to net investment income, net realized gains and net unrealized appreciation/depreciation as such income and/or gains are earned.
In accordance with U.S. GAAP requirements regarding accounting for uncertainties in income taxes, management has analyzed the Portfolio’s tax positions taken or expected to be taken on federal and state income tax returns for all open tax years (the current and the prior three tax years) and has concluded that no provision for income tax is required in the Portfolio’s financial statements.
5. Investment Income and Investment Transactions
Dividend income is recorded on theex-dividend date or as soon as the Portfolio is informed of the dividend. Interest income is accrued daily. Investment transactions are accounted for on the date the securities are purchased or sold. Investment gains or losses are determined on the identified cost basis. The Portfolio amortizes premiums and accretes discounts as adjustments to interest income.
6. Class Allocations
All income earned and expenses incurred by the Portfolio are borne on apro-rata basis by each outstanding class of shares, based on the proportionate interest in the Portfolio represented by the net assets of such class, except for class specific expenses which are allocated to the respective class. Expenses of the Fund are charged proportionately to each portfolio or based on other appropriate methods. Realized and unrealized gains and losses are allocated among the various share classes based on respective net assets.
7. Dividends and Distributions
Dividends and distributions to shareholders, if any, are recorded on theex-dividend date. Income dividends and capital gains distributions are determined in accordance with federal tax regulations and may differ from those determined in accordance with U.S. GAAP. To the extent these differences are permanent, such amounts are reclassified within the capital accounts based on their federal tax basis treatment; temporary differences do not require such reclassification.
NOTE B: Advisory Fee and Other Transactions with Affiliates
Under the terms of the investment advisory agreement, the Portfolio pays the Adviser an advisory fee at an annual rate of .60% of the first $2.5 billion, .50% of the next $2.5 billion and .45% in excess of $5 billion, of the Portfolio’s average daily net assets. The fee is accrued daily and paid monthly.
Pursuant to the investment advisory agreement, the Portfolio may reimburse the Adviser for certain legal and accounting services provided to the Portfolio by the Adviser. For the year ended December 31, 2019, the reimbursement for such services amounted to $80,245.
The Portfolio compensates AllianceBernstein Investor Services, Inc. (“ABIS”), a wholly-owned subsidiary of the Adviser, under a Transfer Agency Agreement for providing personnel and facilities to perform transfer agency services for the Portfolio. Such compensation retained by ABIS amounted to $1,491 for the year ended December 31, 2019.
13
| LARGE CAP GROWTH PORTFOLIO | ||
| NOTES TO FINANCIAL STATEMENTS | ||
| (continued) | AB Variable Products Series Fund | |
The Portfolio may invest in AB Government Money Market Portfolio (the “Government Money Market Portfolio”) which has a contractual annual advisory fee rate of .20% of the portfolio’s average daily net assets and bears its own expenses. The Adviser has contractually agreed to waive .10% of the advisory fee of Government Money Market Portfolio (resulting in a net advisory fee of .10%) until August 31, 2020. In connection with the investment by the Portfolio in Government Money Market Portfolio, the Adviser has contractually agreed to waive its advisory fee from the Portfolio in an amount equal to the Portfolio’s pro rata share of the effective advisory fee of Government Money Market Portfolio, as borne indirectly by the Portfolio as an acquired fund fee and expense. For the year ended December 31, 2019, such waiver amounted to $41,069.
A summary of the Portfolio’s transactions in AB mutual funds for the year ended December 31, 2019 is as follows:
Fund | Market Value 12/31/18 (000) | Purchases at Cost (000) | Sales Proceeds (000) | Market Value 12/31/19 (000) | Dividend Income (000) | |||||||||||||||
Government Money Market Portfolio | $ | 22,378 | $ | 106,897 | $ | 80,128 | $ | 49,147 | $ | 878 | ||||||||||
Government Money Market Portfolio* | 0 | 2,676 | 199 | 2,477 | 0 | ** | ||||||||||||||
|
|
|
| |||||||||||||||||
Total | $ | 51,624 | $ | 878 | ||||||||||||||||
|
|
|
| |||||||||||||||||
| * | Investments of cash collateral for securities lending transactions (see Note E). |
| ** | Amount is less than $500. |
During the second quarter of 2018, AXA S.A (“AXA”), a French holding company for the AXA group, a worldwide leader in life, property and casualty and health insurance and asset management, completed the sale of a minority stake in its subsidiary, AXA Equitable Holdings, Inc. (now named Equitable Holdings, Inc.)(“Equitable”), through an initial public offering. Equitable is the holding company for a diverse group of financial services companies, including an approximately 65.3% economic interest in the Adviser and a 100% interest in AllianceBernstein Corporation, the general partner of the Adviser. Since the initial sale, AXA has completed additional offerings, most recently during the fourth quarter of 2019. As a result, AXA currently owns 10.1% of the outstanding shares of common stock of Equitable, and no longer owns a controlling interest in Equitable. AXA previously annoyed its intention to sell its entire interest in Equitable over time, subject to market conditions and other factors (the “Plan”). Most of AXA’s remaining Equitable shares are to be delivered on redemption of AXA bonds mandatorily exchangeable into Equitable shares and maturing in May 2021. AXA retains sole discretion to determine the timing of any future sales of its remaining shares of Equitable common stock.
The latest transaction under the Plan, which occurred on November 13, 2019, resulted in the indirect transfer of a “controlling block” of voting securities of the Adviser (a “Change of Control Event”) and was deemed an “assignment” causing a termination of the Portfolio’s investment advisory agreement. In order to ensure that investment advisory services could continue uninterrupted in the vent of a Change of Control Event, the Board previously approved a new investment advisory agreement with the Adviser, and shareholders of the Portfolio subsequently approved the new investment advisory agreement. This agreement became effective on November 13, 2019.
NOTE C: Distribution Plan
The Portfolio has adopted a Distribution Plan (the “Plan”) for Class B shares pursuant to Rule12b-1 under the Investment Company Act of 1940. Under the Plan, the Portfolio pays distribution and servicing fees to AllianceBernstein Investments, Inc. (the “Distributor”), a wholly-owned subsidiary of the Adviser, at an annual rate of up to .50% of the Portfolio’s average daily net assets attributable to Class B shares. The fees are accrued daily and paid monthly. The Board currently limits payments under the Plan to .25% of the Portfolio’s average daily net assets attributable to Class B shares. The Plan provides that the Distributor will use such payments in their entirety for distribution assistance and promotional activities.
The Portfolio is not obligated under the Plan to pay any distribution and servicing fees in excess of the amounts set forth above. The purpose of the payments to the Distributor under the Plan is to compensate the Distributor for its distribution services with respect to the sale of the Portfolio’s Class B shares. Since the Distributor’s compensation is not directly tied to its expenses, the amount of compensation received by it under the Plan during any year may be more or less than its actual expenses. For this reason, the Plan is characterized by the staff of the Securities and Exchange Commission as being of the “compensation” variety.
In the event that the Plan is terminated or not continued, no distribution or servicing fees (other than current amounts accrued but not yet paid) would be owed by the Portfolio to the Distributor.
14
| AB Variable Products Series Fund | ||
The Plan also provides that the Adviser may use its own resources to finance the distribution of the Portfolio’s shares.
NOTE D: Investment Transactions
Purchases and sales of investment securities (excluding short-term investments) for the year ended December 31, 2019 were as follows:
| Purchases | Sales | |||||||
Investment securities (excluding U.S. government securities) | $ | 180,809,630 | $ | 199,987,207 | ||||
U.S. government securities | –0 | – | –0 | – | ||||
The cost of investments for federal income tax purposes, gross unrealized appreciation and unrealized depreciation are as follows:
Cost | $ | 375,425,201 | ||
|
| |||
Gross unrealized appreciation | $ | 215,511,182 | ||
Gross unrealized depreciation | (897,064 | ) | ||
|
| |||
Net unrealized appreciation | $ | 214,614,118 | ||
|
|
1. Derivative Financial Instruments
The Portfolio may use derivatives in an effort to earn income and enhance returns, to replace more traditional direct investments, to obtain exposure to otherwise inaccessible markets (collectively, “investment purposes”), or to hedge or adjust the risk profile of its portfolio.
The Portfolio did not engage in derivatives transactions for the year ended December 31, 2019.
2. Currency Transactions
The Portfolio may invest innon-U.S. Dollar-denominated securities on a currency hedged or unhedged basis. The Portfolio may seek investment opportunities by taking long or short positions in currencies through the use of currency-related derivatives, including forward currency exchange contracts, futures and options on futures, swaps, and other options. The Portfolio may enter into transactions for investment opportunities when it anticipates that a foreign currency will appreciate or depreciate in value but securities denominated in that currency are not held by the Portfolio and do not present attractive investment opportunities. Such transactions may also be used when the Adviser believes that it may be more efficient than a direct investment in a foreign currency-denominated security. The Portfolio may also conduct currency exchange contracts on a spot basis (i.e., for cash at the spot rate prevailing in the currency exchange market for buying or selling currencies).
NOTE E: Securities Lending
The Portfolio may enter into securities lending transactions. Under the Portfolio’s securities lending program, all loans of securities will be collateralized continually by cash collateral and/ornon-cash collateral.Non-cash collateral will include only securities issued or guaranteed by the U.S. government or its agencies or instrumentalities. The Portfolio cannot sell or repledge anynon-cash collateral, such collateral will not be reflected in the portfolio of investments. If a loan is collateralized by cash, the Portfolio will be compensated for the loan from a portion of the net return from the income earned on cash collateral after a rebate is paid to the borrower (in some cases, this rebate may be a “negative rebate” or fee paid by the borrower to the Portfolio in connection with the loan), and payments are made for fees of the securities lending agent and for certain other administrative expenses. If the Portfolio receivesnon-cash collateral, the Portfolio will receive a fee from the borrower generally equal to a negotiated percentage of the market value of the loaned securities. The Portfolio will have the right to call a loan and obtain the securities loaned at any time on notice to the borrower within the normal and customary settlement time for the securities. While the securities are on loan, the borrower is obligated to pay the Portfolio amounts equal to any income or other distributions from the securities. The Portfolio will not be able to exercise voting rights with respect to any securities during the existence of a loan, but will have the right to regain ownership of loaned securities in order to exercise voting or other ownership rights. Collateral received and securities loaned are marked to market daily to ensure that the securities loaned are secured by collateral. The lending agent currently invests the cash collateral received in Government Money Market Portfolio, an eligible money market vehicle, in accordance with the investment restrictions of the Portfolio, and as approved by the Board. The collateral received on securities loaned is recorded as an asset as well as a corresponding liability in the statement of assets and liabilities. The collateral will be adjusted the next business day to maintain the required collateral amount. The amounts of securities lending income from the borrowers and Government Money
15
| LARGE CAP GROWTH PORTFOLIO | ||
| NOTES TO FINANCIAL STATEMENTS | ||
| (continued) | AB Variable Products Series Fund | |
Market Portfolio are reflected in the statement of operations. When the Portfolio earns net securities lending income from Government Money Market Portfolio, the income is inclusive of a rebate expense paid to the borrower. In connection with the cash collateral investment by the Portfolio in Government Money Market Portfolio, the Adviser has agreed to waive a portion of the Portfolio’s share of the advisory fees of Government Money Market Portfolio, as borne indirectly by the Portfolio as an acquired fund fee and expense. When the Portfolio lends securities, its investment performance will continue to reflect changes in the value of the securities loaned. A principal risk of lending portfolio securities is that the borrower may fail to return the loaned securities upon termination of the loan and that the collateral will not be sufficient to replace the loaned securities. The lending agent has agreed to indemnify the Portfolio in the case of default of any securities borrower.
A summary of the Portfolio’s transactions surrounding securities lending for the year ended December 31, 2019 is as follows:
Market Value on Loan* | Cash | Market Value | Income from | Government Money Market Portfolio | ||||||||||||||||||
| Income Earned | Advisory Fee Waived | |||||||||||||||||||||
| $ | 41,535,589 | $ | 2,476,611 | $ | 39,896,020 | $ | 28,941 | $ | 398 | $ | 40 | |||||||||||
| * | As of December 31, 2019. |
NOTE F: Capital Stock
Each class consists of 500,000,000 authorized shares. Transactions in capital shares for each class were as follows:
| SHARES | AMOUNT | |||||||||||||||||||
| Year Ended December 31, 2019 | Year Ended December 31, 2018 | Year Ended December 31, 2019 | Year Ended December 31, 2018 | |||||||||||||||||
Class A |
| |||||||||||||||||||
Shares sold | 117,089 | 131,142 | $ | 6,984,405 | $ | 7,751,764 | ||||||||||||||
Shares issued in reinvestment of distributions | 544,009 | 401,687 | 30,469,955 | 23,052,799 | ||||||||||||||||
Shares issued in connection with the Reorganization | 574,265 | –0 | – | 35,749,507 | –0 | – | ||||||||||||||
Shares redeemed | (611,474 | ) | (542,535 | ) | (36,020,088 | ) | (31,574,803 | ) | ||||||||||||
|
|
|
|
|
|
|
| |||||||||||||
Net increase (decrease) | 623,889 | (9,706 | ) | $ | 37,183,779 | $ | (770,240 | ) | ||||||||||||
|
|
|
|
|
|
|
| |||||||||||||
Class B |
| |||||||||||||||||||
Shares sold | 349,243 | 453,785 | $ | 19,217,888 | $ | 25,080,408 | ||||||||||||||
Shares issued in reinvestment of distributions | 744,470 | 498,629 | 39,025,094 | 27,070,582 | ||||||||||||||||
Share issued in connection with the Reorganization | 739,816 | –0 | – | 43,494,004 | –0 | – | ||||||||||||||
Shares redeemed | (658,326 | ) | (608,637 | ) | (36,313,480 | ) | (33,338,740 | ) | ||||||||||||
|
|
|
|
|
|
|
| |||||||||||||
Net increase | 1,175,203 | 343,777 | $ | 65,423,506 | $ | 18,812,250 | ||||||||||||||
|
|
|
|
|
|
|
| |||||||||||||
At December 31, 2019, certain shareholders of the Portfolio owned 66% in aggregate of the Portfolio’s outstanding shares. Significant transactions by such shareholders, if any, may impact the Portfolio’s performance.
NOTE G: Risks Involved in Investing in the Portfolio
Focused Portfolio Risk—Investments in a limited number of companies may have more risk because changes in the value of a single security may have a more significant effect, either negative or positive, on the Portfolio’s net asset value, or NAV.
Foreign(Non-U.S.) Risk—Investments in securities ofnon-U.S. issuers may involve more risk than those of U.S. issuers. These securities may fluctuate more widely in price and may be more difficult to trade or dispose of due to adverse market, economic, political, regulatory or other factors.
16
| AB Variable Products Series Fund | ||
Derivatives Risk—The Portfolio may enter into derivative transactions such as forwards, options, futures and swaps. Derivatives may be illiquid, difficult to price, and leveraged so that small changes may produce disproportionate losses for the Portfolio, and subject to counterparty risk to a greater degree than more traditional investments. Derivatives may result in significant losses, including losses that are far greater than the value of the derivatives reflected on the statement of assets and liabilities.
LIBOR Risk—The Portfolio may invest in certain debt securities, derivatives or other financial instruments that utilize the London Interbank Offered Rate, or “LIBOR,” as a “benchmark” or “reference rate” for various interest rate calculations. In July 2017, the United Kingdom Financial Conduct Authority, which regulates LIBOR, announced a desire to phase out the use of LIBOR by the end of 2021. Although financial regulators and industry working groups have suggested alternative reference rates, such as European Interbank Offer Rate (“EURIBOR”), Sterling Overnight Interbank Average Rate (“SONIA”) and Secured Overnight Financing Rate (“SOFR”), global consensus on alternative rates is lacking and the process for amending existing contracts or instruments to transition away from LIBOR remains unclear. The elimination of LIBOR or changes to other reference rates or any other changes or reforms to the determination or supervision of reference rates could have an adverse impact on the market for, or value of, any securities or payments linked to those reference rates, which may adversely affect the Portfolio’s performance and/or net asset value. Uncertainty and risk also remain regarding the willingness and ability of issuers and lenders to include revised provisions in new and existing contracts or instruments. Consequently, the transition away from LIBOR to other reference rates may lead to increased volatility and illiquidity in markets that are tied to LIBOR, fluctuations in values of LIBOR-related investments or investments in issuers that utilize LIBOR, increased difficulty in borrowing or refinancing and diminished effectiveness of hedging strategies, adversely affecting the Portfolio’s performance. Furthermore, the risks associated with the expected discontinuation of LIBOR and transition may be exacerbated if the work necessary to effect an orderly transition to an alternative reference rate is not completed in a timely manner. Because the usefulness of LIBOR as a benchmark could deteriorate during the transition period, these effects could occur prior to the end of 2021.
Indemnification Risk—In the ordinary course of business, the Portfolio enters into contracts that contain a variety of indemnifications. The Portfolio’s maximum exposure under these arrangements is unknown. However, the Portfolio has not had prior claims or losses pursuant to these indemnification provisions and expects the risk of loss thereunder to be remote. Therefore, the Portfolio has not accrued any liability in connection with these indemnification provisions.
NOTE H: Joint Credit Facility
A number ofopen-end mutual funds managed by the Adviser, including the Portfolio, participate in a $325 million revolving credit facility (the “Facility”) intended to provide short-term financing, if necessary, subject to certain restrictions in connection with abnormal redemption activity. Commitment fees related to the Facility are paid by the participating funds and are included in miscellaneous expenses in the statement of operations. The Portfolio did not utilize the Facility during the year ended December 31, 2019.
NOTE I: Distributions to Shareholders
The tax character of distributions paid during the fiscal years ended December 31, 2019 and December 31, 2018 were as follows:
| 2019 | 2018 | |||||||
Distributions paid from: | ||||||||
Ordinary income | $ | 3,267,073 | $ | 581,143 | ||||
Net long-term capital gains | 66,227,976 | 49,542,238 | ||||||
|
|
|
| |||||
Total taxable distributions | $ | 69,495,049 | $ | 50,123,381 | ||||
|
|
|
| |||||
As of December 31, 2019, the components of accumulated earnings/(deficit) on a tax basis were as follows:
Undistributed ordinary income | $ | 2,683,723 | ||
Undistributed capital gains | 46,542,674 | |||
Unrealized appreciation/(depreciation) | 214,614,118 | (a) | ||
|
| |||
Total accumulated earnings/(deficit) | $ | 263,840,515 | ||
|
|
| (a) | The difference between book-basis andtax-basis unrealized appreciation/(depreciation) is attributable primarily to the tax deferral of losses on wash sales. |
17
| LARGE CAP GROWTH PORTFOLIO | ||
| NOTES TO FINANCIAL STATEMENTS | ||
| (continued) | AB Variable Products Series Fund | |
For tax purposes, net realized capital losses may be carried over to offset future capital gains, if any. Funds are permitted to carry forward capital losses for an indefinite period, and such losses will retain their character as either short-term or long-term capital losses. As of December 31, 2019, the Portfolio did not have any capital loss carryforwards.
During the current fiscal year, permanent differences primarily due to the tax treatment of the Reorganization described in Note J resulted in a net increase in distributable earnings and a net decrease in additional paid-in capital. These reclassifications had no effect on net assets.
NOTE J: Reorganization
At a meeting held on November6-8, 2018, the Board of the Fund approved the acquisition of the assets and assumption of the liabilities of the Acquired Portfolio by the Portfolio, each a series of the Fund. The Portfolios have the same investment objective and similar investment strategies. The Reorganization was completed at the close of business April 26, 2019. Pursuant to the Reorganization, the assets and liabilities of the Acquired Portfolio shares were transferred in exchange for the shares of the same class of the Portfolio, in atax-free exchange as follows:
| Shares outstanding before the Reorganization | Shares outstanding immediately after the Reorganization | Aggregate net assets before the Reorganization | Aggregate net assets immediately after the Reorganization | |||||||||||||
The Acquired Portfolio | 2,572,557 | –0 | – | $ | 79,243,511 | + | $ | –0 | – | |||||||
The Portfolio | 7,930,514 | 9,244,595 | $ | 478,400,346 | ++ | $ | 557,643,857 | |||||||||
| + | Includes accumulated net investment loss of $277,056, accumulated realized gain on investments of $1,407,147 and unrealized appreciation on investments of $25,722,398, with a fair value of $68,435,317 and identified cost of $42,712,919. |
| ++ | Includes accumulated net investment loss of $150,739, accumulated realized gain on investments of $84,360,216 and unrealized appreciation on investments of $159,235,619, with a fair value of $478,656,041 and identified cost of $319,420,422. |
Assuming the acquisition of the Acquired Portfolio had been completed on January 1, 2019, the Portfolio’s pro forma results of operations for the year ended December 31, 2019, are as follows:
Net investment loss | $ | (503,642 | ) | |
Net realized and unrealized gain on investments | 174,866,664 | |||
|
| |||
Net increase in net assets resulting from operations | $ | 174,363,022 | ||
|
|
Because the combined investment portfolios have been managed as a single integrated portfolio since the acquisition was completed, it is not practicable to separate the amounts of revenue and earnings of the Portfolio that have been included in the Portfolio’s Statement of Operations since April 26, 2019.
For financial reporting purposes, assets received and shares issued by the Portfolio were recorded at fair value; however, the cost basis of the investments received from the Acquired Portfolio was carried forward to align ongoing reporting of the Portfolio’s realized and unrealized gains and losses with amounts distributable to shareholders for tax purposes.
NOTE K: Recent Accounting Pronouncements
In August 2018, the Financial Accounting Standards Board issued an Accounting Standards Update, ASU2018-13, Fair Value Measurement (Topic 820), Disclosure Framework—Changes to the Disclosure Requirements for Fair Value Measurement which removes, modifies and adds disclosures to Topic 820. The amendments in this ASU2018-13 (“ASU”) apply to all entities that are required, under existing U.S. GAAP, to make disclosures about recurring or nonrecurring fair value measurements. The amendments in this ASU are effective for all entities for fiscal years, and interim periods within those fiscal years, beginning after December 15, 2019. Management has evaluated the impact of the amendments and elected to early adopt the ASU. The adoption of this ASU did not have a material impact on the disclosure and presentation of the financial statements of the Portfolio.
NOTE L: Subsequent Events
Management has evaluated subsequent events for possible recognition or disclosure in the financial statements through the date the financial statements are issued. Management has determined that there are no material events that would require disclosure in the Portfolio’s financial statements through this date.
18
| LARGE CAP GROWTH PORTFOLIO | ||
| FINANCIAL HIGHLIGHTS | AB Variable Products Series Fund | |
Selected Data For A Share Of Capital Stock Outstanding Throughout Each Period
| CLASS A | ||||||||||||||||||||
| Year Ended December 31, | ||||||||||||||||||||
| 2019 | 2018 | 2017 | 2016 | 2015 | ||||||||||||||||
Net asset value, beginning of period | $51.75 | $56.34 | $45.22 | $49.50 | $48.83 | |||||||||||||||
|
|
|
|
|
|
|
|
|
| |||||||||||
Income From Investment Operations | ||||||||||||||||||||
Net investment income (loss) (a) | .05 | (b) | .02 | (b) | .02 | (b) | (.03 | )(b)† | .02 | |||||||||||
Net realized and unrealized gain on investment transactions | 17.18 | 2.09 | 14.10 | 1.44 | 5.33 | |||||||||||||||
Contributions from Affiliates | –0 | – | –0 | – | –0 | – | .00 | (c) | –0 | – | ||||||||||
|
|
|
|
|
|
|
|
|
| |||||||||||
Net increase in net asset value from operations | 17.23 | 2.11 | 14.12 | 1.41 | 5.35 | |||||||||||||||
|
|
|
|
|
|
|
|
|
| |||||||||||
Less: Distributions | ||||||||||||||||||||
Distributions from net realized gain on investment transactions | (7.72 | ) | (6.70 | ) | (3.00 | ) | (5.69 | ) | (4.68 | ) | ||||||||||
|
|
|
|
|
|
|
|
|
| |||||||||||
Net asset value, end of period | $61.26 | $51.75 | $56.34 | $45.22 | $49.50 | |||||||||||||||
|
|
|
|
|
|
|
|
|
| |||||||||||
Total Return | ||||||||||||||||||||
Total investment return based on net asset value (d)• | 34.70 | % | 2.58 | % | 31.98 | % | 2.63 | %† | 11.11 | % | ||||||||||
Ratios/Supplemental Data | ||||||||||||||||||||
Net assets, end of period (000’s omitted) | $264,234 | $190,899 | $208,392 | $178,136 | $191,568 | |||||||||||||||
Ratio to average net assets of: | ||||||||||||||||||||
Expenses, net of waivers/reimbursements (e)‡ | .67 | % | .68 | % | .70 | % | .85 | % | .82 | % | ||||||||||
Expenses, before waivers/reimbursements (e)‡ | .68 | % | .68 | % | .70 | % | .85 | % | .82 | % | ||||||||||
Net investment income (loss) | .09 | %(b) | .04 | %(b) | .03 | %(b) | (.07 | )%(b)† | .04 | % | ||||||||||
Portfolio turnover rate | 38 | % | 46 | % | 48 | % | 59 | % | 65 | % | ||||||||||
‡ Expense ratios exclude the estimated acquired fund fees of the affiliated/unaffiliated underlying |
| |||||||||||||||||||
portfolios | .01 | % | .00 | % | .00 | % | .00 | % | .00 | % | ||||||||||
| See footnote summary on page 20. |
19
| LARGE CAP GROWTH PORTFOLIO | ||
| FINANCIAL HIGHLIGHTS | ||
| (continued) | AB Variable Products Series Fund | |
Selected Data For A Share Of Capital Stock Outstanding Throughout Each Period
| CLASS B | ||||||||||||||||||||
| Year Ended December 31, | ||||||||||||||||||||
| 2019 | 2018 | 2017 | 2016 | 2015 | ||||||||||||||||
Net asset value, beginning of period | $48.91 | $53.70 | $43.32 | $47.77 | $47.38 | |||||||||||||||
|
|
|
|
|
|
|
|
|
| |||||||||||
Income From Investment Operations | ||||||||||||||||||||
Net investment loss (a) | (.09 | )(b) | (.12 | )(b) | (.11 | )(b) | (.14 | )(b)† | (.10 | ) | ||||||||||
Net realized and unrealized gain on investment transactions | 16.18 | 2.03 | 13.49 | 1.38 | 5.17 | |||||||||||||||
Contributions from Affiliates | –0 | – | –0 | – | –0 | – | .00 | (c) | –0 | – | ||||||||||
|
|
|
|
|
|
|
|
|
| |||||||||||
Net increase in net asset value from operations | 16.09 | 1.91 | 13.38 | 1.24 | 5.07 | |||||||||||||||
|
|
|
|
|
|
|
|
|
| |||||||||||
Less: Distributions | ||||||||||||||||||||
Distributions from net realized gain on investment transactions | (7.72 | ) | (6.70 | ) | (3.00 | ) | (5.69 | ) | (4.68 | ) | ||||||||||
|
|
|
|
|
|
|
|
|
| |||||||||||
Net asset value, end of period | $57.28 | $48.91 | $53.70 | $43.32 | $47.77 | |||||||||||||||
|
|
|
|
|
|
|
|
|
| |||||||||||
Total Return | ||||||||||||||||||||
Total investment return based on net asset value (d)• | 34.37 | % | 2.32 | % | 31.67 | % | 2.36 | %† | 10.86 | % | ||||||||||
Ratios/Supplemental Data | ||||||||||||||||||||
Net assets, end of period (000’s omitted) | $322,688 | $218,027 | $220,934 | $202,903 | $267,171 | |||||||||||||||
Ratio to average net assets of: | ||||||||||||||||||||
Expenses, net of waivers/reimbursements (e)‡ | .92 | % | .93 | % | .95 | % | 1.10 | % | 1.07 | % | ||||||||||
Expenses, before waivers/reimbursements (e)‡ | .93 | % | .93 | % | .95 | % | 1.10 | % | 1.07 | % | ||||||||||
Net investment loss | (.16 | )%(b) | (.21 | )%(b) | (.21 | )%(b) | (.32 | )%(b)† | (.21 | )% | ||||||||||
Portfolio turnover rate | 38 | % | 46 | % | 48 | % | 59 | % | 65 | % | ||||||||||
‡ Expense ratios exclude the estimated acquired fund fees of the affiliated/unaffiliated underlying |
| |||||||||||||||||||
portfolios | .01 | % | .00 | % | .00 | % | .00 | % | .00 | % | ||||||||||
| (a) | Based on average shares outstanding. |
| (b) | Net of expenses waived/reimbursed by the Adviser. |
| (c) | Amount is less than $.005. |
| (d) | Total investment return is calculated assuming an initial investment made at the net asset value at the beginning of the period, reinvestment of all dividends and distributions at net asset value during the period, and redemption on the last day of the period. Total return does not reflect (i) insurance company’s separate account related expense charges and (ii) the deductions of taxes that a shareholder would pay on Portfolio distributions or the redemption of Portfolio shares. Total investment return calculated for a period of less than one year is not annualized. |
| (e) | In connection with the Portfolio’s investments in affiliated underlying portfolios, the Portfolio incurs no direct expenses, but bears proportionate shares of the fees and expenses (i.e., operating, administrative and investment advisory fees) of the affiliated underlying portfolios. The Adviser has contractually agreed to waive its fees from the Portfolio in an amount equal to the Portfolio’s pro rata share of certain acquired fund fees and expenses, and for the year ended December 31, 2019, such waiver amounted to .01%. |
| † | For the year ended December 31, 2016, the amount includes a refund for overbilling of prior years’ custody out of pocket fees as follows: |
Net Investment | Net Investment | Total Return | ||
| $.005 | .01% | .01% |
| • | Includes the impact of proceeds received and credited to the Portfolio resulting from class action settlements, which enhanced the Portfolio’s performance for the years ended December 31, 2019, December 31, 2017, December 31, 2016 and December 31, 2015 by .04%, .03%, .01% and .09%, respectively. |
See notes to financial statements.
20
| REPORT OF INDEPENDENT REGISTERED | ||
| PUBLIC ACCOUNTING FIRM | AB Variable Products Series Fund | |
To the Shareholders and the Board of Directors of AB Large Cap Growth Portfolio:
Opinion on the Financial Statements
We have audited the accompanying statement of assets and liabilities of AB Large Cap Growth Portfolio (the “Portfolio”) (one of the portfolios constituting AB Variable Products Series Fund, Inc. (the “Fund”)), including the portfolio of investments, as of December 31, 2019, and the related statement of operations for the year then ended, the statements of changes in net assets for each of the two years in the period then ended, the financial highlights for each of the five years in the period then ended and the related notes (collectively referred to as the “financial statements”). In our opinion, the financial statements present fairly, in all material respects, the financial position of the Portfolio (one of the portfolios constituting AB Variable Products Series Fund, Inc.) at December 31, 2019, the results of its operations for the year then ended, the changes in its net assets for each of the two years in the period then ended and its financial highlights for each of the five years in the period then ended, in conformity with U.S. generally accepted accounting principles.
Basis for Opinion
These financial statements are the responsibility of the Fund’s management. Our responsibility is to express an opinion on the Portfolio’s financial statements based on our audits. We are a public accounting firm registered with the Public Company Accounting Oversight Board (United States) (“PCAOB”) and are required to be independent with respect to the Fund in accordance with the U.S. federal securities laws and the applicable rules and regulations of the Securities and Exchange Commission and the PCAOB.
We conducted our audits in accordance with the standards of the PCAOB. Those standards require that we plan and perform the audit to obtain reasonable assurance about whether the financial statements are free of material misstatement, whether due to error or fraud. The Fund is not required to have, nor were we engaged to perform, an audit of the Fund’s internal control over financial reporting. As part of our audits, we are required to obtain an understanding of internal control over financial reporting, but not for the purpose of expressing an opinion on the effectiveness of the Fund’s internal control over financial reporting. Accordingly, we express no such opinion.
Our audits included performing procedures to assess the risks of material misstatement of the financial statements, whether due to error or fraud, and performing procedures that respond to those risks. Such procedures included examining, on a test basis, evidence regarding the amounts and disclosures in the financial statements. Our procedures included confirmation of securities owned as of December 31, 2019, by correspondence with the custodian and others or by other appropriate auditing procedures where replies from others were not received. Our audits also included evaluating the accounting principles used and significant estimates made by management, as well as evaluating the overall presentation of the financial statements. We believe that our audits provide a reasonable basis for our opinion.
��

We have served as the auditor of one or more of the AB investment companies since 1968.
New York, New York
February 14, 2020
21
| 2019 TAX INFORMATION(unaudited) | AB Variable Products Series Fund | |
For Federal income tax purposes, the following information is furnished with respect to the distributions paid by the Portfolio during the taxable year ended December 31, 2019. For corporate shareholders, 81.91% of dividends paid qualify for the dividends received deduction.
22
| LARGE CAP GROWTH PORTFOLIO | AB Variable Products Series Fund | |
| BOARD OF DIRECTORS | ||
Marshall C. Turner, Jr.(1),Chairman Jorge A. Bermudez^ Michael J. Downey(1) Nancy P. Jacklin(1) | Robert M. Keith,President and Carol C. McMullen(1) Garry L. Moody(1) Earl D. Weiner(1) | |
| OFFICERS | ||
Frank V. Caruso(2),Vice President John H. Fogarty(2),Vice President Vinay Thapar(2),Vice President Emilie D. Wrapp,Secretary Michael B. Reyes,Senior Analyst | Joseph J. Mantineo,Treasurer and Phyllis J. Clarke,Controller Vincent S. Noto,Chief Compliance Officer | |
CUSTODIAN AND ACCOUNTING AGENT State Street Bank and Trust Company State Street Corporation CCB/5 1 Iron Street Boston, MA 02210 | LEGAL COUNSEL Seward & Kissel LLP One Battery Park Plaza New York, NY 10004 | |
DISTRIBUTOR AllianceBernstein Investments, Inc. 1345 Avenue of the Americas New York, NY 10105 | TRANSFER AGENT AllianceBernstein Investor Services, Inc. P.O. Box 786003 San Antonio, TX 78278-6003 Toll-Free (800)221-5672 | |
INDEPENDENT REGISTERED PUBLIC ACCOUNTING FIRM Ernst & Young LLP 5 Times Square New York, NY 10036 |
| (1) | Member of the Audit Committee, the Governance and Nominating Committee, and the Independent Directors Committee. |
| (2) | Theday-to-day management of, and investment decisions for, the Portfolio’s portfolio are made by the Adviser’s U.S. Large Cap Growth Investment Team. Messrs. Caruso, Fogarty and Thapar are the investment professionals with the most significant responsibility for theday-to-day management of the Portfolio’s portfolio. |
| ^ | Mr. Bermudez will be a member of the Audit Committee, the Governance and Nominating Committee, and the Independent Directors Committee when he joins the Board on January 1, 2020. |
23
| LARGE CAP GROWTH PORTFOLIO | ||
| MANAGEMENT OF THE FUND | AB Variable Products Series Fund | |
Board of Directors Information
The business and affairs of the Fund are managed under the direction of the Board of Directors. Certain information concerning the Fund’s Directors is set forth below.
| NAME, ADDRESS*, AGE AND (YEAR FIRST ELECTED)** | PRINCIPAL OCCUPATION(S), DURING PAST FIVE YEARS AND OTHER INFORMATION*** | PORTFOLIOS IN AB FUND COMPLEX OVERSEEN BY DIRECTOR | OTHER PUBLIC COMPANY DIRECTORSHIPS CURRENTLY HELD BY DIRECTOR | |||||
| INTERESTED DIRECTOR | ||||||||
Robert M. Keith,# New York, NY 10105 59 (2010) | Senior Vice President of AllianceBernstein L.P. (the “Adviser”) and the head of AllianceBernstein Investments, Inc. (“ABI”) since July 2008; Director of ABI and President of the AB Mutual Funds. Previously, he served as Executive Managing Director of ABI from December 2006 to June 2008. Prior to joining ABI in 2006, Executive Managing Director of Bernstein Global Wealth Management, and prior thereto, Senior Managing Director and Global Head of Client Service and Sales of the Adviser’s institutional investment management business since 2004. Prior thereto, he was Managing Director and Head of North American Client Service and Sales in the Adviser’s institutional investment management business with which he had been associated since prior to 2004. | 91 | None | |||||
| INDEPENDENT DIRECTORS | ||||||||
| Marshall C. Turner, Jr.,## Chairman of the Board 78 (2005) | Private Investor since prior to 2015. Former Chairman and CEO of Dupont Photomasks, Inc. (components of semi-conductor manufacturing). He has extensive operating leadership, and venture capital investing experience, including five interim or full-time CEO roles, and prior service as general partner of institutional venture capital partnerships. He also has extensivenon-profit board leadership experience, and currently serves on the boards of two education and science-relatednon-profit organizations. He has served as a director of one AB Fund since 1992, and director or trustee of all AB Funds since 2005. He has been Chairman of the AB Funds since January 2014, and the Chairman of the Independent Directors Committees of such AB Funds since February 2014. | 91 | Xilinx, Inc. (programmable logic semi-conductors) since 2007 | |||||
Jorge A. Bermudez,^ (2020) | Private investor since prior to 2015. Former Chief Risk Officer of Citigroup, Inc., a global financial services company, from November 2007 to March 2008, Chief Executive Officer of Citigroup’s Commercial Business Group in North America and Citibank Texas from 2005 to 2007, and a variety of other executive and leadership roles at various businesses within Citigroup prior to then; Chairman (2018) of the Texas A&M Foundation Board of Trustees (Trustee since 2013) and Chairman of the Smart Grid Center Board at Texas A&M University since 2012; director of, among others, Citibank N.A. from 2005 to 2008, the Federal Reserve Bank of Dallas, Houston Branch from 2009 to 2011, the Federal Reserve Bank of Dallas from 2011 to 2017, and the Electric Reliability Council of Texas from 2010 to 2016. He has served as director or trustee of the AB Funds since 2020. | 91 | Moody’s Corporation since April 2011 | |||||
24
| AB Variable Products Series Fund | ||
| NAME, ADDRESS*, AGE AND (YEAR FIRST ELECTED)** | PRINCIPAL OCCUPATION(S), DURING PAST FIVE YEARS AND OTHER INFORMATION*** | PORTFOLIOS IN AB FUND COMPLEX OVERSEEN BY DIRECTOR | OTHER PUBLIC COMPANY DIRECTORSHIPS CURRENTLY HELD BY DIRECTOR | |||||
INDEPENDENT DIRECTORS (continued) | ||||||||
Michael J. Downey,## (2005) | Private Investor since prior to 2015. Formerly, Chairman of The Asia Pacific Fund, Inc. (registered investment company) since prior to 2015 until January 2019. From 1987 until 1993, Chairman and CEO of Prudential Mutual Fund Management, director of the Prudential mutual funds, and member of the Executive Committee of Prudential Securities, Inc. He has served as a director or trustee of the AB Funds since 2005. | 91 | None | |||||
Nancy P. Jacklin,## (2006) | Private Investor since prior to 2015. Professorial Lecturer at the Johns Hopkins School of Advanced International Studies (2008-2015). U.S. Executive Director of the International Monetary Fund (which is responsible for ensuring the stability of the international monetary system), (December2002-May 2006); Partner, Clifford Chance (1992-2002); Sector Counsel, International Banking and Finance, and Associate General Counsel, Citicorp (1985-1992); Assistant General Counsel (International), Federal Reserve Board of Governors (1982-1985); and Attorney Advisor, U.S. Department of the Treasury (1973-1982). Member of the Bar of the District of Columbia and of New York; and member of the Council on Foreign Relations. She has served as a director or trustee of the AB Funds since 2006 and has been Chair of the Governance and Nominating Committees of the AB Funds since August 2014. | 91 | None | |||||
Carol C. McMullen,## (2016) | Managing Director of Slalom Consulting (consulting) since 2014, private investor and member of the Advisory Board of Butcher Box (since 2018). Formerly, member, Partners Healthcare Investment Committee (2010-2019); Director of Norfolk & Dedham Group (mutual property and casualty insurance) from 2011 until November 2016; Director of Partners Community Physicians Organization (healthcare) from 2014 until December 2016; and Managing Director of The Crossland Group (consulting) from 2012 until 2013. She has held a number of senior positions in the asset and wealth management industries, including at Eastern Bank (where her roles included President of Eastern Wealth Management), Thomson Financial (Global Head of Sales for Investment Management), and Putnam Investments (where her roles included Chief Investment Officer, Core and Growth and Head of Global Investment Research). She has served on a number of private company andnon-profit boards, and as a director or trustee of the AB Funds since June 2016. | 91 | None | |||||
25
| LARGE CAP GROWTH PORTFOLIO | ||
| MANAGEMENT OF THE FUND | ||
| (continued) | AB Variable Products Series Fund | |
| NAME, ADDRESS*, AGE AND (YEAR FIRST ELECTED)** | PRINCIPAL OCCUPATION(S), DURING PAST FIVE YEARS AND OTHER INFORMATION*** | PORTFOLIOS IN AB FUND COMPLEX OVERSEEN BY DIRECTOR | OTHER PUBLIC COMPANY DIRECTORSHIPS CURRENTLY HELD BY DIRECTOR | |||||
INDEPENDENT DIRECTORS (continued) | ||||||||
Garry L. Moody,## (2008) | Formerly, Partner, Deloitte & Touche LLP (1995-2008) where he held a number of senior positions, including Vice Chairman, and U.S. and Global Investment Management Practice Managing Partner; President, Fidelity Accounting and Custody Services Company (1993-1995), where he was responsible for accounting, pricing, custody and reporting for the Fidelity mutual funds; and Partner, Ernst & Young LLP (1975-1993), where he served as the National Director of Mutual Fund Tax Services and Managing Partner of its Chicago Office Tax department. He is a member of the Trustee Advisory Board of BoardIQ, a biweekly publication focused on issues and news affecting directors of mutual funds. He is also a member of the Investment Company Institute’s Board of Governors and the Independent Directors Council Governing Council. He has served as a director or trustee, and as Chairman of the Audit Committees, of the AB Funds since 2008. | 91 | None | |||||
| Earl D. Weiner,## 80 (2007) | Senior Counsel since 2017, Of Counsel from 2007 to 2016, and Partner prior to then, of the law firm Sullivan & Cromwell LLP. He is a former member of the ABA Federal Regulation of Securities Committee Task Force to draft editions of the Fund Director’s Guidebook. He also serves as a director or trustee of variousnon-profit organizations and has served as Chairman or Vice Chairman of a number of them. He has served as a director or trustee of the AB Funds since 2007 and served as Chairman of the Governance and Nominating Committees of the AB Funds from 2007 until August 2014. | 91 | None | |||||
| * | The address for each of the Fund’s disinterested Directors is c/o AllianceBernstein L.P., Attention: Legal and Compliance Department—Mutual Fund Legal, 1345 Avenue of the Americas, New York, NY 10105. |
| ** | There is no stated term of office for the Fund’s Directors. |
| *** | The information above includes each Director’s principal occupation during the last five years and other information relating to the experience, attributes, and skills relevant to each Director’s qualifications to serve as a Director, which led to the conclusion that each Director should serve as a Director for the Fund. |
| # | Mr. Keith is an “interested person” of the Fund, as defined in Section 2(a)(19) of the Investment Company Act of 1940, due to his position as a Senior Vice President of the Adviser. |
| ## | Member of the Audit Committee, the Governance and Nominating Committee, and the Independent Directors Committee. |
| ^ | Mr. Bermudez will be a member of the Audit Committee, the Governance and Nominating Committee, and the Independent Directors Committee when he joins the Board on January 1, 2020. |
26
| AB Variable Products Series Fund | ||
Officer Information
Certain information concerning the Portfolio Officers is listed below.
| NAME, ADDRESS* AND AGE | PRINCIPAL POSITION(S) HELD WITH FUND | PRINCIPAL OCCUPATION DURING PAST FIVE YEARS | ||
Robert M. Keith 59 | President and Chief Executive Officer | See biography above. | ||
Frank V. Caruso 63 | Vice President | Senior Vice President of the Adviser**, with which he has been associated since prior to 2015. He is also Chief Investment Officer of US Growth Equities. | ||
John H. Fogarty 50 | Vice President | Senior Vice President of the Adviser**, with which he has been associated since prior to 2015. | ||
Vinay Thapar 41 | Vice President | Senior Vice President of the Adviser**, with which he was associated since prior to 2015. | ||
Emilie D. Wrapp 64 | Secretary | Senior Vice President, Assistant General Counsel and Assistant Secretary of ABI**, with which she has been associated since prior to 2015. | ||
Michael B. Reyes 43 | Senior Analyst | Vice President of the Adviser**, with which he has been associated since prior to 2015. | ||
Joseph J. Mantineo 60 | Treasurer and Chief Financial Officer | Senior Vice President of AllianceBernstein Investor Services, Inc. (“ABIS”)**, with which he has been associated since prior to 2015. | ||
Phyllis J. Clarke 59 | Controller | Vice President of ABIS**, with which she has been associated since prior to 2015. | ||
Vincent S. Noto 55 | Chief Compliance Officer | Senior Vice President since 2015 and Mutual Fund Chief Compliance Officer of the Adviser** since prior to 2015. | ||
| * | The address for each of the Portfolio’s Officers is 1345 Avenue of the Americas, New York, NY 10105. |
| ** | The Adviser, ABI and ABIS are affiliates of the Fund. |
| The Fund’s Statement of Additional Information (“SAI”) has additional information about the Fund’s Directors and Officers and is available without charge upon request. Contact your financial representative or the Adviser at (800)227-4618, or visit www.abfunds.com, for a free prospectus or SAI. |
27
| LARGE CAP GROWTH PORTFOLIO | ||
| CONTINUANCE DISCLOSURE | AB Variable Products Series Fund | |
INFORMATION REGARDING THE REVIEW AND APPROVAL OF THE FUND’S ADVISORY AGREEMENT
The disinterested directors (the “directors”) of AB Variable Products Series Fund, Inc. (the “Company”) unanimously approved the continuance of the Company’s Advisory Agreement with the Adviser in respect of AB Large Cap Growth Portfolio (the “Fund”) at a meeting held on May7-9, 2019 (the “Meeting”).
Prior to approval of the continuance of the Advisory Agreement, the directors had requested from the Adviser, and received and evaluated, extensive materials. They reviewed the proposed continuance of the Advisory Agreement with the Adviser and with experienced counsel who are independent of the Adviser, who advised on the relevant legal standards. The directors also reviewed additional materials, including comparative analytical data prepared by the Senior Analyst for the Fund. The directors also discussed the proposed continuance in private sessions with counsel.
The directors considered their knowledge of the nature and quality of the services provided by the Adviser to the Fund gained from their experience as directors or trustees of most of the registered investment companies advised by the Adviser, their overall confidence in the Adviser’s integrity and competence they have gained from that experience, the Adviser’s initiative in identifying and raising potential issues with the directors and its responsiveness, frankness and attention to concerns raised by the directors in the past, including the Adviser’s willingness to consider and implement organizational and operational changes designed to improve investment results and the services provided to the AB Funds. The directors noted that they have four regular meetings each year, at each of which they review extensive materials and information from the Adviser, including information on the investment performance of the Fund.
The directors also considered all factors they believed relevant, including the specific matters discussed below. During the course of their deliberations, the directors evaluated, among other things, the reasonableness of the advisory fee. The directors did not identify any particular information that wasall-important or controlling, and different directors may have attributed different weights to the various factors. The directors determined that the selection of the Adviser to manage the Fund and the overall arrangements between the Fund and the Adviser, as provided in the Advisory Agreement, including the advisory fee, were fair and reasonable in light of the services performed, expenses incurred and such other matters as the directors considered relevant in the exercise of their business judgment. The material factors and conclusions that formed the basis for the directors’ determinations included the following:
Nature, Extent and Quality of Services Provided
The directors considered the scope and quality of services provided by the Adviser under the Advisory Agreement, including the quality of the investment research capabilities of the Adviser and the other resources it has dedicated to performing services for the Fund. The directors noted that the Adviser from time to time reviews the Fund’s investment strategies and from time to time proposes changes intended to improve the Fund’s relative or absolute performance for the directors’ consideration. They also noted the professional experience and qualifications of the Fund’s portfolio management team and other senior personnel of the Adviser. The directors also considered that the Advisory Agreement provides that the Fund will reimburse the Adviser for the cost to it of providing certain clerical, accounting, administrative and other services to the Fund by employees of the Adviser or its affiliates. Requests for these reimbursements are made on a quarterly basis and subject to approval by the directors. Reimbursements, to the extent requested and paid, result in a higher rate of total compensation from the Fund to the Adviser than the fee rate stated in the Advisory Agreement. The directors noted that the methodology used to determine the reimbursement amounts had been reviewed by an independent consultant retained by the Fund’s former Senior Officer/Independent Compliance Officer. The quality of administrative and other services, including the Adviser’s role in coordinating the activities of the Fund’s other service providers, also was considered. The directors concluded that, overall, they were satisfied with the nature, extent and quality of services provided to the Fund under the Advisory Agreement.
Costs of Services Provided and Profitability
The directors reviewed a schedule of the revenues and expenses and related notes indicating the profitability of the Fund to the Adviser for calendar years 2017 and 2018 that had been prepared with an expense allocation methodology arrived at in consultation with an independent consultant retained by the Fund’s former Senior Officer/Independent Compliance Officer. The directors noted the assumptions and methods of allocation used by the Adviser in preparing fund-specific profitability data and understood that there are a number of potentially acceptable allocation methodologies for information of this type. The directors noted that the profitability information reflected all revenues and expenses of the Adviser’s relationship with the Fund, including those relating to its subsidiaries that provide transfer agency, distribution and brokerage services to the Fund. The directors recognized that it is difficult to make comparisons of the profitability of the Advisory Agreement with
28
| AB Variable Products Series Fund | ||
the profitability of advisory contracts for unaffiliated funds because comparative information is not generally publicly available and is affected by numerous factors. The directors focused on the profitability of the Adviser’s relationship with the Fund before taxes and distribution expenses. The directors concluded that the Adviser’s level of profitability from its relationship with the Fund was not unreasonable.
Fall-Out Benefits
The directors considered the other benefits to the Adviser and its affiliates from their relationships with the Fund and the underlying fund advised by the Adviser in which the Fund invests, including, but not limited to, benefits relating to soft dollar arrangements (whereby investment advisers receive brokerage and research services from brokers that execute agency transactions for their clients);12b-1 fees and sales charges received by the Fund’s principal underwriter (which is a wholly owned subsidiary of the Adviser) in respect of the Fund’s Class B shares; brokerage commissions paid by the Fund to brokers affiliated with the Adviser; and transfer agency fees paid by the Fund to a wholly owned subsidiary of the Adviser. The directors recognized that the Adviser’s profitability would be somewhat lower without these benefits. The directors understood that the Adviser also might derive reputational and other benefits from its association with the Fund.
Investment Results
In addition to the information reviewed by the directors in connection with the Meeting, the directors receive detailed performance information for the Fund at each regular Board meeting during the year.
At the Meeting, the directors reviewed performance information prepared by an independent service provider (the “15(c) service provider”), showing the performance of the Class A Shares of the Fund against a group of similar funds (“peer group”) and a larger group of similar funds (“peer universe”), each selected by the 15(c) service provider, and information prepared by the Adviser showing performance of the Class A Shares against a broad-based securities market index, in each case for the1-,3-,5- and10-year periods ended February 28, 2019 and (in the case of comparisons with the broad-based securities market index) for the period from inception. Based on their review, the directors concluded that the Fund’s investment performance was acceptable.
Advisory Fees and Other Expenses
The directors considered the advisory fee rate payable by the Fund to the Adviser and information prepared by the 15(c) service provider concerning advisory fee rates payable by other funds in the same category as the Fund at a common asset level. The directors recognized that it is difficult to make comparisons of advisory fees because there are variations in the services that are included in the fees paid by other funds. The directors compared the Fund’s contractual effective advisory fee rate with a peer group median and took into account the impact on the advisory fee rate of the administrative expense reimbursement paid to the Adviser in the latest fiscal year.
The directors also considered the Adviser’s fee schedule for other clients pursuing an investment strategy similar to the Fund’s. For this purpose, they reviewed the relevant advisory fee information from the Adviser’s Form ADV and in a report from the Fund’s Senior Analyst and noted the differences between the Fund’s fee schedule, on the one hand, and the Adviser’s institutional fee schedule and the schedule of fees charged by the Adviser to any offshore funds and for services to anysub-advised funds pursuing an investment strategy similar to the Fund’s, on the other. The directors noted that the Adviser may, in some cases, agree to fee rates with large institutional clients that are lower than those reviewed by the directors and that they had previously discussed with the Adviser its policies in respect of such arrangements. The directors previously discussed these matters with an independent fee consultant. The directors also compared the advisory fee rate for the Fund with those for two other funds advised by the Adviser with a similar investment strategy.
The Adviser reviewed with the directors the significantly greater scope of the services it provides to the Fund relative to institutional, offshore fund andsub-advised fund clients. In this regard, the Adviser noted, among other things, that, compared to institutional and offshore orsub-advisory accounts, the Fund (i) demands considerably more portfolio management, research and trading resources due to significantly higher daily cash flows; (ii) has more tax and regulatory restrictions and compliance obligations; (iii) must prepare and file or distribute regulatory and other communications about fund operations; and (iv) must provide shareholder servicing to retail investors. The Adviser also reviewed the greater legal risks presented by the large and changing population of Fund shareholders who may assert claims against the Adviser in individual or class actions, and the greater entrepreneurial risk in offering new fund products, which require substantial investment to launch, may not succeed, and generally must be priced to compete with larger, more established funds resulting in lack of profitability to the Adviser until a new fund achieves scale. In light of the substantial differences in services rendered by the
29
| LARGE CAP GROWTH PORTFOLIO | ||
| CONTINUANCE DISCLOSURE | ||
| (continued) | AB Variable Products Series Fund | |
Adviser to institutional, offshore fund andsub-advised fund clients as compared to the Fund, and the different risk profile, the directors considered these fee comparisons inapt and did not place significant weight on them in their deliberations.
In connection with their review of the Fund’s advisory fee, the directors also considered the total expense ratio of the Class A shares of the Fund in comparison to a peer group and a peer universe selected by the 15(c) service provider. The Class A expense ratio of the Fund was based on the Fund’s latest fiscal year. The directors noted that it was likely that the expense ratios of some of the other funds in the Fund’s category were lowered by waivers or reimbursements by those funds’ investment advisers, which in some cases might be voluntary or temporary. The directors view expense ratio information as relevant to their evaluation of the Adviser’s services because the Adviser is responsible for coordinating services provided to the Fund by others. Based on their review, the directors concluded that the Fund’s expense ratio was acceptable.
Economies of Scale
The directors noted that the advisory fee schedule for the Fund contains breakpoints that reduce the fee rates on assets above specified levels. The directors took into consideration prior presentations by an independent consultant on economies of scale in the mutual fund industry and for the AB Funds, and presentations from time to time by the Adviser concerning certain of its views on economies of scale. The directors also previously discussed economies of scale with an independent fee consultant. The directors also had requested and received from the Adviser certain updates on economies of scale in advance of the Meeting. The directors believe that economies of scale may be realized (if at all) by the Adviser across a variety of products and services, and not only in respect of a single fund. The directors noted that there is no established methodology for setting breakpoints that give effect to the fund-specific services provided by a fund’s adviser and to the economies of scale that an adviser may realize in its overall mutual fund business or those components of it which directly or indirectly affect a fund’s operations. The directors observed that in the mutual fund industry as a whole, as well as among funds similar to the Fund, there is no uniformity or pattern in the fees and asset levels at which breakpoints (if any) apply. The directors also noted that the advisory agreements for many funds do not have breakpoints at all. Having taken these factors into account, the directors concluded that the Fund’s shareholders would benefit from a sharing of economies of scale in the event the Fund’s net assets exceed a breakpoint in the future.
30
VPS-LCG-0151-1219
DEC 12.31.19

ANNUAL REPORT
AB VARIABLE PRODUCTS SERIES FUND, INC.
| + | SMALL CAP GROWTH PORTFOLIO |
Beginning on May 1, 2021, as permitted by regulations adopted by the Securities and Exchange Commission, you may not be receiving paper copies of the Portfolio’s shareholder reports from the insurance company that offers your contract unless you specifically request paper copies from the insurance company or from your financial intermediary. Instead of delivering paper copies of the reports, the insurance company may choose to make the reports available on a website, and will notify you by mail each time a report is posted and provide you with a website link to access the report. Instructions for requesting paper copies will be provided by your insurance company.
If you already elected to receive shareholder reports electronically, you will not be affected by this change and you need not take any action. You may elect to receive shareholder reports and other communications from the insurance company or your financial intermediary electronically by following the instructions provided by the insurance company or by contacting your financial intermediary.
You may elect to receive all future reports in paper free of charge from the insurance company. You can inform the insurance company or your financial intermediary that you wish to continue receiving paper copies of your shareholder reports by following the instructions provided by the insurance company or by contacting your financial intermediary. Your election to receive reports in paper will apply to all portfolio companies available under your contract with the insurance company.
Investment Products Offered
| • | Are Not FDIC Insured |
| • | May Lose Value |
| • | Are Not Bank Guaranteed |
AllianceBernstein Investments, Inc. (ABI) is the distributor of the AB family of mutual funds. ABI is a member of FINRA and is an affiliate of AllianceBernstein L.P., the Adviser of the funds.
You may obtain a description of the Fund’s proxy voting policies and procedures, and information regarding how the Fund voted proxies relating to portfolio securities during the most recent12-month period ended June 30, without charge. Simply visit AB’s website at www.abfunds.com or go to the Securities and Exchange Commission’s (the “Commission”) website at www.sec.gov, or call AB at (800) 227 4618.
The Fund files its complete schedule of portfolio holdings with the Commission for the first and third quarters of each fiscal year as an exhibit to its reports on Form N-PORT. The Fund’s Form N-PORT reports are available on the Commission’s website at www.sec.gov. The Fund’s Forms N-PORT may also be reviewed and copied at the Commission’s Public Reference Room in Washington, DC; information on the operation of the Public Reference Room may be obtained by calling (800) SEC 0330.
The [A/B] logo is a registered service mark of AllianceBernstein and AllianceBernstein® is a registered service mark used by permission of the owner, AllianceBernstein L.P.
| SMALL CAP GROWTH PORTFOLIO | AB Variable Products Series Fund | |
LETTER TO INVESTORS
February 14, 2020
The following is an update of AB Variable Products Series Fund—Small Cap Growth Portfolio (the “Portfolio”) for the annual reporting period ended December 31, 2019.
INVESTMENT OBJECTIVES AND POLICIES
The Portfolio’s investment objective is long-term growth of capital. The Portfolio invests primarily in a diversified portfolio of equity securities with relatively smaller capitalizations as compared to the overall US market. Under normal circumstances, the Portfolio invests at least 80% of its net assets in equity securities of smaller companies. For these purposes, “smaller companies” are those that, at the time of investment, fall within the lowest 20% of the total US equity market capitalization (excluding, for purposes of this calculation, companies with market capitalizations of less than $10 million). Because the Portfolio’s definition of smaller companies is dynamic, the limits on market capitalization will change with the markets.
The Portfolio may invest in any company and industry and in any type of equity security with potential for capital appreciation. It invests in well-known and established companies and in new and less-seasoned companies. The Portfolio’s investment policies emphasize investments in companies that are demonstrating improving financial results and a favorable earnings outlook. The Portfolio may invest in foreign securities.
The Portfolio invests primarily in equity securities but may also invest in other types of securities, such as preferred stocks. The Portfolio may, at times, invest in shares of exchange-traded funds (“ETFs”) in lieu of making direct investments in securities. ETFs may provide more efficient and economical exposure to the types of companies and geographic locations in which the Portfolio seeks to invest than direct investments. The Portfolio may also invest up to 20% of its total assets in rights or warrants.
The Portfolio may enter into derivatives transactions, such as options, futures contracts, forwards and swaps. The Portfolio may use options strategies involving the purchase and/or writing of various combinations of call and/or put options, including on individual securities and stock indices, futures contracts (including futures contracts on individual securities and stock indices) or shares of ETFs. These transactions may be used, for example, in an effort to earn extra income, to adjust exposure to individual securities or markets, or to protect all or a portion of the Portfolio’s portfolio from a decline in value, sometimes within certain ranges.
INVESTMENT RESULTS
The table on page 3 shows the Portfolio’s performance compared to its benchmark, the Russell 2000 Growth Index, for theone-, five- and10-year periods ended December 31, 2019.
All share classes of the Portfolio outperformed the benchmark for the annual period. Security selection drove outperformance, relative to the benchmark, led by selection within the health care and financials sectors. Selection within materials and energy detracted marginally. Sector selection detracted modestly, as the drag from modest cash balances offset gains from an underweight to communication services.
The Portfolio did not utilize derivatives during the annual period.
MARKET REVIEW AND INVESTMENT STRATEGY
US and international stocks recorded strong double-digit returns while emerging markets also rallied during the annual period ended December 31, 2019. After declining sharply at the end of 2018, equity markets rebounded dramatically in January as strong corporate earnings and optimism about a trade truce between the US and China calmed investors.Trade-war tensions resurfaced, however, and emerging geopolitical pressures drove market volatility. Tariff wars, restrictive monetary policy and a decline in industrial production stoked recessionary fears throughout the global economy. In response, the world’s central banks implemented accommodative monetary policies to help support capital markets. Late in the third quarter, equity market performance was accompanied by a sharp style rotation in the US. Quality-growth and lower-volatility stocks, which had been strong performers, lagged and value stocks outperformed. However, for the most part, growth stocks continued to outperform value over the entire period. From a market-capitalization perspective,large-cap stocks outperformed theirsmall-cap peers. In December, equity markets rallied on news that the US and China had agreed to a preliminaryphase-one trade deal due to be signed in January 2020.
The Portfolio continues to be built from the bottom up, with an emphasis on companies that can deliver fundamental outperformance. The Portfolio remains overweight in secular growth companies that have unique drivers or company-specific initiatives to support their future earnings growth, regardless of the macro backdrop. At the end of the reporting period, consumer/commercial services reflected the Portfolio’s largest overweight, with financial services the largest underweight.
1
SMALL CAP GROWTH PORTFOLIO | ||
| DISCLOSURES AND RISKS | AB Variable Products Series Fund | |
Benchmark Disclosure
The Russell 2000® Growth Index is unmanaged and does not reflect fees and expenses associated with the active management of a mutual fund portfolio.The Russell 2000 Growth Index represents the performance ofsmall-cap growth companies within the US. An investor cannot invest directly in an index, and its results are not indicative of the performance for any specific investment, including the Portfolio.
A Word About Risk
Market Risk:The value of the Portfolio’s assets will fluctuate as the stock or bond market fluctuates. The value of its investments may decline, sometimes rapidly and unpredictably, simply because of economic changes or other events that affect large portions of the market. It includes the risk that a particular style of investing, such as the Portfolio’s growth approach, may underperform the market generally.
Capitalization Risk:Investments in small- andmid-capitalization companies may be more volatile than investments in large-capitalization companies. Investments in small-capitalization companies may have additional risks because these companies have limited product lines, markets or financial resources.
Foreign(Non-US) Risk:Investments in securities ofnon-US issuers may involve more risk than those of US issuers. These securities may fluctuate more widely in price and may be more difficult to trade or dispose of due to adverse market, economic, political, regulatory or other factors.
Derivatives Risk:Derivatives may be difficult to price or unwind and leveraged so that small changes may produce disproportionate losses for the Portfolio. Derivatives may also be subject to counterparty risk to a greater degree than more traditional investments.
Management Risk:The Portfolio is subject to management risk because it is an actively managed investment fund. The Adviser will apply its investment techniques and risk analyses in making investment decisions for the Portfolio, but there is no guarantee that its techniques will produce the intended results.
These risks are fully discussed in the Variable Products prospectus. As with all investments, you may lose money by investing in the Portfolio.
An Important Note About Historical Performance
The investment return and principal value of an investment in the Portfolio will fluctuate, so that shares, when redeemed, may be worth more or less than their original cost. Performance shown in this report represents past performance and does not guarantee future results. Current performance may be lower or higher than the performance information shown. Please contact your financial advisor or insurance agent representative at your financial institution to obtain portfolio performance information current to the most recent month end.
Investors should consider the investment objectives, risks, charges and expenses of the Portfolio carefully before investing. For additional copies of the Portfolio’s prospectus or summary prospectus, which contains this and other information, call your financial advisor or (800) 227 4618. Please read the prospectus and/or summary prospectus carefully before investing.
All fees and expenses related to the operation of the Portfolio have been deducted, but no adjustment has been made for insurance company separate account or annuity contract charges, which would reduce total return to a contract owner. Performance assumes reinvestment of distributions and does not account for taxes.
There are additional fees and expenses associated with all Variable Products. These fees can include mortality and expense risk charges, administrative charges, and other charges that can significantly reduce investment returns. Those fees and expenses are not reflected in this annual report. You should consult your Variable Products prospectus for a description of those fees and expenses and speak to your insurance agent or financial representative if you have any questions. You should read the prospectus before investing or sending money.
2
| SMALL CAP GROWTH PORTFOLIO | ||
| HISTORICAL PERFORMANCE | AB Variable Products Series Fund | |
THE PORTFOLIO VS. ITS BENCHMARK | Net Asset Value Returns | |||||||||||
| PERIODS ENDED DECEMBER 31, 2019 (unaudited) | 1 Year | 5 Years1 | 10 Years1 | |||||||||
| Small Cap Growth Portfolio Class A | 36.40% | 13.77% | 16.19% | |||||||||
| Small Cap Growth Portfolio Class B | 36.01% | 13.48% | 15.90% | |||||||||
| Russell 2000 Growth Index | 28.48% | 9.34% | 13.01% | |||||||||
1 Average annual returns. | ||||||||||||
Please keep in mind that high, double-digit returns are highly unusual and cannot be sustained. Investors should also be aware that these returns were primarily achieved during favorable market conditions. |
| |||||||||||
The Portfolio’s current prospectus fee table shows the Portfolio’s total annual operating expense ratios as 1.15% and 1.40% for Class A and Class B shares, respectively, gross of any fee waivers or expense reimbursements. Contractual fee waivers and/or expense reimbursements limit the Portfolio’s annual operating expense ratios exclusive of expenses associated with acquired fund fees and expenses other than the advisory fees of any AB mutual funds in which the Portfolio may invest, interest expense, taxes, extraordinary expenses, and brokerage commissions and other transaction costs to 0.90% and 1.15% for Class A and Class B shares, respectively. These waivers/reimbursements may not be terminated before May 1, 2020 and may be extended by the Adviser for additionalone-year terms. Absent reimbursements or waivers, performance would have been lower. The Financial Highlights section of this report sets forth expense ratio data for the current reporting period; the expense ratios shown above may differ from the expense ratios in the Financial Highlights section since they are based on different time periods.
GROWTH OF A $10,000 INVESTMENT
12/31/2009 to 12/31/2019 (unaudited)
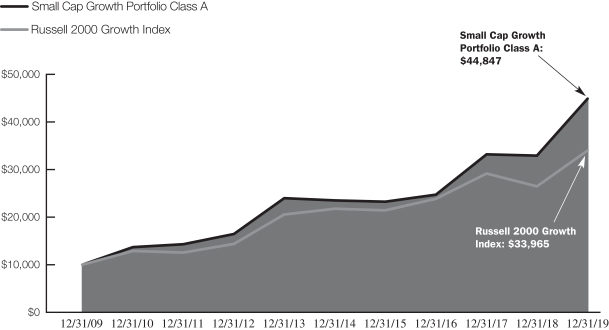
This chart illustrates the total value of an assumed $10,000 investment in Small Cap Growth Portfolio Class A shares (from 12/31/2009 to 12/31/2019) as compared to the performance of the Portfolio’s benchmark. The chart assumes the reinvestment of dividends and capital gains distributions.
See Disclosures, Risks and Note about Historical Performance on page 2.
3
| SMALL CAP GROWTH PORTFOLIO | ||
| EXPENSE EXAMPLE (unaudited) | AB Variable Products Series Fund | |
As a shareholder of the Portfolio, you incur two types of costs: (1) transaction costs, including sales charges (loads) on purchase payments, contingent deferred sales charges on redemptions and (2) ongoing costs, including management fees; distribution(12b-1) fees; and other Portfolio expenses. This example is intended to help you understand your ongoing costs (in dollars) of investing in the Portfolio and to compare these costs with the ongoing costs of investing in other mutual funds.
The Example is based on an investment of $1,000 invested at the beginning of the period and held for the entire period as indicated below.
Actual Expenses
The table below provides information about actual account values and actual expenses. You may use the information in this line, together with the amount you invested, to estimate the expenses that you paid over the period. Simply divide your account value by $1,000 (for example, an $8,600 account value divided by $1,000 = 8.6), then multiply the result by the number in the first line under the heading entitled “Expenses Paid During Period” to estimate the expenses you paid on your account during this period. The estimate of expenses does not include fees or other expenses of any variable insurance product. If such expenses were included, the estimate of expenses you paid during the period would be higher and your ending account value would be lower.
Hypothetical Example for Comparison Purposes
The table below provides information about hypothetical account values and hypothetical expenses based on the Portfolio’s actual expense ratio and an assumed annual rate of return of 5% before expenses, which is not the Portfolio’s actual return. The hypothetical account values and expenses may not be used to estimate the actual ending account balance or expenses you paid for the period. You may use this information to compare the ongoing costs of investing in the Portfolio and other funds by comparing this 5% hypothetical example with the 5% hypothetical examples that appear in the shareholder reports of other funds. The estimate of expenses does not include fees or other expenses of any variable insurance product. If such expenses were included, the estimate of expenses you paid during the period would be higher and your ending account value would be lower.
Please note that the expenses shown in the table are meant to highlight your ongoing costs only and do not reflect any transactional costs, such as sales charges (loads), or contingent deferred sales charges on redemptions. Therefore, the second line of each classes’ table is useful in comparing ongoing costs only, and will not help you determine the relative total costs of owning different funds. In addition, if these transactional costs were included, your costs would have been higher.
| Beginning Account Value July 1, 2019 | Ending Account Value December 31, 2019 | Expenses Paid During Period* | Annualized Expense Ratio* | |||||||||||||
Class A | ||||||||||||||||
Actual | $ | 1,000 | $ | 1,043.60 | $ | 4.64 | 0.90 | % | ||||||||
Hypothetical (5% annual return before expenses) | $ | 1,000 | $ | 1,020.67 | $ | 4.58 | 0.90 | % | ||||||||
Class B | ||||||||||||||||
Actual | $ | 1,000 | $ | 1,041.90 | $ | 5.92 | 1.15 | % | ||||||||
Hypothetical (5% annual return before expenses) | $ | 1,000 | $ | 1,019.41 | $ | 5.85 | 1.15 | % | ||||||||
| * | Expenses are equal to each classes’ annualized expense ratios, multiplied by the average account value over the period, multiplied by 184/365 (to reflect theone-half year period). |
4
SMALL CAP GROWTH PORTFOLIO | ||
| TEN LARGEST HOLDINGS1 | ||
| December 31, 2019 (unaudited) | AB Variable Products Series Fund | |
| COMPANY | U.S. $ VALUE | PERCENT OF NET ASSETS | ||||||
Silicon Laboratories, Inc. | $ | 1,548,797 | 2.0 | % | ||||
Teladoc Health, Inc. | 1,454,217 | 1.8 | ||||||
Axon Enterprise, Inc. | 1,390,854 | 1.8 | ||||||
LHC Group, Inc. | 1,381,733 | 1.8 | ||||||
Freshpet, Inc. | 1,299,448 | 1.7 | ||||||
Chegg, Inc. | 1,285,528 | 1.6 | ||||||
Trupanion, Inc. | 1,246,631 | 1.6 | ||||||
Strategic Education, Inc. | 1,233,064 | 1.6 | ||||||
Five9, Inc. | 1,219,919 | 1.6 | ||||||
Chefs’ Warehouse, Inc. (The) | 1,190,595 | 1.5 | ||||||
|
|
|
| |||||
| $ | 13,250,786 | 17.0 | % | |||||
SECTOR BREAKDOWN2 December 31, 2019 (unaudited)
|
| |||||||
| ||||||||
| SECTOR | U.S. $ VALUE | PERCENT OF TOTAL INVESTMENTS | ||||||
Health Care | $ | 20,454,262 | 26.1 | % | ||||
Information Technology | 16,397,307 | 21.0 | ||||||
Industrials | 15,342,455 | 19.6 | ||||||
Consumer Discretionary | 12,702,415 | 16.2 | ||||||
Financials | 6,272,104 | 8.0 | ||||||
Consumer Staples | 3,360,774 | 4.3 | ||||||
Materials | 1,642,369 | 2.1 | ||||||
Energy | 457,489 | 0.6 | ||||||
Short-Term Investments | 1,604,109 | 2.1 | ||||||
|
|
|
| |||||
Total Investments | $ | 78,233,284 | 100.0 | % | ||||
| 1 | Long-term investments. |
| 2 | The Portfolio’s sector breakdown is expressed as a percentage of total investments (excluding security lending collateral) and may vary over time. |
Please note: The sector classifications presented herein are based on the Global Industry Classification Standard (GICS) which was developed by Morgan Stanley Capital International and Standard & Poor’s. The components are divided into sector, industry group, and industrysub-indices as classified by the GICS for each of the market capitalization indices in the broad market. These sector classifications are broadly defined. The “Portfolio of Investments” section of the report reflects more specific industry information and is consistent with the investment restrictions discussed in the Portfolio’s prospectus.
5
| SMALL CAP GROWTH PORTFOLIO | ||
| PORTFOLIO OF INVESTMENTS | ||
| December 31, 2019 | AB Variable Products Series Fund | |
| Company | Shares | U.S. $ Value | ||||||
COMMON STOCKS–98.1% | ||||||||
HEALTH CARE–26.2% | ||||||||
BIOTECHNOLOGY–12.0% | ||||||||
Aimmune Therapeutics, | 15,243 | $ | 510,183 | |||||
Allakos, Inc.(a)(b) | 4,708 | 448,955 | ||||||
Allogene Therapeutics, | 13,291 | 345,300 | ||||||
Arena Pharmaceuticals, Inc.(b) | 8,260 | 375,169 | ||||||
Ascendis Pharma A/S (Sponsored ADR)(b) | 4,001 | 556,619 | ||||||
BeiGene Ltd. (Sponsored ADR)(b) | 2,177 | 360,860 | ||||||
Biohaven Pharmaceutical Holding Co., Ltd.(b) | 11,736 | 638,908 | ||||||
Blueprint Medicines Corp.(a)(b) | 8,612 | 689,907 | ||||||
Coherus Biosciences, Inc.(b) | 12,850 | 231,364 | ||||||
Deciphera Pharmaceuticals, | 9,470 | 589,413 | ||||||
Gossamer Bio, Inc.(a)(b) | 12,750 | 199,283 | ||||||
Invitae Corp.(a)(b) | 26,230 | 423,090 | ||||||
Iovance Biotherapeutics, Inc.(b) | 24,760 | 685,357 | ||||||
Madrigal Pharmaceuticals, Inc.(a)(b) | 2,530 | 230,508 | ||||||
Neurocrine Biosciences, Inc.(b) | 5,460 | 586,895 | ||||||
NextCure, Inc.(b) | 7,641 | 430,418 | ||||||
Precision BioSciences, Inc.(a)(b) | 10,450 | 145,151 | ||||||
Ra Pharmaceuticals, Inc.(b) | 4,610 | 216,347 | ||||||
Stemline Therapeutics, Inc.(a)(b) | 30,365 | 322,780 | ||||||
Turning Point Therapeutics, Inc.–Class I(a)(b) | 7,991 | 497,759 | ||||||
Ultragenyx Pharmaceutical, Inc.(a)(b) | 11,893 | 507,950 | ||||||
Y-mAbs Therapeutics, Inc.(b) | 12,415 | 387,969 | ||||||
|
| |||||||
| 9,380,185 | ||||||||
|
| |||||||
HEALTH CARE | ||||||||
Insulet Corp.(a)(b) | 4,740 | 811,488 | ||||||
iRhythm Technologies, Inc.(a)(b) | 13,318 | 906,823 | ||||||
Penumbra, Inc.(a)(b) | 4,843 | 795,559 | ||||||
Silk Road Medical, Inc.(b) | 22,639 | 914,163 | ||||||
Tactile Systems Technology, Inc.(b) | 16,399 | 1,107,096 | ||||||
|
| |||||||
| 4,535,129 | ||||||||
|
| |||||||
HEALTH CARE PROVIDERS & | ||||||||
Guardant Health, Inc.(b) | 10,322 | 806,561 | ||||||
LHC Group, Inc.(a)(b) | 10,030 | 1,381,733 | ||||||
|
| |||||||
| 2,188,294 | ||||||||
|
| |||||||
| Company | Shares | U.S. $ Value | ||||||
HEALTH CARE TECHNOLOGY–2.4% | ||||||||
Health Catalyst, Inc.(a)(b) | 11,052 | $ | 383,504 | |||||
Teladoc Health, Inc.(a)(b) | 17,370 | 1,454,217 | ||||||
|
| |||||||
| 1,837,721 | ||||||||
|
| |||||||
LIFE SCIENCES TOOLS & | ||||||||
10X Genomics, Inc.(b) | 6,669 | 508,511 | ||||||
ICON PLC(b) | 6,207 | 1,069,032 | ||||||
|
| |||||||
| 1,577,543 | ||||||||
|
| |||||||
PHARMACEUTICALS–1.2% | ||||||||
Aerie Pharmaceuticals, Inc.(a)(b) | 8,475 | 204,841 | ||||||
Axsome Therapeutics, Inc.(a)(b) | 3,410 | 352,457 | ||||||
GW Pharmaceuticals PLC (Sponsored ADR)(a)(b) | 1,408 | 147,220 | ||||||
Revance Therapeutics, Inc.(a)(b) | 14,225 | 230,872 | ||||||
|
| |||||||
| 935,390 | ||||||||
|
| |||||||
| 20,454,262 | ||||||||
|
| |||||||
INFORMATION TECHNOLOGY–21.0% | ||||||||
COMMUNICATIONS | ||||||||
Ciena Corp.(b) | 13,205 | 563,722 | ||||||
|
| |||||||
ELECTRONIC EQUIPMENT, INSTRUMENTS & | ||||||||
Littelfuse, Inc. | 4,360 | 834,068 | ||||||
Novanta, Inc.(b) | 12,750 | 1,127,610 | ||||||
OSI Systems, Inc.(b) | 9,680 | 975,163 | ||||||
|
| |||||||
| 2,936,841 | ||||||||
|
| |||||||
IT SERVICES–0.2% | ||||||||
International Money Express, Inc.(b) | 12,661 | 152,438 | ||||||
|
| |||||||
SEMICONDUCTORS & SEMICONDUCTOR EQUIPMENT–6.7% | ||||||||
Cree, Inc.(b) | 7,791 | 359,555 | ||||||
Inphi Corp.(b) | 14,960 | 1,107,339 | ||||||
Lattice Semiconductor Corp.(b) | 57,262 | 1,095,995 | ||||||
Monolithic Power Systems, Inc. | 6,221 | 1,107,462 | ||||||
Silicon Laboratories, Inc.(b) | 13,354 | 1,548,797 | ||||||
|
| |||||||
| 5,219,148 | ||||||||
|
| |||||||
SOFTWARE–9.6% | ||||||||
Anaplan, Inc.(b) | 15,729 | 824,200 | ||||||
Aspen Technology, Inc.(b) | 8,529 | 1,031,412 | ||||||
Avalara, Inc.(b) | 10,340 | 757,405 | ||||||
Everbridge, Inc.(a)(b) | 13,280 | 1,036,902 | ||||||
Five9, Inc.(b) | 18,602 | 1,219,919 | ||||||
HubSpot, Inc.(b) | 4,960 | 786,160 | ||||||
Rapid7, Inc.(b) | 17,390 | 974,188 | ||||||
6
| AB Variable Products Series Fund | ||
| Company | Shares | U.S. $ Value | ||||||
Smartsheet, Inc.–Class A(b) | 16,448 | $ | 738,844 | |||||
Trade Desk, Inc. | 601 | 156,128 | ||||||
|
| |||||||
| 7,525,158 | ||||||||
|
| |||||||
| 16,397,307 | ||||||||
|
| |||||||
INDUSTRIALS–19.6% | ||||||||
AEROSPACE & | ||||||||
Axon Enterprise, Inc.(a)(b) | 18,980 | 1,390,854 | ||||||
Hexcel Corp. | 11,364 | 833,095 | ||||||
Mercury Systems, Inc.(b) | 17,090 | 1,181,090 | ||||||
|
| |||||||
| 3,405,039 | ||||||||
|
| |||||||
BUILDING PRODUCTS–2.4% | ||||||||
Armstrong World Industries, Inc. | 7,771 | 730,241 | ||||||
Trex Co., Inc.(a)(b) | 12,963 | 1,165,114 | ||||||
|
| |||||||
| 1,895,355 | ||||||||
|
| |||||||
COMMERCIAL SERVICES & SUPPLIES–1.4% | ||||||||
Tetra Tech, Inc. | 13,025 | 1,122,234 | ||||||
|
| |||||||
INDUSTRIAL CONGLOMERATES–1.1% | ||||||||
Carlisle Cos., Inc. | 5,442 | 880,733 | ||||||
|
| |||||||
MACHINERY–5.5% | ||||||||
Chart Industries, Inc.(b) | 17,378 | 1,172,841 | ||||||
Gardner Denver Holdings, Inc.(a)(b) | 21,489 | 788,217 | ||||||
ITT, Inc. | 8,000 | 591,280 | ||||||
Nordson Corp. | 5,450 | 887,478 | ||||||
RBC Bearings, Inc.(b) | 5,213 | 825,426 | ||||||
|
| |||||||
| 4,265,242 | ||||||||
|
| |||||||
ROAD & RAIL–2.4% | ||||||||
Knight-Swift Transportation Holdings, Inc.(a) | 23,347 | 836,757 | ||||||
Saia, Inc.(a)(b) | 11,200 | �� | 1,042,944 | |||||
|
| |||||||
| 1,879,701 | ||||||||
|
| |||||||
TRADING COMPANIES & DISTRIBUTORS–2.4% | ||||||||
H&E Equipment Services, Inc. | 23,966 | 801,184 | ||||||
SiteOne Landscape Supply, Inc.(a)(b) | 12,057 | 1,092,967 | ||||||
|
| |||||||
| 1,894,151 | ||||||||
|
| |||||||
| 15,342,455 | ||||||||
|
| |||||||
CONSUMER | ||||||||
DISTRIBUTORS–1.2% | ||||||||
Pool Corp. | 4,457 | 946,577 | ||||||
|
| |||||||
DIVERSIFIED CONSUMER SERVICES–4.7% | ||||||||
Bright Horizons Family Solutions, Inc.(b) | 7,385 | 1,109,892 | ||||||
Chegg, Inc.(b) | 33,910 | 1,285,528 | ||||||
Strategic Education, Inc. | 7,760 | 1,233,064 | ||||||
|
| |||||||
| 3,628,484 | ||||||||
|
| |||||||
| Company | Shares | U.S. $ Value | ||||||
HOTELS, RESTAURANTS & LEISURE–3.8% | ||||||||
OneSpaWorld Holdings Ltd.(a)(b) | 48,630 | $ | 818,929 | |||||
Planet Fitness, Inc.(b) | 15,726 | 1,174,418 | ||||||
Wingstop, Inc. | 11,656 | 1,005,097 | ||||||
|
| |||||||
| 2,998,444 | ||||||||
|
| |||||||
HOUSEHOLD | ||||||||
Lovesac Co. (The)(a)(b) | 25,592 | 410,751 | ||||||
Skyline Champion Corp.(b) | 30,771 | 975,441 | ||||||
|
| |||||||
| 1,386,192 | ||||||||
|
| |||||||
INTERNET & DIRECT MARKETING | ||||||||
RealReal, Inc. (The)(a)(b) | 39,335 | 741,465 | ||||||
|
| |||||||
SPECIALTY RETAIL–3.8% | ||||||||
Dynatrace, Inc.(b) | 32,501 | 822,275 | ||||||
Five Below, Inc.(b) | 8,412 | 1,075,559 | ||||||
Sleep Number Corp.(b) | 22,409 | 1,103,419 | ||||||
|
| |||||||
| 3,001,253 | ||||||||
|
| |||||||
| 12,702,415 | ||||||||
|
| |||||||
FINANCIALS–8.0% | ||||||||
BANKS–1.2% | ||||||||
Western Alliance Bancorp | 16,472 | 938,904 | ||||||
|
| |||||||
CAPITAL MARKETS–4.3% | ||||||||
Assetmark Financial Holdings, Inc.(b) | 20,851 | 605,096 | ||||||
Hamilton Lane, Inc.–Class A | 16,717 | 996,333 | ||||||
Houlihan Lokey, Inc. | 19,920 | 973,490 | ||||||
Stifel Financial Corp. | 13,177 | 799,185 | ||||||
|
| |||||||
| 3,374,104 | ||||||||
|
| |||||||
INSURANCE–2.5% | ||||||||
Palomar Holdings, Inc.(a)(b) | 14,111 | 712,465 | ||||||
Trupanion, Inc.(a)(b) | 33,279 | 1,246,631 | ||||||
|
| |||||||
| 1,959,096 | ||||||||
|
| |||||||
| 6,272,104 | ||||||||
|
| |||||||
CONSUMER | ||||||||
FOOD & STAPLES | ||||||||
Chefs’ Warehouse, Inc. (The)(a)(b) | 31,241 | 1,190,595 | ||||||
Grocery Outlet Holding Corp.(a)(b) | 26,833 | 870,731 | ||||||
|
| |||||||
| 2,061,326 | ||||||||
|
| |||||||
FOOD PRODUCTS–1.7% | ||||||||
Freshpet, Inc.(b) | 21,991 | 1,299,448 | ||||||
|
| |||||||
| 3,360,774 | ||||||||
|
| |||||||
MATERIALS–2.1% | ||||||||
CHEMICALS–1.3% | ||||||||
Ingevity Corp.(b) | 11,264 | 984,248 | ||||||
|
| |||||||
7
| SMALL CAP GROWTH PORTFOLIO | ||
PORTFOLIO OF INVESTMENTS | ||
| (continued) | AB Variable Products Series Fund | |
| Company | Shares | U.S. $ Value | ||||||
CONTAINERS & | ||||||||
Ranpak Holdings Corp.(b) | 80,751 | $ | 658,121 | |||||
|
| |||||||
| 1,642,369 | ||||||||
|
| |||||||
ENERGY–0.6% | ||||||||
ENERGY EQUIPMENT & SERVICES–0.6% | ||||||||
DMC Global, Inc.(a) | 10,180 | 457,489 | ||||||
|
| |||||||
Total Common Stocks | 76,629,175 | |||||||
|
| |||||||
SHORT-TERM | ||||||||
INVESTMENT | ||||||||
AB Fixed Income Shares, | 1,604,109 | 1,604,109 | ||||||
|
| |||||||
TOTAL INVESTMENTS BEFORE SECURITY LENDING COLLATERAL FOR SECURITIES | 78,233,284 | |||||||
|
| |||||||
| Company | Shares | U.S. $ Value | ||||||
INVESTMENTS OF CASH COLLATERAL FOR SECURITIES | ||||||||
INVESTMENT | ||||||||
AB Fixed Income Shares, | 3,069,569 | $ | 3,069,569 | |||||
|
| |||||||
TOTAL | 81,302,853 | |||||||
Other assets less | (3,158,289 | ) | ||||||
|
| |||||||
NET ASSETS–100.0% | $ | 78,144,564 | ||||||
|
| |||||||
| (a) | Represents entire or partial securities out on loan. See Note E for securities lending information. |
| (b) | Non-income producing security. |
| (c) | Affiliated investments. |
| (d) | The rate shown represents the7-day yield as of period end. |
| (e) | To obtain a copy of the fund’s shareholder report, please go to the Securities and Exchange Commission’s website at www.sec.gov, or call AB at (800)227-4618. |
Glossary:
ADR—American Depositary Receipt
See notes to financial statements.
8
| SMALL CAP GROWTH PORTFOLIO | ||
| STATEMENT OF ASSETS & LIABILITIES | ||
| December 31, 2019 | AB Variable Products Series Fund | |
ASSETS | ||||
Investments in securities, at value | ||||
Unaffiliated issuers (cost $58,581,821) | $ | 76,629,175 | (a) | |
Affiliated issuers (cost $4,673,678—including investment of cash collateral for securities loaned of $3,069,569) | 4,673,678 | |||
Receivable for investment securities sold | 178,397 | |||
Unaffiliated dividends receivable | 24,633 | |||
Receivable for capital stock sold | 6,092 | |||
Affiliated dividends receivable | 2,616 | |||
|
| |||
Total assets | 81,514,591 | |||
|
| |||
LIABILITIES | ||||
Payable for collateral received on securities loaned | 3,069,569 | |||
Payable for investment securities purchased | 127,451 | |||
Payable for capital stock redeemed | 56,121 | |||
Administrative fee payable | 21,213 | |||
Advisory fee payable | 21,052 | |||
Distribution fee payable | 10,343 | |||
Transfer Agent fee payable | 132 | |||
Accrued expenses | 64,146 | |||
|
| |||
Total liabilities | 3,370,027 | |||
|
| |||
NET ASSETS | $ | 78,144,564 | ||
|
| |||
COMPOSITION OF NET ASSETS | ||||
Capital stock, at par | $ | 4,235 | ||
Additionalpaid-in capital | 54,361,676 | |||
Distributable earnings | 23,778,653 | |||
|
| |||
| $ | 78,144,564 | |||
|
|
Net Asset Value Per Share—1 billion shares of capital stock authorized, $.001 par value
| Class | Net Assets | Shares Outstanding | Net Asset Value | |||||||||
| A | $ | 27,167,247 | 1,364,038 | $ | 19.92 | |||||||
| B | $ | 50,977,317 | 2,871,271 | $ | 17.75 | |||||||
| (a) | Includes securities on loan with a value of $20,203,991 (see Note E). |
See notes to financial statements.
9
| SMALL CAP GROWTH PORTFOLIO | ||
| STATEMENT OF OPERATIONS | ||
| Year Ended December 31, 2019 | AB Variable Products Series Fund | |
INVESTMENT INCOME | ||||
Dividends | ||||
Unaffiliated issuers | $ | 184,277 | ||
Affiliated issuers | 181,819 | |||
Interest | 66 | |||
Securities lending income | 15,182 | |||
|
| |||
| 381,344 | ||||
|
| |||
EXPENSES | ||||
Advisory fee (see Note B) | 561,631 | |||
Distribution fee—Class B | 120,128 | |||
Transfer agency—Class A | 2,020 | |||
Transfer agency—Class B | 3,652 | |||
Custodian | 100,167 | |||
Administrative | 77,521 | |||
Audit and tax | 40,653 | |||
Legal | 31,119 | |||
Printing | 25,666 | |||
Directors’ fees | 22,925 | |||
Miscellaneous | 7,366 | |||
|
| |||
Total expenses | 992,848 | |||
Less: expenses waived and reimbursed by the Adviser (see Notes B & E) | (201,135 | ) | ||
|
| |||
Net expenses | 791,713 | |||
|
| |||
Net investment loss | (410,369 | ) | ||
|
| |||
REALIZED AND UNREALIZED GAIN ON INVESTMENT TRANSACTIONS | ||||
Net realized gain on investment transactions | 6,852,640 | |||
Net change in unrealized appreciation/depreciation of investments | 15,506,078 | |||
|
| |||
Net gain on investment transactions | 22,358,718 | |||
|
| |||
Contributions from Affiliates (see Note B) | 25 | |||
|
| |||
NET INCREASE IN NET ASSETS FROM OPERATIONS | $ | 21,948,374 | ||
|
|
See notes to financial statements.
10
| SMALL CAP GROWTH PORTFOLIO | ||
| STATEMENT OF CHANGES IN NET ASSETS | AB Variable Products Series Fund | |
| Year Ended December 31, 2019 | Year Ended December 31, 2018 | |||||||
INCREASE (DECREASE) IN NET ASSETS FROM OPERATIONS | ||||||||
Net investment loss | $ | (410,369 | ) | $ | (539,704 | ) | ||
Net realized gain on investment transactions | 6,852,640 | 9,717,843 | ||||||
Net change in unrealized appreciation/depreciation of investments | 15,506,078 | (11,367,796 | ) | |||||
Contributions from Affiliates (see Note B) | 25 | –0 | – | |||||
|
|
|
| |||||
Net increase (decrease) in net assets from operations | 21,948,374 | (2,189,657 | ) | |||||
Distributions to Shareholders | ||||||||
Class A | (3,355,272 | ) | (1,292,890 | ) | ||||
Class B | (6,551,394 | ) | (2,385,487 | ) | ||||
CAPITAL STOCK TRANSACTIONS | ||||||||
Net increase | 3,282,769 | 19,253,347 | ||||||
|
|
|
| |||||
Total increase | 15,324,477 | 13,385,313 | ||||||
NET ASSETS | ||||||||
Beginning of period | 62,820,087 | 49,434,774 | ||||||
|
|
|
| |||||
End of period | $ | 78,144,564 | $ | 62,820,087 | ||||
|
|
|
| |||||
See notes to financial statements.
11
| SMALL CAP GROWTH PORTFOLIO | ||
| NOTES TO FINANCIAL STATEMENTS | ||
| December 31, 2019 | AB Variable Products Series Fund | |
NOTE A: Significant Accounting Policies
The AB Small Cap Growth Portfolio (the “Portfolio”) is a series of AB Variable Products Series Fund, Inc. (the “Fund”). The Portfolio’s investment objective is long-term growth of capital. The Portfolio is diversified as defined under the Investment Company Act of 1940. The Fund was incorporated in the State of Maryland on November 17, 1987, as anopen-end series investment company. The Fund offers eleven separately managed pools of assets which have differing investment objectives and policies. The Portfolio offers Class A and Class B shares. Both classes of shares have identical voting, dividend, liquidating and other rights, except that Class B shares bear a distribution expense and have exclusive voting rights with respect to the Class B distribution plan.
The Portfolio offers and sells its shares only to separate accounts of certain life insurance companies for the purpose of funding variable annuity contracts and variable life insurance policies. Sales are made without a sales charge at the Portfolio’s net asset value per share.
Effective February 1, 2013, the Portfolio was closed to new investors except that Contractholders of variable products with investment options that included the Portfolio as of January 31, 2013, may continue to purchase shares of the Portfolio in accordance with the procedures for the purchase of shares in the prospectus of the separate account in which they invest, including through reinvestment of dividends and capital gains distributions. Effective August 10, 2015, the Portfolio reopened to new investors.
The Portfolio may (i) make additional exceptions that, in the Adviser’s judgment, do not adversely affect the Adviser’s ability to manage the Portfolio; (ii) reject any investment or refuse any exception, including those detailed above, that the Adviser believes will adversely affect its ability to manage the Portfolio; and (iii) close and/or reopen the Portfolio to new or existing Contractholders at any time.
The financial statements have been prepared in conformity with U.S. generally accepted accounting principles (“U.S. GAAP”) which require management to make certain estimates and assumptions that affect the reported amounts of assets and liabilities in the financial statements and amounts of income and expenses during the reporting period. Actual results could differ from those estimates. The Portfolio is an investment company under U.S. GAAP and follows the accounting and reporting guidance applicable to investment companies. The following is a summary of significant accounting policies followed by the Portfolio.
1. Security Valuation
Portfolio securities are valued at their current market value determined on the basis of market quotations or, if market quotations are not readily available or are deemed unreliable, at “fair value” as determined in accordance with procedures established by and under the general supervision of the Fund’s Board of Directors (the “Board”).
In general, the market values of securities which are readily available and deemed reliable are determined as follows: securities listed on a national securities exchange (other than securities listed on the NASDAQ Stock Market, Inc. (“NASDAQ”)) or on a foreign securities exchange are valued at the last sale price at the close of the exchange or foreign securities exchange. If there has been no sale on such day, the securities are valued at the last traded price from the previous day. Securities listed on more than one exchange are valued by reference to the principal exchange on which the securities are traded; securities listed only on NASDAQ are valued in accordance with the NASDAQ Official Closing Price; listed or over the counter (“OTC”) market put or call options are valued at the mid level between the current bid and ask prices. If either a current bid or current ask price is unavailable, AllianceBernstein L.P. (the “Adviser”) will have discretion to determine the best valuation (e.g., last trade price in the case of listed options); open futures are valued using the closing settlement price or, in the absence of such a price, the most recent quoted bid price. If there are no quotations available for the day of valuation, the last available closing settlement price is used; U.S. Government securities and any other debt instruments having 60 days or less remaining until maturity are generally valued at market by an independent pricing vendor, if a market price is available. If a market price is not available, the securities are valued at amortized cost. This methodology is commonly used for short term securities that have an original maturity of 60 days or less, as well as short term securities that had an original term to maturity that exceeded 60 days. In instances when amortized cost is utilized, the Valuation Committee (the “Committee”) must reasonably conclude that the utilization of amortized cost is approximately the same as the fair value of the security. Such factors the Committee will consider include, but are not limited to, an impairment of the creditworthiness of the issuer or material changes in interest rates. Fixed-income securities, including mortgage-backed and asset-backed securities, may be valued on the basis of prices provided by a pricing service or at a price obtained from one or
12
| AB Variable Products Series Fund | ||
more of the major broker-dealers. In cases where broker-dealer quotes are obtained, the Adviser may establish procedures whereby changes in market yields or spreads are used to adjust, on a daily basis, a recently obtained quoted price on a security. Swaps and other derivatives are valued daily, primarily using independent pricing services, independent pricing models using market inputs, as well as third party broker-dealers or counterparties. Open end mutual funds are valued at the closing net asset value per share, while exchange traded funds are valued at the closing market price per share.
Securities for which market quotations are not readily available (including restricted securities) or are deemed unreliable are valued at fair value as deemed appropriate by the Adviser. Factors considered in making this determination may include, but are not limited to, information obtained by contacting the issuer, analysts, analysis of the issuer’s financial statements or other available documents. In addition, the Portfolio may use fair value pricing for securities primarily traded innon-U.S. markets because most foreign markets close well before the Portfolio values its securities at 4:00 p.m., Eastern Time. The earlier close of these foreign markets gives rise to the possibility that significant events, including broad market moves, may have occurred in the interim and may materially affect the value of those securities. To account for this, the Portfolio generally values many of its foreign equity securities using fair value prices based on third party vendor modeling tools to the extent available.
2. Fair Value Measurements
In accordance with U.S. GAAP regarding fair value measurements, fair value is defined as the price that the Portfolio would receive to sell an asset or pay to transfer a liability in an orderly transaction between market participants at the measurement date. U.S. GAAP establishes a framework for measuring fair value, and a three-level hierarchy for fair value measurements based upon the transparency of inputs to the valuation of an asset or liability (including those valued based on their market values as described in Note A.1 above). Inputs may be observable or unobservable and refer broadly to the assumptions that market participants would use in pricing the asset or liability. Observable inputs reflect the assumptions market participants would use in pricing the asset or liability based on market data obtained from sources independent of the Portfolio. Unobservable inputs reflect the Portfolio’s own assumptions about the assumptions that market participants would use in pricing the asset or liability based on the best information available in the circumstances. Each investment is assigned a level based upon the observability of the inputs which are significant to the overall valuation. The three-tier hierarchy of inputs is summarized below.
| • | Level 1—quoted prices in active markets for identical investments |
| • | Level 2—other significant observable inputs (including quoted prices for similar investments, interest rates, prepayment speeds, credit risk, etc.) |
| • | Level 3—significant unobservable inputs (including the Portfolio’s own assumptions in determining the fair value of investments) |
Where readily available market prices or relevant bid prices are not available for certain equity investments, such investments may be valued based on similar publicly traded investments, movements in relevant indices since last available prices or based upon underlying company fundamentals and comparable company data (such as multiples to earnings or other multiples to equity). Where an investment is valued using an observable input, such as another publicly traded security, the investment will be classified as Level 2. If management determines that an adjustment is appropriate based on restrictions on resale, illiquidity or uncertainty, and such adjustment is a significant component of the valuation, the investment will be classified as Level 3. An investment will also be classified as Level 3 where management uses company fundamentals and other significant inputs to determine the valuation.
13
| SMALL CAP GROWTH PORTFOLIO | ||
| NOTES TO FINANCIAL STATEMENTS | ||
| (continued) | AB Variable Products Series Fund | |
The following table summarizes the valuation of the Portfolio’s investments by the above fair value hierarchy levels as of December 31, 2019:
| Level 1 | Level 2 | Level 3 | Total | |||||||||||||
Investments in Securities: | ||||||||||||||||
Assets: | ||||||||||||||||
Common Stocks(a) | $ | 76,629,175 | $ | –0 | – | $ | –0 | – | $ | 76,629,175 | ||||||
Short-Term Investments | 1,604,109 | –0 | – | –0 | – | 1,604,109 | ||||||||||
Investments of Cash Collateral for Securities Loaned in Affiliated Money Market Fund | 3,069,569 | –0 | – | –0 | – | 3,069,569 | ||||||||||
|
|
|
|
|
|
|
| |||||||||
Total Investments in Securities | 81,302,853 | –0 | – | –0 | – | 81,302,853 | ||||||||||
Other Financial Instruments(b) | –0 | – | –0 | – | –0 | – | –0 | – | ||||||||
|
|
|
|
|
|
|
| |||||||||
Total | $ | 81,302,853 | $ | –0 | – | $ | –0 | – | $ | 81,302,853 | ||||||
|
|
|
|
|
|
|
| |||||||||
| (a) | See Portfolio of Investments for sector classifications. |
| (b) | Other financial instruments are derivative instruments, such as futures, forwards and swaps, which are valued at the unrealized appreciation/(depreciation) on the instrument. Other financial instruments may also include swaps with upfront premiums, options written and swaptions written which are valued at market value. |
3. Currency Translation
Assets and liabilities denominated in foreign currencies and commitments under forward currency exchange contracts are translated into U.S. dollars at the mean of the quoted bid and ask prices of such currencies against the U.S. dollar. Purchases and sales of portfolio securities are translated into U.S. dollars at the rates of exchange prevailing when such securities were acquired or sold. Income and expenses are translated into U.S. dollars at rates of exchange prevailing when accrued.
Net realized gain or loss on foreign currency transactions represents foreign exchange gains and losses from sales and maturities of foreign fixed income investments, holding of foreign currencies, currency gains or losses realized between the trade and settlement dates on foreign investment transactions, and the difference between the amounts of dividends, interest and foreign withholding taxes recorded on the Portfolio’s books and the U.S. dollar equivalent amounts actually received or paid. Net unrealized currency gains and losses from valuing foreign currency denominated assets and liabilities at period end exchange rates are reflected as a component of net unrealized appreciation or depreciation of foreign currency denominated assets and liabilities.
4. Taxes
It is the Portfolio’s policy to meet the requirements of the Internal Revenue Code applicable to regulated investment companies and to distribute all of its investment company taxable income and net realized gains, if any, to shareholders. Therefore, no provisions for federal income or excise taxes are required. The Portfolio may be subject to taxes imposed by countries in which it invests. Such taxes are generally based on income and/or capital gains earned or repatriated. Taxes are accrued and applied to net investment income, net realized gains and net unrealized appreciation/depreciation as such income and/or gains are earned.
In accordance with U.S. GAAP requirements regarding accounting for uncertainties in income taxes, management has analyzed the Portfolio’s tax positions taken or expected to be taken on federal and state income tax returns for all open tax years (the current and the prior three tax years) and has concluded that no provision for income tax is required in the Portfolio’s financial statements.
5. Investment Income and Investment Transactions
Dividend income is recorded on theex-dividend date or as soon as the Portfolio is informed of the dividend. Interest income is accrued daily. Investment transactions are accounted for on the date the securities are purchased or sold. Investment gains or losses are determined on the identified cost basis. The Portfolio amortizes premiums and accretes discounts as adjustments to interest income.
6. Class Allocations
All income earned and expenses incurred by the Portfolio are borne on apro-rata basis by each outstanding class of shares, based on the proportionate interest in the Portfolio represented by the net assets of such class, except for class specific expenses which are allocated to the respective class. Expenses of the Fund are charged proportionately to each portfolio or based on other appropriate methods. Realized and unrealized gains and losses are allocated among the various share classes based on respective net assets.
14
| AB Variable Products Series Fund | ||
7. Dividends and Distributions
Dividends and distributions to shareholders, if any, are recorded on theex-dividend date. Income dividends and capital gains distributions are determined in accordance with federal tax regulations and may differ from those determined in accordance with U.S. GAAP. To the extent these differences are permanent, such amounts are reclassified within the capital accounts based on their federal tax basis treatment; temporary differences do not require such reclassification.
NOTE B: Advisory Fee and Other Transactions with Affiliates
Under the terms of the investment advisory agreement, the Portfolio pays the Adviser an advisory fee at an annual rate of .75% of the first $2.5 billion, .65% of the next $2.5 billion and .60% in excess of $5 billion, of the Portfolio’s average daily net assets. The fee is accrued daily and paid monthly. Effective September 4, 2018, the Adviser has agreed to waive its fees and bear certain expenses to the extent necessary to limit total operating expenses (excluding expenses associated with acquired fund fees and expenses other than the advisory fees of any AB Mutual Funds in which the Portfolio may invest, interest expense, taxes, extraordinary expenses, and brokerage commissions and other transaction costs) on an annual basis (the “Expense Caps”) to .90% and 1.15% of daily average net assets for Class A and Class B shares, respectively. For the year ended December 31, 2019, such reimbursements/waivers amounted to $198,319. This fee waiver and/or expense reimbursement agreement extends through May 1, 2020 and then may be extended by the Adviser for additionalone-year terms.
Pursuant to the investment advisory agreement, the Portfolio may reimburse the Adviser for certain legal and accounting services provided to the Portfolio by the Adviser. For the year ended December 31, 2019, the reimbursement for such services amounted to $77,521.
The Portfolio compensates AllianceBernstein Investor Services, Inc. (“ABIS”), a wholly-owned subsidiary of the Adviser, under a Transfer Agency Agreement for providing personnel and facilities to perform transfer agency services for the Portfolio. Such compensation retained by ABIS amounted to $1,491 for the year ended December 31, 2019.
The Portfolio may invest in AB Government Money Market Portfolio (the “Government Money Market Portfolio”) which has a contractual annual advisory fee rate of .20% of the portfolio’s average daily net assets and bears its own expenses. The Adviser has contractually agreed to waive .10% of the advisory fee of Government Money Market Portfolio (resulting in a net advisory fee of ..10%) until August 31, 2020. In connection with the investment by the Portfolio in Government Money Market Portfolio, the Adviser has contractually agreed to waive its advisory fee from the Portfolio in an amount equal to the Portfolio’s pro rata share of the effective advisory fee of Government Money Market Portfolio, as borne indirectly by the Portfolio as an acquired fund fee and expense. For the year ended December 31, 2019, such waiver amounted to $1,885.
A summary of the Portfolio’s transactions in AB mutual funds for the year ended December 31, 2019 is as follows:
Fund | Market Value 12/31/18 (000) | Purchases at Cost (000) | Sales Proceeds (000) | Market Value 12/31/19 (000) | Dividend Income (000) | |||||||||||||||
Government Money Market Portfolio | $ | 1,148 | $ | 28,096 | $ | 27,640 | $ | 1,604 | $ | 41 | ||||||||||
Government Money Market Portfolio* | 2,447 | 27,267 | 26,644 | 3,070 | 141 | |||||||||||||||
|
|
|
| |||||||||||||||||
Total | $ | 4,674 | $ | 182 | ||||||||||||||||
|
|
|
| |||||||||||||||||
| * | Investments of cash collateral for securities lending transactions (see Note E). |
During the year ended December 31, 2019, the Adviser reimbursed the Portfolio $25 for trading losses incurred due to a trade entry error.
Brokerage commissions paid on investment transactions for the year ended December 31, 2019 amounted to $38,763, of which $4 and $0, respectively, was paid to Sanford C. Bernstein & Co. LLC and Sanford C. Bernstein Limited, affiliates of the Adviser.
During the second quarter of 2018, AXA S.A. (“AXA”), a French holding company for the AXA Group, a worldwide leader in life, property and casualty and health insurance and asset management, completed the sale of a minority stake in its subsidiary, AXA Equitable Holdings, Inc. (now named Equitable Holdings, Inc.) (“Equitable”), through an initial public offering. Equitable is the holding company for a diverse group of financial services companies, including an approximately 65.3% economic interest in the Adviser and a 100% interest in AllianceBernstein Corporation, the general partner of the
15
| SMALL CAP GROWTH PORTFOLIO | ||
| NOTES TO FINANCIAL STATEMENTS | ||
| (continued) | AB Variable Products Series Fund | |
Adviser Since the initial sale, AXA has completed additional offerings, most recently during the fourth quarter of 2019. As a result, AXA currently owns 10.1% of the outstanding shares of common stock of Equitable, and no longer owns a controlling interest in Equitable. AXA previously announced its intention to sell its entire interest in Equitable over time, subject to market conditions and other factors (the “Plan”). Most of AXA’s remaining Equitable shares are to be delivered on redemption of AXA bonds mandatorily exchangeable into Equitable shares and maturing in May 2021. AXA retains sole discretion to determine the timing of any future sales of its remaining shares of Equitable common stock.
The latest transaction under the Plan, which occurred on November 13, 2019, resulted in the indirect transfer of a “controlling block” of voting securities of the Adviser (a “Change of Control Event”) and was deemed an “assignment” causing a termination of the Portfolio’s investment advisory agreement. In order to ensure that investment advisory services could continue uninterrupted in the event of a Change of Control Event, the Board previously approved a new investment advisory agreement with the Adviser, and shareholders of the Portfolio subsequently approved the new investment advisory agreement. This agreement became effective on November 13, 2019.
NOTE C: Distribution Plan
The Portfolio has adopted a Distribution Plan (the “Plan”) for Class B shares pursuant to Rule12b-1 under the Investment Company Act of 1940. Under the Plan, the Portfolio pays distribution and servicing fees to AllianceBernstein Investments, Inc. (the “Distributor”), a wholly-owned subsidiary of the Adviser, at an annual rate of up to .50% of the Portfolio’s average daily net assets attributable to Class B shares. The fees are accrued daily and paid monthly. The Board currently limits payments under the Plan to .25% of the Portfolio’s average daily net assets attributable to Class B shares. The Plan provides that the Distributor will use such payments in their entirety for distribution assistance and promotional activities.
The Portfolio is not obligated under the Plan to pay any distribution and servicing fees in excess of the amounts set forth above. The purpose of the payments to the Distributor under the Plan is to compensate the Distributor for its distribution services with respect to the sale of the Portfolio’s Class B shares. Since the Distributor’s compensation is not directly tied to its expenses, the amount of compensation received by it under the Plan during any year may be more or less than its actual expenses. For this reason, the Plan is characterized by the staff of the Securities and Exchange Commission as being of the “compensation” variety.
In the event that the Plan is terminated or not continued, no distribution or servicing fees (other than current amounts accrued but not yet paid) would be owed by the Portfolio to the Distributor.
The Plan also provides that the Adviser may use its own resources to finance the distribution of the Portfolio’s shares.
NOTE D: Investment Transactions
Purchases and sales of investment securities (excluding short-term investments) for the year ended December 31, 2019 were as follows:
| Purchases | Sales | |||||||
Investment securities (excluding U.S. government securities) | $ | 50,349,317 | $ | 57,622,658 | ||||
U.S. government securities | –0 | – | –0 | – | ||||
The cost of investments for federal income tax purposes, gross unrealized appreciation and unrealized depreciation are as follows:
Cost | $ | 64,617,672 | ||
|
| |||
Gross unrealized appreciation | $ | 19,510,582 | ||
Gross unrealized depreciation | (2,825,401 | ) | ||
|
| |||
Net unrealized appreciation | $ | 16,685,181 | ||
|
|
1. Derivative Financial Instruments
The Portfolio may use derivatives in an effort to earn income and enhance returns, to replace more traditional direct investments, to obtain exposure to otherwise inaccessible markets (collectively, “investment purposes”), or to hedge or adjust the risk profile of its portfolio.
The Portfolio did not engage in derivatives transactions for the year ended December 31, 2019.
16
| AB Variable Products Series Fund | ||
2. Currency Transactions
The Portfolio may invest innon-U.S. Dollar-denominated securities on a currency hedged or unhedged basis. The Portfolio may seek investment opportunities by taking long or short positions in currencies through the use of currency-related derivatives, including forward currency exchange contracts, futures and options on futures, swaps, and other options. The Portfolio may enter into transactions for investment opportunities when it anticipates that a foreign currency will appreciate or depreciate in value but securities denominated in that currency are not held by the Portfolio and do not present attractive investment opportunities. Such transactions may also be used when the Adviser believes that it may be more efficient than a direct investment in a foreign currency-denominated security. The Portfolio may also conduct currency exchange contracts on a spot basis (i.e., for cash at the spot rate prevailing in the currency exchange market for buying or selling currencies).
NOTE E: Securities Lending
The Portfolio may enter into securities lending transactions. Under the Portfolio’s securities lending program, all loans of securities will be collateralized continually by cash collateral and/ornon-cash collateral.Non-cash collateral will include only securities issued or guaranteed by the U.S. government or its agencies or instrumentalities. The Portfolio cannot sell or repledge anynon-cash collateral, such collateral will not be reflected in the portfolio of investments. If a loan is collateralized by cash, the Portfolio will be compensated for the loan from a portion of the net return from the income earned on cash collateral after a rebate is paid to the borrower (in some cases, this rebate may be a “negative rebate” or fee paid by the borrower to the Portfolio in connection with the loan), and payments are made for fees of the securities lending agent and for certain other administrative expenses. If the Portfolio receivesnon-cash collateral, the Portfolio will receive a fee from the borrower generally equal to a negotiated percentage of the market value of the loaned securities. The Portfolio will have the right to call a loan and obtain the securities loaned at any time on notice to the borrower within the normal and customary settlement time for the securities. While the securities are on loan, the borrower is obligated to pay the Portfolio amounts equal to any income or other distributions from the securities. The Portfolio will not be able to exercise voting rights with respect to any securities during the existence of a loan, but will have the right to regain ownership of loaned securities in order to exercise voting or other ownership rights. Collateral received and securities loaned are marked to market daily to ensure that the securities loaned are secured by collateral. The lending agent currently invests the cash collateral received in Government Money Market Portfolio, an eligible money market vehicle, in accordance with the investment restrictions of the Portfolio, and as approved by the Board. The collateral received on securities loaned is recorded as an asset as well as a corresponding liability in the statement of assets and liabilities. The collateral will be adjusted the next business day to maintain the required collateral amount. The amounts of securities lending income from the borrowers and Government Money Market Portfolio are reflected in the statement of operations. When the Portfolio earns net securities lending income from Government Money Market Portfolio, the income is inclusive of a rebate expense paid to the borrower. In connection with the cash collateral investment by the Portfolio in Government Money Market Portfolio, the Adviser has agreed to waive a portion of the Portfolio’s share of the advisory fees of Government Money Market Portfolio, as borne indirectly by the Portfolio as an acquired fund fee and expense. When the Portfolio lends securities, its investment performance will continue to reflect changes in the value of the securities loaned. A principal risk of lending portfolio securities is that the borrower may fail to return the loaned securities upon termination of the loan and that the collateral will not be sufficient to replace the loaned securities. The lending agent has agreed to indemnify the Portfolio in the case of default of any securities borrower.
A summary of the Portfolio’s transactions surrounding securities lending for the year ended December 31, 2019 is as follows:
| Government Money Market Portfolio | ||||||||||||||||||||||
Market Value of on Loan* | Cash Collateral* | Market Value of | Income from | Income | Advisory Fee | |||||||||||||||||
| $ | 20,203,991 | $ | 3,069,569 | $ | 17,536,566 | $ | 15,182 | $ | 140,729 | $ | 931 | |||||||||||
| * | As of December 31, 2019. |
17
| SMALL CAP GROWTH PORTFOLIO | ||
| NOTES TO FINANCIAL STATEMENTS | ||
| (continued) | AB Variable Products Series Fund | |
NOTE F: Capital Stock
Each class consists of 500,000,000 authorized shares. Transactions in capital shares for each class were as follows:
| SHARES | AMOUNT | |||||||||||||||||||
| Year Ended December 31, 2019 | Year Ended December 31, 2018 | Year Ended December 31, 2019 | Year Ended December 31, 2018 | |||||||||||||||||
Class A |
| |||||||||||||||||||
Shares sold | 77,029 | 117,606 | $ | 1,529,231 | $ | 2,295,761 | ||||||||||||||
Shares issued in reinvestment of distributions | 174,572 | 64,580 | 3,355,272 | 1,292,890 | ||||||||||||||||
Shares redeemed | (258,486 | ) | (296,890 | ) | (5,081,587 | ) | (5,668,570 | ) | ||||||||||||
|
|
|
|
|
|
|
|
|
| |||||||||||
Net decrease | (6,885 | ) | (114,704 | ) | $ | (197,084 | ) | $ | (2,079,919 | ) | ||||||||||
|
|
|
|
|
|
|
|
|
| |||||||||||
Class B | ||||||||||||||||||||
Shares sold | 770,488 | 1,857,692 | $ | 13,546,465 | $ | 32,182,622 | ||||||||||||||
Shares issued in reinvestment of distributions | 382,005 | 131,359 | 6,551,394 | 2,385,487 | ||||||||||||||||
Shares redeemed | (949,627 | ) | (782,656 | ) | (16,618,006 | ) | (13,234,843 | ) | ||||||||||||
|
|
|
|
|
|
|
|
|
| |||||||||||
Net increase | 202,866 | 1,206,395 | $ | 3,479,853 | $ | 21,333,266 | ||||||||||||||
|
|
|
|
|
|
|
|
|
| |||||||||||
At December 31, 2019, certain shareholders of the Portfolio owned 76% in aggregate of the Portfolio’s outstanding shares. Significant transactions by such shareholders, if any, may impact the Portfolio’s performance.
NOTE G: Risks Involved in Investing in the Portfolio
Capitalization Risk—Investments in small- andmid-capitalization companies may be more volatile than investments in large-capitalization companies. Investments in small-capitalization companies may have additional risks because these companies have limited product lines, markets or financial resources.
Foreign(Non-U.S.) Risk—Investments in securities ofnon-U.S. issuers may involve more risk than those of U.S. issuers. These securities may fluctuate more widely in price and may be more difficult to trade or dispose of due to adverse market, economic, political, regulatory or other factors.
Derivatives Risk—The Portfolio may enter into derivative transactions such as forwards, options, futures and swaps. Derivatives may be illiquid, difficult to price, and leveraged so that small changes may produce disproportionate losses for the Portfolio, and subject to counterparty risk to a greater degree than more traditional investments. Derivatives may result in significant losses, including losses that are far greater than the value of the derivatives reflected on the statement of assets and liabilities.
LIBOR Risk—The Portfolio may invest in certain debt securities, derivatives or other financial instruments that utilize the London Interbank Offered Rate, or “LIBOR,” as a “benchmark” or “reference rate” for various interest rate calculations. In July 2017, the United Kingdom Financial Conduct Authority, which regulates LIBOR, announced a desire to phase out the use of LIBOR by the end of 2021. Although financial regulators and industry working groups have suggested alternative reference rates, such as European Interbank Offer Rate (“EURIBOR”), Sterling Overnight Interbank Average Rate (“SONIA”) and Secured Overnight Financing Rate (“SOFR”), global consensus on alternative rates is lacking and the process for amending existing contracts or instruments to transition away from LIBOR remains unclear. The elimination of LIBOR or changes to other reference rates or any other changes or reforms to the determination or supervision of reference rates could have an adverse impact on the market for, or value of, any securities or payments linked to those reference rates, which may adversely affect the Portfolio’s performance and/or net asset value. Uncertainty and risk also remain regarding the willingness and ability of issuers and lenders to include revised provisions in new and existing contracts or instruments. Consequently, the transition away from LIBOR to other reference rates may lead to increased volatility and illiquidity in markets that are tied to LIBOR, fluctuations in values of LIBOR-related investments or investments in issuers that utilize LIBOR, increased difficulty in borrowing or refinancing and diminished effectiveness of hedging strategies, adversely affecting the Portfolio’s performance. Furthermore, the risks associated with the expected discontinuation of LIBOR and transition may be exacerbated if the work necessary to effect an orderly transition to an alternative reference rate is not completed in a timely manner. Because the usefulness of LIBOR as a benchmark could deteriorate during the transition period, these effects could occur prior to the end of 2021.
18
| AB Variable Products Series Fund | ||
Indemnification Risk—In the ordinary course of business, the Portfolio enters into contracts that contain a variety of indemnifications. The Portfolio’s maximum exposure under these arrangements is unknown. However, the Portfolio has not had prior claims or losses pursuant to these indemnification provisions and expects the risk of loss thereunder to be remote. Therefore, the Portfolio has not accrued any liability in connection with these indemnification provisions.
NOTE H: Joint Credit Facility
A number ofopen-end mutual funds managed by the Adviser, including the Portfolio, participate in a $325 million revolving credit facility (the “Facility”) intended to provide short-term financing, if necessary, subject to certain restrictions in connection with abnormal redemption activity. Commitment fees related to the Facility are paid by the participating funds and are included in miscellaneous expenses in the statement of operations. The Portfolio did not utilize the Facility during the year ended December 31, 2019.
NOTE I: Distributions to Shareholders
The tax character of distributions paid during the fiscal years ended December 31, 2019 and December 31, 2018 were as follows:
| 2019 | 2018 | |||||||
Distributions paid from: | ||||||||
Net long-term capital gains | $ | 9,906,666 | $ | 3,678,377 | ||||
|
|
|
| |||||
Total taxable distributions | $ | 9,906,666 | $ | 3,678,377 | ||||
|
|
|
| |||||
As of December 31, 2019, the components of accumulated earnings/(deficit) on a tax basis were as follows:
Undistributed capital gains | $ | 7,087,901 | ||
Unrealized appreciation/(depreciation) | 16,690,756 | (a) | ||
|
| |||
Total accumulated earnings/(deficit) | $ | 23,778,657 | ||
|
|
| (a) | The differences between book-basis andtax-basis unrealized appreciation/(depreciation) are attributable primarily to the tax deferral of losses on wash sales and the tax treatment of passive foreign investment companies (PFICs). |
For tax purposes, net realized capital losses may be carried over to offset future capital gains, if any. Funds are permitted to carry forward capital losses for an indefinite period, and such losses will retain their character as either short-term or long-term capital losses. As of December 31, 2019, the Portfolio did not have any capital loss carryforwards.
During the current fiscal year, permanent differences primarily due to the disallowance of a net operating loss and contributions from the Adviser resulted in a net increase in distributable earnings and a net decrease in additional paid-in capital. These reclassifications had no effect on net assets.
NOTE J: Recent Accounting Pronouncements
In August 2018, the Financial Accounting Standards Board issued an Accounting Standards Update, ASU2018-13, Fair Value Measurement (Topic 820), Disclosure Framework—Changes to the Disclosure Requirements for Fair Value Measurement which removes, modifies and adds disclosures to Topic 820. The amendments in this ASU2018-13 (“ASU”) apply to all entities that are required, under existing U.S. GAAP, to make disclosures about recurring or nonrecurring fair value measurements. The amendments in this ASU are effective for all entities for fiscal years, and interim periods within those fiscal years, beginning after December 15, 2019. Management has evaluated the impact of the amendments and elected to early adopt the ASU. The adoption of this ASU did not have a material impact on the disclosure and presentation of the financial statements of the Portfolio.
NOTE K: Subsequent Events
Management has evaluated subsequent events for possible recognition or disclosure in the financial statements through the date the financial statements are issued. Management has determined that there are no material events that would require disclosure in the Portfolio’s financial statements through this date.
19
| SMALL CAP GROWTH PORTFOLIO | ||
| FINANCIAL HIGHLIGHTS | AB Variable Products Series Fund | |
Selected Data For A Share Of Capital Stock Outstanding Throughout Each Period
CLASS A | ||||||||||||||||||||
| Year Ended December 31, | ||||||||||||||||||||
| 2019 | 2018 | 2017 | 2016 | 2015 | ||||||||||||||||
Net asset value, beginning of period | $16.58 | $17.53 | $13.07 | $17.31 | $20.97 | |||||||||||||||
|
|
|
|
|
|
|
|
|
| |||||||||||
Income From Investment Operations | ||||||||||||||||||||
Net investment loss (a) | (.08 | )(b) | (.13 | )(b) | (.18 | )(b) | (.12 | )(b)† | (.19 | ) | ||||||||||
Net realized and unrealized gain on investment transactions | 6.02 | .14 | (c) | 4.64 | 1.05 | .18 | ||||||||||||||
Contributions from Affiliates | .00 | (d) | –0 | – | | –0 | – | | –0 | – | | –0 | – | |||||||
|
|
|
|
|
|
|
|
|
| |||||||||||
Net increase (decrease) in net asset value from operations | 5.94 | .01 | 4.46 | .93 | (.01 | ) | ||||||||||||||
|
|
|
|
|
|
|
|
|
| |||||||||||
Less: Distributions | ||||||||||||||||||||
Distributions from net realized gain on investment transactions | (2.60 | ) | (.96 | ) | | –0 | – | (5.17 | ) | (3.65 | ) | |||||||||
|
|
|
|
|
|
|
|
|
| |||||||||||
Net asset value, end of period | $19.92 | $16.58 | $17.53 | $13.07 | $17.31 | |||||||||||||||
|
|
|
|
|
|
|
|
|
| |||||||||||
Total Return | ||||||||||||||||||||
Total investment return based on net asset value (e)* | 36.40 | % | (.89 | )% | 34.12 | % | 6.46 | %† | (1.25 | )% | ||||||||||
Ratios/Supplemental Data | ||||||||||||||||||||
Net assets, end of period (000’s omitted) | $27,167 | $22,724 | $26,039 | $22,405 | $25,033 | |||||||||||||||
Ratio to average net assets of: | ||||||||||||||||||||
Expenses, net of waivers/reimbursements (f) | .90 | % | 1.06 | % | 1.38 | % | 1.48 | % | 1.31 | % | ||||||||||
Expenses, before waivers/reimbursements (f) | 1.16 | % | 1.15 | % | 1.38 | % | 1.49 | % | 1.31 | % | ||||||||||
Net investment loss | (.39 | )%(b) | (.65 | )%(b) | (1.19 | )%(b) | (.83 | )%(b)† | (.92 | )% | ||||||||||
Portfolio turnover rate | 69 | % | 73 | % | 69 | % | 60 | % | 72 | % | ||||||||||
See footnote summary on page 21.
20
| AB Variable Products Series Fund | ||
Selected Data For A Share Of Capital Stock Outstanding Throughout Each Period
CLASS B | ||||||||||||||||||||
| Year Ended December 31, | ||||||||||||||||||||
| 2019 | 2018 | 2017 | 2016 | 2015 | ||||||||||||||||
Net asset value, beginning of period | $15.03 | $16.00 | $11.96 | $16.30 | $20.00 | |||||||||||||||
|
|
|
|
|
|
|
|
|
| |||||||||||
Income From Investment Operations | ||||||||||||||||||||
Net investment loss (a) | (.11 | )(b) | (.16 | )(b) | (.20 | )(b) | (.15 | )(b)† | (.22 | ) | ||||||||||
Net realized and unrealized gain on investment transactions | 5.43 | .15 | (c) | 4.24 | .98 | .17 | ||||||||||||||
Contributions from Affiliates | .00 | (d) | –0 | – | | –0 | – | | –0 | – | | –0 | – | |||||||
|
|
|
|
|
|
|
|
|
| |||||||||||
Net increase (decrease) in net asset value from operations | 5.32 | (.01 | ) | 4.04 | .83 | (.05 | ) | |||||||||||||
|
|
|
|
|
|
|
|
|
| |||||||||||
Less: Distributions | ||||||||||||||||||||
Distributions from net realized gain on investment transactions | (2.60 | ) | (.96 | ) | | –0 | – | (5.17 | ) | (3.65 | ) | |||||||||
|
|
|
|
|
|
|
|
|
| |||||||||||
Net asset value, end of period | $17.75 | $15.03 | $16.00 | $11.96 | $16.30 | |||||||||||||||
|
|
|
|
|
|
|
|
|
| |||||||||||
Total Return | ||||||||||||||||||||
Total investment return based on net asset value (e)* | 36.01 | % | (1.11 | )% | 33.78 | % | 6.22 | %† | (1.53 | )% | ||||||||||
Ratios/Supplemental Data | ||||||||||||||||||||
Net assets, end of period (000’s omitted) | $50,978 | $40,096 | $23,396 | $15,094 | $19,857 | |||||||||||||||
Ratio to average net assets of: | ||||||||||||||||||||
Expenses, net of waivers/reimbursements (f) | 1.15 | % | 1.30 | % | 1.61 | % | 1.73 | % | 1.48 | % | ||||||||||
Expenses, before waivers/reimbursements (f) | 1.42 | % | 1.40 | % | 1.62 | % | 1.74 | % | 1.48 | % | ||||||||||
Net investment loss | (.64 | )%(b) | (.88 | )%(b) | (1.42 | )%(b) | (1.08 | )%(b)† | (1.10 | )% | ||||||||||
Portfolio turnover rate | 69 | % | 73 | % | 69 | % | 60 | % | 72 | % | ||||||||||
| (a) | Based on average shares outstanding. |
| (b) | Net of expenses waived/reimbursed by the Adviser. |
| (c) | Due to timing of sales and repurchase of capital shares, the net realized and unrealized gain (loss) per share is not in accordance with the Portfolio’s change in net realized and unrealized gain (loss) on investment transactions for the period. |
| (d) | Amount is less than $.005. |
| (e) | Total investment return is calculated assuming an initial investment made at the net asset value at the beginning of the period, reinvestment of all dividends and distributions at net asset value during the period, and redemption on the last day of the period. Total return does not reflect (i) insurance company’s separate account related expense charges and (ii) the deductions of taxes that a shareholder would pay on Portfolio distributions or the redemption of Portfolio shares. Total investment return calculated for a period of less than one year is not annualized. |
| (f) | In connection with the Portfolio’s investments in affiliated underlying portfolios, the Portfolio incurs no direct expenses, but bears proportionate shares of the fees and expenses (i.e., operating, administrative and investment advisory fees) of the affiliated underlying portfolios. The Adviser has contractually agreed to waive its fees from the Portfolio in an amount equal to the Portfolio’s pro rata share of certain acquired fund fees and expenses, and for the years ended December 31, 2018 and December 31, 2017, such waiver amounted to .01% and .01%, respectively. |
| † | For the year ended December 31, 2016, the amount includes a refund for overbilling of prior years’ custody out of pocket fees as follows: |
| Net Investment Income Per Share | Net Investment Income Ratio | Total Return | ||
| $.004 | .03% | .03% |
| * | Includes the impact of proceeds received and credited to the Portfolio resulting from class action settlements, which enhanced the Portfolio’s performance for the years ended December 31, 2018, December 31, 2017, December 31, 2016 and December 31, 2015 by .05%, .03%, .08% and .02%, respectively. |
21
| REPORT OF INDEPENDENT REGISTERED | ||
| PUBLIC ACCOUNTING FIRM | AB Variable Products Series Fund | |
To the Shareholders and the Board of Directors of AB Small Cap Growth Portfolio:
Opinion on the Financial Statements
We have audited the accompanying statement of assets and liabilities of AB Small Cap Growth Portfolio (the “Portfolio”) (one of the portfolios constituting AB Variable Products Series Fund, Inc. (the “Fund”)), including the portfolio of investments, as of December 31, 2019, and the related statement of operations for the year then ended, the statements of changes in net assets for each of the two years in the period then ended, the financial highlights for each of the five years in the period then ended and the related notes (collectively referred to as the “financial statements”). In our opinion, the financial statements present fairly, in all material respects, the financial position of the Portfolio (one of the portfolios constituting AB Variable Products Series Fund, Inc.) at December 31, 2019, the results of its operations for the year then ended, the changes in its net assets for each of the two years in the period then ended and its financial highlights for each of the five years in the period then ended, in conformity with U.S. generally accepted accounting principles.
Basis for Opinion
These financial statements are the responsibility of the Fund’s management. Our responsibility is to express an opinion on the Portfolio’s financial statements based on our audits. We are a public accounting firm registered with the Public Company Accounting Oversight Board (United States) (“PCAOB”) and are required to be independent with respect to the Fund in accordance with the U.S. federal securities laws and the applicable rules and regulations of the Securities and Exchange Commission and the PCAOB.
We conducted our audits in accordance with the standards of the PCAOB. Those standards require that we plan and perform the audit to obtain reasonable assurance about whether the financial statements are free of material misstatement, whether due to error or fraud. The Fund is not required to have, nor were we engaged to perform, an audit of the Fund’s internal control over financial reporting. As part of our audits, we are required to obtain an understanding of internal control over financial reporting, but not for the purpose of expressing an opinion on the effectiveness of the Fund’s internal control over financial reporting. Accordingly, we express no such opinion.
Our audits included performing procedures to assess the risks of material misstatement of the financial statements, whether due to error or fraud, and performing procedures that respond to those risks. Such procedures included examining, on a test basis, evidence regarding the amounts and disclosures in the financial statements. Our procedures included confirmation of securities owned as of December 31, 2019, by correspondence with the custodian and others or by other appropriate auditing procedures where replies from others were not received. Our audits also included evaluating the accounting principles used and significant estimates made by management, as well as evaluating the overall presentation of the financial statements. We believe that our audits provide a reasonable basis for our opinion.

We have served as the auditor of one or more of the AB investment companies since 1968.
New York, New York
February 14, 2020
22
| SMALL CAP GROWTH PORTFOLIO | AB Variable Products Series Fund | |
| BOARD OF DIRECTORS | ||
Marshall C. Turner, Jr.(1), Chairman Jorge A. Bermudez^ Michael J. Downey(1) Nancy P. Jacklin(1) | Robert M. Keith,President and Carol C. McMullen(1) Garry L. Moody(1) Earl D. Weiner(1) | |
| OFFICERS | ||
Bruce K. Aronow(2),Vice President Esteban Gomez(2),Vice President Samantha S. Lau(2),Vice President Heather Pavlak(2),Vice President Wen-Tse Tseng(2),Vice President | Emilie D. Wrapp,Secretary Michael B. Reyes,Senior Analyst Joseph J. Mantineo,Treasurer and Phyllis J. Clarke,Controller Vincent S. Noto,Chief Compliance Officer | |
| CUSTODIANAND ACCOUNTING AGENT | LEGAL COUNSEL | |
State Street Bank and Trust Company State Street Corporation CCB/5 1 Iron Street Boston, MA 02210 | Seward & Kissel LLP One Battery Park Plaza New York, NY 10004 | |
| DISTRIBUTOR | TRANSFER AGENT | |
AllianceBernstein Investments, Inc. 1345 Avenue of the Americas New York, NY 10105 | AllianceBernstein Investor Services, Inc. P.O. Box 786003 San Antonio, TX 78278-6003 Toll-Free (800) 221-5672 | |
| INDEPENDENT REGISTERED PUBLIC | ||
| ACCOUNTING FIRM | ||
Ernst & Young LLP 5 Times Square New York, NY 10036 |
| (1) | Member of the Audit Committee, the Governance and Nominating Committee, and the Independent Directors Committee. |
| (2) | The management of, and investment decisions for, the Portfolio’s portfolio are made by the Adviser’s Small Cap Growth Investment Team. Messrs. Aronow, Gomez and Tseng, and Mses. Lau and Pavlak are the investment professionals with the most significant responsibility for theday-to-day management of the Portfolio’s portfolio. |
| ^ | Mr. Bermudez will be a member of the Audit Committee, the Governance and Nominating Committee, and the Independent Directors Committee when he joins the Board on January 1, 2020. |
23
| SMALL CAP GROWTH PORTFOLIO | ||
| MANAGEMENT OF THE FUND | AB Variable Products Series Fund | |
Board of Directors Information
The business and affairs of the Fund are managed under the direction of the Board of Directors. Certain information concerning the Fund’s Directors is set forth below.
| NAME, ADDRESS*, AGE, (YEAR FIRST ELECTED**) | PRINCIPAL OCCUPATION(S) DURING PAST FIVE YEARS AND OTHER INFORMATION*** | PORTFOLIOS IN AB FUND COMPLEX OVERSEEN BY DIRECTOR | OTHER PUBLIC COMPANY DIRECTORSHIPS CURRENTLY HELD BY DIRECTOR | |||||
| INTERESTED DIRECTOR | ||||||||
Robert M. Keith,# 1345 Avenue of the Americas New York, NY 10105 59 (2010) | Senior Vice President of AllianceBernstein L.P. (the “Adviser”) and the head of AllianceBernstein Investments, Inc. (“ABI”) since July 2008; Director of ABI and President of the AB Mutual Funds. Previously, he served as Executive Managing Director of ABI from December 2006 to June 2008. Prior to joining ABI in 2006, Executive Managing Director of Bernstein Global Wealth Management, and prior thereto, Senior Managing Director and Global Head of Client Service and Sales of the Adviser’s institutional investment management business since 2004. Prior thereto, he was Managing Director and Head of North American Client Service and Sales in the Adviser’s institutional investment management business, with which he had been associated since prior to 2004. | 91 | None | |||||
| DISINTERESTED DIRECTORS | ||||||||
Marshall C. Turner, Jr.,## Chairman of the Board 78 (2005) | Private Investor since prior to 2015. Former Chairman and CEO of Dupont Photomasks, Inc. (components of semi-conductor manufacturing). He has extensive operating leadership and venture capital investing experience, including five interim or full-time CEO roles, and prior service as general partner of institutional venture capital partnerships. He also has extensive non-profit board leadership experience, and currently serves on the boards of two education and science-related non-profit organizations. He has served as a director of one AB Fund since 1992, and director or trustee of all AB Funds since 2005. He has been Chairman of the AB Funds since January 2014, and the Chairman of the Independent Directors Committees of such AB Funds since February 2014. | 91 | Xilinx, Inc. (programmable logic semi-conductors) since 2007 | |||||
Jorge A. Bermudez,^ 68 (2020) | Private investor since prior to 2015. Former Chief Risk Officer of Citigroup, Inc., a global financial services company, from November 2007 to March 2008, Chief Executive Officer of Citigroup’s Commercial Business Group in North America and Citibank Texas from 2005 to 2007, and a variety of other executive and leadership roles at various businesses within Citigroup prior to then; Chairman (2018) of the Texas A&M Foundation Board of Trustees (Trustee since 2013) and Chairman of the Smart Grid Center Board at Texas A&M University since 2012; director of, among others, Citibank N.A. from 2005 to 2008, the Federal Reserve Bank of Dallas, Houston Branch from 2009 to 2011, the Federal Reserve Bank of Dallas from 2011 to 2017, and the Electric Reliability Council of Texas from 2010 to 2016. He has served as director or trustee of the AB Funds since 2020. | 91 | Moody’s Corporation since April 2011 | |||||
24
| AB Variable Products Series Fund | ||
| NAME, ADDRESS*, AGE, (YEAR FIRST ELECTED**) | PRINCIPAL OCCUPATION(S) DURING PAST FIVE YEARS AND OTHER INFORMATION*** | PORTFOLIOS IN AB FUND COMPLEX OVERSEEN BY DIRECTOR | OTHER PUBLIC COMPANY DIRECTORSHIPS CURRENTLY HELD BY DIRECTOR | |||||
DISINTERESTED DIRECTORS (continued) | ||||||||
Michael J. Downey,## 76 (2005) | Private Investor since prior to 2015. Formerly, Chairman of The Asia Pacific Fund, Inc. (registered investment company) since prior to 2015 until January 2019. From 1987 until 1993, Chairman and CEO of Prudential Mutual Fund Management, director of the Prudential mutual funds, and member of the Executive Committee of Prudential Securities, Inc. He has served as a director or trustee of the AB Funds since 2005. | 91 | None | |||||
Nancy P. Jacklin,## 71 (2006) | Private Investor since prior to 2015. Professorial Lecturer at the Johns Hopkins School of Advanced International Studies (2008-2015). U.S. Executive Director of the International Monetary Fund (which is responsible for ensuring the stability of the international monetary system), (December 2002-May 2006); Partner, Clifford Chance(1992-2002); Sector Counsel, International Banking and Finance, and Associate General Counsel, Citicorp (1985-1992); Assistant General Counsel (International), Federal Reserve Board of Governors (1982-1985); and Attorney Advisor, U.S. Department of the Treasury (1973-1982). Member of the Bar of the District of Columbia and of New York; and member of the Council on Foreign Relations. She has served as a director or trustee of the AB Funds since 2006 and has been Chair of the Governance and Nominating Committees of the AB Funds since August 2014. | 91 | None | |||||
Carol C. McMullen,## 64 (2016) | Managing Director of Slalom Consulting (consulting) since 2014, private investor and member of the Advisory Board of Butcher Box (since 2018). Formerly, member, Partners Healthcare Investment Committee (2010-2019); Director of Norfolk & Dedham Group (mutual property and casualty insurance) from 2011 until November 2016; Director of Partners Community Physicians Organization (healthcare) from 2014 until December 2016; and Managing Director of The Crossland Group (consulting) from 2012 until 2013. She has held a number of senior positions in the asset and wealth management industries, including at Eastern Bank (where her roles included President of Eastern Wealth Management), Thomson Financial (Global Head of Sales for Investment Management), and Putnam Investments (where her roles included Chief Investment Officer, Core and Growth and Head of Global Investment Research). She has served on a number of private company and non-profit boards, and as a director or trustee of the AB Funds since June 2016. | 91 | None | |||||
25
| SMALL CAP GROWTH PORTFOLIO | ||
| MANAGEMENT OF THE FUND | ||
| (continued) | AB Variable Products Series Fund | |
| NAME, ADDRESS*, AGE, (YEAR FIRST ELECTED**) | PRINCIPAL OCCUPATION(S) DURING PAST FIVE YEARS AND OTHER INFORMATION*** | PORTFOLIOS IN AB FUND COMPLEX OVERSEEN BY DIRECTOR | OTHER PUBLIC COMPANY DIRECTORSHIPS CURRENTLY HELD BY DIRECTOR | |||||
DISINTERESTED DIRECTORS (continued) | ||||||||
Garry L. Moody,## 67 (2008) | Formerly, Partner, Deloitte & Touche LLP (1995-2008) where he held a number of senior positions, including Vice Chairman, and U.S. and Global Investment Management Practice Managing Partner; President, Fidelity Accounting and Custody Services Company (1993-1995), where he was responsible for accounting, pricing, custody and reporting for the Fidelity mutual funds; and Partner, Ernst & Young LLP (1975-1993), where he served as the National Director of Mutual Fund Tax Services and Managing Partner of its Chicago Office Tax department. He is a member of the Trustee Advisory Board of BoardIQ, a biweekly publication focused on issues and news affecting directors of mutual funds. He is also a member of the Investment Company Institute’s Board of Governors and the Independent Directors Council Governing Council. He has served as a director or trustee, and as Chairman of the Audit Committees of the AB Funds since 2008. | 91 | None | |||||
Earl D. Weiner,## 80 (2007) | Senior Counsel since 2017, Of Counsel from 2007 to 2016, and Partner prior to then, of the law firm Sullivan & Cromwell LLP. He is a former member of the ABA Federal Regulation of Securities Committee Task Force to draft editions of the Fund Director’s Guidebook. He also serves as a director or trustee of various non-profit organizations and has served as Chairman or Vice Chairman of a number of them. He has served as a director or trustee of the AB Funds since 2007 and served as Chairman of the Governance and Nominating Committees of the AB Funds from 2007 until August 2014. | 91 | None | |||||
| * | The address for each of the Fund’s disinterested Directors is c/o AllianceBernstein L.P., Attention: Legal & Compliance Department—Mutual Fund Legal, 1345 Avenue of the Americas, New York, NY 10105. |
| ** | There is no stated term of office for the Fund’s Directors. |
| *** | The information above includes each Director’s principal occupation during the last five years and other information relating to the experience, attributes, and skills relevant to each Director’s qualifications to serve as a Director, which led to the conclusion that each Director should serve as a Director for the Fund. |
| # | Mr. Keith is an “interested person” of the Fund, as defined in the 1940 Act, due to his position as a Senior Vice President of the Adviser. |
| ## | Member of the Audit Committee, the Governance and Nominating Committee, and the Independent Directors Committee. |
| ^ | Mr. Bermudez will be a member of the Audit Committee, the Governance and Nominating Committee, and the Independent Directors Committee when he joins the Board on January 1, 2020. |
26
| AB Variable Products Series Fund | ||
Officer Information
Certain information concerning the Portfolio’s Officers is listed below.
| NAME, ADDRESS* AND AGE | PRINCIPAL POSITION(S) HELD WITH FUND | PRINCIPAL OCCUPATION DURING PAST FIVE YEARS | ||
Robert M. Keith 59 | President and Chief Executive Officer | See biography above. | ||
Bruce K. Aronow 53 | Vice President | Senior Vice President of the Adviser**, with which he has been associated since prior to 2015. He is also Chief Investment Officer of Small and SMID Cap Growth Equities. | ||
Esteban Gomez 36 | Vice President | Vice President of the Adviser**, with which he has been associated in a substantially similar capacity since 2016. Before joining the Adviser in 2016, he spent three years at J.P. Morgan as an equity research analyst on the Broadlines Retailing, Apparel/Footwear & Specialty Equity Research Team. | ||
Samantha S. Lau 47 | Vice President | Senior Vice President of the Adviser**, with which she has been associated since prior to 2015. She is also Co-Chief Investment Officer of US Small/SMID Cap Growth Equities. | ||
Heather Pavlak 36 | Vice President | Vice President of the Adviser**, with which she has been associated in a substantially similar capacity since 2018. Before joining the Adviser in 2018, she spent four years at Schroders Investment Management, where she covered materials, utilities and transports as an equity research analyst. | ||
Wen-Tse Tseng 54 | Vice President | Senior Vice President of the Adviser**, with which he has been associated since prior to 2015. | ||
Emilie D. Wrapp 64 | Secretary | Senior Vice President, Assistant General Counsel and Assistant Secretary of ABI**, with which she has been associated since prior to 2015. | ||
Michael B. Reyes 43 | Senior Analyst | Vice President of the Adviser**, with which he has been associated since prior to 2015. | ||
Joseph J. Mantineo 60 | Treasurer and Chief Financial Officer | Senior Vice President of AllianceBernstein Investor Services, Inc. (“ABIS”)**, with which he has been associated since prior to 2015. | ||
Phyllis J. Clarke 59 | Controller | Vice President of ABIS**, with which she has been associated since prior to 2015. | ||
Vincent S. Noto 55 | Chief Compliance Officer | Senior Vice President since 2015 and Mutual Fund Chief Compliance Officer of the Adviser** since prior to 2015. |
| * | The address for each of the Portfolio’s Officers is 1345 Avenue of the Americas, New York, NY 10105. |
| ** | The Adviser, ABI and ABIS are affiliates of the Fund. |
| The Fund’s Statement of Additional Information (SAI) has additional information about the Fund’s Directors and Officers and is available without charge upon request. Contact your financial representative or the Adviser at(800) 227-4618, or visit www. abfunds.com, for a free prospectus or SAI. |
27
| SMALL CAP GROWTH PORTFOLIO | ||
| CONTINUANCE DISCLOSURE | AB Variable Products Series Fund | |
INFORMATION REGARDING THE REVIEW AND APPROVAL OF THE FUND’S ADVISORY AGREEMENT
The disinterested directors (the “directors”) of AB Variable Products Series Fund, Inc. (the “Company”) unanimously approved the continuance of the Company’s Advisory Agreement with the Adviser in respect of AB Small Cap Growth Portfolio (the “Fund”) at a meeting held on May7-9, 2019 (the “Meeting”).
Prior to approval of the continuance of the Advisory Agreement, the directors had requested from the Adviser, and received and evaluated, extensive materials. They reviewed the proposed continuance of the Advisory Agreement with the Adviser and with experienced counsel who are independent of the Adviser, who advised on the relevant legal standards. The directors also reviewed additional materials, including comparative analytical data prepared by the Senior Analyst for the Fund. The directors also discussed the proposed continuance in private sessions with counsel.
The directors considered their knowledge of the nature and quality of the services provided by the Adviser to the Fund gained from their experience as directors or trustees of most of the registered investment companies advised by the Adviser, their overall confidence in the Adviser’s integrity and competence they have gained from that experience, the Adviser’s initiative in identifying and raising potential issues with the directors and its responsiveness, frankness and attention to concerns raised by the directors in the past, including the Adviser’s willingness to consider and implement organizational and operational changes designed to improve investment results and the services provided to the AB Funds. The directors noted that they have four regular meetings each year, at each of which they review extensive materials and information from the Adviser, including information on the investment performance of the Fund.
The directors also considered all factors they believed relevant, including the specific matters discussed below. During the course of their deliberations, the directors evaluated, among other things, the reasonableness of the advisory fee. The directors did not identify any particular information that wasall-important or controlling, and different directors may have attributed different weights to the various factors. The directors determined that the selection of the Adviser to manage the Fund and the overall arrangements between the Fund and the Adviser, as provided in the Advisory Agreement, including the advisory fee, were fair and reasonable in light of the services performed, expenses incurred and such other matters as the directors considered relevant in the exercise of their business judgment. The material factors and conclusions that formed the basis for the directors’ determinations included the following:
Nature, Extent and Quality of Services Provided
The directors considered the scope and quality of services provided by the Adviser under the Advisory Agreement, including the quality of the investment research capabilities of the Adviser and the other resources it has dedicated to performing services for the Fund. The directors noted that the Adviser from time to time reviews the Fund’s investment strategies and from time to time proposes changes intended to improve the Fund’s relative or absolute performance for the directors’ consideration. They also noted the professional experience and qualifications of the Fund’s portfolio management team and other senior personnel of the Adviser. The directors also considered that the Advisory Agreement provides that the Fund will reimburse the Adviser for the cost to it of providing certain clerical, accounting, administrative and other services to the Fund by employees of the Adviser or its affiliates. Requests for these reimbursements are made on a quarterly basis and subject to approval by the directors. Reimbursements, to the extent requested and paid, result in a higher rate of total compensation from the Fund to the Adviser than the fee rate stated in the Advisory Agreement. The directors noted that the methodology used to determine the reimbursement amounts had been reviewed by an independent consultant retained by the Fund’s former Senior Officer/Independent Compliance Officer. The quality of administrative and other services, including the Adviser’s role in coordinating the activities of the Fund’s other service providers, also was considered. The directors concluded that, overall, they were satisfied with the nature, extent and quality of services provided to the Fund under the Advisory Agreement.
Costs of Services Provided and Profitability
The directors reviewed a schedule of the revenues and expenses and related notes indicating the profitability of the Fund to the Adviser for calendar years 2017 and 2018 that had been prepared with an expense allocation methodology arrived at in consultation with an independent consultant retained by the Fund’s former Senior Officer/Independent Compliance Officer. The directors noted the assumptions and methods of allocation used by the Adviser in preparing fund-specific profitability data and understood that there are a number of potentially acceptable allocation methodologies for information of this type. The directors noted that the profitability information reflected all revenues and expenses of the Adviser’s relationship with the Fund, including those relating to its subsidiaries that provide transfer agency, distribution and brokerage services to the Fund. The directors recognized that it is difficult to make comparisons of the profitability of the Advisory Agreement with
28
| AB Variable Products Series Fund | ||
the profitability of advisory contracts for unaffiliated funds because comparative information is not generally publicly available and is affected by numerous factors. The directors focused on the profitability of the Adviser’s relationship with the Fund before taxes and distribution expenses. The directors concluded that the Adviser’s level of profitability from its relationship with the Fund was not unreasonable.
Fall-Out Benefits
The directors considered the other benefits to the Adviser and its affiliates from their relationships with the Fund and the underlying fund advised by the Adviser in which the Fund invests, including, but not limited to, benefits relating to soft dollar arrangements (whereby investment advisers receive brokerage and research services from brokers that execute agency transactions for their clients);12b-1 fees and sales charges received by the Fund’s principal underwriter (which is a wholly owned subsidiary of the Adviser) in respect of the Fund’s Class B shares; brokerage commissions paid by the Fund to brokers affiliated with the Adviser; and transfer agency fees paid by the Fund to a wholly owned subsidiary of the Adviser. The directors recognized that the Adviser’s profitability would be somewhat lower without these benefits. The directors understood that the Adviser also might derive reputational and other benefits from its association with the Fund.
Investment Results
In addition to the information reviewed by the directors in connection with the Meeting, the directors receive detailed performance information for the Fund at each regular Board meeting during the year.
At the Meeting, the directors reviewed performance information prepared by an independent service provider (the “15(c) service provider”), showing the performance of the Class A Shares of the Fund against a group of similar funds (“peer group”) and a larger group of similar funds (“peer universe”), each selected by the 15(c) service provider, and information prepared by the Adviser showing performance of the Class A Shares against a broad-based securities market index, in each case for the1-,3-,5- and10-year periods ended February 28, 2019 and (in the case of comparisons with the broad-based securities market index) for the period from inception. Based on their review, the directors concluded that the Fund’s investment performance was acceptable.
Advisory Fees and Other Expenses
The directors considered the advisory fee rate payable by the Fund to the Adviser and information prepared by the 15(c) service provider concerning advisory fee rates payable by other funds in the same category as the Fund. The directors recognized that it is difficult to make comparisons of advisory fees because there are variations in the services that are included in the fees paid by other funds. The directors compared the Fund’s contractual effective advisory fee rate with a peer group median and took into account the impact on the advisory fee rate of the administrative expense reimbursement paid to the Adviser in the latest fiscal year.
The directors also considered the Adviser’s fee schedule for other clients pursuing an investment strategy similar to the Fund’s. For this purpose, they reviewed the relevant advisory fee information from the Adviser’s Form ADV and in a report from the Fund’s Senior Analyst and noted the differences between the Fund’s fee schedule, on the one hand, and the Adviser’s institutional fee schedule and the schedule of fees charged by the Adviser to any offshore funds and for services to anysub-advised funds pursuing an investment strategy similar to the Fund’s, on the other. The directors noted that the Adviser may, in some cases, agree to fee rates with large institutional clients that are lower than those reviewed by the directors and that they had previously discussed with the Adviser its policies in respect of such arrangements. The directors previously discussed these matters with an independent fee consultant. The directors also compared the advisory fee rate for the Fund with those for two other funds advised by the Adviser with a similar investment strategy.
The Adviser reviewed with the directors the significantly greater scope of the services it provides to the Fund relative to institutional, offshore fund andsub-advised fund clients. In this regard, the Adviser noted, among other things, that, compared to institutional and offshore orsub-advisory accounts, the Fund (i) demands considerably more portfolio management, research and trading resources due to significantly higher daily cash flows; (ii) has more tax and regulatory restrictions and compliance obligations; (iii) must prepare and file or distribute regulatory and other communications about fund operations; and (iv) must provide shareholder servicing to retail investors. The Adviser also reviewed the greater legal risks presented by the large and changing population of Fund shareholders who may assert claims against the Adviser in individual or class actions, and the greater entrepreneurial risk in offering new fund products, which require substantial investment to launch, may not succeed, and generally must be priced to compete with larger, more established funds resulting in lack of profitability to the Adviser until a new fund achieves scale. In light of the substantial differences in services rendered by the
29
| SMALL CAP GROWTH PORTFOLIO | ||
| CONTINUANCE DISCLOSURE | ||
| (continued) | AB Variable Products Series Fund | |
Adviser to institutional, offshore fund andsub-advised fund clients as compared to the Fund, and the different risk profile, the directors considered these fee comparisons inapt and did not place significant weight on them in their deliberations.
The directors noted that the Fund may invest in shares of exchange-traded funds (“ETFs”), subject to the restrictions and limitations of the Investment Company Act of 1940 as these may be varied as a result of exemptive orders issued by the SEC. The directors also noted that ETFs pay advisory fees pursuant to their advisory contracts. The directors concluded, based on the Adviser’s explanation of how it uses ETFs when they are the most cost-effective way to obtain desired exposures, in some cases pending purchases of underlying securities, that the advisory fee for the Fund would be for services that would be in addition to, rather than duplicative of, the services provided under the advisory contracts of the ETFs.
In connection with their review of the Fund’s advisory fee, the directors also considered the total expense ratio of the Class A shares of the Fund in comparison to a peer group and a peer universe selected by the 15(c) service provider. The Class A expense ratio of the Fund was based on the Fund’s latest fiscal year and the directors considered the Adviser’s expense cap for the Fund. The directors noted that it was likely that the expense ratios of some of the other funds in the Fund’s category were lowered by waivers or reimbursements by those funds’ investment advisers, which in some cases might be voluntary or temporary. The directors view expense ratio information as relevant to their evaluation of the Adviser’s services because the Adviser is responsible for coordinating services provided to the Fund by others. The directors noted that the Fund’s expense ratio was above the medians. After reviewing and discussing the Adviser’s explanations of the reasons for this, the directors concluded that the Fund’s expense ratio was acceptable.
Economies of Scale
The directors noted that the advisory fee schedule for the Fund contains breakpoints that reduce the fee rates on assets above specified levels. The directors took into consideration prior presentations by an independent consultant on economies of scale in the mutual fund industry and for the AB Funds, and presentations from time to time by the Adviser concerning certain of its views on economies of scale. The directors also previously discussed economies of scale with an independent fee consultant. The directors also had requested and received from the Adviser certain updates on economies of scale in advance of the Meeting. The directors believe that economies of scale may be realized (if at all) by the Adviser across a variety of products and services, and not only in respect of a single fund. The directors noted that there is no established methodology for setting breakpoints that give effect to the fund-specific services provided by a fund’s adviser and to the economies of scale that an adviser may realize in its overall mutual fund business or those components of it which directly or indirectly affect a fund’s operations. The directors observed that in the mutual fund industry as a whole, as well as among funds similar to the Fund, there is no uniformity or pattern in the fees and asset levels at which breakpoints (if any) apply. The directors also noted that the advisory agreements for many funds do not have breakpoints at all. Having taken these factors into account, the directors concluded that the Fund’s shareholders would benefit from a sharing of economies of scale in the event the Fund’s net assets exceed a breakpoint in the future.
30
VPS-SCG-0151-1219
DEC 12.31.19

ANNUAL REPORT
AB VARIABLE PRODUCTS
SERIES FUND, INC.
| + | SMALL/MID CAP VALUE PORTFOLIO |
Beginning on May 1, 2021, as permitted by regulations adopted by the Securities and Exchange Commission, you may not be receiving paper copies of the Portfolio’s shareholder reports from the insurance company that offers your contract unless you specifically request paper copies from the insurance company or from your financial intermediary. Instead of delivering paper copies of the reports, the insurance company may choose to make the reports available on a website, and will notify you by mail each time a report is posted and provide you with a website link to access the report. Instructions for requesting paper copies will be provided by your insurance company.
If you already elected to receive shareholder reports electronically, you will not be affected by this change and you need not take any action. You may elect to receive shareholder reports and other communications from the insurance company or your financial intermediary electronically by following the instructions provided by the insurance company or by contacting your financial intermediary.
You may elect to receive all future reports in paper free of charge from the insurance company. You can inform the insurance company or your financial intermediary that you wish to continue receiving paper copies of your shareholder reports by following the instructions provided by the insurance company or by contacting your financial intermediary. Your election to receive reports in paper will apply to all portfolio companies available under your contract with the insurance company.
Investment Products Offered
| • | Are Not FDIC Insured |
| • | May Lose Value |
| • | Are Not Bank Guaranteed |
AllianceBernstein Investments, Inc. (ABI) is the distributor of the AB family of mutual funds. ABI is a member of FINRA and is an affiliate of AllianceBernstein L.P., the Adviser of the funds.
You may obtain a description of the Fund’s proxy voting policies and procedures, and information regarding how the Fund voted proxies relating to portfolio securities during the most recent12-month period ended June 30, without charge. Simply visit AB’s website at www.abfunds.com or go to the Securities and Exchange Commission’s (the “Commission”) website at www.sec.gov, or call AB at (800) 227 4618.
The Fund files its complete schedule of portfolio holdings with the Commission for the first and third quarters of each fiscal year as an exhibit to its reports on Form N-PORT. The Fund’s Form N-PORT reports are available on the Commission’s website at www.sec.gov. The Fund’s Forms N-PORT may also be reviewed and copied at the Commission’s Public Reference Room in Washington, DC; information on the operation of the Public Reference Room may be obtained by calling (800) SEC 0330.
The [A/B] logo is a registered service mark of AllianceBernstein and AllianceBernstein® is a registered service mark used by permission of the owner, AllianceBernstein L.P.
| SMALL/MID CAP VALUE PORTFOLIO | AB Variable Products Series Fund | |
LETTER TO INVESTORS
February 14, 2020
The following is an update of AB Variable Products Series Fund—Small/Mid Cap Value Portfolio (the “Portfolio”) for the annual reporting period ended December 31, 2019.
INVESTMENT OBJECTIVE AND POLICIES
The Portfolio’s investment objective is long-term growth of capital. The Portfolio invests primarily in a diversified portfolio of equity securities of small- tomid-capitalization US companies. Under normal circumstances, the Portfolio invests at least 80% of its net assets in securities of small- tomid-capitalization companies. Because the Portfolio’s definition of small- tomid-capitalization companies is dynamic, the lower and upper limits on market capitalization will change with the markets. The Portfolio invests in companies that are determined by the Adviser to be undervalued, using the Adviser’s fundamental value approach. In selecting securities for the Portfolio’s portfolio, the Adviser uses its fundamental and quantitative research to identify companies whose long-term earnings power is not reflected in the current market price of their securities.
The Portfolio may enter into derivatives transactions, such as options, futures contracts, forwards and swaps. The Portfolio may use options strategies involving the purchase and/or writing of various combinations of call and/or put options, including on individual securities and stock indices, futures contracts (including futures contracts on individual securities and stock indices) or shares of exchange-traded funds (“ETFs”). These transactions may be used, for example, to earn extra income, to adjust exposure to individual securities or markets, or to protect all or a portion of the Portfolio from a decline in value, sometimes within certain ranges.
The Portfolio may invest in securities issued bynon-US companies.
The Portfolio may, at times, invest in shares of ETFs in lieu of making direct investments in equity securities. ETFs may provide more efficient and economical exposure to the type of companies and geographic locations in which the Portfolio seeks to invest than direct investments.
INVESTMENT RESULTS
The table on page 3 shows the Portfolio’s performance compared to its primary benchmark, the Russell 2500 Value Index, in addition to the Russell 2500 Index, which representssmall/mid-cap stocks, for theone-, five- and10-year periods ended December 31, 2019.
All share classes of the Portfolio underperformed the primary benchmark and the Russell 2500 Index for the annual period. Stock selection in the industrials, materials and technology sectors detracted most, relative to the benchmark, while selection in consumer staples, utilities and consumer discretionary contributed. Overall sector selection contributed to performance. Overweights to consumer staples and consumer discretionary detracted, while an overweight to technology and an underweight to utilities added.
The Portfolio did not utilize derivatives during the annual period.
MARKET REVIEW AND INVESTMENT STRATEGY
Global equities recorded strong double-digit returns while emerging markets also rallied during the annual period ended December 31, 2019. After declining sharply at the end of 2018, equity markets rebounded dramatically in January as strong corporate earnings and optimism about a trade truce between the US and China calmed investors.Trade-war tensions resurfaced, however, and emerging geopolitical pressures drove market volatility. Tariff wars, restrictive monetary policy and a decline in industrial production stoked recessionary fears throughout the global economy. In response, the world’s central banks implemented accommodative monetary policies to help support capital markets. Late in the third quarter, equity market performance was accompanied by a sharp style rotation in the US. Quality-growth and lower-volatility stocks, which had been strong performers, lagged and value stocks outperformed. However, for the most part, growth stocks continued to outperform value over the entire period. From a market-capitalization perspective,large-cap stocks outperformed theirsmall-cap peers. In December, equity markets rallied on news that the US and China had agreed to a preliminaryphase-one trade deal due to be signed in January 2020.
The Portfolio’s Senior Investment Management Team (the “Team”) seeks to invest opportunistically in what it believes are undervalued companies with solid fundamentals, without sacrificing the Portfolio’s deep value discipline. The Team remains focused on attractively valued opportunities, which the Team believes are widespread across most industry sectors and regions. The Portfolio’s emphasis continues to be at the stock-specific level, as the Team looks for companies that offer compelling valuation, strong free cash flow and significant company-level catalysts.
1
| SMALL/MID CAP VALUE PORTFOLIO | ||
| DISCLOSURES AND RISKS | AB Variable Products Series Fund | |
Benchmark Disclosure
The Russell 2500® Value Index and the Russell 2500™ Index are unmanaged and do not reflect fees and expenses associated with the active management of a mutual fund portfolio. The Russell 2500 Value Index represents the performance of small- tomid-cap value companies within the US. The Russell 2500 Index represents the performance of 2,500 small- tomid-cap cap companies within the US. An investor cannot invest directly in an index, and its results are not indicative of the performance for any specific investment, including the Portfolio.
A Word About Risk
Market Risk:The value of the Portfolio’s assets will fluctuate as the stock or bond market fluctuates. The value of its investments may decline, sometimes rapidly and unpredictably, simply because of economic changes or other events that affect large portions of the market. It includes the risk that a particular style of investing, such as the Portfolio’s value approach, may underperform the market generally.
Capitalization Risk:Investments in small- andmid-capitalization companies may be more volatile than investments in large-capitalization companies. Investments in small-capitalization companies may have additional risks because these companies have limited product lines, markets or financial resources.
Foreign(Non-US) Risk:Investments in securities ofnon-US issuers may involve more risk than those of US issuers. These securities may fluctuate more widely in price and may be more difficult to trade or dispose of due to adverse market, economic, political, regulatory or other factors.
Currency Risk:Fluctuations in currency exchange rates may negatively affect the value of the Portfolio’s investments or reduce its returns.
Derivatives Risk:Derivatives may be difficult to price or unwind and leveraged so that small changes may produce disproportionate losses for the Portfolio. Derivatives may also be subject to counterparty risk to a greater degree than more traditional investments.
Management Risk:The Portfolio is subject to management risk because it is an actively managed investment fund. The Adviser will apply its investment techniques and risk analyses in making investment decisions for the Portfolio, but there is no guarantee that its techniques will produce the intended results.
These risks are fully discussed in the Variable Products prospectus. As with all investments, you may lose money by investing in the Portfolio.
An Important Note About Historical Performance
The investment return and principal value of an investment in the Portfolio will fluctuate, so that shares, when redeemed, may be worth more or less than their original cost. Performance shown in this report represents past performance and does not guarantee future results. Current performance may be lower or higher than the performance information shown. Please contact your financial advisor or insurance agent representative at your financial institution to obtain portfolio performance information current to the most recent month end.
Investors should consider the investment objectives, risks, charges and expenses of the Portfolio carefully before investing. For additional copies of the Portfolio’s prospectus or summary prospectus, which contains this and other information, call your financial advisor or (800) 227 4618. Please read the prospectus and/or summary prospectus carefully before investing.
All fees and expenses related to the operation of the Portfolio have been deducted, but no adjustment has been made for insurance company separate account or annuity contract charges, which would reduce total return to a contract owner. Performance assumes reinvestment of distributions and does not account for taxes.
There are additional fees and expenses associated with all Variable Products. These fees can include mortality and expense risk charges, administrative charges, and other charges that can significantly reduce investment returns. Those fees and expenses are not reflected in this annual report. You should consult your Variable Products prospectus for a description of those fees and expenses and speak to your insurance agent or financial representative if you have any questions. You should read the prospectus before investing or sending money.
2
| SMALL/MID CAP VALUE PORTFOLIO | ||
| HISTORICAL PERFORMANCE | AB Variable Products Series Fund | |
| THE PORTFOLIO VS. ITS BENCHMARKS | Net Asset Value Returns | |||||||||||
PERIODS ENDED DECEMBER 31, 2019 (unaudited) | 1 Year | 5 Years1 | 10 Years1 | |||||||||
| Small/Mid Cap Value Portfolio Class A | 20.10% | 6.42% | 11.01% | |||||||||
| Small/Mid Cap Value Portfolio Class B | 19.90% | 6.17% | 10.73% | |||||||||
| Primary Benchmark: Russell 2500 Value Index | 23.56% | 7.18% | 11.25% | |||||||||
| Russell 2500 Index | 27.77% | 8.93% | 12.58% | |||||||||
1 Average annual returns.
|
| |||||||||||
| Please keep in mind that high, double-digit returns are highly unusual and cannot be sustained. Investors should also be aware that these returns were primarily achieved during favorable market conditions. |
| |||||||||||
The Portfolio’s current prospectus fee table shows the Portfolio’s total annual operating expense ratios as 0.81% and 1.06% for Class A and Class B shares, respectively. The Financial Highlights section of this report sets forth expense ratio data for the current reporting period; the expense ratios shown above may differ from the expense ratios in the Financial Highlights section since they are based on different time periods.
GROWTH OF A $10,000 INVESTMENT
12/31/2009 TO 12/31/2019 (unaudited)
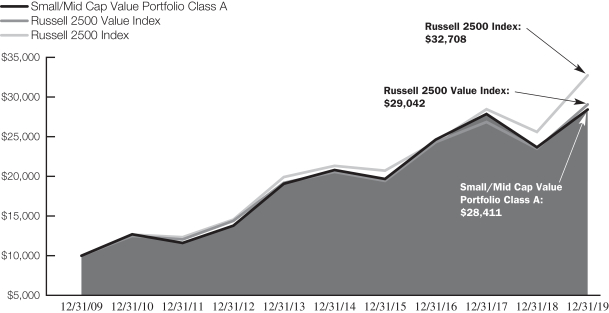
This chart illustrates the total value of an assumed $10,000 investment in the Small/Mid Cap Value Portfolio Class A shares (from 12/31/2009 to 12/31/2019) as compared to the performance of the Portfolio’s benchmarks. The chart assumes the reinvestment of dividends and capital gains distributions.
See Disclosures, Risks and Note about Historical Performance on page 2.
3
| SMALL/MID CAP VALUE PORTFOLIO | ||
| EXPENSE EXAMPLE (unaudited) | AB Variable Products Series Fund | |
As a shareholder of the Portfolio, you incur two types of costs: (1) transaction costs, including sales charges (loads) on purchase payments, contingent deferred sales charges on redemptions and (2) ongoing costs, including management fees; distribution(12b-1) fees; and other Portfolio expenses. This example is intended to help you understand your ongoing costs (in dollars) of investing in the Portfolio and to compare these costs with the ongoing costs of investing in other mutual funds.
The Example is based on an investment of $1,000 invested at the beginning of the period and held for the entire period as indicated below.
Actual Expenses
The table below provides information about actual account values and actual expenses. You may use the information in this line, together with the amount you invested, to estimate the expenses that you paid over the period. Simply divide your account value by $1,000 (for example, an $8,600 account value divided by $1,000 = 8.6), then multiply the result by the number in the first line under the heading entitled “Expenses Paid During Period” to estimate the expenses you paid on your account during this period. The estimate of expenses does not include fees or other expenses of any variable insurance product. If such expenses were included, the estimate of expenses you paid during the period would be higher and your ending account value would be lower.
Hypothetical Example for Comparison Purposes
The table below provides information about hypothetical account values and hypothetical expenses based on the Portfolio’s actual expense ratio and an assumed annual rate of return of 5% before expenses, which is not the Portfolio’s actual return. The hypothetical account values and expenses may not be used to estimate the actual ending account balance or expenses you paid for the period. You may use this information to compare the ongoing costs of investing in the Portfolio and other funds by comparing this 5% hypothetical example with the 5% hypothetical examples that appear in the shareholder reports of other funds. The estimate of expenses does not include fees or other expenses of any variable insurance product. If such expenses were included, the estimate of expenses you paid during the period would be higher and your ending account value would be lower.
Please note that the expenses shown in the table are meant to highlight your ongoing costs only and do not reflect any transactional costs, such as sales charges (loads), or contingent deferred sales charges on redemptions. Therefore, the second line of each class’ table is useful in comparing ongoing costs only, and will not help you determine the relative total costs of owning different funds. In addition, if these transactional costs were included, your costs would have been higher.
| Beginning Account Value July 1, 2019 | Ending Account Value December 31, 2019 | Expenses Paid During Period* | Annualized Expense Ratio* | |||||||||||||
Class A | ||||||||||||||||
Actual | $ | 1,000 | $ | 1,053.50 | $ | 4.30 | 0.83 | % | ||||||||
Hypothetical (5% annual return before expenses) | $ | 1,000 | $ | 1,021.02 | $ | 4.23 | 0.83 | % | ||||||||
Class B | ||||||||||||||||
Actual | $ | 1,000 | $ | 1,052.60 | $ | 5.59 | 1.08 | % | ||||||||
Hypothetical (5% annual return before expenses) | $ | 1,000 | $ | 1,019.76 | $ | 5.50 | 1.08 | % | ||||||||
| * | Expenses are equal to each classes’ annualized expense ratios, multiplied by the average account value over the period, multiplied by 184/365 (to reflect theone-half year period). |
4
| SMALL/MID CAP VALUE PORTFOLIO | ||
| TEN LARGEST HOLDINGS1 | ||
| December 31, 2019 (unaudited) | AB Variable Products Series Fund | |
| COMPANY | U.S. $ VALUE | PERCENT OF NET ASSETS | ||||||
US Foods Holding Corp. | $ | 10,984,647 | 1.8 | % | ||||
Zions Bancorp NA | 10,865,195 | 1.7 | ||||||
Reinsurance Group of America, Inc.—Class A | 10,200,544 | 1.6 | ||||||
Nomad Foods Ltd. | 10,145,287 | 1.6 | ||||||
BankUnited, Inc. | 9,633,853 | 1.5 | ||||||
NCR Corp. | 9,633,488 | 1.5 | ||||||
Alliant Energy Corp. | 9,600,679 | 1.5 | ||||||
Masonite International Corp. | 9,278,841 | 1.5 | ||||||
Everest Re Group Ltd. | 9,273,033 | 1.5 | ||||||
STAG Industrial, Inc. | 9,064,505 | 1.4 | ||||||
|
|
|
| |||||
| $ | 98,680,072 | 15.6 | % | |||||
SECTOR BREAKDOWN2
December 31, 2019 (unaudited)
| SECTOR | U.S. $ VALUE | PERCENT OF TOTAL INVESTMENTS | ||||||
Financials | $ | 140,096,137 | 22.1 | % | ||||
Information Technology | 92,174,974 | 14.5 | ||||||
Industrials | 86,369,989 | 13.6 | ||||||
Consumer Discretionary | 85,987,230 | 13.6 | ||||||
Real Estate | 80,130,106 | 12.6 | ||||||
Materials | 37,663,867 | 5.9 | ||||||
Consumer Staples | 36,465,249 | 5.7 | ||||||
Energy | 26,506,298 | 4.2 | ||||||
Utilities | 24,481,262 | 3.9 | ||||||
Health Care | 14,966,031 | 2.4 | ||||||
Communication Services | 4,346,000 | 0.7 | ||||||
Short-Term Investments | 5,072,307 | 0.8 | ||||||
|
|
|
| |||||
Total Investments | $ | 634,259,450 | 100.0 | % | ||||
| 1 | Long-term investments. |
| 2 | The Portfolio’s sector breakdown is expressed as a percentage of total investments (excluding security lending collateral) and may vary over time. |
Please note: The sector classifications presented herein are based on the Global Industry Classification Standard (GICS) which was developed by Morgan Stanley Capital International and Standard & Poor’s. The components are divided into sector, industry group, and industrysub-indices as classified by the GICS for each of the market capitalization indices in the broad market. These sector classifications are broadly defined. The “Portfolio of Investments” section of the report reflects more specific industry information and is consistent with the investment restrictions discussed in the Portfolio’s prospectus.
5
| SMALL/MID CAP VALUE PORTFOLIO | ||
| PORTFOLIO OF INVESTMENTS | ||
| December 31, 2019 | AB Variable Products Series Fund | |
| Company | Shares | U.S. $ Value | ||||||
COMMON STOCKS–99.2% | ||||||||
FINANCIALS–22.1% | ||||||||
BANKS–10.5% | ||||||||
Associated Banc–Corp. | 407,610 | $ | 8,983,724 | |||||
Comerica, Inc. | 102,560 | 7,358,680 | ||||||
Sterling Bancorp/DE | 358,320 | 7,553,386 | ||||||
Synovus Financial Corp. | 224,402 | 8,796,558 | ||||||
Texas Capital Bancshares, Inc.(a) | 125,252 | 7,110,556 | ||||||
Umpqua Holdings Corp. | 448,673 | 7,941,512 | ||||||
Webster Financial Corp. | 152,732 | 8,149,779 | ||||||
Zions Bancorp NA(b) | 209,268 | 10,865,195 | ||||||
|
| |||||||
| 66,759,390 | ||||||||
|
| |||||||
CONSUMER FINANCE–0.9% | ||||||||
OneMain Holdings, Inc. | 126,626 | 5,337,286 | ||||||
|
| |||||||
INSURANCE–8.1% | ||||||||
American Financial Group, Inc./OH | 74,420 | 8,160,153 | ||||||
Everest Re Group Ltd. | 33,496 | 9,273,033 | ||||||
First American Financial Corp. | 88,199 | 5,143,766 | ||||||
Hanover Insurance Group, Inc. (The) | 37,760 | 5,160,659 | ||||||
Kemper Corp. | 94,416 | 7,317,240 | ||||||
Old Republic International Corp. | 82,200 | 1,838,814 | ||||||
Reinsurance Group of America, Inc.–Class A | 62,557 | 10,200,544 | ||||||
Selective Insurance Group, Inc. | 65,115 | 4,244,847 | ||||||
|
| |||||||
| 51,339,056 | ||||||||
|
| |||||||
THRIFTS & MORTGAGE FINANCE–2.6% | ||||||||
BankUnited, Inc. | 263,508 | 9,633,853 | ||||||
Essent Group Ltd. | 135,152 | 7,026,552 | ||||||
|
| |||||||
| 16,660,405 | ||||||||
|
| |||||||
| 140,096,137 | ||||||||
|
| |||||||
INFORMATION TECHNOLOGY–14.5% | ||||||||
COMMUNICATIONS EQUIPMENT–0.9% | ||||||||
NetScout Systems, Inc.(a) | 236,809 | 5,699,993 | ||||||
|
| |||||||
ELECTRONIC EQUIPMENT, INSTRUMENTS & COMPONENTS–2.9% | ||||||||
Avnet, Inc. | 80,430 | 3,413,449 | ||||||
Belden, Inc. | 115,028 | 6,326,540 | ||||||
TTM Technologies, Inc.(a) | 457,343 | 6,883,012 | ||||||
Vishay Intertechnology, Inc.(b) | 87,610 | 1,865,217 | ||||||
|
| |||||||
| 18,488,218 | ||||||||
|
| |||||||
IT SERVICES–2.1% | ||||||||
Amdocs Ltd. | 95,643 | 6,904,468 | ||||||
Genpact Ltd. | 144,983 | 6,113,933 | ||||||
|
| |||||||
| 13,018,401 | ||||||||
|
| |||||||
| Company | Shares | U.S. $ Value | ||||||
SEMICONDUCTORS & SEMICONDUCTOR EQUIPMENT–3.2% | ||||||||
Cypress Semiconductor Corp. | 287,855 | $ | 6,715,657 | |||||
Kulicke & Soffa Industries, Inc. | 290,735 | 7,907,992 | ||||||
MaxLinear, Inc.–Class A(a) | 273,197 | 5,797,241 | ||||||
|
| |||||||
| 20,420,890 | ||||||||
|
| |||||||
SOFTWARE–3.9% | ||||||||
Cerence, Inc.(a) | 61,584 | 1,393,646 | ||||||
CommVault Systems, Inc.(a) | 156,778 | 6,998,570 | ||||||
Nuance Communications, Inc.(a) | 492,674 | 8,784,378 | ||||||
Verint Systems, Inc.(a) | 139,765 | 7,737,390 | ||||||
|
| |||||||
| 24,913,984 | ||||||||
|
| |||||||
TECHNOLOGY HARDWARE, STORAGE & PERIPHERALS–1.5% | ||||||||
NCR Corp.(a) | 273,990 | 9,633,488 | ||||||
|
| |||||||
| 92,174,974 | ||||||||
|
| |||||||
INDUSTRIALS–13.6% | ||||||||
AEROSPACE & DEFENSE–1.1% | ||||||||
AAR Corp. | 158,964 | 7,169,276 | ||||||
|
| |||||||
AIR FREIGHT & LOGISTICS–0.8% | ||||||||
Hub Group, Inc.–Class A(a) | 94,240 | 4,833,570 | ||||||
|
| |||||||
AIRLINES–3.5% | ||||||||
Alaska Air Group, Inc. | 131,624 | 8,917,526 | ||||||
Hawaiian Holdings, Inc. | 220,076 | 6,446,026 | ||||||
SkyWest, Inc. | 102,283 | 6,610,550 | ||||||
|
| |||||||
| 21,974,102 | ||||||||
|
| |||||||
BUILDING PRODUCTS–1.5% | ||||||||
Masonite International Corp.(a) | 128,498 | 9,278,841 | ||||||
|
| |||||||
CONSTRUCTION & ENGINEERING–1.7% | ||||||||
Quanta Services, Inc. | 183,321 | 7,462,998 | ||||||
Tutor Perini Corp.(a)(b) | 242,178 | 3,114,409 | ||||||
|
| |||||||
| 10,577,407 | ||||||||
|
| |||||||
ELECTRICAL EQUIPMENT–1.8% | ||||||||
EnerSys | 99,917 | 7,476,789 | ||||||
Regal Beloit Corp. | 49,411 | 4,230,076 | ||||||
|
| |||||||
| 11,706,865 | ||||||||
|
| |||||||
MACHINERY–1.7% | ||||||||
Kennametal, Inc. | 169,453 | 6,251,121 | ||||||
Terex Corp. | 158,910 | 4,732,340 | ||||||
|
| |||||||
| 10,983,461 | ||||||||
|
| |||||||
ROAD & RAIL–0.8% | ||||||||
Knight-Swift Transportation Holdings, Inc.(b) | 148,580 | 5,325,107 | ||||||
|
| |||||||
TRADING COMPANIES & DISTRIBUTORS–0.7% | ||||||||
MRC Global, Inc.(a) | 331,478 | 4,521,360 | ||||||
|
| |||||||
| 86,369,989 | ||||||||
|
| |||||||
6
| AB Variable Products Series Fund | ||
| Company | Shares | U.S. $ Value | ||||||
CONSUMER DISCRETIONARY–13.6% | ||||||||
AUTO COMPONENTS–2.9% | ||||||||
Cooper-Standard Holdings, Inc.(a) | 105,281 | $ | 3,491,118 | |||||
Dana, Inc. | 438,378 | 7,978,480 | ||||||
Lear Corp.(b) | 51,511 | 7,067,309 | ||||||
|
| |||||||
| 18,536,907 | ||||||||
|
| |||||||
DIVERSIFIED CONSUMER SERVICES–0.4% | ||||||||
Houghton Mifflin Harcourt Co.(a) | 436,915 | 2,730,719 | ||||||
|
| |||||||
HOTELS, RESTAURANTS & LEISURE–2.3% | ||||||||
Bloomin’ Brands, Inc. | 316,015 | 6,974,451 | ||||||
Papa John’s International, Inc.(b) | 122,413 | 7,730,381 | ||||||
|
| |||||||
| 14,704,832 | ||||||||
|
| |||||||
HOUSEHOLD DURABLES–2.2% | ||||||||
Lennar Corp.–Class A | 124,873 | 6,966,664 | ||||||
Taylor Morrison Home Corp.–Class A(a) | 320,779 | 7,012,229 | ||||||
|
| |||||||
| 13,978,893 | ||||||||
|
| |||||||
LEISURE PRODUCTS–2.1% | ||||||||
Brunswick Corp./DE | 130,976 | 7,855,941 | ||||||
Callaway Golf Co.(b) | 256,821 | 5,444,605 | ||||||
|
| |||||||
| 13,300,546 | ||||||||
|
| |||||||
SPECIALTY RETAIL–2.0% | ||||||||
Foot Locker, Inc. | 139,642 | 5,444,642 | ||||||
Michaels Cos., Inc. (The)(a)(b) | 199,366 | 1,612,871 | ||||||
Signet Jewelers Ltd.(b) | 149,280 | 3,245,347 | ||||||
Williams-Sonoma, Inc.(b) | 28,358 | 2,082,611 | ||||||
|
| |||||||
| 12,385,471 | ||||||||
|
| |||||||
TEXTILES, APPAREL & LUXURY GOODS–1.7% | ||||||||
Capri Holdings Ltd.(a)(b) | 122,812 | 4,685,278 | ||||||
Skechers U.S.A., Inc.–Class A(a) | 131,155 | 5,664,584 | ||||||
|
| |||||||
| 10,349,862 | ||||||||
|
| |||||||
| 85,987,230 | ||||||||
|
| |||||||
REAL ESTATE–12.6% | ||||||||
EQUITY REAL ESTATE INVESTMENT TRUSTS (REITS)–12.6% | ||||||||
American Campus Communities, Inc. | 170,675 | 8,026,845 | ||||||
Americold Realty Trust | 190,839 | 6,690,815 | ||||||
Camden Property Trust | 79,288 | 8,412,457 | ||||||
Cousins Properties, Inc. | 192,335 | 7,924,202 | ||||||
CubeSmart | 280,094 | 8,817,359 | ||||||
Easterly Government Properties, Inc. | 238,683 | 5,663,948 | ||||||
| Company | Shares | U.S. $ Value | ||||||
Empire State Realty Trust, Inc.–Class A | 312,522 | $ | 4,362,807 | |||||
MGM Growth Properties LLC–Class A(b) | 247,550 | 7,666,623 | ||||||
Park Hotels & Resorts, Inc. | 234,385 | 6,063,540 | ||||||
STAG Industrial, Inc. | 287,124 | 9,064,505 | ||||||
Sun Communities, Inc. | 49,547 | 7,437,005 | ||||||
|
| |||||||
| 80,130,106 | ||||||||
|
| |||||||
MATERIALS–5.9% | ||||||||
CHEMICALS–2.4% | ||||||||
Orion Engineered Carbons SA | 287,707 | 5,552,745 | ||||||
Trinseo SA(b) | 119,280 | 4,438,409 | ||||||
Westlake Chemical Corp. | 75,328 | 5,284,259 | ||||||
|
| |||||||
| 15,275,413 | ||||||||
|
| |||||||
CONTAINERS & PACKAGING–2.0% | ||||||||
Graphic Packaging Holding Co. | 420,131 | 6,995,181 | ||||||
Sealed Air Corp. | 138,209 | 5,504,865 | ||||||
|
| |||||||
| 12,500,046 | ||||||||
|
| |||||||
METALS & MINING–1.5% | ||||||||
Alcoa Corp.(a) | 202,129 | 4,347,795 | ||||||
Carpenter Technology Corp. | 111,302 | 5,540,613 | ||||||
|
| |||||||
| 9,888,408 | ||||||||
|
| |||||||
| 37,663,867 | ||||||||
|
| |||||||
CONSUMER STAPLES–5.7% | ||||||||
BEVERAGES–1.1% | ||||||||
Cott Corp. | 533,765 | 7,301,905 | ||||||
|
| |||||||
FOOD & STAPLES RETAILING–1.7% | ||||||||
US Foods Holding Corp.(a) | 262,226 | 10,984,647 | ||||||
|
| |||||||
FOOD PRODUCTS–2.9% | ||||||||
Hain Celestial Group, Inc. (The)(a)(b) | 309,513 | 8,033,410 | ||||||
Nomad Foods Ltd.(a) | 453,522 | 10,145,287 | ||||||
|
| |||||||
| 18,178,697 | ||||||||
|
| |||||||
| 36,465,249 | ||||||||
|
| |||||||
ENERGY���4.2% | ||||||||
ENERGY EQUIPMENT & SERVICES–2.4% | ||||||||
Dril-Quip, Inc.(a)(b) | 105,454 | 4,946,847 | ||||||
Oil States International, Inc.(a) | 270,341 | 4,409,262 | ||||||
Patterson-UTI Energy, Inc. | 373,344 | 3,920,112 | ||||||
RPC, Inc.(b) | 372,210 | 1,950,380 | ||||||
|
| |||||||
| 15,226,601 | ||||||||
|
| |||||||
OIL, GAS & CONSUMABLE FUELS–1.8% | ||||||||
Cimarex Energy Co. | 46,403 | 2,435,694 | ||||||
HollyFrontier Corp. | 113,545 | 5,757,867 | ||||||
QEP Resources, Inc. | 685,808 | 3,086,136 | ||||||
|
| |||||||
| 11,279,697 | ||||||||
|
| |||||||
| 26,506,298 | ||||||||
|
| |||||||
7
| SMALL/MID CAP VALUE PORTFOLIO | ||
| PORTFOLIO OF INVESTMENTS | ||
| (continued) | AB Variable Products Series Fund | |
| Company | Shares | U.S. $ Value | ||||||
UTILITIES–3.9% | ||||||||
ELECTRIC UTILITIES–2.4% | ||||||||
Alliant Energy Corp. | 175,451 | $ | 9,600,679 | |||||
PNM Resources, Inc. | 107,739 | 5,463,444 | ||||||
|
| |||||||
| 15,064,123 | ||||||||
|
| |||||||
GAS UTILITIES–0.6% | ||||||||
Southwest Gas Holdings, Inc. | 48,180 | 3,660,235 | ||||||
|
| |||||||
MULTI-UTILITIES–0.9% | ||||||||
Black Hills Corp. | 73,299 | 5,756,904 | ||||||
|
| |||||||
| 24,481,262 | ||||||||
|
| |||||||
HEALTH CARE–2.4% | ||||||||
HEALTH CARE PROVIDERS & SERVICES–1.2% | ||||||||
Molina Healthcare, Inc.(a) | 55,682 | 7,555,491 | ||||||
|
| |||||||
LIFE SCIENCES TOOLS & SERVICES–1.2% | ||||||||
ICON PLC(a) | 43,027 | 7,410,539 | ||||||
|
| |||||||
| 14,966,030 | ||||||||
|
| |||||||
COMMUNICATION SERVICES–0.7% | ||||||||
MEDIA–0.7% | ||||||||
Criteo SA (Sponsored ADR)(a) | 250,779 | 4,346,000 | ||||||
|
| |||||||
Total Common Stocks | 629,187,142 | |||||||
|
| |||||||
SHORT-TERM INVESTMENTS–0.8% | ||||||||
INVESTMENT COMPANIES–0.8% | ||||||||
AB Fixed Income Shares, Inc.–Government Money Market Portfolio–Class AB, 1.53%(c)(d)(e) | 5,072,308 | 5,072,308 | ||||||
|
| |||||||
TOTAL INVESTMENTS BEFORE SECURITY LENDING COLLATERAL FOR SECURITIES LOANED–100.0% | 634,259,450 | |||||||
|
| |||||||
| Company | Shares | U.S. $ Value | ||||||
INVESTMENTS OF CASH COLLATERAL FOR SECURITIES LOANED–0.2% | ||||||||
INVESTMENT COMPANIES–0.2% | ||||||||
AB Fixed Income Shares, Inc.–Government Money Market Portfolio–Class AB, 1.53%(c)(d)(e) | 1,053,619 | $ | 1,053,619 | |||||
|
| |||||||
TOTAL INVESTMENTS–100.2% | 635,313,069 | |||||||
Other assets less | (1,021,490 | ) | ||||||
|
| |||||||
NET ASSETS–100.0% | $ | 634,291,579 | ||||||
|
| |||||||
| (a) | Non-income producing security. |
| (b) | Represents entire or partial securities out on loan. See Note E for securities lending information. |
| (c) | Affiliated investments. |
| (d) | The rate shown represents the7-day yield as of period end. |
| (e) | To obtain a copy of the fund’s shareholder report, please go to the Securities and Exchange Commission’s website at www.sec.gov, or call AB at (800)227-4618. |
Glossary:
ADR—American Depositary Receipt
See notes to financial statements.
8
| SMALL/MID CAP VALUE PORTFOLIO | ||
| STATEMENT OF ASSETS & LIABILITIES | ||
| December 31, 2019 | AB Variable Products Series Fund | |
ASSETS | ||||
Investments in securities, at value | ||||
Unaffiliated issuers (cost $550,572,461) | $ | 629,187,142 | (a) | |
Affiliated issuers (cost $6,125,927—including investment of cash collateral for securities loaned of $1,053,619) | 6,125,927 | |||
Unaffiliated dividends receivable | 915,403 | |||
Receivable for capital stock sold | 148,605 | |||
Affiliated dividends receivable | 6,884 | |||
|
| |||
Total assets | 636,383,961 | |||
|
| |||
LIABILITIES | ||||
Payable for collateral received on securities loaned | 1,053,619 | |||
Advisory fee payable | 386,533 | |||
Payable for capital stock redeemed | 298,638 | |||
Payable for investment securities purchased | 132,040 | |||
Distribution fee payable | 86,312 | |||
Administrative fee payable | 21,886 | |||
Transfer Agent fee payable | 132 | |||
Accrued expenses | 113,222 | |||
|
| |||
Total liabilities | 2,092,382 | |||
|
| |||
NET ASSETS | $ | 634,291,579 | ||
|
| |||
COMPOSITION OF NET ASSETS | ||||
Capital stock, at par | $ | 35,672 | ||
Additionalpaid-in capital | 524,927,416 | |||
Distributable earnings | 109,328,491 | |||
|
| |||
| $ | 634,291,579 | |||
|
|
Net Asset Value Per Share—1 billion shares of capital stock authorized, $.001 par value
| Class | Net Assets | Shares Outstanding | Net Asset Value | |||||||||
| A | $ | 211,046,080 | 11,780,979 | $ | 17.91 | |||||||
| B | $ | 423,245,499 | 23,890,811 | $ | 17.72 | |||||||
| (a) | Includes securities on loan with a value of $72,060,347 (see Note E). |
See notes to financial statements.
9
| SMALL/MID CAP VALUE PORTFOLIO | ||
| STATEMENT OF OPERATIONS | ||
| Year Ended December 31, 2019 | AB Variable Products Series Fund | |
INVESTMENT INCOME | ||||
Dividends | ||||
Unaffiliated issuers (net of foreign taxes withheld of $46,871) | $ | 10,461,326 | ||
Affiliated issuers | 196,191 | |||
Securities lending income | 33,610 | |||
Interest | 40 | |||
|
| |||
| 10,691,167 | ||||
|
| |||
EXPENSES | ||||
Advisory fee (see Note B) | 4,642,641 | |||
Distribution fee—Class B | 1,033,350 | |||
Transfer agency—Class A | 2,473 | |||
Transfer agency—Class B | 4,971 | |||
Custodian | 127,310 | |||
Printing | 103,677 | |||
Administrative | 79,692 | |||
Legal | 57,541 | |||
Audit and tax | 46,794 | |||
Directors’ fees | 22,925 | |||
Miscellaneous | 25,519 | |||
|
| |||
Total expenses | 6,146,893 | |||
Less: expenses waived and reimbursed by the Adviser (see Notes B & E) | (9,667 | ) | ||
|
| |||
Net expenses | 6,137,226 | |||
|
| |||
Net investment income | 4,553,941 | |||
|
| |||
REALIZED AND UNREALIZED GAIN ON INVESTMENT TRANSACTIONS | ||||
Net realized gain on investment transactions | 27,134,530 | |||
Net change in unrealized appreciation/depreciation of investments | 79,052,203 | |||
|
| |||
Net gain on investment transactions | 106,186,733 | |||
|
| |||
NET INCREASE IN NET ASSETS FROM OPERATIONS | $ | 110,740,674 | ||
|
|
See notes to financial statements.
10
| SMALL/MID CAP VALUE PORTFOLIO | ||
| STATEMENT OF CHANGES IN NET ASSETS | AB Variable Products Series Fund | |
| Year Ended December 31, 2019 | Year Ended December 31, 2018 | |||||||
INCREASE (DECREASE) IN NET ASSETS FROM OPERATIONS | ||||||||
Net investment income | $ | 4,553,941 | $ | 3,007,885 | ||||
Net realized gain on investment transactions | 27,134,530 | 67,778,832 | ||||||
Net change in unrealized appreciation/depreciation of investments | 79,052,203 | (170,330,626 | ) | |||||
|
|
|
| |||||
Net increase (decrease) in net assets from operations | 110,740,674 | (99,543,909 | ) | |||||
Distributions to Shareholders | ||||||||
Class A | (23,904,178 | ) | (18,827,338 | ) | ||||
Class B | (47,150,231 | ) | (36,997,043 | ) | ||||
CAPITAL STOCK TRANSACTIONS | ||||||||
Net increase | 31,612,650 | 15,207,829 | ||||||
|
|
|
| |||||
Total increase (decrease) | 71,298,915 | (140,160,461 | ) | |||||
NET ASSETS | ||||||||
Beginning of period | 562,992,664 | 703,153,125 | ||||||
|
|
|
| |||||
End of period | $ | 634,291,579 | $ | 562,992,664 | ||||
|
|
|
| |||||
See notes to financial statements.
11
| SMALL/MID CAP VALUE PORTFOLIO | ||
| NOTES TO FINANCIAL STATEMENTS | ||
| December 31, 2019 | AB Variable Products Series Fund | |
NOTE A: Significant Accounting Policies
The AB Small/Mid Cap Value Portfolio (the “Portfolio”) is a series of AB Variable Products Series Fund, Inc. (the “Fund”). The Portfolio’s investment objective is long-term growth of capital. The Portfolio is diversified as defined under the Investment Company Act of 1940. The Fund was incorporated in the State of Maryland on November 17, 1987, as anopen-end series investment company. The Fund offers eleven separately managed pools of assets which have differing investment objectives and policies. The Portfolio offers Class A and Class B shares. Both classes of shares have identical voting, dividend, liquidating and other rights, except that Class B shares bear a distribution expense and have exclusive voting rights with respect to the Class B distribution plan.
The Portfolio offers and sells its shares only to separate accounts of certain life insurance companies for the purpose of funding variable annuity contracts and variable life insurance policies. Sales are made without a sales charge at the Portfolio’s net asset value per share.
The financial statements have been prepared in conformity with U.S. generally accepted accounting principles (“U.S. GAAP”) which require management to make certain estimates and assumptions that affect the reported amounts of assets and liabilities in the financial statements and amounts of income and expenses during the reporting period. Actual results could differ from those estimates. The Portfolio is an investment company under U.S. GAAP and follows the accounting and reporting guidance applicable to investment companies. The following is a summary of significant accounting policies followed by the Portfolio.
1. Security Valuation
Portfolio securities are valued at their current market value determined on the basis of market quotations or, if market quotations are not readily available or are deemed unreliable, at “fair value” as determined in accordance with procedures established by and under the general supervision of the Fund’s Board of Directors (the “Board”).
In general, the market values of securities which are readily available and deemed reliable are determined as follows: securities listed on a national securities exchange (other than securities listed on the NASDAQ Stock Market, Inc. (“NASDAQ”)) or on a foreign securities exchange are valued at the last sale price at the close of the exchange or foreign securities exchange. If there has been no sale on such day, the securities are valued at the last traded price from the previous day. Securities listed on more than one exchange are valued by reference to the principal exchange on which the securities are traded; securities listed only on NASDAQ are valued in accordance with the NASDAQ Official Closing Price; listed or over the counter (“OTC”) market put or call options are valued at the mid level between the current bid and ask prices. If either a current bid or current ask price is unavailable, AllianceBernstein L.P. (the “Adviser”) will have discretion to determine the best valuation (e.g., last trade price in the case of listed options); open futures are valued using the closing settlement price or, in the absence of such a price, the most recent quoted bid price. If there are no quotations available for the day of valuation, the last available closing settlement price is used; U.S. Government securities and any other debt instruments having 60 days or less remaining until maturity are generally valued at market by an independent pricing vendor, if a market price is available. If a market price is not available, the securities are valued at amortized cost. This methodology is commonly used for short term securities that have an original maturity of 60 days or less, as well as short term securities that had an original term to maturity that exceeded 60 days. In instances when amortized cost is utilized, the Valuation Committee (the “Committee”) must reasonably conclude that the utilization of amortized cost is approximately the same as the fair value of the security. Such factors the Committee will consider include, but are not limited to, an impairment of the creditworthiness of the issuer or material changes in interest rates. Fixed-income securities, including mortgage-backed and asset-backed securities, may be valued on the basis of prices provided by a pricing service or at a price obtained from one or more of the major broker-dealers. In cases where broker-dealer quotes are obtained, the Adviser may establish procedures whereby changes in market yields or spreads are used to adjust, on a daily basis, a recently obtained quoted price on a security. Swaps and other derivatives are valued daily, primarily using independent pricing services, independent pricing models using market inputs, as well as third party broker-dealers or counterparties. Open end mutual funds are valued at the closing net asset value per share, while exchange traded funds are valued at the closing market price per share.
Securities for which market quotations are not readily available (including restricted securities) or are deemed unreliable are valued at fair value as deemed appropriate by the Adviser. Factors considered in making this determination may include, but are not limited to, information obtained by contacting the issuer, analysts, analysis of the issuer’s financial statements or other available documents. In addition, the Portfolio may use fair value pricing for securities primarily traded innon-U.S. markets because most foreign markets close well before the Portfolio values its securities at 4:00 p.m., Eastern Time. The
12
| AB Variable Products Series Fund | ||
earlier close of these foreign markets gives rise to the possibility that significant events, including broad market moves, may have occurred in the interim and may materially affect the value of those securities. To account for this, the Portfolio generally values many of its foreign equity securities using fair value prices based on third party vendor modeling tools to the extent available.
2. Fair Value Measurements
In accordance with U.S. GAAP regarding fair value measurements, fair value is defined as the price that the Portfolio would receive to sell an asset or pay to transfer a liability in an orderly transaction between market participants at the measurement date. U.S. GAAP establishes a framework for measuring fair value, and a three-level hierarchy for fair value measurements based upon the transparency of inputs to the valuation of an asset or liability (including those valued based on their market values as described in Note A.1 above). Inputs may be observable or unobservable and refer broadly to the assumptions that market participants would use in pricing the asset or liability. Observable inputs reflect the assumptions market participants would use in pricing the asset or liability based on market data obtained from sources independent of the Portfolio. Unobservable inputs reflect the Portfolio’s own assumptions about the assumptions that market participants would use in pricing the asset or liability based on the best information available in the circumstances. Each investment is assigned a level based upon the observability of the inputs which are significant to the overall valuation. The three-tier hierarchy of inputs is summarized below.
| • | Level 1—quoted prices in active markets for identical investments |
| • | Level 2—other significant observable inputs (including quoted prices for similar investments, interest rates, prepayment speeds, credit risk, etc.) |
| • | Level 3—significant unobservable inputs (including the Portfolio’s own assumptions in determining the fair value of investments) |
Where readily available market prices or relevant bid prices are not available for certain equity investments, such investments may be valued based on similar publicly traded investments, movements in relevant indices since last available prices or based upon underlying company fundamentals and comparable company data (such as multiples to earnings or other multiples to equity). Where an investment is valued using an observable input, such as another publicly traded security, the investment will be classified as Level 2. If management determines that an adjustment is appropriate based on restrictions on resale, illiquidity or uncertainty, and such adjustment is a significant component of the valuation, the investment will be classified as Level 3. An investment will also be classified as Level 3 where management uses company fundamentals and other significant inputs to determine the valuation.
The following table summarizes the valuation of the Portfolio’s investments by the above fair value hierarchy levels as of December 31, 2019:
| Level 1 | Level 2 | Level 3 | Total | |||||||||||||
Investments in Securities: | ||||||||||||||||
Assets: | ||||||||||||||||
Common Stocks(a) | $ | 629,187,142 | $ | –0 | – | $ | –0 | – | $ | 629,187,142 | ||||||
Short-Term Investments | 5,072,308 | –0 | – | –0 | – | 5,072,308 | ||||||||||
Investments of Cash Collateral for Securities Loaned in Affiliated Money Market Fund | 1,053,619 | –0 | – | –0 | – | 1,053,619 | ||||||||||
Total Investments in Securities | 635,313,069 | –0 | – | –0 | – | 635,313,069 | ||||||||||
|
|
|
|
|
|
|
| |||||||||
Other Financial Instruments(b) | –0 | – | –0 | – | –0 | – | –0 | – | ||||||||
|
|
|
|
|
|
|
| |||||||||
Total | $ | 635,313,069 | $ | –0 | – | $ | –0 | – | $ | 635,313,069 | ||||||
|
|
|
|
|
|
|
| |||||||||
| (a) | See Portfolio of Investments for sector classifications. |
| (b) | Other financial instruments are derivative instruments, such as futures, forwards and swaps, which are valued at the unrealized appreciation/(depreciation) on the instrument. Other financial instruments may also include swaps with upfront premiums, options written and swaptions written which are valued at market value. |
13
| SMALL/MID CAP VALUE PORTFOLIO | ||
| NOTES TO FINANCIAL STATEMENTS | ||
| (continued) | AB Variable Products Series Fund | |
3. Currency Translation
Assets and liabilities denominated in foreign currencies and commitments under forward currency exchange contracts are translated into U.S. dollars at the mean of the quoted bid and ask prices of such currencies against the U.S. dollar. Purchases and sales of portfolio securities are translated into U.S. dollars at the rates of exchange prevailing when such securities were acquired or sold. Income and expenses are translated into U.S. dollars at rates of exchange prevailing when accrued.
Net realized gain or loss on foreign currency transactions represents foreign exchange gains and losses from sales and maturities of foreign fixed income investments, holding of foreign currencies, currency gains or losses realized between the trade and settlement dates on foreign investment transactions, and the difference between the amounts of dividends, interest and foreign withholding taxes recorded on the Portfolio’s books and the U.S. dollar equivalent amounts actually received or paid. Net unrealized currency gains and losses from valuing foreign currency denominated assets and liabilities at period end exchange rates are reflected as a component of net unrealized appreciation or depreciation of foreign currency denominated assets and liabilities.
4. Taxes
It is the Portfolio’s policy to meet the requirements of the Internal Revenue Code applicable to regulated investment companies and to distribute all of its investment company taxable income and net realized gains, if any, to shareholders. Therefore, no provisions for federal income or excise taxes are required. The Portfolio may be subject to taxes imposed by countries in which it invests. Such taxes are generally based on income and/or capital gains earned or repatriated. Taxes are accrued and applied to net investment income, net realized gains and net unrealized appreciation/depreciation as such income and/or gains are earned.
In accordance with U.S. GAAP requirements regarding accounting for uncertainties in income taxes, management has analyzed the Portfolio’s tax positions taken or expected to be taken on federal and state income tax returns for all open tax years (the current and the prior three tax years) and has concluded that no provision for income tax is required in the Portfolio’s financial statements.
5. Investment Income and Investment Transactions
Dividend income is recorded on theex-dividend date or as soon as the Portfolio is informed of the dividend. Interest income is accrued daily. Investment transactions are accounted for on the date the securities are purchased or sold. Investment gains or losses are determined on the identified cost basis. The Portfolio amortizes premiums and accretes discounts as adjustments to interest income.
6. Class Allocations
All income earned and expenses incurred by the Portfolio are borne on apro-rata basis by each outstanding class of shares, based on the proportionate interest in the Portfolio represented by the net assets of such class, except for class specific expenses which are allocated to the respective class. Expenses of the Fund are charged proportionately to each portfolio or based on other appropriate methods. Realized and unrealized gains and losses are allocated among the various share classes based on respective net assets.
7. Dividends and Distributions
Dividends and distributions to shareholders, if any, are recorded on theex-dividend date. Income dividends and capital gains distributions are determined in accordance with federal tax regulations and may differ from those determined in accordance with U.S. GAAP. To the extent these differences are permanent, such amounts are reclassified within the capital accounts based on their federal tax basis treatment; temporary differences do not require such reclassification.
NOTE B: Advisory Fee and Other Transactions with Affiliates
Under the terms of the investment advisory agreement, the Portfolio pays the Adviser an advisory fee at an annual rate of .75% of the first $2.5 billion, .65% of the next $2.5 billion and .60% in excess of $5 billion, of the Portfolio’s average daily net assets. The fee is accrued daily and paid monthly. The Adviser has agreed to waive its fees and bear certain expenses to the extent necessary to limit total operating expenses on an annual basis (the “Expense Caps”) to 1.20% and 1.45% of daily average net assets for Class A and Class B shares, respectively. For the year ended December 31, 2019, there were no expenses waived by the Adviser.
Pursuant to the investment advisory agreement, the Portfolio may reimburse the Adviser for certain legal and accounting services provided to the Portfolio by the Adviser. For the year ended December 31, 2019, the reimbursement for such services amounted to $79,692.
14
| AB Variable Products Series Fund | ||
The Portfolio compensates AllianceBernstein Investor Services, Inc. (“ABIS”), a wholly-owned subsidiary of the Adviser, under a Transfer Agency Agreement for providing personnel and facilities to perform transfer agency services for the Portfolio. Such compensation retained by ABIS amounted to $1,491 for the year ended December 31, 2019.
The Portfolio may invest in AB Government Money Market Portfolio (the “Government Money Market Portfolio”) which has a contractual annual advisory fee rate of .20% of the portfolio’s average daily net assets and bears its own expenses. The Adviser has contractually agreed to waive .10% of the advisory fee of Government Money Market Portfolio (resulting in a net advisory fee of .10%) until August 31, 2020. In connection with the investment by the Portfolio in Government Money Market Portfolio, the Adviser has contractually agreed to waive its advisory fee from the Portfolio in an amount equal to the Portfolio’s pro rata share of the effective advisory fee of Government Money Market Portfolio, as borne indirectly by the Portfolio as an acquired fund fee and expense. For the year ended December 31, 2019, such waiver amounted to $8,270.
A summary of the Portfolio’s transactions in AB mutual funds for the year ended December 31, 2019 is as follows:
Fund | Market Value 12/31/18 (000) | Purchases at Cost (000) | Sales Proceeds (000) | Market Value 12/31/19 (000) | Dividend Income (000) | |||||||||||||||
Government Money Market Portfolio | $ | 4,557 | $ | 122,208 | $ | 121,693 | $ | 5,072 | $ | 184 | ||||||||||
Government Money Market Portfolio* | 2,473 | 59,212 | 60,631 | 1,054 | 12 | |||||||||||||||
|
|
|
| |||||||||||||||||
Total | $ | 6,126 | $ | 196 | ||||||||||||||||
|
|
|
| |||||||||||||||||
| * | Investments of cash collateral for securities lending transactions (see Note E). |
During the second quarter of 2018, AXA S.A. (“AXA”), a French holding company for the AXA Group, a worldwide leader in life, property and casualty and health insurance and asset management, completed the sale of a minority stake in its subsidiary, AXA Equitable Holdings, Inc. (now named Equitable Holdings, Inc.)(“Equitable”), through an initial public offering. Equitable is the holding company for a diverse group of financial services companies, including an approximately 65.3% economic interest in the Adviser and a 100% interest in AllianceBernstein Corporation, the general partner of the Adviser. Since the initial sale, AXA has completed additional offerings, most recently during the fourth quarter of 2019. As a result, AXA currently owns 10.1% of the outstanding shares of common stock of Equitable, and no longer owns a controlling interest in Equitable. AXA previously announced its intention to sell its entire interest in Equitable over time, subject to market conditions and other factors (the “Plan”). Most of AXA’s remaining Equitable shares are to be delivered on redemption of AXA bonds mandatorily exchangeable into Equitable shares and maturing in May 2021. AXA retains sole discretion to determine the timing of any future sales of its remaining shares of Equitable common stock.
The latest transaction under the Plan, which occurred on November 13, 2019, resulted in the indirect transfer of a “controlling block” of voting securities of the Adviser (a “Change of Control Event”) and was deemed an “assignment” causing a termination of the Portfolio’s investment advisory agreement. In order to ensure that investment advisory services could continue uninterrupted in the event of a Change of Control Event, the Board previously approved a new investment advisory agreement with the Adviser, and shareholders of the Portfolio subsequently approved the new investment advisory agreement. This agreement became effective on November 13, 2019.
NOTE C: Distribution Plan
The Portfolio has adopted a Distribution Plan (the “Plan”) for Class B shares pursuant to Rule12b-1 under the Investment Company Act of 1940. Under the Plan, the Portfolio pays distribution and servicing fees to AllianceBernstein Investments, Inc. (the “Distributor”), a wholly-owned subsidiary of the Adviser, at an annual rate of up to .50% of the Portfolio’s average daily net assets attributable to Class B shares. The fees are accrued daily and paid monthly. The Board currently limits payments under the Plan to .25% of the Portfolio’s average daily net assets attributable to Class B shares. The Plan provides that the Distributor will use such payments in their entirety for distribution assistance and promotional activities.
The Portfolio is not obligated under the Plan to pay any distribution and servicing fees in excess of the amounts set forth above. The purpose of the payments to the Distributor under the Plan is to compensate the Distributor for its distribution services with respect to the sale of the Portfolio’s Class B shares. Since the Distributor’s compensation is not directly tied to its expenses, the amount of compensation received by it under the Plan during any year may be more or less than its actual expenses. For this reason, the Plan is characterized by the staff of the Securities and Exchange Commission as being of the “compensation” variety.
15
| SMALL/MID CAP VALUE PORTFOLIO | ||
| NOTES TO FINANCIAL STATEMENTS | ||
| (continued) | AB Variable Products Series Fund | |
In the event that the Plan is terminated or not continued, no distribution or servicing fees (other than current amounts accrued but not yet paid) would be owed by the Portfolio to the Distributor.
The Plan also provides that the Adviser may use its own resources to finance the distribution of the Portfolio’s shares.
NOTE D: Investment Transactions
Purchases and sales of investment securities (excluding short-term investments) for the year ended December 31, 2019 were as follows:
| Purchases | Sales | |||||||
Investment securities (excluding U.S. government securities) | $ | 201,888,987 | $ | 233,432,693 | ||||
U.S. government securities | –0– | –0– | ||||||
The cost of investments for federal income tax purposes, gross unrealized appreciation and unrealized depreciation are as follows:
Cost | $ | 558,527,420 | ||
|
| |||
Gross unrealized appreciation | $ | 130,820,310 | ||
Gross unrealized depreciation | (54,034,661 | ) | ||
|
| |||
Net unrealized appreciation | $ | 76,785,649 | ||
|
|
1. Derivative Financial Instruments
The Portfolio may use derivatives in an effort to earn income and enhance returns, to replace more traditional direct investments, to obtain exposure to otherwise inaccessible markets (collectively, “investment purposes”), or to hedge or adjust the risk profile of its portfolio.
The Portfolio did not engage in derivatives transactions for the year ended December 31, 2019.
2. Currency Transactions
The Portfolio may invest innon-U.S. Dollar-denominated securities on a currency hedged or unhedged basis. The Portfolio may seek investment opportunities by taking long or short positions in currencies through the use of currency-related derivatives, including forward currency exchange contracts, futures and options on futures, swaps, and other options. The Portfolio may enter into transactions for investment opportunities when it anticipates that a foreign currency will appreciate or depreciate in value but securities denominated in that currency are not held by the Portfolio and do not present attractive investment opportunities. Such transactions may also be used when the Adviser believes that it may be more efficient than a direct investment in a foreign currency-denominated security. The Portfolio may also conduct currency exchange contracts on a spot basis (i.e., for cash at the spot rate prevailing in the currency exchange market for buying or selling currencies).
NOTE E: Securities Lending
The Portfolio may enter into securities lending transactions. Under the Portfolio’s securities lending program, all loans of securities will be collateralized continually by cash collateral and/ornon-cash collateral.Non-cash collateral will include only securities issued or guaranteed by the U.S. government or its agencies or instrumentalities. The Portfolio cannot sell or repledge anynon-cash collateral, such collateral will not be reflected in the portfolio of investments. If a loan is collateralized by cash, the Portfolio will be compensated for the loan from a portion of the net return from the income earned on cash collateral after a rebate is paid to the borrower (in some cases, this rebate may be a “negative rebate” or fee paid by the borrower to the Portfolio in connection with the loan), and payments are made for fees of the securities lending agent and for certain other administrative expenses. If the Portfolio receivesnon-cash collateral, the Portfolio will receive a fee from the borrower generally equal to a negotiated percentage of the market value of the loaned securities. The Portfolio will have the right to call a loan and obtain the securities loaned at any time on notice to the borrower within the normal and customary settlement time for the securities. While the securities are on loan, the borrower is obligated to pay the Portfolio amounts equal to any income or other distributions from the securities. The Portfolio will not be able to exercise voting rights with respect to any securities during the existence of a loan, but will have the right to regain ownership of loaned securities in order to exercise voting or other ownership rights. Collateral received and securities loaned are marked to market daily to ensure that the securities loaned are secured by collateral. The lending agent currently invests the cash collateral received in Government Money Market Portfolio, an eligible money market vehicle, in accordance with the investment restrictions of the Portfolio, and as approved by the Board. The collateral received on securities loaned is recorded as an asset as well as a
16
| AB Variable Products Series Fund | ||
corresponding liability in the statement of assets and liabilities. The collateral will be adjusted the next business day to maintain the required collateral amount. The amounts of securities lending income from the borrowers and Government Money Market Portfolio are reflected in the statement of operations. When the Portfolio earns net securities lending income from Government Money Market Portfolio, the income is inclusive of a rebate expense paid to the borrower. In connection with the cash collateral investment by the Portfolio in Government Money Market Portfolio, the Adviser has agreed to waive a portion of the Portfolio’s share of the advisory fees of Government Money Market Portfolio, as borne indirectly by the Portfolio as an acquired fund fee and expense. When the Portfolio lends securities, its investment performance will continue to reflect changes in the value of the securities loaned. A principal risk of lending portfolio securities is that the borrower may fail to return the loaned securities upon termination of the loan and that the collateral will not be sufficient to replace the loaned securities. The lending agent has agreed to indemnify the Portfolio in the case of default of any securities borrower.
A summary of the Portfolio’s transactions surrounding securities lending for the year ended December 31, 2019 is as follows:
| Government Money Market Portfolio | ||||||||||||||||||||||
Market Value of on Loan* | Cash Collateral* | Market Value of | Income from | Income Earned | Advisory Fee Waived | |||||||||||||||||
| $ | 72,060,347 | $ | 1,053,619 | $ | 72,423,178 | $ | 33,610 | $ | 12,057 | $ | 1,397 | |||||||||||
| * | As of December 31, 2019. |
NOTE F: Capital Stock
Each class consists of 500,000,000 authorized shares. Transactions in capital shares for each class were as follows:
| SHARES | AMOUNT | |||||||||||||||||||
| Year Ended December 31, 2019 | Year Ended December 31, 2018 | Year Ended December 31, 2019 | Year Ended December 31, 2018 | |||||||||||||||||
Class A |
| |||||||||||||||||||
Shares sold | 1,099,281 | 871,353 | $ | 19,873,600 | $ | 18,001,497 | ||||||||||||||
Shares issued in reinvestment of dividends and distributions | 1,454,025 | 902,990 | 23,904,178 | 18,827,338 | ||||||||||||||||
Shares redeemed | (1,881,324 | ) | (1,440,937 | ) | (33,866,418 | ) | (30,577,505 | ) | ||||||||||||
|
|
|
|
|
|
|
| |||||||||||||
Net increase | 671,982 | 333,406 | $ | 9,911,360 | $ | 6,251,330 | ||||||||||||||
|
|
|
|
|
|
|
| |||||||||||||
Class B |
| |||||||||||||||||||
Shares sold | 1,763,040 | 1,658,064 | $ | 31,584,082 | $ | 33,516,890 | ||||||||||||||
Shares issued in reinvestment of dividends and distributions | 2,896,206 | 1,790,757 | 47,150,231 | 36,997,043 | ||||||||||||||||
Shares redeemed | (3,146,774 | ) | (2,929,462 | ) | (57,033,023 | ) | (61,557,434 | ) | ||||||||||||
|
|
|
|
|
|
|
| |||||||||||||
Net increase | 1,512,472 | 519,359 | $ | 21,701,290 | $ | 8,956,499 | ||||||||||||||
|
|
|
|
|
|
|
| |||||||||||||
At December 31, 2019, certain shareholders of the Portfolio owned 71% in aggregate of the Portfolio’s outstanding shares. Significant transactions by such shareholders, if any, may impact the Portfolio’s performance.
NOTE G: Risks Involved in Investing in the Portfolio
Capitalization Risk—Investments in small- andmid-capitalization companies may be more volatile than investments in large-capitalization companies. Investments in small-capitalization companies may have additional risks because these companies have limited product lines, markets or financial resources.
Foreign(Non-U.S.) Risk—Investments in securities ofnon-U.S. issuers may involve more risk than those of U.S. issuers. These securities may fluctuate more widely in price and may be more difficult to trade or dispose of due to adverse market, economic, political, regulatory or other factors.
Currency Risk—Fluctuations in currency exchange rates may negatively affect the value of the Portfolio’s investments or reduce its returns.
17
| SMALL/MID CAP VALUE PORTFOLIO | ||
| NOTES TO FINANCIAL STATEMENTS | ||
| (continued) | AB Variable Products Series Fund | |
Derivatives Risk—The Portfolio may enter into derivative transactions such as forwards, options, futures and swaps. Derivatives may be illiquid, difficult to price, and leveraged so that small changes may produce disproportionate losses for the Portfolio, and subject to counterparty risk to a greater degree than more traditional investments. Derivatives may result in significant losses, including losses that are far greater than the value of the derivatives reflected on the statement of assets and liabilities.
LIBOR Risk—The Portfolio may invest in certain debt securities, derivatives or other financial instruments that utilize the London Interbank Offered Rate, or “LIBOR,” as a “benchmark” or “reference rate” for various interest rate calculations. In July 2017, the United Kingdom Financial Conduct Authority, which regulates LIBOR, announced a desire to phase out the use of LIBOR by the end of 2021. Although financial regulators and industry working groups have suggested alternative reference rates, such as European Interbank Offer Rate (“EURIBOR”), Sterling Overnight Interbank Average Rate (“SONIA”) and Secured Overnight Financing Rate (“SOFR”), global consensus on alternative rates is lacking and the process for amending existing contracts or instruments to transition away from LIBOR remains unclear. The elimination of LIBOR or changes to other reference rates or any other changes or reforms to the determination or supervision of reference rates could have an adverse impact on the market for, or value of, any securities or payments linked to those reference rates, which may adversely affect the Portfolio’s performance and/or net asset value. Uncertainty and risk also remain regarding the willingness and ability of issuers and lenders to include revised provisions in new and existing contracts or instruments. Consequently, the transition away from LIBOR to other reference rates may lead to increased volatility and illiquidity in markets that are tied to LIBOR, fluctuations in values of LIBOR-related investments or investments in issuers that utilize LIBOR, increased difficulty in borrowing or refinancing and diminished effectiveness of hedging strategies, adversely affecting the Portfolio’s performance. Furthermore, the risks associated with the expected discontinuation of LIBOR and transition may be exacerbated if the work necessary to effect an orderly transition to an alternative reference rate is not completed in a timely manner. Because the usefulness of LIBOR as a benchmark could deteriorate during the transition period, these effects could occur prior to the end of 2021.
Indemnification Risk—In the ordinary course of business, the Portfolio enters into contracts that contain a variety of indemnifications. The Portfolio’s maximum exposure under these arrangements is unknown. However, the Portfolio has not had prior claims or losses pursuant to these indemnification provisions and expects the risk of loss thereunder to be remote. Therefore, the Portfolio has not accrued any liability in connection with these indemnification provisions.
NOTE H: Joint Credit Facility
A number ofopen-end mutual funds managed by the Adviser, including the Portfolio, participate in a $325 million revolving credit facility (the “Facility”) intended to provide short-term financing, if necessary, subject to certain restrictions in connection with abnormal redemption activity. Commitment fees related to the Facility are paid by the participating funds and are included in miscellaneous expenses in the statement of operations. The Portfolio did not utilize the Facility during the year ended December 31, 2019.
NOTE I: Distributions to Shareholders
The tax character of distributions paid during the fiscal years ended December 31, 2019 and December 31, 2018 were as follows:
| 2019 | 2018 | |||||||
Distributions paid from: | ||||||||
Ordinary income | $ | 7,298,543 | $ | 2,075,837 | ||||
Net long-term capital gains | 63,755,866 | 53,748,544 | ||||||
|
|
|
| |||||
Total taxable distributions | $ | 71,054,409 | $ | 55,824,381 | ||||
|
|
|
| |||||
As of December 31, 2019, the components of accumulated earnings/(deficit) on a tax basis were as follows:
Undistributed ordinary income | $ | 5,131,270 | ||
Undistributed capital gains | 27,411,574 | |||
Unrealized appreciation/(depreciation) | 76,785,649 | (a) | ||
|
| |||
Total accumulated earnings/(deficit) | $ | 109,328,493 | ||
|
|
| (a) | The difference between book-basis andtax-basis unrealized appreciation/(depreciation) is attributable primarily to the tax deferral of losses on wash sales. |
18
| AB Variable Products Series Fund | ||
For tax purposes, net realized capital losses may be carried over to offset future capital gains, if any. Funds are permitted to carry forward capital losses for an indefinite period, and such losses will retain their character as either short-term or long-term capital losses. As of December 31, 2019, the Portfolio did not have any capital loss carryforwards.
During the current fiscal year, there were no permanent differences that resulted in adjustments to distributable earnings or additional paid-in capital.
NOTE J: Recent Accounting Pronouncements
In August 2018, the Financial Accounting Standards Board issued an Accounting Standards Update, ASU2018-13, Fair Value Measurement (Topic 820), Disclosure Framework—Changes to the Disclosure Requirements for Fair Value Measurement which removes, modifies and adds disclosures to Topic 820. The amendments in this ASU2018-13 (“ASU”) apply to all entities that are required, under existing U.S. GAAP, to make disclosures about recurring or nonrecurring fair value measurements. The amendments in this ASU are effective for all entities for fiscal years, and interim periods within those fiscal years, beginning after December 15, 2019. Management has evaluated the impact of the amendments and elected to early adopt the ASU. The adoption of this ASU did not have a material impact on the disclosure and presentation of the financial statements of the Portfolio.
NOTE K: Subsequent Events
Management has evaluated subsequent events for possible recognition or disclosure in the financial statements through the date the financial statements are issued. Management has determined that there are no material events that would require disclosure in the Portfolio’s financial statements through this date.
19
| SMALL/MID CAP VALUE PORTFOLIO | ||
| FINANCIAL HIGHLIGHTS | AB Variable Products Series Fund | |
Selected Data For A Share Of Capital Stock Outstanding Throughout Each Period
| CLASS A | ||||||||||||||||||||
| Year Ended December 31, | ||||||||||||||||||||
| 2019 | 2018 | 2017 | 2016 | 2015 | ||||||||||||||||
Net asset value, beginning of period | $16.93 | $21.68 | $20.29 | $17.29 | $21.95 | |||||||||||||||
|
|
|
|
|
|
|
|
|
| |||||||||||
Income From Investment Operations | ||||||||||||||||||||
Net investment income (a) | .16 | (b) | .13 | (b) | .10 | (b) | .10 | (b)† | .11 | |||||||||||
Net realized and unrealized gain (loss) on investment transactions | 3.04 | (3.04 | ) | 2.41 | 4.09 | (1.11 | ) | |||||||||||||
|
|
|
|
|
|
|
|
|
| |||||||||||
Net increase (decrease) in net asset value from operations | 3.20 | (2.91 | ) | 2.51 | 4.19 | (1.00 | ) | |||||||||||||
|
|
|
|
|
|
|
|
|
| |||||||||||
Less: Dividends and Distributions | ||||||||||||||||||||
Dividends from net investment income | (.11 | ) | (.11 | ) | (.09 | ) | (.11 | ) | (.17 | ) | ||||||||||
Distributions from net realized gain on investment transactions | (2.11 | ) | (1.73 | ) | (1.03 | ) | (1.08 | ) | (3.49 | ) | ||||||||||
|
|
|
|
|
|
|
|
|
| |||||||||||
Total dividends and distributions | (2.22 | ) | (1.84 | ) | (1.12 | ) | (1.19 | ) | (3.66 | ) | ||||||||||
|
|
|
|
|
|
|
|
|
| |||||||||||
Net asset value, end of period | $17.91 | $16.93 | $21.68 | $20.29 | $17.29 | |||||||||||||||
|
|
|
|
|
|
|
|
|
| |||||||||||
Total Return | ||||||||||||||||||||
Total investment return based on net asset value (c)* | 20.10 | % | (15.03 | )% | 13.15 | % | 25.09 | %† | (5.49 | )% | ||||||||||
Ratios/Supplemental Data | ||||||||||||||||||||
Net assets, end of period (000’s omitted) | $211,046 | $188,052 | $233,652 | $231,197 | $191,388 | |||||||||||||||
Ratio to average net assets of: | ||||||||||||||||||||
Expenses, net of waivers/reimbursements | .82 | % | .81 | % | .81 | % | .82 | % | .82 | % | ||||||||||
Expenses, before waivers/reimbursements | .83 | % | .81 | % | .82 | % | .83 | % | .82 | % | ||||||||||
Net investment income | .90 | %(b) | .61 | %(b) | .47 | %(b) | .53 | %(b)† | .56 | % | ||||||||||
Portfolio turnover rate | 33 | % | 39 | % | 33 | % | 57 | % | 42 | % | ||||||||||
See footnote summary on page 21.
20
| AB Variable Products Series Fund | ||
Selected Data For A Share Of Capital Stock Outstanding Throughout Each Period
| CLASS B | ||||||||||||||||||||
| Year Ended December 31, | ||||||||||||||||||||
| 2019 | 2018 | 2017 | 2016 | 2015 | ||||||||||||||||
Net asset value, beginning of period | $16.75 | $21.48 | $20.12 | $17.15 | $21.79 | |||||||||||||||
|
|
|
|
|
|
|
|
|
| |||||||||||
Income From Investment Operations | ||||||||||||||||||||
Net investment income (a) | .12 | (b) | .07 | (b) | .05 | (b) | .05 | (b)† | .06 | |||||||||||
Net realized and unrealized gain (loss) on investment transactions | 3.02 | (3.02 | ) | 2.39 | 4.06 | (1.09 | ) | |||||||||||||
|
|
|
|
|
|
|
|
|
| |||||||||||
Net increase (decrease) in net asset value from operations | 3.14 | (2.95 | ) | 2.44 | 4.11 | (1.03 | ) | |||||||||||||
|
|
|
|
|
|
|
|
|
| |||||||||||
Less: Dividends and Distributions | ||||||||||||||||||||
Dividends from net investment income | (.06 | ) | (.05 | ) | (.05 | ) | (.06 | ) | (.12 | ) | ||||||||||
Distributions from net realized gain on investment transactions | (2.11 | ) | (1.73 | ) | (1.03 | ) | (1.08 | ) | (3.49 | ) | ||||||||||
|
|
|
|
|
|
|
|
|
| |||||||||||
Total dividends and distributions | (2.17 | ) | (1.78 | ) | (1.08 | ) | (1.14 | ) | (3.61 | ) | ||||||||||
|
|
|
|
|
|
|
|
|
| |||||||||||
Net asset value, end of period | $17.72 | $16.75 | $21.48 | $20.12 | $17.15 | |||||||||||||||
|
|
|
|
|
|
|
|
|
| |||||||||||
Total Return | ||||||||||||||||||||
Total investment return based on net asset value (c)* | 19.90 | % | (15.29 | )% | 12.85 | % | 24.79 | %† | (5.69 | )% | ||||||||||
Ratios/Supplemental Data | ||||||||||||||||||||
Net assets, end of period (000’s omitted) | $423,246 | $374,941 | $469,501 | $455,422 | $386,875 | |||||||||||||||
Ratio to average net assets of: | ||||||||||||||||||||
Expenses, net of waivers/reimbursements | 1.07 | % | 1.06 | % | 1.06 | % | 1.07 | % | 1.07 | % | ||||||||||
Expenses, before waivers/reimbursements | 1.08 | % | 1.06 | % | 1.07 | % | 1.08 | % | 1.07 | % | ||||||||||
Net investment income | .65 | %(b) | .36 | %(b) | .22 | %(b) | .28 | %(b)† | .31 | % | ||||||||||
Portfolio turnover rate. | 33 | % | 39 | % | 33 | % | 57 | % | 42 | % | ||||||||||
| (a) | Based on average shares outstanding. |
| (b) | Net of expenses waived/reimbursed by the Adviser. |
| (c) | Total investment return is calculated assuming an initial investment made at the net asset value at the beginning of the period, reinvestment of all dividends and distributions at net asset value during the period, and redemption on the last day of the period. Total return does not reflect (i) insurance company’s separate account related expense charges and (ii) the deductions of taxes that a shareholder would pay on Portfolio distributions or the redemption of Portfolio shares. Total investment return calculated for a period of less than one year is not annualized. |
| † | For the year ended December 31, 2016, the amount includes a refund for overbilling of prior years’ custody out of pocket fees as follows: |
Net Investment | Net Investment | Total | ||
| $.001 | .003% | .003% |
| * | Includes the impact of proceeds received and credited to the Portfolio resulting from class action settlements, which enhanced the Portfolio’s performance for the years ended December 31, 2018 and December 31, 2017 by .07% and .11%, respectively. |
See notes to financial statements.
21
| REPORT OF INDEPENDENT REGISTERED | ||
| PUBLIC ACCOUNTING FIRM | AB Variable Products Series Fund | |
To the Shareholders and the Board of Directors of AB Small/Mid Cap Value Portfolio:
Opinion on the Financial Statements
We have audited the accompanying statement of assets and liabilities of AB Small/Mid Cap Value Portfolio (the “Portfolio”) (one of the portfolios constituting AB Variable Products Series Fund, Inc. (the “Fund”)), including the portfolio of investments, as of December 31, 2019, and the related statement of operations for the year then ended, the statements of changes in net assets for each of the two years in the period then ended, the financial highlights for each of the five years in the period then ended and the related notes (collectively referred to as the “financial statements”). In our opinion, the financial statements present fairly, in all material respects, the financial position of the Portfolio (one of the portfolios constituting AB Variable Products Series Fund, Inc.) at December 31, 2019, the results of its operations for the year then ended, the changes in its net assets for each of the two years in the period then ended and its financial highlights for each of the five years in the period then ended, in conformity with U.S. generally accepted accounting principles.
Basis for Opinion
These financial statements are the responsibility of the Fund’s management. Our responsibility is to express an opinion on the Portfolio’s financial statements based on our audits. We are a public accounting firm registered with the Public Company Accounting Oversight Board (United States) (“PCAOB”) and are required to be independent with respect to the Fund in accordance with the U.S. federal securities laws and the applicable rules and regulations of the Securities and Exchange Commission and the PCAOB.
We conducted our audits in accordance with the standards of the PCAOB. Those standards require that we plan and perform the audit to obtain reasonable assurance about whether the financial statements are free of material misstatement, whether due to error or fraud. The Fund is not required to have, nor were we engaged to perform, an audit of the Fund’s internal control over financial reporting. As part of our audits, we are required to obtain an understanding of internal control over financial reporting, but not for the purpose of expressing an opinion on the effectiveness of the Fund’s internal control over financial reporting. Accordingly, we express no such opinion.
Our audits included performing procedures to assess the risks of material misstatement of the financial statements, whether due to error or fraud, and performing procedures that respond to those risks. Such procedures included examining, on a test basis, evidence regarding the amounts and disclosures in the financial statements. Our procedures included confirmation of securities owned as of December 31, 2019, by correspondence with the custodian and others or by other appropriate auditing procedures where replies from others were not received. Our audits also included evaluating the accounting principles used and significant estimates made by management, as well as evaluating the overall presentation of the financial statements. We believe that our audits provide a reasonable basis for our opinion.

We have served as the auditor of one or more of the AB investment companies since 1968.
New York, New York
February 14, 2020
22
| 2019 TAX INFORMATION(unaudited) | AB Variable Products Series Fund | |
For Federal income tax purposes, the following information is furnished with respect to the distributions paid by the Portfolio during the taxable year ended December 31, 2019. For corporate shareholders, 87.72% of dividends paid qualify for the dividends received deduction.
23
| SMALL/MID CAP VALUE PORTFOLIO | AB Variable Products Series Fund | |
| BOARD OF DIRECTORS | ||
Marshall C. Turner, Jr.(1),Chairman Jorge A. Bermudez^ Michael J. Downey(1) Nancy P. Jacklin(1) | Robert M. Keith,President and Carol C. McMullen(1) Garry L. Moody(1) Earl D. Weiner(1) | |
| OFFICERS | ||
James W. MacGregor(2),Vice President Erik A. Turenchalk(2)^^,Vice President Emilie D. Wrapp,Secretary Michael B. Reyes,Senior Analyst | Joseph J. Mantineo,Treasurer and Phyllis J. Clarke,Controller Vincent S. Noto, Chief Compliance Officer | |
| CUSTODIANAND ACCOUNTING AGENT | LEGAL COUNSEL | |
State Street Bank and Trust Company State Street Corporation CCB/5 1 Iron Street Boston, MA 02210 | Seward & Kissel LLP One Battery Park Plaza New York, NY 10004 | |
DISTRIBUTOR AllianceBernstein Investments, Inc. 1345 Avenue of the Americas New York, NY 10105 | TRANSFER AGENT AllianceBernstein Investor Services, Inc. P.O. Box 786003 San Antonio, TX 78278-6003 Toll-Free (800) 221-5672 | |
INDEPENDENT REGISTERED PUBLIC ACCOUNTING FIRM Ernst & Young LLP 5 Times Square New York, NY 10036 |
| (1) | Member of the Audit Committee, the Governance and Nominating Committee, and the Independent Directors Committee. |
| (2) | The day-to-day management of, and investment decisions for, the Portfolio’s portfolio are made by the Small/Mid-Cap Value Senior Investment Management Team. Messrs. MacGregor and Turenchalk^^ are the investment professionals with the most significant responsibility for the day-to-day management of the Portfolio’s portfolio. |
| ^ | Mr. Bermudez will be a member of the Audit Committee, the Governance and Nominating Committee, and the Independent Directors Committee when he joins the Board on January 1, 2020. |
| ^^ | Mr. Turenchalk will be a portfolio manager for the Portfolio, effective January 1, 2020. |
24
| SMALL/MID CAP VALUE PORTFOLIO | ||
| MANAGEMENT OF THE FUND | AB Variable Products Series Fund | |
Board of Directors Information
The business and affairs of the Fund are managed under the direction of the Board of Directors. Certain information concerning the Fund’s Directors is set forth below.
| NAME, ADDRESS*, AGE AND (YEAR FIRST ELECTED)** | PRINCIPAL OCCUPATION(S), DURING PAST FIVE YEARS AND OTHER INFORMATION*** | PORTFOLIOS IN AB FUND COMPLEX OVERSEEN BY DIRECTOR | OTHER PUBLIC COMPANY DIRECTORSHIPS CURRENTLY HELD BY DIRECTOR | |||||
| INTERESTED DIRECTOR | ||||||||
Robert M. Keith,# New York, NY 10105 59 (2010) | Senior Vice President of AllianceBernstein L.P. (the “Adviser”) and the head of AllianceBernstein Investments, Inc. (“ABI”) since July 2008; Director of ABI and President of the AB Mutual Funds. Previously, he served as Executive Managing Director of ABI from December 2006 to June 2008. Prior to joining ABI in 2006, Executive Managing Director of Bernstein Global Wealth Management, and prior thereto, Senior Managing Director and Global Head of Client Service and Sales of the Adviser’s institutional investment management business since 2004. Prior thereto, he was Managing Director and Head of North American Client Service and Sales in the Adviser’s institutional investment management business with which he had been associated since prior to 2004. | 91 | None | |||||
| INDEPENDENT DIRECTORS | ||||||||
| Marshall C. Turner, Jr.,## Chairman of the Board 78 (2005) | Private Investor since prior to 2015. Former Chairman and CEO of Dupont Photomasks, Inc. (components of semi-conductor manufacturing). He has extensive operating leadership, and venture capital investing experience, including five interim or full-time CEO roles, and prior service as general partner of institutional venture capital partnerships. He also has extensivenon-profit board leadership experience, and currently serves on the boards of two education and science-relatednon-profit organizations. He has served as a director of one AB Fund since 1992, and director or trustee of all AB Funds since 2005. He has been Chairman of the AB Funds since January 2014, and the Chairman of the Independent Directors Committees of such AB Funds since February 2014. | 91 | Xilinx, Inc. (programmable logic semi-conductors) since 2007 | |||||
25
| SMALL/MID CAP VALUE PORTFOLIO | ||
| MANAGEMENT OF THE FUND | ||
| (continued) | AB Variable Products Series Fund | |
| NAME, ADDRESS*, AGE AND (YEAR FIRST ELECTED)** | PRINCIPAL OCCUPATION(S), DURING PAST FIVE YEARS AND OTHER INFORMATION*** | PORTFOLIOS IN AB FUND COMPLEX OVERSEEN BY DIRECTOR | OTHER PUBLIC COMPANY DIRECTORSHIPS CURRENTLY HELD BY DIRECTOR | |||||
INDEPENDENT DIRECTORS (continued) | ||||||||
Jorge A. Bermudez,^ (2020) | Private investor since prior to 2015. Former Chief Risk Officer of Citigroup, Inc., a global financial services company, from November 2007 to March 2008, Chief Executive Officer of Citigroup’s Commercial Business Group in North America and Citibank Texas from 2005 to 2007, and a variety of other executive and leadership roles at various businesses within Citigroup prior to then; Chairman (2018) of the Texas A&M Foundation Board of Trustees (Trustee since 2013) and Chairman of the Smart Grid Center Board at Texas A&M University since 2012; director of, among others, Citibank N.A. from 2005 to 2008, the Federal Reserve Bank of Dallas, Houston Branch from 2009 to 2011, the Federal Reserve Bank of Dallas from 2011 to 2017, and the Electric Reliability Council of Texas from 2010 to 2016. He has served as director or trustee of the AB Funds since 2020. | 91 | Moody’s Corporation since April 2011 | |||||
Michael J. Downey,## (2005) | Private Investor since prior to 2015. Formerly, Chairman of The Asia Pacific Fund, Inc. (registered investment company) since prior to 2015 until January 2019. From 1987 until 1993, Chairman and CEO of Prudential Mutual Fund Management, director of the Prudential mutual funds, and member of the Executive Committee of Prudential Securities, Inc. He has served as a director or trustee of the AB Funds since 2005. | 91 | None | |||||
Nancy P. Jacklin,## (2006) | Private Investor since prior to 2015. Professorial Lecturer at the Johns Hopkins School of Advanced International Studies (2008–2015). U.S. Executive Director of the International Monetary Fund (which is responsible for ensuring the stability of the international monetary system), (December 2002–May 2006); Partner, Clifford Chance (1992–2002); Sector Counsel, International Banking and Finance, and Associate General Counsel, Citicorp (1985–1992); Assistant General Counsel (International), Federal Reserve Board of Governors (1982–1985); and Attorney Advisor, U.S. Department of the Treasury (1973–1982). Member of the Bar of the District of Columbia and of New York; and member of the Council on Foreign Relations. She has served as a director or trustee of the AB Funds since 2006 and has been Chair of the Governance and Nominating Committees of the AB Funds since August 2014. | 91 | None | |||||
26
| AB Variable Products Series Fund | ||
| NAME, ADDRESS*, AGE AND (YEAR FIRST ELECTED)** | PRINCIPAL OCCUPATION(S), DURING PAST FIVE YEARS AND OTHER INFORMATION*** | PORTFOLIOS IN AB FUND COMPLEX OVERSEEN BY DIRECTOR | OTHER PUBLIC COMPANY DIRECTORSHIPS CURRENTLY HELD BY DIRECTOR | |||||
INDEPENDENT DIRECTORS (continued) | ||||||||
Carol C. McMullen,## (2016) | Managing Director of Slalom Consulting (consulting) since 2014, private investor and member of the Advisory Board of Butcher Box (since 2018). Formerly, member, Partners Healthcare Investment Committee (2010–2019); Director of Norfolk & Dedham Group (mutual property and casualty insurance) from 2011 until November 2016; Director of Partners Community Physicians Organization (healthcare) from 2014 until December 2016; and Managing Director of The Crossland Group (consulting) from 2012 until 2013. She has held a number of senior positions in the asset and wealth management industries, including at Eastern Bank (where her roles included President of Eastern Wealth Management), Thomson Financial (Global Head of Sales for Investment Management), and Putnam Investments (where her roles included Chief Investment Officer, Core and Growth and Head of Global Investment Research). She has served on a number of private company andnon-profit boards, and as a director or trustee of the AB Funds since June 2016. | 91 | None | |||||
Garry L. Moody,## (2008) | Formerly, Partner, Deloitte & Touche LLP (1995–2008) where he held a number of senior positions, including Vice Chairman, and U.S. and Global Investment Management Practice Managing Partner; President, Fidelity Accounting and Custody Services Company (1993–1995), where he was responsible for accounting, pricing, custody and reporting for the Fidelity mutual funds; and Partner, Ernst & Young LLP (1975–1993), where he served as the National Director of Mutual Fund Tax Services and Managing Partner of its Chicago Office Tax department. He is a member of the Trustee Advisory Board of BoardIQ, a biweekly publication focused on issues and news affecting directors of mutual funds. He is also a member of the Investment Company Institute’s Board of Governors and the Independent Directors Council Governing Council. He has served as a director or trustee, and as Chairman of the Audit Committees, of the AB Funds since 2008. | 91 | None | |||||
27
| SMALL/MID CAP VALUE PORTFOLIO | ||
| MANAGEMENT OF THE FUND | ||
| (continued) | AB Variable Products Series Fund | |
| NAME, ADDRESS*, AGE AND (YEAR FIRST ELECTED)** | PRINCIPAL OCCUPATION(S), DURING PAST FIVE YEARS AND OTHER INFORMATION*** | PORTFOLIOS IN AB FUND COMPLEX OVERSEEN BY DIRECTOR | OTHER PUBLIC COMPANY DIRECTORSHIPS CURRENTLY HELD BY DIRECTOR | |||||
INDEPENDENT DIRECTORS (continued) | ||||||||
| Earl D. Weiner,## 80 (2007) | Senior Counsel since 2017, Of Counsel from 2007 to 2016, and Partner prior to then, of the law firm Sullivan & Cromwell LLP. He is a former member of the ABA Federal Regulation of Securities Committee Task Force to draft editions of the Fund Director’s Guidebook. He also serves as a director or trustee of variousnon-profit organizations and has served as Chairman or Vice Chairman of a number of them. He has served as a director or trustee of the AB Funds since 2007 and served as Chairman of the Governance and Nominating Committees of the AB Funds from 2007 until August 2014. | 91 | None | |||||
| * | The address for each of the Fund’s disinterested Directors is c/o AllianceBernstein L.P., Attention: Legal and Compliance Department—Mutual Fund Legal, 1345 Avenue of the Americas, New York, NY 10105. |
| ** | There is no stated term of office for the Fund’s Directors. |
| *** | The information above includes each Director’s principal occupation during the last five years and other information relating to the experience, attributes and skills relevant to each Director’s qualifications to serve as a Director, which led to the conclusion that each Director should serve as a Director for the Fund. |
| # | Mr. Keith is an “interested person” of the Fund, as defined in the 1940 Act, due to his position as a Senior Vice President of the Adviser. |
| ## | Member of the Audit Committee, the Governance and Nominating Committee, and the Independent Directors Committee. |
| ^ | Mr. Bermudez will be a member of the Audit Committee, the Governance and Nominating Committee, and the Independent Directors Committee when he joins the Board on January 1, 2020. |
28
| AB Variable Products Series Fund | ||
Officer Information
Certain information concerning the Portfolio’s Officers is listed below.
| NAME, ADDRESS* AND AGE | PRINCIPAL POSITION(S) HELD WITH FUND | PRINCIPAL OCCUPATION DURING PAST FIVE YEARS | ||
| Robert M. Keith 59 | President and Chief Executive Officer | See biography above. | ||
| James W. MacGregor 52 | Vice President | Senior Vice President of the Adviser**, with which he has been associated since prior to 2015. He is also Chief Investment Officer of US Small and Mid-Cap Value Equities. | ||
| Erik A. Turenchalk^^ 47 | Vice President | Senior Vice President of the Adviser**, with which he has been associated in a substantially similar capacity to his current position since prior to 2015. | ||
| Emilie D. Wrapp 64 | Secretary | Senior Vice President, Assistant General Counsel and Assistant Secretary of ABI **, with which she has been associated since prior to 2015. | ||
| Michael B. Reyes 43 | Senior Analyst | Vice President of the Adviser**, with which he has been associated since prior to 2015. | ||
| Joseph J. Mantineo 60 | Treasurer and Chief Financial Officer | Senior Vice President of AllianceBernstein Investor Services, Inc. (“ABIS”)**, with which he has been associated since prior to 2015. | ||
| Phyllis J. Clarke 59 | Controller | Vice President of ABIS**, with which she has been associated since prior to 2015. | ||
Vincent S. Noto 55 | Chief Compliance Officer | Senior Vice President since 2015 and Mutual Fund Chief Compliance Officer of the Adviser** since prior to 2015. |
| * | The address for each of the Portfolio’s Officers is 1345 Avenue of the Americas, New York, NY 10105. |
| ** | The Adviser, ABIS and ABI are affiliates of the Fund. |
| ^^ | Mr. Turenchalk will be a portfolio manager for the Portfolio, effective January 1, 2020. |
| The Fund’s Statement of Additional Information (“SAI”) has additional information about the Fund’s Directors and Officers and is available without charge upon request. Contact your financial representative or the Adviser at (800) 227-4618 or visit www.abfunds.com, for a free prospectus or SAI. |
29
| SMALL/MID CAP VALUE PORTFOLIO | ||
| CONTINUANCE DISCLOSURE | AB Variable Products Series Fund | |
INFORMATION REGARDING THE REVIEW AND APPROVAL OF THE FUND’S ADVISORY AGREEMENT
The disinterested directors (the “directors”) of AB Variable Products Series Fund, Inc. (the “Company”) unanimously approved the continuance of the Company’s Advisory Agreement with the Adviser in respect of AB Small/Mid Cap Value Portfolio (the “Fund”) at a meeting held on May7-9, 2019 (the “Meeting”).
Prior to approval of the continuance of the Advisory Agreement, the directors had requested from the Adviser, and received and evaluated, extensive materials. They reviewed the proposed continuance of the Advisory Agreement with the Adviser and with experienced counsel who are independent of the Adviser, who advised on the relevant legal standards. The directors also reviewed additional materials, including comparative analytical data prepared by the Senior Analyst for the Fund. The directors also discussed the proposed continuance in private sessions with counsel.
The directors considered their knowledge of the nature and quality of the services provided by the Adviser to the Fund gained from their experience as directors or trustees of most of the registered investment companies advised by the Adviser, their overall confidence in the Adviser’s integrity and competence they have gained from that experience, the Adviser’s initiative in identifying and raising potential issues with the directors and its responsiveness, frankness and attention to concerns raised by the directors in the past, including the Adviser’s willingness to consider and implement organizational and operational changes designed to improve investment results and the services provided to the AB Funds. The directors noted that they have four regular meetings each year, at each of which they review extensive materials and information from the Adviser, including information on the investment performance of the Fund.
The directors also considered all factors they believed relevant, including the specific matters discussed below. During the course of their deliberations, the directors evaluated, among other things, the reasonableness of the advisory fee. The directors did not identify any particular information that wasall-important or controlling, and different directors may have attributed different weights to the various factors. The directors determined that the selection of the Adviser to manage the Fund and the overall arrangements between the Fund and the Adviser, as provided in the Advisory Agreement, including the advisory fee, were fair and reasonable in light of the services performed, expenses incurred and such other matters as the directors considered relevant in the exercise of their business judgment. The material factors and conclusions that formed the basis for the directors’ determinations included the following:
Nature, Extent and Quality of Services Provided
The directors considered the scope and quality of services provided by the Adviser under the Advisory Agreement, including the quality of the investment research capabilities of the Adviser and the other resources it has dedicated to performing services for the Fund. The directors noted that the Adviser from time to time reviews the Fund’s investment strategies and from time to time proposes changes intended to improve the Fund’s relative or absolute performance for the directors’ consideration. They also noted the professional experience and qualifications of the Fund’s portfolio management team and other senior personnel of the Adviser. The directors also considered that the Advisory Agreement provides that the Fund will reimburse the Adviser for the cost to it of providing certain clerical, accounting, administrative and other services to the Fund by employees of the Adviser or its affiliates. Requests for these reimbursements are made on a quarterly basis and subject to approval by the directors. Reimbursements, to the extent requested and paid, result in a higher rate of total compensation from the Fund to the Adviser than the fee rate stated in the Advisory Agreement. The directors noted that the methodology used to determine the reimbursement amounts had been reviewed by an independent consultant retained by the Fund’s former Senior Officer/Independent Compliance Officer. The quality of administrative and other services, including the Adviser’s role in coordinating the activities of the Fund’s other service providers, also was considered. The directors concluded that, overall, they were satisfied with the nature, extent and quality of services provided to the Fund under the Advisory Agreement.
Costs of Services Provided and Profitability
The directors reviewed a schedule of the revenues and expenses and related notes indicating the profitability of the Fund to the Adviser for calendar years 2017 and 2018 that had been prepared with an expense allocation methodology arrived at in consultation with an independent consultant retained by the Fund’s former Senior Officer/Independent Compliance Officer. The directors noted the assumptions and methods of allocation used by the Adviser in preparing fund-specific profitability data and understood that there are a number of potentially acceptable allocation methodologies for information of this type. The directors noted that the profitability information reflected all revenues and expenses of the Adviser’s relationship with the Fund, including those relating to its subsidiaries that provide transfer agency, distribution and brokerage services to the Fund. The directors recognized that it is difficult to make comparisons of the profitability of the Advisory Agreement with
30
| AB Variable Products Series Fund | ||
the profitability of advisory contracts for unaffiliated funds because comparative information is not generally publicly available and is affected by numerous factors. The directors focused on the profitability of the Adviser’s relationship with the Fund before taxes and distribution expenses. The directors concluded that the Adviser’s level of profitability from its relationship with the Fund was not unreasonable.
Fall-Out Benefits
The directors considered the other benefits to the Adviser and its affiliates from their relationships with the Fund and the underlying fund advised by the Adviser in which the Fund invests, including, but not limited to, benefits relating to soft dollar arrangements (whereby investment advisers receive brokerage and research services from brokers that execute agency transactions for their clients);12b-1 fees and sales charges received by the Fund’s principal underwriter (which is a wholly owned subsidiary of the Adviser) in respect of the Fund’s Class B shares; brokerage commissions paid by the Fund to brokers affiliated with the Adviser; and transfer agency fees paid by the Fund to a wholly owned subsidiary of the Adviser. The directors recognized that the Adviser’s profitability would be somewhat lower without these benefits. The directors understood that the Adviser also might derive reputational and other benefits from its association with the Fund.
Investment Results
In addition to the information reviewed by the directors in connection with the Meeting, the directors receive detailed performance information for the Fund at each regular Board meeting during the year.
At the Meeting, the directors reviewed performance information prepared by an independent service provider (the “15(c) service provider”), showing the performance of the Class A Shares of the Fund against a group of similar funds (“peer group”) and a larger group of similar funds (“peer universe”), each selected by the 15(c) service provider, and information prepared by the Adviser showing performance of the Class A Shares against a broad-based securities market index, in each case for the1-,3-,5- and10-year periods ended February 28, 2019 and (in the case of comparisons with the broad-based securities market index) for the period from inception. Based on their review, the directors concluded that the Fund’s investment performance was acceptable.
Advisory Fees and Other Expenses
The directors considered the advisory fee rate payable by the Fund to the Adviser and information prepared by the 15(c) service provider concerning advisory fee rates payable by other funds in the same category as the Fund. The directors recognized that it is difficult to make comparisons of advisory fees because there are variations in the services that are included in the fees paid by other funds. The directors compared the Fund’s contractual effective advisory fee rate with a peer group median and noted that it was above the median. The directors also took into account the impact on the advisory fee rate of the administrative expense reimbursement paid to the Adviser in the latest fiscal year.
The directors also considered the Adviser’s fee schedule for other clients pursuing an investment strategy similar to the Fund’s. For this purpose, they reviewed the relevant advisory fee information from the Adviser’s Form ADV and in a report from the Fund’s Senior Analyst and noted the differences between the Fund’s fee schedule, on the one hand, and the Adviser’s institutional fee schedule and the schedule of fees charged by the Adviser to any offshore funds and for services to anysub-advised funds pursuing an investment strategy similar to the Fund’s, on the other. The directors noted that the Adviser may, in some cases, agree to fee rates with large institutional clients that are lower than those reviewed by the directors and that they had previously discussed with the Adviser its policies in respect of such arrangements. The directors previously discussed these matters with an independent fee consultant. The directors also compared the advisory fee rate for the Fund with that for another fund advised by the Adviser with a similar investment strategy.
The Adviser reviewed with the directors the significantly greater scope of the services it provides to the Fund relative to institutional, offshore fund andsub-advised fund clients. In this regard, the Adviser noted, among other things, that, compared to institutional and offshore orsub-advisory accounts, the Fund (i) demands considerably more portfolio management, research and trading resources due to significantly higher daily cash flows; (ii) has more tax and regulatory restrictions and compliance obligations; (iii) must prepare and file or distribute regulatory and other communications about fund operations; and (iv) must provide shareholder servicing to retail investors. The Adviser also reviewed the greater legal risks presented by the large and changing population of Fund shareholders who may assert claims against the Adviser in individual or class actions, and the greater entrepreneurial risk in offering new fund products, which require substantial investment to launch, may not succeed, and generally must be priced to compete with larger, more established funds resulting in lack of profitability to the Adviser until a new fund achieves scale. In light of the substantial differences in services rendered by the
31
| SMALL/MID CAP VALUE PORTFOLIO | ||
| CONTINUANCE DISCLOSURE | ||
| (continued) | AB Variable Products Series Fund | |
Adviser to institutional, offshore fund andsub-advised fund clients as compared to the Fund, and the different risk profile, the directors considered these fee comparisons inapt and did not place significant weight on them in their deliberations.
In connection with their review of the Fund’s advisory fee, the directors also considered the total expense ratio of the Class A shares of the Fund in comparison to a peer group and a peer universe selected by the 15(c) service provider. The Class A expense ratio of the Fund was based on the Fund’s latest fiscal year and the directors considered the Adviser’s expense cap for the Fund (although the directors noted that the Fund’s expense ratio was currently below the Adviser’s expense cap). The directors noted that it was likely that the expense ratios of some of the other funds in the Fund’s category were lowered by waivers or reimbursements by those funds’ investment advisers, which in some cases might be voluntary or temporary. The directors view expense ratio information as relevant to their evaluation of the Adviser’s services because the Adviser is responsible for coordinating services provided to the Fund by others. Based on their review, the directors concluded that the Fund’s expense ratio was acceptable.
Economies of Scale
The directors noted that the advisory fee schedule for the Fund contains breakpoints that reduce the fee rates on assets above specified levels. The directors took into consideration prior presentations by an independent consultant on economies of scale in the mutual fund industry and for the AB Funds, and presentations from time to time by the Adviser concerning certain of its views on economies of scale. The directors also previously discussed economies of scale with an independent fee consultant. The directors also had requested and received from the Adviser certain updates on economies of scale in advance of the Meeting. The directors believe that economies of scale may be realized (if at all) by the Adviser across a variety of products and services, and not only in respect of a single fund. The directors noted that there is no established methodology for setting breakpoints that give effect to the fund-specific services provided by a fund’s adviser and to the economies of scale that an adviser may realize in its overall mutual fund business or those components of it which directly or indirectly affect a fund’s operations. The directors observed that in the mutual fund industry as a whole, as well as among funds similar to the Fund, there is no uniformity or pattern in the fees and asset levels at which breakpoints (if any) apply. The directors also noted that the advisory agreements for many funds do not have breakpoints at all. Having taken these factors into account, the directors concluded that the Fund’s shareholders would benefit from a sharing of economies of scale in the event the Fund’s net assets exceed a breakpoint in the future.
32
VPS-SMCV-0151-1219
ITEM 2. CODE OF ETHICS.
(a) The registrant has adopted a code of ethics that applies to its principal executive officer, principal financial officer and principal accounting officer. A copy of the registrant’s code of ethics is filed herewith as Exhibit 12(a)(1).
(b) During the period covered by this report, no material amendments were made to the provisions of the code of ethics adopted in 2(a) above.
(c) During the period covered by this report, no implicit or explicit waivers to the provisions of the code of ethics adopted in 2(a) above were granted.
ITEM 3. AUDIT COMMITTEE FINANCIAL EXPERT.
The registrant’s Board of Directors has determined that independent directors Garry L. Moody and Marshall C. Turner, Jr. qualify as audit committee financial experts.
ITEM 4. PRINCIPAL ACCOUNTANT FEES AND SERVICES.
(a) - (c) The following table sets forth the aggregate fees billed by the independent auditor Ernst & Young LLP, for the Fund’s last two fiscal years for professional services rendered for: (i) the audit of the Fund’s annual financial statements included in the Fund’s annual report to stockholders; (ii) assurance and related services that are reasonably related to the performance of the audit of the Fund’s financial statements and are not reported under (i), which include multi-class distribution testing, advice and education on accounting and auditing issues, and consent letters; and (iii) tax compliance, tax advice and tax return preparation.
| Audit Fees | Audit-Related Fees | Tax Fees | ||||||||||||||
AB Balanced Wealth Strategy Portfolio | 2018 | 72,197 | — | 29,226 | ||||||||||||
| 2019 | 72,197 | — | 20,562 | |||||||||||||
AB Global Thematic Growth Portfolio | 2018 | 41,926 | — | 22,238 | ||||||||||||
| 2019 | 41,926 | — | 11,108 | |||||||||||||
AB Growth & Income Portfolio | 2018 | 31,404 | 2,000 | 20,591 | ||||||||||||
| 2019 | 31,404 | — | 20,242 | |||||||||||||
AB Intermediate Bond Portfolio | 2018 | 67,988 | — | 20,103 | ||||||||||||
| 2019 | 67,988 | — | 11,588 | |||||||||||||
AB International Growth Portfolio | 2018 | 41,926 | — | 27,795 | ||||||||||||
| 2019 | 41,926 | — | 13,800 | |||||||||||||
AB International Value Portfolio | 2018 | 41,926 | — | 26,660 | ||||||||||||
| 2019 | 41,926 | — | 16,385 | |||||||||||||
AB Large Cap Growth Portfolio | 2018 | 31,404 | 2,000 | 18,081 | ||||||||||||
| 2019 | 31,404 | — | 19,278 | |||||||||||||
AB Small Cap Growth Portfolio | 2018 | 31,404 | — | 18,095 | ||||||||||||
| 2019 | 31,404 | — | 10,149 | |||||||||||||
AB Small/Mid Cap Value Portfolio | 2018 | 35,613 | — | 20,311 | ||||||||||||
| 2019 | 35,613 | — | 12,381 | |||||||||||||
AB Dynamic Asset Allocation Portfolio | 2018 | 85,147 | — | 29,231 | ||||||||||||
| 2019 | 85,147 | — | 24,338 | |||||||||||||
AB Global Risk Allocation-Moderate Portfolio | 2018 | 36,029 | — | 23,383 | ||||||||||||
| 2019 | 36,029 | — | 13,666 | |||||||||||||
(d) Not applicable.
(e) (1) Beginning with audit andnon-audit service contracts entered into on or after May 6, 2003, the Fund’s Audit Committee policies and procedures require thepre-approval of all audit andnon-audit services provided to the Fund by the Fund’s independent registered public accounting firm. The Fund’s Audit Committee policies and procedures also requirepre-approval of all audit andnon-audit services provided to the Adviser and Service Affiliates to the extent that these services are directly related to the operations or financial reporting of the Fund.
(e) (2) All of the amounts for Audit Fees, Audit-Related Fees and Tax Fees in the table under Item 4 (a) – (c) are for servicespre-approved by the Fund’s Audit Committee.
(f) Not applicable.
(g) The following table sets forth the aggregatenon-audit services provided to the Fund, the Fund’s Adviser and entities that control, are controlled by or under common control with the Adviser that provide ongoing services to the Fund:
| All Fees for Non-Audit Services Provided to the Portfolio, the Adviser and Service Affiliates | Total Amount of Foregoing Column Pre- approved by the Audit Committee (Portion Comprised of Audit Related Fees) (Portion Comprised of Tax Fees) | |||||||||||
AB Balanced Wealth Strategy Portfolio | 2018 | $ | 793,824 | 29,226 | ||||||||
| — | ||||||||||||
| (29,226 | ) | |||||||||||
| 2019 | $ | 864,618 | $ | 20,562 | ||||||||
| — | ||||||||||||
| (20,562 | ) | |||||||||||
AB Global Thematic Growth Portfolio | 2018 | $ | 786,836 | 22,238 | ||||||||
| — | ||||||||||||
| (22,238 | ) | |||||||||||
| 2019 | $ | 855,164 | $ | 11,108 | ||||||||
| — | ||||||||||||
| (11,108 | ) | |||||||||||
AB Growth & Income Portfolio | 2018 | $ | 787,189 | 22,591 | ||||||||
| (2,000 | ) | |||||||||||
| (20,591 | ) | |||||||||||
| 2019 | $ | 864,298 | $ | 20,242 | ||||||||
| — | ||||||||||||
| (20,242 | ) | |||||||||||
AB Intermediate Bond Portfolio | 2018 | $ | 784,701 | 20,103 | ||||||||
| — | ||||||||||||
| (20,103 | ) | |||||||||||
| 2019 | $ | 855,644 | $ | 11,588 | ||||||||
| — | ||||||||||||
| (11,588 | ) | |||||||||||
AB International Growth Portfolio | 2018 | $ | 792,393 | 27,795 | ||||||||
| — | ||||||||||||
| (27,795 | ) | |||||||||||
| 2019 | $ | 857,856 | $ | 13,800 | ||||||||
| — | ||||||||||||
| (13,800 | ) | |||||||||||
AB International Value Portfolio | 2018 | $ | 791,258 | 26,660 | ||||||||
| — | ||||||||||||
| (26,660 | ) | |||||||||||
| 2019 | $ | 860,441 | $ | 16,385 | ||||||||
| — | ||||||||||||
| (16,385 | ) | |||||||||||
AB Large Cap Growth Portfolio | 2018 | $ | 784,679 | 20,081 | ||||||||
| (2,000 | ) | |||||||||||
| (18,081 | ) | |||||||||||
| 2019 | $ | 863,334 | $ | 19,278 | ||||||||
| — | ||||||||||||
| (19,278 | ) | |||||||||||
AB Small Cap Growth Portfolio | 2018 | $ | 782,693 | 18,095 | ||||||||
| — | ||||||||||||
| (18,095 | ) | |||||||||||
| 2019 | $ | 854,205 | $ | 10,149 | ||||||||
| — | ||||||||||||
| (10,149 | ) | |||||||||||
AB Small/Mid Cap Value Portfolio | 2018 | $ | 784,909 | 20,311 | ||||||||
| — | ||||||||||||
| (20,311 | ) | |||||||||||
| 2019 | $ | 856,437 | $ | 12,381 | ||||||||
| — | ||||||||||||
| (12,381 | ) | |||||||||||
AB Dynamic Asset Allocation Portfolio | 2018 | $ | 793,829 | 29,231 | ||||||||
| — | ||||||||||||
| (29,231 | ) | |||||||||||
| 2019 | $ | 868,394 | $ | 24,338 | ||||||||
| — | ||||||||||||
| (24,338 | ) | |||||||||||
AB Global Risk Allocation-Moderate Portfolio | 2018 | $ | 787,981 | 23,383 | ||||||||
| — | ||||||||||||
| (23,383 | ) | |||||||||||
| 2019 | $ | 855,164 | $ | 13,666 | ||||||||
| — | ||||||||||||
| (13,666 | ) | |||||||||||
(h) The Audit Committee of the Fund has considered whether the provision of anynon-audit services notpre-approved by the Audit Committee provided by the Fund’s independent registered public accounting firm to the Adviser and Service Affiliates is compatible with maintaining the auditor’s independence.
ITEM 5. AUDIT COMMITTEE OF LISTED REGISTRANTS.
Not applicable to the registrant.
ITEM 6. SCHEDULE OF INVESTMENTS.
Please see Schedule of Investments contained in the Report to Shareholders included under Item 1 of this FormN-CSR.
ITEM 7. DISCLOSURE OF PROXY VOTING POLICIES AND PROCEDURES FORCLOSED-END MANAGEMENT INVESTMENT COMPANIES.
Not applicable to the registrant.
ITEM 8. PORTFOLIO MANAGERS OFCLOSED-END MANAGEMENT INVESTMENT COMPANIES.
Not applicable to the registrant.
ITEM 9. PURCHASES OF EQUITY SECURITIES BYCLOSED-END MANAGEMENT INVESTMENT COMPANY AND AFFILIATED PURCHASERS.
Not applicable to the registrant.
ITEM 10. SUBMISSION OF MATTERS TO A VOTE OF SECURITY HOLDERS.
There have been no material changes to the procedures by which shareholders may recommend nominees to the Fund’s Board of Directors since the Fund last provided disclosure in response to this item.
ITEM 11. CONTROLS AND PROCEDURES.
(a) The registrant’s principal executive officer and principal financial officer have concluded that the registrant’s disclosure controls and procedures (as defined in Rule30a-3(c) under the Investment Company Act of 1940, as amended) are effective at the reasonable assurance level based on their evaluation of these controls and procedures as of a date within 90 days of the filing date of this document.
(b) There were no significant changes in the registrant’s internal controls over financial reporting that could significantly affect these controls subsequent to the date of their evaluation, including any corrective actions with regard to significant deficiencies and material weaknesses.
ITEM 12. EXHIBITS.
The following exhibits are attached to this FormN-CSR:
EXHIBIT | DESCRIPTION OF EXHIBIT | |
| 12 (a) (1) | Code of ethics that is subject to the disclosure of Item 2 hereof | |
| 12 (b) (1) | Certification of Principal Executive Officer Pursuant to Section 302 of the Sarbanes-Oxley Act of 2002 | |
| 12 (b) (2) | Certification of Principal Financial Officer Pursuant to Section 302 of the Sarbanes-Oxley Act of 2002 | |
| 12 (c) | Certification of Principal Executive Officer and Principal Financial Officer Pursuant to Section 906 of theSarbanes-Oxley Act of 2002 | |
SIGNATURES
Pursuant to the requirements of the Securities Exchange Act of 1934 and the Investment Company Act of 1940, the registrant has duly caused this report to be signed on its behalf by the undersigned, thereunto duly authorized.
(Registrant): AB Variable Products Series Fund, Inc.
| By: | /s/ Robert M. Keith | |
| Robert M. Keith | ||
| President | ||
| Date: | February 14, 2020 | |
Pursuant to the requirements of the Securities Exchange Act of 1934 and the Investment Company Act of 1940, this report has been signed below by the following persons on behalf of the registrant and in the capacities and on the dates indicated.
| By: | /s/ Robert M. Keith | |
| Robert M. Keith | ||
| President | ||
| Date: | February 14, 2020 | |
| By: | /s/ Joseph J. Mantineo | |
| Joseph J. Mantineo | ||
| Treasurer and Chief Financial Officer | ||
| Date: | February 14, 2020 | |