UNITED STATES
SECURITIES AND EXCHANGE COMMISSION
Washington, D.C. 20549
SECURITIES AND EXCHANGE COMMISSION
Washington, D.C. 20549
FORM N-CSR
CERTIFIED SHAREHOLDER REPORT OF REGISTERED
MANAGEMENT INVESTMENT COMPANIES
Investment Company Act file number 811-05407
Trust for Credit Unions
(Exact name of registrant as specified in charter)
(Exact name of registrant as specified in charter)
615 East Michigan Street, 3rd Floor
Milwaukee, WI 53202
(Address of principal executive offices) (Zip code)
(Address of principal executive offices) (Zip code)
Jay E. Johnson
Callahan Financial Services, Inc.
1001 Connecticut Avenue NW, Suite 1001
Washington, DC 20036
(Name and address of agent for service)
With Copies To:
Andrew E. Seaberg
Faegre Drinker Biddle & Reath LLP
One Logan Square, Suite 2000
Philadelphia, PA 19103
Registrant's telephone number, including area code: 1-800-342-5828
Date of fiscal year end: August 31
Date of reporting period: August 31, 2022
Item 1. Reports to Stockholders.
| (a) |
Ultra-Short Duration Portfolio
Short Duration Portfolio
Annual Report
August 31, 2022
The reports concerning the Trust for Credit Unions (“TCU” or the “Trust”) Ultra-Short Duration Portfolio and Short Duration Portfolio (each a “Portfolio” and together the “Portfolios”) included in this shareholder report may contain certain forward-looking statements about the factors that may affect the performance of the Portfolios in the future. These statements are based on Portfolio management’s predictions and expectations concerning certain future events and their expected impact on the Portfolios, such as performance of the economy as a whole and of specific industry sectors, changes in the levels of interest rates, the impact of developing world events, and other factors that may influence the future performance of the Portfolios. Management believes these forward-looking statements to be reasonable, although they are inherently uncertain and difficult to predict. Actual events may cause adjustments in portfolio management strategies from those currently expected to be employed.
TCU files the complete schedule of portfolio holdings of each Portfolio with the Securities and Exchange Commission (“SEC”) for the first and third quarters of each fiscal year on Form N-PORT. The Portfolios’ Forms N-PORT are available on the SEC’s website at http://www.sec.gov.
Information regarding how the Portfolios voted proxies relating to portfolio securities, if any, during the most recent 12-month period ended June 30 is available by August 31 of the relevant year: (i) without charge, upon request, by calling the Trust at 1-800-342-5828; and (ii) on the SEC’s website at http://www.sec.gov.
An investment in a TCU Portfolio is not a credit union deposit and is not insured or guaranteed by the National Credit Union Share Insurance Fund, the National Credit Union Administration, or any other government agency.
The TCU Ultra-Short Duration Portfolio and the TCU Short Duration Portfolio are not money market funds. Investors in these Portfolios should understand that the net asset values of the Portfolios will fluctuate, which may result in a loss of the principal amount invested. The Portfolios’ net asset values and yields are not guaranteed by the U.S. government or by its agencies, instrumentalities or sponsored enterprises. Investments in fixed income securities are subject to the risks associated with debt securities including credit and interest rate risk. The guarantee on U.S. government securities applies only to the underlying securities of the Portfolios if held to maturity and not to the value of the Portfolios’ shares. The Portfolios’ investments in mortgage-backed securities are subject to prepayment risks. These risks may result in greater share price volatility.
Holdings and allocations shown may not be representative of current or future investments. Portfolio holdings should not be relied on in making investment decisions and should not be construed as research or investment advice regarding particular securities.
This material is not authorized for distribution unless preceded or accompanied by a current Prospectus. Investors should consider a Portfolio’s objectives, risks, and charges and expenses, and read the Prospectus carefully before investing or sending money. The Prospectus contains this and other information about the Portfolios.
Callahan Financial Services, Inc. is the distributor of the TCU Portfolios.
This report is for the information of the shareholders of the Trust.
Its use in connection with any offering of shares of the Trust is
authorized only in the case of a concurrent or prior delivery of
the Trust’s current Prospectus.
Dear Credit Union Shareholders,
The difference in the economic environment and credit union performance dynamics at August 31, 2022 versus a year ago is striking. Inflation is the headline issue in 2022, and the Federal Reserve shifted significantly from their position a year ago that inflation was “transitory” by implementing interest rate increases at the fastest pace since the 1980s. Inflation as measured by the consumer price index might have peaked in June at 9.0% but the 12-month increase of 8.2% as of September remains well above the Fed’s target level of 2.0%. As a result, the rate increases are not finished, with the Fed projecting another 1.25 percentage point increase by year-end and more increases projected in 2023.
Similar to the change in the interest rate environment, credit union balance sheet growth dynamics have flipped in 2022 as compared to the prior year. Share growth was the story a year ago but the annual growth rate of 8.1% as of June 2022 is almost half of the 15% rate posted in June 2021. Loan growth has now taken the lead, with a 16.1% annual growth rate as of June that is not only more than triple the 4.9% rate posted a year ago, but the highest in decades. As a result, the industry’s loan-to-share ratio recorded the highest quarterly increase ever in the second quarter, jumping 4.5 percentage points to 74.7% as of June 30th.
Although the industry’s loan-to-share ratio is moving up, the current level would not typically indicate any liquidity concerns. However, the rapid increase in interest rates has resulted in a significant rise in unrealized losses in credit unions’ investment portfolios. Since credit unions prefer to hold investments until maturity, most of these losses will never be realized. The situation does constrain Chief Financial Officers though, who would rather tap into other sources of liquidity before selling securities and having to recognize a loss.
In this environment, the ability of investors in the Trust for Credit Unions (“TCU”) portfolios to access funds on a next-day basis is a significant value. Over the past few years, the TCU funds have demonstrated their value to credit unions by serving the exact purpose they are designed for – a source of returns when liquidity is high, as it was during the deposit surge tied to stimulus inflows and slower consumer spending in 2020 and 2021, and a source of liquid funds when lending picks up and share growth slows, as has happened over the past year.
As a result of credit unions’ need for liquidity to fund loan demand, combined balances in the Ultra-Short Duration and Short Duration portfolios declined over the past fiscal year from $4.8 billion to $1.0 billion. This is a reversal of the trends recorded in the fiscal year ended August 31st 2021 when balances rose 95%, underscoring TCU’s role as conditions in credit unions change.
The rapid rise in interest rates resulted in negative returns in most fixed income securities, as reflected in TCU’s performance results. For the twelve-month period ended August 31, 2022, the cumulative total return of the TCU share class of the Ultra-Short Duration Portfolio (TCU Shares) was -1.93% versus a cumulative total return of the Portfolio’s benchmark, the ICE BofAML Three-Month U.S. Treasury Bill Index, of 0.38%. Over the same period, the TCU share class of the Short Duration Portfolio (TCU Shares) was -5.40% versus a -4.09% cumulative total return for the ICE BofAML Two-Year U.S. Treasury Note Index (Including Transaction Costs). The Investment Adviser’s Discussion and Analysis in this report provides perspective from ALM First on the positioning of the TCU portfolios. Please refer to their discussion for more information.
In an environment that continues to shift, ensuring investors have the most current information available is one of the key value components of TCU. Please visit our website, www.TrustCU.com, for the most current information on the Portfolios, including performance and portfolio holdings. We also regularly host webinars in which ALM First discusses the current market environment and provides an update on TCU portfolio performance and positioning. Please check the website for the next scheduled date. Of course, we are also available to connect with by calling 800-237-5678.
TCU is a unique operation, led by and for credit unions. The credit unions in the Callahan Credit Union Financial Services LLLP partnership continue to provide important support of and market perspective to TCU. Our business partners, including ALM First, U.S. Bank Global Fund Services, Callahan Financial Services and Eascorp, work together to ensure our investors receive outstanding service. The TCU Board of Trustees provide oversight and guidance for this collaboration. They each are important contributors to TCU’s success over the past 35 years.
Thank you, our credit union shareholders, for your interest in and support of TCU. If you have any questions or suggestions, please reach out to our team.
Sincerely,

Jay E. Johnson
President and Treasurer
Trust for Credit Unions
1
INVESTMENT ADVISER’S DISCUSSION AND ANALYSIS
TCU ULTRA-SHORT DURATION PORTFOLIO
Investment Objective
The TCU Ultra-Short Duration Portfolio (“USDP” or the “Portfolio”) seeks to achieve a high level of current income, consistent with low volatility of principal, by investing in obligations authorized under the Federal Credit Union Act. Under normal circumstances, substantially all of the assets (and at least 80%, measured at the time of purchase) of USDP will be invested in fixed-income securities consisting of the following: (1) securities issued or guaranteed as to principal and interest by the U.S. government or by its agencies, instrumentalities or sponsored enterprises and related custodial receipts; (2) repurchase agreements secured with obligations authorized by the Federal Credit Union Act; and (3) U.S. dollar denominated bank notes issued or guaranteed by banks with total assets exceeding $1 billion with weighted average maturities of less than 5 years, but only to the extent permitted under the Federal Credit Union Act and the rules and regulations thereunder. The Portfolio expects that a substantial portion of these securities will be mortgage-related securities. The Portfolio may also invest in non-U.S. government related securities, including bank notes and repurchase agreements secured by non-U.S. government related collateral. While there will be fluctuations in the net asset value (“NAV”) of the USDP, the Portfolio is expected to have less interest rate risk and asset value fluctuation than funds investing primarily in longer-term mortgage-backed securities paying a fixed rate of interest. An investment in the Portfolio is neither insured nor guaranteed by the U.S. government. USDP invests in obligations authorized under the Federal Credit Union Act with a maximum portfolio duration not to exceed that of a One-Year U.S. Treasury Security and a target duration equal to that of its benchmark, the ICE BofAML Three-Month U.S. Treasury Note Index.
Portfolio Management Discussion and Analysis
Below, ALM First discusses the Portfolio’s performance and positioning for the Reporting Period.
Q. How did the Portfolio perform during the Reporting Period?
For the twelve-month period ended August 31, 2022, the cumulative total return of USDP TCU Shares was -1.93% versus a 0.38% cumulative total return of the Portfolio’s benchmark, the ICE BofAML Three-Month U.S. Treasury Bill Index (the “Index”). The Portfolio’s net asset value (“NAV”) per share at the end of the Reporting Period was $9.21, versus $9.40 on February 28, 2022.
Q. What key factors were responsible for the Portfolio’s performance during the Reporting Period?
2022 has seen high credit quality fixed income spreads widen substantially, and floating-rate securities were no exception. Floating-rate Agency Commercial-Backed Securities (“ACMBS”) and Home Equity Conversion Mortgages (“HECMs”) have seen their spreads hit the wide end of their respective historical ranges. These securities exhibit little interest rate risk but are sensitive to changes in spreads which has led to underperformance relative to the index.
Q. Which fixed income market sectors most significantly affected Portfolio performance?
As discussed above spreads on floating-rate ACMBS, HECMs, and Collateralized Mortgage Obligations (“CMOs”) widened over the period and led to the Portfolio underperforming relative to its benchmark as increasing spreads led to a larger price decline than can be attributed to the change in rates alone.
Q. Did the Portfolio’s duration and yield curve positioning strategy help or hurt its results during the Reporting Period?
Since ALM First keeps the duration of the Portfolio aligned with that of the Index to avoid taking a position on the direction of interest rates, the Portfolio’s duration neither helped nor hurt its performance.
Q. Were there any notable changes in the Portfolio’s weightings during the Reporting Period?
The allocation to short-term Treasury securities increased from zero to 20% of portfolio assets over the period. The allocation to repurchase agreements declined significantly as the period progressed amid heavier redemption activity.
Q. How was the Portfolio positioned relative to its benchmark index at the end of August 2022?
At the end of the Reporting Period, the Portfolio’s largest allocations were in Agency Mortgage-Related Securities, which the Index has no allocation to since the Index is made up only of U.S. Treasury securities.
Past performance does not guarantee future results, which may vary.
There is no guarantee that these objectives will be met.
Portfolio holdings and/or allocations shown above are as of the date indicated and may not be representative of future investments. The holdings and/or allocations shown may not represent all of the Portfolio’s investments. Future investments may or may not be profitable.
2
THIS PAGE LEFT INTENTIONALLY BLANK
3
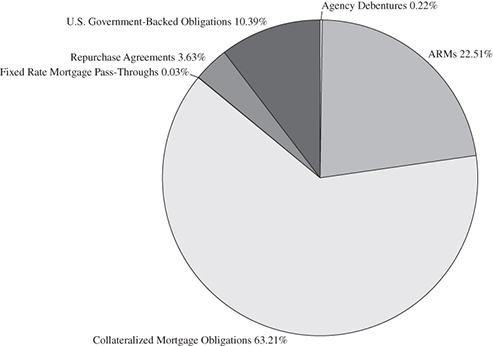
PORTFOLIO COMPOSITION—SECTOR ALLOCATION
TCU ULTRA-SHORT DURATION PORTFOLIO (Unaudited)
August 31, 2022*
August 31, 2021*
4
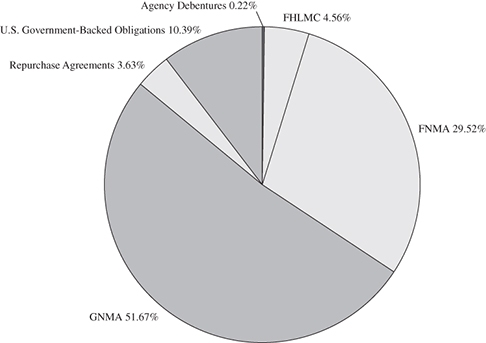
PORTFOLIO COMPOSITION—ISSUER ALLOCATION
TCU ULTRA-SHORT DURATION PORTFOLIO (Unaudited)
August 31, 2022*
August 31, 2021*

| * | These percentages reflect Portfolio holdings as a percentage of net assets. Figures in the above charts may not sum to 100% due to the exclusion of other assets and liabilities, including cash. Holdings and allocations may not be representative of current or future investments. Holdings and allocations may not include the Portfolio’s entire investment portfolio, which may change at any time. Portfolio holdings should not be relied on in making investment decisions and should not be construed as research or investment advice regarding particular securities. |
5
INVESTMENT ADVISER’S DISCUSSION AND ANALYSIS
TCU SHORT DURATION PORTFOLIO
Investment Objective
The TCU Short Duration Portfolio (“SDP” or the “Portfolio”) seeks to achieve a high level of current income, consistent with relatively low volatility of principal, by investing in obligations authorized under the Federal Credit Union Act. During normal market conditions, SDP intends to invest a substantial portion of its assets in mortgage-related securities, which include mortgage-related securities issued or guaranteed by the U.S. government, its agencies, instrumentalities or sponsored enterprises. Mortgage-related securities held by SDP may include adjustable rate and fixed rate mortgage pass-through securities, collateralized mortgage obligations and other multi-class mortgage-related securities, as well as other securities that are collateralized by or represent direct or indirect interests in mortgage-related securities or mortgage loans. An investment in the Portfolio is neither insured nor guaranteed by the U.S. government. SDP invests in obligations authorized under the Federal Credit Union Act with a target duration that is equal to that of the ICE BofAML Two-Year U.S. Treasury Note Index and its maximum duration is that of a Three-Year U.S. Treasury Security.
Portfolio Management Discussion and Analysis
Below, ALM First discusses the Portfolio’s performance and positioning for the Reporting Period.
Q. How did the Portfolio perform during the Reporting Period?
The Portfolio’s cumulative total return for the twelve-month period ended August 31, 2022 was -5.40% for the TCU shares, versus a -4.09% cumulative total return for the ICE BofAML Two-Year U.S. Treasury Note Index (Including Transaction Costs) (the “Index”). The Portfolio’s net asset value per share closed the Reporting Period at $9.22, versus $9.62 on February 28, 2022.
Q. What key factors were responsible for the Portfolio’s performance during the Reporting Period?
During the twelve-month period ended August 31, 2022 the yield curve flattened by 140 basis points, with the spread between the 2-year and 10-year Treasuries decreasing to -30 basis points from 110 basis points. Additionally, the yield curve shifted higher, the 2-year yield increased by 328 basis points while the 10-year yield ended the period 188 basis points higher.
Wider spreads and higher levels of interest rate volatility also impacted the portfolio. Agency Mortgage-Backed Securities (“MBS”), Agency Commercial Backed Securities (“ACMBS”) both experienced spread widening over the period. Additionally, higher levels of interest rate volatility had a negative impact on the price of securities with embedded options such as MBS.
Q. Which fixed income market sectors most significantly affected Portfolio performance?
Wider spreads on MBS and ACMBS had a negative impact on the Portfolio’s performance relative to its benchmark. Additionally, higher levels of interest rate volatility put downward pressure on MBS valuations due to the options embedded within those securities.
Q. Did the Portfolio’s duration and yield curve positioning strategy help or hurt its results during the Reporting Period?
Since ALM First keeps the duration of the Portfolio aligned with that of the Index to avoid taking a position on the direction of interest rates, the Portfolio’s duration neither helped nor hurt its performance. Unlike the benchmark which is sensitive only to changes in 2-year rates, the Portfolio has exposure to the entire yield curve and with long-end rates increasing less than the 2-year, the Portfolio was able to avoid some of that impact.
Q. Were there any notable changes in the Portfolio’s weightings during the Reporting Period?
No.
Q. How was the Portfolio positioned at the end of August 2022?
At the end of the Reporting Period, the Portfolio’s largest allocations were in Agency MBS securities, which the Index has no allocation to since the index is made up only of US Treasury securities.
Past performance does not guarantee future results, which may vary.
There is no guarantee that these objectives will be met.
Portfolio holdings and/or allocations shown above are as of the date indicated and may not be representative of future investments. The holdings and/or allocations shown may not represent all of the Portfolio’s investments. Future investments may or may not be profitable.
6
THIS PAGE LEFT INTENTIONALLY BLANK
7
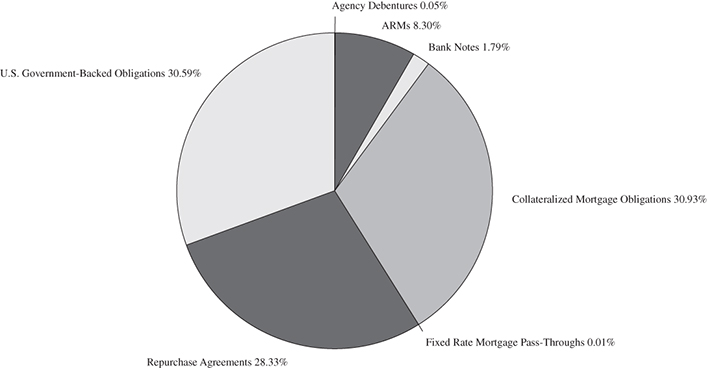
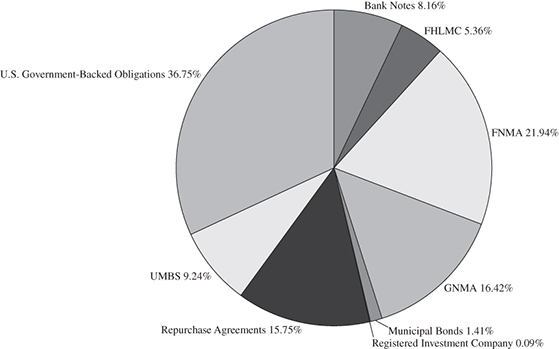
PORTFOLIO COMPOSITION—SECTOR ALLOCATION
TCU SHORT DURATION PORTFOLIO (Unaudited)
August 31, 2022*

August 31, 2021*
8
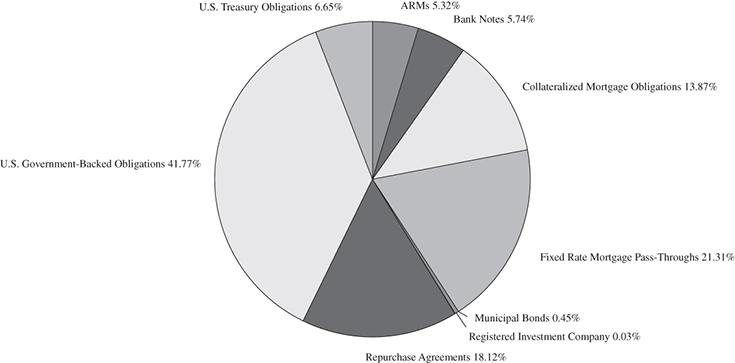
PORTFOLIO COMPOSITION—ISSUER ALLOCATION
TCU SHORT DURATION PORTFOLIO (Unaudited)
August 31, 2022*
August 31, 2021*
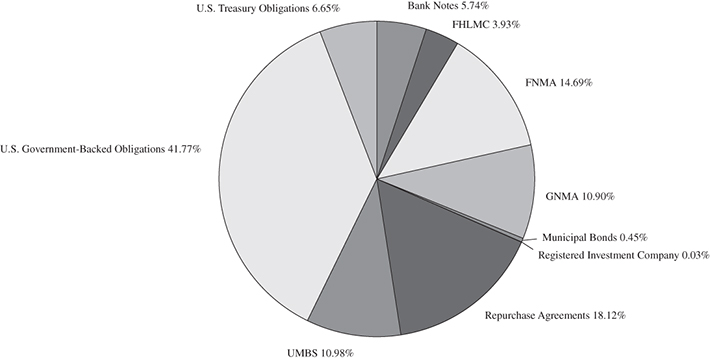
| * | These percentages reflect Portfolio holdings as a percentage of net assets. Figures in the above charts may not sum to 100% due to the exclusion of other assets and liabilities, including cash. Holdings and allocations may not be representative of current or future investments. Holdings and allocations may not include the Portfolio’s entire investment portfolio, which may change at any time. Portfolio holdings should not be relied on in making investment decisions and should not be construed as research or investment advice regarding particular securities. |
9
PORTFOLIO COMPARISON
TCU ULTRA-SHORT DURATION PORTFOLIO (Unaudited)
In accordance with the requirements of the Securities and Exchange Commission, the following data for the Ultra-Short Duration Portfolio is supplied for the period ended August 31, 2022. The Portfolio is compared to its benchmarks assuming the following initial investment:
| Initial | ||
Portfolio | Investment | Compare to: |
| Ultra-Short Duration (“USDP”) | $10,000 | ICE BofAML 3-Month U.S. Treasury Bill Index (“3-Month T-Bill”); |
| ICE BofAML 6-Month U.S. Treasury Bill Index (“6-Month T-Bill”). |
Ultra-Short Duration Portfolio’s(1) TCU Shares 10 Year Performance

Average Annual Total Return(a) | ||||
| One Year | Five Year | Ten Year | Since Inception | |
| TCU Shares | -1.93% | 0.71% | 0.46% | 2.43%(b) |
| Investor Shares | -1.96% | 0.68% | — | 0.43%(c) |
| 3-Month T-Bill (Performance since August 1, 1991) | 0.38% | 1.12% | 0.66% | 2.47% |
(1) | The Portfolio changed its investment strategy effective December 31, 2018. Information for periods prior to December 31, 2018 does not reflect the current investment strategy. |
(a) | ALM First began serving as investment adviser on April 16, 2017. Prior to that date, the Portfolio was advised by a different investment adviser. Performance of the Portfolio for periods prior to April 16, 2017 reflect management of the Portfolio by the previous investment adviser. |
(b) | The Portfolio’s TCU Shares commenced operations on July 10, 1991. |
(c) | The Portfolio’s Investor Shares commenced operations on November 30, 2012. |
The ICE BofAML Three-Month U.S. Treasury Bill Index and the ICE BofAML Six-Month U.S. Treasury Bill Index do not reflect any deduction for fees, expenses or taxes. It is not possible to invest directly in an unmanaged index. The TCU Ultra-Short Duration Portfolio is not a money market fund. Investors in this Portfolio should understand that the net asset value of the Portfolio will fluctuate, which may result in a loss of the principal amount invested. The Portfolio’s net asset value and yield are not guaranteed by the U.S. government, the National Credit Union Administration, or any other U.S. government agency, instrumentality or sponsored enterprise. Investments in fixed income securities are subject to the risks associated with debt securities including credit and interest rate risk. The guarantee on U.S. government securities applies only to the underlying securities of the Portfolio if held to maturity and not to the value of the Portfolio’s shares. The Portfolio’s investments in mortgage-backed securities are subject to prepayment risks. These risks may result in greater share price volatility.
All performance data shown represents past performance and should not be considered indicative of future performance, which will fluctuate as market conditions change. The investment return and principal value of an investment will fluctuate with changes in market conditions so that an investor’s shares, when redeemed, may be worth more or less than their original cost. The chart and table above assume reinvestment of dividends and distributions. Returns shown do not reflect the deduction of taxes that a shareholder would pay on Portfolio distributions or the redemption of Portfolio shares. In addition to the investment adviser’s decisions regarding issuer/industry investment selection and allocation, other factors may affect portfolio performance. These factors include, but are not limited to, portfolio operating fees and expenses, portfolio turnover, and subscription and redemption cash flows affecting a portfolio. Please call 1-800-342-5828 or 1-800-CFS-5678 for the most recent month-end returns.
10
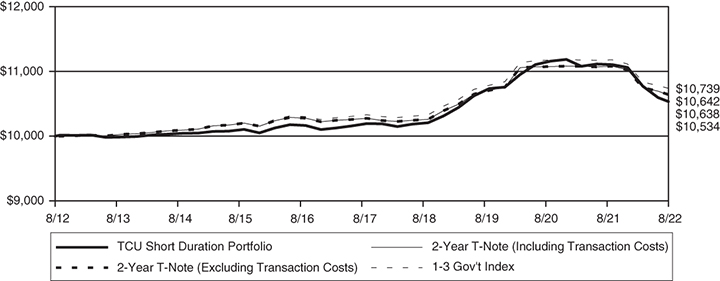
PORTFOLIO COMPARISON
TCU SHORT DURATION PORTFOLIO (Unaudited)
In accordance with the requirements of the Securities and Exchange Commission, the following data for the Short Duration Portfolio is supplied for the period ended August 31, 2022. The Portfolio is compared to its benchmarks assuming the following initial investment:
| Initial | ||
Portfolio | Investment | Compare to: |
| Short Duration (“SDP”) | $10,000 | ICE BofAML 2-Year U.S. Treasury Note Index (Including Transaction Costs) (“2-Year T-Note”); |
| ICE BofAML 2-Year U.S. Treasury Note Index (Excluding Transaction Costs) (“2-Year T-Note”); | ||
| Bloomberg Barclays Mutual Fund Short (1-3 Year) Government Index (“1-3 Gov’t Index”). |
Short Duration Portfolio’s TCU Shares 10 Year Performance
Average Annual Total Return(a) | ||||
| One Year | Five Year | Ten Year | Since Inception | |
| TCU Shares | -5.40% | 0.62% | 0.52% | 2.92%(b) |
| Investor Shares | -5.42% | 0.61% | — | 0.50%(c) |
| 2-Year T-Note (Including Transaction Costs) | ||||
(Performance since October 9, 1992)(d) | -4.09% | 0.66% | 0.62% | 3.08%(d) |
| 2-Year T-Note (Excluding Transaction Costs) | ||||
(Performance since October 9, 1992)(e) | -4.06% | 0.67% | 0.62% | 3.08%(d) |
(a) | ALM First began serving as investment adviser on April 16, 2017. Prior to that date, the Portfolio was advised by a different investment adviser. Performance of the Portfolio for periods prior to April 16, 2017 reflect management of the Portfolio by the previous investment adviser. |
(b) | The Portfolio’s TCU Shares commenced operations on October 9, 1992. |
(c) | The Portfolio’s Investor Shares commenced operations on November 30, 2012. |
(d) | The 2-Year T-Note (Including Transaction Costs) became the Portfolio’s primary benchmark effective October 7, 2022. |
(e) | Prior to October 7, 2022, the Portfolio’s primary benchmark was the 2-Year T-Note (Excluding Transaction Costs). |
The Bloomberg Barclays Mutual Fund Short (1-3 Year) Government Index and the ICE BofAML Two-Year U.S. Treasury Note Index (Excluding Transaction Costs) does not reflect any deduction for fees, expenses or taxes. It is not possible to invest directly in an unmanaged index. The TCU Short Duration Portfolio is not a money market fund. Investors in this Portfolio should understand that the net asset value of the Portfolio will fluctuate, which may result in a loss of the principal amount invested. The Portfolio’s net asset value and yield are not guaranteed by the U.S. government, the National Credit Union Administration, or any other U.S. government agency, instrumentality or sponsored enterprise. Investments in fixed income securities are subject to the risks associated with debt securities including credit and interest rate risk. The guarantee on U.S. government securities applies only to the underlying securities of the Portfolio if held to maturity and not to the value of the Portfolio’s shares. The Portfolio’s investments in mortgage-backed securities are subject to prepayment risks. These risks may result in greater share price volatility.
All performance data shown represents past performance and should not be considered indicative of future performance, which will fluctuate as market conditions change. The investment return and principal value of an investment will fluctuate with changes in market conditions so that an investor’s shares, when redeemed, may be worth more or less than their original cost. The chart and table above assume reinvestment of dividends and distributions. Returns shown do not reflect the deduction of taxes that a shareholder would pay on Portfolio distributions or the redemption of Portfolio shares. In addition to the investment adviser’s decisions regarding issuer/industry investment selection and allocation, other factors may affect portfolio performance. These factors include, but are not limited to, portfolio operating fees and expenses, portfolio turnover, and subscription and redemption cash flows affecting a portfolio. Please call 1-800-342-5828 or 1-800-CFS-5678 for the most recent month-end returns.
11
TRUST FOR CREDIT UNIONS
Ultra-Short Duration Portfolio
Portfolio of Investments – August 31, 2022
| Par Value | Value | ||||||
| ASSET BACKED SECURITIES* – 0.06% | |||||||
| Federal National Mortgage | |||||||
| Association REMIC – 0.06% | |||||||
| $ | 31,341 | Series 2001-W4, Class AV1 | |||||
| 1 Month LIBOR USD + 0.140% | |||||||
| 2.539%, 02/25/32 (a) | $ | 31,099 | |||||
| 48,227 | Series 2002-W2, Class AV1 | ||||||
| 1 Month LIBOR USD + 0.130% | |||||||
| 2.519%, 06/25/32 (a) | 47,015 | ||||||
| 251,207 | Series 2002-T7, Class A1 | ||||||
| 1 Month LIBOR USD + 0.220% | |||||||
| 2.664%, 07/25/32 (a) | 247,107 | ||||||
| Total Asset Backed Securities | 325,221 | ||||||
| (Cost $330,774) | |||||||
| COLLATERALIZED MORTGAGE OBLIGATIONS – 63.21% | |||||||
| Federal Home Loan Mortgage | |||||||
| Corporation REMIC – 4.53% | |||||||
| 153 | Series 1448, Class F | ||||||
| 1 Month LIBOR USD + 1.400% | |||||||
| 3.791%, 12/15/22 (a)(b) | 153 | ||||||
| 172,637 | Series 2977, Class M | ||||||
| 5.000%, 05/15/25 (c) | 173,089 | ||||||
| 879,197 | Series 3702, Class FG | ||||||
| 1 Month LIBOR USD + 0.450% | |||||||
| 2.841%, 08/15/32 (a)(d) | 878,850 | ||||||
| 918,552 | Series 3346, Class FT | ||||||
| 1 Month LIBOR USD + 0.350% | |||||||
| 2.741%, 10/15/33 (a)(c)(d) | 914,593 | ||||||
| 662,065 | Series 3208, Class FH | ||||||
| 1 Month LIBOR USD + 0.400% | |||||||
| 2.791%, 08/15/36 (a) | 659,807 | ||||||
| 52,400 | Series 3231, Class FB | ||||||
| 1 Month LIBOR USD + 0.350% | |||||||
| 2.741%, 10/15/36 (a) | 52,089 | ||||||
| 32,483 | Series 3314, Class FC | ||||||
| 1 Month LIBOR USD + 0.400% | |||||||
| 2.791%, 12/15/36 (a) | 32,361 | ||||||
| 517,448 | Series 4248, Class QF | ||||||
| 1 Month LIBOR USD + 0.500% | |||||||
| 2.891%, 06/15/39 (a)(d) | 517,284 | ||||||
| 104,823 | Series 3545, Class FA | ||||||
| 1 Month LIBOR USD + 0.850% | |||||||
| 3.241%, 06/15/39 (a) | 106,530 | ||||||
| 196,258 | Series 3827, Class KF | ||||||
| 1 Month LIBOR USD + 0.370% | |||||||
| 2.761%, 03/15/41 (a) | 195,725 | ||||||
| 30,831 | Series 3868, Class FA | ||||||
| 1 Month LIBOR USD + 0.400% | |||||||
| 2.791%, 05/15/41 (a) | 30,700 | ||||||
| 51,606 | Series 4109, Class EC | ||||||
| 2.000%, 12/15/41 (b)(d) | 40,408 | ||||||
| 1,637,369 | Series 4566, Class FA | ||||||
| 1 Month LIBOR USD + 0.500% | |||||||
| 2.891%, 04/15/46 (a) | 1,638,204 | ||||||
| 2,159,063 | Series 4748, Class DF | ||||||
| 1 Month LIBOR USD + 0.300% | |||||||
| 2.691%, 08/15/47 (a)(c) | 2,133,347 | ||||||
| 2,329,817 | Series 4735, Class FB | ||||||
| 1 Month LIBOR USD + 0.350% | |||||||
| 2.741%, 12/15/47 (a) | 2,309,929 | ||||||
| 2,508,593 | Series 4875, Class F | ||||||
| 1 Month LIBOR USD + 0.450% | |||||||
| 2.841%, 04/15/49 (a)(c) | 2,501,508 | ||||||
| 6,087,372 | Series 4980, Class FP | ||||||
| 1 Month LIBOR USD + 0.400% | |||||||
| 2.844%, 07/25/49 (a) | 6,046,240 | ||||||
| 3,315,730 | Series 4906, Class QF | ||||||
| 1 Month LIBOR USD + 0.450% | |||||||
| 2.894%, 09/25/49 (a) | 3,302,904 | ||||||
| 3,291,576 | Series 4982, Class F | ||||||
| 1 Month LIBOR USD + 0.450% | |||||||
| 2.894%, 06/25/50 (a)(c) | 3,302,543 | ||||||
| 1,072,264 | Series 4981, Class GF | ||||||
| 1 Month LIBOR USD + 0.400% | |||||||
| 2.844%, 06/25/50 (a) | 1,058,028 | ||||||
| 25,894,292 | |||||||
| Federal National Mortgage | |||||||
| Association REMIC – 8.33% | |||||||
| 2,695 | Series 1993-27, Class F | ||||||
| 1 Month LIBOR USD + 1.150% | |||||||
| 3.594%, 02/25/23 (a)(e) | 2,701 | ||||||
| 6,485 | Series 1998-21, Class F | ||||||
H15T1Y + 0.350% 2.776%, 03/25/28 (a) | |||||||
| 6,459 | |||||||
| 68,196 | Series 2000-16, Class ZG | ||||||
| 8.500%, 06/25/30 (b) | 76,292 | ||||||
| 64,669 | Series 2000-32, Class Z | ||||||
| 7.500%, 10/18/30 | 70,436 | ||||||
| 89,982 | Series 2006-45, Class TF | ||||||
| 1 Month LIBOR USD + 0.400% | |||||||
| 2.844%, 06/25/36 (a) | 89,704 | ||||||
| 127,240 | Series 2006-79, Class PF | ||||||
| 1 Month LIBOR USD + 0.400% | |||||||
| 2.844%, 08/25/36 (a)(c) | 126,839 | ||||||
| 131,655 | Series 2006-76, Class QF | ||||||
| 1 Month LIBOR USD + 0.400% | |||||||
| 2.844%, 08/25/36 (a)(c) | 131,255 | ||||||
| 288,349 | Series 2006-111, Class FA | ||||||
| 1 Month LIBOR USD + 0.380% | |||||||
| 2.824%, 11/25/36 (a) | 287,102 | ||||||
| 118,943 | Series 2007-75, Class VF | ||||||
| 1 Month LIBOR USD + 0.450% | |||||||
| 2.894%, 08/25/37 (a) | 118,844 | ||||||
See accompanying notes to financial statements.
12
TRUST FOR CREDIT UNIONS
Ultra-Short Duration Portfolio
Portfolio of Investments (continued) – August 31, 2022
| Par Value | Value | ||||||
| Federal Home Loan Mortgage | |||||||
| Association REMIC – (continued) | |||||||
| $ | 281,215 | Series 2007-85, Class FC | |||||
| 1 Month LIBOR USD + 0.540% | |||||||
| 2.984%, 09/25/37 (a) | $ | 281,996 | |||||
| 119,003 | Series 2007-86, Class FC | ||||||
| 1 Month LIBOR USD + 0.570% | |||||||
| 3.014%, 09/25/37 (a) | 119,482 | ||||||
| 110,559 | Series 2007-92, Class OF | ||||||
| 1 Month LIBOR USD + 0.570% | |||||||
| 3.014%, 09/25/37 (a) | 110,914 | ||||||
| 155,208 | Series 2007-99, Class FD | ||||||
| 1 Month LIBOR USD + 0.600% | |||||||
| 3.044%, 10/25/37 (a) | 155,879 | ||||||
| 14,596 | Series 2009-84, Class WF | ||||||
| 1 Month LIBOR USD + 1.100% | |||||||
| 3.544%, 10/25/39 (a) | 14,997 | ||||||
| 270,085 | Series 2010-123B, Class FL | ||||||
| 1 Month LIBOR USD + 0.430% | |||||||
| 2.874%, 11/25/40 (a)(c) | 269,841 | ||||||
| 516,843 | Series 2011-110, Class FE | ||||||
| 1 Month LIBOR USD + 0.400% | |||||||
| 2.844%, 04/25/41 (a)(c) | 516,203 | ||||||
| 267,118 | Series 2011-63, Class FG | ||||||
| 1 Month LIBOR USD + 0.450% | |||||||
| 2.894%, 07/25/41 (a) | 266,621 | ||||||
| 291,346 | Series 2012-38, Class JE | ||||||
| 3.250%, 04/25/42 (c) | 275,678 | ||||||
| 1,686,138 | Series 2013-92, Class FA | ||||||
| 1 Month LIBOR USD + 0.550% | |||||||
| 2.994%, 09/25/43 (a) | 1,689,073 | ||||||
| 652,830 | Series 2013-118, Class FB | ||||||
| 1 Month LIBOR USD + 0.520% | |||||||
| 2.964%, 12/25/43 (a) | 653,926 | ||||||
| 1,070,047 | Series 2015-30, Class AB | ||||||
| 3.000%, 05/25/45 | 1,030,242 | ||||||
| 1,746,202 | Series 2017-39, Class FT | ||||||
| 1 Month LIBOR USD + 0.400% | |||||||
| 2.844%, 05/25/47 (a) | 1,733,561 | ||||||
| 2,322,295 | Series 2017-112, Class FC | ||||||
| 1 Month LIBOR USD + 0.350% | |||||||
| 2.794%, 01/25/48 (a) | 2,297,600 | ||||||
| 738,045 | Series 2008-22, Class FD | ||||||
| 1 Month LIBOR USD + 0.840% | |||||||
| 3.284%, 04/25/48 (a)(d) | 751,369 | ||||||
| 4,322,396 | Series 2019-25, Class PF | ||||||
| 1 Month LIBOR USD + 0.450% | |||||||
| 2.894%, 06/25/49 (a)(c) | 4,309,592 | ||||||
| 1,143,362 | Series 2019-35, Class EF | ||||||
| 1 Month LIBOR USD + 0.450% | |||||||
| 2.894%, 07/25/49 (a) | 1,138,485 | ||||||
| 4,315,965 | Series 2019-33, Class CF | ||||||
| 1 Month LIBOR USD + 0.470% | |||||||
| 2.914%, 07/25/49 (a) | 4,300,763 | ||||||
| 4,882,477 | Series 2019-50, Class CF | ||||||
| 1 Month LIBOR USD + 0.450% | |||||||
| 2.894%, 09/25/49 (a)(c) | 4,863,584 | ||||||
| 3,359,794 | Series 2019-61, Class F | ||||||
| 1 Month LIBOR USD + 0.500% | |||||||
| 2.944%, 11/25/49 (a)(c) | 3,353,906 | ||||||
| 2,237,377 | Series 2020-17, Class PF | ||||||
| 1 Month LIBOR USD + 0.450% | |||||||
| 2.894%, 03/25/50 (a)(c) | 2,226,209 | ||||||
| 6,055,673 | Series 2020-26, Class GF | ||||||
| 1 Month LIBOR USD + 0.500% | |||||||
| 2.944%, 05/25/50 (a)(c) | 6,050,001 | ||||||
| 7,252,037 | Series 2020-38, Class NF | ||||||
| 1 Month LIBOR USD + 0.450% | |||||||
| 2.894%, 06/25/50 (a) | 7,221,136 | ||||||
| 3,089,055 | Series 2017-96, Class FA | ||||||
| 1 Month LIBOR USD + 0.400% | |||||||
| 2.844%, 12/25/57 (a) | 3,069,258 | ||||||
| 47,609,948 | |||||||
| Government National | |||||||
| Mortgage Association – 50.35% | |||||||
| 3,643,551 | Series 2019-054, Class HF | ||||||
| 1 Month SOFR + 0.400% | |||||||
| 1.786%, 04/20/44 (a) | 3,574,521 | ||||||
| 5,588,372 | Series 2017-H11, Class FV | ||||||
| 1 Month LIBOR USD + 0.500% | |||||||
| 2.298%, 05/20/67 (a) | 5,541,290 | ||||||
| 2,899,217 | Series 2018-H01, Class FC | ||||||
| 1 Month LIBOR USD + 0.400% | |||||||
| 2.198%, 01/20/68 (a) | 2,866,827 | ||||||
| 2,407,652 | Series 2019-H04, Class FB | ||||||
| 1 Month LIBOR USD + 0.550% | |||||||
| 2.205%, 03/20/69 (a) | 2,357,313 | ||||||
| 2,374,884 | Series 2019-H15, Class NF | ||||||
| 1 Month LIBOR USD + 0.630% | |||||||
| 2.428%, 05/20/69 (a) | 2,340,815 | ||||||
| 2,840,562 | Series 2019-H15, Class EF | ||||||
| 1 Month LIBOR USD + 0.630% | |||||||
| 2.257%, 09/20/69 (a) | 2,797,927 | ||||||
| 3,116,076 | Series 2019-H16, Class FA | ||||||
| 1 Month LIBOR USD + 0.700% | |||||||
| 1.601%, 10/20/69 (a) | 3,073,260 | ||||||
| 3,190,989 | Series 2019-H19, Class FC | ||||||
| 1 Month LIBOR USD + 0.750% | |||||||
| 2.021%, 10/20/69 (a) | 3,164,111 | ||||||
| 5,794,443 | Series 2019-H20, Class AF | ||||||
| 1 Month LIBOR USD + 0.650% | |||||||
| 2.448%, 11/20/69 (a) | 5,695,573 | ||||||
| 33,168,921 | Series 2021-H03, Class FA | ||||||
| 30-Day Average SOFR + 0.380% | |||||||
| 2.438%, 04/20/70 (a) | 33,011,086 | ||||||
See accompanying notes to financial statements.
13
TRUST FOR CREDIT UNIONS
Ultra-Short Duration Portfolio
Portfolio of Investments (continued) – August 31, 2022
| Par Value | Value | ||||||
| Government National | |||||||
| Mortgage Association – (continued) | |||||||
| $ | 4,235,413 | Series 2020-H13, Class FK | |||||
| 1 Month LIBOR USD + 0.500% | |||||||
| 2.298%, 07/20/70 (a) | $ | 4,194,949 | |||||
| 2,725,899 | Series 2020-H16, Class LF | ||||||
| 1 Month LIBOR USD + 1.050% | |||||||
| 2.482%, 09/20/70 (a) | 2,746,362 | ||||||
| 9,144,222 | Series 2020-H22, Class HF | ||||||
| 3.257%, 10/20/70 (a) | 9,689,222 | ||||||
| 17,437,635 | Series 2021-H11, Class FA | ||||||
| 30-Day Average SOFR + 1.500% | |||||||
| 2.455%, 12/20/70 (a) | 17,637,606 | ||||||
| 18,728,218 | Series 2021-H04, Class FD | ||||||
| 30-Day Average SOFR + 1.150% | |||||||
| 2.417%, 12/20/70 (a) | 18,634,655 | ||||||
| 11,681,330 | Series 2021-H03, Class JF | ||||||
| 30-Day Average SOFR + 1.250% | |||||||
| 3.308%, 01/20/71 (a) | 11,771,474 | ||||||
| 12,313,575 | Series 2021-H04, Class FA | ||||||
| 30-Day Average SOFR + 1.250% | |||||||
| 3.308%, 02/20/71 (a) | 12,405,742 | ||||||
| 16,734,350 | Series 2021-H04, Class FB | ||||||
| 30-Day Average SOFR + 1.200% | |||||||
| 3.258%, 02/20/71 (a) | 16,820,460 | ||||||
| 14,991,302 | Series 2021-H03, Class FJ | ||||||
| 30-Day Average SOFR + 1.150% | |||||||
| 2.537%, 02/20/71 (a) | 14,904,012 | ||||||
| 22,169,028 | Series 2021-H06, Class LF | ||||||
| 30-Day Average SOFR + 1.500% | |||||||
| 3.558%, 03/20/71 (a) | 22,629,306 | ||||||
| 20,782,282 | Series 2021-H06, Class PF | ||||||
| 30-Day Average SOFR + 1.500% | |||||||
| 3.558%, 04/20/71 (a) | 21,219,172 | ||||||
| 21,788,338 | Series 2021-H08, Class NF | ||||||
| 30-Day Average SOFR + 1.500% | |||||||
| 3.558%, 04/20/71 (a) | 22,236,426 | ||||||
| 23,035,969 | Series 2021-H10, Class FB | ||||||
| 30-Day Average SOFR + 1.500% | |||||||
| 3.558%, 06/20/71 (a) | 23,521,784 | ||||||
| 24,523,736 | Series 2021-H11, Class FM | ||||||
| 30-Day Average SOFR + 1.500% | |||||||
| 3.558%, 07/20/71 (a) | 25,020,400 | ||||||
| 287,854,293 | |||||||
| Total Collateralized | |||||||
| Mortgage Obligations | 361,358,533 | ||||||
| (Cost $372,032,232) | |||||||
| MORTGAGE-BACKED OBLIGATIONS – 22.48% | |||||||
| Federal Home Loan | |||||||
| Mortgage Corporation – 0.03% | |||||||
| 189 | 6 Month LIBOR USD + 1.625% | ||||||
| 2.375%, 11/01/22 (a) | 188 | ||||||
| 425 | 6 Month LIBOR USD + 1.095% | ||||||
| 2.254%, 11/01/22 (a) | 423 | ||||||
| 3,762 | 6 Month LIBOR USD + 2.232% | ||||||
| 2.974%, 10/01/24 (a) | 3,719 | ||||||
| 135,613 | H15T3Y + 2.537% 2.900%, 08/01/28 (a) | ||||||
| 134,675 | |||||||
| 25,508 | H15T1Y + 1.920% 3.690%, 05/01/31 (a) | ||||||
| 25,243 | |||||||
| 164,248 | |||||||
| Federal Home Loan Mortgage | |||||||
| Corporation Gold – 0.00% | |||||||
| 92 | 3.500%, 10/01/22 | 92 | |||||
| 41 | 4.500%, 07/01/23 | 42 | |||||
| 134 | |||||||
| Federal National | |||||||
| Mortgage Association – 21.13% | |||||||
| 24,095 | 5.000%, 03/01/27 | 24,660 | |||||
| 10,329 | 11th District COFI Institutional | ||||||
| Replacement Index + 1.254% | |||||||
| 2.358%, 07/01/27 (a) | 10,169 | ||||||
| 28,937 | 11th District COFI Institutional | ||||||
| Replacement Index + 1.504% | |||||||
| 4.685%, 01/01/29 (a) | 29,482 | ||||||
| 4,531 | 11th District COFI Institutional | ||||||
| Replacement Index + 1.504% | |||||||
| 4.671%, 02/01/29 (a) | 4,616 | ||||||
| 5,000,000 | 1 Month LIBOR USD + 0.520% | ||||||
| 2.882%, 05/01/29 (a) | 4,999,743 | ||||||
| 5,000,000 | 1 Month LIBOR USD + 0.580% | ||||||
| 2.942%, 06/01/29 (a) | 4,999,850 | ||||||
| 5,546 | 11th District COFI Institutional | ||||||
| Replacement Index + 1.695% | |||||||
| 2.188%, 08/01/29 (a) | 5,471 | ||||||
| 31,131,000 | 30-Day Average SOFR + 0.390% | ||||||
| 1.945%, 12/01/30 (a) | 31,134,449 | ||||||
| 30,870,000 | 30-Day Average SOFR + 0.350% | ||||||
| 1.905%, 01/01/31 (a) | 30,872,908 | ||||||
| 3,675,000 | 30-Day Average SOFR + 0.380% | ||||||
| 1.935%, 01/01/31 (a) | 3,675,529 | ||||||
| 21,122,124 | 30-Day Average SOFR + 0.390% | ||||||
| 1.945%, 01/01/31 (a) | 21,125,422 | ||||||
| 20,100,000 | 30-Day Average SOFR + 0.250% | ||||||
| 1.805%, 04/01/31 (a) | 20,099,100 | ||||||
| 37,580 | 12 Month LIBOR USD + 1.755% | ||||||
| 4.005%, 07/01/32 (a) | 37,275 | ||||||
| 7,233 | 6.000%, 08/01/32 | 7,495 | |||||
| 143,621 | H15T1Y + 2.625% | ||||||
| 3.703%, 09/01/32 (a) | 142,215 | ||||||
| 7,170 | 12 Month LIBOR USD + 1.225% | ||||||
| 1.475%, 01/01/33 (a) | 7,087 | ||||||
| 9,775 | H15T1Y + 2.181% | ||||||
| 3.180%, 06/01/33 (a) | 9,986 | ||||||
See accompanying notes to financial statements.
14
TRUST FOR CREDIT UNIONS
Ultra-Short Duration Portfolio
Portfolio of Investments (continued) – August 31, 2022
| Par Value | Value | ||||||
| Federal National | |||||||
| Mortgage Association – (continued) | |||||||
| $ | 192,930 | 11th District COFI Institutional | |||||
| Replacement Index + 1.254% | |||||||
| 4.592%, 08/01/33 (a) | $ | 196,041 | |||||
| 673 | 6.000%, 11/01/33 | 699 | |||||
| 94,530 | H15T1Y + 2.003% 3.003%, 04/01/34 (a) | ||||||
| 96,864 | |||||||
| 347,618 | 12 Month US Treasury Average + 1.144% | ||||||
| 1.788%, 08/01/34 (a) | 346,870 | ||||||
| 25,556 | 6.000%, 09/01/34 | 26,485 | |||||
| 119,322 | 12 Month LIBOR USD + 1.713% | ||||||
| 3.298%, 07/01/37 (a) | 122,191 | ||||||
| 53,833 | 6.500%, 11/01/37 | 54,111 | |||||
| 13,703 | 6.000%, 06/01/38 | 14,190 | |||||
| 17,334 | 6.000%, 09/01/38 | 18,013 | |||||
| 6,969 | 6.000%, 09/01/38 | 7,423 | |||||
| 5,716 | 6.000%, 11/01/38 | 5,914 | |||||
| 855 | 6.000%, 10/01/39 | 884 | |||||
| 824,259 | 12 Month LIBOR USD + 1.714% | ||||||
| 2.727%, 07/01/40 (a) | 836,512 | ||||||
| 1,371,072 | 12 Month LIBOR USD + 1.755% | ||||||
| 2.926%, 02/01/42 (a) | 1,403,872 | ||||||
| 204,550 | 12 Month LIBOR USD + 1.749% | ||||||
| 2.949%, 05/01/42 (a) | 207,990 | ||||||
| 290,438 | 12 Month US Treasury Average + 1.153% | ||||||
| 1.797%, 08/01/44 (a) | 289,984 | ||||||
| 120,813,500 | |||||||
| Government National | |||||||
| Mortgage Association – 1.32% | |||||||
| 4,811 | 7.000%, 04/15/26 | 4,903 | |||||
| 68,941 | H15T1Y + 2.000% 3.375%, 04/20/34 (a) | ||||||
| 68,658 | |||||||
| 229,663 | H15T1Y + 1.500% 2.875%, 06/20/34 (a) | ||||||
| 228,200 | |||||||
| 349,609 | H15T1Y + 1.500% 1.625%, 08/20/34 (a) | ||||||
| 343,580 | |||||||
| 14,554 | H15T1Y + 1.500% 2.875%, 05/20/42 (a) | ||||||
| 14,535 | |||||||
| 12,199 | H15T1Y + 1.500% 2.875%, 06/20/42 (a) | ||||||
| 12,183 | |||||||
| 71,555 | H15T1Y + 1.500% 1.625%, 07/20/42 (a) | ||||||
| 70,646 | |||||||
| 7,005 | H15T1Y + 1.500% 1.750%, 10/20/42 (a) | ||||||
| 6,895 | |||||||
| 14,005 | H15T1Y + 1.500% 1.750%, 12/20/42 (a) | ||||||
| 13,784 | |||||||
| 1,337,798 | 12 Month LIBOR USD + 1.695% 1.982%, 11/20/68 (a) | ||||||
| 1,362,100 | |||||||
| 2,702,910 | 12 Month LIBOR USD + 1.903% 3.206%, 06/20/69 (a) | ||||||
| 2,796,655 | |||||||
| 2,568,725 | 12 Month LIBOR USD + 1.511% 2.806%, 09/20/69 (a) | ||||||
| 2,612,516 | |||||||
| 7,534,655 | |||||||
| Total Mortgage-Backed Obligations | 128,512,537 | ||||||
| (Cost $128,604,560) | |||||||
| AGENCY DEBENTURES – 0.22% | |||||||
| Other Agency Debentures – 0.22% | |||||||
| 1,250,000 | Sri Lanka Government AID Bond | ||||||
3 Month LIBOR USD + 0.300% 1.635%, 11/01/24 (a)(f)(g) | |||||||
| 1,250,000 | |||||||
| Total Agency Debentures | 1,250,000 | ||||||
| (Cost $1,250,000) | |||||||
| U.S. GOVERNMENT-BACKED OBLIGATIONS – 10.39% | |||||||
| FHLMC, Multifamily Structured | |||||||
| Pass Through Certificates | |||||||
| 414,447 | Series K-F29, Class A | ||||||
1 Month LIBOR USD + 0.360% 2.722%, 02/25/24 (a)(d) | |||||||
| 414,093 | |||||||
| 251,087 | Series K-BF1, Class A | ||||||
1 Month LIBOR USD + 0.390% 2.752%, 07/25/24 (a)(d) | |||||||
| 250,723 | |||||||
| 2,208,589 | Series K-F49, Class A | ||||||
1 Month LIBOR USD + 0.340% 2.702%, 06/25/25 (a)(d) | |||||||
| 2,202,143 | |||||||
| 5,996,644 | Series K-F55, Class A | ||||||
1 Month LIBOR USD + 0.510% 2.872%, 11/25/25 (a)(d) | |||||||
| 5,996,638 | |||||||
| 152,072 | Series K-F30, Class A | ||||||
1 Month LIBOR USD + 0.370% 2.732%, 03/25/27 (a)(d) | |||||||
| 150,352 | |||||||
| 3,906,240 | Series K-F81, Class AL | ||||||
1 Month LIBOR USD + 0.360% 2.722%, 06/25/27 (a)(d) | |||||||
| 3,876,978 | |||||||
| 676,379 | Series K-F86, Class AS | ||||||
30-Day Average SOFR + 0.320% 1.875%, 08/25/27 (a)(d) | |||||||
| 674,059 | |||||||
| 985,500 | Series K-F50, Class A | ||||||
1 Month LIBOR USD + 0.400% 2.762%, 07/25/28 (a)(d) | |||||||
| 983,522 | |||||||
| 15,000,000 | Series K-L06, Class AFL | ||||||
1 Month LIBOR USD + 0.370% 2.732%, 12/25/29 (a)(d) | |||||||
| 14,931,909 | |||||||
| 14,701,060 | Series K-F87, Class AL | ||||||
1 Month LIBOR USD + 0.350% 2.712%, 08/26/30 (a) | |||||||
| 14,591,931 | |||||||
| 15,356,877 | Series K-F92, Class AL | ||||||
1 Month LIBOR USD + 0.330% 2.692%, 10/25/30 (a)(d) | |||||||
| 15,312,700 | |||||||
| Total U.S. Government-Backed | |||||||
| Obligations | 59,385,048 | ||||||
| (Cost $59,649,380) | |||||||
See accompanying notes to financial statements.
15
TRUST FOR CREDIT UNIONS
Ultra-Short Duration Portfolio
Portfolio of Investments (continued) – August 31, 2022
| Par Value | Value | ||||||
| REPURCHASE AGREEMENTS – 3.63% | |||||||
| $ | 20,750,000 | INTL FCStone Financial, Inc., 2.410%, | |||||
| Dated 08/31/2022, matures 09/01/2022, | |||||||
| repurchase price $20,751,389 (collateralized | |||||||
| by $22,280,230 par amount of GNMA, | |||||||
| FNMA, and FHLMC securities of 3.180% to | |||||||
| 5.000% due 03/01/28 to 08/20/52, | |||||||
| total market value $21,122,243) | $ | 20,750,000 | |||||
| Total Repurchase Agreements | 20,750,000 | ||||||
| (Cost $20,750,000) | |||||||
| Total Investments – 99.99% | 571,581,339 | ||||||
| (Cost $582,616,946) | |||||||
| Net Other Assets | |||||||
| and Liabilities – 0.01% | 77,220 | ||||||
| Net Assets – 100.00% | $ | 571,658,559 | |||||
| * | See Note A. |
| (a) | Variable rate securities. Interest rates disclosed are those which are in effect at August 31, 2022. Maturity date shown is the date of the next coupon rate reset or actual maturity. Certain variable rate securities are not based on a published reference rate and spread but are determined by the issuer or agent and are based on current market conditions. These securities do not indicate a reference rate and spread in their description. For those variable rate securities which are based on published reference and spread, the reference rate and spread are indicated in the description in the Portfolio of Investments. See also, Explanation of Abbreviations and Acronyms below. |
| (b) | The security has Sequential collateral. |
| (c) | The security has PAC (Planned Amortization Class) collateral. |
| (d) | The security has Structured collateral. |
| (e) | The security has Support collateral. |
| (f) | Security has been valued at fair market value as determined in good faith by or under the direction of the Board of Trustees of the Trust. As of August 31, 2022, this security amounted to $1,250,000 or 0.22% of net assets. Investment categorized as a significant unobservable input (Level 3). |
| (g) | Illiquid security. The total market value of this security was $1,250,000, representing 0.22% of net assets. |
Explanation of Abbreviations and Acronyms:
| COFI | Cost of Funds Indices |
| FHLMC | Federal Home Loan Mortgage Corporation |
| FNMA | Federal National Mortgage Association |
| GNMA | Government National Mortgage Association |
| H15T1Y | 1 Year US Treasury Yield Curve Constant Maturity Rate |
| H15T3Y | 3 Year US Treasury Yield Curve Constant Maturity Rate |
| LIBOR | London Interbank Offered Rate |
| REMIC | Real Estate Mortgage Investment Conduit |
| SOFR | Secured Overnight Financing Rate |
| USD | U.S. Dollar |
See accompanying notes to financial statements.
16
TRUST FOR CREDIT UNIONS
Short Duration Portfolio
Portfolio of Investments – August 31, 2022
| Par Value | Value | ||||||
| BANK NOTES – 8.16% | |||||||
| Financials – 8.16% | |||||||
| $ | 6,308,000 | Citizens Bank NA, | |||||
| 2.250%, 04/28/25 | $ | 5,980,299 | |||||
| 10,000,000 | Discover Bank, | ||||||
| 2.450%, 09/12/24 | 9,607,930 | ||||||
| 20,562,000 | First-Citizens Bank & Trust Co., | ||||||
3 Month SOFR + 1.715% 2.969%, 09/27/25 (a) | |||||||
| 19,644,311 | |||||||
| Total Bank Notes | 35,232,540 | ||||||
| (Cost $37,774,164) | |||||||
| COLLATERALIZED MORTGAGE OBLIGATIONS – 23.02% | |||||||
| Federal Home Loan Mortgage | |||||||
| Corporation REMIC – 2.04% | |||||||
| 358 | Series 1448, Class F | ||||||
1 Month LIBOR USD + 1.400% 3.791%, 12/15/22 (a)(b) | |||||||
| 358 | |||||||
| 35,338 | Series 2868, Class AV | ||||||
| 5.000%, 08/15/24 (b)(c) | 35,422 | ||||||
| 51,820 | Series 1980, Class Z | ||||||
| 7.000%, 07/15/27 (b) | 54,006 | ||||||
| 762,066 | Series 3346, Class FT | ||||||
1 Month LIBOR USD + 0.350% 2.741%, 10/15/33 (a)(c)(d) | |||||||
| 758,781 | |||||||
| 595,511 | Series 3471, Class FB | ||||||
1 Month LIBOR USD + 1.000% 3.391%, 08/15/35 (a) | |||||||
| 599,798 | |||||||
| 997,086 | Series 3208, Class FA | ||||||
1 Month LIBOR USD + 0.400% 2.791%, 08/15/36 (a) | |||||||
| 993,686 | |||||||
| 335,021 | Series 3208, Class FH | ||||||
1 Month LIBOR USD + 0.400% 2.791%, 08/15/36 (a) | |||||||
| 333,878 | |||||||
| 231,911 | Series 3367, Class YF | ||||||
1 Month LIBOR USD + 0.550% 2.941%, 09/15/37 (a) | |||||||
| 232,649 | |||||||
| 805,775 | Series 3371, Class FA | ||||||
1 Month LIBOR USD + 0.600% 2.991%, 09/15/37 (a) | |||||||
| 810,331 | |||||||
| 324,764 | Series 4248, Class QF | ||||||
1 Month LIBOR USD + 0.500% 2.891%, 06/15/39 (a)(c) | |||||||
| 324,661 | |||||||
| 123,142 | Series 3827, Class KF | ||||||
1 Month LIBOR USD + 0.370% 2.761%, 03/15/41 (a) | |||||||
| 122,808 | |||||||
| 41,120 | Series 4109, Class EC | ||||||
| 2.000%, 12/15/41 (b)(c) | 32,197 | ||||||
| 668,414 | Series 4272, Class FD | ||||||
1 Month LIBOR USD + 0.350% 2.741%, 11/15/43 (a) | |||||||
| 665,296 | |||||||
| 1,020,714 | Series 4606, Class FL | ||||||
1 Month LIBOR USD + 0.500% 2.891%, 12/15/44 (a)(c) | |||||||
| 1,017,176 | |||||||
| 447,794 | Series 4784, Class PK | ||||||
| 3.500%, 06/15/45 (d) | 442,273 | ||||||
| 2,096,369 | Series 4968, Class NP | ||||||
| 6.500%, 04/25/50 (d) | 2,402,674 | ||||||
| 8,825,994 | |||||||
| Federal National Mortgage | |||||||
| Association REMIC – 5.20% | |||||||
| 1,567,714 | Series 2013-57, Class DK | ||||||
| 3.500%, 06/25/33 | 1,547,351 | ||||||
| 130,238 | Series 2006-45, Class TF | ||||||
1 Month LIBOR USD + 0.400% 2.844%, 06/25/36 (a) | |||||||
| 129,834 | |||||||
| 155,773 | Series 2006-76, Class QF | ||||||
1 Month LIBOR USD + 0.400% 2.844%, 08/25/36 (a)(d) | |||||||
| 155,299 | |||||||
| 89,207 | Series 2007-75, Class VF | ||||||
1 Month LIBOR USD + 0.450% 2.894%, 08/25/37 (a) | |||||||
| 89,133 | |||||||
| 106,735 | Series 2010-123, Class FL | ||||||
1 Month LIBOR USD + 0.430% 2.874%, 11/25/40 (a)(d) | |||||||
| 106,638 | |||||||
| 169,211 | Series 2011-110, Class FE | ||||||
1 Month LIBOR USD + 0.400% 2.844%, 04/25/41 (a)(d) | |||||||
| 169,002 | |||||||
| 225,605 | Series 2015-92, Class PA | ||||||
| 2.500%, 12/25/41 (c)(d) | 213,613 | ||||||
| 233,687 | Series 2012-38, Class JE | ||||||
| 3.250%, 04/25/42 (d) | 221,120 | ||||||
| 579,874 | Series 2012-71, Class FL | ||||||
1 Month LIBOR USD + 0.500% 2.944%, 07/25/42 (a) | |||||||
| 579,884 | |||||||
| 1,613,215 | Series 2013-101, Class FE | ||||||
1 Month LIBOR USD + 0.600% 3.044%, 10/25/43 (a) | |||||||
| 1,621,003 | |||||||
| 2,323,276 | Series 2013-101, Class CF | ||||||
1 Month LIBOR USD + 0.600% 3.044%, 10/25/43 (a) | |||||||
| 2,334,391 | |||||||
| 2,828,382 | Series 2016-62, Class FH | ||||||
1 Month LIBOR USD + 0.400% 2.844%, 09/25/46 (a) | |||||||
| 2,817,519 | |||||||
| 3,094,390 | Series 2016-83, Class FK | ||||||
1 Month LIBOR USD + 0.500% 2.944%, 11/25/46 (a) | |||||||
| 3,095,382 | |||||||
| 1,746,202 | Series 2017-39, Class FT | ||||||
1 Month LIBOR USD + 0.400% 2.844%, 05/25/47 (a) | |||||||
| 1,733,561 | |||||||
| 1,939,648 | Series 2017-112, Class FC | ||||||
1 Month LIBOR USD + 0.350% 2.794%, 01/25/48 | |||||||
| 1,919,022 | |||||||
| 572,951 | Series 2008-22, Class FD | ||||||
1 Month LIBOR USD + 0.840% 3.284%, 04/25/48 (a)(c) | |||||||
| 583,295 | |||||||
See accompanying notes to financial statements.
17
TRUST FOR CREDIT UNIONS
Short Duration Portfolio
Portfolio of Investments (continued) – August 31, 2022
| Par Value | Value | ||||||
| Federal National Mortgage | |||||||
| Association REMIC – (continued) | |||||||
| $ | 4,488,637 | Series 2020-18, Class KD | |||||
| 6.500%, 03/25/50 | $ | 5,113,784 | |||||
| 22,429,831 | |||||||
| Government National | |||||||
| Mortgage Association – 15.78% | |||||||
| 2,899,217 | Series 2018-H01, Class FC | ||||||
1 Month LIBOR USD + 0.400% 2.198%, 01/20/68 (a) | |||||||
| 2,866,828 | |||||||
| 4,756,345 | Series 2018-H09, Class FC | ||||||
12 Month LIBOR USD + 0.150% 2.779%, 06/20/68 (a) | |||||||
| 4,633,479 | |||||||
| 5,563,700 | Series 2018-H11, Class FJ | ||||||
12 Month LIBOR USD + 0.080% 2.855%, 06/20/68 (a) | |||||||
| 5,438,848 | |||||||
| 16,584,460 | Series 2021-H03, Class FA | ||||||
30-Day Average SOFR + 0.380% 2.438%, 04/20/70 (a) | |||||||
| 16,505,543 | |||||||
| 3,292,237 | Series 2020-H09, Class DF | ||||||
1 Month LIBOR USD + 0.640% 2.438%, 05/20/70 (a) | |||||||
| 3,252,501 | |||||||
| 18,338,368 | Series 2021-H10, Class FB | ||||||
30-Day Average SOFR + 1.500% 3.558%, 06/20/71 (a) | |||||||
| 18,725,113 | |||||||
| 6,199,842 | Series 2021-H11, Class FM | ||||||
30-Day Average SOFR + 1.500% 3.558%, 07/20/71 (a) | |||||||
| 6,325,403 | |||||||
| 10,087,800 | Series 2020-176, Class MT | ||||||
| 5.000%, 11/20/50 | 10,402,023 | ||||||
| 68,149,738 | |||||||
| Total Collateralized | |||||||
| Mortgage Obligations | 99,405,563 | ||||||
| (Cost $101,726,517) | |||||||
| MORTGAGE-BACKED OBLIGATIONS – 29.94% | |||||||
| Federal Home Loan | |||||||
| Mortgage Corporation – 0.94% | |||||||
| 47,465 | 12 Month LIBOR USD + 1.840% 2.692%, 11/01/34 (a) | ||||||
| 47,205 | |||||||
| 1,266,302 | 3.000%, 11/01/34 | 1,231,195 | |||||
| 88,216 | H15T1Y + 2.250% 2.864%, 08/01/35 (a) | ||||||
| 90,189 | |||||||
| 112,433 | 12 Month LIBOR USD + 1.767% 2.332%, 05/01/36 | ||||||
| 113,757 | |||||||
| 60,911 | 12 Month LIBOR USD + 1.890% 2626%, 03/01/42 | ||||||
| 61,563 | |||||||
| 2,634,589 | 3.000%, 02/01/47 | 2,494,058 | |||||
| 4,037,967 | |||||||
| Federal Home Loan Mortgage | |||||||
| Corporation Gold – 2.38% | |||||||
| 76 | 3.500%, 10/01/22 | 76 | |||||
| 3,290,659 | 2.000%, 12/01/31 | 3,086,582 | |||||
| 35,332 | 5.000%, 08/01/35 | 36,955 | |||||
| 6,198 | 5.000%, 12/01/35 | 6,481 | |||||
| 1,435,285 | 3.000%, 01/01/37 | 1,380,535 | |||||
| 1,615,937 | 3.000%, 02/01/37 | 1,559,154 | |||||
| 2,045,854 | 3.500%, 02/01/37 | 2,022,324 | |||||
| 52,573 | 5.000%, 03/01/37 | 54,991 | |||||
| 1,713,081 | 3.500%, 03/01/37 | 1,693,379 | |||||
| 112,408 | 5.000%, 05/01/37 | 117,578 | |||||
| 77,586 | 5.000%, 02/01/38 | 80,687 | |||||
| 40,479 | 5.000%, 03/01/38 | 42,286 | |||||
| 25,920 | 5.000%, 09/01/38 | 27,105 | |||||
| 88,719 | 5.000%, 12/01/38 | 92,780 | |||||
| 59,962 | 5.000%, 01/01/39 | 62,709 | |||||
| 10,263,622 | |||||||
| Federal National | |||||||
| Mortgage Association – 16.74% | |||||||
| 19,276 | 5.000%, 03/01/27 | 19,728 | |||||
| 23,887 | 7.000%, 08/01/28 | 23,884 | |||||
| 19,349 | 7.000%, 08/01/28 | 19,346 | |||||
| 33,186 | 7.000%, 11/01/28 | 33,427 | |||||
| 5,233,000 | 1 Month LIBOR USD + 0.520% 2.882%, 05/01/29 (a) | ||||||
| 5,232,732 | |||||||
| 49,128 | 2.500%, 02/01/32 | 47,141 | |||||
| 6,859 | 7.000%, 02/01/32 | 7,093 | |||||
| 55,041 | 7.000%, 05/01/32 | 56,809 | |||||
| 147,490 | H15T1Y + 2.625% 3.703%, 09/01/32 (a) | ||||||
| 146,046 | |||||||
| 2,825,154 | 4.000%, 04/01/33 | 2,834,171 | |||||
| 146,587 | H15T1Y + 2.215% 4.105%, 07/01/33 (a) | ||||||
| 151,571 | |||||||
| 120,304 | 12 Month LIBOR USD + 1.537% 1.787%, 11/01/33 (a) | ||||||
| 119,175 | |||||||
| 159,141 | H15T1Y + 2.215% 2.340%, 12/01/33 (a) | ||||||
| 157,261 | |||||||
| 856,176 | 4.500%, 01/01/34 | 872,967 | |||||
| 442,916 | 4.500%, 01/01/34 | 450,926 | |||||
| 149,041 | 12 Month LIBOR USD + 1.533% 2.699%, 04/01/34 (a) | ||||||
| 148,027 | |||||||
| 55,944 | H15T1Y + 2.185% | ||||||
| 3.537%, 08/01/34 (a) | 55,785 | ||||||
| 329 | 6.000%, 09/01/34 | 343 | |||||
| 69,541 | 12 Month LIBOR USD + 1.679% 1.929%, 10/01/34 (a) | ||||||
| 70,975 | |||||||
| 2,769,783 | 3.000%, 01/01/35 | 2,692,986 | |||||
| 2,465,431 | 3.500%, 01/01/35 | 2,428,070 | |||||
| 2,266,244 | 2.500%, 03/01/35 | 2,160,134 | |||||
| 22,294 | 12 Month LIBOR USD + 1.671% 2.296%, 03/01/35 (a) | ||||||
| 22,153 | |||||||
| 40,620 | 12 Month LIBOR USD + 1.720% 3.095%, 04/01/35 (a) | ||||||
| 40,491 | |||||||
| 1,578,078 | 3.000%, 04/01/35 | 1,532,916 | |||||
See accompanying notes to financial statements.
18
TRUST FOR CREDIT UNIONS
Short Duration Portfolio
Portfolio of Investments (continued) – August 31, 2022
| Par Value | Value | ||||||
| Federal National | |||||||
| Mortgage Association – (continued) | |||||||
| $ | 95,478 | 12 Month LIBOR USD + 1.413% 2.225%, 05/01/35 (a) | |||||
| $ | 96,992 | ||||||
| 115,665 | H15T1Y + 2.313% 3.284%, 05/01/35 (a) | ||||||
| 119,221 | |||||||
| 51,551 | 6 Month LIBOR USD + 1.412% 2.193%, 06/01/35 (a) | ||||||
| 50,945 | |||||||
| 1,407,654 | 4.000%, 06/01/35 | 1,393,137 | |||||
| 153,759 | 12 Month LIBOR USD + 1.750% 4.000%, 08/01/35 (a) | ||||||
| 158,817 | |||||||
| 62,092 | 6 Month LIBOR USD + 1.498% 2.587%, 08/01/35 (a) | ||||||
| 61,831 | |||||||
| 35,578 | 12 Month LIBOR USD + 2.435% 3.742%, 09/01/35 (a) | ||||||
| 35,576 | |||||||
| 74,001 | H15T1Y + 2.085% 2.085%, 10/01/35 (a) | ||||||
| 73,433 | |||||||
| 277,123 | 12 Month LIBOR USD + 1.557% 2.315%, 11/01/35 (a) | ||||||
| 274,513 | |||||||
| 12,156,528 | 3.000%, 01/01/36 | 11,820,541 | |||||
| 77,053 | 12 Month LIBOR USD + 1.737% 2.487%, 03/01/36 (a) | ||||||
| 76,532 | |||||||
| 6,693,860 | 2.000%, 03/01/36 | 6,186,791 | |||||
| 95,019 | 12 Month US Treasury Average + 2.245% 2.917%, 04/01/36 (a) | ||||||
| 99,888 | |||||||
| 856,866 | 4.500%, 12/01/38 | 868,605 | |||||
| 3,270,970 | 4.000%, 09/01/39 | 3,248,447 | |||||
| 29,333 | 5.000%, 10/01/39 | 30,378 | |||||
| 262,993 | 12 Month LIBOR USD + 1.749% 2.949%, 05/01/42 (a) | ||||||
| 267,416 | |||||||
| 83,616 | 12 Month LIBOR USD + 1.700% 3.450%, 06/01/42 (a) | ||||||
| 85,867 | |||||||
| 131,687 | 12 Month LIBOR USD + 1.684% 1.934%, 10/01/42 (a) | ||||||
| 133,158 | |||||||
| 213,164 | 12 Month LIBOR USD + 1.597% 3.108%, 12/01/44 (a) | ||||||
| 215,900 | |||||||
| 744,154 | 12 Month LIBOR USD + 1.610% 3.138%, 04/01/47 (a) | ||||||
| 728,445 | |||||||
| 627,082 | 12 Month LIBOR USD + 1.609% 3.141%, 09/01/47 (a) | ||||||
| 612,849 | |||||||
| 549,964 | 3.500%, 04/01/49 | 529,890 | |||||
| 704,151 | 4.000%, 05/01/49 | 694,189 | |||||
| 12,500,000 | 4.500%, 09/01/52 | 12,462,694 | |||||
| 12,500,000 | 5.000%, 09/01/52 | 12,639,476 | |||||
| 72,289,688 | |||||||
| Government National | |||||||
| Mortgage Association – 0.64% | |||||||
| 16,027 | H15T1Y + 1.500% 2.875%, 05/20/42 (a) | ||||||
| 16,007 | |||||||
| 13,881 | H15T1Y + 1.500% 2.875%, 06/20/42 (a) | ||||||
| 13,864 | |||||||
| 79,250 | H15T1Y + 1.500% 1.625%, 07/20/42 (a) | ||||||
| 78,243 | |||||||
| 7,971 | H15T1Y + 1.500% 1.750%, 10/20/42 (a) | ||||||
| 7,846 | |||||||
| 15,667 | H15T1Y + 1.500% 1.750%, 12/20/42 (a) | ||||||
| 15,420 | |||||||
| 2,606,109 | 12 Month LIBOR USD + 1.511% 2.431%, 09/20/69 (a) | ||||||
| 2,650,538 | |||||||
| 2,781,918 | |||||||
| Uniform Mortgage | |||||||
| Backed Securities – 9.24% | |||||||
| 40,000,000 | 4.000%, 09/15/29 (e) | 39,901,103 | |||||
| 39,901,103 | |||||||
| Total Mortgage-Backed Obligations | 129,274,298 | ||||||
| (Cost $132,206,962) | |||||||
| MUNICIPAL BONDS – 1.41% | |||||||
| City of New Orleans LA | |||||||
| Sewerage Service Revenue – 0.30% | |||||||
| 400,000 | 0.589%, 06/01/24 | 375,871 | |||||
| 500,000 | 0.808%, 06/01/25 | 455,493 | |||||
| 500,000 | 0.958%, 06/01/26 | 441,697 | |||||
| 1,273,061 | |||||||
| City of New Orleans LA | |||||||
| Water System Revenue – 0.28% | |||||||
| 500,000 | 0.465%, 12/01/23 | 478,195 | |||||
| 500,000 | 0.858%, 12/01/25 | 448,925 | |||||
| 315,000 | 1.008%, 12/01/26 | 274,340 | |||||
| 1,201,460 | |||||||
| City of New York NY – 0.83% | |||||||
| 4,000,000 | 1.216%, 08/01/26 | 3,603,569 | |||||
| Total Municipal Bonds | 6,078,090 | ||||||
| (Cost $6,764,671) | |||||||
| U.S. GOVERNMENT-BACKED OBLIGATIONS – 36.75% | |||||||
| FHLMC, Multifamily Structured | |||||||
| Pass Through Certificates | |||||||
| 414,447 | Series K-F29, Class A | ||||||
1 Month LIBOR USD + 0.360% 2.722%, 02/25/24 (a)(c) | |||||||
| 414,093 | |||||||
| 33,063 | Series K-J27, Class A1 | ||||||
| 2.092%, 07/25/24 (b)(c) | 32,850 | ||||||
| 1,192,883 | Series K-F49, Class A | ||||||
1 Month LIBOR USD + 0.340% 2.702%, 06/25/25 (a)(c) | |||||||
| 1,189,402 | |||||||
| 7,783,855 | Series K-S10, Class A10 | ||||||
1 Month LIBOR USD + 0.610% 2.972%, 10/25/28 (a)(c) | |||||||
| 7,771,098 | |||||||
| 876,806 | Series K-091, Class A1 | ||||||
| 3.339%, 10/25/28 (b)(c) | 869,802 | ||||||
| 21,791,372 | Series K-F125, Class AS | ||||||
30-Day Average SOFR + 0.220% 1.775%, 10/25/28 (a)(c) | |||||||
| 21,509,488 | |||||||
| 3,040,200 | Series K-F59, Class A | ||||||
1 Month LIBOR USD + 0.540% 2.902%, 02/25/29 (a)(c) | |||||||
| 3,028,023 | |||||||
See accompanying notes to financial statements.
19
TRUST FOR CREDIT UNIONS
Short Duration Portfolio
Portfolio of Investments (continued) – August 31, 2022
| Par Value | Value | ||||||
| U.S. GOVERNMENT-BACKED OBLIGATIONS – (continued) | |||||||
| FHLMC, Multifamily Structured | |||||||
| Pass Through Certificates (continued) | |||||||
| $ | 5,000,000 | Series K-S13, Class A | |||||
1 Month LIBOR USD + 0.660% 3.022%, 09/25/29 (a)(c) | |||||||
| $ | 4,993,811 | ||||||
| 15,356,877 | Series K-F92, Class AL | ||||||
1 Month LIBOR USD + 0.330% 2.692%, 10/25/30 (a)(c) | |||||||
| 15,312,700 | |||||||
| 18,506,220 | Series K-103, Class AS | ||||||
30-Day Average SOFR + 0.240% 1.795%, 01/27/31 (a)(c) | |||||||
| 18,177,507 | |||||||
| FNMA | |||||||
| 820,104 | Series 2013-M6, Class 2A | ||||||
| 2.672%, 03/25/23 (a) | 813,157 | ||||||
| GNMA | |||||||
| 22,074,505 | Series 2021-051, Class AC | ||||||
| 1.500%, 05/16/55 (d) | 19,418,399 | ||||||
| 22,986,671 | Series 2021-040, Class AD | ||||||
| 1.500%, 05/16/61 (d) | 20,083,006 | ||||||
| 20,396,382 | Series 2021-052, Class A | ||||||
| 1.500%, 05/16/61 (d) | 17,914,717 | ||||||
| 13,357,881 | Series 2021-068, Class AB | ||||||
| 1.500%, 12/16/61 (d) | 11,714,312 | ||||||
| 17,250,192 | Series 2020-132, Class AD | ||||||
| 2.200%, 09/16/62 (a) | 15,434,126 | ||||||
| Total U.S. Government-Backed | |||||||
| Obligations | 158,676,491 | ||||||
| (Cost $172,392,757) | |||||||
| REPURCHASE AGREEMENTS – 15.75% | |||||||
| 68,000,000 | INT FCStone Financial, Inc., 2.410%, Dated 08/31/2022, matures 09/01/2022, | ||||||
| repurchase price $68,004,552 (collateralized | |||||||
| by $305,218,322 par amount of | |||||||
| GNMA, FNMA, and FHLMC | |||||||
| securities of 1.000% to 9.500% | |||||||
| due 09/25/22 to 08/20/66, | |||||||
| total market value $69,541,725) | 68,000,000 | ||||||
| Total Repurchase Agreements | 68,000,000 | ||||||
| (Cost $68,000,000) | |||||||
| REGISTERED INVESTMENT COMPANY – 0.09% | |||||||
| 399,879 | First American Government | ||||||
| Obligations Fund – Class X | |||||||
| 2.039%, 12/01/31 (f) | 399,879 | ||||||
| Total Registered | |||||||
| Investment Company | 399,879 | ||||||
| (Cost $399,879) | |||||||
| Total Investments – 115.12% | 497,066,861 | ||||||
| (Cost $519,264,950) | |||||||
| Net Other Assets | |||||||
| and Liabilities – (15.12)% | (65,295,350 | ) | |||||
| Net Assets – 100.00% | $ | 431,771,511 | |||||
| (a) | Variable rate securities. Interest rates disclosed are those which are in effect at August 31, 2022. Maturity date shown is the date of the next coupon rate reset or actual maturity. Certain variable rate securities are not based on a published reference rate and spread but are determined by the issuer or agent and are based on current market conditions. These securities do not indicate a reference rate and spread in their description. For those variable rate securities which are based on published reference and spread, the reference rate and spread are indicated in the description in the Portfolio of Investments. See also, Explanation of Abbreviations and Acronyms below. |
| (b) | The security has Sequential collateral. |
| (c) | The security has Structured collateral. |
| (d) | The security has PAC (Planned Amortization Class) collateral. |
| (e) | Represents or includes a TBA (To Be Announced) transaction. See Note 2.J. |
| (f) | Seven day yield as of August 31, 2022. |
Explanation of Abbreviations and Acronyms:
| FHLMC | Federal Home Loan Mortgage Corp. |
| FNMA | Federal National Mortgage Association |
| GNMA | Government National Mortgage Association |
| H15T1Y | 1 Year US Treasury Yield Curve Constant Maturity Rate |
| LIBOR | London Interbank Offered Rate |
| REMIC | Real Estate Mortgage Investment Conduit |
| SOFR | Secured Overnight Financing Rate |
| USD | U.S. Dollar |
See accompanying notes to financial statements.
20
TRUST FOR CREDIT UNIONS
Statements of Assets and Liabilities
August 31, 2022
| Ultra-Short | Short | |||||||
| Duration | Duration | |||||||
| Portfolio | Portfolio | |||||||
| ASSETS: | ||||||||
| INVESTMENTS: | ||||||||
| Investments and repurchase agreements at cost | $ | 582,616,946 | $ | 519,264,950 | ||||
| Investments at value | $ | 550,831,339 | $ | 429,066,861 | ||||
| Repurchase agreements at value | 20,750,000 | 68,000,000 | ||||||
| Total investments and repurchase agreements at value | 571,581,339 | 497,066,861 | ||||||
| Cash | 265,178 | — | ||||||
| RECEIVABLES: | ||||||||
| Interest | 603,788 | 1,053,736 | ||||||
| Investment securities sold | 3,817 | 14,441 | ||||||
| TBA investment securities sold | — | 35,423,733 | ||||||
| Other assets | 57,706 | 27,759 | ||||||
| Total Assets | 572,511,828 | 533,586,530 | ||||||
| LIABILITIES: | ||||||||
| PAYABLES: | ||||||||
| Dividends | 637,221 | 440,352 | ||||||
| Investment securities purchased | — | 25,156,163 | ||||||
| TBA investment securities purchased | — | 76,059,201 | ||||||
| Advisory fees | 61,719 | 49,586 | ||||||
| Administration fees | 25,304 | 18,891 | ||||||
| Distribution fees | 2,684 | 1,940 | ||||||
| Trustees’ fees | 8 | 5 | ||||||
| Accrued expenses | 126,333 | 88,881 | ||||||
| Total Liabilities | 853,269 | 101,815,019 | ||||||
| NET ASSETS | $ | 571,658,559 | $ | 431,771,511 | ||||
| NET ASSETS CONSIST OF: | ||||||||
| Paid-in capital | $ | 609,942,503 | $ | 493,173,190 | ||||
| Accumulated deficit | (38,283,944 | ) | (61,401,679 | ) | ||||
| NET ASSETS | $ | 571,658,559 | $ | 431,771,511 | ||||
| TCU Shares: | ||||||||
| Net assets | $ | 466,894,047 | $ | 356,187,421 | ||||
| Total shares outstanding, $0.001 par value (unlimited number of shares authorized) | 50,693,943 | 38,612,956 | ||||||
| Net asset value, offering price and redemption | ||||||||
| price per share (net assets/shares outstanding) | $ | 9.21 | $ | 9.22 | ||||
| Investor Shares: | ||||||||
| Net assets | $ | 104,764,512 | $ | 75,584,090 | ||||
| Total shares outstanding, $0.001 par value (unlimited number of shares authorized) | 11,378,470 | 8,189,457 | ||||||
| Net asset value, offering price and redemption | ||||||||
| price per share (net assets/shares outstanding) | $ | 9.21 | $ | 9.23 | ||||
See accompanying notes to financial statements.
21
TRUST FOR CREDIT UNIONS
Statements of Operations
For the Year Ended August 31, 2022
| Ultra-Short | Short | |||||||
| Duration | Duration | |||||||
| Portfolio | Portfolio | |||||||
| INVESTMENT INCOME: | ||||||||
| Interest | $ | 5,272,051 | $ | 7,694,570 | ||||
| EXPENSES: | ||||||||
| Advisory fees | 1,737,921 | 1,050,560 | ||||||
| Administration fees | 1,080,835 | 524,353 | ||||||
| Accounting fees | 550,220 | 293,091 | ||||||
| Distribution and Service (12b-1) Fees on Investor Shares | 315,398 | 108,193 | ||||||
| Legal fees | 210,712 | 103,924 | ||||||
| Trustees' fees | 200,233 | 98,417 | ||||||
| Transfer agent fees | 152,570 | 84,398 | ||||||
| Compliance fees | 123,303 | 63,023 | ||||||
| Custody fees | 94,603 | 51,050 | ||||||
| Interest expense | 76,151 | 37,995 | ||||||
| Audit and tax fees | 24,991 | 24,991 | ||||||
| Registration fees | 22,511 | 21,331 | ||||||
| Printing fees | 5,224 | 3,378 | ||||||
| Other expenses | 135,929 | 64,180 | ||||||
| Net operating expenses | 4,730,601 | 2,528,884 | ||||||
| Net Investment Income | 541,450 | 5,165,686 | ||||||
| REALIZED AND UNREALIZED GAIN (LOSS) ON INVESTMENTS: | ||||||||
| Net realized loss on investment transactions | (9,669,436 | ) | (29,890,222 | ) | ||||
| Net change in unrealized appreciation (depreciation) of: | ||||||||
| Investments | (17,006,407 | ) | (29,506,643 | ) | ||||
| Net Realized and Unrealized Loss on Investments | (26,675,843 | ) | (59,396,865 | ) | ||||
NET DECREASE IN NET ASSETS RESULTING FROM OPERATIONS: | $ | (26,134,393 | ) | $ | (54,231,179 | ) | ||
See accompanying notes to financial statements.
22
TRUST FOR CREDIT UNIONS
Statements of Changes in Net Assets
| Ultra-Short Duration Portfolio | Short Duration Portfolio | |||||||||||||||
| Year Ended | Year Ended | Year Ended | Year Ended | |||||||||||||
| August 31, 2022 | August 31, 2021 | August 31, 2022 | August 31, 2021 | |||||||||||||
| Investment Activities: | ||||||||||||||||
| Operations: | ||||||||||||||||
| Net investment income | $ | 541,450 | $ | 6,492,631 | $ | 5,165,686 | $ | 3,819,874 | ||||||||
| Net realized gain (loss) | ||||||||||||||||
| on investment transactions | (9,669,436 | ) | 352,841 | (29,890,222 | ) | 3,265,308 | ||||||||||
| Net change in unrealized appreciation | ||||||||||||||||
| (depreciation) of investments | (17,006,407 | ) | 1,329,797 | (29,506,643 | ) | (7,824,812 | ) | |||||||||
| Net increase (decrease) in net assets | ||||||||||||||||
| resulting from operations | (26,134,393 | ) | 8,175,269 | (54,231,179 | ) | (739,630 | ) | |||||||||
| Distributions to Shareholders: | ||||||||||||||||
| Dividends and distributions to shareholders | ||||||||||||||||
| TCU Shares | (3,643,894 | ) | (3,487,534 | ) | (5,244,302 | ) | (4,920,730 | ) | ||||||||
| Investor Shares | (2,478,607 | ) | (4,416,618 | ) | (2,080,511 | ) | (2,730,824 | ) | ||||||||
| Total Distributions | (6,122,501 | ) | (7,904,152 | ) | (7,324,813 | ) | (7,651,554 | ) | ||||||||
| From Shares Transactions: | ||||||||||||||||
| TCU Shares: | ||||||||||||||||
| Proceeds from sale of shares | 35,500,000 | 824,617,066 | 283,849,220 | 259,000,000 | ||||||||||||
| Reinvestment of dividends and distributions | 1,769,335 | 2,233,087 | 2,436,377 | 2,266,877 | ||||||||||||
| Cost of shares repurchased | (1,031,267,632 | ) | (95,042,735 | ) | (691,021,045 | ) | (43,688,555 | ) | ||||||||
| Investor Shares: | ||||||||||||||||
| Proceeds from sale of shares | 144,591,517 | 1,943,061,043 | 30,000,000 | 644,550,185 | ||||||||||||
| Reinvestment of dividends and distributions | 1,395,841 | 2,476,031 | 879,078 | 1,582,802 | ||||||||||||
| Cost of shares repurchased | (1,893,224,048 | ) | (969,886,028 | ) | (634,667,236 | ) | (204,142,155 | ) | ||||||||
| Net increase (decrease) in net assets | ||||||||||||||||
| resulting from shares transactions | (2,741,234,987 | ) | 1,707,458,464 | (1,008,523,606 | ) | 659,569,154 | ||||||||||
| Net change in net assets | (2,773,491,881 | ) | 1,707,729,581 | (1,070,079,598 | ) | 651,177,970 | ||||||||||
| Net Assets: | ||||||||||||||||
| Beginning of year | 3,345,150,440 | 1,637,420,859 | 1,501,851,109 | 850,673,139 | ||||||||||||
| End of year | $ | 571,658,559 | $ | 3,345,150,440 | $ | 431,771,511 | $ | 1,501,851,109 | ||||||||
| Other Information: | ||||||||||||||||
| Summary of Shares Transactions: | ||||||||||||||||
| TCU Shares: | ||||||||||||||||
| Shares sold | 3,765,707 | 87,373,733 | 29,882,023 | 26,255,089 | ||||||||||||
| Reinvestment of dividends and distributions | 188,484 | 236,714 | 256,933 | 229,769 | ||||||||||||
| Shares repurchased | (110,225,827 | ) | (10,072,021 | ) | (73,109,677 | ) | (4,446,487 | ) | ||||||||
| Total TCU Share Transactions | (106,271,636 | ) | 77,538,426 | (42,970,721 | ) | 22,038,371 | ||||||||||
| Investor Shares: | ||||||||||||||||
| Shares sold | 15,361,849 | 205,937,764 | 3,058,104 | 65,426,742 | ||||||||||||
| Reinvestment of dividends and distributions | 148,593 | 262,475 | 90,825 | 160,542 | ||||||||||||
| Shares repurchased | (201,967,137 | ) | (102,761,009 | ) | (66,079,781 | ) | (20,728,219 | ) | ||||||||
| Total Investor Share Transactions | (186,456,695 | ) | 103,439,230 | (62,930,852 | ) | 44,859,065 | ||||||||||
| Net increase (decrease) in | ||||||||||||||||
| shares outstanding | (292,728,331 | ) | 180,977,656 | (105,901,573 | ) | 66,897,436 | ||||||||||
See accompanying notes to financial statements.
23
TRUST FOR CREDIT UNIONS
Financial Highlights
SELECTED DATA FOR A SHARE OUTSTANDING THROUGHOUT EACH YEAR
| Ultra-Short Duration Portfolio – TCU Shares | ||||||||||||||||||||
| Years Ended August 31, | ||||||||||||||||||||
| 2022 | 2021 | 2020 | 2019 | 2018 | ||||||||||||||||
| Net Asset Value, | ||||||||||||||||||||
| Beginning of year | $ | 9.43 | $ | 9.42 | $ | 9.38 | $ | 9.40 | $ | 9.47 | ||||||||||
| Income from Investment Operations: | ||||||||||||||||||||
Net investment income(a)(b) | 0.00 | (c) | 0.02 | 0.13 | 0.22 | 0.14 | ||||||||||||||
| Net realized and unrealized gain (loss) | ||||||||||||||||||||
| on investment transactions | (0.18 | ) | 0.02 | 0.05 | (0.01 | ) | (0.06 | ) | ||||||||||||
| Total income from investment operations | (0.18 | ) | 0.04 | 0.18 | 0.21 | 0.08 | ||||||||||||||
| Less Distributions from: | ||||||||||||||||||||
Investment income(b) | (0.04 | ) | (0.03 | ) | (0.14 | ) | (0.23 | ) | (0.15 | ) | ||||||||||
| Total Distributions | (0.04 | ) | (0.03 | ) | (0.14 | ) | (0.23 | ) | (0.15 | ) | ||||||||||
| Net Asset Value, | ||||||||||||||||||||
| End of year | $ | 9.21 | $ | 9.43 | $ | 9.42 | $ | 9.38 | $ | 9.40 | ||||||||||
Total Return(d) | -1.93 | % | 0.44 | % | 1.99 | % | 2.22 | % | 0.89 | % | ||||||||||
| Ratios/Supplemental Data: | ||||||||||||||||||||
| Net assets at the end of year (in thousands) | $ | 466,894 | $ | 1,479,989 | $ | 748,181 | $ | 427,038 | $ | 360,130 | ||||||||||
| Ratios to average net assets: | ||||||||||||||||||||
| Expenses net of expense reductions | 0.20 | % | 0.20 | % | 0.26 | %(e) | 0.32 | %(e) | 0.40 | %(e) | ||||||||||
| Expenses before expense reductions | 0.20 | % | 0.20 | % | 0.26 | % | 0.33 | % | 0.41 | % | ||||||||||
| Net investment income net of expense reductions | 0.04 | % | 0.26 | % | 1.39 | %(e) | 2.37 | %(e) | 1.52 | %(e) | ||||||||||
| Net investment income before expense reductions | 0.04 | % | 0.26 | % | 1.39 | % | 2.36 | % | 1.51 | % | ||||||||||
| Portfolio Turnover Rate | 3 | % | 26 | % | 25 | % | 60 | % | 157 | % | ||||||||||
______________________
| (a) | Calculated based on average shares outstanding. |
| (b) | Net investment income per share differs from Distributions to Shareholders from net investment income primarily due to book/tax differences on treatment of paydown gains and losses, market discounts and market premiums. |
| (c) | Amount is between $(0.005) and 0.005. |
| (d) | Assumes investment at the net asset value at the beginning of the year, reinvestment of all distributions and a complete redemption of the investment at the net asset value at the end of the year. |
| (e) | During the year, certain fees were waived (see Note 3). |
See accompanying notes to financial statements.
24
TRUST FOR CREDIT UNIONS
Financial Highlights
SELECTED DATA FOR A SHARE OUTSTANDING THROUGHOUT EACH YEAR
| Ultra-Short Duration Portfolio – Investor Shares | ||||||||||||||||||||
| Years Ended August 31, | ||||||||||||||||||||
| 2022 | 2021 | 2020 | 2019 | 2018 | ||||||||||||||||
| Net Asset Value, | ||||||||||||||||||||
| Beginning of year | $ | 9.43 | $ | 9.42 | $ | 9.38 | $ | 9.40 | $ | 9.47 | ||||||||||
| Income from Investment Operations: | ||||||||||||||||||||
Net investment income(a)(b) | 0.00 | (c) | 0.02 | 0.09 | 0.22 | 0.14 | ||||||||||||||
| Net realized and unrealized gain (loss) | ||||||||||||||||||||
| on investment transactions | (0.18 | ) | 0.02 | 0.09 | (0.02 | ) | (0.06 | ) | ||||||||||||
| Total income from investment operations | (0.18 | ) | 0.04 | 0.18 | 0.20 | 0.08 | ||||||||||||||
| Less Distributions from: | ||||||||||||||||||||
Investment income(b) | (0.04 | ) | (0.03 | ) | (0.14 | ) | (0.22 | ) | (0.15 | ) | ||||||||||
| Total Distributions | (0.04 | ) | (0.03 | ) | (0.14 | ) | (0.22 | ) | (0.15 | ) | ||||||||||
| Net Asset Value, | ||||||||||||||||||||
| End of year | $ | 9.21 | $ | 9.43 | $ | 9.42 | $ | 9.38 | $ | 9.40 | ||||||||||
Total Return(d) | -1.96 | % | 0.41 | % | 1.96 | % | 2.19 | % | 0.86 | % | ||||||||||
| Ratios/Supplemental Data: | ||||||||||||||||||||
| Net assets at the end of year (in thousands) | $ | 104,765 | $ | 1,865,162 | $ | 889,240 | $ | 54,160 | $ | 14,192 | ||||||||||
| Ratios to average net assets: | ||||||||||||||||||||
| Expenses net of expense reductions | 0.23 | % | 0.23 | % | 0.28 | %(e) | 0.34 | %(e) | 0.43 | %(e) | ||||||||||
| Expenses before expense reductions | 0.23 | % | 0.23 | % | 0.28 | % | 0.35 | % | 0.44 | % | ||||||||||
| Net investment income net of expense reductions | 0.01 | % | 0.23 | % | 0.94 | %(e) | 2.40 | %(e) | 1.48 | %(e) | ||||||||||
| Net investment income before expense reductions | 0.01 | % | 0.23 | % | 0.94 | % | 2.39 | % | 1.47 | % | ||||||||||
| Portfolio Turnover Rate | 3 | % | 26 | % | 25 | % | 60 | % | 157 | % | ||||||||||
______________________
| (a) | Calculated based on average shares outstanding. |
| (b) | Net investment income per share differs from Distributions to Shareholders from net investment income primarily due to book/tax differences on treatment of paydown gains and losses, market discounts and market premiums. |
| (c) | Amount is between $(0.005) and 0.005. |
| (d) | Assumes investment at the net asset value at the beginning of the year, reinvestment of all distributions and a complete redemption of the investment at the net asset value at the end of the year. |
| (e) | During the year, certain fees were waived (see Note 3). |
See accompanying notes to financial statements.
25
TRUST FOR CREDIT UNIONS
Financial Highlights
SELECTED DATA FOR A SHARE OUTSTANDING THROUGHOUT EACH YEAR
| Short Duration Portfolio – TCU Shares | ||||||||||||||||||||
| Years Ended August 31, | ||||||||||||||||||||
| 2022 | 2021 | 2020 | 2019 | 2018 | ||||||||||||||||
| Net Asset Value, | ||||||||||||||||||||
| Beginning of year | $ | 9.83 | $ | 9.91 | $ | 9.75 | $ | 9.51 | $ | 9.67 | ||||||||||
| Income from Investment Operations: | ||||||||||||||||||||
Net investment income(a)(b) | 0.05 | 0.03 | 0.17 | 0.23 | 0.16 | |||||||||||||||
| Net realized and unrealized gain (loss) | ||||||||||||||||||||
| on investment transactions | (0.58 | ) | (0.04 | ) | 0.19 | 0.25 | (0.15 | ) | ||||||||||||
| Total income from investment operations | (0.53 | ) | (0.01 | ) | 0.36 | 0.48 | 0.01 | |||||||||||||
| Less Distributions from: | ||||||||||||||||||||
Investment income(b) | (0.08 | ) | (0.07 | ) | (0.20 | ) | (0.24 | ) | (0.17 | ) | ||||||||||
| Total Distributions | (0.08 | ) | (0.07 | ) | (0.20 | ) | (0.24 | ) | (0.17 | ) | ||||||||||
| Net Asset Value, | ||||||||||||||||||||
| End of year | $ | 9.22 | $ | 9.83 | $ | 9.91 | $ | 9.75 | $ | 9.51 | ||||||||||
Total Return(c) | -5.40 | % | -0.13 | % | 3.76 | % | 5.15 | % | 0.06 | % | ||||||||||
| Ratios/Supplemental Data: | ||||||||||||||||||||
| Net assets at the end of year (in thousands) | $ | 356,187 | $ | 802,363 | $ | 590,322 | $ | 400,537 | $ | 380,063 | ||||||||||
| Ratios to average net assets: | ||||||||||||||||||||
| Expenses net of expense reductions | 0.23 | % | 0.21 | % | 0.27 | %(d) | 0.32 | %(d) | 0.39 | %(d) | ||||||||||
| Expenses before expense reductions | 0.23 | % | 0.21 | % | 0.27 | % | 0.33 | % | 0.40 | % | ||||||||||
| Net investment income net of expense reductions | 0.50 | % | 0.34 | % | 1.71 | %(d) | 2.42 | %(d) | 1.65 | %(d) | ||||||||||
| Net investment income before expense reductions | 0.50 | % | 0.34 | % | 1.71 | % | 2.41 | % | 1.64 | % | ||||||||||
| Portfolio Turnover Rate | 266 | % | 311 | % | 112 | % | 80 | % | 196 | % | ||||||||||
______________________
| (a) | Calculated based on average shares outstanding. |
| (b) | Net investment income per share differs from Distributions to Shareholders from net investment income primarily due to book/tax differences on treatment of paydown gains and losses, market discounts and market premiums. |
| (c) | Assumes investment at the net asset value at the beginning of the year, reinvestment of all distributions and a complete redemption of the investment at the net asset value at the end of the year. |
| (d) | During the year, certain fees were waived (see Note 3). |
See accompanying notes to financial statements.
26
TRUST FOR CREDIT UNIONS
Financial Highlights
SELECTED DATA FOR A SHARE OUTSTANDING THROUGHOUT EACH YEAR
| Short Duration Portfolio – Investor Shares | ||||||||||||||||||||
| Years Ended August 31, | ||||||||||||||||||||
| 2022 | 2021 | 2020 | 2019 | 2018 | ||||||||||||||||
| Net Asset Value, | ||||||||||||||||||||
| Beginning of year | $ | 9.84 | $ | 9.91 | $ | 9.75 | $ | 9.51 | $ | 9.67 | ||||||||||
| Income from Investment Operations: | ||||||||||||||||||||
Net investment income(a)(b) | 0.04 | 0.03 | 0.12 | 0.22 | 0.15 | |||||||||||||||
| Net realized and unrealized gain (loss) | ||||||||||||||||||||
| on investment transactions | (0.57 | ) | (0.04 | ) | 0.24 | 0.26 | (0.15 | ) | ||||||||||||
| Total income from investment operations | (0.53 | ) | (0.01 | ) | 0.36 | 0.48 | 0.00 | |||||||||||||
| Less Distributions from: | ||||||||||||||||||||
Investment income(b) | (0.08 | ) | (0.06 | ) | (0.20 | ) | (0.24 | ) | (0.16 | ) | ||||||||||
| Total Distributions | (0.08 | ) | (0.06 | ) | (0.20 | ) | (0.24 | ) | (0.16 | ) | ||||||||||
| Net Asset Value, | ||||||||||||||||||||
| End of year | $ | 9.23 | $ | 9.84 | $ | 9.91 | $ | 9.75 | $ | 9.51 | ||||||||||
Total Return(c) | -5.42 | % | -0.06 | % | 3.73 | % | 5.12 | % | 0.03 | % | ||||||||||
| Ratios/Supplemental Data: | ||||||||||||||||||||
| Net assets at the end of year (in thousands) | $ | 75,584 | $ | 699,488 | $ | 260,351 | $ | 1,792 | $ | 22,082 | ||||||||||
| Ratios to average net assets: | ||||||||||||||||||||
| Expenses net of expense reductions | 0.26 | % | 0.24 | % | 0.28 | %(d) | 0.35 | %(d) | 0.42 | %(d) | ||||||||||
| Expenses before expense reductions | 0.26 | % | 0.24 | % | 0.28 | % | 0.36 | % | 0.43 | % | ||||||||||
| Net investment income net of expense reductions | 0.47 | % | 0.27 | % | 1.23 | %(d) | 2.27 | %(d) | 1.62 | %(d) | ||||||||||
| Net investment income before expense reductions | 0.47 | % | 0.27 | % | 1.23 | % | 2.26 | % | 1.61 | % | ||||||||||
| Portfolio Turnover Rate | 266 | % | 311 | % | 112 | % | 80 | % | 196 | % | ||||||||||
______________________
| (a) | Calculated based on average shares outstanding. |
| (b) | Net investment income per share differs from Distributions to Shareholders from net investment income primarily due to book/tax differences on treatment of paydown gains and losses, market discounts and market premiums. |
| (c) | Assumes investment at the net asset value at the beginning of the year, reinvestment of all distributions and a complete redemption of the investment at the net asset value at the end of the year. |
| (d) | During the year, certain fees were waived (see Note 3). |
See accompanying notes to financial statements.
27
TRUST FOR CREDIT UNIONS
Notes to Financial Statements
Year Ended August 31, 2022
Note 1. Organization
Trust for Credit Unions (the “Trust”) is a Massachusetts business trust registered under the Investment Company Act of 1940, as amended (the “Act”), as an open-end management investment company currently consisting of three diversified portfolios. This shareholder report relates to the Trust’s Ultra-Short Duration Portfolio and Short Duration Portfolio (together, the “Portfolios” or individually, a “Portfolio”). Shares of the Portfolios are offered for sale solely to state and federally chartered credit unions. The Trust previously offered shares of another portfolio, the Money Market Portfolio, which suspended operations as of the close of business on May 30, 2014.
On October 1, 2012, the Trust began offering a second class of shares, known as Investor Shares, in each of the Portfolios and the existing shares in each Portfolio were redesignated as TCU Shares. Investor Shares and TCU Shares of each Portfolio should have returns that are substantially the same because they represent interests in the same Portfolio and differ only to the extent that they have different class specific expenses. Effective October 1, 2012, TCU Shares of each Portfolio are only available to those shareholders that had open accounts in the particular Portfolio as of such date. The Investor Shares of each Portfolio commenced operations on November 30, 2012.
The Portfolios seek to achieve a high level of current income, consistent with low volatility of principal (in the case of the Ultra-Short Duration Portfolio) and relatively low volatility of principal (in the case of the Short Duration Portfolio) by investing in obligations authorized under the Federal Credit Union Act.
The Portfolios are investment companies and accordingly follow the investment company accounting and reporting guidance of the Financial Accounting Standards Board (“FASB”) Accounting Standards Codification (“ASC”) Topic 946 “Financial Services – Investment Companies”.
Note 2. Summary of Significant Accounting Policies
The following is a summary of significant accounting policies consistently followed by the Portfolios. The preparation of financial statements in conformity with U.S. generally accepted accounting principles (“U.S. GAAP”) requires management to make estimates and assumptions that may affect the reported amounts. Actual results could differ from those estimates.
A. Investment Valuation
Investments in mortgage-backed, asset-backed (to the extent that obligations authorized under the Federal Credit Union Act are categorized as asset-backed obligations), and U.S. Treasury obligations for which accurate market quotations are readily available are valued on the basis of quotations furnished by a pricing service or provided by dealers in such securities. The pricing services may use valuation models or matrix pricing, which considers yield or price with respect to comparable bonds, quotations from bond dealers or by reference to other securities that are considered comparable in such characteristics as rating, interest rate and maturity date, to determine current value. Short-term debt obligations maturing in sixty days or less are valued at amortized cost, which approximates market value. Portfolio securities for which accurate market quotations are not readily available due to, among other factors, current market trading activity, credit quality and default rates, are valued based on yield equivalents, pricing matrices or other sources, under valuation procedures established by the Board of Trustees of the Trust (the “Board”).
The Portfolios are subject to fair value accounting standards that define fair value, establish the framework for measuring fair value and provide a three-level hierarchy for fair valuation based upon the inputs to the valuation as of the measurement date. The three levels of the fair value hierarchy are as follows:
| Level 1 – | quoted prices in active markets for identical | |
| securities | ||
| Level 2 – | significant observable inputs (including | |
| quoted prices for similar securities, interest | ||
| rates, prepayment speeds, credit risk, etc.) | ||
| Level 3 – | significant unobservable inputs (including the | |
| Portfolio’s own assumptions in determining | ||
| the fair value of investments) |
At the end of each calendar quarter, management evaluates the Level 2 and Level 3 assets and liabilities, if any, for changes in liquidity, including but not limited to: whether a broker is willing to execute at the quoted price, the depth and consistency of prices from third party services, and the existence of contemporaneous, observable trades in the market. Additionally, management evaluates Level 1 and Level 2 assets and liabilities, if any, on a quarterly basis for changes in listings or delistings on national exchanges. Due to the inherent uncertainty of determining the fair value of investments that do not have a readily available market value, the fair value of the Portfolios’ investments may fluctuate from period to period. Additionally, the fair value of investments may differ significantly from the values that would have been used had a ready market existed for such investments and may differ materially from the values the Portfolios may ultimately realize. Further, such investments may be subject to legal and other restrictions on resale or otherwise less liquid than publicly traded securities.
The inputs or methodology used for valuing securities are not necessarily an indication of the risk associated with investing in those securities.
28
TRUST FOR CREDIT UNIONS
Notes to Financial Statements
Year Ended August 31, 2022 (continued)
The summary of inputs used to value each Portfolio’s net assets as of August 31, 2022 is as follows:
| Ultra-Short Duration Portfolio | ||||||||||||||||
| Total | Level 2 | Level 3 | ||||||||||||||
| Market | Level 1 | Significant | Significant | |||||||||||||
| Value at | Quoted | Observable | Unobservable | |||||||||||||
| 8/31/2022 | Price | Inputs | Inputs | |||||||||||||
| Assets: | ||||||||||||||||
| Asset-Backed | ||||||||||||||||
| Securities | $ | 325,221 | $ | — | $ | 325,221 | $ | — | ||||||||
| Collateralized | ||||||||||||||||
| Mortgage | ||||||||||||||||
| Obligations | 361,358,533 | — | 361,358,533 | — | ||||||||||||
| Mortgage- | ||||||||||||||||
| Backed | ||||||||||||||||
| Obligations | 128,512,537 | — | 128,512,537 | — | ||||||||||||
| Agency | ||||||||||||||||
| Debentures | 1,250,000 | — | — | 1,250,000 | ||||||||||||
| U.S. Government- | ||||||||||||||||
| Backed | ||||||||||||||||
| Obligations | 59,385,048 | — | 59,385,048 | — | ||||||||||||
| Repurchase | ||||||||||||||||
| Agreement | 20,750,000 | — | 20,750,000 | — | ||||||||||||
| $ | 571,581,339 | $ | — | $ | 570,331,339 | $ | 1,250,000 | |||||||||
| Short Duration Portfolio | ||||||||||||||||
| Total | Level 2 | Level 3 | ||||||||||||||
| Market | Level 1 | Significant | Significant | |||||||||||||
| Value at | Quoted | Observable | Unobservable | |||||||||||||
| 8/31/2022 | Price | Inputs | Inputs | |||||||||||||
| Assets: | ||||||||||||||||
| Bank Notes | $ | 35,232,540 | $ | — | $ | 35,232,540 | $ | — | ||||||||
| Collateralized | ||||||||||||||||
| Mortgage | ||||||||||||||||
| Obligations | 99,405,563 | — | 99,405,563 | — | ||||||||||||
| Mortgage- | ||||||||||||||||
| Backed | ||||||||||||||||
| Obligations | 129,274,298 | — | 129,274,298 | — | ||||||||||||
| Municipal | ||||||||||||||||
| Bonds | 6,078,090 | — | 6,078,090 | — | ||||||||||||
| U.S. Government- | ||||||||||||||||
| Backed | ||||||||||||||||
| Obligations | 158,676,491 | — | 158,676,491 | — | ||||||||||||
| Repurchase | ||||||||||||||||
| Agreements | 68,000,000 | — | 68,000,000 | — | ||||||||||||
| Registered | ||||||||||||||||
| Investment | ||||||||||||||||
| Company | 399,879 | 399,879 | — | — | ||||||||||||
| $ | 497,066,861 | $ | 399,879 | $ | 496,666,982 | $ | — | |||||||||
The following is a reconciliation of Level 3 holdings for which significant unobservable inputs were used in determining fair value as of August 31, 2022:
| Ultra-Short | ||||
| Duration Portfolio | ||||
| Fair Value, as of | ||||
| August 31, 2021 | $ | 1,750,000 | ||
| Gross sales | (500,000 | ) | ||
| Fair Value, as of | ||||
| August 31, 2022 | $ | 1,250,000 | ||
Factors considered in determining the fair value of investments designated as Level 3 include anticipated cash flows and credit characteristics.
B. Security Transactions and Investment Income
Security transactions are reflected for financial reporting purposes as of the trade date. Realized gains and losses on sales of portfolio securities are calculated using the identified cost basis. Interest income is recorded on the basis of interest accrued, premium amortized and discount accreted.
All paydown gains and losses are classified as interest income in the accompanying Statements of Operations in accordance with U.S. GAAP. Market discounts, original issue discounts and market premiums on debt securities are accreted/amortized to interest income over the life of the security with a corresponding increase/decrease in the cost basis of that security using the yield to maturity method, or where applicable, the first call date of the security.
C. Distribution to Shareholders
Each Portfolio intends to distribute to its shareholders substantially all of its investment income and capital gains. The Portfolios declare dividends from net investment income daily and pay such dividends monthly. Each Portfolio makes distributions of net realized capital gains, if any, at least annually. Income distributions and capital gain distributions are determined in accordance with income tax regulations.
D. Allocations
Net investment income earned, other than class-specific expenses, realized capital gains and losses, and unrealized appreciation and depreciation for a Portfolio are allocated daily to each class of shares based upon the relative net asset value of settled shares of each class at the beginning of the day (after adjusting for the current day’s settled capital share activity of the respective class). Class-specific expenses are charged directly to the class incurring the expense. Expenses not directly charged to a Portfolio are allocated proportionally among all the Portfolios in the Trust, daily in relation to the net assets of each Portfolio or another reasonable measure.
E. Estimates
The preparation of financial statements in conformity with U.S. GAAP requires management to make estimates and assumptions that affect the reported amounts of assets and liabilities and disclosure of contingent assets and liabilities at the date of the financial statements and the reported amounts of income and expenses during the reported period. Actual results could differ from those estimates.
29
TRUST FOR CREDIT UNIONS
Notes to Financial Statements
Year Ended August 31, 2022 (continued)
F. LIBOR Transition
The Portfolios invest in financial instruments with payment obligations, financing terms, hedging strategies or investment values based on floating rates, such as London Interbank Offered Rate (“LIBOR”). LIBOR is the offered rate for short-term Eurodollar deposits between major international banks.
ICE Benchmark Administration, the administrator of LIBOR, ceased publication of most LIBOR settings on a representative basis at the end of 2021 and is expected to cease publication of a majority of U.S. dollar LIBOR settings on a representative basis after June 30, 2023. In addition, global regulators have announced that, with limited exceptions, no new LIBOR-based contracts should be entered into after 2021. The transition away from LIBOR poses a number of other risks, including changed values of LIBOR-related investments, which may adversely affect the Portfolios’ performance.
G. Federal Taxes
It is each Portfolio’s policy to comply with the requirements of the Internal Revenue Code of 1986, as amended, (the “Code”) applicable to regulated investment companies and to distribute each year substantially all of its investment company taxable income and capital gains to its shareholders. Accordingly, no federal tax provisions are required. Income distributions to shareholders are recorded on the ex-dividend date, declared daily and paid monthly by the Portfolios. Net capital losses are carried forward to future years and may be used to the extent allowed by the Code to offset any future capital gains. Utilization of capital loss carryforwards may reduce the requirement of future capital gain distributions.
The characterization of distributions to shareholders is determined in accordance with U.S. federal income tax rules, which may differ from U.S. GAAP. Therefore, the source of each Portfolio’s distributions may be shown in the accompanying financial statements as either from net investment income, net realized gains or as a tax return of capital.
Generally, paydown gains and losses are recorded as increases (paydown gains) or decreases (paydown losses) against capital gains for tax purposes. The Portfolios have elected to accrete and amortize market discounts and premiums on portfolio securities for tax purposes based on the securities’ yield to maturity. For the current year, net amortization is reducing ordinary income available for distribution.
Management has analyzed the Portfolios’ tax positions taken on federal income tax returns for all open tax years (current and prior three tax years), and has concluded that no provision for federal income tax is required in the Portfolios’ financial statements. The Portfolios’ federal and state income and federal excise tax returns for tax years for which the applicable statutes of limitations have not expired are subject to examination by the Internal Revenue Service and state departments of revenue.
The aggregate cost of investments and the composition of unrealized appreciation and depreciation on investments for Federal income tax purposes as of August 31, 2022, were as follows:
| Ultra-Short | Short | |||||||
| Duration | Duration | |||||||
| Portfolio | Portfolio | |||||||
| Total Cost of Investments | ||||||||
| on Tax Basis | $ | 582,630,399 | $ | 519,283,373 | ||||
| Gross Unrealized | ||||||||
| Appreciation on | ||||||||
| Investments | $ | 90,472 | $ | 660,081 | ||||
| Gross Unrealized | ||||||||
| Depreciation on | ||||||||
| Investments | (11,139,532 | ) | (22,876,593 | ) | ||||
| Net Unrealized | ||||||||
| Appreciation (Depreciation) | ||||||||
| on Investments | $ | (11,049,060 | ) | $ | (22,216,512 | ) | ||
H. Expenses
Expenses incurred by the Portfolios that do not specifically relate to an individual Portfolio are generally allocated to the Portfolios based on each Portfolio’s relative average net assets for the period or in such other manner as the Board deems fair or equitable depending upon the nature of the expenses. In addition, expenses incurred by a Portfolio that do not specifically relate to a particular class of shares of the Portfolio are generally allocated to the appropriate classes based on each class’ relative average net assets or in such other manner as the Board deems fair and equitable. Expenses that specifically relate to a particular class of shares of a Portfolio are allocated to that class.
The Portfolios pay compensation to the independent Trustees of the Trust in the form of a retainer, attendance fees, and additional compensation to Board and Committee chairpersons. The Portfolios do not pay compensation to Trustees or officers of the Trust who are also officers of the Trust’s investment adviser or administrator.
I. Repurchase Agreements and Reverse Repurchase Agreements
Repurchase agreements involve the purchase of securities subject to the seller’s agreement to repurchase the securities at a mutually agreed upon date and price. During the term of a repurchase agreement, the value of the underlying securities held as collateral on behalf of the Portfolios, including accrued interest, is required to exceed the value of the repurchase agreement, including accrued
30
TRUST FOR CREDIT UNIONS
Notes to Financial Statements
Year Ended August 31, 2022 (continued)
interest. If the seller defaults or becomes insolvent, realization of the collateral by the Portfolios may be delayed or limited and there may be a decline in the value of the collateral during the period while the Portfolios seek to assert their rights. The underlying securities for all repurchase agreements are held in safekeeping at the Portfolios’ regular custodian or at a custodian specifically designated for purposes of the repurchase agreement under triparty repurchase agreements.
A repurchase agreement may permit a Portfolio, under certain circumstances, including an event of default (such as bankruptcy or insolvency), to offset payables and/or receivables under the repurchase agreement with collateral held and/or posted to the counterparty and create one single net payment due to or from the Portfolio. However, bankruptcy or insolvency laws of a particular jurisdiction may impose restrictions on or prohibitions against such a right of offset in the event of the repurchase agreement counterparty’s bankruptcy or insolvency. Pursuant to the terms of the repurchase agreement, a Portfolio receives or posts securities as collateral with a market value in excess of the repurchase price to be paid or received by the Portfolio upon the maturity of the transaction. Upon a bankruptcy or insolvency of the repurchase agreement counterparty, the Portfolio would recognize a liability with respect to such excess collateral to reflect the Portfolio’s obligation under bankruptcy law to return the excess to the counterparty.
Master Repurchase Agreements (“MRAs”) permit the Portfolio, under certain circumstances, including an event of default (such as bankruptcy or insolvency), to offset payables and/or receivables under the MRA with collateral held and/or posted to the counterparty and create one single net payment due to or from the Portfolio. However, bankruptcy or insolvency laws of a particular jurisdiction may impose restrictions on or prohibitions against such a right of offset in the event of the MRA counterparty’s bankruptcy or insolvency. Pursuant to the terms of the MRA, the Portfolio receives or posts securities as collateral with a market value in excess of the repurchase price to be paid or received by the Portfolio upon the maturity of the transaction. Upon a bankruptcy or insolvency of the MRA counterparty, the Portfolio would recognize a liability with respect to such excess collateral to reflect the Portfolio’s obligation under bankruptcy law to return the excess to the counterparty.
The Portfolios had investments in repurchase agreements at August 31, 2022. The gross value and related collateral received for these investments are presented in each Portfolio of Investments and the value of these investments is also presented in the Statements of Assets and Liabilities. The value of the related collateral held by each Portfolio exceeded the value of its respective repurchase agreements as of August 31, 2022.
The Portfolios may also engage in reverse repurchase transactions in which a Portfolio sells its securities and simultaneously agrees to repurchase the securities at a specified time and price. Reverse repurchase transactions are considered to be borrowings by a Portfolio. The Portfolios did not engage in reverse repurchase transactions during the year ended August 31, 2022.
J. When-Issued Securities
Consistent with National Credit Union Administration (“NCUA”) rules and regulations, the Portfolios may purchase or sell when-issued securities, including TBA (“To Be Announced”) securities that have been authorized but not yet issued in the market. The value of a when-issued security sale is recorded as an asset and a liability on the Portfolios’ records with the difference between its market value and expected cash proceeds recorded as an unrealized gain or loss. Gains or losses are realized upon delivery of the security sold. Losses may arise due to changes in the market value of the security or from the inability of counterparties to meet the terms of the transaction. All settlements in connection with purchases and sales of when-issued securities must be by regular way (i.e., the normal security settlement time, which may vary according to security type). Effective August 19, 2022, certain when-issued securities held by the Portfolios will be subject to the SEC’s regulations governing the use of derivatives by registered investment companies (“Rule 18f-4”). Rule 18f-4 imposes limits on the amount of derivatives a fund can enter into, eliminates the asset segregation framework previously used by funds to comply with Section 18 of the 1940 Act, and requires funds whose use of derivatives is greater than a limited specified amount to establish and maintain a comprehensive derivatives risk management program and appoint a derivatives risk manager.
K. Mortgage Dollar Rolls
The Portfolios may enter into mortgage ‘‘dollar rolls’’ in which the Portfolios sell securities in the current month for delivery and simultaneously contract with the same counterparty to repurchase similar (same type, coupon and maturity) but not identical securities on a specified future date. For financial reporting and tax reporting purposes, the Portfolios treat mortgage dollar rolls as two separate transactions; one involving the purchase of a security and a separate transaction involving a sale. During the settlement period between the sale and repurchase, the Portfolios will not be entitled to accrue interest and/or receive principal payments on the securities sold. Dollar roll transactions involve the risk that the market value of
31
TRUST FOR CREDIT UNIONS
Notes to Financial Statements
Year Ended August 31, 2022 (continued)
the securities sold by the Portfolios may decline below the repurchase price of those securities. In the event the buyer of the securities under a dollar roll transaction files for bankruptcy or becomes insolvent, the Portfolios’ use of proceeds of the transaction may be restricted pending a determination by, or with respect to, the other party.
Note 3. Agreements and 12b-1 Plan
A. Advisory Agreement
ALM First Financial Advisors, LLC (“ALM First” or the “Adviser”) serves as investment adviser pursuant to an amended and restated advisory agreement (the “Advisory Agreement”) that was approved by the Board and shareholders of each Portfolio and took effect on January 31, 2021. Under the Advisory Agreement, ALM First manages the Portfolios, subject to the general supervision of the Board.
As compensation for its services and its assumption of certain expenses, the Adviser is entitled to the following fees, computed daily and payable monthly, at the annual rates listed below (as a percentage of each Portfolio’s average daily net assets):
Portfolio(s) | Contractual Rate* |
| Ultra-Short | 0.14% on the first $250 million; |
| Duration | 0.12% between $250 million and $500 million; |
| 0.08% between $500 million and $1 billion; | |
| 0.06% assets above $1 billion | |
| Short | 0.14% on the first $250 million; |
| Duration | 0.12% between $250 million and $500 million; |
| 0.08% between $500 million and $1 billion; | |
| 0.06% assets above $1 billion |
| * | Contractual rate effective January 31, 2021 is based on the average daily net assets of each Portfolio. |
B. Administration Agreement
Callahan Credit Union Financial Services Limited Liability Limited Partnership (“CUFSLP”) serves as the Portfolios’ administrator pursuant to an Administration Agreement. Callahan Financial Services, Inc. (“CFS”) serves as a general partner to CUFSLP, which includes 37 major credit unions that are limited partners. As compensation for services rendered pursuant to such Agreement, CUFSLP is entitled to fees, computed daily and payable by the Portfolios monthly, at the following annual rates as a percentage of each respective Portfolio’s average daily net assets:
Portfolio | CUFSLP Fee |
| Ultra-Short Duration | 0.05% |
| Short Duration | 0.05% |
U.S. Bancorp Fund Services, LLC, doing business as U.S. Bank Global Fund Services (“Fund Services”), an indirect wholly-owned subsidiary of U.S. Bancorp, provides additional administrative services to the Portfolios pursuant to a Fund Administration Servicing Agreement dated June 7, 2018 and is entitled to the following fees, computed daily and payable by the Portfolios monthly, at the following annual rates as a percentage of the aggregate average net assets.
Asset Level | Contractual Rate(1) |
| up to $300 million | 0.030% |
| from $300 to $600 million | 0.025 |
| in excess of $600 million | 0.020 |
________
| (1) | The complex is subject to an aggregate minimum annual base fee of $150,000. |
C. Other Agreements
CFS serves as exclusive distributor of shares of the Portfolios. CFS did not receive any compensation under the Distribution Agreement during the year ended August 31, 2022.
Fund Services also serves as the fund accountant and transfer agent to the Portfolios. U.S. Bank, N.A. (“U.S. Bank”), an affiliate of Fund Services, serves as the Portfolios’ custodian.
From April 11, 2011 through April 2, 2020, the Board of Trustees of the Trust voluntarily agreed to waive 15% of its fees.
From April 11, 2011 through April 2, 2020, Nisen & Elliott, LLC, counsel to the independent Trustees of the Trust, voluntarily agreed to waive 15% of its legal fees.
From April 11, 2011 through April 2, 2020, Vigilant Compliance Services voluntarily agreed to waive its fee in an amount equal to 10% of such fee.
The Trust has adopted a Distribution Plan (the “12b-1 Plan”) with respect to Investor Shares of the Portfolios. Under the 12b-1 Plan, the Trust may pay the distributor (or any other person) an amount of up to 0.25% annually of the average daily net assets attributable to Investor Shares of each Portfolio in consideration for expenses and activities primarily intended to result in the sale of Investor Shares and/or for administrative support services. The Trust is currently limiting the fee payable under the 12b-1 Plan with respect to Investor Shares of each Portfolio to 0.03% of the average daily net assets attributable to Investor Shares of each such Portfolio. For the year ended August 31, 2022, the Ultra-Short Duration Portfolio and Short Duration Portfolio incurred fees under the 12b-1 Plan of $315,398 and $108,193, respectively.
32
TRUST FOR CREDIT UNIONS
Notes to Financial Statements
Year Ended August 31, 2022 (continued)
Note 4. Investment Transactions
The cost of purchases and proceeds from sales and maturities of long-term securities for the year ended August 31, 2022 were as follows:
| Ultra-Short | Short | |||||||
| Duration | Duration | |||||||
| Portfolio | Portfolio | |||||||
| Purchases of U.S. | ||||||||
| Government and | ||||||||
| agency obligations | $ | 51,373,347 | $ | 2,501,960,435 | ||||
| Purchases (excluding | ||||||||
| U.S. Government and | ||||||||
| agency obligations) | 0 | 94,430,802 | ||||||
| Sales or maturities of | ||||||||
| U.S. Government and | ||||||||
| agency obligations | 1,799,830,506 | 3,392,630,245 | ||||||
| Sales or maturities | ||||||||
| (excluding U.S. | ||||||||
| Government and | ||||||||
| agency obligations) | 60,271,349 | 135,989,220 | ||||||
Note 5. Bank Borrowings
On March 24, 2022, each of the Portfolios entered into an uncommitted line of credit (the “Credit Facility”) with U.S. Bank. The Credit Facility provides for a $500,000,000 uncommitted, secured 364-day umbrella line of credit for the Ultra Short Duration Portfolio and the Short Duration Portfolio. The annual interest rate charged on borrowings under the Credit Facility equals (i) the prime rate charged by U.S. Bank, less (ii) 0.50%.
During the year ended August 31, 2022, the Ultra-Short Duration Portfolio had borrowings under the Credit Facility on 14 days, with an average borrowing and interest rate on those days of $42,346,571 and 4.46%, respectively. Interest expense of $76,151 incurred during the year is included on the Statement of Operations. The balance as of July 29, 2022 of $102,657,000 was the maximum amount of borrowings outstanding during the year ended August 31, 2022.
During the year ended August 31, 2022, the Short Duration Portfolio had borrowings under the Credit Facility on 16 days, with an average borrowing and interest rate on those days of $20,752,187 and 3.83%, respectively. Interest expense of $37,995 incurred during the year is included on the Statement of Operations. The balance as of July 22, 2022 of $44,347,000 was the maximum amount of borrowings outstanding during the year ended August 31, 2022.
Note 6. Tax Information
The tax character of distributions paid for the fiscal year ended August 31, 2022 was as follows:
| Ultra-Short | Short | |||||||
| Duration | Duration | |||||||
| Portfolio | Portfolio | |||||||
| Distributions paid from: | ||||||||
| Ordinary income | $ | 6,122,501 | $ | 7,324,813 | ||||
| Long Term Capital Gains | — | — | ||||||
| Total taxable distributions | $ | 6,122,501 | $ | 7,324,813 | ||||
The tax character of distributions paid for the fiscal year ended August 31, 2021 was as follows:
| Ultra-Short | Short | |||||||
| Duration | Duration | |||||||
| Portfolio | Portfolio | |||||||
| Distributions paid from: | ||||||||
| Ordinary income | $ | 7,904,152 | $ | 7,651,554 | ||||
| Long Term Capital Gains | — | — | ||||||
| Total taxable distributions | $ | 7,904,152 | $ | 7,651,554 | ||||
As of August 31, 2022, the components of accumulated earnings (losses) on a tax basis were as follows:
| Ultra-Short | Short | |||||||
| Duration | Duration | |||||||
| Portfolio | Portfolio | |||||||
| Undistributed ordinary | ||||||||
| income—net | $ | 1,244,003 | $ | 787,210 | ||||
| Total undistributed | ||||||||
| earnings | $ | 1,244,003 | $ | 787,210 | ||||
| Capital loss | ||||||||
carryforward(1) | (27,841,666 | ) | (39,532,025 | ) | ||||
| Timing differences | ||||||||
| (dividends payable) | (637,221 | ) | (440,352 | ) | ||||
| Unrealized | ||||||||
| gains/(losses)—net | (11,049,060 | ) | (22,216,512 | ) | ||||
| Total accumulated | ||||||||
| gains/(losses)—net | $ | (38,283,944 | ) | $ | (61,401,679 | ) | ||
________
| (1) | The amount for each capital loss carryforward is indicated below. |
On December 22, 2010, the Regulated Investment Company Modernization Act of 2010 was enacted to modernize several of the federal income and excise tax provisions related to regulated investment companies. Under pre-enactment law, capital losses could be carried forward for eight years following the loss, and such carryforward is treated as a short-term capital loss in each of those years, irrespective of the character of the original loss. Net capital losses (earned in taxable years beginning
33
TRUST FOR CREDIT UNIONS
Notes to Financial Statements
Year Ended August 31, 2022 (continued)
after December 22, 2010) (“post–2010 losses”) may be carried forward indefinitely and must retain the character of the original loss.
| Ultra-Short | Short | |||||||
| Duration | Duration | |||||||
| Portfolio | Portfolio | |||||||
| No Expiration – | ||||||||
| Long Term | $ | 17,176,774 | $ | 8,318,557 | ||||
| No Expiration – | ||||||||
| Short Term | 10,664,892 | 31,213,468 | ||||||
Net capital and foreign currency losses incurred after October 31 and certain ordinary losses incurred after December 31 may be deferred and treated as occurring on the first day of the following fiscal year. For the fiscal year ended August 31, 2022, the Portfolios did not defer any late year losses.
The difference between book-basis and tax-basis unrealized gains (losses) is attributable primarily to accretion of market discounts, amortization of market premiums, and wash sale deferrals.
In order to present certain components of the Portfolios’ capital accounts on a tax basis, certain reclassifications have been recorded to the Portfolios’ accounts. These reclassifications have no impact on the net asset value of the Portfolios. Reclassifications result primarily from the difference in the tax treatment of paydown gains and losses, distribution redesignations, market discounts and market premiums and expiration of capital loss carryforwards. There were no reclassifications during the year ended August 31, 2022.
Note 7. Credit and Concentration Risk
The Portfolios’ investments are subject to credit risk, the risk that issuers and/or counterparties will fail to make payments when due or default completely. If an issuer’s or a counterparty’s financial condition worsens, the credit quality of the issuer or counterparty may deteriorate. Credit spreads may increase, which may reduce the market values of a Portfolio’s securities. Credit spread risk is the risk that economic and market conditions or any actual or perceived credit deterioration may lead to an increase in the credit spreads (i.e., the difference in yield between two securities of similar maturity but different credit quality) and a decline in price of the issuer’s securities.
The Portfolios may invest a portion of their assets in securities of issuers that hold mortgage securities, including residential mortgages. The value of these securities is sensitive to changes in economic conditions, including delinquencies and/or defaults, and may be adversely affected by shifts in the market’s perception of the issuers and changes in the interest rates.
The Portfolios may also invest in CMOs. These multiple class securities may be mortgage-related securities issued by the U.S. Government, its agencies, instrumentalities or sponsored enterprises, including the Federal National Mortgage Association and Federal Home Loan Mortgage Corp. In general, CMOs represent direct ownership interests in a pool of residential mortgage loans or mortgage pass-through securities (the “Mortgage Assets”), the payments on which are used to make payments on the CMOs. Investors may purchase beneficial interests in CMOs, which are known as “regular” interests or “residual” interests. The Portfolios may not purchase residual interests, but may purchase other types of interests. Each class of a CMO, often referred to as a “tranche,” is issued at a specific adjustable or fixed interest rate and must be fully retired no later than its final distribution date. Principal prepayments on the Mortgage Assets underlying a CMO may cause some or all of the classes of the CMO to be retired substantially earlier than its final distribution date. The principal of and interest on the Mortgage Assets may be allocated among several classes of a CMO in various ways.
Note 8. Regulatory Updates
Rule 18f-4 under the 1940 Act, which went into effect on August 19, 2022, governs the use of derivatives by registered investment companies. Rule 18f-4 imposes limits on the amount of derivatives a fund can enter into, eliminates the asset segregation framework previously used by funds to comply with Section 18 of the 1940 Act, and requires funds whose use of derivatives is greater than a limited specified amount to establish and maintain a comprehensive derivatives risk management program and appoint a derivatives risk manager. The Portfolios are required to comply with Rule 18f-4 and have adopted procedures for investing in derivatives and other transactions (including when-issued securities) in compliance with Rule 18f-4. Rule 18f-4 may require the Portfolios to observe more stringent requirements than were previously imposed by the 1940 Act, which could adversely affect the ability of the Portfolios to engage in certain derivatives and related transactions and/or increase the costs of such derivatives and related transactions, which could adversely affect the Portfolios’ performance and increase the costs related to the Portfolios’ use of derivatives and related instruments.
In December 2020, the SEC adopted a new rule providing a framework for fund valuation practices (“Rule 2a-5”). Rule 2a-5 establishes requirements for
34
TRUST FOR CREDIT UNIONS
Notes to Financial Statements
Year Ended August 31, 2022 (continued)
determining fair value in good faith for purposes of the 1940 Act. Rule 2a-5 will permit fund boards to designate certain parties to perform fair value determinations, subject to board oversight and certain other conditions. Rule 2a-5 also defines when market quotations are “readily available” for purposes of the 1940 Act and the threshold for determining whether a fund must fair value a security. In connection with Rule 2a-5, the SEC also adopted related recordkeeping requirements and is rescinding previously issued guidance, including with respect to the role of a board in determining fair value and the accounting and auditing of fund investments. Effective September 8, 2022, the Portfolios adopted valuation procedures consistent with Rule 2a-5.
Note 9. Subsequent Events
Management has evaluated the impact of all subsequent events on the Portfolios through the date the financial statements were issued and has determined that, aside from the foregoing, there were no subsequent events requiring recognition or disclosure in the financials statements.
35
Report of Independent Public Accounting Firm
To the Shareholders and the Board of Trustees
Trust for Credit Union
Opinion on the Financial Statements
We have audited the accompanying statements of assets and liabilities of the Trust for Credit Unions (the “Trust”), comprising respectively, the Ultra-Short Duration Portfolio and the Short Duration Portfolio (the “Portfolios”), including the portfolios of investments, as of August 31, 2022, the related statements of operations for the year then ended, the statements of changes in net assets for each of the two years in the period then ended, and the financial highlights for each of the five years in the period then ended, and the related notes (collectively referred to as the “financial statements”). In our opinion, the financial statements present fairly, in all material respects, the financial position of the Portfolios as of August 31, 2022, the results of their operations for the year then ended, the changes in their net assets for each of the two years in the period then ended, and the financial highlights for each of the five years in the period then ended, in conformity with accounting principles generally accepted in the United States of America.
Basis for Opinion
These financial statements are the responsibility of the Funds’ management. Our responsibility is to express an opinion on the Funds’ financial statements based on our audits. We are a public accounting firm registered with the Public Company Accounting Oversight Board (United States) (“PCAOB”) and are required to be independent with respect to the Funds in accordance with the U.S. federal securities laws and the applicable rules and regulations of the Securities and Exchange Commission and the PCAOB. We have served as the auditor of one or more of the funds in the Trust since 2011.
We conducted our audits in accordance with the standards of the PCAOB. Those standards require that we plan and perform the audits to obtain reasonable assurance about whether the financial statements are free of material misstatement, whether due to error or fraud. The Funds are not required to have, nor were we engaged to perform, an audit of their internal control over financial reporting. As part of our audits we are required to obtain an understanding of internal control over financial reporting, but not for the purpose of expressing an opinion on the effectiveness of the Funds’ internal control over financial reporting. Accordingly, we express no such opinion.
Our audits included performing procedures to assess the risks of material misstatement of the financial statements, whether due to error or fraud, and performing procedures that respond to those risks. Such procedures included examining, on a test basis, evidence regarding the amounts and disclosures in the financial statements. Our audits also included evaluating the accounting principles used and significant estimates made by management, as well as evaluating the overall presentation of the financial statements. Our procedures included confirmation of securities owned as of August 31, 2022 by correspondence with the custodian and brokers or by other appropriate auditing procedures where replies from brokers were not received. We believe that our audits provide a reasonable basis for our opinion.
| TAIT, WELLER & BAKER LLP |
Philadelphia, Pennsylvania
October 28, 2022
36
TRUST FOR CREDIT UNIONS
Additional Information (Unaudited)
Tax Information
For the fiscal year ended August 31, 2022, the Portfolios had no long-term capital gain distributions.
Expenses – Six Months Ended August 31, 2022
As a shareholder of the Portfolios, you incur ongoing costs, including management fees, administration fees and other Portfolio expenses. This example is intended to help you understand your ongoing costs (in dollars) of investing in the Portfolios and to compare these costs with the ongoing costs of investing in other mutual funds.
The example is based on an investment of $1,000 invested at the beginning of the period and held for the entire period from March 1, 2022 through August 31, 2022.
Actual Expenses – The first line of the table below provides information about actual account values and actual expenses. You may use the information in this line, together with the amount you invested, to estimate the expenses that you paid over the period. Simply divide your account value by $1,000 (for example, an $8,600 account value divided by $1,000 = 8.6), then multiply the result by the number in the first line under the heading entitled “Expenses Paid” to estimate the expenses you paid on your account for this period.
Hypothetical Example for Comparison Purposes – The second line of the table below provides information about hypothetical account values and hypothetical expenses based on the Portfolios’ actual expense ratios and an assumed rate of return of 5% per year before expenses, which is not the actual return. The hypothetical account values and expenses may not be used to estimate the actual ending account balance or expenses you paid for the period. You may use this information to compare the ongoing costs of investing in the Portfolios and other funds. To do so, compare these 5% hypothetical examples with the 5% hypothetical examples that appear in the shareholder reports of the other funds.
Please note that the expenses shown in the table are meant to highlight your ongoing costs only. As a shareholder of the Portfolios, you do not incur any transaction costs, such as sales charges (loads), redemption fees or exchange fees, but shareholders of other funds may incur such costs. The second line of the table is useful in comparing ongoing costs only, and will not help you determine the relative total costs of owning different funds whose shareholder may incur transaction costs.
| Ultra-Short | Short Duration | |||||||||||||||||||||||
| Duration Portfolio | Portfolio | |||||||||||||||||||||||
| Expenses | Expenses | |||||||||||||||||||||||
| Beginning | Ending | Paid for the | Beginning | Ending | Paid for the | |||||||||||||||||||
| Account | Account | 6 months | Account | Account | 6 months | |||||||||||||||||||
| Value | Value | ended | Value | Value | ended | |||||||||||||||||||
| 3/1/22 | 8/31/22 | 8/31/22* | 3/1/22 | 8/31/22 | 8/31/22* | |||||||||||||||||||
| TCU Shares | ||||||||||||||||||||||||
| Actual | $ | 1,000.00 | $ | 982.70 | $ | 1.25 | $ | 1,000.00 | $ | 964.20 | $ | 1.29 | ||||||||||||
| Hypothetical 5% Return | 1,000.00 | 1,023.95 | + | 1.28 | 1,000.00 | 1,023.89 | + | 1.33 | ||||||||||||||||
| Investor Shares | ||||||||||||||||||||||||
| Actual | 1,000.00 | 982.60 | 1.25 | 1,000.00 | 965.10 | 1.44 | ||||||||||||||||||
| Hypothetical 5% Return | 1,000.00 | 1,023.95 | + | 1.28 | 1,000.00 | 1,023.74 | + | 1.48 | ||||||||||||||||
______________
| * | Expenses are equal to the Fund’s annualized expense ratio, multiplied by the average account value over the period, multiplied by 184/365 (to reflect one-half year period). The annualized net expense ratios for the period were 0.25% and 0.26% for the Ultra-Short Duration Portfolio and Short Duration Portfolio’s TCU Shares, respectively, and 0.25% and 0.29% for the Ultra-Short Duration Portfolio and Short Duration Portfolio’s Investor Shares, respectively. |
| + | Hypothetical expenses are based on the Portfolios’ actual annualized expense ratios and an assumed rate of return of 5% per year before expenses. |
37
TRUST FOR CREDIT UNIONS
| Additional Information (Unaudited) | August 31, 2022 |
Trustees and Officers (unaudited)1
| Number of | |||||
| Portfolios | |||||
| Term of | in Fund | Other | |||
| Office and | Complex | Directorships | |||
| Position(s) Held | Length of | Principal Occupation(s) | Overseen by | Held by | |
Name, Age and Address2 | with Trust | Time Served3 | During Past 5 Years | Trustee4 | Trustee5 |
| Independent Trustees | |||||
| Lisa Ginter | Trustee | Since | Chief Executive Officer (since 2015), | 3 | None |
| Age: 58 | August 2021 | Community America Credit Union. | |||
| Stanley C. Hollen | Trustee | Since | Chief Executive Officer, Co-Op | 3 | None |
| Age: 73 | 2007 | Financial Services (credit | |||
| union-owned payments CUSO) | |||||
| (2005-2016); President and Chief | |||||
| Executive Officer, Liberty Enterprises | |||||
| (credit union-focused check printer, | |||||
| payments provider) (2003-2005); | |||||
| President and Chief Executive | |||||
| Officer, Golden 1 Credit | |||||
| Union (1984-2002). | |||||
| J. Mark McWatters | Trustee | Since | Self-Employed Attorney; Board member | 3 | None |
| Age: 67 | July 2021 | (2014-2020) and Chair (2017-2019) of | |||
| the National Credit Union Administration. | |||||
| Erin Mendez | Vice Chair | Since | President and Chief Executive Officer, | 3 | None |
| Age: 63 | and | July 2020 | Patelco Credit Union (since 2013). | ||
| Trustee | and 2019 | ||||
| James F. Regan | Trustee | Since | President and Chief Executive Officer | 3 | None |
| Age: 56 | 2013 | (2009-2022) and Vice President and | |||
| Chief Financial Officer (1996-2008), | |||||
| Digital Federal Credit Union. | |||||
| Wendell A. Sebastian | Trustee | Since | Executive Director, National Credit | 3 | None |
| Age: 78 | 1989 | Union Foundation (2010-2013); | |||
| President and Chief Executive Officer, | |||||
| GTE Federal Credit Union | |||||
| (1998-2009). | |||||
| Michael D. Steinberger | Trustee | Since | Associate Professor of Economics | 3 | None |
| Age: 45 | 2015 | (since 2011), Assistant Professor | |||
| of Economics (2004-2011) Pomona | |||||
| College; Dean (2011-Present), | |||||
| Associate Dean (2006-2011) and | |||||
| Chief Academic Officer (2016-Present), | |||||
| Western CUNA Management School. | |||||
Interested Trustees6 | |||||
| Julie A. Renderos | Chair | Since | Executive Vice President/Chief | 3 | None |
| Age: 46 | and | July 2020 | Financial Officer (since 2012), | ||
| Trustee | and 2015 | Senior Vice President/Finance | |||
| (2007-2012), Suncoast Credit Union. |
1 | The Statement of Additional Information includes additional information about the Trustees and is available, without charge, upon request by calling Trust for Credit Unions at (800) DIAL TCU (800-342-5828) or Callahan Financial Services, Inc. at (800) 237-5678. |
2 | Each Trustee may be contacted by writing to the Trustee, c/o Callahan Credit Union Financial Services LLLP, 1001 Connecticut Avenue, NW, Suite 1001, Washington, D.C. 20036-5504. |
3 | Except in the event of resignation or removal, each Trustee holds office until the next meeting of shareholders called for the purpose of electing Trustees, and until the election and qualification of his successor. |
4 | The Fund Complex includes all registered investment companies that are advised by ALM First or one of its affiliates. |
5 | Directorships of companies required to report to the SEC under the Securities Exchange Act of 1934 (i.e., “public companies”) or other investment companies registered under the 1940 Act. |
6 | Ms. Renderos is considered to be an “interested” Trustee as that term is defined in the 1940 Act due to her status as an employee of a shareholder holding more than 25% of the voting securities of the Trust. |
38
TRUST FOR CREDIT UNIONS
| Additional Information (Unaudited) (continued) | August 31, 2022 |
Trustees and Officers (unaudited) (continued)
Information pertaining to the officers of the Trust is set forth below.
| Term of Office | |||
| Position(s) Held | and Length of | ||
Name, Age and Address | with Trust | Time Served1 | Principal Occupation(s) During Past 5 Years |
| Jay E. Johnson, 54 | President and | Since 2013 | President, CFS (2019-Present); Executive Vice |
| 1001 Connecticut Ave., NW | Treasurer | and 2008 | President, CFS (2001-2019). |
| Suite 1001 | |||
| Washington, D.C. 20036 | |||
| Jonathan K. Jeffreys, 43 | Vice President | Since 2008 | Vice President, CFS (2001-Present). |
| 1001 Connecticut Ave., NW | and Assistant | and 2013 | |
| Suite 1001 | Treasurer | ||
| Washington, D.C. 20036 | |||
| Andrew E. Seaberg, 43 | Secretary | Since | Partner (2020-Present), Faegre Drinker Biddle & Reath LLP |
| Faegre Drinker Biddle & Reath LLP | 2020 | (law firm); Associate (2009-2020), Drinker Biddle & Reath LLP | |
| One Logan Square, Ste. 2000 | (law firm). | ||
| Philadelphia, PA 19103-6996 | |||
| Salvatore Faia, JD, CPA, CFE, 59 | Chief | Since 2008 | President, Vigilant Compliance, LLC (investment |
| Vigilant Compliance, LLC | Compliance | management services company) (2004-Present); | |
| Gateway Corporate Center | Officer | President (since 2009) and Chief Compliance Officer | |
| Suite 216 | (since 2004), The RBB Fund, Inc (registered investment | ||
| 223 Wilmington West Chester Pike | company); Independent Trustee of EIP Investment Trust | ||
| Chadds Ford, PA 19317 | (registered investment company) (2005-Present). |
1 | Each officer is elected by the Board of Trustees of the Trust and holds office at the pleasure of the Board of Trustees or until his or her successor shall have been duly elected and qualified. |
39
THIS PAGE LEFT INTENTIONALLY BLANK
Trustees
Julie A. Renderos, Chair
Erin M. Mendez, Vice Chair
Lisa Ginter
Stanley Hollen
J. Mark McWatters
James F. Regan
Wendell A. Sebastian
Michael D. Steinberger
Officers
Jay E. Johnson, President and Treasurer
Jonathan K. Jeffreys, Vice President and Assistant Treasurer
Andrew E. Seaberg, Secretary
Salvatore Faia, JD, CPA, Chief Compliance Officer
Administrator
Callahan Credit Union Financial Services
Limited Liability Limited Partnership
Investment Adviser
ALM First Financial Advisors, LLC
Administrative & Fund Accounting Agent
U.S. Bank Global Fund Services
Transfer Agent
U.S. Bancorp Fund Services, LLC
Distributor
Callahan Financial Services, Inc.
Independent Registered Public Accounting Firm
Tait,Weller & Baker LLP
Enhanced Income Intermediate Duration Credit Portfolio
Annual Report
August 31, 2022
| TRUST FOR CREDIT UNIONS | |
| Statements of Assets and Liabilities | |
| August 31, 2022 |
| Enhanced Income Intermediate Duration Credit Portfolio | ||||
| ASSETS | ||||
| INVESTMENTS: | ||||
| Investments and repurchase agreements at cost | $ | - | ||
| Investments at value | $ | - | ||
| RECEIVABLES: | ||||
| Fund shares sold | 10,000 | |||
| Total Assets | 10,000 | |||
| NET ASSETS | $ | 10,000 | ||
| NET ASSETS CONSIST OF: | ||||
| Paid-in capital | $ | 10,000 | ||
| Accumulated deficit | 0 | |||
| Net Assets | $ | 10,000 | ||
| $ | — | |||
| Investor Shares: | ||||
| Net assets | $ | 10,000 | ||
| Total shares outstanding, $0.001 par value (unlimited number of shares authorized) | 1,000 | |||
| Net asset value, offering price and redemption price per share (net assets/shares outstanding) | $ | 10.00 | ||
| See accompanying notes to financial statements. |
| TRUST FOR CREDIT UNIONS | |
| Statements of Changes in Net Assets |
Enhanced Income Intermediate Duration Credit Portfolio | ||||
Period Ended August 31, 2022 (1) | ||||
| From Shares Transactions: | ||||
| Investor Shares: | ||||
| Proceeds from sale of shares | 10,000 | |||
| Net increase in net assets resulting from shares transactions | 10,000 | |||
| Net change in net assets | 10,000 | |||
| Net Assets: | ||||
| Beginning of period | – | |||
| End of period | $ | 10,000 | ||
| Other Information: | ||||
| Summary of Shares Transactions: | ||||
| Investor Shares: | ||||
| Shares sold | 1,000 | |||
| Total Investor Share Transactions | 1,000 | |||
| Net increase in shares outstanding | 1,000 | |||
(1) The Portfolio commenced operations August 31, 2022. | |
| See accompanying notes to financial statements. |
NOTES TO FINANCIAL STATEMENTS
Note 1: Organization
Trust for Credit Unions (the “Trust”) is a Massachusetts business trust registered under the Investment Company Act of 1940, as amended (the “Act”), as an open-end management investment company currently consisting of three active portfolios. This shareholder report relates to the Trust’s Enhanced Income Intermediate Duration Credit Portfolio (the “Portfolio”). Shares of the Portfolio are offered for sale principally to state and federally chartered credit unions. The Portfolio seeks to achieve a high level of total return and income. The Portfolio commenced investment operations on August 31, 2022, with one class of shares, Investor Class. The Fund did not earn any income or incur any expenses during the period ended August 31, 2022.
The Portfolio is an investment company and accordingly follows the investment company accounting and reporting guidance of the Financial Accounting Standards Board (FASB) Accounting Standard Codification, “Financial Services – Investment Companies”, Topic 946 (ASC 946).
Note 2: Summary of Significant Accounting Policies
The following is a summary of significant accounting policies consistently followed by the Portfolio. The preparation of financial statements in conformity with U.S. generally accepted accounting principles (“U.S. GAAP”) requires management to make estimates and assumptions that may affect the reported amounts. Actual results could differ from those estimates.
A. Investment Valuation
Investments in mortgage-backed, asset-backed (to the extent that obligations authorized under the Federal Credit Union Act are categorized as asset-backed obligations), and U.S. Treasury obligations for which accurate market quotations are readily available are valued on the basis of quotations furnished by a pricing service or provided by dealers in such securities. The pricing services may use valuation models or matrix pricing, which considers yield or price with respect to comparable bonds, quotations from bond dealers or by reference to other securities that are considered comparable in such characteristics as rating, interest rate and maturity date, to determine current value. Short-term debt obligations maturing in sixty days or less are valued at amortized cost, which approximates market value. Portfolio securities for which accurate market quotations are not readily available due to, among other factors, current market trading activity, credit quality and default rates, are valued based on yield equivalents, pricing matrices or other sources, under valuation procedures established by the Board of Trustees of the Trust (the “Board”).
The Portfolio is subject to fair value accounting standards that define fair value, establish the framework for measuring fair value and provide a three-level hierarchy for fair valuation based upon the inputs to the valuation as of the measurement date. The three levels of the fair value hierarchy are as follows:
Level 1 – quoted prices in active markets for identical securities
Level 2 – significant observable inputs (including quoted prices for similar securities, interest rates, prepayment speeds, credit risk, etc.)
Level 3 – significant unobservable inputs (including the Portfolio’s own assumptions in determining the fair value of investments)
At the end of each calendar quarter, management evaluates the Level 2 and Level 3 assets and liabilities, if any, for changes in liquidity, including but not limited to: whether a broker is willing to execute at the quoted price, the depth and consistency of prices from third party services, and the existence of contemporaneous, observable trades in the market. Additionally, management evaluates Level 1 and Level 2 assets and liabilities, if any, on a quarterly basis for changes in listings or delistings on national exchanges. Due to the inherent uncertainty of determining the fair value of investments that do not have a readily available market value, the fair value of the Portfolio’s investments may fluctuate from period to period. Additionally, the fair value of investments may differ significantly from the values that would have been used had a ready market existed for such investments and may differ materially from the values the Portfolio may ultimately realize. Further, such investments may be subject to legal and other restrictions on resale or otherwise less liquid than publicly traded securities.
The inputs or methodology used for valuing securities are not necessarily an indication of the risk associated with investing in those securities.
The Portfolio commenced operations on August 31, 2022, and held no investments at period end.
B. Security Transactions and Investment Income
Security transactions are reflected for financial reporting purposes as of the trade date. Realized gains and losses on sales of portfolio securities are calculated using the identified cost basis. Interest income is recorded on the basis of interest accrued, premium amortized and discount accreted.
All paydown gains and losses will be classified as interest income in the Statements of Operations in accordance with U.S. GAAP. Market discounts, original issue discounts and market premiums on debt securities are accreted/amortized to interest income over the life of the security with a corresponding increase/decrease in the cost basis of that security using the yield to maturity method, or where applicable, the first call date of the security.
C. Distribution to Shareholders
The Portfolio intends to distribute to its shareholders substantially all of its investment income and capital gains. The Portfolio will declare dividends from net investment income daily and pay such dividends monthly. The Portfolio will make distributions of net realized capital gains, if any, at least annually. Income distributions and capital gain distributions are determined in accordance with income tax regulations.
D. Estimates
The preparation of financial statements in conformity with U.S. GAAP requires management to make estimates and assumptions that affect the reported amounts of assets and liabilities and disclosure of contingent assets and liabilities at the date of the financial statements and the reported amounts of income and expenses during the reported period. Actual results could differ from those estimates.
E. Federal Taxes
It is the Portfolio’s policy to comply with the requirements of the Internal Revenue Code of 1986, as amended, (the “Code”) applicable to regulated investment companies and to distribute each year substantially all of its investment company taxable income and capital gains to its shareholders. Accordingly, no federal tax provisions are required. Income distributions to shareholders are recorded on the ex-dividend date, declared daily and paid monthly by the Portfolio. Net capital losses are carried forward to future years and may be used to the extent allowed by the Code to offset any future capital gains. Utilization of capital loss carryforwards may reduce the requirement of future capital gain distributions.
Note 3: Agreements and 12b-1 Plan
A. | Advisory Agreement |
ALM First Financial Advisors, LLC (“ALM First” or the “Adviser”) serves as the investment adviser pursuant to an investment advisory agreement (the “Advisory Agreement”). Under the Advisory Agreement, ALM First manages the Portfolio, subject to the supervision of the Trust’s Board. As compensation for its services and its assumption of certain expenses, the Adviser is entitled to the following fees, computed daily and payable monthly, at the annual rates listed below (as a percentage of the Portfolio’s average daily net assets):
0.25% on the first $100 million;
0.20% on the next $150 million;
0.15% assets above $250 million
During the period following the Portfolio’s launch, ALM First has voluntarily agreed to waive its investment advisory fees fee with respect to the Portfolio. This is a voluntary fee waiver that may be discontinued by ALM First at any time, in its sole discretion.
B. | Administration Agreement |
Callahan Credit Union Financial Services Limited Liability Limited Partnership (“CUFSLP”) serves as the Portfolio’s administrator pursuant to an Administration Agreement. Callahan Financial Services, Inc. (“CFS”) serves as a general partner to CUFSLP, which includes 37 major credit unions that are limited partners. As compensation for services rendered pursuant to such Agreement, CUFSLP is entitled to fees, computed daily and payable by the Portfolio monthly, at an annual rate of 0.05% calculated as a percentage of the Portfolio’s average daily net assets.
CUFSLP has contractually agreed to waive its entire administration fee for a period of at least one year. This waiver may only be terminated before this date by a vote of a majority of the Board.
U.S. Bancorp Fund Services, LLC, doing business as U.S. Bank Global Fund Services (“Fund Services”), an indirect wholly-owned subsidiary of U.S. Bancorp, provides additional administrative services to the Portfolio pursuant to a Fund Administration Servicing Agreement dated June 7, 2018 and is entitled to the following fees, computed daily and payable by the Portfolio monthly, at the following annual rates as a percentage of the aggregate average net assets.
Asset Level Contractual Rate(1)
| up to $300 million . . . . . . . . . . . . | 0.030% | |
| from $300 to $600 million . . . . . . | 0.025 | |
| in excess of $600 million . . . . . . . | 0.020 |
(1) The complex is subject to an aggregate minimum annual base fee of $150,000.
C. Other Agreements
CFS serves as exclusive distributor of shares of the Portfolio. CFS did not receive any compensation under the Distribution Agreement during the period ended August 31, 2022.
Fund Services also serves as the fund accountant and transfer agent to the Portfolio. U.S. Bank, N.A. (“U.S. Bank”), an affiliate of Fund Services, serves as the Portfolio’s custodian.
The Trust has adopted a Distribution Plan (the “12b-1 Plan”) with respect to Investor Shares of the Portfolio. Under the 12b-1 Plan, the Trust may pay the distributor (or any other person) an amount of up to 0.25% annually of the average daily net assets attributable to Investor Shares of the Portfolio in consideration for expenses and activities primarily intended to result in the sale of Investor Shares and/or for administrative support services. The Trust is currently limiting the fee payable under the 12b-1 Plan with respect to Investor Shares of the Portfolio to 0.03% of the average daily net assets attributable to Investor Shares of the Portfolio.
CFS has contractually agreed to waive its entire administration fee for a period of at least one year. This waiver may only be terminated before this date by a vote of a majority of the Board.
Note 4. Credit and Concentration Risk
The Portfolio’s investments are subject to credit risk, the risk that issuers and/or counterparties will fail to make payments when due or default completely. If an issuer’s or a counterparty’s financial condition worsens, the credit quality of the issuer or counterparty may deteriorate. Credit spreads may increase, which may reduce the market values of a Portfolio’s securities. Credit spread risk is the risk that economic and market conditions or any actual or perceived credit deterioration may lead to an increase in the credit spreads (i.e., the difference in yield between two securities of similar maturity but different credit quality) and a decline in price of the issuer’s securities.
The Portfolio may invest a portion of its assets in securities of issuers that hold mortgage securities, including residential mortgages. The value of these securities is sensitive to changes in economic conditions, including delinquencies and/or defaults, and may be adversely affected by shifts in the market’s perception of the issuers and changes in the interest rates.
The Portfolio may also invest in CMOs. These multiple class securities may be mortgage-related securities issued by the U.S. Government, its agencies, instrumentalities or sponsored enterprises, including the Federal National Mortgage Association and Federal Home Loan Mortgage Corp. In general, CMOs represent direct ownership interests in a pool of residential mortgage loans or mortgage passthrough securities (the “Mortgage Assets”), the payments on which are used to make payments on the CMOs. Investors may purchase beneficial interests in CMOs, which are known as “regular” interests or “residual” interests. The Portfolio may not purchase residual interests, but may purchase other types of interests. Each class of a CMO, often referred to as a “tranche,” is issued at a specific adjustable or fixed interest rate and must be fully retired no later than its final distribution date. Principal repayments on the Mortgage Assets underlying a CMO may cause some or all of the classes of the CMO to be retired substantially earlier than its final distribution date. The principal of and interest on the Mortgage Assets may be allocated among several classes of a CMO in various ways.
Note 5. Subsequent Events
Management has evaluated the impact of all subsequent events on the Portfolio through the date the financial statements were issued and has determined that, aside from the foregoing, there were no subsequent events requiring recognition or disclosure in the financials statements.
REPORT OF INDEPENDENT REGISTERED PUBLIC ACCOUNTING FIRM
To the Shareholders and the Board of Trustees
Trust for Credit Union
Opinion on the Financial Statements
We have audited the accompanying statement of assets and liabilities of the Enhanced Income Intermediate Duration Credit Portfolio (the “Portfolio”), a series of Trust for Credit Unions (the “Trust”) as of August 31, 2022, and the related statement of changes in net assets in the period ended August 31, 2022, and the related notes (collectively referred to as the “financial statements”). In our opinion, the financial statements present fairly, in all material respects, the financial position of the Portfolio as of August 31, 2022, the changes in its net assets in the period August 31, 2022, in conformity with accounting principles generally accepted in the United States of America.
Basis for Opinion
These financial statements are the responsibility of the Fund’s management. Our responsibility is to express an opinion on the Fund’s financial statements based on our audit. We are a public accounting firm registered with the Public Company Accounting Oversight Board (United States) (“PCAOB”) and are required to be independent with respect to the Fund in accordance with the U.S. federal securities laws and the applicable rules and regulations of the Securities and Exchange Commission and the PCAOB. We have served as the auditor of one or more of the funds in the Trust since 2011.
We conducted our audit in accordance with the standards of the PCAOB. Those standards require that we plan and perform the audit to obtain reasonable assurance about whether the financial statements are free of material misstatement, whether due to error or fraud. The Fund is not required to have, nor was we engaged to perform, an audit of its internal control over financial reporting. As part of our audit we are required to obtain an understanding of internal control over financial reporting, but not for the purpose of expressing an opinion on the effectiveness of the Fund’s internal control over financial reporting. Accordingly, we express no such opinion.
Our audit included performing procedures to assess the risks of material misstatement of the financial statements, whether due to error or fraud, and performing procedures that respond to those risks. Such procedures included examining, on a test basis, evidence regarding the amounts and disclosures in the financial statements. Our audit also included evaluating the accounting principles used and significant estimates made by management, as well as evaluating the overall presentation of the financial statements. We believe that our audit provides a reasonable basis for our opinion.
TAIT, WELLER & BAKER LLP
Philadelphia, Pennsylvania
October 28, 2022
Board Considerations of Investment Advisory Agreement (Unaudited)
At a quarterly meeting of the Board of Trustees (the “Board” or the “Trustees”) of Trust for Credit Unions (the “Trust”) held on July 13, 2021 (the “Contract Approval Meeting”), the Trustees, including a majority of the Trustees who are not “interested” persons of the Trust within the meaning of the Investment Company Act of 1940, as amended (the “1940 Act”) (the “Independent Trustees”) voting separately, considered and approved for an initial two-year term a new advisory agreement (the “Advisory Agreement”) between the Trust, on behalf of the Enhanced Income Intermediate Duration Credit Portfolio (the “New Portfolio”), and ALM First Financial Advisors, LLC (“ALM First” or the “Adviser”).
Prior to the Contract Approval Meeting, the Trustees met via videoconference with representatives of ALM First and with the officers of the Trust (“Fund Management”) to review and discuss the investment management services to be provided to the New Portfolio by ALM First. In considering the New Portfolio’s investment advisory arrangements, the Board met with ALM First on April 15, 2021, and members of the Product Development Committee of the Board and other Trustees had met with representatives of ALM First at the Product Development Committee meeting held on May 24, 2021 and separately in executive session to discuss, among other things: (i) projected profitability of the New Portfolio to ALM First; (ii) services and personnel to be provided by ALM First; (iii) compensation, including advisory fees payable by the New Portfolio; (iv) procedures for allocating portfolio transactions among the New Portfolio; and (v) compliance and administration of the New Portfolio. At each of these meetings and the Contract Approval Meeting, the Trustees received and reviewed information provided by ALM First in response to requests from the Trustees, Trust counsel and Independent Trustee counsel. Among other written and oral information, the Trustees requested and were provided information related to:
| • | the nature, extent and quality of the management and advisory services to be provided to the New Portfolio by ALM First; |
| • | the level of management and advisory fees that would be payable under the Advisory Agreement; |
| • | the costs of the services provided and the anticipated profits to be realized by ALM First and its affiliates; |
| • | the New Portfolio’s projected expense ratio; |
| • | the New Portfolio’s and ALM First’s compliance programs; |
| • | economies of scale to be realized in connection with the management of the New Portfolio; |
| • | ancillary benefits that may be received by ALM First and its affiliates that may arise as a result of their relationship with the New Portfolio; and |
| • | various other matters within the information provided by ALM First |
The Trustees also relied upon their knowledge of ALM First as investment adviser to the Trust’s existing Portfolios, as well as the services ALM First has provided to the existing Portfolios and the Board’s interactions with ALM First from regular meetings and interactions throughout the year and in the time since ALM First had commenced management of the existing Portfolios.
Throughout the process, the Trustees had opportunities to ask questions of and requested and received additional materials from ALM First and from Fund Management. In considering whether to approve the Advisory Agreement, the Trustees reviewed and analyzed various factors that they determined were relevant, none of which by itself was considered dispositive. The material factors and conclusions that formed the basis for the determination of the Trustees to approve the Advisory Agreement for the New Portfolio are discussed below:
Decision to Approve the New Advisory Agreement
Nature, Extent, and Quality of Services. The Trustees considered the nature, extent and quality of advisory services to be provided by ALM First. In that regard, the Trustees noted that ALM First had managed the Trust’s existing Portfolios since April of 2017, and provided materials on the Adviser’s history of managing assets for credit unions subject to Part 703 of the National Credit Union Administration (“NCUA”) rules and regulations, as well as the Adviser’s experience in managing non-Part 703 assets. Other considerations included: (i) ALM First’s ability to supervise the New Portfolio’s service providers, to supervise operations for the New Portfolio, to prepare compliance and regulatory filings for the New Portfolio and disclosures to Portfolio shareholders, to assist the Trustees in their capacity as trustees, and to provide other services; (ii) ALM First’s significant connections to and history of managing assets in the credit union industry; and (iii) ALM First’s regulatory history and timely responses to requests from regulators. The Trustees were familiar generally with the quality of services provided by ALM First and with members of its management team based on ALM First’s time spent serving as investment adviser to the Trust’s existing Portfolios, as well as ALM First’s prior history of providing investment advisory and other financial services to credit unions and support organizations in the credit union industry. The Trustees discussed and reviewed ALM First’s work on behalf of the credit union movement with respect to the implementation and interpretation of NCUA rules and regulations, and the firm’s overall presence as a credit union industry advisor, and noted the ancillary benefits that this presence and reputation may present to make the existing Portfolios and the New Portfolios attractive entities for credit union investors.
The Trustees noted the representations of ALM First with respect to ensuring compliance with the New Portfolio’s investment policies and restrictions, as well as ALM First’s familiarity with NCUA rules and regulations. They reviewed the quality of managerial services proposed to be provided by ALM First in its capacity as investment adviser to the New Portfolio, noting that ALM First had actively guided the Trust’s existing Portfolios while managing their investments since the firm began advising the existing Portfolios in 2017.
The Trustees also considered information such as: (i) the experience of ALM First’s investment professionals; (ii) the reputation, regulatory history and resources of ALM First, generally, and its reputation and standing particularly within the credit union industry; (iii) information on the approach of ALM First to retention and compensation of investment and other key personnel; (iv) ALM First’s current and projected financial condition; and (v) the management structure of ALM First and ALM First’s plans with respect to the proposed management of the New Portfolio.
The Trustees concluded that ALM First was able to commit, and had committed, appropriate financial and other resources to the operations of the Trust and was able to provide quality services to the New Portfolio.
Investment Performance of the Portfolio. The Trustees did not consider the investment performance of the New Portfolio because it had not yet commenced operations. ALM First representatives discussed with the Trustees its experience managing assets for pre-funded employee benefits and charitable donation accounts, including the Adviser’s work in developing investments solutions for credit unions through separately managed accounts. The ALM First representatives noted that, because the investment restrictions of separately managed accounts are tailored to the preferences of the individual investing institution, they do not provide comparable performance for the New Portfolio.
Expenses. The Trustees reviewed the proposed expense structure of the New Portfolio under the Advisory Agreement. The Trustees noted that the Advisory Agreement included breakpoints in the fees charged to the New Portfolio. They noted that such breakpoints would result in economies of scale for the New Portfolio if it reached higher asset levels. The Trustees reviewed information on the fee rates to be paid by the New Portfolio and the New Portfolio’s projected total expense ratio at various asset levels compared to similar information for mutual funds advised by unaffiliated investment management firms, as prepared by an independent third-party data provider. The Trustees considered that even at relatively low asset levels, the New Portfolio’s management fees would be below the median of its peers. The Trustees concluded that for the New Portfolio the contractual management fee payable to ALM First under the Advisory Agreement would be reasonable based upon the qualifications, experience and reputation of ALM First and the projected overall expense ratios of the Portfolio.
Profitability and Costs of Services to ALM First. The Trustees considered materials concerning ALM First’s projected profitability and the expected costs attributable to the New Portfolio. ALM First provided, and the Trustees reviewed and discussed, ALM First’s projected profitability for managing the Portfolio at various asset levels.
Extent of Economies of Scale as the Portfolios Grow. The Trustees considered the extent to which economies of scale would be realized with respect to the management of the New Portfolio as it grows and whether the New Portfolio would appropriately benefit from any economies of scale in the management fee levels payable under the Advisory Agreement. The Trustees noted the Advisory Agreement contained breakpoints on the New Portfolio’s advisory fees that would allow investors to benefit directly in the form of lower fees as the New Portfolio’s assets grow.
Other Relevant Considerations. (a) Personnel and Methods. The Trustees also considered the history, reputation, qualifications and background of ALM First, as well as the qualifications of their personnel, and concluded that ALM First currently had sufficient personnel to serve the New Portfolio effectively. (b) Other Benefits. The Trustees also considered the character and amount of other direct and incidental benefits received by ALM First and its affiliates from their association with the Trust and the New Portfolio. The Trustees concluded that potential “fall-out” benefits that ALM First and its affiliates might receive, such as greater name recognition visibility
among credit unions or increased ability to obtain research services, appeared to be reasonable, and might in some cases also benefit the Trust’s existing Portfolios and the New Portfolio. The Trustees noted, for instance, that ALM First had participated with the existing Portfolio’s sponsor in providing investor education services and outreach efforts, and that the association with ALM First as Adviser had provided additional name recognition in the credit union industry.
Conclusion. In considering the Advisory Agreement, the Trustees did not identify any factor as all-important or all-controlling and instead considered the above listed and other factors collectively in light of the New Portfolio’s surrounding circumstances. Based on this review, it was the judgment of the Trustees that shareholders of the New Portfolio would receive acceptable performance and that the proposed fees under the Advisory Agreement were reasonable. The Trustees considered assurances from ALM First that it would manage the New Portfolio in accordance with its investment objectives and policies as disclosed to shareholders and would employ an experienced portfolio management team in managing the New Portfolio. After full consideration of the above factors, as well as other factors that the Trustees considered relevant in evaluating the Advisory Agreement, the Trustees unanimously concluded that the approval of the Advisory Agreement was in the best interest of the New Portfolio and its shareholders, and voted to approve the Advisory Agreement for an initial two-year term.
TRUST FOR CREDIT UNIONS
| Additional Information (Unaudited) | August 31, 2022 |
Trustees and Officers (unaudited)1
| Number of | |||||
| Portfolios | |||||
| Term of | in Fund | Other | |||
| Office and | Complex | Directorships | |||
| Position(s) Held | Length of | Principal Occupation(s) | Overseen by | Held by | |
Name, Age and Address2 | with Trust | Time Served3 | During Past 5 Years | Trustee4 | Trustee5 |
| Independent Trustees | |||||
| Lisa Ginter | Trustee | Since | Chief Executive Officer (since 2015), | 3 | None |
| Age: 58 | August 2021 | Community America Credit Union. | |||
| Stanley C. Hollen | Trustee | Since | Chief Executive Officer, Co-Op | 3 | None |
| Age: 73 | 2007 | Financial Services (credit | |||
| union-owned payments CUSO) | |||||
| (2005-2016); President and Chief | |||||
| Executive Officer, Liberty Enterprises | |||||
| (credit union-focused check printer, | |||||
| payments provider) (2003-2005); | |||||
| President and Chief Executive | |||||
| Officer, Golden 1 Credit | |||||
| Union (1984-2002). | |||||
| J. Mark McWatters | Trustee | Since | Self-Employed Attorney; Board member | 3 | None |
| Age: 67 | July 2021 | (2014-2020) and Chair (2017-2019) of | |||
| the National Credit Union Administration. | |||||
| Erin Mendez | Vice Chair | Since | President and Chief Executive Officer, | 3 | None |
| Age: 63 | and | July 2020 | Patelco Credit Union (since 2013). | ||
| Trustee | and 2019 | ||||
| James F. Regan | Trustee | Since | President and Chief Executive Officer | 3 | None |
| Age: 56 | 2013 | (2009-2022) and Vice President and | |||
| Chief Financial Officer (1996-2008), | |||||
| Digital Federal Credit Union. | |||||
| Wendell A. Sebastian | Trustee | Since | Executive Director, National Credit | 3 | None |
| Age: 78 | 1989 | Union Foundation (2010-2013); | |||
| President and Chief Executive Officer, | |||||
| GTE Federal Credit Union | |||||
| (1998-2009). | |||||
| Michael D. Steinberger | Trustee | Since | Associate Professor of Economics | 3 | None |
| Age: 45 | 2015 | (since 2011), Assistant Professor | |||
| of Economics (2004-2011) Pomona | |||||
| College; Dean (2011-Present), | |||||
| Associate Dean (2006-2011) and | |||||
| Chief Academic Officer (2016-Present), | |||||
| Western CUNA Management School. | |||||
Interested Trustees6 | |||||
| Julie A. Renderos | Chair | Since | Executive Vice President/Chief | 3 | None |
| Age: 46 | and | July 2020 | Financial Officer (since 2012), | ||
| Trustee | and 2015 | Senior Vice President/Finance | |||
| (2007-2012), Suncoast Credit Union. |
1 | The Statement of Additional Information includes additional information about the Trustees and is available, without charge, upon request by calling Trust for Credit Unions at (800) DIAL TCU (800-342-5828) or Callahan Financial Services, Inc. at (800) 237-5678. |
2 | Each Trustee may be contacted by writing to the Trustee, c/o Callahan Credit Union Financial Services LLLP, 1001 Connecticut Avenue, NW, Suite 1001, Washington, D.C. 20036-5504. |
3 | Except in the event of resignation or removal, each Trustee holds office until the next meeting of shareholders called for the purpose of electing Trustees, and until the election and qualification of his successor. |
4 | The Fund Complex includes all registered investment companies that are advised by ALM First or one of its affiliates. |
5 | Directorships of companies required to report to the SEC under the Securities Exchange Act of 1934 (i.e., Òpublic companiesÓ) or other investment companies registered under the 1940 Act. |
6 | Ms. Renderos is considered to be an ÒinterestedÓ Trustee as that term is defined in the 1940 Act due to her status as an employee of a shareholder holding more than 25% of the voting securities of the Trust. |
TRUST FOR CREDIT UNIONS
| Additional Information (Unaudited) (continued) | August 31, 2022 |
Trustees and Officers (unaudited) (continued)
Information pertaining to the officers of the Trust is set forth below.
| Term of Office | |||
| Position(s) Held | and Length of | ||
Name, Age and Address | with Trust | Time Served1 | Principal Occupation(s) During Past 5 Years |
| Jay E. Johnson, 54 | President and | Since 2013 | President, CFS (2019-Present); Executive Vice |
| 1001 Connecticut Ave., NW | Treasurer | and 2008 | President, CFS (2001-2019). |
| Suite 1001 | |||
| Washington, D.C. 20036 | |||
| Jonathan K. Jeffreys, 43 | Vice President | Since 2008 | Vice President, CFS (2001-Present). |
| 1001 Connecticut Ave., NW | and Assistant | and 2013 | |
| Suite 1001 | Treasurer | ||
| Washington, D.C. 20036 | |||
| Andrew E. Seaberg, 43 | Secretary | Since | Partner (2020-Present), Faegre Drinker Biddle & Reath LLP |
| Faegre Drinker Biddle & Reath LLP | 2020 | (law firm); Associate (2009-2020), Drinker Biddle & Reath LLP | |
| One Logan Square, Ste. 2000 | (law firm). | ||
| Philadelphia, PA 19103-6996 | |||
| Salvatore Faia, JD, CPA, CFE, 59 | Chief | Since 2008 | President, Vigilant Compliance, LLC (investment |
| Vigilant Compliance, LLC | Compliance | management services company) (2004-Present); | |
| Gateway Corporate Center | Officer | President (since 2009) and Chief Compliance Officer | |
| Suite 216 | (since 2004), The RBB Fund, Inc (registered investment | ||
| 223 Wilmington West Chester Pike | company); Independent Trustee of EIP Investment Trust | ||
| Chadds Ford, PA 19317 | (registered investment company) (2005-Present). |
1 | Each officer is elected by the Board of Trustees of the Trust and holds office at the pleasure of the Board of Trustees or until his or her successor shall have been duly elected and qualified. |
Trustees
Julie A. Renderos, Chair
Erin M. Mendez, Vice Chair
Lisa Ginter
Stanley Hollen
J. Mark McWatters
James F. Regan
Wendell A. Sebastian
Michael D. Steinberger
Officers
Jay E. Johnson, President and Treasurer
Jonathan K. Jeffreys, Vice President and Assistant Treasurer
Andrew E. Seaberg, Secretary
Salvatore Faia, JD, CPA, Chief Compliance Officer
Administrator
Callahan Credit Union Financial Services
Limited Liability Limited Partnership
Investment Adviser
ALM First Financial Advisors, LLC
Administrative & Fund Accounting Agent
U.S. Bank Global Fund Services
Transfer Agent
U.S. Bancorp Fund Services, LLC
Distributor
Callahan Financial Services, Inc.
Independent Registered Public Accounting Firm
Tait,Weller & Baker LLP
| (b) |
NOTICE: Important Reports to Shareholders of the Trust for Credit Unions Short Duration Portfolio and Ultra-Short Duration Portfolio are Now Available Online and In Print by Request. The shareholder reports contain important information about your investments, including portfolio holdings and financial statements. We encourage you to view the shareholder reports and other information by visiting: https://trustcu.com/investment-documents/. |
You may request a paper copy of the shareholder reports or other materials available at www.trustcu.com/contact-us or by contacting the Trust at 1-800-237-5678. You will not otherwise receive a paper copy of these materials. You may elect to receive all future shareholder reports and other communications from your Portfolio(s) electronically by contacting your broker-dealer or other financial intermediary. You may elect to receive all future shareholder reports in paper free of charge. If you invest through a financial intermediary, you can contact your financial intermediary to request that you receive paper copies of your shareholder reports. If you invest directly with the Trust, you can call 1-800-237-5678 to request paper copies of your shareholder reports. You may also elect to receive shareholder reports and other communications electronically by contacting your financial intermediary or, if you are a direct investor, by enrolling at www.trustcu.com/contact-us or calling us at the number above. |
Item 2. Code of Ethics.
(a) As of the end of the period covered by this report, the registrant has adopted a code of ethics that applies to the registrant's principal executive officer, principal financial officer, principal accounting officer or controller, or persons performing similar functions, regardless of whether these individuals are employed by the registrant or a third party (the "Code of Ethics").
(c) There have been no amendments, during the period covered by this report, to a provision of the code of ethics that applies to the registrant's principal executive officer, principal financial officer, principal accounting officer or controller, or persons performing similar functions, regardless of whether these individuals are employed by the registrant or a third party, and that relates to any element of the code of ethics description.
(d) During the period covered by this report, the registrant did not grant any waivers, including an implicit waiver, from any provision of the Code of Ethics.
Item 3. Audit Committee Financial Expert.
The registrant’s board of trustees has determined that there is at least one audit committee financial expert serving on its audit committee. Stanley C. Hollen is the “audit committee financial expert” and is considered to be “independent” as each term is defined in Item 3 of Form N‑CSR.
Item 4. Principal Accountant Fees and Services for the Trust for Credit Unions*: Table 1 Items 4(a) - 4(d).
| FYE 8/31/2022 | FYE 8/31/2021 | Description of Services Rendered | |
Audit Fees | $45,500 | $44,000 | Financial Statement Audits |
Audit-Related Fees | $0 | $0 | |
Tax Fees | $6,500 | $6,000 | Tax compliance services provided in connection with the preparation and review of the registrant's tax returns |
All Other Fees | $0 | $0 |
Table 2 - Items 4(b), (c) & (d). Non-Audit Services to the Trust for Credit Unions' service
affiliates** that were pre-approved by the Trust for Credit Unions' Audit Committee pursuant to
Rule 2-0l(c)(7)(ii) of Regulation S-X.
FYE 8/31/2022 | FYE 8/31/2021 | |
Audit Fees | $0 | $0 |
Audit-Related Fees | $0 | $0 |
Tax Fees | $0 | $0 |
All Other Fees | $0 | $0 |
* Tait Weller & Baker LLP served as the registrant's principal accountant for the fiscal years ended August 31, 2022 and August 31, 2021.
** These include the advisers and any entity controlling, controlled by or under common control with the advisers that provides ongoing services to the registrant (hereinafter referred to as "service affiliates").
(e)(1) Disclose the audit committee's pre-approval policies and procedures described in paragraph (c)(7) of Rule 2-01 of Regulation S-X.
Pre-Approval of Audit and Non-Audit Services Provided to the Portfolios of the Trust for Credit Unions. The Audit and Non-Audit Services Pre-Approval Policy (the "Policy") adopted by the Audit Committee of the Trust for Credit Unions ("TCU") sets forth the procedures and the conditions pursuant to which services performed by the independent auditor for TCU may be pre-approved. Services may be pre-approved specifically by the Audit Committee as a whole or by one or more members of the Audit Committee to whom authority to grant such approvals has been delegated by the Audit Committee. In addition, subject to specified cost limitations, certain services may be pre-approved under the provisions of the Policy. The Policy provides that the Audit Committee will consider whether the services provided by an independent auditor are consistent with the Securities and Exchange Commission's rules on auditor independence. The Policy provides for periodic review and pre-approval by the Audit Committee of the services that may be provided by the independent auditor.
De Minimis Waiver. The pre-approval requirements of the Policy may be waived with respect to the provision of non-audit services that are permissible for an independent auditor to perform, provided (1) the aggregate amount of all such services provided constitutes no more than five percent of the total amount of revenues subject to pre-approval that was paid to the independent auditor during the fiscal year in which the services are provided; (2) such services were not recognized by TCU at the time of the engagement to be non-audit services; and (3) such services are promptly brought to the attention of the Audit Committee and approved prior to the completion of the audit by the Audit Committee or by one or more members of the Audit Committee to whom authority to grant such approvals has been delegated by the Audit Committee, pursuant to the pre-approval provisions of the Policy.
Pre-Approval of Non-Audit Services Provided to TCU's Investment Adviser. The Policy provides that, in addition to requiring pre-approval of audit and non-audit services provided to TCU, the Audit Committee will pre-approve those non-audit services provided to TCU's investment adviser (and entities controlling, controlled by or under common control with the investment adviser that provide ongoing services to TCU) where the engagement relates directly to the operations or financial reporting of TCU.
(e)(2) None of the services described in the Registrant's response to paragraphs (b) through (d) of ltem 4 were approved by the Registrant's Audit Committee pursuant to the "de minimis" exception of Rule 2-0l(c)(7)(i)(C) of Regulation S-X
(f) Not applicable.
(g) The aggregate non-audit fees billed by the registrant's accountant for services rendered to the registrant, and rendered to the registrant's investment adviser (not including any sub-adviser whose role is primarily portfolio management and is subcontracted with or overseen by another investment adviser), and any entity controlling, controlled by, or under common control with the adviser that provides ongoing services to the registrant for each of the last two fiscal years of the registrant was $0 for the fiscal year ended August 31, 2022 and $0 for the fiscal year ended August 31, 2021.
(h) Not applicable.
Item 5. Audit Committee of Listed Registrants.
Not applicable.
Item 6. Investments.
(a) Schedule of Investments is included as part of the report to shareholders filed under Item 1 of this Form.
(b) Not applicable
Item 7. Disclosure of Proxy Voting Policies and Procedures for Closed-End Management Investment Companies.
Not applicable to open-end investment companies.
Item 8. Portfolio Managers of Closed-End Management Investment Companies.
Not applicable to open-end investment companies.
Item 9. Purchases of Equity Securities by Closed‑End Management Investment Company and Affiliated Purchasers.
Not applicable to open-end investment companies.
Item 10. Submission of Matters to a Vote of Security Holders.
There have been no material changes to the procedures by which shareholders may recommend nominees to the registrant’s board of trustees.
Item 11. Controls and Procedures.
| (a) | The registrant’s principal executive officer and principal financial officer, or persons performing similar functions, have concluded that the registrant's disclosure controls and procedures (as defined in Rule 30a-3(c) under the Investment Company Act of 1940 (the “Act”)) are effective, as of a date within 90 days of the filing of this report, based on the evaluation of these controls and procedures required by Rule 30a-3(b) under the Act and Rules 13a-15(b) or 15d‑15(b) under the Securities Exchange Act of 1934, as amended. |
| (b) | There were no changes in the registrant's internal control over financial reporting (as defined in Rule 30a-3(d) under the Act) that occurred during the period covered by this report that have materially affected, or are reasonably likely to materially affect, the registrant's internal control over financial reporting. |
Item 12. Disclosure of Securities Lending Activities for Closed-End Management Investment Companies
Not applicable to open-end investment companies.
Item 13. Exhibits.
| (a) | (1) Any code of ethics or amendment thereto, that is the subject of the disclosure required by Item 2, to the extent that the registrant intends to satisfy Item 2 requirements through filing an exhibit. Incorporated by reference to the registrant’s Form N-CSR filed on November 2, 2017. |
(3) Any written solicitation to purchase securities under Rule 23c‑1 under the Act sent or given during the period covered by the report by or on behalf of the registrant to 10 or more persons. Not applicable to open-end investment companies.
(4) Change in the registrant’s independent public accountant. There was no change in the registrant’s independent public accountant for the period covered by this report.
SIGNATURES
Pursuant to the requirements of the Securities Exchange Act of 1934 and the Investment Company Act of 1940, the registrant has duly caused this report to be signed on its behalf by the undersigned, thereunto duly authorized.
(Registrant) Trust for Credit Unions
By (Signature and Title)* /s/Jay E. Johnson
Jay E. Johnson, President & Treasurer
(principal executive officer and principal financial officer)
Date November 2, 2022
Pursuant to the requirements of the Securities Exchange Act of 1934 and the Investment Company Act of 1940, this report has been signed below by the following persons on behalf of the registrant and in the capacities and on the dates indicated.
By (Signature and Title)* /s/Jay E. Johnson
Jay E. Johnson, President & Treasurer
(principal executive officer and principal financial officer)
* Print the name and title of each signing officer under his or her signature