UNITED STATES
SECURITIES AND EXCHANGE COMMISSION
Washington, D.C. 20549
FORM N-CSR
CERTIFIED SHAREHOLDER REPORT
OF
REGISTERED MANAGEMENT INVESTMENT COMPANIES
Investment Company Act file number: 811-05445
Name of Registrant: Vanguard Fenway Funds
Address of Registrant:
P.O. Box 2600
Valley Forge, PA 19482
Name and address of agent for service:
Anne E. Robinson, Esquire
P.O. Box 876
Valley Forge, PA 19482
Registrant’s telephone number, including area code: (610) 669-1000
Date of fiscal year end: September 30
Date of reporting period: October 1, 2017 – September 30, 2018
Item 1: Reports to Shareholders
| Annual Report | September 30, 2018 |
| Vanguard Equity Income Fund |
Vanguard’s Principles for Investing Success
We want to give you the best chance of investment success. These principles, grounded in Vanguard’s research and experience, can put you on the right path.
Goals. Create clear, appropriate investment goals.
Balance. Develop a suitable asset allocation using broadly diversified funds. Cost. Minimize cost.
Discipline. Maintain perspective and long-term discipline.
A single theme unites these principles: Focus on the things you can control.
We believe there is no wiser course for any investor.
| Contents | |
| Your Fund’s Performance at a Glance. | 1 |
| CEO’s Perspective. | 3 |
| Advisors’ Report. | 5 |
| Fund Profile. | 9 |
| Performance Summary. | 11 |
| Financial Statements. | 13 |
| Your Fund’s After-Tax Returns. | 30 |
| About Your Fund’s Expenses. | 31 |
| Glossary. | 33 |
Please note: The opinions expressed in this report are just that—informed opinions. They should not be considered promises or advice. Also, please keep in mind that the information and opinions cover the period through the date on the front of this report. Of course, the risks of investing in your fund are spelled out in the prospectus.
See the Glossary for definitions of investment terms used in this report.
Your Fund’s Performance at a Glance
• Vanguard Equity Income Fund returned more than 10% for the 12 months ended September 30, 2018, in line with the return of its benchmark, the FTSE High Dividend Yield Index, and a bit ahead of the average return of its peers.
• The broad U.S. stock market advanced more than 17% as corporate earnings remained strong and the U.S. economy continued to grow. However, stocks endured a stretch of volatility earlier in 2018 before rebounding.
• Growth stocks outperformed their value brethren over the period, and large-and small-capitalization stocks generally surpassed mid-caps.
• The Equity Income Fund’s two advisors focus on investing in large-cap value companies with higher yields, and they emphasize dividends.
• On a relative basis, industrial stocks were the fund’s top performers. The fund’s information technology stocks climbed more than 30% and added about 4 percentage points to returns, but the fund had a modestly lower weighting in the sector than the index did.
| Total Returns: Fiscal Year Ended September 30, 2018 | |
| Total | |
| Returns | |
| Vanguard Equity Income Fund | |
| Investor Shares | 10.58% |
| Admiral™ Shares | 10.70 |
| FTSE High Dividend Yield Index | 10.75 |
| Equity Income Funds Average | 10.41 |
| Equity Income Funds Average: Derived from data provided by Lipper, a Thomson Reuters Company. | |
| Admiral Shares carry lower expenses and are available to investors who meet certain account-balance requirements. | |
| Total Returns: Ten Years Ended September 30, 2018 | |
| Average | |
| Annual Return | |
| Equity Income Fund Investor Shares | 11.06% |
| FTSE High Dividend Yield Index | 11.06 |
| Equity Income Funds Average | 9.25 |
| Equity Income Funds Average: Derived from data provided by Lipper, a Thomson Reuters Company. | |
The figures shown represent past performance, which is not a guarantee of future results. (Current performance may be lower or higher than the performance data cited. For performance data current to the most recent month-end, visit our website at vanguard.com/performance.) Note, too, that both investment returns and principal value can fluctuate widely, so an investor’s shares, when sold, could be worth more or less than their original cost.
1
| Expense Ratios | |||
| Your Fund Compared With Its Peer Group | |||
| Investor | Admiral | Peer Group | |
| Shares | Shares | Average | |
| Equity Income Fund | 0.26% | 0.17% | 1.15% |
The fund expense ratios shown are from the prospectus dated January 25, 2018, and represent estimated costs for the current fiscal year. For the fiscal year ended September 30, 2018, the fund’s expense ratios were 0.27% for Investor Shares and 0.18% for Admiral Shares. The peer-group expense ratio is derived from data provided by Lipper, a Thomson Reuters Company, and captures information through year-end 2017.
Peer group: Equity Income Funds.
2
CEO’s Perspective

Tim Buckley
President and Chief Executive Officer
Dear Shareholder,
Over the years, I’ve found that prudent investors exhibit a common trait: discipline. No matter how the markets move or what new investing fad hits the headlines, those who stay focused on their goals and tune out the noise are set up for long-term success.
The prime gateway to investing is saving, and you don’t usually become a saver without a healthy dose of discipline. Savers make the decision to sock away part of their income, which means spending less and delaying gratification, no matter how difficult that may be.
Of course, disciplined investing extends beyond diligent saving. The financial markets, in the short term especially, are unpredictable; I have yet to meet the investor who can time them perfectly. It takes discipline to resist the urge to go all-in when markets are frothy or to retreat when things look bleak.
Staying put with your investments is one strategy for handling volatility. Another, rebalancing, requires even more discipline because it means steering your money away from strong performers and toward poorer performers.
Patience—a form of discipline—is also the friend of long-term investors. Higher returns are the potential reward for weathering the market’s turbulence and uncertainty.
3
We have been enjoying one of the longest bull markets in history, but it won’t continue forever. Prepare yourself now for how you will react when volatility comes back. Don’t panic. Don’t chase returns or look for answers outside the asset classes you trust. And be sure to rebalance periodically, even when there’s turmoil.
Whether you’re a master of self-control, get a boost from technology, or work with a professional advisor, know that discipline
is necessary to get the most out of your investment portfolio. And know that Vanguard is with you for the entire ride.
Thank you for your continued loyalty.
Sincerely,

Mortimer J. Buckley
President and Chief Executive Officer
October 18, 2018
| Market Barometer | |||
| Average Annual Total Returns | |||
| Periods Ended September 30, 2018 | |||
| One Year | Three Years | Five Years | |
| Stocks | |||
| Russell 1000 Index (Large-caps) | 17.76% | 17.07% | 13.67% |
| Russell 2000 Index (Small-caps) | 15.24 | 17.12 | 11.07 |
| Russell 3000 Index (Broad U.S. market) | 17.58 | 17.07 | 13.46 |
| FTSE All-World ex US Index (International) | 2.13 | 10.18 | 4.51 |
| Bonds | |||
| Bloomberg Barclays U.S. Aggregate Bond Index | |||
| (Broad taxable market) | -1.22% | 1.31% | 2.16% |
| Bloomberg Barclays Municipal Bond Index | |||
| (Broad tax-exempt market) | 0.35 | 2.24 | 3.54 |
| FTSE Three-Month U. S. Treasury Bill Index | 1.57 | 0.80 | 0.48 |
| CPI | |||
| Consumer Price Index | 2.28% | 1.99% | 1.52% |
4
Advisors’ Report
For the fiscal year ended September 30, 2018, Vanguard Equity Income Fund returned more than 10%, in line with its benchmark and the average return of its peers. Your fund is managed by two independent investment advisors, Wellington Management Company and Vanguard Quantitative Equity Group. The use of two advisors provides exposure to distinct yet complementary investment approaches, enhancing the diversification of your fund. It is not uncommon for different advisors to have different views about individual securities or the broader investment environment.
The advisors, the percentage and amount of the fund’s assets each manages, and brief descriptions of their investment strategies are presented in the table
below. The advisors have also prepared a discussion of the investment environment that existed during the fiscal year and of how their portfolio positioning reflects this assessment. These comments were prepared on October 19, 2018.
Wellington Management Company llp
Portfolio Manager:
W. Michael Reckmeyer, III, CFA, Senior Managing Director and Equity Portfolio Manager
The global economy ended 2017 on a positive note, supported by low unemployment rates, high consumer and business confidence, and optimism about new tax legislation. Investors
| Vanguard Equity Income Fund Investment Advisors | |||
| Fund Assets Managed | |||
| Investment Advisor | % | $ Million | Investment Strategy |
| Wellington Management | 64 | 21,409 | A fundamental approach to seeking desirable |
| Company LLP | stocks. Our selections typically offer | ||
| above-average dividend yields, below-average | |||
| valuations, and the potential for dividend | |||
| increases in the future. | |||
| Vanguard Quantitative Equity | 35 | 11,484 | Employs a quantitative fundamental |
| Group | management approach, using models that | ||
| assess valuation, growth prospects, | |||
| management decisions, market sentiment, and | |||
| earnings and balance-sheet quality of | |||
| companies as compared with their peers. | |||
| Cash Investments | 1 | 483 | These short-term reserves are invested by |
| Vanguard in equity index products to simulate | |||
| investment in stocks. Each advisor may also | |||
| maintain a modest cash position. | |||
5
looking for a pickup in inflation were left waiting. The strong equity markets continued into the start of 2018, helped by healthy corporate and economic fundamentals.
In February, the U.S. equity markets marked the first significant decline since late 2015 with a sharp correction, accompanied by a spike in volatility, which appeared to be the result of investor concern about inflation and global trade. President Trump imposed tariffs on steel and aluminum and announced plans to place additional tariffs on billions of dollars of goods from China. The Federal Reserve raised interest rates in March, with wide speculation that there would be two to three more hikes over the year.
By midyear, U.S. equity markets had rebounded, boosted by the positive effects of tax cuts and greater capital expenditures. Nevertheless, we remained wary of the modest acceleration in inflation, gradually higher interest rates, and deceleration in housing affordability. Energy prices also rose, which was good news for producers but weighed on consumer sentiment. Fears of a global trade war mounted as President Trump threatened tariffs on European auto manufacturers and imposed additional levies on Chinese imports. As anticipated, the Fed increased rates again in June.
As of the date of this letter, the U.S. stock market officially recorded the longest bull market in history. More than 80% of domestic public companies reported that they had exceeded their most recent earnings forecasts. The Fed presented an upbeat assessment of the economy, downplaying the effects of trade tensions and raising interest rates for the third time this year, in September.
During the 12-month period, security selection detracted from relative performance in our portion of the fund, driven by weaker selection in financials, energy, and consumer staples. An underweight to the strongly performing information technology sector also weighed on performance, as did a small frictional cash position. From an individual-stock perspective, our decision not to own benchmark constituent Boeing hurt most, along with our positions in consumer staples companies Philip Morris International and British American Tobacco.
Sector allocation, a result of our bottom-up stock selection process, contributed to relative performance during the period. An underweight to industrials and utilities was beneficial, as was security selection in industrials, information technology, and health care. Among individual stocks, our decision to sell out of General Electric benefited the portfolio because the stock declined more than 30%. Our stakes in Union Pacific and Procter & Gamble helped performance, as did our decision not to own benchmark constituent AT&T.
At the end of the period, our portion of the fund was most overweight health care, energy, and real estate. We
6
decreased our active overweight to financials during the 12 months, but remain narrowly overweight to the sector.
The reduction in financials was the result of individual stock decisions. Our position in Marsh & McLennan performed well, and we trimmed into strength. We also eliminated our position in Thomson Reuters after the company announced plans to sell a majority stake in its Financial & Risk business, which marked a change in strategy that was not aligned with our investment thesis.
New purchases included Comcast, Crown Castle International, Lockheed Martin, American International Group, and Koninklijke Philips. As mentioned in previous shareholder letters, we bought Comcast on short-term price weakness related to the company’s bid for Sky, the U.K.-based media and telecommunications company. We purchased Lockheed Martin in mid-2018 because we are optimistic about the outlook for defense companies. We sold out of our holding in competitor Raytheon and moved the proceeds to Lockheed Martin, which we think offers more upside and a better dividend yield.
Other sales from our portion of the fund included Microsoft, VF, Abbott Laboratories, and Diageo. We sold Microsoft and VF into strength and eliminated Abbott Laboratories and Diageo as the stock prices fell outside the range set by our valuation discipline.
As always, we remain focused on finding investment opportunities in quality dividend-paying companies with attractive total-return potential at discounted valuations.
Vanguard Quantitative Equity Group
Portfolio Managers: James P. Stetler
Binbin Guo, Principal, Head of Alpha Equity Investments
Investment environment
U.S. gross domestic product (GDP) grew at an annual rate of 4.2% in the second quarter of 2018, powered by a rebound in consumer spending, exports, and business investment. The unemployment rate declined to 3.7% in September, and total nonfarm payroll employment increased by 134,000. Jobs increased in professional and business services, health care, and transportation and warehousing.
In its September meeting, the Federal Reserve increased interest rates by 25 basis points to a target range of 2%–2.25%. The Fed projects one more hike before the end of the year and three in 2019. The European Central Bank (ECB) announced plans to end bond purchases at the end of the year and keep interest rates at record-low levels at least through next summer. The ECB also confirmed it would halve bond purchases to $17.4 billion per month from October.
7
Over the period, the broad U.S. equity market, as measured by the Russell 3000 Index, returned more than 17%. U.S. stock market performance was broad-based; ten of 11 market sectors advanced, led by information technology, health care, and consumer discretionary. Growth stocks outperformed their value counterparts. Small- and large-capitalization stocks generated similar returns. U.S. stocks outpaced their international brethren. Developed Pacific markets surpassed developed European and emerging markets.
Investment objective and strategy
Although it’s important to understand how overall performance is affected by the macroeconomic factors we’ve described, our strategy focuses on company-specific fundamentals—not technical analysis.
Our stock selection model evaluates companies within our investment universe to identify those with attractive characteristics that we believe will outperform over the long run.
To do this, we use a strict quantitative process that focuses on a combination of five key themes: high quality—healthy balance sheets and consistent cash-flow generation; effective use of capital—management decisions; consistent earnings growth—a demonstrated ability to grow earnings year after year; strong market sentiment—market confirmation of our view; and reasonable valuation—avoidance of overpriced stocks.
The interaction of these themes generates an opinion on all the stocks in our universe each day. Using the results of our model, we then construct our portfolio with the goal of maximizing expected return while minimizing exposure to risks that our research indicates do not improve returns, such as industry selection and other risks relative to our benchmark.
Our successes and shortfalls
The growth and valuation signals contributed most to the portfolio’s performance. The quality and management decisions signals contributed to a lesser degree, while our sentiment signal detracted.
Results exceeded the benchmark in eight of 11 sectors and were strongest in industrials, energy, and consumer staples. Information technology, telecommunication services, and real estate were the weakest relative performers.
The portfolio benefited from Delek US Holdings, ConocoPhillips, and Valero Energy in energy; Ralph Lauren in consumer discretionary; and an underweighted allocation to General Electric in industrials. The greatest shortfalls were from Copa Holdings in industrials and PG&E in utilities, and from underweighted allocations to Intel and Cisco Systems in information technology.
8
Equity Income Fund
Fund Profile
As of September 30, 2018
| Share-Class Characteristics | ||
| Investor | Admiral | |
| Shares | Shares | |
| Ticker Symbol | VEIPX | VEIRX |
| Expense Ratio1 | 0.26% | 0.17% |
| 30-Day SEC Yield | 2.87% | 2.96% |
| Portfolio Characteristics | ||||
| FTSE High | DJ | |||
| Dividend | U.S. Total | |||
| Yield | Market | |||
| Fund | Index | FA Index | ||
| Number of Stocks | 190 | 399 | 3,825 | |
| Median Market Cap | $111.9B | $105.8B | $73.9B | |
| Price/Earnings Ratio | 16.6x | 16.8x | 21.0x | |
| Price/Book Ratio | 2.6x | 2.5x | 3.1x | |
| Return on Equity | 15.3% | 15.4% | 14.9% | |
| Earnings Growth | ||||
| Rate | 2.5% | 3.4% | 8.5% | |
| Dividend Yield | 2.9% | 3.1% | 1.7% | |
| Foreign Holdings | 9.1% | 0.0% | 0.0% | |
| Turnover Rate | 37% | — | — | |
| Short-Term | ||||
| Reserves | 1.1% | — | — | |
| Volatility Measures | ||
| FTSE High | DJ | |
| Dividend | U.S. Total | |
| Yield | Market | |
| Index | FA Index | |
| R-Squared | 0.99 | 0.88 |
| Beta | 0.98 | 0.86 |
These measures show the degree and timing of the fund’s fluctuations compared with the indexes over 36 months.
| Sector Diversification (% of equity exposure) | |
| Fund | |
| Consumer Discretionary | 5.7% |
| Consumer Staples | 12.7 |
| Energy | 11.3 |
| Financials | 16.0 |
| Health Care | 16.1 |
| Industrials | 11.1 |
| Information Technology | 10.2 |
| Materials | 4.1 |
| Real Estate | 0.9 |
| Telecommunication Services | 4.1 |
| Utilities | 7.8 |
Sector categories are based on the Global Industry Classification Standard (“GICS”), except for the “Other” category (if applicable), which includes securities that have not been provided a GICS classification as of the effective reporting period.
| Ten Largest Holdings (% of total net assets) | ||
| JPMorgan Chase & Co. | Diversified Banks | 4.2% |
| Johnson & Johnson | Pharmaceuticals | 3.3 |
| Verizon Communications Integrated | ||
| Inc. | Telecommunication | |
| Services | 2.8 | |
| Chevron Corp. | Integrated Oil & Gas | 2.5 |
| Cisco Systems Inc. | Communications | |
| Equipment | 2.5 | |
| Intel Corp. | Semiconductors | 2.3 |
| Pfizer Inc. | Pharmaceuticals | 2.3 |
| Exxon Mobil Corp. | Integrated Oil & Gas | 2.1 |
| Eli Lilly & Co. | Pharmaceuticals | 2.0 |
| Merck & Co. Inc. | Pharmaceuticals | 1.9 |
| Top Ten | 25.9% | |
The holdings listed exclude any temporary cash investments and equity index products.
1 The expense ratios shown are from the prospectus dated January 25, 2018, and represent estimated costs for the current fiscal year. For the fiscal year ended September 30, 2018, the expense ratios were 0.27% for Investor Shares and 0.18% for Admiral Shares.
9
Equity Income Fund
Investment Focus

10
Equity Income Fund
Performance Summary
All of the returns in this report represent past performance, which is not a guarantee of future results that may be achieved by the fund. (Current performance may be lower or higher than the performance data cited. For performance data current to the most recent month-end, visit our website at vanguard.com/performance.) Note, too, that both investment returns and principal value can fluctuate widely, so an investor’s shares, when sold, could be worth more or less than their original cost. The returns shown do not reflect taxes that a shareholder would pay on fund distributions or on the sale of fund shares.
Cumulative Performance: September 30, 2008, Through September 30, 2018
Initial Investment of $10,000
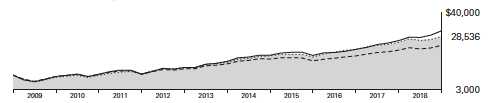
| Average Annual Total Returns | ||||
| Periods Ended September 30, 2018 | ||||
| Final Value | ||||
| One | Five | Ten | of a $10,000 | |
| Year | Years | Years | Investment | |
| Equity Income Fund*Investor Shares | 10.58% | 11.54% | 11.06% | $28,536 |
| FTSE High Dividend Yield Index | 10.75 | 12.12 | 11.06 | 28,556 |
| Equity Income Funds Average | 10.41 | 9.51 | 9.25 | 24,225 |
| Dow Jones U.S. Total Stock Market | ||||
| Float Adjusted Index | 17.58 | 13.42 | 12.05 | 31,191 |
Equity Income Funds Average: Derived from data provided by Lipper, a Thomson Reuters Company.
| Final Value | ||||
| One | Five | Ten | of a $50,000 | |
| Year | Years | Years | Investment | |
| Equity Income Fund Admiral Shares | 10.70% | 11.64% | 11.16% | $144,001 |
| FTSE High Dividend Yield Index | 10.75 | 12.12 | 11.06 | 142,782 |
| Dow Jones U.S. Total Stock Market Float | ||||
| Adjusted Index | 17.58 | 13.42 | 12.05 | 155,955 |
See Financial Highlights for dividend and capital gains information.
11
Equity Income Fund
Fiscal-Year Total Returns (%): September 30, 2008, Through September 30, 2018

12
Equity Income Fund
Financial Statements
Statement of Net Assets
As of September 30, 2018
The fund reports a complete list of its holdings in regulatory filings four times in each fiscal year, at the quarter-ends. For the second and fourth fiscal quarters, the lists appear in the fund’s semiannual and annual reports to shareholders. For the first and third fiscal quarters, the fund files the lists with the Securities and Exchange Commission on Form N-Q. Shareholders can look up the fund’s Forms N-Q on the SEC’s website at sec.gov. Forms N-Q may also be reviewed and copied at the SEC’s Public Reference Room (see the back cover of this report for further information).
| Market | ||
| Value• | ||
| Shares | ($000) | |
| Common Stocks (97.5%)1 | ||
| Consumer Discretionary (5.4%) | ||
| Comcast Corp. Class A | 15,831,776 | 560,603 |
| McDonald’s Corp. | 1,583,617 | 264,923 |
| Home Depot Inc. | 1,003,147 | 207,802 |
| General Motors Co. | 2,832,318 | 95,364 |
| Cie Generale des | ||
| Etablissements | ||
| Michelin SCA | 755,098 | 90,126 |
| Macy’s Inc. | 1,925,166 | 66,861 |
| Omnicom Group Inc. | 945,706 | 64,327 |
| Las Vegas Sands Corp. | 958,658 | 56,877 |
| Tailored Brands Inc. | 2,237,606 | 56,365 |
| Ralph Lauren Corp. | ||
| Class A | 380,281 | 52,308 |
| Polaris Industries Inc. | 409,467 | 41,336 |
| Abercrombie & Fitch Co. | 1,486,549 | 31,396 |
| H&R Block Inc. | 1,102,441 | 28,388 |
| International Game | ||
| Technology plc | 1,316,121 | 25,993 |
| Darden Restaurants Inc. | 213,942 | 23,788 |
| Viacom Inc. Class B | 679,438 | 22,938 |
| Kohl’s Corp. | 296,436 | 22,099 |
| VF Corp. | 211,015 | 19,719 |
| Dine Brands Global Inc. | 224,135 | 18,224 |
| Sinclair Broadcast | ||
| Group Inc. Class A | 583,409 | 16,540 |
| TEGNA Inc. | 1,226,160 | 14,665 |
| MDC Holdings Inc. | 422,829 | 12,507 |
| Tribune Media Co. | ||
| Class A | 244,874 | 9,411 |
| Six Flags Entertainment | ||
| Corp. | 100,052 | 6,986 |
| Best Buy Co. Inc. | 73,508 | 5,834 |
| 1,815,380 | ||
| Consumer Staples (12.4%) | ||
| Philip Morris | ||
| International Inc. | 7,417,497 | 604,823 |
| Market | |||
| Value• | |||
| Shares | ($000) | ||
| PepsiCo Inc. | 4,280,154 | 478,521 | |
| Coca-Cola Co. | 10,006,943 | 462,221 | |
| Procter & Gamble Co. | 4,977,891 | 414,310 | |
| Unilever NV | 7,083,378 | 393,482 | |
| Sysco Corp. | 3,946,490 | 289,080 | |
| Walmart Inc. | 2,647,479 | 248,625 | |
| Mondelez International | |||
| Inc. Class A | 4,983,922 | 214,109 | |
| Kraft Heinz Co. | 3,619,174 | 199,453 | |
| Nestle SA | 2,020,957 | 168,218 | |
| British American | |||
| Tobacco plc | 3,471,639 | 161,850 | |
| Kellogg Co. | 1,147,294 | 80,334 | |
| Clorox Co. | 471,818 | 70,966 | |
| Altria Group Inc. | 1,121,057 | 67,611 | |
| Conagra Brands Inc. | 1,973,344 | 67,034 | |
| Nu Skin Enterprises | |||
| Inc. Class A | 807,540 | 66,557 | |
| JM Smucker Co. | 404,570 | 41,513 | |
| Archer-Daniels-Midland | |||
| Co. | 767,057 | 38,560 | |
| Flowers Foods Inc. | 1,584,342 | 29,564 | |
| Colgate-Palmolive Co. | 264,110 | 17,682 | |
| Coca-Cola European | |||
| Partners plc | 368,108 | 16,738 | |
| Walgreens Boots | |||
| Alliance Inc. | 128,381 | 9,359 | |
| Pinnacle Foods Inc. | 129,347 | 8,383 | |
| 4,148,993 | |||
| Energy (11.1%) | |||
| Chevron Corp. | 6,889,443 | 842,441 | |
| Exxon Mobil Corp. | 8,145,857 | 692,561 | |
| Suncor Energy Inc. | 13,702,843 | 530,163 | |
| Occidental Petroleum | |||
| Corp. | 3,930,964 | 323,007 | |
| Canadian Natural | |||
| Resources Ltd. | 7,115,488 | 232,392 | |
| ^ | TransCanada Corp. | 5,712,067 | 231,110 |
13
| Equity Income Fund | ||
| Market | ||
| Value• | ||
| Shares | ($000) | |
| Schlumberger Ltd. | 3,604,225 | 219,569 |
| Kinder Morgan Inc. | 11,216,435 | 198,867 |
| Phillips 66 | 1,204,436 | 135,764 |
| ConocoPhillips | 1,098,210 | 85,002 |
| HollyFrontier Corp. | 994,695 | 69,529 |
| Valero Energy Corp. | 529,168 | 60,193 |
| Murphy Oil Corp. | 1,099,018 | 36,641 |
| Delek US Holdings Inc. | 394,928 | 16,757 |
| Cosan Ltd. | 2,134,313 | 14,364 |
| PBF Energy Inc. Class A | 214,925 | 10,727 |
| Archrock Inc. | 333,945 | 4,074 |
| 3,703,161 | ||
| Financials (15.6%) | ||
| JPMorgan Chase & Co. | 12,406,733 | 1,399,976 |
| Wells Fargo & Co. | 11,833,873 | 621,988 |
| MetLife Inc. | 9,741,528 | 455,124 |
| PNC Financial Services | ||
| Group Inc. | 2,165,716 | 294,949 |
| Marsh & McLennan | ||
| Cos. Inc. | 3,475,921 | 287,528 |
| Chubb Ltd. | 1,815,502 | 242,624 |
| M&T Bank Corp. | 1,300,230 | 213,940 |
| American International | ||
| Group Inc. | 3,458,211 | 184,115 |
| US Bancorp | 3,145,936 | 166,137 |
| Travelers Cos. Inc. | 1,224,734 | 158,860 |
| Principal Financial | ||
| Group Inc. | 2,130,950 | 124,852 |
| Aflac Inc. | 2,143,034 | 100,873 |
| BlackRock Inc. | 203,349 | 95,845 |
| SunTrust Banks Inc. | 1,289,765 | 86,143 |
| Ameriprise Financial Inc. | 569,857 | 84,145 |
| BB&T Corp. | 1,713,944 | 83,195 |
| T. Rowe Price Group Inc. | 754,628 | 82,390 |
| Regions Financial Corp. | 4,329,478 | 79,446 |
| Fifth Third Bancorp | 2,718,019 | 75,887 |
| Prudential Financial Inc. | 688,127 | 69,721 |
| LPL Financial Holdings | ||
| Inc. | 974,244 | 62,849 |
| Citizens Financial | ||
| Group Inc. | 1,411,377 | 54,437 |
| Fidelity National | ||
| Financial Inc. | 1,239,092 | 48,758 |
| KeyCorp | 2,280,995 | 45,369 |
| First American Financial | ||
| Corp. | 799,107 | 41,226 |
| BankUnited Inc. | 398,739 | 14,115 |
| Unum Group | 311,710 | 12,179 |
| CME Group Inc. | 47,808 | 8,137 |
| Arthur J Gallagher & Co. | 81,846 | 6,093 |
| 5,200,901 | ||
| Health Care (15.7%) | ||
| Johnson & Johnson | 7,907,684 | 1,092,605 |
| Pfizer Inc. | 17,140,188 | 755,368 |
| Eli Lilly & Co. | 6,233,973 | 668,968 |
| Merck & Co. Inc. | 9,143,052 | 648,608 |
| Bristol-Myers Squibb | ||
| Co. | 7,100,298 | 440,786 |
| Medtronic plc | 4,063,922 | 399,768 |
| Novartis AG | 2,799,947 | 241,015 |
| Koninklijke Philips NV | 5,158,308 | 235,126 |
| AbbVie Inc. | 2,338,583 | 221,183 |
| Amgen Inc. | 972,399 | 201,569 |
| Roche Holding AG | 733,482 | 177,367 |
| CVS Health Corp. | 1,165,984 | 91,786 |
| Gilead Sciences Inc. | 781,077 | 60,307 |
| 5,234,456 | ||
| Industrials (10.8%) | ||
| Caterpillar Inc. | 3,008,423 | 458,754 |
| Lockheed Martin Corp. | 1,232,430 | 426,372 |
| Union Pacific Corp. | 2,365,700 | 385,207 |
| 3M Co. | 1,512,229 | 318,642 |
| Eaton Corp. plc | 3,537,758 | 306,830 |
| Boeing Co. | 777,705 | 289,229 |
| Honeywell International | ||
| Inc. | 1,636,331 | 272,285 |
| Deere & Co. | 1,418,368 | 213,223 |
| BAE Systems plc | 24,028,420 | 197,033 |
| United Technologies | ||
| Corp. | 934,158 | 130,605 |
| Raytheon Co. | 362,919 | 75,001 |
| Norfolk Southern Corp. | 341,346 | 61,613 |
| PACCAR Inc. | 851,753 | 58,081 |
| CH Robinson | ||
| Worldwide Inc. | 583,504 | 57,137 |
| Waste Management | ||
| Inc. | 622,004 | 56,204 |
| General Electric Co. | 4,906,706 | 55,397 |
| GATX Corp. | 581,158 | 50,322 |
| Greenbrier Cos. Inc. | 823,626 | 49,500 |
| Delta Air Lines Inc. | 697,846 | 40,356 |
| KAR Auction Services | ||
| Inc. | 510,853 | 30,493 |
| United Parcel Service | ||
| Inc. Class B | 229,879 | 26,838 |
| Emerson Electric Co. | 283,136 | 21,683 |
| Copa Holdings SA | ||
| Class A | 212,281 | 16,949 |
| Fastenal Co. | 179,572 | 10,419 |
| Ryder System Inc. | 72,854 | 5,323 |
| 3,613,496 | ||
| Information Technology (9.8%) | ||
| Cisco Systems Inc. | 17,173,676 | 835,500 |
| Intel Corp. | 16,049,317 | 758,972 |
| Analog Devices Inc. | 3,918,062 | 362,264 |
| QUALCOMM Inc. | 3,662,852 | 263,835 |
| Maxim Integrated | ||
| Products Inc. | 3,125,676 | 176,257 |
14
| Equity Income Fund | |||
| Market | |||
| Value• | |||
| Shares | ($000) | ||
| Texas Instruments Inc. | 1,607,062 | 172,422 | |
| HP Inc. | 4,344,620 | 111,961 | |
| International Business | |||
| Machines Corp. | 596,336 | 90,172 | |
| Broadcom Inc. | 364,091 | 89,832 | |
| Microsoft Corp. | 711,797 | 81,408 | |
| Seagate Technology plc | 1,460,738 | 69,166 | |
| KLA-Tencor Corp. | 508,250 | 51,694 | |
| Cypress Semiconductor | |||
| Corp. | 3,524,851 | 51,075 | |
| Western Union Co. | 2,596,337 | 49,486 | |
| Science Applications | |||
| International Corp. | 522,929 | 42,148 | |
| Western Digital Corp. | 670,088 | 39,227 | |
| Hewlett Packard | |||
| Enterprise Co. | 364,930 | 5,952 | |
| Automatic Data | |||
| Processing Inc. | 37,163 | 5,599 | |
| 3,256,970 | |||
| Materials (4.0%) | |||
| DowDuPont Inc. | 8,599,716 | 553,048 | |
| ^ | Nutrien Ltd. | 3,548,746 | 204,763 |
| LyondellBasell | |||
| Industries NV Class A | 1,808,436 | 185,383 | |
| International Paper Co. | 3,352,432 | 164,772 | |
| CF Industries Holdings | |||
| Inc. | 1,089,403 | 59,307 | |
| Nucor Corp. | 920,680 | 58,417 | |
| Huntsman Corp. | 2,005,344 | 54,605 | |
| Greif Inc. Class A | 526,873 | 28,272 | |
| Domtar Corp. | 269,641 | 14,067 | |
| Avery Dennison Corp. | 127,492 | 13,814 | |
| Praxair Inc. | 54,175 | 8,707 | |
| 1,345,155 | |||
| Other (0.3%) | |||
| ^,2 | Vanguard High Dividend | ||
| Yield ETF | 1,047,950 | 91,266 | |
| Real Estate (0.9%) | |||
| Crown Castle | |||
| International Corp. | 2,647,927 | 294,794 | |
| Telecommunication Services (3.9%) | |||
| Verizon | |||
| Communications Inc. | 17,268,003 | 921,939 | |
| AT&T Inc. | 6,788,670 | 227,963 | |
| BCE Inc. | 4,019,346 | 162,840 | |
| 1,312,742 | |||
| Utilities (7.6%) | |||
| NextEra Energy Inc. | 2,453,454 | 411,199 | |
| Dominion Energy Inc. | 3,832,974 | 269,381 | |
| Exelon Corp. | 5,630,467 | 245,826 | |
| Sempra Energy | 1,958,143 | 222,739 | |
| American Electric Power | ||
| Co. Inc. | 2,971,646 | 210,630 |
| Eversource Energy | 3,178,453 | 195,284 |
| Duke Energy Corp. | 2,027,787 | 162,263 |
| Xcel Energy Inc. | 3,233,339 | 152,646 |
| Public Service | ||
| Enterprise Group Inc. | 1,650,323 | 87,121 |
| FirstEnergy Corp. | 2,292,533 | 85,213 |
| Entergy Corp. | 923,105 | 74,891 |
| Edison International | 1,089,718 | 73,752 |
| AES Corp. | 3,906,297 | 54,688 |
| MDU Resources Group | ||
| Inc. | 1,792,162 | 46,041 |
| PNM Resources Inc. | 1,035,714 | 40,859 |
| NRG Energy Inc. | 951,263 | 35,577 |
| National Fuel Gas Co. | 622,568 | 34,901 |
| CenterPoint Energy Inc. | 1,202,011 | 33,236 |
| Ameren Corp. | 459,120 | 29,026 |
| Atmos Energy Corp. | 220,293 | 20,688 |
| IDACORP Inc. | 180,819 | 17,943 |
| DTE Energy Co. | 112,739 | 12,303 |
| CMS Energy Corp. | 214,449 | 10,508 |
| WEC Energy Group Inc. | 83,742 | 5,591 |
| 2,532,306 | ||
| Total Common Stocks | ||
| (Cost $25,037,931) | 32,549,620 | |
| Temporary Cash Investments (2.8%)1 | ||
| Money Market Fund (1.5%) | ||
| 3,4 Vanguard Market | ||
| Liquidity Fund, | ||
| 2.209% | 5,072,792 | 507,279 |
| Face | ||
| Amount | ||
| ($000) | ||
| Repurchase Agreements (1.2%) | ||
| Goldman Sachs & Co. | ||
| 2.210%, 10/1/18 | ||
| (Dated 9/28/18, | ||
| Repurchase Value | ||
| $67,712,000, | ||
| collateralized by | ||
| Federal Home Loan | ||
| Mortgage Corp. | ||
| 3.000%–7.000%, | ||
| 11/1/29–10/1/48, | ||
| and Federal National | ||
| Mortgage Assn. | ||
| 3.500%–8.000%, | ||
| 2/1/24–11/1/48, with a | ||
| value of $69,054,000) | 67,700 | 67,700 |
15
| Equity Income Fund | |||
| Face | Market | ||
| Amount | Value • | ||
| ($000) | ($000) | ||
| Nomura International plc | |||
| 2.250%, 10/1/18 | |||
| (Dated 9/28/18, | |||
| Repurchase Value | |||
| $56,611,000, | |||
| collateralized by U. S. | |||
| Treasury Note/Bond | |||
| 1.375%–2.750%, | |||
| 4/30/20–8/15/27, with | |||
| a value of $57,732,000) | 56,600 | 56,600 | |
| RBS Securities, Inc. | |||
| 2.240%, 10/1/18 | |||
| (Dated 9/28/18, | |||
| Repurchase Value | |||
| $151,828,000, | |||
| collateralized by U. S. | |||
| Treasury Note/Bond | |||
| 1.625%, 5/15/26, with a | |||
| value of $154,836,000) | 151,800 | 151,800 | |
| Societe Generale | |||
| 2.220%, 10/1/18 | |||
| (Dated 9/28/18, | |||
| Repurchase Value | |||
| $111,421,000, | |||
| collateralized by | |||
| Government National | |||
| Mortgage Assn. | |||
| 3.500%–7.000%, | |||
| 6/20/26–7/20/46, U. S. | |||
| Treasury Bill 0.000%, | |||
| 1/10/19–9/12/19, and | |||
| U.S. Treasury Note/ | |||
| Bond 1.375%–7.125%, | |||
| 9/30/19–2/15/42, with a | |||
| value of $113,628,000) | 111,400 | 111,400 | |
| 387,500 | |||
| U. S. Government and Agency Obligations (0.1%) | |||
| 5 | United States Treasury | ||
| Bill, 1.928%, 10/4/18 | 10,000 | 9,998 | |
| United States Treasury | |||
| Bill, 1.962%, 10/11/18 | 300 | 300 | |
| 5 | United States Treasury | ||
| Bill, 1.982%–1.995%, | |||
| 10/18/18 | 11,850 | 11,838 | |
| 5 | United States Treasury | ||
| Bill, 2.078%, 11/15/18 | 300 | 299 | |
| United States Treasury | |||
| Bill, 2.099%, 12/27/18 | 77 | 77 | |
| 5 | United States Treasury | ||
| Bill, 2.132%–2.133%, | |||
| 1/3/19 | 3,800 | 3,778 | |
| Face | Market | |
| Amount | Value • | |
| ($000) | ($000) | |
| 5 United States Treasury | ||
| Bill, 2.280%–2.294%, | ||
| 2/21/19 | 10,500 | 10,405 |
| United States Treasury | ||
| Bill, 2.314%, 2/28/19 | 2,000 | 1,981 |
| 38,676 | ||
| Total Temporary Cash Investments | ||
| (Cost $933,433) | 933,455 | |
| Total Investments (100.3%) | ||
| (Cost $25,971,364) | 33,483,075 | |
| Amount | ||
| ($000) | ||
| Other Assets and Liabilities (-0.3%) | ||
| Other Assets | ||
| Investment in Vanguard | 1,692 | |
| Receivables for Investment Securities Sold 14,451 | ||
| Receivables for Accrued Income | 56,842 | |
| Receivables for Capital Shares Issued | 47,335 | |
| Other Assets | 3,776 | |
| Total Other Assets | 124,096 | |
| Liabilities | ||
| Payables for Investment Securities | ||
| Purchased | (42,781) | |
| Collateral for Securities on Loan | (143,154) | |
| Payables to Investment Advisor | (6,020) | |
| Payables for Capital Shares Redeemed | (23,352) | |
| Payables to Vanguard | (16,134) | |
| Variation Margin Payable— | ||
| Futures Contracts | (128) | |
| Total Liabilities | (231,569) | |
| Net Assets (100%) | 33,375,602 | |
| At September 30, 2018, net assets consisted of: | |
| Amount | |
| ($000) | |
| Paid-in Capital | 23,676,141 |
| Undistributed Net Investment Income | 21,152 |
| Accumulated Net Realized Gains | 2,165,471 |
| Unrealized Appreciation (Depreciation) | |
| Investment Securities | 7,511,711 |
| Futures Contracts | 1,064 |
| Foreign Currencies | 63 |
| Net Assets | 33,375,602 |
16
| Equity Income Fund | |
| Amount | |
| ($000) | |
| Investor Shares—Net Assets | |
| Applicable to 151,410,429 outstanding | |
| $.001 par value shares of beneficial | |
| interest (unlimited authorization) | 5,750,823 |
| Net Asset Value Per Share— | |
| Investor Shares | $37.98 |
| Admiral Shares—Net Assets | |
| Applicable to 347,020,325 outstanding | |
| $.001 par value shares of beneficial | |
| interest (unlimited authorization) | 27,624,779 |
| Net Asset Value Per Share— | |
| Admiral Shares | $79.61 |
• See Note A in Notes to Financial Statements.
^ Includes partial security positions on loan to broker-dealers.
The total value of securities on loan is $136,417,000.
1 The fund invests a portion of its cash reserves in equity
markets through the use of index futures contracts. After
giving effect to futures investments, the fund’s effective
common stock and temporary cash investment positions
represent 98.8% and 1.5%, respectively, of net assets.
2 Considered an affiliated company of the fund as the issuer is
another member of The Vanguard Group.
3 Affiliated money market fund available only to Vanguard funds
and certain trusts and accounts managed by Vanguard. Rate
shown is the 7-day yield.
4 Includes $143,154,000 of collateral received for securities
on loan.
5 Securities with a value of $17,529,000 have been segregated
as initial margin for open futures contracts.
| Derivative Financial Instruments Outstanding as of Period End | ||||
| Futures Contracts | ||||
| ($000) | ||||
| Value and | ||||
| Number of | Unrealized | |||
| Long (Short) | Notional | Appreciation | ||
| Expiration | Contracts | Amount | (Depreciation) | |
| Long Futures Contracts | ||||
| E-mini S&P 500 Index | December 2018 | 2,928 | 427,342 | 1,064 |
See accompanying Notes, which are an integral part of the Financial Statements.
17
| Equity Income Fund | |
| Statement of Operations | |
| Year Ended | |
| September 30, 2018 | |
| ($000) | |
| Investment Income | |
| Income | |
| Dividends—Unaffiliated Issuers1 | 888,776 |
| Dividends—Affiliated Issuers | 2,676 |
| Interest—Unaffiliated Issuers | 6,573 |
| Interest—Affiliated Issuers | 8,088 |
| Securities Lending—Net | 1,389 |
| Total Income | 907,502 |
| Expenses | |
| Investment Advisory Fees—Note B | |
| Basic Fee | 25,517 |
| Performance Adjustment | (37) |
| The Vanguard Group—Note C | |
| Management and Administrative—Investor Shares | 9,640 |
| Management and Administrative—Admiral Shares | 21,601 |
| Marketing and Distribution—Investor Shares | 1,039 |
| Marketing and Distribution—Admiral Shares | 1,885 |
| Custodian Fees | 277 |
| Auditing Fees | 26 |
| Shareholders’ Reports and Proxy—Investor Shares | 162 |
| Shareholders’ Reports and Proxy—Admiral Shares | 399 |
| Trustees’ Fees and Expenses | 43 |
| Total Expenses | 60,552 |
| Net Investment Income | 846,950 |
| Realized Net Gain (Loss) | |
| Investment Securities Sold—Unaffiliated Issuers | 2,310,803 |
| Investment Securities Sold—Affiliated Issuers | (60) |
| Futures Contracts | 76,557 |
| Foreign Currencies | (462) |
| Realized Net Gain (Loss) | 2,386,838 |
| Change in Unrealized Appreciation (Depreciation) | |
| Investment Securities—Unaffiliated Issuers | (49,652) |
| Investment Securities—Affiliated Issuers | 6,282 |
| Futures Contracts | (4,544) |
| Foreign Currencies | 85 |
| Change in Unrealized Appreciation (Depreciation) | (47,829) |
| Net Increase (Decrease) in Net Assets Resulting from Operations | 3,185,959 |
| 1 Dividends are net of foreign withholding taxes of $11,914,000. | |
| See accompanying Notes, which are an integral part of the Financial Statements. | |
18
| Equity Income Fund | ||
| Statement of Changes in Net Assets | ||
| Year Ended September 30, | ||
| 2018 | 2017 | |
| ($000) | ($000) | |
| Increase (Decrease) in Net Assets | ||
| Operations | ||
| Net Investment Income | 846,950 | 741,584 |
| Realized Net Gain (Loss) | 2,386,838 | 376,595 |
| Change in Unrealized Appreciation (Depreciation) | (47,829) | 3,006,882 |
| Net Increase (Decrease) in Net Assets Resulting from Operations | 3,185,959 | 4,125,061 |
| Distributions | ||
| Net Investment Income | ||
| Investor Shares | (148,454) | (158,563) |
| Admiral Shares | (679,886) | (590,086) |
| Realized Capital Gain1 | ||
| Investor Shares | (71,934) | (59,063) |
| Admiral Shares | (298,582) | (197,566) |
| Total Distributions | (1,198,856) | (1,005,278) |
| Capital Share Transactions | ||
| Investor Shares | (625,682) | (168,911) |
| Admiral Shares | 2,638,920 | 2,822,122 |
| Net Increase (Decrease) from Capital Share Transactions | 2,013,238 | 2,653,211 |
| Total Increase (Decrease) | 4,000,341 | 5,772,994 |
| Net Assets | ||
| Beginning of Period | 29,375,261 | 23,602,267 |
| End of Period2 | 33,375,602 | 29,375,261 |
1 Includes fiscal 2018 and 2017 short-term gain distributions totaling $78,981,000 and $0, respectively. Short-term gain distributions
are treated as ordinary income dividends for tax purposes.
2 Net Assets—End of Period includes undistributed (overdistributed) net investment income of $21,152,000 and $3,004,000.
See accompanying Notes, which are an integral part of the Financial Statements.
19
| Equity Income Fund | |||||
| Financial Highlights | |||||
| Investor Shares | |||||
| For a Share Outstanding | Year Ended September 30, | ||||
| Throughout Each Period | 2018 | 2017 | 2016 | 2015 | 2014 |
| Net Asset Value, Beginning of Period | $35.64 | $31.69 | $28.78 | $31.23 | $28.26 |
| Investment Operations | |||||
| Net Investment Income | . 9651 | .9081 | .909 | .847 | .826 |
| Net Realized and Unrealized Gain (Loss) | |||||
| on Investments | 2.764 | 4.292 | 3.912 | (1.431) | 3.754 |
| Total from Investment Operations | 3.729 | 5.200 | 4.821 | (.584) | 4.580 |
| Distributions | |||||
| Dividends from Net Investment Income | (. 943) | (. 912) | (. 895) | (. 852) | (. 811) |
| Distributions from Realized Capital Gains | (.446) | (.338) | (1.016) | (1.014) | (.799) |
| Total Distributions | (1.389) | (1.250) | (1.911) | (1.866) | (1.610) |
| Net Asset Value, End of Period | $37.98 | $35.64 | $31.69 | $28.78 | $31.23 |
| Total Return2 | 10.58% | 16.68% | 17.21% | -2.11% | 16.62% |
| Ratios/Supplemental Data | |||||
| Net Assets, End of Period (Millions) | $5,751 | $6,002 | $5,487 | $4,812 | $5,528 |
| Ratio of Total Expenses to Average Net Assets3 | 0.27% | 0.26% | 0.26% | 0.26% | 0.29% |
| Ratio of Net Investment Income to | |||||
| Average Net Assets | 2.60% | 2.70% | 3.00% | 2.72% | 2.74% |
| Portfolio Turnover Rate | 37% | 28% | 26% | 32% | 33% |
1 Calculated based on average shares outstanding.
2 Total returns do not include account service fees that may have applied in the periods shown. Fund prospectuses provide information
about any applicable account service fees.
3 Includes performance-based investment advisory fee increases (decreases) of (0.00%), (0.01%), (0.01%), (0.01%), and 0.00%.
See accompanying Notes, which are an integral part of the Financial Statements.
20
| Equity Income Fund | |||||
| Financial Highlights | |||||
| Admiral Shares | |||||
| For a Share Outstanding | Year Ended September 30, | ||||
| Throughout Each Period | 2018 | 2017 | 2016 | 2015 | 2014 |
| Net Asset Value, Beginning of Period | $74.69 | $66.43 | $60.31 | $65.45 | $59.24 |
| Investment Operations | |||||
| Net Investment Income | 2.0991 | 1.9681 | 1.963 | 1.834 | 1.790 |
| Net Realized and Unrealized Gain (Loss) | |||||
| on Investments | 5.806 | 8.977 | 8.219 | (3.003) | 7.853 |
| Total from Investment Operations | 7.905 | 10.945 | 10.182 | (1.169) | 9.643 |
| Distributions | |||||
| Dividends from Net Investment Income | (2.048) | (1.977) | (1.932) | (1.846) | (1.758) |
| Distributions from Realized Capital Gains | (.937) | (.708) | (2.130) | (2.125) | (1.675) |
| Total Distributions | (2.985) | (2.685) | (4.062) | (3.971) | (3.433) |
| Net Asset Value, End of Period | $79.61 | $74.69 | $66.43 | $60.31 | $65.45 |
| Total Return2 | 10.70% | 16.75% | 17.35% | -2.03% | 16.70% |
| Ratios/Supplemental Data | |||||
| Net Assets, End of Period (Millions) | $27,625 | $23,373 | $18,115 | $12,962 | $12,319 |
| Ratio of Total Expenses to Average Net Assets3 | 0.18% | 0.17% | 0.17% | 0.17% | 0.20% |
| Ratio of Net Investment Income to | |||||
| Average Net Assets | 2.69% | 2.79% | 3.09% | 2.81% | 2.83% |
| Portfolio Turnover Rate | 37% | 28% | 26% | 32% | 33% |
1 Calculated based on average shares outstanding.
2 Total returns do not include account service fees that may have applied in the periods shown. Fund prospectuses provide information
about any applicable account service fees.
3 Includes performance-based investment advisory fee increases (decreases) of (0.00%), (0.01%), (0.01%), (0.01%), and 0.00%.
See accompanying Notes, which are an integral part of the Financial Statements.
21
Equity Income Fund
Notes to Financial Statements
Vanguard Equity Income Fund is registered under the Investment Company Act of 1940 as an open-end investment company, or mutual fund. The fund offers two classes of shares: Investor Shares and Admiral Shares. Investor Shares are available to any investor who meets the fund’s minimum purchase requirements. Admiral Shares are designed for investors who meet certain administrative, service, and account-size criteria.
A. The following significant accounting policies conform to generally accepted accounting principles for U.S. investment companies. The fund consistently follows such policies in preparing its financial statements.
1. Security Valuation: Securities are valued as of the close of trading on the New York Stock Exchange (generally 4 p.m., Eastern time) on the valuation date. Equity securities are valued at the latest quoted sales prices or official closing prices taken from the primary market in which each security trades; such securities not traded on the valuation date are valued at the mean of the latest quoted bid and asked prices. Securities for which market quotations are not readily available, or whose values have been affected by events occurring before the fund’s pricing time but after the close of the securities’ primary markets, are valued at their fair values calculated according to procedures adopted by the board of trustees. These procedures include obtaining quotations from an independent pricing service, monitoring news to identify significant market- or security-specific events, and evaluating changes in the values of foreign market proxies (for example, ADRs, futures contracts, or exchange-traded funds), between the time the foreign markets close and the fund’s pricing time. When fair-value pricing is employed, the prices of securities used by a fund to calculate its net asset value may differ from quoted or published prices for the same securities. Investments in Vanguard Market Liquidity Fund are valued at that fund’s net asset value. Temporary cash investments are valued using the latest bid prices or using valuations based on a matrix system (which considers such factors as security prices, yields, maturities, and ratings), both as furnished by independent pricing services.
2. Foreign Currency: Securities and other assets and liabilities denominated in foreign currencies are translated into U.S. dollars using exchange rates obtained from an independent third party as of the fund’s pricing time on the valuation date. Realized gains (losses) and unrealized appreciation (depreciation) on investment securities include the effects of changes in exchange rates since the securities were purchased, combined with the effects of changes in security prices. Fluctuations in the value of other assets and liabilities resulting from changes in exchange rates are recorded as unrealized foreign currency gains (losses) until the assets or liabilities are settled in cash, at which time they are recorded as realized foreign currency gains (losses).
3. Futures Contracts: The fund uses index futures contracts to a limited extent, with the objective of maintaining full exposure to the stock market while maintaining liquidity. The fund may purchase or sell futures contracts to achieve a desired level of investment, whether to accommodate portfolio turnover or cash flows from capital share transactions. The primary risks associated with the use of futures contracts are imperfect correlation between changes in market values of stocks held by the fund and the prices of futures contracts, and the possibility of an illiquid market. Counterparty risk involving futures is mitigated because a regulated clearinghouse is the counterparty instead of the clearing broker. To further mitigate counterparty risk, the fund trades futures contracts on an exchange, monitors the financial strength of its clearing brokers and clearinghouse, and has entered into clearing agreements with its clearing brokers. The clearinghouse imposes initial
22
Equity Income Fund
margin requirements to secure the fund’s performance and requires daily settlement of variation margin representing changes in the market value of each contract. Any assets pledged as initial margin for open contracts are noted in the Statement of Net Assets.
Futures contracts are valued at their quoted daily settlement prices. The notional amounts of the contracts are not recorded in the Statement of Net Assets. Fluctuations in the value of the contracts are recorded in the Statement of Net Assets as an asset (liability) and in the Statement of Operations as unrealized appreciation (depreciation) until the contracts are closed, when they are recorded as realized futures gains (losses).
During the year ended September 30, 2018, the fund’s average investments in long and short futures contracts represented 1% and 0% of net assets, respectively, based on the average of the notional amounts at each quarter-end during the period.
4. Repurchase Agreements: The fund enters into repurchase agreements with institutional counterparties. Securities pledged as collateral to the fund under repurchase agreements are held by a custodian bank until the agreements mature, and in the absence of a default, such collateral cannot be repledged, resold, or rehypothecated. Each agreement requires that the market value of the collateral be sufficient to cover payments of interest and principal. The fund further mitigates its counterparty risk by entering into repurchase agreements only with a diverse group of prequalified counterparties, monitoring their financial strength, and entering into master repurchase agreements with its counterparties. The master repurchase agreements provide that, in the event of a counterparty’s default (including bankruptcy), the fund may terminate any repurchase agreements with that counterparty, determine the net amount owed, and sell or retain the collateral up to the net amount owed to the fund. Such action may be subject to legal proceedings, which may delay or limit the disposition of collateral.
5. Federal Income Taxes: The fund intends to continue to qualify as a regulated investment company and distribute all of its taxable income. Management has analyzed the fund’s tax positions taken for all open federal income tax years (September 30, 2015–2018), and has concluded that no provision for federal income tax is required in the fund’s financial statements.
6. Distributions: Distributions to shareholders are recorded on the ex-dividend date. Distributions are determined on a tax basis and may differ from net investment income and realized capital gains for financial reporting purposes.
7. Securities Lending: To earn additional income, the fund lends its securities to qualified institutional borrowers. Security loans are subject to termination by the fund at any time, and are required to be secured at all times by collateral in an amount at least equal to the market value of securities loaned. Daily market fluctuations could cause the value of loaned securities to be more or less than the value of the collateral received. When this occurs, the collateral is adjusted and settled before the opening of the market on the next business day. The fund further mitigates its counterparty risk by entering into securities lending transactions only with a diverse group of prequalified counterparties, monitoring their financial strength, and entering into master securities lending agreements with its counterparties. The master securities lending agreements provide that, in the event of a counterparty’s default (including bankruptcy), the fund may terminate any loans with that borrower, determine the net amount owed, and sell or retain the collateral up to the net amount owed to the fund; however, such actions may be subject to legal proceedings. While collateral mitigates counterparty risk, in the event of a default, the fund may experience delays and costs in recovering the securities loaned. The fund invests cash collateral received
23
Equity Income Fund
in Vanguard Market Liquidity Fund, and records a liability in the Statement of Net Assets for the return of the collateral, during the period the securities are on loan. Securities lending income represents fees charged to borrowers plus income earned on invested cash collateral, less expenses associated with the loan. During the term of the loan, the fund is entitled to all distributions made on or in respect of the loaned securities.
8. Credit Facility: The fund and certain other funds managed by The Vanguard Group (“Vanguard”) participate in a $3.1 billion committed credit facility provided by a syndicate of lenders pursuant to a credit agreement that may be renewed annually; each fund is individually liable for its borrowings, if any, under the credit facility. Borrowings may be utilized for temporary and emergency purposes, and are subject to the fund’s regulatory and contractual borrowing restrictions. The participating funds are charged administrative fees and an annual commitment fee of 0.10% of the undrawn amount of the facility; these fees are allocated to the funds based on a method approved by the fund’s board of trustees and included in Management and Administrative expenses on the fund’s Statement of Operations. Any borrowings under this facility bear interest at a rate based upon the higher of the one-month London Interbank Offered Rate, federal funds effective rate, or overnight bank funding rate plus an agreed-upon spread.
The fund had no borrowings outstanding at September 30, 2018, or at any time during the period then ended.
9. Other: Interest income includes income distributions received from Vanguard Market Liquidity Fund and is accrued daily. Premiums and discounts on debt securities purchased are amortized and accreted, respectively, to interest income over the lives of the respective securities. Security transactions are accounted for on the date securities are bought or sold. Costs used to determine realized gains (losses) on the sale of investment securities are those of the specific securities sold.
Each class of shares has equal rights as to assets and earnings, except that each class separately bears certain class-specific expenses related to maintenance of shareholder accounts (included in Management and Administrative expenses), shareholder reporting, and the proxy. Marketing and distribution expenses are allocated to each class of shares based on a method approved by the board of trustees. Income, other non-class-specific expenses, and gains and losses on investments are allocated to each class of shares based on its relative net assets.
B. The investment advisory firm Wellington Management Company LLP provides investment advisory services to a portion of the fund for a fee calculated at an annual percentage rate of average net assets managed by the advisor. The basic fee of Wellington Management Company LLP is subject to quarterly adjustments based on performance relative to the FTSE High Dividend Yield Index for the preceding three years.
Vanguard provides investment advisory services to a portion of the fund as described below; the fund paid Vanguard advisory fees of $1,800,000 for the year ended September 30, 2018.
For the year ended September 30, 2018, the aggregate investment advisory fee paid to all advisors represented an effective annual basic rate of 0.08% of the fund’s average net assets, before a decrease of $37,000 (0.00%) based on performance.
C. In accordance with the terms of a Funds’ Service Agreement (the “FSA”) between Vanguard and the fund, Vanguard furnishes to the fund corporate management, administrative, marketing, distribution, and cash management services at Vanguard’s cost of operations (as defined by the FSA). These costs of operations are allocated to the fund based on methods and guidelines
24
Equity Income Fund
approved by the board of trustees. Vanguard does not require reimbursement in the current period for certain costs of operations (such as deferred compensation/benefits and risk/insurance costs); the fund’s liability for these costs of operations is included in Payables to Vanguard on the Statement of Net Assets. All other costs of operations payable to Vanguard are generally settled twice a month.
Upon the request of Vanguard, the fund may invest up to 0.40% of its net assets as capital in Vanguard. At September 30, 2018, the fund had contributed to Vanguard capital in the amount of $1,692,000, representing 0.01% of the fund’s net assets and 0.68% of Vanguard’s capitalization. The fund’s trustees and officers are also directors and employees, respectively, of Vanguard.
D. Various inputs may be used to determine the value of the fund’s investments. These inputs are summarized in three broad levels for financial statement purposes. The inputs or methodologies used to value securities are not necessarily an indication of the risk associated with investing in those securities.
Level 1—Quoted prices in active markets for identical securities.
Level 2—Other significant observable inputs (including quoted prices for similar securities, interest rates, prepayment speeds, credit risk, etc.).
Level 3—Significant unobservable inputs (including the fund’s own assumptions used to determine the fair value of investments). Any investments valued with significant unobservable inputs are noted on the Statement of Net Assets.
The following table summarizes the market value of the fund’s investments as of September 30, 2018, based on the inputs used to value them:
| Level 1 | Level 2 | Level 3 | |
| Investments | ($000) | ($000) | ($000) |
| Common Stocks | 31,278,885 | 1,270,735 | — |
| Temporary Cash Investments | 507,279 | 426,176 | — |
| Futures Contracts—Liabilities1 | (128) | — | — |
| Total | 31,786,036 | 1,696,911 | — |
| 1 Represents variation margin on the last day of the reporting period. |
E. Permanent differences between book-basis and tax-basis components of net assets are reclassified among capital accounts in the financial statements to reflect their tax character. These reclassifications have no effect on net assets or net asset value per share. As of period end, the following permanent differences primarily attributable to the accounting for foreign currency transactions and distributions in connection with fund share redemptions were reclassified to the following accounts:
| Amount | |
| ($000) | |
| Paid-in Capital | 149,374 |
| Undistributed (Overdistributed) Net Investment Income | (462) |
| Accumulated Net Realized Gains (Losses) | (148,912) |
25
Equity Income Fund
Temporary differences between book-basis and tax-basis components of accumulated net earnings (losses) arise when certain items of income, gain, or loss are recognized in different periods for financial statement and tax purposes; these differences will reverse at some time in the future. The differences are primarily related to the tax deferral of losses on wash sales and the realization of unrealized gains or losses on certain futures contracts. As of period end, the tax-basis components of accumulated net earnings (losses) are detailed in the table as follows:
| Amount | |
| ($000) | |
| Undistributed Ordinary Income | 35,637 |
| Undistributed Long-Term Gains | 2,168,180 |
| Capital Loss Carryforwards (Non-expiring) | — |
| Net Unrealized Gains (Losses) | 7,510,111 |
As of September 30, 2018, gross unrealized appreciation and depreciation for investments and derivatives based on cost for U.S. federal income tax purposes were as follows:
| Amount | |
| ($000) | |
| Tax Cost | 25,973,027 |
| Gross Unrealized Appreciation | 7,863,059 |
| Gross Unrealized Depreciation | (353,011) |
| Net Unrealized Appreciation (Depreciation) | 7,510,048 |
F. During the year ended September 30, 2018, the fund purchased $12,878,864,000 of investment securities and sold $11,313,112,000 of investment securities, other than temporary cash investments.
| G. Capital share transactions for each class of shares were: | ||||
| Year Ended September 30, | ||||
| 2018 | 2017 | |||
| Amount | Shares | Amount | Shares | |
| ($000) | (000) | ($000) | (000) | |
| Investor Shares | ||||
| Issued | 998,715 | 26,933 | 1,307,027 | 39,209 |
| Issued in Lieu of Cash Distributions | 201,873 | 5,406 | 201,419 | 5,967 |
| Redeemed | (1,826,270) | (49,355) | (1,677,357) | (49,867) |
| Net Increase (Decrease)—Investor Shares | (625,682) | (17,016) | (168,911) | (4,691) |
| Admiral Shares | ||||
| Issued | 5,851,704 | 75,470 | 5,702,925 | 81,210 |
| Issued in Lieu of Cash Distributions | 837,871 | 10,700 | 667,841 | 9,421 |
| Redeemed | (4,050,655) | (52,093) | (3,548,644) | (50,390) |
| Net Increase (Decrease) —Admiral Shares | 2,638,920 | 34,077 | 2,822,122 | 40,241 |
26
Equity Income Fund
H. Transactions during the period in investments where the issuer is another member of The Vanguard Group were as follows:
| Current Period Transactions | ||||||||
| Sept. 30, | Proceeds | Realized | Sept. 30, | |||||
| 2017 | from | Net | Change in | Capital Gain | 2018 | |||
| Market | Purchases | Securities | Gain | Unrealized | Distributions | Market | ||
| Value | at Cost | Sold | (Loss) | App. (Dep.) | Income | Received | Value | |
| ($000) | ($000) | ($000) | ($000) | ($000) | ($000) | ($000) | ($000) | |
| Vanguard High | ||||||||
| Dividend Yield ETF | 84,957 | — | — | — | 6,309 | 2,676 | — | 91,266 |
| Vanguard Market | ||||||||
| Liquidity Fund | 471,508 | NA1 | NA1 | (60) | (27) | 8,088 | — | 507,279 |
| Total | 556,465 | (60) | 6,282 | 10,764 | — | 598,545 | ||
1 Not applicable—purchases and sales are for temporary cash investment purposes.
I. Management has determined that no events or transactions occurred subsequent to September 30, 2018, that would require recognition or disclosure in these financial statements.
27
Report of Independent Registered Public Accounting Firm
To the Board of Trustees of Vanguard Fenway Funds and Shareholders of Vanguard Equity Income Fund
Opinion on the Financial Statements
We have audited the accompanying statement of net assets of Vanguard Equity Income Fund (one of the funds constituting Vanguard Fenway Funds, referred to hereafter as the “Fund”) as of September 30, 2018, the related statement of operations for the year ended September 30, 2018, the statement of changes in net assets for each of the two years in the period ended September 30, 2018, including the related notes, and the financial highlights for each of the five years in the period ended September 30, 2018 (collectively referred to as the “financial statements”). In our opinion, the financial statements present fairly, in all material respects, the financial position of the Fund as of September 30, 2018, the results of its operations for the year then ended, the changes in its net assets for each of the two years in the period ended September 30, 2018 and the financial highlights for each of the five years in the period ended September 30, 2018 in conformity with accounting principles generally accepted in the United States of America.
Basis for Opinion
These financial statements are the responsibility of the Fund’s management. Our responsibility is to express an opinion on the Fund’s financial statements based on our audits. We are a public accounting firm registered with the Public Company Accounting Oversight Board (United States) (“PCAOB”) and are required to be independent with respect to the Fund in accordance with the U.S. federal securities laws and the applicable rules and regulations of the Securities and Exchange Commission and the PCAOB.
We conducted our audits of these financial statements in accordance with the standards of the PCAOB. Those standards require that we plan and perform the audit to obtain reasonable assurance about whether the financial statements are free of material misstatement, whether due to error or fraud.
Our audits included performing procedures to assess the risks of material misstatement of the financial statements, whether due to error or fraud, and performing procedures that respond to those risks. Such procedures included examining, on a test basis, evidence regarding the amounts and disclosures in the financial statements. Our audits also included evaluating the accounting principles used and significant estimates made by management, as well as evaluating the overall presentation of the financial statements. Our procedures included confirmation of securities owned as of September 30, 2018 by correspondence with the custodians and brokers and by agreement to the underlying ownership records of the transfer agent; when replies were not received from brokers, we performed other auditing procedures. We believe that our audits provide a reasonable basis for our opinion.
/s/PricewaterhouseCoopers LLP
Philadelphia, Pennsylvania
November 15, 2018
We have served as the auditor of one or more investment companies in The Vanguard Group of Funds since 1975.
28
Special 2018 tax information (unaudited) for Vanguard Equity Income Fund
This information for the fiscal year ended September 30, 2018, is included pursuant to provisions of the Internal Revenue Code.
The fund distributed $440,909,000 as capital gain dividends (20% rate gain distributions) to shareholders during the fiscal year.
For nonresident alien shareholders, 100% of short-term capital gain dividends distributed by the fund are qualified short-term capital gains.
The fund distributed $828,340,000 of qualified dividend income to shareholders during the fiscal year.
For corporate shareholders, 91.4% of investment income (dividend income plus short-term gains, if any) qualifies for the dividends-received deduction.
29
Your Fund’s After-Tax Returns
This table presents returns for your fund both before and after taxes. The after-tax returns are shown in two ways: (1) assuming that an investor owned the fund during the entire period and paid taxes on the fund’s distributions, and (2) assuming that an investor paid taxes on the fund’s distributions and sold all shares at the end of each period.
Calculations are based on the highest individual federal income tax and capital gains tax rates in effect at the times of the distributions and the hypothetical sales. State and local taxes were not considered. After-tax returns reflect any qualified dividend income, using actual prior-year figures and estimates for 2018. (In the example, returns after the sale of fund shares may be higher than those assuming no sale. This occurs when the sale would have produced a capital loss. The calculation assumes that the investor received a tax deduction for the loss.)
The table shows returns for Investor Shares only; returns for other share classes will differ. Please note that your actual after-tax returns will depend on your tax situation and may differ from those shown. Also note that if you own the fund in a tax-deferred account, such as an individual retirement account or a 401(k) plan, this information does not apply to you. Such accounts are not subject to current taxes.
Finally, keep in mind that a fund’s performance—whether before or after taxes—does not guarantee future results.
| Average Annual Total Returns: Equity Income Fund Investor Shares | |||
| Periods Ended September 30, 2018 | |||
| One | Five | Ten | |
| Year | Years | Years | |
| Returns Before Taxes | 10.58% | 11.54% | 11.06% |
| Returns After Taxes on Distributions | 9.57 | 10.16 | 10.09 |
| Returns After Taxes on Distributions and Sale of Fund Shares | 6.87 | 8.87 | 8.94 |
30
About Your Fund’s Expenses
As a shareholder of the fund, you incur ongoing costs, which include costs for portfolio management, administrative services, and shareholder reports (like this one), among others. Operating expenses, which are deducted from a fund’s gross income, directly reduce the investment return of the fund.
A fund’s expenses are expressed as a percentage of its average net assets. This figure is known as the expense ratio. The following examples are intended to help you understand the ongoing costs (in dollars) of investing in your fund and to compare these costs with those of other mutual funds. The examples are based on an investment of $1,000 made at the beginning of the period shown and held for the entire period.
The accompanying table illustrates your fund’s costs in two ways:
• Based on actual fund return. This section helps you to estimate the actual expenses that you paid over the period. The ”Ending Account Value“ shown is derived from the fund‘s actual return, and the third column shows the dollar amount that would have been paid by an investor who started with $1,000 in the fund. You may use the information here, together with the amount you invested, to estimate the expenses that you paid over the period.
To do so, simply divide your account value by $1,000 (for example, an $8,600 account value divided by $1,000 = 8.6), then multiply the result by the number given for your fund under the heading ”Expenses Paid During Period.“
• Based on hypothetical 5% yearly return. This section is intended to help you compare your fund‘s costs with those of other mutual funds. It assumes that the fund had a yearly return of 5% before expenses, but that the expense ratio is unchanged. In this case—because the return used is not the fund’s actual return—the results do not apply to your investment. The example is useful in making comparisons because the Securities and Exchange Commission requires all mutual funds to calculate expenses based on a 5% return. You can assess your fund’s costs by comparing this hypothetical example with the hypothetical examples that appear in shareholder reports of other funds.
Note that the expenses shown in the table are meant to highlight and help you compare ongoing costs only and do not reflect transaction costs incurred by the fund for buying and selling securities. Further, the expenses do not include any purchase, redemption, or account service fees described in the fund prospectus. If such fees were applied to your account, your costs would be higher. Your fund does not carry a “sales load.”
The calculations assume no shares were bought or sold during the period. Your actual costs may have been higher or lower, depending on the amount of your investment and the timing of any purchases or redemptions.
You can find more information about the fund’s expenses, including annual expense ratios, in the Financial Statements section of this report. For additional information on operating expenses and other shareholder costs, please refer to your fund’s current prospectus.
31
| Six Months Ended September 30, 2018 | |||
| Beginning | Ending | Expenses | |
| Account Value | Account Value | Paid During | |
| Equity Income Fund | 3/31/2018 | 9/30/2018 | Period |
| Based on Actual Fund Return | |||
| Investor Shares | $1,000.00 | $1,067.48 | $1.35 |
| Admiral Shares | 1,000.00 | 1,068.20 | 0.88 |
| Based on Hypothetical 5% Yearly Return | |||
| Investor Shares | $1,000.00 | $1,023.76 | $1.32 |
| Admiral Shares | 1,000.00 | 1,024.22 | 0.86 |
The calculations are based on expenses incurred in the most recent six-month period. The fund’s annualized six-month expense ratios for that period are 0.26% for Investor Shares and 0.17% for Admiral Shares. The dollar amounts shown as “Expenses Paid” are equal to the annualized expense ratio multiplied by the average account value over the period, multiplied by the number of days in the most recent six-month period, then divided by the number of days in the most recent 12-month period (183/365).
32
Glossary
30-Day SEC Yield. A fund’s 30-day SEC yield is derived using a formula specified by the U.S. Securities and Exchange Commission. Under the formula, data related to the fund’s security holdings in the previous 30 days are used to calculate the fund’s hypothetical net income for that period, which is then annualized and divided by the fund’s estimated average net assets over the calculation period. For the purposes of this calculation, a security’s income is based on its current market yield to maturity (for bonds), its actual income (for asset-backed securities), or its projected dividend yield (for stocks). Because the SEC yield represents hypothetical annualized income, it will differ—at times significantly—from the fund’s actual experience. As a result, the fund’s income distributions may be higher or lower than implied by the SEC yield.
Beta. A measure of the magnitude of a fund’s past share-price fluctuations in relation to the ups and downs of a given market index. The index is assigned a beta of 1.00. Compared with a given index, a fund with a beta of 1.20 typically would have seen its share price rise or fall by 12% when the index rose or fell by 10%. For this report, beta is based on returns over the past 36 months for both the fund and the index. Note that a fund’s beta should be reviewed in conjunction with its R-squared (see definition). The lower the R-squared, the less correlation there is between the fund and the index, and the less reliable beta is as an indicator of volatility.
Dividend Yield. Dividend income earned by stocks, expressed as a percentage of the aggregate market value (or of net asset value, for a fund). The yield is determined by dividing the amount of the annual dividends by the aggregate value (or net asset value) at the end of the period. For a fund, the dividend yield is based solely on stock holdings and does not include any income produced by other investments.
Earnings Growth Rate. The average annual rate of growth in earnings over the past five years for the stocks now in a fund.
Equity Exposure. A measure that reflects a fund’s investments in stocks and stock futures. Any holdings in short-term reserves are excluded.
Expense Ratio. A fund’s total annual operating expenses expressed as a percentage of the fund’s average net assets. The expense ratio includes management and administrative expenses, but does not include the transaction costs of buying and selling portfolio securities.
Foreign Holdings. The percentage of a fund represented by securities or depositary receipts of companies based outside the United States.
Inception Date. The date on which the assets of a fund (or one of its share classes) are first invested in accordance with the fund’s investment objective. For funds with a subscription period, the inception date is the day after that period ends. Investment performance is measured from the inception date.
Median Market Cap. An indicator of the size of companies in which a fund invests; the midpoint of market capitalization (market price x shares outstanding) of a fund’s stocks, weighted by the proportion of the fund’s assets invested in each stock. Stocks representing half of the fund’s assets have market capitalizations above the median, and the rest are below it.
Price/Book Ratio. The share price of a stock divided by its net worth, or book value, per share.
For a fund, the weighted average price/book ratio of the stocks it holds.
33
Price/Earnings Ratio. The ratio of a stock’s current price to its per-share earnings over the past year. For a fund, the weighted average P/E of the stocks it holds. P/E is an indicator of market expectations about corporate prospects; the higher the P/E, the greater the expectations for a company’s future growth.
R-Squared. A measure of how much of a fund’s past returns can be explained by the returns from the market in general, as measured by a given index. If a fund’s total returns were precisely synchronized with an index’s returns, its R-squared would be 1.00. If the fund’s returns bore no relationship to the index’s returns, its R-squared would be 0. For this report, R-squared is based on returns over the past 36 months for both the fund and the index.
Return on Equity. The annual average rate of return generated by a company during the past five years for each dollar of shareholder’s equity (net income divided by shareholder’s equity). For a fund, the weighted average return on equity for the companies whose stocks it holds.
Short-Term Reserves. The percentage of a fund invested in highly liquid, short-term securities that can be readily converted to cash.
Turnover Rate. An indication of the fund’s trading activity. Funds with high turnover rates incur higher transaction costs and may be more likely to distribute capital gains (which may be taxable to investors). The turnover rate excludes in-kind transactions, which have minimal impact on costs.
34
The Global Industry Classification Standard (“GICS”) was developed by and is the exclusive property and a service mark of MSCI Inc. (“MSCI”) and Standard and Poor’s, a division of McGraw-Hill Companies, Inc. (“S&P”), and is licensed for use by Vanguard. Neither MSCI, S&P nor any third party involved in making or compiling the GICS or any GICS classification makes any express or implied warranties or representations with respect to such standard or classification (or the results to be obtained by the use thereof), and all such parties hereby expressly disclaim all warranties of originality, accuracy, completeness, merchantability or fitness for a particular purpose with respect to any such standard or classification. Without limiting any of the foregoing, in no event shall MSCI, S&P, any of its affiliates or any third party involved in making or compiling the GICS or any GICS classification have any liability for any direct, indirect, special, punitive, consequential or any other damages (including lost profits) even if notified of the possibility of such damages.
35
This page intentionally left blank.
This page intentionally left blank.
This page intentionally left blank.
The People Who Govern Your Fund
The trustees of your mutual fund are there to see that the fund is operated and managed in your best interests since, as a shareholder, you are a part owner of the fund. Your fund’s trustees also serve on the board of directors of The Vanguard Group, Inc., which is owned by the Vanguard funds and provides services to them on an at-cost basis.
A majority of Vanguard’s board members are independent, meaning that they have no affiliation with Vanguard or the funds they oversee, apart from the sizable personal investments they have made as private individuals. The independent board members have distinguished backgrounds in business, academia, and public service. Each of the trustees and executive officers oversees 211 Vanguard funds.
Information for each trustee and executive officer of the fund appears below. The mailing address of the trustees and officers is P.O. Box 876, Valley Forge, PA 19482. More information about the trustees is in the Statement of Additional Information, which can be obtained, without charge, by contacting Vanguard at 800-662-7447, or online at vanguard.com.
Interested Trustees1
F. William McNabb III
Born in 1957. Trustee since July 2009. Principal occupation(s) during the past five years and other experience: chairman of the board (January 2010–present) of Vanguard and of each of the investment companies served by Vanguard, trustee (2009–present) of each of the investment companies served by Vanguard, and director (2008–present) of Vanguard. Chief executive officer and president (2008–2017) of Vanguard and each of the investment companies served by Vanguard, managing director (1995–2008) of Vanguard, and director (1997–2018) of Vanguard Marketing Corporation. Director (2018–present) of UnitedHealth Group.
Mortimer J. Buckley
Born in 1969. Trustee since January 2018. Principal occupation(s) during the past five years and other experience: chief executive officer (January 2018–present) of Vanguard; chief executive officer, president, and trustee (January 2018–present) of each of the investment companies served by Vanguard; president and director (2017–present) of Vanguard; and president (February 2018–present) of Vanguard Marketing Corporation. Chief investment officer (2013–2017), managing director (2002–2017), head of the Retail Investor Group (2006–2012), and chief information officer (2001–2006) of Vanguard. Chairman of the board (2011–2017) of the Children’s Hospital of Philadelphia.
Independent Trustees
Emerson U. Fullwood
Born in 1948. Trustee since January 2008. Principal occupation(s) during the past five years and other experience: executive chief staff and marketing officer for North America and corporate vice president (retired 2008) of Xerox Corporation (document management products and services). Former president of the Worldwide Channels Group, Latin America, and Worldwide Customer Service and executive chief staff officer of Developing Markets of Xerox. Executive in residence and 2009–2010 Distinguished Minett Professor at the Rochester Institute of Technology. Lead director of SPX FLOW, Inc. (multi-industry manufacturing). Director of the University of Rochester Medical Center, the Monroe Community College Foundation, the United Way of Rochester, North Carolina A&T University, and Roberts Wesleyan College. Trustee of the University of Rochester.
Amy Gutmann
Born in 1949. Trustee since June 2006. Principal occupation(s) during the past five years and other experience: president (2004–present) of the University of Pennsylvania. Christopher H. Browne Distinguished Professor of Political Science, School of Arts and Sciences, and professor of communication, Annenberg School for Communication, with secondary faculty appointments in the Department of Philosophy, School of Arts and Sciences, and at the Graduate School of Education, University of Pennsylvania. Trustee of the National Constitution Center.
1 Mr. McNabb and Mr. Buckley are considered “interested persons,” as defined in the Investment Company Act of 1940, because they are officers of the Vanguard funds.
JoAnn Heffernan Heisen
Born in 1950. Trustee since July 1998. Principal occupation(s) during the past five years and other experience: corporate vice president of Johnson & Johnson (pharmaceuticals/medical devices/consumer products) and member of its executive committee (1997–2008). Chief global diversity officer (retired 2008), vice president and chief information officer (1997–2006), controller (1995–1997), treasurer (1991–1995), and assistant treasurer (1989–1991) of Johnson & Johnson. Director of Skytop Lodge Corporation (hotels) and the Robert Wood Johnson Foundation. Member of the advisory board of the Institute for Women’s Leadership at Rutgers University.
F. Joseph Loughrey
Born in 1949. Trustee since October 2009. Principal occupation(s) during the past five years and other experience: president and chief operating officer (retired 2009) and vice chairman of the board (2008–2009) of Cummins Inc. (industrial machinery). Chairman of the board of Hillenbrand, Inc. (specialized consumer services), Oxfam America, and the Lumina Foundation for Education. Director of the V Foundation for Cancer Research. Member of the advisory council for the College of Arts and Letters and chair of the advisory board to the Kellogg Institute for International Studies, both at the University of Notre Dame.
Mark Loughridge
Born in 1953. Trustee since March 2012. Principal occupation(s) during the past five years and other experience: senior vice president and chief financial officer (retired 2013) of IBM (information technology services). Fiduciary member of IBM’s Retirement Plan Committee (2004–2013), senior vice president and general manager (2002–2004) of IBM Global Financing, vice president and controller (1998–2002) of IBM, and a variety of other prior management roles at IBM. Member of the Council on Chicago Booth.
Scott C. Malpass
Born in 1962. Trustee since March 2012. Principal occupation(s) during the past five years and other experience: chief investment officer (1989–present) and vice president (1996–present) of the University of Notre Dame. Assistant professor of finance at the Mendoza College of Business, University of Notre Dame, and member of the Notre Dame 403(b) Investment Committee. Chairman of the board of TIFF Advisory Services, Inc. Member of the board of Catholic Investment Services, Inc. (investment advisors), the board of advisors for Spruceview Capital Partners, and the board of superintendence of the Institute for the Works of Religion.
Deanna Mulligan
Born in 1963. Trustee since January 2018. Principal occupation(s) during the past five years and other experience: president (2010–present) and chief executive officer (2011–present) of The Guardian Life Insurance Company of America. Chief operating officer (2010–2011) and executive vice president (2008–2010) of Individual Life and Disability of The Guardian Life Insurance Company of America. Member of the board of The Guardian Life Insurance Company of America, the American Council of Life Insurers, the Partnership for New York City (business leadership), and the Committee Encouraging Corporate Philanthropy. Trustee of the Economic Club of New York and the Bruce Museum (arts and science). Member of the Advisory Council for the Stanford Graduate School of Business.
André F. Perold
Born in 1952. Trustee since December 2004. Principal occupation(s) during the past five years and other experience: George Gund Professor of Finance and Banking, Emeritus at the Harvard Business School (retired 2011). Chief investment officer and co-managing partner of HighVista Strategies LLC (private investment firm). Overseer of the Museum of Fine Arts Boston.
Sarah Bloom Raskin
Born in 1961. Trustee since January 2018. Principal occupation(s) during the past five years and other experience: deputy secretary (2014–2017) of the United States Department of the Treasury. Governor (2010–2014) of the Federal Reserve Board. Commissioner (2007–2010) of financial regulation for the State of Maryland. Member of the board of directors (2012–2014) of Neighborhood Reinvestment Corporation. Director of i(x) Investments, LLC.
Peter F. Volanakis
Born in 1955. Trustee since July 2009. Principal occupation(s) during the past five years and other experience: president and chief operating officer (retired 2010) of Corning Incorporated (communications equipment) and director of Corning Incorporated (2000–2010) and Dow Corning (2001–2010). Director (2012) of SPX Corporation (multi-industry manufacturing). Overseer of the Amos Tuck School of Business Administration, Dartmouth College (2001–2013). Chairman of the board of trustees of Colby-Sawyer College. Member of the Board of Hypertherm Inc. (industrial cutting systems, software, and consumables).
Executive Officers
Glenn Booraem
Born in 1967. Principal occupation(s) during the past five years and other experience: principal of Vanguard. Investment stewardship officer (2017–present), treasurer (2015–2017), controller (2010–2015), and assistant controller (2001–2010) of each of the investment companies served by Vanguard.
Christine M. Buchanan
Born in 1970. Principal occupation(s) during the past five years and other experience: principal of Vanguard and global head of Fund Administration at Vanguard. Treasurer (2017–present) of each of the investment companies served by Vanguard. Partner (2005–2017) at KPMG LLP (audit, tax, and advisory services).
Brian Dvorak
Born in 1973. Principal occupation(s) during the past five years and other experience: principal of Vanguard. Chief compliance officer (2017–present) of Vanguard and each of the investment companies served by Vanguard. Assistant vice president (2017–present) of Vanguard Marketing Corporation. Vice president and director of Enterprise Risk Management (2011–2013) at Oppenheimer Funds, Inc.
Thomas J. Higgins
Born in 1957. Principal occupation(s) during the past five years and other experience: principal of Vanguard. Chief financial officer (2008–present) and treasurer (1998–2008) of each of the investment companies served by Vanguard.
Peter Mahoney
Born in 1974. Principal occupation(s) during the past five years and other experience: principal of Vanguard. Controller (2015–present) of each of the investment companies served by Vanguard. Head of International Fund Services (2008–2014) at Vanguard.
Anne E. Robinson
Born in 1970. Principal occupation(s) during the past five years and other experience: general counsel (2016–present) of Vanguard. Secretary (2016–present) of Vanguard and of each of the investment companies served by Vanguard. Managing director (2016–present) of Vanguard. Director and senior vice president (2016–2018) of Vanguard Marketing Corporation. Managing director and general counsel of Global Cards and Consumer Services (2014–2016) at Citigroup. Counsel (2003–2014) at American Express.
Michael Rollings
Born in 1963. Principal occupation(s) during the past five years and other experience: finance director (2017–present) and treasurer (2017) of each of the investment companies served by Vanguard. Managing director (2016–present) of Vanguard. Chief financial officer (2016–present) of Vanguard. Director (2016–present) of Vanguard Marketing Corporation. Executive vice president and chief financial officer (2006–2016) of MassMutual Financial Group.
| Vanguard Senior Management Team | |
| Joseph Brennan | Chris D. McIsaac |
| Mortimer J. Buckley | James M. Norris |
| Gregory Davis | Thomas M. Rampulla |
| John James | Karin A. Risi |
| Martha G. King | Anne E. Robinson |
| John T. Marcante | Michael Rollings |
| Chairman Emeritus and Senior Advisor | |
| John J. Brennan | |
| Chairman, 1996–2009 | |
| Chief Executive Officer and President, 1996–2008 | |
| Founder | |
| John C. Bogle | |
| Chairman and Chief Executive Officer, 1974–1996 | |
 | |
P.O. Box 2600 | |
Connect with Vanguard® > vanguard.com | |
| Fund Information > 800-662-7447 | Source for Bloomberg Barclays indexes: Bloomberg |
| Direct Investor Account Services > 800-662-2739 | Index Services Limited. Copyright 2018, Bloomberg. All |
| Institutional Investor Services > 800-523-1036 | rights reserved. |
| Text Telephone for People | |
| Who Are Deaf or Hard of Hearing > 800-749-7273 | CFA® is a registered trademark owned by CFA Institute. |
| This material may be used in conjunction | |
| with the offering of shares of any Vanguard | |
| fund only if preceded or accompanied by | |
| the fund’s current prospectus. | |
| All comparative mutual fund data are from Lipper, a | |
| Thomson Reuters Company, or Morningstar, Inc., unless | |
| otherwise noted. | |
| You can obtain a free copy of Vanguard’s proxy voting | |
| guidelines by visiting vanguard.com/proxyreporting or by | |
| calling Vanguard at 800-662-2739. The guidelines are | |
| also available from the SEC’s website, sec.gov. In | |
| addition, you may obtain a free report on how your fund | |
| voted the proxies for securities it owned during the 12 | |
| months ended June 30. To get the report, visit either | |
| vanguard.com/proxyreporting or sec.gov. | |
| You can review and copy information about your fund at | |
| the SEC’s Public Reference Room in Washington, D.C. To | |
| find out more about this public service, call the SEC at | |
| 202-551-8090. Information about your fund is also | |
| available on the SEC’s website, and you can receive | |
| copies of this information, for a fee, by sending a | |
| request in either of two ways: via email addressed to | |
| publicinfo@sec.gov or via regular mail addressed to the | |
| Public Reference Section, Securities and Exchange | |
| Commission, Washington, DC 20549-1520. | |
| © 2018 The Vanguard Group, Inc. | |
| All rights reserved. | |
| Vanguard Marketing Corporation, Distributor. | |
| Q650 112018 | |
| Annual Report | September 30, 2018 |
| Vanguard PRIMECAP Core Fund |
Vanguard’s Principles for Investing Success
We want to give you the best chance of investment success. These principles, grounded in Vanguard’s research and experience, can put you on the right path.
Goals. Create clear, appropriate investment goals.
Balance. Develop a suitable asset allocation using broadly diversified funds. Cost. Minimize cost.
Discipline. Maintain perspective and long-term discipline.
A single theme unites these principles: Focus on the things you can control.
We believe there is no wiser course for any investor.
| Contents | |
| Your Fund’s Performance at a Glance. | 1 |
| CEO’s Perspective. | 3 |
| Advisor’s Report. | 5 |
| Fund Profile. | 8 |
| Performance Summary. | 9 |
| Financial Statements. | 11 |
| Your Fund’s After-Tax Returns. | 23 |
| About Your Fund’s Expenses. | 24 |
| Glossary. | 26 |
Please note: The opinions expressed in this report are just that—informed opinions. They should not be considered promises or advice. Also, please keep in mind that the information and opinions cover the period through the date on the front of this report. Of course, the risks of investing in your fund are spelled out in the prospectus.
See the Glossary for definitions of investment terms used in this report.
Your Fund’s Performance at a Glance
• Vanguard PRIMECAP Core Fund returned about 18% for the 12 months ended September 30, 2018, slightly ahead of its benchmark, the MSCI US Prime Market 750 Index, and well ahead of the average return of its peers.
• The broad U.S. stock market advanced nearly 18% as corporate earnings remained strong and the U.S. economy continued to grow. However, stocks endured a stretch of volatility earlier in 2018 before rebounding.
• Growth stocks outperformed their value brethren, and large-capitalization stocks generally surpassed mid- and small-caps.
• PRIMECAP Management Company, the fund’s advisor, traditionally invests most heavily in the information technology and health care sectors. Although the fund’s information technology stocks returned 29% and added more than 8 percentage points to return, they detracted from relative performance. Its health care stocks returned more than 18% and added nearly 4 percentage points to return.
| Total Returns: Fiscal Year Ended September 30, 2018 | |
| Total | |
| Returns | |
| Vanguard PRIMECAP Core Fund | 18.27% |
| MSCI US Prime Market 750 Index | 17.93 |
| Multi-Cap Core Funds Average | 13.81 |
| Multi-Cap Core Funds Average: Derived from data provided by Lipper, a Thomson Reuters Company. | |
| Total Returns: Ten Years Ended September 30, 2018 | |
| Average | |
| Annual Return | |
| PRIMECAP Core Fund | 13.85% |
| MSCI US Prime Market 750 Index | 12.10 |
| Multi-Cap Core Funds Average | 10.04 |
| Multi-Cap Core Funds Average: Derived from data provided by Lipper, a Thomson Reuters Company. | |
The figures shown represent past performance, which is not a guarantee of future results. (Current performance may be lower or higher than the performance data cited. For performance data current to the most recent month-end, visit our website at vanguard.com/performance.) Note, too, that both investment returns and principal value can fluctuate widely, so an investor’s shares, when sold, could be worth more or less than their original cost.
1
| Expense Ratios | ||
| Your Fund Compared With Its Peer Group | ||
| Peer Group | ||
| Fund | Average | |
| PRIMECAP Core Fund | 0.46% | 1.11% |
The fund expense ratio shown is from the prospectus dated January 25, 2018, and represents estimated costs for the current fiscal year. For the fiscal year ended September 30, 2018, the fund’s expense ratio was 0.46%. The peer-group expense ratio is derived from data provided by Lipper, a Thomson Reuters Company, and captures information through year-end 2017.
Peer group: Multi-Cap Core Funds.
2
CEO’s Perspective

Tim Buckley
President and Chief Executive Officer
Dear Shareholder,
Over the years, I’ve found that prudent investors exhibit a common trait: discipline. No matter how the markets move or what new investing fad hits the headlines, those who stay focused on their goals and tune out the noise are set up for long-term success.
The prime gateway to investing is saving, and you don’t usually become a saver without a healthy dose of discipline. Savers make the decision to sock away part of their income, which means spending less and delaying gratification, no matter how difficult that may be.
Of course, disciplined investing extends beyond diligent saving. The financial markets, in the short term especially, are unpredictable; I have yet to meet the investor who can time them perfectly. It takes discipline to resist the urge to go all-in when markets are frothy or to retreat when things look bleak.
Staying put with your investments is one strategy for handling volatility. Another, rebalancing, requires even more discipline because it means steering your money away from strong performers and toward poorer performers.
Patience—a form of discipline—is also the friend of long-term investors. Higher returns are the potential reward for weathering the market’s turbulence and uncertainty.
3
We have been enjoying one of the longest bull markets in history, but it won’t continue forever. Prepare yourself now for how you will react when volatility comes back. Don’t panic. Don’t chase returns or look for answers outside the asset classes you trust. And be sure to rebalance periodically, even when there’s turmoil.
Whether you’re a master of self-control, get a boost from technology, or work with a professional advisor, know that discipline is necessary to get the most out of your investment portfolio. And know that Vanguard is with you for the entire ride.
Thank you for your continued loyalty.
Sincerely,

Mortimer J. Buckley
President and Chief Executive Officer
October 18, 2018
| Market Barometer | |||
| Average Annual Total Returns | |||
| Periods Ended September 30, 2018 | |||
| One Year | Three Years | Five Years | |
| Stocks | |||
| Russell 1000 Index (Large-caps) | 17.76% | 17.07% | 13.67% |
| Russell 2000 Index (Small-caps) | 15.24 | 17.12 | 11.07 |
| Russell 3000 Index (Broad U.S. market) | 17.58 | 17.07 | 13.46 |
| FTSE All-World ex US Index (International) | 2.13 | 10.18 | 4.51 |
| Bonds | |||
| Bloomberg Barclays U.S. Aggregate Bond Index | |||
| (Broad taxable market) | -1.22% | 1.31% | 2.16% |
| Bloomberg Barclays Municipal Bond Index | |||
| (Broad tax-exempt market) | 0.35 | 2.24 | 3.54 |
| FTSE Three-Month U. S. Treasury Bill Index | 1.57 | 0.80 | 0.48 |
| CPI | |||
| Consumer Price Index | 2.28% | 1.99% | 1.52% |
4
Advisor’s Report
For the fiscal year ended September 30, 2018, Vanguard PRIMECAP Core Fund returned 18.27%, exceeding the 17.93% return of the fund’s benchmark, the MSCI US Prime Market 750 Index. The fund’s return also exceeded the 13.81% average return of its multi-capitalization core fund competitors and the 17.91% return of the Standard & Poor’s 500 Index, which serves as a proxy for the broad market in the attribution discussion that follows.
The investment environment
The fiscal year featured a strengthening U.S. economy and robust U.S. equity market returns. The American consumer remained upbeat given healthy gains in employment, real disposable personal income, and household net worth. Consumer confidence measures, in turn, climbed to historically elevated levels, including a notable recent uptick in sentiment from lower-income households.
On the corporate side, federal tax legislation in late 2017 catalyzed the best earnings growth since the immediate aftermath of the global financial crisis, and a broad deregulatory agenda helped usher business sentiment to decade-high levels. Various gauges of business activity registered consistent expansion throughout the year, and forward-looking indicators remained encouraging.
While the growth momentum in the U.S. economy ultimately translated into equity strength, the path was not linear. The equity market rose rapidly through late
January on enthusiasm about new tax legislation and consequent upgrades to forward earnings. But market volatility resurfaced in early 2018 as combative trade rhetoric and the regulatory scrutiny of key technology companies escalated. The market corrected lower by more than 10% and largely hovered at those subdued levels for several months.
Eventually, the undeniable fitness of the underlying economy, coupled with key trade resolutions, returned the equity markets to record-setting territory by late August. Cyclical sectors led the way during the fiscal year, with information technology returning 38% and consumer discretionary returning 35%, while defensive sectors generally underperformed the market averages.
Outlook for U.S. equities
As we look beyond the reporting period, we remain cautiously optimistic. This calendar year’s above-trend GDP growth and exceptional corporate earnings growth will likely decelerate next year, but solid growth on both fronts should endure. The S&P 500’s forward price/earnings valuation (16.8 times) sits slightly above its 25-year historical average (16.1 times), while financial conditions remain fairly accommodative despite rising U.S. Treasury yields and a strengthening U.S. dollar. The market’s valuation is thus reasonable overall in our view. Our largest sector positions continue to be in information technology, health care, and industrials, where we believe our holdings enjoy a
5
combination of strong secular growth, improved industry dynamics, and sensible valuations.
As the fiscal year closed, domestic strength increasingly contrasted with signs of emerging weakness abroad. While U.S. outperformance in this scenario is neither unprecedented nor alarming given superior fundamentals, synchronous global growth is a better environment for U.S. equities. And yet the markets are sounding early warnings, particularly in China. Deteriorating U.S.-China relations have contributed to a slumping equity market and a beleaguered yuan.
The risk of broader trade-induced tumult has diminished somewhat with each preliminary trade agreement announced by the Trump administration, but these developments focus the attention on China, the original and largest target of trade ire. As we have indicated previously, we are still hopeful that trade-inspired economic and geopolitical risks will continue to subside, even as we acknowledge few signs of progress in this specific dispute. We invest in many companies and industries, such as semiconductors and airlines, that maintain a cyclical bent. These companies rely heavily on international commerce and global growth more broadly, and some are especially dependent on constructive U.S.-China relations.
Portfolio update
As noted, the portfolio maintains large overweight positions in information technology, health care, and industrial stocks. These sectors make up 66% of average assets compared with their 44% combined weighting in the S&P 500.
The portfolio was also modestly overweight in consumer discretionary (13% versus 10%), while it maintained an underweight position in all other sectors.
Significant sector underweight positions include consumer staples, energy, financials, and telecommunication services. The fund has limited or no exposure to several smaller sectors, including materials, real estate, and utilities.
Sector allocation was the primary driver of relative outperformance during the fiscal year. The fund’s overweight position in information technology took advantage of the year’s best-performing sector. Underweight positions in multiple under-performing sectors also helped results, especially consumer staples and utilities, the two worst-performing sectors.
Stock selection detracted from relative results. Information technology featured many standout performers, including NetApp (+99%) and NVIDIA (+55%), but the portfolio’s holdings trailed the sector benchmark as ownership of Flex (–21%) and negligible exposure to Apple (+49%) dragged on relative results. Health care selection was neutral, as large holdings Eli Lilly (+29%) and Roche (–1%) largely offset each other. The fund’s industrial selection was a positive factor in relative results, though this largely stemmed from avoiding General Electric’s 52% decline. Performance in the fund’s large airline
6
holdings was mixed and detracted overall. Stock selection elsewhere was unfavorable in aggregate, primarily because of our limited exposure to Amazon (+108%) and Netflix (+106%).
As of September 30, 2018, the fund’s top ten holdings made up 31% of assets.
Advisor perspectives
Information technology has been a consistent source of outperformance for the fund. In recent years, our significant ownership in technology companies, particularly semiconductor stocks, has been an extraordinarily reliable driver of annual upside. Such trends tend not to persist indefinitely. That said, we continue to expect demand for semiconductors and software products—and technology and innovation in general—to outpace demand for goods and services more broadly. We also view the sector’s modest valuation premium (18.3 times forward P/E) as largely justified and, of note, not remotely similar to the valuation distortions of technology euphoria in previous eras.
As our assessment of company-level risk/reward evolves after years of outperformance, we have reduced several positions. And if fundamentals or sentiment were to shift after a strong multiyear run, we acknowledge the potential for performance reversion. But, importantly, our ownership is in companies, not sectors, and our conviction is in these companies’ immense opportunities in
an increasingly technology-centric world. Our holdings thus continue to constitute a meaningful portfolio overweight.
In contrast to our technology holdings, our health care holdings have generally performed below our expectations in recent years, implying that the projected upside we envisioned from favorable demographics and company-level innovation remains intact. The airlines have also underperformed of late and now trade at a roughly ten times forward P/E valuation despite continued growth in travel demand. Even as oil prices increase, the airlines’ substantial ongoing earnings power corroborates our contrarian view that this time can indeed be different.
Conclusion
As bottom-up stock pickers, we spend our time searching for opportunities to invest in stocks with long-term prospects we find to be materially better than market prices imply. This approach to stock selection, which drives portfolio composition and therefore sector allocation, often results in portfolios that bear little resemblance to market indexes, creating the possibility for lengthy periods of relative outperformance or underperformance. We nonetheless believe that this approach can generate superior results for shareholders over the long term.
PRIMECAP Management Company
October 23, 2018
7
PRIMECAP Core Fund
Fund Profile
As of September 30, 2018
| Portfolio Characteristics | |||
| MSCI US | DJ | ||
| Prime | U.S. Total | ||
| Market | Market | ||
| Fund | 750 Index | FA Index | |
| Number of Stocks | 152 | 752 | 3,825 |
| Median Market Cap | $75.6B | $98.5B | $73.9B |
| Price/Earnings Ratio | 18.8x | 21.4x | 21.0x |
| Price/Book Ratio | 3.5x | 3.3x | 3.1x |
| Return on Equity | 15.6% | 15.8% | 14.9% |
| Earnings Growth | |||
| Rate | 10.4% | 8.4% | 8.5% |
| Dividend Yield | 1.5% | 1.8% | 1.7% |
| Foreign Holdings | 14.0% | 0.0% | 0.0% |
| Turnover Rate | 9% | — | — |
| Ticker Symbol | VPCCX | — | — |
| Expense Ratio1 | 0.46% | — | — |
| 30-Day SEC Yield | 1.25% | — | — |
| Short-Term Reserves | 2.3% | — | — |
| Sector Diversification (% of equity exposure) | |
| Fund | |
| Consumer Discretionary | 12.3% |
| Consumer Staples | 0.3 |
| Energy | 0.7 |
| Financials | 9.8 |
| Health Care | 23.5 |
| Industrials | 20.3 |
| Information Technology | 31.5 |
| Materials | 1.0 |
| Real Estate | 0.0 |
| Telecommunication Services | 0.6 |
| Utilities | 0.0 |
Sector categories are based on the Global Industry Classification Standard (“GICS”), except for the “Other” category (if applicable), which includes securities that have not been provided a GICS classification as of the effective reporting period.
| Volatility Measures | ||
| DJ | ||
| MSCI US | U.S. Total | |
| Prime Market | Market | |
| 750 Index | FA Index | |
| R-Squared | 0.89 | 0.89 |
| Beta | 1.10 | 1.09 |
These measures show the degree and timing of the fund’s fluctuations compared with the indexes over 36 months.
| Ten Largest Holdings (% of total net assets) | ||
| Southwest Airlines Co. | Airlines | 4.8% |
| Eli Lilly & Co. | Pharmaceuticals | 4.0 |
| Alphabet Inc. | Internet Software & | |
| Services | 3.6 | |
| JPMorgan Chase & Co. | Diversified Banks | 3.3 |
| Amgen Inc. | Biotechnology | 3.3 |
| Texas Instruments Inc. | Semiconductors | 2.9 |
| Biogen Inc. | Biotechnology | 2.6 |
| Microsoft Corp. | Systems Software | 2.5 |
| AstraZeneca plc | Pharmaceuticals | 2.3 |
| NetApp Inc. | Technology | |
| Hardware, Storage & | ||
| Peripherals | 2.0 | |
| Top Ten | 31.3% | |
The holdings listed exclude any temporary cash investments and equity index products.
Investment Focus

1 The expense ratio shown is from the prospectus dated January 25, 2018, and represents estimated costs for the current fiscal year. For the fiscal year ended September 30, 2018, the expense ratio was 0.46%.
8
PRIMECAP Core Fund
Performance Summary
All of the returns in this report represent past performance, which is not a guarantee of future results that may be achieved by the fund. (Current performance may be lower or higher than the performance data cited. For performance data current to the most recent month-end, visit our website at vanguard.com/performance.) Note, too, that both investment returns and principal value can fluctuate widely, so an investor’s shares, when sold, could be worth more or less than their original cost. The returns shown do not reflect taxes that a shareholder would pay on fund distributions or on the sale of fund shares.
Cumulative Performance: September 30, 2008, Through September 30, 2018
Initial Investment of $10,000
| Average Annual Total Returns | ||||
| Periods Ended September 30, 2018 | ||||
| Final Value | ||||
| One | Five | Ten | of a $10,000 | |
| Year | Years | Years | Investment | |
| PRIMECAP Core Fund* | 18.27% | 15.66% | 13.85% | $36,576 |
| MSCI US Prime Market 750 Index | 17.93 | 13.82 | 12.10 | 31,332 |
| Multi-Cap Core Funds Average | 13.81 | 10.54 | 10.04 | 26,042 |
| Dow Jones U.S. Total Stock Market | ||||
| Float Adjusted Index | 17.58 | 13.42 | 12.05 | 31,191 |
Multi-Cap Core Funds Average: Derived from data provided by Lipper, a Thomson Reuters Company.
See Financial Highlights for dividend and capital gains information.
9
PRIMECAP Core Fund
Fiscal-Year Total Returns (%): September 30, 2008, Through September 30, 2018

10
PRIMECAP Core Fund
Financial Statements
Statement of Net Assets
As of September 30, 2018
The fund reports a complete list of its holdings in regulatory filings four times in each fiscal year, at the quarter-ends. For the second and fourth fiscal quarters, the lists appear in the fund’s semiannual and annual reports to shareholders. For the first and third fiscal quarters, the fund files the lists with the Securities and Exchange Commission on Form N-Q. Shareholders can look up the fund’s Forms N-Q on the SEC’s website at sec.gov. Forms N-Q may also be reviewed and copied at the SEC’s Public Reference Room (see the back cover of this report for further information).
| Market | |||
| Value• | |||
| Shares | ($000) | ||
| Common Stocks (97.6%) | |||
| Consumer Discretionary (12.0%) | |||
| Sony Corp. ADR | 3,649,000 | 221,312 | |
| * | CarMax Inc. | 2,044,300 | 152,648 |
| Whirlpool Corp. | 1,077,074 | 127,903 | |
| Carnival Corp. | 1,866,000 | 118,995 | |
| Royal Caribbean Cruises | |||
| Ltd. | 894,000 | 116,166 | |
| Ross Stores Inc. | 1,126,300 | 111,616 | |
| TJX Cos. Inc. | 930,000 | 104,179 | |
| *,^ | Mattel Inc. | 6,086,771 | 95,562 |
| * | Amazon.com Inc. | 30,593 | 61,278 |
| L Brands Inc. | 1,589,700 | 48,168 | |
| Walt Disney Co. | 400,000 | 46,776 | |
| VF Corp. | 300,000 | 28,035 | |
| Tribune Media Co. | |||
| Class A | 685,700 | 26,351 | |
| CBS Corp. Class B | 443,554 | 25,482 | |
| Newell Brands Inc. | 1,110,000 | 22,533 | |
| Marriott International Inc. | |||
| Class A | 101,000 | 13,335 | |
| Comcast Corp. Class A | 375,000 | 13,279 | |
| Hilton Worldwide | |||
| Holdings Inc. | 144,000 | 11,632 | |
| * | Charter Communications | ||
| Inc. Class A | 24,400 | 7,951 | |
| * | Norwegian Cruise Line | ||
| Holdings Ltd. | 130,000 | 7,466 | |
| Gildan Activewear Inc. | |||
| Class A | 195,000 | 5,934 | |
| ^ | Entercom | ||
| Communications Corp. | |||
| Class A | 694,943 | 5,490 | |
| MGM Resorts | |||
| International | 190,000 | 5,303 | |
| Restaurant Brands | |||
| International Inc. | 88,200 | 5,229 | |
| Market | |||
| Value• | |||
| Shares | ($000) | ||
| * | Michael Kors Holdings | ||
| Ltd. | 55,000 | 3,771 | |
| * | Netflix Inc. | 6,150 | 2,301 |
| McDonald’s Corp. | 7,400 | 1,238 | |
| * | Tempur Sealy | ||
| International Inc. | 22,000 | 1,164 | |
| Adient plc | 27,050 | 1,063 | |
| * | Burlington Stores Inc. | 4,600 | 749 |
| Las Vegas Sands Corp. | 9,000 | 534 | |
| 1,393,443 | |||
| Consumer Staples (0.3%) | |||
| PepsiCo Inc. | 200,000 | 22,360 | |
| Tyson Foods Inc. Class A | 125,000 | 7,441 | |
| Constellation Brands Inc. | |||
| Class A | 6,636 | 1,431 | |
| Philip Morris International | |||
| Inc. | 9,275 | 756 | |
| Altria Group Inc. | 9,924 | 599 | |
| 32,587 | |||
| Energy (0.7%) | |||
| Schlumberger Ltd. | 394,300 | 24,021 | |
| *,^ | Transocean Ltd. | 1,321,800 | 18,439 |
| Cabot Oil & Gas Corp. | 506,250 | 11,400 | |
| * | Southwestern Energy | ||
| Co. | 2,100,000 | 10,731 | |
| EOG Resources Inc. | 62,600 | 7,986 | |
| National Oilwell Varco Inc. | 150,000 | 6,462 | |
| Pioneer Natural | |||
| Resources Co. | 2,600 | 453 | |
| 79,492 | |||
| Financials (9.6%) | |||
| JPMorgan Chase & Co. | 3,429,866 | 387,026 | |
| Wells Fargo & Co. | 2,660,600 | 139,841 | |
| Discover Financial | |||
| Services | 1,790,081 | 136,852 | |
| Charles Schwab Corp. | 2,460,734 | 120,945 | |
| Marsh & McLennan | |||
| Cos. Inc. | 1,130,412 | 93,508 | |
11
| PRIMECAP Core Fund | |||
| Market | |||
| Value• | |||
| Shares | ($000) | ||
| Northern Trust Corp. | 899,450 | 91,861 | |
| Bank of America Corp. | 1,830,559 | 53,928 | |
| US Bancorp | 773,300 | 40,838 | |
| Progressive Corp. | 300,400 | 21,340 | |
| CME Group Inc. | 79,850 | 13,591 | |
| Travelers Cos. Inc. | 49,000 | 6,356 | |
| American Express Co. | 51,000 | 5,431 | |
| Comerica Inc. | 35,000 | 3,157 | |
| 1,114,674 | |||
| Health Care (22.9%) | |||
| Eli Lilly & Co. | 4,370,800 | 469,031 | |
| Amgen Inc. | 1,866,600 | 386,928 | |
| * | Biogen Inc. | 860,300 | 303,953 |
| AstraZeneca plc ADR | 6,685,200 | 264,533 | |
| Roche Holding AG | 774,100 | 187,189 | |
| Novartis AG ADR | 1,871,100 | 161,214 | |
| * | Boston Scientific Corp. | 3,522,200 | 135,605 |
| Thermo Fisher Scientific | |||
| Inc. | 552,000 | 134,732 | |
| Bristol-Myers Squibb Co. | 1,661,590 | 103,151 | |
| Abbott Laboratories | 1,402,400 | 102,880 | |
| * | Elanco Animal Health | ||
| Inc. | 2,558,800 | 89,277 | |
| Medtronic plc | 693,000 | 68,170 | |
| *,1 | Siemens Healthineers | ||
| AG | 1,260,200 | 55,370 | |
| * | Illumina Inc. | 149,000 | 54,692 |
| CVS Health Corp. | 572,377 | 45,058 | |
| Merck & Co. Inc. | 375,000 | 26,602 | |
| Agilent Technologies Inc. | 370,000 | 26,100 | |
| Sanofi ADR | 540,000 | 24,122 | |
| Zimmer Biomet Holdings | |||
| Inc. | 106,900 | 14,054 | |
| * | Waters Corp. | 65,000 | 12,654 |
| Stryker Corp. | 45,500 | 8,084 | |
| * | Cerner Corp. | 10,000 | 644 |
| 2,674,043 | |||
| Industrials (19.8%) | |||
| Southwest Airlines Co. | 9,021,525 | 563,394 | |
| FedEx Corp. | 951,500 | 229,112 | |
| Siemens AG | 1,494,108 | 191,044 | |
| * | United Continental | ||
| Holdings Inc. | 2,069,800 | 184,336 | |
| American Airlines Group | |||
| Inc. | 4,183,800 | 172,916 | |
| Airbus SE | 1,368,050 | 171,751 | |
| Caterpillar Inc. | 680,000 | 103,693 | |
| United Parcel Service | |||
| Inc. | |||
| Class B | 742,700 | 86,710 | |
| Delta Air Lines Inc. | 1,482,000 | 85,704 | |
| Jacobs Engineering | |||
| Group Inc. | 1,110,655 | 84,965 | |
| * | AECOM | 2,411,200 | 78,750 |
| Boeing Co. | 166,150 | 61,791 | ||
| Deere & Co. | 383,900 | 57,712 | ||
| Textron Inc. | 580,000 | 41,453 | ||
| Honeywell International | ||||
| Inc. | 200,000 | 33,280 | ||
| Union Pacific Corp. | 204,100 | 33,234 | ||
| Rockwell Automation Inc. | 142,700 | 26,759 | ||
| * | TransDigm Group Inc. | 54,500 | 20,290 | |
| Ritchie Bros Auctioneers | ||||
| Inc. | 384,200 | 13,881 | ||
| IDEX Corp. | 92,000 | 13,861 | ||
| General Dynamics Corp. | 65,000 | 13,307 | ||
| Pentair plc | 270,000 | 11,705 | ||
| CSX Corp. | 125,000 | 9,256 | ||
| Acuity Brands Inc. | 50,000 | 7,860 | ||
| nVent Electric plc | 270,000 | 7,333 | ||
| * | Herc Holdings Inc. | 104,000 | 5,325 | |
| Owens Corning | 30,000 | 1,628 | ||
| 2,311,050 | ||||
| Information Technology (30.8%) | ||||
| Texas Instruments Inc. | 3,124,400 | 335,217 | ||
| Microsoft Corp. | 2,587,800 | 295,967 | ||
| NetApp Inc. | 2,712,600 | 232,985 | ||
| * | Alphabet Inc. Class A | 176,827 | 213,444 | |
| * | Alphabet Inc. Class C | 170,513 | 203,502 | |
| HP Inc. | 6,739,367 | 173,673 | ||
| Hewlett Packard | ||||
| Enterprise Co. | 9,952,367 | 162,323 | ||
| NVIDIA Corp. | 469,000 | 131,798 | ||
| Cisco Systems Inc. | 2,686,600 | 130,703 | ||
| * | Flex Ltd. | 9,519,300 | 124,893 | |
| QUALCOMM Inc. | 1,674,980 | 120,649 | ||
| KLA-Tencor Corp. | 1,112,000 | 113,102 | ||
| Intel Corp. | 2,275,000 | 107,585 | ||
| Intuit Inc. | 470,000 | 106,878 | ||
| * | Adobe Systems Inc. | 370,000 | 99,881 | |
| Telefonaktiebolaget LM | ||||
| Ericsson ADR | 11,006,000 | 96,853 | ||
| * | Alibaba Group Holding | |||
| Ltd. ADR | 542,430 | 89,371 | ||
| ^ | ASML Holding NV | 457,000 | 85,925 | |
| * | Micron Technology Inc. | 1,790,000 | 80,962 | |
| Activision Blizzard Inc. | 800,000 | 66,552 | ||
| * | Keysight Technologies | |||
| Inc. | 843,300 | 55,894 | ||
| Applied Materials Inc. | 1,280,000 | 49,472 | ||
| Corning Inc. | 1,383,220 | 48,828 | ||
| * | eBay Inc. | 1,427,100 | 47,123 | |
| * | Altaba Inc. | 691,600 | 47,112 | |
| ^ | Micro Focus International | |||
| plc ADR | 2,348,401 | 43,398 | ||
| * | Dell Technologies Inc. | |||
| Class V | 418,862 | 40,680 | ||
| Analog Devices Inc. | 439,100 | 40,599 | ||
12
| PRIMECAP Core Fund | |||
| Market | |||
| Value• | |||
| Shares | ($000) | ||
| * | PayPal Holdings Inc. | 458,300 | 40,257 |
| DXC Technology Co. | 422,675 | 39,529 | |
| Visa Inc. Class A | 254,000 | 38,123 | |
| Oracle Corp. | 555,000 | 28,616 | |
| Apple Inc. | 125,000 | 28,217 | |
| * | Electronic Arts Inc. | 225,000 | 27,110 |
| * | BlackBerry Ltd. | 1,547,500 | 17,611 |
| Western Digital Corp. | 188,000 | 11,006 | |
| Perspecta Inc. | 266,997 | 6,867 | |
| Teradyne Inc. | 47,000 | 1,738 | |
| 3,584,443 | |||
| Materials (1.0%) | |||
| DowDuPont Inc. | 802,500 | 51,609 | |
| Praxair Inc. | 229,700 | 36,920 | |
| Albemarle Corp. | 131,700 | 13,141 | |
| Cabot Corp. | 125,000 | 7,840 | |
| Greif Inc. Class A | 60,000 | 3,219 | |
| Greif Inc. Class B | 33,000 | 1,902 | |
| 114,631 | |||
| Real Estate (0.0%) | |||
| Equinix Inc. | 3,100 | 1,342 | |
| Telecommunication Services (0.5%) | |||
| *,^ | Sprint Corp. | 8,480,000 | 55,459 |
| * | T-Mobile US Inc. | 97,400 | 6,836 |
| 62,295 | |||
| Total Common Stocks | |||
| (Cost $5,584,782) | 11,368,000 | ||
| Temporary Cash Investment (2.8%) | |||
| Money Market Fund (2.8%) | |||
| 2,3 | Vanguard Market Liquidity | ||
| Fund, 2.209% | |||
| (Cost $328,000) | 3,280,168 | 328,017 | |
| Total Investments (100.4%) | |||
| (Cost $5,912,782) | 11,696,017 | ||
| Amount | |
| ($000) | |
| Other Assets and Liabilities (-0.4%) | |
| Other Assets | |
| Investment in Vanguard | 589 |
| Receivables for Investment Securities Sold 9,406 | |
| Receivables for Accrued Income | 12,183 |
| Receivables for Capital Shares Issued | 2,711 |
| Other Assets | 13,631 |
| Total Other Assets | 38,520 |
| Liabilities | |
| Payables for Investment Securities | |
| Purchased | (1,001) |
| Collateral for Securities on Loan | (62,026) |
| Payables to Investment Advisor | (8,661) |
| Payables for Capital Shares Redeemed | (1,693) |
| Payables to Vanguard | (7,106) |
| Other Liabilities | (5) |
| Total Liabilities | (80,492) |
| Net Assets (100%) | |
| Applicable to 389,486,936 outstanding | |
| $.001 par value shares of beneficial | |
| interest (unlimited authorization) | 11,654,045 |
| Net Asset Value Per Share | $29.92 |
| At September 30, 2018, net assets consisted of: | |
| Amount | |
| ($000) | |
| Paid-in Capital | 5,158,971 |
| Undistributed Net Investment Income | 88,798 |
| Accumulated Net Realized Gains | 623,039 |
| Unrealized Appreciation (Depreciation) | |
| Investment Securities | 5,783,235 |
| Foreign Currencies | 2 |
| Net Assets | 11,654,045 |
• See Note A in Notes to Financial Statements.
* Non-income-producing security.
^ Includes partial security positions on loan to broker-dealers.
The total value of securities on loan is $58,377,000.
1 Security exempt from registration under Rule 144A of the
Securities Act of 1933. Such securities may be sold in
transactions exempt from registration, normally to qualified
institutional buyers. At September 30, 2018, the value of this
security represented 0.5% of net assets.
2 Affiliated money market fund available only to Vanguard
funds and certain trusts and accounts managed by Vanguard.
Rate shown is the 7-day yield.
3 Includes $62,026,000 of collateral received for securities
on loan.
ADR—American Depositary Receipt.
See accompanying Notes, which are an integral part of the Financial Statements.
13
| PRIMECAP Core Fund | |
| Statement of Operations | |
| Year Ended | |
| September 30, 2018 | |
| ($000) | |
| Investment Income | |
| Income | |
| Dividends1 | 167,913 |
| Interest 2 | 4,212 |
| Securities Lending—Net | 589 |
| Total Income | 172,714 |
| Expenses | |
| Investment Advisory Fees—Note B | 33,321 |
| The Vanguard Group—Note C | |
| Management and Administrative | 14,534 |
| Marketing and Distribution | 1,368 |
| Custodian Fees | 311 |
| Auditing Fees | 31 |
| Shareholders’ Reports and Proxy | 103 |
| Trustees’ Fees and Expenses | 14 |
| Total Expenses | 49,682 |
| Net Investment Income | 123,032 |
| Realized Net Gain (Loss) | |
| Investment Securities Sold 2 | 665,445 |
| Foreign Currencies | (55) |
| Realized Net Gain (Loss) | 665,390 |
| Change in Unrealized Appreciation (Depreciation) | |
| Investment Securities 2 | 1,041,118 |
| Foreign Currencies | (118) |
| Change in Unrealized Appreciation (Depreciation) | 1,041,000 |
| Net Increase (Decrease) in Net Assets Resulting from Operations | 1,829,422 |
1 Dividends are net of foreign withholding taxes of $3,421,000.
2 Interest income, realized net gain (loss), and change in unrealized appreciation (depreciation) from an affiliated company of the fund
were $4,212,000, $17,000, and ($49,000), respectively. Purchases and sales are for temporary cash investment purposes.
See accompanying Notes, which are an integral part of the Financial Statements.
14
| PRIMECAP Core Fund | ||
| Statement of Changes in Net Assets | ||
| Year Ended September 30, | ||
| 2018 | 2017 | |
| ($000) | ($000) | |
| Increase (Decrease) in Net Assets | ||
| Operations | ||
| Net Investment Income | 123,032 | 117,017 |
| Realized Net Gain (Loss) | 665,390 | 319,881 |
| Change in Unrealized Appreciation (Depreciation) | 1,041,000 | 1,493,605 |
| Net Increase (Decrease) in Net Assets Resulting from Operations | 1,829,422 | 1,930,503 |
| Distributions | ||
| Net Investment Income | (111,019) | (103,025) |
| Realized Capital Gain1 | (315,476) | (350,990) |
| Total Distributions | (426,495) | (454,015) |
| Capital Share Transactions | ||
| Issued | 766,774 | 782,491 |
| Issued in Lieu of Cash Distributions | 362,767 | 388,936 |
| Redeemed | (1,102,350) | (843,977) |
| Net Increase (Decrease) from Capital Share Transactions | 27,191 | 327,450 |
| Total Increase (Decrease) | 1,430,118 | 1,803,938 |
| Net Assets | ||
| Beginning of Period | 10,223,927 | 8,419,989 |
| End of Period2 | 11,654,045 | 10,223,927 |
1 Includes fiscal 2018 and 2017 short-term gain distributions totaling $10,052,000 and $12,674,000, respectively. Short-term gain
distributions are treated as ordinary income dividends for tax purposes.
2 Net Assets—End of Period includes undistributed (overdistributed) net investment income of $88,798,000 and $80,816,000.
See accompanying Notes, which are an integral part of the Financial Statements.
15
| PRIMECAP Core Fund | |||||
| Financial Highlights | |||||
| For a Share Outstanding | Year Ended September 30, | ||||
| Throughout Each Period | 2018 | 2017 | 2016 | 2015 | 2014 |
| Net Asset Value, Beginning of Period | $26.33 | $22.55 | $20.26 | $21.87 | $18.65 |
| Investment Operations | |||||
| Net Investment Income | . 3141 | .3041 | .275 | .285 | .255 |
| Net Realized and Unrealized Gain (Loss) | |||||
| on Investments | 4.379 | 4.701 | 3.047 | (.328) | 3.820 |
| Total from Investment Operations | 4.693 | 5.005 | 3.322 | (.043) | 4.075 |
| Distributions | |||||
| Dividends from Net Investment Income | (. 287) | (. 278) | (. 243) | (. 270) | (.178) |
| Distributions from Realized Capital Gains | (. 816) | (. 947) | (.789) | (1.297) | (. 677) |
| Total Distributions | (1.103) | (1.225) | (1.032) | (1.567) | (.855) |
| Net Asset Value, End of Period | $29.92 | $26.33 | $22.55 | $20.26 | $21.87 |
| Total Return2 | 18.27% | 23.13% | 16.78% | -0.73% | 22.60% |
| Ratios/Supplemental Data | |||||
| Net Assets, End of Period (Millions) | $11,654 | $10,224 | $8,420 | $6,917 | $6,828 |
| Ratio of Total Expenses to Average Net Assets | 0.46% | 0.46% | 0.46% | 0.47% | 0.50% |
| Ratio of Net Investment Income to | |||||
| Average Net Assets | 1.13% | 1.27% | 1.31% | 1.29% | 1.23% |
| Portfolio Turnover Rate | 9% | 9% | 11% | 10% | 13% |
1 Calculated based on average shares outstanding.
2 Total returns do not include account service fees that may have applied in the periods shown. Fund prospectuses provide information
about any applicable account service fees.
See accompanying Notes, which are an integral part of the Financial Statements.
16
PRIMECAP Core Fund
Notes to Financial Statements
Vanguard PRIMECAP Core Fund is registered under the Investment Company Act of 1940 as an open-end investment company, or mutual fund.
A. The following significant accounting policies conform to generally accepted accounting principles for U.S. investment companies. The fund consistently follows such policies in preparing its financial statements.
1. Security Valuation: Securities are valued as of the close of trading on the New York Stock Exchange (generally 4 p.m., Eastern time) on the valuation date. Equity securities are valued at the latest quoted sales prices or official closing prices taken from the primary market in which each security trades; such securities not traded on the valuation date are valued at the mean of the latest quoted bid and asked prices. Securities for which market quotations are not readily available, or whose values have been affected by events occurring before the fund’s pricing time but after the close of the securities’ primary markets, are valued at their fair values calculated according to procedures adopted by the board of trustees. These procedures include obtaining quotations from an independent pricing service, monitoring news to identify significant market- or security-specific events, and evaluating changes in the values of foreign market proxies (for example, ADRs, futures contracts, or exchange-traded funds), between the time the foreign markets close and the fund’s pricing time. When fair-value pricing is employed, the prices of securities used by a fund to calculate its net asset value may differ from quoted or published prices for the same securities. Investments in Vanguard Market Liquidity Fund are valued at that fund’s net asset value.
2. Foreign Currency: Securities and other assets and liabilities denominated in foreign currencies are translated into U.S. dollars using exchange rates obtained from an independent third party as of the fund’s pricing time on the valuation date. Realized gains (losses) and unrealized appreciation (depreciation) on investment securities include the effects of changes in exchange rates since the securities were purchased, combined with the effects of changes in security prices. Fluctuations in the value of other assets and liabilities resulting from changes in exchange rates are recorded as unrealized foreign currency gains (losses) until the assets or liabilities are settled in cash, at which time they are recorded as realized foreign currency gains (losses).
3. Federal Income Taxes: The fund intends to continue to qualify as a regulated investment company and distribute all of its taxable income. Management has analyzed the fund’s tax positions taken for all open federal income tax years (September 30, 2015–2018), and has concluded that no provision for federal income tax is required in the fund’s financial statements.
4. Distributions: Distributions to shareholders are recorded on the ex-dividend date. Distributions are determined on a tax basis and may differ from net investment income and realized capital gains for financial reporting purposes.
5. Securities Lending: To earn additional income, the fund lends its securities to qualified institutional borrowers. Security loans are subject to termination by the fund at any time, and are required to be secured at all times by collateral in an amount at least equal to the market value of securities loaned. Daily market fluctuations could cause the value of loaned securities to be more or less than the value of the collateral received. When this occurs, the collateral is adjusted and settled before the opening of the market on the next business day. The fund further mitigates its counterparty risk by entering into securities lending transactions only with a diverse group of prequalified counterparties, monitoring their financial strength, and entering into master securities lending agreements with its counterparties. The master securities lending agreements provide that, in the event of a counterparty’s
17
PRIMECAP Core Fund
default (including bankruptcy), the fund may terminate any loans with that borrower, determine the net amount owed, and sell or retain the collateral up to the net amount owed to the fund; however, such actions may be subject to legal proceedings. While collateral mitigates counterparty risk, in the event of a default, the fund may experience delays and costs in recovering the securities loaned. The fund invests cash collateral received in Vanguard Market Liquidity Fund, and records a liability in the Statement of Net Assets for the return of the collateral, during the period the securities are on loan. Securities lending income represents fees charged to borrowers plus income earned on invested cash collateral, less expenses associated with the loan. During the term of the loan, the fund is entitled to all distributions made on or in respect of the loaned securities.
6. Credit Facility: The fund and certain other funds managed by The Vanguard Group (“Vanguard”) participate in a $3.1 billion committed credit facility provided by a syndicate of lenders pursuant to a credit agreement that may be renewed annually; each fund is individually liable for its borrowings, if any, under the credit facility. Borrowings may be utilized for temporary and emergency purposes, and are subject to the fund’s regulatory and contractual borrowing restrictions. The participating funds are charged administrative fees and an annual commitment fee of 0.10% of the undrawn amount of the facility; these fees are allocated to the funds based on a method approved by the fund’s board of trustees and included in Management and Administrative expenses on the fund’s Statement of Operations. Any borrowings under this facility bear interest at a rate based upon the higher of the one-month London Interbank Offered Rate, federal funds effective rate, or overnight bank funding rate plus an agreed-upon spread.
The fund had no borrowings outstanding at September 30, 2018, or at any time during the period then ended.
7. Other: Dividend income is recorded on the ex-dividend date. Interest income includes income distributions received from Vanguard Market Liquidity Fund and is accrued daily. Security transactions are accounted for on the date securities are bought or sold. Costs used to determine realized gains (losses) on the sale of investment securities are those of the specific securities sold.
B. PRIMECAP Management Company provides investment advisory services to the fund for a fee calculated at an annual percentage rate of average net assets. For the year ended September 30, 2018, the investment advisory fee represented an effective annual rate of 0.31% of the fund’s average net assets.
C. In accordance with the terms of a Funds’ Service Agreement (the “FSA”) between Vanguard and the fund, Vanguard furnishes to the fund corporate management, administrative, marketing, and distribution services at Vanguard’s cost of operations (as defined by the FSA). These costs of operations are allocated to the fund based on methods and guidelines approved by the board of trustees. Vanguard does not require reimbursement in the current period for certain costs of operations (such as deferred compensation/benefits and risk/insurance costs); the fund’s liability for these costs of operations is included in Payables to Vanguard on the Statement of Net Assets. All other costs of operations payable to Vanguard are generally settled twice a month.
Upon the request of Vanguard, the fund may invest up to 0.40% of its net assets as capital in Vanguard. At September 30, 2018, the fund had contributed to Vanguard capital in the amount of $589,000, representing 0.01% of the fund’s net assets and 0.24% of Vanguard’s capitalization. The fund’s trustees and officers are also directors and employees, respectively, of Vanguard.
18
PRIMECAP Core Fund
D. Various inputs may be used to determine the value of the fund’s investments. These inputs are summarized in three broad levels for financial statement purposes. The inputs or methodologies used to value securities are not necessarily an indication of the risk associated with investing in those securities.
Level 1—Quoted prices in active markets for identical securities.
Level 2—Other significant observable inputs (including quoted prices for similar securities, interest rates, prepayment speeds, credit risk, etc.).
Level 3—Significant unobservable inputs (including the fund’s own assumptions used to determine the fair value of investments). Any investments valued with significant unobservable inputs are noted on the Statement of Net Assets.
The following table summarizes the market value of the fund’s investments as of September 30, 2018, based on the inputs used to value them:
| Level 1 | Level 2 | Level 3 | |
| Investments | ($000) | ($000) | ($000) |
| Common Stocks | 10,762,646 | 605,354 | — |
| Temporary Cash Investments | 328,017 | — | — |
| Total | 11,090,663 | 605,354 | — |
E. Permanent differences between book-basis and tax-basis components of net assets are reclassified among capital accounts in the financial statements to reflect their tax character. These reclassifications have no effect on net assets or net asset value per share. As of period end, the following permanent differences primarily attributable to the accounting for foreign currency transactions and distributions in connection with fund share redemptions were reclassified to the following accounts:
| Amount | |
| ($000) | |
| Paid-in Capital | 25,814 |
| Undistributed (Overdistributed) Net Investment Income | (4,031) |
| Accumulated Net Realized Gains (Losses) | (21,783) |
Temporary differences between book-basis and tax-basis components of accumulated net earnings (losses) arise when certain items of income, gain, or loss are recognized in different periods for financial statement and tax purposes; these differences will reverse at some time in the future. The differences are primarily related to the tax deferral of losses on wash sales. As of period end, the tax-basis components of accumulated net earnings (losses) are detailed in the table as follows:
| Amount | |
| ($000) | |
| Undistributed Ordinary Income | 103,320 |
| Undistributed Long-Term Gains | 614,810 |
| Capital Loss Carryforwards (Non-expiring) | — |
| Net Unrealized Gains (Losses) | 5,783,237 |
19
PRIMECAP Core Fund
As of September 30, 2018, gross unrealized appreciation and depreciation for investments and derivatives based on cost for U.S. federal income tax purposes were as follows:
| Amount | |
| ($000) | |
| Tax Cost | 5,912,782 |
| Gross Unrealized Appreciation | 6,030,089 |
| Gross Unrealized Depreciation | (246,854) |
| Net Unrealized Appreciation (Depreciation) | 5,783,235 |
F. During the year ended September 30, 2018, the fund purchased $948,165,000 of investment securities and sold $1,202,087,000 of investment securities, other than temporary cashinvestments.
| G. Capital shares issued and redeemed were: | ||
| Year Ended September 30, | ||
| 2018 | 2017 | |
| Shares | Shares | |
| (000) | (000) | |
| Issued | 27,645 | 32,818 |
| Issued in Lieu of Cash Distributions | 13,401 | 17,325 |
| Redeemed | (39,811) | (35,330) |
| Net Increase (Decrease) in Shares Outstanding | 1,235 | 14,813 |
H. Management has determined that no events or transactions occurred subsequent to September 30, 2018, that would require recognition or disclosure in these financial statements.
20
Report of Independent Registered Public Accounting Firm
To the Board of Trustees of Vanguard Fenway Funds and Shareholders of Vanguard PRIMECAP Core Fund
Opinion on the Financial Statements
We have audited the accompanying statement of net assets of Vanguard PRIMECAP Core Fund (one of the funds constituting Vanguard Fenway Funds, referred to hereafter as the “Fund”) as of September 30, 2018, the related statement of operations for the year ended September 30, 2018, the statement of changes in net assets for each of the two years in the period ended September 30, 2018, including the related notes, and the financial highlights for each of the five years in the period ended September 30, 2018 (collectively referred to as the “financial statements”). In our opinion, the financial statements present fairly, in all material respects, the financial position of the Fund as of September 30, 2018, the results of its operations for the year then ended, the changes in its net assets for each of the two years in the period ended September 30, 2018 and the financial highlights for each of the five years in the period ended September 30, 2018 in conformity with accounting principles generally accepted in the United States of America.
Basis for Opinion
These financial statements are the responsibility of the Fund’s management. Our responsibility is to express an opinion on the Fund’s financial statements based on our audits. We are a public accounting firm registered with the Public Company Accounting Oversight Board (United States) (“PCAOB”) and are required to be independent with respect to the Fund in accordance with the U.S. federal securities laws and the applicable rules and regulations of the Securities and Exchange Commission and the PCAOB.
We conducted our audits of these financial statements in accordance with the standards of the PCAOB. Those standards require that we plan and perform the audit to obtain reasonable assurance about whether the financial statements are free of material misstatement, whether due to error or fraud.
Our audits included performing procedures to assess the risks of material misstatement of the financial statements, whether due to error or fraud, and performing procedures that respond to those risks. Such procedures included examining, on a test basis, evidence regarding the amounts and disclosures in the financial statements. Our audits also included evaluating the accounting principles used and significant estimates made by management, as well as evaluating the overall presentation of the financial statements. Our procedures included confirmation of securities owned as of September 30, 2018 by correspondence with the custodians and brokers and by agreement to the underlying ownership records of the transfer agent; when replies were not received from brokers, we performed other auditing procedures. We believe that our audits provide a reasonable basis for our opinion.
/s/PricewaterhouseCoopers LLP
Philadelphia, Pennsylvania
November 15, 2018
We have served as the auditor of one or more investment companies in The Vanguard Group of Funds since 1975.
21
Special 2018 tax information (unaudited) for Vanguard PRIMECAP Core Fund
This information for the fiscal year ended September 30, 2018, is included pursuant to provisions of the Internal Revenue Code.
The fund distributed $326,938,000 as capital gain dividends (20% rate gain distributions) to shareholders during the fiscal year.
The fund distributed $111,019,000 of qualified dividend income to shareholders during the fiscal year.
For corporate shareholders, 100.0% of investment income (dividend income plus short-term gains, if any) qualifies for the dividends-received deduction.
22
Your Fund’s After-Tax Returns
This table presents returns for your fund both before and after taxes. The after-tax returns are shown in two ways: (1) assuming that an investor owned the fund during the entire period and paid taxes on the fund’s distributions, and (2) assuming that an investor paid taxes on the fund’s distributions and sold all shares at the end of each period.
Calculations are based on the highest individual federal income tax and capital gains tax rates in effect at the times of the distributions and the hypothetical sales. State and local taxes were not considered. After-tax returns reflect any qualified dividend income, using actual prior-year figures and estimates for 2018. (In the example, returns after the sale of fund shares may be higher than those assuming no sale. This occurs when the sale would have produced a capital loss. The calculation assumes that the investor received a tax deduction for the loss.)
Please note that your actual after-tax returns will depend on your tax situation and may differ from those shown. Also note that if you own the fund in a tax-deferred account, such as an individual retirement account or a 401(k) plan, this information does not apply to you. Such accounts are not subject to current taxes.
Finally, keep in mind that a fund’s performance—whether before or after taxes—does not guarantee future results.
| Average Annual Total Returns: PRIMECAP Core Fund | |||
| Periods Ended September 30, 2018 | |||
| One | Five | Ten | |
| Year | Years | Years | |
| Returns Before Taxes | 18.27% | 15.66% | 13.85% |
| Returns After Taxes on Distributions | 17.17 | 14.29 | 13.04 |
| Returns After Taxes on Distributions and Sale of Fund Shares | 11.46 | 12.28 | 11.46 |
23
About Your Fund’s Expenses
As a shareholder of the fund, you incur ongoing costs, which include costs for portfolio management, administrative services, and shareholder reports (like this one), among others. Operating expenses, which are deducted from a fund’s gross income, directly reduce the investment return of the fund.
A fund’s expenses are expressed as a percentage of its average net assets. This figure is known as the expense ratio. The following examples are intended to help you understand the ongoing costs (in dollars) of investing in your fund and to compare these costs with those of other mutual funds. The examples are based on an investment of $1,000 made at the beginning of the period shown and held for the entire period.
The accompanying table illustrates your fund’s costs in two ways:
• Based on actual fund return. This section helps you to estimate the actual expenses that you paid over the period. The ”Ending Account Value“ shown is derived from the fund‘s actual return, and the third column shows the dollar amount that would have been paid by an investor who started with $1,000 in the fund. You may use the information here, together with the amount you invested, to estimate the expenses that you paid over the period.
To do so, simply divide your account value by $1,000 (for example, an $8,600 account value divided by $1,000 = 8.6), then multiply the result by the number given for your fund under the heading ”Expenses Paid During Period.“
• Based on hypothetical 5% yearly return. This section is intended to help you compare your fund‘s costs with those of other mutual funds. It assumes that the fund had a yearly return of 5% before expenses, but that the expense ratio is unchanged. In this case—because the return used is not the fund’s actual return—the results do not apply to your investment. The example is useful in making comparisons because the Securities and Exchange Commission requires all mutual funds to calculate expenses based on a 5% return. You can assess your fund’s costs by comparing this hypothetical example with the hypothetical examples that appear in shareholder reports of other funds.
Note that the expenses shown in the table are meant to highlight and help you compare ongoing costs only and do not reflect transaction costs incurred by the fund for buying and selling securities. Further, the expenses do not include any purchase, redemption, or account service fees described in the fund prospectus. If such fees were applied to your account, your costs would be higher. Your fund does not carry a “sales load.”
The calculations assume no shares were bought or sold during the period. Your actual costs may have been higher or lower, depending on the amount of your investment and the timing of any purchases or redemptions.
You can find more information about the fund’s expenses, including annual expense ratios, in the Financial Statements section of this report. For additional information on operating expenses and other shareholder costs, please refer to your fund’s current prospectus.
24
| Six Months Ended September 30, 2018 | |||
| Beginning | Ending | Expenses | |
| Account Value | Account Value | Paid During | |
| PRIMECAP Core Fund | 3/31/2018 | 9/30/2018 | Period |
| Based on Actual Fund Return | $1,000.00 | $1,114.34 | $2.39 |
| Based on Hypothetical 5% Yearly Return | 1,000.00 | 1,022.81 | 2.28 |
The calculations are based on expenses incurred in the most recent six-month period. The fund’s annualized six-month expense ratio for that period is 0.45%. The dollar amounts shown as “Expenses Paid” are equal to the annualized expense ratio multiplied by the average account value over the period, multiplied by the number of days in the most recent six-month period, then divided by the number of days in the most recent 12-month period (183/365).
25
Glossary
30-Day SEC Yield. A fund’s 30-day SEC yield is derived using a formula specified by the U.S. Securities and Exchange Commission. Under the formula, data related to the fund’s security holdings in the previous 30 days are used to calculate the fund’s hypothetical net income for that period, which is then annualized and divided by the fund’s estimated average net assets over the calculation period. For the purposes of this calculation, a security’s income is based on its current market yield to maturity (for bonds), its actual income (for asset-backed securities), or its projected dividend yield (for stocks). Because the SEC yield represents hypothetical annualized income, it will differ—at times significantly—from the fund’s actual experience. As a result, the fund’s income distributions may be higher or lower than implied by the SEC yield.
Beta. A measure of the magnitude of a fund’s past share-price fluctuations in relation to the ups and downs of a given market index. The index is assigned a beta of 1.00. Compared with a given index, a fund with a beta of 1.20 typically would have seen its share price rise or fall by 12% when the index rose or fell by 10%. For this report, beta is based on returns over the past 36 months for both the fund and the index. Note that a fund’s beta should be reviewed in conjunction with its R-squared (see definition). The lower the R-squared, the less correlation there is between the fund and the index, and the less reliable beta is as an indicator of volatility.
Dividend Yield. Dividend income earned by stocks, expressed as a percentage of the aggregate market value (or of net asset value, for a fund). The yield is determined by dividing the amount of the annual dividends by the aggregate value (or net asset value) at the end of the period. For a fund, the dividend yield is based solely on stock holdings and does not include any income produced by other investments.
Earnings Growth Rate. The average annual rate of growth in earnings over the past five years for the stocks now in a fund.
Equity Exposure. A measure that reflects a fund’s investments in stocks and stock futures. Any holdings in short-term reserves are excluded.
Expense Ratio. A fund’s total annual operating expenses expressed as a percentage of the fund’s average net assets. The expense ratio includes management and administrative expenses, but does not include the transaction costs of buying and selling portfolio securities.
Foreign Holdings. The percentage of a fund represented by securities or depositary receipts of companies based outside the United States.
Inception Date. The date on which the assets of a fund (or one of its share classes) are first invested in accordance with the fund’s investment objective. For funds with a subscription period, the inception date is the day after that period ends. Investment performance is measured from the inception date.
Median Market Cap. An indicator of the size of companies in which a fund invests; the midpoint of market capitalization (market price x shares outstanding) of a fund’s stocks, weighted by the proportion of the fund’s assets invested in each stock. Stocks representing half of the fund’s assets have market capitalizations above the median, and the rest are below it.
Price/Book Ratio. The share price of a stock divided by its net worth, or book value, per share.
For a fund, the weighted average price/book ratio of the stocks it holds.
26
Price/Earnings Ratio. The ratio of a stock’s current price to its per-share earnings over the past year. For a fund, the weighted average P/E of the stocks it holds. P/E is an indicator of market expectations about corporate prospects; the higher the P/E, the greater the expectations for a company’s future growth.
R-Squared. A measure of how much of a fund’s past returns can be explained by the returns from the market in general, as measured by a given index. If a fund’s total returns were precisely synchronized with an index’s returns, its R-squared would be 1.00. If the fund’s returns bore no relationship to the index’s returns, its R-squared would be 0. For this report, R-squared is based on returns over the past 36 months for both the fund and the index.
Return on Equity. The annual average rate of return generated by a company during the past five years for each dollar of shareholder’s equity (net income divided by shareholder’s equity). For a fund, the weighted average return on equity for the companies whose stocks it holds.
Short-Term Reserves. The percentage of a fund invested in highly liquid, short-term securities that can be readily converted to cash.
Turnover Rate. An indication of the fund’s trading activity. Funds with high turnover rates incur higher transaction costs and may be more likely to distribute capital gains (which may be taxable to investors). The turnover rate excludes in-kind transactions, which have minimal impact on costs.
27
The Global Industry Classification Standard (“GICS”) was developed by and is the exclusive property and a service mark of MSCI Inc. (“MSCI”) and Standard and Poor’s, a division of McGraw-Hill Companies, Inc. (“S&P”), and is licensed for use by Vanguard. Neither MSCI, S&P nor any third party involved in making or compiling the GICS or any GICS classification makes any express or implied warranties or representations with respect to such standard or classification (or the results to be obtained by the use thereof), and all such parties hereby expressly disclaim all warranties of originality, accuracy, completeness, merchantability or fitness for a particular purpose with respect to any such standard or classification. Without limiting any of the foregoing, in no event shall MSCI, S&P, any of its affiliates or any third party involved in making or compiling the GICS or any GICS classification have any liability for any direct, indirect, special, punitive, consequential or any other damages (including lost profits) even if notified of the possibility of such damages.
28
This page intentionally left blank.
This page intentionally left blank.
The People Who Govern Your Fund
The trustees of your mutual fund are there to see that the fund is operated and managed in your best interests since, as a shareholder, you are a part owner of the fund. Your fund’s trustees also serve on the board of directors of The Vanguard Group, Inc., which is owned by the Vanguard funds and provides services to them on an at-cost basis.
A majority of Vanguard’s board members are independent, meaning that they have no affiliation with Vanguard or the funds they oversee, apart from the sizable personal investments they have made as private individuals. The independent board members have distinguished backgrounds in business, academia, and public service. Each of the trustees and executive officers oversees 211 Vanguard funds.
Information for each trustee and executive officer of the fund appears below. The mailing address of the trustees and officers is P.O. Box 876, Valley Forge, PA 19482. More information about the trustees is in the Statement of Additional Information, which can be obtained, without charge, by contacting Vanguard at 800-662-7447, or online at vanguard.com.
Interested Trustees1
F. William McNabb III
Born in 1957. Trustee since July 2009. Principal occupation(s) during the past five years and other experience: chairman of the board (January 2010–present) of Vanguard and of each of the investment companies served by Vanguard, trustee (2009–present) of each of the investment companies served by Vanguard, and director (2008–present) of Vanguard. Chief executive officer and president (2008–2017) of Vanguard and each of the investment companies served by Vanguard, managing director (1995–2008) of Vanguard, and director (1997–2018) of Vanguard Marketing Corporation. Director (2018–present) of UnitedHealth Group.
Mortimer J. Buckley
Born in 1969. Trustee since January 2018. Principal occupation(s) during the past five years and other experience: chief executive officer (January 2018–present) of Vanguard; chief executive officer, president, and trustee (January 2018–present) of each of the investment companies served by Vanguard; president and director (2017–present) of Vanguard; and president (February 2018–present) of Vanguard Marketing Corporation. Chief investment officer (2013–2017), managing director (2002–2017), head of the Retail Investor Group (2006–2012), and chief information officer (2001–2006) of Vanguard. Chairman of the board (2011–2017) of the Children’s Hospital of Philadelphia.
Independent Trustees
Emerson U. Fullwood
Born in 1948. Trustee since January 2008. Principal occupation(s) during the past five years and other experience: executive chief staff and marketing officer for North America and corporate vice president (retired 2008) of Xerox Corporation (document management products and services). Former president of the Worldwide Channels Group, Latin America, and Worldwide Customer Service and executive chief staff officer of Developing Markets of Xerox. Executive in residence and 2009–2010 Distinguished Minett Professor at the Rochester Institute of Technology. Lead director of SPX FLOW, Inc. (multi-industry manufacturing). Director of the University of Rochester Medical Center, the Monroe Community College Foundation, the United Way of Rochester, North Carolina A&T University, and Roberts Wesleyan College. Trustee of the University of Rochester.
Amy Gutmann
Born in 1949. Trustee since June 2006. Principal occupation(s) during the past five years and other experience: president (2004–present) of the University of Pennsylvania. Christopher H. Browne Distinguished Professor of Political Science, School of Arts and Sciences, and professor of communication, Annenberg School for Communication, with secondary faculty appointments in the Department of Philosophy, School of Arts and Sciences, and at the Graduate School of Education, University of Pennsylvania. Trustee of the National Constitution Center.
1 Mr. McNabb and Mr. Buckley are considered “interested persons,” as defined in the Investment Company Act of 1940, because they are officers of the Vanguard funds.
JoAnn Heffernan Heisen
Born in 1950. Trustee since July 1998. Principal occupation(s) during the past five years and other experience: corporate vice president of Johnson & Johnson (pharmaceuticals/medical devices/consumer products) and member of its executive committee (1997–2008). Chief global diversity officer (retired 2008), vice president and chief information officer (1997–2006), controller (1995–1997), treasurer (1991–1995), and assistant treasurer (1989–1991) of Johnson & Johnson. Director of Skytop Lodge Corporation (hotels) and the Robert Wood Johnson Foundation. Member of the advisory board of the Institute for Women’s Leadership at Rutgers University.
F. Joseph Loughrey
Born in 1949. Trustee since October 2009. Principal occupation(s) during the past five years and other experience: president and chief operating officer (retired 2009) and vice chairman of the board (2008–2009) of Cummins Inc. (industrial machinery). Chairman of the board of Hillenbrand, Inc. (specialized consumer services), Oxfam America, and the Lumina Foundation for Education. Director of the V Foundation for Cancer Research. Member of the advisory council for the College of Arts and Letters and chair of the advisory board to the Kellogg Institute for International Studies, both at the University of Notre Dame.
Mark Loughridge
Born in 1953. Trustee since March 2012. Principal occupation(s) during the past five years and other experience: senior vice president and chief financial officer (retired 2013) of IBM (information technology services). Fiduciary member of IBM’s Retirement Plan Committee (2004–2013), senior vice president and general manager (2002–2004) of IBM Global Financing, vice president and controller (1998–2002) of IBM, and a variety of other prior management roles at IBM. Member of the Council on Chicago Booth.
Scott C. Malpass
Born in 1962. Trustee since March 2012. Principal occupation(s) during the past five years and other experience: chief investment officer (1989–present) and vice president (1996–present) of the University of Notre Dame. Assistant professor of finance at the Mendoza College of Business, University of Notre Dame, and member of the Notre Dame 403(b) Investment Committee. Chairman of the board of TIFF Advisory Services, Inc. Member of the board of Catholic Investment Services, Inc. (investment advisors), the board of advisors for Spruceview Capital Partners, and the board of superintendence of the Institute for the Works of Religion.
Deanna Mulligan
Born in 1963. Trustee since January 2018. Principal occupation(s) during the past five years and other experience: president (2010–present) and chief executive officer (2011–present) of The Guardian Life Insurance Company of America. Chief operating officer (2010–2011) and executive vice president (2008–2010) of Individual Life and Disability of The Guardian Life Insurance Company of America. Member of the board of The Guardian Life Insurance Company of America, the American Council of Life Insurers, the Partnership for New York City (business leadership), and the Committee Encouraging Corporate Philanthropy. Trustee of the Economic Club of New York and the Bruce Museum (arts and science). Member of the Advisory Council for the Stanford Graduate School of Business.
André F. Perold
Born in 1952. Trustee since December 2004. Principal occupation(s) during the past five years and other experience: George Gund Professor of Finance and Banking, Emeritus at the Harvard Business School (retired 2011). Chief investment officer and co-managing partner of HighVista Strategies LLC (private investment firm). Overseer of the Museum of Fine Arts Boston.
Sarah Bloom Raskin
Born in 1961. Trustee since January 2018. Principal occupation(s) during the past five years and other experience: deputy secretary (2014–2017) of the United States Department of the Treasury. Governor (2010–2014) of the Federal Reserve Board. Commissioner (2007–2010) of financial regulation for the State of Maryland. Member of the board of directors (2012–2014) of Neighborhood Reinvestment Corporation. Director of i(x) Investments, LLC.
Peter F. Volanakis
Born in 1955. Trustee since July 2009. Principal occupation(s) during the past five years and other experience: president and chief operating officer (retired 2010) of Corning Incorporated (communications equipment) and director of Corning Incorporated (2000–2010) and Dow Corning (2001–2010). Director (2012) of SPX Corporation (multi-industry manufacturing). Overseer of the Amos Tuck School of Business Administration, Dartmouth College (2001–2013). Chairman of the board of trustees of Colby-Sawyer College. Member of the Board of Hypertherm Inc. (industrial cutting systems, software, and consumables).
Executive Officers
Glenn Booraem
Born in 1967. Principal occupation(s) during the past five years and other experience: principal of Vanguard. Investment stewardship officer (2017–present), treasurer (2015–2017), controller (2010–2015), and assistant controller (2001–2010) of each of the investment companies served by Vanguard.
Christine M. Buchanan
Born in 1970. Principal occupation(s) during the past five years and other experience: principal of Vanguard and global head of Fund Administration at Vanguard. Treasurer (2017–present) of each of the investment companies served by Vanguard. Partner (2005–2017) at KPMG LLP (audit, tax, and advisory services).
Brian Dvorak
Born in 1973. Principal occupation(s) during the past five years and other experience: principal of Vanguard. Chief compliance officer (2017–present) of Vanguard and each of the investment companies served by Vanguard. Assistant vice president (2017–present) of Vanguard Marketing Corporation. Vice president and director of Enterprise Risk Management (2011–2013) at Oppenheimer Funds, Inc.
Thomas J. Higgins
Born in 1957. Principal occupation(s) during the past five years and other experience: principal of Vanguard. Chief financial officer (2008–present) and treasurer (1998–2008) of each of the investment companies served by Vanguard.
Peter Mahoney
Born in 1974. Principal occupation(s) during the past five years and other experience: principal of Vanguard. Controller (2015–present) of each of the investment companies served by Vanguard. Head of International Fund Services (2008–2014) at Vanguard.
Anne E. Robinson
Born in 1970. Principal occupation(s) during the past five years and other experience: general counsel (2016–present) of Vanguard. Secretary (2016–present) of Vanguard and of each of the investment companies served by Vanguard. Managing director (2016–present) of Vanguard. Director and senior vice president (2016–2018) of Vanguard Marketing Corporation. Managing director and general counsel of Global Cards and Consumer Services (2014–2016) at Citigroup. Counsel (2003–2014) at American Express.
Michael Rollings
Born in 1963. Principal occupation(s) during the past five years and other experience: finance director (2017–present) and treasurer (2017) of each of the investment companies served by Vanguard. Managing director (2016–present) of Vanguard. Chief financial officer (2016–present) of Vanguard. Director (2016–present) of Vanguard Marketing Corporation. Executive vice president and chief financial officer (2006–2016) of MassMutual Financial Group.
| Vanguard Senior Management Team | |
| Joseph Brennan | Chris D. McIsaac |
| Mortimer J. Buckley | James M. Norris |
| Gregory Davis | Thomas M. Rampulla |
| John James | Karin A. Risi |
| Martha G. King | Anne E. Robinson |
| John T. Marcante | Michael Rollings |
| Chairman Emeritus and Senior Advisor | |
| John J. Brennan | |
| Chairman, 1996–2009 | |
| Chief Executive Officer and President, 1996–2008 | |
| Founder | |
| John C. Bogle | |
| Chairman and Chief Executive Officer, 1974–1996 | |
 | |
| P.O. Box 2600 Valley Forge, PA 19482-2600 | |
Connect with Vanguard® > vanguard.com | |
| Fund Information > 800-662-7447 | Source for Bloomberg Barclays indexes: Bloomberg |
| Direct Investor Account Services > 800-662-2739 | Index Services Limited. Copyright 2018, Bloomberg. All |
| Institutional Investor Services > 800-523-1036 | rights reserved. |
| Text Telephone for People | |
| Who Are Deaf or Hard of Hearing > 800-749-7273 | |
| This material may be used in conjunction | |
| with the offering of shares of any Vanguard | |
| fund only if preceded or accompanied by | |
| the fund’s current prospectus. | |
| All comparative mutual fund data are from Lipper, a | |
| Thomson Reuters Company, or Morningstar, Inc., unless | |
| otherwise noted. | |
| You can obtain a free copy of Vanguard’s proxy voting | |
| guidelines by visiting vanguard.com/proxyreporting or by | |
| calling Vanguard at 800-662-2739. The guidelines are | |
| also available from the SEC’s website, sec.gov. In | |
| addition, you may obtain a free report on how your fund | |
| voted the proxies for securities it owned during the 12 | |
| months ended June 30. To get the report, visit either | |
| vanguard.com/proxyreporting or sec.gov. | |
| You can review and copy information about your fund at | |
| the SEC’s Public Reference Room in Washington, D.C. To | |
| find out more about this public service, call the SEC at | |
| 202-551-8090. Information about your fund is also | |
| available on the SEC’s website, and you can receive | |
| copies of this information, for a fee, by sending a | |
| request in either of two ways: via email addressed to | |
| publicinfo@sec.gov or via regular mail addressed to the | |
| Public Reference Section, Securities and Exchange | |
| Commission, Washington, DC 20549-1520. | |
| © 2018 The Vanguard Group, Inc. | |
| All rights reserved. | |
| Vanguard Marketing Corporation, Distributor. | |
| Q12200 112018 | |
Item 2: Code of Ethics. The Registrant has adopted a code of ethics that applies to the Registrant’s principal
executive officer, principal financial officer, principal accounting officer or controller or persons performing similar
functions. The Code of Ethics was amended during the reporting period covered by this report to make certain
technical, non-material changes.
Item 3: Audit Committee Financial Expert. All members of the Audit Committee have been determined by the
Registrant’s Board of Trustees to be Audit Committee Financial Experts and to be independent: JoAnn Heffernan
Heisen, F. Joseph Loughrey, Mark Loughridge, Sarah Bloom Raskin, and Peter F. Volanakis.
Item 4: Principal Accountant Fees and Services.
(a) Audit Fees.
Audit Fees of the Registrant
Fiscal Year Ended September 30, 2018: $57,000
Fiscal Year Ended September 30, 2017: $62,000
Aggregate Audit Fees of Registered Investment Companies in the Vanguard Group.
Fiscal Year Ended September 30, 2018: $9,734,277
Fiscal Year Ended September 30, 2017: $8,424,459
Includes fees billed in connection with audits of the Registrant, other registered investment companies in the
Vanguard complex, The Vanguard Group, Inc. and Vanguard Marketing Corporation.
(b) Audit-Related Fees.
Fiscal Year Ended September 30, 2018: $5,581,336
Fiscal Year Ended September 30, 2017: $3,194,093
Includes fees billed in connection with assurance and related services provided to the Registrant, other
registered investment companies in the Vanguard complex, The Vanguard Group, Inc., and Vanguard
Marketing Corporation.
(c) Tax Fees.
Fiscal Year Ended September 30, 2018: $347,985
Fiscal Year Ended September 30, 2017: $274,313
Includes fees billed in connection with tax compliance, planning, and advice services provided to the
Registrant, other registered investment companies in the Vanguard complex, The Vanguard Group, Inc., and
Vanguard Marketing Corporation.
(d) All Other Fees.
Fiscal Year Ended September 30, 2018: $0
Fiscal Year Ended September 30, 2017: $0
Includes fees billed for services related to tax reported information provided to the Registrant, other registered
investment companies in the Vanguard complex, The Vanguard Group, Inc., and Vanguard Marketing
Corporation.
(e) (1) Pre-Approval Policies. The policy of the Registrant’s Audit Committee is to consider and, if
appropriate, approve before the principal accountant is engaged for such services, all specific audit and non-
audit services provided to: the Registrant, other registered investment companies in the Vanguard complex,
The Vanguard Group, Inc., and entities controlled by The Vanguard Group, Inc. that provide ongoing services
to the Registrant. In making a determination, the Audit Committee considers whether the services are
consistent with maintaining the principal accountant’s independence.
In the event of a contingency situation in which the principal accountant is needed to provide services in
between scheduled Audit Committee meetings, the Chairman of the Audit Committee would be called on to
consider and, if appropriate, pre-approve audit or permitted non-audit services in an amount sufficient to
complete services through the next Audit Committee meeting, and to determine if such services would be
consistent with maintaining the accountant’s independence. At the next scheduled Audit Committee meeting,
services and fees would be presented to the Audit Committee for formal consideration, and, if appropriate,
approval by the entire Audit Committee. The Audit Committee would again consider whether such services and
fees are consistent with maintaining the principal accountant’s independence.
The Registrant’s Audit Committee is informed at least annually of all audit and non-audit services provided
by the principal accountant to the Vanguard complex, whether such services are provided to: the Registrant,
other registered investment companies in the Vanguard complex, The Vanguard Group, Inc., or other entities
controlled by The Vanguard Group, Inc. that provide ongoing services to the Registrant.
(2) No percentage of the principal accountant’s fees or services were approved pursuant to the waiver
provision of paragraph (c)(7)(i)(C) of Rule 2-01 of Regulation S-X.
(f) For the most recent fiscal year, over 50% of the hours worked under the principal accountant’s
engagement were not performed by persons other than full-time, permanent employees of the principal
accountant.
(g) Aggregate Non-Audit Fees.
Fiscal Year Ended September 30, 2018: $347,985
Fiscal Year Ended September 30, 2017: $274,313
Includes fees billed for non-audit services provided to the Registrant, other registered investment companies in
the Vanguard complex, The Vanguard Group, Inc., and Vanguard Marketing Corporation.
(h) For the most recent fiscal year, the Audit Committee has determined that the provision of all non-audit
services was consistent with maintaining the principal accountant’s independence.
Item 5: Audit Committee of Listed Registrants.
The Registrant is a listed issuer as defined in rule 10A-3 under the Securities Exchange Act of 1934 (“Exchange Act”).
The Registrant has a separately-designated standing audit committee established in accordance with Section
3(a)(58)(A) of the Exchange Act. The Registrant’s audit committee members are: JoAnn Heffernan Heisen, F. Joseph
Loughrey, Mark Loughridge, Sarah Bloom Raskin, and Peter F. Volanakis.
Item 6: Investments.
Not Applicable.
Item 7: Disclosure of Proxy Voting Policies and Procedures for Closed-End Management Investment Companies.
Not Applicable.
Item 8: Portfolio Managers of Closed-End Management Investment Companies.
Not Applicable.
Item 9: Purchase of Equity Securities by Closed-End Management Investment Company and Affiliated Purchasers.
Not Applicable.
Item 10: Submission of Matters to a Vote of Security Holders.
Not Applicable.
Item 11: Controls and Procedures.
(a) Disclosure Controls and Procedures. The Principal Executive and Financial Officers concluded
that the Registrant’s Disclosure Controls and Procedures are effective based on their evaluation of the
Disclosure Controls and Procedures as of a date within 90 days of the filing date of this report.
(b) Internal Control Over Financial Reporting. There were no significant changes in Registrant’s
Internal Control Over Financial Reporting or in other factors that could significantly affect this control
subsequent to the date of the evaluation, including any corrective actions with regard to significant deficiencies
and material weaknesses.
Item 12: Disclosure of Securities Lending Activities for Closed-End Management
Investment Companies.
Not Applicable.
Item 13: Exhibits.
(a) Code of Ethics.
(b) Certifications.
Pursuant to the requirements of the Securities Exchange Act of 1934 and the Investment Company Act of
1940, the registrant has duly caused this report to be signed on its behalf by the undersigned, thereunto duly
authorized.
| VANGUARD FENWAY FUNDS | |
| By: | /s/ MORTIMER J. BUCKLEY* |
| MORTIMER J. BUCKLEY | |
| CHIEF EXECUTIVE OFFICER | |
| Date: November 16, 2018 | |
Pursuant to the requirements of the Securities Exchange Act of 1934 and the Investment Company Act of
1940, this report has been signed below by the following persons on behalf of the registrant and in the
capacities and on the dates indicated.
| VANGUARD FENWAY FUNDS | |
| By: | /s/ MORTIMER J. BUCKLEY* |
| MORTIMER J. BUCKLEY | |
| CHIEF EXECUTIVE OFFICER | |
| Date: November 16, 2018 | |
| VANGUARD FENWAY FUNDS | |
| By: | /s/ THOMAS J. HIGGINS* |
| THOMAS J. HIGGINS | |
| CHIEF FINANCIAL OFFICER | |
| Date: November 16, 2018 | |
* By: /s/ Anne E. Robinson
Anne E. Robinson, pursuant to a Power of Attorney filed on January 18, 2018 see file Number 33-32216,
Incorporated by Reference.