UNITED STATES
SECURITIES AND EXCHANGE COMMISSION
Washington, D.C. 20549
FORM N-CSR
CERTIFIED SHAREHOLDER REPORT
OF
REGISTERED MANAGEMENT INVESTMENT COMPANIES
| Investment Company Act file number: | 811-05445 | |
Name of Registrant: | Vanguard Fenway Funds | |
Address of Registrant: | P.O. Box 2600 | |
| Valley Forge, PA 19482 | ||
Name and address of agent for service: | Anne E. Robinson, Esquire | |
| P.O. Box 876 | ||
| Valley Forge, PA 19482 | ||
Registrant’s telephone number, including area code: (610) 669-1000 | ||
Date of fiscal year end: September 30 | ||
Date of reporting period: October 1, 2015 – September 30, 2016 | ||
Item 1: Reports to Shareholders | ||
Annual Report | September 30, 2016
Vanguard Equity Income Fund
A new format, unwavering commitment
As you begin reading this report, you’ll notice that we’ve made some improvements to the opening sections—based on feedback from you, our clients.
Page 1 starts with a new ”Your Fund’s Performance at a Glance,” a concise, handy summary of how your fund performed during the period.
In the renamed ”Chairman’s Perspective,” Bill McNabb will focus on enduring principles and investment insights.
We’ve modified some tables, and eliminated some redundancy, but we haven’t removed any information.
At Vanguard, we’re always looking for better ways to communicate and to help you make sound investment decisions. Thank you for entrusting your assets to us.
| Contents | |
| Your Fund’s Performance at a Glance. | 1 |
| Chairman’s Perspective. | 3 |
| Advisors’ Report. | 6 |
| Fund Profile. | 10 |
| Performance Summary. | 11 |
| Financial Statements. | 13 |
| Your Fund’s After-Tax Returns. | 28 |
| About Your Fund’s Expenses. | 29 |
| Glossary. | 31 |
Please note: The opinions expressed in this report are just that—informed opinions. They should not be considered promises or advice.
Also, please keep in mind that the information and opinions cover the period through the date on the front of this report. Of course, the
risks of investing in your fund are spelled out in the prospectus.
See the Glossary for definitions of investment terms used in this report.
About the cover: No matter what language you speak, Vanguard has one consistent message and set of principles. Our primary
focus is on you, our clients. We conduct our business with integrity as a faithful steward of your assets. This message is shown
translated into seven languages, reflecting our expanding global presence.
Your Fund’s Performance at a Glance
• The fund returned more than 17% for the 12 months ended September 30, 2016. It trailed its benchmark’s 18.89% return but exceeded the 13.93% average return of its peers.
• All ten industry sectors represented in the fund during the entire period posted positive results. Only consumer discretionary and financials returned less than 10%.
• Information technology (+29%), materials (+25%), and telecommunication services stocks (+24%) posted the highest returns, but the latter two trailed the benchmark’s corresponding sectors by several percentage points.
• Health care (+15%) and energy (+14%) were notable underperformers because of lagging selections by the fund’s advisors.
• Near the end of the period, most real estate investment trusts were moved out of the financial sector and into the new real estate sector, the 11th in the benchmark.
• Over the past ten years, the fund’s average annual return exceeded that of its benchmark index and its peer group.
| Total Returns: Fiscal Year Ended September 30, 2016 | |
| Total | |
| Returns | |
| Vanguard Equity Income Fund | |
| Investor Shares | 17.21% |
| Admiral™ Shares | 17.35 |
| FTSE High Dividend Yield Index | 18.89 |
| Equity Income Funds Average | 13.93 |
| Equity Income Funds Average: Derived from data provided by Lipper, a Thomson Reuters Company. | |
| Admiral Shares carry lower expenses and are available to investors who meet certain account-balance requirements. | |
1
| Total Returns: Ten Years Ended September 30, 2016 | |
| Average | |
| Annual Return | |
| Equity Income Fund Investor Shares | 7.63% |
| Spliced Equity Income Index | 7.40 |
| Equity Income Funds Average | 5.79 |
| For a benchmark description, see the Glossary. | |
| Equity Income Funds Average: Derived from data provided by Lipper, a Thomson Reuters Company. | |
The figures shown represent past performance, which is not a guarantee of future results. (Current performance may be lower or higher than the performance data cited. For performance data current to the most recent month-end, visit our website at vanguard.com/performance.) Note, too, that both investment returns and principal value can fluctuate widely, so an investor’s shares, when sold, could be worth more or less than their original cost.
| Expense Ratios | |||
| Your Fund Compared With Its Peer Group | |||
| Investor | Admiral | Peer Group | |
| Shares | Shares | Average | |
| Equity Income Fund | 0.26% | 0.17% | 1.20% |
The fund expense ratios shown are from the prospectus dated January 27, 2016, and represent estimated costs for the current fiscal year. For the fiscal year ended September 30, 2016, the fund’s expense ratios were 0.26% for Investor Shares and 0.17% for Admiral Shares. The peer-group expense ratio is derived from data provided by Lipper, a Thomson Reuters Company, and captures information through year-end 2015.
Peer group: Equity Income Funds.
2
Chairman’s Perspective

Bill McNabb
Chairman and Chief Executive Officer
Dear Shareholder,
If you think you’ve had reason to feel uneasy about the investment environment lately, you’re not imagining things. In just the past few months, we’ve seen economic uncertainty, intense political polarization, and super-low bond yields. Yet at the same time, the stock market kept pushing higher.
In this confusing and sometimes contradictory climate, you may be asking yourself a question that I hear often: How do I make sense of all this, keep investing, and still get a good night’s sleep?
As with any problem, there are multiple ways to go at it. But there’s one approach in particular that is simple, straightforward, and nearly foolproof: Save more money. Not only can saving more give you a greater sense of control over your investment plan, it can help compensate for long-term returns that, in our estimation, could fall short of historical averages.
I love the way one of our investment pros put it. Fran Kinniry this summer told The Wall Street Journal, “Investing is always a partnership between you and the markets.” He explained that the markets carried more than their fair share of the weight for a couple of decades, through the 1990s, providing outsized returns that made the investor’s half of the partnership relatively light work. “But now you are going to have to be the majority partner.”
Sobering? Sure. Hopeless? Definitely not.
3
Over the 12 months since last September, U.S. stocks returned 15%, though the rise has not been a one-way ticket straight up. International markets have also posted strong returns, but lower than those of the broad U.S. market. The decision by United Kingdom voters in June to exit the European Union came as a surprise but caused market heartburn for only a few days.
In fixed income, yields remained extremely low—about 1.60% on the 10-year U.S. Treasury note at the end of September, after dipping below 1.40% over the summer. And bond yields in some international markets were negative.
Even this relatively small window of time illustrates a truism of the financial markets: There will always be segments that perform well and others that don’t. Saving more saves you from trying to control the uncontrollable—how economies and the markets perform. And it keeps you in control of one of the most vital parts of your investment program.
Although the “save more” logic is easy to grasp, it’s not always easy to follow. Bills, illness, the loss of a job—these can affect any of us.
But whatever our circumstances, figuring out how to save more is worth the effort. It requires that we make difficult decisions to forgo some consumption today to increase the likelihood of consuming (or consuming more) in the future. This is the very heart of investing. Sacrifices are never fun, so consider carrying them out systematically and in doses that you
| Market Barometer | |||
| Average Annual Total Returns | |||
| Periods Ended September 30, 2016 | |||
| One | Three | Five | |
| Year | Years | Years | |
| Stocks | |||
| Russell 1000 Index (Large-caps) | 14.93% | 10.78% | 16.41% |
| Russell 2000 Index (Small-caps) | 15.47 | 6.71 | 15.82 |
| Russell 3000 Index (Broad U.S. market) | 14.96 | 10.44 | 16.36 |
| FTSE All-World ex US Index (International) | 9.62 | 0.71 | 6.50 |
| Bonds | |||
| Bloomberg Barclays U.S. Aggregate Bond Index | |||
| (Broad taxable market) | 5.19% | 4.03% | 3.08% |
| Bloomberg Barclays Municipal Bond Index | |||
| (Broad tax-exempt market) | 5.58 | 5.54 | 4.48 |
| Citigroup Three-Month U.S. Treasury Bill Index | 0.20 | 0.06 | 0.06 |
| CPI | |||
| Consumer Price Index | 1.46% | 1.03% | 1.25% |
4
can be comfortable with—for instance, gradually getting up to the max in your IRA, or adding a percentage point or so to the amount you stash in your employer’s retirement plan. As a point of reference, we generally suggest that investors strive for a retirement savings rate of 12%–15%, including any employer contributions.
If you need more convincing about the wisdom of the “save more” course of action, it might be helpful to examine your alternatives. This list is by no means exhaustive, but it hits on a few of the big ones, and none are without risk.
• Reach for yield. With yields so low on many types of bonds, it’s tempting to find the corners of the fixed income market where payouts are juicier. But with the juice comes considerable risk. You need to be aware that you’d be taking on more risk—and how much more.
• Go all-in on a hot-performing asset class or fund. By now, you know better than that, right?
• Sit tight. This approach isn’t a terrible idea; it’s better than panicking and deciding to just “do something,” particularly if that means changing your approach in response to the market’s movements.
Here’s the inescapably challenging part of your partnership with the markets: In the short run, your “partner” is fickle, emotional, and wildly unpredictable. But in the long run, your partner is mostly rational and extremely helpful.
The best way to minimize your vulnerability to the market’s mood swings, and to maximize the benefit of your partner’s longer-term strengths, is to expect less and save more. Maybe the markets will deliver better-than-expected returns. Maybe they’ll be consistent with our more modest expectations. In either case, a higher savings rate can help put you in a better position to reach your goals.
As always, thank you for investing with Vanguard.
Sincerely,

F. William McNabb III
Chairman and Chief Executive Officer
October 18, 2016
5
Advisors’ Report
For the fiscal year ended September 30, 2016, Vanguard Equity Income Fund returned more than 17%, a step behind its benchmark but ahead of the average return of its peers and the broad U.S. stock market. Your fund is managed by two independent investment advisors, Wellington Management Company and Vanguard’s Quantitative Equity Group. The use of two advisors provides exposure to distinct yet complementary investment approaches, enhancing the diversification of your fund. It is not uncommon for different advisors to have different views about individual securities or the broader investment environment.
The advisors, the percentage and amount of the fund’s assets each manages, and brief descriptions of their investment
strategies are presented in the table below. The advisors have also prepared a discussion of the investment environment that existed during the fiscal year and of how their portfolio positioning reflects this assessment. These comments were prepared on October 17, 2016.
Wellington Management Company llp
Portfolio Manager:
W. Michael Reckmeyer, III, CFA,
Senior Managing Director
and Equity Portfolio Manager
Investors experienced a choppy 12 months highlighted by divergent central bank actions, global uncertainty, oil price fluctuations, and the United Kingdom’s unexpected decision to leave the European
| Vanguard Equity Income Fund Investment Advisors | |||
| Fund Assets Managed | |||
| Investment Advisor | % | $ Million | Investment Strategy |
| Wellington Management | 64 | 15,105 | A fundamental approach to seeking desirable stocks. |
| Company LLP | Our selections typically offer above-average dividend | ||
| yields, below-average valuations, and the potential for | |||
| dividend increases in the future. | |||
| Vanguard Quantitative Equity | 34 | 8,142 | Employs a quantitative fundamental management |
| Group | approach, using models that assess valuation, growth | ||
| prospects, management decisions, market sentiment, | |||
| and earnings and balance-sheet quality of companies | |||
| as compared with their peers. | |||
| Cash Investments | 2 | 355 | These short-term reserves are invested by Vanguard in |
| equity index products to simulate investment in stocks. | |||
| Each advisor may also maintain a modest cash | |||
| position. | |||
6
Union. The much-anticipated monetary-policy divergence materialized in late 2015 when the European Central Bank and the Bank of Japan announced additional policy easing—including negative interest rates and additional purchases of domestic securities—and the U.S. Federal Reserve initiated its well-telegraphed liftoff in December.
The start of 2016 was volatile as Chinese stocks plunged in early January, sparking global “risk-off” trading. U.S. stocks moved in virtual lockstep with the price of oil at the start of the year as fears of a recession weighed on investors’ minds. Markets then surged in the second half of the quarter as solid economic data, stabilization in oil prices, and accommodative Fed comments helped calm the market’s jitters. However, June brought fresh concerns largely because of the British vote to leave the European Union.
Despite a negative initial market reaction, U.S. stocks staged an impressive comeback, keeping the seven-year-old bull market intact. The third quarter was relatively uneventful, as markets rose amid subsiding Brexit fears and expectations for continued accommodative monetary policy from central banks around the globe. At its September meeting, the Fed decided to leave interest rates unchanged as Fed Chair Janet Yellen indicated that the case for a rate increase had strengthened but not enough to warrant a move. There was some volatility in September because of the U.S. presidential election campaign, tepid economic data, and valuation concerns.
Our modest underperformance was driven by sector allocation, a function of our bottom-up stock selection process. A cash position in a strong equity market and an overweight allocation to financials detracted most from relative performance. Stock selection in health care, utilities, and telecommunication services also hurt performance. Among individual stocks, our positions in Marathon Oil and Novartis, as well as our decision not to own benchmark constituent AT&T, detracted most. We eliminated our position in Marathon Oil as eroding oil fundamentals caused management to cut its dividend.
Security selection contributed to relative performance, led by energy, financials, and industrials. An underweight allocation to consumer discretionary also aided relative performance. Top individual contributors to relative performance included Marsh & McLennan and our new position in TransCanada. Our decision not to own energy company Kinder Morgan also benefited portfolio performance.
At the end of the period, we were most overweighted in financials, health care, and energy. Consumer staples, information technology, and telecommunication services were most underweighted relative to the benchmark.
Significant purchases in the past 12 months included new positions in VF, Canadian Natural Resources, and TransCanada. We also added to our position in Philip Morris International. We trimmed our position in Home Depot
7
and eliminated National Grid, Waste Management, and Texas Instruments based on our valuation concerns.
As always, we remain focused on finding investment opportunities in quality dividend-paying companies with attractive total return potential at discounted valuations.
Vanguard Quantitative Equity Group
Portfolio Managers:
Michael R. Roach, CFA
James P. Stetler, Principal
Binbin Guo, Principal, Head of Equity
Research and Portfolio Strategies
For the 12 months ended September 30, the broad U.S. equity market, as represented by the Russell 3000 Index, was up 14.96%. Small-capitalization stocks outpaced the large- and mid-cap universe Value stocks outperformed growth stocks Globally, emerging markets surpassed developed markets. Performance within the fund’s FTSE benchmark was positive across all 11 sectors (real estate became a separate sector on September 1), and particularly strong in the information technology and consumer staples sectors.
Growth around the globe remains subdued. The U.S. economy grew at an annual rate of 1.4% in the second quarter of 2016 after only a 0.8% increase in the first quarter. The increased rate of growth reflected positive contributions from personal consumption expenditures, exports, and nonresidential fixed investment, but declines in private inventory investment and residential fixed investment weighed on the U.S. economy.
The International Monetary Fund estimated global growth at 2.9% in the first half of 2016, slightly weaker than in the second half of 2015.
Brexit is still unfolding, as the long-term arrangements between the United Kingdom and the European Union will be uncertain for some time. There is a partial recovery in commodity prices. After hitting a ten-year low in January 2016, oil prices rallied by 50% to $45 in August, mostly due to production outages. Nonfuel commodity prices have also increased, with metals and agricultural commodity prices rising by 12% and 9%, respectively.
While we seek to understand the impact of macro factors on fund performance, we emphasize that our process is centered on specific stock fundamentals. We use a quantitative approach to systematically identify stocks in our investment universe that we believe are more likely to exhibit long-term outperformance. Our process focuses on valuation and other factors that contribute to fundamental growth. Using the results of our model, we then construct our portfolio with the goal of maximizing expected return while minimizing exposure to risks that our research indicates do not improve returns, such as industry selection and other risks relative to our benchmark.
As with any investment management process, there will be periods when our model does not perform as expected. Unfortunately, over the current annual period, the stocks that outperformed had characteristics that our model did not pursue. While we are disappointed with the performance results, it is important to
8
remind our investors that through different market environments, we maintain our commitment to invest in stocks with attractive fundamentals that we believe will outperform in the long run.
For the fiscal year, our valuation and management decision models were the strongest contributors to performance. However, our sentiment model did not perform as expected.
Our stock selection results varied across sectors throughout the year. We produced positive selections in financials and consumer staples. However, our stock selection within the energy sector was most disappointing and had the biggest impact on performance. Our strength in the financial sector can be attributed to an overweight in Navient (+35%) and an underweight in MetLife (–2.5%). Consumer staples performance benefited from overweighting Ingredion (+23%) and Nu Skin Enterprises (+63%). In the energy sector, an overweight in Ensco (–19%), Western Refining (–37%), and HollyFrontier (–48%) significantly detracted from performance.
9
Equity Income Fund
Fund Profile
As of September 30, 2016
| Share-Class Characteristics | ||
| Investor | Admiral | |
| Shares | Shares | |
| Ticker Symbol | VEIPX | VEIRX |
| Expense Ratio1 | 0.26% | 0.17% |
| 30-Day SEC Yield | 2.86% | 2.96% |
| Portfolio Characteristics | |||
| DJ | |||
| U.S. | |||
| FTSE High | Total | ||
| Dividend | Market | ||
| Yield | FA | ||
| Fund | Index | Index | |
| Number of Stocks | 211 | 414 | 3,850 |
| Median Market Cap | $102.0B | $108.8B | $51.8B |
| Price/Earnings Ratio | 20.5x | 20.7x | 23.7x |
| Price/Book Ratio | 2.6x | 2.7x | 2.8x |
| Return on Equity | 17.7% | 17.7% | 16.6% |
| Earnings Growth | |||
| Rate | 1.9% | 1.0% | 7.6% |
| Dividend Yield | 3.2% | 3.2% | 2.0% |
| Foreign Holdings | 8.6% | 0.0% | 0.0% |
| Turnover Rate | 26% | — | — |
| Short-Term | |||
| Reserves | 2.6% | — | — |
| Sector Diversification (% of equity exposure) | |||
| FTSE High | DJ | ||
| Dividend | U.S. Total | ||
| Yield | Market | ||
| Fund | Index | FA Index | |
| Consumer | |||
| Discretionary | 5.0% | 5.8% | 12.8% |
| Consumer Staples | 12.9 | 14.6 | 8.7 |
| Energy | 11.6 | 10.6 | 6.7 |
| Financials | 16.0 | 13.2 | 13.3 |
| Health Care | 12.6 | 11.4 | 14.2 |
| Industrials | 12.3 | 11.5 | 10.3 |
| Information | |||
| Technology | 14.5 | 15.6 | 20.7 |
| Materials | 2.8 | 3.5 | 3.3 |
| Real Estate | 0.1 | 0.0 | 4.3 |
| Telecommunication | |||
| Services | 4.4 | 5.6 | 2.4 |
| Utilities | 7.8 | 8.2 | 3.3 |
| Volatility Measures | ||
| FTSE High | DJ | |
| Dividend | U.S. Total | |
| Yield | Market | |
| Index | FA Index | |
| R-Squared | 0.98 | 0.91 |
| Beta | 0.98 | 0.87 |
| These measures show the degree and timing of the fund’s fluctuations compared with the indexes over 36 months. | ||
| Ten Largest Holdings (% of total net assets) | ||
| Microsoft Corp. | Systems Software | 4.6% |
| Johnson & Johnson | Pharmaceuticals | 3.3 |
| JPMorgan Chase & Co. | Diversified Banks | 3.0 |
| General Electric Co. | Industrial | |
| Conglomerates | 2.7 | |
| Wells Fargo & Co. | Diversified Banks | 2.6 |
| Philip Morris | ||
| International Inc. | Tobacco | 2.5 |
| Cisco Systems Inc. | Communications | |
| Equipment | 2.5 | |
| Exxon Mobil Corp. | Integrated Oil & Gas | 2.5 |
| Merck & Co. Inc. | Pharmaceuticals | 2.4 |
| Verizon Communications Integrated | ||
| Inc. | Telecommunication | |
| Services | 2.4 | |
| Top Ten | 28.5% | |
| The holdings listed exclude any temporary cash investments and equity index products. | ||
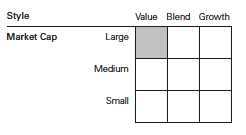
Investment Focus
1 The expense ratios shown are from the prospectus dated January 27, 2016, and represent estimated costs for the current fiscal year. For the fiscal
year ended September 30, 2016, the expense ratios were 0.26% for Investor Shares and 0.17% for Admiral Shares.
10
Equity Income Fund
Performance Summary
All of the returns in this report represent past performance, which is not a guarantee of future results that may be achieved by the fund. (Current performance may be lower or higher than the performance data cited. For performance data current to the most recent month-end, visit our website at vanguard.com/performance.) Note, too, that both investment returns and principal value can fluctuate widely, so an investor’s shares, when sold, could be worth more or less than their original cost. The returns shown do not reflect taxes that a shareholder would pay on fund distributions or on the sale of fund shares.
Cumulative Performance: September 30, 2006, Through September 30, 2016
Initial Investment of $10,000

| Average Annual Total Returns | |||||
| Periods Ended September 30, 2016 | |||||
| Final Value | |||||
| One | Five | Ten | of a $10,000 | ||
| Year | Years | Years | Investment | ||
| Equity Income Fund Investor Shares | 17.21% | 15.57% | 7.63% | $20,853 | |
| •••••••• | Spliced Equity Income Index | 18.89 | 15.92 | 7.40 | 20,423 |
| – – – – | Equity Income Funds Average | 13.93 | 12.93 | 5.79 | 17,560 |
| Dow Jones U.S. Total Stock Market | |||||
| Float Adjusted Index | 14.93 | 16.30 | 7.49 | 20,592 | |
| For a benchmark description, see the Glossary. | |||||
| Equity Income Funds Average: Derived from data provided by Lipper, a Thomson Reuters Company. | |||||
| Final Value | ||||
| One | Five | Ten | of a $50,000 | |
| Year | Years | Years | Investment | |
| Equity Income Fund Admiral Shares | 17.35% | 15.67% | 7.73% | $105,318 |
| Spliced Equity Income Index | 18.89 | 15.92 | 7.40 | 102,117 |
| Dow Jones U.S. Total Stock Market Float | ||||
| Adjusted Index | 14.93 | 16.30 | 7.49 | 102,961 |
See Financial Highlights for dividend and capital gains information.
11
Equity Income Fund
Fiscal-Year Total Returns (%): September 30, 2006, Through September 30, 2016
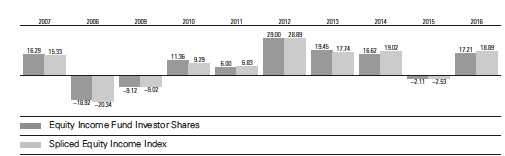
For a benchmark description, see the Glossary.
12
Equity Income Fund
Financial Statements
Statement of Net Assets
As of September 30, 2016
The fund reports a complete list of its holdings in regulatory filings four times in each fiscal year, at the quarter-ends. For the second and fourth fiscal quarters, the lists appear in the fund’s semiannual and annual reports to shareholders. For the first and third fiscal quarters, the fund files the lists with the Securities and Exchange Commission on Form N-Q. Shareholders can look up the fund’s Forms N-Q on the SEC’s website at sec.gov. Forms N-Q may also be reviewed and copied at the SEC’s Public Reference Room (see the back cover of this report for further information).
| Market | |||
| Value• | |||
| Shares | ($000) | ||
| Common Stocks (96.8%)1 | |||
| Consumer Discretionary (4.6%) | |||
| Home Depot Inc. | 2,288,882 | 294,533 | |
| McDonald’s Corp. | 1,876,670 | 216,493 | |
| VF Corp. | 2,892,481 | 162,124 | |
| Ford Motor Co. | 6,826,962 | 82,401 | |
| ^ | Nordstrom Inc. | 995,704 | 51,657 |
| Carnival Corp. | 1,042,096 | 50,875 | |
| Darden Restaurants Inc. | 762,604 | 46,763 | |
| Best Buy Co. Inc. | 1,130,941 | 43,179 | |
| Leggett & Platt Inc. | 618,031 | 28,170 | |
| American Eagle | |||
| Outfitters Inc. | 1,193,190 | 21,310 | |
| Omnicom Group Inc. | 195,512 | 16,619 | |
| ^ | Regal Entertainment | ||
| Group Class A | 740,926 | 16,115 | |
| General Motors Co. | 417,634 | 13,268 | |
| International Game | |||
| Technology plc | 528,274 | 12,879 | |
| Tupperware Brands Corp. | 191,987 | 12,550 | |
| TEGNA Inc. | 345,377 | 7,550 | |
| Time Inc. | 488,249 | 7,070 | |
| Rent-A-Center Inc. | 470,702 | 5,950 | |
| Bob Evans Farms Inc. | 145,836 | 5,586 | |
| Gannett Co. Inc. | 218,253 | 2,541 | |
| Superior Industries | |||
| International Inc. | 12,900 | 376 | |
| 1,098,009 | |||
| Consumer Staples (12.5%) | |||
| Philip Morris | |||
| International Inc. | 6,125,236 | 595,495 | |
| Coca-Cola Co. | 7,135,204 | 301,962 | |
| Kraft Heinz Co. | 3,210,869 | 287,405 | |
| PepsiCo Inc. | 2,448,619 | 266,336 | |
| ^ | Procter & Gamble Co. | 2,942,800 | 264,116 |
| Altria Group Inc. | 3,752,700 | 237,283 | |
| British American | |||
| Tobacco plc | 3,651,658 | 233,534 | |
| Wal-Mart Stores Inc. | 2,692,924 | 194,214 | |
| Diageo plc ADR | 971,619 | 112,747 | |
| Unilever NV | 1,638,792 | 75,548 | |
| Kimberly-Clark Corp. | 588,922 | 74,286 | |
| General Mills Inc. | 1,132,169 | 72,323 | |
| ConAgra Foods Inc. | 1,350,608 | 63,627 | |
| Ingredion Inc. | 321,064 | 42,721 | |
| Campbell Soup Co. | 581,694 | 31,819 | |
| Nu Skin Enterprises Inc. | |||
| Class A | 481,560 | 31,195 | |
| Sysco Corp. | 480,468 | 23,548 | |
| Dr Pepper Snapple | |||
| Group Inc. | 173,340 | 15,828 | |
| Universal Corp. | 271,468 | 15,805 | |
| 2,939,792 | |||
| Energy (11.3%) | |||
| Exxon Mobil Corp. | 6,642,135 | 579,725 | |
| Chevron Corp. | 4,721,987 | 485,987 | |
| Suncor Energy Inc. | 10,381,739 | 288,405 | |
| Occidental Petroleum | |||
| Corp. | 3,231,279 | 235,625 | |
| Canadian Natural | |||
| Resources Ltd. | 5,913,444 | 189,467 | |
| ^ | TransCanada Corp. | 3,642,670 | 173,006 |
| Phillips 66 | 1,979,770 | 159,470 | |
| Enbridge Inc. | 3,181,066 | 140,699 | |
| Valero Energy Corp. | 1,207,038 | 63,973 | |
| ONEOK Inc. | 1,080,386 | 55,521 | |
| Spectra Energy Corp. | 948,374 | 40,543 | |
| Noble Corp. plc | 6,076,659 | 38,526 | |
| ^ | Nordic American | ||
| Tankers Ltd. | 3,128,981 | 31,634 | |
| Ensco plc Class A | 3,418,709 | 29,059 | |
| PBF Energy Inc. Class A | 1,232,959 | 27,914 | |
| Western Refining Inc. | 921,505 | 24,383 | |
| ^ | Ship Finance | ||
| International Ltd. | 1,479,235 | 21,789 | |
| Scorpio Tankers Inc. | 4,598,955 | 21,293 | |
| Oceaneering | |||
| International Inc. | 609,155 | 16,758 | |
| Murphy Oil Corp. | 545,943 | 16,597 | |
13
Equity Income Fund
| Market | |||
| Value• | |||
| Shares | ($000) | ||
| Helmerich & Payne Inc. | 146,884 | 9,885 | |
| ConocoPhillips | 123,508 | 5,369 | |
| Cosan Ltd. | 300,869 | 2,151 | |
| Archrock Inc. | 77,900 | 1,019 | |
| 2,658,798 | |||
| Financials (15.6%) | |||
| JPMorgan Chase & Co. | 10,576,617 | 704,297 | |
| Wells Fargo & Co. | 13,714,235 | 607,266 | |
| Marsh & McLennan | |||
| Cos. Inc. | 5,741,148 | 386,092 | |
| PNC Financial Services | |||
| Group Inc. | 2,719,094 | 244,963 | |
| BlackRock Inc. | 647,878 | 234,830 | |
| Chubb Ltd. | 1,854,568 | 233,027 | |
| MetLife Inc. | 4,346,015 | 193,093 | |
| Thomson Reuters Corp. | 3,420,877 | 141,556 | |
| M&T Bank Corp. | 1,148,058 | 133,290 | |
| Principal Financial | |||
| Group Inc. | 2,335,566 | 120,305 | |
| US Bancorp | 2,565,365 | 110,029 | |
| Prudential Financial Inc. | 951,566 | 77,695 | |
| Travelers Cos. Inc. | 618,068 | 70,800 | |
| Aflac Inc. | 921,463 | 66,226 | |
| SunTrust Banks Inc. | 1,409,119 | 61,719 | |
| Fifth Third Bancorp | 2,895,568 | 59,243 | |
| Ameriprise Financial Inc. | 589,717 | 58,836 | |
| Regions Financial Corp. | 5,725,714 | 56,513 | |
| Navient Corp. | 3,334,966 | 48,257 | |
| NorthStar Asset | |||
| Management Group Inc. | 976,247 | 12,623 | |
| Federated Investors Inc. | |||
| Class B | 245,559 | 7,276 | |
| IBERIABANK Corp. | 90,239 | 6,057 | |
| ^ | LPL Financial Holdings Inc. | 195,753 | 5,855 |
| Lazard Ltd. Class A | 154,795 | 5,628 | |
| Axis Capital Holdings Ltd. | 92,340 | 5,017 | |
| Allied World Assurance | |||
| Co. Holdings AG | 120,637 | 4,876 | |
| Old Republic International | |||
| Corp. | 248,702 | 4,382 | |
| Validus Holdings Ltd. | 83,613 | 4,166 | |
| Eaton Vance Corp. | 87,129 | 3,402 | |
| Washington Federal Inc. | 91,000 | 2,428 | |
| First American Financial | |||
| Corp. | 42,578 | 1,672 | |
| Maiden Holdings Ltd. | 32,400 | 411 | |
| 3,671,830 | |||
| Health Care (12.1%) | |||
| Johnson & Johnson | 6,657,129 | 786,407 | |
| Merck & Co. Inc. | 9,156,790 | 571,475 | |
| Pfizer Inc. | 15,272,002 | 517,263 | |
| Bristol-Myers Squibb Co. | 4,426,975 | 238,703 | |
| Novartis AG | 2,435,909 | 191,563 | |
| Roche Holding AG | 622,445 | 154,202 | |
| ^ | AstraZeneca plc ADR | 3,922,662 | 128,899 |
| Eli Lilly & Co. | 1,425,369 | 114,400 | |
| Amgen Inc. | 575,261 | 95,959 | |
| AbbVie Inc. | 813,667 | 51,318 | |
| Quest Diagnostics Inc. | 136,252 | 11,531 | |
| Baxter International Inc. | 84,211 | 4,008 | |
| Kindred Healthcare Inc. | 72,400 | 740 | |
| 2,866,468 | |||
| Industrials (11.9%) | |||
| General Electric Co. | 21,719,871 | 643,343 | |
| Eaton Corp. plc | 4,652,267 | 305,701 | |
| Union Pacific Corp. | 2,814,682 | 274,516 | |
| 3M Co. | 1,510,205 | 266,143 | |
| Raytheon Co. | 1,622,775 | 220,908 | |
| Honeywell International | |||
| Inc. | 1,731,310 | 201,853 | |
| United Technologies | |||
| Corp. | 1,893,222 | 192,351 | |
| United Parcel Service | |||
| Inc. Class B | 1,159,924 | 126,849 | |
| Caterpillar Inc. | 1,197,982 | 106,345 | |
| Stanley Black & Decker | |||
| Inc. | 478,024 | 58,787 | |
| CH Robinson Worldwide | |||
| Inc. | 705,655 | 49,721 | |
| ^ | GATX Corp. | 930,848 | 41,469 |
| PACCAR Inc. | 553,014 | 32,506 | |
| ^ | Copa Holdings SA Class A 351,540 | 30,911 | |
| Boeing Co. | 221,453 | 29,174 | |
| RR Donnelley & Sons Co. | 1,822,697 | 28,653 | |
| Pitney Bowes Inc. | 1,530,510 | 27,794 | |
| Lockheed Martin Corp. | 103,205 | 24,740 | |
| Emerson Electric Co. | 415,187 | 22,632 | |
| ^ | Greenbrier Cos. Inc. | 580,695 | 20,499 |
| MSC Industrial Direct Co. | |||
| Inc. Class A | 273,274 | 20,061 | |
| Briggs & Stratton Corp. | 699,096 | 13,038 | |
| General Cable Corp. | 856,173 | 12,826 | |
| Ryder System Inc. | 192,648 | 12,705 | |
| Cummins Inc. | 97,736 | 12,525 | |
| Timken Co. | 343,934 | 12,086 | |
| Aircastle Ltd. | 382,479 | 7,596 | |
| West Corp. | 269,922 | 5,960 | |
| Kennametal Inc. | 180,297 | 5,232 | |
| ^ | American Railcar | ||
| Industries Inc. | 79,380 | 3,292 | |
| 2,810,216 | |||
| Information Technology (13.8%) | |||
| Microsoft Corp. | 18,869,833 | 1,086,902 | |
| Cisco Systems Inc. | 18,643,520 | 591,372 | |
| Intel Corp. | 13,218,610 | 499,003 | |
| Analog Devices Inc. | 3,374,152 | 217,464 | |
| Maxim Integrated | |||
| Products Inc. | 4,492,765 | 179,396 | |
14
Equity Income Fund
| Market | ||
| Value• | ||
| Shares | ($000) | |
| International Business | ||
| Machines Corp. | 1,028,498 | 163,377 |
| Texas Instruments Inc. | 1,525,204 | 107,039 |
| HP Inc. | 4,500,273 | 69,889 |
| Western Union Co. | 2,391,142 | 49,784 |
| QUALCOMM Inc. | 663,882 | 45,476 |
| Seagate Technology plc | 1,096,790 | 42,281 |
| Cypress Semiconductor | ||
| Corp. | 3,074,912 | 37,391 |
| Leidos Holdings Inc. | 774,783 | 33,533 |
| Xerox Corp. | 2,909,876 | 29,477 |
| Computer Sciences Corp. | 488,700 | 25,515 |
| Xilinx Inc. | 374,260 | 20,337 |
| Science Applications | ||
| International Corp. | 287,495 | 19,944 |
| Linear Technology Corp. | 194,864 | 11,554 |
| KLA-Tencor Corp. | 136,150 | 9,491 |
| EarthLink Holdings Corp. | 1,262,329 | 7,826 |
| Broadridge Financial | ||
| Solutions Inc. | 111,644 | 7,568 |
| ManTech International | ||
| Corp. Class A | 8,700 | 328 |
| 3,254,947 | ||
| Materials (2.7%) | ||
| Dow Chemical Co. | 4,616,597 | 239,278 |
| International Paper Co. | 1,576,450 | 75,638 |
| Nucor Corp. | 1,378,704 | 68,177 |
| LyondellBasell Industries | ||
| NV Class A | 791,525 | 63,844 |
| Steel Dynamics Inc. | 1,843,890 | 46,079 |
| Avery Dennison Corp. | 538,681 | 41,904 |
| Commercial Metals Co. | 2,269,568 | 36,744 |
| Reliance Steel & | ||
| Aluminum Co. | 239,419 | 17,245 |
| Huntsman Corp. | 1,041,562 | 16,946 |
| EI du Pont de Nemours | ||
| & Co. | 213,395 | 14,291 |
| Greif Inc. Class A | 209,208 | 10,375 |
| Packaging Corp. of America | 50,344 | 4,091 |
| Rayonier Advanced | ||
| Materials Inc. | 255,459 | 3,416 |
| Domtar Corp. | 42,318 | 1,571 |
| Schnitzer Steel Industries | ||
| Inc. | 50,227 | 1,050 |
| 640,649 | ||
| Other (0.3%) | ||
| ^,2 Vanguard High Dividend | ||
| Yield ETF | 1,047,950 | 75,599 |
| Telecommunication Services (4.3%) | ||
| Verizon Communications | ||
| Inc. | 10,887,217 | 565,917 |
| BCE Inc. | 4,111,210 | 189,869 |
| AT&T Inc. | 4,665,098 | 189,450 |
| CenturyLink Inc. | 1,980,726 | 54,331 |
| Cogent Communications | ||
| Holdings Inc. | 269,431 | 9,918 |
| ^ Windstream Holdings Inc. | 679,997 | 6,834 |
| 1,016,319 | ||
| Utilities (7.7%) | ||
| Dominion Resources Inc. | 3,766,450 | 279,734 |
| UGI Corp. | 4,006,197 | 181,240 |
| Xcel Energy Inc. | 4,308,387 | 177,247 |
| Eversource Energy | 3,022,323 | 163,749 |
| NextEra Energy Inc. | 1,305,330 | 159,668 |
| Sempra Energy | 1,309,749 | 140,392 |
| Duke Energy Corp. | 1,414,829 | 113,243 |
| PPL Corp. | 1,785,492 | 61,724 |
| Edison International | 849,546 | 61,380 |
| FirstEnergy Corp. | 1,618,759 | 53,549 |
| Entergy Corp. | 677,290 | 51,968 |
| CenterPoint Energy Inc. | 2,179,538 | 50,631 |
| NiSource Inc. | 1,933,285 | 46,611 |
| MDU Resources Group | ||
| Inc. | 1,585,812 | 40,343 |
| Great Plains Energy Inc. | 1,270,781 | 34,680 |
| Ameren Corp. | 642,503 | 31,598 |
| AES Corp. | 2,332,310 | 29,970 |
| NRG Energy Inc. | 2,640,475 | 29,600 |
| Southwest Gas Corp. | 289,865 | 20,250 |
| ONE Gas Inc. | 301,158 | 18,624 |
| DTE Energy Co. | 188,370 | 17,645 |
| American Electric Power | ||
| Co. Inc. | 222,599 | 14,293 |
| Public Service Enterprise | ||
| Group Inc. | 253,799 | 10,627 |
| CMS Energy Corp. | 165,294 | 6,944 |
| National Fuel Gas Co. | 97,146 | 5,253 |
| Southern Co. | 95,873 | 4,918 |
| NRG Yield Inc. | 143,937 | 2,441 |
| Portland General Electric Co. | 45,767 | 1,949 |
| NRG Yield Inc. Class A | 5,800 | 95 |
| 1,810,366 | ||
| Total Common Stocks | ||
| (Cost $18,291,134) | 22,842,993 | |
15
Equity Income Fund
| Market | ||
| Value• | ||
| Shares | ($000) | |
| Temporary Cash Investments (5.0%)1 | ||
| Money Market Fund (2.5%) | ||
| 3,4 Vanguard Market | ||
| Liquidity Fund, | ||
| 0.640% | 5,794,487 | 579,507 |
| Face | ||
| Amount | ||
| ($000) | ||
| Repurchase Agreements (1.6%) | ||
| RBS Securities, Inc. | ||
| 0.460%, 10/3/16 (Dated | ||
| 9/30/16, Repurchase | ||
| Value $156,206,000 | ||
| collateralized by U.S. | ||
| Treasury Bond/Note | ||
| 0.625%–3.500%, | ||
| 5/31/17–5/15/19, with | ||
| a value of $159,329,000) | 156,200 | 156,200 |
| Societe Generale 0.470%, | ||
| 10/3/16 (Dated 9/30/16, | ||
| Repurchase Value | ||
| $65,403,000, collateralized | ||
| by U.S. Treasury Note/ | ||
| Bond 0.000%–2.125%, | ||
| 12/8/16–10/31/20, with | ||
| a value of $66,708,000) | 65,400 | 65,400 |
| Goldman Sachs & Co. | ||
| 0.500%, 10/3/16 (Dated | ||
| 9/30/16, Repurchase | ||
| Value $149,106,000, | ||
| collateralized by Federal | ||
| National Mortgage Assn. | ||
| 3.500%–4.500%, | ||
| 4/1/27–9/1/41, and | ||
| Federal Home Loan | ||
| Mortgage Corp. 4.500%, | ||
| 9/1/44, with a value | ||
| of $152,082,000) | 149,100 | 149,100 |
| 370,700 | ||
| Face | Market | ||
| Amount | Value• | ||
| ($000) | ($000) | ||
| U.S. Government and Agency Obligations (0.9%) | |||
| 5 | Federal Home Loan | ||
| Bank Discount Notes, | |||
| 0.431%, 10/3/16 | 10,000 | 10,000 | |
| 5 | Federal Home Loan | ||
| Bank Discount Notes, | |||
| 0.348%, 10/11/16 | 500 | 500 | |
| 5 | Federal Home Loan | ||
| Bank Discount Notes, | |||
| 0.360%, 10/28/16 | 2,200 | 2,200 | |
| 5,6 | Federal Home Loan | ||
| Bank Discount Notes, | |||
| 0.339%, 11/14/16 | 4,300 | 4,299 | |
| 5,6 | Federal Home Loan | ||
| Bank Discount Notes, | |||
| 0.340%, 11/16/16 | 1,400 | 1,399 | |
| 5 | Federal Home Loan | ||
| Bank Discount Notes, | |||
| 0.345%-0.347%, 12/7/16 | 50,000 | 49,973 | |
| United States Treasury Bill, | |||
| 0.100%, 10/27/16 | 150,000 | 149,980 | |
| 6 | United States Treasury Bill, | ||
| 0.296%, 11/25/16 | 6,000 | 5,999 | |
| 224,350 | |||
| Total Temporary Cash Investments | |||
| (Cost $1,174,530) | 1,174,557 | ||
| Total Investments (101.8%) | |||
| (Cost $19,465,664) | 24,017,550 | ||
| Amount | |||
| ($000) | |||
| Other Assets and Liabilities (-1.8%) | |||
| Other Assets | |||
| Investment in Vanguard | 1,800 | ||
| Receivables for Investment Securities Sold 77,467 | |||
| Receivables for Accrued Income | 48,778 | ||
| Receivables for Capital Shares Issued | 76,371 | ||
| Other Assets 6 | 10,695 | ||
| Total Other Assets | 215,111 | ||
| Liabilities | |||
| Payables for Investment Securities | |||
| Purchased | (264,338) | ||
| Collateral for Securities on Loan | (258,938) | ||
| Payables to Investment Advisor | (3,779) | ||
| Payables for Capital Shares Redeemed | (85,257) | ||
| Payables to Vanguard | (18,005) | ||
| Other Liabilities | (77) | ||
| Total Liabilities | (630,394) | ||
| Net Assets (100%) | 23,602,267 | ||
16
Equity Income Fund
| At September 30, 2016, net assets consisted of: | |
| Amount | |
| ($000) | |
| Paid-in Capital | 18,827,264 |
| Undistributed Net Investment Income | 8,405 |
| Accumulated Net Realized Gains | 212,813 |
| Unrealized Appreciation (Depreciation) | |
| Investment Securities | 4,551,886 |
| Futures Contracts | 1,962 |
| Foreign Currencies | (63) |
| Net Assets | 23,602,267 |
| Amount | |
| ($000) | |
| Investor Shares—Net Assets | |
| Applicable to 173,117,325 outstanding | |
| $.001 par value shares of beneficial | |
| interest (unlimited authorization) | 5,486,820 |
| Net Asset Value Per Share— | |
| Investor Shares | $31.69 |
| Admiral Shares—Net Assets | |
| Applicable to 272,701,676 outstanding | |
| $.001 par value shares of beneficial | |
| interest (unlimited authorization) | 18,115,447 |
| Net Asset Value Per Share— | |
| Admiral Shares | $66.43 |
• See Note A in Notes to Financial Statements.
^ Includes partial security positions on loan to broker-dealers. The total value of securities on loan is $248,438,000.
1 The fund invests a portion of its cash reserves in equity markets through the use of index futures contracts. After giving effect to futures
investments, the fund’s effective common stock and temporary cash investment positions represent 98.1% and 3.7%, respectively,
of net assets.
2 Considered an affiliated company of the fund as the issuer is another member of The Vanguard Group.
3 Affiliated money market fund available only to Vanguard funds and certain trusts and accounts managed by Vanguard. Rate shown is the
7-day yield.
4 Includes $258,938,000 of collateral received for securities on loan.
5 The issuer operates under a congressional charter; its securities are generally neither guaranteed by the U.S. Treasury nor backed by the
full faith and credit of the U.S. government.
6 Securities with a value of $7,198,000 and cash of $5,050,000 have been segregated as initial margin for open futures contracts.
ADR—American Depositary Receipt.
See accompanying Notes, which are an integral part of the Financial Statements.
17
Equity Income Fund
Statement of Operations
| Year Ended | |
| September 30, 2016 | |
| ($000) | |
| Investment Income | |
| Income | |
| Dividends1,2 | 659,654 |
| Interest2 | 2,459 |
| Securities Lending—Net | 5,983 |
| Total Income | 668,096 |
| Expenses | |
| Investment Advisory Fees—Note B | |
| Basic Fee | 18,120 |
| Performance Adjustment | (1,781) |
| The Vanguard Group—Note C | |
| Management and Administrative—Investor Shares | 7,957 |
| Management and Administrative—Admiral Shares | 11,740 |
| Marketing and Distribution—Investor Shares | 1,195 |
| Marketing and Distribution—Admiral Shares | 1,682 |
| Custodian Fees | 183 |
| Auditing Fees | 37 |
| Shareholders’ Reports—Investor Shares | 115 |
| Shareholders’ Reports—Admiral Shares | 118 |
| Trustees’ Fees and Expenses | 24 |
| Total Expenses | 39,390 |
| Net Investment Income | 628,706 |
| Realized Net Gain (Loss) | |
| Investment Securities Sold2 | 232,207 |
| Futures Contracts | 41,664 |
| Foreign Currencies | (696) |
| Realized Net Gain (Loss) | 273,175 |
| Change in Unrealized Appreciation (Depreciation) | |
| Investment Securities | 2,276,182 |
| Futures Contracts | 3,984 |
| Foreign Currencies | 62 |
| Change in Unrealized Appreciation (Depreciation) | 2,280,228 |
| Net Increase (Decrease) in Net Assets Resulting from Operations | 3,182,109 |
| 1 Dividends are net of foreign withholding taxes of $5,741,000. | |
| 2 Dividend income, interest income, and realized net gain (loss) from affiliated companies of the fund were $2,241,000, $1,446,000, and $8,000, respectively. | |
See accompanying Notes, which are an integral part of the Financial Statements.
18
Equity Income Fund
Statement of Changes in Net Assets
| Year Ended September 30, | ||
| 2016 | 2015 | |
| ($000) | ($000) | |
| Increase (Decrease) in Net Assets | ||
| Operations | ||
| Net Investment Income | 628,706 | 522,834 |
| Realized Net Gain (Loss) | 273,175 | 709,638 |
| Change in Unrealized Appreciation (Depreciation) | 2,280,228 | (1,607,265) |
| Net Increase (Decrease) in Net Assets Resulting from Operations | 3,182,109 | (374,793) |
| Distributions | ||
| Net Investment Income | ||
| Investor Shares | (151,777) | (148,834) |
| Admiral Shares | (466,535) | (377,108) |
| Realized Capital Gain1 | ||
| Investor Shares | (168,698) | (178,446) |
| Admiral Shares | (461,700) | (410,635) |
| Total Distributions | (1,248,710) | (1,115,023) |
| Capital Share Transactions | ||
| Investor Shares | 179,932 | (307,678) |
| Admiral Shares | 3,714,163 | 1,725,388 |
| Net Increase (Decrease) from Capital Share Transactions | 3,894,095 | 1,417,710 |
| Total Increase (Decrease) | 5,827,494 | (72,106) |
| Net Assets | ||
| Beginning of Period | 17,774,773 | 17,846,879 |
| End of Period2 | 23,602,267 | 17,774,773 |
| 1 Includes fiscal 2016 and 2015 short-term gain distributions totaling $134,022,000 and $129,551,000, respectively. Short-term gain | ||
| distributions are treated as ordinary income dividends for tax purposes. | ||
| 2 Net Assets—End of Period includes undistributed (overdistributed) net investment income of $8,405,000 and ($1,440,000). | ||
See accompanying Notes, which are an integral part of the Financial Statements.
19
Equity Income Fund
Financial Highlights
| Investor Shares | |||||
| For a Share Outstanding | Year Ended September 30, | ||||
| Throughout Each Period | 2016 | 2015 | 2014 | 2013 | 2012 |
| Net Asset Value, Beginning of Period | $28.78 | $31.23 | $28.26 | $24.31 | $19.40 |
| Investment Operations | |||||
| Net Investment Income | . 909 | . 847 | . 826 | .732 | . 667 |
| Net Realized and Unrealized Gain (Loss) | |||||
| on Investments | 3.912 | (1.431) | 3.754 | 3.946 | 4.908 |
| Total from Investment Operations | 4.821 | (.584) | 4.580 | 4.678 | 5.575 |
| Distributions | |||||
| Dividends from Net Investment Income | (. 895) | (. 852) | (. 811) | (.728) | (. 665) |
| Distributions from Realized Capital Gains | (1.016) | (1.014) | (.799) | — | — |
| Total Distributions | (1.911) | (1.866) | (1.610) | (.728) | (.665) |
| Net Asset Value, End of Period | $31.69 | $28.78 | $31.23 | $28.26 | $24.31 |
| Total Return1 | 17.21% | -2.11% | 16.62% | 19.45% | 29.00% |
| Ratios/Supplemental Data | |||||
| Net Assets, End of Period (Millions) | $5,487 | $4,812 | $5,528 | $4,839 | $4,107 |
| Ratio of Total Expenses to Average Net Assets2 | 0.26% | 0.26% | 0.29% | 0.30% | 0.30% |
| Ratio of Net Investment Income to | |||||
| Average Net Assets | 3.00% | 2.72% | 2.74% | 2.81% | 3.00% |
| Portfolio Turnover Rate | 26% | 32% | 33% | 34% | 26% |
1 Total returns do not include account service fees that may have applied in the periods shown. Fund prospectuses provide information about any applicable account service fees.
2 Includes performance-based investment advisory fee increases (decreases) of (0.01%), (0.01%), 0.00%, 0.00%, and 0.00%.
See accompanying Notes, which are an integral part of the Financial Statements.
20
Equity Income Fund
Financial Highlights
| Admiral Shares | |||||
| For a Share Outstanding | Year Ended September 30, | ||||
| Throughout Each Period | 2016 | 2015 | 2014 | 2013 | 2012 |
| Net Asset Value, Beginning of Period | $60.31 | $65.45 | $59.24 | $50.94 | $40.67 |
| Investment Operations | |||||
| Net Investment Income | 1.963 | 1.834 | 1.790 | 1.585 | 1.445 |
| Net Realized and Unrealized Gain (Loss) | |||||
| on Investments | 8.219 | (3.003) | 7.853 | 8.293 | 10.265 |
| Total from Investment Operations | 10.182 | (1.169) | 9.643 | 9.878 | 11.710 |
| Distributions | |||||
| Dividends from Net Investment Income | (1.932) | (1.846) | (1.758) | (1.578) | (1.440) |
| Distributions from Realized Capital Gains | (2.130) | (2.125) | (1.675) | — | — |
| Total Distributions | (4.062) | (3.971) | (3.433) | (1.578) | (1.440) |
| Net Asset Value, End of Period | $66.43 | $60.31 | $65.45 | $59.24 | $50.94 |
| Total Return1 | 17.35% | -2.03% | 16.70% | 19.61% | 29.06% |
| Ratios/Supplemental Data | |||||
| Net Assets, End of Period (Millions) | $18,115 | $12,962 | $12,319 | $9,134 | $5,234 |
| Ratio of Total Expenses to Average Net Assets2 | 0.17% | 0.17% | 0.20% | 0.21% | 0.21% |
| Ratio of Net Investment Income to | |||||
| Average Net Assets | 3.09% | 2.81% | 2.83% | 2.90% | 3.09% |
| Portfolio Turnover Rate | 26% | 32% | 33% | 34% | 26% |
1 Total returns do not include account service fees that may have applied in the periods shown. Fund prospectuses provide information about any applicable account service fees.
2 Includes performance-based investment advisory fee increases (decreases) of (0.01%), (0.01%), 0.00%, 0.00%, and 0.00%.
See accompanying Notes, which are an integral part of the Financial Statements.
21
Equity Income Fund
Notes to Financial Statements
Vanguard Equity Income Fund is registered under the Investment Company Act of 1940 as an open-end investment company, or mutual fund. The fund offers two classes of shares: Investor Shares and Admiral Shares. Investor Shares are available to any investor who meets the fund’s minimum purchase requirements. Admiral Shares are designed for investors who meet certain administrative, service, and account-size criteria.
A. The following significant accounting policies conform to generally accepted accounting principles for U.S. investment companies. The fund consistently follows such policies in preparing its financial statements.
1. Security Valuation: Securities are valued as of the close of trading on the New York Stock Exchange (generally 4 p.m., Eastern time) on the valuation date. Equity securities are valued at the latest quoted sales prices or official closing prices taken from the primary market in which each security trades; such securities not traded on the valuation date are valued at the mean of the latest quoted bid and asked prices. Securities for which market quotations are not readily available, or whose values have been affected by events occurring before the fund’s pricing time but after the close of the securities’ primary markets, are valued at their fair values calculated according to procedures adopted by the board of trustees. These procedures include obtaining quotations from an independent pricing service, monitoring news to identify significant market- or security-specific events, and evaluating changes in the values of foreign market proxies (for example, ADRs, futures contracts, or exchange-traded funds), between the time the foreign markets close and the fund’s pricing time. When fair-value pricing is employed, the prices of securities used by a fund to calculate its net asset value may differ from quoted or published prices for the same securities. Investments in Vanguard Market Liquidity Fund are valued at that fund’s net asset value. Temporary cash investments acquired over 60 days to maturity are valued using the latest bid prices or using valuations based on a matrix system (which considers such factors as security prices, yields, maturities, and ratings), both as furnished by independent pricing services. Other temporary cash investments are valued at amortized cost, which approximates market value.
2. Foreign Currency: Securities and other assets and liabilities denominated in foreign currencies are translated into U.S. dollars using exchange rates obtained from an independent third party as of the fund’s pricing time on the valuation date. Realized gains (losses) and unrealized appreciation (depreciation) on investment securities include the effects of changes in exchange rates since the securities were purchased, combined with the effects of changes in security prices. Fluctuations in the value of other assets and liabilities resulting from changes in exchange rates are recorded as unrealized foreign currency gains (losses) until the assets or liabilities are settled in cash, at which time they are recorded as realized foreign currency gains (losses).
3. Futures Contracts: The fund uses index futures contracts to a limited extent, with the objective of maintaining full exposure to the stock market while maintaining liquidity. The fund may purchase or sell futures contracts to achieve a desired level of investment, whether to accommodate portfolio turnover or cash flows from capital share transactions. The primary risks associated with the use of futures contracts are imperfect correlation between changes in market values of stocks held by the fund and the prices of futures contracts, and the possibility of an illiquid market. Counterparty risk involving futures is mitigated because a regulated clearinghouse is the counterparty instead of the clearing broker. To further mitigate counterparty risk, the fund trades futures contracts on an exchange, monitors the financial strength of its clearing brokers and clearinghouse, and has entered into clearing agreements with its clearing brokers. The clearinghouse imposes initial margin requirements to secure the fund’s performance and requires daily settlement of variation margin representing changes in the market value of each contract.
22
Equity Income Fund
Futures contracts are valued at their quoted daily settlement prices. The aggregate settlement values of the contracts are not recorded in the Statement of Net Assets. Fluctuations in the value of the contracts are recorded in the Statement of Net Assets as an asset (liability) and in the Statement of Operations as unrealized appreciation (depreciation) until the contracts are closed, when they are recorded as realized futures gains (losses).
During the year ended September 30, 2016, the fund’s average investments in long and short futures contracts represented 1% and 0% of net assets, respectively, based on the average of aggregate settlement values at each quarter-end during the period.
4. Repurchase Agreements: The fund enters into repurchase agreements with institutional counterparties. Securities pledged as collateral to the fund under repurchase agreements are held by a custodian bank until the agreements mature, and in the absence of a default, such collateral cannot be repledged, resold or rehypothecated. Each agreement requires that the market value of the collateral be sufficient to cover payments of interest and principal. The fund further mitigates its counterparty risk by entering into repurchase agreements only with a diverse group of prequalified counterparties, monitoring their financial strength, and entering into master repurchase agreements with its counterparties. The master repurchase agreements provide that, in the event of a counterparty’s default (including bankruptcy), the fund may terminate any repurchase agreements with that counterparty, determine the net amount owed, and sell or retain the collateral up to the net amount owed to the fund. Such action may be subject to legal proceedings, which may delay or limit the disposition of collateral.
5. Federal Income Taxes: The fund intends to continue to qualify as a regulated investment company and distribute all of its taxable income. Management has analyzed the fund’s tax positions taken for all open federal income tax years (September 30, 2013–2016), and has concluded that no provision for federal income tax is required in the fund’s financial statements.
6. Distributions: Distributions to shareholders are recorded on the ex-dividend date.
7. Securities Lending: To earn additional income, the fund lends its securities to qualified institutional borrowers. Security loans are subject to termination by the fund at any time, and are required to be secured at all times by collateral in an amount at least equal to the market value of securities loaned. Daily market fluctuations could cause the value of loaned securities to be more or less than the value of the collateral received. When this occurs, the collateral is adjusted and settled on the next business day. The fund further mitigates its counterparty risk by entering into securities lending transactions only with a diverse group of prequalified counterparties, monitoring their financial strength, and entering into master securities lending agreements with its counterparties. The master securities lending agreements provide that, in the event of a counterparty’s default (including bankruptcy), the fund may terminate any loans with that borrower, determine the net amount owed, and sell or retain the collateral up to the net amount owed to the fund; however, such actions may be subject to legal proceedings. While collateral mitigates counterparty risk, in the absence of a default the fund may experience delays and costs in recovering the securities loaned. The fund invests cash collateral received in Vanguard Market Liquidity Fund, and records a liability in the Statement of Net Assets for the return of the collateral, during the period the securities are on loan. Securities lending income represents fees charged to borrowers plus income earned on invested cash collateral, less expenses associated with the loan. During the term of the loan, the fund is entitled to all distributions made on or in respect of the loaned securities.
23
Equity Income Fund
8. Credit Facility: The fund and certain other funds managed by The Vanguard Group (“Vanguard”) participate in a $3.1 billion committed credit facility provided by a syndicate of lenders pursuant to a credit agreement that may be renewed annually; each fund is individually liable for its borrowings, if any, under the credit facility. Borrowings may be utilized for temporary and emergency purposes, and are subject to the fund’s regulatory and contractual borrowing restrictions. The participating funds are charged administrative fees and an annual commitment fee of 0.10% of the undrawn amount of the facility; these fees are allocated to the funds based on a method approved by the fund’s board of trustees and included in Management and Administrative expenses on the fund’s Statement of Operations. Any borrowings under this facility bear interest at a rate based upon the higher of the one-month London Interbank Offered Rate, federal funds effective rate, or overnight bank funding rate plus an agreed-upon spread.
The fund had no borrowings outstanding at September 30, 2016, or at any time during the period then ended.
9. Other: Dividend income is recorded on the ex-dividend date. Interest income includes income distributions received from Vanguard Market Liquidity Fund and is accrued daily. Premiums and discounts on debt securities purchased are amortized and accreted, respectively, to interest income over the lives of the respective securities. Security transactions are accounted for on the date securities are bought or sold. Costs used to determine realized gains (losses) on the sale of investment securities are those of the specific securities sold.
Each class of shares has equal rights as to assets and earnings, except that each class separately bears certain class-specific expenses related to maintenance of shareholder accounts (included in Management and Administrative expenses) and shareholder reporting. Marketing and distribution expenses are allocated to each class of shares based on a method approved by the board of trustees. Income, other non-class-specific expenses, and gains and losses on investments are allocated to each class of shares based on its relative net assets.
B. The investment advisory firm Wellington Management Company LLP provides investment advisory services to a portion of the fund for a fee calculated at an annual percentage rate of average net assets managed by the advisor. The basic fee of Wellington Management Company LLP is subject to quarterly adjustments based on performance relative to the FTSE High Dividend Yield Index for the preceding three years.
Vanguard provides investment advisory services to a portion of the fund as described below; the fund paid Vanguard advisory fees of $2,647,000 for the year ended September 30, 2016.
For the year ended September 30, 2016, the aggregate investment advisory fee paid to all advisors represented an effective annual basic rate of 0.09% of the fund’s average net assets, before a decrease of $1,781,000 (0.01%) based on performance.
C. In accordance with the terms of a Funds’ Service Agreement (the “FSA”) between Vanguard and the fund, Vanguard furnishes to the fund investment advisory, corporate management, administrative, marketing, and distribution services at Vanguard’s cost of operations (as defined by the FSA). These costs of operations are allocated to the fund based on methods and guidelines approved by the board of trustees. Vanguard does not require reimbursement in the current period for certain costs of operations (such as deferred compensation/benefits and risk/insurance costs); the fund’s liability for these costs of operations is included in Payables to Vanguard on the Statement of Net Assets.
24
Equity Income Fund
Upon the request of Vanguard, the fund may invest up to 0.40% of its net assets as capital in Vanguard. At September 30, 2016, the fund had contributed to Vanguard capital in the amount of $1,800,000, representing 0.01% of the fund’s net assets and 0.72% of Vanguard’s capitalization. The fund’s trustees and officers are also directors and employees, respectively, of Vanguard.
D. Various inputs may be used to determine the value of the fund’s investments. These inputs are summarized in three broad levels for financial statement purposes. The inputs or methodologies used to value securities are not necessarily an indication of the risk associated with investing in those securities.
Level 1—Quoted prices in active markets for identical securities.
Level 2—Other significant observable inputs (including quoted prices for similar securities, interest rates, prepayment speeds, credit risk, etc.).
Level 3—Significant unobservable inputs (including the fund’s own assumptions used to determine the fair value of investments).
The following table summarizes the market value of the fund’s investments as of September 30, 2016, based on the inputs used to value them:
| Level 1 | Level 2 | Level 3 | |
| Investments | ($000) | ($000) | ($000) |
| Common Stocks | 22,263,694 | 579,299 | — |
| Temporary Cash Investments | 579,507 | 595,050 | — |
| Futures Contracts—Assets1 | 1,731 | — | — |
| Futures Contracts—Liabilities1 | (47) | — | — |
| Total | 22,844,885 | 1,174,349 | — |
| 1 Represents variation margin on the last day of the reporting period. | |||
E. At September 30, 2016, the aggregate settlement value of open futures contracts and the related unrealized appreciation (depreciation) were:
| ($000) | ||||
| Aggregate | ||||
| Number of | Settlement | Unrealized | ||
| Long (Short) | Value | Appreciation | ||
| Futures Contracts | Expiration | Contracts | Long (Short) | (Depreciation) |
| E-mini S&P 500 Index | December 2016 | 2,754 | 297,487 | 1,962 |
Unrealized appreciation (depreciation) on open futures contracts is required to be treated as realized gain (loss) for tax purposes.
F. Distributions are determined on a tax basis and may differ from net investment income and realized capital gains for financial reporting purposes. Differences may be permanent or temporary. Permanent differences are reclassified among capital accounts in the financial statements to reflect their tax character. Temporary differences arise when certain items of income, expense, gain, or loss are recognized in different periods for financial statement and tax purposes. These differences will reverse at some time in the future. Differences in classification may also result from the treatment of short-term gains as ordinary income for tax purposes.
25
Equity Income Fund
During the year ended September 30, 2016, the fund realized net foreign currency losses of $696,000, which decreased distributable net income for tax purposes; accordingly, such losses have been reclassified from accumulated net realized gains to undistributed net investment income. Certain of the fund’s investments are in securities considered to be passive foreign investment companies, for which any unrealized appreciation and/or realized gains are required to be included in distributable net income for tax purposes. During the year ended September 30, 2016, the fund realized gains on the sale of passive foreign investment companies of $147,000, which have been included in current and prior periods’ taxable income; accordingly, such gains have been reclassified from accumulated net realized gains to undistributed net investment income.
The fund used a tax accounting practice to treat a portion of the price of capital shares redeemed during the year as distributions from realized capital gains. Accordingly, the fund has reclassified $28,621,000 from accumulated net realized gains to paid-in capital.
For tax purposes, at September 30, 2016, the fund had $25,436,000 of ordinary income and $221,842,000 of long-term capital gains available for distribution.
At September 30, 2016, the cost of investment securities for tax purposes was $19,472,754,000. Net unrealized appreciation of investment securities for tax purposes was $4,544,796,000, consisting of unrealized gains of $4,797,758,000 on securities that had risen in value since their purchase and $252,962,000 in unrealized losses on securities that had fallen in value since their purchase.
G. During the year ended September 30, 2016, the fund purchased $8,220,748,000 of investment securities and sold $5,181,848,000 of investment securities, other than temporary cash investments.
H. Capital share transactions for each class of shares were:
| Year Ended September 30, | ||||
| 2016 | 2015 | |||
| Amount | Shares | Amount | Shares | |
| ($000) | (000) | ($000) | (000) | |
| Investor Shares | ||||
| Issued | 1,251,751 | 40,977 | 1,014,630 | 32,639 |
| Issued in Lieu of Cash Distributions | 298,827 | 9,913 | 306,263 | 10,045 |
| Redeemed | (1,370,646) | (45,014) | (1,628,571) | (52,449) |
| Net Increase (Decrease)—Investor Shares | 179,932 | 5,876 | (307,678) | (9,765) |
| Admiral Shares | ||||
| Issued | 5,274,178 | 82,254 | 3,559,820 | 54,765 |
| Issued in Lieu of Cash Distributions | 784,001 | 12,393 | 672,092 | 10,525 |
| Redeemed | (2,344,016) | (36,870) | (2,506,524) | (38,575) |
| Net Increase (Decrease)—Admiral Shares | 3,714,163 | 57,777 | 1,725,388 | 26,715 |
I. Management has determined that no material events or transactions occurred subsequent to September 30, 2016, that would require recognition or disclosure in these financial statements.
26
Report of Independent Registered
Public Accounting Firm
To the Board of Trustees of Vanguard Fenway Funds and the Shareholders of Vanguard Equity Income Fund:
In our opinion, the accompanying statement of net assets and the related statements of operations and of changes in net assets and the financial highlights present fairly, in all material respects, the financial position of Vanguard Equity Income Fund (constituting a separate portfolio of Vanguard Fenway Funds, hereafter referred to as the “Fund”) at September 30, 2016, the results of its operations for the year then ended, the changes in its net assets for each of the two years in the period then ended, and the financial highlights for each of the five years in the period then ended, in conformity with accounting principles generally accepted in the United States of America. These financial statements and financial highlights (hereafter referred to as “financial statements”) are the responsibility of the Fund’s management. Our responsibility is to express an opinion on these financial statements based on our audits. We conducted our audits of these financial statements in accordance with the standards of the Public Company Accounting Oversight Board (United States). Those standards require that we plan and perform the audit to obtain reasonable assurance about whether the financial statements are free of material misstatement. An audit includes examining, on a test basis, evidence supporting the amounts and disclosures in the financial statements, assessing the accounting principles used and significant estimates made by management, and evaluating the overall financial statement presentation. We believe that our audits, which included confirmation of securities at September 30, 2016 by correspondence with the custodian and brokers and by agreement to the underlying ownership records of the transfer agent, provide a reasonable basis for our opinion.
/s/PricewaterhouseCoopers LLP
Philadelphia, Pennsylvania
November 10, 2016

Special 2016 tax information (unaudited) for Vanguard Equity Income Fund
This information for the fiscal year ended September 30, 2016, is included pursuant to provisions of
the Internal Revenue Code.
The fund distributed $524,998,000 as capital gain dividends (20% rate gain distributions) to
shareholders during the fiscal year.
For nonresident alien shareholders, 100% of short-term capital gain dividends distributed by the fund
are qualified short-term capital gains.
The fund distributed $631,178,000 of qualified dividend income to shareholders during the fiscal year.
For corporate shareholders, 89.9% of investment income (dividend income plus short-term gains,
if any) qualifies for the dividends-received deduction.
27
Your Fund’s After-Tax Returns
This table presents returns for your fund both before and after taxes. The after-tax returns are shown in two ways: (1) assuming that an investor owned the fund during the entire period and paid taxes on the fund’s distributions, and (2) assuming that an investor paid taxes on the fund’s distributions and sold all shares at the end of each period.
Calculations are based on the highest individual federal income tax and capital gains tax rates in effect at the times of the distributions and the hypothetical sales. State and local taxes were not considered. After-tax returns reflect any qualified dividend income, using actual prior-year figures and estimates for 2016. (In the example, returns after the sale of fund shares may be higher than those assuming no sale. This occurs when the sale would have produced a capital loss. The calculation assumes that the investor received a tax deduction for the loss.)
The table shows returns for Investor Shares only; returns for other share classes will differ. Please note that your actual after-tax returns will depend on your tax situation and may differ from those shown. Also note that if you own the fund in a tax-deferred account, such as an individual retirement account or a 401(k) plan, this information does not apply to you. Such accounts are not subject to current taxes.
Finally, keep in mind that a fund’s performance—whether before or after taxes—does not guarantee future results.
| Average Annual Total Returns: Equity Income Fund Investor Shares | |||
| Periods Ended September 30, 2016 | |||
| One | Five | Ten | |
| Year | Years | Years | |
| Returns Before Taxes | 17.21% | 15.57% | 7.63% |
| Returns After Taxes on Distributions | 15.35 | 14.32 | 6.58 |
| Returns After Taxes on Distributions and Sale of Fund Shares | 10.86 | 12.40 | 6.05 |
28
About Your Fund’s Expenses
As a shareholder of the fund, you incur ongoing costs, which include costs for portfolio management, administrative services, and shareholder reports (like this one), among others. Operating expenses, which are deducted from a fund’s gross income, directly reduce the investment return of the fund.
A fund’s expenses are expressed as a percentage of its average net assets. This figure is known as the expense ratio. The following examples are intended to help you understand the ongoing costs (in dollars) of investing in your fund and to compare these costs with those of other mutual funds. The examples are based on an investment of $1,000 made at the beginning of the period shown and held for the entire period.
The accompanying table illustrates your fund’s costs in two ways:
• Based on actual fund return. This section helps you to estimate the actual expenses that you paid over the period. The ”Ending Account Value“ shown is derived from the fund‘s actual return, and the third column shows the dollar amount that would have been paid by an investor who started with $1,000 in the fund. You may use the information here, together with the amount you invested, to estimate the expenses that you paid over the period.
To do so, simply divide your account value by $1,000 (for example, an $8,600 account value divided by $1,000 = 8.6), then multiply the result by the number given for your fund under the heading ”Expenses Paid During Period.“
• Based on hypothetical 5% yearly return. This section is intended to help you compare your fund‘s costs with those of other mutual funds. It assumes that the fund had a yearly return of 5% before expenses, but that the expense ratio is unchanged. In this case—because the return used is not the fund’s actual return—the results do not apply to your investment. The example is useful in making comparisons because the Securities and Exchange Commission requires all mutual funds to calculate expenses based on a 5% return. You can assess your fund’s costs by comparing this hypothetical example with the hypothetical examples that appear in shareholder reports of other funds.
Note that the expenses shown in the table are meant to highlight and help you compare ongoing costs only and do not reflect transaction costs incurred by the fund for buying and selling securities. Further, the expenses do not include any purchase, redemption, or account service fees described in the fund prospectus. If such fees were applied to your account, your costs would be higher. Your fund does not carry a “sales load.”
The calculations assume no shares were bought or sold during the period. Your actual costs may have been higher or lower, depending on the amount of your investment and the timing of any purchases or redemptions.
You can find more information about the fund’s expenses, including annual expense ratios, in the Financial Statements section of this report. For additional information on operating expenses and other shareholder costs, please refer to your fund’s current prospectus.
29
| Six Months Ended September 30, 2016 | |||
| Beginning | Ending | Expenses | |
| Account Value | Account Value | Paid During | |
| Equity Income Fund | 3/31/2016 | 9/30/2016 | Period |
| Based on Actual Fund Return | |||
| Investor Shares | $1,000.00 | $1,057.45 | $1.44 |
| Admiral Shares | 1,000.00 | 1,058.22 | 0.87 |
| Based on Hypothetical 5% Yearly Return | |||
| Investor Shares | $1,000.00 | $1,023.60 | $1.42 |
| Admiral Shares | 1,000.00 | 1,024.15 | 0.86 |
The calculations are based on expenses incurred in the most recent six-month period. The fund’s annualized six-month expense ratios for that
period are 0.28% for Investor Shares and 0.17% for Admiral Shares. The dollar amounts shown as “Expenses Paid” are equal to the
annualized expense ratio multiplied by the average account value over the period, multiplied by the number of days in the most recent
six-month period, then divided by the number of days in the most recent 12-month period (183/366).
30
Glossary
30-Day SEC Yield. A fund’s 30-day SEC yield is derived using a formula specified by the U.S. Securities and Exchange Commission. Under the formula, data related to the fund’s security holdings in the previous 30 days are used to calculate the fund’s hypothetical net income for that period, which is then annualized and divided by the fund’s estimated average net assets over the calculation period. For the purposes of this calculation, a security’s income is based on its current market yield to maturity (for bonds), its actual income (for asset-backed securities), or its projected dividend yield (for stocks). Because the SEC yield represents hypothetical annualized income, it will differ—at times significantly—from the fund’s actual experience. As a result, the fund’s income distributions may be higher or lower than implied by the SEC yield.
Beta. A measure of the magnitude of a fund’s past share-price fluctuations in relation to the ups and downs of a given market index. The index is assigned a beta of 1.00. Compared with a given index, a fund with a beta of 1.20 typically would have seen its share price rise or fall by 12% when the index rose or fell by 10%. For this report, beta is based on returns over the past 36 months for both the fund and the index. Note that a fund’s beta should be reviewed in conjunction with its R-squared (see definition). The lower the R-squared, the less correlation there is between the fund and the index, and the less reliable beta is as an indicator of volatility.
Dividend Yield. Dividend income earned by stocks, expressed as a percentage of the aggregate market value (or of net asset value, for a fund). The yield is determined by dividing the amount of the annual dividends by the aggregate value (or net asset value) at the end of the period. For a fund, the dividend yield is based solely on stock holdings and does not include any income produced by other investments.
Earnings Growth Rate. The average annual rate of growth in earnings over the past five years for the stocks now in a fund.
Equity Exposure. A measure that reflects a fund’s investments in stocks and stock futures. Any holdings in short-term reserves are excluded.
Expense Ratio. A fund’s total annual operating expenses expressed as a percentage of the fund’s average net assets. The expense ratio includes management and administrative expenses, but does not include the transaction costs of buying and selling portfolio securities.
Foreign Holdings. The percentage of a fund represented by securities or depositary receipts of companies based outside the United States.
Inception Date. The date on which the assets of a fund (or one of its share classes) are first invested in accordance with the fund’s investment objective. For funds with a subscription period, the inception date is the day after that period ends. Investment performance is measured from the inception date.
Median Market Cap. An indicator of the size of companies in which a fund invests; the midpoint of market capitalization (market price x shares outstanding) of a fund’s stocks, weighted by the proportion of the fund’s assets invested in each stock. Stocks representing half of the fund’s assets have market capitalizations above the median, and the rest are below it.
Price/Book Ratio. The share price of a stock divided by its net worth, or book value, per share. For a fund, the weighted average price/book ratio of the stocks it holds.
31
Price/Earnings Ratio. The ratio of a stock’s current price to its per-share earnings over the past year. For a fund, the weighted average P/E of the stocks it holds. P/E is an indicator of market expectations about corporate prospects; the higher the P/E, the greater the expectations for a company’s future growth.
R-Squared. A measure of how much of a fund’s past returns can be explained by the returns from the market in general, as measured by a given index. If a fund’s total returns were precisely synchronized with an index’s returns, its R-squared would be 1.00. If the fund’s returns bore no relationship to the index’s returns, its R-squared would be 0. For this report, R-squared is based on returns over the past 36 months for both the fund and the index.
Return on Equity. The annual average rate of return generated by a company during the past five years for each dollar of shareholder’s equity (net income divided by shareholder’s equity). For a fund, the weighted average return on equity for the companies whose stocks it holds.
Short-Term Reserves. The percentage of a fund invested in highly liquid, short-term securities that can be readily converted to cash.
Turnover Rate. An indication of the fund’s trading activity. Funds with high turnover rates incur higher transaction costs and may be more likely to distribute capital gains (which may be taxable to investors). The turnover rate excludes in-kind transactions, which have minimal impact on costs.
Benchmark Information
Spliced Equity Income Index: Russell 1000 Value Index through July 31, 2007; FTSE High Dividend
Yield Index thereafter.
32
This page intentionally left blank.
This page intentionally left blank.
This page intentionally left blank.
The People Who Govern Your Fund
The trustees of your mutual fund are there to see that the fund is operated and managed in your best interests since, as a shareholder, you are a part owner of the fund. Your fund’s trustees also serve on the board of directors of The Vanguard Group, Inc., which is owned by the Vanguard funds and provides services to them on an at-cost basis.
A majority of Vanguard’s board members are independent, meaning that they have no affiliation with Vanguard or the funds they oversee, apart from the sizable personal investments they have made as private individuals. The independent board members have distinguished backgrounds in business, academia, and public service. Each of the trustees and executive officers oversees 198 Vanguard funds.
The following table provides information for each trustee and executive officer of the fund. The mailing address of the trustees and officers is P.O. Box 876, Valley Forge, PA 19482. More information about the trustees is in the Statement of Additional Information, which can be obtained, without charge, by contacting Vanguard at 800-662-7447, or online at vanguard.com.
| InterestedTrustee1 |
| F. William McNabb III |
| Born 1957. Trustee Since July 2009. Chairman of |
| the Board. Principal Occupation(s) During the Past |
| Five Years and Other Experience: Chairman of the |
| Board of The Vanguard Group, Inc., and of each of |
| the investment companies served by The Vanguard |
| Group, since January 2010; Director of The Vanguard |
| Group since 2008; Chief Executive Officer and |
| President of The Vanguard Group, and of each of |
| the investment companies served by The Vanguard |
| Group, since 2008; Director of Vanguard Marketing |
| Corporation; Managing Director of The Vanguard |
| Group (1995–2008). |
| IndependentTrustees |
| Emerson U. Fullwood |
| Born 1948. Trustee Since January 2008. Principal |
| Occupation(s) During the Past Five Years and Other |
| Experience: Executive Chief Staff and Marketing |
| Officer for North America and Corporate Vice President |
| (retired 2008) of Xerox Corporation (document manage- |
| ment products and services); Executive in Residence |
| and 2009–2010 Distinguished Minett Professor at |
| the Rochester Institute of Technology; Lead Director |
| of SPX FLOW, Inc. (multi-industry manufacturing); |
| Director of the United Way of Rochester, the University |
| of Rochester Medical Center, Monroe Community |
| College Foundation, North Carolina A&T University, |
| and Roberts Wesleyan College. |
| Rajiv L. Gupta |
| Born 1945. Trustee Since December 2001.2 Principal |
| Occupation(s) During the Past Five Years and Other |
| Experience: Chairman and Chief Executive Officer |
| (retired 2009) and President (2006–2008) of |
| Rohm and Haas Co. (chemicals); Director of Tyco |
| International plc (diversified manufacturing and |
| services), HP Inc. (printer and personal computer |
| manufacturing), and Delphi Automotive plc |
| (automotive components); Senior Advisor at |
| New Mountain Capital. |
Amy Gutmann |
| Born 1949. Trustee Since June 2006. Principal |
| Occupation(s) During the Past Five Years and |
| Other Experience: President of the University of |
| Pennsylvania; Christopher H. Browne Distinguished |
| Professor of Political Science, School of Arts and |
| Sciences, and Professor of Communication, Annenberg |
| School for Communication, with secondary faculty |
| appointments in the Department of Philosophy, School |
| of Arts and Sciences, and at the Graduate School of |
| Education, University of Pennsylvania; Trustee of the |
| National Constitution Center; Chair of the Presidential |
| Commission for the Study of Bioethical Issues. |
JoAnn Heffernan Heisen |
| Born 1950. Trustee Since July 1998. Principal |
| Occupation(s) During the Past Five Years and |
| Other Experience: Corporate Vice President and |
| Chief Global Diversity Officer (retired 2008) and |
| Member of the Executive Committee (1997–2008) |
| of Johnson & Johnson (pharmaceuticals/medical |
| devices/consumer products); Director of Skytop |
| Lodge Corporation (hotels) and the Robert Wood |
| Johnson Foundation; Member of the Advisory |
| Board of the Institute for Women’s Leadership |
| at Rutgers University. |
F. Joseph Loughrey |
| Born 1949. Trustee Since October 2009. Principal |
| Occupation(s) During the Past Five Years and Other |
| Experience: President and Chief Operating Officer |
| (retired 2009) of Cummins Inc. (industrial machinery); |
| Chairman of the Board of Hillenbrand, Inc. (specialized |
| consumer services), and of Oxfam America; Director |
| of SKF AB (industrial machinery), Hyster-Yale Materials |
| Handling, Inc. (forklift trucks), the Lumina Foundation |
| for Education, and the V Foundation for Cancer |
| Research; Member of the Advisory Council for the |
| College of Arts and Letters and of the Advisory Board |
| to the Kellogg Institute for International Studies, both |
| at the University of Notre Dame. |
Mark Loughridge |
| Born 1953. Trustee Since March 2012. Principal |
| Occupation(s) During the Past Five Years and Other |
| Experience: Senior Vice President and Chief Financial |
| Officer (retired 2013) at IBM (information technology |
| services); Fiduciary Member of IBM’s Retirement Plan |
| Committee (2004–2013); Director of the Dow Chemical |
| Company; Member of the Council on Chicago Booth. |
Scott C. Malpass |
| Born 1962. Trustee Since March 2012. Principal |
| Occupation(s) During the Past Five Years and Other |
| Experience: Chief Investment Officer and Vice |
| President at the University of Notre Dame; Assistant |
| Professor of Finance at the Mendoza College of |
| Business at Notre Dame; Member of the Notre Dame |
| 403(b) Investment Committee, the Board of Advisors |
| for Spruceview Capital Partners, and the Investment |
| Advisory Committee of Major League Baseball; Board |
| Member of TIFF Advisory Services, Inc., and Catholic |
| Investment Services, Inc. (investment advisors). |
André F. Perold |
| Born 1952. Trustee Since December 2004. Principal |
| Occupation(s) During the Past Five Years and Other |
| Experience: George Gund Professor of Finance and |
| Banking, Emeritus at the Harvard Business School |
| (retired 2011); Chief Investment Officer and Managing |
| Partner of HighVista Strategies LLC (private investment |
| firm); Director of Rand Merchant Bank; Overseer of |
| the Museum of Fine Arts Boston. |
Peter F. Volanakis |
| Born 1955. Trustee Since July 2009. Principal |
| Occupation(s) During the Past Five Years and |
| Other Experience: President and Chief Operating |
| Officer (retired 2010) of Corning Incorporated |
| (communications equipment); Chairman of the |
| Board of Trustees of Colby-Sawyer College; |
| Member of the Advisory Board of the Norris |
| Cotton Cancer Center. |
| Executive Officers | |
| Glenn Booraem | |
| Born 1967. Treasurer Since May 2015. Principal | |
| Occupation(s) During the Past Five Years and | |
| Other Experience: Principal of The Vanguard Group, | |
| Inc.; Treasurer of each of the investment companies | |
| served by The Vanguard Group; Controller of each of | |
| the investment companies served by The Vanguard | |
| Group (2010–2015); Assistant Controller of each of | |
| the investment companies served by The Vanguard | |
| Group (2001–2010). | |
Thomas J. Higgins | |
| Born 1957. Chief Financial Officer Since September | |
| 2008. Principal Occupation(s) During the Past Five | |
| Years and Other Experience: Principal of The Vanguard | |
| Group, Inc.; Chief Financial Officer of each of the | |
| investment companies served by The Vanguard Group; | |
| Treasurer of each of the investment companies served | |
| by The Vanguard Group (1998–2008). | |
Peter Mahoney | |
| Born 1974. Controller Since May 2015. Principal | |
| Occupation(s) During the Past Five Years and Other | |
| Experience: Head of Global Fund Accounting at The | |
| Vanguard Group, Inc.; Controller of each of the invest- | |
| ment companies served by The Vanguard Group; | |
| Head of International Fund Services at The Vanguard | |
| Group (2008–2014). | |
Anne E. Robinson | |
| Born 1970. Secretary Since September 2016. Principal | |
| Occupation(s) During the Past Five Years and Other | |
| Experience: Managing Director of The Vanguard Group, | |
| Inc.; General Counsel of The Vanguard Group; Secretary | |
| of The Vanguard Group and of each of the investment | |
| companies served by The Vanguard Group; Director | |
| and Senior Vice President of Vanguard Marketing | |
| Corporation; Managing Director and General Counsel | |
| of Global Cards and Consumer Services at Citigroup | |
| (2014–2016); Counsel at American Express (2003–2014). | |
| Vanguard Senior ManagementTeam | |
| Mortimer J. Buckley | James M. Norris |
| Kathleen C. Gubanich | Thomas M. Rampulla |
| Martha G. King | Glenn W. Reed |
| John T. Marcante | Karin A. Risi |
| Chris D. McIsaac | Michael Rollings |
| Chairman Emeritus and Senior Advisor | |
| John J. Brennan | |
| Chairman, 1996–2009 | |
| Chief Executive Officer and President, 1996–2008 | |
| Founder | |
| John C. Bogle | |
| Chairman and Chief Executive Officer, 1974–1996 | |
1 Mr. McNabb is considered an “interested person,” as defined in the Investment Company Act of 1940, because he is an officer of the Vanguard funds.
2 December 2002 for Vanguard Equity Income Fund, the Vanguard Municipal Bond Funds, and the Vanguard State Tax-Exempt Funds.
 | |
| P.O. Box 2600 | |
| Valley Forge, PA 19482-2600 | |
| Connect with Vanguard® > vanguard.com | |
| Fund Information > 800-662-7447 | CFA® is a registered trademark owned by CFA Institute. |
| Direct Investor Account Services > 800-662-2739 | |
| Institutional Investor Services > 800-523-1036 | |
| Text Telephone for People | |
| Who Are Deaf or Hard of Hearing> 800-749-7273 | |
| This material may be used in conjunction | |
| with the offering of shares of any Vanguard | |
| fund only if preceded or accompanied by | |
| the fund’s current prospectus. | |
| All comparative mutual fund data are from Lipper, a | |
| Thomson Reuters Company, or Morningstar, Inc., unless | |
| otherwise noted. | |
| You can obtain a free copy of Vanguard’s proxy voting | |
| guidelines by visiting vanguard.com/proxyreporting or by | |
| calling Vanguard at 800-662-2739. The guidelines are | |
| also available from the SEC’s website, sec.gov. In | |
| addition, you may obtain a free report on how your fund | |
| voted the proxies for securities it owned during the 12 | |
| months ended June 30. To get the report, visit either | |
| vanguard.com/proxyreporting or sec.gov. | |
| You can review and copy information about your fund at | |
| the SEC’s Public Reference Room in Washington, D.C. To | |
| find out more about this public service, call the SEC at | |
| 202-551-8090. Information about your fund is also | |
| available on the SEC’s website, and you can receive | |
| copies of this information, for a fee, by sending a | |
| request in either of two ways: via email addressed to | |
| publicinfo@sec.gov or via regular mail addressed to the | |
| Public Reference Section, Securities and Exchange | |
| Commission, Washington, DC 20549-1520. | |
| © 2016 The Vanguard Group, Inc. | |
| All rights reserved. | |
| Vanguard Marketing Corporation, Distributor. | |
| Q650 112016 | |
Annual Report | September 30, 2016
Vanguard PRIMECAP Core Fund
A new format, unwavering commitment
As you begin reading this report, you’ll notice that we’ve made some improvements to the opening sections—based on feedback from you, our clients.
Page 1 starts with a new ”Your Fund’s Performance at a Glance,” a concise, handy summary of how your fund performed during the period.
In the renamed ”Chairman’s Perspective,” Bill McNabb will focus on enduring principles and investment insights.
We’ve modified some tables, and eliminated some redundancy, but we haven’t removed any information.
At Vanguard, we’re always looking for better ways to communicate and to help you make sound investment decisions. Thank you for entrusting your assets to us.
| Contents | |
| Your Fund’s Performance at a Glance. | 1 |
| Chairman’s Perspective. | 3 |
| Advisor’s Report. | 6 |
| Fund Profile. | 9 |
| Performance Summary. | 10 |
| Financial Statements. | 12 |
| Your Fund’s After-Tax Returns. | 23 |
| About Your Fund’s Expenses. | 24 |
| Glossary. | 26 |
Please note: The opinions expressed in this report are just that—informed opinions. They should not be considered promises or advice.
Also, please keep in mind that the information and opinions cover the period through the date on the front of this report. Of course, the
risks of investing in your fund are spelled out in the prospectus.
See the Glossary for definitions of investment terms used in this report.
About the cover: No matter what language you speak, Vanguard has one consistent message and set of principles. Our primary
focus is on you, our clients. We conduct our business with integrity as a faithful steward of your assets. This message is shown
translated into seven languages, reflecting our expanding global presence.
Your Fund’s Performance at a Glance
• Vanguard PRIMECAP Core Fund returned nearly 17% for the 12 months ended
September 30, 2016, exceeding the benchmark MSCI US Prime 750 Index return
of 15% and the 11% average return of its multi-capitalization core fund peers.
• Value stocks outpaced their growth counterparts for the fiscal year. All of PRIMECAP
Core’s industry sectors posted gains, seven of them at or near double digits.
• PRIMECAP Management Company, the fund’s advisor, traditionally invests most
heavily in the information technology and health care sectors. The fund’s technology
stocks advanced more than 38%, well ahead of those in the benchmark, and contributed
about 10 percentage points to results. Health care stocks returned 11% and added about
3 percentage points to results.
• Although the fund’s telecommunication services stocks returned almost 60%, its light
exposure to the sector limited the positive effect.
| Total Returns: Fiscal Year Ended September 30, 2016 | |
| Total | |
| Returns | |
| Vanguard PRIMECAP Core Fund | 16.78% |
| MSCI US Prime Market 750 Index | 15.00 |
| Multi-Cap Core Funds Average | 10.97 |
| Multi-Cap Core Funds Average: Derived from data provided by Lipper, a Thomson Reuters Company. | |
| Total Returns: Ten Years Ended September 30, 2016 | |
| Average | |
| Annual Return | |
| PRIMECAP Core Fund | 9.30% |
| MSCI US Prime Market 750 Index | 7.49 |
| Multi-Cap Core Funds Average | 5.82 |
| Multi-Cap Core Funds Average: Derived from data provided by Lipper, a Thomson Reuters Company. | |
The figures shown represent past performance, which is not a guarantee of future results. (Current performance may be
lower or higher than the performance data cited. For performance data current to the most recent month-end, visit our
website at vanguard.com/performance.) Note, too, that both investment returns and principal value can fluctuate widely, so
an investor’s shares, when sold, could be worth more or less than their original cost.
1
| Expense Ratios | ||
| Your Fund Compared With Its Peer Group | ||
| Peer Group | ||
| Fund | Average | |
| PRIMECAP Core Fund | 0.47% | 1.17% |
The fund expense ratio shown is from the prospectus dated January 27, 2016, and represents estimated costs for the current fiscal year. For
the fiscal year ended September 30, 2016, the fund’s expense ratio was 0.46%. The peer-group expense ratio is derived from data provided
by Lipper, a Thomson Reuters Company, and captures information through year-end 2015.
Peer group: Multi-Cap Core Funds.
2
Chairman’s Perspective

Bill McNabb
Chairman and Chief Executive Officer
Dear Shareholder,
If you think you’ve had reason to feel uneasy about the investment environment lately, you’re not imagining things. In just the past few months, we’ve seen economic uncertainty, intense political polarization, and super-low bond yields. Yet at the same time, the stock market kept pushing higher.
In this confusing and sometimes contradictory climate, you may be asking yourself a question that I hear often: How do I make sense of all this, keep investing, and still get a good night’s sleep?
As with any problem, there are multiple ways to go at it. But there’s one approach in particular that is simple, straightforward, and nearly foolproof: Save more money. Not only can saving more give you a greater sense of control over your investment plan, it can help compensate for long-term returns that, in our estimation, could fall short of historical averages.
I love the way one of our investment pros put it. Fran Kinniry this summer told The Wall Street Journal, “Investing is always a partnership between you and the markets.” He explained that the markets carried more than their fair share of the weight for a couple of decades, through the 1990s, providing outsized returns that made the investor’s half of the partnership relatively light work. “But now you are going to have to be the majority partner.”
Sobering? Sure. Hopeless? Definitely not.
3
Over the 12 months since last September, U.S. stocks returned 15%, though the rise has not been a one-way ticket straight up. International markets have also posted strong returns, but lower than those of the broad U.S. market. The decision by United Kingdom voters in June to exit the European Union came as a surprise but caused market heartburn for only a few days.
In fixed income, yields remained extremely low—about 1.60% on the 10-year U.S. Treasury note at the end of September, after dipping below 1.40% over the summer. And bond yields in some international markets were negative.
Even this relatively small window of time illustrates a truism of the financial markets: There will always be segments that perform well and others that don’t. Saving more saves you from trying to control the uncontrollable—how economies and the markets perform. And it keeps you in control of one of the most vital parts of your investment program.
Although the “save more” logic is easy to grasp, it’s not always easy to follow. Bills, illness, the loss of a job—these can affect any of us.
But whatever our circumstances, figuring out how to save more is worth the effort. It requires that we make difficult decisions to forgo some consumption today to increase the likelihood of consuming (or consuming more) in the future. This is the very heart of investing. Sacrifices are never fun, so consider carrying them out systematically and in doses that you
| Market Barometer | |||
| Average Annual Total Returns | |||
| Periods Ended September 30, 2016 | |||
| One | Three | Five | |
| Year | Years | Years | |
| Stocks | |||
| Russell 1000 Index (Large-caps) | 14.93% | 10.78% | 16.41% |
| Russell 2000 Index (Small-caps) | 15.47 | 6.71 | 15.82 |
| Russell 3000 Index (Broad U.S. market) | 14.96 | 10.44 | 16.36 |
| FTSE All-World ex US Index (International) | 9.62 | 0.71 | 6.50 |
| Bonds | |||
| Bloomberg Barclays U.S. Aggregate Bond Index | |||
| (Broad taxable market) | 5.19% | 4.03% | 3.08% |
| Bloomberg Barclays Municipal Bond Index | |||
| (Broad tax-exempt market) | 5.58 | 5.54 | 4.48 |
| Citigroup Three-Month U.S. Treasury Bill Index | 0.20 | 0.06 | 0.06 |
| CPI | |||
| Consumer Price Index | 1.46% | 1.03% | 1.25% |
4
can be comfortable with—for instance, gradually getting up to the max in your IRA, or adding a percentage point or so to the amount you stash in your employer’s retirement plan. As a point of reference, we generally suggest that investors strive for a retirement savings rate of 12%–15%, including any employer contributions.
If you need more convincing about the wisdom of the “save more” course of action, it might be helpful to examine your alternatives. This list is by no means exhaustive, but it hits on a few of the big ones, and none are without risk.
• Reach for yield. With yields so low on
many types of bonds, it’s tempting to find
the corners of the fixed income market
where payouts are juicier. But with the
juice comes considerable risk. You need
to be aware that you’d be taking on more
risk—and how much more.
• Go all-in on a hot-performing asset
class or fund. By now, you know better
than that, right?
• Sit tight. This approach isn’t a
terrible idea; it’s better than panicking
and deciding to just “do something,”
particularly if that means changing your
approach in response to the market’s
movements.
Here’s the inescapably challenging part of your partnership with the markets: In the short run, your “partner” is fickle, emotional, and wildly unpredictable. But in the long run, your partner is mostly rational and extremely helpful.
The best way to minimize your vulnerability to the market’s mood swings, and to maximize the benefit of your partner’s longer-term strengths, is to expect less and save more. Maybe the markets will deliver better-than-expected returns. Maybe they’ll be consistent with our more modest expectations. In either case, a higher savings rate can help put you in a better position to reach your goals.
As always, thank you for investing with Vanguard.
Sincerely,

F. William McNabb III
Chairman and Chief Executive Officer
October 18, 2016
5
Advisor’s Report
For the fiscal year ended September 30, 2016, Vanguard PRIMECAP Core Fund returned 16.78%, exceeding the 15.00% return of its benchmark, the unmanaged MSCI US Prime Market 750 Index, the 10.97% return of its multi-capitalization core fund competitors and the 15.43% return of the unmanaged Standard & Poor’s 500 Index, which serves as a proxy for the broad market in the attribution discussion that follows.
The fund’s information technology portfolio was the most significant contributor to its absolute and relative results, returning 38%, compared with the 23% return of the S&P 500 Information Technology Index. The fund’s overweight position in health care detracted from relative returns, as did the poor relative performance of its industrial holdings, which returned 10%, compared with the 19% return of the S&P 500 Industrials Index. Financials were a bright spot for the fund thanks to the combined benefit of an underweight position (financials were the worst-performing sector over the period) and favorable stock selection.
The investment environment
The investment environment has been inhospitable for active managers recently, with the vast majority of large-capitalization growth stock funds underperforming their benchmarks in calendar year 2016. The dispersion of sector returns has been extreme, as have the pace and magnitude of changes in market leadership.
For example, during the first quarter alone, the best-performing sector in the S&P 500 Index, telecommunication services (+17%), returned nearly 22 percentage points more than the worst-performing sector, financial services (–5%). Telecommunication services (+25%) and utilities (+23%), which led the market for the first six months of the calendar year (compared with the 4% total return of the S&P 500 Index), were the worst-performing sectors during the third calendar quarter, when each returned –6% (compared with the 4% total return of the S&P 500 Index). Conversely, information technology, which had a slightly negative total return in the first half of the year, far exceeded all other sectors during the third quarter, returning 12%.
Portfolio update
The portfolio remained heavily overweighted in information technology and health care stocks, which had a combined ending weight of 55%, compared with 36% in the S&P 500 Index. The portfolio’s most significant underweights were in consumer staples, energy, real estate, and utilities; those sectors’ combined ending weight was 2%, compared with 24% in the S&P 500 Index. The portfolio also was underweighted in consumer discretionary, financials, materials, and telecommunication services. Combined, they represented 25% of assets at the end of the period, compared with 31% in the S&P 500 Index.
In information technology, the fund is most overweighted in semiconductors (9% vs. 3% for the S&P 500 Index). During the past fiscal year, semiconductors were the sector’s best-performing industry for both the fund (+49%) and the index (+39%), with the fund’s outperformance driven
6
by Texas Instruments (+45%) and NVIDIA (+181%). The fund’s hardware stocks returned 39%, primarily due to Hewlett Packard Enterprise (+59%) and HP Inc. (+30%).
In health care, the fund is most overweighted in biotechnology and pharmaceutical stocks, whose 19% combined weighting was more than double their weighting in the S&P 500 Index at the end of the period. The portfolio’s biotech holdings returned 17%. Biogen (+7%), one of the fund’s largest holdings, suffered several setbacks during the fiscal year but rebounded strongly during the third quarter, returning 29%, in part on rumors that the company could be acquired. The fund’s pharmaceutical holdings returned 2%, below the index return, as Eli Lilly (–2%), Roche (–2%), and Novartis (–11%) underperformed.
The fund is also significantly overweighted in industrial stocks (17% vs. 10% for the S&P 500 Index), notably airlines (7% vs. 1% for the S&P 500 Index) and air freight and logistics companies (3% vs. 1%). Airline stocks were the worst-performing group in industrials; their return of less than 1% accounted for most of the fund’s underperformance in that sector.
As of September 30, 2016, the fund’s top 10 holdings represented 32% of assets.
Advisor perspectives
Our search for new investments often begins with research on out-of-favor companies and industries. Over the last several years, the information technology industry has been disrupted by cloud computing and the associated shift to subscription-based pricing models, the rise of smartphones and concomitant erosion of the personal computer market, and the advent of social networking. The industry has always been characterized by such disruptive innovations, which force incumbents to internally develop or acquire next-generation technologies in order to survive. Although such transitions carry significant risks, investors who focus solely on the threats posed by next-generation technologies often ignore the significant intellectual capital, established sales and distribution channels, and sizeable cash flows the “old technology” incumbents bring to bear.
Several years ago, Adobe and Microsoft were dismissed as “old technology” companies tied to legacy business models. Their software was delivered from locally deployed servers or personal computers and sold as perpetual licenses with annual maintenance contracts, whereas next-generation competitors delivered their software from the cloud and sold monthly subscriptions.
At the end of 2011, Adobe traded for $28 per share, or 11.5 times the 2012 estimated earnings per share (EPS) of $2.45, while at the end of 2012, Microsoft sold for $27 per share, or 8.8 times the 2013 estimated EPS of $3.04. In Adobe’s case, as it became clear that the company’s transition to a software-as-a-service (SaaS) model would be successful, investors overlooked the negative near-term financial impact of the transition and began to value the stock based on its long-term earnings
7
potential. Adobe currently trades for $107, or 27.3 times the 2017 estimated EPS of $3.97. In Microsoft’s case, the transitioning of its existing software to a SaaS model was accompanied by the creation of entirely new cloud computing businesses, which gave investors confidence that the company would remain a valued partner to its business customers as they shifted their internal IT environments to the cloud. Microsoft currently sells for $57, or 18.7 times the 2017 estimated EPS of $3.06.
The portfolio contains a number of stocks of “old technology” companies, including Cisco (12.5 times the 2017 estimated EPS), Intel (13.3 times), Hewlett Packard Enterprise (10.6 times), HP Inc. (9.6 times), Micron Technology (13.1 times), NetApp (13.2 times), and QUALCOMM (13.8 times). Each company faces unique challenges, but each possesses significant competitive advantages and has the potential to exceed the market’s modest expectations.
Outside of information technology, we remain enthusiastic about the fund’s airline holdings, whose extraordinarily low valuation multiples reflect a high degree of skepticism about their ability to sustain current profits. We are more sanguine about the outlook for airline industry profitability, as we believe industry supply and demand dynamics are favorable.
We also find many financials to be attractively valued, particularly large banks that are trading near book value and could benefit significantly from rising interest rates. Finally, we are excited by the prospects for our health care holdings,
many of which are trading at or below the S&P 500 Index forward price-to-earnings multiple in spite of superior secular growth prospects. In the short term, however, we expect significant volatility in this area, as two of the fund’s largest holdings, Biogen and Eli Lilly, present data related to their respective Alzheimer’s drugs later this year.
Conclusion
As bottom-up stock pickers, we spend our time searching for stocks with long-term prospects we find to be materially better than market prices would seem to imply. Our approach often results in portfolios that bear little resemblance to market indices, creating the possibility for substantial deviations in relative performance. For example, our relative returns were significantly negative during the first half of calendar 2016, when the fund’s overweighted sectors and industries underperformed, and we expect to experience similar conditions in the future. We nonetheless believe that this approach can generate superior results for shareholders over the long term.
PRIMECAP Management Company
October 24, 2016
8
PRIMECAP Core Fund
Fund Profile
As of September 30, 2016
| Portfolio Characteristics | |||
| DJ | |||
| U.S. | |||
| MSCI US | Total | ||
| Prime | Market | ||
| Market | FA | ||
| Fund | 750 Index | Index | |
| Number of Stocks | 148 | 748 | 3,850 |
| Median Market Cap | $49.7B | $67.0B | $51.8B |
| Price/Earnings Ratio | 19.0x | 22.9x | 23.7x |
| Price/Book Ratio | 3.3x | 2.9x | 2.8x |
| Return on Equity | 16.9% | 17.3% | 16.6% |
| Earnings Growth | |||
| Rate | 8.5% | 7.5% | 7.6% |
| Dividend Yield | 1.8% | 2.1% | 2.0% |
| Foreign Holdings | 11.0% | 0.0% | 0.0% |
| Turnover Rate | 11% | — | — |
| Ticker Symbol | VPCCX | — | — |
| Expense Ratio1 | 0.47% | — | — |
| 30-Day SEC Yield | 1.37% | — | — |
| Short-Term Reserves | 5.6% | — | — |
| Sector Diversification (% of equity exposure) | |||
| DJ | |||
| U.S. | |||
| MSCI US | Total | ||
| Prime | Market | ||
| Market | FA | ||
| Fund | 750 Index | Index | |
| Consumer Discretionary | 12.9% | 13.0% | 12.8% |
| Consumer Staples | 0.9 | 9.5 | 8.7 |
| Energy | 1.2 | 7.0 | 6.7 |
| Financials | 8.5 | 12.5 | 13.3 |
| Health Care | 25.1 | 14.3 | 14.2 |
| Industrials | 17.8 | 10.0 | 10.3 |
| Information Technology | 30.1 | 21.2 | 20.7 |
| Materials | 2.4 | 3.0 | 3.3 |
| Real Estate | 0.0 | 3.6 | 4.3 |
| Telecommunication | |||
| Services | 1.1 | 2.6 | 2.4 |
| Utilities | 0.0 | 3.3 | 3.3 |
| Volatility Measures | ||
| DJ | ||
| MSCI US | U.S. Total | |
| Prime Market | Market | |
| 750 Index | FA Index | |
| R-Squared | 0.90 | 0.90 |
| Beta | 0.99 | 0.98 |
| These measures show the degree and timing of the fund’s fluctuations compared with the indexes over 36 months. | ||
| Ten Largest Holdings (% of total net assets) | ||
| Amgen Inc. | Biotechnology | 4.6% |
| Southwest Airlines Co. | Airlines | 4.2 |
| Eli Lilly & Co. | Pharmaceuticals | 4.0 |
| Alphabet Inc. | Internet Software & | |
| Services | 3.6 | |
| Biogen Inc. | Biotechnology | 3.2 |
| Roche Holding AG | Pharmaceuticals | 3.1 |
| Texas Instruments Inc. | Semiconductors | 2.9 |
| JPMorgan Chase & Co. | Diversified Banks | 2.7 |
| Microsoft Corp. | Systems Software | 2.0 |
| FedEx Corp. | Air Freight & | |
| Logistics | 1.9 | |
| Top Ten | 32.2% | |
| The holdings listed exclude any temporary cash investments and equity index products. | ||
Investment Focus
1 The expense ratio shown is from the prospectus dated January 27, 2016, and represents estimated costs for the current fiscal year. For the fiscal
year ended September 30, 2016, the expense ratio was 0.46%.
9
PRIMECAP Core Fund
Performance Summary
All of the returns in this report represent past performance, which is not a guarantee of future results that may be achieved by the fund. (Current performance may be lower or higher than the performance data cited. For performance data current to the most recent month-end, visit our website at vanguard.com/performance.) Note, too, that both investment returns and principal value can fluctuate widely, so an investor’s shares, when sold, could be worth more or less than their original cost. The returns shown do not reflect taxes that a shareholder would pay on fund distributions or on the sale of fund shares.
Cumulative Performance: September 30, 2006, Through September 30, 2016
Initial Investment of $10,000
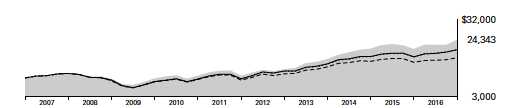
| Average Annual Total Returns | |||||
| Periods Ended September 30, 2016 | |||||
| Final Value | |||||
| One | Five | Ten | of a $10,000 | ||
| Year | Years | Years | Investment | ||
| PRIMECAP Core Fund | 16.78% | 17.55% | 9.30% | $24,343 | |
| •••••••• | MSCI US Prime Market 750 Index | 15.00 | 16.40 | 7.49 | 20,601 |
| – – – – | Dow Multi-Cap Jones Core U.S. Funds Total Stock Average Market | 10.97 | 13.82 | 5.82 | 17,602 |
| Float Adjusted Index | 14.93 | 16.30 | 7.49 | 20,592 | |
| Multi-Cap Core Funds Average: Derived from data provided by Lipper, a Thomson Reuters Company. | |||||
See Financial Highlights for dividend and capital gains information.
10
PRIMECAP Core Fund
Fiscal-Year Total Returns (%): September 30, 2006, Through September 30, 2016
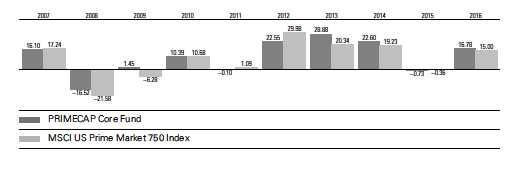
11
PRIMECAP Core Fund
Financial Statements
Statement of Net Assets
As of September 30, 2016
The fund reports a complete list of its holdings in regulatory filings four times in each fiscal year, at the quarter-ends. For the second and fourth fiscal quarters, the lists appear in the fund’s semiannual and annual reports to shareholders. For the first and third fiscal quarters, the fund files the lists with the Securities and Exchange Commission on Form N-Q. Shareholders can look up the fund’s Forms N-Q on the SEC’s website at sec.gov. Forms N-Q may also be reviewed and copied at the SEC’s Public Reference Room (see the back cover of this report for further information).
| Market | |||
| Value• | |||
| Shares | ($000) | ||
| Common Stocks (94.4%) | |||
| Consumer Discretionary (12.0%) | |||
| * | CarMax Inc. | 2,985,400 | 159,271 |
| Sony Corp. ADR | 3,765,000 | 125,036 | |
| TJX Cos. Inc. | 1,529,700 | 114,391 | |
| Royal Caribbean Cruises | |||
| Ltd. | 1,325,000 | 99,309 | |
| Carnival Corp. | 1,885,900 | 92,070 | |
| L Brands Inc. | 1,133,025 | 80,184 | |
| Ross Stores Inc. | 1,227,000 | 78,896 | |
| Walt Disney Co. | 620,000 | 57,573 | |
| Las Vegas Sands Corp. | 610,000 | 35,099 | |
| Tribune Media Co. | |||
| Class A | 803,500 | 29,344 | |
| * | Amazon.com Inc. | 30,593 | 25,616 |
| Lowe’s Cos. Inc. | 247,700 | 17,886 | |
| Garmin Ltd. | 350,000 | 16,839 | |
| VF Corp. | 278,000 | 15,582 | |
| Bed Bath & Beyond Inc. | 337,491 | 14,549 | |
| Gildan Activewear Inc. | |||
| Class A | 480,000 | 13,416 | |
| Comcast Corp. Class A | 148,500 | 9,851 | |
| * | Charter Communications | ||
| Inc. Class A | 24,400 | 6,587 | |
| * | AutoZone Inc. | 7,800 | 5,993 |
| Newell Brands Inc. | 110,000 | 5,793 | |
| * | Norwegian Cruise Line | ||
| Holdings Ltd. | 91,700 | 3,457 | |
| Marriott International Inc. | |||
| Class A | 46,000 | 3,097 | |
| Whirlpool Corp. | 10,000 | 1,622 | |
| 1,011,461 | |||
| Consumer Staples (0.8%) | |||
| CVS Health Corp. | 407,377 | 36,252 | |
| PepsiCo Inc. | 300,000 | 32,631 | |
| 68,883 | |||
| Energy (1.1%) | |||
| Schlumberger Ltd. | 447,414 | 35,185 | |
| *,^ | Transocean Ltd. | 1,408,300 | 15,013 |
| * | Southwestern Energy Co. | 960,000 | 13,286 |
| Cabot Oil & Gas Corp. | 425,000 | 10,965 | |
| National Oilwell Varco Inc. | 243,200 | 8,935 | |
| EOG Resources Inc. | 63,000 | 6,093 | |
| Exxon Mobil Corp. | 46,012 | 4,016 | |
| * | Petroleo Brasileiro SA ADR | ||
| Preference Shares | 75,000 | 623 | |
| Range Resources Corp. | 15,000 | 581 | |
| * | Petroleo Brasileiro SA ADR | 30,000 | 280 |
| ^ | Frank’s International NV | 10,000 | 130 |
| 95,107 | |||
| Financials (8.1%) | |||
| JPMorgan Chase & Co. | 3,351,365 | 223,168 | |
| Charles Schwab Corp. | 3,665,100 | 115,707 | |
| Marsh & McLennan | |||
| Cos. Inc. | 1,411,814 | 94,945 | |
| Wells Fargo & Co. | 1,733,000 | 76,737 | |
| Northern Trust Corp. | 700,400 | 47,620 | |
| Discover Financial | |||
| Services | 719,400 | 40,682 | |
| US Bancorp | 748,300 | 32,095 | |
| Progressive Corp. | 910,800 | 28,690 | |
| CME Group Inc. | 79,850 | 8,346 | |
| Travelers Cos. Inc. | 40,000 | 4,582 | |
| American Express Co. | 51,000 | 3,266 | |
| Comerica Inc. | 35,000 | 1,656 | |
| Chubb Ltd. | 9,630 | 1,210 | |
| 678,704 | |||
| Health Care (23.7%) | |||
| Amgen Inc. | 2,303,524 | 384,251 | |
| Eli Lilly & Co. | 4,242,100 | 340,471 | |
| * | Biogen Inc. | 865,400 | 270,896 |
| Roche Holding AG | 1,066,806 | 264,286 | |
| Novartis AG ADR | 1,686,105 | 133,135 | |
12
PRIMECAP Core Fund
| Market | |||
| Value• | |||
| Shares | ($000) | ||
| Medtronic plc | 1,097,550 | 94,828 | |
| Thermo Fisher Scientific | |||
| Inc. | 562,700 | 89,503 | |
| * | Boston Scientific Corp. | 3,327,200 | 79,187 |
| ^ | AstraZeneca plc ADR | 2,210,200 | 72,627 |
| Abbott Laboratories | 1,672,700 | 70,738 | |
| Johnson & Johnson | 558,800 | 66,011 | |
| * | Illumina Inc. | 155,900 | 28,321 |
| * | Waters Corp. | 165,000 | 26,151 |
| Merck & Co. Inc. | 370,000 | 23,092 | |
| Sanofi ADR | 540,000 | 20,623 | |
| Agilent Technologies Inc. | 382,600 | 18,017 | |
| Zimmer Biomet Holdings | |||
| Inc. | 42,900 | 5,578 | |
| Stryker Corp. | 45,500 | 5,297 | |
| AbbVie Inc. | 70,000 | 4,415 | |
| * | Cerner Corp. | 10,000 | 617 |
| 1,998,044 | |||
| Industrials (16.9%) | |||
| Southwest Airlines Co. | 9,006,525 | 350,264 | |
| FedEx Corp. | 928,500 | 162,190 | |
| American Airlines Group | |||
| Inc. | 2,747,800 | 100,597 | |
| Airbus Group SE | 1,586,850 | 95,987 | |
| United Parcel Service | |||
| Inc. Class B | 827,500 | 90,495 | |
| Honeywell International | |||
| Inc. | 690,000 | 80,447 | |
| * | United Continental | ||
| Holdings Inc. | 1,158,000 | 60,760 | |
| Delta Air Lines Inc. | 1,430,000 | 56,285 | |
| Deere & Co. | 513,400 | 43,819 | |
| Caterpillar Inc. | 492,000 | 43,675 | |
| * | Jacobs Engineering | ||
| Group Inc. | 746,655 | 38,617 | |
| Union Pacific Corp. | 316,400 | 30,858 | |
| CSX Corp. | 925,000 | 28,212 | |
| * | AECOM | 875,000 | 26,014 |
| Siemens AG | 215,000 | 25,169 | |
| Safran SA | 337,600 | 24,275 | |
| Rockwell Automation Inc. | 168,700 | 20,639 | |
| Pentair plc | 310,000 | 19,914 | |
| Ritchie Bros Auctioneers | |||
| Inc. (New York Shares) | 563,300 | 19,755 | |
| United Technologies Corp. | 150,000 | 15,240 | |
| * | Hertz Global Holdings Inc. | 342,000 | 13,735 |
| Republic Services Inc. | |||
| Class A | 268,935 | 13,568 | |
| IDEX Corp. | 139,000 | 13,006 | |
| * | Johnson Controls | ||
| International plc | 270,500 | 12,586 | |
| Expeditors International | |||
| of Washington Inc. | 230,000 | 11,850 | |
| Boeing Co. | 80,000 | 10,539 | |
| Textron Inc. | 160,000 | 6,360 | |
| * | TransDigm Group Inc. | 12,500 | 3,614 |
| * | Herc Holdings Inc. | 104,000 | 3,505 |
| * | Kirby Corp. | 16,000 | 994 |
| Chicago Bridge & Iron Co. | |||
| NV | 20,000 | 561 | |
| 1,423,530 | |||
| Information Technology (28.4%) | |||
| Texas Instruments Inc. | 3,506,100 | 246,058 | |
| Microsoft Corp. | 2,959,200 | 170,450 | |
| Hewlett Packard | |||
| Enterprise Co. | 6,917,567 | 157,375 | |
| * | Alphabet Inc. Class A | 189,677 | 152,512 |
| * | Alphabet Inc. Class C | 189,108 | 146,992 |
| Intel Corp. | 3,309,400 | 124,930 | |
| * | Flex Ltd. | 9,031,200 | 123,005 |
| NetApp Inc. | 3,020,400 | 108,191 | |
| HP Inc. | 6,739,367 | 104,662 | |
| NVIDIA Corp. | 1,503,000 | 102,986 | |
| QUALCOMM Inc. | 1,280,430 | 87,709 | |
| KLA-Tencor Corp. | 1,178,600 | 82,160 | |
| Cisco Systems Inc. | 2,507,500 | 79,538 | |
| Intuit Inc. | 541,500 | 59,570 | |
| * | Alibaba Group Holding | ||
| Ltd. ADR | 542,430 | 57,384 | |
| ASML Holding NV | 480,000 | 52,598 | |
| ^ | Telefonaktiebolaget LM | ||
| Ericsson ADR | 7,197,900 | 51,897 | |
| * | Adobe Systems Inc. | 435,000 | 47,215 |
| * | eBay Inc. | 1,266,900 | 41,681 |
| Activision Blizzard Inc. | 905,000 | 40,091 | |
| Applied Materials Inc. | 1,274,000 | 38,411 | |
| * | Micron Technology Inc. | 1,970,000 | 35,027 |
| Corning Inc. | 1,425,000 | 33,701 | |
| * | PayPal Holdings Inc. | 744,300 | 30,494 |
| * | Yahoo! Inc. | 692,600 | 29,851 |
| * | Keysight Technologies | ||
| Inc. | 924,700 | 29,304 | |
| * | Electronic Arts Inc. | 290,000 | 24,766 |
| Analog Devices Inc. | 365,000 | 23,524 | |
| Visa Inc. Class A | 277,000 | 22,908 | |
| * | Dell Technologies Inc - | ||
| VMware Inc | 394,823 | 18,872 | |
| Western Digital Corp. | 302,743 | 17,701 | |
| Oracle Corp. | 450,000 | 17,676 | |
| Apple Inc. | 132,000 | 14,923 | |
| * | BlackBerry Ltd. | 1,547,500 | 12,349 |
| Teradyne Inc. | 200,000 | 4,316 | |
| *,^ | VMware Inc. Class A | 3,000 | 220 |
| 2,391,047 | |||
| Materials (2.3%) | |||
| Monsanto Co. | 773,350 | 79,036 | |
| Praxair Inc. | 229,700 | 27,755 | |
| Dow Chemical Co. | 433,000 | 22,442 | |
13
PRIMECAP Core Fund
| Market | ||
| Value• | ||
| Shares | ($000) | |
| Celanese Corp. Class A | 310,000 | 20,634 |
| EI du Pont de Nemours & | ||
| Co. | 275,000 | 18,417 |
| Cabot Corp. | 125,000 | 6,551 |
| Greif Inc. Class A | 125,400 | 6,219 |
| * Crown Holdings Inc. | 100,000 | 5,709 |
| LyondellBasell Industries | ||
| NV Class A | 46,200 | 3,726 |
| Greif Inc. Class B | 37,000 | 2,242 |
| 192,731 | ||
| Telecommunication Services (1.1%) | ||
| *,^ Sprint Corp. | 8,150,000 | 54,035 |
| AT&T Inc. | 905,492 | 36,772 |
| 90,807 | ||
| Total Common Stocks | ||
| (Cost $4,701,599) | 7,950,314 | |
| Temporary Cash Investment (6.3%) | ||
| Money Market Fund (6.3%) | ||
| 1,2 Vanguard Market | ||
| Liquidity Fund, 0.640% | ||
| (Cost $526,791) | 5,267,828 | 526,835 |
| Total Investments (100.7%) | ||
| (Cost $5,228,390) | 8,477,149 | |
| Amount | |
| ($000) | |
| Other Assets and Liabilities (-0.7%) | |
| Other Assets | |
| Investment in Vanguard | 641 |
| Receivables for Investment Securities Sold 4,652 | |
| Receivables for Accrued Income | 10,334 |
| Receivables for Capital Shares Issued | 2,144 |
| Other Assets | 1,254 |
| Total Other Assets | 19,025 |
| Liabilities | |
| Payables for Investment Securities | |
| Purchased | (7,420) |
| Collateral for Securities on Loan | (51,910) |
| Payables to Investment Advisor | (6,351) |
| Payables for Capital Shares Redeemed | (2,449) |
| Payables to Vanguard | (8,046) |
| Other Liabilities | (9) |
| Total Liabilities | (76,185) |
| Net Assets (100%) | |
| Applicable to 373,438,294 outstanding | |
| $.001 par value shares of beneficial | |
| interest (unlimited authorization) | 8,419,989 |
| Net Asset Value Per Share | $22.55 |
| At September 30, 2016, net assets consisted of: | |
| Amount | |
| ($000) | |
| Paid-in Capital | 4,763,695 |
| Undistributed Net Investment Income | 70,929 |
| Accumulated Net Realized Gains | 336,733 |
| Unrealized Appreciation (Depreciation) | |
| Investment Securities | 3,248,759 |
| Foreign Currencies | (127) |
| Net Assets | 8,419,989 |
• See Note A in Notes to Financial Statements.
* Non-income-producing security.
^ Includes partial security positions on loan to broker-dealers. The total value of securities on loan is $49,807,000.
1 Affiliated money market fund available only to Vanguard funds and certain trusts and accounts managed by Vanguard. Rate shown is the
7-day yield.
2 Includes $51,910,000 of collateral received for securities on loan.
ADR—American Depositary Receipt.
See accompanying Notes, which are an integral part of the Financial Statements.
14
PRIMECAP Core Fund
Statement of Operations
| Year Ended | |
| September 30, 2016 | |
| ($000) | |
| Investment Income | |
| Income | |
| Dividends1 | 134,770 |
| Interest2 | 2,550 |
| Securities Lending—Net | 853 |
| Total Income | 138,173 |
| Expenses | |
| Investment Advisory Fees—Note B | 24,009 |
| The Vanguard Group—Note C | |
| Management and Administrative | 9,906 |
| Marketing and Distribution | 1,380 |
| Custodian Fees | 146 |
| Auditing Fees | 32 |
| Shareholders’ Reports | 60 |
| Trustees’ Fees and Expenses | 9 |
| Total Expenses | 35,542 |
| Net Investment Income | 102,631 |
| Realized Net Gain (Loss) | |
| Investment Securities Sold2 | 365,177 |
| Foreign Currencies | (12) |
| Realized Net Gain (Loss) | 365,165 |
| Change in Unrealized Appreciation (Depreciation) | |
| Investment Securities | 731,546 |
| Foreign Currencies | 19 |
| Change in Unrealized Appreciation (Depreciation) | 731,565 |
| Net Increase (Decrease) in Net Assets Resulting from Operations | 1,199,361 |
| 1 Dividends are net of foreign withholding taxes of $3,386,000. | |
| 2 Interest income and realized net gain (loss) from an affiliated company of the fund were $2,549,000 and $5,000, respectively. | |
See accompanying Notes, which are an integral part of the Financial Statements.
15
PRIMECAP Core Fund
Statement of Changes in Net Assets
| Year Ended September 30, | ||
| 2016 | 2015 | |
| ($000) | ($000) | |
| Increase (Decrease) in Net Assets | ||
| Operations | ||
| Net Investment Income | 102,631 | 95,603 |
| Realized Net Gain (Loss) | 365,165 | 323,785 |
| Change in Unrealized Appreciation (Depreciation) | 731,565 | (477,795) |
| Net Increase (Decrease) in Net Assets Resulting from Operations | 1,199,361 | (58,407) |
| Distributions | ||
| Net Investment Income | (84,999) | (85,623) |
| Realized Capital Gain1 | (275,983) | (411,308) |
| Total Distributions | (360,982) | (496,931) |
| Capital Share Transactions | ||
| Issued | 1,115,657 | 800,640 |
| Issued in Lieu of Cash Distributions | 323,163 | 445,777 |
| Redeemed | (774,510) | (601,660) |
| Net Increase (Decrease) from Capital Share Transactions | 664,310 | 644,757 |
| Total Increase (Decrease) | 1,502,689 | 89,419 |
| Net Assets | ||
| Beginning of Period | 6,917,300 | 6,827,881 |
| End of Period2 | 8,419,989 | 6,917,300 |
| 1 Includes fiscal 2016 and 2015 short-term gain distributions totaling $0 and $11,734,000, respectively. Short-term gain distributions are treated as ordinary income dividends for tax purposes. | ||
| 2 Net Assets—End of Period includes undistributed (overdistributed) net investment income of $70,929,000 and $57,888,000. | ||
See accompanying Notes, which are an integral part of the Financial Statements.
16
PRIMECAP Core Fund
Financial Highlights
| For a Share Outstanding | Year Ended September 30, | ||||
| Throughout Each Period | 2016 | 2015 | 2014 | 2013 | 2012 |
| Net Asset Value, Beginning of Period | $20.26 | $21.87 | $18.65 | $14.98 | $12.37 |
| Investment Operations | |||||
| Net Investment Income | .275 | .285 | .255 | .242 | .206 |
| Net Realized and Unrealized Gain (Loss) | |||||
| on Investments | 3.047 | (.328) | 3.820 | 3.955 | 2.567 |
| Total from Investment Operations | 3.322 | (.043) | 4.075 | 4.197 | 2.773 |
| Distributions | |||||
| Dividends from Net Investment Income | (. 243) | (. 270) | (.178) | (. 260) | (.163) |
| Distributions from Realized Capital Gains | (.789) | (1.297) | (.677) | (.267) | — |
| Total Distributions | (1.032) | (1.567) | (.855) | (.527) | (.163) |
| Net Asset Value, End of Period | $22.55 | $20.26 | $21.87 | $18.65 | $14.98 |
| Total Return1 | 16.78% | -0.73% | 22.60% | 28.88% | 22.55% |
| Ratios/Supplemental Data | |||||
| Net Assets, End of Period (Millions) | $8,420 | $6,917 | $6,828 | $5,774 | $4,702 |
| Ratio of Total Expenses to Average Net Assets | 0.46% | 0.47% | 0.50% | 0.50% | 0.50% |
| Ratio of Net Investment Income to | |||||
| Average Net Assets | 1.31% | 1.29% | 1.23% | 1.42% | 1.39% |
| Portfolio Turnover Rate | 11% | 10% | 13% | 7% | 10% |
| 1 Total returns do not include transaction or account service fees that may have applied in the periods shown. Fund prospectuses provide | |||||
| information about any applicable transaction and account service fees. | |||||
See accompanying Notes, which are an integral part of the Financial Statements.
17
PRIMECAP Core Fund
Notes to Financial Statements
Vanguard PRIMECAP Core Fund is registered under the Investment Company Act of 1940 as an open-end investment company, or mutual fund.
A. The following significant accounting policies conform to generally accepted accounting principles for U.S. investment companies. The fund consistently follows such policies in preparing its financial statements.
1. Security Valuation: Securities are valued as of the close of trading on the New York Stock Exchange (generally 4 p.m., Eastern time) on the valuation date. Equity securities are valued at the latest quoted sales prices or official closing prices taken from the primary market in which each security trades; such securities not traded on the valuation date are valued at the mean of the latest quoted bid and asked prices. Securities for which market quotations are not readily available, or whose values have been affected by events occurring before the fund’s pricing time but after the close of the securities’ primary markets, are valued at their fair values calculated according to procedures adopted by the board of trustees. These procedures include obtaining quotations from an independent pricing service, monitoring news to identify significant market- or security-specific events, and evaluating changes in the values of foreign market proxies (for example, ADRs, futures contracts, or exchange-traded funds), between the time the foreign markets close and the fund’s pricing time. When fair-value pricing is employed, the prices of securities used by a fund to calculate its net asset value may differ from quoted or published prices for the same securities. Investments in Vanguard Market Liquidity Fund are valued at that fund’s net asset value.
2. Foreign Currency: Securities and other assets and liabilities denominated in foreign currencies are translated into U.S. dollars using exchange rates obtained from an independent third party as of the fund’s pricing time on the valuation date. Realized gains (losses) and unrealized appreciation (depreciation) on investment securities include the effects of changes in exchange rates since the securities were purchased, combined with the effects of changes in security prices. Fluctuations in the value of other assets and liabilities resulting from changes in exchange rates are recorded as unrealized foreign currency gains (losses) until the assets or liabilities are settled in cash, at which time they are recorded as realized foreign currency gains (losses).
3. Federal Income Taxes: The fund intends to continue to qualify as a regulated investment company and distribute all of its taxable income. Management has analyzed the fund’s tax positions taken for all open federal income tax years (September 30, 2013–2016), and has concluded that no provision for federal income tax is required in the fund’s financial statements.
4. Distributions: Distributions to shareholders are recorded on the ex-dividend date.
5. Securities Lending: To earn additional income, the fund lends its securities to qualified institutional borrowers. Security loans are subject to termination by the fund at any time, and are required to be secured at all times by collateral in an amount at least equal to the market value of securities loaned. Daily market fluctuations could cause the value of loaned securities to be more or less than the value of the collateral received. When this occurs, the collateral is adjusted and settled on the next business day. The fund further mitigates its counterparty risk by entering into securities lending transactions only with a diverse group of prequalified counterparties, monitoring their financial strength, and entering into master securities lending agreements with its counterparties. The master securities lending agreements provide that, in the event of a counterparty’s default (including bankruptcy), the
18
PRIMECAP Core Fund
fund may terminate any loans with that borrower, determine the net amount owed, and sell or retain the collateral up to the net amount owed to the fund; however, such actions may be subject to legal proceedings. While collateral mitigates counterparty risk, in the absence of a default the fund may experience delays and costs in recovering the securities loaned. The fund invests cash collateral received in Vanguard Market Liquidity Fund, and records a liability in the Statement of Net Assets for the return of the collateral, during the period the securities are on loan. Securities lending income represents fees charged to borrowers plus income earned on invested cash collateral, less expenses associated with the loan. During the term of the loan, the fund is entitled to all distributions made on or in respect of the loaned securities.
6. Credit Facility: The fund and certain other funds managed by The Vanguard Group (“Vanguard”) participate in a $3.1 billion committed credit facility provided by a syndicate of lenders pursuant to a credit agreement that may be renewed annually; each fund is individually liable for its borrowings, if any, under the credit facility. Borrowings may be utilized for temporary and emergency purposes, and are subject to the fund’s regulatory and contractual borrowing restrictions. The participating funds are charged administrative fees and an annual commitment fee of 0.10% of the undrawn amount of the facility; these fees are allocated to the funds based on a method approved by the fund’s board of trustees and included in Management and Administrative expenses on the fund’s Statement of Operations. Any borrowings under this facility bear interest at a rate based upon the higher of the one-month London Interbank Offered Rate, federal funds effective rate, or overnight bank funding rate plus an agreed-upon spread.
The fund had no borrowings outstanding at September 30, 2016, or at any time during the period then ended.
7. Other: Dividend income is recorded on the ex-dividend date. Interest income includes income distributions received from Vanguard Market Liquidity Fund and is accrued daily. Security transactions are accounted for on the date securities are bought or sold. Costs used to determine realized gains (losses) on the sale of investment securities are those of the specific securities sold.
B. PRIMECAP Management Company provides investment advisory services to the fund for a fee calculated at an annual percentage rate of average net assets. For the year ended September 30, 2016, the investment advisory fee represented an effective annual rate of 0.31% of the fund’s average net assets.
C. In accordance with the terms of a Funds’ Service Agreement (the “FSA”) between Vanguard and the fund, Vanguard furnishes to the fund corporate management, administrative, marketing, and distribution services at Vanguard’s cost of operations (as defined by the FSA). These costs of operations are allocated to the fund based on methods and guidelines approved by the board of trustees. Vanguard does not require reimbursement in the current period for certain costs of operations (such as deferred compensation/benefits and risk/insurance costs); the fund’s liability for these costs of operations is included in Payables to Vanguard on the Statement of Net Assets.
Upon the request of Vanguard, the fund may invest up to 0.40% of its net assets as capital in Vanguard. At September 30, 2016, the fund had contributed to Vanguard capital in the amount of $641,000, representing 0.01% of the fund’s net assets and 0.26% of Vanguard’s capitalization. The fund’s trustees and officers are also directors and employees, respectively, of Vanguard.
19
PRIMECAP Core Fund
D. Various inputs may be used to determine the value of the fund’s investments. These inputs are summarized in three broad levels for financial statement purposes. The inputs or methodologies used to value securities are not necessarily an indication of the risk associated with investing in those securities.
Level 1—Quoted prices in active markets for identical securities.
Level 2—Other significant observable inputs (including quoted prices for similar securities, interest rates, prepayment speeds, credit risk, etc.).
Level 3—Significant unobservable inputs (including the fund’s own assumptions used to determine the fair value of investments).
The following table summarizes the market value of the fund’s investments as of September 30, 2016, based on the inputs used to value them:
| Level 1 | Level 2 | Level 3 | |
| Investments | ($000) | ($000) | ($000) |
| Common Stocks | 7,540,597 | 409,717 | — |
| Temporary Cash Investments | 526,835 | — | — |
| Total | 8,067,432 | 409,717 | — |
E. Distributions are determined on a tax basis and may differ from net investment income and realized capital gains for financial reporting purposes. Differences may be permanent or temporary. Permanent differences are reclassified among capital accounts in the financial statements to reflect their tax character. Temporary differences arise when certain items of income, expense, gain, or loss are recognized in different periods for financial statement and tax purposes. These differences will reverse at some time in the future. Differences in classification may also result from the treatment of short-term gains as ordinary income for tax purposes.
During the year ended September 30, 2016, the fund realized net foreign currency losses of $12,000, which decreased distributable net income for tax purposes; accordingly, such losses have been reclassified from accumulated net realized gains to undistributed net investment income.
The fund used a tax accounting practice to treat a portion of the price of capital shares redeemed during the year as distributions from net investment income and realized capital gains. Accordingly, the fund has reclassified $4,579,000 from undistributed net investment income, and $16,281,000 from accumulated net realized gains, to paid-in capital.
For tax purposes, at September 30, 2016, the fund had $91,460,000 of ordinary income and $324,186,000 of long-term capital gains available for distribution.
At September 30, 2016, the cost of investment securities for tax purposes was $5,228,390,000. Net unrealized appreciation of investment securities for tax purposes was $3,248,759,000, consisting of unrealized gains of $3,408,700,000 on securities that had risen in value since their purchase and $159,941,000 in unrealized losses on securities that had fallen in value since their purchase.
F. During the year ended September 30, 2016, the fund purchased $1,105,407,000 of investment securities and sold $820,962,000 of investment securities, other than temporary cash investments.
20
PRIMECAP Core Fund
G. Capital shares issued and redeemed were:
| Year Ended September 30, | ||
| 2016 | 2015 | |
| Shares | Shares | |
| (000) | (000) | |
| Issued | 53,545 | 36,473 |
| Issued in Lieu of Cash Distributions | 15,403 | 20,364 |
| Redeemed | (36,981) | (27,555) |
| Net Increase (Decrease) in Shares Outstanding | 31,967 | 29,282 |
H. Management has determined that no material events or transactions occurred subsequent to September 30, 2016, that would require recognition or disclosure in these financial statements.
21
Report of Independent Registered
Public Accounting Firm
To the Board of Trustees of Vanguard Fenway Funds and the Shareholders of Vanguard PRIMECAP Core Fund: In our opinion, the accompanying statement of net assets and the related statements of operations and of changes in net assets and the financial highlights present fairly, in all material respects, the financial position of Vanguard PRIMECAP Core Fund (constituting a separate portfolio of Vanguard Fenway Funds, hereafter referred to as the “Fund”) at September 30, 2016, the results of its operations for the year then ended, the changes in its net assets for each of the two years in the period then ended, and the financial highlights for each of the five years in the period then ended, in conformity with accounting principles generally accepted in the United States of America. These financial statements and financial highlights (hereafter referred to as “financial statements”) are the responsibility of the Fund’s management. Our responsibility is to express an opinion on these financial statements based on our audits. We conducted our audits of these financial statements in accordance with the standards of the Public Company Accounting Oversight Board (United States). Those standards require that we plan and perform the audit to obtain reasonable assurance about whether the financial statements are free of material misstatement. An audit includes examining, on a test basis, evidence supporting the amounts and disclosures in the financial statements, assessing the accounting principles used and significant estimates made by management, and evaluating the overall financial statement presentation. We believe that our audits, which included confirmation of securities at September 30, 2016 by correspondence with the custodian and brokers and by agreement to the underlying ownership records of the transfer agent, provide a reasonable basis for our opinion.
/s/PricewaterhouseCoopers LLP
Philadelphia, Pennsylvania
November 15, 2016

Special 2016 tax information (unaudited) for Vanguard PRIMECAP Core Fund
This information for the fiscal year ended September 30, 2016, is included pursuant to provisions
of the Internal Revenue Code.
The fund distributed $291,675,000 as capital gain dividends (20% rate gain distributions) to
shareholders during the fiscal year.
The fund distributed $84,999,000 of qualified dividend income to shareholders during the fiscal year.
For corporate shareholders, 91.7% of investment income (dividend income plus short-term gains, if
any) qualifies for the dividends-received deduction.
22
Your Fund’s After-Tax Returns
This table presents returns for your fund both before and after taxes. The after-tax returns are shown in two ways: (1) assuming that an investor owned the fund during the entire period and paid taxes on the fund’s distributions, and (2) assuming that an investor paid taxes on the fund’s distributions and sold all shares at the end of each period.
Calculations are based on the highest individual federal income tax and capital gains tax rates in effect at the times of the distributions and the hypothetical sales. State and local taxes were not considered. After-tax returns reflect any qualified dividend income, using actual prior-year figures and estimates for 2016. (In the example, returns after the sale of fund shares may be higher than those assuming no sale. This occurs when the sale would have produced a capital loss. The calculation assumes that the investor received a tax deduction for the loss.)
Please note that your actual after-tax returns will depend on your tax situation and may differ from those shown. Also note that if you own the fund in a tax-deferred account, such as an individual retirement account or a 401(k) plan, this information does not apply to you. Such accounts are not subject to current taxes.
Finally, keep in mind that a fund’s performance—whether before or after taxes—does not guarantee future results.
| Average Annual Total Returns: PRIMECAP Core Fund | |||
| Periods Ended September 30, 2016 | |||
| One | Five | Ten | |
| Year | Years | Years | |
| Returns Before Taxes | 16.78% | 17.55% | 9.30% |
| Returns After Taxes on Distributions | 15.47 | 16.51 | 8.69 |
| Returns After Taxes on Distributions and Sale of Fund Shares | 10.44 | 14.16 | 7.58 |
23
About Your Fund’s Expenses
As a shareholder of the fund, you incur ongoing costs, which include costs for portfolio management, administrative services, and shareholder reports (like this one), among others. Operating expenses, which are deducted from a fund’s gross income, directly reduce the investment return of the fund.
A fund’s expenses are expressed as a percentage of its average net assets. This figure is known as the expense ratio. The following examples are intended to help you understand the ongoing costs (in dollars) of investing in your fund and to compare these costs with those of other mutual funds. The examples are based on an investment of $1,000 made at the beginning of the period shown and held for the entire period.
The accompanying table illustrates your fund’s costs in two ways:
• Based on actual fund return. This section helps you to estimate the actual expenses that you paid over the period. The ”Ending Account Value“ shown is derived from the fund‘s actual return, and the third column shows the dollar amount that would have been paid by an investor who started with $1,000 in the fund. You may use the information here, together with the amount you invested, to estimate the expenses that you paid over the period.
To do so, simply divide your account value by $1,000 (for example, an $8,600 account value divided by $1,000 = 8.6), then multiply the result by the number given for your fund under the heading ”Expenses Paid During Period.“
• Based on hypothetical 5% yearly return. This section is intended to help you compare your fund‘s costs with those of other mutual funds. It assumes that the fund had a yearly return of 5% before expenses, but that the expense ratio is unchanged. In this case—because the return used is not the fund’s actual return—the results do not apply to your investment. The example is useful in making comparisons because the Securities and Exchange Commission requires all mutual funds to calculate expenses based on a 5% return. You can assess your fund’s costs by comparing this hypothetical example with the hypothetical examples that appear in shareholder reports of other funds.
Note that the expenses shown in the table are meant to highlight and help you compare ongoing costs only and do not reflect transaction costs incurred by the fund for buying and selling securities. Further, the expenses do not include any purchase, redemption, or account service fees described in the fund prospectus. If such fees were applied to your account, your costs would be higher. Your fund does not carry a “sales load.”
The calculations assume no shares were bought or sold during the period. Your actual costs may have been higher or lower, depending on the amount of your investment and the timing of any purchases or redemptions.
You can find more information about the fund’s expenses, including annual expense ratios, in the Financial Statements section of this report. For additional information on operating expenses and other shareholder costs, please refer to your fund’s current prospectus.
24
| Six Months Ended September 30, 2016 | |||
| Beginning | Ending | Expenses | |
| Account Value | Account Value | Paid During | |
| PRIMECAP Core Fund | 3/31/2016 | 9/30/2016 | Period |
| Based on Actual Fund Return | $1,000.00 | $1,087.80 | $2.40 |
| Based on Hypothetical 5% Yearly Return | 1,000.00 | 1,022.70 | 2.33 |
The calculations are based on expenses incurred in the most recent six-month period. The fund’s annualized six-month expense ratio for that
period is 0.46%. The dollar amounts shown as “Expenses Paid” are equal to the annualized expense ratio multiplied by the average account
value over the period, multiplied by the number of days in the most recent six-month period, then divided by the number of days in the most
recent 12-month period (183/366).
25
Glossary
30-Day SEC Yield. A fund’s 30-day SEC yield is derived using a formula specified by the U.S. Securities and Exchange Commission. Under the formula, data related to the fund’s security holdings in the previous 30 days are used to calculate the fund’s hypothetical net income for that period, which is then annualized and divided by the fund’s estimated average net assets over the calculation period. For the purposes of this calculation, a security’s income is based on its current market yield to maturity (for bonds), its actual income (for asset-backed securities), or its projected dividend yield (for stocks). Because the SEC yield represents hypothetical annualized income, it will differ—at times significantly—from the fund’s actual experience. As a result, the fund’s income distributions may be higher or lower than implied by the SEC yield.
Beta. A measure of the magnitude of a fund’s past share-price fluctuations in relation to the ups and downs of a given market index. The index is assigned a beta of 1.00. Compared with a given index, a fund with a beta of 1.20 typically would have seen its share price rise or fall by 12% when the index rose or fell by 10%. For this report, beta is based on returns over the past 36 months for both the fund and the index. Note that a fund’s beta should be reviewed in conjunction with its R-squared (see definition). The lower the R-squared, the less correlation there is between the fund and the index, and the less reliable beta is as an indicator of volatility.
Dividend Yield. Dividend income earned by stocks, expressed as a percentage of the aggregate market value (or of net asset value, for a fund). The yield is determined by dividing the amount of the annual dividends by the aggregate value (or net asset value) at the end of the period. For a fund, the dividend yield is based solely on stock holdings and does not include any income produced by other investments.
Earnings Growth Rate. The average annual rate of growth in earnings over the past five years for the stocks now in a fund.
Equity Exposure. A measure that reflects a fund’s investments in stocks and stock futures. Any holdings in short-term reserves are excluded.
Expense Ratio. A fund’s total annual operating expenses expressed as a percentage of the fund’s average net assets. The expense ratio includes management and administrative expenses, but does not include the transaction costs of buying and selling portfolio securities.
Foreign Holdings. The percentage of a fund represented by securities or depositary receipts of companies based outside the United States.
Inception Date. The date on which the assets of a fund (or one of its share classes) are first invested in accordance with the fund’s investment objective. For funds with a subscription period, the inception date is the day after that period ends. Investment performance is measured from the inception date.
Median Market Cap. An indicator of the size of companies in which a fund invests; the midpoint of market capitalization (market price x shares outstanding) of a fund’s stocks, weighted by the proportion of the fund’s assets invested in each stock. Stocks representing half of the fund’s assets have market capitalizations above the median, and the rest are below it.
Price/Book Ratio. The share price of a stock divided by its net worth, or book value, per share. For a fund, the weighted average price/book ratio of the stocks it holds.
26
Price/Earnings Ratio. The ratio of a stock’s current price to its per-share earnings over the past year. For a fund, the weighted average P/E of the stocks it holds. P/E is an indicator of market expectations about corporate prospects; the higher the P/E, the greater the expectations for a company’s future growth.
R-Squared. A measure of how much of a fund’s past returns can be explained by the returns from the market in general, as measured by a given index. If a fund’s total returns were precisely synchronized with an index’s returns, its R-squared would be 1.00. If the fund’s returns bore no relationship to the index’s returns, its R-squared would be 0. For this report, R-squared is based on returns over the past 36 months for both the fund and the index.
Return on Equity. The annual average rate of return generated by a company during the past five years for each dollar of shareholder’s equity (net income divided by shareholder’s equity). For a fund, the weighted average return on equity for the companies whose stocks it holds.
Short-Term Reserves. The percentage of a fund invested in highly liquid, short-term securities that can be readily converted to cash.
Turnover Rate. An indication of the fund’s trading activity. Funds with high turnover rates incur higher transaction costs and may be more likely to distribute capital gains (which may be taxable to investors). The turnover rate excludes in-kind transactions, which have minimal impact on costs.
27
The People Who Govern Your Fund
The trustees of your mutual fund are there to see that the fund is operated and managed in your best interests since, as a shareholder, you are a part owner of the fund. Your fund’s trustees also serve on the board of directors of The Vanguard Group, Inc., which is owned by the Vanguard funds and provides services to them on an at-cost basis.
A majority of Vanguard’s board members are independent, meaning that they have no affiliation with Vanguard or the funds they oversee, apart from the sizable personal investments they have made as private individuals. The independent board members have distinguished backgrounds in business, academia, and public service. Each of the trustees and executive officers oversees 198 Vanguard funds.
The following table provides information for each trustee and executive officer of the fund. The mailing address of the trustees and officers is P.O. Box 876, Valley Forge, PA 19482. More information about the trustees is in the Statement of Additional Information, which can be obtained, without charge, by contacting Vanguard at 800-662-7447, or online at vanguard.com.
| InterestedTrustee1 |
| F. William McNabb III |
| Born 1957. Trustee Since July 2009. Chairman of |
| the Board. Principal Occupation(s) During the Past |
| Five Years and Other Experience: Chairman of the |
| Board of The Vanguard Group, Inc., and of each of |
| the investment companies served by The Vanguard |
| Group, since January 2010; Director of The Vanguard |
| Group since 2008; Chief Executive Officer and |
| President of The Vanguard Group, and of each of |
| the investment companies served by The Vanguard |
| Group, since 2008; Director of Vanguard Marketing |
| Corporation; Managing Director of The Vanguard |
| Group (1995–2008). |
| IndependentTrustees |
| Emerson U. Fullwood |
| Born 1948. Trustee Since January 2008. Principal |
| Occupation(s) During the Past Five Years and Other |
| Experience: Executive Chief Staff and Marketing |
| Officer for North America and Corporate Vice President |
| (retired 2008) of Xerox Corporation (document manage- |
| ment products and services); Executive in Residence |
| and 2009–2010 Distinguished Minett Professor at |
| the Rochester Institute of Technology; Lead Director |
| of SPX FLOW, Inc. (multi-industry manufacturing); |
| Director of the United Way of Rochester, the University |
| of Rochester Medical Center, Monroe Community |
| College Foundation, North Carolina A&T University, |
| and Roberts Wesleyan College. |
| Rajiv L. Gupta |
| Born 1945. Trustee Since December 2001.2 Principal |
| Occupation(s) During the Past Five Years and Other |
| Experience: Chairman and Chief Executive Officer |
| (retired 2009) and President (2006–2008) of |
| Rohm and Haas Co. (chemicals); Director of Tyco |
| International plc (diversified manufacturing and |
| services), HP Inc. (printer and personal computer |
| manufacturing), and Delphi Automotive plc |
| (automotive components); Senior Advisor at |
| New Mountain Capital. |
Amy Gutmann |
| Born 1949. Trustee Since June 2006. Principal |
| Occupation(s) During the Past Five Years and |
| Other Experience: President of the University of |
| Pennsylvania; Christopher H. Browne Distinguished |
| Professor of Political Science, School of Arts and |
| Sciences, and Professor of Communication, Annenberg |
| School for Communication, with secondary faculty |
| appointments in the Department of Philosophy, School |
| of Arts and Sciences, and at the Graduate School of |
| Education, University of Pennsylvania; Trustee of the |
| National Constitution Center; Chair of the Presidential |
| Commission for the Study of Bioethical Issues. |
JoAnn Heffernan Heisen |
| Born 1950. Trustee Since July 1998. Principal |
| Occupation(s) During the Past Five Years and |
| Other Experience: Corporate Vice President and |
| Chief Global Diversity Officer (retired 2008) and |
| Member of the Executive Committee (1997–2008) |
| of Johnson & Johnson (pharmaceuticals/medical |
| devices/consumer products); Director of Skytop |
| Lodge Corporation (hotels) and the Robert Wood |
| Johnson Foundation; Member of the Advisory |
| Board of the Institute for Women’s Leadership |
| at Rutgers University. |
| F. Joseph Loughrey |
| Born 1949. Trustee Since October 2009. Principal |
| Occupation(s) During the Past Five Years and Other |
| Experience: President and Chief Operating Officer |
| (retired 2009) of Cummins Inc. (industrial machinery); |
| Chairman of the Board of Hillenbrand, Inc. (specialized |
| consumer services), and of Oxfam America; Director |
| of SKF AB (industrial machinery), Hyster-Yale Materials |
| Handling, Inc. (forklift trucks), the Lumina Foundation |
| for Education, and the V Foundation for Cancer |
| Research; Member of the Advisory Council for the |
| College of Arts and Letters and of the Advisory Board |
| to the Kellogg Institute for International Studies, both |
at the University of Notre Dame. |
Mark Loughridge |
| Born 1953. Trustee Since March 2012. Principal |
| Occupation(s) During the Past Five Years and Other |
| Experience: Senior Vice President and Chief Financial |
| Officer (retired 2013) at IBM (information technology |
| services); Fiduciary Member of IBM’s Retirement Plan |
| Committee (2004–2013); Director of the Dow Chemical |
| Company; Member of the Council on Chicago Booth. |
Scott C. Malpass |
| Born 1962. Trustee Since March 2012. Principal |
| Occupation(s) During the Past Five Years and Other |
| Experience: Chief Investment Officer and Vice |
| President at the University of Notre Dame; Assistant |
| Professor of Finance at the Mendoza College of |
| Business at Notre Dame; Member of the Notre Dame |
| 403(b) Investment Committee, the Board of Advisors |
| for Spruceview Capital Partners, and the Investment |
| Advisory Committee of Major League Baseball; Board |
| Member of TIFF Advisory Services, Inc., and Catholic |
| Investment Services, Inc. (investment advisors). |
André F. Perold |
| Born 1952. Trustee Since December 2004. Principal |
| Occupation(s) During the Past Five Years and Other |
| Experience: George Gund Professor of Finance and |
| Banking, Emeritus at the Harvard Business School |
| (retired 2011); Chief Investment Officer and Managing |
| Partner of HighVista Strategies LLC (private investment |
| firm); Director of Rand Merchant Bank; Overseer of |
| the Museum of Fine Arts Boston. |
Peter F. Volanakis |
| Born 1955. Trustee Since July 2009. Principal |
| Occupation(s) During the Past Five Years and |
| Other Experience: President and Chief Operating |
| Officer (retired 2010) of Corning Incorporated |
| (communications equipment); Chairman of the |
| Board of Trustees of Colby-Sawyer College; |
| Member of the Advisory Board of the Norris |
| Cotton Cancer Center. |
| Executive Officers | |
| Glenn Booraem | |
| Born 1967. Treasurer Since May 2015. Principal | |
| Occupation(s) During the Past Five Years and | |
| Other Experience: Principal of The Vanguard Group, | |
| Inc.; Treasurer of each of the investment companies | |
| served by The Vanguard Group; Controller of each of | |
| the investment companies served by The Vanguard | |
| Group (2010–2015); Assistant Controller of each of | |
| the investment companies served by The Vanguard | |
| Group (2001–2010). | |
Thomas J. Higgins | |
| Born 1957. Chief Financial Officer Since September | |
| 2008. Principal Occupation(s) During the Past Five | |
| Years and Other Experience: Principal of The Vanguard | |
| Group, Inc.; Chief Financial Officer of each of the | |
| investment companies served by The Vanguard Group; | |
| Treasurer of each of the investment companies served | |
| by The Vanguard Group (1998–2008). | |
Peter Mahoney | |
| Born 1974. Controller Since May 2015. Principal | |
| Occupation(s) During the Past Five Years and Other | |
| Experience: Head of Global Fund Accounting at The | |
| Vanguard Group, Inc.; Controller of each of the invest- | |
| ment companies served by The Vanguard Group; | |
| Head of International Fund Services at The Vanguard | |
| Group (2008–2014). | |
Anne E. Robinson | |
| Born 1970. Secretary Since September 2016. Principal | |
| Occupation(s) During the Past Five Years and Other | |
| Experience: Managing Director of The Vanguard Group, | |
| Inc.; General Counsel of The Vanguard Group; Secretary | |
| of The Vanguard Group and of each of the investment | |
| companies served by The Vanguard Group; Director | |
| and Senior Vice President of Vanguard Marketing | |
| Corporation; Managing Director and General Counsel | |
| of Global Cards and Consumer Services at Citigroup | |
| (2014–2016); Counsel at American Express (2003–2014). | |
| Vanguard Senior ManagementTeam | |
| Mortimer J. Buckley | James M. Norris |
| Kathleen C. Gubanich | Thomas M. Rampulla |
| Martha G. King | Glenn W. Reed |
| John T. Marcante | Karin A. Risi |
| Chris D. McIsaac | Michael Rollings |
| Chairman Emeritus and Senior Advisor | |
| John J. Brennan | |
| Chairman, 1996–2009 | |
| Chief Executive Officer and President, 1996–2008 | |
| Founder | |
| John C. Bogle | |
| Chairman and Chief Executive Officer, 1974–1996 | |
1 Mr. McNabb is considered an “interested person,” as defined in the Investment Company Act of 1940, because he is an officer of the Vanguard funds.
2 December 2002 for Vanguard Equity Income Fund, the Vanguard Municipal Bond Funds, and the Vanguard State Tax-Exempt Funds.
 | |
| P.O. Box 2600 | |
| Valley Forge, PA 19482-2600 | |
| Connect with Vanguard® > vanguard.com | |
| Fund Information > 800-662-7447 | |
| Direct Investor Account Services > 800-662-2739 | |
| Institutional Investor Services > 800-523-1036 | |
| Text Telephone for People | |
| Who Are Deaf or Hard of Hearing> 800-749-7273 | |
| This material may be used in conjunction | |
| with the offering of shares of any Vanguard | |
| fund only if preceded or accompanied by | |
| the fund’s current prospectus. | |
| All comparative mutual fund data are from Lipper, a | |
| Thomson Reuters Company, or Morningstar, Inc., unless | |
| otherwise noted. | |
| You can obtain a free copy of Vanguard’s proxy voting | |
| guidelines by visiting vanguard.com/proxyreporting or by | |
| calling Vanguard at 800-662-2739. The guidelines are | |
| also available from the SEC’s website, sec.gov. In | |
| addition, you may obtain a free report on how your fund | |
| voted the proxies for securities it owned during the 12 | |
| months ended June 30. To get the report, visit either | |
| vanguard.com/proxyreporting or sec.gov. | |
| You can review and copy information about your fund at | |
| the SEC’s Public Reference Room in Washington, D.C. To | |
| find out more about this public service, call the SEC at | |
| 202-551-8090. Information about your fund is also | |
| available on the SEC’s website, and you can receive | |
| copies of this information, for a fee, by sending a | |
| request in either of two ways: via email addressed to | |
| publicinfo@sec.gov or via regular mail addressed to the | |
| Public Reference Section, Securities and Exchange | |
| Commission, Washington, DC 20549-1520. | |
| © 2016 The Vanguard Group, Inc. | |
| All rights reserved. | |
| Vanguard Marketing Corporation, Distributor. | |
| Q12200 112016 | |
Item 2: Code of Ethics. The Registrant has adopted a code of ethics that applies to the Registrant’s principal executive officer, principal financial officer, principal accounting officer or controller or persons performing similar functions. The Code of Ethics was amended during the reporting period covered by this report to make certain technical, non-material changes.
Item 3: Audit Committee Financial Expert. All members of the Audit Committee have been determined by the Registrant’s Board of Trustees to be Audit Committee Financial Experts and to be independent: Rajiv L. Gupta, JoAnn Heffernan Heisen, F. Joseph Loughrey, Mark Loughridge, and Peter F. Volanakis.
Item 4: Principal Accountant Fees and Services.
(a) Audit Fees.
Audit Fees of the Registrant
Fiscal Year Ended September 30, 2016: $69,000
Fiscal Year Ended September 30, 2015: $67,000
Aggregate Audit Fees of Registered Investment Companies in the Vanguard Group.
Fiscal Year Ended September 30, 2016: $9,629,849
Fiscal Year Ended September 30, 2015: $7,000,200
Includes fees billed in connection with audits of the Registrant, other registered investment companies in the Vanguard complex, The Vanguard Group, Inc. and Vanguard Marketing Corporation.
(b) Audit-Related Fees.
Fiscal Year Ended September 30, 2016: $2,717,627
Fiscal Year Ended September 30, 2015: $2,899,096
Includes fees billed in connection with assurance and related services provided to the Registrant, other registered investment companies in the Vanguard complex, The Vanguard Group, Inc., and Vanguard Marketing Corporation.
(c) Tax Fees.
Fiscal Year Ended September 30, 2016: $254,050
Fiscal Year Ended September 30, 2015: $353,389
Includes fees billed in connection with tax compliance, planning, and advice services provided to the Registrant, other registered investment companies in the Vanguard complex, The Vanguard Group, Inc., and Vanguard Marketing Corporation.
(d) All Other Fees.
Fiscal Year Ended September 30, 2016: $214,225
Fiscal Year Ended September 30, 2015: $202,313
Includes fees billed for services related to tax reported information provided to the Registrant, other registered investment companies in the Vanguard complex, The Vanguard Group, Inc., and Vanguard Marketing Corporation.
(e) (1) Pre-Approval Policies. The policy of the Registrant’s Audit Committee is to consider and, if appropriate, approve before the principal accountant is engaged for such services, all specific audit and non-audit services provided to: the Registrant, other registered investment companies in the Vanguard complex, The Vanguard Group, Inc., and entities controlled by The Vanguard Group, Inc. that provide ongoing services to the Registrant. In making a determination, the Audit Committee considers whether the services are consistent with maintaining the principal accountant’s independence.
In the event of a contingency situation in which the principal accountant is needed to provide services in between scheduled Audit Committee meetings, the Chairman of the Audit Committee would be called on to consider and, if appropriate, pre-approve audit or permitted non-audit services in an amount sufficient to complete services through the next Audit Committee meeting, and to determine if such services would be consistent with maintaining the accountant’s independence. At the next scheduled Audit Committee meeting, services and fees would be presented to the Audit Committee for formal consideration, and, if appropriate, approval by the entire Audit Committee. The Audit Committee would again consider whether such services and fees are consistent with maintaining the principal accountant’s independence.
The Registrant’s Audit Committee is informed at least annually of all audit and non-audit services provided by the principal accountant to the Vanguard complex, whether such services are provided to: the Registrant, other registered investment companies in the Vanguard complex, The Vanguard Group, Inc., or other entities controlled by The Vanguard Group, Inc. that provide ongoing services to the Registrant.
(2) No percentage of the principal accountant’s fees or services were approved pursuant to the waiver provision of paragraph (c)(7)(i)(C) of Rule 2-01 of Regulation S-X.
(f) For the most recent fiscal year, over 50% of the hours worked under the principal accountant’s engagement were not performed by persons other than full-time, permanent employees of the principal accountant.
(g) Aggregate Non-Audit Fees.
Fiscal Year Ended September 30, 2016: $468,275
Fiscal Year Ended September 30, 2015: $555,702
Includes fees billed for non-audit services provided to the Registrant, other registered investment companies in the Vanguard complex, The Vanguard Group, Inc., and Vanguard Marketing Corporation.
(h) For the most recent fiscal year, the Audit Committee has determined that the provision of all non-audit services was consistent with maintaining the principal accountant’s independence.
Item 5: Audit Committee of Listed Registrants.
Not Applicable.
Item 6: Investments.
Not Applicable.
Item 7: Disclosure of Proxy Voting Policies and Procedures for Closed-End Management
Investment Companies.
Not Applicable.
Item 8: Portfolio Managers of Closed-End Management Investment Companies.
Not Applicable.
Item 9: Purchase of Equity Securities by Closed-End Management Investment Company and
Affiliated Purchasers.
Not Applicable.
Item 10: Submission of Matters to a Vote of Security Holders.
Not Applicable.
Item 11: Controls and Procedures.
(a) Disclosure Controls and Procedures. The Principal Executive and Financial Officers concluded that the Registrant’s Disclosure Controls and Procedures are effective based on their evaluation of the Disclosure Controls and Procedures as of a date within 90 days of the filing date of this report.
(b) Internal Control Over Financial Reporting. There were no significant changes in Registrant’s Internal Control Over Financial Reporting or in other factors that could significantly affect this control subsequent to the date of the evaluation, including any corrective actions with regard to significant deficiencies and material weaknesses.
Item 12: Exhibits.
(a) Code of Ethics.
(b) Certifications.
Pursuant to the requirements of the Securities Exchange Act of 1934 and the Investment Company Act of 1940, the registrant has duly caused this report to be signed on its behalf by the undersigned, thereunto duly authorized.
| VANGUARD FENWAY FUNDS | |
| BY: | /s/ F. WILLIAM MCNABB III* |
| F. WILLIAM MCNABB III | |
| CHIEF EXECUTIVE OFFICER | |
| Date: November 17, 2016 | |
Pursuant to the requirements of the Securities Exchange Act of 1934 and the Investment Company Act of 1940, this report has been signed below by the following persons on behalf of the registrant and in the capacities and on the dates indicated.
| VANGUARD FENWAY FUNDS | |
| BY: | /s/ F. WILLIAM MCNABB III* |
| F. WILLIAM MCNABB III | |
| CHIEF EXECUTIVE OFFICER | |
Date: November 17, 2016 | |
| VANGUARD FENWAY FUNDS |
| BY: | /s/ THOMAS J. HIGGINS* |
| THOMAS J. HIGGINS | |
| CHIEF FINANCIAL OFFICER | |
Date: November 17, 2016 | |
* By: /s/ Anne E. Robinson
Anne E. Robinson, pursuant to a Power of Attorney filed on October 4, 2016 see file Number
33-32548, Incorporated by Reference.