UNITED STATES
SECURITIES AND EXCHANGE COMMISSION
Washington, D.C. 20549
FORM N-CSR
CERTIFIED SHAREHOLDER REPORT OF
REGISTERED MANAGEMENT INVESTMENT COMPANIES
Investment Company Act file number: 811-05445
Name of Registrant: Vanguard Fenway Funds
Address of Registrant:
P.O. Box 2600
Valley Forge, PA 19482
Name and address of agent for service:
Heidi Stam, Esquire
P.O. Box 876
Valley Forge, PA 19482
Registrant’s telephone number, including area code: (610) 669-1000
Date of fiscal year end: September 30
Date of reporting period: October 1, 2012 – September 30, 2013
Item 1: Reports to Shareholders
![]()
Annual Report | September 30, 2013
Vanguard Equity Income Fund

Vanguard’s Principles for Investing Success
We want to give you the best chance of investment success. These principles, grounded in Vanguard’s research and experience, can put you on the right path.
Goals. Create clear, appropriate investment goals.
Balance. Develop a suitable asset allocation using broadly diversified funds. Cost. Minimize cost.
Discipline. Maintain perspective and long-term discipline.
A single theme unites these principles: Focus on the things you can control.
We believe there is no wiser course for any investor.
| Contents | |
| Your Fund’s Total Returns. | 1 |
| Chairman’s Letter. | 2 |
| Advisors’ Report. | 8 |
| Fund Profile. | 12 |
| Performance Summary. | 13 |
| Financial Statements. | 15 |
| Your Fund’s After-Tax Returns. | 29 |
| About Your Fund’s Expenses. | 30 |
| Glossary. | 32 |
Please note: The opinions expressed in this report are just that—informed opinions. They should not be considered promises or advice.
Also, please keep in mind that the information and opinions cover the period through the date on the front of this report. Of course, the risks of investing in your fund are spelled out in the prospectus.
See the Glossary for definitions of investment terms used in this report.
About the cover: The ship's wheel represents leadership and guidance, essential qualities in navigating difficult seas.
This one is a replica based on an 18th-century British vessel. The HMS Vanguard, another ship of that era, served as the flagship for Admiral Horatio Nelson when he defeated a French fleet at the Battle of the Nile.
| Your Fund’s Total Returns | |
| Fiscal Year Ended September 30, 2013 | |
| Total | |
| Returns | |
| Vanguard Equity Income Fund | |
| Investor Shares | 19.45% |
| Admiral™ Shares | 19.61 |
| FTSE High Dividend Yield Index | 17.74 |
| Equity Income Funds Average | 17.68 |
| Equity Income Funds Average: Derived from data provided by Lipper, a Thomson Reuters Company. | |
Admiral Shares carry lower expenses and are available to investors who meet certain account-balance requirements.
Your Fund’s Performance at a Glance
September 30, 2012, Through September 30, 2013
| Distributions Per Share | ||||
| Starting | Ending | |||
| Share | Share | Income | Capital | |
| Price | Price | Dividends | Gains | |
| Vanguard Equity Income Fund | ||||
| Investor Shares | $24.31 | $28.26 | $0.728 | $0.000 |
| Admiral Shares | 50.94 | 59.24 | 1.578 | 0.000 |
1

Chairman’s Letter
Dear Shareholder,
Investors participated in a robust stock market during the 12 months ended September 30, 2013, a period that saw highs for some of the major stock indexes. Investor Shares of Vanguard Equity Income Fund returned 19.45% during the period, ahead of the 17.74% return of its benchmark index and the 17.68% average return of its peer group.
A large portion of the fund’s return came from holdings in the industrial and financial sectors. And the advisors’ selections among consumer discretionary and utilities stocks played a key role in helping the fund outpace its comparative standards.
The advisors, Wellington Management Company and Vanguard Equity Investment Group, use different but complementary methods of fundamental analysis to find undervalued stocks of mid- and large-capitalization companies that they believe will pay above-average dividends.
As of September 30, the fund’s 30-day SEC yield stood at 2.77%, about 1 percentage point higher than that of the broad U.S. stock market, as measured by the yield of Vanguard Total Stock Market Index Fund. (All returns and yields discussed here and elsewhere in this letter are for Investor Shares.)
2
Stocks dodged obstacles to produce strong gains
Although their path wasn’t always smooth, U.S. equities powered to a strong return for the fiscal year. The U.S. economy delivered only modest growth over the period, but investors’ appetite for risk seemed to increase faster than companies’ profits.
In mid-September, U.S. stocks jumped when the Federal Reserve surprised investors by announcing that it had no immediate plans to unwind its stimulative bond-buying program. But in the waning days of that month, stocks slid ahead of the partial federal government shutdown that began October 1.
It’s natural for investors to be concerned by the situation in Washington. But as Sarah Hammer, a senior analyst in Vanguard Investment Strategy Group, noted in the midst of the temporary shutdown, they shouldn’t be unduly influenced by these events. “Investors are often best served by sticking to their long-term investment plans and avoiding short-term decisions based on the legislative outlook,” Ms. Hammer said. Our recurrent advice to stick to your plan may lack pizzazz, but it’s proven to be sound counsel over the decades.
International stocks generally posted strong results. Emerging-market stocks, however, lagged amid worries about slowing economic growth.
| Market Barometer | |||
| Average Annual Total Returns | |||
| Periods Ended September 30, 2013 | |||
| One | Three | Five | |
| Year | Years | Years | |
| Stocks | |||
| Russell 1000 Index (Large-caps) | 20.91% | 16.64% | 10.53% |
| Russell 2000 Index (Small-caps) | 30.06 | 18.29 | 11.15 |
| Russell 3000 Index (Broad U.S. market) | 21.60 | 16.76 | 10.58 |
| MSCI All Country World Index ex USA (International) | 16.48 | 5.95 | 6.26 |
| Bonds | |||
| Barclays U.S. Aggregate Bond Index (Broad taxable market) | -1.68% | 2.86% | 5.41% |
| Barclays Municipal Bond Index (Broad tax-exempt market) | -2.21 | 3.24 | 5.98 |
| Citigroup Three-Month U.S. Treasury Bill Index | 0.07 | 0.07 | 0.14 |
| CPI | |||
| Consumer Price Index | 1.18% | 2.34% | 1.37% |
3
Bond returns were negative despite September’s bounce
Investor concern about the Fed’s potential tapering of its bond-buying program also affected the performance of bonds, which declined for the year. In September, however, bonds trimmed their losses after the Fed said it would maintain its level of purchases.
The broad U.S. taxable bond market returned –1.68% for the fiscal year, and the yield of the 10-year Treasury note closed at 2.63%, up from 1.64% a year earlier. (Bond yields and prices move in opposite directions.) Municipal bonds returned –2.21% after rebounding a bit in September.
Money markets and savings accounts barely budged as the Fed’s target for short-term interest rates remained at 0%–0.25%.
Industrial and financial stocks played a large role in results
Industrial and financial stocks were the largest contributors to the fund’s return for the period. In industrials, notable contributors included diversified manufacturing firms and manufacturers of aerospace, defense, and electric equipment; in financials, the lift to returns came from insurers, banks, and asset managers.
| Expense Ratios | |||
| Your Fund Compared With Its Peer Group | |||
| Investor | Admiral | Peer Group | |
| Shares | Shares | Average | |
| Equity Income Fund | 0.30% | 0.21% | 1.27% |
The fund expense ratios shown are from the prospectus dated January 25, 2013, and represent estimated costs for the current fiscal year. For the fiscal year ended September 30, 2013, the fund’s expense ratios were 0.30% for Investor Shares and 0.21% for Admiral Shares. The peer-group expense ratio is derived from data provided by Lipper, a Thomson Reuters Company, and captures information through year-end 2012.
Peer group: Equity Income Funds.
4
Health care, consumer discretionary, and consumer staples stocks also contributed significantly to the fund’s return. Standout holdings included pharmaceuticals, home-improvement retailers, media companies (advertising, cable and satellite, and newspaper publishing firms), and providers of packaged foods and meats.
The advisors’ selection of home-improvement retailers and advertising firms (within consumer discretionary) and electric utility stocks (within utilities) pushed the fund’s results past those of its benchmark. Financial and energy stocks, by contrast, led the fund to underperform its benchmark in those sectors.
The fund’s longer-term results are marked by solid annual returns
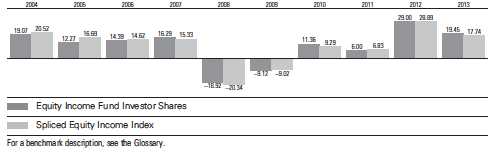
The fund has had back-to-back double-digit fiscal years with its returns of 19.45% for fiscal 2013 and 29.00% for fiscal 2012. Over the longer term, its results continue to be muted by the deeply negative returns seen in the years of the financial crisis. For the ten years ended September 30, the Equity Income Fund had an average annual return of 9.07%, close to the benchmark’s return of 9.09%. These results exceeded the average annual returns of the broad stock market, as measured by Vanguard Total Stock Market Index Fund (8.22%), and peer funds (7.61%).
| Total Returns | |
| Ten Years Ended September 30, 2013 | |
| Average | |
| Annual Return | |
| Equity Income Fund Investor Shares | 9.07% |
| Spliced Equity Income Index | 9.09 |
| Equity Income Funds Average | 7.61 |
For a benchmark description, see the Glossary.
Equity Income Funds Average: Derived from data provided by Lipper, a Thomson Reuters Company.
The figures shown represent past performance, which is not a guarantee of future results. (Current performance may be lower or higher than the performance data cited. For performance data current to the most recent month-end, visit our website at vanguard.com/performance.) Note, too, that both investment returns and principal value can fluctuate widely, so an investor’s shares, when sold, could be worth more or less than their original cost.
5
Yield levels are, of course, important for an equity income fund. Over the decade, your fund has consistently yielded at least 1 percentage point more than the broad U.S. stock market (as measured by the Vanguard Total Stock Market Index Fund).
Vanguard Equity Income Fund’s long-term results reflect the skills of Wellington Management Company and Vanguard Equity Investment Group. The results also reflect the fund’s unwavering mandate: As we noted in our semiannual report,
| Investment insight | |
| Don’t let a trick of the calendar alter your course | |
| When making investment decisions, it’s important to weigh past returns with caution. | |
| That’s because investment returns from any particular period are an unreliable anchor | |
| for gauging the future. They can be highly date-dependent. | |
| For example, take the five-year average annual return for the broad U.S. stock | |
| market. That average just made a startling bounce: from 1.30% for the period | |
| ended September 30, 2012, to 10.58% for the period ended September 30, 2013. | |
| True, the market returned a hearty 21.60% in the most recent 12 months, but that’s | |
| not enough to explain such a big leap in the average. Significantly, the year ended | |
| September 30, 2008––when U.S. stocks returned –21.52% during the financial | |
| crisis––has now rolled off the five-year calculation. | |
| The important thing to remember is that historical returns are just that: historical. | |
| Basing investment decisions on such date-dependent snapshots could easily lead | |
| you to alter course––possibly in the wrong direction. Instead, Vanguard believes, you | |
| should build your asset allocation strategy on long-term risk-and-return relationships, | |
| always recognizing that no level of return is guaranteed. | |
| Which five-year average should you count on? | |
| (Answer: None of them!) | |
| Average annual returns for U.S. stocks over five-year periods ended September 30 | |
| 2007 | 16.18% |
| 2008 | 5.70 |
| 2009 | 1.56 |
| 2010 | 0.92 |
| 2011 | –0.92 |
| 2012 | 1.30 |
| 2013 | 10.58 |
| Note: The U.S. stock market is represented by the Russell 3000 Index. | |
| Source: Vanguard. | |
6
the fund has served investors for 25 years, and unlike its typical peer, it continues to focus exclusively on stocks that pay high dividends.
Low costs, diversity of thought can make a good combination
Investors sometimes ask why Vanguard uses a multi-advisor approach for many of its actively managed equity funds, including the Equity Income Fund. Just as we recommend diversification within and across asset classes for an investor’s overall portfolio, we think significant benefits can accrue from using multiple advisory firms for a single fund: diversity of investment process and style, thought, and holdings.
All of these elements can lead to less risk and better results. Because not all investment managers invest the same way, their returns relative to the benchmark don’t move in lockstep.
As with many investment topics, however, there are some misconceptions about the benefits and drawbacks of using a multi-manager approach. For example, it is often suggested that the best ideas of the advisors are diluted when they are combined in one portfolio. Recent Vanguard research has found otherwise.
Conventional wisdom also suggests that multi-manager funds tend to be expensive. At Vanguard, this is not the case: Low costs are a hallmark of all our offerings. And Vanguard research indicates that low costs can contribute greatly to investing success, helping investors keep more of a portfolio’s return. (You can read more in Analyzing Multi-Manager Funds: Does Management Structure Affect Performance? at vanguard.com/research.)
As always, thank you for investing with Vanguard.
Sincerely,

F. William McNabb III
Chairman and Chief Executive Officer
October 16, 2013
7
Advisors’ Report
For the fiscal year ended September 30, 2013, Vanguard Equity Income Fund returned about 20%, more than the roughly 18% returned by both its benchmark index, the FTSE High Dividend Yield Index, and its peer group. The results reflect the combined results of your fund’s two independent investment advisors, Wellington Management Company and Vanguard Equity Investment Group. The use of two advisors provides exposure to distinct yet complementary investment approaches, enhancing the diversification of your fund. It is not uncommon for different advisors to have different views about individual securities or the broader investment environment.
The advisors, the percentage of the fund’s assets each manages, and brief descriptions of their investment strategies are presented in the table below. The advisors have also prepared a discussion of the investment environment that existed during the fiscal year and of how their portfolio positioning reflects this assessment. These comments were prepared on October 10, 2013.
| Vanguard Equity Income Fund Investment Advisors | |||
| Fund Assets Managed | |||
| Investment Advisor | % | $ Million | Investment Strategy |
| Wellington Management | 63 | 8,773 | A fundamental approach to seeking desirable stocks. |
| Company, LLP | Our selections typically offer above-average dividend | ||
| yields, below-average valuations, and the potential for | |||
| dividend increases in the future. | |||
| Vanguard Equity Investment | 34 | 4,689 | Employs a quantitative fundamental management |
| Group | approach, using models that assess valuation, growth | ||
| prospects, management decisions, market sentiment, | |||
| and earnings-quality of companies as compared with | |||
| their peers. | |||
| Cash Investments | 3 | 511 | These short-term reserves are invested by Vanguard in |
| equity index products to simulate investment in stocks. | |||
| Each advisor may also maintain a modest cash | |||
| position. | |||
8
Wellington Management Company, LLP
Portfolio Manager:
W. Michael Reckmeyer, III, CFA, Senior Vice President and Equity Portfolio Manager
The quantitative easing measures enacted by central banks across the globe have boosted liquidity and lowered interest rates, and this has helped support economic activity and equity markets.
However, as quantitative easing is eventually unwound, risks will increase to economic activity and financial markets. Recent evidence of this was seen in the reaction of financial markets to the Federal Reserve’s comments about tapering its stimulative bond-buying program. Economic conditions are improving, but we remain cognizant that governments have not addressed longer-term structural imbalances.
The U.S. economy continues to improve, albeit at a moderate growth rate. Challenges have included tax reform and higher interest rates triggered by the possible winding down of quantitative easing, and the recent uncertainty about government funding and the renewed debate over extending the debt ceiling. We believe that despite these challenges, the U.S. economy can continue to grow, led by improving auto and housing industries, the resurgence of manufacturing, and the oil shale revolution.
Growth in Europe remains lackluster, but there are encouraging signs. Germany and the United Kingdom are experiencing positive growth, and other regions are showing signs of stabilization. We are cautiously optimistic about 2014.
After a slow first half of 2013, China’s growth appears to have accelerated. While we are hopeful this acceleration will continue, our hope is tempered by caution, given the Chinese government’s intentions to stem real estate speculation and slow down growth in the country’s “shadow” banking system.
Significant purchases during the past 12 months included additions to existing positions in Wells Fargo, Microsoft, and United Technologies. We also initiated new positions in Suncor Energy and Verizon Communications. We eliminated our positions in General Mills and Home Depot because of less attractive valuations, in Swiss Re and Kohl’s because of eroding fundamentals, and in Zoetis because of insufficient yield.
Vanguard Equity Investment Group
Portfolio Managers:
James P. Stetler, Principal
James D. Troyer, CFA, Principal
Michael R. Roach, CFA
Although the broad U.S. equity market delivered a robust return of more than 21% for the fiscal year, income-oriented
9
stocks trailed the overall market by about 4 percentage points. The U.S. market performed similarly to other developed countries, while emerging-market returns were basically flat. Within the equity income benchmark, nine of ten sector groups generated positive returns. Results were best in financials, industrials, and consumer discretionary. Telecommunication services was the sole laggard.
Equity investors seemed to gain confidence at the start of the fiscal year as economic data from around the world continued to improve (though at a snail’s pace). In the United States, the longer-term economic outlook is one of cautious optimism: GDP growth is expected to accelerate into 2014 and 2015, the housing market continues to recover, the unemployment rate is slowly falling, and corporate balance sheets are strong, with profits holding up.
Recently, however, macro events have again grabbed headlines, and this may translate into near-term market volatility. The Federal Reserve’s mixed signals on the tapering of quantitative easing, a jump in interest rates, and the failure of Congress and the White House to reach a budget agreement or forestall a federal government shutdown have left investors guessing about the market’s immediate prospects. Under these conditions, an increase in volatility would not be surprising, given how quickly stocks have risen here and abroad.
Equity markets will always be subject to short-term fluctuations brought on by the latest headlines. We find that often there is too much focus on the short term and not enough on the fundamental conditions and attributes that give investors the best chance of success. Strategies such as ours shift the focus back to company fundamentals by seeking to capture the spread between undervalued and overvalued stocks.
For the 12-month period, the five-component model we use in selecting stocks was, overall, effective in identifying the outperforming companies from the underperformers within each industry group. Our quality, sentiment, and valuation components contributed positively to performance, but our management decisions and growth components detracted from relative returns. Our stock selections were positive in five of ten sectors.
Our stock selections helped relative performance the most in consumer discretionary, materials, and information technology. In consumer discretionary, H&R Block, GameStop, and Gannett helped relative results the most. Within materials, LyondellBasell Industries and PPG Industries led results; within techonology, Computer Sciences Corp. and Seagate Technology were the leaders. Our selection in financials detracted the most from relative performance, mainly because of underweighted positions in Prudential Financial, BlackRock, and PNC Financial Services.
10
While we cannot predict how the markets will be affected by broader economic or political events, we remain confident that the stock market will produce worthwhile returns for long-term investors. With that in mind, we believe that equity exposure will continue to be an important part of a diversified investment plan.
We thank you for your investment and look forward to the new fiscal year.
11
Equity Income Fund
Fund Profile
As of September 30, 2013
| Share-Class Characteristics | |||
| Investor | Admiral | ||
| Shares | Shares | ||
| Ticker Symbol | VEIPX | VEIRX | |
| Expense Ratio1 | 0.30% | 0.21% | |
| 30-Day SEC Yield | 2.77% | 2.86% | |
| Portfolio Characteristics | |||
| DJ U.S. | |||
| FTSE High | Total | ||
| Dividend | Market | ||
| Yield | FA | ||
| Fund | Index | Index | |
| Number of Stocks | 173 | 385 | 3,636 |
| Median Market Cap | $85.0B | $99.1B | $40.2B |
| Price/Earnings Ratio | 15.6x | 16.4x | 19.5x |
| Price/Book Ratio | 2.4x | 2.4x | 2.5x |
| Return on Equity | 17.8% | 18.3% | 16.5% |
| Earnings Growth | |||
| Rate | 7.1% | 5.6% | 11.1% |
| Dividend Yield | 3.2% | 3.3% | 1.9% |
| Foreign Holdings | 9.5% | 0.0% | 0.0% |
| Turnover Rate | 34% | — | — |
| Short-Term Reserves | 0.3% | — | — |
| Sector Diversification (% of equity exposure) | |||
| FTSE High | DJ U.S. | ||
| Dividend | Total | ||
| Yield | Market | ||
| Fund | Index FA Index | ||
| Consumer | |||
| Discretionary | 7.1% | 6.0% | 13.3% |
| Consumer Staples | 12.8 | 16.1 | 8.7 |
| Energy | 12.2 | 12.6 | 9.6 |
| Financials | 15.1 | 12.5 | 17.3 |
| Health Care | 13.0 | 11.8 | 12.6 |
| Industrials | 14.5 | 13.3 | 11.4 |
| Information | |||
| Technology | 11.0 | 10.3 | 17.9 |
| Materials | 4.1 | 4.3 | 3.8 |
| Telecommunication | |||
| Services | 4.0 | 5.0 | 2.2 |
| Utilities | 6.2 | 8.1 | 3.2 |
| Volatility Measures | |||
| FTSE High | |||
| Dividend | DJ U.S. | ||
| Yield | Total Market | ||
| Index | FA Index | ||
| R-Squared | 0.99 | 0.90 | |
| Beta | 1.04 | 0.78 | |
| These measures show the degree and timing of the fund’s fluctuations compared with the indexes over 36 months. | |||
| Ten Largest Holdings (% of total net assets) | |||
| Johnson & Johnson | Pharmaceuticals | 3.9% | |
| Chevron Corp. | Integrated Oil & Gas | 3.5 | |
| Wells Fargo & Co. | Diversified Banks | 3.3 | |
| Exxon Mobil Corp. | Integrated Oil & Gas | 3.1 | |
| Microsoft Corp. | Systems Software | 3.1 | |
| JPMorgan Chase & Co. | Diversified Financial | ||
| Services | 2.9 | ||
| Merck & Co. Inc. | Pharmaceuticals | 2.6 | |
| General Electric Co. | Industrial | ||
| Conglomerates | 2.6 | ||
| Pfizer Inc. | Pharmaceuticals | 2.2 | |
| United Technologies | Aerospace & | ||
| Corp. | Defense | 2.0 | |
| Top Ten | 29.2% | ||
| The holdings listed exclude any temporary cash investments and equity index products. | |||
Investment Focus

1 The expense ratios shown are from the prospectus dated January 25, 2013, and represent estimated costs for the current fiscal year. For the fiscal year ended September 30, 2013, the expense ratios were 0.30% for Investor Shares and 0.21% for Admiral Shares.
12
Equity Income Fund
Performance Summary
All of the returns in this report represent past performance, which is not a guarantee of future results that may be achieved by the fund. (Current performance may be lower or higher than the performance data cited. For performance data current to the most recent month-end, visit our website at vanguard.com/performance.) Note, too, that both investment returns and principal value can fluctuate widely, so an investor’s shares, when sold, could be worth more or less than their original cost. The returns shown do not reflect taxes that a shareholder would pay on fund distributions or on the sale of fund shares.
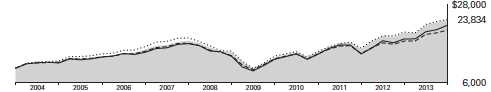
Cumulative Performance: September 30, 2003, Through September 30, 2013
Initial Investment of $10,000
| Average Annual Total Returns | |||||
| Periods Ended September 30, 2013 | |||||
| Final Value | |||||
| One | Five | Ten | of a $10,000 | ||
| Year | Years | Years | Investment | ||
| Equity Income Fund*Investor Shares | 19.45% | 10.57% | 9.07% | $23,834 | |
| •••••••• | Spliced Equity Income Index | 17.74 | 10.02 | 9.09 | 23,869 |
| – – – – | Equity Income Funds Average | 17.68 | 8.99 | 7.61 | 20,829 |
| Dow Jones U.S. Total Stock Market | |||||
| Float Adjusted Index | 21.44 | 10.69 | 8.32 | 22,235 | |
| For a benchmark description, see the Glossary. | |||||
| Equity Income Funds Average: Derived from data provided by Lipper, a Thomson Reuters Company. | |||||
| Final Value | |||||
| One | Five | Ten | of a $50,000 | ||
| Year | Years | Years | Investment | ||
| Equity Income Fund Admiral Shares | 19.61% | 10.68% | 9.19% | $120,494 | |
| Spliced Equity Income Index | 17.74 | 10.02 | 9.09 | 119,346 | |
| Dow Jones U.S. Total Stock Market Float | |||||
| Adjusted Index | 21.44 | 10.69 | 8.32 | 111,177 | |
See Financial Highlights for dividend and capital gains information.
13
Equity Income Fund
Fiscal-Year Total Returns (%): September 30, 2003, Through September 30, 2013
14
Equity Income Fund
Financial Statements
Statement of Net Assets
As of September 30, 2013
The fund reports a complete list of its holdings in regulatory filings four times in each fiscal year, at the quarter-ends. For the second and fourth fiscal quarters, the lists appear in the fund’s semiannual and annual reports to shareholders. For the first and third fiscal quarters, the fund files the lists with the Securities and Exchange Commission on Form N-Q. Shareholders can look up the fund’s Forms N-Q on the SEC’s website at sec.gov. Forms N-Q may also be reviewed and copied at the SEC’s Public Reference Room (see the back cover of this report for further information).
| Market | ||
| Value | ||
| Shares | ($000) | |
| Common Stocks (97.7%)1 | ||
| Consumer Discretionary (6.7%) | ||
| Lowe’s Cos. Inc. | 5,330,710 | 253,795 |
| McDonald’s Corp. | 1,232,305 | 118,560 |
| WPP plc | 5,496,603 | 112,956 |
| Mattel Inc. | 1,932,660 | 80,901 |
| Thomson Reuters Corp. | 2,267,670 | 79,391 |
| Time Warner Cable Inc. | 566,060 | 63,172 |
| Las Vegas Sands Corp. | 680,500 | 45,199 |
| GameStop Corp. Class A | 593,400 | 29,462 |
| Ford Motor Co. | 1,734,600 | 29,263 |
| Gannett Co. Inc. | 1,076,600 | 28,842 |
| Home Depot Inc. | 309,800 | 23,498 |
| H&R Block Inc. | 666,900 | 17,780 |
| Tupperware Brands Corp. | 186,500 | 16,108 |
| Brinker International Inc. | 310,200 | 12,573 |
| Hasbro Inc. | 263,000 | 12,398 |
| Cracker Barrel Old Country | ||
| Store Inc. | 102,900 | 10,623 |
| Staples Inc. | 149,600 | 2,192 |
| Whirlpool Corp. | 8,400 | 1,230 |
| 937,943 | ||
| Consumer Staples (12.2%) | ||
| Philip Morris International | ||
| Inc. | 2,853,945 | 247,123 |
| Kraft Foods Group Inc. | 3,544,889 | 185,894 |
| Procter & Gamble Co. | 2,392,240 | 180,829 |
| PepsiCo Inc. | 1,850,490 | 147,114 |
| Unilever NV | 3,756,420 | 141,692 |
| Altria Group Inc. | 3,290,175 | 113,018 |
| Wal-Mart Stores Inc. | 1,466,092 | 108,432 |
| Sysco Corp. | 3,050,260 | 97,090 |
| Coca-Cola Co. | 2,165,064 | 82,013 |
| Anheuser-Busch InBev | ||
| NV ADR | 815,560 | 80,904 |
| Kimberly-Clark Corp. | 739,988 | 69,722 |
| Diageo plc ADR | 345,100 | 43,855 |
| General Mills Inc. | 835,300 | 40,028 |
| Lorillard Inc. | 798,000 | 35,734 |
| Market | |||
| Value | |||
| Shares | ($000) | ||
| Imperial Tobacco Group plc | 939,217 | 34,721 | |
| British American Tobacco | |||
| plc | 558,764 | 29,407 | |
| Safeway Inc. | 877,000 | 28,055 | |
| Walgreen Co. | 410,910 | 22,107 | |
| JM Smucker Co. | 145,300 | 15,262 | |
| Molson Coors Brewing | |||
| Co. Class B | 99,900 | 5,008 | |
| 1,708,008 | |||
| Energy (11.8%) | |||
| Chevron Corp. | 4,062,070 | 493,541 | |
| Exxon Mobil Corp. | 5,074,310 | 436,594 | |
| ConocoPhillips | 2,697,320 | 187,491 | |
| Suncor Energy Inc. | 4,509,410 | 161,347 | |
| Occidental Petroleum | |||
| Corp. | 1,472,530 | 137,740 | |
| Royal Dutch Shell plc | |||
| Class B | 3,276,865 | 113,062 | |
| BP plc ADR | 1,528,910 | 64,260 | |
| Valero Energy Corp. | 525,400 | 17,942 | |
| Marathon Petroleum Corp. | 267,500 | 17,206 | |
| Kinder Morgan Inc. | 350,000 | 12,449 | |
| Targa Resources Corp. | 18,300 | 1,335 | |
| 1,642,967 | |||
| Exchange-Traded Funds (1.9%) | |||
| ^,2 | Vanguard High Dividend | ||
| Yield ETF | 3,507,000 | 201,617 | |
| 2 | Vanguard Value ETF | 963,400 | 67,236 |
| 268,853 | |||
| Financials (14.4%) | |||
| Wells Fargo & Co. | 11,039,140 | 456,137 | |
| JPMorgan Chase & Co. | 7,748,830 | 400,537 | |
| Marsh & McLennan Cos. | |||
| Inc. | 6,261,670 | 272,696 | |
| BlackRock Inc. | 652,230 | 176,506 | |
| PNC Financial Services | |||
| Group Inc. | 2,031,892 | 147,211 | |
| ACE Ltd. | 1,317,340 | 123,250 | |
| Chubb Corp. | 1,144,380 | 102,147 | |
15
| Equity Income Fund | ||
| Market | ||
| Value | ||
| Shares | ($000) | |
| M&T Bank Corp. | 865,990 | 96,922 |
| US Bancorp | 2,147,440 | 78,553 |
| Aflac Inc. | 697,400 | 43,232 |
| Fifth Third Bancorp | 1,840,900 | 33,210 |
| SLM Corp. | 552,100 | 13,747 |
| Protective Life Corp. | 258,600 | 11,003 |
| Huntington Bancshares | ||
| Inc. | 1,133,900 | 9,366 |
| Principal Financial Group | ||
| Inc. | 199,600 | 8,547 |
| Allstate Corp. | 154,100 | 7,790 |
| Axis Capital Holdings Ltd. | 162,900 | 7,055 |
| StanCorp Financial Group | ||
| Inc. | 96,100 | 5,287 |
| First Niagara Financial | ||
| Group Inc. | 467,100 | 4,844 |
| Cincinnati Financial Corp. | 83,000 | 3,914 |
| Fulton Financial Corp. | 214,000 | 2,500 |
| Umpqua Holdings Corp. | 152,700 | 2,477 |
| Old Republic International | ||
| Corp. | 157,800 | 2,430 |
| Hancock Holding Co. | 68,500 | 2,150 |
| Hanover Insurance Group | ||
| Inc. | 28,900 | 1,599 |
| Horace Mann Educators | ||
| Corp. | 43,500 | 1,235 |
| 2,014,345 | ||
| Health Care (12.5%) | ||
| Johnson & Johnson | 6,287,345 | 545,050 |
| Merck & Co. Inc. | 7,537,524 | 358,861 |
| Pfizer Inc. | 10,524,845 | 302,168 |
| Roche Holding AG | 654,835 | 176,723 |
| Baxter International Inc. | 1,366,550 | 89,769 |
| AbbVie Inc. | 1,598,600 | 71,505 |
| AstraZeneca plc ADR | 1,326,949 | 68,908 |
| Eli Lilly & Co. | 1,126,949 | 56,719 |
| Bristol-Myers Squibb Co. | 940,732 | 43,537 |
| Becton Dickinson and Co. | 184,800 | 18,484 |
| Medtronic Inc. | 129,100 | 6,875 |
| Meridian Bioscience Inc. | 123,800 | 2,928 |
| ^ PDL BioPharma Inc. | 301,500 | 2,403 |
| 1,743,930 | ||
| Industrials (14.0%) | ||
| General Electric Co. | 14,995,452 | 358,241 |
| United Technologies | ||
| Corp. | 2,587,880 | 279,025 |
| 3M Co. | 1,917,630 | 228,984 |
| Eaton Corp. plc | 2,682,610 | 184,671 |
| United Parcel Service Inc. | ||
| Class B | 1,719,830 | 157,141 |
| Stanley Black & Decker | ||
| Inc. | 1,471,330 | 133,258 |
| Illinois Tool Works Inc. | 1,220,370 | 93,078 |
| Schneider Electric SA | 971,450 | 82,202 |
| Market | ||
| Value | ||
| Shares | ($000) | |
| Boeing Co. | 684,000 | 80,370 |
| Lockheed Martin Corp. | 611,220 | 77,961 |
| Waste Management Inc. | 1,832,190 | 75,560 |
| General Dynamics Corp. | 496,000 | 43,410 |
| Raytheon Co. | 538,600 | 41,510 |
| Northrop Grumman Corp. | 417,913 | 39,811 |
| L-3 Communications | ||
| Holdings Inc. | 308,300 | 29,134 |
| RR Donnelley & Sons Co. | 1,377,900 | 21,771 |
| Deluxe Corp. | 311,300 | 12,969 |
| Copa Holdings SA Class A | 52,400 | 7,266 |
| Emerson Electric Co. | 77,300 | 5,001 |
| Exelis Inc. | 267,400 | 4,201 |
| Republic Services Inc. | ||
| Class A | 76,600 | 2,555 |
| 1,958,119 | ||
| Information Technology (10.5%) | ||
| Microsoft Corp. | 12,955,919 | 431,562 |
| Cisco Systems Inc. | 9,695,680 | 227,073 |
| Intel Corp. | 9,537,250 | 218,594 |
| Analog Devices Inc. | 3,624,160 | 170,517 |
| Xilinx Inc. | 1,700,343 | 79,678 |
| Maxim Integrated | ||
| Products Inc. | 1,815,768 | 54,110 |
| Texas Instruments Inc. | 1,058,300 | 42,618 |
| Applied Materials Inc. | 2,274,800 | 39,900 |
| Seagate Technology plc | 778,400 | 34,047 |
| Xerox Corp. | 3,134,800 | 32,257 |
| CA Inc. | 911,900 | 27,056 |
| Broadridge Financial | ||
| Solutions Inc. | 842,400 | 26,746 |
| Computer Sciences Corp. | 443,900 | 22,967 |
| Accenture plc Class A | 281,300 | 20,715 |
| Lexmark International Inc. | ||
| Class A | 333,900 | 11,019 |
| Harris Corp. | 122,500 | 7,264 |
| KLA-Tencor Corp. | 101,000 | 6,146 |
| Linear Technology Corp. | 148,200 | 5,878 |
| Western Union Co. | 77,300 | 1,442 |
| United Online Inc. | 139,800 | 1,115 |
| 1,460,704 | ||
| Materials (3.9%) | ||
| Dow Chemical Co. | 3,651,620 | 140,222 |
| International Paper Co. | 2,676,240 | 119,895 |
| EI du Pont de Nemours | ||
| & Co. | 1,598,217 | 93,592 |
| Nucor Corp. | 1,551,810 | 76,070 |
| LyondellBasell Industries | ||
| NV Class A | 624,100 | 45,703 |
| Packaging Corp. of | ||
| America | 489,100 | 27,923 |
| Avery Dennison Corp. | 575,100 | 25,028 |
| PPG Industries Inc. | 81,334 | 13,588 |
16
| Equity Income Fund | ||
| Market | ||
| Value | ||
| Shares | ($000) | |
| Schweitzer-Mauduit | ||
| International Inc. | 109,200 | 6,610 |
| 548,631 | ||
| Telecommunication Services (3.8%) | ||
| Verizon Communications | ||
| Inc. | 5,654,678 | 263,847 |
| AT&T Inc. | 7,393,105 | 250,035 |
| Vodafone Group plc ADR | 591,140 | 20,797 |
| CenturyLink Inc. | 27,700 | 869 |
| 535,548 | ||
| Utilities (6.0%) | ||
| UGI Corp. | 3,156,660 | 123,520 |
| National Grid plc | 10,131,449 | 119,679 |
| Xcel Energy Inc. | 3,585,990 | 99,009 |
| NextEra Energy Inc. | 914,316 | 73,291 |
| Northeast Utilities | 1,619,790 | 66,816 |
| Public Service Enterprise | ||
| Group Inc. | 1,052,800 | 34,669 |
| Edison International | 724,600 | 33,375 |
| DTE Energy Co. | 442,100 | 29,170 |
| Pinnacle West Capital | ||
| Corp. | 502,900 | 27,529 |
| PG&E Corp. | 666,600 | 27,277 |
| UNS Energy Corp. | 535,000 | 24,942 |
| Westar Energy Inc. | ||
| Class A | 765,500 | 23,462 |
| AGL Resources Inc. | 472,600 | 21,754 |
| Dominion Resources Inc. | 310,260 | 19,385 |
| Black Hills Corp. | 360,203 | 17,960 |
| Portland General Electric | ||
| Co. | 590,900 | 16,681 |
| CenterPoint Energy Inc. | 610,430 | 14,632 |
| Wisconsin Energy Corp. | 256,900 | 10,374 |
| American States Water | ||
| Co. | 285,200 | 7,860 |
| Duke Energy Corp. | 111,600 | 7,453 |
| PNM Resources Inc. | 310,200 | 7,020 |
| Atmos Energy Corp. | 140,900 | 6,001 |
| OGE Energy Corp. | 128,900 | 4,652 |
| NV Energy Inc. | 137,300 | 3,242 |
| PPL Corp. | 104,700 | 3,181 |
| Questar Corp. | 115,400 | 2,595 |
| IDACORP Inc. | 41,800 | 2,023 |
| Hawaiian Electric | ||
| Industries Inc. | 72,100 | 1,810 |
| UIL Holdings Corp. | 39,100 | 1,454 |
| Southern Co. | 31,800 | 1,309 |
| Southwest Gas Corp. | 23,600 | 1,180 |
| 833,305 | ||
| Total Common Stocks | ||
| (Cost $10,943,287) | 13,652,353 | |
| Market | ||
| Value | ||
| Shares | ($000) | |
| Temporary Cash Investments (2.3%)1 | ||
| Money Market Fund (1.8%) | ||
| 3,4 Vanguard Market | ||
| Liquidity Fund, | ||
| 0.112% | 252,831,288 | 252,831 |
| Face | ||
| Amount | ||
| ($000) | ||
| Repurchase Agreement (0.3%) | ||
| Goldman Sachs & Co. | ||
| 0.060%, 10/1/13 | ||
| (Dated 9/30/13, | ||
| Repurchase Value | ||
| $44,200,000, | ||
| collateralized by | ||
| Federal National | ||
| Mortgage Assn. | ||
| 2.500%–6.500%, | ||
| 11/1/27–10/1/42, | ||
| with a value of | ||
| $45,084,000) | 44,200 | 44,200 |
U.S. Government and Agency Obligations (0.2%)
| 5,6 | Fannie Mae Discount | ||
| Notes, 0.098%, 11/6/13 | 1,000,000 | 1,000 | |
| 6,7 | Federal Home Loan | ||
| Bank Discount Notes, | |||
| 0.055%, 11/29/13 | 200,000 | 200 | |
| 5,6 | Freddie Mac | ||
| Discount Notes, | |||
| 0.073%–0.100%, | |||
| 11/12/13 | 16,000,000 | 15,998 | |
| 17,198 | |||
| Total Temporary Cash Investments | |||
| (Cost $314,230) | 314,229 | ||
| Total Investments (100.0%) | |||
| (Cost $11,257,517) | 13,966,582 | ||
| Other Assets and Liabilities (0.0%) | |||
| Other Assets | 46,900 | ||
| Liabilities4 | (40,875) | ||
| 6,025 | |||
| Net Assets (100%) | 13,972,607 | ||
17
Equity Income Fund
| At September 30, 2013, net assets consisted of: | |
| Amount | |
| ($000) | |
| Paid-in Capital | 11,010,609 |
| Overdistributed Net Investment Income | (5,575) |
| Accumulated Net Realized Gains | 262,248 |
| Unrealized Appreciation (Depreciation) | |
| Investment Securities | 2,709,065 |
| Futures Contracts | (3,801) |
| Foreign Currencies | 61 |
| Net Assets | 13,972,607 |
| Investor Shares—Net Assets | |
| Applicable to 171,191,903 outstanding | |
| $.001 par value shares of beneficial | |
| interest (unlimited authorization) | 4,838,707 |
| Net Asset Value Per Share— | |
| Investor Shares | $28.26 |
| Admiral Shares—Net Assets | |
| Applicable to 154,178,945 outstanding | |
| $.001 par value shares of beneficial | |
| interest (unlimited authorization) | 9,133,900 |
| Net Asset Value Per Share— | |
| Admiral Shares | $59.24 |
See Note A in Notes to Financial Statements.
^ Part of security position is on loan to broker-dealers. The total value of securities on loan is $2,623,000.
1 The fund invests a portion of its cash reserves in equity markets through the use of index futures contracts. After giving effect to futures investments, the fund’s effective common stock and temporary cash investment positions represent 99.6% and 0.4%, respectively, of net assets.
2 Considered an affiliated company of the fund as the issuer is another member of The Vanguard Group.
3 Affiliated money market fund available only to Vanguard funds and certain trusts and accounts managed by Vanguard. Rate shown is the 7-day yield.
4 Includes $2,700,000 of collateral received for securities on loan.
5 The issuer was placed under federal conservatorship in September 2008; since that time, its daily operations have been managed by the Federal Housing Finance Agency and it receives capital from the U.S. Treasury, as needed to maintain a positive net worth, in exchange for senior preferred stock.
6 Securities with a value of $13,098,000 have been segregated as initial margin for open futures contracts.
7 The issuer operates under a congressional charter; its securities are generally neither guaranteed by the U.S. Treasury nor backed by the full faith and credit of the U.S. government.
ADR—American Depositary Receipt.
See accompanying Notes, which are an integral part of the Financial Statements.
18
| Equity Income Fund | |
| Statement of Operations | |
| Year Ended | |
| September 30, 2013 | |
| ($000) | |
| Investment Income | |
| Income | |
| Dividends1,2 | 356,834 |
| Interest2 | 664 |
| Securities Lending | 807 |
| Total Income | 358,305 |
| Expenses | |
| Investment Advisory Fees—Note B | |
| Basic Fee | 8,658 |
| Performance Adjustment | 135 |
| The Vanguard Group—Note C | |
| Management and Administrative—Investor Shares | 8,395 |
| Management and Administrative—Admiral Shares | 7,561 |
| Marketing and Distribution—Investor Shares | 1,131 |
| Marketing and Distribution—Admiral Shares | 1,455 |
| Custodian Fees | 122 |
| Auditing Fees | 30 |
| Shareholders’ Reports—Investor Shares | 114 |
| Shareholders’ Reports—Admiral Shares | 50 |
| Trustees’ Fees and Expenses | 28 |
| Total Expenses | 27,679 |
| Net Investment Income | 330,626 |
| Realized Net Gain (Loss) | |
| Investment Securities Sold2 | 515,136 |
| Futures Contracts | 50,429 |
| Foreign Currencies | (22) |
| Realized Net Gain (Loss) | 565,543 |
| Change in Unrealized Appreciation (Depreciation) | |
| Investment Securities | 1,113,157 |
| Futures Contracts | 691 |
| Foreign Currencies | 74 |
| Change in Unrealized Appreciation (Depreciation) | 1,113,922 |
| Net Increase (Decrease) in Net Assets Resulting from Operations | 2,010,091 |
1 Dividends are net of foreign withholding taxes of $2,323,000.
2 Dividend income, interest income, and realized net gain (loss) from affiliated companies of the fund were $4,404,000, $447,000, and $0, respectively.
See accompanying Notes, which are an integral part of the Financial Statements.
19
| Equity Income Fund | ||
| Statement of Changes in Net Assets | ||
| Year Ended September 30, | ||
| 2013 | 2012 | |
| ($000) | ($000) | |
| Increase (Decrease) in Net Assets | ||
| Operations | ||
| Net Investment Income | 330,626 | 231,822 |
| Realized Net Gain (Loss) | 565,543 | 258,561 |
| Change in Unrealized Appreciation (Depreciation) | 1,113,922 | 1,289,713 |
| Net Increase (Decrease) in Net Assets Resulting from Operations | 2,010,091 | 1,780,096 |
| Distributions | ||
| Net Investment Income | ||
| Investor Shares | (122,346) | (110,412) |
| Admiral Shares | (208,254) | (122,429) |
| Realized Capital Gain | ||
| Investor Shares | — | — |
| Admiral Shares | — | — |
| Total Distributions | (330,600) | (232,841) |
| Capital Share Transactions | ||
| Investor Shares | 65,329 | 496,124 |
| Admiral Shares | 2,886,791 | 1,848,221 |
| Net Increase (Decrease) from Capital Share Transactions | 2,952,120 | 2,344,345 |
| Total Increase (Decrease) | 4,631,611 | 3,891,600 |
| Net Assets | ||
| Beginning of Period | 9,340,996 | 5,449,396 |
| End of Period1 | 13,972,607 | 9,340,996 |
1 Net Assets—End of Period includes undistributed (overdistributed) net investment income of ($5,575,000) and ($5,579,000).
See accompanying Notes, which are an integral part of the Financial Statements.
20
| Equity Income Fund | |||||
| Financial Highlights | |||||
| Investor Shares | |||||
| For a Share Outstanding | Year Ended September 30, | ||||
| Throughout Each Period | 2013 | 2012 | 2011 | 2010 | 2009 |
| Net Asset Value, Beginning of Period | $24.31 | $19.40 | $18.83 | $17.40 | $20.02 |
| Investment Operations | |||||
| Net Investment Income | .732 | .667 | .596 | .526 | .585 |
| Net Realized and Unrealized Gain (Loss) | |||||
| on Investments | 3.946 | 4.908 | .567 | 1.432 | (2.506) |
| Total from Investment Operations | 4.678 | 5.575 | 1.163 | 1.958 | (1.921) |
| Distributions | |||||
| Dividends from Net Investment Income | (.728) | (. 665) | (. 593) | (. 528) | (.587) |
| Distributions from Realized Capital Gains | — | — | — | — | (.112) |
| Total Distributions | (.728) | (. 665) | (. 593) | (. 528) | (.699) |
| Net Asset Value, End of Period | $28.26 | $24.31 | $19.40 | $18.83 | $17.40 |
| Total Return1 | 19.45% | 29.00% | 6.00% | 11.36% | -9.12% |
| Ratios/Supplemental Data | |||||
| Net Assets, End of Period (Millions) | $4,839 | $4,107 | $2,835 | $2,651 | $2,423 |
| Ratio of Total Expenses to | |||||
| Average Net Assets2 | 0.30% | 0.30% | 0.31% | 0.31% | 0.36% |
| Ratio of Net Investment Income to | |||||
| Average Net Assets | 2.81% | 3.00% | 2.89% | 2.88% | 3.76% |
| Portfolio Turnover Rate | 34% | 26% | 29% | 45% | 51% |
1 Total returns do not include account service fees that may have applied in the periods shown. Fund prospectuses provide information about any applicable account service fees.
2 Includes performance-based investment advisory fee increases (decreases) of 0.00%, 0.00%, 0.01%, 0.01%, and 0.02%.
See accompanying Notes, which are an integral part of the Financial Statements.
21
| Equity Income Fund | |||||
| Financial Highlights | |||||
| Admiral Shares | |||||
| For a Share Outstanding | Year Ended September 30, | ||||
| Throughout Each Period | 2013 | 2012 | 2011 | 2010 | 2009 |
| Net Asset Value, Beginning of Period | $50.94 | $40.67 | $39.47 | $36.46 | $41.97 |
| Investment Operations | |||||
| Net Investment Income | 1.585 | 1.445 | 1.286 | 1.138 | 1.264 |
| Net Realized and Unrealized Gain (Loss) | |||||
| on Investments | 8.293 | 10.265 | 1.194 | 3.013 | (5.269) |
| Total from Investment Operations | 9.878 | 11.710 | 2.480 | 4.151 | (4.005) |
| Distributions | |||||
| Dividends from Net Investment Income | (1.578) | (1.440) | (1.280) | (1.141) | (1.270) |
| Distributions from Realized Capital Gains | — | — | — | — | (.235) |
| Total Distributions | (1.578) | (1.440) | (1.280) | (1.141) | (1.505) |
| Net Asset Value, End of Period | $59.24 | $50.94 | $40.67 | $39.47 | $36.46 |
| Total Return | 19.61% | 29.06% | 6.10% | 11.50% | -9.05% |
| Ratios/Supplemental Data | |||||
| Net Assets, End of Period (Millions) | $9,134 | $5,234 | $2,614 | $1,667 | $1,475 |
| Ratio of Total Expenses to | |||||
| Average Net Assets1 | 0.21% | 0.21% | 0.22% | 0.22% | 0.24% |
| Ratio of Net Investment Income to | |||||
| Average Net Assets | 2.90% | 3.09% | 2.98% | 2.97% | 3.89% |
| Portfolio Turnover Rate | 34% | 26% | 29% | 45% | 51% |
1 Includes performance-based investment advisory fee increases (decreases) of 0.00%, 0.00%, 0.01%, 0.01%, and 0.02%.
See accompanying Notes, which are an integral part of the Financial Statements.
22
Equity Income Fund
Notes to Financial Statements
Vanguard Equity Income Fund is registered under the Investment Company Act of 1940 as an open-end investment company, or mutual fund. The fund offers two classes of shares: Investor Shares and Admiral Shares. Investor Shares are available to any investor who meets the fund’s minimum purchase requirements. Admiral Shares are designed for investors who meet certain administrative, service, and account-size criteria.
A. The following significant accounting policies conform to generally accepted accounting principles for U.S. mutual funds. The fund consistently follows such policies in preparing its financial statements.
1. Security Valuation: Securities are valued as of the close of trading on the New York Stock Exchange (generally 4 p.m., Eastern time) on the valuation date. Equity securities are valued at the latest quoted sales prices or official closing prices taken from the primary market in which each security trades; such securities not traded on the valuation date are valued at the mean of the latest quoted bid and asked prices. Securities for which market quotations are not readily available, or whose values have been affected by events occurring before the fund’s pricing time but after the close of the securities’ primary markets, are valued at their fair values calculated according to procedures adopted by the board of trustees. These procedures include obtaining quotations from an independent pricing service, monitoring news to identify significant market- or security-specific events, and evaluating changes in the values of foreign market proxies (for example, ADRs, futures contracts, or exchange-traded funds), between the time the foreign markets close and the fund’s pricing time. When fair-value pricing is employed, the prices of securities used by a fund to calculate its net asset value may differ from quoted or published prices for the same securities. Investments in Vanguard Market Liquidity Fund are valued at that fund’s net asset value. Temporary cash investments acquired over 60 days to maturity are valued using the latest bid prices or using valuations based on a matrix system (which considers such factors as security prices, yields, maturities, and ratings), both as furnished by independent pricing services. Other temporary cash investments are valued at amortized cost, which approximates market value.
2. Foreign Currency: Securities and other assets and liabilities denominated in foreign currencies are translated into U.S. dollars using exchange rates obtained from an independent third party as of the fund’s pricing time on the valuation date. Realized gains (losses) and unrealized appreciation (depreciation) on investment securities include the effects of changes in exchange rates since the securities were purchased, combined with the effects of changes in security prices. Fluctuations in the value of other assets and liabilities resulting from changes in exchange rates are recorded as unrealized foreign currency gains (losses) until the assets or liabilities are settled in cash, at which time they are recorded as realized foreign currency gains (losses).
3. Futures Contracts: The fund may use index futures contracts to a limited extent, with the objective of maintaining full exposure to the stock market while maintaining liquidity. The fund may purchase or sell futures contracts to achieve a desired level of investment, whether to accommodate portfolio turnover or cash flows from capital share transactions. The primary risks associated with the use of futures contracts are imperfect correlation between changes in market values of stocks held by the fund and the prices of futures contracts, and the possibility of an illiquid market. Counterparty risk involving futures is mitigated because a regulated clearinghouse is the counterparty instead of the clearing broker. To further mitigate counterparty risk, the fund trades futures contracts on an exchange, monitors the financial strength of its clearing brokers and clearinghouse, and has entered into clearing agreements with its clearing brokers. The clearinghouse imposes initial margin requirements to secure the fund’s performance and requires daily settlement of variation margin representing changes in the market value of each contract.
23
Equity Income Fund
Futures contracts are valued at their quoted daily settlement prices. The aggregate notional amounts of the contracts are not recorded in the Statement of Net Assets. Fluctuations in the value of the contracts are recorded in the Statement of Net Assets as an asset (liability) and in the Statement of Operations as unrealized appreciation (depreciation) until the contracts are closed, when they are recorded as realized futures gains (losses).
During the year ended September 30, 2013, the fund’s average investments in long and short futures contracts represented 3% and 0% of net assets, respectively, based on quarterly average aggregate settlement values.
4. Repurchase Agreements: The fund may enter into repurchase agreements with institutional counterparties. Securities pledged as collateral to the fund under repurchase agreements are held by a custodian bank until the agreements mature. Each agreement requires that the market value of the collateral be sufficient to cover payments of interest and principal. The fund further mitigates its counterparty risk by entering into repurchase agreements only with a diverse group of prequalified counterparties, monitoring their financial strength, and entering into master repurchase agreements with its counterparties. The master repurchase agreements provide that, in the event of a counter-party’s default (including bankruptcy), the fund may terminate any repurchase agreements with that counterparty, determine the net amount owed, and sell or retain the collateral up to the net amount owed to the fund. Such action may be subject to legal proceedings, which may delay or limit the disposition of collateral.
5. Federal Income Taxes: The fund intends to continue to qualify as a regulated investment company and distribute all of its taxable income. Management has analyzed the fund’s tax positions taken for all open federal income tax years (September 30, 2010–2013), and has concluded that no provision for federal income tax is required in the fund’s financial statements.
6. Distributions: Distributions to shareholders are recorded on the ex-dividend date.
7. Securities Lending: To earn additional income, the fund may lend its securities to qualified institutional borrowers. Security loans are required to be secured at all times by collateral in an amount at least equal to the market value of securities loaned. Daily market fluctuations could cause the value of loaned securities to be more or less than the value of the collateral received. When this occurs, the collateral is adjusted and settled on the next business day. The fund further mitigates its counterparty risk by entering into securities lending transactions only with a diverse group of prequalified counterparties, monitoring their financial strength, and entering into master securities lending agreements with its counterparties. The master securities lending agreements provide that, in the event of a counterparty’s default (including bankruptcy), the fund may terminate any loans with that borrower, determine the net amount owed, and sell or retain the collateral up to the net amount owed to the fund; however, such actions may be subject to legal proceedings. While collateral mitigates counterparty risk, in the absence of a default the fund may experience delays and costs in recovering the securities loaned. The fund invests cash collateral received in Vanguard Market Liquidity Fund, and records a liability for the return of the collateral, during the period the securities are on loan. Securities lending income represents fees charged to borrowers plus income earned on invested cash collateral, less expenses associated with the loan.
8. Other: Dividend income is recorded on the ex-dividend date. Interest income includes income distributions received from Vanguard Market Liquidity Fund and is accrued daily. Premiums and discounts on debt securities purchased are amortized and accreted, respectively, to interest income
24
Equity Income Fund
over the lives of the respective securities. Security transactions are accounted for on the date securities are bought or sold. Costs used to determine realized gains (losses) on the sale of investment securities are those of the specific securities sold.
Each class of shares has equal rights as to assets and earnings, except that each class separately bears certain class-specific expenses related to maintenance of shareholder accounts (included in Management and Administrative expenses) and shareholder reporting. Marketing and distribution expenses are allocated to each class of shares based on a method approved by the board of trustees. Income, other non-class-specific expenses, and gains and losses on investments are allocated to each class of shares based on its relative net assets.
B. Wellington Management Company, LLP, provides investment advisory services to a portion of the fund for a fee calculated at an annual percentage rate of average net assets managed by the advisor. The basic fee of Wellington Management Company, LLP, is subject to quarterly adjustments based on performance for the preceding three years relative to the FTSE High Dividend Yield Index.
The Vanguard Group provides investment advisory services to a portion of the fund on an at-cost basis; the fund paid Vanguard advisory fees of $1,221,000 for the year ended September 30, 2013.
For the year ended September 30, 2013, the aggregate investment advisory fee represented an effective annual basic rate of 0.08% of the fund’s average net assets, before an increase of $135,000 (0.00%) based on performance.
C. The Vanguard Group furnishes at cost corporate management, administrative, marketing, and distribution services. The costs of such services are allocated to the fund under methods approved by the board of trustees. The fund has committed to provide up to 0.40% of its net assets in capital contributions to Vanguard. At September 30, 2013, the fund had contributed capital of $1,649,000 to Vanguard (included in Other Assets), representing 0.01% of the fund’s net assets and 0.66% of Vanguard’s capitalization. The fund’s trustees and officers are also directors and officers of Vanguard.
D. Various inputs may be used to determine the value of the fund’s investments. These inputs are summarized in three broad levels for financial statement purposes. The inputs or methodologies used to value securities are not necessarily an indication of the risk associated with investing in those securities.
Level 1—Quoted prices in active markets for identical securities.
Level 2—Other significant observable inputs (including quoted prices for similar securities, interest rates, prepayment speeds, credit risk, etc.).
Level 3—Significant unobservable inputs (including the fund’s own assumptions used to determine the fair value of investments).
The following table summarizes the market value of the fund’s investments as of September 30, 2013, based on the inputs used to value them:
| Level 1 | Level 2 | Level 3 | |
| Investments | ($000) | ($000) | ($000) |
| Common Stocks | 12,983,603 | 668,750 | — |
| Temporary Cash Investments | 252,831 | 61,398 | — |
| Futures Contracts—Liabilities1 | (1,897) | — | — |
| Total | 13,234,537 | 730,148 | — |
| 1 Represents variation margin on the last day of the reporting period. |
25
Equity Income Fund
E. At September 30, 2013, the aggregate settlement value of open futures contracts and the related unrealized appreciation (depreciation) were:
| ($000) | ||||
| Aggregate | ||||
| Number of | Settlement | Unrealized | ||
| Long (Short) | Value | Appreciation | ||
| Futures Contracts | Expiration | Contracts | Long (Short) | (Depreciation) |
| S&P 500 Index | December 2013 | 401 | 167,849 | (2,285) |
| E-mini S&P 500 Index | December 2013 | 1,135 | 95,016 | (1,516) |
Unrealized appreciation (depreciation) on open futures contracts is required to be treated as realized gain (loss) for tax purposes.
F. Distributions are determined on a tax basis and may differ from net investment income and realized capital gains for financial reporting purposes. Differences may be permanent or temporary. Permanent differences are reclassified among capital accounts in the financial statements to reflect their tax character. Temporary differences arise when certain items of income, expense, gain, or loss are recognized in different periods for financial statement and tax purposes; these differences will reverse at some time in the future. Differences in classification may also result from the treatment of short-term gains as ordinary income for tax purposes.
During the year ended September 30, 2013, the fund realized net foreign currency losses of $22,000, which decreased distributable net income for tax purposes; accordingly, such losses have been reclassified from accumulated net realized gains to overdistributed net investment income.
The fund used a tax accounting practice to treat a portion of the price of capital shares redeemed during the year as distributions from realized capital gains. Accordingly, the fund has reclassified $17,370,000 from accumulated net realized gains to paid-in capital.
The fund used a capital loss carryforward of $290,391,000 to offset taxable capital gains realized during the year ended September 30, 2013, reducing the amount of capital gains that would otherwise be available to distribute to shareholders. For tax purposes, at September 30, 2013, the fund had $6,382,000 of ordinary income and $259,797,000 of long-term capital gains available for distribution.
At September 30, 2013, the cost of investment securities for tax purposes was $11,258,886,000. Net unrealized appreciation of investment securities for tax purposes was $2,707,696,000, consisting of unrealized gains of $2,758,452,000 on securities that had risen in value since their purchase and $50,756,000 in unrealized losses on securities that had fallen in value since their purchase.
G. During the year ended September 30, 2013, the fund purchased $6,901,868,000 of investment securities and sold $3,744,605,000 of investment securities, other than temporary cash investments.
26
Equity Income Fund
H. Capital share transactions for each class of shares were:
| Year Ended September 30, | ||||
| 2013 | 2012 | |||
| Amount | Shares | Amount | Shares | |
| ($000) | (000) | ($000) | (000) | |
| Investor Shares | ||||
| Issued | 1,660,385 | 62,876 | 1,782,119 | 78,809 |
| Issued in Lieu of Cash Distributions | 113,805 | 4,261 | 101,255 | 4,424 |
| Redeemed | (1,708,861) | (64,935) | (1,387,250) | (60,380) |
| Net Increase (Decrease)—Investor Shares | 65,329 | 2,202 | 496,124 | 22,853 |
| Admiral Shares | ||||
| Issued | 3,878,687 | 69,335 | 2,304,711 | 48,050 |
| Issued in Lieu of Cash Distributions | 175,891 | 3,123 | 102,576 | 2,129 |
| Redeemed | (1,167,787) | (21,012) | (559,066) | (11,723) |
| Net Increase (Decrease) —Admiral Shares | 2,886,791 | 51,446 | 1,848,221 | 38,456 |
I. Management has determined that no material events or transactions occurred subsequent to September 30, 2013, that would require recognition or disclosure in these financial statements.
27
Report of Independent Registered Public Accounting Firm
To the Trustees of Vanguard Fenway Funds and the Shareholders of Vanguard Equity Income Fund:
In our opinion, the accompanying statement of net assets and the related statements of operations and of changes in net assets and the financial highlights present fairly, in all material respects, the financial position of Vanguard Equity Income Fund (constituting a separate portfolio of Vanguard Fenway Funds, hereafter referred to as the “Fund”) at September 30, 2013, the results of its operations for the year then ended, the changes in its net assets for each of the two years in the period then ended, and the financial highlights for each of the five years in the period then ended, in conformity with accounting principles generally accepted in the United States of America. These financial statements and financial highlights (hereafter referred to as “financial statements”) are the responsibility of the Fund’s management; our responsibility is to express an opinion on these financial statements based on our audits. We conducted our audits of these financial statements in accordance with the standards of the Public Company Accounting Oversight Board (United States). Those standards require that we plan and perform the audit to obtain reasonable assurance about whether the financial statements are free of material misstatement. An audit includes examining, on a test basis, evidence supporting the amounts and disclosures in the financial statements, assessing the accounting principles used and significant estimates made by management, and evaluating the overall financial statement presentation. We believe that our audits, which included confirmation of securities at September 30, 2013 by correspondence with the custodians and brokers and by agreement to the underlying ownership records of the transfer agent, provide a reasonable basis for our opinion.
PricewaterhouseCoopers LLP
Philadelphia, Pennsylvania
November 14, 2013
| Special 2013 tax information (unaudited) for Vanguard Equity Income Fund |
| This information for the fiscal year ended September 30, 2013, is included pursuant to provisions |
| of the Internal Revenue Code. |
| The fund distributed $17,370,000 as capital gain dividends (from net long-term capital gains) to |
| shareholders during the fiscal year. |
| The fund distributed $330,600,000 of qualified dividend income to shareholders during the fiscal year. |
| For corporate shareholders, 92.0% of investment income (dividend income plus short-term gains, |
| if any) qualifies for the dividends-received deduction. |
28
Your Fund’s After-Tax Returns
This table presents returns for your fund both before and after taxes. The after-tax returns are shown in two ways: (1) assuming that an investor owned the fund during the entire period and paid taxes on the fund’s distributions, and (2) assuming that an investor paid taxes on the fund’s distributions and sold all shares at the end of each period.
Calculations are based on the highest individual federal income tax and capital gains tax rates in effect at the times of the distributions and the hypothetical sales. State and local taxes were not considered. After-tax returns reflect any qualified dividend income, using actual prior-year figures and estimates for 2013. (In the example, returns after the sale of fund shares may be higher than those assuming no sale. This occurs when the sale would have produced a capital loss. The calculation assumes that the investor received a tax deduction for the loss.)
The table shows returns for one share class only; returns for other share classes will differ. Please note that your actual after-tax returns will depend on your tax situation and may differ from those shown. Also note that if you own the fund in a tax-deferred account, such as an individual retirement account or a 401(k) plan, this information does not apply to you. Such accounts are not subject to current taxes.
Finally, keep in mind that a fund’s performance—whether before or after taxes—does not guarantee future results.
Average Annual Total Returns: Equity Income Fund Investor Shares
Periods Ended September 30, 2013
| One | Five | Ten | |
| Year | Years | Years | |
| Returns Before Taxes | 19.45% | 10.57% | 9.07% |
| Returns After Taxes on Distributions | 18.76 | 10.02 | 8.13 |
| Returns After Taxes on Distributions and Sale of Fund Shares | 11.65 | 8.45 | 7.44 |
29
About Your Fund’s Expenses
As a shareholder of the fund, you incur ongoing costs, which include costs for portfolio management, administrative services, and shareholder reports (like this one), among others. Operating expenses, which are deducted from a fund’s gross income, directly reduce the investment return of the fund.
A fund’s expenses are expressed as a percentage of its average net assets. This figure is known as the expense ratio. The following examples are intended to help you understand the ongoing costs (in dollars) of investing in your fund and to compare these costs with those of other mutual funds. The examples are based on an investment of $1,000 made at the beginning of the period shown and held for the entire period.
The accompanying table illustrates your fund’s costs in two ways:
• Based on actual fund return. This section helps you to estimate the actual expenses that you paid over the period. The ”Ending Account Value“ shown is derived from the fund‘s actual return, and the third column shows the dollar amount that would have been paid by an investor who started with $1,000 in the fund. You may use the information here, together with the amount you invested, to estimate the expenses that you paid over the period.
To do so, simply divide your account value by $1,000 (for example, an $8,600 account value divided by $1,000 = 8.6), then multiply the result by the number given for your fund under the heading ”Expenses Paid During Period.“
• Based on hypothetical 5% yearly return. This section is intended to help you compare your fund‘s costs with those of other mutual funds. It assumes that the fund had a yearly return of 5% before expenses, but that the expense ratio is unchanged. In this case—because the return used is not the fund’s actual return—the results do not apply to your investment. The example is useful in making comparisons because the Securities and Exchange Commission requires all mutual funds to calculate expenses based on a 5% return. You can assess your fund’s costs by comparing this hypothetical example with the hypothetical examples that appear in shareholder reports of other funds.
Note that the expenses shown in the table are meant to highlight and help you compare ongoing costs only and do not reflect transaction costs incurred by the fund for buying and selling securities. Further, the expenses do not include any purchase, redemption, or account service fees described in the fund prospectus. If such fees were applied to your account, your costs would be higher. Your fund does not carry a “sales load.”
The calculations assume no shares were bought or sold during the period. Your actual costs may have been higher or lower, depending on the amount of your investment and the timing of any purchases or redemptions.
You can find more information about the fund’s expenses, including annual expense ratios, in the Financial Statements section of this report. For additional information on operating expenses and other shareholder costs, please refer to your fund’s current prospectus.
30
| Six Months Ended September 30, 2013 | |||
| Beginning | Ending | Expenses | |
| Account Value | Account Value | Paid During | |
| Equity Income Fund | 3/31/2013 | 9/30/2013 | Period |
| Based on Actual Fund Return | |||
| Investor Shares | $1,000.00 | $1,072.76 | $1.51 |
| Admiral Shares | 1,000.00 | 1,073.43 | 1.04 |
| Based on Hypothetical 5% Yearly Return | |||
| Investor Shares | $1,000.00 | $1,023.61 | $1.47 |
| Admiral Shares | 1,000.00 | 1,024.07 | 1.01 |
The calculations are based on expenses incurred in the most recent six-month period. The fund’s annualized six-month expense ratios for that period are 0.29% for Investor Shares and 0.20% for Admiral Shares. The dollar amounts shown as “Expenses Paid” are equal to the annualized expense ratio multiplied by the average account value over the period, multiplied by the number of days in the most recent six-month period, then divided by the number of days in the most recent 12-month period.
31
Glossary
30-Day SEC Yield. A fund’s 30-day SEC yield is derived using a formula specified by the U.S. Securities and Exchange Commission. Under the formula, data related to the fund’s security holdings in the previous 30 days are used to calculate the fund’s hypothetical net income for that period, which is then annualized and divided by the fund’s estimated average net assets over the calculation period. For the purposes of this calculation, a security’s income is based on its current market yield to maturity (for bonds), its actual income (for asset-backed securities), or its projected dividend yield (for stocks). Because the SEC yield represents hypothetical annualized income, it will differ—at times significantly—from the fund’s actual experience. As a result, the fund’s income distributions may be higher or lower than implied by the SEC yield.
Beta. A measure of the magnitude of a fund’s past share-price fluctuations in relation to the ups and downs of a given market index. The index is assigned a beta of 1.00. Compared with a given index, a fund with a beta of 1.20 typically would have seen its share price rise or fall by 12% when the index rose or fell by 10%. For this report, beta is based on returns over the past 36 months for both the fund and the index. Note that a fund’s beta should be reviewed in conjunction with its R-squared (see definition). The lower the R-squared, the less correlation there is between the fund and the index, and the less reliable beta is as an indicator of volatility.
Dividend Yield. Dividend income earned by stocks, expressed as a percentage of the aggregate market value (or of net asset value, for a fund). The yield is determined by dividing the amount of the annual dividends by the aggregate value (or net asset value) at the end of the period. For a fund, the dividend yield is based solely on stock holdings and does not include any income produced by other investments.
Earnings Growth Rate. The average annual rate of growth in earnings over the past five years for the stocks now in a fund.
Equity Exposure. A measure that reflects a fund’s investments in stocks and stock futures. Any holdings in short-term reserves are excluded.
Expense Ratio. A fund’s total annual operating expenses expressed as a percentage of the fund’s average net assets. The expense ratio includes management and administrative expenses, but does not include the transaction costs of buying and selling portfolio securities.
Foreign Holdings. The percentage of a fund represented by securities or depositary receipts of companies based outside the United States.
Inception Date. The date on which the assets of a fund (or one of its share classes) are first invested in accordance with the fund’s investment objective. For funds with a subscription period, the inception date is the day after that period ends. Investment performance is measured from the inception date.
Median Market Cap. An indicator of the size of companies in which a fund invests; the midpoint of market capitalization (market price x shares outstanding) of a fund’s stocks, weighted by the proportion of the fund’s assets invested in each stock. Stocks representing half of the fund’s assets have market capitalizations above the median, and the rest are below it.
Price/Book Ratio. The share price of a stock divided by its net worth, or book value, per share. For a fund, the weighted average price/book ratio of the stocks it holds.
32
Price/Earnings Ratio. The ratio of a stock’s current price to its per-share earnings over the past year. For a fund, the weighted average P/E of the stocks it holds. P/E is an indicator of market expectations about corporate prospects; the higher the P/E, the greater the expectations for a company’s future growth.
R-Squared. A measure of how much of a fund’s past returns can be explained by the returns from the market in general, as measured by a given index. If a fund’s total returns were precisely synchronized with an index’s returns, its R-squared would be 1.00. If the fund’s returns bore no relationship to the index’s returns, its R-squared would be 0. For this report, R-squared is based on returns over the past 36 months for both the fund and the index.
Return on Equity. The annual average rate of return generated by a company during the past five years for each dollar of shareholder’s equity (net income divided by shareholder’s equity). For a fund, the weighted average return on equity for the companies whose stocks it holds.
Short-Term Reserves. The percentage of a fund invested in highly liquid, short-term securities that can be readily converted to cash.
Turnover Rate. An indication of the fund’s trading activity. Funds with high turnover rates incur higher transaction costs and may be more likely to distribute capital gains (which may be taxable to investors). The turnover rate excludes in-kind transactions, which have minimal impact on costs.
Benchmark Information
Spliced Equity Income Index: Russell 1000 Value Index through July 31, 2007; FTSE High Dividend Yield Index thereafter.
33
This page intentionally left blank.
This page intentionally left blank.
The People Who Govern Your Fund
The trustees of your mutual fund are there to see that the fund is operated and managed in your best interests since, as a shareholder, you are a part owner of the fund. Your fund’s trustees also serve on the board of directors of The Vanguard Group, Inc., which is owned by the Vanguard funds and provides services to them on an at-cost basis.
A majority of Vanguard’s board members are independent, meaning that they have no affiliation with Vanguard or the funds they oversee, apart from the sizable personal investments they have made as private individuals. The independent board members have distinguished backgrounds in business, academia, and public service. Each of the trustees and executive officers oversees 181 Vanguard funds.
The following table provides information for each trustee and executive officer of the fund. More information about the trustees is in the Statement of Additional Information, which can be obtained, without charge, by contacting Vanguard at 800-662-7447, or online at vanguard.com.
| InterestedTrustee1 | and Delphi Automotive LLP (automotive components); |
| Senior Advisor at New Mountain Capital; Trustee of | |
| F. William McNabb III | The Conference Board. |
| Born 1957. Trustee Since July 2009. Chairman of the | |
| Board. Principal Occupation(s) During the Past Five | Amy Gutmann |
| Years: Chairman of the Board of The Vanguard Group, | Born 1949. Trustee Since June 2006. Principal |
| Inc., and of each of the investment companies served | Occupation(s) During the Past Five Years: President |
| by The Vanguard Group, since January 2010; Director | of the University of Pennsylvania; Christopher H. |
| of The Vanguard Group since 2008; Chief Executive | Browne Distinguished Professor of Political Science |
| Officer and President of The Vanguard Group and of | in the School of Arts and Sciences with secondary |
| each of the investment companies served by The | appointments at the Annenberg School for |
| Vanguard Group since 2008; Director of Vanguard | Communication and the Graduate School of Education |
| Marketing Corporation; Managing Director of The | of the University of Pennsylvania; Member of the |
| Vanguard Group (1995–2008). | National Commission on the Humanities and Social |
| Sciences; Trustee of Carnegie Corporation of New | |
| York and of the National Constitution Center; Chair | |
| IndependentTrustees | of the U. S. Presidential Commission for the Study |
| of Bioethical Issues. | |
| Emerson U. Fullwood | |
| Born 1948. Trustee Since January 2008. Principal | |
| Occupation(s) During the Past Five Years: Executive | JoAnn Heffernan Heisen |
| Chief Staff and Marketing Officer for North America | Born 1950. Trustee Since July 1998. Principal |
| and Corporate Vice President (retired 2008) of Xerox | Occupation(s) During the Past Five Years: Corporate |
| Corporation (document management products and | Vice President and Chief Global Diversity Officer |
| services); Executive in Residence and 2010 | (retired 2008) and Member of the Executive |
| Distinguished Minett Professor at the Rochester | Committee (1997–2008) of Johnson & Johnson |
| Institute of Technology; Director of SPX Corporation | (pharmaceuticals/medical devices/consumer |
| (multi-industry manufacturing), the United Way of | products); Director of Skytop Lodge Corporation |
| Rochester, Amerigroup Corporation (managed health | (hotels), the University Medical Center at Princeton, |
| care), the University of Rochester Medical Center, | the Robert Wood Johnson Foundation, and the Center |
| Monroe Community College Foundation, and North | for Talent Innovation; Member of the Advisory Board |
| Carolina A&T University. | of the Maxwell School of Citizenship and Public Affairs |
| at Syracuse University. | |
| Rajiv L. Gupta | |
| Born 1945. Trustee Since December 2001. 2 | F. Joseph Loughrey |
| Principal Occupation(s) During the Past Five Years: | Born 1949. Trustee Since October 2009. Principal |
| Chairman and Chief Executive Officer (retired 2009) | Occupation(s) During the Past Five Years: President |
| and President (2006–2008) of Rohm and Haas Co. | and Chief Operating Officer (retired 2009) of Cummins |
| (chemicals); Director of Tyco International, Ltd. | Inc. (industrial machinery); Chairman of the Board of |
| (diversified manufacturing and services), Hewlett- | Hillenbrand, Inc. (specialized consumer services) and |
| Packard Co. (electronic computer manufacturing), | of Oxfam America; Director of SKF AB (industrial |
| machinery) and the Lumina Foundation for Education; | Executive Officers | |
| Member of the Advisory Council for the College of | ||
| Arts and Letters and of the Advisory Board to the | Glenn Booraem | |
| Kellogg Institute for International Studies, both at | Born 1967. Controller Since July 2010. Principal | |
| the University of Notre Dame. | Occupation(s) During the Past Five Years: Principal | |
| of The Vanguard Group, Inc.; Controller of each of | ||
| Mark Loughridge | the investment companies served by The Vanguard | |
| Born 1953. Trustee Since March 2012. Principal | Group; Assistant Controller of each of the investment | |
| Occupation(s) During the Past Five Years: Senior Vice | companies served by The Vanguard Group (2001–2010). | |
| President and Chief Financial Officer at IBM (information | ||
| technology services); Fiduciary Member of IBM’s | Thomas J. Higgins | |
| Retirement Plan Committee. | Born 1957. Chief Financial Officer Since September | |
| 2008. Principal Occupation(s) During the Past Five | ||
| Scott C. Malpass | Years: Principal of The Vanguard Group, Inc.; Chief | |
| Born 1962. Trustee Since March 2012. Principal | Financial Officer of each of the investment companies | |
| Occupation(s) During the Past Five Years: Chief | served by The Vanguard Group; Treasurer of each of | |
| Investment Officer and Vice President at the University | the investment companies served by The Vanguard | |
| of Notre Dame; Assistant Professor of Finance at the | Group (1998–2008). | |
| Mendoza College of Business at Notre Dame; Member | ||
| of the Notre Dame 403(b) Investment Committee; | Kathryn J. Hyatt | |
| Director of TIFF Advisory Services, Inc. (investment | Born 1955. Treasurer Since November 2008. Principal | |
| advisor); Member of the Investment Advisory | Occupation(s) During the Past Five Years: Principal of | |
| Committees of the Financial Industry Regulatory | The Vanguard Group, Inc.; Treasurer of each of the | |
| Authority (FINRA) and of Major League Baseball. | investment companies served by The Vanguard | |
| Group; Assistant Treasurer of each of the investment | ||
| André F. Perold | companies served by The Vanguard Group (1988–2008). | |
| Born 1952. Trustee Since December 2004. Principal | ||
| Occupation(s) During the Past Five Years: George | Heidi Stam | |
| Gund Professor of Finance and Banking at the Harvard | Born 1956. Secretary Since July 2005. Principal | |
| Business School (retired 2011); Chief Investment | Occupation(s) During the Past Five Years: Managing | |
| Officer and Managing Partner of HighVista Strategies | Director of The Vanguard Group, Inc.; General Counsel | |
| LLC (private investment firm); Director of Rand | of The Vanguard Group; Secretary of The Vanguard | |
| Merchant Bank; Overseer of the Museum of Fine | Group and of each of the investment companies | |
| Arts Boston. | served by The Vanguard Group; Director and Senior | |
| Vice President of Vanguard Marketing Corporation. | ||
| Alfred M. Rankin, Jr. | ||
| Born 1941. Trustee Since January 1993. Principal | Vanguard Senior ManagementTeam | |
| Occupation(s) During the Past Five Years: Chairman, | ||
| President, and Chief Executive Officer of NACCO | Mortimer J. Buckley | Chris D. McIsaac |
| Industries, Inc. (housewares/lignite) and of Hyster-Yale | Kathleen C. Gubanich | Michael S. Miller |
| Materials Handling, Inc. (forklift trucks); Director of | Paul A. Heller | James M. Norris |
| the National Association of Manufacturers; Chairman | Martha G. King | Glenn W. Reed |
| of the Board of University Hospitals of Cleveland; | John T. Marcante | |
| Advisory Chairman of the Board of The Cleveland | ||
| Museum of Art. | ||
| Chairman Emeritus and Senior Advisor | ||
| Peter F. Volanakis | ||
| Born 1955. Trustee Since July 2009. Principal | John J. Brennan | |
| Occupation(s) During the Past Five Years: President | Chairman, 1996–2009 | |
| and Chief Operating Officer (retired 2010) of Corning | Chief Executive Officer and President, 1996–2008 | |
| Incorporated (communications equipment); Director | ||
| of SPX Corporation (multi-industry manufacturing); | Founder | |
| Overseer of the Amos Tuck School of Business | ||
| Administration at Dartmouth College; Advisor to the | John C. Bogle | |
| Norris Cotton Cancer Center. | Chairman and Chief Executive Officer, 1974–1996 | |
1 Mr. McNabb is considered an “interested person,” as defined in the Investment Company Act of 1940, because he is an officer of the Vanguard funds.
2 December 2002 for Vanguard Equity Income Fund, Vanguard Growth Equity Fund, the Vanguard Municipal Bond Funds, and the Vanguard State Tax-Exempt Funds.
 | |
| P.O. Box 2600 | |
| Valley Forge, PA 19482-2600 |
Connect with Vanguard® > vanguard.com
| Fund Information > 800-662-7447 | CFA® is a trademark owned by CFA Institute. |
| Direct Investor Account Services > 800-662-2739 | |
| Institutional Investor Services > 800-523-1036 | |
| Text Telephone for People | |
| With Hearing Impairment > 800-749-7273 | |
| This material may be used in conjunction | |
| with the offering of shares of any Vanguard | |
| fund only if preceded or accompanied by | |
| the fund’s current prospectus. | |
| All comparative mutual fund data are from Lipper, a | |
| Thomson Reuters Company, or Morningstar, Inc., unless | |
| otherwise noted. | |
| You can obtain a free copy of Vanguard’s proxy voting | |
| guidelines by visiting vanguard.com/proxyreporting or by | |
| calling Vanguard at 800-662-2739. The guidelines are | |
| also available from the SEC’s website, sec.gov. In | |
| addition, you may obtain a free report on how your fund | |
| voted the proxies for securities it owned during the 12 | |
| months ended June 30. To get the report, visit either | |
| vanguard.com/proxyreporting or sec.gov. | |
| You can review and copy information about your fund at | |
| the SEC’s Public Reference Room in Washington, D.C. To | |
| find out more about this public service, call the SEC at | |
| 202-551-8090. Information about your fund is also | |
| available on the SEC’s website, and you can receive | |
| copies of this information, for a fee, by sending a | |
| request in either of two ways: via e-mail addressed to | |
| publicinfo@sec.gov or via regular mail addressed to the | |
| Public Reference Section, Securities and Exchange | |
| Commission, Washington, DC 20549-1520. | |
| © 2013 The Vanguard Group, Inc. | |
| All rights reserved. | |
| Vanguard Marketing Corporation, Distributor. | |
| Q650 112013 | |
![]()
Annual Report | September 30, 2013
Vanguard Growth Equity Fund

Vanguard’s Principles for Investing Success
We want to give you the best chance of investment success. These principles, grounded in Vanguard’s research and experience, can put you on the right path.
Goals. Create clear, appropriate investment goals.
Balance. Develop a suitable asset allocation using broadly diversified funds. Cost. Minimize cost.
Discipline. Maintain perspective and long-term discipline.
A single theme unites these principles: Focus on the things you can control.
We believe there is no wiser course for any investor.
| Contents | |
| Your Fund’s Total Returns. | 1 |
| Chairman’s Letter. | 2 |
| Advisors’ Report. | 9 |
| Fund Profile. | 13 |
| Performance Summary. | 14 |
| Financial Statements. | 16 |
| Your Fund’s After-Tax Returns. | 28 |
| About Your Fund’s Expenses. | 29 |
| Glossary. | 31 |
Please note: The opinions expressed in this report are just that—informed opinions. They should not be considered promises or advice.
Also, please keep in mind that the information and opinions cover the period through the date on the front of this report. Of course, the risks of investing in your fund are spelled out in the prospectus.
See the Glossary for definitions of investment terms used in this report.
About the cover: The ship's wheel represents leadership and guidance, essential qualities in navigating difficult seas.
This one is a replica based on an 18th-century British vessel. The HMS Vanguard, another ship of that era, served as the flagship for Admiral Horatio Nelson when he defeated a French fleet at the Battle of the Nile.
Your Fund’s Total Returns
| Fiscal Year Ended September 30, 2013 | |
| Total | |
| Returns | |
| Vanguard Growth Equity Fund | 19.82% |
| Russell 1000 Growth Index | 19.27 |
| Large-Cap Growth Funds Average | 19.58 |
| Large-Cap Growth Funds Average: Derived from data provided by Lipper, a Thomson Reuters Company. | |
Your Fund’s Performance at a Glance
September 30, 2012, Through September 30, 2013
| Distributions Per Share | ||||
| Starting | Ending | |||
| Share | Share | Income | Capital | |
| Price | Price | Dividends | Gains | |
| Vanguard Growth Equity Fund | $12.53 | $14.86 | $0.127 | $0.000 |
1

Chairman’s Letter
Dear Shareholder,
For the second straight year, the U.S. stock market rose sharply over the 12-month period ended September 30, outpacing its historical long-term average. Vanguard Growth Equity Fund returned 19.82% for the period, slightly above the return of its benchmark index, the Russell 1000 Growth Index, and the average return of its large-capitalization fund peers.
For the period, the fund posted double-digit results in eight of the nine sectors in which it was invested. Stocks in the consumer discretionary and financial sectors were notable winners.
If you hold shares in a taxable account, you may wish to review the information about after-tax returns, based on the highest federal income tax bracket, that appears later in the report.
An important announcement about an upcoming merger
On October 16, 2013, your fund’s board of trustees announced that the Growth Equity Fund would merge with Vanguard U.S. Growth Fund. We plan to complete the merger by the first quarter of 2014. There will be no change to your fund’s objective. Both actively managed funds use a multi-manager structure in seeking to
2
provide capital appreciation, and both rely on a traditional stock-selection process that emphasizes fundamental research of large-capitalization companies with strong earnings potential.
The Growth Equity Fund’s two investment advisors, Baillie Gifford Overseas Ltd. and Jennison Associates LLC, will join the U.S. Growth Fund’s three-member advisory team.
Growth Equity shareholders can benefit from the U.S. Growth Fund’s lower expense ratios. Your fund has annual expenses of 0.54% of average net assets. The U.S. Growth Fund has expense ratios of 0.45% for Investor Shares and 0.31% for Admiral Shares.
Until the merger is completed, the Growth Equity Fund has been closed to new accounts. Current shareholders can continue to make additional investments without restriction. Shareholders will receive more information about the planned merger in the near future.
| Market Barometer | |||
| Average Annual Total Returns | |||
| Periods Ended September 30, 2013 | |||
| One | Three | Five | |
| Year | Years | Years | |
| Stocks | |||
| Russell 1000 Index (Large-caps) | 20.91% | 16.64% | 10.53% |
| Russell 2000 Index (Small-caps) | 30.06 | 18.29 | 11.15 |
| Russell 3000 Index (Broad U.S. market) | 21.60 | 16.76 | 10.58 |
| MSCI All Country World Index ex USA (International) | 16.48 | 5.95 | 6.26 |
| Bonds | |||
| Barclays U.S. Aggregate Bond Index (Broad taxable market) | -1.68% | 2.86% | 5.41% |
| Barclays Municipal Bond Index (Broad tax-exempt market) | -2.21 | 3.24 | 5.98 |
| Citigroup Three-Month U.S. Treasury Bill Index | 0.07 | 0.07 | 0.14 |
| CPI | |||
| Consumer Price Index | 1.18% | 2.34% | 1.37% |
3
Stocks dodged obstacles to produce strong gains
Although their path wasn’t always smooth, U.S. stocks powered to a return of about 22% for the 12 months ended September 30. The U.S. economy delivered only modest growth over the fiscal year, but investors’ appetite for risk seemed to increase faster than companies’ profits.
In mid-September, U.S. stocks jumped when the Federal Reserve surprised investors by announcing that it had no immediate plans to unwind its stimulative bond-buying program. But in the waning days of that month, stocks slid ahead of the partial federal government shutdown that began October 1.
It’s natural for investors to be concerned by the situation in Washington. But as Sarah Hammer, a senior analyst in Vanguard Investment Strategy Group, noted in the midst of the temporary shutdown, they shouldn’t be unduly influenced by these events. “Investors are often best served by sticking to their long-term investment plans and avoiding short-term decisions based on the legislative outlook,” Ms. Hammer said. Our recurrent advice to stick to your plan may lack pizzazz, but it’s proven to be sound counsel over the decades.
| Expense Ratios | ||
| Your Fund Compared With Its Peer Group | ||
| Peer Group | ||
| Fund | Average | |
| Growth Equity Fund | 0.54% | 1.28% |
The fund expense ratio shown is from the prospectus dated January 25, 2013, and represents estimated costs for the current fiscal year. For the fiscal year ended September 30, 2013, the fund’s expense ratio was 0.52%. The peer-group expense ratio is derived from data provided by Lipper, a Thomson Reuters Company, and captures information through year-end 2012.
Peer group: Large-Cap Growth Funds.
4
International stocks generally posted strong results. Emerging-market stocks, however, lagged amid worries about slowing economic growth.
Bond returns were negative despite September’s bounce
Investor concern about the Fed’s potential scaling back of its bond-buying program also affected the performance of bonds, which posted declines for the year. In September, however, bonds trimmed their losses after the Fed said it would continue the purchases.
The broad U.S. taxable bond market returned –1.68% for the fiscal year, and the yield of the 10-year Treasury note closed at 2.63%, down from 2.76% a month earlier. (Bond yields and prices move in opposite directions.) Municipal bonds returned –2.21% after rebounding a bit in September.
Money markets and savings accounts barely budged as the Fed’s target for short-term interest rates remained at 0%–0.25%.
| Total Returns | |
| Ten Years Ended September 30, 2013 | |
| Average | |
| Annual Return | |
| Growth Equity Fund | 6.44% |
| Russell 1000 Growth Index | 7.82 |
| Large-Cap Growth Funds Average | 6.66 |
| Large-Cap Growth Funds Average: Derived from data provided by Lipper, a Thomson Reuters Company. |
The figures shown represent past performance, which is not a guarantee of future results. (Current performance may be lower or higher than the performance data cited. For performance data current to the most recent month-end, visit our website at vanguard.com/performance.) Note, too, that both investment returns and principal value can fluctuate widely, so an investor’s shares, when sold, could be worth more or less than their original cost.
5
Gains across all nine sectors powered Growth Equity’s advance
Vanguard Growth Equity Fund invests in mid- and large-cap stocks that have the potential to grow at an above-average pace. The fund’s two investment advisors, Jennison Associates LLC and Baillie Gifford Overseas Ltd., use different but complementary approaches to manage independent subportfolios.
In the most recent fiscal year, the fund again performed well, returning nearly 20%. The most significant contributors were companies in the consumer discretionary sector, the fund’s third-largest, on average. The advisors’ selections returned about 41%—nine percentage points higher than their counterparts in the index—as resilient U.S. consumers continued to play a key role in sustaining the nation’s modest recovery. Internet-based retailers and specialty stores, such as those selling automotive parts, apparel, and home improvement products, were especially strong performers.
The financial sector was another standout for the fund. The advisors’ decision to allocate more assets to commercial banks, insurance companies, and investment banks than in the index paid off. The fund’s holdings in consumer staples also outperformed the index’s stocks in that sector, but by a smaller margin.
Information technology stocks, which make up the largest sector in the fund (about 25% of assets, on average), returned a modest 6%, a notch above IT stocks in the index.
Health care and energy were two notable underperforming sectors, although both had double-digit returns. The fund’s health care holdings rose (26%) but not as much as those in the index (33%). The advisors’ energy selections returned 12%, but lagged their index counterparts by 15 percentage points, as gas and oil-related stocks disappointed.
The fund’s advisory team will join one with a solid record
For the ten years ended September 30, 2013, the average annual return for the Growth Equity Fund was 6.44%, below the average annual returns of its benchmark index and its peers.
The fund’s two advisors, which joined Growth Equity about five years ago, will become part of an experienced advisory team at Vanguard U.S. Growth Fund when the fund merger is completed. Delaware Investments Fund Advisers and Wellington Management Company llp have advised U.S. Growth since 2010, and William Blair & Company, L.L.C., has been an advisor since 2004. Together they have compiled a solid record in the three years since they have been overseeing separately managed portfolios for U.S. Growth.
6
We are confident that the five advisors who will manage the U.S. Growth Fund after the merger will serve our shareholders well in the years to come. It’s important to note that the merged fund’s bottom line will be
helped by its low investment costs, which allow you to retain a larger proportion of fund returns.
| Investment insight | |
| Don’t let a trick of the calendar alter your course | |
| When making investment decisions, it’s important to weigh past returns with caution. | |
| That’s because investment returns from any particular period are an unreliable anchor | |
| for gauging the future. They can be highly date-dependent. | |
| For example, take the five-year average annual return for the broad U.S. stock | |
| market. That average just made a startling bounce: from 1.30% for the period | |
| ended September 30, 2012, to 10.58% for the period ended September 30, 2013. | |
| True, the market returned a hearty 21.60% in the most recent 12 months, but that��s | |
| not enough to explain such a big leap in the average. Significantly, the year ended | |
| September 30, 2008––when U.S. stocks returned –21.52% during the financial | |
| crisis––has now rolled off the five-year calculation. | |
| The important thing to remember is that historical returns are just that: historical. | |
| Basing investment decisions on such date-dependent snapshots could easily lead | |
| you to alter course––possibly in the wrong direction. Instead, Vanguard believes, you | |
| should build your asset allocation strategy on long-term risk-and-return relationships, | |
| always recognizing that no level of return is guaranteed. | |
| Which five-year average should you count on? | |
| (Answer: None of them!) | |
| Average annual returns for U.S. stocks over five-year periods ended September 30 | |
| 2007 | 16.18% |
| 2008 | 5.70 |
| 2009 | 1.56 |
| 2010 | 0.92 |
| 2011 | –0.92 |
| 2012 | 1.30 |
| 2013 | 10.58 |
| Note: The U.S. stock market is represented by the Russell 3000 Index. | |
| Source: Vanguard. | |
7
Benefits of combining low costs with diversity of thought
Investors sometimes ask why Vanguard uses a multi-advisor approach for many of its actively managed equity funds. Just as we recommend diversification within and across asset classes for an investor’s overall portfolio, we think significant benefits can accrue from using multiple advisory firms for a single fund: diversity of investment process and style, thought, and holdings.
All of these elements can lead to less risk and better results. Because not all investment managers invest the same way, their returns relative to the benchmark don’t move in lockstep.
As with many investment topics, however, there are some misconceptions about the benefits of using a multi-manager approach. For example, it is often suggested that the best ideas of the advisors are diluted when they are combined in one portfolio. Recent Vanguard research has found otherwise.
Conventional wisdom also suggests that multi-manager funds tend to be expensive. At Vanguard, this is not the case: Low costs are a hallmark of all our offerings. And Vanguard research indicates that low costs can contribute greatly to investing success, helping investors keep more of a portfolio’s return. (You can read more in Analyzing Multi-Manager Funds: Does Management Structure Affect Performance? at vanguard.com/research.)
As always, thank you for investing with Vanguard.
Sincerely,

F. William McNabb III
Chairman and Chief Executive Officer
October 17, 2013
8
Advisors’ Report
For the fiscal year ended September 30, 2013, Vanguard Growth Equity Fund returned 19.82%. Your fund is managed by two independent advisors, a strategy that enhances the fund’s diversification by providing exposure to distinct, yet complementary, investment approaches. It’s not uncommon for different advisors to have different views about individual securities or the broader investment environment.
The advisors, the percentage of fund assets each manages, and brief descriptions of their investment strategies are presented in the table below. The advisors have also prepared a discussion of the investment environment that existed during the period and of how portfolio positioning reflects this assessment. These comments were prepared on October 21, 2013.
Jennison Associates LLC
Portfolio Manager:
Kathleen A. McCarragher, Managing Director
The U.S. equity market advanced strongly in the 12 months ended September 30, 2013, but with bouts of volatility, as sentiment vacillated based on short-term data. The lingering economic malaise in Europe and political inertia preceding the U.S. presidential election in November contributed to a downturn early in the period. Subsequent concerns about the reinstatement of the full Social Security payroll tax, increased tax rates on higher
Vanguard Growth Equity Fund Investment Advisors
| Fund Assets Managed | |||
| Investment Advisor | % | $ Million | Investment Strategy |
| Jennison Associates LLC | 49 | 361 | Uses a research-driven, fundamental investment |
| approach that relies on in-depth company knowledge | |||
| gleaned through meetings with management, | |||
| customers, and suppliers. | |||
| Baillie Gifford Overseas Ltd. | 48 | 354 | Uses a fundamental approach to identify quality growth |
| companies. The firm considers the sustainability of | |||
| earnings growth to be a critical factor in evaluating a | |||
| company’s prospects. The firm looks for companies | |||
| with attractive industry backgrounds, strong | |||
| competitive positions within those industries, | |||
| high-quality earnings, and a favorable attitude toward | |||
| shareholders. | |||
| Cash Investments | 3 | 23 | These short-term reserves are invested by Vanguard in |
| equity index products to simulate investment in stocks. | |||
| Each advisor also may maintain a modest cash | |||
| position. | |||
9
incomes, and across-the-board federal spending cuts stalled advances temporarily.
Investors eventually seemed to shrug off these fears, focusing instead on improving housing and employment data, rising consumer confidence, and continued strength in corporate profits. In early summer, China’s slowdown and Europe’s ongoing issues led to a moderation of global growth and to market volatility, as did concerns that the Federal Reserve would begin scaling back its quantitative easing program. By September, however, investors, who had preferred higher-yielding bond substitutes, showed a greater willingness to ascribe higher valuations to companies with attractive growth potential.
Portfolio holdings in consumer discretionary and health care were strong contributors to returns but lagged their counterparts in the benchmark. Overweight positions in both areas were beneficial. In consumer discretionary, the decline of Lululemon, the apparel and accessories retailer, had the effect of tempering strong advances in Nike and TJX. We eliminated the portfolio’s position in Lululemon after a second product recall and the departure of the chief executive officer, which raised questions about execution and leadership during a period of transition.
Nike reported impressive earnings, revenue, gross margins, and future orders, reinforcing our conviction in the momentum of the Nike brand around the world and across product categories.
Off-price retailer TJX reported strong revenue and earnings and broad-based momentum across all of its businesses. We expect the company’s earnings growth to be driven by same-store sales growth, new-store openings, operating margin expansion, and share repurchases.
In health care, Express Scripts’ dip effectively moderated strong gains in Gilead Sciences, Biogen Idec, and Vertex Pharmaceuticals. Concerns about enrollment trends and the effect of health care reform hampered Express Scripts, a pharmacy benefits manager. We continue to like the pharmacy benefits management industry, which we believe is positioned to benefit from an aging population that uses more prescription drugs.
Gilead Sciences reported strong revenue and earnings. We like its opportunities in the hepatitis C virus market and leading position in HIV treatment, where pipeline drugs look promising.
The Food and Drug Administration approved Biogen’s Tecfidera for the treatment of multiple sclerosis. We believe its ease of use could support broad adoption and potential market leadership. The drug may also eventually be used to treat other neurodegenerative diseases such as ALS and Parkinson’s.
10
Vertex Pharmaceuticals’ Kalydeco is the first medicine to treat the underlying cause of cystic fibrosis. Promising data from ongoing studies of Kalydeco in combination with other Vertex drugs suggest a potentially significant expansion of the company’s cystic fibrosis market.
Our information technology holdings outperformed those in the benchmark sector, with strong gains in LinkedIn and Facebook outpacing declines in Apple and VMware.
LinkedIn’s revenue and earnings exceeded consensus expectations significantly. The company is a leading global online professional network that provides what we consider unique access to a scalable database of active and passive job candidates. Marketing services and professional publishing are in early phases of development and could provide added growth opportunities.
Apple was hurt by slowing revenue growth and lowered earnings projections. We believe recent product launches can revive its growth outlook.
VMware was hurt by uncertainty about when revenue related to new products will accelerate. The new software products, which will replace hardware in the data center, are designed to protect and expand the company’s dominant position in the market for virtualized servers.
The portfolio continues to hold stocks of companies we believe have above-average growth prospects at reasonable valuations.
Baillie Gifford Overseas Ltd.
Portfolio Manager:
Mick Brewis, Partner and Head of North American Investment Team The last 12 months can be divided into two periods; the turning point was in May, when Federal Reserve Chairman Ben Bernanke first mentioned a potential tapering of the Fed’s quantitative easing program. Before this, stock markets were rising mainly in the belief that the Fed’s monetary policy would remain accommodative for the foreseeable future. Since May, equities have been more volatile, and the focus has been on the prospect of a reduction in the Fed’s stimulus program, although the Fed has backtracked some from its statements about scaling back.
The dilemma for policymakers is that the overall economic recovery appears to be tepid rather than rapid, but we would point to the contrast between the public and private sectors. The public sector has been affected by sequester-related fiscal drag, and the deadlock in Congress is hardly an example of smooth economic management. In contrast, the improving housing market and better auto sales have provided evidence of a decent level of private sector growth that should be robust enough to withstand rising long-term interest rates.
11
Although we monitor the ebb and flow of the economy, we select companies for the portfolio based on the attractiveness of specific stocks. At present a number of sector-related trends offer meaningful growth opportunities and give us confidence in the outlook for several of the fund’s holdings. In the energy sector, for example, technological improvements continue to drive investment in unconventional assets, while robotics and factory automation are spurring growth in the industrial sector. The ever-expanding online economy and increasing prevalence of mobile commerce are combining to create a data explosion that in turn is leading to increased telecom capital spending.
In the medical sphere, improving R&D productivity among pharmaceutical companies has led us to make new investments in Johnson & Johnson and Pfizer, which both have excellent prospects for drug development and are better managed than in the recent past. While these purchases are in well-established health care companies, we have also made initial investments in Seattle Genetics and Genomic Health. Seattle is an early-stage biotechnology company whose first drug, Adcetris, has had considerable success in fighting blood cancers. Genomic is a molecular diagnostics company that sells tests for cancer that enable personalized treatment.
Elsewhere, we established a holding in Google, whose relentless innovation means its dominance in desktop internet search should extend to the mobile internet, providing years of growth. In contrast, we sold our position in Apple early in 2013, because we think that intensifying competitive pressures, leading to a diminishing gap between Apple’s products and those of other smartphone providers, mean the company’s margins have started a long-term decline.
Several holdings are generating company-specific growth, at least partly because exceptional management teams are gaining market share through tremendous customer service and product quality. First Republic Bank and Harley-Davidson are examples, and we added to both during the year.
In a low-growth global economy, the companies that should fare best are those with strong management, durable competitive advantages, financial flexibility, and idiosyncratic, sustainable long-term growth prospects, and investing in such stocks remains our focus.
12
Growth Equity Fund
Fund Profile
As of September 30, 2013
| Portfolio Characteristics | |||
| Russell | DJ U.S. | ||
| 1000 | Total | ||
| Growth | Market | ||
| Fund | Index | FA Index | |
| Number of Stocks | 87 | 610 | 3,636 |
| Median Market Cap | $33.4B | $51.8B | $40.2B |
| Price/Earnings Ratio | 25.2x | 21.9x | 19.5x |
| Price/Book Ratio | 3.5x | 4.8x | 2.5x |
| Return on Equity | 21.0% | 22.6% | 16.5% |
| Earnings Growth Rate | 15.7% | 15.1% | 11.1% |
| Dividend Yield | 1.0% | 1.7% | 1.9% |
| Foreign Holdings | 6.4% | 0.0% | 0.0% |
| Turnover Rate | 36% | — | — |
| Ticker Symbol | VGEQX | — | — |
| Expense Ratio1 | 0.54% | — | — |
| 30-Day SEC Yield | 0.43% | — | — |
| Short-Term Reserves | 1.3% | — | — |
| Sector Diversification (% of equity exposure) | |||
| DJ U.S. | |||
| Russell | Total | ||
| 1000 | Market | ||
| Growth | FA | ||
| Fund | Index | Index | |
| Consumer Discretionary 16.9% | 20.0% | 13.3% | |
| Consumer Staples | 8.6 | 12.3 | 8.7 |
| Energy | 6.5 | 4.8 | 9.6 |
| Financials | 14.7 | 5.3 | 17.3 |
| Health Care | 18.5 | 12.2 | 12.6 |
| Industrials | 9.5 | 12.2 | 11.4 |
| Information Technology 22.2 | 26.5 | 17.9 | |
| Materials | 2.2 | 4.5 | 3.8 |
| Telecommunication | |||
| Services | 0.8 | 2.0 | 2.2 |
| Utilities | 0.1 | 0.2 | 3.2 |
| Volatility Measures | ||
| DJ U.S. | ||
| Russell 1000 | Total Market | |
| Growth Index | FA Index | |
| R-Squared | 0.96 | 0.92 |
| Beta | 1.02 | 0.96 |
| These measures show the degree and timing of the fund’s fluctuations compared with the indexes over 36 months. | ||
| Ten Largest Holdings (% of total net assets) | ||
| Google Inc. | Internet Software & | |
| Services | 3.8% | |
| Johnson & Johnson | Pharmaceuticals | 2.6 |
| eBay Inc. | Internet Software & | |
| Services | 2.5 | |
| First Republic Bank | Regional Banks | 2.4 |
| Progressive Corp. | Property & Casualty | |
| Insurance | 2.3 | |
| US Bancorp | Diversified Banks | 2.1 |
| Apple Inc. | Computer Hardware | 2.1 |
| Watsco Inc. | Trading Companies & | |
| Distributors | 1.9 | |
| Pfizer Inc. | Pharmaceuticals | 1.9 |
| Berkshire Hathaway Inc. Multi-Sector Holdings | 1.9 | |
| Top Ten | 23.5% | |
| The holdings listed exclude any temporary cash investments and equity index products. | ||
Investment Focus
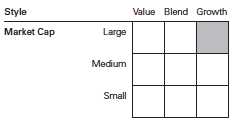
1 The expense ratio shown is from the prospectus dated January 25, 2013, and represents estimated costs for the current fiscal year. For the fiscal year ended September 30, 2013, the expense ratio was 0.52%.
13
Growth Equity Fund
Performance Summary
All of the returns in this report represent past performance, which is not a guarantee of future results that may be achieved by the fund. (Current performance may be lower or higher than the performance data cited. For performance data current to the most recent month-end, visit our website at vanguard.com/performance.) Note, too, that both investment returns and principal value can fluctuate widely, so an investor’s shares, when sold, could be worth more or less than their original cost. The returns shown do not reflect taxes that a shareholder would pay on fund distributions or on the sale of fund shares.
Cumulative Performance: September 30, 2003, Through September 30, 2013
Initial Investment of $10,000
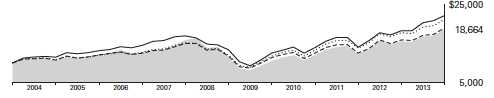
| Average Annual Total Returns | |||||
| Periods Ended September 30, 2013 | |||||
| Final Value | |||||
| One | Five | Ten | of a $10,000 | ||
| Year | Years | Years | Investment | ||
| Growth Equity Fund* | 19.82% | 10.32% | 6.44% | $18,664 | |
| •••••••• | Russell 1000 Growth Index | 19.27 | 12.07 | 7.82 | 21,241 |
| – – – – | Large-Cap Growth Funds Average | 19.58 | 10.19 | 6.66 | 19,061 |
| Dow Jones U.S. Total Stock Market | |||||
| Float Adjusted Index | 21.44 | 10.69 | 8.32 | 22,235 | |
| Large-Cap Growth Funds Average: Derived from data provided by Lipper, a Thomson Reuters Company. | |||||
See Financial Highlights for dividend and capital gains information.
14
Growth Equity Fund
Fiscal-Year Total Returns (%): September 30, 2003, Through September 30, 2013
15
Growth Equity Fund
Financial Statements
Statement of Net Assets
As of September 30, 2013
The fund reports a complete list of its holdings in regulatory filings four times in each fiscal year, at the quarter-ends. For the second and fourth fiscal quarters, the lists appear in the fund’s semiannual and annual reports to shareholders. For the first and third fiscal quarters, the fund files the lists with the Securities and Exchange Commission on Form N-Q. Shareholders can look up the fund’s Forms N-Q on the SEC’s website at sec.gov. Forms N-Q may also be reviewed and copied at the SEC’s Public Reference Room (see the back cover of this report for further information).
| Market | |||
| Value | |||
| Shares | ($000) | ||
| Common Stocks (96.1%)1 | |||
| Consumer Discretionary (16.4%) | |||
| Harley-Davidson Inc. | 195,791 | 12,578 | |
| * | Amazon.com Inc. | 38,418 | 12,011 |
| TJX Cos. Inc. | 204,069 | 11,508 | |
| * | Michael Kors Holdings Ltd. | 141,642 | 10,555 |
| NIKE Inc. Class B | 137,408 | 9,981 | |
| Inditex SA ADR | 272,482 | 8,406 | |
| Ralph Lauren Corp. Class A | 48,251 | 7,948 | |
| * | TripAdvisor Inc. | 94,177 | 7,142 |
| * | priceline.com Inc. | 6,964 | 7,040 |
| * | CarMax Inc. | 113,739 | 5,513 |
| Luxottica Group SPA ADR | 94,542 | 4,970 | |
| * | Netflix Inc. | 14,118 | 4,366 |
| Starbucks Corp. | 49,529 | 3,812 | |
| Prada SPA | 388,535 | 3,774 | |
| Home Depot Inc. | 44,920 | 3,407 | |
| * | ASOS plc ADR | 37,603 | 3,178 |
| * | O’Reilly Automotive Inc. | 24,701 | 3,152 |
| Burberry Group plc | 71,701 | 1,897 | |
| 121,238 | |||
| Consumer Staples (8.2%) | |||
| Whole Foods Market Inc. | 205,969 | 12,049 | |
| Brown-Forman Corp. | |||
| Class B | 172,455 | 11,749 | |
| Colgate-Palmolive Co. | 144,384 | 8,562 | |
| Costco Wholesale Corp. | 70,279 | 8,091 | |
| Beam Inc. | 106,390 | 6,878 | |
| Estee Lauder Cos. Inc. | |||
| Class A | 98,239 | 6,867 | |
| Kraft Foods Group Inc. | 121,820 | 6,388 | |
| * | Sprouts Farmers Market Inc. | 3,732 | 166 |
| 60,750 | |||
| Energy (6.1%) | |||
| EOG Resources Inc. | 64,138 | 10,857 | |
| Apache Corp. | 112,804 | 9,604 | |
| Exxon Mobil Corp. | 110,970 | 9,548 | |
| Noble Energy Inc. | 127,569 | 8,549 | |
| Schlumberger Ltd. | 76,916 | 6,796 | |
| 45,354 | |||
| Market | |||
| Value | |||
| Shares | ($000) | ||
| Financials (14.1%) | |||
| First Republic Bank | 381,993 | 17,812 | |
| Progressive Corp. | 611,124 | 16,641 | |
| US Bancorp | 431,675 | 15,791 | |
| * | Berkshire Hathaway Inc. | ||
| Class B | 124,016 | 14,077 | |
| M&T Bank Corp. | 83,528 | 9,348 | |
| Fairfax Financial Holdings | |||
| Ltd. | 21,120 | 8,541 | |
| Goldman Sachs Group Inc. | 51,918 | 8,214 | |
| Morgan Stanley | 268,937 | 7,248 | |
| * | Markel Corp. | 12,100 | 6,265 |
| 103,937 | |||
| Health Care (17.9%) | |||
| Johnson & Johnson | 221,960 | 19,242 | |
| Pfizer Inc. | 494,210 | 14,189 | |
| * | Gilead Sciences Inc. | 184,462 | 11,592 |
| * | Biogen Idec Inc. | 46,999 | 11,315 |
| * | Life Technologies Corp. | 126,142 | 9,439 |
| * | Express Scripts Holding | ||
| Co. | 137,003 | 8,464 | |
| * | Vertex Pharmaceuticals | ||
| Inc. | 108,650 | 8,238 | |
| Novo Nordisk A/S ADR | 39,399 | 6,667 | |
| * | Alexion Pharmaceuticals | ||
| Inc. | 56,196 | 6,528 | |
| Allergan Inc. | 69,398 | 6,277 | |
| Bristol-Myers Squibb Co. | 127,864 | 5,917 | |
| * | Seattle Genetics Inc. | 130,730 | 5,730 |
| * | BioMarin Pharmaceutical | ||
| Inc. | 53,486 | 3,863 | |
| * | Waters Corp. | 35,404 | 3,760 |
| * | IDEXX Laboratories Inc. | 35,019 | 3,490 |
| * | Genomic Health Inc. | 106,620 | 3,260 |
| Shire plc ADR | 26,308 | 3,154 | |
| Essilor International SA | 10,506 | 1,130 | |
| 132,255 | |||
| Industrials (9.1%) | |||
| Watsco Inc. | 150,600 | 14,197 | |
| United Parcel Service Inc. | |||
| Class B | 153,405 | 14,017 | |
16
| Growth Equity Fund | |||
| Market | |||
| Value | |||
| Shares | ($000) | ||
| Danaher Corp. | 131,208 | 9,095 | |
| Precision Castparts Corp. | 36,992 | 8,406 | |
| TransDigm Group Inc. | 55,337 | 7,675 | |
| ^ | Canadian Pacific Railway | ||
| Ltd. | 42,403 | 5,228 | |
| AMETEK Inc. | 108,781 | 5,006 | |
| Rockwell Automation Inc. | 31,189 | 3,336 | |
| 66,960 | |||
| Information Technology (21.5%) | |||
| * | Google Inc. Class A | 32,135 | 28,147 |
| * | eBay Inc. | 329,156 | 18,364 |
| Apple Inc. | 32,785 | 15,630 | |
| Mastercard Inc. Class A | 19,886 | 13,379 | |
| * | LinkedIn Corp. Class A | 51,830 | 12,753 |
| * | Facebook Inc. Class A | 155,948 | 7,835 |
| Analog Devices Inc. | 166,520 | 7,835 | |
| * | Salesforce.com Inc. | 129,312 | 6,713 |
| * | VMware Inc. Class A | 81,245 | 6,573 |
| * | Red Hat Inc. | 138,786 | 6,404 |
| EMC Corp. | 248,483 | 6,351 | |
| * | F5 Networks Inc. | 56,939 | 4,883 |
| Linear Technology Corp. | 117,347 | 4,654 | |
| Altera Corp. | 119,961 | 4,458 | |
| Xilinx Inc. | 94,530 | 4,430 | |
| * | Workday Inc. Class A | 53,435 | 4,324 |
| * | FleetCor Technologies Inc. | 28,055 | 3,090 |
| * | Teradata Corp. | 47,437 | 2,630 |
| 158,453 | |||
| Materials (2.1%) | |||
| Monsanto Co. | 117,560 | 12,270 | |
| Martin Marietta Materials | |||
| Inc. | 32,610 | 3,201 | |
| 15,471 | |||
| Market | ||
| Value | ||
| Shares | ($000) | |
| Telecommunication Services (0.7%) | ||
| * SBA Communications Corp. | ||
| Class A | 66,009 | 5,311 |
| Total Common Stocks | ||
| (Cost $542,169) | 709,729 | |
| Temporary Cash Investments (5.0%)1 | ||
| Money Market Fund (4.8%) | ||
| 2,3 Vanguard Market Liquidity | ||
| Fund, 0.112% | 35,478,028 | 35,478 |
| Face | ||
| Amount | ||
| ($000) | ||
| U.S. Government and Agency Obligations (0.2%) | ||
| 4,5 Freddie Mac Discount | ||
| Notes, 0.063%, 3/17/14 | 1,300 | 1,299 |
| Total Temporary Cash Investments | ||
| (Cost $36,778) | 36,777 | |
| Total Investments (101.1%) | ||
| (Cost $578,947) | 746,506 | |
| Other Assets and Liabilities (-1.1%) | ||
| Other Assets | 2,510 | |
| Liabilities3 | (10,609) | |
| (8,099) | ||
| Net Assets (100%) | ||
| Applicable to 49,700,698 outstanding | ||
| $.001 par value shares of beneficial | ||
| interest (unlimited authorization) | 738,407 | |
| Net Asset Value Per Share | $14.86 | |
17
Growth Equity Fund
| At September 30, 2013, net assets consisted of: | |
| Amount | |
| ($000) | |
| Paid-in Capital | 630,023 |
| Undistributed Net Investment Income | 938 |
| Accumulated Net Realized Losses | (59,892) |
| Unrealized Appreciation (Depreciation) | |
| Investment Securities | 167,559 |
| Futures Contracts | (217) |
| Foreign Currencies | (4) |
| Net Assets | 738,407 |
See Note A in Notes to Financial Statements.
* Non-income-producing security.
^ Part of security position is on loan to broker-dealers. The total value of securities on loan is $4,957,000.
1 The fund invests a portion of its cash reserves in equity markets through the use of index futures contracts. After giving effect to futures investments, the fund’s effective common stock and temporary cash investment positions represent 99.1% and 2.0%, respectively, of net assets.
2 Affiliated money market fund available only to Vanguard funds and certain trusts and accounts managed by Vanguard. Rate shown is the 7-day yield.
3 Includes $5,146,000 of collateral received for securities on loan.
4 The issuer was placed under federal conservatorship in September 2008; since that time, its daily operations have been managed by the Federal Housing Finance Agency and it receives capital from the U.S. Treasury, as needed to maintain a positive net worth, in exchange for senior preferred stock.
5 Securities with a value of $1,199,000 have been segregated as initial margin for open futures contracts.
ADR—American Depositary Receipt.
See accompanying Notes, which are an integral part of the Financial Statements.
18
| Growth Equity Fund | |
| Statement of Operations | |
| Year Ended | |
| September 30, 2013 | |
| ($000) | |
| Investment Income | |
| Income | |
| Dividends1 | 11,024 |
| Interest2 | 50 |
| Securities Lending | 174 |
| Total Income | 11,248 |
| Expenses | |
| Investment Advisory Fees—Note B | |
| Basic Fee | 1,726 |
| Performance Adjustment | (334) |
| The Vanguard Group—Note C | |
| Management and Administrative | 2,212 |
| Marketing and Distribution | 135 |
| Custodian Fees | 28 |
| Auditing Fees | 26 |
| Shareholders’ Reports | 18 |
| Trustees’ Fees and Expenses | 3 |
| Total Expenses | 3,814 |
| Expenses Paid Indirectly | (19) |
| Net Expenses | 3,795 |
| Net Investment Income | 7,453 |
| Realized Net Gain (Loss) | |
| Investment Securities Sold | 98,064 |
| Futures Contracts | 4,313 |
| Foreign Currencies | (10) |
| Realized Net Gain (Loss) | 102,367 |
| Change in Unrealized Appreciation (Depreciation) | |
| Investment Securities | 21,701 |
| Futures Contracts | 16 |
| Foreign Currencies | (4) |
| Change in Unrealized Appreciation (Depreciation) | 21,713 |
| Net Increase (Decrease) in Net Assets Resulting from Operations | 131,533 |
| 1 Dividends are net of foreign withholding taxes of $81,000. | |
| 2 Interest income from an affiliated company of the fund was $44,000. | |
See accompanying Notes, which are an integral part of the Financial Statements.
19
| Growth Equity Fund | ||
| Statement of Changes in Net Assets | ||
| Year Ended September 30, | ||
| 2013 | 2012 | |
| ($000) | ($000) | |
| Increase (Decrease) in Net Assets | ||
| Operations | ||
| Net Investment Income | 7,453 | 3,565 |
| Realized Net Gain (Loss) | 102,367 | 39,049 |
| Change in Unrealized Appreciation (Depreciation) | 21,713 | 112,420 |
| Net Increase (Decrease) in Net Assets Resulting from Operations | 131,533 | 155,034 |
| Distributions | ||
| Net Investment Income | (7,387) | (3,035) |
| Realized Capital Gain | — | — |
| Total Distributions | (7,387) | (3,035) |
| Capital Share Transactions | ||
| Issued | 109,102 | 184,615 |
| Issued in Lieu of Cash Distributions | 7,168 | 2,957 |
| Redeemed | (248,598) | (172,298) |
| Net Increase (Decrease) from Capital Share Transactions | (132,328) | 15,274 |
| Total Increase (Decrease) | (8,182) | 167,273 |
| Net Assets | ||
| Beginning of Period | 746,589 | 579,316 |
| End of Period1 | 738,407 | 746,589 |
| 1 Net Assets—End of Period includes undistributed net investment income of $938,000 and $882,000. | ||
See accompanying Notes, which are an integral part of the Financial Statements.
20
| Growth Equity Fund | |||||
| Financial Highlights | |||||
| For a Share Outstanding | Year Ended September 30, | ||||
| Throughout Each Period | 2013 | 2012 | 2011 | 2010 | 2009 |
| Net Asset Value, Beginning of Period | $12.53 | $9.93 | $9.77 | $8.60 | $9.46 |
| Investment Operations | |||||
| Net Investment Income | .1311 | .061 | .067 | .062 | .085 |
| Net Realized and Unrealized Gain (Loss) | |||||
| on Investments | 2.326 | 2.591 | .168 | 1.183 | (.883) |
| Total from Investment Operations | 2.457 | 2.652 | .235 | 1.245 | (.798) |
| Distributions | |||||
| Dividends from Net Investment Income | (.127) | (. 052) | (. 075) | (.075) | (.062) |
| Distributions from Realized Capital Gains | — | — | — | — | — |
| Total Distributions | (.127) | (. 052) | (. 075) | (.075) | (.062) |
| Net Asset Value, End of Period | $14.86 | $12.53 | $9.93 | $9.77 | $8.60 |
| Total Return2 | 19.82% | 26.80% | 2.35% | 14.54% | -8.25% |
| Ratios/Supplemental Data | |||||
| Net Assets, End of Period (Millions) | $738 | $747 | $579 | $597 | $594 |
| Ratio of Total Expenses to Average Net Assets3 | 0.52% | 0.54% | 0.52% | 0.51% | 0.51% |
| Ratio of Net Investment Income to | |||||
| Average Net Assets | 1.01%1 | 0.51% | 0.60% | 0.66% | 1.10% |
| Portfolio Turnover Rate | 36% | 40% | 44% | 48% | 98% |
1 Net investment income per share and the ratio of net investment income to average net assets include $.013 and 0.10%, respectively, resulting from a special dividend from Brown-Forman Corp. in December 2012.
2 Total returns do not include account service fees that may have applied in the periods shown. Fund prospectuses provide information about any applicable account service fees.
3 Includes performance-based investment advisory fee increases (decreases) of (0.05%), (0.02%), (0.05%), (0.06%), and (0.09%).
See accompanying Notes, which are an integral part of the Financial Statements.
21
Growth Equity Fund
Notes to Financial Statements
Vanguard Growth Equity Fund is registered under the Investment Company Act of 1940 as an open-end investment company, or mutual fund.
A. The following significant accounting policies conform to generally accepted accounting principles for U.S. mutual funds. The fund consistently follows such policies in preparing its financial statements.
1. Security Valuation: Securities are valued as of the close of trading on the New York Stock Exchange (generally 4 p.m., Eastern time) on the valuation date. Equity securities are valued at the latest quoted sales prices or official closing prices taken from the primary market in which each security trades; such securities not traded on the valuation date are valued at the mean of the latest quoted bid and asked prices. Securities for which market quotations are not readily available, or whose values have been affected by events occurring before the fund’s pricing time but after the close of the securities’ primary markets, are valued at their fair values calculated according to procedures adopted by the board of trustees. These procedures include obtaining quotations from an independent pricing service, monitoring news to identify significant market- or security-specific events, and evaluating changes in the values of foreign market proxies (for example, ADRs, futures contracts, or exchange-traded funds), between the time the foreign markets close and the fund’s pricing time. When fair-value pricing is employed, the prices of securities used by a fund to calculate its net asset value may differ from quoted or published prices for the same securities. Investments in Vanguard Market Liquidity Fund are valued at that fund’s net asset value. Temporary cash investments acquired over 60 days to maturity are valued using the latest bid prices or using valuations based on a matrix system (which considers such factors as security prices, yields, maturities, and ratings), both as furnished by independent pricing services. Other temporary cash investments are valued at amortized cost, which approximates market value.
2. Foreign Currency: Securities and other assets and liabilities denominated in foreign currencies are translated into U.S. dollars using exchange rates obtained from an independent third party as of the fund’s pricing time on the valuation date. Realized gains (losses) and unrealized appreciation (depreciation) on investment securities include the effects of changes in exchange rates since the securities were purchased, combined with the effects of changes in security prices. Fluctuations in the value of other assets and liabilities resulting from changes in exchange rates are recorded as unrealized foreign currency gains (losses) until the assets or liabilities are settled in cash, at which time they are recorded as realized foreign currency gains (losses).
3. Futures Contracts: The fund may use index futures contracts to a limited extent, with the objective of maintaining full exposure to the stock market while maintaining liquidity. The fund may purchase or sell futures contracts to achieve a desired level of investment, whether to accommodate portfolio turnover or cash flows from capital share transactions. The primary risks associated with the use of futures contracts are imperfect correlation between changes in market values of stocks held by the fund and the prices of futures contracts, and the possibility of an illiquid market. Counterparty risk involving futures is mitigated because a regulated clearinghouse is the counterparty instead of the clearing broker. To further mitigate counterparty risk, the fund trades futures contracts on an exchange, monitors the financial strength of its clearing brokers and clearinghouse, and has entered into clearing agreements with its clearing brokers. The clearinghouse imposes initial margin requirements to secure the fund’s performance and requires daily settlement of variation margin representing changes in the market value of each contract.
22
Growth Equity Fund
Futures contracts are valued at their quoted daily settlement prices. The aggregate notional amounts of the contracts are not recorded in the Statement of Net Assets. Fluctuations in the value of the contracts are recorded in the Statement of Net Assets as an asset (liability) and in the Statement of Operations as unrealized appreciation (depreciation) until the contracts are closed, when they are recorded as realized futures gains (losses).
During the year ended September 30, 2013, the fund’s average investments in long and short futures contracts represented 4% and 0% of net assets, respectively, based on quarterly average aggregate settlement values.
4. Federal Income Taxes: The fund intends to continue to qualify as a regulated investment company and distribute all of its taxable income. Management has analyzed the fund’s tax positions taken for all open federal income tax years (September 30, 2010–2013), and has concluded that no provision for federal income tax is required in the fund’s financial statements.
5. Distributions: Distributions to shareholders are recorded on the ex-dividend date.
6. Securities Lending: To earn additional income, the fund may lend its securities to qualified institutional borrowers. Security loans are required to be secured at all times by collateral in an amount at least equal to the market value of securities loaned. Daily market fluctuations could cause the value of loaned securities to be more or less than the value of the collateral received. When this occurs, the collateral is adjusted and settled on the next business day. The fund further mitigates its counterparty risk by entering into securities lending transactions only with a diverse group of prequalified counterparties, monitoring their financial strength, and entering into master securities lending agreements with its counterparties. The master securities lending agreements provide that, in the event of a counterparty’s default (including bankruptcy), the fund may terminate any loans with that borrower, determine the net amount owed, and sell or retain the collateral up to the net amount owed to the fund; however, such actions may be subject to legal proceedings. While collateral mitigates counterparty risk, in the absence of a default the fund may experience delays and costs in recovering the securities loaned. The fund invests cash collateral received in Vanguard Market Liquidity Fund, and records a liability for the return of the collateral, during the period the securities are on loan. Securities lending income represents fees charged to borrowers plus income earned on invested cash collateral, less expenses associated with the loan.
7. Other: Dividend income is recorded on the ex-dividend date. Interest income includes income distributions received from Vanguard Market Liquidity Fund and is accrued daily. Premiums and discounts on debt securities purchased are amortized and accreted, respectively, to interest income over the lives of the respective securities. Security transactions are accounted for on the date securities are bought or sold. Costs used to determine realized gains (losses) on the sale of investment securities are those of the specific securities sold.
B. Jennison Associates LLC and Baillie Gifford Overseas Ltd. each provide investment advisory services to a portion of the fund for a fee calculated at an annual percentage rate of average net assets managed by the advisor. The basic fee of Jennison Associates LLC is subject to quarterly adjustments based on performance for the preceding three years relative to the Russell 1000 Growth Index. The basic fee of Baillie Gifford Overseas Ltd. is subject to quarterly adjustments based on performance for the preceding three years relative to the S&P 500 Index.
23
Growth Equity Fund
The Vanguard Group manages the cash reserves of the fund on an at-cost basis.
For the year ended September 30, 2013, the aggregate investment advisory fee represented an effective annual basic rate of 0.23% of the fund’s average net assets, before a decrease of $334,000 (0.05%) based on performance.
C. The Vanguard Group furnishes at cost corporate management, administrative, marketing, and distribution services. The costs of such services are allocated to the fund under methods approved by the board of trustees. The fund has committed to provide up to 0.40% of its net assets in capital contributions to Vanguard. At September 30, 2013, the fund had contributed capital of $88,000 to Vanguard (included in Other Assets), representing 0.01% of the fund’s net assets and 0.04% of Vanguard’s capitalization. The fund’s trustees and officers are also directors and officers of Vanguard.
D. The fund has asked its investment advisors to direct certain security trades, subject to obtaining the best price and execution, to brokers who have agreed to rebate to the fund part of the commissions generated. Such rebates are used solely to reduce the fund’s management and administrative expenses. For the year ended September 30, 2013, these arrangements reduced the fund’s expenses by $19,000 (an annual rate of 0.00% of average net assets).
E. Various inputs may be used to determine the value of the fund’s investments. These inputs are summarized in three broad levels for financial statement purposes. The inputs or methodologies used to value securities are not necessarily an indication of the risk associated with investing in those securities.
Level 1—Quoted prices in active markets for identical securities.
Level 2—Other significant observable inputs (including quoted prices for similar securities, interest rates, prepayment speeds, credit risk, etc.).
Level 3—Significant unobservable inputs (including the fund’s own assumptions used to determine the fair value of investments).
The following table summarizes the market value of the fund’s investments as of September 30, 2013, based on the inputs used to value them:
| Level 1 | Level 2 | Level 3 | |
| Investments | ($000) | ($000) | ($000) |
| Common Stocks | 702,928 | 6,801 | — |
| Temporary Cash Investments | 35,478 | 1,299 | — |
| Futures Contracts—Assets1 | 61 | — | — |
| Futures Contracts—Liabilities1 | (240) | — | — |
| Total | 738,227 | 8,100 | — |
| 1 Represents variation margin on the last day of the reporting period. |
24
Growth Equity Fund
F. At September 30, 2013, the aggregate settlement value of open futures contracts and the related unrealized appreciation (depreciation) were:
| ($000) | ||||
| Aggregate | ||||
| Number of | Settlement | Unrealized | ||
| Long (Short) | Value | Appreciation | ||
| Futures Contracts | Expiration | Contracts | Long (Short) | (Depreciation) |
| S&P 500 Index | December 2013 | 39 | 16,324 | (175) |
| E-mini S&P 500 Index | December 2013 | 70 | 5,860 | (42) |
Unrealized appreciation (depreciation) on open futures contracts is required to be treated as realized gain (loss) for tax purposes.
G. Distributions are determined on a tax basis and may differ from net investment income and realized capital gains for financial reporting purposes. Differences may be permanent or temporary. Permanent differences are reclassified among capital accounts in the financial statements to reflect their tax character. Temporary differences arise when certain items of income, expense, gain, or loss are recognized in different periods for financial statement and tax purposes; these differences will reverse at some time in the future. Differences in classification may also result from the treatment of short-term gains as ordinary income for tax purposes.
During the year ended September 30, 2013, the fund realized net foreign currency losses of $10,000, which decreased distributable net income for tax purposes; accordingly, such losses have been reclassified from accumulated net realized losses to undistributed net investment income.
For tax purposes, at September 30, 2013, the fund had $2,791,000 of ordinary income available for distribution. The fund used capital loss carryforwards of $102,394,000 to offset taxable capital gains realized during the year ended September 30, 2013. At September 30, 2013, the fund had available capital losses totaling $59,957,000 to offset future net capital gains through September 30, 2018.
At September 30, 2013, the cost of investment securities for tax purposes was $578,947,000. Net unrealized appreciation of investment securities for tax purposes was $167,559,000, consisting of unrealized gains of $175,618,000 on securities that had risen in value since their purchase and $8,059,000 in unrealized losses on securities that had fallen in value since their purchase.
H. During the year ended September 30, 2013, the fund purchased $250,704,000 of investment securities and sold $382,622,000 of investment securities, other than temporary cash investments.
25
Growth Equity Fund
I. Capital shares issued and redeemed were:
| Year Ended September 30, | ||
| 2013 | 2012 | |
| Shares | Shares | |
| (000) | (000) | |
| Issued | 8,384 | 15,606 |
| Issued in Lieu of Cash Distributions | 583 | 279 |
| Redeemed | (18,844) | (14,632) |
| Net Increase (Decrease) in Shares Outstanding | (9,877) | 1,253 |
J. Management has determined that no material events or transactions occurred subsequent to September 30, 2013, that would require recognition in these financial statements. In October 2013, Vanguard announced plans to merge Vanguard Growth Equity Fund into Vanguard U.S. Growth Fund, combining two funds with the same investment objectives. The reorganization does not require shareholder approval. The reorganization is expected to qualify as a tax-free reorganization for federal income tax purposes, and to be completed in the first quarter of 2014. Growth Equity Fund’s two investment advisors will be added to the U.S. Growth Fund’s advisory team after the closing of the reorganization.
26
Report of Independent Registered
Public Accounting Firm
To the Trustees of Vanguard Fenway Funds and the Shareholders of Vanguard Growth Equity Fund:
In our opinion, the accompanying statement of net assets and the related statements of operations and of changes in net assets and the financial highlights present fairly, in all material respects, the financial position of Vanguard Growth Equity Fund (constituting a separate portfolio of Vanguard Fenway Funds, hereafter referred to as the “Fund”) at September 30, 2013, the results of its operations for the year then ended, the changes in its net assets for each of the two years in the period then ended, and the financial highlights for each of the five years in the period then ended, in conformity with accounting principles generally accepted in the United States of America. These financial statements and financial highlights (hereafter referred to as “financial statements”) are the responsibility of the Fund’s management; our responsibility is to express an opinion on these financial statements based on our audits. We conducted our audits of these financial statements in accordance with the standards of the Public Company Accounting Oversight Board (United States). Those standards require that we plan and perform the audit to obtain reasonable assurance about whether the financial statements are free of material misstatement. An audit includes examining, on a test basis, evidence supporting the amounts and disclosures in the financial statements, assessing the accounting principles used and significant estimates made by management, and evaluating the overall financial statement presentation. We believe that our audits, which included confirmation of securities at September 30, 2013 by correspondence with the custodian and broker and by agreement to the underlying ownership records of the transfer agent, provide a reasonable basis for our opinion.
PricewaterhouseCoopers LLP
Philadelphia, Pennsylvania
November 14, 2013
| Special 2013 tax information (unaudited) for Vanguard Growth Equity Fund |
| This information for the fiscal year ended September 30, 2013, is included pursuant to provisions of |
| the Internal Revenue Code. |
| The fund distributed $7,387,000 of qualified dividend income to shareholders during the fiscal year. |
| For corporate shareholders, 100% of investment income (dividend income plus short-term gains, if |
| any) qualifies for the dividends-received deduction. |
27
Your Fund’s After-Tax Returns
This table presents returns for your fund both before and after taxes. The after-tax returns are shown in two ways: (1) assuming that an investor owned the fund during the entire period and paid taxes on the fund’s distributions, and (2) assuming that an investor paid taxes on the fund’s distributions and sold all shares at the end of each period.
Calculations are based on the highest individual federal income tax and capital gains tax rates in effect at the times of the distributions and the hypothetical sales. State and local taxes were not considered. After-tax returns reflect any qualified dividend income, using actual prior-year figures and estimates for 2013. (In the example, returns after the sale of fund shares may be higher than those assuming no sale. This occurs when the sale would have produced a capital loss. The calculation assumes that the investor received a tax deduction for the loss.)
Please note that your actual after-tax returns will depend on your tax situation and may differ from those shown. Also note that if you own the fund in a tax-deferred account, such as an individual retirement account or a 401(k) plan, this information does not apply to you. Such accounts are not subject to current taxes.
Finally, keep in mind that a fund’s performance—whether before or after taxes—does not guarantee future results.
| Average Annual Total Returns: Growth Equity Fund | |||
| Periods Ended September 30, 2013 | |||
| One | Five | Ten | |
| Year | Years | Years | |
| Returns Before Taxes | 19.82% | 10.32% | 6.44% |
| Returns After Taxes on Distributions | 19.64 | 10.19 | 6.37 |
| Returns After Taxes on Distributions and Sale of Fund Shares | 11.49 | 8.21 | 5.21 |
28
About Your Fund’s Expenses
As a shareholder of the fund, you incur ongoing costs, which include costs for portfolio management, administrative services, and shareholder reports (like this one), among others. Operating expenses, which are deducted from a fund’s gross income, directly reduce the investment return of the fund.
A fund’s expenses are expressed as a percentage of its average net assets. This figure is known as the expense ratio. The following examples are intended to help you understand the ongoing costs (in dollars) of investing in your fund and to compare these costs with those of other mutual funds. The examples are based on an investment of $1,000 made at the beginning of the period shown and held for the entire period.
The accompanying table illustrates your fund’s costs in two ways:
• Based on actual fund return. This section helps you to estimate the actual expenses that you paid over the period. The ”Ending Account Value“ shown is derived from the fund‘s actual return, and the third column shows the dollar amount that would have been paid by an investor who started with $1,000 in the fund. You may use the information here, together with the amount you invested, to estimate the expenses that you paid over the period.
To do so, simply divide your account value by $1,000 (for example, an $8,600 account value divided by $1,000 = 8.6), then multiply the result by the number given for your fund under the heading ”Expenses Paid During Period.“
• Based on hypothetical 5% yearly return. This section is intended to help you compare your fund‘s costs with those of other mutual funds. It assumes that the fund had a yearly return of 5% before expenses, but that the expense ratio is unchanged. In this case—because the return used is not the fund’s actual return—the results do not apply to your investment. The example is useful in making comparisons because the Securities and Exchange Commission requires all mutual funds to calculate expenses based on a 5% return. You can assess your fund’s costs by comparing this hypothetical example with the hypothetical examples that appear in shareholder reports of other funds.
Note that the expenses shown in the table are meant to highlight and help you compare ongoing costs only and do not reflect transaction costs incurred by the fund for buying and selling securities. Further, the expenses do not include any purchase, redemption, or account service fees described in the fund prospectus. If such fees were applied to your account, your costs would be higher. Your fund does not carry a “sales load.”
The calculations assume no shares were bought or sold during the period. Your actual costs may have been higher or lower, depending on the amount of your investment and the timing of any purchases or redemptions.
You can find more information about the fund’s expenses, including annual expense ratios, in the Financial Statements section of this report. For additional information on operating expenses and other shareholder costs, please refer to your fund’s current prospectus.
29
| Six Months Ended September 30, 2013 | |||
| Beginning | Ending | Expenses | |
| Account Value | Account Value | Paid During | |
| Growth Equity Fund | 3/31/2013 | 9/30/2013 | Period |
| Based on Actual Fund Return | $1,000.00 | $1,113.94 | $2.70 |
| Based on Hypothetical 5% Yearly Return | 1,000.00 | 1,022.51 | 2.59 |
The calculations are based on expenses incurred in the most recent six-month period. The fund’s annualized six-month expense ratio for that period is 0.51%. The dollar amounts shown as “Expenses Paid” are equal to the annualized expense ratio multiplied by the average account value over the period, multiplied by the number of days in the most recent six-month period, then divided by the number of days in the most recent 12-month period.
30
Glossary
30-Day SEC Yield. A fund’s 30-day SEC yield is derived using a formula specified by the U.S. Securities and Exchange Commission. Under the formula, data related to the fund’s security holdings in the previous 30 days are used to calculate the fund’s hypothetical net income for that period, which is then annualized and divided by the fund’s estimated average net assets over the calculation period. For the purposes of this calculation, a security’s income is based on its current market yield to maturity (for bonds), its actual income (for asset-backed securities), or its projected dividend yield (for stocks). Because the SEC yield represents hypothetical annualized income, it will differ—at times significantly—from the fund’s actual experience. As a result, the fund’s income distributions may be higher or lower than implied by the SEC yield.
Beta. A measure of the magnitude of a fund’s past share-price fluctuations in relation to the ups and downs of a given market index. The index is assigned a beta of 1.00. Compared with a given index, a fund with a beta of 1.20 typically would have seen its share price rise or fall by 12% when the index rose or fell by 10%. For this report, beta is based on returns over the past 36 months for both the fund and the index. Note that a fund’s beta should be reviewed in conjunction with its R-squared (see definition). The lower the R-squared, the less correlation there is between the fund and the index, and the less reliable beta is as an indicator of volatility.
Dividend Yield. Dividend income earned by stocks, expressed as a percentage of the aggregate market value (or of net asset value, for a fund). The yield is determined by dividing the amount of the annual dividends by the aggregate value (or net asset value) at the end of the period. For a fund, the dividend yield is based solely on stock holdings and does not include any income produced by other investments.
Earnings Growth Rate. The average annual rate of growth in earnings over the past five years for the stocks now in a fund.
Equity Exposure. A measure that reflects a fund’s investments in stocks and stock futures. Any holdings in short-term reserves are excluded.
Expense Ratio. A fund’s total annual operating expenses expressed as a percentage of the fund’s average net assets. The expense ratio includes management and administrative expenses, but does not include the transaction costs of buying and selling portfolio securities.
Foreign Holdings. The percentage of a fund represented by securities or depositary receipts of companies based outside the United States.
Inception Date. The date on which the assets of a fund (or one of its share classes) are first invested in accordance with the fund’s investment objective. For funds with a subscription period, the inception date is the day after that period ends. Investment performance is measured from the inception date.
Median Market Cap. An indicator of the size of companies in which a fund invests; the midpoint of market capitalization (market price x shares outstanding) of a fund’s stocks, weighted by the proportion of the fund’s assets invested in each stock. Stocks representing half of the fund’s assets have market capitalizations above the median, and the rest are below it.
Price/Book Ratio. The share price of a stock divided by its net worth, or book value, per share. For a fund, the weighted average price/book ratio of the stocks it holds.
31
Price/Earnings Ratio. The ratio of a stock’s current price to its per-share earnings over the past year. For a fund, the weighted average P/E of the stocks it holds. P/E is an indicator of market expectations about corporate prospects; the higher the P/E, the greater the expectations for a company’s future growth.
R-Squared. A measure of how much of a fund’s past returns can be explained by the returns from the market in general, as measured by a given index. If a fund’s total returns were precisely synchronized with an index’s returns, its R-squared would be 1.00. If the fund’s returns bore no relationship to the index’s returns, its R-squared would be 0. For this report, R-squared is based on returns over the past 36 months for both the fund and the index.
Return on Equity. The annual average rate of return generated by a company during the past five years for each dollar of shareholder’s equity (net income divided by shareholder’s equity). For a fund, the weighted average return on equity for the companies whose stocks it holds.
Short-Term Reserves. The percentage of a fund invested in highly liquid, short-term securities that can be readily converted to cash.
Turnover Rate. An indication of the fund’s trading activity. Funds with high turnover rates incur higher transaction costs and may be more likely to distribute capital gains (which may be taxable to investors). The turnover rate excludes in-kind transactions, which have minimal impact on costs.
32
This page intentionally left blank.
This page intentionally left blank.
This page intentionally left blank.
The People Who Govern Your Fund
The trustees of your mutual fund are there to see that the fund is operated and managed in your best interests since, as a shareholder, you are a part owner of the fund. Your fund’s trustees also serve on the board of directors of The Vanguard Group, Inc., which is owned by the Vanguard funds and provides services to them on an at-cost basis.
A majority of Vanguard’s board members are independent, meaning that they have no affiliation with Vanguard or the funds they oversee, apart from the sizable personal investments they have made as private individuals. The independent board members have distinguished backgrounds in business, academia, and public service. Each of the trustees and executive officers oversees 181 Vanguard funds.
The following table provides information for each trustee and executive officer of the fund. More information about the trustees is in the Statement of Additional Information, which can be obtained, without charge, by contacting Vanguard at 800-662-7447, or online at vanguard.com.
| InterestedTrustee1 | and Delphi Automotive LLP (automotive components); |
| Senior Advisor at New Mountain Capital; Trustee of | |
| F. William McNabb III | The Conference Board. |
| Born 1957. Trustee Since July 2009. Chairman of the | |
| Board. Principal Occupation(s) During the Past Five | Amy Gutmann |
| Years: Chairman of the Board of The Vanguard Group, | Born 1949. Trustee Since June 2006. Principal |
| Inc., and of each of the investment companies served | Occupation(s) During the Past Five Years: President |
| by The Vanguard Group, since January 2010; Director | of the University of Pennsylvania; Christopher H. |
| of The Vanguard Group since 2008; Chief Executive | Browne Distinguished Professor of Political Science |
| Officer and President of The Vanguard Group and of | in the School of Arts and Sciences with secondary |
| each of the investment companies served by The | appointments at the Annenberg School for |
| Vanguard Group since 2008; Director of Vanguard | Communication and the Graduate School of Education |
| Marketing Corporation; Managing Director of The | of the University of Pennsylvania; Member of the |
| Vanguard Group (1995–2008). | National Commission on the Humanities and Social |
| Sciences; Trustee of Carnegie Corporation of New | |
| York and of the National Constitution Center; Chair | |
| IndependentTrustees | of the U. S. Presidential Commission for the Study |
| of Bioethical Issues. | |
| Emerson U. Fullwood | |
| Born 1948. Trustee Since January 2008. Principal | |
| Occupation(s) During the Past Five Years: Executive | JoAnn Heffernan Heisen |
| Chief Staff and Marketing Officer for North America | Born 1950. Trustee Since July 1998. Principal |
| and Corporate Vice President (retired 2008) of Xerox | Occupation(s) During the Past Five Years: Corporate |
| Corporation (document management products and | Vice President and Chief Global Diversity Officer |
| services); Executive in Residence and 2010 | (retired 2008) and Member of the Executive |
| Distinguished Minett Professor at the Rochester | Committee (1997–2008) of Johnson & Johnson |
| Institute of Technology; Director of SPX Corporation | (pharmaceuticals/medical devices/consumer |
| (multi-industry manufacturing), the United Way of | products); Director of Skytop Lodge Corporation |
| Rochester, Amerigroup Corporation (managed health | (hotels), the University Medical Center at Princeton, |
| care), the University of Rochester Medical Center, | the Robert Wood Johnson Foundation, and the Center |
| Monroe Community College Foundation, and North | for Talent Innovation; Member of the Advisory Board |
| Carolina A&T University. | of the Maxwell School of Citizenship and Public Affairs |
| at Syracuse University. | |
| Rajiv L. Gupta | |
| Born 1945. Trustee Since December 2001. 2 | F. Joseph Loughrey |
| Principal Occupation(s) During the Past Five Years: | Born 1949. Trustee Since October 2009. Principal |
| Chairman and Chief Executive Officer (retired 2009) | Occupation(s) During the Past Five Years: President |
| and President (2006–2008) of Rohm and Haas Co. | and Chief Operating Officer (retired 2009) of Cummins |
| (chemicals); Director of Tyco International, Ltd. | Inc. (industrial machinery); Chairman of the Board of |
| (diversified manufacturing and services), Hewlett- | Hillenbrand, Inc. (specialized consumer services) and |
| Packard Co. (electronic computer manufacturing), | of Oxfam America; Director of SKF AB (industrial |
| machinery) and the Lumina Foundation for Education; | Executive Officers | |
| Member of the Advisory Council for the College of | ||
| Arts and Letters and of the Advisory Board to the | Glenn Booraem | |
| Kellogg Institute for International Studies, both at | Born 1967. Controller Since July 2010. Principal | |
| the University of Notre Dame. | Occupation(s) During the Past Five Years: Principal | |
| of The Vanguard Group, Inc.; Controller of each of | ||
| Mark Loughridge | the investment companies served by The Vanguard | |
| Born 1953. Trustee Since March 2012. Principal | Group; Assistant Controller of each of the investment | |
| Occupation(s) During the Past Five Years: Senior Vice | companies served by The Vanguard Group (2001–2010). | |
| President and Chief Financial Officer at IBM (information | ||
| technology services); Fiduciary Member of IBM’s | Thomas J. Higgins | |
| Retirement Plan Committee. | Born 1957. Chief Financial Officer Since September | |
| 2008. Principal Occupation(s) During the Past Five | ||
| Scott C. Malpass | Years: Principal of The Vanguard Group, Inc.; Chief | |
| Born 1962. Trustee Since March 2012. Principal | Financial Officer of each of the investment companies | |
| Occupation(s) During the Past Five Years: Chief | served by The Vanguard Group; Treasurer of each of | |
| Investment Officer and Vice President at the University | the investment companies served by The Vanguard | |
| of Notre Dame; Assistant Professor of Finance at the | Group (1998–2008). | |
| Mendoza College of Business at Notre Dame; Member | ||
| of the Notre Dame 403(b) Investment Committee; | Kathryn J. Hyatt | |
| Director of TIFF Advisory Services, Inc. (investment | Born 1955. Treasurer Since November 2008. Principal | |
| advisor); Member of the Investment Advisory | Occupation(s) During the Past Five Years: Principal of | |
| Committees of the Financial Industry Regulatory | The Vanguard Group, Inc.; Treasurer of each of the | |
| Authority (FINRA) and of Major League Baseball. | investment companies served by The Vanguard | |
| Group; Assistant Treasurer of each of the investment | ||
| André F. Perold | companies served by The Vanguard Group (1988–2008). | |
| Born 1952. Trustee Since December 2004. Principal | ||
| Occupation(s) During the Past Five Years: George | Heidi Stam | |
| Gund Professor of Finance and Banking at the Harvard | Born 1956. Secretary Since July 2005. Principal | |
| Business School (retired 2011); Chief Investment | Occupation(s) During the Past Five Years: Managing | |
| Officer and Managing Partner of HighVista Strategies | Director of The Vanguard Group, Inc.; General Counsel | |
| LLC (private investment firm); Director of Rand | of The Vanguard Group; Secretary of The Vanguard | |
| Merchant Bank; Overseer of the Museum of Fine | Group and of each of the investment companies | |
| Arts Boston. | served by The Vanguard Group; Director and Senior | |
| Vice President of Vanguard Marketing Corporation. | ||
| Alfred M. Rankin, Jr. | ||
| Born 1941. Trustee Since January 1993. Principal | Vanguard Senior ManagementTeam | |
| Occupation(s) During the Past Five Years: Chairman, | ||
| President, and Chief Executive Officer of NACCO | Mortimer J. Buckley | Chris D. McIsaac |
| Industries, Inc. (housewares/lignite) and of Hyster-Yale | Kathleen C. Gubanich | Michael S. Miller |
| Materials Handling, Inc. (forklift trucks); Director of | Paul A. Heller | James M. Norris |
| the National Association of Manufacturers; Chairman | Martha G. King | Glenn W. Reed |
| of the Board of University Hospitals of Cleveland; | John T. Marcante | |
| Advisory Chairman of the Board of The Cleveland | ||
| Museum of Art. | ||
| Chairman Emeritus and Senior Advisor | ||
| Peter F. Volanakis | ||
| Born 1955. Trustee Since July 2009. Principal | John J. Brennan | |
| Occupation(s) During the Past Five Years: President | Chairman, 1996–2009 | |
| and Chief Operating Officer (retired 2010) of Corning | Chief Executive Officer and President, 1996–2008 | |
| Incorporated (communications equipment); Director | ||
| of SPX Corporation (multi-industry manufacturing); | Founder | |
| Overseer of the Amos Tuck School of Business | ||
| Administration at Dartmouth College; Advisor to the | John C. Bogle | |
| Norris Cotton Cancer Center. | Chairman and Chief Executive Officer, 1974–1996 | |
1 Mr. McNabb is considered an “interested person,” as defined in the Investment Company Act of 1940, because he is an officer of the Vanguard funds.
2 December 2002 for Vanguard Equity Income Fund, Vanguard Growth Equity Fund, the Vanguard Municipal Bond Funds, and the Vanguard State Tax-Exempt Funds.
 | |
| P.O. Box 2600 | |
| Valley Forge, PA 19482-2600 |
Connect with Vanguard® > vanguard.com
| Fund Information > 800-662-7447 | |
| Direct Investor Account Services > 800-662-2739 | |
| Institutional Investor Services > 800-523-1036 | |
| Text Telephone for People | |
| With Hearing Impairment > 800-749-7273 | |
| This material may be used in conjunction | |
| with the offering of shares of any Vanguard | |
| fund only if preceded or accompanied by | |
| the fund’s current prospectus. | |
| All comparative mutual fund data are from Lipper, a | |
| Thomson Reuters Company, or Morningstar, Inc., unless | |
| otherwise noted. | |
| You can obtain a free copy of Vanguard’s proxy voting | |
| guidelines by visiting vanguard.com/proxyreporting or by | |
| calling Vanguard at 800-662-2739. The guidelines are | |
| also available from the SEC’s website, sec.gov. In | |
| addition, you may obtain a free report on how your fund | |
| voted the proxies for securities it owned during the 12 | |
| months ended June 30. To get the report, visit either | |
| vanguard.com/proxyreporting or sec.gov. | |
| You can review and copy information about your fund at | |
| the SEC’s Public Reference Room in Washington, D.C. To | |
| find out more about this public service, call the SEC at | |
| 202-551-8090. Information about your fund is also | |
| available on the SEC’s website, and you can receive | |
| copies of this information, for a fee, by sending a | |
| request in either of two ways: via e-mail addressed to | |
| publicinfo@sec.gov or via regular mail addressed to the | |
| Public Reference Section, Securities and Exchange | |
| Commission, Washington, DC 20549-1520. | |
| © 2013 The Vanguard Group, Inc. | |
| All rights reserved. | |
| Vanguard Marketing Corporation, Distributor. | |
| Q5440 112013 | |
![]()
Annual Report | September 30, 2013
Vanguard PRIMECAP Core Fund

Vanguard’s Principles for Investing Success
We want to give you the best chance of investment success. These principles, grounded in Vanguard’s research and experience, can put you on the right path.
Goals. Create clear, appropriate investment goals.
Balance. Develop a suitable asset allocation using broadly diversified funds. Cost. Minimize cost.
Discipline. Maintain perspective and long-term discipline.
A single theme unites these principles: Focus on the things you can control.
We believe there is no wiser course for any investor.
| Contents | |
| Your Fund’s Total Returns. | 1 |
| Chairman’s Letter. | 2 |
| Advisor’s Report. | 9 |
| Fund Profile. | 13 |
| Performance Summary. | 14 |
| Financial Statements. | 16 |
| Your Fund’s After-Tax Returns. | 26 |
| About Your Fund’s Expenses. | 27 |
| Glossary. | 29 |
Please note: The opinions expressed in this report are just that—informed opinions. They should not be considered promises or advice.
Also, please keep in mind that the information and opinions cover the period through the date on the front of this report. Of course, the risks of investing in your fund are spelled out in the prospectus.
See the Glossary for definitions of investment terms used in this report.
About the cover: The ship's wheel represents leadership and guidance, essential qualities in navigating difficult seas.
This one is a replica based on an 18th-century British vessel. The HMS Vanguard, another ship of that era, served as the flagship for Admiral Horatio Nelson when he defeated a French fleet at the Battle of the Nile.
| Your Fund’s Total Returns | ||||
| Fiscal Year Ended September 30, 2013 | ||||
| Total | ||||
| Returns | ||||
| Vanguard PRIMECAP Core Fund | 28.88% | |||
| MSCI US Prime Market 750 Index | 20.34 | |||
| Multi-Cap Core Funds Average | 22.81 | |||
| Multi-Cap Core Funds Average: Derived from data provided by Lipper, a Thomson Reuters Company. | ||||
| Your Fund’s Performance at a Glance | ||||
| September 30, 2012, Through September 30, 2013 | ||||
| Distributions Per Share | ||||
| Starting | Ending | |||
| Share | Share | Income | Capital | |
| Price | Price | Dividends | Gains | |
| Vanguard PRIMECAP Core Fund | $14.98 | $18.65 | $0.260 | $0.267 |
1

Chairman’s Letter
Dear Shareholder,
Vanguard PRIMECAP Core Fund, buoyed by a favorable stock market and the skill of its advisor, delivered a praiseworthy performance for the 12 months ended September 30, 2013. The fund returned nearly 29%, notably ahead of its comparative standards––about 20% for its benchmark, the MSCI US Prime Market 750 Index, and almost 23% on average for its peer multi-capitalization core funds.
PRIMECAP Management Company, the fund’s advisor, has customarily made outsized investments in health care and information technology. In the 2013 fiscal year, the advisor’s investment decisions within these sectors significantly boosted returns. The industrial sector was also a source of strength. At the same time, the fund was aided by its minimal or zero exposure to some of the market’s less productive precincts, such as consumer staples, utilities, and telecommunication services.
If you hold fund shares in a taxable account, you may wish to review the table of after-tax returns, based on the highest federal income tax bracket, that appears later in this report.
Stocks dodged obstacles to produce strong gains
Although their path wasn’t always smooth, U.S. stocks powered to a return of about 22% for the 12 months ended
2
September 30. The U.S. economy delivered only modest growth over the fiscal year, but investors’ appetite for risk seemed to increase faster than companies’ profits.
In mid-September, U.S. stocks jumped when the Federal Reserve surprised investors by announcing that it had no immediate plans to unwind its stimulative bond-buying program. But in the waning days of that month, stocks slid ahead of the partial federal government shutdown that began October 1.
It’s natural for investors to be concerned by the situation in Washington. But as Sarah Hammer, a senior analyst in Vanguard Investment Strategy Group, noted in the midst of the temporary shutdown, they shouldn’t be unduly influenced by these events. “Investors are often best served by sticking to their long-term investment plans and avoiding short-term decisions based on the legislative outlook,” Ms. Hammer said. Our recurrent advice to stick to your plan may lack pizzazz, but it’s proven to be sound counsel over the decades.
International stocks generally posted strong results. Emerging-market stocks, however, lagged amid worries about slowing growth.
Bond returns were negative despite September’s bounce
Investor concern about the Fed’s potential scaling back of its bond-buying program also affected the performance of bonds,
| Market Barometer | |||
| Average Annual Total Returns | |||
| Periods Ended September 30, 2013 | |||
| One | Three | Five | |
| Year | Years | Years | |
| Stocks | |||
| Russell 1000 Index (Large-caps) | 20.91% | 16.64% | 10.53% |
| Russell 2000 Index (Small-caps) | 30.06 | 18.29 | 11.15 |
| Russell 3000 Index (Broad U.S. market) | 21.60 | 16.76 | 10.58 |
| MSCI All Country World Index ex USA (International) | 16.48 | 5.95 | 6.26 |
| Bonds | |||
| Barclays U.S. Aggregate Bond Index (Broad taxable market) | -1.68% | 2.86% | 5.41% |
| Barclays Municipal Bond Index (Broad tax-exempt market) | -2.21 | 3.24 | 5.98 |
| Citigroup Three-Month U.S. Treasury Bill Index | 0.07 | 0.07 | 0.14 |
| CPI | |||
| Consumer Price Index | 1.18% | 2.34% | 1.37% |
3
which declined for the year. In September, however, bonds trimmed their losses after the Fed said it would maintain the level of purchases.
The broad U.S. taxable bond market returned –1.68% for the fiscal year, and the yield of the 10-year Treasury note closed at 2.63%, down from 2.76% at the end of August. (Bond yields and prices move in opposite directions.) Municipal bonds returned –2.21% after rebounding a bit in September.
Money markets and savings accounts barely budged as the Fed’s target for short-term interest rates remained at 0%–0.25%.
People and process are both crucial to the fund’s performance
PRIMECAP Management’s investment principles are steeped in both its people and its investment process, which draws on deep research. In seeking to understand a company or a business, PRIMECAP’s portfolio managers visit headquarters, factories, and stores; speak with employees and customers; build models; attend conferences; and analyze the links of the supply chain.
PRIMECAP Management’s people are equally essential. On that note, I’d like to express my appreciation to Mitch Milias, co-founder and chairman of the company and a manager of Vanguard PRIMECAP
| Expense Ratios | ||
| Your Fund Compared With Its Peer Group | ||
| Peer Group | ||
| Fund | Average | |
| PRIMECAP Core Fund | 0.50% | 1.20% |
The fund expense ratio shown is from the prospectus dated January 25, 2013, and represents estimated costs for the current fiscal year. For the fiscal year ended September 30, 2013, the fund’s expense ratio was 0.50%. The peer-group expense ratio is derived from data provided by Lipper, a Thomson Reuters Company, and captures information through year-end 2012.
Peer group: Multi-Cap Core Funds.
4
Core Fund since 2004, who will relinquish his portfolio management duties at the end of the year. Mitch will remain with the firm in a management and client relationship role.
Although this is a natural progression, Mitch has been an integral part of the PRIMECAP team, and we will miss him. However, we have full confidence in the talented co-managers and analysts at PRIMECAP who will continue to oversee the fund. Mitch’s portion will be absorbed by the four other portfolio managers as well as by analysts in the firm’s research department. As before, each manager will remain responsible for his own portion of the fund.
PRIMECAP Core focused on information technology and health care before and during Mitch’s tenure with the fund, and the sizable allocations to these industries are likely to continue after his departure. On average, the fund had close to 30% of its assets in health care and almost 25% in IT, both far higher exposures than the benchmark’s.
Over the 12 months, the fund’s health care stocks surged about 34% and were responsible for about one-third of its return. Major pharmaceutical and biotech-nology companies have been especially productive for PRIMECAP Core as pipelines for new medicines have expanded and positive rulings from the Food and Drug Administration have resulted in a more hospitable business climate.
| Total Returns | |
| Inception Through September 30, 2013 | |
| Average | |
| Annual Return | |
| PRIMECAP Core Fund (Returns since inception: 12/9/2004) | 8.89% |
| MSCI US Prime Market 750 Index | 6.72 |
| Multi-Cap Core Funds Average | 5.80 |
| Multi-Cap Core Funds Average: Derived from data provided by Lipper, a Thomson Reuters Company. |
The figures shown represent past performance, which is not a guarantee of future results. (Current performance may be lower or higher than the performance data cited. For performance data current to the most recent month-end, visit our website at vanguard.com/performance.) Note, too, that both investment returns and principal value can fluctuate widely, so an investor’s shares, when sold, could be worth more or less than their original cost.
5
As in the previous reporting period, the fund’s relative success in IT was due to both the stocks it held and those it largely sidestepped. Its holdings in the software and semiconductor industries were a boon.
At the same time, PRIMECAP Core had only a minuscule investment in Apple, whose stock fell almost 27%. (Of course, the minimal exposure to Apple has also
| Investment insight | |
| Don’t let a trick of the calendar alter your course | |
| When making investment decisions, it’s important to weigh past returns with caution. | |
| That’s because investment returns from any particular period are an unreliable anchor | |
| for gauging the future. They can be highly date-dependent. | |
| For example, take the five-year average annual return for the broad U.S. stock | |
| market. That average just made a startling bounce: from 1.30% for the period | |
| ended September 30, 2012, to 10.58% for the period ended September 30, 2013. | |
| True, the market returned a hearty 21.60% in the most recent 12 months, but that’s | |
| not enough to explain such a big leap in the average. Significantly, the year ended | |
| September 30, 2008––when U.S. stocks returned –21.52% during the financial | |
| crisis––has now rolled off the five-year calculation. | |
| The important thing to remember is that historical returns are just that: historical. | |
| Basing investment decisions on such date-dependent snapshots could easily lead | |
| you to alter course––possibly in the wrong direction. Instead, Vanguard believes, you | |
| should build your asset allocation strategy on long-term risk-and-return relationships, | |
| always recognizing that no level of return is guaranteed. | |
| Which five-year average should you count on? | |
| (Answer: None of them!) | |
| Average annual returns for U.S. stocks over five-year periods ended September 30 | |
| 2007 | 16.18% |
| 2008 | 5.70 |
| 2009 | 1.56 |
| 2010 | 0.92 |
| 2011 | –0.92 |
| 2012 | 1.30 |
| 2013 | 10.58 |
| Note: The U.S. stock market is represented by the Russell 3000 Index. | |
| Source: Vanguard. | |
6
meant the fund didn’t benefit from the company’s soaring stock price over the past few years.)
PRIMECAP Core’s industrial stocks rose almost 45%, with much of the strength coming from the aerospace and defense, airline, and air freight groups. All of the fund’s industry sectors posted positive returns, with financial and consumer discretionary stocks advancing more than 30%, though selection weighed slightly on relative performance in the latter category. Stock decisions also weighed on relative performance in the small materials sector.
For more on the advisor’s strategy and outlook, please see the Advisor’s Report that follows this letter.
The advisor’s patient approach has yielded strong long-term results
PRIMECAP Management Company has consistently taken a long-term, low-turnover approach to investing and shown conviction in constructing a portfolio that can differ greatly from the broad market. The strategy has served the fund well for its nearly nine years of existence, though there have been periods of underperformance.
Most recently, the fund lagged one or both of its comparative standards in fiscal years 2011 and 2012. During that period, however, PRIMECAP Management never veered from its investment plan, though its sector allocation and stock choices were sometimes out of sync with market trends. In 2013, the advisor’s patience and program were rewarded, and the fund surpassed both its benchmark and the average return of its peers by a wide margin.
Since its December 9, 2004, inception, the PRIMECAP Core Fund has recorded an average annual return of 8.89%, more than 2 percentage points ahead of its market benchmark, the MSCI US Prime Market 750 Index, and more than 3 percentage points ahead of its peer funds average.
Those results are a product of PRIMECAP Management’s skill and expertise and also of Vanguard’s historically low costs, which allow shareholders to keep more of the fund’s returns.
Staying out of the rough by staying the course
Back in September 2008, global financial markets were stunned by the collapse of Lehman Brothers, which transformed the economic downturn already under way into the Great Recession. Fast-forward to 2013: The U.S. economy is growing, albeit slowly, and stock markets have set record highs.
When headlines are blaring and stock markets are sinking, it’s human nature to be tempted to head for the exits. But it’s important to stick with the principles of balance and diversification—and the portfolio asset allocation you established to meet your long-term goals. Bonds can provide ballast if stock prices keep falling, and, by remaining in the stock market, you will be able to participate when stocks begin to recover.
7
The benefit of staying the course was confirmed in a recent analysis of the performance of more than 58,000 self-directed Vanguard IRA® investors over the five years ended December 31, 2012. Vanguard compared actual returns earned by each investor with the hypothetical results of personalized index benchmarks, taking into consideration investors’ beginning and ending balances and any intervening cash flow.
The key finding: Those who stayed with their investment plans earned five-year returns commensurate with the calculated benchmarks, generally outperforming those who changed course. Investors who reacted to market events were much more likely to miss out on potential returns. (You can read more in Most Vanguard IRA Investors Shot Par by Staying the Course: 2008–2012, available at vanguard.com/ research.)
The results for the five years through 2012 are a good reminder that sticking with a simple, broad-based portfolio—even amid a financial tempest—can help minimize the chances of making a mistake that can reduce returns.
As always, thank you for investing with Vanguard.
Sincerely,

F. William McNabb III
Chairman and Chief Executive Officer
October 11, 2013
8
Advisor’s Report
For the fiscal year ended September 30, 2013, Vanguard PRIMECAP Core Fund returned 28.88%, exceeding both the 20.34% return of its benchmark, the unmanaged MSCI US Prime Market 750 Index, and the 22.81% average return of its multi-capitalization core fund peers. Favorable stock selection in information technology, health care, and industrials was the main reason for the positive performance.
The investment environment
During the fiscal year, the actions of central banks worldwide, particularly those in the United States, Japan, Europe, and the United Kingdom, heavily influenced the investment environment. Since the 2008–2009 financial crisis, these institutions have taken extraordinary measures to stimulate their countries’ economies, including large-scale quantitative easing, or QE. The banks have largely used the newly created money to buy government bonds, mortgage-backed securities, or both to try to reduce borrowing costs and encourage lending and investing.
QE supports asset prices, because those who sell their securities to a central bank use some of the proceeds to buy other financial assets, and it often weakens currencies because of the increased supply.
For the 12 months, Japan’s stock market outperformed those of other major countries. When adjusted for the size of Japan’s economy, Japan’s QE program was the largest of any central bank’s. The Nikkei 225 index appreciated by 64% over the period after languishing since the financial crisis, and the yen depreciated by more than 25% relative to the U.S. dollar.
We are concerned that the absence of significant inflation in developed economies after the Great Recession has led many to assume that these conditions will persist indefinitely. In an inflationary environment, interest rates need to increase to compensate lenders for the loss of purchasing power, making debt levels that appear manageable at a time of ultralow interest rates more difficult to service. Overall debt levels in the United States remain high relative to gross domestic product, and large, unfunded entitlement obligations cloud the government’s fiscal outlook. Although U.S. interest rates have risen from recent lows, they remain depressed by historical standards. Eventually they will rise to more normal levels, but we believe the portfolio is relatively well-positioned for that circumstance given the strong balance sheets of many of our companies.
Outlook for U.S. equities
U.S. equities performed strongly for the fiscal year, with the Standard & Poor’s 500 Index returning 19.34%. In fact, the index reached a record high of 1,730 on September 18. Economically sensitive sectors such as consumer discretionary, financials, and industrials led the market. Defensive sectors such as consumer
9
staples, utilities, and telecommunications services underperformed. Bonds, which had enjoyed an extended period of outperformance, generally declined in price as interest rates increased.
We are less optimistic about U.S. equities than we were a year ago, though we still believe they are more attractive than bonds at current prices. At the end of the fiscal year, the S&P 500 was trading at about 15.5 times its calendar 2013 estimated earnings per share of $109, a reasonable valuation by historical standards. We are skeptical, though, that the index can sustain its recent earnings per share growth unless revenue growth accelerates. Much of the recent earnings growth has come from profit margin expansion, and corporate margins are near record highs. Favorable trends from lower debt service costs and debt-funded share repurchases, which have also helped boost earnings per share, could become hindrances in a rising interest rate environment.
Portfolio update and outlook
Although our focus is on the long term, we are encouraged by the fund’s fiscal year results. After generally lagging the returns of the S&P 500 for 2½ years, they improved dramatically. The portfolio remains significantly overweighted in health care and information technology. As of September 30, these two sectors constituted nearly 57% of its assets (versus 31% for the S&P 500) and included nine of its ten largest holdings.
The fund’s outperformance was primarily driven by favorable stock selection in IT, health care, and industrials. Even though the IT sector was the second-worst performer in the S&P 500, the fund’s stock selection more than offset the negative impact of its overweight position. Several longstanding investments appreciated significantly, including Electronic Arts (+101%) and Texas Instruments (+50%). A minimal exposure to Apple (–27%)—which still has the largest market capitalization in the S&P 500—further helped relative returns.
The health care sector outpaced the broader market by a wide margin and was the third-best performer in the index. Favorable stock selection and the fund’s overweight position contributed equally to relative results. Several long-held investments in pharmaceutical, biotechnology, and medical device stocks, which together make up a significant portion of the overall portfolio, outperformed the benchmark sector and the broader market. Examples include Biogen Idec (+61%), Roche Holding (+49%), and Amgen (+35%). In the industrial sector, investments in aerospace, airline, and transportation stocks contributed significantly to relative results.
We believe that many of our IT and health care holdings are attractively valued. Both sectors are trading at discounts to their historical price-to-earnings ratios. IT is
10
also currently valued at a discount to the overall market even though it has historically traded at a premium. We believe it has superior growth prospects.
Technology
In IT, the adoption of low-cost smartphones in developing countries will give billions of people access to the internet for the first time. The internet more recently has emerged as a platform for delivering software applications and cloud computing services. Thanks to exponential growth in processing power, network bandwidth, storage capacity, and other capabilities, cloud computing is replacing the client-server model as the dominant computing paradigm. It enables productivity growth through better use of technology assets and allows users to obtain and pay for software and computing resources as needed.
We expect that internet-connected sensor applications will raise productivity through increased automation and improved use of assets. We believe we have positioned the fund to benefit from the internet’s continuing growth by investing in companies that provide underlying processes as well as those that offer internet-based services directly to users.
We have also identified other areas in which new technologies should create growth opportunities. The fund has significant investments in companies whose ideas help boost productivity in agriculture, oil and gas production, and payments. And we remain optimistic that health care applications will keep advancing, as we discuss in greater detail below.
Health care
The fund’s substantial investments in health care reflect our belief that innovation in this area will continue, as well as our expectation that consumption of health care services will grow more rapidly than the overall economy for the foreseeable future. Global demographic trends support increased demand as populations age in most developed countries and in China (largely because of its one-child policy instituted in 1979). As the proportion of elderly people grows, so does health care spending; older people consume three times as many health care resources on average as the general population. We are also optimistic that the expected rise in living standards in many developing countries will open up new markets. As incomes in these countries grow and affordability improves, we anticipate that consumption will rise.
On the supply side, the industry’s considerable investments in research and development over the years are resulting in more effective therapies for many diseases such as cancer, diabetes, and Alzheimer’s. The precipitous decline in the cost of genetic sequencing is allowing researchers to identify diseases and rapidly
11
devise therapies that improve the standard of care and save lives. Increasingly, drugs developed based on a better understanding of the genetic causes of a disease are providing higher cure rates with fewer side effects than conventional treatments.
Conclusion
We remain committed to our investment philosophy, which is based on individual stock selection. Although this “bottom-up” approach can lead to periods of underperformance when the stocks in our portfolio fall out of favor, we believe it can generate superior results for investors over the long term.
PRIMECAP Management Company
October 11, 2013
Portfolio management team update
After nearly 50 years of managing equity investments, Mitchell J. Milias, a co-founder and the chairman of PRIMECAP Management Company, has decided to relinquish his portfolio management duties at the end of 2013. Mr. Milias has been a co-manager of the PRIMECAP Core Fund since 2004. The portion of the fund he manages will be assumed by the fund’s other co-managers and the firm’s research department.
12
PRIMECAP Core Fund
Fund Profile
As of September 30, 2013
| Portfolio Characteristics | |||
| MSCI US | DJ U.S. | ||
| Prime | Total | ||
| Market | Market | ||
| Fund | 750 Index | FA Index | |
| Number of Stocks | 147 | 753 | 3,636 |
| Median Market Cap | $53.7B | $53.7B | $40.2B |
| Price/Earnings Ratio | 20.4x | 18.6x | 19.5x |
| Price/Book Ratio | 3.2x | 2.5x | 2.5x |
| Return on Equity | 18.5% | 17.5% | 16.5% |
| Earnings Growth Rate | 11.6% | 11.2% | 11.1% |
| Dividend Yield | 1.8% | 2.1% | 1.9% |
| Foreign Holdings | 13.8% | 0.0% | 0.0% |
| Turnover Rate | 7% | — | — |
| Ticker Symbol | VPCCX | — | — |
| Expense Ratio1 | 0.50% | — | — |
| 30-Day SEC Yield | 1.25% | — | — |
| Short-Term Reserves | 4.8% | — | — |
Sector Diversification (% of equity exposure)
| DJ U.S. | |||
| MSCI US | Total | ||
| Prime | Market | ||
| Market | FA | ||
| Fund | 750 Index | Index | |
| Consumer Discretionary 10.8% | 13.1% | 13.3% | |
| Consumer Staples | 1.4 | 9.5 | 8.7 |
| Energy | 4.1 | 10.2 | 9.6 |
| Financials | 7.8 | 16.2 | 17.3 |
| Health Care | 30.9 | 12.6 | 12.6 |
| Industrials | 14.7 | 10.8 | 11.4 |
| Information Technology | 25.6 | 18.3 | 17.9 |
| Materials | 4.2 | 3.7 | 3.8 |
| Telecommunication | |||
| Services | 0.0 | 2.4 | 2.2 |
| Utilities | 0.5 | 3.2 | 3.2 |
| Volatility Measures | ||
| MSCI US | DJ U.S. | |
| Prime Market | Total Market | |
| 750 Index | FA Index | |
| R-Squared | 0.95 | 0.96 |
| Beta | 0.97 | 0.94 |
These measures show the degree and timing of the fund’s fluctuations compared with the indexes over 36 months.
Ten Largest Holdings (% of total net assets)
| Amgen Inc. | Biotechnology | 5.3% |
| Roche Holding AG | Pharmaceuticals | 5.0 |
| Biogen Idec Inc. | Biotechnology | 3.7 |
| Google Inc. | Internet Software & | |
| Services | 3.1 | |
| Eli Lilly & Co. | Pharmaceuticals | 3.1 |
| Novartis AG | Pharmaceuticals | 2.9 |
| Marsh & McLennan Cos. | ||
| Inc. | Insurance Brokers | 2.8 |
| Texas Instruments Inc. | Semiconductors | 2.6 |
| Johnson & Johnson | Pharmaceuticals | 2.5 |
| Medtronic Inc. | Health Care | |
| Equipment | 2.3 | |
| Top Ten | 33.3% |
The holdings listed exclude any temporary cash investments and equity index products.
Investment Focus
1 The expense ratio shown is from the prospectus dated January 25, 2013, and represents estimated costs for the current fiscal year. For the fiscal year ended September 30, 2013, the expense ratio was 0.50%.
13
PRIMECAP Core Fund
Performance Summary
All of the returns in this report represent past performance, which is not a guarantee of future results that may be achieved by the fund. (Current performance may be lower or higher than the performance data cited. For performance data current to the most recent month-end, visit our website at vanguard.com/performance.) Note, too, that both investment returns and principal value can fluctuate widely, so an investor’s shares, when sold, could be worth more or less than their original cost. The returns shown do not reflect taxes that a shareholder would pay on fund distributions or on the sale of fund shares.
Cumulative Performance: December 9, 2004, Through September 30, 2013
Initial Investment of $10,000
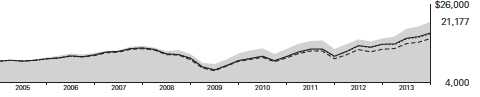
| Average Annual Total Returns | |||||
| Periods Ended September 30, 2013 | |||||
| Since | Final Value | ||||
| One | Five | Inception | of a $10,000 | ||
| Year | Years | (12/9/2004) | Investment | ||
| PRIMECAP Core Fund* | 28.88% | 12.06% | 8.89% | $21,177 | |
| •••••••• | MSCI US Prime Market 750 Index | 20.34 | 10.40 | 6.72 | 17,728 |
| – – – – | Multi-Cap Core Funds Average | 22.81 | 9.55 | 5.80 | 16,429 |
| Dow Jones U.S. Total Stock Market | |||||
| Float Adjusted Index | 21.44 | 10.69 | 6.91 | 18,014 | |
Multi-Cap Core Funds Average: Derived from data provided by Lipper, a Thomson Reuters Company.
"Since Inception" performance is calculated from the inception date for both the fund and its comparative standards.
See Financial Highlights for dividend and capital gains information.
14
PRIMECAP Core Fund
Fiscal-Year Total Returns (%): December 9, 2004, Through September 30, 2013
15
PRIMECAP Core Fund
Financial Statements
Statement of Net Assets
As of September 30, 2013
The fund reports a complete list of its holdings in regulatory filings four times in each fiscal year, at the quarter-ends. For the second and fourth fiscal quarters, the lists appear in the fund’s semiannual and annual reports to shareholders. For the first and third fiscal quarters, the fund files the lists with the Securities and Exchange Commission on Form N-Q. Shareholders can look up the fund’s Forms N-Q on the SEC’s website at sec.gov. Forms N-Q may also be reviewed and copied at the SEC’s Public Reference Room (see the back cover of this report for further information).
| Market | |||
| Value | |||
| Shares | ($000) | ||
| Common Stocks (95.5%) | |||
| Consumer Discretionary (10.3%) | |||
| L Brands Inc. | 1,583,800 | 96,770 | |
| * | CarMax Inc. | 1,748,300 | 84,740 |
| TJX Cos. Inc. | 1,450,000 | 81,765 | |
| Walt Disney Co. | 1,070,300 | 69,024 | |
| * | DIRECTV | 734,488 | 43,886 |
| Carnival Corp. | 1,297,200 | 42,341 | |
| * | Bed Bath & Beyond Inc. | 487,491 | 37,712 |
| Mattel Inc. | 800,000 | 33,488 | |
| Whirlpool Corp. | 205,000 | 30,020 | |
| Sony Corp. ADR | 1,389,500 | 29,902 | |
| VF Corp. | 54,470 | 10,842 | |
| Time Warner Cable Inc. | 93,500 | 10,435 | |
| Lowe’s Cos. Inc. | 200,000 | 9,522 | |
| Macy’s Inc. | 103,600 | 4,483 | |
| Ross Stores Inc. | 49,550 | 3,607 | |
| Royal Caribbean | |||
| Cruises Ltd. | 77,001 | 2,948 | |
| Nordstrom Inc. | 30,000 | 1,686 | |
| Las Vegas Sands Corp. | 25,000 | 1,660 | |
| Hasbro Inc. | 13,100 | 617 | |
| * | Amazon.com Inc. | 600 | 188 |
| 595,636 | |||
| Consumer Staples (1.4%) | |||
| Kellogg Co. | 700,000 | 41,111 | |
| PepsiCo Inc. | 425,000 | 33,787 | |
| CVS Caremark Corp. | 71,377 | 4,051 | |
| 78,949 | |||
| Energy (3.9%) | |||
| Transocean Ltd. | 1,349,000 | 60,030 | |
| Schlumberger Ltd. | 619,100 | 54,704 | |
| Noble Energy Inc. | 406,000 | 27,206 | |
| EOG Resources Inc. | 124,600 | 21,092 | |
| National Oilwell Varco Inc. | 191,800 | 14,981 | |
| * | Cameron | ||
| International Corp. | 245,888 | 14,352 | |
| Encana Corp. | 619,600 | 10,738 | |
| Cabot Oil & Gas Corp. | 261,000 | 9,741 | |
| Market | |||
| Value | |||
| Shares | ($000) | ||
| * | Southwestern Energy Co. | 145,000 | 5,275 |
| Exxon Mobil Corp. | 38,512 | 3,314 | |
| * | McDermott | ||
| International Inc. | 250,000 | 1,858 | |
| Petroleo Brasileiro SA ADR | |||
| Type A | 75,000 | 1,255 | |
| Noble Corp. | 24,000 | 906 | |
| Petroleo Brasileiro SA ADR | 30,000 | 465 | |
| * | Frank’s International NV | 10,000 | 299 |
| Range Resources Corp. | 1,500 | 114 | |
| 226,330 | |||
| Financials (7.4%) | |||
| Marsh & | |||
| McLennan Cos. Inc. | 3,647,775 | 158,861 | |
| Charles Schwab Corp. | 4,512,500 | 95,394 | |
| * | Berkshire Hathaway Inc. | ||
| Class B | 500,000 | 56,755 | |
| Chubb Corp. | 409,700 | 36,570 | |
| Wells Fargo & Co. | 666,000 | 27,519 | |
| Willis Group Holdings plc | 592,900 | 25,690 | |
| CME Group, Inc. Class A | 159,700 | 11,799 | |
| American Express Co. | 108,300 | 8,179 | |
| Comerica Inc. | 166,000 | 6,525 | |
| 427,292 | |||
| Health Care (29.5%) | |||
| Amgen Inc. | 2,739,600 | 306,671 | |
| Roche Holding AG | 1,076,234 | 290,447 | |
| * | Biogen Idec Inc. | 879,097 | 211,651 |
| Eli Lilly & Co. | 3,500,000 | 176,155 | |
| Novartis AG ADR | 2,200,605 | 168,808 | |
| Johnson & Johnson | 1,689,850 | 146,493 | |
| Medtronic Inc. | 2,475,200 | 131,804 | |
| GlaxoSmithKline plc ADR | 1,118,700 | 56,125 | |
| Abbott Laboratories | 1,599,700 | 53,094 | |
| * | Boston Scientific Corp. | 3,632,200 | 42,642 |
| Sanofi ADR | 706,300 | 35,760 | |
| AbbVie Inc. | 744,800 | 33,315 | |
| * | Waters Corp. | 258,000 | 27,402 |
| * | Illumina Inc. | 169,363 | 13,690 |
16
| PRIMECAP Core Fund | |||
| Market | |||
| Value | |||
| Shares | ($000) | ||
| Agilent Technologies Inc. | 70,000 | 3,588 | |
| Stryker Corp. | 45,500 | 3,075 | |
| * | Cerner Corp. | 10,000 | 526 |
| 1,701,246 | |||
| Industrials (14.0%) | |||
| Southwest Airlines Co. | 8,926,525 | 129,970 | |
| Honeywell | |||
| International Inc. | 1,319,700 | 109,588 | |
| United Parcel Service Inc. | |||
| Class B | 903,000 | 82,507 | |
| FedEx Corp. | 597,475 | 68,178 | |
| Boeing Co. | 509,600 | 59,878 | |
| European Aeronautic | |||
| Defence and Space Co. | |||
| NV | 897,350 | 57,181 | |
| Union Pacific Corp. | 253,950 | 39,449 | |
| Expeditors International of | |||
| Washington Inc. | 833,000 | 36,702 | |
| CH Robinson | |||
| Worldwide Inc. | 500,000 | 29,780 | |
| Norfolk Southern Corp. | 298,000 | 23,050 | |
| Rockwell Automation Inc. | 206,200 | 22,051 | |
| ^ | Ritchie Bros | ||
| Auctioneers Inc. | 893,300 | 18,027 | |
| Delta Air Lines Inc. | 665,000 | 15,687 | |
| * | AECOM Technology Corp. | 495,000 | 15,479 |
| PACCAR Inc. | 250,000 | 13,915 | |
| Caterpillar Inc. | 143,900 | 11,997 | |
| Cummins Inc. | 71,000 | 9,434 | |
| IDEX Corp. | 137,000 | 8,939 | |
| Pentair Ltd. | 133,600 | 8,676 | |
| * | United Continental | ||
| Holdings Inc. | 267,000 | 8,199 | |
| Republic Services Inc. | |||
| Class A | 230,935 | 7,704 | |
| * | Hertz Global Holdings Inc. | 330,000 | 7,313 |
| Safran SA | 100,000 | 6,159 | |
| * | Jacobs Engineering | ||
| Group Inc. | 100,000 | 5,818 | |
| CSX Corp. | 225,000 | 5,791 | |
| ^ | Canadian Pacific | ||
| Railway Ltd. | 24,030 | 2,963 | |
| Chicago Bridge & | |||
| Iron Co. NV | 34,500 | 2,338 | |
| * | Kirby Corp. | 16,000 | 1,385 |
| Babcock & Wilcox Co. | 25,000 | 843 | |
| * | Avis Budget Group Inc. | 5,400 | 156 |
| 809,157 | |||
| Information Technology (24.5%) | |||
| * | Google Inc. Class A | 207,622 | 181,858 |
| Texas Instruments Inc. | 3,680,150 | 148,200 | |
| QUALCOMM Inc. | 1,325,930 | 89,315 | |
| * | Electronic Arts Inc. | 3,469,300 | 88,641 |
| SanDisk Corp. | 1,465,216 | 87,195 | |
| Market | |||
| Value | |||
| Shares | ($000) | ||
| Microsoft Corp. | 2,493,200 | 83,049 | |
| Intuit Inc. | 1,164,200 | 77,198 | |
| * | Flextronics | ||
| International Ltd. | 8,092,200 | 73,558 | |
| Visa Inc. Class A | 330,663 | 63,190 | |
| EMC Corp. | 2,229,100 | 56,976 | |
| Symantec Corp. | 2,143,500 | 53,052 | |
| Oracle Corp. | 1,509,000 | 50,054 | |
| ASML Holding NV | 490,000 | 48,392 | |
| Telefonaktiebolaget LM | |||
| Ericsson ADR | 2,354,800 | 31,437 | |
| KLA-Tencor Corp. | 494,600 | 30,096 | |
| Intel Corp. | 1,285,600 | 29,466 | |
| Applied Materials Inc. | 1,500,000 | 26,310 | |
| * | Adobe Systems Inc. | 498,000 | 25,866 |
| Accenture plc Class A | 335,700 | 24,721 | |
| Corning Inc. | 1,425,000 | 20,791 | |
| Altera Corp. | 547,200 | 20,334 | |
| Cisco Systems Inc. | 760,000 | 17,799 | |
| Motorola Solutions Inc. | 256,000 | 15,201 | |
| NVIDIA Corp. | 832,000 | 12,946 | |
| * | Blackberry Ltd. | 1,527,100 | 12,140 |
| Hewlett-Packard Co. | 486,000 | 10,196 | |
| Activision Blizzard Inc. | 575,000 | 9,585 | |
| Apple Inc. | 19,650 | 9,368 | |
| Mastercard Inc. Class A | 8,600 | 5,786 | |
| Analog Devices Inc. | 107,000 | 5,034 | |
| * | eBay Inc. | 42,000 | 2,343 |
| Xilinx Inc. | 27,300 | 1,279 | |
| * | VMware Inc. Class A | 3,000 | 243 |
| * | Micron Technology Inc. | 12,000 | 210 |
| * | Yahoo! Inc. | 2,000 | 66 |
| 1,411,895 | |||
| Materials (4.0%) | |||
| Monsanto Co. | 787,850 | 82,228 | |
| Cabot Corp. | 750,000 | 32,033 | |
| Potash Corp. of | |||
| Saskatchewan Inc. | 938,500 | 29,356 | |
| Praxair Inc. | 229,700 | 27,612 | |
| EI du Pont de | |||
| Nemours & Co. | 300,000 | 17,568 | |
| Celanese Corp. Class A | 265,000 | 13,990 | |
| Dow Chemical Co. | 340,000 | 13,056 | |
| Greif Inc. Class A | 130,000 | 6,374 | |
| * | Crown Holdings Inc. | 100,000 | 4,228 |
| International Paper Co. | 75,000 | 3,360 | |
| Greif Inc. Class B | 37,000 | 1,970 | |
| 231,775 | |||
| Utilities (0.5%) | |||
| Public Service Enterprise | |||
| Group Inc. | 398,393 | 13,119 | |
| Exelon Corp. | 254,500 | 7,543 | |
| NextEra Energy Inc. | 56,700 | 4,545 | |
| Edison International | 35,800 | 1,649 | |
17
| PRIMECAP Core Fund | ||
| Market | ||
| Value | ||
| Shares | ($000) | |
| AES Corp. | 99,999 | 1,329 |
| FirstEnergy Corp. | 12,000 | 438 |
| 28,623 | ||
| Total Common Stocks | ||
| (Cost $3,317,985) | 5,510,903 | |
| Temporary Cash Investment (5.0%) | ||
| Money Market Fund (5.0%) | ||
| 1,2 Vanguard Market | ||
| Liquidity Fund, 0.112% | ||
| (Cost $290,872) | 290,872,393 | 290,872 |
| Total Investments (100.5%) | ||
| (Cost $3,608,857) | 5,801,775 | |
| Other Assets and Liabilities (-0.5%) | ||
| Other Assets | 11,251 | |
| Liabilities2 | (39,007) | |
| (27,756) | ||
| Net Assets (100%) | ||
| Applicable to 309,528,732 outstanding | ||
| $.001 par value shares of beneficial | ||
| interest (unlimited authorization) | 5,774,019 | |
| Net Asset Value Per Share | $18.65 | |
| At September 30, 2013, net assets consisted of: | |
| Amount | |
| ($000) | |
| Paid-in Capital | 3,356,386 |
| Undistributed Net Investment Income | 31,537 |
| Accumulated Net Realized Gains | 192,887 |
| Unrealized Appreciation (Depreciation) | |
| Investment Securities | 2,192,918 |
| Foreign Currencies | 291 |
| Net Assets | 5,774,019 |
See Note A in Notes to Financial Statements.
* Non-income-producing security.
^ Part of security position is on loan to broker-dealers. The total value of securities on loan is $10,135,000.
1 Affiliated money market fund available only to Vanguard funds and certain trusts and accounts managed by Vanguard. Rate shown is the 7-day yield.
2 Includes $10,539,000 of collateral received for securities on loan.
ADR—American Depositary Receipt.
See accompanying Notes, which are an integral part of the Financial Statements.
18
| PRIMECAP Core Fund | |
| Statement of Operations | |
| Year Ended | |
| September 30, 2013 | |
| ($000) | |
| Investment Income | |
| Income | |
| Dividends1 | 98,544 |
| Interest2 | 260 |
| Securities Lending | 675 |
| Total Income | 99,479 |
| Expenses | |
| Investment Advisory Fees—Note B | 16,051 |
| The Vanguard Group—Note C | |
| Management and Administrative | 8,963 |
| Marketing and Distribution | 699 |
| Custodian Fees | 84 |
| Auditing Fees | 26 |
| Shareholders’ Reports | 48 |
| Trustees’ Fees and Expenses | 13 |
| Total Expenses | 25,884 |
| Net Investment Income | 73,595 |
| Realized Net Gain (Loss) | |
| Investment Securities Sold | 204,454 |
| Foreign Currencies | (44) |
| Realized Net Gain (Loss) | 204,410 |
| Change in Unrealized Appreciation (Depreciation) | |
| Investment Securities | 1,024,265 |
| Foreign Currencies | 198 |
| Change in Unrealized Appreciation (Depreciation) | 1,024,463 |
| Net Increase (Decrease) in Net Assets Resulting from Operations | 1,302,468 |
| 1 Dividends are net of foreign withholding taxes of $2,861,000. | |
| 2 Interest income from an affiliated company of the fund was $260,000. | |
See accompanying Notes, which are an integral part of the Financial Statements.
19
| PRIMECAP Core Fund | ||
| Statement of Changes in Net Assets | ||
| Year Ended September 30, | ||
| 2013 | 2012 | |
| ($000) | ($000) | |
| Increase (Decrease) in Net Assets | ||
| Operations | ||
| Net Investment Income | 73,595 | 65,304 |
| Realized Net Gain (Loss) | 204,410 | 139,260 |
| Change in Unrealized Appreciation (Depreciation) | 1,024,463 | 735,627 |
| Net Increase (Decrease) in Net Assets Resulting from Operations | 1,302,468 | 940,191 |
| Distributions | ||
| Net Investment Income | (79,568) | (55,432) |
| Realized Capital Gain | (81,710) | — |
| Total Distributions | (161,278) | (55,432) |
| Capital Share Transactions | ||
| Issued | 402,141 | 165,417 |
| Issued in Lieu of Cash Distributions | 144,815 | 49,692 |
| Redeemed1 | (616,525) | (742,140) |
| Net Increase (Decrease) from Capital Share Transactions | (69,569) | (527,031) |
| Total Increase (Decrease) | 1,071,621 | 357,728 |
| Net Assets | ||
| Beginning of Period | 4,702,398 | 4,344,670 |
| End of Period2 | 5,774,019 | 4,702,398 |
1 Net of redemption fees for fiscal 2012 of $90,000. Effective May 23, 2012, the redemption fee was eliminated.
2 Net Assets—End of Period includes undistributed net investment income of $31,537,000 and $41,625,000.
See accompanying Notes, which are an integral part of the Financial Statements.
20
| PRIMECAP Core Fund | |||||
| Financial Highlights | |||||
| For a Share Outstanding | Year Ended September 30, | ||||
| Throughout Each Period | 2013 | 2012 | 2011 | 2010 | 2009 |
| Net Asset Value, Beginning of Period | $14.98 | $12.37 | $12.51 | $11.42 | $11.41 |
| Investment Operations | |||||
| Net Investment Income | . 242 | .206 | .145 | .1331 | .097 |
| Net Realized and Unrealized Gain (Loss) | |||||
| on Investments | 3.955 | 2.567 | (.143) | 1.051 | .030 |
| Total from Investment Operations | 4.197 | 2.773 | .002 | 1.184 | .127 |
| Distributions | |||||
| Dividends from Net Investment Income | (. 260) | (.163) | (.142) | (. 094) | (.117) |
| Distributions from Realized Capital Gains | (.267) | — | — | — | — |
| Total Distributions | (.527) | (.163) | (.142) | (. 094) | (.117) |
| Net Asset Value, End of Period | $18.65 | $14.98 | $12.37 | $12.51 | $11.42 |
| Total Return2 | 28.88% | 22.55% | -0.10% | 10.39% | 1.45% |
| Ratios/Supplemental Data | |||||
| Net Assets, End of Period (Millions) | $5,774 | $4,702 | $4,345 | $4,569 | $4,245 |
| Ratio of Total Expenses to | |||||
| Average Net Assets | 0.50% | 0.50% | 0.51% | 0.51% | 0.54% |
| Ratio of Net Investment Income to | |||||
| Average Net Assets | 1.42% | 1.39% | 1.01% | 1.09%1 | 1.10% |
| Portfolio Turnover Rate | 7% | 10% | 9% | 8% | 5% |
1 Net investment income per share and the ratio of net investment income to average net assets include $.019 and 0.15%, respectively, resulting from a special dividend from Weyerhaeuser Co. in July 2010.
2 Total returns do not include transaction or account service fees that may have applied in the periods shown. Fund prospectuses provide information about any applicable transaction and account service fees.
See accompanying Notes, which are an integral part of the Financial Statements.
21
PRIMECAP Core Fund
Notes to Financial Statements
Vanguard PRIMECAP Core Fund is registered under the Investment Company Act of 1940 as an open-end investment company, or mutual fund.
A. The following significant accounting policies conform to generally accepted accounting principles for U.S. mutual funds. The fund consistently follows such policies in preparing its financial statements.
1. Security Valuation: Securities are valued as of the close of trading on the New York Stock Exchange (generally 4 p.m., Eastern time) on the valuation date. Equity securities are valued at the latest quoted sales prices or official closing prices taken from the primary market in which each security trades; such securities not traded on the valuation date are valued at the mean of the latest quoted bid and asked prices. Securities for which market quotations are not readily available, or whose values have been affected by events occurring before the fund’s pricing time but after the close of the securities’ primary markets, are valued at their fair values calculated according to procedures adopted by the board of trustees. These procedures include obtaining quotations from an independent pricing service, monitoring news to identify significant market- or security-specific events, and evaluating changes in the values of foreign market proxies (for example, ADRs, futures contracts, or exchange-traded funds), between the time the foreign markets close and the fund’s pricing time. When fair-value pricing is employed, the prices of securities used by a fund to calculate its net asset value may differ from quoted or published prices for the same securities. Investments in Vanguard Market Liquidity Fund are valued at that fund’s net asset value.
2. Foreign Currency: Securities and other assets and liabilities denominated in foreign currencies are translated into U.S. dollars using exchange rates obtained from an independent third party as of the fund’s pricing time on the valuation date. Realized gains (losses) and unrealized appreciation (depreciation) on investment securities include the effects of changes in exchange rates since the securities were purchased, combined with the effects of changes in security prices. Fluctuations in the value of other assets and liabilities resulting from changes in exchange rates are recorded as unrealized foreign currency gains (losses) until the assets or liabilities are settled in cash, at which time they are recorded as realized foreign currency gains (losses).
3. Federal Income Taxes: The fund intends to continue to qualify as a regulated investment company and distribute all of its taxable income. Management has analyzed the fund’s tax positions taken for all open federal income tax years (September 30, 2010–2013), and has concluded that no provision for federal income tax is required in the fund’s financial statements.
4. Distributions: Distributions to shareholders are recorded on the ex-dividend date.
5. Securities Lending: To earn additional income, the fund may lend its securities to qualified institutional borrowers. Security loans are required to be secured at all times by collateral in an amount at least equal to the market value of securities loaned. Daily market fluctuations could cause the value of loaned securities to be more or less than the value of the collateral received. When this occurs, the collateral is adjusted and settled on the next business day. The fund further mitigates its counterparty risk by entering into securities lending transactions only with a diverse group of prequalified counterparties, monitoring their financial strength, and entering into master securities lending agreements with its counterparties. The master securities lending agreements provide that, in the event of a counterparty’s default (including bankruptcy), the fund may terminate any loans with that borrower, determine the net amount owed, and sell or retain the collateral up to the net amount owed to the fund; however, such actions may be subject to legal proceedings. While collateral mitigates counterparty risk, in the absence of a default the fund may experience delays and costs in recovering the securities loaned. The fund invests cash collateral received in Vanguard
22
PRIMECAP Core Fund
Market Liquidity Fund, and records a liability for the return of the collateral, during the period the securities are on loan. Securities lending income represents fees charged to borrowers plus income earned on invested cash collateral, less expenses associated with the loan.
6. Other: Dividend income is recorded on the ex-dividend date. Interest income includes income distributions received from Vanguard Market Liquidity Fund and is accrued daily. Security transactions are accounted for on the date securities are bought or sold. Costs used to determine realized gains (losses) on the sale of investment securities are those of the specific securities sold.
B. PRIMECAP Management Company provides investment advisory services to the fund for a fee calculated at an annual percentage rate of average net assets. For the year ended September 30, 2013, the investment advisory fee represented an effective annual rate of 0.31% of the fund’s average net assets.
C. The Vanguard Group furnishes at cost corporate management, administrative, marketing, and distribution services. The costs of such services are allocated to the fund under methods approved by the board of trustees. The fund has committed to provide up to 0.40% of its net assets in capital contributions to Vanguard. At September 30, 2013, the fund had contributed capital of $680,000 to Vanguard (included in Other Assets), representing 0.01% of the fund’s net assets and 0.27% of Vanguard’s capitalization. The fund’s trustees and officers are also directors and officers of Vanguard.
D. Various inputs may be used to determine the value of the fund’s investments. These inputs are summarized in three broad levels for financial statement purposes. The inputs or methodologies used to value securities are not necessarily an indication of the risk associated with investing in those securities.
Level 1—Quoted prices in active markets for identical securities.
Level 2—Other significant observable inputs (including quoted prices for similar securities, interest rates, prepayment speeds, credit risk, etc.).
Level 3—Significant unobservable inputs (including the fund’s own assumptions used to determine the fair value of investments).
The following table summarizes the market value of the fund’s investments as of September 30, 2013, based on the inputs used to value them:
| Level 1 | Level 2 | Level 3 | |
| Investments | ($000) | ($000) | ($000) |
| Common Stocks | 5,157,116 | 353,787 | — |
| Temporary Cash Investments | 290,872 | — | — |
| Total | 5,447,988 | 353,787 | — |
E. Distributions are determined on a tax basis and may differ from net investment income and realized capital gains for financial reporting purposes. Differences may be permanent or temporary. Permanent differences are reclassified among capital accounts in the financial statements to reflect their tax character. Temporary differences arise when certain items of income, expense, gain, or loss are recognized in different periods for financial statement and tax purposes; these differences will reverse at some time in the future. Differences in classification may also result from the treatment of short-term gains as ordinary income for tax purposes.
23
PRIMECAP Core Fund
During the year ended September 30, 2013, the fund realized net foreign currency losses of $44,000, which decreased distributable net income for tax purposes; accordingly, such losses have been reclassified from accumulated net realized gains to undistributed net investment income.
The fund used a tax accounting practice to treat a portion of the price of capital shares redeemed during the year as distributions from net investment income and realized capital gains. Accordingly, the fund has reclassified $4,071,000 from undistributed net investment income, and $11,237,000 from accumulated net realized gains, to paid-in capital.
For tax purposes, at September 30, 2013, the fund had $38,894,000 of ordinary income and $192,885,000 of long-term capital gains available for distribution.
At September 30, 2013, the cost of investment securities for tax purposes was $3,608,857,000. Net unrealized appreciation of investment securities for tax purposes was $2,192,918,000, consisting of unrealized gains of $2,266,410,000 on securities that had risen in value since their purchase and $73,492,000 in unrealized losses on securities that had fallen in value since their purchase.
F. During the year ended September 30, 2013, the fund purchased $361,140,000 of investment securities and sold $708,473,000 of investment securities, other than temporary cash investments.
G. Capital shares issued and redeemed were:
| Year Ended September 30, | ||
| 2013 | 2012 | |
| Shares | Shares | |
| (000) | (000) | |
| Issued | 23,662 | 11,732 |
| Issued in Lieu of Cash Distributions | 9,674 | 3,662 |
| Redeemed | (37,714) | (52,603) |
| Net Increase (Decrease) in Shares Outstanding | (4,378) | (37,209) |
H. Management has determined that no material events or transactions occurred subsequent to September 30, 2013, that would require recognition or disclosure in these financial statements.
24
Report of Independent Registered
Public Accounting Firm
To the Trustees of Vanguard Fenway Funds and the Shareholders of the Vanguard PRIMECAP Core Fund:
In our opinion, the accompanying statement of net assets and the related statements of operations and of changes in net assets and the financial highlights present fairly, in all material respects, the financial position of the Vanguard PRIMECAP Core Fund (constituting a separate portfolio of Vanguard Fenway Funds, hereafter referred to as the “Fund”) at September 30, 2013, the results of its operations for the year then ended, the changes in its net assets for each of the two years in the period then ended, and the financial highlights for each of the five years in the period then ended, in conformity with accounting principles generally accepted in the United States of America. These financial statements and financial highlights (hereafter referred to as “financial statements”) are the responsibility of the Fund’s management; our responsibility is to express an opinion on these financial statements based on our audits. We conducted our audits of these financial statements in accordance with the standards of the Public Company Accounting Oversight Board (United States). Those standards require that we plan and perform the audit to obtain reasonable assurance about whether the financial statements are free of material misstatement. An audit includes examining, on a test basis, evidence supporting the amounts and disclosures in the financial statements, assessing the accounting principles used and significant estimates made by management, and evaluating the overall financial statement presentation. We believe that our audits, which included confirmation of securities at September 30, 2013 by correspondence with the custodian and by agreement to the underlying ownership records of the transfer agent, provide a reasonable basis for our opinion.
PricewaterhouseCoopers LLP
Philadelphia, Pennsylvania
November 14, 2013
| Special 2013 tax information (unaudited) for Vanguard PRIMECAP Core Fund |
| This information for the fiscal year ended September 30, 2013, is included pursuant to provisions of |
| the Internal Revenue Code. |
| The fund distributed $92,946,000 as capital gain dividends (from net long-term capital gains) to |
| shareholders during the fiscal year. |
| The fund distributed $79,568,000 of qualified dividend income to shareholders during the fiscal year. |
| For corporate shareholders, 100% of investment income (dividend income plus short-term gains, |
| if any) qualifies for the dividends-received deduction. |
25
Your Fund’s After-Tax Returns
This table presents returns for your fund both before and after taxes. The after-tax returns are shown in two ways: (1) assuming that an investor owned the fund during the entire period and paid taxes on the fund’s distributions, and (2) assuming that an investor paid taxes on the fund’s distributions and sold all shares at the end of each period.
Calculations are based on the highest individual federal income tax and capital gains tax rates in effect at the times of the distributions and the hypothetical sales. State and local taxes were not considered. After-tax returns reflect any qualified dividend income, using actual prior-year figures and estimates for 2013. (In the example, returns after the sale of fund shares may be higher than those assuming no sale. This occurs when the sale would have produced a capital loss. The calculation assumes that the investor received a tax deduction for the loss.)
Please note that your actual after-tax returns will depend on your tax situation and may differ from those shown. Also note that if you own the fund in a tax-deferred account, such as an individual retirement account or a 401(k) plan, this information does not apply to you. Such accounts are not subject to current taxes.
Finally, keep in mind that a fund’s performance—whether before or after taxes—does not guarantee future results.
Average Annual Total Returns: PRIMECAP Core Fund
Periods Ended September 30, 2013
| Since | |||
| One | Five | Inception | |
| Year | Years | (12/9/2004) | |
| Returns Before Taxes | 28.88% | 12.06% | 8.89% |
| Returns After Taxes on Distributions | 28.22 | 11.80 | 8.64 |
| Returns After Taxes on Distributions and Sale of Fund Shares | 17.27 | 9.66 | 7.25 |
26
About Your Fund’s Expenses
As a shareholder of the fund, you incur ongoing costs, which include costs for portfolio management, administrative services, and shareholder reports (like this one), among others. Operating expenses, which are deducted from a fund’s gross income, directly reduce the investment return of the fund.
A fund’s expenses are expressed as a percentage of its average net assets. This figure is known as the expense ratio. The following examples are intended to help you understand the ongoing costs (in dollars) of investing in your fund and to compare these costs with those of other mutual funds. The examples are based on an investment of $1,000 made at the beginning of the period shown and held for the entire period.
The accompanying table illustrates your fund’s costs in two ways:
• Based on actual fund return. This section helps you to estimate the actual expenses that you paid over the period. The ”Ending Account Value“ shown is derived from the fund‘s actual return, and the third column shows the dollar amount that would have been paid by an investor who started with $1,000 in the fund. You may use the information here, together with the amount you invested, to estimate the expenses that you paid over the period.
To do so, simply divide your account value by $1,000 (for example, an $8,600 account value divided by $1,000 = 8.6), then multiply the result by the number given for your fund under the heading ”Expenses Paid During Period.“
• Based on hypothetical 5% yearly return. This section is intended to help you compare your fund‘s costs with those of other mutual funds. It assumes that the fund had a yearly return of 5% before expenses, but that the expense ratio is unchanged. In this case—because the return used is not the fund’s actual return—the results do not apply to your investment. The example is useful in making comparisons because the Securities and Exchange Commission requires all mutual funds to calculate expenses based on a 5% return. You can assess your fund’s costs by comparing this hypothetical example with the hypothetical examples that appear in shareholder reports of other funds.
Note that the expenses shown in the table are meant to highlight and help you compare ongoing costs only and do not reflect transaction costs incurred by the fund for buying and selling securities. Further, the expenses do not include any purchase, redemption, or account service fees described in the fund prospectus. If such fees were applied to your account, your costs would be higher. Your fund does not carry a “sales load.”
The calculations assume no shares were bought or sold during the period. Your actual costs may have been higher or lower, depending on the amount of your investment and the timing of any purchases or redemptions.
You can find more information about the fund’s expenses, including annual expense ratios, in the Financial Statements section of this report. For additional information on operating expenses and other shareholder costs, please refer to your fund’s current prospectus.
27
| Six Months Ended September 30, 2013 | |||
| Beginning | Ending | Expenses | |
| Account Value | Account Value | Paid During | |
| PRIMECAP Core Fund | 3/31/2013 | 9/30/2013 | Period |
| Based on Actual Fund Return | $1,000.00 | $1,103.55 | $2.64 |
| Based on Hypothetical 5% Yearly Return | 1,000.00 | 1,022.56 | 2.54 |
The calculations are based on expenses incurred in the most recent six-month period. The fund’s annualized six-month expense ratio for that period is 0.50%. The dollar amounts shown as “Expenses Paid” are equal to the annualized expense ratio multiplied by the average account value over the period, multiplied by the number of days in the most recent six-month period, then divided by the number of days in the most recent 12-month period.
28
Glossary
30-Day SEC Yield. A fund’s 30-day SEC yield is derived using a formula specified by the U.S. Securities and Exchange Commission. Under the formula, data related to the fund’s security holdings in the previous 30 days are used to calculate the fund’s hypothetical net income for that period, which is then annualized and divided by the fund’s estimated average net assets over the calculation period. For the purposes of this calculation, a security’s income is based on its current market yield to maturity (for bonds), its actual income (for asset-backed securities), or its projected dividend yield (for stocks). Because the SEC yield represents hypothetical annualized income, it will differ—at times significantly—from the fund’s actual experience. As a result, the fund’s income distributions may be higher or lower than implied by the SEC yield.
Beta. A measure of the magnitude of a fund’s past share-price fluctuations in relation to the ups and downs of a given market index. The index is assigned a beta of 1.00. Compared with a given index, a fund with a beta of 1.20 typically would have seen its share price rise or fall by 12% when the index rose or fell by 10%. For this report, beta is based on returns over the past 36 months for both the fund and the index. Note that a fund’s beta should be reviewed in conjunction with its R-squared (see definition). The lower the R-squared, the less correlation there is between the fund and the index, and the less reliable beta is as an indicator of volatility.
Dividend Yield. Dividend income earned by stocks, expressed as a percentage of the aggregate market value (or of net asset value, for a fund). The yield is determined by dividing the amount of the annual dividends by the aggregate value (or net asset value) at the end of the period. For a fund, the dividend yield is based solely on stock holdings and does not include any income produced by other investments.
Earnings Growth Rate. The average annual rate of growth in earnings over the past five years for the stocks now in a fund.
Equity Exposure. A measure that reflects a fund’s investments in stocks and stock futures. Any holdings in short-term reserves are excluded.
Expense Ratio. A fund’s total annual operating expenses expressed as a percentage of the fund’s average net assets. The expense ratio includes management and administrative expenses, but does not include the transaction costs of buying and selling portfolio securities.
Foreign Holdings. The percentage of a fund represented by securities or depositary receipts of companies based outside the United States.
Inception Date. The date on which the assets of a fund (or one of its share classes) are first invested in accordance with the fund’s investment objective. For funds with a subscription period, the inception date is the day after that period ends. Investment performance is measured from the inception date.
Median Market Cap. An indicator of the size of companies in which a fund invests; the midpoint of market capitalization (market price x shares outstanding) of a fund’s stocks, weighted by the proportion of the fund’s assets invested in each stock. Stocks representing half of the fund’s assets have market capitalizations above the median, and the rest are below it.
Price/Book Ratio. The share price of a stock divided by its net worth, or book value, per share. For a fund, the weighted average price/book ratio of the stocks it holds.
29
Price/Earnings Ratio. The ratio of a stock’s current price to its per-share earnings over the past year. For a fund, the weighted average P/E of the stocks it holds. P/E is an indicator of market expectations about corporate prospects; the higher the P/E, the greater the expectations for a company’s future growth.
R-Squared. A measure of how much of a fund’s past returns can be explained by the returns from the market in general, as measured by a given index. If a fund’s total returns were precisely synchronized with an index’s returns, its R-squared would be 1.00. If the fund’s returns bore no relationship to the index’s returns, its R-squared would be 0. For this report, R-squared is based on returns over the past 36 months for both the fund and the index.
Return on Equity. The annual average rate of return generated by a company during the past five years for each dollar of shareholder’s equity (net income divided by shareholder’s equity). For a fund, the weighted average return on equity for the companies whose stocks it holds.
Short-Term Reserves. The percentage of a fund invested in highly liquid, short-term securities that can be readily converted to cash.
Turnover Rate. An indication of the fund’s trading activity. Funds with high turnover rates incur higher transaction costs and may be more likely to distribute capital gains (which may be taxable to investors). The turnover rate excludes in-kind transactions, which have minimal impact on costs.
30
This page intentionally left blank.
The People Who Govern Your Fund
The trustees of your mutual fund are there to see that the fund is operated and managed in your best interests since, as a shareholder, you are a part owner of the fund. Your fund’s trustees also serve on the board of directors of The Vanguard Group, Inc., which is owned by the Vanguard funds and provides services to them on an at-cost basis.
A majority of Vanguard’s board members are independent, meaning that they have no affiliation with Vanguard or the funds they oversee, apart from the sizable personal investments they have made as private individuals. The independent board members have distinguished backgrounds in business, academia, and public service. Each of the trustees and executive officers oversees 181 Vanguard funds.
The following table provides information for each trustee and executive officer of the fund. More information about the trustees is in the Statement of Additional Information, which can be obtained, without charge, by contacting Vanguard at 800-662-7447, or online at vanguard.com.
| InterestedTrustee1 | and Delphi Automotive LLP (automotive components); |
| Senior Advisor at New Mountain Capital; Trustee of | |
| F. William McNabb III | The Conference Board. |
| Born 1957. Trustee Since July 2009. Chairman of the | |
| Board. Principal Occupation(s) During the Past Five | Amy Gutmann |
| Years: Chairman of the Board of The Vanguard Group, | Born 1949. Trustee Since June 2006. Principal |
| Inc., and of each of the investment companies served | Occupation(s) During the Past Five Years: President |
| by The Vanguard Group, since January 2010; Director | of the University of Pennsylvania; Christopher H. |
| of The Vanguard Group since 2008; Chief Executive | Browne Distinguished Professor of Political Science |
| Officer and President of The Vanguard Group and of | in the School of Arts and Sciences with secondary |
| each of the investment companies served by The | appointments at the Annenberg School for |
| Vanguard Group since 2008; Director of Vanguard | Communication and the Graduate School of Education |
| Marketing Corporation; Managing Director of The | of the University of Pennsylvania; Member of the |
| Vanguard Group (1995–2008). | National Commission on the Humanities and Social |
| Sciences; Trustee of Carnegie Corporation of New | |
| York and of the National Constitution Center; Chair | |
| IndependentTrustees | of the U. S. Presidential Commission for the Study |
| of Bioethical Issues. | |
| Emerson U. Fullwood | |
| Born 1948. Trustee Since January 2008. Principal | |
| Occupation(s) During the Past Five Years: Executive | JoAnn Heffernan Heisen |
| Chief Staff and Marketing Officer for North America | Born 1950. Trustee Since July 1998. Principal |
| and Corporate Vice President (retired 2008) of Xerox | Occupation(s) During the Past Five Years: Corporate |
| Corporation (document management products and | Vice President and Chief Global Diversity Officer |
| services); Executive in Residence and 2010 | (retired 2008) and Member of the Executive |
| Distinguished Minett Professor at the Rochester | Committee (1997–2008) of Johnson & Johnson |
| Institute of Technology; Director of SPX Corporation | (pharmaceuticals/medical devices/consumer |
| (multi-industry manufacturing), the United Way of | products); Director of Skytop Lodge Corporation |
| Rochester, Amerigroup Corporation (managed health | (hotels), the University Medical Center at Princeton, |
| care), the University of Rochester Medical Center, | the Robert Wood Johnson Foundation, and the Center |
| Monroe Community College Foundation, and North | for Talent Innovation; Member of the Advisory Board |
| Carolina A&T University. | of the Maxwell School of Citizenship and Public Affairs |
| at Syracuse University. | |
| Rajiv L. Gupta | |
| Born 1945. Trustee Since December 2001. 2 | F. Joseph Loughrey |
| Principal Occupation(s) During the Past Five Years: | Born 1949. Trustee Since October 2009. Principal |
| Chairman and Chief Executive Officer (retired 2009) | Occupation(s) During the Past Five Years: President |
| and President (2006–2008) of Rohm and Haas Co. | and Chief Operating Officer (retired 2009) of Cummins |
| (chemicals); Director of Tyco International, Ltd. | Inc. (industrial machinery); Chairman of the Board of |
| (diversified manufacturing and services), Hewlett- | Hillenbrand, Inc. (specialized consumer services) and |
| Packard Co. (electronic computer manufacturing), | of Oxfam America; Director of SKF AB (industrial |
| machinery) and the Lumina Foundation for Education; | Executive Officers | |
| Member of the Advisory Council for the College of | ||
| Arts and Letters and of the Advisory Board to the | Glenn Booraem | |
| Kellogg Institute for International Studies, both at | Born 1967. Controller Since July 2010. Principal | |
| the University of Notre Dame. | Occupation(s) During the Past Five Years: Principal | |
| of The Vanguard Group, Inc.; Controller of each of | ||
| Mark Loughridge | the investment companies served by The Vanguard | |
| Born 1953. Trustee Since March 2012. Principal | Group; Assistant Controller of each of the investment | |
| Occupation(s) During the Past Five Years: Senior Vice | companies served by The Vanguard Group (2001–2010). | |
| President and Chief Financial Officer at IBM (information | ||
| technology services); Fiduciary Member of IBM’s | Thomas J. Higgins | |
| Retirement Plan Committee. | Born 1957. Chief Financial Officer Since September | |
| 2008. Principal Occupation(s) During the Past Five | ||
| Scott C. Malpass | Years: Principal of The Vanguard Group, Inc.; Chief | |
| Born 1962. Trustee Since March 2012. Principal | Financial Officer of each of the investment companies | |
| Occupation(s) During the Past Five Years: Chief | served by The Vanguard Group; Treasurer of each of | |
| Investment Officer and Vice President at the University | the investment companies served by The Vanguard | |
| of Notre Dame; Assistant Professor of Finance at the | Group (1998–2008). | |
| Mendoza College of Business at Notre Dame; Member | ||
| of the Notre Dame 403(b) Investment Committee; | Kathryn J. Hyatt | |
| Director of TIFF Advisory Services, Inc. (investment | Born 1955. Treasurer Since November 2008. Principal | |
| advisor); Member of the Investment Advisory | Occupation(s) During the Past Five Years: Principal of | |
| Committees of the Financial Industry Regulatory | The Vanguard Group, Inc.; Treasurer of each of the | |
| Authority (FINRA) and of Major League Baseball. | investment companies served by The Vanguard | |
| Group; Assistant Treasurer of each of the investment | ||
| André F. Perold | companies served by The Vanguard Group (1988–2008). | |
| Born 1952. Trustee Since December 2004. Principal | ||
| Occupation(s) During the Past Five Years: George | Heidi Stam | |
| Gund Professor of Finance and Banking at the Harvard | Born 1956. Secretary Since July 2005. Principal | |
| Business School (retired 2011); Chief Investment | Occupation(s) During the Past Five Years: Managing | |
| Officer and Managing Partner of HighVista Strategies | Director of The Vanguard Group, Inc.; General Counsel | |
| LLC (private investment firm); Director of Rand | of The Vanguard Group; Secretary of The Vanguard | |
| Merchant Bank; Overseer of the Museum of Fine | Group and of each of the investment companies | |
| Arts Boston. | served by The Vanguard Group; Director and Senior | |
| Vice President of Vanguard Marketing Corporation. | ||
| Alfred M. Rankin, Jr. | ||
| Born 1941. Trustee Since January 1993. Principal | Vanguard Senior ManagementTeam | |
| Occupation(s) During the Past Five Years: Chairman, | ||
| President, and Chief Executive Officer of NACCO | Mortimer J. Buckley | Chris D. McIsaac |
| Industries, Inc. (housewares/lignite) and of Hyster-Yale | Kathleen C. Gubanich | Michael S. Miller |
| Materials Handling, Inc. (forklift trucks); Director of | Paul A. Heller | James M. Norris |
| the National Association of Manufacturers; Chairman | Martha G. King | Glenn W. Reed |
| of the Board of University Hospitals of Cleveland; | John T. Marcante | |
| Advisory Chairman of the Board of The Cleveland | ||
| Museum of Art. | ||
| Chairman Emeritus and Senior Advisor | ||
| Peter F. Volanakis | ||
| Born 1955. Trustee Since July 2009. Principal | John J. Brennan | |
| Occupation(s) During the Past Five Years: President | Chairman, 1996–2009 | |
| and Chief Operating Officer (retired 2010) of Corning | Chief Executive Officer and President, 1996–2008 | |
| Incorporated (communications equipment); Director | ||
| of SPX Corporation (multi-industry manufacturing); | Founder | |
| Overseer of the Amos Tuck School of Business | ||
| Administration at Dartmouth College; Advisor to the | John C. Bogle | |
| Norris Cotton Cancer Center. | Chairman and Chief Executive Officer, 1974–1996 | |
1 Mr. McNabb is considered an “interested person,” as defined in the Investment Company Act of 1940, because he is an officer of the Vanguard funds.
2 December 2002 for Vanguard Equity Income Fund, Vanguard Growth Equity Fund, the Vanguard Municipal Bond Funds, and the Vanguard State Tax-Exempt Funds.
 | |
| P.O. Box 2600 | |
| Valley Forge, PA 19482-2600 |
Connect with Vanguard® > vanguard.com
| Fund Information > 800-662-7447 | |
| Direct Investor Account Services > 800-662-2739 | |
| Institutional Investor Services > 800-523-1036 | |
| Text Telephone for People | |
| With Hearing Impairment > 800-749-7273 | |
| This material may be used in conjunction | |
| with the offering of shares of any Vanguard | |
| fund only if preceded or accompanied by | |
| the fund’s current prospectus. | |
| All comparative mutual fund data are from Lipper, a | |
| Thomson Reuters Company, or Morningstar, Inc., unless | |
| otherwise noted. | |
| You can obtain a free copy of Vanguard’s proxy voting | |
| guidelines by visiting vanguard.com/proxyreporting or by | |
| calling Vanguard at 800-662-2739. The guidelines are | |
| also available from the SEC’s website, sec.gov. In | |
| addition, you may obtain a free report on how your fund | |
| voted the proxies for securities it owned during the 12 | |
| months ended June 30. To get the report, visit either | |
| vanguard.com/proxyreporting or sec.gov. | |
| You can review and copy information about your fund at | |
| the SEC’s Public Reference Room in Washington, D.C. To | |
| find out more about this public service, call the SEC at | |
| 202-551-8090. Information about your fund is also | |
| available on the SEC’s website, and you can receive | |
| copies of this information, for a fee, by sending a | |
| request in either of two ways: via e-mail addressed to | |
| publicinfo@sec.gov or via regular mail addressed to the | |
| Public Reference Section, Securities and Exchange | |
| Commission, Washington, DC 20549-1520. | |
| © 2013 The Vanguard Group, Inc. | |
| All rights reserved. | |
| Vanguard Marketing Corporation, Distributor. | |
| Q12200 112013 | |
Item 2: Code of Ethics. The Registrant has adopted a code of ethics that applies to the Registrant’s principal executive officer, principal financial officer, principal accounting officer or controller or persons performing similar functions. The Code of Ethics was amended during the reporting period covered by this report to make certain technical, non-material changes.
Item 3: Audit Committee Financial Expert. The following members of the Audit Committee have been determined by the Registrant’s Board of Trustees to be Audit Committee Financial Experts serving on its Audit Committee, and to be independent: Rajiv L. Gupta, Amy Gutmann, JoAnn Heffernan Heisen, F. Joseph Loughrey, Mark Loughridge, Scott C. Malpass, André F. Perold, and Alfred M. Rankin, Jr.
Item 4: Principal Accountant Fees and Services.
(a) Audit Fees.
Audit Fees of the Registrant
Fiscal Year Ended September 30, 2013: $82,000 Fiscal Year Ended September 30, 2012: $82,000
Aggregate Audit Fees of Registered Investment Companies in the Vanguard Group.
Fiscal Year Ended September 30, 2013: $5,714,113
Fiscal Year Ended September 30, 2012: $4,809,780
Includes fees billed in connection with audits of the Registrant and other registered investment companies in the Vanguard complex. Also includes fees billed in connection with audits of The Vanguard Group, Inc. and Vanguard Marketing Corporation for Fiscal Year Ended September 30, 2013.
(b) Audit-Related Fees.
Fiscal Year Ended September 30, 2013: $1,552,950
Fiscal Year Ended September 30, 2012: $1,812,565
Includes fees billed in connection with assurance and related services provided to the Registrant, other registered investment companies in the Vanguard complex, The Vanguard Group, Inc., and Vanguard Marketing Corporation.
(c) Tax Fees.
Fiscal Year Ended September 30, 2013: $110,000
Fiscal Year Ended September 30, 2012: $490,518
Includes fees billed in connection with tax compliance, planning, and advice services provided to the Registrant, other registered investment companies in the Vanguard complex, The Vanguard Group, Inc., and Vanguard Marketing Corporation. Also includes fees billed in connection with certain tax services related to audits of the Registrant and other registered investment companies in the Vanguard complex for Fiscal Year Ended September 30, 2012.
(d) All Other Fees.
Fiscal Year Ended September 30, 2013: $132,000
Fiscal Year Ended September 30, 2012: $16,000
Includes fees billed in connection with tax compliance, planning, and advice services provided to the Registrant, other registered investment companies in the Vanguard complex, The Vanguard Group, Inc., and Vanguard Marketing Corporation.
(e) (1) Pre-Approval Policies. The policy of the Registrant’s Audit Committee is to consider and, if appropriate, approve before the principal accountant is engaged for such services, all specific audit and non-audit services provided to: the Registrant, other registered investment companies in the Vanguard complex, The Vanguard Group, Inc., and entities controlled by The Vanguard Group, Inc. that provide ongoing services to the Registrant. In making a determination, the Audit Committee considers whether the services are consistent with maintaining the principal accountant’s independence.
In the event of a contingency situation in which the principal accountant is needed to provide services in between scheduled Audit Committee meetings, the Chairman of the Audit Committee would be called on to consider and, if appropriate, pre-approve audit or permitted non-audit services in an amount sufficient to complete services through the next Audit Committee meeting, and to determine if such services would be consistent with maintaining the accountant’s independence. At the next scheduled Audit Committee meeting, services and fees would be presented to the Audit Committee for formal consideration, and, if appropriate, approval by the entire Audit Committee. The Audit Committee would again consider whether such services and fees are consistent with maintaining the principal accountant’s independence.
The Registrant’s Audit Committee is informed at least annually of all audit and non-audit services provided by the principal accountant to the Vanguard complex, whether such services are provided to: the Registrant, other registered investment companies in the Vanguard complex, The Vanguard Group, Inc., or other entities controlled by The Vanguard Group, Inc. that provide ongoing services to the Registrant.
(2) No percentage of the principal accountant’s fees or services were approved pursuant to the waiver provision of paragraph (c)(7)(i)(C) of Rule 2-01 of Regulation S-X.
(f) For the most recent fiscal year, over 50% of the hours worked under the principal accountant’s engagement were not performed by persons other than full-time, permanent employees of the principal accountant.
(g) Aggregate Non-Audit Fees.
Fiscal Year Ended September 30, 2013: $242,000
Fiscal Year Ended September 30, 2012: $506,518
Includes fees billed for non-audit services provided to the Registrant, other registered investment companies in the Vanguard complex, The Vanguard Group, Inc., and Vanguard Marketing Corporation.
(h) For the most recent fiscal year, the Audit Committee has determined that the provision of all non-audit services was consistent with maintaining the principal accountant’s independence.
Item 5: Audit Committee of Listed Registrants.
Not Applicable.
Item 6: Investments.
Not Applicable.
Item 7: Disclosure of Proxy Voting Policies and Procedures for Closed-End Management Investment Companies.
Not Applicable.
Item 8: Portfolio Managers of Closed-End Management Investment Companies.
Not Applicable.
Item 9: Purchase of Equity Securities by Closed-End Management Investment Company and Affiliated Purchasers.
Not Applicable.
Item 10: Submission of Matters to a Vote of Security Holders.
Not Applicable.
Item 11: Controls and Procedures.
(a) Disclosure Controls and Procedures. The Principal Executive and Financial Officers concluded that the Registrant’s Disclosure Controls and Procedures are effective based on their evaluation of the Disclosure Controls and Procedures as of a date within 90 days of the filing date of this report.
(b) Internal Control Over Financial Reporting. There were no significant changes in Registrant’s Internal Control Over Financial Reporting or in other factors that could significantly affect this control subsequent to the date of the evaluation, including any corrective actions with regard to significant deficiencies and material weaknesses.
Item 12: Exhibits.
(a) Code of Ethics.
(b) Certifications.
Pursuant to the requirements of the Securities Exchange Act of 1934 and the Investment Company Act of 1940, the registrant has duly caused this report to be signed on its behalf by the undersigned, thereunto duly authorized.
| VANGUARD FENWAY FUNDS | |
| By: | /s/ F. WILLIAM MCNABB III* |
| F. WILLIAM MCNABB III | |
| CHIEF EXECUTIVE OFFICER | |
| Date: November 15, 2013 | |
Pursuant to the requirements of the Securities Exchange Act of 1934 and the Investment Company Act of 1940, this report has been signed below by the following persons on behalf of the registrant and in the capacities and on the dates indicated.
| VANGUARD FENWAY FUNDS | |
| By: | /s/ F. WILLIAM MCNABB III* |
| F. WILLIAM MCNABB III | |
| CHIEF EXECUTIVE OFFICER | |
| Date: November 15, 2013 | |
| VANGUARD FENWAY FUNDS | |
| By: | /s/ THOMAS J. HIGGINS* |
| THOMAS J. HIGGINS | |
| CHIEF FINANCIAL OFFICER | |
| Date: November 15, 2013 | |
* By: /s/ Heidi Stam
Heidi Stam, pursuant to a Power of Attorney filed on March 27, 2012 see file Number 2-11444, Incorporated by Reference.