UNITED STATES
SECURITIES AND EXCHANGE COMMISSION
Washington, D.C. 20549
FORM N-CSR
CERTIFIED SHAREHOLDER REPORT
OF
REGISTERED MANAGEMENT INVESTMENT COMPANIES
Investment Company Act file number: 811-5445
Name of Registrant: Vanguard Fenway Funds
Address of Registrant:
P.O. Box 2600
Valley Forge, PA 19482
Name and address of agent for service:
Heidi Stam, Esquire
P.O. Box 876
Valley Forge, PA 19482
Registrant’s telephone number, including area code: (610) 669-1000
Date of fiscal year end: September 30
Date of reporting period: October 1, 2010 – September 30, 2011
Item 1: Reports to Shareholders
| Annual Report | September 30, 2011 |
| Vanguard Equity Income Fund |
| Annual Report |
> Vanguard Equity Income Fund returned about 6% for the fiscal year ended September 30, 2011, behind the return of its benchmark index but well ahead of the average return for equity income funds.
> In the second half of the fiscal year, a spike in investor anxiety bolstered the performance of high-yield and defensive stocks.
> At the end of the period, the fund’s yield was more than a percentage point above that of the broad stock market.
| Contents | |
| Your Fund’s Total Returns. | 1 |
| Chairman’s Letter. | 2 |
| Advisors’ Report. | 7 |
| Fund Profile. | 10 |
| Performance Summary. | 11 |
| Financial Statements. | 13 |
| Your Fund’s After-Tax Returns. | 26 |
| About Your Fund’s Expenses. | 27 |
| Glossary. | 29 |
Please note: The opinions expressed in this report are just that—informed opinions. They should not be considered promises or advice. Also, please keep in mind that the information and opinions cover the period through the date on the front of this report. Of course, the risks of investing in your fund are spelled out in the prospectus.
See the Glossary for definitions of investment terms used in this report.
About the cover: Vanguard was named for the HMS Vanguard, flagship of British Admiral Horatio Nelson. A ship—whose performance and safety depend on the work of all hands—has served as a fitting metaphor for the Vanguard crew as we strive to help clients reach their financial goals.
Your Fund’s Total Returns
| Fiscal Year Ended September 30, 2011 | |
| Total | |
| Returns | |
| Vanguard Equity Income Fund | |
| Investor Shares | 6.00% |
| Admiral™ Shares | 6.10 |
| FTSE High Dividend Yield Index | 6.83 |
| Equity Income Funds Average | 0.50 |
| Equity Income Funds Average: Derived from data provided by Lipper Inc. | |
| Admiral Shares carry lower expenses and are available to investors who meet certain account-balance requirements. | |
| Your Fund’s Performance at a Glance | ||||
| September 30, 2010 , Through September 30, 2011 | ||||
| Distributions Per Share | ||||
| Starting | Ending | Income | Capital | |
| Share Price | Share Price | Dividends | Gains | |
| Vanguard Equity Income Fund | ||||
| Investor Shares | $18.83 | $19.40 | $0.593 | $0.000 |
| Admiral Shares | 39.47 | 40.67 | 1.280 | 0.000 |
1

Chairman’s Letter
Dear Shareholder,
Optimism about the economic recovery and the employment outlook in the first six months of the fund’s fiscal year diminished in the second half of the year. The reversal in sentiment caused investors to turn their attention to more defensive investments, including U.S. Treasuries and the sectors of the stock market that are prominent in Vanguard Equity Income Fund’s portfolio.
Vanguard Equity Income Fund’s Investor Shares returned 6.00% for the 12 months ended September 30, 2011, and its Admiral Shares returned 6.10%. While these performances slightly lagged the return of the benchmark FTSE High Dividend Yield Index, they outpaced the average return for equity income funds by well over 5 percentage points.
At the end of the period, the 30-day SEC yield was 3.24% for the fund’s Investor Shares and 3.33% for its Admiral Shares, both more than a full percentage point above the yield of the broad U.S. stock market (as measured by the yield of Vanguard Total Stock Market Index Fund’s Investor Shares). Although corporate America cut dividends sharply during the financial crisis, payouts have mostly recovered, bolstered by strong corporate profits over the last several years.
2
A swift change in sentiment weighed on stock prices
Global stock markets rallied through the first half of the fiscal year as corporate earnings surged and the economic recovery seemed to be gathering steam. In the second half, however, stock prices tumbled as economic indicators took a turn for the worse and U.S. and European policymaking strife dominated the headlines. (Standard & Poor’s downgraded the U.S. credit rating, in large part because of the political gridlock on display during the debt-ceiling debate. Vanguard’s confidence in the “full faith and credit” of the U.S. Treasury remains unshaken.)
The U.S. stock market’s second-half weakness sapped its first-half strength. The broad market returned 0.31% for the full 12 months. International stocks, which gained less at the start of the year and lost more at the end, returned –10.81% in U.S. dollars.
Bond prices rallied as optimism faded
The stock market’s pattern of strength and weakness was inverted in the bond market. Early in the year, bond prices retreated, consistent with investor optimism about economic growth. Later in the year, as optimism gave way to anxiety, bond prices surged, driving yields to remarkable lows. At the end of September, the yield of the 10-year U.S. Treasury note, a benchmark for longer-term interest rates, stood at 1.93%. Bond indexes recorded impressive returns, though it’s worth noting that shrinking yields imply lower returns on prospective investments.
| Market Barometer | |||
| Average Annual Total Returns | |||
| Periods Ended September 30, 2011 | |||
| One | Three | Five | |
| Year | Years | Years | |
| Stocks | |||
| Russell 1000 Index (Large-caps) | 0.91% | 1.61% | -0.91% |
| Russell 2000 Index (Small-caps) | -3.53 | -0.37 | -1.02 |
| Dow Jones U.S. Total Stock Market Index | 0.31 | 1.75 | -0.57 |
| MSCI All Country World Index ex USA (International) | -10.81 | 0.52 | -1.57 |
| Bonds | |||
| Barclays Capital U.S. Aggregate Bond Index (Broad | |||
| taxable market) | 5.26% | 7.97% | 6.53% |
| Barclays Capital Municipal Bond Index (Broad | |||
| tax-exempt market) | 3.88 | 8.08 | 5.01 |
| Citigroup Three-Month U.S. Treasury Bill Index | 0.11 | 0.19 | 1.61 |
| CPI | |||
| Consumer Price Index | 3.87% | 1.22% | 2.26% |
3
The yields of money market instruments hovered near zero, as they have since December 2008, when the Federal Reserve cut its target for short-term interest rates to between 0% and 0.25%. Toward the end of the period, the Fed indicated that it expected to maintain this exceptionally low target at least through mid-2013.
Resilient stock performance and a solid yield
The financial markets finished the 12-month period on an anxious note, with the broad stock market index giving up almost all of its earlier gains and the yield on U.S. Treasuries slipping to under 2%. Vanguard Equity Income Fund finished the fiscal year in a comparatively strong position: As I noted earlier, it returned about 6% for the year (a bit less than its benchmark), and had 30-day SEC yields of 3.24% for Investor Shares and 3.33% for Admiral Shares at the end of September.
In part, the fund’s relative strength reflected renewed appetite among equity investors for high-dividend stocks—particularly those of high-quality companies with attractive valuations and solid balance sheets. Such stocks, which are characteristic of the Equity Income Fund’s holdings, tend to hold up better during market downturns. Moreover, during this period investors seeking income from their portfolios began turning to these stocks as an alternative—albeit a much higher-risk alternative—to fixed income instruments whose yields had fallen.
| Expense Ratios | |||
| Your Fund Compared With Its Peer Group | |||
| Investor | Admiral | Peer Group | |
| Shares | Shares | Average | |
| Equity Income Fund | 0.31% | 0.22% | 1.35% |
The fund expense ratios shown are from the prospectus dated January 28, 2011, and represent estimated costs for the current fiscal year. For the fiscal year ended September 30, 2011, the fund’s expense ratios were 0.31% for Investor Shares and 0.22% for Admiral Shares. The peer-group expense ratio is derived from data provided by Lipper Inc. and captures information through year-end 2010.
Peer group: Equity Income Funds.
4
The Equity Income Fund’s strong performance also reflected its advisors’ success in capturing most, if not all, of the returns available from this segment of the market. The fund outstripped the average return of equity income funds by more than 5 percentage points.
The fund’s modest shortfall compared with its benchmark was the net result of strong performances from its holdings in information technology, financials, consumer discretionary, and consumer staples and underperformance in the other sectors.
Technology stocks haven’t traditionally come to mind when thinking of dividends, but as some of the industry’s larger companies have matured, their strong cash flow has put them in a position to pay out impressive dividends to investors. Positions in a handful of such software and semiconductor companies paid off handsomely for the fund, making technology the top-performing sector in terms of relative performance.
The largest drag on performance came from industrials, which performed poorly in the benchmark and worse in the fund. And while returns from utilities were positive
| Total Returns | |
| Ten Years Ended September 30, 2011 | |
| Average | |
| Annual Return | |
| Equity Income Fund Investor Shares | 4.21% |
| Spliced Equity Income Index | 4.97 |
| Equity Income Funds Average | 3.52 |
| Spliced Equity Income Index: Russell 1000 Value Index through July 31, 2007; FTSE High Dividend Yield Index thereafter. | |
| Equity Income Funds Average: Derived from data provided by Lipper Inc. |
The figures shown represent past performance, which is not a guarantee of future results. (Current performance may be lower or higher than the performance data cited. For performance data current to the most recent month-end, visit our website at vanguard.com/performance.) Note, too, that both investment returns and principal value can fluctuate widely, so an investor’s shares, when sold, could be worth more or less than their original cost.
5
over the period, missed opportunities kept the fund’s holdings a few steps behind their counterparts in the benchmark.
Competitive long-term returns in turbulent times
The fund’s two advisors, Wellington Management Company and Vanguard Quantitative Equity Group, use different, but complementary, bottom-up approaches to identify undervalued stocks with both solid balance sheets and the prospect of paying out above-average dividends. While such stocks are by no means immune to the effects of economic cycles and market movements, their share prices do tend to be more resilient during market ups and downs.
The Investor Shares of Vanguard Equity Income Fund posted an average annual return of 4.21% for the ten years ended September 30 (a particularly volatile decade). While the fund lagged its benchmark, which had an annualized return of 4.97%, it did better than the broad market index, which had an annualized return of 3.93%. It also outpaced the average annual return of 3.52% for equity income fund peers. Skilled stock selection by its managers contributed to this performance, as did the fund’s low costs—its expense ratio is lower than the average expense ratio for its peers by more than a full percentage point.
Investing is a marathon, not a sprint
Over the past 12 months, the stock market has shown us once again how unpredictable it can be. But investing is not really about rallies or corrections; it’s about generating solid returns over time by following an investment plan that fits your financial goals, your time horizon, and your tolerance for risk.
We believe an investment plan that is balanced among stocks, bonds, and money market funds will allow you to increase your wealth over time while securing some protection from the market’s occasional—and inevitable—reversals. Vanguard Equity Income Fund can play an important role in such an investment plan, particularly for investors seeking both broad exposure to stocks (and the capital appreciation that offers over time) and a regular income from their investment. And whatever your asset mix, low costs can help maximize your share of the fund’s returns, in good times and in bad.
As always, thank you for entrusting your assets to Vanguard.
Sincerely,

F. William McNabb III
Chairman and Chief Executive Officer
October 13, 2011
Advisors’ Report
For the fiscal year ended September 30, the Equity Income Fund returned about 6%, reflecting the combined results of your fund’s two independent investment advisors. The use of two advisors provides exposure to distinct, yet complementary, investment approaches, enhancing the diversification of your fund. It is not uncommon for different advisors to have different views about individual securities or the broader investment environment.
The advisors, the percentage of the fund’s assets each manages, and brief descriptions of their investment strategies are presented in the table below. The advisors have also prepared a discussion of the investment environment that existed during the fiscal year and of how their portfolio positioning reflects this assessment. These comments were prepared on October 12, 2011.
| Vanguard Equity Income Fund Investment Advisors | |||
| Fund Assets Managed | |||
| Investment Advisor | % | $ Million | Investment Strategy |
| Wellington Management | 62 | 3,361 | A fundamental approach to seeking desirable stocks. |
| Company, LLP | Our selections typically offer above-average dividend | ||
| yields, below-average valuations, and the potential for | |||
| dividend increases in the future. | |||
| Vanguard Quantitative Equity | 34 | 1,836 | Employs a quantitative fundamental management |
| Group | approach, using models that assess valuation, growth | ||
| prospects, management decisions, market sentiment, | |||
| and earnings-quality of companies as compared with | |||
| their peers. | |||
| Cash Investments | 4 | 252 | These short-term reserves are invested by Vanguard in |
| equity index products to simulate investment in stocks. | |||
| Each advisor may also maintain a modest cash | |||
| position. | |||
7
Wellington Management Company, llp
Portfolio Manager:
W. Michael Reckmeyer, III, CFA, Senior Vice President and Equity Portfolio Manager
Global markets took a significant step backward during the fiscal year because of faltering economic activity as well as heightened uncertainties over political and monetary actions. Government and regulatory decisions are influencing economic prospects, and while we are hopeful that things will improve in the near term, we remain concerned that longer-term issues will persist, resulting in continued episodic dislocations.
In the United States, the recently revised gross domestic product figures suggest that underlying economic growth was weaker than originally expected, raising concerns that the economy is close to a tipping point and raising recessionary fears. Unfortunately, the government’s ability to respond to this environment is hampered by fiscal and monetary limitations. This was readily apparent in Washington’s recent deficit discussions, which highlighted both the nation’s rapidly deteriorating fiscal situation and politicians’ inability to address it effectively. We continue to believe that the economic expansion will continue, albeit at a slower growth rate than we previously expected, because of lackluster employment growth.
The European marketplace appears to be slipping into a recession. The continent is struggling with sovereign and banking challenges, and unfortunately, there are no easy solutions. While Greece is the key focal point, Portugal, Italy, Spain, and Ireland also remain problematic.
China remains a conundrum as its economy is slowing amid tighter policy initiatives, but we expect economic growth to reaccelerate as inflationary pressures come under control. However, concerns remain about the speculative characteristics of China’s economy and the sustainability of its economic growth.
Our largest purchases over the past 12 months included Royal Dutch Shell and Exxon Mobil (energy), Unilever (consumer staples), Vodafone (telecommunications), and BlackRock (asset management). Our sales included stocks that reached or approached our target price, such as Genuine Parts, Texas Instruments, PPG Industries, and Toronto Dominion Bank, as well as Total SA, which we sold because of eroding fundamentals.
Vanguard Quantitative Equity Group
Portfolio Manager: James P. Stetler, Principal
What a contrast between the first half of the fiscal year and the second half. When we reported to you midway through the fiscal year, the fund had risen about 16%. However, since then, and particularly in the last three months of the period, all equities, large and small, both here in the United States and abroad, have sold off strongly. Driving the pullback and increasing overall market volatility over this period were
8
continued concerns over a stalling U.S. economy, a lack of improvement in the U.S. employment picture, and the unresolved European sovereign-debt crisis. With so much market uncertainty, many investors reduced their equity exposure as they sought safety in U.S. Treasuries, the U.S. dollar, and gold.
Most economists have reduced their growth estimates for the next year or two, and this has cast a cloud of doubt over the near-term prospects for equities. Investors will be looking to U.S. and European leaders for fresh solutions to the issues that face them, and to third-quarter corporate earnings and future forecasts in the United States for guidance on market direction over the next few months.
Stocks providing above-average yields, which are the focus of the Equity Income Fund, outperformed the broad market by about 6% for the fiscal year, with energy, consumer, and utilities companies leading the way. Financial and industrial companies were the laggards within this stock universe.
While the macro factors described above have an impact on overall portfolio performance, our approach to investing focuses on specific stock fundamentals. As we believe there is no single indicator for identifying attractive stocks, our company evaluation process is diversified
across several factors: valuation, growth, quality, management decisions, and market sentiment. For the fiscal year, our quality and market sentiment indicators were our most effective models, while growth, management decisions, and valuation lagged.
Our stock selection results were strongest in the consumer staples, consumer discretionary, and financial sectors. In financials, avoiding the sector’s worst-performing stocks and owning RenaissanceRe Holdings contributed the most to our relative returns. In the consumer categories, Del Monte Foods, Sara Lee, Herbalife, and Limited Brands were the largest contributors to our relative returns. Stock selection results were disappointing in materials and utilities. Cabot and Southern Copper in materials and PPL and Entergy in utilities did not perform as expected.
While we cannot predict how broader political or economic events will affect the markets, we are confident that the stock market will have worthwhile returns for long-term investors. With that in mind, we believe that equity exposure will continue to play an important part in a diversified investment plan. We thank you for your investment and look forward to the coming year.
9
Equity Income Fund
Fund Profile
As of September 30, 2011
| Share-Class Characteristics | ||
| Investor | Admiral | |
| Shares | Shares | |
| Ticker Symbol | VEIPX | VEIRX |
| Expense Ratio1 | 0.31% | 0.22% |
| 30-Day SEC Yield | 3.24% | 3.33% |
| Portfolio Characteristics | |||
| FTSE High | DJ | ||
| Dividend | U.S. Total | ||
| Yield | Market | ||
| Fund | Index | Index | |
| Number of Stocks | 144 | 427 | 3,717 |
| Median Market Cap | $59.0B | $79.5B | $28.7B |
| Price/Earnings Ratio | 11.9x | 12.7x | 13.6x |
| Price/Book Ratio | 1.9x | 2.1x | 1.9x |
| Return on Equity | 21.0% | 21.9% | 19.1% |
| Earnings Growth Rate | 3.3% | 3.6% | 7.3% |
| Dividend Yield | 3.7% | 3.7% | 2.2% |
| Foreign Holdings | 4.9% | 0.0% | 0.0% |
| Turnover Rate | 29% | — | — |
| Short-Term Reserves | 0.9% | — | — |
| Sector Diversification (% of equity exposure) | |||
| FTSE High | DJ | ||
| Dividend | U.S. Total | ||
| Yield | Market | ||
| Fund | Index | Index | |
| Consumer | |||
| Discretionary | 7.5% | 6.5% | 12.2% |
| Consumer Staples | 18.1 | 20.5 | 11.0 |
| Energy | 13.6 | 13.5 | 10.3 |
| Financials | 9.2 | 4.9 | 14.3 |
| Health Care | 12.8 | 13.3 | 11.7 |
| Industrials | 13.7 | 14.0 | 10.6 |
| Information | |||
| Technology | 9.0 | 9.0 | 19.4 |
| Materials | 3.3 | 3.0 | 4.0 |
| Telecommunication | |||
| Services | 4.9 | 5.9 | 2.8 |
| Utilities | 7.9 | 9.4 | 3.7 |
| Volatility Measures | ||
| FTSE High | DJ | |
| Dividend | U.S. Total | |
| Yield | Market | |
| Index | Index | |
| R-Squared | 0.99 | 0.94 |
| Beta | 0.92 | 0.88 |
These measures show the degree and timing of the fund’s fluctuations compared with the indexes over 36 months.
| Ten Largest Holdings (% of total net assets) | ||
| Exxon Mobil Corp. | Integrated Oil & | |
| Gas | 4.6% | |
| Chevron Corp. | Integrated Oil & | |
| Gas | 4.0 | |
| Johnson & Johnson | Pharmaceuticals | 3.4 |
| AT&T Inc. | Integrated | |
| Telecommunication | ||
| Services | 3.2 | |
| Pfizer Inc. | Pharmaceuticals | 3.0 |
| Merck & Co. Inc. | Pharmaceuticals | 2.8 |
| Microsoft Corp. | Systems Software | 2.8 |
| Philip Morris | ||
| International Inc. | Tobacco | 2.4 |
| General Electric Co. | Industrial | |
| Conglomerates | 2.4 | |
| Intel Corp. | Semiconductors | 2.0 |
| Top Ten | 30.6% | |
The holdings listed exclude any temporary cash investments and equity index products.
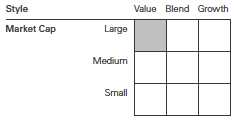
Investment Focus
1 The expense ratios shown are from the prospectus dated January 28, 2011, and represent estimated costs for the current fiscal year. For the fiscal year ended September 30, 2011, the expense ratios were 0.31% for Investor Shares and 0.22% for Admiral Shares.
10
Equity Income Fund
Performance Summary
All of the returns in this report represent past performance, which is not a guarantee of future results that may be achieved by the fund. (Current performance may be lower or higher than the performance data cited. For performance data current to the most recent month-end, visit our website at vanguard.com/performance.) Note, too, that both investment returns and principal value can fluctuate widely, so an investor’s shares, when sold, could be worth more or less than their original cost. The returns shown do not reflect taxes that a shareholder would pay on fund distributions or on the sale of fund shares.
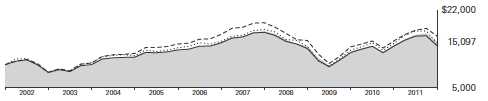
Cumulative Performance: September 30, 2001, Through September 30, 2011
Initial Investment of $10,000
| Average Annual Total Returns | ||||
| Periods Ended September 30, 2011 | ||||
| Final Value | ||||
| One | Five | Ten | of a $10,000 | |
| Year | Years | Years | Investment | |
| Equity Income Fund Investor Shares | 6.00% | 0.23% | 4.21% | $15,097 |
| Dow Jones U.S. Total Stock Market | ||||
| Index | 0.31 | -0.57 | 3.93 | 14,709 |
| Spliced Equity Income Index | 6.83 | -0.49 | 4.97 | 16,246 |
| Equity Income Funds Average | 0.50 | -0.89 | 3.52 | 14,137 |
| Spliced Equity Income Index: Russell 1000 Value Index through July 31, 2007; FTSE High Dividend Yield Index thereafter. | ||||
| Equity Income Funds Average: Derived from data provided by Lipper Inc. | ||||
| Final Value | ||||
| One | Five | Ten | of a $50,000 | |
| Year | Years | Years | Investment | |
| Equity Income Fund Admiral Shares | 6.10% | 0.34% | 4.32% | $76,332 |
| Dow Jones U.S. Total Stock Market | ||||
| Index | 0.31 | -0.57 | 3.93 | 73,544 |
| Spliced Equity Income Index | 6.83 | -0.49 | 4.97 | 81,229 |
See Financial Highlights for dividend and capital gains information.
11
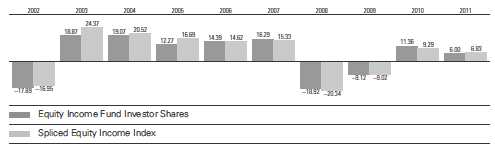
Equity Income Fund
Fiscal-Year Total Returns (%): September 30, 2001, Through September 30, 2011
12
Equity Income Fund
Financial Statements
Statement of Net Assets
As of September 30, 2011
The fund reports a complete list of its holdings in regulatory filings four times in each fiscal year, at the quarter-ends. For the second and fourth fiscal quarters, the lists appear in the fund’s semiannual and annual reports to shareholders. For the first and third fiscal quarters, the fund files the lists with the Securities and Exchange Commission on Form N-Q. Shareholders can look up the fund’s Forms N-Q on the SEC’s website at sec.gov. Forms N-Q may also be reviewed and copied at the SEC’s Public Reference Room (see the back cover of this report for further information).
| Market | ||
| Value | ||
| Shares | ($000) | |
| Common Stocks (94.6%)1 | ||
| Consumer Discretionary (6.9%) | ||
| McDonald’s Corp. | 1,170,315 | 102,777 |
| Home Depot Inc. | 3,107,980 | 102,159 |
| Mattel Inc. | 1,165,350 | 30,171 |
| Lowe’s Cos. Inc. | 1,500,010 | 29,010 |
| Nordstrom Inc. | 587,800 | 26,851 |
| Time Warner Cable Inc. | 263,500 | 16,513 |
| VF Corp. | 92,500 | 11,241 |
| Polaris Industries Inc. | 215,000 | 10,743 |
| Foot Locker Inc. | 528,600 | 10,620 |
| Limited Brands Inc. | 251,900 | 9,701 |
| Brinker International Inc. | 437,600 | 9,155 |
| Darden Restaurants Inc. | 113,700 | 4,861 |
| Weight Watchers | ||
| International Inc. | 52,800 | 3,076 |
| American Greetings Corp. | ||
| Class A | 150,500 | 2,784 |
| Bob Evans Farms Inc. | 86,900 | 2,478 |
| Time Warner Inc. | 72,100 | 2,161 |
| Meredith Corp. | 75,000 | 1,698 |
| Comcast Corp. | 71,400 | 1,477 |
| 377,476 | ||
| Consumer Staples (17.3%) | ||
| Philip Morris | ||
| International Inc. | 2,109,595 | 131,596 |
| PepsiCo Inc. | 1,553,530 | 96,163 |
| Procter & Gamble Co. | 1,466,190 | 92,634 |
| Kraft Foods Inc. | 2,609,929 | 87,641 |
| General Mills Inc. | 1,653,200 | 63,599 |
| Unilever NV | 1,920,140 | 60,465 |
| Altria Group Inc. | 2,240,745 | 60,074 |
| Kimberly-Clark Corp. | 842,458 | 59,823 |
| Sysco Corp. | 2,293,960 | 59,414 |
| Wal-Mart Stores Inc. | 1,013,800 | 52,616 |
| Coca-Cola Co. | 640,982 | 43,305 |
| Colgate-Palmolive Co. | 273,100 | 24,218 |
| Market | |||
| Value | |||
| Shares | ($000) | ||
| Imperial Tobacco Group plc | 574,344 | 19,383 | |
| Reynolds American Inc. | 408,400 | 15,307 | |
| Lorillard Inc. | 135,600 | 15,011 | |
| Hershey Co. | 221,300 | 13,110 | |
| ConAgra Foods Inc. | 537,100 | 13,009 | |
| Dr Pepper Snapple | |||
| Group Inc. | 319,200 | 12,379 | |
| Hormel Foods Corp. | 413,800 | 11,181 | |
| Herbalife Ltd. | 179,700 | 9,632 | |
| 940,560 | |||
| Energy (12.8%) | |||
| Exxon Mobil Corp. | 3,453,730 | 250,845 | |
| Chevron Corp. | 2,372,810 | 219,532 | |
| ConocoPhillips | 1,543,890 | 97,759 | |
| Royal Dutch Shell plc | |||
| Class B | 2,240,255 | 69,705 | |
| Occidental Petroleum | |||
| Corp. | 731,200 | 52,281 | |
| Marathon Oil Corp. | 479,200 | 10,341 | |
| 700,463 | |||
| Exchange-Traded Fund (0.8%) | |||
| 2 | Vanguard Value ETF | 963,400 | 45,328 |
| Financials (8.3%) | |||
| Marsh & McLennan | |||
| Cos. Inc. | 3,391,320 | 90,006 | |
| Chubb Corp. | 1,017,842 | 61,060 | |
| ACE Ltd. | 786,530 | 47,664 | |
| M&T Bank Corp. | 636,300 | 44,477 | |
| PNC Financial Services | |||
| Group Inc. | 780,492 | 37,612 | |
| BlackRock Inc. | 230,290 | 34,085 | |
| Wells Fargo & Co. | 1,367,880 | 32,993 | |
| JPMorgan Chase & Co. | 975,690 | 29,388 | |
| Swiss Re AG | 488,687 | 22,925 | |
| Commerce Bancshares Inc. | 265,700 | 9,233 | |
| RLI Corp. | 134,604 | 8,558 | |
13
Equity Income Fund
| Market | ||
| Value | ||
| Shares | ($000) | |
| Erie Indemnity Co. Class A | 102,600 | 7,303 |
| Allied World Assurance Co. | ||
| Holdings AG | 135,000 | 7,251 |
| Fidelity National Financial | ||
| Inc. Class A | 346,095 | 5,254 |
| American Financial | ||
| Group Inc. | 157,400 | 4,891 |
| American Express Co. | 67,600 | 3,035 |
| Ameriprise Financial Inc. | 48,600 | 1,913 |
| Oritani Financial Corp. | 83,513 | 1,074 |
| 1st Source Corp. | 45,000 | 937 |
| American National | ||
| Insurance Co. | 10,400 | 720 |
| Community Trust | ||
| Bancorp Inc. | 25,300 | 589 |
| WesBanco Inc. | 32,800 | 568 |
| Washington Trust | ||
| Bancorp Inc. | 21,400 | 423 |
| 451,959 | ||
| Health Care (12.0%) | ||
| Johnson & Johnson | 2,883,205 | 183,689 |
| Pfizer Inc. | 9,398,377 | 166,163 |
| Merck & Co. Inc. | 4,673,304 | 152,864 |
| AstraZeneca plc ADR | 1,067,289 | 47,345 |
| Bristol-Myers Squibb Co. | 914,432 | 28,695 |
| Eli Lilly & Co. | 628,749 | 23,245 |
| Baxter International Inc. | 388,400 | 21,805 |
| Abbott Laboratories | 407,200 | 20,824 |
| Cardinal Health Inc. | 111,300 | 4,661 |
| Medtronic Inc. | 87,700 | 2,915 |
| National Healthcare Corp. | 39,700 | 1,282 |
| 653,488 | ||
| Industrials (13.0%) | ||
| General Electric Co. | 8,549,392 | 130,293 |
| 3M Co. | 1,280,300 | 91,913 |
| Tyco International Ltd. | 1,569,380 | 63,952 |
| Eaton Corp. | 1,425,860 | 50,618 |
| Illinois Tool Works Inc. | 1,111,450 | 46,236 |
| Stanley Black & Decker | ||
| Inc. | 941,490 | 46,227 |
| Waste Management Inc. | 1,241,300 | 40,417 |
| Republic Services Inc. | ||
| Class A | 1,326,840 | 37,231 |
| Lockheed Martin Corp. | 471,200 | 34,228 |
| United Technologies Corp. | 439,300 | 30,909 |
| Caterpillar Inc. | 324,700 | 23,976 |
| Norfolk Southern Corp. | 277,400 | 16,927 |
| General Dynamics Corp. | 274,200 | 15,599 |
| Northrop Grumman Corp. | 267,413 | 13,948 |
| Schneider Electric SA | 254,094 | 13,598 |
| Honeywell International Inc. | 264,462 | 11,613 |
| PACCAR Inc. | 316,350 | 10,699 |
| Market | ||
| Value | ||
| Shares | ($000) | |
| Pitney Bowes Inc. | 517,500 | 9,729 |
| Parker Hannifin Corp. | 131,300 | 8,289 |
| United Parcel Service Inc. | ||
| Class B | 112,900 | 7,130 |
| Boeing Co. | 94,500 | 5,718 |
| Emerson Electric Co. | 54,300 | 2,243 |
| 711,493 | ||
| Information Technology (8.1%) | ||
| Microsoft Corp. | 6,074,580 | 151,196 |
| Intel Corp. | 5,197,430 | 110,861 |
| Analog Devices Inc. | 1,976,580 | 61,768 |
| Maxim Integrated | ||
| Products Inc. | 1,755,286 | 40,951 |
| Xilinx Inc. | 1,182,500 | 32,448 |
| Accenture plc Class A | 389,900 | 20,540 |
| Applied Materials Inc. | 1,235,500 | 12,787 |
| KLA-Tencor Corp. | 260,200 | 9,961 |
| 440,512 | ||
| Materials (3.1%) | ||
| Sherwin-Williams Co. | 575,430 | 42,766 |
| EI du Pont de | ||
| Nemours & Co. | 1,018,157 | 40,696 |
| Nucor Corp. | 1,145,060 | 36,230 |
| Packaging Corp. of America | 852,640 | 19,866 |
| PPG Industries Inc. | 162,700 | 11,496 |
| Eastman Chemical Co. | 136,200 | 9,334 |
| Cabot Corp. | 152,257 | 3,773 |
| Innophos Holdings Inc. | 84,200 | 3,357 |
| 167,518 | ||
| Telecommunication Services (4.7%) | ||
| AT&T Inc. | 6,055,625 | 172,706 |
| Verizon Communications | ||
| Inc. | 1,252,198 | 46,081 |
| Vodafone Group plc ADR | 1,295,610 | 33,232 |
| Windstream Corp. | 163,000 | 1,901 |
| 253,920 | ||
| Utilities (7.6%) | ||
| American Electric Power | ||
| Co. Inc. | 1,160,820 | 44,134 |
| Xcel Energy Inc. | 1,721,590 | 42,506 |
| Northeast Utilities | 1,222,210 | 41,127 |
| UGI Corp. | 1,499,960 | 39,404 |
| NextEra Energy Inc. | 551,196 | 29,776 |
| PG&E Corp. | 622,280 | 26,329 |
| Dominion Resources Inc. | 469,970 | 23,860 |
| Duke Energy Corp. | 956,200 | 19,115 |
| Consolidated Edison Inc. | 282,300 | 16,097 |
| Entergy Corp. | 196,400 | 13,019 |
| DTE Energy Co. | 247,100 | 12,113 |
| CMS Energy Corp. | 581,600 | 11,510 |
| Pepco Holdings Inc. | 576,800 | 10,913 |
| Alliant Energy Corp. | 271,400 | 10,498 |
14
Equity Income Fund
| Market | ||
| Value | ||
| Shares | ($000) | |
| Cleco Corp. | 298,800 | 10,201 |
| Portland General | ||
| Electric Co. | 419,500 | 9,938 |
| PPL Corp. | 346,360 | 9,885 |
| Unisource Energy Corp. | 273,700 | 9,878 |
| TECO Energy Inc. | 573,500 | 9,824 |
| NiSource Inc. | 403,000 | 8,616 |
| Avista Corp. | 212,500 | 5,068 |
| Southwest Gas Corp. | 110,687 | 4,004 |
| Southern Co. | 69,800 | 2,957 |
| CenterPoint Energy Inc. | 51,800 | 1,016 |
| 411,788 | ||
| Total Common Stocks | ||
| (Cost $4,846,401) | 5,154,505 | |
| Temporary Cash Investments (4.8%)1 | ||
| Money Market Fund (2.8%) | ||
| 3 Vanguard Market Liquidity | ||
| Fund, 0.144% | 153,699,992 | 153,700 |
| Face | Market | ||
| Amount | Value | ||
| ($000) | ($000) | ||
| Repurchase Agreement (1.5%) | |||
| Goldman Sachs & Co. | |||
| 0.050%, 10/3/11 (Dated | |||
| 9/30/11, Repurchase | |||
| Value $85,100,000 | |||
| collateralized by | |||
| Federal National | |||
| Mortgage Assn. | |||
| 4.500%-6.000%, | |||
| 7/1/37-2/1/41) | 85,100 | 85,100 | |
| U.S. Government and Agency Obligations (0.5%) | |||
| 4,5 | Fannie Mae Discount Notes, | ||
| 0.110%, 10/19/11 | 1,000 | 1,000 | |
| 4,5 | Federal Home Loan Bank | ||
| Discount Notes, | |||
| 0.100%, 10/11/11 | 500 | 500 | |
| 4,5 | Federal Home Loan Bank | ||
| Discount Notes, | |||
| 0.040%, 11/28/11 | 1,000 | 1,000 | |
| 4,5 | Federal Home Loan Bank | ||
| Discount Notes, | |||
| 0.040%, 11/30/11 | 750 | 750 | |
| 4 | Federal Home Loan Bank | ||
| Discount Notes, | |||
| 0.025%, 12/2/11 | 11,000 | 10,996 | |
| 4,5 | Freddie Mac Discount | ||
| Notes, 0.070%, 10/7/11 | 11,000 | 11,000 | |
| 25,246 | |||
| Total Temporary Cash Investments | |||
| (Cost $264,049) | 264,046 | ||
| Total Investments (99.4%) | |||
| (Cost $5,110,450) | 5,418,551 | ||
| Other Assets and Liabilities (0.6%) | |||
| Other Assets | 63,066 | ||
| Liabilities | (32,221) | ||
| 30,845 | |||
| Net Assets (100%) | 5,449,396 | ||
15
Equity Income Fund
| At September 30, 2011, net assets consisted of: | |
| Amount | |
| ($000) | |
| Paid-in Capital | 5,696,774 |
| Overdistributed Net Investment Income | (5,328) |
| Accumulated Net Realized Losses | (543,740) |
| Unrealized Appreciation (Depreciation) | |
| Investment Securities | 308,101 |
| Futures Contracts | (6,324) |
| Foreign Currencies | (87) |
| Net Assets | 5,449,396 |
| Investor Shares—Net Assets | |
| Applicable to 146,136,650 outstanding | |
| $.001 par value shares of beneficial | |
| interest (unlimited authorization) | 2,835,329 |
| Net Asset Value Per Share— | |
| Investor Shares | $19.40 |
| Admiral Shares—Net Assets | |
| Applicable to 64,276,741 outstanding | |
| $.001 par value shares of beneficial | |
| interest (unlimited authorization) | 2,614,067 |
| Net Asset Value Per Share— | |
| Admiral Shares | $40.67 |
See Note A in Notes to Financial Statements.
1 The fund invests a portion of its cash reserves in equity markets through the use of index futures contracts. After giving effect to futures investments, the fund’s effective common stock and temporary cash investment positions represent 98.5% and 0.9%, respectively, of net assets.
2 Considered an affiliated company of the fund as the issuer is another member of The Vanguard Group.
3 Affiliated money market fund available only to Vanguard funds and certain trusts and accounts managed by Vanguard. Rate shown is the 7-day yield.
4 The issuer operates under a congressional charter; its securities are not backed by the full faith and credit of the U.S. government.
5 Securities with a value of $14,099,000 have been segregated as initial margin for open futures contracts.
ADR—American Depositary Receipt.
See accompanying Notes, which are an integral part of the Financial Statements.
16
Equity Income Fund
| Statement of Operations | |
| Year Ended | |
| September 30, 2011 | |
| ($000) | |
| Investment Income | |
| Income | |
| Dividends1,2 | 167,305 |
| Interest2 | 351 |
| Security Lending | 308 |
| Total Income | 167,964 |
| Expenses | |
| Investment Advisory Fees—Note B | |
| Basic Fee | 4,354 |
| Performance Adjustment | 554 |
| The Vanguard Group—Note C | |
| Management and Administrative—Investor Shares | 5,130 |
| Management and Administrative—Admiral Shares | 2,499 |
| Marketing and Distribution—Investor Shares | 700 |
| Marketing and Distribution—Admiral Shares | 464 |
| Custodian Fees | 91 |
| Auditing Fees | 30 |
| Shareholders’ Reports—Investor Shares | 75 |
| Shareholders’ Reports—Admiral Shares | 11 |
| Trustees’ Fees and Expenses | 10 |
| Total Expenses | 13,918 |
| Net Investment Income | 154,046 |
| Realized Net Gain (Loss) | |
| Investment Securities Sold2 | 172,397 |
| Futures Contracts | 12,704 |
| Foreign Currencies | 45 |
| Realized Net Gain (Loss) | 185,146 |
| Change in Unrealized Appreciation (Depreciation) | |
| Investment Securities | (107,173) |
| Futures Contracts | (8,290) |
| Foreign Currencies | (87) |
| Change in Unrealized Appreciation (Depreciation) | (115,550) |
| Net Increase (Decrease) in Net Assets Resulting from Operations | 223,642 |
1 Dividends are net of foreign withholding taxes of $599,000.
2 Dividend income, interest income, and realized net gain (loss) from affiliated companies of the fund were $1,299,000, $274,000, and $0, respectively.
See accompanying Notes, which are an integral part of the Financial Statements.
17
Equity Income Fund
| Statement of Changes in Net Assets | ||
| Year Ended September 30, | ||
| 2011 | 2010 | |
| ($000) | ($000) | |
| Increase (Decrease) in Net Assets | ||
| Operations | ||
| Net Investment Income | 154,046 | 118,995 |
| Realized Net Gain (Loss) | 185,146 | 58,689 |
| Change in Unrealized Appreciation (Depreciation) | (115,550) | 261,705 |
| Net Increase (Decrease) in Net Assets Resulting from Operations | 223,642 | 439,389 |
| Distributions | ||
| Net Investment Income | ||
| Investor Shares | (80,499) | (72,980) |
| Admiral Shares | (73,911) | (46,454) |
| Realized Capital Gain | ||
| Investor Shares | — | — |
| Admiral Shares | — | — |
| Total Distributions | (154,410) | (119,434) |
| Capital Share Transactions | ||
| Investor Shares | 128,197 | 29,451 |
| Admiral Shares | 934,379 | 69,613 |
| Net Increase (Decrease) from Capital Share Transactions | 1,062,576 | 99,064 |
| Total Increase (Decrease) | 1,131,808 | 419,019 |
| Net Assets | ||
| Beginning of Period | 4,317,588 | 3,898,569 |
| End of Period1 | 5,449,396 | 4,317,588 |
| 1 Net Assets—End of Period includes undistributed (overdistributed) net investment income of ($5,328,000) and ($5,009,000). | ||
See accompanying Notes, which are an integral part of the Financial Statements.
18
Equity Income Fund
Financial Highlights
| Investor Shares | |||||
| For a Share Outstanding | Year Ended September 30, | ||||
| Throughout Each Period | 2011 | 2010 | 2009 | 2008 | 2007 |
| Net Asset Value, Beginning of Period | $18.83 | $17.40 | $20.02 | $27.01 | $25.21 |
| Investment Operations | |||||
| Net Investment Income | .596 | .526 | .585 | .770 | .733 |
| Net Realized and Unrealized Gain (Loss) | |||||
| on Investments | .567 | 1.432 | (2.506) | (5.617) | 3.215 |
| Total from Investment Operations | 1.163 | 1.958 | (1.921) | (4.847) | 3.948 |
| Distributions | |||||
| Dividends from Net Investment Income | (.593) | (.528) | (.587) | (.785) | (.730) |
| Distributions from Realized Capital Gains | — | — | (.112) | (1.358) | (1.418) |
| Total Distributions | (.593) | (.528) | (.699) | (2.143) | (2.148) |
| Net Asset Value, End of Period | $19.40 | $18.83 | $17.40 | $20.02 | $27.01 |
| Total Return1 | 6.00% | 11.36% | -9.12% | -18.92% | 16.29% |
| Ratios/Supplemental Data | |||||
| Net Assets, End of Period (Millions) | $2,835 | $2,651 | $2,423 | $2,626 | $3,445 |
| Ratio of Total Expenses to | |||||
| Average Net Assets2 | 0.31% | 0.31% | 0.36% | 0.30% | 0.29% |
| Ratio of Net Investment Income to | |||||
| Average Net Assets | 2.89% | 2.88% | 3.76% | 3.30% | 2.79% |
| Portfolio Turnover Rate | 29% | 45% | 51% | 55% | 51% |
1 Total returns do not include account service fees that may have applied in the periods shown. Fund prospectuses provide information about any applicable account service fees.
2 Includes performance-based investment advisory fee increases of 0.01%, 0.01%, 0.02%, 0.00%, and 0.00%.
See accompanying Notes, which are an integral part of the Financial Statements.
19
Equity Income Fund
Financial Highlights
| Admiral Shares | |||||
| For a Share Outstanding | Year Ended September 30, | ||||
| Throughout Each Period | 2011 | 2010 | 2009 | 2008 | 2007 |
| Net Asset Value, Beginning of Period | $39.47 | $36.46 | $41.97 | $56.62 | $52.84 |
| Investment Operations | |||||
| Net Investment Income | 1.286 | 1.138 | 1.264 | 1.673 | 1.601 |
| Net Realized and Unrealized Gain (Loss) | |||||
| on Investments | 1.194 | 3.013 | (5.269) | (11.772) | 6.746 |
| Total from Investment Operations | 2.480 | 4.151 | (4.005) | (10.099) | 8.347 |
| Distributions | |||||
| Dividends from Net Investment Income | (1.280) | (1.141) | (1.270) | (1.705) | (1.595) |
| Distributions from Realized Capital Gains | — | — | (.235) | (2.846) | (2.972) |
| Total Distributions | (1.280) | (1.141) | (1.505) | (4.551) | (4.567) |
| Net Asset Value, End of Period | $40.67 | $39.47 | $36.46 | $41.97 | $56.62 |
| Total Return | 6.10% | 11.50% | -9.05% | -18.82% | 16.44% |
| Ratios/Supplemental Data | |||||
| Net Assets, End of Period (Millions) | $2,614 | $1,667 | $1,475 | $1,711 | $2,256 |
| Ratio of Total Expenses to | |||||
| Average Net Assets1 | 0.22% | 0.22% | 0.24% | 0.18% | 0.17% |
| Ratio of Net Investment Income to | |||||
| Average Net Assets | 2.98% | 2.97% | 3.89% | 3.42% | 2.91% |
| Portfolio Turnover Rate | 29% | 45% | 51% | 55% | 51% |
| 1 Includes performance-based investment advisory fee increases of 0.01%, 0.01%, 0.02%, 0.00% and 0.00%. | |||||
See accompanying Notes, which are an integral part of the Financial Statements.
20
Equity Income Fund
Notes to Financial Statements
Vanguard Equity Income Fund is registered under the Investment Company Act of 1940 as an open-end investment company, or mutual fund. The fund offers two classes of shares: Investor Shares and Admiral Shares. Investor Shares are available to any investor who meets the fund’s minimum purchase requirements. Admiral Shares are designed for investors who meet certain administrative, service, and account-size criteria.
A. The following significant accounting policies conform to generally accepted accounting principles for U.S. mutual funds. The fund consistently follows such policies in preparing its financial statements.
1. Security Valuation: Securities are valued as of the close of trading on the New York Stock Exchange (generally 4 p.m., Eastern time) on the valuation date. Equity securities are valued at the latest quoted sales prices or official closing prices taken from the primary market in which each security trades; such securities not traded on the valuation date are valued at the mean of the latest quoted bid and asked prices. Securities for which market quotations are not readily available, or whose values have been affected by events occurring before the fund’s pricing time but after the close of the securities’ primary markets, are valued at their fair values calculated according to procedures adopted by the board of trustees. These procedures include obtaining quotations from an independent pricing service, monitoring news to identify significant market- or security-specific events, and evaluating changes in the values of foreign market proxies (for example, ADRs, futures contracts, or exchange-traded funds), between the time the foreign markets close and the fund’s pricing time. When fair-value pricing is employed, the prices of securities used by a fund to calculate its net asset value may differ from quoted or published prices for the same securities. Investments in Vanguard Market Liquidity Fund are valued at that fund’s net asset value. Temporary cash investments acquired over 60 days to maturity are valued using the latest bid prices or using valuations based on a matrix system (which considers such factors as security prices, yields, maturities, and ratings), both as furnished by independent pricing services. Other temporary cash investments are valued at amortized cost, which approximates market value.
2. Foreign Currency: Securities and other assets and liabilities denominated in foreign currencies are translated into U.S. dollars using exchange rates obtained from an independent third party as of the fund’s pricing time on the valuation date. Realized gains (losses) and unrealized appreciation (depreciation) on investment securities include the effects of changes in exchange rates since the securities were purchased, combined with the effects of changes in security prices. Fluctuations in the value of other assets and liabilities resulting from changes in exchange rates are recorded as unrealized foreign currency gains (losses) until the assets or liabilities are settled in cash, at which time they are recorded as realized foreign currency gains (losses).
3. Futures Contracts: The fund uses index futures contracts to a limited extent, with the objective of maintaining full exposure to the stock market while maintaining liquidity. The fund may purchase or sell futures contracts to achieve a desired level of investment, whether to accommodate portfolio turnover or cash flows from capital share transactions. The primary risks associated with the use of futures contracts are imperfect correlation between changes in market values of stocks held by the fund and the prices of futures contracts, and the possibility of an illiquid market.
Futures contracts are valued at their quoted daily settlement prices. The aggregate principal amounts of the contracts are not recorded in the Statement of Net Assets. Fluctuations in the value of the contracts are recorded in the Statement of Net Assets as an asset (liability) and in the Statement of Operations as unrealized appreciation (depreciation) until the contracts are closed, when they are recorded as realized futures gains (losses).
21
Equity Income Fund
4. Repurchase Agreements: The fund invests in repurchase agreements. Securities pledged as collateral for repurchase agreements are held by a custodian bank until the agreements mature. Each agreement requires that the market value of the collateral be sufficient to cover payments of interest and principal; however, in the event of default or bankruptcy by the other party to the agreement, retention of the collateral may be subject to legal proceedings.
5. Federal Income Taxes: The fund intends to continue to qualify as a regulated investment company and distribute all of its taxable income. Management has analyzed the fund’s tax positions taken for all open federal income tax years (September 30, 2008–2011), and has concluded that no provision for federal income tax is required in the fund’s financial statements.
6. Distributions: Distributions to shareholders are recorded on the ex-dividend date.
7. Security Lending: The fund may lend its securities to qualified institutional borrowers to earn additional income. Security loans are required to be secured at all times by collateral at least equal to the market value of securities loaned. The fund invests cash collateral received in Vanguard Market Liquidity Fund, and records a liability for the return of the collateral, during the period the securities are on loan. Security lending income represents fees charged to borrowers plus income earned on investing cash collateral, less expenses associated with the loan.
8. Other: Dividend income is recorded on the ex-dividend date. Interest income includes income distributions received from Vanguard Market Liquidity Fund and is accrued daily. Security transactions are accounted for on the date securities are bought or sold. Costs used to determine realized gains (losses) on the sale of investment securities are those of the specific securities sold.
Each class of shares has equal rights as to assets and earnings, except that each class separately bears certain class-specific expenses related to maintenance of shareholder accounts (included in Management and Administrative expenses) and shareholder reporting. Marketing and distribution expenses are allocated to each class of shares based on a method approved by the board of trustees. Income, other non-class-specific expenses, and gains and losses on investments are allocated to each class of shares based on its relative net assets.
B. Wellington Management Company, LLP, provides investment advisory services to a portion of the fund for a fee calculated at an annual percentage rate of average net assets managed by the advisor. The basic fee for Wellington Management Company, LLP, is subject to quarterly adjustments based on the fund’s performance for the preceding three years relative to the FTSE High Dividend Yield Index.
The Vanguard Group provides investment advisory services to a portion of the fund on an at-cost basis; the fund paid Vanguard advisory fees of $830,000 for the year ended September 30, 2011.
For the year ended September 30, 2011, the aggregate investment advisory fee represented an effective annual basic rate of 0.08% of the fund’s average net assets, before an increase of $554,000 (0.01%) based on performance.
C. The Vanguard Group furnishes at cost corporate management, administrative, marketing, and distribution services. The costs of such services are allocated to the fund under methods approved by the board of trustees. The fund has committed to provide up to 0.40% of its net assets in capital contributions to Vanguard. At September 30, 2011, the fund had contributed capital of $931,000 to Vanguard (included in Other Assets), representing 0.02% of the fund’s net assets and 0.37% of Vanguard’s capitalization. The fund’s trustees and officers are also directors and officers of Vanguard.
22
Equity Income Fund
D. Various inputs may be used to determine the value of the fund’s investments. These inputs are summarized in three broad levels for financial statement purposes. The inputs or methodologies used to value securities are not necessarily an indication of the risk associated with investing in those securities.
Level 1—Quoted prices in active markets for identical securities.
Level 2—Other significant observable inputs (including quoted prices for similar securities, interest rates, prepayment speeds, credit risk, etc.).
Level 3—Significant unobservable inputs (including the fund’s own assumptions used to determine the fair value of investments).
The following table summarizes the fund’s investments as of September 30, 2011, based on the inputs used to value them:
| Level 1 | Level 2 | Level 3 | |
| Investments | ($000) | ($000) | ($000) |
| Common Stocks | 5,028,894 | 125,611 | — |
| Temporary Cash Investments | 153,700 | 110,346 | — |
| Futures Contracts—Liabilities1 | (5,061) | — | — |
| Total | 5,177,533 | 235,957 | — |
| 1 Represents variation margin on the last day of the reporting period. |
E. At September 30, 2011, the aggregate settlement value of open futures contracts and the related unrealized appreciation (depreciation) were:
| ($000) | ||||
| Aggregate | ||||
| Number of | Settlement | Unrealized | ||
| Long (Short) | Value | Appreciation | ||
| Futures Contracts | Expiration | Contracts | Long (Short) | (Depreciation) |
| S&P 500 Index | December 2011 | 501 | 141,032 | (4,905) |
| E-mini S&P 500 Index | December 2011 | 1329 | 74,822 | (1,419) |
Unrealized appreciation (depreciation) on open futures contracts is required to be treated as realized gain (loss) for tax purposes.
F. Distributions are determined on a tax basis and may differ from net investment income and realized capital gains for financial reporting purposes. Differences may be permanent or temporary. Permanent differences are reclassified among capital accounts in the financial statements to reflect their tax character. Temporary differences arise when certain items of income, expense, gain, or loss are recognized in different periods for financial statement and tax purposes; these differences will reverse at some time in the future. Differences in classification may also result from the treatment of short-term gains as ordinary income for tax purposes.
During the year ended September 30, 2011, the fund realized net foreign currency gains of $45,000, which increased distributable net income for tax purposes; accordingly, such gains have been reclassified from accumulated net realized losses to overdistributed net investment income.
23
Equity Income Fund
For tax purposes, at September 30, 2011, the fund had $3,598,000 of ordinary income available for distribution. The fund had available capital loss carryforwards totaling $549,995,000 to offset future net capital gains through September 30, 2018.
At September 30, 2011, the cost of investment securities for tax purposes was $5,110,538,000. Net unrealized appreciation of investment securities for tax purposes was $308,013,000, consisting of unrealized gains of $553,555,000 on securities that had risen in value since their purchase and $245,542,000 in unrealized losses on securities that had fallen in value since their purchase.
G. During the year ended September 30, 2011, the fund purchased $2,392,823,000 of investment securities and sold $1,466,971,000 of investment securities, other than temporary cash investments.
H. Capital share transactions for each class of shares were:
| Year Ended September 30, | ||||
| 2011 | 2010 | |||
| Amount | Shares | Amount | Shares | |
| ($000) | (000) | ($000) | (000) | |
| Investor Shares | ||||
| Issued | 858,008 | 41,420 | 438,771 | 23,942 |
| Issued in Lieu of Cash Distributions | 74,430 | 3,580 | 66,879 | 3,637 |
| Redeemed | (804,241) | (39,640) | (476,199) | (26,097) |
| Net Increase (Decrease)—Investor Shares | 128,197 | 5,360 | 29,451 | 1,482 |
| Admiral Shares | ||||
| Issued | 1,278,314 | 29,946 | 303,119 | 7,894 |
| Issued in Lieu of Cash Distributions | 60,944 | 1,398 | 37,356 | 969 |
| Redeemed | (404,879) | (9,292) | (270,862) | (7,098) |
| Net Increase (Decrease)—Admiral Shares | 934,379 | 22,052 | 69,613 | 1,765 |
I. In preparing the financial statements as of September 30, 2011, management considered the impact of subsequent events for potential recognition or disclosure in these financial statements.
24
Report of Independent Registered Public Accounting Firm
To the Trustees of Vanguard Fenway Funds and the Shareholders of Vanguard Equity Income Fund:
In our opinion, the accompanying statement of net assets and the related statements of operations and of changes in net assets and the financial highlights present fairly, in all material respects, the financial position of Vanguard Equity Income Fund (constituting a separate portfolio of Vanguard Fenway Funds, hereafter referred to as the “Fund”) at September 30, 2011, the results of its operations for the year then ended, the changes in its net assets for each of the two years in the period then ended and the financial highlights for each of the five years in the period then ended, in conformity with accounting principles generally accepted in the United States of America. These financial statements and financial highlights (hereafter referred to as “financial statements”) are the responsibility of the Fund’s management; our responsibility is to express an opinion on these financial statements based on our audits. We conducted our audits of these financial statements in accordance with the standards of the Public Company Accounting Oversight Board (United States). Those standards require that we plan and perform the audit to obtain reasonable assurance about whether the financial statements are free of material misstatement. An audit includes examining, on a test basis, evidence supporting the amounts and disclosures in the financial statements, assessing the accounting principles used and significant estimates made by management, and evaluating the overall financial statement presentation. We believe that our audits, which included confirmation of securities at September 30, 2011 by correspondence with the custodians and brokers and by agreement to the underlying ownership records of Vanguard Market Liquidity Fund, provide a reasonable basis for our opinion.
PricewaterhouseCoopers LLP
Philadelphia, Pennsylvania
November 11, 2011
| Special 2011 tax information (unaudited) for Vanguard Equity Income Fund |
This information for the fiscal year ended September 30, 2011, is included pursuant to provisions of the Internal Revenue Code.
The fund distributed $154,410,000 of qualified dividend income to shareholders during the fiscal year.
For corporate shareholders, 99.1% of investment income (dividend income plus short-term gains, if any) qualifies for the dividends-received deduction.
25
Your Fund’s After-Tax Returns
This table presents returns for your fund both before and after taxes. The after-tax returns are shown in two ways: (1) assuming that an investor owned the fund during the entire period and paid taxes on the fund’s distributions, and (2) assuming that an investor paid taxes on the fund’s distributions and sold all shares at the end of each period.
Calculations are based on the highest individual federal income tax and capital gains tax rates in effect at the times of the distributions and the hypothetical sales. State and local taxes were not considered. After-tax returns reflect any qualified dividend income, using actual prior-year figures and estimates for 2011. (In the example, returns after the sale of fund shares may be higher than those assuming no sale. This occurs when the sale would have produced a capital loss. The calculation assumes that the investor received a tax deduction for the loss.)
The table shows returns for Investor Shares only; returns for other share classes will differ. Please note that your actual after-tax returns will depend on your tax situation and may differ from those shown. Also note that if you own the fund in a tax-deferred account, such as an individual retirement account or a 401(k) plan, this information does not apply to you. Such accounts are not subject to current taxes.
Finally, keep in mind that a fund’s performance—whether before or after taxes—does not guarantee future results.
| Average Annual Total Returns: Equity Income Fund Investor Shares | |||
| Periods Ended September 30, 2011 | |||
| One | Five | Ten | |
| Year | Years | Years | |
| Returns Before Taxes | 6.00% | 0.23% | 4.21% |
| Returns After Taxes on Distributions | 5.55 | -0.63 | 3.23 |
| Returns After Taxes on Distributions and Sale of Fund Shares | 4.55 | 0.15 | 3.45 |
26
About Your Fund’s Expenses
As a shareholder of the fund, you incur ongoing costs, which include costs for portfolio management, administrative services, and shareholder reports (like this one), among others. Operating expenses, which are deducted from a fund’s gross income, directly reduce the investment return of the fund.
A fund’s expenses are expressed as a percentage of its average net assets. This figure is known as the expense ratio. The following examples are intended to help you understand the ongoing costs (in dollars) of investing in your fund and to compare these costs with those of other mutual funds. The examples are based on an investment of $1,000 made at the beginning of the period shown and held for the entire period.
The accompanying table illustrates your fund’s costs in two ways:
• Based on actual fund return. This section helps you to estimate the actual expenses that you paid over the period. The ”Ending Account Value“ shown is derived from the fund‘s actual return, and the third column shows the dollar amount that would have been paid by an investor who started with $1,000 in the fund. You may use the information here, together with the amount you invested, to estimate the expenses that you paid over the period.
To do so, simply divide your account value by $1,000 (for example, an $8,600 account value divided by $1,000 = 8.6), then multiply the result by the number given for your fund under the heading ”Expenses Paid During Period.“
• Based on hypothetical 5% yearly return. This section is intended to help you compare your fund‘s costs with those of other mutual funds. It assumes that the fund had a yearly return of 5% before expenses, but that the expense ratio is unchanged. In this case—because the return used is not the fund’s actual return—the results do not apply to your investment. The example is useful in making comparisons because the Securities and Exchange Commission requires all mutual funds to calculate expenses based on a 5% return. You can assess your fund’s costs by comparing this hypothetical example with the hypothetical examples that appear in shareholder reports of other funds.
Note that the expenses shown in the table are meant to highlight and help you compare ongoing costs only and do not reflect transaction costs incurred by the fund for buying and selling securities. Further, the expenses do not include any purchase, redemption, or account service fees described in the fund prospectus. If such fees were applied to your account, your costs would be higher. Your fund does not carry a “sales load.”
The calculations assume no shares were bought or sold during the period. Your actual costs may have been higher or lower, depending on the amount of your investment and the timing of any purchases or redemptions.
You can find more information about the fund’s expenses, including annual expense ratios, in the Financial Statements section of this report. For additional information on operating expenses and other shareholder costs, please refer to your fund’s current prospectus.
27
| Six Months Ended September 30, 2011 | |||
| Beginning | Ending | Expenses | |
| Account Value | Account Value | Paid During | |
| Equity Income Fund | 3/31/2011 | 9/30/2011 | Period |
| Based on Actual Fund Return | |||
| Investor Shares | $1,000.00 | $912.17 | $1.49 |
| Admiral Shares | 1,000.00 | 912.55 | 1.05 |
| Based on Hypothetical 5% Yearly Return | |||
| Investor Shares | $1,000.00 | $1,023.51 | $1.57 |
| Admiral Shares | 1,000.00 | 1,023.97 | 1.12 |
The calculations are based on expenses incurred in the most recent six-month period. The fund’s annualized six-month expense ratios for that period are 0.31% for Investor Shares and 0.22% for Admiral Shares. The dollar amounts shown as “Expenses Paid” are equal to the annualized expense ratio multiplied by the average account value over the period, multiplied by the number of days in the most recent six-month period, then divided by the number of days in the most recent 12-month period.
28
Glossary
30-Day SEC Yield. A fund’s 30-day SEC yield is derived using a formula specified by the U.S. Securities and Exchange Commission. Under the formula, data related to the fund’s security holdings in the previous 30 days are used to calculate the fund’s hypothetical net income for that period, which is then annualized and divided by the fund’s estimated average net assets over the calculation period. For the purposes of this calculation, a security’s income is based on its current market yield to maturity (for bonds; excluding inflation for inflation-protected securities), its actual income (for asset-backed securities), or its projected dividend yield (for stocks). Because the SEC yield represents hypothetical annualized income, it will differ—at times significantly—from the fund’s actual experience. As a result, the fund’s income distributions may be higher or lower than implied by the SEC yield.
Beta. A measure of the magnitude of a fund’s past share-price fluctuations in relation to the ups and downs of a given market index. The index is assigned a beta of 1.00. Compared with a given index, a fund with a beta of 1.20 typically would have seen its share price rise or fall by 12% when the index rose or fell by 10%. For this report, beta is based on returns over the past 36 months for both the fund and the index. Note that a fund’s beta should be reviewed in conjunction with its R-squared (see definition). The lower the R-squared, the less correlation there is between the fund and the index, and the less reliable beta is as an indicator of volatility.
Dividend Yield. Dividend income earned by stocks, expressed as a percentage of the aggregate market value (or of net asset value, for a fund). The yield is determined by dividing the amount of the annual dividends by the aggregate value (or net asset value) at the end of the period. For a fund, the dividend yield is based solely on stock holdings and does not include any income produced by other investments.
Earnings Growth Rate. The average annual rate of growth in earnings over the past five years for the stocks now in a fund.
Equity Exposure. A measure that reflects a fund’s investments in stocks and stock futures. Any holdings in short-term reserves are excluded.
Expense Ratio. The percentage of a fund’s average net assets used to pay its annual administrative and advisory expenses. These expenses directly reduce returns to investors.
Foreign Holdings. The percentage of a fund represented by securities or depositary receipts of companies based outside the United States.
Inception Date. The date on which the assets of a fund (or one of its share classes) are first invested in accordance with the fund’s investment objective. For funds with a subscription period, the inception date is the day after that period ends. Investment performance is measured from the inception date.
Median Market Cap. An indicator of the size of companies in which a fund invests; the midpoint of market capitalization (market price x shares outstanding) of a fund’s stocks, weighted by the proportion of the fund’s assets invested in each stock. Stocks representing half of the fund’s assets have market capitalizations above the median, and the rest are below it.
Price/Book Ratio. The share price of a stock divided by its net worth, or book value, per share. For a fund, the weighted average price/book ratio of the stocks it holds.
29
Price/Earnings Ratio. The ratio of a stock’s current price to its per-share earnings over the past year. For a fund, the weighted average P/E of the stocks it holds. P/E is an indicator of market expectations about corporate prospects; the higher the P/E, the greater the expectations for a company’s future growth.
R-Squared. A measure of how much of a fund’s past returns can be explained by the returns from the market in general, as measured by a given index. If a fund’s total returns were precisely synchronized with an index’s returns, its R-squared would be 1.00. If the fund’s returns bore no relationship to the index’s returns, its R-squared would be 0. For this report, R-squared is based on returns over the past 36 months for both the fund and the index.
Return on Equity. The annual average rate of return generated by a company during the past five years for each dollar of shareholder’s equity (net income divided by shareholder’s equity). For a fund, the weighted average return on equity for the companies whose stocks it holds.
Short-Term Reserves. The percentage of a fund invested in highly liquid, short-term securities that can be readily converted to cash.
Turnover Rate. An indication of the fund’s trading activity. Funds with high turnover rates incur higher transaction costs and may be more likely to distribute capital gains (which may be taxable to investors). The turnover rate excludes in-kind transactions, which have minimal impact on costs.
30
This page intentionally left blank.
The People Who Govern Your Fund
The trustees of your mutual fund are there to see that the fund is operated and managed in your best interests since, as a shareholder, you are a part owner of the fund. Your fund’s trustees also serve on the board of directors of The Vanguard Group, Inc., which is owned by the Vanguard funds and provides services to them on an at-cost basis.
A majority of Vanguard’s board members are independent, meaning that they have no affiliation with Vanguard or the funds they oversee, apart from the sizable personal investments they have made as private individuals. The independent board members have distinguished backgrounds in business, academia, and public service. Each of the trustees and executive officers oversees 178 Vanguard funds.
The following table provides information for each trustee and executive officer of the fund. More information about the trustees is in the Statement of Additional Information, which can be obtained, without charge, by contacting Vanguard at 800-662-7447, or online at vanguard.com.
| Interested Trustee1 | and President (2006–2008) of Rohm and Haas Co. |
| (chemicals); Director of Tyco International, Ltd. | |
| F. William McNabb III | (diversified manufacturing and services) and Hewlett- |
| Born 1957. Trustee Since July 2009. Chairman of the | Packard Co. (electronic computer manufacturing); |
| Board. Principal Occupation(s) During the Past Five | Senior Advisor at New Mountain Capital; Trustee |
| Years: Chairman of the Board of The Vanguard Group, | of The Conference Board; Member of the Board of |
| Inc., and of each of the investment companies served | Managers of Delphi Automotive LLP (automotive |
| by The Vanguard Group, since January 2010; Director | components). |
| of The Vanguard Group since 2008; Chief Executive | |
| Officer and President of The Vanguard Group and of | Amy Gutmann |
| each of the investment companies served by The | Born 1949. Trustee Since June 2006. Principal |
| Vanguard Group since 2008; Director of Vanguard | Occupation(s) During the Past Five Years: President |
| Marketing Corporation; Managing Director of The | of the University of Pennsylvania; Christopher H. |
| Vanguard Group (1995–2008). | Browne Distinguished Professor of Political Science |
| in the School of Arts and Sciences with secondary | |
| appointments at the Annenberg School for Commu- | |
| Independent Trustees | nication and the Graduate School of Education |
| of the University of Pennsylvania; Director of | |
| Emerson U. Fullwood | Carnegie Corporation of New York, Schuylkill River |
| Born 1948. Trustee Since January 2008. Principal | Development Corporation, and Greater Philadelphia |
| Occupation(s) During the Past Five Years: Executive | Chamber of Commerce; Trustee of the National |
| Chief Staff and Marketing Officer for North America | Constitution Center; Chair of the Presidential |
| and Corporate Vice President (retired 2008) of Xerox | Commission for the Study of Bioethical Issues. |
| Corporation (document management products and | |
| services); Executive in Residence and 2010 | JoAnn Heffernan Heisen |
| Distinguished Minett Professor at the Rochester | Born 1950. Trustee Since July 1998. Principal |
| Institute of Technology; Director of SPX Corporation | Occupation(s) During the Past Five Years: Corporate |
| (multi-industry manufacturing), the United Way of | Vice President and Chief Global Diversity Officer |
| Rochester, Amerigroup Corporation (managed health | (retired 2008) and Member of the Executive |
| care), the University of Rochester Medical Center, | Committee (1997–2008) of Johnson & Johnson |
| Monroe Community College Foundation, and North | (pharmaceuticals/consumer products); Director of |
| Carolina A&T University. | Skytop Lodge Corporation (hotels), the University |
| Medical Center at Princeton, the Robert Wood | |
| Rajiv L. Gupta | Johnson Foundation, and the Center for Work Life |
| Born 1945. Trustee Since December 2001.2 | Policy; Member of the Advisory Board of the |
| Principal Occupation(s) During the Past Five Years: | Maxwell School of Citizenship and Public Affairs |
| Chairman and Chief Executive Officer (retired 2009) | at Syracuse University. |
| F. Joseph Loughrey | Thomas J. Higgins | |
| Born 1949. Trustee Since October 2009. Principal | Born 1957. Chief Financial Officer Since September | |
| Occupation(s) During the Past Five Years: President | 2008. Principal Occupation(s) During the Past Five | |
| and Chief Operating Officer (retired 2009) and Vice | Years: Principal of The Vanguard Group, Inc.; Chief | |
| Chairman of the Board (2008–2009) of Cummins Inc. | Financial Officer of each of the investment companies | |
| (industrial machinery); Director of SKF AB (industrial | served by The Vanguard Group since 2008; Treasurer | |
| machinery), Hillenbrand, Inc. (specialized consumer | of each of the investment companies served by The | |
| services), the Lumina Foundation for Education, and | Vanguard Group (1998–2008). | |
| Oxfam America; Chairman of the Advisory Council | ||
| for the College of Arts and Letters and Member | Kathryn J. Hyatt | |
| of the Advisory Board to the Kellogg Institute for | Born 1955. Treasurer Since November 2008. Principal | |
| International Studies at the University of Notre Dame. | Occupation(s) During the Past Five Years: Principal | |
| of The Vanguard Group, Inc.; Treasurer of each of | ||
| André F. Perold | the investment companies served by The Vanguard | |
| Born 1952. Trustee Since December 2004. Principal | Group since 2008; Assistant Treasurer of each of the | |
| Occupation(s) During the Past Five Years: George | investment companies served by The Vanguard Group | |
| Gund Professor of Finance and Banking at the Harvard | (1988–2008). | |
| Business School (retired July 2011); Chief Investment | ||
| Officer and co-Managing Partner of HighVista | Heidi Stam | |
| Strategies LLC (private investment firm); Director of | Born 1956. Secretary Since July 2005. Principal | |
| Rand Merchant Bank; Overseer of the Museum of | Occupation(s) During the Past Five Years: Managing | |
| Fine Arts Boston. | Director of The Vanguard Group, Inc., since 2006; | |
| General Counsel of The Vanguard Group since 2005; | ||
| Alfred M. Rankin, Jr. | Secretary of The Vanguard Group and of each of the | |
| Born 1941. Trustee Since January 1993. Principal | investment companies served by The Vanguard Group | |
| Occupation(s) During the Past Five Years: Chairman, | since 2005; Director and Senior Vice President of | |
| President, and Chief Executive Officer of NACCO | Vanguard Marketing Corporation since 2005; | |
| Industries, Inc. (forklift trucks/housewares/lignite); | Principal of The Vanguard Group (1997–2006). | |
| Director of Goodrich Corporation (industrial products/ | ||
| aircraft systems and services) and the National | ||
| Association of Manufacturers; Chairman of the | Vanguard Senior Management Team | |
| Federal Reserve Bank of Cleveland; Vice Chairman | ||
| of University Hospitals of Cleveland; President of | R. Gregory Barton | Chris D. McIsaac |
| the Board of The Cleveland Museum of Art. | Mortimer J. Buckley | Michael S. Miller |
| Kathleen C. Gubanich | James M. Norris | |
| Peter F. Volanakis | Paul A. Heller | Glenn W. Reed |
| Born 1955. Trustee Since July 2009. Principal | Martha G. King | George U. Sauter |
| Occupation(s) During the Past Five Years: President | ||
| and Chief Operating Officer (retired 2010) of Corning | ||
| Incorporated (communications equipment); Director of | Chairman Emeritus and Senior Advisor | |
| Corning Incorporated (2000–2010) and Dow Corning | ||
| (2001–2010); Overseer of the Amos Tuck School of | John J. Brennan | |
| Business Administration at Dartmouth College. | Chairman, 1996–2009 | |
| Chief Executive Officer and President, 1996–2008 | ||
| Executive Officers | ||
| Founder | ||
| Glenn Booraem | ||
| Born 1967. Controller Since July 2010. Principal | John C. Bogle | |
| Occupation(s) During the Past Five Years: Principal | Chairman and Chief Executive Officer, 1974–1996 | |
| of The Vanguard Group, Inc.; Controller of each of | ||
| the investment companies served by The Vanguard | ||
| Group since 2010; Assistant Controller of each of | ||
| the investment companies served by The Vanguard | ||
| Group (2001–2010). | ||
1 Mr. McNabb is considered an “interested person,” as defined in the Investment Company Act of 1940, because he is an officer of the Vanguard funds.
2 December 2002 for Vanguard Equity Income Fund, Vanguard Growth Equity Fund, the Vanguard Municipal Bond Funds, and the Vanguard State Tax-Exempt Funds.
 | |
| P.O. Box 2600 | |
| Valley Forge, PA 19482-2600 |
Connect with Vanguard® > vanguard.com
| Fund Information > 800-662-7447 | CFA® is a trademark owned by CFA Institute. |
| Direct Investor Account Services > 800-662-2739 | |
| Institutional Investor Services > 800-523-1036 | |
| Text Telephone for People | |
| With Hearing Impairment > 800-749-7273 | |
| This material may be used in conjunction | |
| with the offering of shares of any Vanguard | |
| fund only if preceded or accompanied by | |
| the fund’s current prospectus. | |
| All comparative mutual fund data are from Lipper Inc. or | |
| Morningstar, Inc., unless otherwise noted. | |
| You can obtain a free copy of Vanguard’s proxy voting | |
| guidelines by visiting vanguard.com/proxyreporting or by | |
| calling Vanguard at 800-662-2739. The guidelines are | |
| also available from the SEC’s website, sec.gov. In | |
| addition, you may obtain a free report on how your fund | |
| voted the proxies for securities it owned during the 12 | |
| months ended June 30. To get the report, visit either | |
| vanguard.com/proxyreporting or sec.gov. | |
| You can review and copy information about your fund at | |
| the SEC’s Public Reference Room in Washington, D.C. To | |
| find out more about this public service, call the SEC at | |
| 202-551-8090. Information about your fund is also | |
| available on the SEC’s website, and you can receive | |
| copies of this information, for a fee, by sending a | |
| request in either of two ways: via e-mail addressed to | |
| publicinfo@sec.gov or via regular mail addressed to the | |
| Public Reference Section, Securities and Exchange | |
| Commission, Washington, DC 20549-1520. | |
| © 2011 The Vanguard Group, Inc. | |
| All rights reserved. | |
| Vanguard Marketing Corporation, Distributor. | |
| Q650 112011 | |
| Annual Report | September 30, 2011 |
| Vanguard Growth Equity Fund |
> For the fiscal year ended September 30, 2011, Vanguard Growth Equity Fund returned 2.35%, a modest conclusion to a period marked by pronounced highs and lows.
> The fund trailed its benchmark index, but outperformed its peer group.
> The strong performance of the fund’s industrial stocks was offset by weakness in other sectors, such as financials.
| Contents | |
| Your Fund’s Total Returns. | 1 |
| Chairman’s Letter. | 2 |
| Advisors’ Report. | 7 |
| Fund Profile. | 11 |
| Performance Summary. | 12 |
| Financial Statements. | 14 |
| Your Fund’s After-Tax Returns. | 25 |
| About Your Fund’s Expenses. | 26 |
| Glossary. | 28 |
Please note: The opinions expressed in this report are just that—informed opinions. They should not be considered promises or advice. Also, please keep in mind that the information and opinions cover the period through the date on the front of this report. Of course, the risks of investing in your fund are spelled out in the prospectus.
See the Glossary for definitions of investment terms used in this report.
About the cover: Vanguard was named for the HMS Vanguard, flagship of British Admiral Horatio Nelson. A ship—whose performance and safety depend on the work of all hands—has served as a fitting metaphor for the Vanguard crew as we strive to help clients reach their financial goals.
Your Fund’s Total Returns
| Fiscal Year Ended September 30, 2011 | |
| Total | |
| Returns | |
| Vanguard Growth Equity Fund | 2.35% |
| Russell 1000 Growth Index | 3.78 |
| Large-Cap Growth Funds Average | -0.09 |
| Large-Cap Growth Funds Average: Derived from data provided by Lipper Inc. | |
| Your Fund’s Performance at a Glance | ||||
| September 30, 2010 , Through September 30, 2011 | ||||
| Distributions Per Share | ||||
| Starting | Ending | Income | Capital | |
| Share Price | Share Price | Dividends | Gains | |
| Vanguard Growth Equity Fund | $9.77 | $9.93 | $0.075 | $0.000 |
1

Chairman’s Letter
Dear Shareholder,
Vanguard Growth Equity Fund returned 2.35% for the year ended September 30, 2011, as stock market declines in the second half of the fiscal year erased some of the gains produced in the first. The fund’s return for fiscal 2011 trailed that of its benchmark but exceeded the average return of large-cap growth funds.
The fund’s modestly positive total return reflected strength in the consumer discretionary and consumer staples sectors and pronounced weakness in the financial sector. The fund distinguished itself with superior stock selection in a few sectors—industrials, most notably—but sacrificed that advantage in relative performance to subpar selection in others.
If you own shares of the fund in a taxable account, you may wish to review the section on the fund’s after-tax returns that appears later in this report.
A swift change in sentiment weighed on stock prices
Global stock markets rallied through the first half of the fiscal year as corporate earnings surged and the economic recovery seemed to be gathering steam. In the second half, however, stock prices tumbled as economic indicators took a turn for the worse and U.S. and European policymaking strife dominated the headlines. (Standard & Poor’s, the ratings agency, downgraded the U.S. credit rating, in large part because of the political
2
gridlock on display during the debt-ceiling debate. Vanguard’s confidence in the “full faith and credit” of the U.S. Treasury remains unshaken.)
The U.S. stock market’s second-half weakness offset its first-half strength. The broad market returned 0.31% for the full 12 months. International stocks, which gained less at the start of the year and lost more at the end, returned –10.81% in U.S. dollars.
Bond prices rallied as optimism faded
The stock market’s pattern of strength and weakness was inverted in the bond market. Early in the year, bond prices retreated, consistent with investor optimism about economic growth.
Later in the year, as optimism gave way to anxiety, bond prices surged, driving yields to remarkable lows. At the end of September, the yield of the 10-year U.S. Treasury note, a benchmark for longer-term interest rates, stood at 1.93%. Bond indexes recorded impressive returns, though it’s worth noting that shrinking yields imply lower returns on prospective investments.
The yields of money market instruments hovered near zero, as they have since December 2008, when the Federal Reserve cut its target for short-term interest rates to between 0% and 0.25%. Toward the end of the period, the Fed indicated that it expected to maintain this exceptionally low target at least through mid-2013.
| Market Barometer | |||
| Average Annual Total Returns | |||
| Periods Ended September 30, 2011 | |||
| One | Three | Five | |
| Year | Years | Years | |
| Stocks | |||
| Russell 1000 Index (Large-caps) | 0.91% | 1.61% | -0.91% |
| Russell 2000 Index (Small-caps) | -3.53 | -0.37 | -1.02 |
| Dow Jones U.S. Total Stock Market Index | 0.31 | 1.75 | -0.57 |
| MSCI All Country World Index ex USA (International) | -10.81 | 0.52 | -1.57 |
| Bonds | |||
| Barclays Capital U.S. Aggregate Bond Index (Broad | |||
| taxable market) | 5.26% | 7.97% | 6.53% |
| Barclays Capital Municipal Bond Index (Broad | |||
| tax-exempt market) | 3.88 | 8.08 | 5.01 |
| Citigroup Three-Month U.S. Treasury Bill Index | 0.11 | 0.19 | 1.61 |
| CPI | |||
| Consumer Price Index | 3.87% | 1.22% | 2.26% |
3
Fund’s performance was hurt by financial and energy stocks
For the fiscal year ended September 30, Vanguard Growth Equity Fund lagged its benchmark, the Russell 1000 Growth Index, but outpaced the average return of large-cap growth funds.
The Growth Equity Fund’s performance got a boost from the healthy returns generated by the consumer discretionary and consumer staples sectors. Although consumer discretionary stocks tend to be vulnerable in periods of economic uncertainty, the fund held a number of companies, such as Amazon.com and Starbucks, that have managed to separate themselves from the pack of retailers,
restaurants, and entertainment purveyors that make up the sector. Both the fund’sand the broader market’s—consumer staples stocks produced strong returns, a pattern consistent with their reputation as a defensive haven in unsettled markets.
The fund’s performance was also helped by strong stock selection in the industrials sector. While the benchmark’s industrial holdings produced negative returns for the year, the fund’s industrial stocks posted a gain. The fund benefited both from the stocks it held and from the advisors’ decision to steer clear of airlines, a weak-performing sector because of concerns that an anemic global economy would put the brakes on travel.
| Expense Ratios | ||
| Your Fund Compared With Its Peer Group | ||
| Peer Group | ||
| Fund | Average | |
| Growth Equity Fund | 0.51% | 1.37% |
The fund expense ratio shown is from the prospectus dated January 28, 2011, and represents estimated costs for the current fiscal year. For the fiscal year ended September 30, 2011, the fund’s expense ratio was 0.52%. The peer-group expense ratio is derived from data provided by Lipper Inc. and captures information through year-end 2010.
Peer group: Large-Cap Growth Funds.
4
The fund’s positions in financials and energy were a drag on its return and hurt performance relative to the benchmark. As a group, financial institutions have struggled, burdened by bad loans and other legacies of the financial crisis.
The fund’s relatively small number of financial holdings grappled with additional challenges, both in the investment banking and insurance industries. Energy stocks held up better than the broad market during the past year, but the fund had relatively significant exposure to poorly performing oil and gas exploration stocks.
Although returns in information technology were positive, the fund’s 12-month performance in the sector, which accounted for more than one-quarter of fund assets, also was a factor in keeping the fund a few steps behind its benchmark, as business-oriented storage and network communications stocks struggled.
For more on the strategy and outlook of the fund’s two advisory firms, Baillie Gifford Overseas and Jennison Associates, please see the Advisors’ Report following this letter.
Market turmoil has an impact on the fund’s long-term returns
Over the past ten years, Vanguard Growth Equity Fund has had an annual average return of 2.22%, a bit lower than the benchmark index’s modest 3.01%, but higher than the peer group’s 1.70%. All three figures reflect the broad stock market downturn triggered by the financial crisis of 2008.
| Total Returns | |
| Ten Years Ended September 30, 2011 | |
| Average | |
| Annual Return | |
| Growth Equity Fund | 2.22% |
| Russell 1000 Growth Index | 3.01 |
| Large-Cap Growth Funds Average | 1.70 |
| Large-Cap Growth Funds Average: Derived from data provided by Lipper Inc. |
The figures shown represent past performance, which is not a guarantee of future results. (Current performance may be lower or higher than the performance data cited. For performance data current to the most recent month-end, visit our website at vanguard.com/performance.) Note, too, that both investment returns and principal value can fluctuate widely, so an investor’s shares, when sold, could be worth more or less than their original cost.
5
Although these figures provide perspective on the stock market’s challenges during the past decade, they shed less light on the performance of the fund’s two advisory firms, which joined the fund about three years ago. Our confidence in both advisors makes us optimistic about the fund’s ability to deliver competitive returns relative to both its peers and its benchmark index. They’ll be aided in these efforts by the fund’s low costs, which can minimize the gap between an advisor’s talents and an investor’s returns.
A diversified portfolio is crucial in uncertain times
Although the fiscal year got off to a promising start, its conclusion produced fresh anxieties, an unnerving pattern of back-and-forth that has characterized the financial markets for much of the past decade.
At times, however, gloomy commentary and punditry about the investment environment and its prospects have painted an unnecessarily bleak picture. Although stock market performance has been disappointing, both Vanguard Growth Equity Fund and the broad market have managed a positive return for one of the worst ten-year stretches in stock market history. Bonds, meanwhile, have produced surprisingly strong returns.
Even as short-term drama dominates the headlines, we encourage investors to maintain a long-term focus. We believe investors are best served by building a diversified, balanced portfolio that includes a mix of stock and bond funds and short-term investments.
Vanguard Growth Equity Fund, with its low costs and experienced advisors, can be an integral piece of that sort of sound investment strategy. Thank you for entrusting your assets to Vanguard.
Sincerely,

F. William McNabb III
Chairman and Chief Executive Officer
October 13, 2011
6
Advisors’ Report
For the fiscal year ended September 30, 2011, Vanguard Growth Equity Fund returned 2.35%. Your fund is managed by two independent advisors, a strategy that enhances the fund’s diversification by providing exposure to distinct, yet complementary, investment approaches. It’s not uncommon for different advisors to have different views about individual securities or the broader investment environment.
The advisors, the percentage of fund assets each manages, and brief descriptions of their investment strategies are presented in the table below. The advisors have also prepared a discussion of the investment environment that existed during the fiscal year and of how portfolio positioning reflects this assessment. These comments were prepared on October 18, 2011.
| Vanguard Growth Equity Fund Investment Advisors | |||
| Fund Assets Managed | |||
| Investment Advisor | % | $ Million | Investment Strategy |
| Baillie Gifford Overseas Ltd. | 49 | 284 | Uses a fundamental approach to identify quality growth |
| companies. The firm considers the sustainability of | |||
| earnings growth to be a critical factor in evaluating a | |||
| company’s prospects. The firm looks for companies | |||
| with attractive industry backgrounds, strong | |||
| competitive positions within those industries, | |||
| high-quality earnings, and a favorable attitude toward | |||
| shareholders. | |||
| Jennison Associates LLC | 48 | 278 | Uses a research-driven, fundamental investment |
| approach that relies on in-depth company knowledge | |||
| gleaned through meetings with management, | |||
| customers, and suppliers. | |||
| Cash Investments | 3 | 17 | These short-term reserves are invested by Vanguard in |
| equity index products to simulate investment in stocks. | |||
| Each advisor also may maintain a modest cash | |||
| position. | |||
7
Baillie Gifford Overseas Ltd.
Portfolio Manager:
Mick Brewis, Partner and Head of North American Investment Team For much of the period, improving fundamentals and better corporate news led to a steady appreciation in the index. During the last three months, however, financial markets succumbed to frayed nerves. A combination of deteriorating economic data globally and political wrangling on both sides of the Atlantic was at the heart of the matter. There now seems little doubt that we are looking at a period of lower growth in the United States than had been anticipated at the start of the year, and the Federal Reserve has added to the angst by discussing the possibility of significant downside risks to economic activity.
Although we recognize that the economy is stuttering, we believe that the stream of negative macroeconomic news needs to be balanced against the growth prospects for individual companies. We are investing in a focused selection of stocks rather than the economy as a whole, and we are encouraged that we continue to generate a broad range of potential buying ideas with stock-specific growth drivers.
We are also satisfied with the operational performance of a wide range of portfolio holdings. From Bed Bath & Beyond to Bristol Myers Squibb to Progressive, we see well-financed companies with particular competitive advantages and the prospect of sustainable, resilient earnings growth.
Since our last letter, activity in the portfolio has remained at the usual low level. Our two most recent purchases include IDEXX Laboratories, which supplies veterinary diagnostic products and services, and U.S. Bancorp. The latter is of particular note, as the portfolio has had limited bank exposure because of persistent concerns about lingering bad debt and the costs of tighter regulation.
U.S. Bancorp, which operates in the western United States and the Midwest, has leading commercial and retail bank franchises and attractive fee-earning businesses. The management focus is on profitability and organic growth, which is reflected in superior returns. While the industry background remains uncertain, we believe that the fog is beginning to clear, and U.S. Bancorp’s strong competitive position should allow it over time to garner market share and generate deposit and loan growth.
Although current stock market conditions might suggest otherwise, there are reasons to be positive amid the gloom and doom. Domestically, the consumer will benefit from lower gas prices at the pump, and the Fed’s so-called Operation Twist should result in lower interest and
8
mortgage rates. U.S. employment news has generally been better than expected. Europe’s fiscal and debt crisis, however, is likely to hinder global growth for many years.
To fund purchases of more domestically oriented stocks, we reduced our large holding in Schlumberger, the oil field services giant, and made some sales in the industrial and IT sectors.
Overall, the portfolio remains broadly balanced. Valuations look attractive, and it should be a good time to invest in the types of growth stock that typically populate the portfolio. Furthermore, in an environment in which growth is harder to come by, those stocks that have specific, identifiable drivers of growth should become more valuable.
Jennison Associates LLC
Portfolio Manager: Kathleen A. McCarragher, Managing Director Consumer discretionary positions contributed most to the portfolio’s return; the portfolio benefited from our above-benchmark weightings of strongly performing stocks. Amazon.com’s strong earnings reflected both the company’s gains in market share and a long-term shift to e-commerce. Starbucks benefited from strong domestic and international growth, and from enthusiasm about a strategic relationship that furthers the company’s goal of expanding its presence in the premium single-cup coffee market.
Stock selection was strong in consumer staples, where Whole Foods Market climbed because of strong sales trends and gains in market share. Costco Wholesale reported better-than-projected earnings on solid traffic and sales growth, strong membership renewal trends, and solid margin expansion.
Underweighted positions in industrials and materials, the benchmark’s two worst-performing sectors, also helped the portfolio’s performance.
Stock selection hurt performance in health care, where Express Scripts’ decline largely offset Shire’s advance. Express Scripts, one of the largest pharmacy benefits managers in North America, was buffeted by Walgreens’ threat to withdraw from its provider network and uncertainty about whether its proposed acquisition of Medco Health Solutions would be approved by the Federal Trade Commission. The better-than-anticipated earnings and revenues of Shire, a specialty biopharmaceutical company, reflected strong sales of key products Adderall (for attention deficit
9
hyperactivity disorder), Replagal (for Fabry disease, an enzyme-deficiency condition), and Elaprase (for Hunter syndrome, another enzyme-deficiency disease).
In information technology, stock selection detracted from relative return as EMC and Juniper Networks fell, countering strong gains in Apple and IBM. Both EMC, a provider of data storage systems, and Juniper, an internet protocol routing company, were hurt by a deteriorating macroeconomic backdrop. Apple’s financial results beat consensus forecasts by a wide margin, as sales of iPhones and iPads continued to impress. IBM climbed on better-than-expected revenue and earnings, growth across the globe, and strong cash flow.
10
Growth Equity Fund
Fund Profile
As of September 30, 2011
| Portfolio Characteristics | |||
| Russell | DJ | ||
| 1000 | U.S. Total | ||
| Growth | Market | ||
| Fund | Index | Index | |
| Number of Stocks | 84 | 587 | 3,717 |
| Median Market Cap | $30.1B | $32.4B | $28.7B |
| Price/Earnings Ratio | 18.1x | 15.0x | 13.6x |
| Price/Book Ratio | 3.2x | 3.4x | 1.9x |
| Return on Equity | 22.1% | 25.5% | 19.1% |
| Earnings Growth Rate | 17.0% | 13.7% | 7.3% |
| Dividend Yield | 1.2% | 1.7% | 2.2% |
| Foreign Holdings | 6.6% | 0.0% | 0.0% |
| Turnover Rate | 44% | — | — |
| Ticker Symbol | VGEQX | — | — |
| Expense Ratio1 | 0.51% | — | — |
| 30-Day SEC Yield | 0.60% | — | — |
| Short-Term Reserves | 3.1% | — | — |
| Sector Diversification (% of equity exposure) | |||
| Russell | DJ | ||
| 1000 | U.S. Total | ||
| Growth | Market | ||
| Fund | Index | Index | |
| Consumer | |||
| Discretionary | 17.3% | 14.5% | 12.2% |
| Consumer Staples | 12.0 | 13.0 | 11.0 |
| Energy | 9.1 | 10.3 | 10.3 |
| Financials | 8.0 | 3.8 | 14.3 |
| Health Care | 14.6 | 11.0 | 11.7 |
| Industrials | 7.8 | 12.1 | 10.6 |
| Information | |||
| Technology | 27.3 | 28.9 | 19.4 |
| Materials | 2.6 | 5.1 | 4.0 |
| Telecommunication | |||
| Services | 1.2 | 1.2 | 2.8 |
| Utilities | 0.1 | 0.1 | 3.7 |
| Volatility Measures | ||
| DJ | ||
| U.S. Total | ||
| Russell 1000 | Market | |
| Growth Index | Index | |
| R-Squared | 0.99 | 0.97 |
| Beta | 0.99 | 0.93 |
These measures show the degree and timing of the fund’s fluctuations compared with the indexes over 36 months.
| Ten Largest Holdings (% of total net assets) | ||
| Apple Inc. | Computer | |
| Hardware | 6.3% | |
| Oracle Corp. | Systems Software | 3.6 |
| Bristol-Myers Squibb Co. | Pharmaceuticals | 2.8 |
| Amazon.com Inc. | Internet Retail | 2.5 |
| Progressive Corp. | Property & Casualty | |
| Insurance | 2.1 | |
| Walgreen Co. | Drug Retail | 2.1 |
| Exxon Mobil Corp. | Integrated Oil & | |
| Gas | 2.0 | |
| Colgate-Palmolive Co. | Household | |
| Products | 1.9 | |
| Monsanto Co. | Fertilizers & | |
| Agricultural | ||
| Chemicals | 1.9 | |
| Schlumberger Ltd. | Oil & Gas | |
| Equipment & | ||
| Services | 1.8 | |
| Top Ten | 27.0% | |
The holdings listed exclude any temporary cash investments and equity index products.
Investment Focus
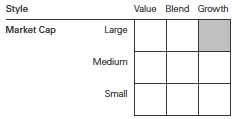
1 The expense ratio shown is from the prospectus dated January 28, 2011, and represents estimated costs for the current fiscal year. For the fiscal year ended September 30, 2011, the expense ratio was 0.52%.
11
Growth Equity Fund
Performance Summary
All of the returns in this report represent past performance, which is not a guarantee of future results that may be achieved by the fund. (Current performance may be lower or higher than the performance data cited. For performance data current to the most recent month-end, visit our website at vanguard.com/performance.) Note, too, that both investment returns and principal value can fluctuate widely, so an investor’s shares, when sold, could be worth more or less than their original cost. The returns shown do not reflect taxes that a shareholder would pay on fund distributions or on the sale of fund shares.
Cumulative Performance: September 30, 2001, Through September 30, 2011
Initial Investment of $10,000
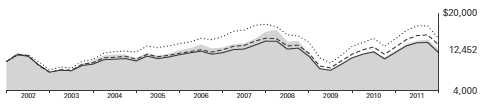
| Average Annual Total Returns | ||||
| Periods Ended September 30, 2011 | ||||
| Final Value | ||||
| One | Five | Ten | of a $10,000 | |
| Year | Years | Years | Investment | |
| Growth Equity Fund | 2.35% | -0.64% | 2.22% | $12,452 |
| Dow Jones U.S. Total Stock Market | ||||
| Index | 0.31 | -0.57 | 3.93 | 14,709 |
| Russell 1000 Growth Index | 3.78 | 1.62 | 3.01 | 13,451 |
| Large-Cap Growth Funds Average | -0.09 | 0.05 | 1.70 | 11,841 |
| Large-Cap Growth Funds Average: Derived from data provided by Lipper Inc. | ||||
See Financial Highlights for dividend and capital gains information.
12
Growth Equity Fund
Fiscal-Year Total Returns (%): September 30, 2001, Through September 30, 2011
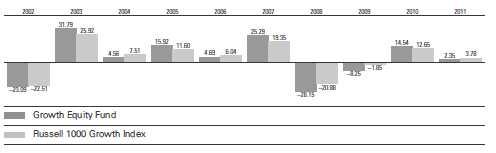
13
Growth Equity Fund
Financial Statements
Statement of Net Assets
As of September 30, 2011
The fund reports a complete list of its holdings in regulatory filings four times in each fiscal year, at the quarter-ends. For the second and fourth fiscal quarters, the lists appear in the fund’s semiannual and annual reports to shareholders. For the first and third fiscal quarters, the fund files the lists with the Securities and Exchange Commission on Form N-Q. Shareholders can look up the fund’s Forms N-Q on the SEC’s website at sec.gov. Forms N-Q may also be reviewed and copied at the SEC’s Public Reference Room (see the back cover of this report for further information).
| Market | |||
| Value | |||
| Shares | ($000) | ||
| Common Stocks (94.4%)1 | |||
| Consumer Discretionary (16.5%) | |||
| * | Amazon.com Inc. | 65,749 | 14,217 |
| Starbucks Corp. | 272,467 | 10,160 | |
| * | O’Reilly Automotive Inc. | 149,021 | 9,929 |
| Home Depot Inc. | 280,070 | 9,206 | |
| Ralph Lauren Corp. Class A | 61,579 | 7,987 | |
| * | Bed Bath & Beyond Inc. | 138,009 | 7,909 |
| NIKE Inc. Class B | 74,535 | 6,373 | |
| Coach Inc. | 117,050 | 6,067 | |
| Omnicom Group Inc. | 114,511 | 4,219 | |
| Bayerische Motoren | |||
| Werke AG ADR | 180,146 | 3,951 | |
| LVMH Moet Hennessy | |||
| Louis Vuitton SA ADR | 146,393 | 3,855 | |
| * | BorgWarner Inc. | 60,874 | 3,685 |
| * | Lululemon Athletica Inc. | 59,504 | 2,895 |
| Johnson Controls Inc. | 88,150 | 2,324 | |
| * | CarMax Inc. | 91,309 | 2,178 |
| * | Tesla Motors Inc. | 23,973 | 585 |
| 95,540 | |||
| Consumer Staples (11.4%) | |||
| Walgreen Co. | 365,232 | 12,012 | |
| Colgate-Palmolive Co. | 123,524 | 10,954 | |
| Whole Foods Market Inc. | 124,038 | 8,101 | |
| Brown-Forman Corp. | |||
| Class B | 112,680 | 7,903 | |
| Mead Johnson Nutrition | |||
| Co. | 111,471 | 7,673 | |
| Costco Wholesale Corp. | 72,294 | 5,937 | |
| Estee Lauder Cos. Inc. | |||
| Class A | 57,606 | 5,060 | |
| * | Green Mountain Coffee | ||
| Roasters Inc. | 50,430 | 4,687 | |
| PepsiCo Inc. | 56,115 | 3,474 | |
| 65,801 | |||
| Market | |||
| Value | |||
| Shares | ($000) | ||
| Energy (8.5%) | |||
| Exxon Mobil Corp. | 160,020 | 11,622 | |
| Schlumberger Ltd. | 176,169 | 10,522 | |
| Apache Corp. | 106,614 | 8,555 | |
| EOG Resources Inc. | 79,125 | 5,619 | |
| Cenovus Energy Inc. | 180,650 | 5,563 | |
| National Oilwell Varco Inc. | 101,230 | 5,185 | |
| * | Concho Resources Inc. | 35,026 | 2,492 |
| 49,558 | |||
| Financials (7.4%) | |||
| Progressive Corp. | 682,308 | 12,118 | |
| * | Berkshire Hathaway Inc. | ||
| Class B | 134,084 | 9,525 | |
| M&T Bank Corp. | 87,644 | 6,126 | |
| American Express Co. | 128,024 | 5,748 | |
| US Bancorp | 203,170 | 4,783 | |
| * | Markel Corp. | 7,593 | 2,712 |
| Goldman Sachs Group Inc. | 18,572 | 1,756 | |
| 42,768 | |||
| Health Care (13.9%) | |||
| Bristol-Myers Squibb Co. | 517,975 | 16,254 | |
| * | Intuitive Surgical Inc. | 23,176 | 8,442 |
| Shire plc ADR | 69,609 | 6,538 | |
| * | Agilent Technologies Inc. | 191,643 | 5,989 |
| * | Celgene Corp. | 88,647 | 5,489 |
| * | Express Scripts Inc. | 134,721 | 4,994 |
| Novo Nordisk A/S ADR | 48,205 | 4,797 | |
| * | Vertex Pharmaceuticals Inc. | 106,193 | 4,730 |
| * | IDEXX Laboratories Inc. | 57,400 | 3,959 |
| * | Life Technologies Corp. | 93,520 | 3,594 |
| * | Waters Corp. | 43,750 | 3,303 |
| Valeant Pharmaceuticals | |||
| International Inc. | 88,596 | 3,289 | |
| * | Illumina Inc. | 74,649 | 3,055 |
| Techne Corp. | 40,773 | 2,773 | |
| * | Alexion Pharmaceuticals | ||
| Inc. | 27,087 | 1,735 | |
| * | Edwards Lifesciences Corp. | 20,074 | 1,431 |
| 80,372 | |||
14
Growth Equity Fund
| Market | |||
| Value | |||
| Shares | ($000) | ||
| Industrials (7.3%) | |||
| United Parcel Service Inc. | |||
| Class B | 145,572 | 9,193 | |
| Danaher Corp. | 204,418 | 8,573 | |
| Precision Castparts Corp. | 51,234 | 7,965 | |
| United Technologies Corp. | 70,740 | 4,977 | |
| Boeing Co. | 82,049 | 4,965 | |
| Deere & Co. | 43,135 | 2,785 | |
| Rockwell Automation Inc. | 32,580 | 1,824 | |
| ^ | Ritchie Bros Auctioneers | ||
| Inc. | 86,710 | 1,751 | |
| 42,033 | |||
| Information Technology (25.9%) | |||
| * | Apple Inc. | 95,025 | 36,222 |
| Oracle Corp. | 725,472 | 20,850 | |
| International Business | |||
| Machines Corp. | 58,978 | 10,323 | |
| * | VMware Inc. Class A | 105,826 | 8,506 |
| * | Baidu Inc./China ADR | 76,319 | 8,159 |
| * | eBay Inc. | 255,943 | 7,548 |
| * | EMC Corp. | 354,940 | 7,450 |
| * | Google Inc. Class A | 14,388 | 7,401 |
| Linear Technology Corp. | 263,025 | 7,273 | |
| QUALCOMM Inc. | 135,576 | 6,593 | |
| Avago Technologies Ltd. | 197,899 | 6,485 | |
| * | F5 Networks Inc. | 89,040 | 6,326 |
| * | Salesforce.com Inc. | 49,980 | 5,712 |
| * | Red Hat Inc. | 108,085 | 4,568 |
| * | NetApp Inc. | 94,405 | 3,204 |
| * | Juniper Networks Inc. | 109,800 | 1,895 |
| Broadcom Corp. Class A | 47,744 | 1,589 | |
| * | Youku.com Inc. ADR | 13,452 | 220 |
| 150,324 | |||
| Materials (2.4%) | |||
| Monsanto Co. | 179,723 | 10,790 | |
| Praxair Inc. | 36,389 | 3,402 | |
| 14,192 | |||
| Telecommunication Services (1.1%) | |||
| * | American Tower Corp. | ||
| Class A | 118,038 | 6,351 | |
| Total Common Stocks | |||
| (Cost $513,024) | 546,939 | ||
| Market | |||
| Value | |||
| Shares | ($000) | ||
| Temporary Cash Investments (6.2%)1 | |||
| Money Market Fund (5.9%) | |||
| 2,3 | Vanguard Market | ||
| Liquidity Fund, 0.144% | 34,554,608 | 34,555 | |
| Face | |||
| Amount | |||
| ($000) | |||
| U.S. Government and Agency Obligations (0.3%) | |||
| 4,5 | Fannie Mae Discount Notes, | ||
| 0.045%, 12/7/11 | 450 | 450 | |
| 4,5 | Federal Home Loan Bank | ||
| Discount Notes, 0.075%, | |||
| 11/16/11 | 100 | 100 | |
| 4,5 | Federal Home Loan Bank | ||
| Discount Notes, 0.040%, | |||
| 12/9/11 | 500 | 500 | |
| 4,5 | Freddie Mac Discount Notes, | ||
| 0.080%, 12/29/11 | 500 | 499 | |
| 1,549 | |||
| Total Temporary Cash Investments | |||
| (Cost $36,104) | 36,104 | ||
| Total Investments (100.6%) | |||
| (Cost $549,128) | 583,043 | ||
| Other Assets and Liabilities (-0.6%) | |||
| Other Assets | 1,094 | ||
| Liabilities3 | (4,821) | ||
| (3,727) | |||
| Net Assets (100%) | |||
| Applicable to 58,325,404 outstanding | |||
| $.001 par value shares of beneficial | |||
| interest (unlimited authorization) | 579,316 | ||
| Net Asset Value Per Share | $9.93 | ||
15
Growth Equity Fund
| At September 30, 2011, net assets consisted of: | |
| Amount | |
| ($000) | |
| Paid-in Capital | 747,079 |
| Undistributed Net Investment Income | 354 |
| Accumulated Net Realized Losses | (201,322) |
| Unrealized Appreciation (Depreciation) | |
| Investment Securities | 33,915 |
| Futures Contracts | (710) |
| Net Assets | 579,316 |
See Note A in Notes to Financial Statements.
* Non-income-producing security.
^ Part of security position is on loan to broker-dealers. The total value of securities on loan is $856,000.
1 The fund invests a portion of its cash reserves in equity markets through the use of index futures contracts. After giving effect to futures investments, the fund’s effective common stock and temporary cash investment positions represent 97.4% and 3.2%, respectively, of net assets.
2 Affiliated money market fund available only to Vanguard funds and certain trusts and accounts managed by Vanguard. Rate shown is the 7-day yield.
3 Includes $890,000 of collateral received for securities on loan.
4 The issuer operates under a congressional charter; its securities are not backed by the full faith and credit of the U.S. government.
5 Securities with a value of $1,350,000 have been segregated as initial margin for open futures contracts.
ADR—American Depositary Receipt.
See accompanying Notes, which are an integral part of the Financial Statements.
16
Growth Equity Fund
| Statement of Operations | |
| Year Ended | |
| September 30, 2011 | |
| ($000) | |
| Investment Income | |
| Income | |
| Dividends1 | 7,338 |
| Interest2 | 56 |
| Security Lending | 58 |
| Total Income | 7,452 |
| Expenses | |
| Investment Advisory Fees—Note B | |
| Basic Fee | 1,579 |
| Performance Adjustment | (311) |
| The Vanguard Group—Note C | |
| Management and Administrative | 1,974 |
| Marketing and Distribution | 152 |
| Custodian Fees | 25 |
| Auditing Fees | 25 |
| Shareholders’ Reports | 22 |
| Trustees’ Fees and Expenses | 2 |
| Total Expenses | 3,468 |
| Expenses Paid Indirectly | (46) |
| Net Expenses | 3,422 |
| Net Investment Income | 4,030 |
| Realized Net Gain (Loss) | |
| Investment Securities Sold | 43,901 |
| Futures Contracts | 1,370 |
| Foreign Currencies | 2 |
| Realized Net Gain (Loss) | 45,273 |
| Change in Unrealized Appreciation (Depreciation) | |
| Investment Securities | (29,933) |
| Futures Contracts | (852) |
| Change in Unrealized Appreciation (Depreciation) | (30,785) |
| Net Increase (Decrease) in Net Assets Resulting from Operations | 18,518 |
| 1 Dividends are net of foreign withholding taxes of $55,000. | |
| 2 Interest income from an affiliated company of the fund was $50,000. | |
See accompanying Notes, which are an integral part of the Financial Statements.
17
Growth Equity Fund
| Statement of Changes in Net Assets | ||
| Year Ended September 30, | ||
| 2011 | 2010 | |
| ($000) | ($000) | |
| Increase (Decrease) in Net Assets | ||
| Operations | ||
| Net Investment Income | 4,030 | 4,060 |
| Realized Net Gain (Loss) | 45,273 | 29,178 |
| Change in Unrealized Appreciation (Depreciation) | (30,785) | 49,435 |
| Net Increase (Decrease) in Net Assets Resulting from Operations | 18,518 | 82,673 |
| Distributions | ||
| Net Investment Income | (4,557) | (5,088) |
| Realized Capital Gain | — | — |
| Total Distributions | (4,557) | (5,088) |
| Capital Share Transactions | ||
| Issued | 131,034 | 82,529 |
| Issued in Lieu of Cash Distributions | 4,444 | 4,881 |
| Redeemed | (167,605) | (161,263) |
| Net Increase (Decrease) from Capital Share Transactions | (32,127) | (73,853) |
| Total Increase (Decrease) | (18,166) | 3,732 |
| Net Assets | ||
| Beginning of Period | 597,482 | 593,750 |
| End of Period1 | 579,316 | 597,482 |
| 1 Net Assets—End of Period includes undistributed net investment income of $354,000 and $879,000. | ||
See accompanying Notes, which are an integral part of the Financial Statements.
18
Growth Equity Fund
Financial Highlights
| For a Share Outstanding | Year Ended September 30, | ||||
| Throughout Each Period | 2011 | 2010 | 2009 | 2008 | 2007 |
| Net Asset Value, Beginning of Period | $9.77 | $8.60 | $9.46 | $13.18 | $10.52 |
| Investment Operations | |||||
| Net Investment Income | .067 | .062 | .085 | .015 | .020 |
| Net Realized and Unrealized Gain (Loss) | |||||
| on Investments | .168 | 1.183 | (.883) | (3.720) | 2.640 |
| Total from Investment Operations | .235 | 1.245 | (.798) | (3.705) | 2.660 |
| Distributions | |||||
| Dividends from Net Investment Income | (.075) | (.075) | (.062) | (.015) | — |
| Distributions from Realized Capital Gains | — | — | — | — | — |
| Total Distributions | (.075) | (.075) | (.062) | (.015) | — |
| Net Asset Value, End of Period | $9.93 | $9.77 | $8.60 | $9.46 | $13.18 |
| Total Return1 | 2.35% | 14.54% | -8.25% | -28.15% | 25.29% |
| Ratios/Supplemental Data | |||||
| Net Assets, End of Period (Millions) | $579 | $597 | $594 | $731 | $975 |
| Ratio of Total Expenses to | |||||
| Average Net Assets2 | 0.52% | 0.51% | 0.51% | 0.72% | 0.68% |
| Ratio of Net Investment Income to | |||||
| Average Net Assets | 0.60% | 0.66% | 1.10% | 0.18% | 0.14% |
| Portfolio Turnover Rate | 44% | 48% | 98% | 222% | 131% |
1 Total returns do not include account service fees that may have applied in the periods shown. Fund prospectuses provide information about any applicable account service fees.
2 Includes performance-based investment advisory fee increases (decreases) of (0.05%), (0.06%), (0.09%), 0.08%, and 0.04%.
See accompanying Notes, which are an integral part of the Financial Statements.
19
Growth Equity Fund
Notes to Financial Statements
Vanguard Growth Equity Fund is registered under the Investment Company Act of 1940 as an open-end investment company, or mutual fund.
A. The following significant accounting policies conform to generally accepted accounting principles for U.S. mutual funds. The fund consistently follows such policies in preparing its financial statements.
1. Security Valuation: Securities are valued as of the close of trading on the New York Stock Exchange (generally 4 p.m., Eastern time) on the valuation date. Equity securities are valued at the latest quoted sales prices or official closing prices taken from the primary market in which each security trades; such securities not traded on the valuation date are valued at the mean of the latest quoted bid and asked prices. Securities for which market quotations are not readily available, or whose values have been affected by events occurring before the fund’s pricing time but after the close of the securities’ primary markets, are valued at their fair values calculated according to procedures adopted by the board of trustees. These procedures include obtaining quotations from an independent pricing service, monitoring news to identify significant market- or security-specific events, and evaluating changes in the values of foreign market proxies (for example, ADRs, futures contracts, or exchange-traded funds), between the time the foreign markets close and the fund’s pricing time. When fair-value pricing is employed, the prices of securities used by a fund to calculate its net asset value may differ from quoted or published prices for the same securities. Investments in Vanguard Market Liquidity Fund are valued at that fund’s net asset value. Temporary cash investments acquired over 60 days to maturity are valued using the latest bid prices or using valuations based on a matrix system (which considers such factors as security prices, yields, maturities, and ratings), both as furnished by independent pricing services. Other temporary cash investments are valued at amortized cost, which approximates market value.
2. Foreign Currency: Securities and other assets and liabilities denominated in foreign currencies are translated into U.S. dollars using exchange rates obtained from an independent third party as of the fund’s pricing time on the valuation date. Realized gains (losses) and unrealized appreciation (depreciation) on investment securities include the effects of changes in exchange rates since the securities were purchased, combined with the effects of changes in security prices. Fluctuations in the value of other assets and liabilities resulting from changes in exchange rates are recorded as unrealized foreign currency gains (losses) until the assets or liabilities are settled in cash, at which time they are recorded as realized foreign currency gains (losses).
3. Futures Contracts: The fund uses index futures contracts to a limited extent, with the objective of maintaining full exposure to the stock market while maintaining liquidity. The fund may purchase or sell futures contracts to achieve a desired level of investment, whether to accommodate portfolio turnover or cash flows from capital share transactions. The primary risks associated with the use of futures contracts are imperfect correlation between changes in market values of stocks held by the fund and the prices of futures contracts, and the possibility of an illiquid market.
Futures contracts are valued at their quoted daily settlement prices. The aggregate principal amounts of the contracts are not recorded in the Statement of Net Assets. Fluctuations in the value of the contracts are recorded in the Statement of Net Assets as an asset (liability) and in the Statement of Operations as unrealized appreciation (depreciation) until the contracts are closed, when they are recorded as realized futures gains (losses).
20
Growth Equity Fund
4. Federal Income Taxes: The fund intends to continue to qualify as a regulated investment company and distribute all of its taxable income. Management has analyzed the fund’s tax positions taken for all open federal income tax years (September 30, 2008–2011), and has concluded that no provision for federal income tax is required in the fund’s financial statements.
5. Distributions: Distributions to shareholders are recorded on the ex-dividend date.
6. Security Lending: The fund may lend its securities to qualified institutional borrowers to earn additional income. Security loans are required to be secured at all times by collateral at least equal to the market value of securities loaned. The fund invests cash collateral received in Vanguard Market Liquidity Fund, and records a liability for the return of the collateral, during the period the securities are on loan. Security lending income represents fees charged to borrowers plus income earned on investing cash collateral, less expenses associated with the loan.
7. Other: Dividend income is recorded on the ex-dividend date. Interest income includes income distributions received from Vanguard Market Liquidity Fund and is accrued daily. Security transactions are accounted for on the date securities are bought or sold. Costs used to determine realized gains (losses) on the sale of investment securities are those of the specific securities sold.
B. Baillie Gifford Overseas Ltd. and Jennison Associates LLC each provide investment advisory services to a portion of the fund for fees calculated at an annual percentage rate of average net assets managed by the advisor. The basic fee of Baillie Gifford Overseas Ltd. is subject to quarterly adjustments based on performance for the preceding three years, relative to the S&P 500 Index. The basic fee of Jennison Associates LLC is subject to quarterly adjustments based on performance since March 31, 2009, relative to the Russell 1000 Growth Index.
The Vanguard Group manages the cash reserves of the fund on an at-cost basis.
For the year ended September 30, 2011, the aggregate investment advisory fee represented an effective annual basic rate of 0.24% of the fund’s average net assets, before a decrease of $311,000 (0.05%) based on performance.
C. The Vanguard Group furnishes at cost corporate management, administrative, marketing, and distribution services. The costs of such services are allocated to the fund under methods approved by the board of trustees. The fund has committed to provide up to 0.40% of its net assets in capital contributions to Vanguard. At September 30, 2011, the fund had contributed capital of $104,000 to Vanguard (included in Other Assets), representing 0.02% of the fund’s net assets and 0.04% of Vanguard’s capitalization. The fund’s trustees and officers are also directors and officers of Vanguard.
D. The fund has asked its investment advisors to direct certain security trades, subject to obtaining the best price and execution, to brokers who have agreed to rebate to the fund part of the commissions generated. Such rebates are used solely to reduce the fund’s management and administrative expenses. For the year ended September 30, 2011, these arrangements reduced the fund’s expenses by $46,000 (an annual rate of 0.01% of average net assets).
21
Growth Equity Fund
E. Various inputs may be used to determine the value of the fund’s investments. These inputs are summarized in three broad levels for financial statement purposes. The inputs or methodologies used to value securities are not necessarily an indication of the risk associated with investing in those securities.
Level 1—Quoted prices in active markets for identical securities.
Level 2—Other significant observable inputs (including quoted prices for similar securities, interest rates, prepayment speeds, credit risk, etc.).
Level 3—Significant unobservable inputs (including the fund’s own assumptions used to determine the fair value of investments).
The following table summarizes the fund’s investments as of September 30, 2011, based on the inputs used to value them:
| Level 1 | Level 2 | Level 3 | |
| Investments | ($000) | ($000) | ($000) |
| Common Stocks | 546,939 | — | — |
| Temporary Cash Investments | 34,555 | 1,549 | — |
| Futures Contracts—Liabilities1 | (462) | — | — |
| Total | 581,032 | 1,549 | — |
| 1 Represents variation margin on the last day of the reporting period. |
F. At September 30, 2011, the aggregate settlement value of open futures contracts and the related unrealized appreciation (depreciation) were:
| ($000) | ||||
| Aggregate | ||||
| Number of | Settlement | Unrealized | ||
| Long (Short) | Value | Appreciation | ||
| Futures Contracts | Expiration | Contracts | Long (Short) | (Depreciation) |
| S&P 500 Index | December 2011 | 61 | 17,172 | (710) |
Unrealized appreciation (depreciation) on open futures contracts is required to be treated as realized gain (loss) for tax purposes.
G. Distributions are determined on a tax basis and may differ from net investment income and realized capital gains for financial reporting purposes. Differences may be permanent or temporary. Permanent differences are reclassified among capital accounts in the financial statements to reflect their tax character. Temporary differences arise when certain items of income, expense, gain, or loss are recognized in different periods for financial statement and tax purposes; these differences will reverse at some time in the future. Differences in classification may also result from the treatment of short-term gains as ordinary income for tax purposes.
During the year ended September 30, 2011, the fund realized net foreign currency gains of $2,000, which increased distributable net income for tax purposes; accordingly, such gains have been reclassified from accumulated net realized losses to undistributed net investment income.
22
Growth Equity Fund
For tax purposes, at September 30, 2011, the fund had $2,063,000 of ordinary income available for distribution. The fund had available capital loss carryforwards totaling $201,879,000 to offset future net capital gains of $73,821,000 through September 30, 2017 and $128,058,000 through September 30, 2018. Capital loss carryforwards of $92,062,000 expired on September 30, 2011; accordingly, such losses have been reclassified from accumulated net realized losses to paid-in capital.
At September 30, 2011, the cost of investment securities for tax purposes was $549,128,000. Net unrealized appreciation of investment securities for tax purposes was $33,915,000, consisting of unrealized gains of $84,279,000 on securities that had risen in value since their purchase and $50,364,000 in unrealized losses on securities that had fallen in value since their purchase.
H. During the year ended September 30, 2011, the fund purchased $278,245,000 of investment securities and sold $317,667,000 of investment securities, other than temporary cash investments.
I. Capital shares issued and redeemed were:
| Year Ended September 30, | ||
| 2011 | 2010 | |
| Shares | Shares | |
| (000) | (000) | |
| Issued | 11,983 | 8,902 |
| Issued in Lieu of Cash Distributions | 414 | 535 |
| Redeemed | (15,205) | (17,309) |
| Net Increase (Decrease) in Shares Outstanding | (2,808) | (7,872) |
J. In preparing the financial statements as of September 30, 2011, management considered the impact of subsequent events for potential recognition or disclosure in these financial statements.
23
Report of Independent Registered Public Accounting Firm
To the Trustees of Vanguard Fenway Funds and the Shareholders of Vanguard Growth Equity Fund:
In our opinion, the accompanying statement of net assets and the related statements of operations and of changes in net assets and the financial highlights present fairly, in all material respects, the financial position of Vanguard Growth Equity Fund (constituting a separate portfolio of Vanguard Fenway Funds, hereafter referred to as the “Fund”) at September 30, 2011, the results of its operations for the year then ended, the changes in its net assets for each of the two years in the period then ended and the financial highlights for each of the five years in the period then ended, in conformity with accounting principles generally accepted in the United States of America. These financial statements and financial highlights (hereafter referred to as “financial statements”) are the responsibility of the Fund’s management; our responsibility is to express an opinion on these financial statements based on our audits.
We conducted our audits of these financial statements in accordance with the standards of the Public Company Accounting Oversight Board (United States). Those standards require that we plan and perform the audit to obtain reasonable assurance about whether the financial statements are free of material misstatement. An audit includes examining, on a test basis, evidence supporting the amounts and disclosures in the financial statements, assessing the accounting principles used and significant estimates made by management, and evaluating the overall financial statement presentation.
We believe that our audits, which included confirmation of securities at September 30, 2011 by correspondence with the custodian and broker and by agreement to the underlying ownership records of Vanguard Market Liquidity Fund, provide a reasonable basis for our opinion.
PricewaterhouseCoopers LLP
Philadelphia, Pennsylvania
November 15, 2011
| Special 2011 tax information (unaudited) for Vanguard Growth Equity Fund |
This information for the fiscal year ended September 30, 2011, is included pursuant to provisions of the Internal Revenue Code.
The fund distributed $4,557,000 of qualified dividend income to shareholders during the fiscal year.
For corporate shareholders, 100% of investment income (dividend income plus short-term gains, if any) qualifies for the dividends-received deduction.
24
Your Fund’s After-Tax Returns
This table presents returns for your fund both before and after taxes. The after-tax returns are shown in two ways: (1) assuming that an investor owned the fund during the entire period and paid taxes on the fund’s distributions, and (2) assuming that an investor paid taxes on the fund’s distributions and sold all shares at the end of each period.
Calculations are based on the highest individual federal income tax and capital gains tax rates in effect at the times of the distributions and the hypothetical sales. State and local taxes were not considered. After-tax returns reflect any qualified dividend income, using actual prior-year figures and estimates for 2011. (In the example, returns after the sale of fund shares may be higher than those assuming no sale. This occurs when the sale would have produced a capital loss. The calculation assumes that the investor received a tax deduction for the loss.)
Please note that your actual after-tax returns will depend on your tax situation and may differ from those shown. Also note that if you own the fund in a tax-deferred account, such as an individual retirement account or a 401(k) plan, this information does not apply to you. Such accounts are not subject to current taxes.
Finally, keep in mind that a fund’s performance—whether before or after taxes—does not guarantee future results.
| Average Annual Total Returns: Growth Equity Fund | |||
| Periods Ended September 30, 2011 | |||
| One | Five | Ten | |
| Year | Years | Years | |
| Returns Before Taxes | 2.35% | -0.64% | 2.22% |
| Returns After Taxes on Distributions | 2.24 | -0.72 | 2.16 |
| Returns After Taxes on Distributions and Sale of Fund Shares | 1.69 | -0.55 | 1.90 |
25
About Your Fund’s Expenses
As a shareholder of the fund, you incur ongoing costs, which include costs for portfolio management, administrative services, and shareholder reports (like this one), among others. Operating expenses, which are deducted from a fund’s gross income, directly reduce the investment return of the fund.
A fund’s expenses are expressed as a percentage of its average net assets. This figure is known as the expense ratio. The following examples are intended to help you understand the ongoing costs (in dollars) of investing in your fund and to compare these costs with those of other mutual funds. The examples are based on an investment of $1,000 made at the beginning of the period shown and held for the entire period.
The accompanying table illustrates your fund’s costs in two ways:
• Based on actual fund return. This section helps you to estimate the actual expenses that you paid over the period. The ”Ending Account Value“ shown is derived from the fund‘s actual return, and the third column shows the dollar amount that would have been paid by an investor who started with $1,000 in the fund. You may use the information here, together with the amount you invested, to estimate the expenses that you paid over the period.
To do so, simply divide your account value by $1,000 (for example, an $8,600 account value divided by $1,000 = 8.6), then multiply the result by the number given for your fund under the heading ”Expenses Paid During Period.“
• Based on hypothetical 5% yearly return. This section is intended to help you compare your fund‘s costs with those of other mutual funds. It assumes that the fund had a yearly return of 5% before expenses, but that the expense ratio is unchanged. In this case—because the return used is not the fund’s actual return—the results do not apply to your investment. The example is useful in making comparisons because the Securities and Exchange Commission requires all mutual funds to calculate expenses based on a 5% return. You can assess your fund’s costs by comparing this hypothetical example with the hypothetical examples that appear in shareholder reports of other funds.
Note that the expenses shown in the table are meant to highlight and help you compare ongoing costs only and do not reflect transaction costs incurred by the fund for buying and selling securities. Further, the expenses do not include any purchase, redemption, or account service fees described in the fund prospectus. If such fees were applied to your account, your costs would be higher. Your fund does not carry a “sales load.”
The calculations assume no shares were bought or sold during the period. Your actual costs may have been higher or lower, depending on the amount of your investment and the timing of any purchases or redemptions.
You can find more information about the fund’s expenses, including annual expense ratios, in the Financial Statements section of this report. For additional information on operating expenses and other shareholder costs, please refer to your fund’s current prospectus.
26
| Six Months Ended September 30, 2011 | |||
| Beginning | Ending | Expenses | |
| Account Value | Account Value | Paid During | |
| Growth Equity Fund | 3/31/2011 | 9/30/2011 | Period |
| Based on Actual Fund Return | $1,000.00 | $874.89 | $2.44 |
| Based on Hypothetical 5% Yearly Return | 1,000.00 | 1,022.46 | 2.64 |
The calculations are based on expenses incurred in the most recent six-month period. The fund’s annualized six-month expense ratio for that period is 0.52%. The dollar amounts shown as “Expenses Paid” are equal to the annualized expense ratio multiplied by the average account value over the period, multiplied by the number of days in the most recent six-month period, then divided by the number of days in the most recent 12-month period.
27
Glossary
30-Day SEC Yield. A fund’s 30-day SEC yield is derived using a formula specified by the U.S. Securities and Exchange Commission. Under the formula, data related to the fund’s security holdings in the previous 30 days are used to calculate the fund’s hypothetical net income for that period, which is then annualized and divided by the fund’s estimated average net assets over the calculation period. For the purposes of this calculation, a security’s income is based on its current market yield to maturity (for bonds; excluding inflation for inflation-protected securities), its actual income (for asset-backed securities), or its projected dividend yield (for stocks). Because the SEC yield represents hypothetical annualized income, it will differ—at times significantly—from the fund’s actual experience. As a result, the fund’s income distributions may be higher or lower than implied by the SEC yield.
Beta. A measure of the magnitude of a fund’s past share-price fluctuations in relation to the ups and downs of a given market index. The index is assigned a beta of 1.00. Compared with a given index, a fund with a beta of 1.20 typically would have seen its share price rise or fall by 12% when the index rose or fell by 10%. For this report, beta is based on returns over the past 36 months for both the fund and the index. Note that a fund’s beta should be reviewed in conjunction with its R-squared (see definition). The lower the R-squared, the less correlation there is between the fund and the index, and the less reliable beta is as an indicator of volatility.
Dividend Yield. Dividend income earned by stocks, expressed as a percentage of the aggregate market value (or of net asset value, for a fund). The yield is determined by dividing the amount of the annual dividends by the aggregate value (or net asset value) at the end of the period. For a fund, the dividend yield is based solely on stock holdings and does not include any income produced by other investments.
Earnings Growth Rate. The average annual rate of growth in earnings over the past five years for the stocks now in a fund.
Equity Exposure. A measure that reflects a fund’s investments in stocks and stock futures. Any holdings in short-term reserves are excluded.
Expense Ratio. The percentage of a fund’s average net assets used to pay its annual administrative and advisory expenses. These expenses directly reduce returns to investors.
Foreign Holdings. The percentage of a fund represented by securities or depositary receipts of companies based outside the United States.
Inception Date. The date on which the assets of a fund (or one of its share classes) are first invested in accordance with the fund’s investment objective. For funds with a subscription period, the inception date is the day after that period ends. Investment performance is measured from the inception date.
Median Market Cap. An indicator of the size of companies in which a fund invests; the midpoint of market capitalization (market price x shares outstanding) of a fund’s stocks, weighted by the proportion of the fund’s assets invested in each stock. Stocks representing half of the fund’s assets have market capitalizations above the median, and the rest are below it.
Price/Book Ratio. The share price of a stock divided by its net worth, or book value, per share. For a fund, the weighted average price/book ratio of the stocks it holds.
28
Price/Earnings Ratio. The ratio of a stock’s current price to its per-share earnings over the past year. For a fund, the weighted average P/E of the stocks it holds. P/E is an indicator of market expectations about corporate prospects; the higher the P/E, the greater the expectations for a company’s future growth.
R-Squared. A measure of how much of a fund’s past returns can be explained by the returns from the market in general, as measured by a given index. If a fund’s total returns were precisely synchronized with an index’s returns, its R-squared would be 1.00. If the fund’s returns bore no relationship to the index’s returns, its R-squared would be 0. For this report, R-squared is based on returns over the past 36 months for both the fund and the index.
Return on Equity. The annual average rate of return generated by a company during the past five years for each dollar of shareholder’s equity (net income divided by shareholder’s equity). For a fund, the weighted average return on equity for the companies whose stocks it holds.
Short-Term Reserves. The percentage of a fund invested in highly liquid, short-term securities that can be readily converted to cash.
Turnover Rate. An indication of the fund’s trading activity. Funds with high turnover rates incur higher transaction costs and may be more likely to distribute capital gains (which may be taxable to investors). The turnover rate excludes in-kind transactions, which have minimal impact on costs.
29
This page intentionally left blank.
This page intentionally left blank.
The People Who Govern Your Fund
The trustees of your mutual fund are there to see that the fund is operated and managed in your best interests since, as a shareholder, you are a part owner of the fund. Your fund’s trustees also serve on the board of directors of The Vanguard Group, Inc., which is owned by the Vanguard funds and provides services to them on an at-cost basis.
A majority of Vanguard’s board members are independent, meaning that they have no affiliation with Vanguard or the funds they oversee, apart from the sizable personal investments they have made as private individuals. The independent board members have distinguished backgrounds in business, academia, and public service. Each of the trustees and executive officers oversees 178 Vanguard funds.
The following table provides information for each trustee and executive officer of the fund. More information about the trustees is in the Statement of Additional Information, which can be obtained, without charge, by contacting Vanguard at 800-662-7447, or online at vanguard.com.
| Interested Trustee1 | and President (2006–2008) of Rohm and Haas Co. |
| (chemicals); Director of Tyco International, Ltd. | |
| F. William McNabb III | (diversified manufacturing and services) and Hewlett- |
| Born 1957. Trustee Since July 2009. Chairman of the | Packard Co. (electronic computer manufacturing); |
| Board. Principal Occupation(s) During the Past Five | Senior Advisor at New Mountain Capital; Trustee |
| Years: Chairman of the Board of The Vanguard Group, | of The Conference Board; Member of the Board of |
| Inc., and of each of the investment companies served | Managers of Delphi Automotive LLP (automotive |
| by The Vanguard Group, since January 2010; Director | components). |
| of The Vanguard Group since 2008; Chief Executive | |
| Officer and President of The Vanguard Group and of | Amy Gutmann |
| each of the investment companies served by The | Born 1949. Trustee Since June 2006. Principal |
| Vanguard Group since 2008; Director of Vanguard | Occupation(s) During the Past Five Years: President |
| Marketing Corporation; Managing Director of The | of the University of Pennsylvania; Christopher H. |
| Vanguard Group (1995–2008). | Browne Distinguished Professor of Political Science |
| in the School of Arts and Sciences with secondary | |
| appointments at the Annenberg School for Commu- | |
| Independent Trustees | nication and the Graduate School of Education |
| of the University of Pennsylvania; Director of | |
| Emerson U. Fullwood | Carnegie Corporation of New York, Schuylkill River |
| Born 1948. Trustee Since January 2008. Principal | Development Corporation, and Greater Philadelphia |
| Occupation(s) During the Past Five Years: Executive | Chamber of Commerce; Trustee of the National |
| Chief Staff and Marketing Officer for North America | Constitution Center; Chair of the Presidential |
| and Corporate Vice President (retired 2008) of Xerox | Commission for the Study of Bioethical Issues. |
| Corporation (document management products and | |
| services); Executive in Residence and 2010 | JoAnn Heffernan Heisen |
| Distinguished Minett Professor at the Rochester | Born 1950. Trustee Since July 1998. Principal |
| Institute of Technology; Director of SPX Corporation | Occupation(s) During the Past Five Years: Corporate |
| (multi-industry manufacturing), the United Way of | Vice President and Chief Global Diversity Officer |
| Rochester, Amerigroup Corporation (managed health | (retired 2008) and Member of the Executive |
| care), the University of Rochester Medical Center, | Committee (1997–2008) of Johnson & Johnson |
| Monroe Community College Foundation, and North | (pharmaceuticals/consumer products); Director of |
| Carolina A&T University. | Skytop Lodge Corporation (hotels), the University |
| Medical Center at Princeton, the Robert Wood | |
| Rajiv L. Gupta | Johnson Foundation, and the Center for Work Life |
| Born 1945. Trustee Since December 2001.2 | Policy; Member of the Advisory Board of the |
| Principal Occupation(s) During the Past Five Years: | Maxwell School of Citizenship and Public Affairs |
| Chairman and Chief Executive Officer (retired 2009) | at Syracuse University. |
| F. Joseph Loughrey | Thomas J. Higgins | |
| Born 1949. Trustee Since October 2009. Principal | Born 1957. Chief Financial Officer Since September | |
| Occupation(s) During the Past Five Years: President | 2008. Principal Occupation(s) During the Past Five | |
| and Chief Operating Officer (retired 2009) and Vice | Years: Principal of The Vanguard Group, Inc.; Chief | |
| Chairman of the Board (2008–2009) of Cummins Inc. | Financial Officer of each of the investment companies | |
| (industrial machinery); Director of SKF AB (industrial | served by The Vanguard Group since 2008; Treasurer | |
| machinery), Hillenbrand, Inc. (specialized consumer | of each of the investment companies served by The | |
| services), the Lumina Foundation for Education, and | Vanguard Group (1998–2008). | |
| Oxfam America; Chairman of the Advisory Council | ||
| for the College of Arts and Letters and Member | Kathryn J. Hyatt | |
| of the Advisory Board to the Kellogg Institute for | Born 1955. Treasurer Since November 2008. Principal | |
| International Studies at the University of Notre Dame. | Occupation(s) During the Past Five Years: Principal | |
| of The Vanguard Group, Inc.; Treasurer of each of | ||
| André F. Perold | the investment companies served by The Vanguard | |
| Born 1952. Trustee Since December 2004. Principal | Group since 2008; Assistant Treasurer of each of the | |
| Occupation(s) During the Past Five Years: George | investment companies served by The Vanguard Group | |
| Gund Professor of Finance and Banking at the Harvard | (1988–2008). | |
| Business School (retired July 2011); Chief Investment | ||
| Officer and co-Managing Partner of HighVista | Heidi Stam | |
| Strategies LLC (private investment firm); Director of | Born 1956. Secretary Since July 2005. Principal | |
| Rand Merchant Bank; Overseer of the Museum of | Occupation(s) During the Past Five Years: Managing | |
| Fine Arts Boston. | Director of The Vanguard Group, Inc., since 2006; | |
| General Counsel of The Vanguard Group since 2005; | ||
| Alfred M. Rankin, Jr. | Secretary of The Vanguard Group and of each of the | |
| Born 1941. Trustee Since January 1993. Principal | investment companies served by The Vanguard Group | |
| Occupation(s) During the Past Five Years: Chairman, | since 2005; Director and Senior Vice President of | |
| President, and Chief Executive Officer of NACCO | Vanguard Marketing Corporation since 2005; | |
| Industries, Inc. (forklift trucks/housewares/lignite); | Principal of The Vanguard Group (1997–2006). | |
| Director of Goodrich Corporation (industrial products/ | ||
| aircraft systems and services) and the National | ||
| Association of Manufacturers; Chairman of the | Vanguard Senior Management Team | |
| Federal Reserve Bank of Cleveland; Vice Chairman | ||
| of University Hospitals of Cleveland; President of | R. Gregory Barton | Chris D. McIsaac |
| the Board of The Cleveland Museum of Art. | Mortimer J. Buckley | Michael S. Miller |
| Kathleen C. Gubanich | James M. Norris | |
| Peter F. Volanakis | Paul A. Heller | Glenn W. Reed |
| Born 1955. Trustee Since July 2009. Principal | Martha G. King | George U. Sauter |
| Occupation(s) During the Past Five Years: President | ||
| and Chief Operating Officer (retired 2010) of Corning | ||
| Incorporated (communications equipment); Director of | Chairman Emeritus and Senior Advisor | |
| Corning Incorporated (2000–2010) and Dow Corning | ||
| (2001–2010); Overseer of the Amos Tuck School of | John J. Brennan | |
| Business Administration at Dartmouth College. | Chairman, 1996–2009 | |
| Chief Executive Officer and President, 1996–2008 | ||
| Executive Officers | ||
| Founder | ||
| Glenn Booraem | ||
| Born 1967. Controller Since July 2010. Principal | John C. Bogle | |
| Occupation(s) During the Past Five Years: Principal | Chairman and Chief Executive Officer, 1974–1996 | |
| of The Vanguard Group, Inc.; Controller of each of | ||
| the investment companies served by The Vanguard | ||
| Group since 2010; Assistant Controller of each of | ||
| the investment companies served by The Vanguard | ||
| Group (2001–2010). | ||
1 Mr. McNabb is considered an “interested person,” as defined in the Investment Company Act of 1940, because he is an officer of the Vanguard funds.
2 December 2002 for Vanguard Equity Income Fund, Vanguard Growth Equity Fund, the Vanguard Municipal Bond Funds, and the Vanguard State Tax-Exempt Funds.
 | |
| P.O. Box 2600 | |
| Valley Forge, PA 19482-2600 |
Connect with Vanguard® > vanguard.com
| Fund Information > 800-662-7447 | |
| Direct Investor Account Services > 800-662-2739 | |
| Institutional Investor Services > 800-523-1036 | |
| Text Telephone for People | |
| With Hearing Impairment > 800-749-7273 | |
| This material may be used in conjunction | |
| with the offering of shares of any Vanguard | |
| fund only if preceded or accompanied by | |
| the fund’s current prospectus. | |
| All comparative mutual fund data are from Lipper Inc. or | |
| Morningstar, Inc., unless otherwise noted. | |
| You can obtain a free copy of Vanguard’s proxy voting | |
| guidelines by visiting vanguard.com/proxyreporting or by | |
| calling Vanguard at 800-662-2739. The guidelines are | |
| also available from the SEC’s website, sec.gov. In | |
| addition, you may obtain a free report on how your fund | |
| voted the proxies for securities it owned during the 12 | |
| months ended June 30. To get the report, visit either | |
| vanguard.com/proxyreporting or sec.gov. | |
| You can review and copy information about your fund at | |
| the SEC’s Public Reference Room in Washington, D.C. To | |
| find out more about this public service, call the SEC at | |
| 202-551-8090. Information about your fund is also | |
| available on the SEC’s website, and you can receive | |
| copies of this information, for a fee, by sending a | |
| request in either of two ways: via e-mail addressed to | |
| publicinfo@sec.gov or via regular mail addressed to the | |
| Public Reference Section, Securities and Exchange | |
| Commission, Washington, DC 20549-1520. | |
| © 2011 The Vanguard Group, Inc. | |
| All rights reserved. | |
| Vanguard Marketing Corporation, Distributor. | |
| Q5440 112011 | |
| Annual Report | September 30, 2011 |
| Vanguard PRIMECAP Core Fund |
> Vanguard PRIMECAP Core Fund returned –0.10% in the 2011 fiscal year, trailing the return of its benchmark index but exceeding the average return of peer funds.
> The fund had disappointing results from its industrial and energy stocks, but benefited from having only limited exposure to the troubled financial sector.
> As for the fund’s two largest sectors, health care produced notable gains, but technology results were lackluster.
| Contents | |
| Your Fund’s Total Returns. | 1 |
| Chairman’s Letter. | 2 |
| Advisor’s Report. | 7 |
| Fund Profile. | 10 |
| Performance Summary. | 11 |
| Financial Statements. | 13 |
| Your Fund’s After-Tax Returns. | 23 |
| About Your Fund’s Expenses. | 24 |
| Glossary. | 26 |
Please note: The opinions expressed in this report are just that—informed opinions. They should not be considered promises or advice. Also, please keep in mind that the information and opinions cover the period through the date on the front of this report. Of course, the risks of investing in your fund are spelled out in the prospectus.
See the Glossary for definitions of investment terms used in this report.
About the cover: Vanguard was named for the HMS Vanguard, flagship of British Admiral Horatio Nelson. A ship—whose performance and safety depend on the work of all hands—has served as a fitting metaphor for the Vanguard crew as we strive to help clients reach their financial goals.
Your Fund’s Total Returns
| Fiscal Year Ended September 30, 2011 | |
| Total | |
| Returns | |
| Vanguard PRIMECAP Core Fund | -0.10% |
| MSCI US Prime Market 750 Index | 1.09 |
| Multi-Cap Core Funds Average | -2.39 |
| Multi-Cap Core Funds Average: Derived from data provided by Lipper Inc. | |
| Your Fund’s Performance at a Glance | ||||
| September 30, 2010 , Through September 30, 2011 | ||||
| Distributions Per Share | ||||
| Starting | Ending | Income | Capital | |
| Share Price | Share Price | Dividends | Gains | |
| Vanguard PRIMECAP Core Fund | $12.51 | $12.37 | $0.142 | $0.000 |
1

Chairman’s Letter
Dear Shareholder,
Vanguard PRIMECAP Core Fund, like the broad U.S. stock market, had solid results in the first half of the fiscal year, but then retreated in the second half amid intensifying concerns about the economic outlook, both domestically and internationally.
For the 12 months ended September 30, 2011, the fund returned –0.10%. Although the return trailed that of the benchmark MSCI US Prime Market 750 Index, which notched a gain of a little more than 1%, it exceeded the –2.39% average return of multi-capitalization core funds.
The distinctive investment strategy of the fund’s advisor, PRIMECAP Management Company, can cause the fund’s results to be out of step with those of its benchmark or peers. The managers are willing to concentrate assets where they believe opportunity exists. Perhaps the most notable examples of this approach are their outsized investments in information technology and health care. This emphasis has been rewarding since the fund’s inception in late 2004, but it can lead to significant year-to-year variations in performance.
Indeed, we saw marked variation within the 2011 fiscal year. Through the first six months, the fund’s technology stocks turned in impressive gains amid optimism that business investment was set to pick up. As economic indicators turned negative in the second half, tech stocks reversed course. By contrast, health care was one
2
of the weakest sectors early on, but it gained ground in the second half of the fiscal year, benefiting from the perception that health care is insulated from changes in demand tied to the economy.
Although there are inevitably ups and downs for both sectors, your fund’s advisor remains consistent in its view that investments in health care and information technology offer the potential for achieving higher returns than the overall market will produce.
If you hold fund shares in a taxable account, you may wish to review the table of after-tax returns, based on the highest federal income tax bracket, that appears later in this report.
A swift change in sentiment weighed on stock prices
Global stock markets rallied through the first half of the fiscal year as corporate earnings surged and the economic recovery seemed to be gathering steam. In the second half, as I noted earlier, stock prices tumbled as economic indicators took a turn for the worse and U.S. and European policymaking strife dominated the headlines. (Standard & Poor’s, the ratings agency, downgraded the U.S. credit rating, in large part because of the political gridlock on display during the debt-ceiling debate. Vanguard’s confidence in the “full faith and credit” of the U.S. Treasury remains unshaken.)
| Market Barometer | |||
| Average Annual Total Returns | |||
| Periods Ended September 30, 2011 | |||
| One | Three | Five | |
| Year | Years | Years | |
| Stocks | |||
| Russell 1000 Index (Large-caps) | 0.91% | 1.61% | -0.91% |
| Russell 2000 Index (Small-caps) | -3.53 | -0.37 | -1.02 |
| Dow Jones U.S. Total Stock Market Index | 0.31 | 1.75 | -0.57 |
| MSCI All Country World Index ex USA (International) | -10.81 | 0.52 | -1.57 |
| Bonds | |||
| Barclays Capital U.S. Aggregate Bond Index (Broad | |||
| taxable market) | 5.26% | 7.97% | 6.53% |
| Barclays Capital Municipal Bond Index (Broad | |||
| tax-exempt market) | 3.88 | 8.08 | 5.01 |
| Citigroup Three-Month U.S. Treasury Bill Index | 0.11 | 0.19 | 1.61 |
| CPI | |||
| Consumer Price Index | 3.87% | 1.22% | 2.26% |
3
The U.S. stock market’s second-half weakness offset its first-half strength. The broad market returned 0.31% for the full 12 months. International stocks, which gained less at the start of the year and lost more at the end, returned –10.81% in U.S. dollars.
Bond prices rallied as optimism faded
The stock market’s pattern of strength and weakness was inverted in the bond market. Early in the year, bond prices retreated, consistent with investor optimism about economic growth. Later in the year, as optimism gave way to anxiety, bond prices surged, driving yields to remarkable lows. At the end of September, the yield of the 10-year U.S. Treasury note, a benchmark for longer-term interest rates, stood at 1.93%. Bond indexes recorded impressive returns, though it’s worth noting that shrinking yields imply lower returns on prospective investments.
The yields of money market instruments hovered near zero, as they have since December 2008, when the Federal Reserve cut its target for short-term interest rates to between 0% and 0.25%. Toward the end of the period, the Fed indicated that it expected to maintain this exceptionally low target at least through mid-2013.
Key themes in the fund produced mixed results
The key investment themes that have framed the advisor’s strategy in recent years remain constant: a strong belief
| Expense Ratios | ||
| Your Fund Compared With Its Peer Group | ||
| Peer Group | ||
| Fund | Average | |
| PRIMECAP Core Fund | 0.51% | 1.18% |
The fund expense ratio shown is from the prospectus dated January 28, 2011, and represents estimated costs for the current fiscal year. For the fiscal year ended September 30, 2011, the fund’s expense ratio was 0.51%. The peer-group expense ratio is derived from data provided by Lipper Inc. and captures information through year-end 2010.
Peer group: Multi-Cap Core Funds.
4
in the exceptional long-term growth prospects for technology stocks, a similar belief regarding health care stocks, and a wariness about the financial sector. In the 2011 fiscal year, it was the advisor’s emphasis on health care and skeptical attitude toward the financial sector that had the most positive impact on performance.
Some of the PRIMECAP Core Fund’s long-term health care holdings recorded substantial gains. And the sector, in general, benefited from investors’ anxiousness about the economy. Health care is traditionally seen as a defensive investment that’s not as sensitive to a slowdown as other industries.
Also positive for the fund was the advisor’s longstanding wariness of the financial sector, which was the benchmark index’s worst-performing sector for the year. Many financial services firms continue to face deep problems, from the lingering effects of mortgage defaults and home foreclosures to concerns about the fallout from the European debt crisis. The financial stocks that the fund did own performed well overall. These holdings were concentrated in insurance firms, outside of the struggling banking industry.
The fund’s technology stocks, which accounted for about a quarter of its assets on average, posted a modest gain as a group. But that return trailed the performance of the technology
| Total Returns | |
| Inception Through September 30, 2011 | |
| Average | |
| Annual Return | |
| PRIMECAP Core Fund (Returns since inception: 12/9/2004) | 4.40% |
| MSCI US Prime Market 750 Index | 1.86 |
| Multi-Cap Core Funds Average | 0.97 |
| Multi-Cap Core Funds Average: Derived from data provided by Lipper Inc. |
The figures shown represent past performance, which is not a guarantee of future results. (Current performance may be lower or higher than the performance data cited. For performance data current to the most recent month-end, visit our website at vanguard.com/performance.) Note, too, that both investment returns and principal value can fluctuate widely, so an investor’s shares, when sold, could be worth more or less than their original cost.
5
sector in the benchmark index. Some of the fund’s largest tech holdings were perceived as suffering, at least in the near term, from changing consumer tastes in smartphones and tablet computers.
The industrial sector was the biggest detractor from the fund’s results, with airlines and other transportation-related holdings hit hard by concerns that a sagging economy would hurt their businesses.
For more on the advisor’s strategy and outlook, please see the Advisor’s Report following this letter.
Since its inception, the fund has achieved a superior record
Although your fund doesn’t yet have a ten-year track record, its average annual return since inception in late 2004 has been significantly better than both its benchmark’s results and the average return for its peer funds. Because of the advisor’s long-term approach, evaluating performance since inception can be more insightful than focusing on returns for any one year.
The nearly seven-year period since the fund launched has been marked by turmoil, including the financial crisis of 2008 and, most recently, this year’s policymaking and debt dramas. Still, the advisor’s bottom-up research and its disciplined approach to investing helped to deliver gains for long-term shareholders. The fund’s shareholders also have benefited from relatively low investment expenses. Keeping costs low, of course, helps you to receive more of your fund’s returns.
A fund built on shared faith in long-term investing
Philosophically, Vanguard and PRIMECAP Management Company share a commitment to long-term investing.
As individuals, it’s not always easy for us to keep a long-term perspective in the face of day-to-day events that seem dramatic. As the fiscal year drew to a close, some of the anxiety of 2008 returned to the markets, with dire headlines about debt troubles in Europe and stubbornly high unemployment in the United States.
Feeling strong emotions—anxiety, confusion, and frustration—in the face of these events is natural. Still, our experience with other tough situations tells us that the best course for most investors is to stick with a sensible, long-term asset allocation that’s in keeping with their personal goals and their tolerance for risk.
Vanguard PRIMECAP Core Fund can play an important role in such a portfolio. The advisor’s patient and disciplined approach can help you stay the course and reach your investment goals.
Thank you for entrusting your assets to Vanguard.
Sincerely,

F. William McNabb III
Chairman and Chief Executive Officer
October 12, 2011
Advisor’s Report
For the fiscal year ended September 30, 2011, Vanguard PRIMECAP Core Fund returned –0.10%, trailing the 1.09% return of the unmanaged MSCI US Prime Market 750 Index but surpassing the –2.39% average return of competing multi-cap core funds.
The investment environment
Led by energy, materials, and industrial stocks, the MSCI US Prime Market 750 Index gained almost 17% in the first half of the fiscal year. By mid-year, however, confidence in the U.S. economic recovery began to falter, and concern regarding the European sovereign-debt crisis and its potential ramifications for the global financial system weighed on financial markets. In response, stock prices fell precipitously in the last fiscal quarter, reversing nearly all of the earlier gains.
The U.S. economy’s recovery from the recession has unquestionably slowed, as evidenced by moderating growth in gross domestic product and consumer spending. Unemployment remains stubbornly high, and the housing market has failed to show any meaningful improvement. Despite these unsettling developments, industrial production continues to grow, and corporations are generating profit margins and returns on capital well above historical averages.
Management of the fund
Despite the subpar results for this past fiscal year, our investment approach remains consistent. We rely on fundamental research to identify companies whose revenues and earnings will, in our opinion, grow more rapidly over a three-to-five-year time frame than current valuations might suggest. We seek to capitalize on situations in which the fundamental value of a company significantly exceeds its current market value.
This investment strategy has led us to build and maintain significant investments in information technology and health care companies that we believe offer the potential for higher returns than the overall market. These two sectors account for more than half of the fund’s holdings (versus about 32% for the MSCI US Prime Market 750 Index). Eleven of the fund’s 15 largest holdings are health care or information technology stocks.
Technology
Several of our holdings in the information technology sector hurt the fund’s relative results. Research In Motion (–58.3%) and Corning (–31.7%) were among the biggest decliners. Research In Motion, a new holding in the fund, suffered from concerns about its loss of market share in U.S. smartphones and delays in the development of its next-generation QNX operating system. Notwithstanding the company’s struggles in the United States, we believe there is significant value in the stock at current levels, given the recurring nature of the company’s services revenue and its strong position in rapidly growing markets in Latin America and Asia. Corning, the leading manufacturer of display glass used in flat-screen televisions, lowered its sales forecast as its largest customers reduced production in anticipation of weaker consumer demand during the upcoming holiday season.
7
We remain enthusiastic about investment opportunities in the information technology sector. The explosive growth in smartphones and tablet computers, the emergence of “the cloud” as the new data center, and the popularity of social networks are spawning entirely new business opportunities and driving higher demand for semiconductors, computer hardware, and storage. Additionally, as wireless networks evolve to support higher data transmission capacity and faster speeds, the use of mobile platforms for search, advertising, and commerce is increasing. Some of the largest holdings in the portfolio, such as Google, Texas Instruments, Oracle, and Microsoft, are well-positioned to capitalize on these trends. These companies are also trading at attractive valuations and have strong balance sheets.
Health care
The fund’s holdings in health care boosted overall performance, with Biogen Idec (+66.0%) and Roche Holding AG (+23.7%) among the biggest gainers. Biogen Idec reported favorable results from studies of its new oral drug to treat multiple sclerosis, while Roche received regulatory approval for new drugs to treat melanoma and lung cancer.
We built considerable positions in large pharmaceutical, biotechnology, and medical device companies based on the view that growth in revenues and earnings derived from new products, an aging global population, and growing demand in emerging markets would more than offset any loss in earnings from patent expirations. Following a period of considerable political and regulatory challenges, we are encouraged by the uptick in new drug approvals by the U.S. Food and Drug Administration in the past year. We continue to believe that the pharmaceutical, biotechnology, and medical device products currently in development represent real advances in the treatment of diseases such as Alzheimer’s, diabetes, and cancer. The aging of populations in the United States, Europe, and Japan, along with rising standards of living in developing markets such as China and India, should lead to greater demand for health care products.
Financials
In performance relative to the benchmark, the fund benefited from having minimal exposure to the financial sector. This was the worst-performing sector in the MSCI US Prime Market 750 Index by a considerable margin. In general, we continue to view the outlook for financial stocks as negative. Prior to the recent financial crisis, banks had enjoyed 15 years of above-average profitability. In our opinion, the combination of increased regulatory and compliance costs, higher capital requirements, and a reassessment of credit risk will constrain banks’ earnings going forward.
Outlook
As we enter fiscal year 2012, U.S. equities look attractive in our judgment, particularly in light of the significant decline in stock prices in the last fiscal quarter. In the sectors that have the largest portfolio weightings, especially information
8
technology and health care, we find the valuations compelling. Moreover, many of the fund’s holdings in these sectors have very strong balance sheets and generate significant free cash flow.
Over the last decade, the greatest returns among U.S. stocks were concentrated in the energy and materials sectors. Driven by rapidly growing demand from China, India, Brazil, and other emerging economies, prices for commodities such as oil, copper, and corn have soared, generating large profits and high valuations for companies in these industries. In our opinion, and contrary to conventional wisdom, this trend is unsustainable. Conversely, the information technology and health care sectors have endured a decade of shrinking valuation measures, such as price-to-earnings ratios, as investors questioned the long-term growth prospects and earnings potential of companies in these sectors. As noted, we believe the fundamental outlook for many companies in both sectors is promising. We also think our investment case is supported by compelling valuations and very strong balance sheets.
Over the history of the PRIMECAP Core Fund, we have tended to find the greatest opportunities in downtrodden stocks and sectors where others often have perceived the greatest risks. Similarly, we frequently consider the risks to be greatest in stocks and sectors that are viewed most favorably by the consensus. We believe this approach has been a key driver of the fund’s long-term results.
PRIMECAP Management Company
October 12, 2011
9
PRIMECAP Core Fund
Fund Profile
As of September 30, 2011
| Portfolio Characteristics | |||
| MSCI US | DJ | ||
| Prime | U.S. Total | ||
| Market | Market | ||
| Fund | 750 Index | Index | |
| Number of Stocks | 135 | 748 | 3,717 |
| Median Market Cap | $30.9B | $36.7B | $28.7B |
| Price/Earnings Ratio | 14.2x | 13.1x | 13.6x |
| Price/Book Ratio | 2.3x | 1.9x | 1.9x |
| Return on Equity | 21.9% | 19.8% | 19.1% |
| Earnings Growth Rate | 8.2% | 7.4% | 7.3% |
| Dividend Yield | 2.0% | 2.3% | 2.2% |
| Foreign Holdings | 15.4% | 0.0% | 0.0% |
| Turnover Rate | 9% | — | — |
| Ticker Symbol | VPCCX | — | — |
| Expense Ratio1 | 0.51% | — | — |
| 30-Day SEC Yield | 1.36% | — | — |
| Short-Term Reserves | 3.1% | — | — |
| Sector Diversification (% of equity exposure) | |||
| MSCI US | DJ | ||
| Prime | U.S. Total | ||
| Market | Market | ||
| Fund 750 Index | Index | ||
| Consumer | |||
| Discretionary | 12.5% | 11.3% | 12.2% |
| Consumer Staples | 2.3 | 11.2 | 11.0 |
| Energy | 6.4 | 11.5 | 10.3 |
| Financials | 5.8 | 13.5 | 14.3 |
| Health Care | 25.3 | 12.2 | 11.7 |
| Industrials | 15.4 | 10.1 | 10.6 |
| Information | |||
| Technology | 25.7 | 19.4 | 19.4 |
| Materials | 5.2 | 3.6 | 4.0 |
| Telecommunication | |||
| Services | 0.2 | 3.2 | 2.8 |
| Utilities | 1.2 | 4.0 | 3.7 |
| Volatility Measures | ||
| DJ | ||
| MSCI US | U.S. Total | |
| Prime Market | Market | |
| 750 Index | Index | |
| R-Squared | 0.96 | 0.97 |
| Beta | 0.98 | 0.96 |
These measures show the degree and timing of the fund’s fluctuations compared with the indexes over 36 months.
| Ten Largest Holdings (% of total net assets) | ||
| Amgen Inc. | Biotechnology | 4.6% |
| Roche Holding AG | Pharmaceuticals | 3.5 |
| Novartis AG ADR | Pharmaceuticals | 3.0 |
| Eli Lilly & Co. | Pharmaceuticals | 2.9 |
| Marsh & McLennan Cos. | ||
| Inc. | Insurance Brokers | 2.8 |
| Amazon.com Inc. | Internet Retail | 2.4 |
| Medtronic Inc. | Health Care | |
| Equipment | 2.2 | |
| Google Inc. Class A | Internet Software & | |
| Services | 2.2 | |
| Boeing Co. | Aerospace & | |
| Defense | 2.1 | |
| Johnson & Johnson | Pharmaceuticals | 2.1 |
| Top Ten | 27.8% | |
The holdings listed exclude any temporary cash investments and equity index products.
Investment Focus
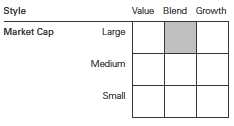
1 The expense ratio shown is from the prospectus dated January 28, 2011, and represents estimated costs for the current fiscal year. For the fiscal year ended September 30, 2011, the expense ratio was 0.51%.
10
PRIMECAP Core Fund
Performance Summary
All of the returns in this report represent past performance, which is not a guarantee of future results that may be achieved by the fund. (Current performance may be lower or higher than the performance data cited. For performance data current to the most recent month-end, visit our website at vanguard.com/performance.) Note, too, that both investment returns and principal value can fluctuate widely, so an investor’s shares, when sold, could be worth more or less than their original cost. The returns shown do not reflect taxes that a shareholder would pay on fund distributions or on the sale of fund shares.
Cumulative Performance: December 9, 2004, Through September 30, 2011
Initial Investment of $10,000
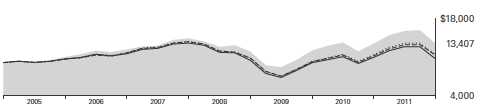
| Average Annual Total Returns | ||||
| Periods Ended September 30, 2011 | ||||
| Since | Final Value | |||
| One | Five | Inception | of a $10,000 | |
| Year | Years | (12/9/2004) | Investment | |
| PRIMECAP Core Fund | -0.10% | 1.63% | 4.40% | $13,407 |
| Dow Jones U.S. Total Stock Market | ||||
| Index | 0.31 | -0.57 | 1.99 | 11,433 |
| MSCI US Prime Market 750 Index | 1.09 | -0.73 | 1.86 | 11,334 |
| Multi-Cap Core Funds Average | -2.39 | -1.62 | 0.97 | 10,681 |
| Multi-Cap Core Funds Average: Derived from data provided by Lipper Inc. | ||||
| "Since Inception" performance is calculated from the inception date for both the fund and its comparative standards. | ||||
Vanguard fund returns do not reflect the 1% fee on redemptions of shares held for less than one year. See Financial Highlights for dividend and capital gains information.
11
PRIMECAP Core Fund
Fiscal-Year Total Returns (%): December 9, 2004, Through September 30, 2011
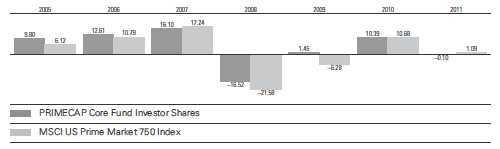
Vanguard fund returns do not reflect the 1% fee on redemptions of shares held for less than one year.
12
PRIMECAP Core Fund
Financial Statements
Statement of Net Assets
As of September 30, 2011
The fund reports a complete list of its holdings in regulatory filings four times in each fiscal year, at the quarter-ends. For the second and fourth fiscal quarters, the lists appear in the fund’s semiannual and annual reports to shareholders. For the first and third fiscal quarters, the fund files the lists with the Securities and Exchange Commission on Form N-Q. Shareholders can look up the fund’s Forms N-Q on the SEC’s website at sec.gov. Forms N-Q may also be reviewed and copied at the SEC’s Public Reference Room (see the back cover of this report for further information).
| Market | |||
| Value | |||
| Shares | ($000) | ||
| Common Stocks (97.3%) | |||
| Consumer Discretionary (12.1%) | |||
| * | Amazon.com Inc. | 478,800 | 103,531 |
| * | Bed Bath & Beyond Inc. | 1,257,791 | 72,084 |
| * | DIRECTV Class A | 1,095,788 | 46,297 |
| Whirlpool Corp. | 919,300 | 45,882 | |
| * | CarMax Inc. | 1,917,600 | 45,735 |
| TJX Cos. Inc. | 766,100 | 42,495 | |
| Walt Disney Co. | 1,286,100 | 38,789 | |
| Limited Brands Inc. | 807,762 | 31,107 | |
| Carnival Corp. | 920,000 | 27,876 | |
| Mattel Inc. | 1,000,000 | 25,890 | |
| Sony Corp. ADR | 1,228,200 | 23,336 | |
| Kohl’s Corp. | 300,000 | 14,730 | |
| Lowe’s Cos. Inc. | 300,000 | 5,802 | |
| Nordstrom Inc. | 60,000 | 2,741 | |
| Hasbro Inc. | 14,100 | 460 | |
| 526,755 | |||
| Consumer Staples (2.3%) | |||
| Kellogg Co. | 818,000 | 43,510 | |
| Procter & Gamble Co. | 300,000 | 18,954 | |
| PepsiCo Inc. | 284,400 | 17,604 | |
| Costco Wholesale Corp. | 100,000 | 8,212 | |
| CVS Caremark Corp. | 218,000 | 7,321 | |
| Kraft Foods Inc. | 80,000 | 2,686 | |
| 98,287 | |||
| Energy (6.2%) | |||
| Schlumberger Ltd. | 772,300 | 46,129 | |
| National Oilwell Varco Inc. | 883,000 | 45,227 | |
| Cabot Oil & Gas Corp. | 628,200 | 38,892 | |
| EOG Resources Inc. | 502,000 | 35,647 | |
| Cenovus Energy Inc. | 503,624 | 15,466 | |
| * | McDermott | ||
| International Inc. | 1,380,800 | 14,857 | |
| ^ | Cameco Corp. | 780,000 | 14,290 |
| Noble Energy Inc. | 200,000 | 14,160 | |
| Petroleo Brasileiro SA ADR | |||
| Type A | 555,600 | 11,512 | |
| Market | |||
| Value | |||
| Shares | ($000) | ||
| * | Southwestern Energy Co. | 342,000 | 11,399 |
| Encana Corp. | 499,100 | 9,588 | |
| Hess Corp. | 160,000 | 8,394 | |
| Transocean Ltd. | 67,000 | 3,198 | |
| * | Cameron International Corp. | 23,500 | 976 |
| Petroleo Brasileiro SA ADR | 39,600 | 889 | |
| Noble Corp. | 20,000 | 587 | |
| * | Exterran Holdings Inc. | 30,000 | 292 |
| 271,503 | |||
| Financials (5.7%) | |||
| Marsh & | |||
| McLennan Cos. Inc. | 4,638,000 | 123,093 | |
| * | Berkshire Hathaway Inc. | ||
| Class B | 570,000 | 40,493 | |
| Chubb Corp. | 600,000 | 35,994 | |
| Charles Schwab Corp. | 2,194,000 | 24,726 | |
| Wells Fargo & Co. | 450,000 | 10,854 | |
| Progressive Corp. | 600,000 | 10,656 | |
| 245,816 | |||
| Health Care (24.6%) | |||
| Amgen Inc. | 3,640,700 | 200,056 | |
| Roche Holding AG | 932,100 | 150,545 | |
| Novartis AG ADR | 2,356,000 | 131,394 | |
| Eli Lilly & Co. | 3,453,900 | 127,691 | |
| Medtronic Inc. | 2,908,400 | 96,675 | |
| Johnson & Johnson | 1,416,400 | 90,239 | |
| * | Biogen Idec Inc. | 930,000 | 86,630 |
| * | Waters Corp. | 795,094 | 60,022 |
| GlaxoSmithKline plc ADR | 1,331,700 | 54,986 | |
| * | Boston Scientific Corp. | 4,849,400 | 28,660 |
| Sanofi ADR | 539,300 | 17,689 | |
| Abbott Laboratories | 260,000 | 13,296 | |
| * | Illumina Inc. | 163,900 | 6,707 |
| * | Agilent Technologies Inc. | 70,000 | 2,188 |
| * | Cerner Corp. | 24,000 | 1,644 |
| * | Dendreon Corp. | 112,000 | 1,008 |
| 1,069,430 | |||
PRIMECAP Core Fund
| Market | |||
| Value | |||
| Shares | ($000) | ||
| Industrials (15.0%) | |||
| Boeing Co. | 1,506,600 | 91,164 | |
| United Parcel Service Inc. | |||
| Class B | 1,189,950 | 75,145 | |
| Southwest Airlines Co. | 8,734,125 | 70,222 | |
| Honeywell | |||
| International Inc. | 1,530,000 | 67,182 | |
| FedEx Corp. | 709,200 | 47,999 | |
| Expeditors International of | |||
| Washington Inc. | 1,049,200 | 42,545 | |
| Union Pacific Corp. | 326,150 | 26,637 | |
| Norfolk Southern Corp. | 419,600 | 25,604 | |
| Rockwell Automation Inc. | 454,000 | 25,424 | |
| * | Babcock & Wilcox Co. | 1,300,000 | 25,415 |
| CH Robinson | |||
| Worldwide Inc. | 365,000 | 24,992 | |
| European Aeronautic | |||
| Defence and Space Co. | |||
| NV | 765,050 | 21,505 | |
| ^ | Ritchie Bros | ||
| Auctioneers Inc. | 1,035,000 | 20,897 | |
| ^ | Canadian Pacific | ||
| Railway Ltd. | 304,430 | 14,640 | |
| Caterpillar Inc. | 196,050 | 14,476 | |
| SPX Corp. | 290,000 | 13,140 | |
| *,^ | AMR Corp. | 3,237,740 | 9,584 |
| * | AECOM Technology Corp. | 495,000 | 8,747 |
| Cummins Inc. | 105,700 | 8,631 | |
| Republic Services Inc. | |||
| Class A | 269,435 | 7,560 | |
| Deere & Co. | 99,000 | 6,392 | |
| * | Jacobs Engineering | ||
| Group Inc. | 50,000 | 1,615 | |
| Chicago Bridge & | |||
| Iron Co. NV | 44,500 | 1,274 | |
| 650,790 | |||
| Information Technology (25.0%) | |||
| * | Google Inc. Class A | 182,145 | 93,692 |
| Oracle Corp. | 2,984,900 | 85,786 | |
| * | Intuit Inc. | 1,793,000 | 85,060 |
| Texas Instruments Inc. | 3,184,900 | 84,878 | |
| * | Electronic Arts Inc. | 3,495,800 | 71,489 |
| * | EMC Corp. | 2,935,100 | 61,608 |
| Microsoft Corp. | 2,410,500 | 59,997 | |
| * | SanDisk Corp. | 1,395,066 | 56,291 |
| Altera Corp. | 1,599,100 | 50,420 | |
| Qualcomm Inc. | 1,004,100 | 48,829 | |
| * | Flextronics | ||
| International Ltd. | 8,125,000 | 45,744 | |
| ASML Holding NV | 1,211,900 | 41,859 | |
| Telefonaktiebolaget LM | |||
| Ericsson ADR | 4,254,800 | 40,633 | |
| * | Symantec Corp. | 2,263,500 | 36,895 |
| * | Research In Motion Ltd. | 1,527,100 | 31,000 |
| Market | |||
| Value | |||
| Shares | ($000) | ||
| Intel Corp. | 1,285,600 | 27,422 | |
| Applied Materials Inc. | 2,258,000 | 23,370 | |
| Corning Inc. | 1,756,300 | 21,708 | |
| Visa Inc. Class A | 237,985 | 20,400 | |
| KLA-Tencor Corp. | 469,600 | 17,976 | |
| Accenture plc Class A | 309,200 | 16,289 | |
| * | Adobe Systems Inc. | 470,000 | 11,360 |
| Motorola Solutions Inc. | 252,000 | 10,559 | |
| * | Motorola Mobility | ||
| Holdings Inc. | 220,500 | 8,330 | |
| * | NVIDIA Corp. | 560,000 | 7,000 |
| Activision Blizzard Inc. | 575,000 | 6,842 | |
| * | Apple Inc. | 17,000 | 6,480 |
| Cisco Systems Inc. | 300,000 | 4,647 | |
| Hewlett-Packard Co. | 197,000 | 4,423 | |
| * | Yahoo! Inc. | 150,000 | 1,974 |
| Mastercard Inc. Class A | 5,150 | 1,633 | |
| Xilinx Inc. | 37,300 | 1,024 | |
| Analog Devices Inc. | 30,000 | 938 | |
| 1,086,556 | |||
| Materials (5.1%) | |||
| Potash Corp. of | |||
| Saskatchewan Inc. | 1,574,300 | 68,041 | |
| Monsanto Co. | 893,150 | 53,625 | |
| Vulcan Materials Co. | 1,423,700 | 39,237 | |
| Praxair Inc. | 214,700 | 20,070 | |
| Freeport-McMoRan | |||
| Copper & Gold Inc. | 391,400 | 11,918 | |
| Domtar Corp. | 147,400 | 10,048 | |
| FMC Corp. | 71,254 | 4,928 | |
| Greif Inc. Class A | 91,000 | 3,903 | |
| International Paper Co. | 100,000 | 2,325 | |
| * | Crown Holdings Inc. | 75,000 | 2,296 |
| Kaiser Aluminum Corp. | 45,000 | 1,993 | |
| Greif Inc. Class B | 30,786 | 1,324 | |
| 219,708 | |||
| Telecommunication Services (0.2%) | |||
| * | Sprint Nextel Corp. | 2,854,950 | 8,679 |
| Utilities (1.1%) | |||
| Public Service Enterprise | |||
| Group Inc. | 623,400 | 20,803 | |
| Edison International | 263,800 | 10,090 | |
| * | AES Corp. | 726,800 | 7,094 |
| Exelon Corp. | 156,500 | 6,668 | |
| NextEra Energy Inc. | 56,700 | 3,063 | |
| FirstEnergy Corp. | 22,000 | 988 | |
| 48,706 | |||
| Total Common Stocks | |||
| (Cost $3,793,316) | 4,226,230 | ||
14
PRIMECAP Core Fund
| Market | ||
| Value | ||
| Shares | ($000) | |
| Temporary Cash Investment (3.9%) | ||
| Money Market Fund (3.9%) | ||
| 1,2 Vanguard Market | ||
| Liquidity Fund, 0.144% | ||
| (Cost $172,213) | 172,212,622 | 172,213 |
| Total Investments (101.2%) | ||
| (Cost $3,965,529) | 4,398,443 | |
| Other Assets and Liabilities (-1.2%) | ||
| Other Assets | 8,572 | |
| Liabilities2 | (62,345) | |
| (53,773) | ||
| Net Assets (100%) | ||
| Applicable to 351,115,854 outstanding | ||
| $.001 par value shares of beneficial | ||
| interest (unlimited authorization) | 4,344,670 | |
| Net Asset Value Per Share | $12.37 | |
| At September 30, 2011, net assets consisted of: | |
| Amount | |
| ($000) | |
| Paid-in Capital | 3,930,403 |
| Undistributed Net Investment Income | 34,992 |
| Accumulated Net Realized Losses | (53,844) |
| Unrealized Appreciation (Depreciation) | |
| Investment Securities | 432,914 |
| Foreign Currencies | 205 |
| Net Assets | 4,344,670 |
See Note A in Notes to Financial Statements.
* Non-income-producing security.
^ Part of security position is on loan to broker-dealers. The total value of securities on loan is $36,978,000.
1 Affiliated money market fund available only to Vanguard funds and certain trusts and accounts managed by Vanguard. Rate shown is the 7-day yield.
2 Includes $39,036,000 of collateral received for securities on loan.
ADR—American Depositary Receipt.
See accompanying Notes, which are an integral part of the Financial Statements.
15
PRIMECAP Core Fund
| Statement of Operations | |
| Year Ended | |
| September 30, 2011 | |
| ($000) | |
| Investment Income | |
| Income | |
| Dividends1 | 75,712 |
| Interest2 | 222 |
| Security Lending | 657 |
| Total Income | 76,591 |
| Expenses | |
| Investment Advisory Fees—Note B | 15,703 |
| The Vanguard Group—Note C | |
| Management and Administrative | 8,724 |
| Marketing and Distribution | 1,123 |
| Custodian Fees | 86 |
| Auditing Fees | 25 |
| Shareholders’ Reports | 58 |
| Trustees’ Fees and Expenses | 9 |
| Total Expenses | 25,728 |
| Net Investment Income | 50,863 |
| Realized Net Gain (Loss) | |
| Investment Securities Sold | 98,547 |
| Foreign Currencies | (1) |
| Realized Net Gain (Loss) | 98,546 |
| Change in Unrealized Appreciation (Depreciation) | |
| Investment Securities | (127,964) |
| Foreign Currencies | 120 |
| Change in Unrealized Appreciation (Depreciation) | (127,844) |
| Net Increase (Decrease) in Net Assets Resulting from Operations | 21,565 |
1 Dividends are net of foreign withholding taxes of $2,943,000.
2 Interest income from an affiliated company of the fund was $222,000.
See accompanying Notes, which are an integral part of the Financial Statements.
16
PRIMECAP Core Fund
| Statement of Changes in Net Assets | ||
| Year Ended September 30, | ||
| 2011 | 2010 | |
| ($000) | ($000) | |
| Increase (Decrease) in Net Assets | ||
| Operations | ||
| Net Investment Income | 50,863 | 49,576 |
| Realized Net Gain (Loss) | 98,546 | (57,091) |
| Change in Unrealized Appreciation (Depreciation) | (127,844) | 441,284 |
| Net Increase (Decrease) in Net Assets Resulting from Operations | 21,565 | 433,769 |
| Distributions | ||
| Net Investment Income | (51,418) | (35,722) |
| Realized Capital Gain | — | — |
| Total Distributions | (51,418) | (35,722) |
| Capital Share Transactions | ||
| Issued | 346,193 | 534,174 |
| Issued in Lieu of Cash Distributions | 46,358 | 32,212 |
| Redeemed1 | (587,212) | (640,251) |
| Net Increase (Decrease) from Capital Share Transactions | (194,661) | (73,865) |
| Total Increase (Decrease) | (224,514) | 324,182 |
| Net Assets | ||
| Beginning of Period | 4,569,184 | 4,245,002 |
| End of Period2 | 4,344,670 | 4,569,184 |
1 Net of redemption fees for fiscal 2011 and 2010 of $223,000 and $819,000, respectively.
2 Net Assets—End of Period includes undistributed net investment income of $34,992,000 and $35,548,000.
See accompanying Notes, which are an integral part of the Financial Statements.
17
PRIMECAP Core Fund
| Financial Highlights | |||||
| For a Share Outstanding | Year Ended September 30, | ||||
| Throughout Each Period | 2011 | 2010 | 2009 | 2008 | 2007 |
| Net Asset Value, Beginning of Period | $12.51 | $11.42 | $11.41 | $14.03 | $12.28 |
| Investment Operations | |||||
| Net Investment Income | .145 | .1331 | .097 | .1382 | .095 |
| Net Realized and Unrealized Gain (Loss) | |||||
| on Investments | (.143) | 1.051 | .030 | (2.417) | 1.861 |
| Total from Investment Operations | .002 | 1.184 | .127 | (2.279) | 1.956 |
| Distributions | |||||
| Dividends from Net Investment Income | (.142) | (.094) | (.117) | (.110) | (.095) |
| Distributions from Realized Capital Gains | — | — | — | (.231) | (.111) |
| Total Distributions | (.142) | (.094) | (.117) | (.341) | (.206) |
| Net Asset Value, End of Period | $12.37 | $12.51 | $11.42 | $11.41 | $14.03 |
| Total Return3 | -0.10% | 10.39% | 1.45% | -16.52% | 16.10% |
| Ratios/Supplemental Data | |||||
| Net Assets, End of Period (Millions) | $4,345 | $4,569 | $4,245 | $3,253 | $3,305 |
| Ratio of Total Expenses to | |||||
| Average Net Assets | 0.51% | 0.51% | 0.54% | 0.50% | 0.55% |
| Ratio of Net Investment Income to | |||||
| Average Net Assets | 1.01% | 1.09%1 | 1.10% | 1.12%2 | 0.73% |
| Portfolio Turnover Rate | 9% | 8% | 5% | 9% | 10% |
1 Net investment income per share and the ratio of net investment income to average net assets include $.019 and 0.15%, respectively, resulting from a special dividend from Weyerhaeuser Co. in July 2010.
2 Net investment income per share and the ratio of net investment income to average net assets include $.027 and 0.23%, respectively, resulting from a special dividend from ASML Holding NV in October 2007.
3 Total returns do not include transaction or account service fees that may have applied in the periods shown. Fund prospectuses provide information about any applicable transaction and account service fees.
See accompanying Notes, which are an integral part of the Financial Statements.
18
PRIMECAP Core Fund
Notes to Financial Statements
Vanguard PRIMECAP Core Fund is registered under the Investment Company Act of 1940 as an open-end investment company, or mutual fund.
A. The following significant accounting policies conform to generally accepted accounting principles for U.S. mutual funds. The fund consistently follows such policies in preparing its financial statements.
1. Security Valuation: Securities are valued as of the close of trading on the New York Stock Exchange (generally 4 p.m., Eastern time) on the valuation date. Equity securities are valued at the latest quoted sales prices or official closing prices taken from the primary market in which each security trades; such securities not traded on the valuation date are valued at the mean of the latest quoted bid and asked prices. Securities for which market quotations are not readily available, or whose values have been affected by events occurring before the fund’s pricing time but after the close of the securities’ primary markets, are valued at their fair values calculated according to procedures adopted by the board of trustees. These procedures include obtaining quotations from an independent pricing service, monitoring news to identify significant market- or security-specific events, and evaluating changes in the values of foreign market proxies (for example, ADRs, futures contracts, or exchange-traded funds), between the time the foreign markets close and the fund’s pricing time. When fair-value pricing is employed, the prices of securities used by a fund to calculate its net asset value may differ from quoted or published prices for the same securities. Investments in Vanguard Market Liquidity Fund are valued at that fund’s net asset value.
2. Foreign Currency: Securities and other assets and liabilities denominated in foreign currencies are translated into U.S. dollars using exchange rates obtained from an independent third party as of the fund’s pricing time on the valuation date. Realized gains (losses) and unrealized appreciation (depreciation) on investment securities include the effects of changes in exchange rates since the securities were purchased, combined with the effects of changes in security prices. Fluctuations in the value of other assets and liabilities resulting from changes in exchange rates are recorded as unrealized foreign currency gains (losses) until the assets or liabilities are settled in cash, at which time they are recorded as realized foreign currency gains (losses).
3. Federal Income Taxes: The fund intends to continue to qualify as a regulated investment company and distribute all of its taxable income. Management has analyzed the fund’s tax positions taken for all open federal income tax years (September 30, 2008–2011), and has concluded that no provision for federal income tax is required in the fund’s financial statements.
4. Distributions: Distributions to shareholders are recorded on the ex-dividend date.
5. Security Lending: The fund may lend its securities to qualified institutional borrowers to earn additional income. Security loans are required to be secured at all times by collateral at least equal to the market value of securities loaned. The fund invests cash collateral received in Vanguard Market Liquidity Fund, and records a liability for the return of the collateral, during the period the securities are on loan. Security lending income represents fees charged to borrowers plus income earned on investing cash collateral, less expenses associated with the loan.
6. Other: Dividend income is recorded on the ex-dividend date. Interest income includes income distributions received from Vanguard Market Liquidity Fund and is accrued daily. Security transactions are accounted for on the date securities are bought or sold. Costs used to determine realized gains (losses) on the sale of investment securities are those of the specific securities sold. Fees assessed on redemptions of capital shares are credited to paid-in capital.
19
PRIMECAP Core Fund
B. PRIMECAP Management Company provides investment advisory services to the fund for a fee calculated at an annual percentage rate of average net assets. For the year ended September 30, 2011, the investment advisory fee represented an effective annual rate of 0.31% of the fund’s average net assets.
C. The Vanguard Group furnishes at cost corporate management, administrative, marketing, and distribution services. The costs of such services are allocated to the fund under methods approved by the board of trustees. The fund has committed to provide up to 0.40% of its net assets in capital contributions to Vanguard. At September 30, 2011, the fund had contributed capital of $783,000 to Vanguard (included in Other Assets), representing 0.02% of the fund’s net assets and 0.31% of Vanguard’s capitalization. The fund’s trustees and officers are also directors and officers of Vanguard.
D. Various inputs may be used to determine the value of the fund’s investments. These inputs are summarized in three broad levels for financial statement purposes. The inputs or methodologies used to value securities are not necessarily an indication of the risk associated with investing in those securities.
Level 1—Quoted prices in active markets for identical securities.
Level 2—Other significant observable inputs (including quoted prices for similar securities, interest rates, prepayment speeds, credit risk, etc.).
Level 3—Significant unobservable inputs (including the fund’s own assumptions used to determine the fair value of investments).
The following table summarizes the fund’s investments as of September 30, 2011, based on the inputs used to value them:
| Level 1 | Level 2 | Level 3 | |
| Investments | ($000) | ($000) | ($000) |
| Common Stocks | 4,054,180 | 172,050 | — |
| Temporary Cash Investments | 172,213 | — | — |
| Total | 4,226,393 | 172,050 | — |
E. Distributions are determined on a tax basis and may differ from net investment income and realized capital gains for financial reporting purposes. Differences may be permanent or temporary. Permanent differences are reclassified among capital accounts in the financial statements to reflect their tax character. Temporary differences arise when certain items of income, expense, gain, or loss are recognized in different periods for financial statement and tax purposes; these differences will reverse at some time in the future. Differences in classification may also result from the treatment of short-term gains as ordinary income for tax purposes.
During the year ended September 30, 2011, the fund realized net foreign currency losses of $1,000, which decreased distributable net income for tax purposes; accordingly, such losses have been reclassified from accumulated net realized losses to undistributed net investment income.
For tax purposes, at September 30, 2011, the fund had $41,155,000 of ordinary income available for distribution. The fund had available capital loss carryforwards totaling $53,326,000 to offset future net capital gains through September 30, 2018.
20
PRIMECAP Core Fund
At September 30, 2011, the cost of investment securities for tax purposes was $3,966,048,000. Net unrealized appreciation of investment securities for tax purposes was $432,395,000, consisting of unrealized gains of $831,402,000 on securities that had risen in value since their purchase and $399,007,000 in unrealized losses on securities that had fallen in value since their purchase.
F. During the year ended September 30, 2011, the fund purchased $444,684,000 of investment securities and sold $677,894,000 of investment securities, other than temporary cash investments.
G. Capital shares issued and redeemed were:
| Year Ended September 30, | ||
| 2011 | 2010 | |
| Shares | Shares | |
| (000) | (000) | |
| Issued | 24,985 | 44,581 |
| Issued in Lieu of Cash Distributions | 3,372 | 2,634 |
| Redeemed | (42,610) | (53,549) |
| Net Increase (Decrease) in Shares Outstanding | (14,253) | (6,334) |
H. In preparing the financial statements as of September 30, 2011, management considered the impact of subsequent events for potential recognition or disclosure in these financial statements.
21
Report of Independent Registered Public Accounting Firm
To the Trustees of Vanguard Fenway Funds and the Shareholders of the Vanguard PRIMECAP Core Fund:
In our opinion, the accompanying statement of net assets and the related statements of operations and of changes in net assets and the financial highlights present fairly, in all material respects, the financial position of the Vanguard PRIMECAP Core Fund (constituting a separate portfolio of Vanguard Fenway Funds, hereafter referred to as the “Fund”) at September 30, 2011, the results of its operations for the year then ended, the changes in its net assets for each of the two years in the period then ended and the financial highlights for each of the five years in the period then ended, in conformity with accounting principles generally accepted in the United States of America. These financial statements and financial highlights (hereafter referred to as “financial statements”) are the responsibility of the Fund’s management; our responsibility is to express an opinion on these financial statements based on our audits. We conducted our audits of these financial statements in accordance with the standards of the Public Company Accounting Oversight Board (United States). Those standards require that we plan and perform the audit to obtain reasonable assurance about whether the financial statements are free of material misstatement. An audit includes examining, on a test basis, evidence supporting the amounts and disclosures in the financial statements, assessing the accounting principles used and significant estimates made by management, and evaluating the overall financial statement presentation. We believe that our audits, which included confirmation of securities at September 30, 2011 by correspondence with the custodian and by agreement to the underlying ownership records of Vanguard Market Liquidity Fund, provide a reasonable basis for our opinion.
PricewaterhouseCoopers LLP
Philadelphia, Pennsylvania
November 11, 2011
| Special 2011 tax information (unaudited) for Vanguard PRIMECAP Core Fund |
This information for the fiscal year ended September 30, 2011, is included pursuant to provisions of the Internal Revenue Code.
The fund distributed $51,418,000 of qualified dividend income to shareholders during the fiscal year.
For corporate shareholders, 100% of investment income (dividend income plus short-term gains, if any) qualifies for the dividends-received deduction.
22
Your Fund’s After-Tax Returns
This table presents returns for your fund both before and after taxes. The after-tax returns are shown in two ways: (1) assuming that an investor owned the fund during the entire period and paid taxes on the fund’s distributions, and (2) assuming that an investor paid taxes on the fund’s distributions and sold all shares at the end of each period.
Calculations are based on the highest individual federal income tax and capital gains tax rates in effect at the times of the distributions and the hypothetical sales. State and local taxes were not considered. After-tax returns reflect any qualified dividend income, using actual prior-year figures and estimates for 2011. (In the example, returns after the sale of fund shares may be higher than those assuming no sale. This occurs when the sale would have produced a capital loss. The calculation assumes that the investor received a tax deduction for the loss.)
Please note that your actual after-tax returns will depend on your tax situation and may differ from those shown. Also note that if you own the fund in a tax-deferred account, such as an individual retirement account or a 401(k) plan, this information does not apply to you. Such accounts are not subject to current taxes.
Finally, keep in mind that a fund’s performance—whether before or after taxes—does not guarantee future results.
| Average Annual Total Returns: PRIMECAP Core Fund | |||
| Periods Ended September 30, 2011 | |||
| Since | |||
| One | Five | Inception | |
| Year | Years | (12/9/2004) | |
| Returns Before Taxes | -0.10% | 1.63% | 4.40% |
| Returns After Taxes on Distributions | -0.25 | 1.39 | 4.20 |
| Returns After Taxes on Distributions and Sale of Fund Shares | 0.17 | 1.36 | 3.78 |
Returns do not reflect the 1% fee on redemptions of shares held for less than one year.
23
About Your Fund’s Expenses
As a shareholder of the fund, you incur ongoing costs, which include costs for portfolio management, administrative services, and shareholder reports (like this one), among others. Operating expenses, which are deducted from a fund’s gross income, directly reduce the investment return of the fund.
A fund’s expenses are expressed as a percentage of its average net assets. This figure is known as the expense ratio. The following examples are intended to help you understand the ongoing costs (in dollars) of investing in your fund and to compare these costs with those of other mutual funds. The examples are based on an investment of $1,000 made at the beginning of the period shown and held for the entire period.
The accompanying table illustrates your fund’s costs in two ways:
• Based on actual fund return. This section helps you to estimate the actual expenses that you paid over the period. The ”Ending Account Value“ shown is derived from the fund‘s actual return, and the third column shows the dollar amount that would have been paid by an investor who started with $1,000 in the fund. You may use the information here, together with the amount you invested, to estimate the expenses that you paid over the period.
To do so, simply divide your account value by $1,000 (for example, an $8,600 account value divided by $1,000 = 8.6), then multiply the result by the number given for your fund under the heading ”Expenses Paid During Period.“
• Based on hypothetical 5% yearly return. This section is intended to help you compare your fund‘s costs with those of other mutual funds. It assumes that the fund had a yearly return of 5% before expenses, but that the expense ratio is unchanged. In this case—because the return used is not the fund’s actual return—the results do not apply to your investment. The example is useful in making comparisons because the Securities and Exchange Commission requires all mutual funds to calculate expenses based on a 5% return. You can assess your fund’s costs by comparing this hypothetical example with the hypothetical examples that appear in shareholder reports of other funds.
Note that the expenses shown in the table are meant to highlight and help you compare ongoing costs only and do not reflect transaction costs incurred by the fund for buying and selling securities. Further, the expenses do not include any purchase, redemption, or account service fees described in the fund prospectus. If such fees were applied to your account, your costs would be higher. Your fund does not carry a “sales load.”
The calculations assume no shares were bought or sold during the period. Your actual costs may have been higher or lower, depending on the amount of your investment and the timing of any purchases or redemptions.
You can find more information about the fund’s expenses, including annual expense ratios, in the Financial Statements section of this report. For additional information on operating expenses and other shareholder costs, please refer to your fund’s current prospectus.
24
| Six Months Ended September 30, 2011 | |||
| Beginning | Ending | Expenses | |
| Account Value | Account Value | Paid During | |
| PRIMECAP Core Fund | 3/31/2011 | 9/30/2011 | Period |
| Based on Actual Fund Return | $1,000.00 | $854.28 | $2.37 |
| Based on Hypothetical 5% Yearly Return | 1,000.00 | 1,022.51 | 2.59 |
The calculations are based on expenses incurred in the most recent six-month period. The fund’s annualized six-month expense ratio for that period is 0.51%. The dollar amounts shown as “Expenses Paid” are equal to the annualized expense ratio multiplied by the average account value over the period, multiplied by the number of days in the most recent six-month period, then divided by the number of days in the most recent 12-month period.
25
Glossary
30-Day SEC Yield. A fund’s 30-day SEC yield is derived using a formula specified by the U.S. Securities and Exchange Commission. Under the formula, data related to the fund’s security holdings in the previous 30 days are used to calculate the fund’s hypothetical net income for that period, which is then annualized and divided by the fund’s estimated average net assets over the calculation period. For the purposes of this calculation, a security’s income is based on its current market yield to maturity (for bonds; excluding inflation for inflation-protected securities), its actual income (for asset-backed securities), or its projected dividend yield (for stocks). Because the SEC yield represents hypothetical annualized income, it will differ—at times significantly—from the fund’s actual experience. As a result, the fund’s income distributions may be higher or lower than implied by the SEC yield.
Beta. A measure of the magnitude of a fund’s past share-price fluctuations in relation to the ups and downs of a given market index. The index is assigned a beta of 1.00. Compared with a given index, a fund with a beta of 1.20 typically would have seen its share price rise or fall by 12% when the index rose or fell by 10%. For this report, beta is based on returns over the past 36 months for both the fund and the index. Note that a fund’s beta should be reviewed in conjunction with its R-squared (see definition). The lower the R-squared, the less correlation there is between the fund and the index, and the less reliable beta is as an indicator of volatility.
Dividend Yield. Dividend income earned by stocks, expressed as a percentage of the aggregate market value (or of net asset value, for a fund). The yield is determined by dividing the amount of the annual dividends by the aggregate value (or net asset value) at the end of the period. For a fund, the dividend yield is based solely on stock holdings and does not include any income produced by other investments.
Earnings Growth Rate. The average annual rate of growth in earnings over the past five years for the stocks now in a fund.
Equity Exposure. A measure that reflects a fund’s investments in stocks and stock futures. Any holdings in short-term reserves are excluded.
Expense Ratio. The percentage of a fund’s average net assets used to pay its annual administrative and advisory expenses. These expenses directly reduce returns to investors.
Foreign Holdings. The percentage of a fund represented by securities or depositary receipts of companies based outside the United States.
Inception Date. The date on which the assets of a fund (or one of its share classes) are first invested in accordance with the fund’s investment objective. For funds with a subscription period, the inception date is the day after that period ends. Investment performance is measured from the inception date.
Median Market Cap. An indicator of the size of companies in which a fund invests; the midpoint of market capitalization (market price x shares outstanding) of a fund’s stocks, weighted by the proportion of the fund’s assets invested in each stock. Stocks representing half of the fund’s assets have market capitalizations above the median, and the rest are below it.
Price/Book Ratio. The share price of a stock divided by its net worth, or book value, per share. For a fund, the weighted average price/book ratio of the stocks it holds.
26
Price/Earnings Ratio. The ratio of a stock’s current price to its per-share earnings over the past year. For a fund, the weighted average P/E of the stocks it holds. P/E is an indicator of market expectations about corporate prospects; the higher the P/E, the greater the expectations for a company’s future growth.
R-Squared. A measure of how much of a fund’s past returns can be explained by the returns from the market in general, as measured by a given index. If a fund’s total returns were precisely synchronized with an index’s returns, its R-squared would be 1.00. If the fund’s returns bore no relationship to the index’s returns, its R-squared would be 0. For this report, R-squared is based on returns over the past 36 months for both the fund and the index.
Return on Equity. The annual average rate of return generated by a company during the past five years for each dollar of shareholder’s equity (net income divided by shareholder’s equity). For a fund, the weighted average return on equity for the companies whose stocks it holds.
Short-Term Reserves. The percentage of a fund invested in highly liquid, short-term securities that can be readily converted to cash.
Turnover Rate. An indication of the fund’s trading activity. Funds with high turnover rates incur higher transaction costs and may be more likely to distribute capital gains (which may be taxable to investors). The turnover rate excludes in-kind transactions, which have minimal impact on costs.
27
The People Who Govern Your Fund
The trustees of your mutual fund are there to see that the fund is operated and managed in your best interests since, as a shareholder, you are a part owner of the fund. Your fund’s trustees also serve on the board of directors of The Vanguard Group, Inc., which is owned by the Vanguard funds and provides services to them on an at-cost basis.
A majority of Vanguard’s board members are independent, meaning that they have no affiliation with Vanguard or the funds they oversee, apart from the sizable personal investments they have made as private individuals. The independent board members have distinguished backgrounds in business, academia, and public service. Each of the trustees and executive officers oversees 178 Vanguard funds.
The following table provides information for each trustee and executive officer of the fund. More information about the trustees is in the Statement of Additional Information, which can be obtained, without charge, by contacting Vanguard at 800-662-7447, or online at vanguard.com.
| Interested Trustee1 | and President (2006–2008) of Rohm and Haas Co. |
| (chemicals); Director of Tyco International, Ltd. | |
| F. William McNabb III | (diversified manufacturing and services) and Hewlett- |
| Born 1957. Trustee Since July 2009. Chairman of the | Packard Co. (electronic computer manufacturing); |
| Board. Principal Occupation(s) During the Past Five | Senior Advisor at New Mountain Capital; Trustee |
| Years: Chairman of the Board of The Vanguard Group, | of The Conference Board; Member of the Board of |
| Inc., and of each of the investment companies served | Managers of Delphi Automotive LLP (automotive |
| by The Vanguard Group, since January 2010; Director | components). |
| of The Vanguard Group since 2008; Chief Executive | |
| Officer and President of The Vanguard Group and of | Amy Gutmann |
| each of the investment companies served by The | Born 1949. Trustee Since June 2006. Principal |
| Vanguard Group since 2008; Director of Vanguard | Occupation(s) During the Past Five Years: President |
| Marketing Corporation; Managing Director of The | of the University of Pennsylvania; Christopher H. |
| Vanguard Group (1995–2008). | Browne Distinguished Professor of Political Science |
| in the School of Arts and Sciences with secondary | |
| appointments at the Annenberg School for Commu- | |
| Independent Trustees | nication and the Graduate School of Education |
| of the University of Pennsylvania; Director of | |
| Emerson U. Fullwood | Carnegie Corporation of New York, Schuylkill River |
| Born 1948. Trustee Since January 2008. Principal | Development Corporation, and Greater Philadelphia |
| Occupation(s) During the Past Five Years: Executive | Chamber of Commerce; Trustee of the National |
| Chief Staff and Marketing Officer for North America | Constitution Center; Chair of the Presidential |
| and Corporate Vice President (retired 2008) of Xerox | Commission for the Study of Bioethical Issues. |
| Corporation (document management products and | |
| services); Executive in Residence and 2010 | JoAnn Heffernan Heisen |
| Distinguished Minett Professor at the Rochester | Born 1950. Trustee Since July 1998. Principal |
| Institute of Technology; Director of SPX Corporation | Occupation(s) During the Past Five Years: Corporate |
| (multi-industry manufacturing), the United Way of | Vice President and Chief Global Diversity Officer |
| Rochester, Amerigroup Corporation (managed health | (retired 2008) and Member of the Executive |
| care), the University of Rochester Medical Center, | Committee (1997–2008) of Johnson & Johnson |
| Monroe Community College Foundation, and North | (pharmaceuticals/consumer products); Director of |
| Carolina A&T University. | Skytop Lodge Corporation (hotels), the University |
| Medical Center at Princeton, the Robert Wood | |
| Rajiv L. Gupta | Johnson Foundation, and the Center for Work Life |
| Born 1945. Trustee Since December 2001.2 | Policy; Member of the Advisory Board of the |
| Principal Occupation(s) During the Past Five Years: | Maxwell School of Citizenship and Public Affairs |
| Chairman and Chief Executive Officer (retired 2009) | at Syracuse University. |
| F. Joseph Loughrey | Thomas J. Higgins | |
| Born 1949. Trustee Since October 2009. Principal | Born 1957. Chief Financial Officer Since September | |
| Occupation(s) During the Past Five Years: President | 2008. Principal Occupation(s) During the Past Five | |
| and Chief Operating Officer (retired 2009) and Vice | Years: Principal of The Vanguard Group, Inc.; Chief | |
| Chairman of the Board (2008–2009) of Cummins Inc. | Financial Officer of each of the investment companies | |
| (industrial machinery); Director of SKF AB (industrial | served by The Vanguard Group since 2008; Treasurer | |
| machinery), Hillenbrand, Inc. (specialized consumer | of each of the investment companies served by The | |
| services), the Lumina Foundation for Education, and | Vanguard Group (1998–2008). | |
| Oxfam America; Chairman of the Advisory Council | ||
| for the College of Arts and Letters and Member | Kathryn J. Hyatt | |
| of the Advisory Board to the Kellogg Institute for | Born 1955. Treasurer Since November 2008. Principal | |
| International Studies at the University of Notre Dame. | Occupation(s) During the Past Five Years: Principal | |
| of The Vanguard Group, Inc.; Treasurer of each of | ||
| André F. Perold | the investment companies served by The Vanguard | |
| Born 1952. Trustee Since December 2004. Principal | Group since 2008; Assistant Treasurer of each of the | |
| Occupation(s) During the Past Five Years: George | investment companies served by The Vanguard Group | |
| Gund Professor of Finance and Banking at the Harvard | (1988–2008). | |
| Business School (retired July 2011); Chief Investment | ||
| Officer and co-Managing Partner of HighVista | Heidi Stam | |
| Strategies LLC (private investment firm); Director of | Born 1956. Secretary Since July 2005. Principal | |
| Rand Merchant Bank; Overseer of the Museum of | Occupation(s) During the Past Five Years: Managing | |
| Fine Arts Boston. | Director of The Vanguard Group, Inc., since 2006; | |
| General Counsel of The Vanguard Group since 2005; | ||
| Alfred M. Rankin, Jr. | Secretary of The Vanguard Group and of each of the | |
| Born 1941. Trustee Since January 1993. Principal | investment companies served by The Vanguard Group | |
| Occupation(s) During the Past Five Years: Chairman, | since 2005; Director and Senior Vice President of | |
| President, and Chief Executive Officer of NACCO | Vanguard Marketing Corporation since 2005; | |
| Industries, Inc. (forklift trucks/housewares/lignite); | Principal of The Vanguard Group (1997–2006). | |
| Director of Goodrich Corporation (industrial products/ | ||
| aircraft systems and services) and the National | ||
| Association of Manufacturers; Chairman of the | Vanguard Senior Management Team | |
| Federal Reserve Bank of Cleveland; Vice Chairman | ||
| of University Hospitals of Cleveland; President of | R. Gregory Barton | Chris D. McIsaac |
| the Board of The Cleveland Museum of Art. | Mortimer J. Buckley | Michael S. Miller |
| Kathleen C. Gubanich | James M. Norris | |
| Peter F. Volanakis | Paul A. Heller | Glenn W. Reed |
| Born 1955. Trustee Since July 2009. Principal | Martha G. King | George U. Sauter |
| Occupation(s) During the Past Five Years: President | ||
| and Chief Operating Officer (retired 2010) of Corning | ||
| Incorporated (communications equipment); Director of | Chairman Emeritus and Senior Advisor | |
| Corning Incorporated (2000–2010) and Dow Corning | ||
| (2001–2010); Overseer of the Amos Tuck School of | John J. Brennan | |
| Business Administration at Dartmouth College. | Chairman, 1996–2009 | |
| Chief Executive Officer and President, 1996–2008 | ||
| Executive Officers | ||
| Founder | ||
| Glenn Booraem | ||
| Born 1967. Controller Since July 2010. Principal | John C. Bogle | |
| Occupation(s) During the Past Five Years: Principal | Chairman and Chief Executive Officer, 1974–1996 | |
| of The Vanguard Group, Inc.; Controller of each of | ||
| the investment companies served by The Vanguard | ||
| Group since 2010; Assistant Controller of each of | ||
| the investment companies served by The Vanguard | ||
| Group (2001–2010). | ||
1 Mr. McNabb is considered an “interested person,” as defined in the Investment Company Act of 1940, because he is an officer of the Vanguard funds.
2 December 2002 for Vanguard Equity Income Fund, Vanguard Growth Equity Fund, the Vanguard Municipal Bond Funds, and the Vanguard State Tax-Exempt Funds.
 | |
| P.O. Box 2600 | |
| Valley Forge, PA 19482-2600 |
Connect with Vanguard® > vanguard.com
| Fund Information > 800-662-7447 | |
| Direct Investor Account Services > 800-662-2739 | |
| Institutional Investor Services > 800-523-1036 | |
| Text Telephone for People | |
| With Hearing Impairment > 800-749-7273 | |
| This material may be used in conjunction | |
| with the offering of shares of any Vanguard | |
| fund only if preceded or accompanied by | |
| the fund’s current prospectus. | |
| All comparative mutual fund data are from Lipper Inc. or | |
| Morningstar, Inc., unless otherwise noted. | |
| You can obtain a free copy of Vanguard’s proxy voting | |
| guidelines by visiting vanguard.com/proxyreporting or by | |
| calling Vanguard at 800-662-2739. The guidelines are | |
| also available from the SEC’s website, sec.gov. In | |
| addition, you may obtain a free report on how your fund | |
| voted the proxies for securities it owned during the 12 | |
| months ended June 30. To get the report, visit either | |
| vanguard.com/proxyreporting or sec.gov. | |
| You can review and copy information about your fund at | |
| the SEC’s Public Reference Room in Washington, D.C. To | |
| find out more about this public service, call the SEC at | |
| 202-551-8090. Information about your fund is also | |
| available on the SEC’s website, and you can receive | |
| copies of this information, for a fee, by sending a | |
| request in either of two ways: via e-mail addressed to | |
| publicinfo@sec.gov or via regular mail addressed to the | |
| Public Reference Section, Securities and Exchange | |
| Commission, Washington, DC 20549-1520. | |
| © 2011 The Vanguard Group, Inc. | |
| All rights reserved. | |
| Vanguard Marketing Corporation, Distributor. | |
| Q12200 112011 | |
Item 2: Code of Ethics. The Registrant has adopted a code of ethics that applies to the Registrant’s principal executive officer, principal financial officer, principal accounting officer or controller or persons performing similar functions. The Code of Ethics was amended during the reporting period covered by this report to make certain technical, non-material changes.
Item 3: Audit Committee Financial Expert. The following members of the Audit Committee have been determined by the Registrant’s Board of Trustees to be Audit Committee Financial Experts serving on its Audit Committee, and to be independent: Charles D. Ellis, Rajiv L. Gupta, JoAnn Heffernan Heisen, André F. Perold, and Alfred M. Rankin, Jr. Item 4: Principal Accountant Fees and Services.
(a) Audit Fees.
Audit Fees of the Registrant
Fiscal Year Ended September 30, 2011: $80,000
Fiscal Year Ended September 30, 2010: $76,000
Aggregate Audit Fees of Registered Investment Companies in the Vanguard Group.
Fiscal Year Ended September 30, 2011: $3,978,540
Fiscal Year Ended September 30, 2010: $3,607,060
(b) Audit-Related Fees.
Fiscal Year Ended September 30, 2011: $1,341,750
Fiscal Year Ended September 30, 2010: $791,350
Includes fees billed in connection with assurance and related services provided to the Registrant, The Vanguard Group, Inc., Vanguard Marketing Corporation, and other registered investment companies in the Vanguard Group.
(c) Tax Fees.
Fiscal Year Ended September 30, 2011: $373,830
Fiscal Year Ended September 30, 2010: $336,090
Includes fees billed in connection with tax compliance, planning and advice services provided to the Registrant, The Vanguard Group, Inc., Vanguard Marketing Corporation, and other registered investment companies in the Vanguard Group and related to income and excise taxes.
(d) All Other Fees.
Fiscal Year Ended September 30, 2011: $16,000
Fiscal Year Ended September 30, 2010: $16,000
Includes fees billed for services related to risk management and privacy matters. Services were provided to the Registrant, The Vanguard Group, Inc., Vanguard Marketing Corporation, and other registered investment companies in the Vanguard Group.
(e) (1) Pre-Approval Policies. The policy of the Registrant’s Audit Committee is to consider and, if appropriate, approve before the principal accountant is engaged for such services, all specific audit and non-audit services provided to: (1) the Registrant; (2) The Vanguard Group, Inc.; (3) other entities controlled by The Vanguard Group, Inc. that provide ongoing services to the Registrant; and (4) other registered investment companies in the Vanguard Group. In making a determination, the Audit Committee considers whether the services are consistent with maintaining the principal accountant’s independence.
In the event of a contingency situation in which the principal accountant is needed to provide services in between scheduled Audit Committee meetings, the Chairman of the Audit Committee would be called on to consider and, if appropriate, pre-approve audit or permitted non-audit services in an amount sufficient to complete services through the next Audit Committee meeting, and to determine if such services would be consistent with maintaining the accountant’s independence. At the next scheduled Audit Committee meeting, services and fees would be presented to the Audit Committee for formal consideration, and, if appropriate, approval by the entire Audit Committee. The Audit Committee would again consider whether such services and fees are consistent with maintaining the principal accountant’s independence.
The Registrant’s Audit Committee is informed at least annually of all audit and non-audit services provided by the principal accountant to the Vanguard complex, whether such services are provided to: (1) the Registrant; (2) The Vanguard Group, Inc.; (3) other entities controlled by The Vanguard Group, Inc. that provide ongoing services to the Registrant; or (4) other registered investment companies in the Vanguard Group.
(2) No percentage of the principal accountant’s fees or services were approved pursuant to the waiver provision of paragraph (c)(7)(i)(C) of Rule 2-01 of Regulation S-X.
(f) For the most recent fiscal year, over 50% of the hours worked under the principal accountant’s engagement were not performed by persons other than full-time, permanent employees of the principal accountant.
(g) Aggregate Non-Audit Fees.
Fiscal Year Ended September 30, 2011: $389,830
Fiscal Year Ended September 30, 2010: $352,090
Includes fees billed for non-audit services provided to the Registrant, The Vanguard Group, Inc., Vanguard Marketing Corporation, and other registered investment companies in the Vanguard Group.
(h) For the most recent fiscal year, the Audit Committee has determined that the provision of all non-audit services was consistent with maintaining the principal accountant’s independence.
Item 5: Audit Committee of Listed Registrants.
Not Applicable.
Item 6: Investments.
Not Applicable.
Item 7: Disclosure of Proxy Voting Policies and Procedures for Closed-End Management Investment Companies.
Not Applicable.
Item 8: Portfolio Managers of Closed-End Management Investment Companies.
Not Applicable.
Item 9: Purchase of Equity Securities by Closed-End Management Investment Company and Affiliated Purchasers.
Not Applicable.
Item 10: Submission of Matters to a Vote of Security Holders.
Not Applicable.
Item 11: Controls and Procedures.
(a) Disclosure Controls and Procedures. The Principal Executive and Financial Officers concluded that the Registrant's Disclosure Controls and Procedures are effective based on their evaluation of the Disclosure Controls and Procedures as of a date within 90 days of the filing date of this report.
(b) Internal Control Over Financial Reporting. There were no significant changes in Registrant’s Internal Control Over Financial Reporting or in other factors that could significantly affect this control subsequent to the date of the evaluation, including any corrective actions with regard to significant deficiencies and material weaknesses.
Item 12: Exhibits.
(a) Code of Ethics.
(b) Certifications.
Pursuant to the requirements of the Securities Exchange Act of 1934 and the Investment Company Act of 1940, the registrant has duly caused this report to be signed on its behalf by the undersigned, thereunto duly authorized.
| VANGUARD FENWAY FUNDS | |
| By: | /s/ F. WILLIAM MCNABB III* |
| F. WILLIAM MCNABB III | |
| CHIEF EXECUTIVE OFFICER | |
| Date: November 18, 2011 | |
Pursuant to the requirements of the Securities Exchange Act of 1934 and the Investment Company Act of 1940, this report has been signed below by the following persons on behalf of the registrant and in the capacities and on the dates indicated.
| VANGUARD FENWAY FUNDS | |
| By: | /s/ F. WILLIAM MCNABB III* |
| F. WILLIAM MCNABB III | |
| CHIEF EXECUTIVE OFFICER | |
| Date: November 18, 2011 | |
| VANGUARD FENWAY FUNDS | |
| By: | /s/ THOMAS J. HIGGINS* |
| THOMAS J. HIGGINS | |
| CHIEF FINANCIAL OFFICER | |
| Date: November 18, 2011 | |
* By: /s/ Heidi Stam
Heidi Stam, pursuant to a Power of Attorney filed on November 28, 2011, see file Number 33-23444, Incorporated by Reference.