UNITED STATES
SECURITIES AND EXCHANGE COMMISSION
Washington, D.C. 20549
FORM N-CSR
CERTIFIED SHAREHOLDER REPORT
OF
REGISTERED MANAGEMENT INVESTMENT COMPANIES
Investment Company Act file number: 811-5445
Name of Registrant: Vanguard Fenway Funds
Address of Registrant:
P.O. Box 2600
Valley Forge, PA 19482
Name and address of agent for service:
Heidi Stam, Esquire
P.O. Box 876
Valley Forge, PA 19482
Registrant’s telephone number, including area code: (610) 669-1000
Date of fiscal year end: September 30
Date of reporting period: October 1, 2009 – September 30, 2010
Item 1: Reports to Shareholders
| Vanguard Equity Income Fund |
| Annual Report |
| September 30, 2010 |
 |
> For the fiscal year ended September 30, 2010, Vanguard Equity Income Fund returned about 11%.
> The fund outperformed its benchmark, the FTSE High Dividend Yield Index, by more than 2 percentage points for the period.
> The fund’s 30-day SEC yield declined slightly from 2009 fiscal year-end as stock prices rose.
| Contents | |
| Your Fund’s Total Returns. | 1 |
| Chairman’s Letter. | 2 |
| Advisors’ Report. | 7 |
| Fund Profile. | 10 |
| Performance Summary. | 11 |
| Financial Statements. | 13 |
| Your Fund’s After-Tax Returns. | 26 |
| About Your Fund’s Expenses. | 27 |
| Glossary. | 29 |
Please note: The opinions expressed in this report are just that—informed opinions. They should not be considered promises or advice. Also, please keep in mind that the information and opinions cover the period through the date on the front of this report. Of course, the risks of investing in your fund are spelled out in the prospectus.
See the Glossary for definitions of investment terms used in this report.
Cover photograph: Jean Maher.
Your Fund’s Total Returns
| Fiscal Year Ended September 30, 2010 | |
| Total | |
| Returns | |
| Vanguard Equity Income Fund | |
| Investor Shares | 11.36% |
| Admiral™ Shares | 11.50 |
| FTSE High Dividend Yield Index | 9.29 |
| Equity Income Funds Average | 11.09 |
Equity Income Funds Average: Derived from data provided by Lipper Inc.
Admiral Shares carry lower expenses and are available to investors who meet certain account-balance requirements.
Your Fund’s Performance at a Glance
September 30, 2009, Through September 30, 2010
| Distributions Per Share | |||||
| Starting | Ending | Income | Capital | ||
| Share Price | Share Price | Dividends | Gains | ||
| Vanguard Equity Income Fund | |||||
| Investor Shares | $17.40 | $18.83 | $0.528 | $0.000 | |
| Admiral Shares | 36.46 | 39.47 | 1.141 | 0.000 | |
1

Chairman’s Letter
Dear Shareholder,
Vanguard Equity Income Fund returned about 11% for the 12 months ended September 30, 2010. The fund performed considerably better than its index, the FTSE High Dividend Yield Index, which returned about 9% for the period. The fund also outperformed the average return for equity income funds.
At the end of the 12-month period, the fund had a 30-day SEC yield of 2.60%, more than 1 percentage point higher than the yield of the broad stock market, as measured by Vanguard Total Stock Market Index Fund Investor Shares. The yield is down a bit from its year-ago level, as investor enthusiasm for dividend-paying stocks has boosted share prices.
Also, please note that on October 6, after the close of the period, Vanguard broadened the availability of our lower-cost Admiral Shares. We reduced the Admiral minimums on most of our actively managed funds to $50,000 from $100,000, as part of our ongoing efforts to lower the cost of investing for our clients.
An upbeat end to a worrisome 12 months
Although global stock markets traced a ragged trajectory, they ultimately gained ground for the 12 months ended September 30. Europe’s sovereign debt crisis and a dispiriting lack of vigor in the U.S. economy weighed on stock prices through the spring and summer.
2
In September, however, investor sentiment perked up, buoyed by continued signs of strength in corporate financial statements. The broad U.S. stock market rallied to close the 12-month period with a return of more than 11%. Small-capitalization stocks finished a few steps ahead of their large-cap counterparts.
International stock markets were a mixed bag: middling returns in Europe, stagnation in the Pacific region’s developed markets, and a return of more than 20% from emerging markets. The combined result, as measured by the MSCI All Country World Index ex USA, was a 12-month return of 8%.
Bond prices rallied, driving yields to surprising lows
Bonds produced strong 12-month returns, a gratifying performance that nevertheless raises questions about the prospects for total returns in a fixed income market where yields hover near all-time lows. At the start of the period, the 10-year U.S. Treasury note yielded 3.31%; at the end of the period, the figure was 2.51% as investors bid up bond prices. As yields move lower, of course, the scope for continued declines—and the attendant rise in prices—diminishes. Corporate bonds performed best for the 12 months. Municipal bonds delivered solid, but more modest, returns.
| Market Barometer | |||
| Average Annual Total Returns | |||
| Periods Ended September 30, 2010 | |||
| One | Three | Five | |
| Year | Years | Years | |
| Stocks | |||
| Russell 1000 Index (Large-caps) | 10.75% | -6.79% | 0.86% |
| Russell 2000 Index (Small-caps) | 13.35 | -4.29 | 1.60 |
| Dow Jones U.S. Total Stock Market Index | 11.51 | -6.12 | 1.37 |
| MSCI All Country World Index ex USA (International) | 8.00 | -6.98 | 4.72 |
| Bonds | |||
| Barclays Capital U.S. Aggregate Bond Index (Broad | |||
| taxable market) | 8.16% | 7.42% | 6.20% |
| Barclays Capital Municipal Bond Index (Broad | |||
| tax-exempt market) | 5.81 | 6.04 | 5.13 |
| Citigroup Three-Month U.S. Treasury Bill Index | 0.12 | 1.01 | 2.47 |
| CPI | |||
| Consumer Price Index | 1.14% | 1.57% | 1.90% |
3
As has been the case for almost two years now, the yields of money market securities remained near 0%, a consequence of the Federal Reserve Board’s efforts to stimulate the economy by keeping a tight lid on borrowing costs.
Dividend-paying stocks make a strong comeback
In the wake of the 2008–2009 financial crisis, many companies slashed or eliminated dividends, putting pressure on dividend-oriented funds. From the fourth quarter of 2008 to the fourth quarter of 2009, for example, dividends paid by the companies in the S&P 500 Index declined by about 20%, according to Standard & Poor’s. Although payouts have yet to return to their precrisis highs, dividends have been bouncing back, boosting enthusiasm for—and the share prices of—dividend-paying stocks.
General Electric, one of the fund’s top-10 holdings, illustrates the tos and fros. Amid fallout from the financial crisis, the company cut its dividend in 2009 for the first time since the Great Depression. In July, General Electric’s Board of Directors announced a 20% increase in dividends to 12 cents per share, up from 10 cents per share.
Investor enthusiasm for dividend-paying companies may also reflect dissatisfaction with the distressingly small yields available from fixed income investments. Although stock prices are much more volatile than bond prices, investors seem to view stocks
Expense Ratios
Your Fund Compared With Its Peer Group
| Investor | Admiral | Peer Group | |
| Shares | Shares | Average | |
| Equity Income Fund | 0.36% | 0.24% | 1.36% |
The fund expense ratios shown are from the prospectus dated January 28, 2010, and represent estimated costs for the current fiscal year. For the fiscal year ended September 30, 2010, the fund’s expense ratios were 0.31% for Investor Shares and 0.22% for Admiral Shares. The peer-group expense ratio is derived from data provided by Lipper Inc. and captures information through year-end 2009.
Peer group: Equity Income Funds.
4
that pay dividends as an alternative to low-yielding fixed income securities. During the past 12 months, this search for income in the stock market brought investors the additional benefit of a solid increase in share prices.
The fund’s 30-day SEC yield dropped during the period, even as the dividend climate improved. At the end of the 12 months, the fund’s 30-day SEC yield was 2.60% for Investor Shares (down from 2.80% at the end of the 2009 fiscal year). Still, the fund’s 30-day SEC yield was more than a percentage point higher than the broad stock market’s yield of 1.52% as measured by Vanguard Total Stock Market Index Fund’s Investor Shares. The overall drop in yields was mostly attributable to a concurrent rise in company stock prices.
On a sector level, stocks in information technology, consumer discretionary, materials, and consumer staples all contributed to the fund’s relative performance. In technology, software companies were down for the period, but the fund managed to avoid some of the harder-hit stocks. In consumer-related industries, household goods, retailers, and food products all helped performance, while chemical and container companies were areas of strength in the materials sector.
Although the fund’s financial holdings—which accounted for about 15% of the fund’s assets, on average, during the period—posted overall negative results, stock selection in the sector helped boost performance relative to the index. The opposite was true in the
Total Returns
Ten Years Ended September 30, 2010
| Average | |
| Annual Return | |
| Equity Income Fund Investor Shares | 3.52% |
| Spliced Equity Income Index | 3.31 |
| Equity Income Funds Average | 2.42 |
Spliced Equity Income Index: Russell 1000 Value Index through July 31, 2007; FTSE High Dividend Yield Index thereafter.
Equity Income Funds Average: Derived from data provided by Lipper Inc.
The figures shown represent past performance, which is not a guarantee of future results. (Current performance may be lower or higher than the performance data cited. For performance data current to the most recent month-end, visit our website at vanguard.com/performance.) Note, too, that both investment returns and principal value can fluctuate widely, so an investor’s shares, when sold, could be worth more or less than their original cost.
5
telecommunication services industry. Although these stocks turned in strong results for the period, the fund’s performance in this sector trailed that of the index. The fund’s underperformance was mostly because of its limited exposure to Verizon Communications, which jumped 23% for the period.
Fund’s long-term results outperform by comparative standards
For the ten years ended September 30, Investor Shares of Vanguard Equity Income Fund posted an average annual return of 3.52%. The fund slightly outperformed its benchmark index (+3.31%) for the same period, and returned significantly more than its peer-group average (+2.42%).
The fund’s two advisors—Wellington Management Company and Vanguard Quantitative Equity Group—identify dividend-paying, undervalued companies whose share prices are expected to appreciate over time. Each advisor follows its own distinct strategy, and together they’ve led the fund to competitive long-term results. In addition to the advisors’ skills, the fund’s low costs have helped to provide a head start on performance compared with its peers.
Focus on your goals rather than the market’s moves
The stock market’s ups and downs can be unsettling for investors, but the volatility is also a good reminder that you shouldn’t let the market’s unpredictable movements startle you or influence your long-term investment strategy.
While nobody can predict what’s going to happen next in the financial markets, we can position our investment portfolios to make sure that they’re in line with our long-term financial goals. Vanguard encourages you to create a plan that includes a mix of stocks, bonds, and short-term investments appropriate for your goals and risk tolerance.
A well-balanced investment portfolio can help provide some cushion from the stock market’s downward swings while allowing you to participate in its long-term potential for growth. Vanguard’s low-cost Equity Income Fund can play an important role in such an investment plan, particularly for investors who hope to generate regular income from their stock portfolios.
As always, thank you for entrusting your assets to Vanguard.
Sincerely,

F. William McNabb III
Chairman and Chief Executive Officer
October 12, 2010
6
Advisors’ Report
For the fiscal year ended September 30, the Equity Income Fund returned about 11%, reflecting the combined results of your fund’s two independent investment advisors. The use of two advisors provides exposure to distinct, yet complementary, investment approaches, enhancing the diversification of your fund. It is not uncommon for different advisors to have different views about individual securities or the broader investment environment.
The advisors, the percentage of the fund’s assets each manages, and brief descriptions of their investment strategies are presented in the table below. The advisors have also prepared a discussion of the investment environment that existed during the fiscal year and of how their portfolio positioning reflects this assessment. These comments were prepared on October 15, 2010.
| Vanguard Equity Income Fund Investment Advisors | |||
| Fund Assets Managed | |||
| Investment Advisor | % | $ Million | Investment Strategy |
| Wellington Management | 61 | 2,622 | A fundamental approach to seeking desirable stocks. |
| Company, LLP | Our selections typically offer above-average dividend | ||
| yields, below-average valuations, and the potential for | |||
| dividend increases in the future. | |||
| Vanguard Quantitative Equity | 35 | 1,520 | Employs a quantitative fundamental management |
| Group | approach, using models that assess valuation, growth | ||
| prospects, management decisions, market sentiment, | |||
| and earnings-quality of companies as compared with | |||
| their peers. | |||
| Cash Investments | 4 | 176 | These short-term reserves are invested by Vanguard in |
| equity index products to simulate investment in stocks. | |||
| Each advisor may also maintain a modest cash | |||
| position. | |||
7
Wellington Management Company, llp
Portfolio Manager:
W. Michael Reckmeyer, III, CFA, Senior Vice President and Equity Portfolio Manager
U.S. economic growth slowed from the pace experienced in the first half of 2010, as the benefit from significant inventory restocking waned and the pace of job growth was muted. Midcycle economic corrections are not uncommon, and while we acknowledge that there is the risk of an economic double dip, we believe that the economy will continue to expand at a moderate pace.
Corporate earnings have been strong because of aggressive cost cutting and improving revenues. The stabilizing economic outlook should enable corporations to grow revenues at a moderate pace and, combined with strong operating leverage generated by their slimmed-down cost structure, should drive attractive earnings growth.
Global economic growth remains solid, largely driven by the emerging economies. China is still the key driver of growth, and while there remains some risk that Chinese economic activity will unravel, we believe the country will successfully navigate through this economic slowdown. European growth remains mixed, with Germany experiencing strong growth, while other countries, such as Greece and Spain, struggle with big deficits.
Over the past 12 months, we sold several companies that reached our target prices, such as Nestlé, Caterpillar, and Air Products. We also sold Ingersoll Rand and UNUM as they approached our target prices and reinvested the proceeds into names with more attractive dividend yields. BP and AFLAC were sold because of eroding fundamentals.
Our largest purchases included insurance broker Marsh & McLennan, food manufacturing and packaging company Kraft, energy producer Exxon Mobil, and security provider Tyco International.
Vanguard Quantitative Equity Group
Portfolio Manager:
James P. Stetler, Principal
After starting the fiscal year with two strong quarters of returns, the U.S. equity market headed south during the fiscal third quarter, declining more than 10%, only to see a strong rally finish the fiscal fourth quarter and year. The September recovery came despite continued weakness and uncertainty in economic data.
There has been a slow and steady decline of GDP results since the fourth quarter of 2009, when GDP growth registered a 5.0% gain followed by a 3.7% gain in the first calendar quarter of 2010, and finally a 1.6% gain in the second quarter. Corporate earnings have continued to surprise to the upside and may continue for this third quarter. Still, an uncertain global recovery,
8
near-10% unemployment, sovereign debt concerns, and recent Federal Reserve statements discussing the possibility of additional stimulus measures have investors cautious and concerned about where equity markets will head next.
Higher dividend-yielding stocks, the focus of your investment in the Equity Income Fund, returned 9.3% for the period, as measured by the FTSE High Dividend Yield Index.
For the 12-month period, returns in this area of the equity market were led by consumer discretionary, materials, and telecommunication companies. Technology and financial company returns were the laggards for the fiscal period.
Our valuation, management decisions, growth, and quality indicators accurately distinguished the outperformers from the underperformers for the period. Our valuation model measures the price we will pay for a stock’s earnings or cash flow. The management decisions model evaluates the decisions corporate managers make to enhance shareholder value, while the growth indicator differentiates between companies with low valuations because of poor growth prospects and firms with more attractive prospects. The quality model measures balance sheet strength and the sustainability of earnings. Our market sentiment model, which assesses investor’s actions toward a company in the marketplace, was negative for the period and detracted from our overall results.
Stock selections were strongest in the financial and materials sectors. In financials, selections such as New York Community Bancorp and an underweighting in Citigroup added most to our returns. In the materials category, Lubrizol, DuPont, and Eastman Chemical were the largest contributors to our relative results. On the other hand, our selections in the industrial, utilities, and technology sectors held back our overall return. R.R. Donnelley & Sons, Exelon, Jabil Circuit, and Diebold were among the holdings that did not perform as we expected.
Although proof of a stable economic recovery has not yet materialized and market uncertainty and volatility may be with us for the near term, we remain committed to a portfolio of companies with lower relative price-to-earnings and cash-flow ratios, growth rates near the market, a higher return on equity, quality balance sheets, and positive market sentiment.
We believe this “growth at a reasonable price” approach to building a portfolio, combined with a disciplined risk control framework, offers an attractive profile that the market will reward in the long term. We thank you for your investment and trust and we look forward to reporting to you in 2011.
9
Equity Income Fund
Fund Profile
As of September 30, 2010
| Share-Class Characteristics | ||
| Investor | Admiral | |
| Shares | Shares | |
| Ticker Symbol | VEIPX | VEIRX |
| Expense Ratio1 | 0.36% | 0.24% |
| 30-Day SEC Yield | 2.60% | 2.60% |
| Portfolio Characteristics | |||
| FTSE High | DJ | ||
| Dividend | U.S. Total | ||
| Yield | Market | ||
| Fund | Index | Index | |
| Number of Stocks | 147 | 552 | 3,920 |
| Median Market Cap $53.6B | $53.6B | $27.3B | |
| Price/Earnings Ratio | 13.3x | 14.4x | 17.1x |
| Price/Book Ratio | 2.1x | 2.2x | 2.1x |
| Return on Equity | 20.8% | 21.3% | 19.1% |
| Earnings Growth Rate | 1.6% | 2.0% | 6.4% |
| Dividend Yield | 3.3% | 3.2% | 1.8% |
| Foreign Holdings | 3.6% | 0.0% | 0.0% |
| Turnover Rate | 45% | — | — |
| Short-Term Reserves | 0.5% | — | — |
| Sector Diversification (% of equity exposure) | |||
| FTSE High | DJ | ||
| Dividend | U.S. Total | ||
| Yield | Market | ||
| Fund | Index | Index | |
| Consumer | |||
| Discretionary | 9.3% | 8.3% | 11.7% |
| Consumer Staples | 15.0 | 17.7 | 10.1 |
| Energy | 11.6 | 11.0 | 9.7 |
| Financials | 12.8 | 10.3 | 16.6 |
| Health Care | 12.0 | 12.0 | 11.2 |
| Industrials | 14.8 | 15.7 | 11.1 |
| Information | |||
| Technology | 8.9 | 8.6 | 19.0 |
| Materials | 4.5 | 3.9 | 4.2 |
| Telecommunication | |||
| Services | 3.8 | 5.0 | 2.9 |
| Utilities | 7.3 | 7.5 | 3.5 |
| Volatility Measures | ||
| FTSE High | DJ | |
| Dividend | U.S. Total | |
| Yield | Market | |
| Index | Index | |
| R-Squared | 0.99 | 0.92 |
| Beta | 0.91 | 0.86 |
These measures show the degree and timing of the fund’s fluctuations compared with the indexes over 36 months.
| Ten Largest Holdings (% of total net assets) | ||
| Chevron Corp. | Integrated Oil & | |
| Gas | 3.8% | |
| Johnson & Johnson | Pharmaceuticals | 3.3 |
| AT&T Inc. | Integrated | |
| Telecommunication | ||
| Services | 2.9 | |
| Microsoft Corp. | Systems Software | 2.8 |
| Pfizer Inc. | Pharmaceuticals | 2.7 |
| Merck & Co. Inc. | Pharmaceuticals | 2.7 |
| Exxon Mobil Corp. | Integrated Oil & | |
| Gas | 2.6 | |
| JPMorgan Chase & Co. | Diversified Financial | |
| Services | 2.5 | |
| 3M Co. | Industrial | |
| Conglomerates | 2.5 | |
| General Electric Co. | Industrial | |
| Conglomerates | 2.5 | |
| Top Ten | 28.3% | |
The holdings listed exclude any temporary cash investments and equity index products.
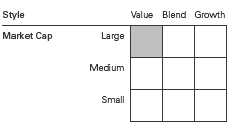
Investment Focus
1 The expense ratios shown are from the prospectus dated January 28, 2010, and represent estimated costs for the current fiscal year. For the fiscal year ended September 30, 2010, the expense ratios were 0.31% for Investor Shares and 0.22% for Admiral Shares.
10
Equity Income Fund
Performance Summary
All of the returns in this report represent past performance, which is not a guarantee of future results that may be achieved by the fund. (Current performance may be lower or higher than the performance data cited. For performance data current to the most recent month-end, visit our website at vanguard.com/performance.) Note, too, that both investment returns and principal value can fluctuate widely, so an investor’s shares, when sold, could be worth more or less than their original cost. The returns shown do not reflect taxes that a shareholder would pay on fund distributions or on the sale of fund shares.
Cumulative Performance: September 30, 2000, Through September 30, 2010
Initial Investment of $10,000
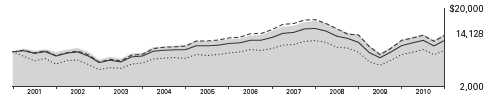
| Average Annual Total Returns | ||||
| Periods Ended September 30, 2010 | ||||
| Final Value | ||||
| One | Five | Ten | of a $10,000 | |
| Year | Years | Years | Investment | |
| Equity Income Fund Investor Shares | 11.36% | 1.77% | 3.52% | $14,128 |
| Dow Jones U.S. Total Stock Market | ||||
| Index | 11.51 | 1.37 | 0.41 | 10,421 |
| Spliced Equity Income Index | 9.29 | 0.92 | 3.31 | 13,852 |
| Equity Income Funds Average | 11.09 | 1.24 | 2.42 | 12,697 |
Spliced Equity Income Index: Russell 1000 Value Index through July 31, 2007; FTSE High Dividend Yield Index thereafter.
Equity Income Funds Average: Derived from data provided by Lipper Inc.
See Financial Highlights for dividend and capital gains information.
11
Equity Income Fund
| Average Annual Total Returns | ||||
| Periods Ended September 30, 2010 | ||||
| Since | Final Value | |||
| One | Five | Inception | of a $50,000 | |
| Year | Years | (8/13/2001) | Investment | |
| Equity Income Fund Admiral Shares | 11.50% | 1.89% | 3.33% | $67,406 |
| Dow Jones U.S. Total Stock Market | ||||
| Index | 11.51 | 1.37 | 2.69 | 63,729 |
| Spliced Equity Income Index | 9.29 | 0.92 | 3.49 | 68,413 |
| "Since Inception" performance is calculated from the Admiral Shares’ inception date for both the fund and its comparative standards. | ||||
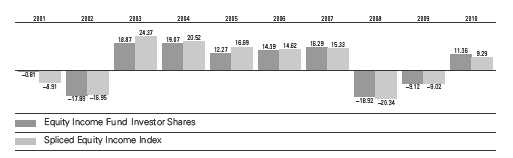
Fiscal-Year Total Returns (%): September 30, 2000, Through September 30, 2010
12
Equity Income Fund
Financial Statements
Statement of Net Assets
As of September 30, 2010
The fund reports a complete list of its holdings in regulatory filings four times in each fiscal year, at the quarter-ends. For the second and fourth fiscal quarters, the lists appear in the fund’s semiannual and annual reports to shareholders. For the first and third fiscal quarters, the fund files the lists with the Securities and Exchange Commission on Form N-Q. Shareholders can look up the fund’s Forms N-Q on the SEC’s website at sec.gov. Forms N-Q may also be reviewed and copied at the SEC’s Public Reference Room (see the back cover of this report for further information).
| Market | |||
| Value | |||
| Shares | ($000) | ||
| Common Stocks (96.5%)1 | |||
| Consumer Discretionary (8.8%) | |||
| McDonald’s Corp. | 1,161,605 | 86,551 | |
| Home Depot Inc. | 2,581,600 | 81,785 | |
| Stanley Black & | |||
| Decker Inc. | 787,200 | 48,240 | |
| Genuine Parts Co. | 1,060,800 | 47,301 | |
| Mattel Inc. | 854,200 | 20,040 | |
| Nordstrom Inc. | 476,900 | 17,741 | |
| Time Warner Inc. | 461,900 | 14,157 | |
| Limited Brands Inc. | 407,300 | 10,907 | |
| Williams-Sonoma Inc. | 293,200 | 9,294 | |
| Whirlpool Corp. | 88,100 | 7,133 | |
| Gannett Co. Inc. | 565,728 | 6,919 | |
| Comcast Corp. | |||
| Special Class A Shares | 402,600 | 6,848 | |
| Darden Restaurants Inc. | 124,600 | 5,330 | |
| Cooper Tire & Rubber Co. | 253,074 | 4,968 | |
| H&R Block Inc. | 302,200 | 3,913 | |
| DR Horton Inc. | 283,200 | 3,149 | |
| Cracker Barrel Old Country | |||
| Store Inc. | 54,700 | 2,777 | |
| McGraw-Hill Cos. Inc. | 80,800 | 2,671 | |
| Comcast Corp. Class A | 66,900 | 1,210 | |
| 380,934 | |||
| Consumer Staples (14.5%) | |||
| Philip Morris | |||
| International Inc. | 1,480,955 | 82,963 | |
| PepsiCo Inc. | 1,196,700 | 79,509 | |
| Kraft Foods Inc. | 1,902,989 | 58,726 | |
| Altria Group Inc. | 2,287,055 | 54,935 | |
| Procter & Gamble Co. | 859,300 | 51,532 | |
| General Mills Inc. | 1,341,000 | 49,000 | |
| Wal-Mart Stores Inc. | 859,000 | 45,974 | |
| Kimberly-Clark Corp. | 704,388 | 45,821 | |
| Sysco Corp. | 1,446,800 | 41,263 | |
| Coca-Cola Co. | 443,082 | 25,929 | |
| Market | |||
| Value | |||
| Shares | ($000) | ||
| Lorillard Inc. | 303,900 | 24,406 | |
| Colgate-Palmolive Co. | 153,100 | 11,767 | |
| Hershey Co. | 202,900 | 9,656 | |
| Sara Lee Corp. | 717,200 | 9,632 | |
| ConAgra Foods Inc. | 423,700 | 9,296 | |
| Del Monte Foods Co. | 546,500 | 7,165 | |
| Herbalife Ltd. | 106,600 | 6,433 | |
| Ruddick Corp. | 134,700 | 4,671 | |
| Hormel Foods Corp. | 87,000 | 3,880 | |
| Nu Skin Enterprises Inc. | |||
| Class A | 132,000 | 3,802 | |
| 626,360 | |||
| Energy (11.0%) | |||
| Chevron Corp. | 1,999,300 | 162,043 | |
| Exxon Mobil Corp. | 1,801,600 | 111,321 | |
| ConocoPhillips | 1,457,200 | 83,687 | |
| Occidental | |||
| Petroleum Corp. | 611,400 | 47,873 | |
| Total SA ADR | 586,700 | 30,274 | |
| Marathon Oil Corp. | 888,500 | 29,409 | |
| Williams Cos. Inc. | 470,000 | 8,982 | |
| Southern Union Co. | 96,100 | 2,312 | |
| 475,901 | |||
| Exchange-Traded Fund (1.1%) | |||
| 2 | Vanguard Value ETF | 963,400 | 46,918 |
| Financials (12.0%) | |||
| JPMorgan Chase & Co. | 2,861,000 | 108,918 | |
| Marsh & McLennan | |||
| Cos. Inc. | 2,499,400 | 60,286 | |
| Chubb Corp. | 936,762 | 53,386 | |
| PNC Financial Services | |||
| Group Inc. | 893,382 | 46,375 | |
| ACE Ltd. | 737,500 | 42,959 | |
| Wells Fargo & Co. | 1,521,200 | 38,228 | |
| Toronto-Dominion Bank | 384,800 | 27,806 | |
| American Express Co. | 488,800 | 20,544 | |
13
Equity Income Fund
| Market | |||
| Value | |||
| Shares | ($000) | ||
| Credit Suisse Group | |||
| AG ADR | 412,900 | 17,573 | |
| Travelers Cos. Inc. | 288,200 | 15,015 | |
| National Bank of Canada | 227,000 | 14,325 | |
| M&T Bank Corp. | 121,900 | 9,973 | |
| Assurant Inc. | 232,100 | 9,447 | |
| New York Community | |||
| Bancorp Inc. | 568,200 | 9,233 | |
| Ameriprise Financial Inc. | 189,800 | 8,983 | |
| Hudson City Bancorp Inc. | 712,700 | 8,738 | |
| RenaissanceRe | |||
| Holdings Ltd. | 142,800 | 8,562 | |
| American Financial | |||
| Group Inc. | 198,600 | 6,073 | |
| Bank of Hawaii Corp. | 127,700 | 5,736 | |
| MetLife Inc. | 90,300 | 3,472 | |
| Endurance Specialty | |||
| Holdings Ltd. | 76,900 | 3,061 | |
| 518,693 | |||
| Health Care (11.5%) | |||
| Johnson & Johnson | 2,331,305 | 144,448 | |
| Pfizer Inc. | 6,914,067 | 118,715 | |
| Merck & Co. Inc. | 3,195,614 | 117,631 | |
| AstraZeneca PLC ADR | 664,600 | 33,695 | |
| Bristol-Myers Squibb Co. | 724,232 | 19,634 | |
| Eli Lilly & Co. | 493,949 | 18,044 | |
| Abbott Laboratories | 233,500 | 12,198 | |
| Medtronic Inc. | 357,400 | 12,001 | |
| Cardinal Health Inc. | 318,500 | 10,523 | |
| Hill-Rom Holdings Inc. | 200,501 | 7,196 | |
| 494,085 | |||
| Industrials (14.3%) | |||
| 3M Co. | 1,246,700 | 108,101 | |
| General Electric Co. | 6,516,672 | 105,896 | |
| Illinois Tool Works Inc. | 1,169,400 | 54,985 | |
| Waste Management Inc. | 1,516,500 | 54,200 | |
| Eaton Corp. | 624,300 | 51,499 | |
| Tyco International Ltd. | 1,078,700 | 39,621 | |
| Republic Services Inc. | |||
| Class A | 1,109,400 | 33,826 | |
| PACCAR Inc. | 440,400 | 21,205 | |
| United Technologies Corp. | 231,500 | 16,490 | |
| Deere & Co. | 215,400 | 15,031 | |
| United Parcel Service Inc. | |||
| Class B | 219,500 | 14,638 | |
| Schneider Electric SA | 106,234 | 13,496 | |
| Northrop Grumman Corp. | 210,613 | 12,769 | |
| Parker Hannifin Corp. | 153,500 | 10,754 | |
| Caterpillar Inc. | 134,600 | 10,590 | |
| Rockwell Automation Inc. | 168,000 | 10,371 | |
| Honeywell International Inc. | 234,262 | 10,293 | |
| Pitney Bowes Inc. | 370,500 | 7,921 | |
| RR Donnelley & Sons Co. | 402,310 | 6,823 | |
| Boeing Co. | 78,800 | 5,243 | |
| Emerson Electric Co. | 70,500 | 3,713 | |
| CSX Corp. | 54,900 | 3,037 | |
| Market | |||
| Value | |||
| Shares | ($000) | ||
| Lockheed Martin Corp. | 40,500 | 2,887 | |
| Deluxe Corp. | 100,500 | 1,923 | |
| Raytheon Co. | 38,000 | 1,737 | |
| 617,049 | |||
| Information Technology (8.2%) | |||
| Microsoft Corp. | 4,853,800 | 118,870 | |
| Intel Corp. | 4,086,600 | 78,585 | |
| Analog Devices Inc. | 1,889,400 | 59,289 | |
| Texas Instruments Inc. | 1,392,400 | 37,790 | |
| Maxim Integrated | |||
| Products Inc. | 1,467,606 | 27,165 | |
| Taiwan Semiconductor | |||
| Manufacturing Co. Ltd. | |||
| ADR | 1,592,300 | 16,146 | |
| Tyco Electronics Ltd. | 240,700 | 7,033 | |
| Xilinx Inc. | 149,000 | 3,965 | |
| Molex Inc. | 183,600 | 3,843 | |
| Earthlink Inc. | 246,100 | 2,237 | |
| 354,923 | |||
| Materials (4.4%) | |||
| Sherwin-Williams Co. | 659,100 | 49,525 | |
| EI du Pont de Nemours | |||
| & Co. | 1,012,427 | 45,174 | |
| PPG Industries Inc. | 473,600 | 34,478 | |
| Packaging Corp. | |||
| of America | 1,079,200 | 25,005 | |
| Lubrizol Corp. | 101,600 | 10,766 | |
| Eastman Chemical Co. | 139,900 | 10,353 | |
| Valspar Corp. | 223,000 | 7,102 | |
| Sonoco Products Co. | 168,800 | 5,645 | |
| Dow Chemical Co. | 13,100 | 360 | |
| 188,408 | |||
| Telecommunication Services (3.7%) | |||
| AT&T Inc. | 4,417,805 | 126,349 | |
| Verizon | |||
| Communications Inc. | 515,498 | 16,800 | |
| Frontier | |||
| Communications Corp. | 1,284,801 | 10,497 | |
| Qwest Communications | |||
| International Inc. | 435,724 | 2,732 | |
| Consolidated | |||
| Communications | |||
| Holdings Inc. | 80,000 | 1,494 | |
| 157,872 | |||
| Utilities (7.0%) | |||
| Xcel Energy Inc. | 1,439,500 | 33,065 | |
| Dominion Resources Inc. | 712,870 | 31,124 | |
| PG&E Corp. | 602,800 | 27,379 | |
| Entergy Corp. | 354,700 | 27,145 | |
| NextEra Energy Inc. | 460,966 | 25,072 | |
| UGI Corp. | 844,900 | 24,173 | |
| American Electric | |||
| Power Co. Inc. | 628,600 | 22,774 | |
| Northeast Utilities | 729,100 | 21,560 | |
| Exelon Corp. | 347,500 | 14,797 | |
14
Equity Income Fund
| Market | |||
| Value | |||
| Shares | ($000) | ||
| Public Service | |||
| Enterprise Group Inc. | 381,620 | 12,624 | |
| DTE Energy Co. | 217,700 | 9,999 | |
| NiSource Inc. | 558,100 | 9,711 | |
| Pinnacle West Capital Corp. | 232,400 | 9,591 | |
| Integrys Energy Group Inc. | 176,200 | 9,173 | |
| IDACORP Inc. | 218,100 | 7,834 | |
| Ameren Corp. | 237,000 | 6,731 | |
| Oneok Inc. | 125,671 | 5,660 | |
| Atmos Energy Corp. | 142,510 | 4,168 | |
| CenterPoint Energy Inc. | 44,700 | 703 | |
| Hawaiian Electric | |||
| Industries Inc. | 6,700 | 151 | |
| 303,434 | |||
| Total Common Stocks | |||
| (Cost $3,749,302) | 4,164,577 | ||
| Temporary Cash Investments (3.5%)1 | |||
| Money Market Fund (2.8%) | |||
| 3 | Vanguard Market Liquidity | ||
| Fund, 0.261% | 122,022,136 | 122,022 | |
| Face | Market | ||
| Amount | Value | ||
| ($000) | ($000) | ||
| Repurchase Agreement (0.5%) | |||
| Goldman Sachs & Co. | |||
| 0.250%, 10/4/10 | |||
| (Dated 9/30/10, | |||
| Repurchase Value | |||
| $19,600,000, | |||
| collateralized by | |||
| Government National | |||
| Mortgage Assn. | |||
| 6.000%, 12/15/39) | 19,600 | 19,600 | |
| U.S. Government and Agency Obligations (0.2%) | |||
| 4,5 | Fannie Mae Discount Notes, | ||
| 0.300%, 11/3/10 | 500 | 500 | |
| 4,5 | Fannie Mae Discount Notes, | ||
| 0.240%, 2/16/11 | 500 | 499 | |
| 4,5 | Freddie Mac Discount Notes, | ||
| 0.321%, 10/25/10 | 120 | 120 | |
| 4,5 | Freddie Mac Discount Notes, | ||
| 0.250%, 3/21/11 | 300 | 300 | |
| 4,5 | Freddie Mac Discount Notes, | ||
| 0.271%, 6/7/11 | 9,000 | 8,983 | |
| 4,5 | Freddie Mac Discount Notes, | ||
| 0.281%, 6/21/11 | 250 | 249 | |
| 10,651 | |||
| Total Temporary Cash Investments | |||
| (Cost $152,274) | 152,273 | ||
| Total Investments (100.0%) | |||
| (Cost $3,901,576) | 4,316,850 | ||
| Other Assets and Liabilities (0.0%) | |||
| Other Assets | 14,881 | ||
| Liabilities | (14,143) | ||
| 738 | |||
| Net Assets (100%) | 4,317,588 | ||
15
Equity Income Fund
| At September 30, 2010, net assets consisted of: | |
| Amount | |
| ($000) | |
| Paid-in Capital | 4,634,198 |
| Overdistributed Net Investment Income | (5,009) |
| Accumulated Net Realized Losses | (728,841) |
| Unrealized Appreciation (Depreciation) | |
| Investment Securities | 415,274 |
| Futures Contracts | 1,966 |
| Net Assets | 4,317,588 |
| Investor Shares—Net Assets | |
| Applicable to 140,776,733 outstanding | |
| $.001 par value shares of beneficial | |
| interest (unlimited authorization) | 2,650,993 |
| Net Asset Value Per Share— | |
| Investor Shares | $18.83 |
| Admiral Shares—Net Assets | |
| Applicable to 42,224,248 outstanding | |
| $.001 par value shares of beneficial | |
| interest (unlimited authorization) | 1,666,595 |
| Net Asset Value Per Share— | |
| Admiral Shares | $39.47 |
See Note A in Notes to Financial Statements.
1 The fund invests a portion of its cash reserves in equity markets through the use of index futures contracts. After giving effect to futures investments, the fund’s effective common stock and temporary cash investment positions represent 99.5% and 0.5%, respectively, of net assets.
2 Considered an affiliated company of the fund as the issuer is another member of The Vanguard Group.
3 Affiliated money market fund available only to Vanguard funds and certain trusts and accounts managed by Vanguard. Rate shown is the 7-day yield.
4 The issuer operates under a congressional charter; its securities are not backed by the full faith and credit of the U.S. government.
5 Securities with a value of $10,651,000 have been segregated as initial margin for open futures contracts.
ADR—American Depositary Receipt.
See accompanying Notes, which are an integral part of the Financial Statements.
16
Equity Income Fund
Statement of Operations
| Year Ended | ||
| September 30, 2010 | ||
| ($000) | ||
| Investment Income | ||
| Income | ||
| Dividends1,2 | 129,653 | |
| Interest2 | 240 | |
| Security Lending | 326 | |
| Total Income | 130,219 | |
| Expenses | ||
| Investment Advisory Fees—Note B | ||
| Basic Fee | 3,446 | |
| Performance Adjustment | 565 | |
| The Vanguard Group—Note C | ||
| Management and Administrative—Investor Shares | 4,604 | |
| Management and Administrative—Admiral Shares | 1,506 | |
| Marketing and Distribution—Investor Shares | 609 | |
| Marketing and Distribution—Admiral Shares | 315 | |
| Custodian Fees | 65 | |
| Auditing Fees | 28 | |
| Shareholders’ Reports—Investor Shares | 73 | |
| Shareholders’ Reports—Admiral Shares | 5 | |
| Trustees’ Fees and Expenses | 8 | |
| Total Expenses | 11,224 | |
| Net Investment Income | 118,995 | |
| Realized Net Gain (Loss) | ||
| Investment Securities Sold2 | 53,587 | |
| Futures Contracts | 5,118 | |
| Foreign Currencies | (16) | |
| Realized Net Gain (Loss) | 58,689 | |
| Change in Unrealized Appreciation (Depreciation) | ||
| Investment Securities | 261,011 | |
| Futures Contracts | 694 | |
| Change in Unrealized Appreciation (Depreciation) | 261,705 | |
| Net Increase (Decrease) in Net Assets Resulting from Operations | 439,389 | |
1 Dividends are net of foreign withholding taxes of $792,000.
2 Dividend income, interest income, and realized net gain (loss) from affiliated companies of the fund were $1,267,000, $167,000, and $0, respectively.
See accompanying Notes, which are an integral part of the Financial Statements.
17
Equity Income Fund
Statement of Changes in Net Assets
| Year Ended September 30, | |||
| 2010 | 2009 | ||
| ($000) | ($000) | ||
| Increase (Decrease) in Net Assets | |||
| Operations | |||
| Net Investment Income | 118,995 | 130,251 | |
| Realized Net Gain (Loss) | 58,689 | (770,444) | |
| Change in Unrealized Appreciation (Depreciation) | 261,705 | 223,473 | |
| Net Increase (Decrease) in Net Assets Resulting from Operations | 439,389 | (416,720) | |
| Distributions | |||
| Net Investment Income | |||
| Investor Shares | (72,980) | (79,799) | |
| Admiral Shares | (46,454) | (51,186) | |
| Realized Capital Gain | |||
| Investor Shares | — | (14,956) | |
| Admiral Shares | — | (9,460) | |
| Total Distributions | (119,434) | (155,401) | |
| Capital Share Transactions | |||
| Investor Shares | 29,451 | 136,361 | |
| Admiral Shares | 69,613 | (3,445) | |
| Net Increase (Decrease) from Capital Share Transactions | 99,064 | 132,916 | |
| Total Increase (Decrease) | 419,019 | (439,205) | |
| Net Assets | |||
| Beginning of Period | 3,898,569 | 4,337,774 | |
| End of Period1 | 4,317,588 | 3,898,569 | |
| 1 Net Assets—End of Period includes undistributed (overdistributed) net investment income of ($5,009,000) and ($4,554,000). | |||
See accompanying Notes, which are an integral part of the Financial Statements.
18
Equity Income Fund
Financial Highlights
| Investor Shares | ||||||
| For a Share Outstanding | Year Ended September 30, | |||||
| Throughout Each Period | 2010 | 2009 | 2008 | 2007 | 2006 | |
| Net Asset Value, Beginning of Period | $17.40 | $20.02 | $27.01 | $25.21 | $23.73 | |
| Investment Operations | ||||||
| Net Investment Income | .526 | .585 | .770 | .733 | .703 | |
| Net Realized and Unrealized Gain (Loss) | ||||||
| on Investments | 1.432 | (2.506) | (5.617) | 3.215 | 2.541 | |
| Total from Investment Operations | 1.958 | (1.921) | (4.847) | 3.948 | 3.244 | |
| Distributions | ||||||
| Dividends from Net Investment Income | (.528) | (.587) | (.785) | (.730) | (.710) | |
| Distributions from Realized Capital Gains | — | (.112) | (1.358) | (1.418) | (1.054) | |
| Total Distributions | (.528) | (.699) | (2.143) | (2.148) | (1.764) | |
| Net Asset Value, End of Period | $18.83 | $17.40 | $20.02 | $27.01 | $25.21 | |
| Total Return1 | 11.36% | -9.12% | -18.92% | 16.29% | 14.39% | |
| Ratios/Supplemental Data | ||||||
| Net Assets, End of Period (Millions) | $2,651 | $2,423 | $2,626 | $3,445 | $3,035 | |
| Ratio of Total Expenses to | ||||||
| Average Net Assets2 | 0.31% | 0.36% | 0.30% | 0.29% | 0.31% | |
| Ratio of Net Investment Income to | ||||||
| Average Net Assets | 2.88% | 3.76% | 3.30% | 2.79% | 2.94% | |
| Portfolio Turnover Rate | 45% | 51% | 55% | 51% | 26% | |
1 Total returns do not include account service fees that may have applied in the periods shown. Fund prospectuses provide information about any applicable account service fees.
2 Includes performance-based investment advisory fee increases (decreases) of 0.01%, 0.02%, 0.00%, 0.00%, and (0.01)%.
See accompanying Notes, which are an integral part of the Financial Statements.
19
Equity Income Fund
Financial Highlights
| Admiral Shares | ||||||
| For a Share Outstanding | Year Ended September 30, | |||||
| Throughout Each Period | 2010 | 2009 | 2008 | 2007 | 2006 | |
| Net Asset Value, Beginning of Period | $36.46 | $41.97 | $56.62 | $52.84 | $49.74 | |
| Investment Operations | ||||||
| Net Investment Income | 1.138 | 1.264 | 1.673 | 1.601 | 1.545 | |
| Net Realized and Unrealized Gain (Loss) | ||||||
| on Investments | 3.013 | (5.269) | (11.772) | 6.746 | 5.324 | |
| Total from Investment Operations | 4.151 | (4.005) | (10.099) | 8.347 | 6.869 | |
| Distributions | ||||||
| Dividends from Net Investment Income | (1.141) | (1.270) | (1.705) | (1.595) | (1.560) | |
| Distributions from Realized Capital Gains | — | (.235) | (2.846) | (2.972) | (2.209) | |
| Total Distributions | (1.141) | (1.505) | (4.551) | (4.567) | (3.769) | |
| Net Asset Value, End of Period | $39.47 | $36.46 | $41.97 | $56.62 | $52.84 | |
| Total Return | 11.50% | -9.05% | -18.82% | 16.44% | 14.55% | |
| Ratios/Supplemental Data | ||||||
| Net Assets, End of Period (Millions) | $1,667 | $1,475 | $1,711 | $2,256 | $1,783 | |
| Ratio of Total Expenses to | ||||||
| Average Net Assets1 | 0.22% | 0.24% | 0.18% | 0.17% | 0.17% | |
| Ratio of Net Investment Income to | ||||||
| Average Net Assets | 2.97% | 3.89% | 3.42% | 2.91% | 3.08% | |
| Portfolio Turnover Rate | 45% | 51% | 55% | 51% | 26% | |
1 Includes performance-based investment advisory fee increases (decreases) of 0.01%, 0.02%, 0.00%, 0.00%, and (0.01)%.
See accompanying Notes, which are an integral part of the Financial Statements.
20
Equity Income Fund
Notes to Financial Statements
Vanguard Equity Income Fund is registered under the Investment Company Act of 1940 as an open-end investment company, or mutual fund. The fund offers two classes of shares: Investor Shares and Admiral Shares. Investor Shares are available to any investor who meets the fund’s minimum purchase requirements. Admiral Shares are designed for investors who meet certain administrative, service, and account-size criteria.
A. The following significant accounting policies conform to generally accepted accounting principles for U.S. mutual funds. The fund consistently follows such policies in preparing its financial statements.
1. Security Valuation: Securities are valued as of the close of trading on the New York Stock Exchange (generally 4 p.m., Eastern time) on the valuation date. Equity securities are valued at the latest quoted sales prices or official closing prices taken from the primary market in which each security trades; such securities not traded on the valuation date are valued at the mean of the latest quoted bid and asked prices. Securities for which market quotations are not readily available, or whose values have been affected by events occurring before the fund’s pricing time but after the close of the securities’ primary markets, are valued at their fair values calculated according to procedures adopted by the board of trustees. These procedures include obtaining quotations from an independent pricing service, monitoring news to identify significant market- or security-specific events, and evaluating changes in the values of foreign market proxies (for example, ADRs, futures contracts, or exchange-traded funds), between the time the foreign markets close and the fund’s pricing time. When fair-value pricing is employed, the prices of securities used by a fund to calculate its net asset value may differ from quoted or published prices for the same securities. Investments in Vanguard Market Liquidity Fund are valued at that fund’s net asset value. Temporary cash investments acquired over 60 days to maturity are valued using the latest bid prices or using valuations based on a matrix system (which considers such factors as security prices, yields, maturities, and ratings), both as furnished by independent pricing services. Other temporary cash investments are valued at amortized cost, which approximates market value.
2. Foreign Currency: Securities and other assets and liabilities denominated in foreign currencies are translated into U.S. dollars using exchange rates obtained from an independent third party as of the fund’s pricing time on the valuation date. Realized gains (losses) and unrealized appreciation (depreciation) on investment securities include the effects of changes in exchange rates since the securities were purchased, combined with the effects of changes in security prices. Fluctuations in the value of other assets and liabilities resulting from changes in exchange rates are recorded as unrealized foreign currency gains (losses) until the assets or liabilities are settled in cash, at which time they are recorded as realized foreign currency gains (losses).
3. Futures Contracts: The fund uses index futures contracts to a limited extent, with the objective of maintaining full exposure to the stock market while maintaining liquidity. The fund may purchase or sell futures contracts to achieve a desired level of investment, whether to accommodate portfolio turnover or cash flows from capital share transactions. The primary risks associated with the use of futures contracts are imperfect correlation between changes in market values of stocks held by the fund and the prices of futures contracts, and the possibility of an illiquid market.
Futures contracts are valued at their quoted daily settlement prices. The aggregate principal amounts of the contracts are not recorded in the Statement of Net Assets. Fluctuations in the value of the contracts are recorded in the Statement of Net Assets as an asset (liability) and in the Statement of Operations as unrealized appreciation (depreciation) until the contracts are closed, when they are recorded as realized futures gains (losses).
21
Equity Income Fund
4. Repurchase Agreements: The fund may invest in repurchase agreements. Securities pledged as collateral for repurchase agreements are held by a custodian bank until the agreements mature. Each agreement requires that the market value of the collateral be sufficient to cover payments of interest and principal; however, in the event of default or bankruptcy by the other party to the agreement, retention of the collateral may be subject to legal proceedings.
5. Federal Income Taxes: The fund intends to continue to qualify as a regulated investment company and distribute all of its taxable income. Management has analyzed the fund’s tax positions taken for all open federal income tax years (September 30, 2007–2010), and has concluded that no provision for federal income tax is required in the fund’s financial statements.
6. Distributions: Distributions to shareholders are recorded on the ex-dividend date.
7. Security Lending: The fund may lend its securities to qualified institutional borrowers to earn additional income. Security loans are required to be secured at all times by collateral at least equal to the market value of securities loaned. The fund invests cash collateral received in Vanguard Market Liquidity Fund, and records a liability for the return of the collateral, during the period the securities are on loan. Security lending income represents fees charged to borrowers plus income earned on investing cash collateral, less expenses associated with the loan.
8. Other: Dividend income is recorded on the ex-dividend date. Interest income includes income distributions received from Vanguard Market Liquidity Fund and is accrued daily. Security transactions are accounted for on the date securities are bought or sold. Costs used to determine realized gains (losses) on the sale of investment securities are those of the specific securities sold.
Each class of shares has equal rights as to assets and earnings, except that each class separately bears certain class-specific expenses related to maintenance of shareholder accounts (included in Management and Administrative expenses) and shareholder reporting. Marketing and distribution expenses are allocated to each class of shares based on a method approved by the board of trustees. Income, other non-class-specific expenses, and gains and losses on investments are allocated to each class of shares based on its relative net assets.
B. Wellington Management Company, LLP, provides investment advisory services to a portion of the fund for a fee calculated at an annual percentage rate of average net assets managed by the advisor. The basic fee for Wellington Management Company, LLP, is subject to quarterly adjustments based on the fund’s performance for the preceding three years relative to the Lipper Equity Income Average for periods prior to April 1, 2008, and the FTSE High Dividend Yield Index beginning April 1, 2008. The benchmark change will be fully phased in by March 2011.
The Vanguard Group provides investment advisory services to a portion of the fund on an at-cost basis; the fund paid Vanguard advisory fees of $711,000 for the year ended September 30, 2010.
For the year ended September 30, 2010, the aggregate investment advisory fee represented an effective annual basic rate of 0.08% of the fund’s average net assets, before an increase of $565,000 (0.01%) based on performance.
C. The Vanguard Group furnishes at cost corporate management, administrative, marketing, and distribution services. The costs of such services are allocated to the fund under methods approved by the board of trustees. The fund has committed to provide up to 0.40% of its net assets in capital contributions to Vanguard. At September 30, 2010, the fund had contributed capital of $758,000 to Vanguard (included in Other Assets), representing 0.02% of the fund’s net assets and 0.30% of Vanguard’s capitalization. The fund’s trustees and officers are also directors and officers of Vanguard.
22
Equity Income Fund
D. Various inputs may be used to determine the value of the fund’s investments. These inputs are summarized in three broad levels for financial statement purposes. The inputs or methodologies used to value securities are not necessarily an indication of the risk associated with investing in those securities.
Level 1—Quoted prices in active markets for identical securities.
Level 2—Other significant observable inputs (including quoted prices for similar securities, interest rates, prepayment speeds, credit risk, etc.).
Level 3—Significant unobservable inputs (including the fund’s own assumptions used to determine the fair value of investments).
The following table summarizes the fund’s investments as of September 30, 2010, based on the inputs used to value them:
| Level 1 | Level 2 | Level 3 | |
| Investments | ($000) | ($000) | ($000) |
| Common Stocks | 4,151,081 | 13,496 | ---- |
| Temporary Cash Investments | 122,022 | 30,251 | ---- |
| Futures Contracts—Liabilities1 | (480) | ---- | ---- |
| Total | 4,272,623 | 43,747 | ---- |
| 1 Represents variation margin on the last day of the reporting period. |
E. At September 30, 2010, the aggregate settlement value of open futures contracts and the related unrealized appreciation (depreciation) were:
| ($000) | |||||
| Aggregate | |||||
| Number of | Settlement | Unrealized | |||
| Long (Short) | Value | Appreciation | |||
| Futures Contracts | Expiration | Contracts | Long (Short) | (Depreciation) | |
| S&P 500 Index | December 2010 | 357 | 101,450 | 1,840 | |
| E-mini S&P 500 Index | December 2010 | 493 | 28,020 | 126 | |
Unrealized appreciation (depreciation) on open futures contracts is required to be treated as realized gain (loss) for tax purposes.
F. Distributions are determined on a tax basis and may differ from net investment income and realized capital gains for financial reporting purposes. Differences may be permanent or temporary. Permanent differences are reclassified among capital accounts in the financial statements to reflect their tax character. Temporary differences arise when certain items of income, expense, gain, or loss are recognized in different periods for financial statement and tax purposes; these differences will reverse at some time in the future. Differences in classification may also result from the treatment of short-term gains as ordinary income for tax purposes.
During the year ended September 30, 2010, the fund realized net foreign currency losses of $16,000, which decreased distributable net income for tax purposes; accordingly, such losses have been reclassified from accumulated net realized losses to overdistributed net investment income.
23
Equity Income Fund
For tax purposes, at September 30, 2010, the fund had $3,520,000 of ordinary income available for distribution. The fund had available capital loss carryforwards totaling $696,667,000 to offset future net capital gains of $55,116,000 through September 30, 2017, and $641,551,000 through September 30, 2018. In addition, the fund realized losses of $30,227,000 during the period from November 1, 2009, through September 30, 2010, which are deferred and will be treated as realized for tax purposes in fiscal 2011.
At September 30, 2010, the cost of investment securities for tax purposes was $3,901,576,000. Net unrealized appreciation of investment securities for tax purposes was $415,274,000, consisting of unrealized gains of $597,832,000 on securities that had risen in value since their purchase and $182,558,000 in unrealized losses on securities that had fallen in value since their purchase.
G. During the year ended September 30, 2010, the fund purchased $1,815,659,000 of investment securities and sold $1,760,723,000 of investment securities, other than temporary cash investments.
H. Capital share transactions for each class of shares were:
| Year Ended September 30, | ||||||
| 2010 | 2009 | |||||
| Amount | Shares | Amount | Shares | |||
| ($000) | (000) | ($000) | (000) | |||
| Investor Shares | ||||||
| Issued | 438,771 | 23,942 | 571,703 | 37,049 | ||
| Issued in Lieu of Cash Distributions | 66,879 | 3,637 | 86,878 | 5,584 | ||
| Redeemed | (476,199) | (26,097) | (522,220) | (34,497) | ||
| Net Increase (Decrease)—Investor Shares | 29,451 | 1,482 | 136,361 | 8,136 | ||
| Admiral Shares | ||||||
| Issued | 303,119 | 7,894 | 297,028 | 9,259 | ||
| Issued in Lieu of Cash Distributions | 37,356 | 969 | 49,009 | 1,503 | ||
| Redeemed | (270,862) | (7,098) | (349,482) | (11,079) | ||
| Net Increase (Decrease)—Admiral Shares | 69,613 | 1,765 | (3,445) | (317) | ||
I. In preparing the financial statements as of September 30, 2010, management considered the impact of subsequent events for potential recognition or disclosure in these financial statements.
24
Report of Independent Registered Public Accounting Firm
To the Trustees of Vanguard Fenway Funds and the Shareholders of Vanguard Equity Income Fund:
In our opinion, the accompanying statement of net assets and the related statements of operations and of changes in net assets and the financial highlights present fairly, in all material respects, the financial position of Vanguard Equity Income Fund (constituting a separate portfolio of Vanguard Fenway Funds, hereafter referred to as the “Fund”) at September 30, 2010, the results of its operations for the year then ended, the changes in its net assets for each of the two years in the period then ended and the financial highlights for each of the five years in the period then ended, in conformity with accounting principles generally accepted in the United States of America. These financial statements and financial highlights (hereafter referred to as “financial statements”) are the responsibility of the Fund’s management; our responsibility is to express an opinion on these financial statements based on our audits. We conducted our audits of these financial statements in accordance with the standards of the Public Company Accounting Oversight Board (United States). Those standards require that we plan and perform the audit to obtain reasonable assurance about whether the financial statements are free of material misstatement. An audit includes examining, on a test basis, evidence supporting the amounts and disclosures in the financial statements, assessing the accounting principles used and significant estimates made by management, and evaluating the overall financial statement presentation. We believe that our audits, which included confirmation of securities at September 30, 2010 by correspondence with the custodians and brokers and by agreement to the underlying ownership records of Vanguard Market Liquidity Fund, provide a reasonable basis for our opinion.
PricewaterhouseCoopers LLP
Philadelphia, Pennsylvania
November 8, 2010

Special 2010 tax information (unaudited) for Vanguard Equity Income Fund
This information for the fiscal year ended September 30, 2010, is included pursuant to provisions of the
Internal Revenue Code.
The fund distributed $119,434,000 of qualified dividend income to shareholders during the fiscal year.
For corporate shareholders, 100.0% of investment income (dividend income plus short-term gains,
if any) qualifies for the dividends-received deduction.
25
Your Fund’s After-Tax Returns
This table presents returns for your fund both before and after taxes. The after-tax returns are shown in two ways: (1) assuming that an investor owned the fund during the entire period and paid taxes on the fund’s distributions, and (2) assuming that an investor paid taxes on the fund’s distributions and sold all shares at the end of each period.
Calculations are based on the highest individual federal income tax and capital gains tax rates in effect at the times of the distributions and the hypothetical sales. State and local taxes were not considered. After-tax returns reflect any qualified dividend income , using actual prior-year figures and estimates for 2010. (In the example, returns after the sale of fund shares may be higher than those assuming no sale. This occurs when the sale would have produced a capital loss. The calculation assumes that the investor received a tax deduction for the loss.)
The table shows returns for Investor Shares only; returns for other share classes will differ. Please note that your actual after-tax returns will depend on your tax situation and may differ from those shown. Also note that if you own the fund in a tax-deferred account, such as an individual retirement account or a 401(k) plan, this information does not apply to you. Such accounts are not subject to current taxes.
Finally, keep in mind that a fund’s performance—whether before or after taxes—does not guarantee future results.
Average Annual Total Returns: Equity Income Fund Investor Shares
Periods Ended September 30, 2010
| One | Five | Ten | |
| Year | Years | Years | |
| Returns Before Taxes | 11.36% | 1.77% | 3.52% |
| Returns After Taxes on Distributions | 10.88 | 0.75 | 2.39 |
| Returns After Taxes on Distributions and Sale of Fund Shares | 7.99 | 1.46 | 2.76 |
26
About Your Fund’s Expenses
As a shareholder of the fund, you incur ongoing costs, which include costs for portfolio management, administrative services, and shareholder reports (like this one), among others. Operating expenses, which are deducted from a fund’s gross income, directly reduce the investment return of the fund.
A fund’s expenses are expressed as a percentage of its average net assets. This figure is known as the expense ratio. The following examples are intended to help you understand the ongoing costs (in dollars) of investing in your fund and to compare these costs with those of other mutual funds. The examples are based on an investment of $1,000 made at the beginning of the period shown and held for the entire period.
The accompanying table illustrates your fund’s costs in two ways:
• Based on actual fund return. This section helps you to estimate the actual expenses that you paid over the period. The ”Ending Account Value“ shown is derived from the fund‘s actual return, and the third column shows the dollar amount that would have been paid by an investor who started with $1,000 in the fund. You may use the information here, together with the amount you invested, to estimate the expenses that you paid over the period.
To do so, simply divide your account value by $1,000 (for example, an $8,600 account value divided by $1,000 = 8.6), then multiply the result by the number given for your fund under the heading ”Expenses Paid During Period.“
• Based on hypothetical 5% yearly return. This section is intended to help you compare your fund‘s costs with those of other mutual funds. It assumes that the fund had a yearly return of 5% before expenses, but that the expense ratio is unchanged. In this case—because the return used is not the fund’s actual return—the results do not apply to your investment. The example is useful in making comparisons because the Securities and Exchange Commission requires all mutual funds to calculate expenses based on a 5% return. You can assess your fund’s costs by comparing this hypothetical example with the hypothetical examples that appear in shareholder reports of other funds.
Note that the expenses shown in the table are meant to highlight and help you compare ongoing costs only and do not reflect transaction costs incurred by the fund for buying and selling securities. Further, the expenses do not include the account service fee described in the prospectus. If such a fee were applied to your account, your costs would be higher. Your fund does not charge transaction fees, such as purchase or redemption fees, nor does it carry a “sales load.”
The calculations assume no shares were bought or sold during the period. Your actual costs may have been higher or lower, depending on the amount of your investment and the timing of any purchases or redemptions.
You can find more information about the fund’s expenses, including annual expense ratios, in the Financial Statements section of this report. For additional information on operating expenses and other shareholder costs, please refer to your fund’s current prospectus.
27
| Six Months Ended September 30, 2010 | |||
| Beginning | Ending | Expenses | |
| Account Value | Account Value | Paid During | |
| Equity Income Fund | 3/31/2010 | 9/30/2010 | Period |
| Based on Actual Fund Return | |||
| Investor Shares | $1,000.00 | $1,007.70 | $1.36 |
| Admiral Shares | 1,000.00 | 1,008.00 | 1.11 |
| Based on Hypothetical 5% Yearly Return | |||
| Investor Shares | $1,000.00 | $1,023.71 | $1.37 |
| Admiral Shares | 1,000.00 | 1,023.97 | 1.12 |
The calculations are based on expenses incurred in the most recent six-month period. The fund’s annualized six-month expense ratios for that period are 0.27% for Investor Shares and 0.22% for Admiral Shares. The dollar amounts shown as “Expenses Paid” are equal to the annualized expense ratio multiplied by the average account value over the period, multiplied by the number of days in the most recent six-month period, then divided by the number of days in the most recent 12-month period.
28
Glossary
30-Day SEC Yield. A fund’s 30-day SEC yield is derived using a formula specified by the U.S. Securities and Exchange Commission. Under the formula, data related to the fund’s security holdings in the previous 30 days are used to calculate the fund’s hypothetical net income for that period, which is then annualized and divided by the fund’s estimated average net assets over the calculation period. For the purposes of this calculation, a security’s income is based on its current market yield to maturity (in the case of bonds) or its projected dividend yield (for stocks). Because the SEC yield represents hypothetical annualized income, it will differ—at times significantly—from the fund’s actual experience. As a result, the fund’s income distributions may be higher or lower than implied by the SEC yield.
Beta. A measure of the magnitude of a fund’s past share-price fluctuations in relation to the ups and downs of a given market index. The index is assigned a beta of 1.00. Compared with a given index, a fund with a beta of 1.20 typically would have seen its share price rise or fall by 12% when the index rose or fell by 10%. For this report, beta is based on returns over the past 36 months for both the fund and the index. Note that a fund’s beta should be reviewed in conjunction with its R-squared (see definition). The lower the R-squared, the less correlation there is between the fund and the index, and the less reliable beta is as an indicator of volatility.
Dividend Yield. Dividend income earned by stocks, expressed as a percentage of the aggregate market value (or of net asset value, for a fund). The yield is determined by dividing the amount of the annual dividends by the aggregate value (or net asset value) at the end of the period. For a fund, the dividend yield is based solely on stock holdings and does not include any income produced by other investments.
Earnings Growth Rate. The average annual rate of growth in earnings over the past five years for the stocks now in a fund.
Equity Exposure. A measure that reflects a fund’s investments in stocks and stock futures. Any holdings in short-term reserves are excluded.
Expense Ratio. The percentage of a fund’s average net assets used to pay its annual administrative and advisory expenses. These expenses directly reduce returns to investors.
Foreign Holdings. The percentage of a fund represented by stocks or depositary receipts of companies based outside the United States.
Inception Date. The date on which the assets of a fund (or one of its share classes) are first invested in accordance with the fund’s investment objective. For funds with a subscription period, the inception date is the day after that period ends. Investment performance is measured from the inception date.
Median Market Cap. An indicator of the size of companies in which a fund invests; the midpoint of market capitalization (market price x shares outstanding) of a fund’s stocks, weighted by the proportion of the fund’s assets invested in each stock. Stocks representing half of the fund’s assets have market capitalizations above the median, and the rest are below it.
Price/Book Ratio. The share price of a stock divided by its net worth, or book value, per share. For a fund, the weighted average price/book ratio of the stocks it holds.
29
Price/Earnings Ratio. The ratio of a stock’s current price to its per-share earnings over the past year. For a fund, the weighted average P/E of the stocks it holds. P/E is an indicator of market expectations about corporate prospects; the higher the P/E, the greater the expectations for a company’s future growth.
R-Squared. A measure of how much of a fund’s past returns can be explained by the returns from the market in general, as measured by a given index. If a fund’s total returns were precisely synchronized with an index’s returns, its R-squared would be 1.00. If the fund’s returns bore no relationship to the index’s returns, its R-squared would be 0. For this report, R-squared is based on returns over the past 36 months for both the fund and the index.
Return on Equity. The annual average rate of return generated by a company during the past five years for each dollar of shareholder’s equity (net income divided by shareholder’s equity). For a fund, the weighted average return on equity for the companies whose stocks it holds.
Short-Term Reserves. The percentage of a fund invested in highly liquid, short-term securities that can be readily converted to cash.
Turnover Rate. An indication of the fund’s trading activity. Funds with high turnover rates incur higher transaction costs and may be more likely to distribute capital gains (which may be taxable to investors). The turnover rate excludes in-kind transactions, which have minimal impact on costs.
30
This page intentionally left blank.
The People Who Govern Your Fund
The trustees of your mutual fund are there to see that the fund is operated and managed in your best interests since, as a shareholder, you are a part owner of the fund. Your fund’s trustees also serve on the board of directors of The Vanguard Group, Inc., which is owned by the Vanguard funds and provides services to them on an at-cost basis.
A majority of Vanguard’s board members are independent, meaning that they have no affiliation with Vanguard or the funds they oversee, apart from the sizable personal investments they have made as private individuals. The independent board members have distinguished backgrounds in business, academia, and public service. Each of the trustees and executive officers oversees 178 Vanguard funds.
The following table provides information for each trustee and executive officer of the fund. More information about the trustees is in the Statement of Additional Information, which can be obtained, without charge, by contacting Vanguard at 800-662-7447, or online at Vanguard.com.
| Interested Trustee1 | Amy Gutmann |
| Born 1949. Trustee Since June 2006. Principal | |
| F. William McNabb III | Occupation(s) During the Past Five Years: President |
| Born 1957. Trustee Since July 2009. Chairman of the | of the University of Pennsylvania; Christopher H. |
| Board. Principal Occupation(s) During the Past Five | Browne Distinguished Professor of Political Science |
| Years: Chairman of the Board of The Vanguard Group, | in the School of Arts and Sciences with secondary |
| Inc., and of each of the investment companies served | appointments at the Annenberg School for Commu- |
| by The Vanguard Group, since January 2010; Director | nication and the Graduate School of Education |
| of The Vanguard Group since 2008; Chief Executive | of the University of Pennsylvania; Director of |
| Officer and President of The Vanguard Group and of | Carnegie Corporation of New York, Schuylkill River |
| each of the investment companies served by The | Development Corporation, and Greater Philadelphia |
| Vanguard Group since 2008; Director of Vanguard | Chamber of Commerce; Trustee of the National |
| Marketing Corporation; Managing Director of The | Constitution Center; Chair of the Presidential |
| Vanguard Group (1995–2008) . | Commission for the Study of Bioethical Issues. |
| JoAnn Heffernan Heisen | |
| Independent Trustees | Born 1950. Trustee Since July 1998. Principal |
| Occupation(s) During the Past Five Years: Corporate | |
| Emerson U. Fullwood | Vice President and Chief Global Diversity Officer |
| Born 1948. Trustee Since January 2008. Principal | since 2006 (retired 2008) and Member of the |
| Occupation(s) During the Past Five Years: Executive | Executive Committee (retired 2008) of Johnson & |
| Chief Staff and Marketing Officer for North America | Johnson (pharmaceuticals/consumer products); Vice |
| and Corporate Vice President (retired 2008) of Xerox | President and Chief Information Officer of Johnson & |
| Corporation (document management products and | Johnson (1997–2005); Director of the University |
| services); Director of SPX Corporation (multi-industry | Medical Center at Princeton and Women’s Research |
| manufacturing), the United Way of Rochester, | and Education Institute; Member of the Advisory |
| Amerigroup Corporation (managed health care), | Board of the Maxwell School of Citizenship and Public |
| the University of Rochester Medical Center, and | Affairs at Syracuse University. |
| Monroe Community College Foundation. | |
| F. Joseph Loughrey | |
| Rajiv L. Gupta | Born 1949. Trustee Since October 2009. Principal |
| Born 1945. Trustee Since December 2001.2 | Occupation(s) During the Past Five Years: President |
| Principal Occupation(s) During the Past Five Years: | and Chief Operating Officer since 2005 (retired 2009) |
| Chairman and Chief Executive Officer (retired 2009) | and Vice Chairman of the Board (2008–2009) of |
| and President (2006–2008) of Rohm and Haas Co. | Cummins Inc. (industrial machinery); Director of |
| (chemicals); Director of Tyco International, Ltd. | SKF AB (industrial machinery), Hillenbrand, Inc. |
| (diversified manufacturing and services) and Hewlett- | (specialized consumer services), Sauer-Danfoss Inc. |
| Packard Co. (electronic computer manufacturing); | (machinery), the Lumina Foundation for Education, |
| Trustee of The Conference Board; Member of the | and Oxfam America; Chairman of the Advisory |
| Board of Managers of Delphi Automotive LLP | Council for the College of Arts and Letters at the |
| (automotive components) . | University of Notre Dame. |
| André F. Perold | Kathryn J. Hyatt | |
| Born 1952. Trustee Since December 2004. Principal | Born 1955. Treasurer Since November 2008. Principal | |
| Occupation(s) During the Past Five Years: George | Occupation(s) During the Past Five Years: Principal | |
| Gund Professor of Finance and Banking at the Harvard | of The Vanguard Group, Inc.; Treasurer of each of | |
| Business School; Chair of the Investment Committee | the investment companies served by The Vanguard | |
| of HighVista Strategies LLC (private investment firm) . | Group since 2008; Assistant Treasurer of each of the | |
| investment companies served by The Vanguard Group | ||
| Alfred M. Rankin, Jr. | (1988–2008) . | |
| Born 1941. Trustee Since January 1993. Principal | ||
| Occupation(s) During the Past Five Years: Chairman, | Heidi Stam | |
| President, and Chief Executive Officer of NACCO | Born 1956. Secretary Since July 2005. Principal | |
| Industries, Inc. (forklift trucks/housewares/lignite); | Occupation(s) During the Past Five Years: Managing | |
| Director of Goodrich Corporation (industrial products/ | Director of The Vanguard Group, Inc., since 2006; | |
| aircraft systems and services); Chairman of the | General Counsel of The Vanguard Group since 2005; | |
| Federal Reserve Bank of Cleveland; Trustee of The | Secretary of The Vanguard Group and of each of the | |
| Cleveland Museum of Art. | investment companies served by The Vanguard Group | |
| since 2005; Director and Senior Vice President of | ||
| Peter F. Volanakis | Vanguard Marketing Corporation since 2005; | |
| Born 1955. Trustee Since July 2009. Principal | Principal of The Vanguard Group (1997–2006). | |
| Occupation(s) During the Past Five Years: President | ||
| since 2007 and Chief Operating Officer since 2005 | ||
| of Corning Incorporated (communications equipment); | Vanguard Senior Management Team | |
| President of Corning Technologies (2001–2005); | ||
| Director of Corning Incorporated and Dow Corning; | R. Gregory Barton | Michael S. Miller |
| Trustee of the Corning Incorporated Foundation and | Mortimer J. Buckley | James M. Norris |
| the Corning Museum of Glass; Overseer of the | Kathleen C. Gubanich | Glenn W. Reed |
| Amos Tuck School of Business Administration at | Paul A. Heller | George U. Sauter |
| Dartmouth College. | ||
| Chairman Emeritus and Senior Advisor | ||
| Executive Officers | ||
| John J. Brennan | ||
| Glenn Booraem | Chairman, 1996–2009 | |
| Born 1967. Controller Since July 2010. Principal | Chief Executive Officer and President, 1996–2008 | |
| Occupation(s) During the Past Five Years: Principal | ||
| of The Vanguard Group, Inc.; Controller of each of | ||
| the investment companies served by The Vanguard | Founder | |
| Group since 2010; Assistant Controller of each of | ||
| the investment companies served by The Vanguard | John C. Bogle | |
| Group (2001–2010) . | Chairman and Chief Executive Officer, 1974–1996 | |
| Thomas J. Higgins | ||
| Born 1957. Chief Financial Officer Since September | ||
| 2008. Principal Occupation(s) During the Past Five | ||
| Years: Principal of The Vanguard Group, Inc.; Chief | ||
| Financial Officer of each of the investment companies | ||
| served by The Vanguard Group since 2008; Treasurer | ||
| of each of the investment companies served by The | ||
| Vanguard Group (1998–2008) . | ||
1 Mr. McNabb is considered an “interested person,” as defined in the Investment Company Act of 1940, because he is an officer of the Vanguard funds.
2 December 2002 for Vanguard Equity Income Fund, Vanguard Growth Equity Fund, the Vanguard Municipal Bond Funds, and the Vanguard State Tax-Exempt Funds.
 | |
| P.O. Box 2600 | |
| Valley Forge, PA 19482-2600 |
Connect with Vanguard® > Vanguard.com
| Fund Information > 800-662-7447 | CFA® is a trademark owned by CFA Institute. |
| Direct Investor Account Services > 800-662-2739 | |
| Institutional Investor Services > 800-523-1036 | |
| Text Telephone for People | |
| With Hearing Impairment > 800-749-7273 | |
| This material may be used in conjunction | |
| with the offering of shares of any Vanguard | |
| fund only if preceded or accompanied by | |
| the fund’s current prospectus. | |
| All comparative mutual fund data are from Lipper Inc. or | |
| Morningstar, Inc., unless otherwise noted. | |
| You can obtain a free copy of Vanguard’s proxy voting | |
| guidelines by visiting vanguard.com/proxyreporting or by | |
| calling Vanguard at 800-662-2739. The guidelines are | |
| also available from the SEC’s website, sec.gov. In | |
| addition, you may obtain a free report on how your fund | |
| voted the proxies for securities it owned during the 12 | |
| months ended June 30. To get the report, visit either | |
| vanguard.com/proxyreporting or sec.gov. | |
| You can review and copy information about your fund at | |
| the SEC’s Public Reference Room in Washington, D.C. To | |
| find out more about this public service, call the SEC at | |
| 202-551-8090. Information about your fund is also | |
| available on the SEC’s website, and you can receive | |
| copies of this information, for a fee, by sending a | |
| request in either of two ways: via e-mail addressed to | |
| publicinfo@sec.gov or via regular mail addressed to the | |
| Public Reference Section, Securities and Exchange | |
| Commission, Washington, DC 20549-1520. | |
| © 2010 The Vanguard Group, Inc. | |
| All rights reserved. | |
| Vanguard Marketing Corporation, Distributor. | |
| Q650 112010 | |
| Vanguard Growth Equity Fund |
| Annual Report |
| September 30, 2010 |
 |
> For the fiscal year ended September 30, 2010, Vanguard Growth Equity Fund returned 14.54%.
> The fund’s return outpaced that of its benchmark, the Russell 1000 Growth Index, as well as the average return of large-capitalization growth funds.
> Astute stock selection in information technology, consumer discretionary, and health care stocks boosted the fund’s performance.
| Contents | |
| Your Fund’s Total Returns. | 1 |
| Chairman’s Letter. | 2 |
| Advisors’ Report. | 8 |
| Fund Profile. | 11 |
| Performance Summary. | 12 |
| Financial Statements. | 13 |
| Your Fund’s After-Tax Returns. | 23 |
| About Your Fund’s Expenses. | 24 |
| Glossary. | 26 |
Please note: The opinions expressed in this report are just that—informed opinions. They should not be considered promises or advice. Also, please keep in mind that the information and opinions cover the period through the date on the front of this report. Of course, the risks of investing in your fund are spelled out in the prospectus.
See the Glossary for definitions of investment terms used in this report.
Cover photograph: Jean Maher.
Your Fund’s Total Returns
| Fiscal Year Ended September 30, 2010 | |
| Total | |
| Returns | |
| Vanguard Growth Equity Fund | 14.54% |
| Russell 1000 Growth Index | 12.65 |
| Large-Cap Growth Funds Average | 10.23 |
| Large-Cap Growth Funds Average: Derived from data provided by Lipper Inc. |
Your Fund’s Performance at a Glance
September 30, 2009, Through September 30, 2010
| Distributions Per Share | ||||
| Starting | Ending | Income | Capital | |
| Share Price | Share Price | Dividends | Gains | |
| Vanguard Growth Equity Fund | $8.60 | $9.77 | $0.075 | $0.000 |
1

Chairman’s Letter
Dear Shareholder,
Vanguard Growth Equity Fund returned 14.54% for the 12 months ended September 30, 2010, an encouraging turnaround for a fund that, for each of the two previous years, endured negative results and trailed its benchmark, the Russell 1000 Growth Index. The fund’s return for the 2010 fiscal year surpassed that of the benchmark by nearly 2 percentage points, and beat the average return of large-cap growth funds by more than 4 percentage points.
The fund’s success reflected both improvements in the stock market over the past year and superior stock selections by the fund’s two advisors. The fund benefited most from outstanding picks in the information technology sector.
If you own shares of the fund in a taxable account, you may wish to review our report on the fund’s after-tax returns on page 23.
An upbeat end to a worrisome 12 months
Although global stock markets traced a ragged trajectory, they ultimately gained ground for the 12 months ended September 30. Europe’s sovereign debt crisis and a dispiriting lack of vigor in the U.S. economy weighed on stock prices through the spring and summer. In September, however, investor sentiment perked up, buoyed by continued signs of strength in corporate financial statements. The broad U.S. stock market rallied to
2
close the 12-month period with a return of more than 11%. Small-capitalization stocks finished a few steps ahead of their large-cap counterparts.
International stock markets were a mixed bag: middling returns in Europe, stagnation in the Pacific region’s developed markets, and a return of more than 20% from emerging markets. The combined result, as measured by the MSCI All Country World Index ex USA, was a 12-month return of 8%.
Bond prices rallied, driving yields to surprising lows
Bonds produced strong 12-month returns, a gratifying performance that neverthelessraises questions about the prospects for total returns in a fixed income market where yields hover near all-time lows. At the start of the period, the 10-year U.S. Treasury note yielded 3.31%; at the end of the period, the figure was 2.51% as investors bid up bond prices. As yields move lower, of course, the scope for continued declines—and the attendant rise in prices—diminishes. Corporate bonds performed best for the 12 months. Municipal bonds delivered solid, but more modest, returns.
As has been the case for almost two years now, the yields of money market securities remained near 0%, a consequence of the Federal Reserve Board’s efforts to stimulate the economy by keeping a tight lid on borrowing costs.
| Market Barometer | |||
| Average Annual Total Returns | |||
| Periods Ended September 30, 2010 | |||
| One | Three | Five | |
| Year | Years | Years | |
| Stocks | |||
| Russell 1000 Index (Large-caps) | 10.75% | -6.79% | 0.86% |
| Russell 2000 Index (Small-caps) | 13.35 | -4.29 | 1.60 |
| Dow Jones U.S. Total Stock Market Index | 11.51 | -6.12 | 1.37 |
| MSCI All Country World Index ex USA (International) | 8.00 | -6.98 | 4.72 |
| Bonds | |||
| Barclays Capital U.S. Aggregate Bond Index (Broad | |||
| taxable market) | 8.16% | 7.42% | 6.20% |
| Barclays Capital Municipal Bond Index (Broad | |||
| tax-exempt market) | 5.81 | 6.04 | 5.13 |
| Citigroup Three-Month U.S. Treasury Bill Index | 0.12 | 1.01 | 2.47 |
| CPI | |||
| Consumer Price Index | 1.14% | 1.57% | 1.90% |
3
IT stocks bolstered the fund’s results
For the fiscal year ended September 30, 2010, Vanguard Growth Equity Fund handily outpaced its benchmark, the Russell 1000 Growth Index.
The Growth Equity Fund benefited from the strong performance of high-quality growth stocks during the period. Unlike the equity rally of 2009—which was driven substantially by riskier stocks with shaky financials—the rebound over the past year was broad enough to include companies more aligned with the fund’s preferences: the stocks of companies with enduring competitive advantages and strong earnings-growth potential.
The Growth Equity Fund’s success stemmed in large part from the advisors’ selection among information technology stocks. Representing a little less than one-third of the fund’s portfolio, on average, IT stocks contributed close to 40% of its return. Standout performers relative to the benchmark index included software firm VMware (+103%), communications equipment maker F5 Networks (+98%), and Chinese search engine Baidu (+162%). The fund’s heavy weightings in some of the best-performing tech stocks helped it to almost double the return of the index’s tech sector.
Other sectors in the fund that outperformed their respective index sectors included consumer discretionary
Expense Ratios
Your Fund Compared With Its Peer Group
| Peer Group | ||
| Fund | Average | |
| Growth Equity Fund | 0.51% | 1.37% |
The fund expense ratio shown is from the prospectus dated January 28, 2010, and represents estimated costs for the current fiscal year. For the fiscal year ended September 30, 2010, the fund’s expense ratio was 0.51%. The peer-group expense ratio is derived from data provided by Lipper Inc. and captures information through year-end 2009.
Peer group: Large-Cap Growth Funds.
4
and health care. In consumer discretionary, the fund’s sizable holdings in a select number of stocks across a variety of industries boosted the fund’s relative performance. Household names such as Amazon.com (+68%), Home Depot (+23%), and Walt Disney (+22%) were among the fund’s best performers. The fund also steered clear of some of the sector’s worst performers, including educational-services companies whose business practices have recently come under increased federal scrutiny.
In health care, the fund’s equipment and supplies holdings and pharmaceutical stocks produced strong results. The star performer for the fund’s sector was heart-valve maker Edwards Lifesciences (+92%). Relative performance also got a boost from the fund’s large holdings in pharmaceutical giant Bristol-Meyers Squibb (+26%) and Illumina (+50%), a maker of DNA analysis equipment.
The fund’s weakest spot versus the benchmark index was the consumer staples sector. Although both the fund and benchmark sector weightings exceeded 10% of assets, the index sector’s return was almost twice that of the fund sector’s. Supermarkets and drug stores were major detractors for the fund, with drugstore giant Walgreen (–9%) declining the most, as it faced increased competition and potentially smaller margins from its drug sales.
Total Returns
Ten Years Ended September 30, 2010
| Average | |
| Annual Return | |
| Growth Equity Fund | -6.05% |
| Russell 1000 Growth Index | -3.44 |
| Large-Cap Growth Funds Average | -4.35 |
| Large-Cap Growth Funds Average: Derived from data provided by Lipper Inc. |
The figures shown represent past performance, which is not a guarantee of future results. (Current performance may be lower or higher than the performance data cited. For performance data current to the most recent month-end, visit our website at vanguard.com/performance.) Note, too, that both investment returns and principal value can fluctuate widely, so an investor’s shares, when sold, could be worth more or less than their original cost.
5
For more about your fund’s strategy and the advisors’ outlook, please see the Advisors’ Report following this letter.
Periods of weakness cast shadow on long-term record
Vanguard Growth Equity Fund’s return for the past fiscal year, while impressive, wasn’t enough to make up for its losses over the previous two years. As you consider the fund’s longer-term record, it’s important to remember that it includes two severe market downturns—first, the collapse of the tech bubble earlier in the decade, and second, the recent financial crisis. Together, these two events have significantly dampened some of the strength in the fund’s longer-term record.
Even so, we are disappointed in Vanguard Growth Equity Fund’s –6.05% average annual return for the past ten years. The fund’s return for that period lagged the return of its benchmark index (–3.44%) and the average return of its large-cap growth peer funds (–4.35%).
Although the fund’s past performance may provide some insight into its prospects for future success, such historical analysis isn’t as helpful as it might be, given how the fund might perform in different environments and, more important, the fund’s new management structure. As you may recall, the fund recently changed its advisory arrangement, hiring Jennison Associates LLC and Baillie Gifford Overseas Ltd. over the past two years.
Despite the fund’s poor ten-year record, we remain confident in its prospects. The fund’s advisors have distinguished themselves as excellent growth managers. Their efforts to deliver superior performance are also aided by the fund’s low costs.
Diversification and long-term focus can help combat uncertainty
The stock market’s volatility over the past couple of years has been frustrating for even die-hard investors.
Although the fund’s 2010 fiscal year ended on a high note, it’s impossible to predict the market’s direction down the road. As seasoned investors understand, coping with the stock market’s ups and downs is an integral part of investing. And as you know, to reap the potential rewards of your investment, you must embrace risk.
Our experience suggests that an effective way to cope with market uncertainty is for investors to focus on the long term and build a diversified, well-balanced portfolio.
6
A balanced portfolio with a mix of stock, bond, and short-term investments can help protect your assets from the markets’ worst outcomes while giving you the opportunity to participate in the best.
Vanguard Growth Equity Fund, with its low costs and talented advisory teams, can play an important supporting role in such a balanced portfolio.
Thank you for entrusting your assets to Vanguard.
Sincerely,

F. William McNabb III
Chairman and Chief Executive Officer
October 15, 2010
7
Advisors’ Report
For the fiscal year ended September 30, 2010, Vanguard Growth Equity Fund returned 14.54%.Your fund is managed by two independent advisors, a strategy that enhances the fund’s diversification by providing exposure to distinct, yet complementary, investment approaches. It’s not uncommon for different advisors to have different views about individual securities or the broader investment environment. The advisors, the percentage of fund assets each manages, and brief descriptions of their investment strategies are presented in the table below. The advisors have also prepared a discussion of the investment environment that existed during the fiscal year and of how portfolio positioning reflects this assessment. These comments were prepared on October 20, 2010.
Baillie Gifford Overseas Ltd.
Portfolio Manager:
Mick Brewis, Partner and Head of North American Investment Team
For much of the fund’s past fiscal year the U.S. economy seemed to be recovering well, driven by stimulatory monetary and fiscal policies and a corporate sector that
Vanguard Growth Equity Fund Investment Advisors
| Fund Assets Managed | |||
| Investment Advisor | % | $ Million | Investment Strategy |
| Baillie Gifford Overseas Ltd. | 50 | 299 | Uses a fundamental approach to identify quality growth |
| companies. The firm considers the sustainability of | |||
| earnings growth to be a critical factor in evaluating a | |||
| company’s prospects. The firm looks for companies | |||
| with attractive industry backgrounds, strong | |||
| competitive positions within those industries, | |||
| high-quality earnings, and a favorable attitude toward | |||
| shareholders. | |||
| Jennison Associates LLC | 46 | 277 | Uses a research-driven, fundamental investment |
| approach that relies on in-depth company knowledge | |||
| gleaned through meetings with management, | |||
| customers, and suppliers. | |||
| Cash Investments | 4 | 21 | These short-term reserves are invested by Vanguard in |
| equity index products to simulate investment in stocks. | |||
| Each advisor also may maintain a modest cash | |||
| position. | |||
8
was doing an impressive job of restoring its profitability and cash generation through timely cost cutting. An upturn in the inventory cycle and healthy global growth also contributed. However, in recent months it has become apparent that the upturn in employment was not strong enough to restore consumer confidence, which was also affected when the stock market fell in the spring amid the European sovereign debt crisis. It appears that consumers are more intent on paying down some of their debt than purchasing new houses or cars.
One bright spot has been demand for information technology products. Apple’s iPhones and iPads have been tremendous successes, and there should still be considerable scope to increase international sales as distribution is broadened. Companies may not have built new factories or offices recently, but they have increased their capital spending on technology. They do this partly to cope with rapidly rising internet data traffic and partly to take advantage of new technologies such as virtualization, which can lower the cost of running their databases. Our holding in F5 Networks, which we bought last December, is a beneficiary of this trend, as is NetApp, a recent purchase that is a leader in network-attached storage.
Other purchases made in the second half of the fiscal period include O’Reilly Automotive and Colgate-Palmolive, stocks that should be able to deliver sustainable earnings growth even in the face of a subdued U.S. economic recovery. The aging of the country’s auto fleet, resulting from reduced sales of new autos, is providing a tailwind for O’Reilly’s auto part sales, while growth in developing markets is boosting Colgate’s strong global toothpaste franchise.
Because we are in the aftermath of a financial crisis, the outlook is, as Federal Reserve Chairman Ben Bernanke put it, “unusually uncertain.” It may be that there will be an extended period of muted economic growth owing to deleveraging. Whatever the path of the recovery, we are optimistic that our holdings will increase their earnings at an above-average rate, at times because they occupy attractive niche markets but more often because of market-share gains based on a durable competitive edge.
Jennison Associates LLC
Portfolio Manager:
Kathleen A. McCarragher, Managing Director
We build our portfolio from the bottom up based on our research of company fundamentals.
Technology positions contributed most to the portfolio’s return for the period. Baidu, the world’s dominant Chinese-language internet search engine, rose more than 160%. We believe the Chinese search market is still in its early growth stage, and we like Baidu’s improving execution and exploration of long-term monetization opportunities. VMware also climbed more than 100%. Companies use VMware’s
9
software to integrate and manage server, storage, and networking functions, thus lowering their operating costs. We believe VMware is positioned to benefit from greater corporate interest in the use of virtual machines that let multiple network users maintain individualized desktops on a single, centrally located server.
NetApp, which provides tools to simplify storing, managing, protecting, and archiving enterprise data, rose more than 85%. We believe the company is positioned to benefit from growth in the storage business stemming from increased digital content. The strong launch of the iPad, international opportunities, and long-term growth in Mac personal computers made the period favorable for Apple’s stock, which rose more than 50%. We believe the company will continue to benefit from its creativity and innovation in product design and marketing.
In the consumer discretionary sector, Amazon.com’s strong earnings reflected a long-term shift toward e-commerce. In health care, Illumina was a notable contributor. The company’s genotyping, next-generation sequencing, and gene-expression tools isolate and analyze genetic information, allowing researchers to determine which genetic combinations are associated with certain diseases. We expect Illumina to benefit as next-generation sequencing enters what we believe will be a significant growth stage.
Other health care holdings hurt performance. Baxter International fell after it lowered its financial outlook following weakness in its blood plasma products business, and we have since eliminated the shares from the portfolio. Gilead Sciences’ decline reflected reduced earnings and revenue guidance stemming from health care reform.
Stock selection also detracted from the portfolio’s return in financials, where Goldman Sachs and Morgan Stanley were hurt by uncertainty surrounding proposed financial reform legislation.
Current undemanding price/earnings multiples make equities look increasingly attractive. The portfolio holds a number of stocks that we believe have above-average growth potential by virtue of the companies’ business opportunities in rapidly growing markets overseas.
10
Growth Equity Fund
Fund Profile
As of September 30, 2010
| Portfolio Characteristics | |||
| Russell | DJ | ||
| 1000 | U.S. Total | ||
| Growth | Market | ||
| Fund | Index | Index | |
| Number of Stocks | 83 | 627 | 3,920 |
| Median Market Cap $35.7B | $34.9B | $27.3B | |
| Price/Earnings Ratio | 20.3x | 17.9x | 17.1x |
| Price/Book Ratio | 3.6x | 3.5x | 2.1x |
| Return on Equity | 22.0% | 24.7% | 19.1% |
| Earnings Growth Rate 10.8% | 11.7% | 6.4% | |
| Dividend Yield | 1.1% | 1.5% | 1.8% |
| Foreign Holdings | 4.1% | 0.0% | 0.0% |
| Turnover Rate | 48% | — | — |
| Ticker Symbol | VGEQX | — | — |
| Expense Ratio1 | 0.51% | — | — |
| 30-Day SEC Yield | 0.48% | — | — |
| Short-Term Reserves | -3.6% | — | — |
The fund invested a portion of its cash reserves in equity markets through the use of index futures contracts. After the effect of the futures investments, the fund's temporary cash position was negative.
| Sector Diversification (% of equity exposure) | |||
| Russell | DJ | ||
| 1000 | U.S. Total | ||
| Growth | Market | ||
| Fund | Index | Index | |
| Consumer | |||
| Discretionary | 15.1% | 14.7% | 11.7% |
| Consumer Staples | 10.8 | 10.1 | 10.1 |
| Energy | 6.9 | 10.0 | 9.7 |
| Financials | 7.1 | 4.6 | 16.6 |
| Health Care | 15.6 | 10.1 | 11.2 |
| Industrials | 9.8 | 13.1 | 11.1 |
| Information | |||
| Technology | 31.9 | 31.4 | 19.0 |
| Materials | 1.4 | 5.0 | 4.2 |
| Telecommunication | |||
| Services | 1.2 | 0.9 | 2.9 |
| Utilities | 0.2 | 0.1 | 3.5 |
| Volatility Measures | ||
| DJ | ||
| U.S. Total | ||
| Russell 1000 | Market | |
| Growth Index | Index | |
| R-Squared | 0.97 | 0.91 |
| Beta | 1.03 | 0.99 |
These measures show the degree and timing of the fund’s fluctuations compared with the indexes over 36 months.
| Ten Largest Holdings (% of total net assets) | ||
| Apple Inc. | Computer | |
| Hardware | 5.7% | |
| Oracle Corp. | Systems Software | 3.4 |
| Schlumberger Ltd. | Oil & Gas | |
| Equipment & | ||
| Services | 2.7 | |
| Progressive Corp. | Property & Casualty | |
| Insurance | 2.5 | |
| Cisco Systems Inc. | Communications | |
| Equipment | 2.4 | |
| F5 Networks Inc. | Communications | |
| Equipment | 2.3 | |
| NetApp Inc. | Computer Storage | |
| & Peripherals | 2.1 | |
| Amazon.com Inc. | Internet Retail | 2.1 |
| Walgreen Co. | Drug Retail | 1.9 |
| VMware Inc. Class A | Systems Software | 1.8 |
| Top Ten | 26.9% | |
The holdings listed exclude any temporary cash investments and equity index products.
Investment Focus
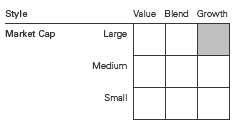
1 The expense ratio shown is from the prospectus dated January 28, 2010, and represents estimated costs for the current fiscal year. For the fiscal year ended September 30, 2010, the expense ratio was 0.51%.
11
Growth Equity Fund
Performance Summary
All of the returns in this report represent past performance, which is not a guarantee of future results that may be achieved by the fund. (Current performance may be lower or higher than the performance data cited. For performance data current to the most recent month-end, visit our website at vanguard.com/performance.) Note, too, that both investment returns and principal value can fluctuate widely, so an investor’s shares, when sold, could be worth more or less than their original cost. The returns shown do not reflect taxes that a shareholder would pay on fund distributions or on the sale of fund shares.
Cumulative Performance: September 30, 2000, Through September 30, 2010
Initial Investment of $10,000
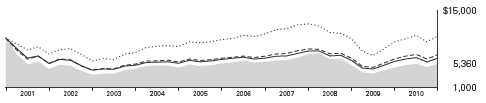
| Average Annual Total Returns | ||||
| Periods Ended September 30, 2010 | ||||
| Final Value | ||||
| One | Five | Ten | of a $10,000 | |
| Year | Years | Years | Investment | |
| Growth Equity Fund | 14.54% | -0.19% | -6.05% | $5,360 |
| Dow Jones U.S. Total Stock Market | ||||
| Index | 11.51 | 1.37 | 0.41 | 10,421 |
| Russell 1000 Growth Index | 12.65 | 2.06 | -3.44 | 7,046 |
| Large-Cap Growth Funds Average | 10.23 | 0.79 | -4.35 | 6,408 |
Large-Cap Growth Funds Average: Derived from data provided by Lipper Inc.
Fiscal-Year Total Returns (%): September 30, 2000, Through September 30, 2010
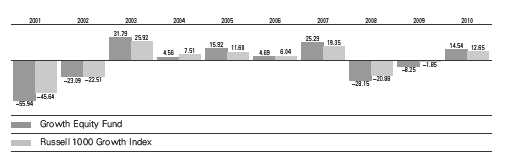
See Financial Highlights for dividend and capital gains information.
12
Growth Equity Fund
Financial Statements
Statement of Net Assets
As of September 30, 2010
The fund reports a complete list of its holdings in regulatory filings four times in each fiscal year, at the quarter-ends. For the second and fourth fiscal quarters, the lists appear in the fund’s semiannual and annual reports to shareholders. For the first and third fiscal quarters, the fund files the lists with the Securities and Exchange Commission on Form N-Q. Shareholders can look up the fund’s Forms N-Q on the SEC’s website at sec.gov. Forms N-Q may also be reviewed and copied at the SEC’s Public Reference Room (see the back cover of this report for further information).
| Market | |||
| Value | |||
| Shares | ($000) | ||
| Common Stocks (95.8%)1 | |||
| Consumer Discretionary (14.8%) | |||
| * | Amazon.com Inc. | 80,266 | 12,607 |
| Home Depot Inc. | 325,330 | 10,306 | |
| Walt Disney Co. | 237,591 | 7,867 | |
| NIKE Inc. Class B | 88,839 | 7,120 | |
| Starbucks Corp. | 272,770 | 6,977 | |
| * | O’Reilly Automotive Inc. | 127,000 | 6,756 |
| * | CarMax Inc. | 227,190 | 6,330 |
| * | Bed Bath & Beyond Inc. | 141,280 | 6,133 |
| Coach Inc. | 134,915 | 5,796 | |
| Target Corp. | 107,835 | 5,763 | |
| Omnicom Group Inc. | 118,700 | 4,686 | |
| * | Dollar General Corp. | 140,696 | 4,115 |
| McDonald’s Corp. | 54,972 | 4,096 | |
| 88,552 | |||
| Consumer Staples (10.4%) | |||
| Walgreen Co. | 332,990 | 11,155 | |
| Colgate-Palmolive Co. | 132,710 | 10,200 | |
| PepsiCo Inc. | 127,130 | 8,447 | |
| Brown-Forman Corp. | |||
| Class B | 115,680 | 7,130 | |
| Alberto-Culver Co. Class B | 150,642 | 5,672 | |
| Kraft Foods Inc. | 182,409 | 5,629 | |
| Mead Johnson Nutrition Co. | 75,745 | 4,311 | |
| Wal-Mart Stores Inc. | 79,610 | 4,261 | |
| * | Whole Foods Market Inc. | 114,495 | 4,249 |
| Costco Wholesale Corp. | 13,033 | 840 | |
| 61,894 | |||
| Energy (6.3%) | |||
| Schlumberger Ltd. | 260,839 | 16,070 | |
| Apache Corp. | 101,420 | 9,915 | |
| EOG Resources Inc. | 66,400 | 6,173 | |
| Occidental Petroleum Corp. | 71,530 | 5,601 | |
| 37,759 | |||
| Financials (6.3%) | |||
| Progressive Corp. | 711,080 | 14,840 | |
| * | Berkshire Hathaway Inc. | ||
| Class B | 118,596 | 9,806 | |
| Market | |||
| Value | |||
| Shares | ($000) | ||
| JPMorgan Chase & Co. | 104,959 | 3,996 | |
| * | Markel Corp. | 8,190 | 2,822 |
| Goldman Sachs Group Inc. | 18,801 | 2,718 | |
| M&T Bank Corp. | 31,730 | 2,596 | |
| Morgan Stanley | 29,432 | 726 | |
| 37,504 | |||
| Health Care (15.2%) | |||
| Bristol-Myers Squibb Co. | 369,800 | 10,025 | |
| * | Edwards Lifesciences Corp. | 146,980 | 9,855 |
| Johnson & Johnson | 155,180 | 9,615 | |
| Teva Pharmaceutical | |||
| Industries Ltd. ADR | 124,414 | 6,563 | |
| * | Express Scripts Inc. | 127,223 | 6,196 |
| Abbott Laboratories | 116,242 | 6,073 | |
| * | Celgene Corp. | 101,373 | 5,840 |
| Alcon Inc. | 30,970 | 5,166 | |
| Shire PLC ADR | 73,981 | 4,977 | |
| * | Mylan Inc. | 235,854 | 4,436 |
| * | Medco Health Solutions Inc. | 80,720 | 4,202 |
| * | Illumina Inc. | 80,617 | 3,966 |
| * | Vertex Pharmaceuticals Inc. | 113,207 | 3,914 |
| * | Gilead Sciences Inc. | 99,920 | 3,558 |
| Techne Corp. | 44,270 | 2,733 | |
| Merck & Co. Inc. | 63,330 | 2,331 | |
| Stryker Corp. | 32,970 | 1,650 | |
| 91,100 | |||
| Industrials (9.3%) | |||
| United Parcel Service Inc. | |||
| Class B | 151,880 | 10,129 | |
| United Technologies Corp. | 136,738 | 9,740 | |
| Danaher Corp. | 163,320 | 6,632 | |
| * | Stericycle Inc. | 94,670 | 6,578 |
| Boeing Co. | 93,167 | 6,199 | |
| Precision Castparts Corp. | 48,347 | 6,157 | |
| Rockwell Automation Inc. | 78,760 | 4,862 | |
| Deere & Co. | 50,300 | 3,510 | |
| ^ | Ritchie Bros Auctioneers Inc. | 86,710 | 1,801 |
| 55,608 | |||
13
Growth Equity Fund
| Market | |||
| Value | |||
| Shares | ($000) | ||
| Information Technology (31.3%) | |||
| * | Apple Inc. | 119,395 | 33,878 |
| Oracle Corp. | 748,835 | 20,106 | |
| * | Cisco Systems Inc. | 649,261 | 14,219 |
| * | F5 Networks Inc. | 129,740 | 13,468 |
| * | NetApp Inc. | 253,899 | 12,642 |
| * | VMware Inc. Class A | 124,952 | 10,613 |
| Microsoft Corp. | 373,440 | 9,146 | |
| * | Baidu Inc. | 82,534 | 8,470 |
| Linear Technology Corp. | 272,020 | 8,359 | |
| International Business | |||
| Machines Corp. | 60,705 | 8,143 | |
| * | Google Inc. Class A | 14,548 | 7,649 |
| Mastercard Inc. Class A | 30,619 | 6,859 | |
| * | Juniper Networks Inc. | 211,697 | 6,425 |
| * | Agilent Technologies Inc. | 172,381 | 5,752 |
| Broadcom Corp. Class A | 123,128 | 4,357 | |
| * | Marvell Technology | ||
| Group Ltd. | 238,007 | 4,168 | |
| Intel Corp. | 215,947 | 4,153 | |
| * | eBay Inc. | 151,650 | 3,700 |
| * | Adobe Systems Inc. | 106,743 | 2,791 |
| Tencent Holdings Ltd. ADR | 109,010 | 2,389 | |
| 187,287 | |||
| Materials (1.2%) | |||
| Monsanto Co. | 77,860 | 3,732 | |
| Praxair Inc. | 37,230 | 3,360 | |
| 7,092 | |||
| Telecommunication Services (1.0%) | |||
| * | American Tower Corp. | ||
| Class A | 115,777 | 5,935 | |
| Total Common Stocks | |||
| (Cost $508,883) | 572,731 | ||
| Temporary Cash Investments (3.4%)1 | |||
| Money Market Fund (3.0%) | |||
| 2,3 | Vanguard Market Liquidity | ||
| Fund, 0.261% | 17,699,692 | 17,700 | |
| Face | Market | |
| Amount | Value | |
| ($000) | ($000) | |
| U.S. Government and Agency Obligations (0.4%) | ||
| 4,5 Freddie Mac Discount Notes, | ||
| 0.271%, 6/7/11 | 2,500 | 2,495 |
| Total Temporary Cash Investments | ||
| (Cost $20,195) | 20,195 | |
| Total Investments (99.2%) | ||
| (Cost $529,078) | 592,926 | |
| Other Assets and Liabilities (0.8%) | ||
| Other Assets | 30,608 | |
| Liabilities3 | (26,052) | |
| 4,556 | ||
| Net Assets (100%) | ||
| Applicable to 61,133,806 outstanding | ||
| $.001 par value shares of beneficial | ||
| interest (unlimited authorization) | 597,482 | |
| Net Asset Value Per Share | $9.77 | |
| At September 30, 2010, net assets consisted of: | ||
| Amount | ||
| ($000) | ||
| Paid-in Capital | 871,268 | |
| Undistributed Net Investment Income | 879 | |
| Accumulated Net Realized Losses | (338,655) | |
| Unrealized Appreciation (Depreciation) | ||
| Investment Securities | 63,848 | |
| Futures Contracts | 142 | |
| Net Assets | 597,482 | |
See Note A in Notes to Financial Statements.
* Non-income-producing security.
^ Part of security position is on loan to broker-dealers. The total value of securities on loan is $1,107,000.
1 The fund invests a portion of its cash reserves in equity markets through the use of index futures contracts. After giving effect to futures investments, the fund’s effective common stock and temporary cash investment positions represent 102.6% and -3.4%, respectively, of net assets.
2 Affiliated money market fund available only to Vanguard funds and certain trusts and accounts managed by Vanguard. Rate shown is the 7-day yield.
3 Includes $1,119,000 of collateral received for securities on loan.
4 The issuer operates under a congressional charter; its securities are not backed by the full faith and credit of the U.S. government.
5 Securities with a value of $2,495,000 have been segregated as initial margin for open futures contracts.
ADR—American Depositary Receipt.
See accompanying Notes, which are an integral part of the Financial Statements.
14
Growth Equity Fund
Statement of Operations
| Year Ended | ||
| September 30, 2010 | ||
| ($000) | ||
| Investment Income | ||
| Income | ||
| Dividends1 | 7,032 | |
| Interest2 | 60 | |
| Security Lending | 85 | |
| Total Income | 7,177 | |
| Expenses | ||
| Investment Advisory Fees—Note B | ||
| Basic Fee | 1,462 | |
| Performance Adjustment | (397) | |
| The Vanguard Group—Note C | ||
| Management and Administrative | 1,852 | |
| Marketing and Distribution | 147 | |
| Custodian Fees | 9 | |
| Auditing Fees | 24 | |
| Shareholders’ Reports | 18 | |
| Trustees’ Fees and Expenses | 2 | |
| Total Expenses | 3,117 | |
| Net Investment Income | 4,060 | |
| Realized Net Gain (Loss) | ||
| Investment Securities Sold | 26,808 | |
| Futures Contracts | 2,379 | |
| Foreign Currencies | (9) | |
| Realized Net Gain (Loss) | 29,178 | |
| Change in Unrealized Appreciation (Depreciation) | ||
| Investment Securities | 50,000 | |
| Futures Contracts | (565) | |
| Change in Unrealized Appreciation (Depreciation) | 49,435 | |
| Net Increase (Decrease) in Net Assets Resulting from Operations | 82,673 | |
1 Dividends are net of foreign withholding taxes of $48,000.
2 Interest income from an affiliated company of the fund was $50,000.
See accompanying Notes, which are an integral part of the Financial Statements.
15
Growth Equity Fund
Statement of Changes in Net Assets
| Year Ended September 30, | ||
| 2010 | 2009 | |
| ($000) | ($000) | |
| Increase (Decrease) in Net Assets | ||
| Operations | ||
| Net Investment Income | 4,060 | 5,772 |
| Realized Net Gain (Loss) | 29,178 | (202,880) |
| Change in Unrealized Appreciation (Depreciation) | 49,435 | 122,802 |
| Net Increase (Decrease) in Net Assets Resulting from Operations | 82,673 | (74,306) |
| Distributions | ||
| Net Investment Income | (5,088) | (4,464) |
| Realized Capital Gain | — | — |
| Total Distributions | (5,088) | (4,464) |
| Capital Share Transactions | ||
| Issued | 82,529 | 94,847 |
| Issued in Lieu of Cash Distributions | 4,881 | 4,238 |
| Redeemed | (161,263) | (157,944) |
| Net Increase (Decrease) from Capital Share Transactions | (73,853) | (58,859) |
| Total Increase (Decrease) | 3,732 | (137,629) |
| Net Assets | ||
| Beginning of Period | 593,750 | 731,379 |
| End of Period1 | 597,482 | 593,750 |
1 Net Assets—End of Period includes undistributed net investment income of $879,000 and $1,916,000.
See accompanying Notes, which are an integral part of the Financial Statements.
16
Growth Equity Fund
Financial Highlights
| For a Share Outstanding | Year Ended September 30, | ||||
| Throughout Each Period | 2010 | 2009 | 2008 | 2007 | 2006 |
| Net Asset Value, Beginning of Period | $8.60 | $9.46 | $13.18 | $10.52 | $10.05 |
| Investment Operations | |||||
| Net Investment Income (Loss) | .062 | .085 | .015 | .020 | (.009) |
| Net Realized and Unrealized Gain (Loss) | |||||
| on Investments | 1.183 | (.883) | (3.720) | 2.640 | .480 |
| Total from Investment Operations | 1.245 | (.798) | (3.705) | 2.660 | .471 |
| Distributions | |||||
| Dividends from Net Investment Income | (.075) | (.062) | (.015) | — | (.001) |
| Distributions from Realized Capital Gains | — | — | — | — | — |
| Total Distributions | (.075) | (.062) | (.015) | — | (.001) |
| Net Asset Value, End of Period | $9.77 | $8.60 | $9.46 | $13.18 | $10.52 |
| Total Return1 | 14.54% | -8.25% | -28.15% | 25.29% | 4.69% |
| Ratios/Supplemental Data | |||||
| Net Assets, End of Period (Millions) | $597 | $594 | $731 | $975 | $759 |
| Ratio of Total Expenses to | |||||
| Average Net Assets2 | 0.51% | 0.51% | 0.72% | 0.68% | 0.91% |
| Ratio of Net Investment Income (Loss) to | |||||
| Average Net Assets | 0.66% | 1.10% | 0.18% | 0.14% | (0.04%) |
| Portfolio Turnover Rate | 48% | 98% | 222% | 131% | 147% |
1 Total returns do not include account service fees that may have applied in the periods shown. Fund prospectuses provide information about any applicable account service fees.
2 Includes performance-based investment advisory fee increases (decreases) of (0.06%), (0.09%), 0.08%, 0.04%, and 0.19%.
See accompanying Notes, which are an integral part of the Financial Statements.
17
Growth Equity Fund
Notes to Financial Statements
Vanguard Growth Equity Fund is registered under the Investment Company Act of 1940 as an open-end investment company, or mutual fund.
A. The following significant accounting policies conform to generally accepted accounting principles for U.S. mutual funds. The fund consistently follows such policies in preparing its financial statements.
1. Security Valuation: Securities are valued as of the close of trading on the New York Stock Exchange (generally 4 p.m., Eastern time) on the valuation date. Equity securities are valued at the latest quoted sales prices or official closing prices taken from the primary market in which each security trades; such securities not traded on the valuation date are valued at the mean of the latest quoted bid and asked prices. Securities for which market quotations are not readily available, or whose values have been affected by events occurring before the fund’s pricing time but after the close of the securities’ primary markets, are valued at their fair values calculated according to procedures adopted by the board of trustees. These procedures include obtaining quotations from an independent pricing service, monitoring news to identify significant market- or security-specific events, and evaluating changes in the values of foreign market proxies (for example, ADRs, futures contracts, or exchange-traded funds), between the time the foreign markets close and the fund’s pricing time. When fair-value pricing is employed, the prices of securities used by a fund to calculate its net asset value may differ from quoted or published prices for the same securities. Investments in Vanguard Market Liquidity Fund are valued at that fund’s net asset value. Temporary cash investments acquired over 60 days to maturity are valued using the latest bid prices or using valuations based on a matrix system (which considers such factors as security prices, yields, maturities, and ratings), both as furnished by independent pricing services. Other temporary cash investments are valued at amortized cost, which approximates market value.
2. Foreign Currency: Securities and other assets and liabilities denominated in foreign currencies are translated into U.S. dollars using exchange rates obtained from an independent third party as of the fund’s pricing time on the valuation date. Realized gains (losses) and unrealized appreciation (depreciation) on investment securities include the effects of changes in exchange rates since the securities were purchased, combined with the effects of changes in security prices. Fluctuations in the value of other assets and liabilities resulting from changes in exchange rates are recorded as unrealized foreign currency gains (losses) until the assets or liabilities are settled in cash, at which time they are recorded as realized foreign currency gains (losses).
3. Futures Contracts: The fund uses index futures contracts to a limited extent, with the objective of maintaining full exposure to the stock market while maintaining liquidity. The fund may purchase or sell futures contracts to achieve a desired level of investment, whether to accommodate portfolio turnover or cash flows from capital share transactions. The primary risks associated with the use of futures contracts are imperfect correlation between changes in market values of stocks held by the fund and the prices of futures contracts, and the possibility of an illiquid market.
Futures contracts are valued at their quoted daily settlement prices. The aggregate principal amounts of the contracts are not recorded in the Statement of Net Assets. Fluctuations in the value of the contracts are recorded in the Statement of Net Assets as an asset (liability) and in the Statement of Operations as unrealized appreciation (depreciation) until the contracts are closed, when they are recorded as realized futures gains (losses).
18
Growth Equity Fund
4. Federal Income Taxes: The fund intends to continue to qualify as a regulated investment company and distribute all of its taxable income. Management has analyzed the fund’s tax positions taken for all open federal income tax years (September 30, 2007–2010), and has concluded that no provision for federal income tax is required in the fund’s financial statements.
5. Distributions: Distributions to shareholders are recorded on the ex-dividend date.
6. Security Lending: The fund may lend its securities to qualified institutional borrowers to earn additional income. Security loans are required to be secured at all times by collateral at least equal to the market value of securities loaned. The fund invests cash collateral received in Vanguard Market Liquidity Fund, and records a liability for the return of the collateral, during the period the securities are on loan. Security lending income represents fees charged to borrowers plus income earned on investing cash collateral, less expenses associated with the loan.
7. Other: Dividend income is recorded on the ex-dividend date. Interest income includes income distributions received from Vanguard Market Liquidity Fund and is accrued daily. Security transactions are accounted for on the date securities are bought or sold. Costs used to determine realized gains (losses) on the sale of investment securities are those of the specific securities sold.
B. Baillie Gifford Overseas Ltd. and Jennison Associates LLC each provide investment advisory services to a portion of the fund for fees calculated at an annual percentage rate of average net assets managed by the advisor. The basic fee of Baillie Gifford Overseas Ltd. is subject to quarterly adjustments based on performance since June 30, 2008, relative to the S&P 500 Index. The basic fee of Jennison Associates LLC is subject to quarterly adjustments based on performance since March 31, 2009, relative to the Russell 1000 Growth Index.
The Vanguard Group manages the cash reserves of the fund on an at-cost basis.
For the year ended September 30, 2010, the aggregate investment advisory fee represented an effective annual basic rate of 0.24% of the fund’s average net assets, before a decrease of $397,000 (0.06%) based on performance.
C. The Vanguard Group furnishes at cost corporate management, administrative, marketing, and distribution services. The costs of such services are allocated to the fund under methods approved by the board of trustees. The fund has committed to provide up to 0.40% of its net assets in capital contributions to Vanguard. At September 30, 2010, the fund had contributed capital of $107,000 to Vanguard (included in Other Assets), representing 0.02% of the fund’s net assets and 0.04% of Vanguard’s capitalization. The fund’s trustees and officers are also directors and officers of Vanguard.
D. Various inputs may be used to determine the value of the fund’s investments. These inputs are summarized in three broad levels for financial statement purposes. The inputs or methodologies used to value securities are not necessarily an indication of the risk associated with investing in those securities.
19
Growth Equity Fund
Level 1—Quoted prices in active markets for identical securities.
Level 2—Other significant observable inputs (including quoted prices for similar securities, interest rates, prepayment speeds, credit risk, etc.).
Level 3—Significant unobservable inputs (including the fund’s own assumptions used to determine the fair value of investments).
The following table summarizes the fund’s investments as of September 30, 2010, based on the inputs used to value them:
| Level 1 | Level 2 | Level 3 | |
| Investments | ($000) | ($000) | ($000) |
| Common Stocks | 572,731 | — | — |
| Temporary Cash Investments | 17,700 | 2,495 | — |
| Futures Contracts—Liabilities1 | (149) | — | — |
| Total | 590,282 | 2,495 | — |
| 1 Represents variation margin on the last day of the reporting period. |
E. At September 30, 2010, the aggregate settlement value of open futures contracts and the related unrealized appreciation (depreciation) were:
| ($000) | ||||
| Number of | Aggregate | Unrealized | ||
| Long (Short) | Settlement | Appreciation | ||
| Futures Contracts | Expiration | Contracts | Value | (Depreciation) |
| S&P 500 Index | December 2010 | 48 | 13,640 | 248 |
| E-mini S&P 500 Index | December 2010 | 470 | 26,712 | (106) |
Unrealized appreciation (depreciation) on open futures contracts is required to be treated as realized gain (loss) for tax purposes.
F. Distributions are determined on a tax basis and may differ from net investment income and realized capital gains for financial reporting purposes. Differences may be permanent or temporary. Permanent differences are reclassified among capital accounts in the financial statements to reflect their tax character. Temporary differences arise when certain items of income, expense, gain, or loss are recognized in different periods for financial statement and tax purposes; these differences will reverse at some time in the future. Differences in classification may also result from the treatment of short-term gains as ordinary income for tax purposes.
During the year ended September 30, 2010, the fund realized net foreign currency losses of $9,000, which decreased distributable net income for tax purposes; accordingly, such losses have been reclassified from accumulated net realized losses to undistributed net investment income.
For tax purposes, at September 30, 2010, the fund had $2,862,000 of ordinary income available for distribution. The fund had available capital loss carryforwards totaling $338,361,000 to offset future net capital gains of $136,482,000 through September 30, 2011, $73,821,000 through September 30, 2017, and $128,058,000 through September 30, 2018. Capital loss carryforwards of $327,753,000 expired on September 30, 2010; accordingly, such losses have been reclassified from accumulated net realized losses to paid-in capital.
20
Growth Equity Fund
At September 30, 2010, the cost of investment securities for tax purposes was $529,078,000. Net unrealized appreciation of investment securities for tax purposes was $63,848,000, consisting of unrealized gains of $92,672,000 on securities that had risen in value since their purchase and $28,824,000 in unrealized losses on securities that had fallen in value since their purchase.
G. During the year ended September 30, 2010, the fund purchased $279,409,000 of investment securities and sold $343,116,000 of investment securities, other than temporary cash investments.
H. Capital shares issued and redeemed were:
| Year Ended September 30, | ||
| 2010 | 2009 | |
| Shares | Shares | |
| (000) | (000) | |
| Issued | 8,902 | 12,991 |
| Issued in Lieu of Cash Distributions | 535 | 629 |
| Redeemed | (17,309) | (21,902) |
| Net Increase (Decrease) in Shares Outstanding | (7,872) | (8,282) |
I. In preparing the financial statements as of September 30, 2010, management considered the impact of subsequent events for potential recognition or disclosure in these financial statements.
21
Report of Independent Registered Public Accounting Firm
To the Trustees of Vanguard Fenway Funds and the Shareholders of Vanguard Growth Equity Fund:
In our opinion, the accompanying statement of net assets and the related statements of operations and of changes in net assets and the financial highlights present fairly, in all material respects, the financial position of Vanguard Growth Equity Fund (constituting a separate portfolio of Vanguard Fenway Funds, hereafter referred to as the “Fund”) at September 30, 2010, the results of its operations for the year then ended, the changes in its net assets for each of the two years in the period then ended and the financial highlights for each of the five years in the period then ended, in conformity with accounting principles generally accepted in the United States of America. These financial statements and financial highlights (hereafter referred to as “financial statements”) are the responsibility of the Fund’s management; our responsibility is to express an opinion on these financial statements based on our audits. We conducted our audits of these financial statements in accordance with the standards of the Public Company Accounting Oversight Board (United States). Those standards require that we plan and perform the audit to obtain reasonable assurance about whether the financial statements are free of material misstatement. An audit includes examining, on a test basis, evidence supporting the amounts and disclosures in the financial statements, assessing the accounting principles used and significant estimates made by management, and evaluating the overall financial statement presentation. We believe that our audits, which included confirmation of securities at September 30, 2010 by correspondence with the custodian and broker and by agreement to the underlying ownership records of Vanguard Market Liquidity Fund, provide a reasonable basis for our opinion.
PricewaterhouseCoopers LLP
Philadelphia, Pennsylvania
November 17, 2010

Special 2010 tax information (unaudited) for Vanguard Growth Equity Fund
This information for the fiscal year ended September 30, 2010, is included pursuant to provisions of the Internal Revenue Code.
The fund distributed $5,088,000 of qualified dividend income to shareholders during the fiscal year.
For corporate shareholders, 100% of investment income (dividend income plus short-term gains, if any) qualifies for the dividends-received deduction.
22
Your Fund’s After-Tax Returns
This table presents returns for your fund both before and after taxes. The after-tax returns are shown in two ways: (1) assuming that an investor owned the fund during the entire period and paid taxes on the fund’s distributions, and (2) assuming that an investor paid taxes on the fund’s distributions and sold all shares at the end of each period.
Calculations are based on the highest individual federal income tax and capital gains tax rates in effect at the times of the distributions and the hypothetical sales. State and local taxes were not considered. After-tax returns reflect any qualified dividend income , using actual prior-year figures and estimates for 2010. (In the example, returns after the sale of fund shares may be higher than those assuming no sale. This occurs when the sale would have produced a capital loss. The calculation assumes that the investor received a tax deduction for the loss.)
Please note that your actual after-tax returns will depend on your tax situation and may differ from those shown. Also note that if you own the fund in a tax-deferred account, such as an individual retirement account or a 401(k) plan, this information does not apply to you. Such accounts are not subject to current taxes.
Finally, keep in mind that a fund’s performance—whether before or after taxes—does not guarantee future results.
Average Annual Total Returns: Growth Equity Fund
Periods Ended September 30, 2010
| One | Five | Ten | |
| Year | Years | Years | |
| Returns Before Taxes | 14.54% | -0.19% | -6.05% |
| Returns After Taxes on Distributions | 14.40 | -0.25 | -6.09 |
| Returns After Taxes on Distributions and Sale of Fund Shares | 9.62 | -0.17 | -4.90 |
23
About Your Fund’s Expenses
As a shareholder of the fund, you incur ongoing costs, which include costs for portfolio management, administrative services, and shareholder reports (like this one), among others. Operating expenses, which are deducted from a fund’s gross income, directly reduce the investment return of the fund.
A fund’s expenses are expressed as a percentage of its average net assets. This figure is known as the expense ratio. The following examples are intended to help you understand the ongoing costs (in dollars) of investing in your fund and to compare these costs with those of other mutual funds. The examples are based on an investment of $1,000 made at the beginning of the period shown and held for the entire period.
The accompanying table illustrates your fund’s costs in two ways:
• Based on actual fund return. This section helps you to estimate the actual expenses that you paid over the period. The ”Ending Account Value“ shown is derived from the fund‘s actual return, and the third column shows the dollar amount that would have been paid by an investor who started with $1,000 in the fund. You may use the information here, together with the amount you invested, to estimate the expenses that you paid over the period.
To do so, simply divide your account value by $1,000 (for example, an $8,600 account value divided by $1,000 = 8.6), then multiply the result by the number given for your fund under the heading ”Expenses Paid During Period.“
• Based on hypothetical 5% yearly return. This section is intended to help you compare your fund‘s costs with those of other mutual funds. It assumes that the fund had a yearly return of 5% before expenses, but that the expense ratio is unchanged. In this case—because the return used is not the fund’s actual return—the results do not apply to your investment. The example is useful in making comparisons because the Securities and Exchange Commission requires all mutual funds to calculate expenses based on a 5% return. You can assess your fund’s costs by comparing this hypothetical example with the hypothetical examples that appear in shareholder reports of other funds.
Note that the expenses shown in the table are meant to highlight and help you compare ongoing costs only and do not reflect transaction costs incurred by the fund for buying and selling securities. Further, the expenses do not include the account service fee described in the prospectus. If such a fee were applied to your account, your costs would be higher. Your fund does not charge transaction fees, such as purchase or redemption fees, nor does it carry a “sales load.”
The calculations assume no shares were bought or sold during the period. Your actual costs may have been higher or lower, depending on the amount of your investment and the timing of any purchases or redemptions.
You can find more information about the fund’s expenses, including annual expense ratios, in the Financial Statements section of this report. For additional information on operating expenses and other shareholder costs, please refer to your fund’s current prospectus.
24
| Six Months Ended September 30, 2010 | |||
| Beginning | Ending | Expenses | |
| Account Value | Account Value | Paid During | |
| Growth Equity Fund | 3/31/2010 | 9/30/2010 | Period |
| Based on Actual Fund Return | $1,000.00 | $1,004.11 | $2.51 |
| Based on Hypothetical 5% Yearly Return | 1,000.00 | 1,022.56 | 2.54 |
The calculations are based on expenses incurred in the most recent six-month period. The fund’s annualized six-month expense ratio for that period is 0.50%. The dollar amounts shown as “Expenses Paid” are equal to the annualized expense ratio multiplied by the average account value over the period, multiplied by the number of days in the most recent six-month period, then divided by the number of days in the most recent 12-month period.
25
Glossary
30-Day SEC Yield. A fund’s 30-day SEC yield is derived using a formula specified by the U.S. Securities and Exchange Commission. Under the formula, data related to the fund’s security holdings in the previous 30 days are used to calculate the fund’s hypothetical net income for that period, which is then annualized and divided by the fund’s estimated average net assets over the calculation period. For the purposes of this calculation, a security’s income is based on its current market yield to maturity (in the case of bonds) or its projected dividend yield (for stocks). Because the SEC yield represents hypothetical annualized income, it will differ—at times significantly—from the fund’s actual experience. As a result, the fund’s income distributions may be higher or lower than implied by the SEC yield.
Beta. A measure of the magnitude of a fund’s past share-price fluctuations in relation to the ups and downs of a given market index. The index is assigned a beta of 1.00. Compared with a given index, a fund with a beta of 1.20 typically would have seen its share price rise or fall by 12% when the index rose or fell by 10%. For this report, beta is based on returns over the past 36 months for both the fund and the index. Note that a fund’s beta should be reviewed in conjunction with its R-squared (see definition). The lower the R-squared, the less correlation there is between the fund and the index, and the less reliable beta is as an indicator of volatility.
Dividend Yield. Dividend income earned by stocks, expressed as a percentage of the aggregate market value (or of net asset value, for a fund). The yield is determined by dividing the amount of the annual dividends by the aggregate value (or net asset value) at the end of the period. For a fund, the dividend yield is based solely on stock holdings and does not include any income produced by other investments.
Earnings Growth Rate. The average annual rate of growth in earnings over the past five years for the stocks now in a fund.
Equity Exposure. A measure that reflects a fund’s investments in stocks and stock futures. Any holdings in short-term reserves are excluded.
Expense Ratio. The percentage of a fund’s average net assets used to pay its annual administrative and advisory expenses. These expenses directly reduce returns to investors.
Foreign Holdings. The percentage of a fund represented by stocks or depositary receipts of companies based outside the United States.
Inception Date. The date on which the assets of a fund (or one of its share classes) are first invested in accordance with the fund’s investment objective. For funds with a subscription period, the inception date is the day after that period ends. Investment performance is measured from the inception date.
Median Market Cap. An indicator of the size of companies in which a fund invests; the midpoint of market capitalization (market price x shares outstanding) of a fund’s stocks, weighted by the proportion of the fund’s assets invested in each stock. Stocks representing half of the fund’s assets have market capitalizations above the median, and the rest are below it.
Price/Book Ratio. The share price of a stock divided by its net worth, or book value, per share. For a fund, the weighted average price/book ratio of the stocks it holds.
26
Price/Earnings Ratio. The ratio of a stock’s current price to its per-share earnings over the past year. For a fund, the weighted average P/E of the stocks it holds. P/E is an indicator of market expectations about corporate prospects; the higher the P/E, the greater the expectations for a company’s future growth.
R-Squared. A measure of how much of a fund’s past returns can be explained by the returns from the market in general, as measured by a given index. If a fund’s total returns were precisely synchronized with an index’s returns, its R-squared would be 1.00. If the fund’s returns bore no relationship to the index’s returns, its R-squared would be 0. For this report, R-squared is based on returns over the past 36 months for both the fund and the index.
Return on Equity. The annual average rate of return generated by a company during the past five years for each dollar of shareholder’s equity (net income divided by shareholder’s equity). For a fund, the weighted average return on equity for the companies whose stocks it holds.
Short-Term Reserves. The percentage of a fund invested in highly liquid, short-term securities that can be readily converted to cash.
Turnover Rate. An indication of the fund’s trading activity. Funds with high turnover rates incur higher transaction costs and may be more likely to distribute capital gains (which may be taxable to investors). The turnover rate excludes in-kind transactions, which have minimal impact on costs.
27
The People Who Govern Your Fund
The trustees of your mutual fund are there to see that the fund is operated and managed in your best interests since, as a shareholder, you are a part owner of the fund. Your fund’s trustees also serve on the board of directors of The Vanguard Group, Inc., which is owned by the Vanguard funds and provides services to them on an at-cost basis.
A majority of Vanguard’s board members are independent, meaning that they have no affiliation with Vanguard or the funds they oversee, apart from the sizable personal investments they have made as private individuals. The independent board members have distinguished backgrounds in business, academia, and public service. Each of the trustees and executive officers oversees 178 Vanguard funds.
The following table provides information for each trustee and executive officer of the fund. More information about the trustees is in the Statement of Additional Information, which can be obtained, without charge, by contacting Vanguard at 800-662-7447, or online at Vanguard.com.
| Interested Trustee1 | Amy Gutmann |
| Born 1949. Trustee Since June 2006. Principal | |
| F. William McNabb III | Occupation(s) During the Past Five Years: President |
| Born 1957. Trustee Since July 2009. Chairman of the | of the University of Pennsylvania; Christopher H. |
| Board. Principal Occupation(s) During the Past Five | Browne Distinguished Professor of Political Science |
| Years: Chairman of the Board of The Vanguard Group, | in the School of Arts and Sciences with secondary |
| Inc., and of each of the investment companies served | appointments at the Annenberg School for Commu- |
| by The Vanguard Group, since January 2010; Director | nication and the Graduate School of Education |
| of The Vanguard Group since 2008; Chief Executive | of the University of Pennsylvania; Director of |
| Officer and President of The Vanguard Group and of | Carnegie Corporation of New York, Schuylkill River |
| each of the investment companies served by The | Development Corporation, and Greater Philadelphia |
| Vanguard Group since 2008; Director of Vanguard | Chamber of Commerce; Trustee of the National |
| Marketing Corporation; Managing Director of The | Constitution Center; Chair of the Presidential |
| Vanguard Group (1995–2008) . | Commission for the Study of Bioethical Issues. |
| JoAnn Heffernan Heisen | |
| Independent Trustees | Born 1950. Trustee Since July 1998. Principal |
| Occupation(s) During the Past Five Years: Corporate | |
| Emerson U. Fullwood | Vice President and Chief Global Diversity Officer |
| Born 1948. Trustee Since January 2008. Principal | since 2006 (retired 2008) and Member of the |
| Occupation(s) During the Past Five Years: Executive | Executive Committee (retired 2008) of Johnson & |
| Chief Staff and Marketing Officer for North America | Johnson (pharmaceuticals/consumer products); Vice |
| and Corporate Vice President (retired 2008) of Xerox | President and Chief Information Officer of Johnson & |
| Corporation (document management products and | Johnson (1997–2005); Director of the University |
| services); Director of SPX Corporation (multi-industry | Medical Center at Princeton and Women’s Research |
| manufacturing), the United Way of Rochester, | and Education Institute; Member of the Advisory |
| Amerigroup Corporation (managed health care), | Board of the Maxwell School of Citizenship and Public |
| the University of Rochester Medical Center, and | Affairs at Syracuse University. |
| Monroe Community College Foundation. | |
| F. Joseph Loughrey | |
| Rajiv L. Gupta | Born 1949. Trustee Since October 2009. Principal |
| Born 1945. Trustee Since December 2001.2 | Occupation(s) During the Past Five Years: President |
| Principal Occupation(s) During the Past Five Years: | and Chief Operating Officer since 2005 (retired 2009) |
| Chairman and Chief Executive Officer (retired 2009) | and Vice Chairman of the Board (2008–2009) of |
| and President (2006–2008) of Rohm and Haas Co. | Cummins Inc. (industrial machinery); Director of |
| (chemicals); Director of Tyco International, Ltd. | SKF AB (industrial machinery), Hillenbrand, Inc. |
| (diversified manufacturing and services) and Hewlett- | (specialized consumer services), Sauer-Danfoss Inc. |
| Packard Co. (electronic computer manufacturing); | (machinery), the Lumina Foundation for Education, |
| Trustee of The Conference Board; Member of the | and Oxfam America; Chairman of the Advisory |
| Board of Managers of Delphi Automotive LLP | Council for the College of Arts and Letters at the |
| (automotive components) . | University of Notre Dame. |
| André F. Perold | Kathryn J. Hyatt | |
| Born 1952. Trustee Since December 2004. Principal | Born 1955. Treasurer Since November 2008. Principal | |
| Occupation(s) During the Past Five Years: George | Occupation(s) During the Past Five Years: Principal | |
| Gund Professor of Finance and Banking at the Harvard | of The Vanguard Group, Inc.; Treasurer of each of | |
| Business School; Chair of the Investment Committee | the investment companies served by The Vanguard | |
| of HighVista Strategies LLC (private investment firm) . | Group since 2008; Assistant Treasurer of each of the | |
| investment companies served by The Vanguard Group | ||
| Alfred M. Rankin, Jr. | (1988–2008) . | |
| Born 1941. Trustee Since January 1993. Principal | ||
| Occupation(s) During the Past Five Years: Chairman, | Heidi Stam | |
| President, and Chief Executive Officer of NACCO | Born 1956. Secretary Since July 2005. Principal | |
| Industries, Inc. (forklift trucks/housewares/lignite); | Occupation(s) During the Past Five Years: Managing | |
| Director of Goodrich Corporation (industrial products/ | Director of The Vanguard Group, Inc., since 2006; | |
| aircraft systems and services); Chairman of the | General Counsel of The Vanguard Group since 2005; | |
| Federal Reserve Bank of Cleveland; Trustee of The | Secretary of The Vanguard Group and of each of the | |
| Cleveland Museum of Art. | investment companies served by The Vanguard Group | |
| since 2005; Director and Senior Vice President of | ||
| Peter F. Volanakis | Vanguard Marketing Corporation since 2005; | |
| Born 1955. Trustee Since July 2009. Principal | Principal of The Vanguard Group (1997–2006). | |
| Occupation(s) During the Past Five Years: President | ||
| since 2007 and Chief Operating Officer since 2005 | ||
| of Corning Incorporated (communications equipment); | Vanguard Senior Management Team | |
| President of Corning Technologies (2001–2005); | ||
| Director of Corning Incorporated and Dow Corning; | R. Gregory Barton | Michael S. Miller |
| Trustee of the Corning Incorporated Foundation and | Mortimer J. Buckley | James M. Norris |
| the Corning Museum of Glass; Overseer of the | Kathleen C. Gubanich | Glenn W. Reed |
| Amos Tuck School of Business Administration at | Paul A. Heller | George U. Sauter |
| Dartmouth College. | ||
| Chairman Emeritus and Senior Advisor | ||
| Executive Officers | ||
| John J. Brennan | ||
| Glenn Booraem | Chairman, 1996–2009 | |
| Born 1967. Controller Since July 2010. Principal | Chief Executive Officer and President, 1996–2008 | |
| Occupation(s) During the Past Five Years: Principal | ||
| of The Vanguard Group, Inc.; Controller of each of | ||
| the investment companies served by The Vanguard | Founder | |
| Group since 2010; Assistant Controller of each of | ||
| the investment companies served by The Vanguard | John C. Bogle | |
| Group (2001–2010) . | Chairman and Chief Executive Officer, 1974–1996 | |
| Thomas J. Higgins | ||
| Born 1957. Chief Financial Officer Since September | ||
| 2008. Principal Occupation(s) During the Past Five | ||
| Years: Principal of The Vanguard Group, Inc.; Chief | ||
| Financial Officer of each of the investment companies | ||
| served by The Vanguard Group since 2008; Treasurer | ||
| of each of the investment companies served by The | ||
| Vanguard Group (1998–2008) . | ||
1 Mr. McNabb is considered an “interested person,” as defined in the Investment Company Act of 1940, because he is an officer of the Vanguard funds.
2 December 2002 for Vanguard Equity Income Fund, Vanguard Growth Equity Fund, the Vanguard Municipal Bond Funds, and the Vanguard State Tax-Exempt Funds.
 | |
| P.O. Box 2600 | |
| Valley Forge, PA 19482-2600 |
Connect with Vanguard® > Vanguard.com
| Fund Information > 800-662-7447 | |
| Direct Investor Account Services > 800-662-2739 | |
| Institutional Investor Services > 800-523-1036 | |
| Text Telephone for People | |
| With Hearing Impairment > 800-749-7273 | |
| This material may be used in conjunction | |
| with the offering of shares of any Vanguard | |
| fund only if preceded or accompanied by | |
| the fund’s current prospectus. | |
| All comparative mutual fund data are from Lipper Inc. or | |
| Morningstar, Inc., unless otherwise noted. | |
| You can obtain a free copy of Vanguard’s proxy voting | |
| guidelines by visiting vanguard.com/proxyreporting or by | |
| calling Vanguard at 800-662-2739. The guidelines are | |
| also available from the SEC’s website, sec.gov. In | |
| addition, you may obtain a free report on how your fund | |
| voted the proxies for securities it owned during the 12 | |
| months ended June 30. To get the report, visit either | |
| vanguard.com/proxyreporting or sec.gov. | |
| You can review and copy information about your fund at | |
| the SEC’s Public Reference Room in Washington, D.C. To | |
| find out more about this public service, call the SEC at | |
| 202-551-8090. Information about your fund is also | |
| available on the SEC’s website, and you can receive | |
| copies of this information, for a fee, by sending a | |
| request in either of two ways: via e-mail addressed to | |
| publicinfo@sec.gov or via regular mail addressed to the | |
| Public Reference Section, Securities and Exchange | |
| Commission, Washington, DC 20549-1520. | |
| © 2010 The Vanguard Group, Inc. | |
| All rights reserved. | |
| Vanguard Marketing Corporation, Distributor. | |
| Q5440 112010 | |
| Vanguard PRIMECAP Core Fund |
| Annual Report |
| September 30, 2010 |
 |
> Vanguard PRIMECAP Core Fund returned more than 10% for the 2010 fiscal year, in line with its benchmark index and just ahead of the average return of peer funds.
> Information technology, industrial, and consumer discretionary stocks—three of the fund’s largest sectors—accounted for most of its return.
> Performance varied widely among the fund’s health care stocks, leading to a slight decline for the fund’s second-largest sector.
| Contents | |
| Your Fund’s Total Returns. | 1 |
| Chairman’s Letter. | 2 |
| Advisor’s Report. | 7 |
| Fund Profile. | 12 |
| Performance Summary. | 13 |
| Financial Statements. | 15 |
| Your Fund’s After-Tax Returns. | 25 |
| About Your Fund’s Expenses. | 26 |
| Glossary. | 28 |
Please note: The opinions expressed in this report are just that—informed opinions. They should not be considered promises or advice. Also, please keep in mind that the information and opinions cover the period through the date on the front of this report. Of course, the risks of investing in your fund are spelled out in the prospectus.
See the Glossary for definitions of investment terms used in this report.
Cover photograph: Jean Maher.
Your Fund’s Total Returns
| Fiscal Year Ended September 30, 2010 | |
| Total | |
| Returns | |
| Vanguard PRIMECAP Core Fund | 10.39% |
| MSCI US Prime Market 750 Index | 10.68 |
| Multi-Cap Core Funds Average | 9.82 |
| Multi-Cap Core Funds Average: Derived from data provided by Lipper Inc. |
Your Fund’s Performance at a Glance
September 30, 2009, Through September 30, 2010
| Distributions Per Share | |||||
| Starting | Ending | Income | Capital | ||
| Share Price | Share Price | Dividends | Gains | ||
| Vanguard PRIMECAP Core Fund | $11.42 | $12.51 | $0.094 | $0.000 | |
1

Chairman’s Letter
Dear Shareholder,
The gains of about 12% notched by Vanguard PRIMECAP Core Fund, and the broad U.S. stock market, during the first half of the fiscal year gave way to modest losses in the second half. For the 12 months ended September 30, 2010, the fund returned 10.39%, in line with the result of its unmanaged benchmark (the MSCI US Prime Market 750 Index) and just ahead of the average return of multi-capitalization core funds.
The apparent similarity between the fund’s return and that of its benchmark masked several substantial variations that stem from the distinctive investment strategy of the fund’s advisor, PRIMECAP Management Company. Perhaps most notable are outsized investments in information technology and health care, minimal holdings in the financial sector, and a patient, low-turnover style—features that have rewarded the fund’s shareholders since its inception in December 2004. Although health care held back the fund’s performance in fiscal 2010, the advisor’s decisions in the tech and financial sectors—and among industrial stocks—were rewarding.
An upbeat end to a worrisome 12 months
Although global stock markets traced a ragged trajectory, they ultimately gained ground for the 12 months ended September 30. Europe’s sovereign debt crisis and a dispiriting lack of vigor in the U.S. economy weighed on stock prices
2
through the spring and summer. In September, however, investor sentiment perked up, buoyed by continued signs of strength in corporate financial statements. The broad U.S. stock market rallied to close the 12-month period with a return of more than 11%. Small-capitalization stocks finished a few steps ahead of their large-cap counterparts.
International stock markets were a mixed bag: middling returns in Europe, stagnation in the Pacific region’s developed markets, and a return of more than 20% from emerging markets. The combined result, as measured by the MSCI All Country World Index ex USA, was a 12-month return of 8%.
Bond prices rallied, driving yields to surprising lows
Bonds produced strong 12-month returns, a gratifying performance that nevertheless raises questions about the prospects for total returns in a fixed income market where yields hover near all-time lows. At the start of the period, the 10-year U.S. Treasury note yielded 3.31%; at the end of the period, the figure was 2.51% as investors bid up bond prices. As yields move lower, of course, the scope for continued declines—and the attendant rise in prices—diminishes. Corporate bonds performed best for the 12 months. Municipal bonds delivered solid, but more modest, returns.
| Market Barometer | |||
| Average Annual Total Returns | |||
| Periods Ended September 30, 2010 | |||
| One | Three | Five | |
| Year | Years | Years | |
| Stocks | |||
| Russell 1000 Index (Large-caps) | 10.75% | -6.79% | 0.86% |
| Russell 2000 Index (Small-caps) | 13.35 | -4.29 | 1.60 |
| Dow Jones U.S. Total Stock Market Index | 11.51 | -6.12 | 1.37 |
| MSCI All Country World Index ex USA (International) | 8.00 | -6.98 | 4.72 |
| Bonds | |||
| Barclays Capital U.S. Aggregate Bond Index (Broad | |||
| taxable market) | 8.16% | 7.42% | 6.20% |
| Barclays Capital Municipal Bond Index (Broad | |||
| tax-exempt market) | 5.81 | 6.04 | 5.13 |
| Citigroup Three-Month U.S. Treasury Bill Index | 0.12 | 1.01 | 2.47 |
| CPI | |||
| Consumer Price Index | 1.14% | 1.57% | 1.90% |
3
As has been the case for almost two years now, the yields of money market securities remained near 0%, a consequence of the Federal Reserve Board’s efforts to stimulate the economy by keeping a tight lid on borrowing costs.
Consistent themes produced some inconsistent results
In recent years, the sizable technology sector has dominated the PRIMECAP Core Fund’s performance—accounting for almost two-thirds of its decline in fiscal-year 2008 and much of its rebound in fiscal 2009. In the past year, however, IT stocks shared the spotlight with two smaller sectors.
Both industrial (+28%) and consumer discretionary (+22%) stocks benefited from a U.S. economy that was slowly on the mend and on the move. Together, these two sectors represented less than one-third of the fund’s market value, on average, but accounted for almost two-thirds of the fund’s total return for the year. Among the best industrial contributors were air freight and logistics companies, railroads, heavy machinery makers, and top-ten holding Southwest Airlines. Rising consumer confidence lifted a broad cross section of companies, including brick-and-mortar retailers, Amazon.com, and DIRECTV.
Expense Ratios
Your Fund Compared With Its Peer Group
| Peer Group | ||
| Fund | Average | |
| PRIMECAP Core Fund | 0.54% | 1.20% |
The fund expense ratio shown is from the prospectus dated January 28, 2010, and represents estimated costs for the current fiscal year. For the fiscal year ended September 30, 2010, the fund’s expense ratio was 0.51%. The peer-group expense ratio is derived from data provided by Lipper Inc. and captures information through year-end 2009.
Peer group: Multi-Cap Core Funds.
4
Although the fund’s IT holdings (+13%) generated mixed results, they were able to add about 3 percentage points to the fund’s total return. Some of the fund’s software companies declined, but top-ten holdings Intuit and Oracle made significant contributions. Computer storage and semiconductor companies also had rising fortunes, but BlackBerry maker Research In Motion was a disappointment.
In contrast, the fund’s health care stocks almost broke even for the year, with several holdings remaining weak for reasons that seemed to have little to do with the eventual passage of health care reform. Results diverged notably for the fund’s three top-ten pharmaceuticals: Eli Lilly and Novartis notched double-digit gains, while Roche Holding finished in the red. A similar dichotomy existed among biotech holdings: Biogen Idec advanced, but top-ten holding Amgen lost ground.
Compared with the benchmark index, five of the fund’s sectors outperformed and five lagged. Financials gave the greatest boost, thanks to a small stake in the sector (which fell in the index but advanced in the fund) and adroit stock selection among insurance companies. Industrials also provided a strong assist. In the materials sector, Potash Corp. of Saskatchewan—a fertilizer maker, and takeover target, that is not included in the all-U.S. benchmark—was another big plus for the fund, but it was offset by Monsanto. Health care holdings pulled down the fund’s return relative to its benchmark by about 2 percentage points.
Total Returns
Inception Through September 30, 2010
| Average | |
| Annual Return | |
| PRIMECAP Core Fund (Returns since inception: 12/9/2004) | 5.20% |
| MSCI US Prime Market 750 Index | 1.99 |
| Multi-Cap Core Funds Average | 1.56 |
| Multi-Cap Core Funds Average: Derived from data provided by Lipper Inc. |
The figures shown represent past performance, which is not a guarantee of future results. (Current performance may be lower or higher than the performance data cited. For performance data current to the most recent month-end, visit our website at vanguard.com/performance.) Note, too, that both investment returns and principal value can fluctuate widely, so an investor’s shares, when sold, could be worth more or less than their original cost.
5
For more on the advisor’s strategy and outlook, please see the Advisor’s Report following this letter.
A patient approach can reap rewards
The up-and-down path of the U.S. stock market over the past 12 months was not unlike historical patterns of market returns from year to year. Also, over time, growth and value stocks have often traded places in the performance rankings, as have large- and small-cap stocks. Because we can’t predict such twists and turns, it helps to diversify your holdings among and within stocks, bonds, and money market funds, in proportions that are consistent with your risk tolerance and time horizon.
Vanguard PRIMECAP Core Fund can play an important role in such a balanced portfolio. Although your fund does not have a ten-year track record yet, its average annual return since inception in late 2004 has been more than 3 percentage points ahead of its comparative standards. While there’s no assurance that this outperformance will continue, the advisor’s patient and disciplined approach—more like the proverbial tortoise than the hare—can help you reach your investment goals.
Thank you for entrusting your assets to Vanguard.
Sincerely,

F. William McNabb III
Chairman and Chief Executive Officer
October 12, 2010
6
Advisor’s Report
For the fiscal year ended September 30, 2010, Vanguard PRIMECAP Core Fund returned 10.39%, slightly below the 10.68% return of the unmanaged benchmark, the MSCI US Prime Market 750 Index, and above the 9.82% average return of multi-capitalization core fund competitors. The fund’s holdings in health care, its second-largest sector, detracted from the year’s results, but this was partially offset by positive contributions from the fund’s holdings in the industrials and information technology sectors.
Investment environment
In a year characterized by considerable volatility in equity markets, the major indexes managed to post gains. For example, the S&P 500 Index advanced slightly more than 10%, largely on the strength of a rally in September 2010. Taking a longer perspective, the S&P 500 ended the fiscal year approximately 70% higher than its March 2009 low, but remains more than 25% below the peak levels reached in October 2007.
The National Bureau of Economic Research recently determined that the recession, which began in late 2007, officially ended in June 2009. However, growth in the U.S. economy continues to be modest, unemployment hovers near 10%, and housing markets remain weak. Uncertainty regarding the future course of tax rates, regulatory reforms, monetary and fiscal policies, and the overall fragility of the economic recovery cloud the investment outlook.
Although stock prices have risen dramatically over the past 18 months, valuations appear attractive, especially given the low interest rate environment. Corporate earnings have also improved as business activity has rebounded, allowing many companies to improve their balance sheets during this period. We have found compelling purchase opportunities over the past year in companies with strong growth prospects, solid balance sheets, and attractive valuations.
Management of the fund
Our investment philosophy and process have not changed. We rely on fundamental, in-depth research to find companies whose revenue and earnings will, in our opinion, grow more rapidly over a three-to-five-year horizon than current valuations might suggest. In doing so, we focus on assessing the fundamental value of a company relative to the market price of its stock.
This bottom-up, stock-by-stock investment strategy has led us to build and maintain significant investments in technology and health care companies that we believe offer superior appreciation potential. The following discussion focuses on these two sectors, which on average represented
7
nearly half of the fund’s market value (but less than one-third of the benchmark’s) during the fiscal year.
Technology
The fund’s information technology holdings, which represented about one-quarter of its market value, returned almost 13% in the fiscal year, ahead of the approximately 11% return of the technology sector in the benchmark index. In our judgment, technology remains an attractive investment area for several reasons. First, internet usage continues to grow, driven by social networking, e-commerce, and the emergence of new devices such as smartphones and tablet computers. Second, demand for semiconductors, computer hardware, and storage remains robust as consumers and enterprises generate ever greater amounts of data, photos, and videos. Third, emerging middle-class consumers in developing economies represent a vast new audience for technology products and services. Finally, technology companies have strong balance sheets with cash at record levels and reasonable stock valuations.
SanDisk and Intuit were significant contributors to the fund’s results, posting gains of almost 70% and more than 50%, respectively. SanDisk, a leading manufacturer of flash memory used in smartphones and tablet computers, has benefited from the strong growth in unit sales of these devices. Intuit, a top-ten holding, successfully raised prices for both its TurboTax consumer and QuickBooks small business software products. The company is also expanding into medical-payments processing and online banking software.
Research In Motion, maker of BlackBerry smartphones, was a notable detractor from the fund’s performance. Despite very strong revenue and earnings growth this year, its stock declined as concerns mounted that the BlackBerry will lose market share to Android devices and Apple’s iPhone. We believe the BlackBerry franchise remains a vibrant ecosystem that offers customers distinct advantages in security, reliability, and messaging.
Overall, we remain optimistic about the fund’s overweight position in the technology sector. These well-capitalized companies are highly profitable and continue to invest in innovation that should drive future growth and profitability as they expand into new markets for their products and services.
Health care
The fund’s health care stocks posted disappointing returns for the fiscal year, lagging the MSCI US Prime Market 750 Index’s health care sector, which in turn lagged the overall index. The sector has been challenged with unfavorable news this year. The Patient Protection and Affordable Care Act passed in March will
8
lead to various forms of pricing pressure for the sector. The weak economy and high unemployment have emboldened employers to require more of their employees in terms of co-pays and sharing premiums for health care plans, thereby reducing demand for some health care products. European austerity measures have also hurt health care companies selling products in that region.
Despite these negatives, we remain optimistic about our health care holdings, which are concentrated in the biotech-nology, pharmaceutical, and medical device industries. The fund’s largest holding is Amgen. This biotechnology company recently received Food and Drug Administration (FDA) approval to market Prolia for the treatment of osteoporosis in post-menopausal women. Prolia is also awaiting an FDA decision on its use in treating skeletal-related events and may be considered for a third indication—to prevent bone metastases in cases of prostate cancer. We don’t believe Amgen’s below-market valuation reflects the potential of Prolia and other Amgen pipeline drugs to meet the tremendous demand from patients.
Pharmaceuticals makers Novartis and Eli Lilly, two of the fund’s largest holdings, showed double-digit gains for the year. Novartis has one of the most productive research and development platforms in the industry, with more products approved by the FDA than any other pharmaceutical company over the last decade. Novartis has also broadened its portfolio into areas with strong growth prospects, such as personal care products, vaccines, and eye care, the last of these through its purchase of Alcon. Eli Lilly has not been as successful as Novartis in developing and launching new drugs. Its recent launch of the blood thinner Effient has been disappointing. Concerns over patent expirations, especially for blockbusters Zyprexa and Cymbalta, weigh on the stock. Our thesis for Eli Lilly remains pinned on its low valuation and commitment to research and development; it has 30 products in late-stage clinical trials (phase two or th ree) or under regulatory review. Both Novartis and Eli Lilly are increasingly investing in biologic therapies, which should provide longer exclusivity periods than easy-to-copy, small-molecule therapies.
We remain optimistic that the fund’s overweight position in this sector will help results going forward. The pricing concerns raised by the recently passed health care legislation should be offset, in part, by the 30 million currently uninsured who will gain coverage as a result. We believe that pharmaceutical and medical device products currently in development will represent a far more efficient way, both in terms of cost and efficacy, to treat diseases like Alzheimer’s, diabetes, and cancer than the alternatives available today. Within the United States, baby
9
boomers, the first of whom turn 65 next year, will provide two decades of increased demand for health care products. Outside the United States, there is an even larger opportunity in the emerging markets, where people want better health care products as a critical component of a higher standard of living.
Other sector highlights
As a group, industrial and consumer discretionary stocks were among the year’s best sectors in both the fund and the benchmark index. Stock selection and the fund’s overweight positions helped its relative results. Boeing and Southwest Airlines were strong contributors; we believe that Southwest’s recently announced plan to acquire AirTran will prove to be a good strategic decision. Among consumer discretionary companies, Amazon.com and DIRECTV were two of the largest contributors to the fund’s results.
Given our long-standing concerns about leverage and lack of transparency in the banking sector, we generally remain negatively disposed toward financials stocks. The fund has only a modest stake in the sector, primarily in insurance companies, but its holdings fared well, in contrast to the financials sector’s decline in the index. In the materials sector, the fund’s holdings had mixed results. Monsanto struggled because of reports that its latest generation of seeds failed to produce expected yield gains, and Vulcan Materials declined as the spending environment for both residential and nonresidential construction and infrastructure remained challenging. Conversely, Potash Corp. of Saskatchewan added almost a full percentage point to the fund’s return.
Outlook
Looking ahead to the 2011 fiscal year and beyond, we view the prospects for equity returns relative to most other asset classes as encouraging. With the earnings yield (a measure of valuation) on stocks approaching 8% versus less than 3% for a 10-year Treasury bond and less than 1% for a money market fund, we believe that stocks have significant potential for appreciation and that valuations are attractive. However, while we are on balance optimistic, our outlook is tempered by several macro-level concerns.
We are concerned that the current fiscal and monetary policies in the United States may ultimately lead to a rise in inflation and a weaker U.S. dollar—which recently touched a 15-year low against the Japanese yen and has weakened against the euro. Increased regulations and other government intervention into the private sector are even more troubling, as they distort economic incentives. We believe that market forces result in a more efficient allocation of resources than government programs.
10
Longer-term, the recent problems in Greece and other European countries demonstrate the challenge of sustaining fiscal policies that increase government spending more rapidly than the growth rate of the broader economy. The United States faces a similar challenge not only at the federal level but also at the state and local government levels—where spending needs and future obligations are increasing faster than tax revenues.
Despite these concerns, we hold a generally positive outlook for U.S. equities. In addition to attractive valuations, we would highlight three factors. First, many U.S. corporations today generate a meaningful and increasing portion of their revenues and earnings from outside the United States. The opportunities for growth globally, particularly in developing economies, will result in many corporations increasing earnings more rapidly than the rate of economic growth in the U.S. Second, we believe the pace of innovation in U.S. companies continues to accelerate. We expect that the substantial investments in research and development, particularly by health care and technology companies, will lead to new and unforeseen growth opportunities that are not reflected in current expectations. Finally, the balance sheets of corporate America are as strong and liquid as they have ever been. This will afford companies great financial fle xibility during challenging economic times.
PRIMECAP Management Company
October 20, 2010
11
PRIMECAP Core Fund
Fund Profile
As of September 30, 2010
| Portfolio Characteristics | |||
| MSCI US | DJ | ||
| Prime | U.S. Total | ||
| Market | Market | ||
| Fund | 750 Index | Index | |
| Number of Stocks | 136 | 750 | 3,920 |
| Median Market Cap $28.5B | $35.6B | $27.3B | |
| Price/Earnings Ratio | 17.3x | 16.1x | 17.1x |
| Price/Book Ratio | 2.7x | 2.1x | 2.1x |
| Return on Equity | 19.4% | 20.1% | 19.1% |
| Earnings Growth Rate | 8.9% | 6.6% | 6.4% |
| Dividend Yield | 1.5% | 2.0% | 1.8% |
| Foreign Holdings | 15.5% | 0.0% | 0.0% |
| Turnover Rate | 8% | — | — |
| Ticker Symbol | VPCCX | — | — |
| Expense Ratio1 | 0.54% | — | — |
| 30-Day SEC Yield | 0.78% | — | — |
| Short-Term Reserves | 2.0% | — | — |
| Sector Diversification (% of equity exposure) | |||
| MSCI US | DJ | ||
| Prime | U.S. Total | ||
| Market | Market | ||
| Fund 750 Index | Index | ||
| Consumer | |||
| Discretionary | 14.2% | 10.8% | 11.7% |
| Consumer Staples | 2.2 | 10.6 | 10.1 |
| Energy | 6.7 | 11.1 | 9.7 |
| Financials | 5.5 | 15.2 | 16.6 |
| Health Care | 21.2 | 12.0 | 11.2 |
| Industrials | 16.3 | 10.7 | 11.1 |
| Information | |||
| Technology | 25.1 | 18.9 | 19.0 |
| Materials | 7.8 | 3.8 | 4.2 |
| Telecommunication | |||
| Services | 0.3 | 3.2 | 2.9 |
| Utilities | 0.7 | 3.7 | 3.5 |
| Volatility Measures | ||
| DJ | ||
| MSCI US | U.S. Total | |
| Prime Market | Market | |
| 750 Index | Index | |
| R-Squared | 0.95 | 0.96 |
| Beta | 0.96 | 0.94 |
These measures show the degree and timing of the fund’s fluctuations compared with the indexes over 36 months.
| Ten Largest Holdings (% of total net assets) | ||
| Amgen Inc. | Biotechnology | 4.0% |
| Eli Lilly & Co. | Pharmaceuticals | 3.2 |
| Novartis AG ADR | Pharmaceuticals | 3.0 |
| Roche Holding AG | Pharmaceuticals | 2.7 |
| Southwest Airlines Co. | Airlines | 2.5 |
| Intuit Inc. | Application | |
| Software | 2.5 | |
| Marsh & McLennan Cos. | Insurance Brokers | |
| Inc. | 2.4 | |
| Potash Corp. of | Fertilizers & | |
| Saskatchewan Inc. | Agricultural | |
| Chemicals | 2.2 | |
| Oracle Corp. | Systems Software | 2.2 |
| Boeing Co. | Aerospace & | |
| Defense | 2.2 | |
| Top Ten | 26.9% | |
The holdings listed exclude any temporary cash investments and equity index products.
Investment Focus
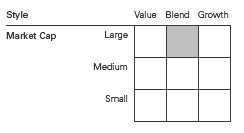
1 The expense ratio shown is from the prospectus dated January 28, 2010, and represents estimated costs for the current fiscal year. For the fiscal year ended September 30, 2010, the expense ratio was 0.51%.
12
PRIMECAP Core Fund
Performance Summary
All of the returns in this report represent past performance, which is not a guarantee of future results that may be achieved by the fund. (Current performance may be lower or higher than the performance data cited. For performance data current to the most recent month-end, visit our website at vanguard.com/performance.) Note, too, that both investment returns and principal value can fluctuate widely, so an investor’s shares, when sold, could be worth more or less than their original cost. The returns shown do not reflect taxes that a shareholder would pay on fund distributions or on the sale of fund shares.
Cumulative Performance: December 9, 2004, Through September 30, 2010
Initial Investment of $10,000

| Average Annual Total Returns | ||||
| Periods Ended September 30, 2010 | ||||
| Since | Final Value | |||
| One | Five | Inception | of a $10,000 | |
| Year | Years | (12/9/2004) | Investment | |
| PRIMECAP Core Fund | 10.39% | 4.10% | 5.20% | $13,420 |
| Dow Jones U.S. Total Stock Market | ||||
| Index | 11.51 | 1.37 | 2.28 | 11,397 |
| MSCI US Prime Market 750 Index | 10.68 | 1.10 | 1.99 | 11,212 |
| Multi-Cap Core Funds Average | 9.82 | 0.51 | 1.56 | 10,942 |
Multi-Cap Core Funds Average: Derived from data provided by Lipper Inc.
"Since Inception" performance is calculated from the inception date for both the fund and its comparative standards.
Vanguard fund returns do not reflect the 1% fee on redemptions of shares held for less than one year.
See Financial Highlights for dividend and capital gains information.
13
PRIMECAP Core Fund
Fiscal-Year Total Returns (%): December 9, 2004, Through September 30, 2010
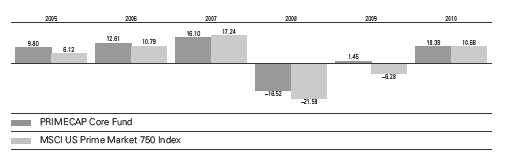
Vanguard fund returns do not reflect the 1% fee on redemptions of shares held for less than one year.
14
PRIMECAP Core Fund
Financial Statements
Statement of Net Assets
As of September 30, 2010
The fund reports a complete list of its holdings in regulatory filings four times in each fiscal year, at the quarter-ends. For the second and fourth fiscal quarters, the lists appear in the fund’s semiannual and annual reports to shareholders. For the first and third fiscal quarters, the fund files the lists with the Securities and Exchange Commission on Form N-Q. Shareholders can look up the fund’s Forms N-Q on the SEC’s website at sec.gov. Forms N-Q may also be reviewed and copied at the SEC’s Public Reference Room (see the back cover of this report for further information).
| Market | |||
| Value | |||
| Shares | ($000) | ||
| Common Stocks (98.2%) | |||
| Consumer Discretionary (13.9%) | |||
| * | Bed Bath & Beyond Inc. | 2,051,991 | 89,077 |
| * | Amazon.com Inc. | 502,800 | 78,970 |
| WhirlpoolCorp. | 891,800 | 72,200 | |
| * | CarMax Inc. | 2,003,700 | 55,823 |
| * | DIRECTV Class A | 1,184,225 | 49,299 |
| * | Kohl’s Corp. | 856,900 | 45,142 |
| TJX Cos. Inc. | 1,005,100 | 44,858 | |
| Walt Disney Co. | 1,236,100 | 40,927 | |
| Sony Corp. ADR | 1,255,600 | 38,823 | |
| Mattel Inc. | 994,600 | 23,333 | |
| Target Corp. | 396,250 | 21,176 | |
| Best Buy Co. Inc. | 442,600 | 18,071 | |
| Nordstrom Inc. | 440,400 | 16,383 | |
| Lowe’s Cos. Inc. | 725,900 | 16,180 | |
| Carnival Corp. | 370,000 | 14,138 | |
| Chico’sFAS Inc. | 850,000 | 8,942 | |
| Expedia Inc. | 108,250 | 3,054 | |
| 636,396 | |||
| Consumer Staples (2.2%) | |||
| Kellogg Co. | 765,500 | 38,665 | |
| Procter & Gamble Co. | 298,000 | 17,871 | |
| PepsiCo Inc. | 234,400 | 15,574 | |
| Avon Products Inc. | 424,600 | 13,634 | |
| Costco Wholesale Corp. | 100,000 | 6,449 | |
| Sysco Corp. | 197,700 | 5,638 | |
| 97,831 | |||
| Energy (6.7%) | |||
| Schlumberger Ltd. | 1,017,500 | 62,688 | |
| EOG Resources Inc. | 502,000 | 46,671 | |
| National Oilwell Varco Inc. | 883,000 | 39,267 | |
| * | McDermott | ||
| International Inc. | 1,578,900 | 23,336 | |
| ^ | Cameco Corp. | 780,000 | 21,629 |
| Cenovus Energy Inc. | 705,000 | 20,283 | |
| Cabot Oil & Gas Corp. | 623,200 | 18,765 | |
| Noble Energy Inc. | 200,000 | 15,018 | |
| Peabody Energy Corp. | 235,000 | 11,517�� | |
| Encana Corp. | 321,000 | 9,704 | |
| Market | |||
| Value | |||
| Shares | ($000) | ||
| Hess Corp. | 150,000 | 8,868 | |
| * | Exterran Holdings Inc. | 250,000 | 5,677 |
| Murphy Oil Corp. | 87,000 | 5,387 | |
| * | Transocean Ltd. | 67,000 | 4,307 |
| * | Pride International Inc. | 120,000 | 3,532 |
| Petroleo Brasileiro | |||
| SA ADR Type A | 80,000 | 2,626 | |
| * | Southwestern Energy Co. | 50,000 | 1,672 |
| Petroleo Brasileiro SA ADR | 39,600 | 1,436 | |
| * | Cameron International Corp. | 16,000 | 687 |
| Noble Corp. | 20,000 | 676 | |
| * | Seahawk Drilling Inc. | 2,666 | 23 |
| 303,769 | |||
| Financials (5.4%) | |||
| Marsh & McLennan | |||
| Cos. Inc. | 4,635,000 | 111,796 | |
| * | Berkshire Hathaway Inc. | ||
| Class B | 590,000 | 48,781 | |
| ChubbCorp. | 600,000 | 34,194 | |
| DiscoverFinancial | |||
| Services | 1,295,400 | 21,607 | |
| Wells Fargo & Co. | 550,000 | 13,822 | |
| Progressive Corp. | 600,000 | 12,522 | |
| Bank of New York | |||
| Mellon Corp. | 216,982 | 5,670 | |
| 248,392 | |||
| Health Care (20.8%) | |||
| * | Amgen Inc. | 3,296,800 | 181,687 |
| Eli Lilly & Co. | 3,953,900 | 144,436 | |
| Novartis AG ADR | 2,356,000 | 135,870 | |
| Roche Holding AG | 892,100 | 121,889 | |
| Medtronic Inc. | 2,754,500 | 92,496 | |
| * | Waters Corp. | 950,294 | 67,262 |
| * | Biogen Idec Inc. | 1,062,500 | 59,627 |
| GlaxoSmithKline | |||
| PLC ADR | 1,164,400 | 46,017 | |
| Johnson & Johnson | 597,000 | 36,990 | |
| * | Boston Scientific Corp. | 4,849,400 | 29,727 |
| Sanofi-Aventis SA ADR | 608,200 | 20,223 | |
| * | Illumina Inc. | 163,900 | 8,064 |
15
PRIMECAP Core Fund
| Market | |||
| Value | |||
| Shares | ($000) | ||
| * | Dendreon Corp. | 102,600 | 4,225 |
| * | Cerner Corp. | 36,000 | 3,024 |
| 951,537 | |||
| Industrials (16.0%) | |||
| Southwest Airlines Co. | 8,734,125 | 114,155 | |
| Boeing Co. | 1,502,900 | 100,003 | |
| United Parcel | |||
| Service Inc. Class B | 1,189,950 | 79,358 | |
| Honeywell | |||
| International Inc. | 1,530,000 | 67,228 | |
| FedEx Corp. | 709,200 | 60,637 | |
| Expeditors International | |||
| of Washington Inc. | 1,047,200 | 48,412 | |
| Caterpillar Inc. | 554,450 | 43,624 | |
| Rockwell Automation Inc. | 454,000 | 28,026 | |
| Union Pacific Corp. | 326,150 | 26,679 | |
| Norfolk Southern Corp. | 419,600 | 24,970 | |
| CH Robinson | |||
| Worldwide Inc. | 310,000 | 21,675 | |
| * | AMR Corp. | 3,237,740 | 20,301 |
| ^ | RitchieBros | ||
| Auctioneers Inc. | 931,000 | 19,337 | |
| * | Babcock & Wilcox Co. | 864,450 | 18,396 |
| SPX Corp. | 258,000 | 16,326 | |
| Canadian Pacific | |||
| Railway Ltd. | 231,430 | 14,101 | |
| Cummins Inc. | 105,700 | 9,574 | |
| Deere & Co. | 99,000 | 6,908 | |
| Goodrich Corp. | 89,600 | 6,606 | |
| Republic Services Inc. | |||
| Class A | 69,435 | 2,117 | |
| * | ChicagoBridge & | ||
| Iron Co. NV | 60,000 | 1,467 | |
| * | Jacobs Engineering | ||
| Group Inc. | 10,000 | 387 | |
| 730,287 | |||
| Information Technology (24.6%) | |||
| * | Intuit Inc. | 2,560,000 | 112,154 |
| Oracle Corp. | 3,795,800 | 101,917 | |
| * | Google Inc. Class A | 170,000 | 89,384 |
| Texas Instruments Inc. | 3,098,800 | 84,101 | |
| * | EMC Corp. | 3,221,000 | 65,419 |
| Telefonaktiebolaget LM | |||
| Ericsson ADR | 5,701,200 | 62,542 | |
| ASML Holding NV ADR | 2,044,900 | 60,795 | |
| * | Electronic Arts Inc. | 3,487,200 | 57,295 |
| * | SanDisk Corp. | 1,395,066 | 51,129 |
| MicrosoftCorp. | 1,994,200 | 48,838 | |
| Altera Corp. | 1,604,100 | 48,380 | |
| * | Flextronics | ||
| International Ltd. | 7,925,000 | 47,867 | |
| QUALCOMM Inc. | 971,600 | 43,839 | |
| * | Symantec Corp. | 2,263,500 | 34,337 |
| Corning Inc. | 1,756,300 | 32,105 | |
| Market | |||
| Value | |||
| Shares | ($000) | ||
| Intel Corp. | 1,627,700 | 31,301 | |
| * | Research In Motion Ltd. | 584,300 | 28,450 |
| Applied Materials Inc. | 2,258,000 | 26,373 | |
| KLA-TencorCorp. | 444,600 | 15,663 | |
| * | Motorola Inc. | 1,764,000 | 15,047 |
| Accenture PLC Class A | 298,900 | 12,700 | |
| Hewlett-Packard Co. | 277,000 | 11,653 | |
| * | CiscoSystems Inc. | 487,800 | 10,683 |
| * | eBayInc. | 304,600 | 7,432 |
| * | NVIDIA Corp. | 530,000 | 6,190 |
| * | Adobe Systems Inc. | 195,400 | 5,110 |
| * | Apple Inc. | 17,000 | 4,824 |
| Activision Blizzard Inc. | 380,000 | 4,112 | |
| * | Agilent Technologies Inc. | 70,000 | 2,336 |
| * | Yahoo! Inc. | 150,000 | 2,125 |
| XilinxInc. | 37,300 | 993 | |
| Intersil Corp. Class A | 25,000 | 292 | |
| 1,125,386 | |||
| Materials (7.6%) | |||
| Potash Corp. of | |||
| Saskatchewan Inc. | 710,100 | 102,283 | |
| Monsanto Co. | 1,396,950 | 66,956 | |
| Vulcan Materials Co. | 1,573,700 | 58,101 | |
| Praxair Inc. | 354,700 | 32,015 | |
| Newmont Mining Corp. | 440,000 | 27,636 | |
| FMC Corp. | 350,000 | 23,943 | |
| Freeport-McMoRan | |||
| Copper & Gold Inc. | 195,700 | 16,711 | |
| Domtar Corp. | 147,400 | 9,519 | |
| Weyerhaeuser Co. | 402,068 | 6,337 | |
| International Paper Co. | 100,000 | 2,175 | |
| * | Crown Holdings Inc. | 55,000 | 1,576 |
| Alcoa Inc. | 127,300 | 1,542 | |
| 348,794 | |||
| Telecommunication Services (0.3%) | |||
| * | Sprint Nextel Corp. | 3,363,650 | 15,574 |
| Utilities (0.7%) | |||
| Public Service | |||
| Enterprise Group Inc. | 340,000 | 11,247 | |
| Edison International | 250,000 | 8,598 | |
| * | AES Corp. | 726,800 | 8,249 |
| NextEra Energy Inc. | 56,700 | 3,084 | |
| 31,178 | |||
| Total Common Stocks | |||
| (Cost $3,928,266) | 4,489,144 | ||
| Temporary Cash Investment (2.4%) | |||
| Money Market Fund (2.4%) | |||
| 1,2 | Vanguard Market | ||
| Liquidity Fund, 0.261% | |||
| (Cost $108,840) | 108,839,751 | 108,840 | |
| Total Investments (100.6%) | |||
| (Cost $4,037,106) | 4,597,984 | ||
16
PRIMECAP Core Fund
| Market | |
| Value | |
| ($000) | |
| Other Assets and Liabilities (-0.6%) | |
| Other Assets | 4,741 |
| Liabilities2 | (33,541) |
| (28,800) | |
| Net Assets (100%) | |
| Applicable to 365,369,188 outstanding | |
| $.001 par value shares of beneficial | |
| interest (unlimited authorization) | 4,569,184 |
| Net Asset Value Per Share | $12.51 |
| At September 30, 2010, net assets consisted of: | |
| Amount | |
| ($000) | |
| Paid-in Capital | 4,125,064 |
| Undistributed Net Investment Income | 35,548 |
| Accumulated Net Realized Losses | (152,391) |
| Unrealized Appreciation (Depreciation) | |
| Investment Securities | 560,878 |
| Foreign Currencies | 85 |
| Net Assets | 4,569,184 |
See Note A in Notes to Financial Statements.
* Non-income-producing security.
^ Part of security position is on loan to broker-dealers. The total value of securities on loan is $18,975,000.
1 Affiliated money market fund available only to Vanguard funds and certain trusts and accounts managed by Vanguard. Rate shown is the 7-day yield.
2 Includes $19,434,000 of collateral received for securities on loan.
ADR—American Depositary Receipt.
See accompanying Notes, which are an integral part of the Financial Statements.
17
PRIMECAP Core Fund
Statement of Operations
| Year Ended | ||
| September 30, 2010 | ||
| ($000) | ||
| Investment Income | ||
| Income | ||
| Dividends1 | 71,785 | |
| Interest2 | 414 | |
| Security Lending | 671 | |
| Total Income | 72,870 | |
| Expenses | ||
| Investment Advisory Fees—Note B | 14,245 | |
| The Vanguard Group—Note C | ||
| Management and Administrative | 7,714 | |
| Marketing and Distribution | 1,154 | |
| Custodian Fees | 84 | |
| Auditing Fees | 24 | |
| Shareholders’ Reports | 66 | |
| Trustees’ Fees and Expenses | 7 | |
| Total Expenses | 23,294 | |
| Net Investment Income | 49,576 | |
| Realized Net Gain (Loss) | ||
| Investment Securities Sold | (57,063) | |
| Foreign Currencies | (28) | |
| Realized Net Gain (Loss) | (57,091) | |
| Change in Unrealized Appreciation (Depreciation) | ||
| Investment Securities | 441,198 | |
| Foreign Currencies | 86 | |
| Change in Unrealized Appreciation (Depreciation) | 441,284 | |
| Net Increase (Decrease) in Net Assets Resulting from Operations | 433,769 | |
1 Dividends are net of foreign withholding taxes of $2,131,000.
2 Interest income from an affiliated company of the fund was $414,000.
See accompanying Notes, which are an integral part of the Financial Statements.
18
PRIMECAP Core Fund
Statement of Changes in Net Assets
| Year Ended September 30, | |||
| 2010 | 2009 | ||
| ($000) | ($000) | ||
| Increase (Decrease) in Net Assets | |||
| Operations | |||
| Net Investment Income | 49,576 | 33,989 | |
| Realized Net Gain (Loss) | (57,091) | (73,798) | |
| Change in Unrealized Appreciation (Depreciation) | 441,284 | 231,060 | |
| Net Increase (Decrease) in Net Assets Resulting from Operations | 433,769 | 191,251 | |
| Distributions | |||
| Net Investment Income | (35,722) | (34,373) | |
| Realized Capital Gain | — | — | |
| Total Distributions | (35,722) | (34,373) | |
| Capital Share Transactions | |||
| Issued | 534,174 | 1,403,364 | |
| Issued in Lieu of Cash Distributions | 32,212 | 30,939 | |
| Redeemed1 | (640,251) | (599,122) | |
| Net Increase (Decrease) from Capital Share Transactions | (73,865) | 835,181 | |
| Total Increase (Decrease) | 324,182 | 992,059 | |
| Net Assets | |||
| Beginning of Period | 4,245,002 | 3,252,943 | |
| End of Period2 | 4,569,184 | 4,245,002 | |
1 Net of redemption fees for fiscal 2010 and 2009 of $819,000 and $1,191,000, respectively.
2 Net Assets—End of Period includes undistributed net investment income of $35,548,000 and $21,722,000.
See accompanying Notes, which are an integral part of the Financial Statements.
19
PRIMECAP Core Fund
Financial Highlights
| For a Share Outstanding | Year Ended September 30, | |||||
| Throughout Each Period | 2010 | 2009 | 2008 | 2007 | 2006 | |
| Net Asset Value, Beginning of Period | $11.42 | $11.41 | $14.03 | $12.28 | $10.98 | |
| Investment Operations | ||||||
| Net Investment Income | .1331 | .097 | .1382 | .095 | .090 | |
| Net Realized and Unrealized Gain | ||||||
| (Loss) on Investments | 1.051 | .030 | (2.417) | 1.861 | 1.289 | |
| Total from Investment Operations | 1.184 | .127 | (2.279) | 1.956 | 1.379 | |
| Distributions | ||||||
| Dividends from Net Investment Income | (.094) | (.117) | (.110) | (.095) | (.050) | |
| Distributions from Realized Capital Gains | — | — | (.231) | (.111) | (.029) | |
| Total Distributions | (.094) | (.117) | (.341) | (.206) | (.079) | |
| Net Asset Value, End of Period | $12.51 | $11.42 | $11.41 | $14.03 | $12.28 | |
| Total Return3 | 10.39%�� | 1.45% | -16.52% | 16.10% | 12.61% | |
| Ratios/Supplemental Data | ||||||
| Net Assets, End of Period (Millions) | $4,569 | $4,245 | $3,253 | $3,305 | $2,208 | |
| Ratio of Total Expenses to | ||||||
| Average Net Assets | 0.51% | 0.54% | 0.50% | 0.55% | 0.60% | |
| Ratio of Net Investment Income to | ||||||
| Average Net Assets | 1.09%1 | 1.10% | 1.12%2 | 0.73% | 0.90% | |
| Portfolio Turnover Rate | 8% | 5% | 9% | 10% | 5% | |
1 Net investment income per share and the ratio of net investment income to average net assets include $.019 and 0.15%, respectively, resulting from a special dividend from Weyerhaeuser Co. in July 2010.
2 Net investment income per share and the ratio of net investment income to average net assets include $.027 and 0.23%, respectively, resulting from a special dividend from ASML Holding NV in October 2007.
3 Total returns do not include transaction or account service fees that may have applied in the periods shown. Fund prospectuses provide information about any applicable transaction and account service fees.
See accompanying Notes, which are an integral part of the Financial Statements.
20
PRIMECAP Core Fund
Notes to Financial Statements
Vanguard PRIMECAP Core Fund is registered under the Investment Company Act of 1940 as an open-end investment company, or mutual fund.
A. The following significant accounting policies conform to generally accepted accounting principles for U.S. mutual funds. The fund consistently follows such policies in preparing its financial statements.
1. Security Valuation: Securities are valued as of the close of trading on the New York Stock Exchange (generally 4 p.m., Eastern time) on the valuation date. Equity securities are valued at the latest quoted sales prices or official closing prices taken from the primary market in which each security trades; such securities not traded on the valuation date are valued at the mean of the latest quoted bid and asked prices. Securities for which market quotations are not readily available, or whose values have been affected by events occurring before the fund’s pricing time but after the close of the securities’ primary markets, are valued at their fair values calculated according to procedures adopted by the board of trustees. These procedures include obtaining quotations from an independent pricing service, monitoring news to identify significant market- or security-specific events, and evaluating changes in the values of foreign market proxies (for example, ADRs, futures contracts, or exchange-traded funds), between the time the foreign markets close and the fund’s pricing time. When fair-value pricing is employed, the prices of securities used by a fund to calculate its net asset value may differ from quoted or published prices for the same securities. Investments in Vanguard Market Liquidity Fund are valued at that fund’s net asset value.
2. Foreign Currency: Securities and other assets and liabilities denominated in foreign currencies are translated into U.S. dollars us ing exchange rates obtained from an independent third party as of the fund’s pricing time on the valuation date. Realized gains (losses) and unrealized appreciation (depreciation) on investment securities include the effects of changes in exchange rates since the securities were purchased, combined with the effects of changes in security prices. Fluctuations in the value of other assets and liabilities resulting from changes in exchange rates are recorded as unrealized foreign currency gains (losses) until the assets or liabilities are settled in cash, at which time they are recorded as realized foreign currency gains (losses).
3. Federal Income Taxes: The fund intends to continue to qualify as a regulated investment company and distribute all of its taxable income. Management has analyzed the fund’s tax positions taken for all open federal income tax years (September 30, 2007–2010), and has concluded that no provision for federal income tax is required in the fund’s financial statements.
4. Distributions: Distributions to shareholders are recorded on the ex-dividend date.
5. Security Lending: The fund may lend its securities to qualified institutional borrowers to earn addi tional income. Security loans are required to be secured at all times by collateral at least equal to the market value of securities loaned. The fund invests cash collateral received in Vanguard Market Liquidity Fund, and records a liability for the return of the collateral, during the period the securities are on loan. Security lending income represents fees charged to borrowers plus income earned on investing cash collateral, less expenses associated with the loan.
6. Other: Dividend income is recorded on the ex-dividend date. Interest income includes income distributions received from Vanguard Market Liquidity Fund and is accrued daily. Security transactions are accounted for on the date securities are bought or sold. Costs used to determine realized gains (losses) on the sale of investment securities are those of the specific securities sold. Fees assessed on redemptions of capital shares are credited to paid-in capital.
21
PRIMECAP Core Fund
B. PRIMECAP Management Company provides investment advisory services to the fund for a fee calculated at an annual percentage rate of average net assets. For the year ended September 30, 2010, the investment advisory fee represented an effective annual rate of 0.31% of the fund’s average net assets.
C. The Vanguard Group furnishes at cost corporate management, administrative, marketing, and distribution services. The costs of such services are allocated to the fund under methods approved by the board of trustees. The fund has committed to provide up to 0.40% of its net assets in capital contributions to Vanguard. At September 30, 2010, t he fund had contributed capital of $793,000 to Vanguard (included in Other Assets), representing 0.02% of the fund’s net assets and 0.32% of Vanguard’s capitalization. The fund’s trustees and off icers are also directors and officers of Vanguard.
D. Various inputs may be used to determine the value of the fund’s investments. These inputs are summarized in three broad levels for financial statement purposes. The inputs or methodologies used to value securities are not necessarily an indication of the risk associated wit h investing in those securities.
Level 1—Quoted prices in active markets for identical securities.
Level 2—Other significant observable inputs (including quoted prices for similar securities, interest rates, prepayment speeds, credit risk, etc.).
Level 3—Significant unobservable inputs (including the fund’s own assumptions used to determine the fair value of investments).
The following table summarizes the fund’s investments as of September 30, 2010, based on the inputs used to value them:
| Level 1 | Level 2 | Level 3 | |
| Investments | ($000) | ($000) | ($000) |
| Common Stocks | 4,367,255 | 121,889 | — |
| Temporary Cash Investments | 108,840 | — | — |
| Total | 4,476,095 | 121,889 | — |
E. Distributions are determined on a tax basis and may differ from net investment income and realized capital gains for financi al reporting purposes. Differences may be permanent or temporary. Permanent differences are reclassified among capital accounts in the financial statements to reflect their tax character. Temporary differences arise when certain items of income, expense, gain, or loss are recognized in different periods for financial statement and tax purposes; these differences will reverse at some time in the future. Differences in classification may also result from the treatment of short-term gains as ordinary income for tax purposes.
During the year ended September 30, 2010, the fund realized net foreign currency losses of $28,000, which decreased distributable net income for tax purposes; accordingly, such losses have been reclassified from accumulated net realized losses to undistributed net investment income.
During the year ended September 30, 2010, the fund realized $6,396,000 of net capital gains resulting from in-kind redemptions—in which shareholders exchanged fund shares for securities held by the fund rather than for cash. Because such gains are not taxable to the fund, and are not distributed to shareholders, they have been reclassified from accumulated net realized losses to paid-in capital.
22
PRIMECAP Core Fund
For tax purposes, at September 30, 2010, the fund had $41,158,000 of ordinary income available for distribution. The fund had available capital loss carryforwards to taling $89,089,000 to offset future net capital gains of $15,115,000 through September 30, 2017, and $73,974,000 through September 30, 2018. In addition, the fund realized losses of $54,028,000 during the period from November 1, 2009, through September 30, 2010, which are deferred and will be treated as realized for tax purposes in fiscal 2011.
At September 30, 2010, the cost of investment securities for tax purposes was $4,046,382,000. Net unrealized appreciation of investment securities for tax purposes was $551,602,000, consisting of unrealized gains of $845,161,000 on securities that had risen in value since their purchase and $293,559,000 in unrealized losses on securities that had fallen in value since their purchase.
F. During the year ended September 30, 2010, the fund purchased $526,129,000 of investment securities and sold $379,768,000 of investment securities, other than temporary cash investments.
G. Capital shares issued and redeemed were:
| Year Ended September 30, | |||
| 2010 | 2009 | ||
| Shares | Shares | ||
| (000) | (000) | ||
| Issued | 44,581 | 148,431 | |
| Issued in Lieu of Cash Distributions | 2,634 | 3,602 | |
| Redeemed | (53,549) | (65,435) | |
| Net Increase (Decrease) in Shares Outstanding | (6,334) | 86,598 | |
H. In preparing the financial statements as of September 30, 2010, management considered the impact of subsequent events for potential recognition or disclosure in these financial statements.
23
Report of Independent Registered Public Accounting Firm
To the Trustees of Vanguard Fenway Funds and the Shareholders of the Vanguard PRIMECAP Core Fund:
In our opinion, the accompanying statement of net assets and the related statements of operations and of changes in net assets and the financial highlights present fairly, in all material respects, the financial position of the Vanguard PRIMECAP Core Fund (constituting a separate portfolio of Vanguard Fenway Funds, hereafter referred to as the “Fund”) at September 30, 2010, the results of its operations for the year then ended, the changes in its net assets for each of the two years in the period then ended and the financial highlights for each of the five years in the period then ended, in conformity with accounting principles generally accepted in the United States of America. These financial statements and financial highlights (hereafter referred to as “financial statements”) are the responsibility of the Fund’s management; our responsibility is to express an opinion on these financial statements based on our audits. We conducted our audits of these financial statements in accordance with the standards of the Public Company Accounting Oversight Board (United States). Those standards require that we plan and perform the audit to obtain reasonable assurance about whether the financial statements are free of material misstatement. An au dit includes examining, on a test basis, evidence supporting the amounts and disclosures in the financial statements, assessing the accounting principles used and significant estimates made by management, and evaluating the overall financial statement presentation. We believe th at our audits, which included confirmation of securities at September 30, 2010 by correspondence with the custodian and by agreement to the underlying ownership records of Vanguard Market Liquidity Fund, provide a reasonable basis for our opinion.
PricewaterhouseCoopers LLP
Philadelphia, Pennsylvania
November 8, 2010

Special 2010 tax information (unaudited) for Vanguard PRIMECAP Core Fund
This information for the fiscal year ended September 30, 2010, is included pursuant to provisions of the Internal Revenue Code.
The fund distributed $35,722,000 of qualified dividend income to shareholders during the fiscal year.
For corporate shareholders, 100% of investment income (dividend income plus short-term gains, if any) qualifies for the dividends-received deduction.
24
Your Fund’s After-Tax Returns
This table presents returns for your fund both before and after taxes. The after-tax returns are shown in two ways: (1) assuming that an investor owned the fund during the entire period and paid taxes on the fund’s distributions, and (2) assuming that an investor paid taxes on the fund’s distributions and sold all shares at the end of each period.
Calculations are based on the highest individual federal income tax and capital gains tax rates in effect at the times of the distributions and the hypothetical sales. State and local taxes were not considered. After-tax returns reflect any qualified dividend income , using actual prior-year figures and estimates for 2010. (In the example, returns after the sale of fund shares may be higher than those assuming no sale. This occurs when the sale would have produced a capital loss. The calculation assumes that the investor received a tax deduction for the loss.)
Please note that your actual after-tax returns will depend on your tax situation and may differ from those shown. Also note that if you own the fund in a tax-deferred account, such as an individual retirement account or a 401(k) plan, this information does not apply to you. Such accounts are not subject to current taxes.
Finally, keep in mind that a fund’s performance—whether before or after taxes—does not guarantee future results.
Average Annual Total Returns: PRIMECAP Core Fund
Periods Ended September 30, 2010
| Since | |||
| One | Five | Inception | |
| Year | Years | (12/9/2004) | |
| Returns Before Taxes | 10.39% | 4.10% | 5.20% |
| Returns After Taxes on Distributions | 10.26 | 3.85 | 4.98 |
| Returns After Taxes on Distributions and Sale of Fund Shares | 6.91 | 3.48 | 4.45 |
Returns do not reflect the 1% fee on redemptions of shares held for less than one year.
25
About Your Fund’s Expenses
As a shareholder of the fund, you incur ongoing costs, which include costs for portfolio management, administrative services, and shareholder reports (like this one), among others. Operating expenses, which are deducted from a fund’s gross income, directly reduce the investment return of the fund.
A fund’s expenses are expressed as a percentage of its average net assets. This figure is known as the expense ratio. The following examples are intended to help you understand the ongoing costs (in dollars) of investing in your fund and to compare these costs with those of other mutual funds. The examples are based on an investment of $1,000 made at the beginning of the period shown and held for the entire period.
The accompanying table illustrates your fund’s costs in two ways:
• Based on actual fund return. This section helps you to estimate the actual expenses that you paid over the period. The ”Ending Account Value“ shown is derived from the fund‘s actual return, and the third column shows the dollar amount that would have been paid by an investor who started with $1,000 in the fund. You may use the information here, together with the amount you invested, to estimate the expenses that you paid over the period.
To do so, simply divide your account value by $1,000 (for example, an $8,600 account value divided by $1,000 = 8.6), then multiply the result by the number given for your fund under the heading ”Expenses Paid During Period.“
• Based on hypothetical 5% yearly return. This section is intended to help you compare your fund‘s costs with those of other mutual funds. It assumes that the fund had a yearly return of 5% before expenses, but that the expense ratio is unchanged. In this case—because the return used is not the fund’s actual return—the results do not apply to your investment. The example is useful in making comparisons because the Securities and Exchange Commission requires all mutual funds to calculate expenses based on a 5% return. You can assess your fund’s costs by comparing this hypothetical example with the hypothetical examples that appear in shareholder reports of other funds.
Note that the expenses shown in the table are meant to highlight and help you compare ongoing costs only and do not reflect transaction costs incurred by the fund for buying and selling securities. Further, the expenses do not include the 1% fee on redemptions of shares held for less than one year, nor do they include the account service fee described in the prospectus. If such fees were applied to your account, your costs would be higher. Your fund does not carry a “sales load.”
The calculations assume no shares were bought or sold during the period. Your actual costs may have been higher or lower, depending on the amount of your investment and the timing of any purchases or redemptions.
You can find more information about the fund’s expenses, including annual expense ratios, in the Financial Statements section of this report. For additional information on operating expenses and other shareholder costs, please refer to your fund’s current prospectus.
26
| Six Months Ended September 30, 2010 | |||
| Beginning | Ending | Expenses | |
| Account Value | Account Value | Paid During | |
| PRIMECAP Core Fund | 3/31/2010 | 9/30/2010 | Period |
| Based on Actual Fund Return | $1,000.00 | $985.82 | $2.54 |
| Based on Hypothetical 5% Yearly Return | 1,000.00 | 1,022.51 | 2.59 |
The calculations are based on expenses incurred in the most recent six-month period. The fund’s annualized six-month expense ratio for that period is 0.51%. The dollar amounts shown as “Expenses Paid” are equal to the annualized expense ratio multiplied by the average account value over the period, multiplied by the number of days in the most recent six-month period, then divided by the number of days in the most recent 12-month period.
27
Glossary
30-Day SEC Yield. A fund’s 30-day SEC yield is derived using a formula specified by the U.S. Securities and Exchange Commission. Under the formula, data related to the fund’s security holdings in the previous 30 days are used to calculate the fund’s hypothetical net income for that period, which is then annualized and divided by the fund’s estimated average net assets over the calculation period. For the purposes of this calculation, a security’s income is based on its current market yield to maturity (in the case of bonds) or its projected dividend yield (for stocks). Because the SEC yield represents hypothetical annualized income, it will differ—at times significantly—from the fund’s actual experience. As a result, the fund’s income distributions may be higher or lower than implied by the SEC yield.
Beta. A measure of the magnitude of a fund’s past share-price fluctuations in relation to the ups and downs of a given market index. The index is assigned a beta of 1.00. Compared with a given index, a fund with a beta of 1.20 typically would have seen its share price rise or fall by 12% when the index rose or fell by 10%. For this report, beta is based on returns over the past 36 months for both the fund and the index. Note that a fund’s beta should be reviewed in conjunction with its R-squared (see definition). The lower the R-squared, the less correlation there is between the fund and the index, and the less reliable beta is as an indicator of volatility.
Dividend Yield. Dividend income earned by stocks, expressed as a percentage of the aggregate market value (or of net asset value, for a fund). The yield is determined by dividing the amount of the annual dividends by the aggregate value (or net asset value) at the end of the period. For a fund, the dividend yield is based solely on stock holdings and does not include any income produced by other investments.
Earnings Growth Rate. The average annual rate of growth in earnings over the past five years for the stocks now in a fund.
Equity Exposure. A measure that reflects a fund’s investments in stocks and stock futures. Any holdings in short-term reserves are excluded.
Expense Ratio. The percentage of a fund’s average net assets used to pay its annual administrative and advisory expenses. These expenses directly reduce returns to investors.
Foreign Holdings. The percentage of a fund represented by stocks or depositary receipts of companies based outside the United States.
Inception Date. The date on which the assets of a fund (or one of its share classes) are first invested in accordance with the fund’s investment objective. For funds with a subscription period, the inception date is the day after that period ends. Investment performance is measured from the inception date.
Median Market Cap. An indicator of the size of companies in which a fund invests; the midpoint of market capitalization (market price x shares outstanding) of a fund’s stocks, weighted by the proportion of the fund’s assets invested in each stock. Stocks representing half of the fund’s assets have market capitalizations above the median, and the rest are below it.
Price/Book Ratio. The share price of a stock divided by its net worth, or book value, per share. For a fund, the weighted average price/book ratio of the stocks it holds.
28
Price/Earnings Ratio. The ratio of a stock’s current price to its per-share earnings over the past year. For a fund, the weighted average P/E of the stocks it holds. P/E is an indicator of market expectations about corporate prospects; the higher the P/E, the greater the expectations for a company’s future growth.
R-Squared. A measure of how much of a fund’s past returns can be explained by the returns from the market in general, as measured by a given index. If a fund’s total returns were precisely synchronized with an index’s returns, its R-squared would be 1.00. If the fund’s returns bore no relationship to the index’s returns, its R-squared would be 0. For this report, R-squared is based on returns over the past 36 months for both the fund and the index.
Return on Equity. The annual average rate of return generated by a company during the past five years for each dollar of shareholder’s equity (net income divided by shareholder’s equity). For a fund, the weighted average return on equity for the companies whose stocks it holds.
Short-Term Reserves. The percentage of a fund invested in highly liquid, short-term securities that can be readily converted to cash.
Turnover Rate. An indication of the fund’s trading activity. Funds with high turnover rates incur higher transaction costs and may be more likely to distribute capital gains (which may be taxable to investors). The turnover rate excludes in-kind transactions, which have minimal impact on costs.
29
This page intentionally left blank.
This page intentionally left blank.
The People Who Govern Your Fund
The trustees of your mutual fund are there to see that the fund is operated and managed in your best interests since, as a shareholder, you are a part owner of the fund. Your fund’s trustees also serve on the board of directors of The Vanguard Group, Inc., which is owned by the Vanguard funds and provides services to them on an at-cost basis.
A majority of Vanguard’s board members are independent, meaning that they have no affiliation with Vanguard or the funds they oversee, apart from the sizable personal investments they have made as private individuals. The independent board members have distinguished backgrounds in business, academia, and public service. Each of the trustees and executive officers oversees 178 Vanguard funds.
The following table provides information for each trustee and executive officer of the fund. More information about the trustees is in the Statement of Additional Information, which can be obtained, without charge, by contacting Vanguard at 800-662-7447, or online at Vanguard.com.
| Interested Trustee1 | Amy Gutmann |
| Born 1949. Trustee Since June 2006. Principal | |
| F. William McNabb III | Occupation(s) During the Past Five Years: President |
| Born 1957. Trustee Since July 2009. Chairman of the | of the University of Pennsylvania; Christopher H. |
| Board. Principal Occupation(s) During the Past Five | Browne Distinguished Professor of Political Science |
| Years: Chairman of the Board of The Vanguard Group, | in the School of Arts and Sciences with secondary |
| Inc., and of each of the investment companies served | appointments at the Annenberg School for Commu- |
| by The Vanguard Group, since January 2010; Director | nication and the Graduate School of Education |
| of The Vanguard Group since 2008; Chief Executive | of the University of Pennsylvania; Director of |
| Officer and President of The Vanguard Group and of | Carnegie Corporation of New York, Schuylkill River |
| each of the investment companies served by The | Development Corporation, and Greater Philadelphia |
| Vanguard Group since 2008; Director of Vanguard | Chamber of Commerce; Trustee of the National |
| Marketing Corporation; Managing Director of The | Constitution Center; Chair of the Presidential |
| Vanguard Group (1995–2008) . | Commission for the Study of Bioethical Issues. |
| JoAnn Heffernan Heisen | |
| Independent Trustees | Born 1950. Trustee Since July 1998. Principal |
| Occupation(s) During the Past Five Years: Corporate | |
| Emerson U. Fullwood | Vice President and Chief Global Diversity Officer |
| Born 1948. Trustee Since January 2008. Principal | since 2006 (retired 2008) and Member of the |
| Occupation(s) During the Past Five Years: Executive | Executive Committee (retired 2008) of Johnson & |
| Chief Staff and Marketing Officer for North America | Johnson (pharmaceuticals/consumer products); Vice |
| and Corporate Vice President (retired 2008) of Xerox | President and Chief Information Officer of Johnson & |
| Corporation (document management products and | Johnson (1997–2005); Director of the University |
| services); Director of SPX Corporation (multi-industry | Medical Center at Princeton and Women’s Research |
| manufacturing), the United Way of Rochester, | and Education Institute; Member of the Advisory |
| Amerigroup Corporation (managed health care), | Board of the Maxwell School of Citizenship and Public |
| the University of Rochester Medical Center, and | Affairs at Syracuse University. |
| Monroe Community College Foundation. | |
| F. Joseph Loughrey | |
| Rajiv L. Gupta | Born 1949. Trustee Since October 2009. Principal |
| Born 1945. Trustee Since December 2001.2 | Occupation(s) During the Past Five Years: President |
| Principal Occupation(s) During the Past Five Years: | and Chief Operating Officer since 2005 (retired 2009) |
| Chairman and Chief Executive Officer (retired 2009) | and Vice Chairman of the Board (2008–2009) of |
| and President (2006–2008) of Rohm and Haas Co. | Cummins Inc. (industrial machinery); Director of |
| (chemicals); Director of Tyco International, Ltd. | SKF AB (industrial machinery), Hillenbrand, Inc. |
| (diversified manufacturing and services) and Hewlett- | (specialized consumer services), Sauer-Danfoss Inc. |
| Packard Co. (electronic computer manufacturing); | (machinery), the Lumina Foundation for Education, |
| Trustee of The Conference Board; Member of the | and Oxfam America; Chairman of the Advisory |
| Board of Managers of Delphi Automotive LLP | Council for the College of Arts and Letters at the |
| (automotive components) . | University of Notre Dame. |
| André F. Perold | Kathryn J. Hyatt | |
| Born 1952. Trustee Since December 2004. Principal | Born 1955. Treasurer Since November 2008. Principal | |
| Occupation(s) During the Past Five Years: George | Occupation(s) During the Past Five Years: Principal | |
| Gund Professor of Finance and Banking at the Harvard | of The Vanguard Group, Inc.; Treasurer of each of | |
| Business School; Chair of the Investment Committee | the investment companies served by The Vanguard | |
| of HighVista Strategies LLC (private investment firm) . | Group since 2008; Assistant Treasurer of each of the | |
| investment companies served by The Vanguard Group | ||
| Alfred M. Rankin, Jr. | (1988–2008) . | |
| Born 1941. Trustee Since January 1993. Principal | ||
| Occupation(s) During the Past Five Years: Chairman, | Heidi Stam | |
| President, and Chief Executive Officer of NACCO | Born 1956. Secretary Since July 2005. Principal | |
| Industries, Inc. (forklift trucks/housewares/lignite); | Occupation(s) During the Past Five Years: Managing | |
| Director of Goodrich Corporation (industrial products/ | Director of The Vanguard Group, Inc., since 2006; | |
| aircraft systems and services); Chairman of the | General Counsel of The Vanguard Group since 2005; | |
| Federal Reserve Bank of Cleveland; Trustee of The | Secretary of The Vanguard Group and of each of the | |
| Cleveland Museum of Art. | investment companies served by The Vanguard Group | |
| since 2005; Director and Senior Vice President of | ||
| Peter F. Volanakis | Vanguard Marketing Corporation since 2005; | |
| Born 1955. Trustee Since July 2009. Principal | Principal of The Vanguard Group (1997–2006). | |
| Occupation(s) During the Past Five Years: President | ||
| since 2007 and Chief Operating Officer since 2005 | ||
| of Corning Incorporated (communications equipment); | Vanguard Senior Management Team | |
| President of Corning Technologies (2001–2005); | ||
| Director of Corning Incorporated and Dow Corning; | R. Gregory Barton | Michael S. Miller |
| Trustee of the Corning Incorporated Foundation and | Mortimer J. Buckley | James M. Norris |
| the Corning Museum of Glass; Overseer of the | Kathleen C. Gubanich | Glenn W. Reed |
| Amos Tuck School of Business Administration at | Paul A. Heller | George U. Sauter |
| Dartmouth College. | ||
| Chairman Emeritus and Senior Advisor | ||
| Executive Officers | ||
| John J. Brennan | ||
| Glenn Booraem | Chairman, 1996–2009 | |
| Born 1967. Controller Since July 2010. Principal | Chief Executive Officer and President, 1996–2008 | |
| Occupation(s) During the Past Five Years: Principal | ||
| of The Vanguard Group, Inc.; Controller of each of | ||
| the investment companies served by The Vanguard | Founder | |
| Group since 2010; Assistant Controller of each of | ||
| the investment companies served by The Vanguard | John C. Bogle | |
| Group (2001–2010) . | Chairman and Chief Executive Officer, 1974–1996 | |
| Thomas J. Higgins | ||
| Born 1957. Chief Financial Officer Since September | ||
| 2008. Principal Occupation(s) During the Past Five | ||
| Years: Principal of The Vanguard Group, Inc.; Chief | ||
| Financial Officer of each of the investment companies | ||
| served by The Vanguard Group since 2008; Treasurer | ||
| of each of the investment companies served by The | ||
| Vanguard Group (1998–2008) . | ||
1 Mr. McNabb is considered an “interested person,” as defined in the Investment Company Act of 1940, because he is an officer of the Vanguard funds.
2 December 2002 for Vanguard Equity Income Fund, Vanguard Growth Equity Fund, the Vanguard Municipal Bond Funds, and the Vanguard State Tax-Exempt Funds.
 | |
| P.O. Box 2600 | |
| Valley Forge, PA 19482-2600 |
Connect with Vanguard® > Vanguard.com
| Fund Information > 800-662-7447 | |
| Direct Investor Account Services > 800-662-2739 | |
| Institutional Investor Services > 800-523-1036 | |
| Text Telephone for People | |
| With Hearing Impairment > 800-749-7273 | |
| This material may be used in conjunction | |
| with the offering of shares of any Vanguard | |
| fund only if preceded or accompanied by | |
| the fund’s current prospectus. | |
| All comparative mutual fund data are from Lipper Inc. or | |
| Morningstar, Inc., unless otherwise noted. | |
| You can obtain a free copy of Vanguard’s proxy voting | |
| guidelines by visiting vanguard.com/proxyreporting or by | |
| calling Vanguard at 800-662-2739. The guidelines are | |
| also available from the SEC’s website, sec.gov. In | |
| addition, you may obtain a free report on how your fund | |
| voted the proxies for securities it owned during the 12 | |
| months ended June 30. To get the report, visit either | |
| vanguard.com/proxyreporting or sec.gov. | |
| You can review and copy information about your fund at | |
| the SEC’s Public Reference Room in Washington, D.C. To | |
| find out more about this public service, call the SEC at | |
| 202-551-8090. Information about your fund is also | |
| available on the SEC’s website, and you can receive | |
| copies of this information, for a fee, by sending a | |
| request in either of two ways: via e-mail addressed to | |
| publicinfo@sec.gov or via regular mail addressed to the | |
| Public Reference Section, Securities and Exchange | |
| Commission, Washington, DC 20549-1520. | |
| © 2010 The Vanguard Group, Inc. | |
| All rights reserved. | |
| Vanguard Marketing Corporation, Distributor. | |
| Q12200 112010 | |
Item 2: Code of Ethics. The Registrant has adopted a code of ethics that applies to the Registrant’s principal executive officer, principal financial officer, principal accounting officer or controller or persons performing similar functions. The Code of Ethics was amended during the reporting period covered by this report to make certain technical, non-material changes.
Item 3: Audit Committee Financial Expert. The following members of the Audit Committee have been determined by the Registrant’s Board of Trustees to be Audit Committee Financial Experts serving on its Audit Committee, and to be independent: Charles D. Ellis, Rajiv L. Gupta, JoAnn Heffernan Heisen, André F. Perold, and Alfred M. Rankin, Jr.
Item 4: Principal Accountant Fees and Services.
(a) Audit Fees.
Audit Fees of the Registrant
Fiscal Year Ended September 30, 2010: $76,000
Fiscal Year Ended September 30, 2009: $68,000
Aggregate Audit Fees of Registered Investment Companies in the Vanguard Group.
Fiscal Year Ended September 30, 2010: $3,607,060
Fiscal Year Ended September 30, 2009: $3,354,640
(b) Audit-Related Fees.
Fiscal Year Ended September 30, 2010: $791,350
Fiscal Year Ended September 30, 2009: $876,210
Includes fees billed in connection with assurance and related services provided to the Registrant, The Vanguard Group, Inc., Vanguard Marketing Corporation, and other registered investment companies in the Vanguard Group.
(c) Tax Fees.
Fiscal Year Ended September 30, 2010: $336,090
Fiscal Year Ended September 30, 2009: $423,070
Includes fees billed in connection with tax compliance, planning and advice services provided to the Registrant, The Vanguard Group, Inc., Vanguard Marketing Corporation, and other registered investment companies in the Vanguard Group and related to income and excise taxes.
(d) All Other Fees.
Fiscal Year Ended September 30, 2010: $16,000
Fiscal Year Ended September 30, 2009: $0
Includes fees billed for services related to risk management and privacy matters. Services were provided to the Registrant, The Vanguard Group, Inc., Vanguard Marketing Corporation, and other registered investment companies in the Vanguard Group.
(e) (1) Pre-Approval Policies. The policy of the Registrant’s Audit Committee is to consider and, if appropriate, approve before the principal accountant is engaged for such services, all specific audit and non-audit services provided to: (1) the Registrant; (2) The Vanguard Group, Inc.; (3) other entities controlled by The Vanguard Group, Inc. that provide ongoing services to the Registrant; and (4) other registered investment companies in the Vanguard Group. In making a determination, the Audit Committee considers whether the services are consistent with maintaining the principal accountant’s independence.
In the event of a contingency situation in which the principal accountant is needed to provide services in between scheduled Audit Committee meetings, the Chairman of the Audit Committee would be called on to consider and, if appropriate, pre-approve audit or permitted non-audit services in an amount sufficient to complete services through the next Audit Committee meeting, and to determine if such services would be consistent with maintaining the accountant’s independence. At the next scheduled Audit Committee meeting, services and fees would be presented to the Audit Committee for formal consideration, and, if appropriate, approval by the entire Audit Committee. The Audit Committee would again consider whether such services and fees are consistent with maintaining the principal accountant’s independence.
The Registrant’s Audit Committee is informed at least annually of all audit and non-audit services provided by the principal accountant to the Vanguard complex, whether such services are provided to: (1) the Registrant; (2) The Vanguard Group, Inc.; (3) other entities controlled by The Vanguard Group, Inc. that provide ongoing services to the Registrant; or (4) other registered investment companies in the Vanguard Group.
(2) No percentage of the principal accountant’s fees or services were approved pursuant to the waiver provision of paragraph (c)(7)(i)(C) of Rule 2-01 of Regulation S-X.
(f) For the most recent fiscal year, over 50% of the hours worked under the principal accountant’s engagement were not performed by persons other than full-time, permanent employees of the principal accountant.
(g) Aggregate Non-Audit Fees.
Fiscal Year Ended September 30, 2010: $352,090
Fiscal Year Ended September 30, 2009: $423,070
Includes fees billed for non-audit services provided to the Registrant, The Vanguard Group, Inc., Vanguard Marketing Corporation, and other registered investment companies in the Vanguard Group.
(h) For the most recent fiscal year, the Audit Committee has determined that the provision of all non-audit services was consistent with maintaining the principal accountant’s independence.
Item 5: Audit Committee of Listed Registrants.
Not Applicable.
Item 6: Investments.
Not Applicable.
Item 7: Disclosure of Proxy Voting Policies and Procedures for Closed-End Management Investment Companies.
Not Applicable.
Item 8: Portfolio Managers of Closed-End Management Investment Companies.
Not Applicable.
Item 9: Purchase of Equity Securities by Closed-End Management Investment Company and Affiliated Purchasers.
Not Applicable.
Item 10: Submission of Matters to a Vote of Security Holders.
Not Applicable.
Item 11: Controls and Procedures.
(a) Disclosure Controls and Procedures. The Principal Executive and Financial Officers concluded that the Registrant's Disclosure Controls and Procedures are effective based on their evaluation of the Disclosure Controls and Procedures as of a date within 90 days of the filing date of this report.
(b) Internal Control Over Financial Reporting. There were no significant changes in Registrant’s Internal Control Over Financial Reporting or in other factors that could significantly affect this control subsequent to the date of the evaluation, including any corrective actions with regard to significant deficiencies and material weaknesses.
Item 12: Exhibits.
(a) Code of Ethics.
(b) Certifications.
Pursuant to the requirements of the Securities Exchange Act of 1934 and the Investment Company Act of 1940, the registrant has duly caused this report to be signed on its behalf by the undersigned, thereunto duly authorized.
| VANGUARD FENWAY FUNDS | |
| By: | /s/ F. WILLIAM MCNABB III* |
| F. WILLIAM MCNABB III | |
| CHIEF EXECUTIVE OFFICER | |
| Date: November 18, 2010 | |
Pursuant to the requirements of the Securities Exchange Act of 1934 and the Investment Company Act of 1940, this report has been signed below by the following persons on behalf of the registrant and in the capacities and on the dates indicated.
| VANGUARD FENWAY FUNDS | |
| By: | /s/ F. WILLIAM MCNABB III* |
| F. WILLIAM MCNABB III | |
| CHIEF EXECUTIVE OFFICER | |
| Date: November 18, 2010 | |
| VANGUARD FENWAY FUNDS | |
| By: | /s/ THOMAS J. HIGGINS* |
| THOMAS J. HIGGINS | |
| CHIEF FINANCIAL OFFICER | |
| Date: November 18, 2010 | |
* By: /s/ Heidi Stam
Heidi Stam, pursuant to a Power of Attorney filed on April 26, 2010, see file Number
33-53683, Incorporated by Reference.