UNITED STATES
SECURITIES AND EXCHANGE COMMISSION
Washington, D.C. 20549
FORM N-CSR
CERTIFIED SHAREHOLDER REPORT
OF
REGISTERED MANAGEMENT INVESTMENT COMPANIES
Investment Company Act file number: 811-05445
Name of Registrant: Vanguard Fenway Funds
Address of Registrant:
P.O. Box 2600
Valley Forge, PA 19482
Name and address of agent for service:
Heidi Stam, Esquire
P.O. Box 876
Valley Forge, PA 19482
Registrant’s telephone number, including area code: (610) 669-1000
Date of fiscal year end: September 30
Date of reporting period: October 1, 2011 – September 30, 2012
Item 1: Reports to Shareholders
|
| Annual Report | September 30, 2012 |
| Vanguard Equity Income Fund |
 |
> For the 12 months ended September 30, 2012, Vanguard Equity Income Fund returned about 29%, in line with the fund’s benchmark and well ahead of the average return of equity income funds.
> Much of the gain occurred in the first half of the period as optimism rose regarding economic growth in the United States and the European debt crisis seemed to stabilize somewhat.
> All ten of the fund’s industry sectors recorded returns of more than 17%; consumer discretionary was the standout performer.
| Contents | |
| Your Fund’s Total Returns. | 1 |
| Chairman’s Letter. | 2 |
| Advisors’ Report. | 8 |
| Fund Profile. | 11 |
| Performance Summary. | 12 |
| Financial Statements. | 14 |
| Your Fund’s After-Tax Returns. | 27 |
| About Your Fund’s Expenses. | 28 |
| Glossary. | 30 |
Please note: The opinions expressed in this report are just that—informed opinions. They should not be considered promises or advice. Also, please keep in mind that the information and opinions cover the period through the date on the front of this report. Of course, the risks of investing in your fund are spelled out in the prospectus.
See the Glossary for definitions of investment terms used in this report.
About the cover: Our cover photograph shows rigging on the HMSSurprise, a replica of an 18th-century Royal Navy frigate. It was featured in the 2003 movie Master and Commander: The Far Side of the World, which was based on Patrick O’Brian’s sea novels, set amid the Napoleonic Wars. Vanguard was named for another ship of that era, the HMSVanguard, which was the flagship of British Admiral Horatio Nelson at the Battle of the Nile.
Your Fund’s Total Returns
| Fiscal Year Ended September 30, 2012 | |
| Total | |
| Returns | |
| Vanguard Equity Income Fund | |
| Investor Shares | 29.00% |
| Admiral™ Shares | 29.06 |
| FTSE High Dividend Yield Index | 28.89 |
| Equity Income Funds Average | 25.02 |
| Equity Income Funds Average: Derived from data provided by Lipper Inc. | |
| Admiral Shares carry lower expenses and are available to investors who meet certain account-balance requirements. | |
| Your Fund’s Performance at a Glance | ||||
| September 30, 2011, Through September 30, 2012 | ||||
| Distributions Per Share | ||||
| Starting | Ending | Income | Capital | |
| Share Price | Share Price | Dividends | Gains | |
| Vanguard Equity Income Fund | ||||
| Investor Shares | $19.40 | $24.31 | $0.665 | $0.000 |
| Admiral Shares | 40.67 | 50.94 | 1.440 | 0.000 |
1

Chairman’s Letter
Dear Shareholder,
Over the past 12 months, stocks rebounded strongly from depressed levels. A large part of the gain occurred in the first six months as investors grew more optimistic about the economy. Returns were more modest in the second half of the year as concerns resurfaced about the pace of economic growth at home and the debt crisis in Europe.
The market’s rise was broad-based, with both growth and value stocks, including dividend-paying stocks, producing strong returns. For the fiscal year ended September 30, 2012, Vanguard Equity Income Fund returned 29.00% for Investor Shares and 29.06% for Admiral Shares. The fund’s performance was in line with the 28.89% return of its benchmark, the FTSE High Dividend Yield Index, and well ahead of the 25.02% average return of its equity income fund peers.
At the end of the period, the fund’s Investor Shares had a 30-day SEC yield of 2.91%, roughly 1 percentage point higher than the broad U.S. stock market’s yield.
If you own the fund’s shares in a taxable account, you may want to review the information about after-tax returns that appears later in this report.
2
Stocks notched a powerful rally, with help from central bankers
U.S. stocks surged 30% in the 12 months ended September 30, outpacing the gains of their international counterparts. The rally came amid moves by U.S. and European central bankers to quiet—at least temporarily—investors’ concerns about the U.S. economy and the finances of European governments and banks.
While U.S. stocks were the standouts, European and emerging markets stocks also posted double-digit results. The developed markets of the Pacific region were the weakest performers but still recorded a modest advance.
In July, the president of the European Central Bank declared that policymakers would do whatever was needed to preserve the euro common currency. That pronouncement was encouraging to investors, but Europe’s financial troubles are by no means resolved. Vanguard economists believe the most likely scenario is that the Eurozone will “muddle through” for several years, with occasional spikes in market volatility, as fiscal tightening continues in the face of weak economic growth.
Bonds produced solid returns; future results may be more muted
Bonds once again advanced; the broad U.S. taxable market returned about 5% for the 12 months. Among U.S. Treasuries,
| Market Barometer | |||
| Average Annual Total Returns | |||
| Periods Ended September 30, 2012 | |||
| One | Three | Five | |
| Year | Years | Years | |
| Stocks | |||
| Russell 1000 Index (Large-caps) | 30.06% | 13.27% | 1.22% |
| Russell 2000 Index (Small-caps) | 31.91 | 12.99 | 2.21 |
| Dow Jones U.S. Total Stock Market Index | 30.00 | 13.29 | 1.53 |
| MSCI All Country World Index ex USA (International) | 14.48 | 3.17 | -4.12 |
| Bonds | |||
| Barclays U.S. Aggregate Bond Index (Broad taxable market) | 5.16% | 6.19% | 6.53% |
| Barclays Municipal Bond Index (Broad tax-exempt market) | 8.32 | 5.99 | 6.06 |
| Citigroup Three-Month U.S. Treasury Bill Index | 0.05 | 0.08 | 0.63 |
| CPI | |||
| Consumer Price Index | 1.99% | 2.33% | 2.11% |
3
long-term bonds were particularly strong as they benefited from the Federal Reserve’s bond-buying program.
As bond prices rose, the yield of the 10-year U.S. Treasury note fell to a record low in July, closing below 1.5%. (Bond yields and prices move in opposite directions.) By the end of the period, the yield had climbed, but it still remained low by historical standards.
Bondholders have enjoyed years of strong returns. But as Tim Buckley, our incoming chief investment officer, has noted, investors shouldn’t be surprised if future results are much more modest. As yields tumble, the scope for further declines—and price increases—diminishes.
The Federal Reserve announced on September 13 that it would continue to hold its target for short-term interest rates between 0% and 0.25% at least through mid-2015. The exceptionally low rates, in place since late 2008, have kept a tight lid on returns from money market funds and savings accounts.
Solid gains from some sectors and even stronger gains from others
Vanguard Equity Income Fund is managed by two advisors, Wellington Management Company and Vanguard’s Equity Investment Group, which use different but complementary bottom-up methods to identify and invest in stocks offering the prospect of above-average dividends. The stock choices and sector exposure resulting from this multimanager approach enabled
| Expense Ratios | |||
| Your Fund Compared With Its Peer Group | |||
| Investor | Admiral | Peer Group | |
| Shares | Shares | Average | |
| Equity Income Fund | 0.31% | 0.22% | 1.27% |
The fund expense ratios shown are from the prospectus dated January 27, 2012, and represent estimated costs for the current fiscal year. For the fiscal year ended September 30, 2012, the fund’s expense ratios were 0.30% for Investor Shares and 0.21% for Admiral Shares. The peer-group expense ratio is derived from data provided by Lipper Inc. and captures information through year-end 2011.
Peer group: Equity Income Funds.
4
the fund to return a bit more than its benchmark index during the fiscal year and about 4 percentage points more than its equity income fund peers.
All ten of the fund’s industry sectors produced returns above 17%, with consumer discretionary stocks leading the way. Relative to the index, the fund had an overweight exposure to this sector and specifically to stocks of home improvement retailers, which posted stellar returns as more homeowners took on repair and remodeling projects.
The materials sector was another cyclical group in which the fund outperformed the index. Here, too, stocks related to residential construction and remodeling did well. Chemical companies involved in activities relating to agriculture were another source of strength, as rising food prices and widespread droughts helped drive up demand for drought-resistant and higher-yielding crops.
Utilities, a defensive sector that traditionally generates substantial dividend income, was among the weaker performers as investors became more comfortable taking on riskier assets. While low interest rates helped
| Total Returns | |
| Ten Years Ended September 30, 2012 | |
| Average | |
| Annual Return | |
| Equity Income Fund Investor Shares | 9.02% |
| Spliced Equity Income Index | 9.69 |
| Equity Income Funds Average | 7.85 |
| For a benchmark description, see the Glossary. | |
| Equity Income Funds Average: Derived from data provided by Lipper Inc. | |
The figures shown represent past performance, which is not a guarantee of future results. (Current performance may be lower or higher than the performance data cited. For performance data current to the most recent month-end, visit our website at vanguard.com/performance.) Note, too, that both investment returns and principal value can fluctuate widely, so an investor’s shares, when sold, could be worth more or less than their original cost.
5
keep borrowing costs down in this capital-intensive sector, falling natural gas and power prices put pressure on profit margins.
The ride was sometimes rocky, but the long-term returns are solid
Despite two fiscal years of negative returns during the financial crisis, Vanguard Equity Income Fund posted average annual returns of 9.02% for Investor Shares and 9.14% for Admiral Shares over the ten years ended September 30, 2012. Although the fund fell a little shy of the 9.69% return posted by its benchmark index, it outpaced the broad U.S. stock market’s 8.77% return (as measured by the Dow Jones U.S. Total Stock Market Index).
| Investment insight |
| Looking for income? |
| Watch fund costs |
| The aim of Vanguard Equity Income Fund is to provide investors with an above-average level of income as well as the potential for capital appreciation afforded by investing in stocks. The problem these days is that even an above-average level of income is not very high. |
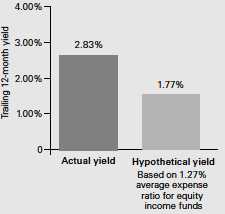
| When yields are modest, it’s especially important to maximize your share of a fund’s investment income by keeping your costs low. For the current fiscal year, the Equity Income Fund’s Admiral Shares have an estimated expense ratio of 0.22%. Over the past 12 months, the Admiral Shares distributed investment income equal to 2.83% of their September 30 share price. If your fund had charged 1.27%, the average expense ratio for equity income funds, that trailing yield would have shriveled to 1.77%. |
| Investment income from Admiral Shares |
| of Vanguard Equity Income Fund |
 |
| Notes: The trailing 12-month yield represents dividend distributions paid out over the past 12 months divided by the Admiral Shares’ net asset value at the end of the period. |
| Sources: Vanguard and Lipper Inc. Data are as of September 30, 2012. |
6
The Equity Income Fund also outpaced the 7.85% average annual return of its peers, thanks to skillful stock selection by the fund’s managers, as well as the fund’s low costs.
The lessons of the financial crisis remain relevant four years later
In September, the end of your fund’s fiscal year, we marked the fourth anniversary of Lehman Brothers’ collapse, the start of the 2008–2009 financial crisis. When the Lehman news broke, I was speaking to institutional clients at an event in Washington, D.C., all of three weeks into my new role as Vanguard’s CEO.
In the ensuing months, I was struck both by how fortunate I was to work with a great team of Vanguard crew and by the remarkable steadiness demonstrated by our clients. Many clients experienced significant losses, but signs of panic were few. On balance, they remained committed to their long-term investment programs and managed to benefit from the financial markets’ subsequent recovery.
As the crisis recedes further in time, it’s important not to lose sight of the lessons that it illuminated about investing and sound financial practices generally. First among those lessons is that diversification does work. Diversification didn’t immunize investors from the market’s decline, but it certainly helped to insulate them from the worst of it.
Second, saving money and living within your means are critical. Investors are acting on this lesson as they pay off debt, which is a form of saving, and increase their savings rates from the dangerously low levels that prevailed before the crisis.
Third, having the courage to stick with a sound investment plan—as so many of our clients did—is important during volatile, uncertain times. Investors who resisted the urge to bail out of stocks in the depths of the crisis have largely been rewarded in the succeeding years.
I am very optimistic that, if investors embrace these lessons, they can give themselves a better chance of reaching their long-term goals. As always, thank you for investing with Vanguard.
Sincerely,

F. William McNabb III
Chairman and Chief Executive Officer
October 12, 2012
7
Advisors’ Report
For the fiscal year ended September 30, the Equity Income Fund returned about 29%, reflecting the combined results of your fund’s two independent investment advisors. The use of two advisors provides exposure to distinct yet complementary investment approaches, enhancing the diversification of your fund. It is not uncommon for different advisors to have different views about individual securities or the broader investment environment.
The advisors, the percentage of the fund’s assets each manages, and brief descriptions of their investment strategies are presented in the table below. The advisors have also prepared a discussion of the investment environment that existed during the fiscal year and of how their
portfolio positioning reflects this assessment. These comments were prepared on October 12, 2012.
Wellington Management Company, llp
Portfolio Manager:
W. Michael Reckmeyer, III, CFA,
Senior Vice President and Equity Portfolio Manager
While economic conditions around the world remained slow as the fiscal year drew to a close, equity markets moved steadily higher as investors reacted to central bank interventions. We expect global economic growth to continue, but at a slow rate and with varying degrees of recovery by region.
| Vanguard Equity Income Fund Investment Advisors | |||
| Fund Assets Managed | |||
| Investment Advisor | % | $ Million | Investment Strategy |
| Wellington Management | 62 | 5,791 | A fundamental approach to seeking desirable stocks. |
| Company, LLP | Our selections typically offer above-average dividend | ||
| yields, below-average valuations, and the potential for | |||
| dividend increases in the future. | |||
| Vanguard Equity Investment | 34 | 3,136 | Employs a quantitative fundamental management |
| Group | approach, using models that assess valuation, growth | ||
| prospects, management decisions, market sentiment, | |||
| and earnings-quality of companies as compared with | |||
| their peers. | |||
| Cash Investments | 4 | 414 | These short-term reserves are invested by Vanguard in |
| equity index products to simulate investment in stocks. | |||
| Each advisor may also maintain a modest cash | |||
| position. | |||
8
Many European economies are now in recession. The European Central Bank’s indications of willingness to provide unlimited liquidity seem to have reduced the risk of a severe outcome, but persistent structural constraints will limit the pace of a rebound.
China’s economy continues to slow and the risks of a hard landing remain. The Chinese have given preliminary signs that they stand ready to stimulate their economy, but we may not get clarity on policy initiatives until the first half of 2013.
The United States has performed better than many other economies, partly because its deleveraging process is more advanced and partly because of more aggressive policy actions. However, growth is still lackluster in the face of weak employment gains, uncertainties about government policies and the presidential election, and the potential impacts of the looming “fiscal cliff.” The Federal Reserve’s concerns prompted it to implement a third round of quantitative easing. We continue to forecast a slow economic recovery but acknowledge that risk factors remain elevated.
Significant purchases during the period included additional shares of financial services company JPMorgan and pharmaceutical company Johnson & Johnson and new positions in industrial company United Technologies and pharmaceutical company Roche. We eliminated our holding in Sherwin-Williams, which hit our target price, and in Republic Services and PG&E because of eroding fundamentals.
Vanguard Equity Investment Group
Portfolio Managers:
James P. Stetler, Principal
James D. Troyer, CFA, Principal
Michael R. Roach, CFA
For the fiscal year, Investor Shares of the Equity Income Fund returned 29.00%, and the FTSE High Dividend Yield Index benchmark gained 28.89%. The 12 months presented two very different halves. For the first six months, dividend-paying stocks rose sharply along with the rest of the market, gaining almost 22%. In the second half, they slowed dramatically, moving ahead but only by about 5%.
Dividend-oriented stocks, the focus of your investment in the fund, trailed the overall market by a little more than 1% for the year. Although all ten sector groups in the benchmark index generated positive returns, financial, consumer discretionary, and industrials companies performed best, and utility and technology firms lagged.
Equity markets have staged quite a rally since last fall, but investor concerns and economic uncertainty are still prominent. Internationally, the Eurozone crisis and slowing growth in China remain worrisome. Looking ahead, the United States faces a potential fiscal cliff scenario that could send us into recession if not resolved. Add to
9
that a stagnant employment picture and election and corporate profit uncertainty, and it’s easy to see why investor appetite for riskier assets may be on hold for a while. Market volatility, although it has declined substantially, will likely continue as long as these issues persist.
Although overall portfolio performance is affected by the macroeconomic factors described above, our approach to investing focuses on stock fundamentals. Specifically, we evaluate these five components:
1. Valuation, which measures the price we pay for earnings and cash flows.
2. Growth, which considers the growth of earnings as a factor in how much we pay for them.
3. Management decisions, an assessment of the actions taken by company management that signal its informed opinions about the firm’s prospects and earnings outlook.
4. Market sentiment, which captures how investors reflect their opinions of a company through their activity in the market.
5. Quality, which measures balance-sheet strength and the sustainability of earnings.
We assess all stocks in the benchmark index by comparing companies from the same sector against one another using these five components.
For the period, our results were mixed. Our growth and valuation models were effective in identifying outperformers, but our management decisions and quality indicators were ineffective and detracted from returns.
Our stock selection results were positive in five sectors and negative in the other five. Company selections in the materials, consumer discretionary, and utilities sectors added most to relative returns. In materials, Eastman Chemical, PPG Industries, and LyondellBasell Industries stood out. In consumer discretionary, Foot Locker, Brinker International, and Polaris Industries were the largest contributors. DTE Energy, CMS Energy, and American Electric Power added most in utilities.
Selection results were most disappointing in industrials and financials, where Pitney Bowes and Boeing (industrials) and Travelers Companies and Invesco Limited (financials) did not perform as expected.
Although we cannot predict how the broader political or economic events will affect the markets, we are confident that stocks can bring worthwhile returns to long-term investors. With that in mind, we believe that equity exposure will continue to play an important role in a diversified investment plan.
We thank you for your investment and look forward to the new fiscal year.
10
Equity Income Fund
Fund Profile
As of September 30, 2012
| Share-Class Characteristics | ||
| Investor | Admiral | |
| Shares | Shares | |
| Ticker Symbol | VEIPX | VEIRX |
| Expense Ratio1 | 0.31% | 0.22% |
| 30-Day SEC Yield | 2.91% | 3.00% |
| Portfolio Characteristics | |||
| FTSE High | DJ | ||
| Dividend | U.S. Total | ||
| Yield | Market | ||
| Fund | Index | Index | |
| Number of Stocks | 150 | 433 | 3,638 |
| Median Market Cap | $73.3B | $93.2B | $35.6B |
| Price/Earnings Ratio | 14.0x | 15.1x | 17.0x |
| Price/Book Ratio | 2.2x | 2.3x | 2.2x |
| Return on Equity | 19.2% | 20.0% | 18.0% |
| Earnings Growth Rate | 4.5% | 3.6% | 10.4% |
| Dividend Yield | 3.4% | 3.3% | 2.0% |
| Foreign Holdings | 6.6% | 0.0% | 0.0% |
| Turnover Rate | 26% | — | — |
| Short-Term Reserves | 0.9% | — | — |
| Sector Diversification (% of equity exposure) | |||
| FTSE High | DJ | ||
| Dividend | U.S. Total | ||
| Yield | Market | ||
| Fund | Index | Index | |
| Consumer Discretionary | 7.2% | 6.0% | 12.0% |
| Consumer Staples | 15.4 | 19.6 | 9.5 |
| Energy | 13.4 | 13.3 | 10.4 |
| Financials | 13.1 | 9.9 | 16.0 |
| Health Care | 13.2 | 12.7 | 11.9 |
| Industrials | 13.1 | 12.2 | 10.6 |
| Information Technology | 9.3 | 8.3 | 19.2 |
| Materials | 3.6 | 4.0 | 3.9 |
| Telecommunication | |||
| Services | 4.8 | 5.9 | 2.9 |
| Utilities | 6.9 | 8.1 | 3.6 |
| Volatility Measures | ||
| FTSE High | DJ | |
| Dividend | U.S. Total | |
| Yield | Market | |
| Index | Index | |
| R-Squared | 0.99 | 0.93 |
| Beta | 0.99 | 0.79 |
These measures show the degree and timing of the fund’s fluctuations compared with the indexes over 36 months.
| Ten Largest Holdings (% of total net assets) | ||
| Exxon Mobil Corp. | Integrated Oil & | |
| Gas | 4.4% | |
| Chevron Corp. | Integrated Oil & | |
| Gas | 4.1 | |
| Merck & Co. Inc. | Pharmaceuticals | 3.4 |
| Johnson & Johnson | Pharmaceuticals | 3.2 |
| Pfizer Inc. | Pharmaceuticals | 3.2 |
| AT&T Inc. | Integrated | |
| Telecommunication | ||
| Services | 3.1 | |
| General Electric Co. | Industrial | |
| Conglomerates | 2.9 | |
| JPMorgan Chase & Co. | Diversified Financial | |
| Services | 2.6 | |
| Philip Morris | ||
| International Inc. | Tobacco | 2.5 |
| Microsoft Corp. | Systems Software | 2.4 |
| Top Ten | 31.8% | |
The holdings listed exclude any temporary cash investments and equity index products.
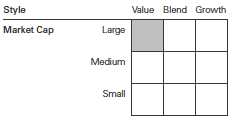
Investment Focus
1 The expense ratios shown are from the prospectus dated January 27, 2012, and represent estimated costs for the current fiscal year. For the fiscal year ended September 30, 2012, the expense ratios were 0.30% for Investor Shares and 0.21% for Admiral Shares.
11
Equity Income Fund
Performance Summary
All of the returns in this report represent past performance, which is not a guarantee of future results that may be achieved by the fund. (Current performance may be lower or higher than the performance data cited. For performance data current to the most recent month-end, visit our website at vanguard.com/performance.) Note, too, that both investment returns and principal value can fluctuate widely, so an investor’s shares, when sold, could be worth more or less than their original cost. The returns shown do not reflect taxes that a shareholder would pay on fund distributions or on the sale of fund shares.
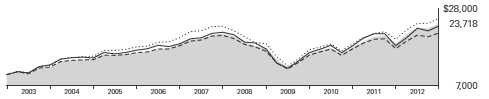
Cumulative Performance: September 30, 2002, Through September 30, 2012
Initial Investment of $10,000
| Average Annual Total Returns | |||||
| Periods Ended September 30, 2012 | |||||
| Final Value | |||||
| One | Five | Ten | of a $10,000 | ||
| Year | Years | Years | Investment | ||
| Equity Income Fund Investor Shares | 29.00% | 2.33% | 9.02% | $23,718 | |
| •••••••• | Spliced Equity Income Index | 28.89 | 1.75 | 9.69 | 25,213 |
| – – – – | Equity Income Funds Average | ||||
| 25.02 | 0.67 | 7.85 | 21,301 | ||
| Dow Jones U.S. Total Stock Market | 30.00 | 1.53 | 8.77 | 23,184 | |
| For a benchmark description, see the Glossary. | |||||
| Equity Income Funds Average: Derived from data provided by Lipper Inc. | |||||
| Final Value | ||||
| One | Five | Ten | of a $50,000 | |
| Year | Years | Years | Investment | |
| Equity Income Fund Admiral Shares | 29.06% | 2.43% | 9.14% | $119,856 |
| Spliced Equity Income Index | 28.89 | 1.75 | 9.69 | 126,066 |
| Dow Jones U.S. Total Stock Market Index | 30.00 | 1.53 | 8.77 | 115,920 |
See Financial Highlights for dividend and capital gains information.
12
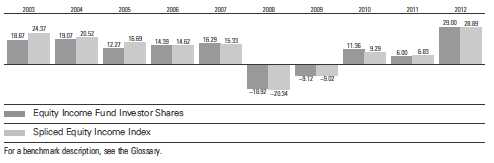
Equity Income Fund
Fiscal-Year Total Returns (%): September 30, 2002, Through September 30, 2012
13
Equity Income Fund
Financial Statements
Statement of Net Assets
As of September 30, 2012
The fund reports a complete list of its holdings in regulatory filings four times in each fiscal year, at the quarter-ends. For the second and fourth fiscal quarters, the lists appear in the fund’s semiannual and annual reports to shareholders. For the first and third fiscal quarters, the fund files the lists with the Securities and Exchange Commission on Form N-Q. Shareholders can look up the fund’s Forms N-Q on the SEC’s website at sec.gov. Forms N-Q may also be reviewed and copied at the SEC’s Public Reference Room (see the back cover of this report for further information).
| Market | |||
| Value | |||
| Shares | ($000) | ||
| Common Stocks (94.9%)1 | |||
| Consumer Discretionary (6.6%) | |||
| Home Depot Inc. | 2,456,080 | 148,274 | |
| Lowe’s Cos. Inc. | 4,523,210 | 136,782 | |
| McDonald’s Corp. | 738,615 | 67,768 | |
| Mattel Inc. | 1,532,950 | 54,389 | |
| Thomson Reuters Corp. | 1,798,500 | 51,905 | |
| Kohl’s Corp. | 988,100 | 50,610 | |
| Darden Restaurants Inc. | 338,400 | 18,866 | |
| Foot Locker Inc. | 528,600 | 18,765 | |
| H&R Block Inc. | 1,071,300 | 18,566 | |
| Brinker International Inc. | 520,100 | 18,359 | |
| ^ | Regal Entertainment | ||
| Group Class A | 1,033,600 | 14,543 | |
| Cooper Tire & Rubber Co. | 359,100 | 6,888 | |
| Cinemark Holdings Inc. | 181,600 | 4,073 | |
| Belo Corp. Class A | 397,450 | 3,112 | |
| Time Warner Inc. | 61,200 | 2,774 | |
| Bob Evans Farms Inc. | 65,800 | 2,575 | |
| Garmin Ltd. | 54,300 | 2,266 | |
| Gannett Co. Inc. | 44,000 | 781 | |
| 621,296 | |||
| Consumer Staples (14.9%) | |||
| Philip Morris | |||
| International Inc. | 2,619,395 | 235,588 | |
| Kraft Foods Inc. | 4,181,129 | 172,890 | |
| Procter & Gamble Co. | 1,735,490 | 120,374 | |
| Kimberly-Clark Corp. | 1,248,758 | 107,118 | |
| Wal-Mart Stores Inc. | 1,421,392 | 104,899 | |
| Unilever NV | 2,665,940 | 94,587 | |
| General Mills Inc. | 2,364,400 | 94,221 | |
| PepsiCo Inc. | 1,321,730 | 93,539 | |
| Altria Group Inc. | 2,790,045 | 93,160 | |
| Sysco Corp. | 2,419,160 | 75,647 | |
| Coca-Cola Co. | 1,679,964 | 63,721 | |
| Imperial Tobacco | |||
| Group plc | 755,531 | 27,990 | |
| Reynolds American Inc. | 543,000 | 23,534 | |
| Market | |||
| Value | |||
| Shares | ($000) | ||
| Campbell Soup Co. | 565,100 | 19,677 | |
| Universal Corp. | 333,582 | 16,986 | |
| British American | |||
| Tobacco plc | 326,166 | 16,760 | |
| Herbalife Ltd. | 253,800 | 12,030 | |
| Walgreen Co. | 252,400 | 9,197 | |
| Colgate-Palmolive Co. | 68,000 | 7,291 | |
| 1,389,209 | |||
| Energy (12.7%) | |||
| Exxon Mobil Corp. | 4,531,530 | 414,408 | |
| Chevron Corp. | 3,256,610 | 379,591 | |
| ConocoPhillips | 2,073,090 | 118,539 | |
| Royal Dutch Shell plc | |||
| Class B | 3,243,113 | 115,409 | |
| Occidental Petroleum Corp. | 961,800 | 82,773 | |
| BP plc ADR | 801,700 | 33,960 | |
| Marathon Petroleum Corp. | 369,900 | 20,193 | |
| Valero Energy Corp. | 557,100 | 17,649 | |
| 1,182,522 | |||
| Exchange-Traded Fund (0.6%) | |||
| 2 | Vanguard Value ETF | 963,400 | 56,571 |
| Financials (12.2%) | |||
| JPMorgan Chase & Co. | 5,974,490 | 241,847 | |
| Marsh & McLennan | |||
| Cos. Inc. | 4,966,520 | 168,514 | |
| BlackRock Inc. | 460,890 | 82,177 | |
| PNC Financial Services | |||
| Group Inc. | 1,281,192 | 80,843 | |
| Wells Fargo & Co. | 2,315,680 | 79,960 | |
| ACE Ltd. | 1,044,730 | 78,982 | |
| Chubb Corp. | 907,680 | 69,238 | |
| M&T Bank Corp. | 686,800 | 65,356 | |
| Swiss Re AG | 642,850 | 41,363 | |
| Travelers Cos. Inc. | 396,800 | 27,086 | |
| BB&T Corp. | 782,000 | 25,931 | |
| Allstate Corp. | 641,500 | 25,410 | |
| Aflac Inc. | 489,400 | 23,433 | |
14
Equity Income Fund
| Market | ||
| Value | ||
| Shares | ($000) | |
| Fifth Third Bancorp | 1,485,000 | 23,032 |
| Invesco Ltd. | 833,300 | 20,824 |
| Huntington Bancshares | ||
| Inc. | 2,594,300 | 17,901 |
| PartnerRe Ltd. | 228,100 | 16,943 |
| Protective Life Corp. | 531,500 | 13,931 |
| Validus Holdings Ltd. | 406,900 | 13,798 |
| SLM Corp. | 552,100 | 8,679 |
| American Express Co. | 131,400 | 7,471 |
| CVB Financial Corp. | 333,100 | 3,977 |
| Montpelier Re Holdings Ltd. | 41,500 | 918 |
| Chemical Financial Corp. | 37,300 | 903 |
| 1,138,517 | ||
| Health Care (12.5%) | ||
| Merck & Co. Inc. | 7,112,404 | 320,769 |
| Johnson & Johnson | 4,375,305 | 301,502 |
| Pfizer Inc. | 11,945,477 | 296,845 |
| Abbott Laboratories | 981,300 | 67,278 |
| Roche Holding AG | 342,939 | 64,146 |
| Eli Lilly & Co. | 888,749 | 42,136 |
| AstraZeneca plc ADR | 669,089 | 32,023 |
| Baxter International Inc. | 448,000 | 26,996 |
| Bristol-Myers Squibb Co. | 346,432 | 11,692 |
| Medtronic Inc. | 87,700 | 3,782 |
| 1,167,169 | ||
| Industrials (12.5%) | ||
| General Electric Co. | 11,784,992 | 267,637 |
| 3M Co. | 1,664,400 | 153,824 |
| Eaton Corp. | 2,162,660 | 102,207 |
| United Parcel Service | ||
| Inc. Class B | 1,335,600 | 95,589 |
| Stanley Black & | ||
| Decker Inc. | 1,166,790 | 88,968 |
| United Technologies Corp. | 1,073,100 | 84,013 |
| Illinois Tool Works Inc. | 1,367,350 | 81,316 |
| Waste Management Inc. | 1,498,989 | 48,087 |
| Lockheed Martin Corp. | 486,100 | 45,392 |
| Boeing Co. | 528,200 | 36,773 |
| Honeywell International Inc. | 549,762 | 32,848 |
| Raytheon Co. | 424,800 | 24,282 |
| Tyco International Ltd. | 419,580 | 23,606 |
| Northrop Grumman Corp. | 348,613 | 23,158 |
| Schneider Electric SA | 334,247 | 19,762 |
| Pitney Bowes Inc. | 846,900 | 11,704 |
| Exelis Inc. | 922,400 | 9,538 |
| Caterpillar Inc. | 87,200 | 7,503 |
| ^ RR Donnelley & Sons Co. | 482,800 | 5,118 |
| Hubbell Inc. Class B | 57,100 | 4,610 |
| Deluxe Corp. | 62,700 | 1,916 |
| Emerson Electric Co. | 19,700 | 951 |
| 1,168,802 |
| Market | ||
| Value | ||
| Shares | ($000) | |
| Information Technology (8.3%) | ||
| Microsoft Corp. | 7,502,249 | 223,417 |
| Intel Corp. | 8,694,430 | 197,190 |
| Analog Devices Inc. | 2,874,380 | 112,647 |
| Maxim Integrated | ||
| Products Inc. | 2,308,886 | 61,462 |
| Xilinx Inc. | 1,555,300 | 51,963 |
| Cisco Systems Inc. | 2,528,500 | 48,269 |
| Accenture plc Class A | 535,400 | 37,494 |
| Seagate Technology plc | 664,700 | 20,606 |
| KLA-Tencor Corp. | 320,500 | 15,289 |
| Computer Sciences Corp. | 234,400 | 7,550 |
| Molex Inc. Class A | 76,100 | 1,653 |
| Diebold Inc. | 32,900 | 1,109 |
| 778,649 | ||
| Materials (3.4%) | ||
| EI du Pont de Nemours | ||
| & Co. | 1,290,957 | 64,897 |
| International Paper Co. | 1,534,400 | 55,730 |
| Dow Chemical Co. | 1,883,300 | 54,540 |
| Nucor Corp. | 1,230,960 | 47,097 |
| LyondellBasell Industries | ||
| NV Class A | 475,100 | 24,544 |
| PPG Industries Inc. | 213,300 | 24,495 |
| Eastman Chemical Co. | 318,300 | 18,146 |
| Huntsman Corp. | 1,173,100 | 17,514 |
| Commercial Metals Co. | 289,800 | 3,825 |
| PH Glatfelter Co. | 130,700 | 2,328 |
| Myers Industries Inc. | 121,400 | 1,896 |
| Freeport-McMoRan Copper | ||
| & Gold Inc. | 28,400 | 1,124 |
| 316,136 | ||
| Telecommunication Services (4.6%) | ||
| AT&T Inc. | 7,799,125 | 294,027 |
| Verizon Communications | ||
| Inc. | 1,705,698 | 77,729 |
| Vodafone Group plc ADR | 2,063,610 | 58,802 |
| 430,558 | ||
| Utilities (6.6%) | ||
| NextEra Energy Inc. | 1,125,496 | 79,156 |
| Xcel Energy Inc. | 2,844,290 | 78,815 |
| UGI Corp. | 1,973,160 | 62,648 |
| National Grid plc | 5,237,475 | 57,774 |
| American Electric Power | ||
| Co. Inc. | 1,150,320 | 50,545 |
| Northeast Utilities | 1,284,810 | 49,118 |
| PPL Corp. | 1,245,160 | 36,172 |
| Public Service Enterprise | ||
| Group Inc. | 700,000 | 22,526 |
| Entergy Corp. | 293,500 | 20,339 |
| DTE Energy Co. | 337,600 | 20,236 |
15
Equity Income Fund
| Market | ||
| Value | ||
| Shares | ($000) | |
| Ameren Corp. | 581,000 | 18,981 |
| Pinnacle West Capital Corp. | 343,700 | 18,147 |
| NV Energy Inc. | 968,700 | 17,446 |
| PNM Resources Inc. | 778,300 | 16,368 |
| Vectren Corp. | 570,900 | 16,328 |
| Consolidated Edison Inc. | 228,500 | 13,685 |
| Dominion Resources Inc. | 246,070 | 13,027 |
| Portland General | ||
| Electric Co. | 386,300 | 10,446 |
| Duke Energy Corp. | 74,700 | 4,841 |
| Avista Corp. | 179,900 | 4,631 |
| Southern Co. | 77,200 | 3,558 |
| Southwest Gas Corp. | 75,600 | 3,341 |
| 618,128 | ||
| Total Common Stocks | ||
| (Cost $7,271,647) | 8,867,557 | |
| Temporary Cash Investments (4.8%)1 | ||
| Money Market Fund (3.3%) | ||
| 3,4 Vanguard Market Liquidity | ||
| Fund, 0.163% | 309,715,849 | 309,716 |
| Face | Market | ||
| Amount | Value | ||
| ($000) | ($000) | ||
| Repurchase Agreement (1.1%) | |||
| Goldman Sachs & Co. | |||
| 0.190%, 10/1/12 (Dated | |||
| 9/28/12, Repurchase | |||
| Value $101,502,000, | |||
| collaterized by Federal | |||
| National Mortgage | |||
| Assn. 4.000%–6.000%, | |||
| 10/1/38–6/1/42 and | |||
| Federal Home Loan | |||
| Mortgage Corp. | |||
| 4.000%, 5/1/2026) | 101,500 | 101,500 | |
| U.S. Government and Agency Obligations (0.4%) | |||
| 5,6 | Fannie Mae Discount Notes, | ||
| 0.135%, 10/31/12 | 100 | 100 | |
| 5,6 | Fannie Mae Discount Notes, | ||
| 0.135%, 12/12/12 | 8,000 | 7,998 | |
| 6,7 | Federal Home Loan Bank | ||
| Discount Notes, 0.130%, | |||
| 10/19/12 | 400 | 400 | |
| 6,7 | Federal Home Loan Bank | ||
| Discount Notes, 0.125%, | |||
| 11/2/12 | 4,000 | 3,999 | |
| 5,6 | Freddie Mac Discount Notes, | ||
| 0.160%, 10/16/12 | 500 | 500 | |
| 5,6 | Freddie Mac Discount Notes, | ||
| 0.130%, 11/6/12 | 1,000 | 1,000 | |
| 5,6 | Freddie Mac Discount Notes, | ||
| 0.135%, 12/17/12 | 700 | 700 | |
| 6 | United States Treasury Note/ | ||
| Bond, 4.000%, 11/15/12 | 1,300 | 1,306 | |
| 6 | United States Treasury Note/ | ||
| Bond, 0.625%, 12/31/12 | 20,200 | 20,222 | |
| 36,225 | |||
| Total Temporary Cash Investments | |||
| (Cost $447,443) | 447,441 | ||
| Total Investments (99.7%) | |||
| (Cost $7,719,090) | 9,314,998 | ||
| Other Assets and Liabilities (0.3%) | |||
| Other Assets | 56,107 | ||
| Liabilities4 | (30,109) | ||
| 25,998 | |||
| Net Assets (100%) | 9,340,996 | ||
16
Equity Income Fund
| At September 30, 2012, net assets consisted of: | |
| Amount | |
| ($000) | |
| Paid-in Capital | 8,041,119 |
| Overdistributed Net Investment Income | (5,579) |
| Accumulated Net Realized Losses | (285,947) |
| Unrealized Appreciation (Depreciation) | |
| Investment Securities | 1,595,908 |
| Futures Contracts | (4,492) |
| Foreign Currencies | (13) |
| Net Assets | 9,340,996 |
| Investor Shares—Net Assets | |
| Applicable to 168,989,404 outstanding | |
| $.001 par value shares of beneficial | |
| interest (unlimited authorization) | 4,107,337 |
| Net Asset Value Per Share— | |
| Investor Shares | $24.31 |
| Admiral Shares—Net Assets | |
| Applicable to 102,732,839 outstanding | |
| $.001 par value shares of beneficial | |
| interest (unlimited authorization) | 5,233,659 |
| Net Asset Value Per Share— | |
| Admiral Shares | $50.94 |
• See Note A in Notes to Financial Statements.
^ Part of security position is on loan to broker-dealers. The total value of securities on loan is $6,404,000.
1 The fund invests a portion of its cash reserves in equity markets through the use of index futures contracts. After giving effect to futures investments, the fund’s effective common stock and temporary cash investment positions represent 98.8% and 0.9%, respectively, of net assets.
2 Considered an affiliated company of the fund as the issuer is another member of The Vanguard Group.
3 Affiliated money market fund available only to Vanguard funds and certain trusts and accounts managed by Vanguard. Rate shown is the 7-day yield.
4 Includes $6,785,000 of collateral received for securities on loan.
5 The issuer was placed under federal conservatorship in September 2008; since that time, its daily operations have been managed by the Federal Housing Finance Agency and it receives capital from the U.S. Treasury, as needed to maintain a positive net worth, in exchange for senior preferred stock.
6 Securities with a value of $17,305,000 have been segregated as initial margin for open futures contracts.
7 The issuer operates under a congressional charter; its securities are generally neither guaranteed by the U.S. Treasury nor backed by the full faith and credit of the U.S. government.
ADR—American Depositary Receipt.
See accompanying Notes, which are an integral part of the Financial Statements.
17
Equity Income Fund
| Statement of Operations | |
| Year Ended | |
| September 30, 2012 | |
| ($000) | |
| Investment Income | |
| Income | |
| Dividends1,2 | 250,305 |
| Interest2 | 464 |
| Security Lending | 467 |
| Total Income | 251,236 |
| Expenses | |
| Investment Advisory Fees—Note B | |
| Basic Fee | 5,793 |
| Performance Adjustment | 362 |
| The Vanguard Group—Note C | |
| Management and Administrative—Investor Shares | 7,113 |
| Management and Administrative—Admiral Shares | 4,089 |
| Marketing and Distribution—Investor Shares | 965 |
| Marketing and Distribution—Admiral Shares | 818 |
| Custodian Fees | 121 |
| Auditing Fees | 30 |
| Shareholders’ Reports—Investor Shares | 92 |
| Shareholders’ Reports—Admiral Shares | 16 |
| Trustees’ Fees and Expenses | 15 |
| Total Expenses | 19,414 |
| Net Investment Income | 231,822 |
| Realized Net Gain (Loss) | |
| Investment Securities Sold2 | 201,653 |
| Futures Contracts | 56,802 |
| Foreign Currencies | 106 |
| Realized Net Gain (Loss) | 258,561 |
| Change in Unrealized Appreciation (Depreciation) | |
| Investment Securities | 1,287,807 |
| Futures Contracts | 1,832 |
| Foreign Currencies | 74 |
| Change in Unrealized Appreciation (Depreciation) | 1,289,713 |
| Net Increase (Decrease) in Net Assets Resulting from Operations | 1,780,096 |
1 Dividends are net of foreign withholding taxes of $1,152,000.
2 Dividend income, interest income, and realized net gain (loss) from affiliated companies of the fund were $1,470,000, $352,000, and $0, respectively.
See accompanying Notes, which are an integral part of the Financial Statements.
18
Equity Income Fund
| Statement of Changes in Net Assets | ||
| Year Ended September 30, | ||
| 2012 | 2011 | |
| ($000) | ($000) | |
| Increase (Decrease) in Net Assets | ||
| Operations | ||
| Net Investment Income | 231,822 | 154,046 |
| Realized Net Gain (Loss) | 258,561 | 185,146 |
| Change in Unrealized Appreciation (Depreciation) | 1,289,713 | (115,550) |
| Net Increase (Decrease) in Net Assets Resulting from Operations | 1,780,096 | 223,642 |
| Distributions | ||
| Net Investment Income | ||
| Investor Shares | (110,412) | (80,499) |
| Admiral Shares | (122,429) | (73,911) |
| Realized Capital Gain | ||
| Investor Shares | — | — |
| Admiral Shares | — | — |
| Total Distributions | (232,841) | (154,410) |
| Capital Share Transactions | ||
| Investor Shares | 496,124 | 128,197 |
| Admiral Shares | 1,848,221 | 934,379 |
| Net Increase (Decrease) from Capital Share Transactions | 2,344,345 | 1,062,576 |
| Total Increase (Decrease) | 3,891,600 | 1,131,808 |
| Net Assets | ||
| Beginning of Period | 5,449,396 | 4,317,588 |
| End of Period1 | 9,340,996 | 5,449,396 |
| 1 Net Assets—End of Period includes undistributed (overdistributed) net investment income of ($5,579,000) and ($5,328,000). | ||
See accompanying Notes, which are an integral part of the Financial Statements.
19
Equity Income Fund
Financial Highlights
| Investor Shares | |||||
| For a Share Outstanding | Year Ended September 30, | ||||
| Throughout Each Period | 2012 | 2011 | 2010 | 2009 | 2008 |
| Net Asset Value, Beginning of Period | $19.40 | $18.83 | $17.40 | $20.02 | $27.01 |
| Investment Operations | |||||
| Net Investment Income | .667 | .596 | .526 | .585 | .770 |
| Net Realized and Unrealized Gain (Loss) | |||||
| on Investments | 4.908 | .567 | 1.432 | (2.506) | (5.617) |
| Total from Investment Operations | 5.575 | 1.163 | 1.958 | (1.921) | (4.847) |
| Distributions | |||||
| Dividends from Net Investment Income | (.665) | (.593) | (.528) | (.587) | (.785) |
| Distributions from Realized Capital Gains | — | — | — | (.112) | (1.358) |
| Total Distributions | (.665) | (.593) | (.528) | (.699) | (2.143) |
| Net Asset Value, End of Period | $24.31 | $19.40 | $18.83 | $17.40 | $20.02 |
| Total Return1 | 29.00% | 6.00% | 11.36% | -9.12% | -18.92% |
| Ratios/Supplemental Data | |||||
| Net Assets, End of Period (Millions) | $4,107 | $2,835 | $2,651 | $2,423 | $2,626 |
| Ratio of Total Expenses to Average | |||||
| Net Assets2 | 0.30% | 0.31% | 0.31% | 0.36% | 0.30% |
| Ratio of Net Investment Income to | |||||
| Average Net Assets | 3.00% | 2.89% | 2.88% | 3.76% | 3.30% |
| Portfolio Turnover Rate | 26% | 29% | 45% | 51% | 55% |
1 Total returns do not include account service fees that may have applied in the periods shown. Fund prospectuses provide information about any applicable account service fees.
2 Includes performance-based investment advisory fee increases of 0.00%, 0.01%, 0.01%, 0.02%, and 0.00%.
See accompanying Notes, which are an integral part of the Financial Statements.
20
Equity Income Fund
Financial Highlights
| Admiral Shares | |||||
| For a Share Outstanding | Year Ended September 30, | ||||
| Throughout Each Period | 2012 | 2011 | 2010 | 2009 | 2008 |
| Net Asset Value, Beginning of Period | $40.67 | $39.47 | $36.46 | $41.97 | $56.62 |
| Investment Operations | |||||
| Net Investment Income | 1.445 | 1.286 | 1.138 | 1.264 | 1.673 |
| Net Realized and Unrealized Gain (Loss) | |||||
| on Investments | 10.265 | 1.194 | 3.013 | (5.269) | (11.772) |
| Total from Investment Operations | 11.710 | 2.480 | 4.151 | (4.005) | (10.099) |
| Distributions | |||||
| Dividends from Net Investment Income | (1.440) | (1.280) | (1.141) | (1.270) | (1.705) |
| Distributions from Realized Capital Gains | — | — | — | (.235) | (2.846) |
| Total Distributions | (1.440) | (1.280) | (1.141) | (1.505) | (4.551) |
| Net Asset Value, End of Period | $50.94 | $40.67 | $39.47 | $36.46 | $41.97 |
| Total Return1 | 29.06% | 6.10% | 11.50% | -9.05% | -18.82% |
| Ratios/Supplemental Data | |||||
| Net Assets, End of Period (Millions) | $5,234 | $2,614 | $1,667 | $1,475 | $1,711 |
| Ratio of Total Expenses to Average | |||||
| Net Assets2 | 0.21% | 0.22% | 0.22% | 0.24% | 0.18% |
| Ratio of Net Investment Income to | |||||
| Average Net Assets | 3.09% | 2.98% | 2.97% | 3.89% | 3.42% |
| Portfolio Turnover Rate | 26% | 29% | 45% | 51% | 55% |
1 Total Returns do not include account service fees that may have applied in the periods shown. Fund prospectuses provide information about any applicable account service fees.
2 Includes performance-based investment advisory fee increases of 0.00%, 0.01%, 0.01%, 0.02%, and 0.00%.
See accompanying Notes, which are an integral part of the Financial Statements.
21
Equity Income Fund
Notes to Financial Statements
Vanguard Equity Income Fund is registered under the Investment Company Act of 1940 as an open-end investment company, or mutual fund. The fund offers two classes of shares: Investor Shares and Admiral Shares. Investor Shares are available to any investor who meets the fund’s minimum purchase requirements. Admiral Shares are designed for investors who meet certain administrative, service, and account-size criteria.
A. The following significant accounting policies conform to generally accepted accounting principles for U.S. mutual funds. The fund consistently follows such policies in preparing its financial statements.
1. Security Valuation: Securities are valued as of the close of trading on the New York Stock Exchange (generally 4 p.m., Eastern time) on the valuation date. Equity securities are valued at the latest quoted sales prices or official closing prices taken from the primary market in which each security trades; such securities not traded on the valuation date are valued at the mean of the latest quoted bid and asked prices. Securities for which market quotations are not readily available, or whose values have been affected by events occurring before the fund’s pricing time but after the close of the securities’ primary markets, are valued at their fair values calculated according to procedures adopted by the board of trustees. These procedures include obtaining quotations from an independent pricing service, monitoring news to identify significant market- or security-specific events, and evaluating changes in the values of foreign market proxies (for example, ADRs, futures contracts, or exchange-traded funds), between the time the foreign markets close and the fund’s pricing time. When fair-value pricing is employed, the prices of securities used by a fund to calculate its net asset value may differ from quoted or published prices for the same securities. Investments in Vanguard Market Liquidity Fund are valued at that fund’s net asset value. Temporary cash investments acquired over 60 days to maturity are valued using the latest bid prices or using valuations based on a matrix system (which considers such factors as security prices, yields, maturities, and ratings), both as furnished by independent pricing services. Other temporary cash investments are valued at amortized cost, which approximates market value.
2. Foreign Currency: Securities and other assets and liabilities denominated in foreign currencies are translated into U.S. dollars using exchange rates obtained from an independent third party as of the fund’s pricing time on the valuation date. Realized gains (losses) and unrealized appreciation (depreciation) on investment securities include the effects of changes in exchange rates since the securities were purchased, combined with the effects of changes in security prices. Fluctuations in the value of other assets and liabilities resulting from changes in exchange rates are recorded as unrealized foreign currency gains (losses) until the assets or liabilities are settled in cash, at which time they are recorded as realized foreign currency gains (losses).
3. Futures Contracts: The fund uses index futures contracts to a limited extent, with the objective of maintaining full exposure to the stock market while maintaining liquidity. The fund may purchase or sell futures contracts to achieve a desired level of investment, whether to accommodate portfolio turnover or cash flows from capital share transactions. The primary risks associated with the use of futures contracts are imperfect correlation between changes in market values of stocks held by the fund and the prices of futures contracts, and the possibility of an illiquid market.
Futures contracts are valued at their quoted daily settlement prices. The aggregate principal amounts of the contracts are not recorded in the Statement of Net Assets. Fluctuations in the value of the contracts are recorded in the Statement of Net Assets as an asset (liability) and in the Statement of Operations as unrealized appreciation (depreciation) until the contracts are closed, when they are recorded as realized futures gains (losses).
22
Equity Income Fund
During the year ended September 30, 2012, the fund’s average investment in futures contracts represented 4% of net assets, based on quarterly average aggregate settlement values.
4. Repurchase Agreements: The fund may enter into repurchase agreements. Securities pledged as collateral for repurchase agreements are held by a custodian bank until the agreements mature. Each agreement requires that the market value of the collateral be sufficient to cover payments of interest and principal. In the event of default or bankruptcy by the other party to the agreement, the fund may sell or retain the collateral; however, such action may be subject to legal proceedings.
5. Federal Income Taxes: The fund intends to continue to qualify as a regulated investment company and distribute all of its taxable income. Management has analyzed the fund’s tax positions taken for all open federal income tax years (September 30, 2009–2012), and has concluded that no provision for federal income tax is required in the fund’s financial statements.
6. Distributions: Distributions to shareholders are recorded on the ex-dividend date.
7. Security Lending: The fund may lend its securities to qualified institutional borrowers to earn additional income. Security loans are required to be secured at all times by collateral at least equal to the market value of securities loaned. The fund invests cash collateral received in Vanguard Market Liquidity Fund, and records a liability for the return of the collateral, during the period the securities are on loan. Security lending income represents fees charged to borrowers plus income earned on investing cash collateral, less expenses associated with the loan.
8. Other: Dividend income is recorded on the ex-dividend date. Interest income includes income distributions received from Vanguard Market Liquidity Fund and is accrued daily. Security transactions are accounted for on the date securities are bought or sold. Costs used to determine realized gains (losses) on the sale of investment securities are those of the specific securities sold.
Each class of shares has equal rights as to assets and earnings, except that each class separately bears certain class-specific expenses related to maintenance of shareholder accounts (included in Management and Administrative expenses) and shareholder reporting. Marketing and distribution expenses are allocated to each class of shares based on a method approved by the board of trustees. Income, other non-class-specific expenses, and gains and losses on investments are allocated to each class of shares based on its relative net assets.
B. Wellington Management Company, LLP, provides investment advisory services to a portion of the fund for a fee calculated at an annual percentage rate of average net assets managed by the advisor. The basic fee of Wellington Management Company, LLP, is subject to quarterly adjustments based on performance for the preceding three years relative to the FTSE High Dividend Yield Index.
The Vanguard Group provides investment advisory services to a portion of the fund on an at-cost basis; the fund paid Vanguard advisory fees of $506,000 for the year ended September 30, 2012.
For the year ended September 30, 2012, the aggregate investment advisory fee represented an effective annual basic rate of 0.08% of the fund’s average net assets, before an increase of $362,000 (0.00%) based on performance.
C. The Vanguard Group furnishes at cost corporate management, administrative, marketing, and distribution services. The costs of such services are allocated to the fund under methods approved by the board of trustees. The fund has committed to provide up to 0.40% of its net assets in capital contributions to Vanguard. At September 30, 2012, the fund had contributed capital of $1,279,000 to Vanguard (included in Other Assets), representing 0.01% of the fund’s net assets and 0.51% of Vanguard’s capitalization. The fund’s trustees and officers are also directors and officers of Vanguard.
23
Equity Income Fund
D. Various inputs may be used to determine the value of the fund’s investments. These inputs are summarized in three broad levels for financial statement purposes. The inputs or methodologies used to value securities are not necessarily an indication of the risk associated with investing in those securities.
Level 1—Quoted prices in active markets for identical securities.
Level 2—Other significant observable inputs (including quoted prices for similar securities, interest rates, prepayment speeds, credit risk, etc.).
Level 3—Significant unobservable inputs (including the fund’s own assumptions used to determine the fair value of investments).
The following table summarizes the market value of the fund’s investments as of September 30, 2012, based on the inputs used to value them:
| Level 1 | Level 2 | Level 3 | |
| Investments | ($000) | ($000) | ($000) |
| Common Stocks | 8,524,353 | 343,204 | — |
| Temporary Cash Investments | 309,716 | 137,725 | — |
| Futures Contracts—Liabilities1 | (1,675) | — | — |
| Total | 8,832,394 | 480,929 | — |
| 1 Represents variation margin on the last day of the reporting period. | |||
E. At September 30, 2012, the aggregate settlement value of open futures contracts and the related unrealized appreciation (depreciation) were:
| ($000) | ||||
| Aggregate | ||||
| Number of | Settlement | Unrealized | ||
| Long (Short) | Value | Appreciation | ||
| Futures Contracts | Expiration | Contracts | Long (Short) | (Depreciation) |
| S&P 500 Index | December 2012 | 839 | 300,823 | (4,006) |
| E-mini S&P 500 Index | December 2012 | 831 | 59,591 | (486) |
Unrealized appreciation (depreciation) on open futures contracts is required to be treated as realized gain (loss) for tax purposes.
F. Distributions are determined on a tax basis and may differ from net investment income and realized capital gains for financial reporting purposes. Differences may be permanent or temporary. Permanent differences are reclassified among capital accounts in the financial statements to reflect their tax character. Temporary differences arise when certain items of income, expense, gain, or loss are recognized in different periods for financial statement and tax purposes; these differences will reverse at some time in the future. Differences in classification may also result from the treatment of short-term gains as ordinary income for tax purposes.
During the year ended September 30, 2012, the fund realized net foreign currency gains of $106,000, which increased distributable net income for tax purposes; accordingly, such gains have been reclassified from accumulated net realized losses to overdistributed net investment income.
24
Equity Income Fund
For tax purposes, at September 30, 2012, the fund had $4,509,000 of ordinary income available for distribution. The fund used capital loss carryforwards of $259,604,000 to offset taxable capital gains realized during the year ended September 30, 2012. At September 30, 2012, the fund had available capital losses totaling $290,391,000 to offset future net capital gains through September 30, 2018.
At September 30, 2012, the cost of investment securities for tax purposes was $7,719,157,000. Net unrealized appreciation of investment securities for tax purposes was $1,595,841,000, consisting of unrealized gains of $1,645,183,000 on securities that had risen in value since their purchase and $49,342,000 in unrealized losses on securities that had fallen in value since their purchase.
G. During the year ended September 30, 2012, the fund purchased $4,121,392,000 of investment securities and sold $1,896,758,000 of investment securities, other than temporary cash investments.
H. Capital share transactions for each class of shares were:
| Year Ended September 30, | ||||
| 2012 | 2011 | |||
| Amount | Shares | Amount | Shares | |
| ($000) | (000) | ($000) | (000) | |
| Investor Shares | ||||
| Issued | 1,782,119 | 78,809 | 858,008 | 41,420 |
| Issued in Lieu of Cash Distributions | 101,255 | 4,424 | 74,430 | 3,580 |
| Redeemed | (1,387,250) | (60,380) | (804,241) | (39,640) |
| Net Increase (Decrease)—Investor Shares | 496,124 | 22,853 | 128,197 | 5,360 |
| Admiral Shares | ||||
| Issued | 2,304,711 | 48,050 | 1,278,314 | 29,946 |
| Issued in Lieu of Cash Distributions | 102,576 | 2,129 | 60,944 | 1,398 |
| Redeemed | (559,066) | (11,723) | (404,879) | (9,292) |
| Net Increase (Decrease)—Admiral Shares | 1,848,221 | 38,456 | 934,379 | 22,052 |
I. In preparing the financial statements as of September 30, 2012, management considered the impact of subsequent events for potential recognition or disclosure in these financial statements.
25
Report of Independent Registered Public Accounting Firm
To the Trustees of Vanguard Fenway Funds and the Shareholders of Vanguard Equity Income Fund:
In our opinion, the accompanying statement of net assets and the related statements of operations and of changes in net assets and the financial highlights present fairly, in all material respects, the financial position of Vanguard Equity Income Fund (constituting a separate portfolio of Vanguard Fenway Funds, hereafter referred to as the “Fund”) at September 30, 2012, the results of its operations for the year then ended, the changes in its net assets for each of the two years in the period then ended and the financial highlights for each of the five years in the period then ended, in conformity with accounting principles generally accepted in the United States of America. These financial statements and financial highlights (hereafter referred to as “financial statements”) are the responsibility of the Fund’s management; our responsibility is to express an opinion on these financial statements based on our audits. We conducted our audits of these financial statements in accordance with the standards of the Public Company Accounting Oversight Board (United States). Those standards require that we plan and perform the audit to obtain reasonable assurance about whether the financial statements are free of material misstatement. An audit includes examining, on a test basis, evidence supporting the amounts and disclosures in the financial statements, assessing the accounting principles used and significant estimates made by management, and evaluating the overall financial statement presentation. We believe that our audits, which included confirmation of securities at September 30, 2012 by correspondence with the custodians and brokers and by agreement to the underlying ownership records of the transfer agent, provide a reasonable basis for our opinion.
PricewaterhouseCoopers LLP
Philadelphia, Pennsylvania
November 9, 2012
| Special 2012 tax information (unaudited) for Vanguard Equity Income Fund |
This information for the fiscal year ended September 30, 2012, is included pursuant to provisions of the Internal Revenue Code.
The fund distributed $232,841,000 of qualified dividend income to shareholders during the fiscal year.
For corporate shareholders, 94.8% of investment income (dividend income plus short-term gains, if any) qualifies for the dividends-received deduction.
26
Your Fund’s After-Tax Returns
This table presents returns for your fund both before and after taxes. The after-tax returns are shown in two ways: (1) assuming that an investor owned the fund during the entire period and paid taxes on the fund’s distributions, and (2) assuming that an investor paid taxes on the fund’s distributions and sold all shares at the end of each period.
Calculations are based on the highest individual federal income tax and capital gains tax rates in effect at the times of the distributions and the hypothetical sales. State and local taxes were not considered. After-tax returns reflect any qualified dividend income , using actual prior-year figures and estimates for 2012. (In the example, returns after the sale of fund shares may be higher than those assuming no sale. This occurs when the sale would have produced a capital loss. The calculation assumes that the investor received a tax deduction for the loss.)
The table shows returns for Investor Shares only; returns for other share classes will differ. Please note that your actual after-tax returns will depend on your tax situation and may differ from those shown. Also note that if you own the fund in a tax-deferred account, such as an individual retirement account or a 401(k) plan, this information does not apply to you. Such accounts are not subject to current taxes.
Finally, keep in mind that a fund’s performance—whether before or after taxes—does not guarantee future results.
| Average Annual Total Returns: Equity Income Fund Investor Shares | |||
| Periods Ended September 30, 2012 | |||
| One | Five | Ten | |
| Year | Years | Years | |
| Returns Before Taxes | 29.00% | 2.33% | 9.02% |
| Returns After Taxes on Distributions | 28.44 | 1.64 | 8.08 |
| Returns After Taxes on Distributions and Sale of Fund Shares | 19.52 | 1.84 | 7.72 |
27
About Your Fund’s Expenses
As a shareholder of the fund, you incur ongoing costs, which include costs for portfolio management, administrative services, and shareholder reports (like this one), among others. Operating expenses, which are deducted from a fund’s gross income, directly reduce the investment return of the fund.
A typical fund’s expenses are expressed as a percentage of its average net assets. This figure is known as the expense ratio. The following examples are intended to help you understand the ongoing costs (in dollars) of investing in your fund and to compare these costs with those of other mutual funds. The examples are based on an investment of $1,000 made at the beginning of the period shown and held for the entire period.
The accompanying table illustrates your fund’s costs in two ways:
• Based on actual fund return. This section helps you to estimate the actual expenses that you paid over the period. The ”Ending Account Value“ shown is derived from the fund‘s actual return, and the third column shows the dollar amount that would have been paid by an investor who started with $1,000 in the fund. You may use the information here, together with the amount you invested, to estimate the expenses that you paid over the period.
To do so, simply divide your account value by $1,000 (for example, an $8,600 account value divided by $1,000 = 8.6), then multiply the result by the number given for your fund under the heading ”Expenses Paid During Period.“
• Based on hypothetical 5% yearly return. This section is intended to help you compare your fund‘s costs with those of other mutual funds. It assumes that the fund had a yearly return of 5% before expenses, but that the expense ratio is unchanged. In this case—because the return used is not the fund’s actual return—the results do not apply to your investment. The example is useful in making comparisons because the Securities and Exchange Commission requires all mutual funds to calculate expenses based on a 5% return. You can assess your fund’s costs by comparing this hypothetical example with the hypothetical examples that appear in shareholder reports of other funds.
Note that the expenses shown in the table are meant to highlight and help you compare ongoing costs only and do not reflect transaction costs incurred by the fund for buying and selling securities. Further, the expenses do not include any purchase, redemption, or account service fees described in the fund prospectus. If such fees were applied to your account, your costs would be higher. Your fund does not carry a “sales load.”
The calculations assume no shares were bought or sold during the period. Your actual costs may have been higher or lower, depending on the amount of your investment and the timing of any purchases or redemptions.
You can find more information about the fund’s expenses, including annual expense ratios, in the Financial Statements section of this report. For additional information on operating expenses and other shareholder costs, please refer to your fund’s current prospectus.
28
| Six Months Ended September 30, 2012 | |||
| Beginning | Ending | Expenses | |
| Account Value | Account Value | Paid During | |
| Equity Income Fund | 3/31/2012 | 9/30/2012 | Period |
| Based on Actual Fund Return | |||
| Investor Shares | $1,000.00 | $1,046.30 | $1.54 |
| Admiral Shares | 1,000.00 | 1,046.57 | 1.08 |
| Based on Hypothetical 5% Yearly Return | |||
| Investor Shares | $1,000.00 | $1,023.56 | $1.52 |
| Admiral Shares | 1,000.00 | 1,024.02 | 1.07 |
The calculations are based on expenses incurred in the most recent six-month period. The fund’s annualized six-month expense ratios for that period are 0.30% for Investor Shares and 0.21% for Admiral Shares. The dollar amounts shown as “Expenses Paid�� are equal to the annualized expense ratio multiplied by the average account value over the period, multiplied by the number of days in the most recent six-month period, then divided by the number of days in the most recent 12-month period.
29
Glossary
30-Day SEC Yield. A fund’s 30-day SEC yield is derived using a formula specified by the U.S. Securities and Exchange Commission. Under the formula, data related to the fund’s security holdings in the previous 30 days are used to calculate the fund’s hypothetical net income for that period, which is then annualized and divided by the fund’s estimated average net assets over the calculation period. For the purposes of this calculation, a security’s income is based on its current market yield to maturity (for bonds), its actual income (for asset-backed securities), or its projected dividend yield (for stocks). Because the SEC yield represents hypothetical annualized income, it will differ—at times significantly—from the fund’s actual experience. As a result, the fund’s income distributions may be higher or lower than implied by the SEC yield.
Beta. A measure of the magnitude of a fund’s past share-price fluctuations in relation to the ups and downs of a given market index. The index is assigned a beta of 1.00. Compared with a given index, a fund with a beta of 1.20 typically would have seen its share price rise or fall by 12% when the index rose or fell by 10%. For this report, beta is based on returns over the past 36 months for both the fund and the index. Note that a fund’s beta should be reviewed in conjunction with its R-squared (see definition). The lower the R-squared, the less correlation there is between the fund and the index, and the less reliable beta is as an indicator of volatility.
Dividend Yield. Dividend income earned by stocks, expressed as a percentage of the aggregate market value (or of net asset value, for a fund). The yield is determined by dividing the amount of the annual dividends by the aggregate value (or net asset value) at the end of the period. For a fund, the dividend yield is based solely on stock holdings and does not include any income produced by other investments.
Earnings Growth Rate. The average annual rate of growth in earnings over the past five years for the stocks now in a fund.
Equity Exposure. A measure that reflects a fund’s investments in stocks and stock futures. Any holdings in short-term reserves are excluded.
Expense Ratio. A fund’s total annual operating expenses expressed as a percentage of the fund’s average net assets. The expense ratio includes management and administrative expenses, but does not include the transaction costs of buying and selling portfolio securities.
Foreign Holdings. The percentage of a fund represented by securities or depositary receipts of companies based outside the United States.
Inception Date. The date on which the assets of a fund (or one of its share classes) are first invested in accordance with the fund’s investment objective. For funds with a subscription period, the inception date is the day after that period ends. Investment performance is measured from the inception date.
Median Market Cap. An indicator of the size of companies in which a fund invests; the midpoint of market capitalization (market price x shares outstanding) of a fund’s stocks, weighted by the proportion of the fund’s assets invested in each stock. Stocks representing half of the fund’s assets have market capitalizations above the median, and the rest are below it.
Price/Book Ratio. The share price of a stock divided by its net worth, or book value, per share. For a fund, the weighted average price/book ratio of the stocks it holds.
30
Price/Earnings Ratio. The ratio of a stock’s current price to its per-share earnings over the past year. For a fund, the weighted average P/E of the stocks it holds. P/E is an indicator of market expectations about corporate prospects; the higher the P/E, the greater the expectations for a company’s future growth.
R-Squared. A measure of how much of a fund’s past returns can be explained by the returns from the market in general, as measured by a given index. If a fund’s total returns were precisely synchronized with an index’s returns, its R-squared would be 1.00. If the fund’s returns bore no relationship to the index’s returns, its R-squared would be 0. For this report, R-squared is based on returns over the past 36 months for both the fund and the index.
Return on Equity. The annual average rate of return generated by a company during the past five years for each dollar of shareholder’s equity (net income divided by shareholder’s equity). For a fund, the weighted average return on equity for the companies whose stocks it holds.
Short-Term Reserves. The percentage of a fund invested in highly liquid, short-term securities that can be readily converted to cash.
Turnover Rate. An indication of the fund’s trading activity. Funds with high turnover rates incur higher transaction costs and may be more likely to distribute capital gains (which may be taxable to investors). The turnover rate excludes in-kind transactions, which have minimal impact on costs.
Benchmark Information
Spliced Equity Income Index: Russell 1000 Value Index through July 31, 2007; FTSE High Dividend Yield Index thereafter.
31
The People Who Govern Your Fund
The trustees of your mutual fund are there to see that the fund is operated and managed in your best interests since, as a shareholder, you are a part owner of the fund. Your fund’s trustees also serve on the board of directors of The Vanguard Group, Inc., which is owned by the Vanguard funds and provides services to them on an at-cost basis.
A majority of Vanguard’s board members are independent, meaning that they have no affiliation with Vanguard or the funds they oversee, apart from the sizable personal investments they have made as private individuals. The independent board members have distinguished backgrounds in business, academia, and public service. Each of the trustees and executive officers oversees 179 Vanguard funds.
The following table provides information for each trustee and executive officer of the fund. More information about the trustees is in the Statement of Additional Information, which can be obtained, without charge, by contacting Vanguard at 800-662-7447, or online at vanguard.com.
| InterestedTrustee1 | and Delphi Automotive LLP (automotive components); |
| Senior Advisor at New Mountain Capital; Trustee of | |
| F. William McNabb III | The Conference Board. |
| Born 1957. Trustee Since July 2009. Chairman of the | |
| Board. Principal Occupation(s) During the Past Five | Amy Gutmann |
| Years: Chairman of the Board of The Vanguard Group, | Born 1949. Trustee Since June 2006. Principal |
| Inc., and of each of the investment companies served | Occupation(s) During the Past Five Years: President |
| by The Vanguard Group, since January 2010; Director | of the University of Pennsylvania; Christopher H. |
| of The Vanguard Group since 2008; Chief Executive | Browne Distinguished Professor of Political Science |
| Officer and President of The Vanguard Group and of | in the School of Arts and Sciences with secondary |
| each of the investment companies served by The | appointments at the Annenberg School for |
| Vanguard Group since 2008; Director of Vanguard | Communication and the Graduate School of Education |
| Marketing Corporation; Managing Director of The | of the University of Pennsylvania; Member of the |
| Vanguard Group (1995–2008). | National Commission on the Humanities and Social |
| Sciences; Trustee of Carnegie Corporation of New | |
| York and of the National Constitution Center; Chair | |
| IndependentTrustees | of the U. S. Presidential Commission for the Study |
| of Bioethical Issues. | |
| Emerson U. Fullwood | |
| Born 1948. Trustee Since January 2008. Principal | JoAnn Heffernan Heisen |
| Occupation(s) During the Past Five Years: Executive | Born 1950. Trustee Since July 1998. Principal |
| Chief Staff and Marketing Officer for North America | Occupation(s) During the Past Five Years: Corporate |
| and Corporate Vice President (retired 2008) of Xerox | Vice President and Chief Global Diversity Officer |
| Corporation (document management products and | (retired 2008) and Member of the Executive |
| services); Executive in Residence and 2010 | Committee (1997–2008) of Johnson & Johnson |
| Distinguished Minett Professor at the Rochester | (pharmaceuticals/medical devices/consumer |
| Institute of Technology; Director of SPX Corporation | products); Director of Skytop Lodge Corporation |
| (multi-industry manufacturing), the United Way of | (hotels), the University Medical Center at Princeton, |
| Rochester, Amerigroup Corporation (managed health | the Robert Wood Johnson Foundation, and the Center |
| care), the University of Rochester Medical Center, | for Talent Innovation; Member of the Advisory Board |
| Monroe Community College Foundation, and North | of the Maxwell School of Citizenship and Public Affairs |
| Carolina A&T University. | at Syracuse University. |
| Rajiv L. Gupta | F. Joseph Loughrey |
| Born 1945. Trustee Since December 2001.2 | Born 1949. Trustee Since October 2009. Principal |
| Principal Occupation(s) During the Past Five Years: | Occupation(s) During the Past Five Years: President |
| Chairman and Chief Executive Officer (retired 2009) | and Chief Operating Officer (retired 2009) of Cummins |
| and President (2006–2008) of Rohm and Haas Co. | Inc. (industrial machinery); Director of SKF AB |
| (chemicals); Director of Tyco International, Ltd. | (industrial machinery), Hillenbrand, Inc. (specialized |
| (diversified manufacturing and services), Hewlett- | consumer services), the Lumina Foundation for |
| Packard Co. (electronic computer manufacturing), |
| Education, and Oxfam America; Chairman of the | Executive Officers | |
| Advisory Council for the College of Arts and Letters | ||
| and Member of the Advisory Board to the Kellogg | Glenn Booraem | |
| Institute for International Studies at the University | Born 1967. Controller Since July 2010. Principal | |
| of Notre Dame. | Occupation(s) During the Past Five Years: Principal | |
| of The Vanguard Group, Inc.; Controller of each of | ||
| Mark Loughridge | the investment companies served by The Vanguard | |
| Born 1953. Trustee Since March 2012. Principal | Group; Assistant Controller of each of the investment | |
| Occupation(s) During the Past Five Years: Senior Vice | companies served by The Vanguard Group (2001–2010). | |
| President and Chief Financial Officer at IBM (information | ||
| technology services); Fiduciary Member of IBM’s | Thomas J. Higgins | |
| Retirement Plan Committee. | Born 1957. Chief Financial Officer Since September | |
| 2008. Principal Occupation(s) During the Past Five | ||
| Scott C. Malpass | Years: Principal of The Vanguard Group, Inc.; Chief | |
| Born 1962. Trustee Since March 2012. Principal | Financial Officer of each of the investment companies | |
| Occupation(s) During the Past Five Years: Chief | served by The Vanguard Group; Treasurer of each of | |
| Investment Officer and Vice President at the University | the investment companies served by The Vanguard | |
| of Notre Dame; Assistant Professor of Finance at the | Group (1998–2008). | |
| Mendoza College of Business at Notre Dame; Member | ||
| of the Notre Dame 403(b) Investment Committee; | Kathryn J. Hyatt | |
| Director of TIFF Advisory Services, Inc. (investment | Born 1955. Treasurer Since November 2008. Principal | |
| advisor); Member of the Investment Advisory | Occupation(s) During the Past Five Years: Principal of | |
| Committees of the Financial Industry Regulatory | The Vanguard Group, Inc.; Treasurer of each of the | |
| Authority (FINRA) and of Major League Baseball. | investment companies served by The Vanguard | |
| Group; Assistant Treasurer of each of the investment | ||
| André F. Perold | companies served by The Vanguard Group (1988–2008). | |
| Born 1952. Trustee Since December 2004. Principal | ||
| Occupation(s) During the Past Five Years: George | Heidi Stam | |
| Gund Professor of Finance and Banking at the Harvard | Born 1956. Secretary Since July 2005. Principal | |
| Business School (retired 2011); Chief Investment | Occupation(s) During the Past Five Years: Managing | |
| Officer and Managing Partner of HighVista Strategies | Director of The Vanguard Group, Inc.; General Counsel | |
| LLC (private investment firm); Director of Rand | of The Vanguard Group; Secretary of The Vanguard | |
| Merchant Bank; Overseer of the Museum of Fine | Group and of each of the investment companies | |
| Arts Boston. | served by The Vanguard Group; Director and Senior | |
| Vice President of Vanguard Marketing Corporation. | ||
| Alfred M. Rankin, Jr. | ||
| Born 1941. Trustee Since January 1993. Principal | Vanguard Senior ManagementTeam | |
| Occupation(s) During the Past Five Years: Chairman, | ||
| President, and Chief Executive Officer of NACCO | Mortimer J. Buckley | Michael S. Miller |
| Industries, Inc. (forklift trucks/housewares/lignite); | Kathleen C. Gubanich | James M. Norris |
| Director of Goodrich Corporation (industrial products/ | Paul A. Heller | Glenn W. Reed |
| aircraft systems and services) and the National | Martha G. King | George U. Sauter |
| Association of Manufacturers; Chairman of the Board | Chris D. McIsaac | |
| of the Federal Reserve Bank of Cleveland and of | ||
| University Hospitals of Cleveland; Advisory Chairman | Chairman Emeritus and Senior Advisor | |
| of the Board of The Cleveland Museum of Art. | ||
| John J. Brennan | ||
| Peter F. Volanakis | Chairman, 1996–2009 | |
| Born 1955. Trustee Since July 2009. Principal | Chief Executive Officer and President, 1996–2008 | |
| Occupation(s) During the Past Five Years: President | ||
| and Chief Operating Officer (retired 2010) of Corning | ||
| Incorporated (communications equipment); Director | Founder | |
| of SPX Corporation (multi-industry manufacturing); | John C. Bogle | |
| Overseer of the Amos Tuck School of Business | Chairman and Chief Executive Officer, 1974–1996 | |
| Administration at Dartmouth College; Advisor to the | ||
| Norris Cotton Cancer Center. | ||
1 Mr. McNabb is considered an “interested person,” as defined in the Investment Company Act of 1940, because he is an officer of the Vanguard funds.
2 December 2002 for Vanguard Equity Income Fund, Vanguard Growth Equity Fund, the Vanguard Municipal Bond Funds, and the Vanguard State Tax-Exempt Funds.
 | |
| P.O. Box 2600 | |
| Valley Forge, PA 19482-2600 |
Connect with Vanguard® > vanguard.com
| Fund Information > 800-662-7447 | CFA® is a trademark owned by CFA Institute. |
| Direct Investor Account Services > 800-662-2739 | |
| Institutional Investor Services > 800-523-1036 | |
| Text Telephone for People | |
| With Hearing Impairment > 800-749-7273 | |
| This material may be used in conjunction | |
| with the offering of shares of any Vanguard | |
| fund only if preceded or accompanied by | |
| the fund’s current prospectus. | |
| All comparative mutual fund data are from Lipper Inc. or | |
| Morningstar, Inc., unless otherwise noted. | |
| You can obtain a free copy of Vanguard’s proxy voting | |
| guidelines by visiting vanguard.com/proxyreporting or by | |
| calling Vanguard at 800-662-2739. The guidelines are | |
| also available from the SEC’s website, sec.gov. In | |
| addition, you may obtain a free report on how your fund | |
| voted the proxies for securities it owned during the 12 | |
| months ended June 30. To get the report, visit either | |
| vanguard.com/proxyreporting or sec.gov. | |
| You can review and copy information about your fund at | |
| the SEC’s Public Reference Room in Washington, D.C. To | |
| find out more about this public service, call the SEC at | |
| 202-551-8090. Information about your fund is also | |
| available on the SEC’s website, and you can receive | |
| copies of this information, for a fee, by sending a | |
| request in either of two ways: via e-mail addressed to | |
| publicinfo@sec.gov or via regular mail addressed to the | |
| Public Reference Section, Securities and Exchange | |
| Commission, Washington, DC 20549-1520. | |
| © 2012 The Vanguard Group, Inc. | |
| All rights reserved. | |
| Vanguard Marketing Corporation, Distributor. | |
| Q650 112012 | |
|
| Annual Report | September 30, 2012 |
| Vanguard Growth Equity Fund |
 |
> For the fiscal year ended September 30, 2012, Vanguard Growth Equity Fund returned 26.80%, as the U.S. stock market posted strong gains.
> The fund lagged its benchmark index and slightly trailed its peer group.
> IT holdings provided the most significant boost; consumer discretionary and health care stocks underperformed.
| Contents | |
| Your Fund’s Total Returns. | 1 |
| Chairman’s Letter. | 2 |
| Advisors’ Report. | 8 |
| Fund Profile. | 12 |
| Performance Summary. | 13 |
| Financial Statements. | 15 |
| Your Fund’s After-Tax Returns. | 26 |
| About Your Fund’s Expenses. | 27 |
| Glossary. | 29 |
Please note: The opinions expressed in this report are just that—informed opinions. They should not be considered promises or advice. Also, please keep in mind that the information and opinions cover the period through the date on the front of this report. Of course, the risks of investing in your fund are spelled out in the prospectus.
See the Glossary for definitions of investment terms used in this report.
About the cover: Our cover photograph shows rigging on the HMSSurprise, a replica of an 18th-century Royal Navy frigate. It was featured in the 2003 movie Master and Commander: The Far Side of the World, which was based on Patrick O’Brian’s sea novels, set amid the Napoleonic Wars. Vanguard was named for another ship of that era, the HMSVanguard, which was the flagship of British Admiral Horatio Nelson at the Battle of the Nile.
Your Fund’s Total Returns
| Fiscal Year Ended September 30, 2012 | |
| Total | |
| Returns | |
| Vanguard Growth Equity Fund | 26.80% |
| Russell 1000 Growth Index | 29.19 |
| Large-Cap Growth Funds Average | 27.21 |
| Large-Cap Growth Funds Average: Derived from data provided by Lipper Inc. | |
| Your Fund’s Performance at a Glance | ||||
| September 30, 2011, Through September 30, 2012 | ||||
| Distributions Per Share | ||||
| Starting | Ending | Income | Capital | |
| Share Price | Share Price | Dividends | Gains | |
| Vanguard Growth Equity Fund | $9.93 | $12.53 | $0.052 | $0.000 |
1

Chairman’s Letter
Dear Shareholder,
Global stock markets began the fiscal year strongly, struggled through much of the spring, and then finished with four straight months of gains. Vanguard Growth Equity Fund returned 26.80% for the year ended September 30, 2012. The fund’s return for fiscal 2012 trailed that of its benchmark, the Russell 1000 Growth Index, by a bit more than 2 percentage points and slightly lagged the average return of large-cap growth funds.
The fund found superior performers among information technology and energy stocks compared to its benchmark, but these results were more than offset by subpar returns from its holdings in consumer discretionary and health care.
If you own shares of the fund in a taxable account, you may wish to review the section on the fund’s after-tax returns that appears later in this report.
Stocks notched a powerful rally, with help from central bankers
U.S. stocks surged 30% in the 12 months ended September 30, outpacing the gains of their international counterparts. The rally came amid moves by U.S. and European central bankers to quiet—at least temporarily—investors’ concerns about the U.S. economy and the finances of European governments and banks.
2
While U.S. stocks were the standouts, European and emerging markets stocks also posted double-digit results. The developed markets of the Pacific region were the weakest performers but still recorded a modest advance.
In July, the president of the European Central Bank declared that policymakers would do whatever was needed to preserve the euro common currency. That pronouncement was encouraging to investors, but Europe’s financial troubles are by no means resolved.
Vanguard economists believe the most likely scenario is that the Eurozone will “muddle through” for several years, with occasional spikes in market volatility, as fiscal tightening continues in the face of weak economic growth.
Bonds produced solid returns; future results may be more muted
Bonds once again advanced; the broad U.S. taxable market returned about 5% for the 12 months. Among U.S. Treasuries, long-term bonds were particularly strong as they benefited from the Federal Reserve’s bond-buying program.
As bond prices rose, the yield of the 10-year U.S. Treasury note fell to a record low in July, closing below 1.5%. (Bond yields and prices move in opposite directions.) By the end of the period, the yield had climbed, but it still remained low by historical standards.
| Market Barometer | |||
| Average Annual Total Returns | |||
| Periods Ended September 30, 2012 | |||
| One | Three | Five | |
| Year | Years | Years | |
| Stocks | |||
| Russell 1000 Index (Large-caps) | 30.06% | 13.27% | 1.22% |
| Russell 2000 Index (Small-caps) | 31.91 | 12.99 | 2.21 |
| Dow Jones U.S. Total Stock Market Index | 30.00 | 13.29 | 1.53 |
| MSCI All Country World Index ex USA (International) | 14.48 | 3.17 | -4.12 |
| Bonds | |||
| Barclays U.S. Aggregate Bond Index (Broad taxable market) | 5.16% | 6.19% | 6.53% |
| Barclays Municipal Bond Index (Broad tax-exempt market) | 8.32 | 5.99 | 6.06 |
| Citigroup Three-Month U.S. Treasury Bill Index | 0.05 | 0.08 | 0.63 |
| CPI | |||
| Consumer Price Index | 1.99% | 2.33% | 2.11% |
3
Bondholders have enjoyed years of strong returns. But as Tim Buckley, our incoming chief investment officer, has noted, investors shouldn’t be surprised if future results are much more modest. As yields tumble, the scope for further declines—and price increases—diminishes.
The Federal Reserve announced on September 13 that it would continue to hold its target for short-term interest rates between 0% and 0.25% at least through mid-2015. The exceptionally low rates, in place since late 2008, kept a tight lid on returns from money market funds and savings accounts.
The fund enjoyed strong gains across eight sectors
The Growth Equity Fund’s 12-month return of 26.80% was the highest since fiscal 2003. The Fund’s two advisors, Baillie Gifford Overseas and Jennison Associates, invest mainly in mid- and large-capitalization stocks of U.S. companies that they believe both have the potential for strong earnings growth and are reasonably valued. Reflecting the market’s bullish sentiment, the fund’s holdings in most sectors posted gains of 20% or more.
The advisors continued to emphasize information technology stocks, which represented by far the largest industry
| Expense Ratios | ||
| Your Fund Compared With Its Peer Group | ||
| Peer Group | ||
| Fund | Average | |
| Growth Equity Fund | 0.52% | 1.37% |
The fund expense ratio shown is from the prospectus dated January 27, 2012, and represents estimated costs for the current fiscal year. For the fiscal year ended September 30, 2012, the fund’s expense ratio was 0.54%. The peer-group expense ratio is derived from data provided by Lipper Inc. and captures information through year-end 2011.
Peer group: Large-Cap Growth Funds.
4
weighting in the portfolio. The advisors’ IT selections returned 37%, outpacing the sector’s performance in the fund’s benchmark and providing the biggest margin of relative outperformance. The fund’s energy stocks also did well.
The advisors’ positioning in the materials sector gave a leg up to the fund’s results in that sector compared to the benchmark; the fund held only two companies in the sector, and one of them, Monsanto, returned 54%.
Of course, results from active management can go the other way. The advisors’ selections in the consumer discretionary arena returned 23%—but in the index, consumer discretionary returned 30%.
Some of this underperformance was caused by the advisors’ omission of any positions in the cable and satellite TV subsector, which rose nearly 50%.
The fund was also hurt by subpar performance in health care and in financials. But returns for those sectors were 25% and 28%, respectively—far above long-term historical averages. These strong returns helped take some of the sting out of the underperformance.
For more on the strategy and outlook of the fund’s two advisory firms, Baillie Gifford Overseas and Jennison Associates, please see the Advisors’ Report following this letter.
| Total Returns | |
| Ten Years Ended September 30, 2012 | |
| Average | |
| Annual Return | |
| Growth Equity Fund | 7.46% |
| Russell 1000 Growth Index | 8.41 |
| Large-Cap Growth Funds Average | 6.80 |
| Large-Cap Growth Funds Average: Derived from data provided by Lipper Inc. | |
The figures shown represent past performance, which is not a guarantee of future results. (Current performance may be lower or higher than the performance data cited. For performance data current to the most recent month-end, visit our website at vanguard.com/performance.) Note, too, that both investment returns and principal value can fluctuate widely, so an investor’s shares, when sold, could be worth more or less than their original cost.
5
Navigating historic currents over the past ten years
Over the ten years ended September 30, Vanguard Growth Equity Fund has posted an average annual return of 7.46%. This figure is a bit lower than the benchmark index (+8.41%), but higher than the average result of its peer group (+6.80%). We should note that the decade included a period in which the U.S. stock market hit all-time highs, before a steep bear market and a global financial crisis crimped long-term returns.
The fund’s two advisory firms, which joined the fund about four years ago, use different but complementary approaches to identifying companies poised to grow profitably over the long term. We’re confident in the advisors’ ability to successfully navigate the uncertainties inherent in stock investing. Fortunately, the fund’s low costs give the advisors a head start in the pursuit of long-term performance.
The lessons of the financial crisis remain relevant four years later
In September, the end of your fund’s fiscal year, we marked the fourth anniversary of Lehman Brothers’ collapse, the start of the 2008–2009 financial crisis. When the Lehman news broke, I was speaking to institutional clients at an event in Washington, D.C., all of three weeks into my new role as Vanguard’s CEO.
In the ensuing months, I was struck both by how fortunate I was to work with a great team of Vanguard “crew” and by the remarkable steadiness demonstrated by our clients. Many clients experienced significant losses, but signs of panic were few. On balance, they remained committed to their long-term investment programs and managed to benefit from the financial markets’ subsequent recovery.
As the crisis recedes further in time, it’s important not to lose sight of the lessons that it illuminated about investing and sound financial practices generally. First among those lessons is that diversification does work. Diversification didn’t immunize investors from the market’s decline, but it certainly helped to insulate them from the worst of it.
Second, saving money and living within your means are critical. Investors are acting on this lesson as they pay off debt, which is a form of saving, and increase their savings rates from the dangerously low levels that prevailed before the crisis.
Third, having the courage to stick with a sound investment plan—as so many of our clients did—is important during volatile, uncertain times. Investors who resisted the urge to bail out of stocks at the depths of the crisis have largely been rewarded in the succeeding years.
6
I am very optimistic that, if investors embrace these lessons, they can give themselves a better chance of reaching their long-term goals.
As always, thank you for entrusting your assets to Vanguard.
Sincerely,

F. William McNabb III
Chairman and Chief Executive Officer
October 17, 2012
Advisors’ Report
For the fiscal year ended September 30, 2012, Vanguard Growth Equity Fund returned 26.80%. Your fund is managed by two independent advisors, a strategy that enhances the fund’s diversification by providing exposure to distinct, yet complementary, investment approaches. It’s not uncommon for different advisors to have different views about individual securities or the broader investment environment.
The advisors, the percentage of fund assets each manages, and brief descriptions of their investment strategies are presented in the table below. The advisors have also prepared a discussion of the investment environment that existed during the period and of how their portfolio positioning reflects this assessment. These comments were prepared on October 17, 2012.
Jennison Associates LLC
Portfolio Manager:
Kathleen A. McCarragher, Managing Director
Equity markets were highly volatile in the 12 months ended September 30, 2012: up strongly in the first six months, down sharply in May, then back upward again beginning in June. The gyrations reflected swings in sentiment about European sovereign-debt issues and uncertainty about global growth. Stock prices rose and fell as sentiment veered between optimism and pessimism, with these mood swings often triggered by the release of short-term data. Economic growth in the United States proceeded at a subpar pace, with unemployment remaining high and the job market
| Vanguard Growth Equity Fund Investment Advisors | |||
| Fund Assets Managed | |||
| Investment Advisor | % | $ Million | Investment Strategy |
| Jennison Associates LLC | 49 | 365 | Uses a research-driven, fundamental investment |
| approach that relies on in-depth company knowledge | |||
| gleaned through meetings with management, | |||
| customers, and suppliers. | |||
| Baillie Gifford Overseas Ltd. | 48 | 361 | Uses a fundamental approach to identify quality growth |
| companies. The firm considers the sustainability of | |||
| earnings growth to be a critical factor in evaluating a | |||
| company’s prospects. The firm looks for companies | |||
| with attractive industry backgrounds, strong | |||
| competitive positions within those industries, | |||
| high-quality earnings, and a favorable attitude toward | |||
| shareholders. | |||
| Cash Investments | 3 | 21 | These short-term reserves are invested by Vanguard in |
| equity index products to simulate investment in stocks. | |||
| Each advisor also may maintain a modest cash | |||
| position. | |||
8
expanding slowly. Personal income and spending increased at generally lackluster rates, and business and housing indicators gave inconsistent signals. Many European economies contracted as austerity measures were implemented, while in China, a key engine of global economic expansion, growth slowed. Globally, raw materials, commodities, food, and energy prices were volatile and reflected shifts in economic expectations.
In consumer discretionary and health care, the fund’s returns lagged those of the benchmark. In the former sector, Amazon.com, Ralph Lauren, and Coach, which started the fiscal year having performed solidly on strong company-specific fundamentals, rose during the period but failed to keep up with the meaningful rebound in their respective economically sensitive specialty retail subsectors. We believe that Amazon’s accelerated business investment is positioning it for robust longer-term growth in the burgeoning mobile market as well as in its core retail business. Our long-term growth assumptions for Ralph Lauren are predicated on opportunities in Europe and Asia, in categories such as accessories and shoes, and in the online channel. We believe that the markets for Coach’s handbags and accessories will continue to grow at a solid pace.
In health care, biotechnology, including our holding Alexion Pharmaceuticals, benefited more than other subsectors when investor risk appetite revived.
Alexion reported strong sales of its key product, Soliris, which treats rare and potentially life-threatening genetic blood disorders. The company is pursuing opportunities in other autoimmune and inflammatory disease settings with high unmet medical needs. However, Shire and Bristol-Myers Squibb, which earlier had been rewarded for attractive business opportunities, lagged the biotech surge. We expect Shire’s strong product pipeline to continue to generate strong revenue growth. We eliminated our investment in Bristol-Myers Squibb.
Several consumer staples stocks, especially Whole Foods and Estée Lauder, contributed significantly to portfolio performance. Whole Foods reported strong sales and earnings, with solid operating margins and continued capital discipline. Estée Lauder’s revenue and earnings were fueled by successful product launches and increased market penetration, particularly in emerging markets.
Stock performance was also solid in information technology, where Apple, Google, and LinkedIn posted strong advances. Apple reported continued impressive sales of iPhones, iPads, and Mac personal computers. We believe Apple’s creativity and innovation in product development, design, and marketing will continue to drive share gains. We consider Google’s technological lead and dominant position in internet search a unique strength that has allowed the company to monetize
9
search traffic at a meaningfully higher rate than that attained by its competitors. LinkedIn’s global online professional network has altered the talent-recruiting market, and the company provides what we consider unique access to a large-scale database of active and passive job candidates.
The portfolio continues to hold stocks of companies that it believes have above-average growth prospects at reasonable valuations.
Baillie Gifford Overseas Ltd.
Portfolio Manager:
Mick Brewis, Partner and Head of North American Investment Team
The U.S. economy has made modest progress over the last year. The economic environment remains challenging both in the United States and overseas, but we believe that despite the sea of gloomy commentary there are good reasons to be positive. The equity market appears to be taking a similar view, with the S&P 500 Index generating a very healthy total return of some 30% for the 12 months ended September 30.
The housing market remains the key to the recovery because it is the foundation upon which so much else rests. It is central to job creation, and here we have seen further steady progress from the depths of the downturn. For example, homebuilder confidence and household formation, both leading indicators of wider economic activity, are now picking up sharply. Pent-up demand is high, with many 20-something Americans living in their parents’ homes; affordability is good; and the promise of sustained low interest rates can only reinforce this dynamic.
Thus far, of course, economic growth has not been sufficiently strong to make a meaningful improvement to payroll data. However, the Federal Reserve Board is directing its latest quantitative easing exercise at the mortgage market and at the same time explicitly linking policy to the employment market. Over time, we believe that monetary policy initiatives will continue to be helpful in terms of generating growth.
At the same time, we see positive developments in the two current international market demons. In Europe, the policy of the European Central Bank is ever more clearly directed at supporting the integrity of the euro and behind the headlines we are encouraged by signs of genuine structural reform. In China, growth may be slowing in the short term, but we believe this is much less significant than the long-term shift to a consumer-led economy.
Even within a low-growth environment there are attractive, stock-specific buying opportunities, and over the last year the portfolio has been shifting toward stocks geared to a domestic cyclical recovery. Such stocks can be found in a range of sectors, and new portfolio holdings
10
include: motorcycle manufacturer Harley-Davidson, an iconic brand that should prosper as consumer spending recovers; semiconductor designers Altera and Xilinx, both of which should benefit from the flexibility their products afford to customers; and online travel review company TripAdvisor, which as the market leader is well-placed to capitalize on growth in online travel advertising spending.
We do not believe that homebuilders themselves represent worthwhile purchases at the moment, but we have recently taken a position in Watsco, a distributor of heating, air conditioning, and refrigeration equipment. Although this company should benefit in the long term from higher environmental regulatory standards and the drive for energy efficiency, it is also clearly geared to benefit from any upturn in the housing market. Similarly, while continuing to avoid investment banks, we have added to U.S. Bancorp, a regional bank whose mortgage book is growing strongly.
We have held a positive view of both the domestic economy and the stock market for some time, based on the combination of strong corporate profitability, a revived banking sector, and supportive monetary policy, and we see no reason to change our view. As always, there are plenty of issues to be resolved, not the least of which is the looming “fiscal cliff” in the United States; however, with valuations at the current modest level, we think much of this uncertainty is already reflected in the market.
11
Growth Equity Fund
Fund Profile
As of September 30, 2012
| Portfolio Characteristics | |||
| Russell | DJ | ||
| 1000 | U.S. Total | ||
| Growth | Market | ||
| Fund | Index | Index | |
| Number of Stocks | 84 | 567 | 3,638 |
| Median Market Cap | $26.3B | $52.1B | $35.6B |
| Price/Earnings Ratio | 20.7x | 19.2x | 17.0x |
| Price/Book Ratio | 3.7x | 4.4x | 2.2x |
| Return on Equity | 23.3% | 24.6% | 18.0% |
| Earnings Growth Rate | 20.0% | 18.3% | 10.4% |
| Dividend Yield | 0.9% | 1.6% | 2.0% |
| Foreign Holdings | 6.9% | 0.0% | 0.0% |
| Turnover Rate | 40% | — | — |
| Ticker Symbol | VGEQX | — | — |
| Expense Ratio1 | 0.52% | — | — |
| 30-Day SEC Yield | 0.45% | — | — |
| Short-Term Reserves | 1.0% | — | — |
| Sector Diversification (% of equity exposure) | |||
| Russell | DJ | ||
| 1000 | U.S. Total | ||
| Growth | Market | ||
| Fund | Index | Index | |
| Consumer Discretionary | 18.6% | 16.4% | 12.0% |
| Consumer Staples | 8.3 | 12.7 | 9.5 |
| Energy | 6.2 | 4.1 | 10.4 |
| Financials | 12.8 | 4.3 | 16.0 |
| Health Care | 13.6 | 11.8 | 11.9 |
| Industrials | 8.3 | 11.8 | 10.6 |
| Information Technology | 29.9 | 32.6 | 19.2 |
| Materials | 2.1 | 3.8 | 3.9 |
| Telecommunication | |||
| Services | 0.1 | 2.3 | 2.9 |
| Utilities | 0.1 | 0.2 | 3.6 |
| Volatility Measures | ||
| DJ | ||
| U.S. Total | ||
| Russell 1000 | Market | |
| Growth Index | Index | |
| R-Squared | 0.97 | 0.95 |
| Beta | 0.99 | 0.97 |
These measures show the degree and timing of the fund’s fluctuations compared with the indexes over 36 months.
| Ten Largest Holdings (% of total net assets) | ||
| Apple Inc. | Computer Hardware | 7.8% |
| eBay Inc. | Internet Software & | |
| Services | 2.3 | |
| Progressive Corp. | Property & Casualty | |
| Insurance | 2.0 | |
| F5 Networks Inc. | Communications | |
| Equipment | 2.0 | |
| US Bancorp | Diversified Banks | 1.9 |
| Berkshire Hathaway Inc. Property & Casualty | ||
| Class B | Insurance | 1.9 |
| Whole Foods Market | ||
| Inc. | Food Retail | 1.8 |
| Google Inc. Class A | Internet Software & | |
| Services | 1.8 | |
| Home Depot Inc. | Home Improvement | |
| Retail | 1.7 | |
| TripAdvisor Inc. | Internet Retail | 1.7 |
| Top Ten | 24.9% | |
The holdings listed exclude any temporary cash investments and equity index products.
Investment Focus
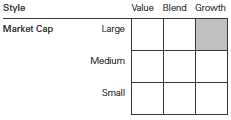
1 The expense ratio shown is from the prospectus dated January 27, 2012, and represents estimated costs for the current fiscal year. For the fiscal year ended September 30, 2012, the expense ratio was 0.54%.
12
Growth Equity Fund
Performance Summary
All of the returns in this report represent past performance, which is not a guarantee of future results that may be achieved by the fund. (Current performance may be lower or higher than the performance data cited. For performance data current to the most recent month-end, visit our website at vanguard.com/performance.) Note, too, that both investment returns and principal value can fluctuate widely, so an investor’s shares, when sold, could be worth more or less than their original cost. The returns shown do not reflect taxes that a shareholder would pay on fund distributions or on the sale of fund shares.
Cumulative Performance: September 30, 2002, Through September 30, 2012
Initial Investment of $10,000
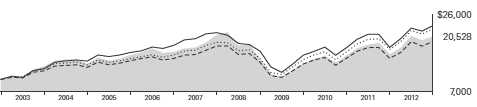
| Average Annual Total Returns | |||||
| Periods Ended September 30, 2012 | |||||
| Final Value | |||||
| One | Five | Ten | of a $10,000 | ||
| Year | Years | Years | Investment | ||
| Growth Equity Fund | 26.80% | -0.40% | 7.46% | $20,528 | |
| •••••••• | Russell 1000 Growth Index | 29.19 | 3.24 | 8.41 | 22,424 |
| – – – – | Large-Cap Growth Funds Average | 27.21 | 1.17 | 6.80 | 19,301 |
| Dow Jones U.S. Total Stock Market | |||||
| Index | 30.00 | 1.53 | 8.77 | 23,184 | |
| Large-Cap Growth Funds Average: Derived from data provided by Lipper Inc. | |||||
See Financial Highlights for dividend and capital gains information.
13
Growth Equity Fund
Fiscal-Year Total Returns (%): September 30, 2002, Through September 30, 2012
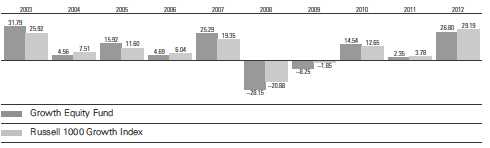
14
Growth Equity Fund
Financial Statements
Statement of Net Assets
As of September 30, 2012
The fund reports a complete list of its holdings in regulatory filings four times in each fiscal year, at the quarter-ends. For the second and fourth fiscal quarters, the lists appear in the fund’s semiannual and annual reports to shareholders. For the first and third fiscal quarters, the fund files the lists with the Securities and Exchange Commission on Form N-Q. Shareholders can look up the fund’s Forms N-Q on the SEC’s website at sec.gov. Forms N-Q may also be reviewed and copied at the SEC’s Public Reference Room (see the back cover of this report for further information).
| Market | |||
| Value | |||
| Shares | ($000) | ||
| Common Stocks (96.8%)1 | |||
| Consumer Discretionary (18.2%) | |||
| Home Depot Inc. | 209,940 | 12,674 | |
| * | TripAdvisor Inc. | 382,487 | 12,595 |
| * | Bed Bath & Beyond Inc. | 197,409 | 12,437 |
| * | Amazon.com Inc. | 43,019 | 10,941 |
| Ralph Lauren Corp. Class A | 60,319 | 9,122 | |
| Coach Inc. | 157,212 | 8,807 | |
| Harley-Davidson Inc. | 203,831 | 8,636 | |
| NIKE Inc. Class B | 85,305 | 8,096 | |
| * | O’Reilly Automotive Inc. | 87,181 | 7,290 |
| * | Michael Kors Holdings Ltd. | 131,028 | 6,968 |
| * | Inditex SA ADR | 274,202 | 6,824 |
| * | Lululemon Athletica Inc. | 88,212 | 6,522 |
| * | BorgWarner Inc. | 82,991 | 5,736 |
| Yum! Brands Inc. | 79,615 | 5,282 | |
| Omnicom Group Inc. | 74,907 | 3,862 | |
| Prada SPA | 482,416 | 3,584 | |
| * | CarMax Inc. | 122,909 | 3,478 |
| *,^ | Tesla Motors Inc. | 113,494 | 3,323 |
| 136,177 | |||
| Consumer Staples (8.0%) | |||
| Whole Foods Market Inc. | 137,108 | 13,355 | |
| Brown-Forman Corp. | |||
| Class B | 188,505 | 12,300 | |
| Colgate-Palmolive Co. | 97,182 | 10,420 | |
| Mead Johnson Nutrition Co. | 113,810 | 8,340 | |
| Costco Wholesale Corp. | 77,256 | 7,735 | |
| Estee Lauder Cos. Inc. | |||
| Class A | 121,976 | 7,510 | |
| 59,660 | |||
| Energy (5.9%) | |||
| Exxon Mobil Corp. | 130,650 | 11,948 | |
| Apache Corp. | 120,014 | 10,378 | |
| Noble Energy Inc. | 57,208 | 5,304 | |
| * | Concho Resources Inc. | 54,649 | 5,178 |
| National Oilwell Varco Inc. | 49,649 | 3,977 | |
| Market | |||
| Value | |||
| Shares | ($000) | ||
| EOG Resources Inc. | 32,478 | 3,639 | |
| Cenovus Energy Inc. | 104,243 | 3,638 | |
| 44,062 | |||
| Financials (12.4%) | |||
| Progressive Corp. | 729,184 | 15,123 | |
| US Bancorp | 415,755 | 14,260 | |
| * | Berkshire Hathaway Inc. | ||
| Class B | 157,126 | 13,859 | |
| American Tower | |||
| Corporation | 142,650 | 10,184 | |
| M&T Bank Corp. | 90,998 | 8,659 | |
| Goldman Sachs Group Inc. | 73,090 | 8,309 | |
| American Express Co. | 121,432 | 6,905 | |
| First Republic Bank | 173,223 | 5,969 | |
| Fairfax Financial | |||
| Holdings Ltd. | 14,720 | 5,686 | |
| * | Markel Corp. | 7,870 | 3,608 |
| 92,562 | |||
| Health Care (13.2%) | |||
| * | Express Scripts Holding Co. | 170,107 | 10,661 |
| * | IDEXX Laboratories Inc. | 99,109 | 9,846 |
| Allergan Inc. | 97,388 | 8,919 | |
| Novo Nordisk A/S ADR | 50,144 | 7,913 | |
| * | Waters Corp. | 87,664 | 7,305 |
| Shire plc ADR | 82,182 | 7,290 | |
| * | Alexion | ||
| Pharmaceuticals Inc. | 63,629 | 7,279 | |
| Agilent Technologies Inc. | 184,146 | 7,080 | |
| * | Vertex Pharmaceuticals Inc. | 123,188 | 6,892 |
| * | Life Technologies Corp. | 138,722 | 6,781 |
| * | Biogen Idec Inc. | 43,701 | 6,521 |
| Bristol-Myers Squibb Co. | 139,844 | 4,720 | |
| * | Gilead Sciences Inc. | 66,867 | 4,435 |
| Techne Corp. | 42,084 | 3,028 | |
| 98,670 | |||
15
Growth Equity Fund
| Market | |||
| Value | |||
| Shares | ($000) | ||
| Industrials (8.0%) | |||
| United Parcel Service Inc. | |||
| Class B | 168,385 | 12,051 | |
| Precision Castparts Corp. | 55,316 | 9,035 | |
| AMETEK Inc. | 253,694 | 8,994 | |
| * | TransDigm Group Inc. | 54,286 | 7,702 |
| Watsco Inc. | 100,320 | 7,603 | |
| Boeing Co. | 93,050 | 6,478 | |
| Danaher Corp. | 99,728 | 5,500 | |
| Rockwell Automation Inc. | 33,649 | 2,340 | |
| 59,703 | |||
| Information Technology (29.1%) | |||
| Apple Inc. | 87,478 | 58,370 | |
| * | eBay Inc. | 354,134 | 17,144 |
| * | F5 Networks Inc. | 142,419 | 14,911 |
| * | Google Inc. Class A | 17,629 | 13,301 |
| * | EMC Corp. | 407,191 | 11,104 |
| * | Teradata Corp. | 136,587 | 10,300 |
| * | VMware Inc. Class A | 105,837 | 10,239 |
| * | Red Hat Inc. | 172,321 | 9,812 |
| * | Baidu Inc. ADR | 81,556 | 9,527 |
| International Business | |||
| Machines Corp. | 44,294 | 9,189 | |
| * | LinkedIn Corp. Class A | 67,389 | 8,114 |
| Xilinx Inc. | 227,620 | 7,605 | |
| Linear Technology Corp. | 218,647 | 6,964 | |
| * | Salesforce.com Inc. | 44,604 | 6,810 |
| Analog Devices Inc. | 168,650 | 6,609 | |
| Altera Corp. | 186,471 | 6,337 | |
| QUALCOMM Inc. | 77,063 | 4,816 | |
| Avago Technologies Ltd. | 109,583 | 3,821 | |
| * | Facebook Inc. Class A | 99,246 | 2,149 |
| 217,122 | |||
| Materials (2.0%) | |||
| Monsanto Co. | 135,303 | 12,315 | |
| Praxair Inc. | 26,361 | 2,739 | |
| 15,054 | |||
| Total Common Stocks | |||
| (Cost $577,152) | 723,010 | ||
| Market | |||
| Value | |||
| Shares | ($000) | ||
| Temporary Cash Investments (3.8%)1 | |||
| Money Market Fund (3.6%) | |||
| 2,3 | Vanguard Market | ||
| Liquidity Fund, | |||
| 0.163% | 26,735,052 | 26,735 | |
| Face | |||
| Amount | |||
| ($000) | |||
| U.S. Government and Agency Obligations (0.2%) | |||
| 4,5 | Federal Home Loan | ||
| Bank Discount Notes, | |||
| 0.140%, 11/28/12 | 200 | 200 | |
| 5 | United States | ||
| Treasury Note/Bond, | |||
| 3.875%, 10/31/12 | 1,000 | 1,003 | |
| 1,203 | |||
| Total Temporary Cash Investments | |||
| (Cost $27,938) | 27,938 | ||
| Total Investments (100.6%) | |||
| (Cost $605,090) | 750,948 | ||
| Other Assets and Liabilities (-0.6%) | |||
| Other Assets | 1,077 | ||
| Liabilities3 | (5,436) | ||
| (4,359) | |||
| Net Assets (100%) | |||
| Applicable to 59,577,979 outstanding | |||
| $.001 par value shares of beneficial | |||
| interest (unlimited authorization) | 746,589 | ||
| Net Asset Value Per Share | $12.53 | ||
16
Growth Equity Fund
| At September 30, 2012, net assets consisted of: | |
| Amount | |
| ($000) | |
| Paid-in Capital | 762,351 |
| Undistributed Net Investment Income | 882 |
| Accumulated Net Realized Losses | (162,269) |
| Unrealized Appreciation (Depreciation) | |
| Investment Securities | 145,858 |
| Futures Contracts | (233) |
| Net Assets | 746,589 |
See Note A in Notes to Financial Statements.
* Non-income-producing security.
^ Part of security position is on loan to broker-dealers. The total value of securities on loan is $1,757,000.
1 The fund invests a portion of its cash reserves in equity markets through the use of index futures contracts. After giving effect to futures investments, the fund’s effective common stock and temporary cash investment positions represent 99.3% and 1.3%, respectively, of net assets.
2 Affiliated money market fund available only to Vanguard funds and certain trusts and accounts managed by Vanguard. Rate shown is the 7-day yield.
3 Includes $1,800,000 of collateral received for securities on loan.
4 The issuer operates under a congressional charter; its securities are generally neither guaranteed by the U.S. Treasury nor backed by the full faith and credit of the U.S. government.
5 Securities with a value of $1,203,000 have been segregated as initial margin for open futures contracts.
ADR—American Depositary Receipt.
See accompanying Notes, which are an integral part of the Financial Statements.
17
Growth Equity Fund
| Statement of Operations | |
| Year Ended | |
| September 30, 2012 | |
| ($000) | |
| Investment Income | |
| Income | |
| Dividends1 | 7,147 |
| Interest2 | 47 |
| Security Lending | 176 |
| Total Income | 7,370 |
| Expenses | |
| Investment Advisory Fees—Note B | |
| Basic Fee | 1,653 |
| Performance Adjustment | (142) |
| The Vanguard Group—Note C | |
| Management and Administrative | 2,093 |
| Marketing and Distribution | 150 |
| Custodian Fees | 26 |
| Auditing Fees | 26 |
| Shareholders’ Reports | 26 |
| Trustees’ Fees and Expenses | 2 |
| Total Expenses | 3,834 |
| Expenses Paid Indirectly | (29) |
| Net Expenses | 3,805 |
| Net Investment Income | 3,565 |
| Realized Net Gain (Loss) | |
| Investment Securities Sold | 33,889 |
| Futures Contracts | 5,164 |
| Foreign Currencies | (4) |
| Realized Net Gain (Loss) | 39,049 |
| Change in Unrealized Appreciation (Depreciation) | |
| Investment Securities | 111,943 |
| Futures Contracts | 477 |
| Change in Unrealized Appreciation (Depreciation) | 112,420 |
| Net Increase (Decrease) in Net Assets Resulting from Operations | 155,034 |
| 1 Dividends are net of foreign withholding taxes of $70,000. | |
| 2 Interest income from an affiliated company of the fund was $45,000. | |
See accompanying Notes, which are an integral part of the Financial Statements.
18
Growth Equity Fund
| Statement of Changes in Net Assets | ||
| Year Ended September 30, | ||
| 2012 | 2011 | |
| ($000) | ($000) | |
| Increase (Decrease) in Net Assets | ||
| Operations | ||
| Net Investment Income | 3,565 | 4,030 |
| Realized Net Gain (Loss) | 39,049 | 45,273 |
| Change in Unrealized Appreciation (Depreciation) | 112,420 | (30,785) |
| Net Increase (Decrease) in Net Assets Resulting from Operations | 155,034 | 18,518 |
| Distributions | ||
| Net Investment Income | (3,035) | (4,557) |
| Realized Capital Gain | — | — |
| Total Distributions | (3,035) | (4,557) |
| Capital Share Transactions | ||
| Issued | 184,615 | 131,034 |
| Issued in Lieu of Cash Distributions | 2,957 | 4,444 |
| Redeemed | (172,298) | (167,605) |
| Net Increase (Decrease) from Capital Share Transactions | 15,274 | (32,127) |
| Total Increase (Decrease) | 167,273 | (18,166) |
| Net Assets | ||
| Beginning of Period | 579,316 | 597,482 |
| End of Period1 | 746,589 | 579,316 |
| 1 Net Assets—End of Period includes undistributed net investment income of $882,000 and $354,000. | ||
See accompanying Notes, which are an integral part of the Financial Statements.
19
Growth Equity Fund
Financial Highlights
| For a Share Outstanding | Year Ended September 30, | ||||
| Throughout Each Period | 2012 | 2011 | 2010 | 2009 | 2008 |
| Net Asset Value, Beginning of Period | $9.93 | $9.77 | $8.60 | $9.46 | $13.18 |
| Investment Operations | |||||
| Net Investment Income | .061 | .067 | .062 | .085 | .015 |
| Net Realized and Unrealized Gain (Loss) | |||||
| on Investments | 2.591 | .168 | 1.183 | (.883) | (3.720) |
| Total from Investment Operations | 2.652 | .235 | 1.245 | (.798) | (3.705) |
| Distributions | |||||
| Dividends from Net Investment Income | (.052) | (.075) | (.075) | (.062) | (.015) |
| Distributions from Realized Capital Gains | — | — | — | — | — |
| Total Distributions | (.052) | (.075) | (.075) | (.062) | (.015) |
| Net Asset Value, End of Period | $12.53 | $9.93 | $9.77 | $8.60 | $9.46 |
| Total Return1 | 26.80% | 2.35% | 14.54% | -8.25% | -28.15% |
| Ratios/Supplemental Data | |||||
| Net Assets, End of Period (Millions) | $747 | $579 | $597 | $594 | $731 |
| Ratio of Total Expenses to | |||||
| Average Net Assets2 | 0.54% | 0.52% | 0.51% | 0.51% | 0.72% |
| Ratio of Net Investment Income to | |||||
| Average Net Assets | 0.51% | 0.60% | 0.66% | 1.10% | 0.18% |
| Portfolio Turnover Rate | 40% | 44% | 48% | 98% | 222% |
1 Total returns do not include account service fees that may have applied in the periods shown. Fund prospectuses provide information about any applicable account service fees.
2 Includes performance-based investment advisory fee increases (decreases) of (0.02%), (0.05%), (0.06%), (0.09%), and 0.08%.
See accompanying Notes, which are an integral part of the Financial Statements.
20
Growth Equity Fund
Notes to Financial Statements
Vanguard Growth Equity Fund is registered under the Investment Company Act of 1940 as an open-end investment company, or mutual fund.
A. The following significant accounting policies conform to generally accepted accounting principles for U.S. mutual funds. The fund consistently follows such policies in preparing its financial statements.
1. Security Valuation: Securities are valued as of the close of trading on the New York Stock Exchange (generally 4 p.m., Eastern time) on the valuation date. Equity securities are valued at the latest quoted sales prices or official closing prices taken from the primary market in which each security trades; such securities not traded on the valuation date are valued at the mean of the latest quoted bid and asked prices. Securities for which market quotations are not readily available, or whose values have been affected by events occurring before the fund’s pricing time but after the close of the securities’ primary markets, are valued at their fair values calculated according to procedures adopted by the board of trustees. These procedures include obtaining quotations from an independent pricing service, monitoring news to identify significant market- or security-specific events, and evaluating changes in the values of foreign market proxies (for example, ADRs, futures contracts, or exchange-traded funds), between the time the foreign markets close and the fund’s pricing time. When fair-value pricing is employed, the prices of securities used by a fund to calculate its net asset value may differ from quoted or published prices for the same securities. Investments in Vanguard Market Liquidity Fund are valued at that fund’s net asset value. Temporary cash investments acquired over 60 days to maturity are valued using the latest bid prices or using valuations based on a matrix system (which considers such factors as security prices, yields, maturities, and ratings), both as furnished by independent pricing services. Other temporary cash investments are valued at amortized cost, which approximates market value.
2. Foreign Currency: Securities and other assets and liabilities denominated in foreign currencies are translated into U.S. dollars using exchange rates obtained from an independent third party as of the fund’s pricing time on the valuation date. Realized gains (losses) and unrealized appreciation (depreciation) on investment securities include the effects of changes in exchange rates since the securities were purchased, combined with the effects of changes in security prices. Fluctuations in the value of other assets and liabilities resulting from changes in exchange rates are recorded as unrealized foreign currency gains (losses) until the assets or liabilities are settled in cash, at which time they are recorded as realized foreign currency gains (losses).
3. Futures Contracts: The fund uses index futures contracts to a limited extent, with the objective of maintaining full exposure to the stock market while maintaining liquidity. The fund may purchase or sell futures contracts to achieve a desired level of investment, whether to accommodate portfolio turnover or cash flows from capital share transactions. The primary risks associated with the use of futures contracts are imperfect correlation between changes in market values of stocks held by the fund and the prices of futures contracts, and the possibility of an illiquid market.
Futures contracts are valued at their quoted daily settlement prices. The aggregate principal amounts of the contracts are not recorded in the Statement of Net Assets. Fluctuations in the value of the contracts are recorded in the Statement of Net Assets as an asset (liability) and in the Statement of Operations as unrealized appreciation (depreciation) until the contracts are closed, when they are recorded as realized futures gains (losses).
21
Growth Equity Fund
During the year ended September 30, 2012, the fund’s average investment in futures contracts represented 3% of net assets, based on quarterly average aggregate settlement values.
4. Federal Income Taxes: The fund intends to continue to qualify as a regulated investment company and distribute all of its taxable income. Management has analyzed the fund’s tax positions taken for all open federal income tax years (September 30, 2009–2012), and has concluded that no provision for federal income tax is required in the fund’s financial statements.
5. Distributions: Distributions to shareholders are recorded on the ex-dividend date.
6. Security Lending: The fund may lend its securities to qualified institutional borrowers to earn additional income. Security loans are required to be secured at all times by collateral at least equal to the market value of securities loaned. The fund invests cash collateral received in Vanguard Market Liquidity Fund, and records a liability for the return of the collateral, during the period the securities are on loan. Security lending income represents fees charged to borrowers plus income earned on investing cash collateral, less expenses associated with the loan.
7. Other: Dividend income is recorded on the ex-dividend date. Interest income includes income distributions received from Vanguard Market Liquidity Fund and is accrued daily. Security transactions are accounted for on the date securities are bought or sold. Costs used to determine realized gains (losses) on the sale of investment securities are those of the specific securities sold.
B. Baillie Gifford Overseas Ltd. and Jennison Associates LLC each provide investment advisory services to a portion of the fund for a fee calculated at an annual percentage rate of average net assets managed by the advisor. The basic fee of Baillie Gifford Overseas Ltd. is subject to quarterly adjustments based on performance for the preceding three years relative to the S&P 500 Index. The basic fee of Jennison Associates LLC is subject to quarterly adjustments based on performance for the preceding three years relative to the Russell 1000 Growth Index.
The Vanguard Group manages the cash reserves of the fund on an at-cost basis.
For the year ended September 30, 2012, the aggregate investment advisory fee represented an effective annual basic rate of 0.23% of the fund’s average net assets, before a decrease of $142,000 (0.02%) based on performance.
C. The Vanguard Group furnishes at cost corporate management, administrative, marketing, and distribution services. The costs of such services are allocated to the fund under methods approved by the board of trustees. The fund has committed to provide up to 0.40% of its net assets in capital contributions to Vanguard. At September 30, 2012, the fund had contributed capital of $105,000 to Vanguard (included in Other Assets), representing 0.01% of the fund’s net assets and 0.04% of Vanguard’s capitalization. The fund’s trustees and officers are also directors and officers of Vanguard.
D. The fund has asked its investment advisor to direct certain security trades, subject to obtaining the best price and execution, to brokers who have agreed to rebate to the fund part of the commissions generated. Such rebates are used solely to reduce the fund’s management and administrative expenses. For the year ended September 30, 2012, these arrangements reduced the fund’s expenses by $29,000 (an annual rate of 0.00% of average net assets).
22
Growth Equity Fund
E. Various inputs may be used to determine the value of the fund’s investments. These inputs are summarized in three broad levels for financial statement purposes. The inputs or methodologies used to value securities are not necessarily an indication of the risk associated with investing in those securities.
Level 1—Quoted prices in active markets for identical securities.
Level 2—Other significant observable inputs (including quoted prices for similar securities, interest rates, prepayment speeds, credit risk, etc.).
Level 3—Significant unobservable inputs (including the fund’s own assumptions used to determine the fair value of investments).
The following table summarizes the market value of the fund’s investments as of September 30, 2012, based on the inputs used to value them:
| Level 1 | Level 2 | Level 3 | |
| Investments | ($000) | ($000) | ($000) |
| Common Stocks | 719,426 | 3,584 | — |
| Temporary Cash Investments | 26,735 | 1,203 | — |
| Futures Contracts—Assets1 | 17 | — | — |
| Futures Contracts—Liabilities1 | (117) | — | — |
| Total | 746,061 | 4,787 | — |
| 1 Represents variation margin on the last day of the reporting period. | |||
F. At September 30, 2012, the aggregate settlement value of open futures contracts and the related unrealized appreciation (depreciation) were:
| ($000) | ||||
| Aggregate | ||||
| Number of | Settlement | Unrealized | ||
| Long (Short) | Value | Appreciation | ||
| Futures Contracts | Expiration | Contracts | Long (Short) | (Depreciation) |
| S&P 500 Index | December 2012 | 48 | 17,210 | (226) |
| E-mini S&P 500 Index | December 2012 | 20 | 1,434 | (7) |
Unrealized appreciation (depreciation) on open futures contracts is required to be treated as realized gain (loss) for tax purposes.
G. Distributions are determined on a tax basis and may differ from net investment income and realized capital gains for financial reporting purposes. Differences may be permanent or temporary. Permanent differences are reclassified among capital accounts in the financial statements to reflect their tax character. Temporary differences arise when certain items of income, expense, gain, or loss are recognized in different periods for financial statement and tax purposes; these differences will reverse at some time in the future. Differences in classification may also result from the treatment of short-term gains as ordinary income for tax purposes.
23
Growth Equity Fund
During the year ended September 30, 2012, the fund realized net foreign currency losses of $4,000, which decreased distributable net income for tax purposes; accordingly, such losses have been reclassified from accumulated net realized losses to undistributed net investment income.
For tax purposes, at September 30, 2012, the fund had $2,678,000 of ordinary income available for distribution. The fund used capital loss carryforwards of $39,529,000 to offset taxable capital gains realized during the year ended September 30, 2012. At September 30, 2012, the fund had available capital losses totaling $162,351,000 to offset future net capital gains of $34,293,000 through September 30, 2017, and $128,058,000 through September 30, 2018.
At September 30, 2012, the cost of investment securities for tax purposes was $605,090,000.
Net unrealized appreciation of investment securities for tax purposes was $145,858,000, consisting of unrealized gains of $158,701,000 on securities that had risen in value since their purchase and $12,843,000 in unrealized losses on securities that had fallen in value since their purchase.
H. During the year ended September 30, 2012, the fund purchased $295,895,000 of investment securities and sold $265,569,000 of investment securities, other than temporary cash investments.
I. Capital shares issued and redeemed were:
| Year Ended September 30, | ||
| 2012 | 2011 | |
| Shares | Shares | |
| (000) | (000) | |
| Issued | 15,606 | 11,983 |
| Issued in Lieu of Cash Distributions | 279 | 414 |
| Redeemed | (14,632) | (15,205) |
| Net Increase (Decrease) in Shares Outstanding | 1,253 | (2,808) |
J. In preparing the financial statements as of September 30, 2012, management considered the impact of subsequent events for potential recognition or disclosure in these financial statements.
24
Report of Independent Registered Public Accounting Firm
To the Trustees of Vanguard Fenway Funds and the Shareholders of Vanguard Growth Equity Fund:
In our opinion, the accompanying statement of net assets and the related statements of operations and of changes in net assets and the financial highlights present fairly, in all material respects, the financial position of Vanguard Growth Equity Fund (constituting a separate portfolio of Vanguard Fenway Funds, hereafter referred to as the “Fund”) at September 30, 2012, the results of its operations for the year then ended, the changes in its net assets for each of the two years in the period then ended and the financial highlights for each of the five years in the period then ended, in conformity with accounting principles generally accepted in the United States of America. These financial statements and financial highlights (hereafter referred to as “financial statements”) are the responsibility of the Fund’s management; our responsibility is to express an opinion on these financial statements based on our audits. We conducted our audits of these financial statements in accordance with the standards of the Public Company Accounting Oversight Board (United States). Those standards require that we plan and perform the audit to obtain reasonable assurance about whether the financial statements are free of material misstatement. An audit includes examining, on a test basis, evidence supporting the amounts and disclosures in the financial statements, assessing the accounting principles used and significant estimates made by management, and evaluating the overall financial statement presentation. We believe that our audits, which included confirmation of securities at September 30, 2012 by correspondence with the custodian and broker and by agreement to the underlying ownership records of the transfer agent, provide a reasonable basis for our opinion.
PricewaterhouseCoopers LLP
Philadelphia, Pennsylvania
November 12, 2012
| Special 2012 tax information (unaudited) for Vanguard Growth Equity Fund |
This information for the fiscal year ended September 30, 2012, is included pursuant to provisions of the Internal Revenue Code.
The fund distributed $3,035,000 of qualified dividend income to shareholders during the fiscal year.
For corporate shareholders, 100% of investment income (dividend income plus short-term gains, if any) qualifies for the dividends-received deduction.
25
Your Fund’s After-Tax Returns
This table presents returns for your fund both before and after taxes. The after-tax returns are shown in two ways: (1) assuming that an investor owned the fund during the entire period and paid taxes on the fund’s distributions, and (2) assuming that an investor paid taxes on the fund’s distributions and sold all shares at the end of each period.
Calculations are based on the highest individual federal income tax and capital gains tax rates in effect at the times of the distributions and the hypothetical sales. State and local taxes were not considered. After-tax returns reflect any qualified dividend income, using actual prior-year figures and estimates for 2012. (In the example, returns after the sale of fund shares may be higher than those assuming no sale. This occurs when the sale would have produced a capital loss. The calculation assumes that the investor received a tax deduction for the loss.)
Please note that your actual after-tax returns will depend on your tax situation and may differ from those shown. Also note that if you own the fund in a tax-deferred account, such as an individual retirement account or a 401(k) plan, this information does not apply to you. Such accounts are not subject to current taxes.
Finally, keep in mind that a fund’s performance—whether before or after taxes—does not guarantee future results.
| Average Annual Total Returns: Growth Equity Fund | |||
| Periods Ended September 30, 2012 | |||
| One | Five | Ten | |
| Year | Years | Years | |
| Returns Before Taxes | 26.80% | -0.40% | 7.46% |
| Returns After Taxes on Distributions | 26.71 | -0.50 | 7.39 |
| Returns After Taxes on Distributions and Sale of Fund Shares | 17.52 | -0.36 | 6.58 |
26
About Your Fund’s Expenses
As a shareholder of the fund, you incur ongoing costs, which include costs for portfolio management, administrative services, and shareholder reports (like this one), among others. Operating expenses, which are deducted from a fund’s gross income, directly reduce the investment return of the fund.
A fund’s expenses are expressed as a percentage of its average net assets. This figure is known as the expense ratio. The following examples are intended to help you understand the ongoing costs (in dollars) of investing in your fund and to compare these costs with those of other mutual funds. The examples are based on an investment of $1,000 made at the beginning of the period shown and held for the entire period.
The accompanying table illustrates your fund’s costs in two ways:
• Based on actual fund return. This section helps you to estimate the actual expenses that you paid over the period. The ”Ending Account Value“ shown is derived from the fund‘s actual return, and the third column shows the dollar amount that would have been paid by an investor who started with $1,000 in the fund. You may use the information here, together with the amount you invested, to estimate the expenses that you paid over the period.
To do so, simply divide your account value by $1,000 (for example, an $8,600 account value divided by $1,000 = 8.6), then multiply the result by the number given for your fund under the heading ”Expenses Paid During Period.“
• Based on hypothetical 5% yearly return. This section is intended to help you compare your fund‘s costs with those of other mutual funds. It assumes that the fund had a yearly return of 5% before expenses, but that the expense ratio is unchanged. In this case—because the return used is not the fund’s actual return—the results do not apply to your investment. The example is useful in making comparisons because the Securities and Exchange Commission requires all mutual funds to calculate expenses based on a 5% return. You can assess your fund’s costs by comparing this hypothetical example with the hypothetical examples that appear in shareholder reports of other funds.
Note that the expenses shown in the table are meant to highlight and help you compare ongoing costs only and do not reflect transaction costs incurred by the fund for buying and selling securities. Further, the expenses do not include any purchase, redemption, or account service fees described in the fund prospectus. If such fees were applied to your account, your costs would be higher. Your fund does not carry a “sales load.”
The calculations assume no shares were bought or sold during the period. Your actual costs may have been higher or lower, depending on the amount of your investment and the timing of any purchases or redemptions.
You can find more information about the fund’s expenses, including annual expense ratios, in the Financial Statements section of this report. For additional information on operating expenses and other shareholder costs, please refer to your fund’s current prospectus.
27
| Six Months Ended September 30, 2012 | |||
| Beginning | Ending | Expenses | |
| Account Value | Account Value | Paid During | |
| Growth Equity Fund | 3/31/2012 | 9/30/2012 | Period |
| Based on Actual Fund Return | $1,000.00 | $993.66 | $2.70 |
| Based on Hypothetical 5% Yearly Return | 1,000.00 | 1,022.36 | 2.74 |
The calculations are based on expenses incurred in the most recent six-month period. The fund’s annualized six-month expense ratio for that period is 0.54%. The dollar amounts shown as “Expenses Paid” are equal to the annualized expense ratio multiplied by the average account value over the period, multiplied by the number of days in the most recent six-month period, then divided by the number of days in the most recent 12-month period.
28
Glossary
30-Day SEC Yield. A fund’s 30-day SEC yield is derived using a formula specified by the U.S. Securities and Exchange Commission. Under the formula, data related to the fund’s security holdings in the previous 30 days are used to calculate the fund’s hypothetical net income for that period, which is then annualized and divided by the fund’s estimated average net assets over the calculation period. For the purposes of this calculation, a security’s income is based on its current market yield to maturity (for bonds), its actual income (for asset-backed securities), or its projected dividend yield (for stocks). Because the SEC yield represents hypothetical annualized income, it will differ—at times significantly—from the fund’s actual experience. As a result, the fund’s income distributions may be higher or lower than implied by the SEC yield.
Beta. A measure of the magnitude of a fund’s past share-price fluctuations in relation to the ups and downs of a given market index. The index is assigned a beta of 1.00. Compared with a given index, a fund with a beta of 1.20 typically would have seen its share price rise or fall by 12% when the index rose or fell by 10%. For this report, beta is based on returns over the past 36 months for both the fund and the index. Note that a fund’s beta should be reviewed in conjunction with its R-squared (see definition). The lower the R-squared, the less correlation there is between the fund and the index, and the less reliable beta is as an indicator of volatility.
Dividend Yield. Dividend income earned by stocks, expressed as a percentage of the aggregate market value (or of net asset value, for a fund). The yield is determined by dividing the amount of the annual dividends by the aggregate value (or net asset value) at the end of the period. For a fund, the dividend yield is based solely on stock holdings and does not include any income produced by other investments.
Earnings Growth Rate. The average annual rate of growth in earnings over the past five years for the stocks now in a fund.
Equity Exposure. A measure that reflects a fund’s investments in stocks and stock futures. Any holdings in short-term reserves are excluded.
Expense Ratio. A fund’s total annual operating expenses expressed as a percentage of the fund’s average net assets. The expense ratio includes management and administrative expenses, but does not include the transaction costs of buying and selling portfolio securities.
Foreign Holdings. The percentage of a fund represented by securities or depositary receipts of companies based outside the United States.
Inception Date. The date on which the assets of a fund (or one of its share classes) are first invested in accordance with the fund’s investment objective. For funds with a subscription period, the inception date is the day after that period ends. Investment performance is measured from the inception date.
Median Market Cap. An indicator of the size of companies in which a fund invests; the midpoint of market capitalization (market price x shares outstanding) of a fund’s stocks, weighted by the proportion of the fund’s assets invested in each stock. Stocks representing half of the fund’s assets have market capitalizations above the median, and the rest are below it.
Price/Book Ratio. The share price of a stock divided by its net worth, or book value, per share. For a fund, the weighted average price/book ratio of the stocks it holds.
29
Price/Earnings Ratio. The ratio of a stock’s current price to its per-share earnings over the past year. For a fund, the weighted average P/E of the stocks it holds. P/E is an indicator of market expectations about corporate prospects; the higher the P/E, the greater the expectations for a company’s future growth.
R-Squared. A measure of how much of a fund’s past returns can be explained by the returns from the market in general, as measured by a given index. If a fund’s total returns were precisely synchronized with an index’s returns, its R-squared would be 1.00. If the fund’s returns bore no relationship to the index’s returns, its R-squared would be 0. For this report, R-squared is based on returns over the past 36 months for both the fund and the index.
Return on Equity. The annual average rate of return generated by a company during the past five years for each dollar of shareholder’s equity (net income divided by shareholder’s equity). For a fund, the weighted average return on equity for the companies whose stocks it holds.
Short-Term Reserves. The percentage of a fund invested in highly liquid, short-term securities that can be readily converted to cash.
Turnover Rate. An indication of the fund’s trading activity. Funds with high turnover rates incur higher transaction costs and may be more likely to distribute capital gains (which may be taxable to investors). The turnover rate excludes in-kind transactions, which have minimal impact on costs.
30
This page intentionally left blank.
The People Who Govern Your Fund
The trustees of your mutual fund are there to see that the fund is operated and managed in your best interests since, as a shareholder, you are a part owner of the fund. Your fund’s trustees also serve on the board of directors of The Vanguard Group, Inc., which is owned by the Vanguard funds and provides services to them on an at-cost basis.
A majority of Vanguard’s board members are independent, meaning that they have no affiliation with Vanguard or the funds they oversee, apart from the sizable personal investments they have made as private individuals. The independent board members have distinguished backgrounds in business, academia, and public service. Each of the trustees and executive officers oversees 179 Vanguard funds.
The following table provides information for each trustee and executive officer of the fund. More information about the trustees is in the Statement of Additional Information, which can be obtained, without charge, by contacting Vanguard at 800-662-7447, or online at vanguard.com.
| InterestedTrustee1 | and Delphi Automotive LLP (automotive components); |
| Senior Advisor at New Mountain Capital; Trustee of | |
| F. William McNabb III | The Conference Board. |
| Born 1957. Trustee Since July 2009. Chairman of the | |
| Board. Principal Occupation(s) During the Past Five | Amy Gutmann |
| Years: Chairman of the Board of The Vanguard Group, | Born 1949. Trustee Since June 2006. Principal |
| Inc., and of each of the investment companies served | Occupation(s) During the Past Five Years: President |
| by The Vanguard Group, since January 2010; Director | of the University of Pennsylvania; Christopher H. |
| of The Vanguard Group since 2008; Chief Executive | Browne Distinguished Professor of Political Science |
| Officer and President of The Vanguard Group and of | in the School of Arts and Sciences with secondary |
| each of the investment companies served by The | appointments at the Annenberg School for |
| Vanguard Group since 2008; Director of Vanguard | Communication and the Graduate School of Education |
| Marketing Corporation; Managing Director of The | of the University of Pennsylvania; Member of the |
| Vanguard Group (1995–2008). | National Commission on the Humanities and Social |
| Sciences; Trustee of Carnegie Corporation of New | |
| IndependentTrustees | York and of the National Constitution Center; Chair |
| of the U. S. Presidential Commission for the Study | |
| Emerson U. Fullwood | of Bioethical Issues. |
| Born 1948. Trustee Since January 2008. Principal | JoAnn Heffernan Heisen |
| Occupation(s) During the Past Five Years: Executive | Born 1950. Trustee Since July 1998. Principal |
| Chief Staff and Marketing Officer for North America | Occupation(s) During the Past Five Years: Corporate |
| and Corporate Vice President (retired 2008) of Xerox | Vice President and Chief Global Diversity Officer |
| Corporation (document management products and | (retired 2008) and Member of the Executive |
| services); Executive in Residence and 2010 | Committee (1997–2008) of Johnson & Johnson |
| Distinguished Minett Professor at the Rochester | (pharmaceuticals/medical devices/consumer |
| Institute of Technology; Director of SPX Corporation | products); Director of Skytop Lodge Corporation |
| (multi-industry manufacturing), the United Way of | (hotels), the University Medical Center at Princeton, |
| Rochester, Amerigroup Corporation (managed health | the Robert Wood Johnson Foundation, and the Center |
| care), the University of Rochester Medical Center, | for Talent Innovation; Member of the Advisory Board |
| Monroe Community College Foundation, and North | of the Maxwell School of Citizenship and Public Affairs |
| Carolina A&T University. | at Syracuse University. |
| Rajiv L. Gupta | F. Joseph Loughrey |
| Born 1945. Trustee Since December 2001.2 | Born 1949. Trustee Since October 2009. Principal |
| Principal Occupation(s) During the Past Five Years: | Occupation(s) During the Past Five Years: President |
| Chairman and Chief Executive Officer (retired 2009) | and Chief Operating Officer (retired 2009) of Cummins |
| and President (2006–2008) of Rohm and Haas Co. | Inc. (industrial machinery); Director of SKF AB |
| (chemicals); Director of Tyco International, Ltd. | (industrial machinery), Hillenbrand, Inc. (specialized |
| (diversified manufacturing and services), Hewlett- | consumer services), the Lumina Foundation for |
| Packard Co. (electronic computer manufacturing), | |
| Education, and Oxfam America; Chairman of the | Executive Officers | |
| Advisory Council for the College of Arts and Letters | ||
| and Member of the Advisory Board to the Kellogg | Glenn Booraem | |
| Institute for International Studies at the University | Born 1967. Controller Since July 2010. Principal | |
| of Notre Dame. | Occupation(s) During the Past Five Years: Principal | |
| of The Vanguard Group, Inc.; Controller of each of | ||
| Mark Loughridge | the investment companies served by The Vanguard | |
| Born 1953. Trustee Since March 2012. Principal | Group; Assistant Controller of each of the investment | |
| Occupation(s) During the Past Five Years: Senior Vice | companies served by The Vanguard Group (2001–2010). | |
| President and Chief Financial Officer at IBM (information | ||
| technology services); Fiduciary Member of IBM’s | Thomas J. Higgins | |
| Retirement Plan Committee. | Born 1957. Chief Financial Officer Since September | |
| 2008. Principal Occupation(s) During the Past Five | ||
| Scott C. Malpass | Years: Principal of The Vanguard Group, Inc.; Chief | |
| Born 1962. Trustee Since March 2012. Principal | Financial Officer of each of the investment companies | |
| Occupation(s) During the Past Five Years: Chief | served by The Vanguard Group; Treasurer of each of | |
| Investment Officer and Vice President at the University | the investment companies served by The Vanguard | |
| of Notre Dame; Assistant Professor of Finance at the | Group (1998–2008). | |
| Mendoza College of Business at Notre Dame; Member | ||
| of the Notre Dame 403(b) Investment Committee; | Kathryn J. Hyatt | |
| Director of TIFF Advisory Services, Inc. (investment | Born 1955. Treasurer Since November 2008. Principal | |
| advisor); Member of the Investment Advisory | Occupation(s) During the Past Five Years: Principal of | |
| Committees of the Financial Industry Regulatory | The Vanguard Group, Inc.; Treasurer of each of the | |
| Authority (FINRA) and of Major League Baseball. | investment companies served by The Vanguard | |
| Group; Assistant Treasurer of each of the investment | ||
| André F. Perold | companies served by The Vanguard Group (1988–2008). | |
| Born 1952. Trustee Since December 2004. Principal | ||
| Occupation(s) During the Past Five Years: George | Heidi Stam | |
| Gund Professor of Finance and Banking at the Harvard | Born 1956. Secretary Since July 2005. Principal | |
| Business School (retired 2011); Chief Investment | Occupation(s) During the Past Five Years: Managing | |
| Officer and Managing Partner of HighVista Strategies | Director of The Vanguard Group, Inc.; General Counsel | |
| LLC (private investment firm); Director of Rand | of The Vanguard Group; Secretary of The Vanguard | |
| Merchant Bank; Overseer of the Museum of Fine | Group and of each of the investment companies | |
| Arts Boston. | served by The Vanguard Group; Director and Senior | |
| Vice President of Vanguard Marketing Corporation. | ||
| Alfred M. Rankin, Jr. | ||
| Born 1941. Trustee Since January 1993. Principal | Vanguard Senior ManagementTeam | |
| Occupation(s) During the Past Five Years: Chairman, | ||
| President, and Chief Executive Officer of NACCO | Mortimer J. Buckley | Michael S. Miller |
| Industries, Inc. (forklift trucks/housewares/lignite); | Kathleen C. Gubanich | James M. Norris |
| Director of Goodrich Corporation (industrial products/ | Paul A. Heller | Glenn W. Reed |
| aircraft systems and services) and the National | Martha G. King | George U. Sauter |
| Association of Manufacturers; Chairman of the Board | Chris D. McIsaac | |
| of the Federal Reserve Bank of Cleveland and of | ||
| University Hospitals of Cleveland; Advisory Chairman | ||
| of the Board of The Cleveland Museum of Art. | Chairman Emeritus and Senior Advisor | |
| Peter F. Volanakis | John | |
| Born 1955. Trustee Since July 2009. Principal | Chairman, 1996–2009 | |
| Occupation(s) During the Past Five Years: President | Chief Executive Officer and President, 1996–2008 | |
| and Chief Operating Officer (retired 2010) of Corning | ||
| Incorporated (communications equipment); Director | Founder | |
| of SPX Corporation (multi-industry manufacturing); | ||
| Overseer of the Amos Tuck School of Business | John C. Bogle | |
| Administration at Dartmouth College; Advisor to the | Chairman and Chief Executive Officer, 1974–1996 | |
| Norris Cotton Cancer Center. | ||
1 Mr. McNabb is considered an “interested person,” as defined in the Investment Company Act of 1940, because he is an officer of the Vanguard funds.
2 December 2002 for Vanguard Equity Income Fund, Vanguard Growth Equity Fund, the Vanguard Municipal Bond Funds, and the Vanguard State Tax-Exempt Funds.
 | |
| P.O. Box 2600 | |
| Valley Forge, PA 19482-2600 |
Connect with Vanguard® > vanguard.com
| Fund Information > 800-662-7447 | |
| Direct Investor Account Services > 800-662-2739 | |
| Institutional Investor Services > 800-523-1036 | |
| Text Telephone for People | |
| With Hearing Impairment > 800-749-7273 | |
| This material may be used in conjunction | |
| with the offering of shares of any Vanguard | |
| fund only if preceded or accompanied by | |
| the fund’s current prospectus. | |
| All comparative mutual fund data are from Lipper Inc. or | |
| Morningstar, Inc., unless otherwise noted. | |
| You can obtain a free copy of Vanguard’s proxy voting | |
| guidelines by visiting vanguard.com/proxyreporting or by | |
| calling Vanguard at 800-662-2739. The guidelines are | |
| also available from the SEC’s website, sec.gov. In | |
| addition, you may obtain a free report on how your fund | |
| voted the proxies for securities it owned during the 12 | |
| months ended June 30. To get the report, visit either | |
| vanguard.com/proxyreporting or sec.gov. | |
| You can review and copy information about your fund at | |
| the SEC’s Public Reference Room in Washington, D.C. To | |
| find out more about this public service, call the SEC at | |
| 202-551-8090. Information about your fund is also | |
| available on the SEC’s website, and you can receive | |
| copies of this information, for a fee, by sending a | |
| request in either of two ways: via e-mail addressed to | |
| publicinfo@sec.gov or via regular mail addressed to the | |
| Public Reference Section, Securities and Exchange | |
| Commission, Washington, DC 20549-1520. | |
| © 2012 The Vanguard Group, Inc. | |
| All rights reserved. | |
| Vanguard Marketing Corporation, Distributor. | |
| Q5440 112012 | |
|
| Annual Report | September 30, 2012 |
| Vanguard PRIMECAP Core Fund |
 |
> For the fiscal year 2012, Vanguard PRIMECAP Core Fund returned about 23%, trailing the return of its benchmark index and the average return of peer funds.
> The fund’s returns in information technology, one of its largest sectors, were less than half those recorded by the benchmark’s information technology stocks.
> While the health care sector was a bright spot for the fund, it couldn’t offset the shortfalls in technology and other areas.
| Contents | |
| Your Fund’s Total Returns. | 1 |
| Chairman’s Letter. | 2 |
| Advisor’s Report. | 8 |
| Fund Profile. | 12 |
| Performance Summary. | 13 |
| Financial Statements. | 15 |
| Your Fund’s After-Tax Returns. | 25 |
| About Your Fund’s Expenses. | 26 |
| Glossary. | 28 |
Please note: The opinions expressed in this report are just that—informed opinions. They should not be considered promises or advice. Also, please keep in mind that the information and opinions cover the period through the date on the front of this report. Of course, the risks of investing in your fund are spelled out in the prospectus.
See the Glossary for definitions of investment terms used in this report.
About the cover: Our cover photograph shows rigging on the HMSSurprise, a replica of an 18th-century Royal Navy frigate. It was featured in the 2003 movie Master and Commander: The Far Side of the World, which was based on Patrick O’Brian’s sea novels, set amid the Napoleonic Wars. Vanguard was named for another ship of that era, the HMSVanguard, which was the flagship of British Admiral Horatio Nelson at the Battle of the Nile.
Your Fund’s Total Returns
| Fiscal Year Ended September 30, 2012 | |
| Total | |
| Returns | |
| Vanguard PRIMECAP Core Fund | 22.55% |
| MSCI US Prime Market 750 Index | 29.98 |
| Multi-Cap Core Funds Average | 25.24 |
| Multi-Cap Core Funds Average: Derived from data provided by Lipper Inc. | |
| Your Fund’s Performance at a Glance | ||||
| September 30, 2011, Through September 30, 2012 | ||||
| Distributions Per Share | ||||
| Starting | Ending | Income | Capital | |
| Share Price | Share Price | Dividends | Gains | |
| Vanguard PRIMECAP Core Fund | $12.37 | $14.98 | $0.163 | $0.000 |
1

Chairman’s Letter
Dear Shareholder,
Global stock markets began the fiscal year strongly and––after weathering some springtime disruption––also finished on a high note with four straight months of gains. Although Vanguard PRIMECAP Core Fund’s performance was strong for the 12 months ended September 30, 2012, it trailed its comparative standards. The fund returned about 23% for the period, compared to about 30% for its benchmark, the MSCI US Prime 750 Index, and about 25% on average for peer multi-capitalization core funds.
The fund’s returns often diverge from those of its benchmark and peers because of the advisor’s willingness to establish outsized stakes in what it considers the market’s most promising long-term investment opportunities. In recent years, the advisor has found those opportunities in information technology and health care companies. Over the past 12 months, the fund’s tech stocks weighed on relative performance, while its health care stocks gave it a boost.
On a separate note, I want to inform you that Vanguard has eliminated the redemption fee for your fund, effective May 23. The fund’s trustees determined that the fee, one of several measures in place to discourage frequent trading and protect the interests of long-term investors, was no longer needed.
2
If you hold fund shares in a taxable account, you may wish to review the table of after-tax returns, based on the highest federal income tax bracket, that appears later in this report.
Stocks notched a powerful rally, with help from central bankers
U.S. stocks surged 30% in the 12 months ended September 30, outpacing the gains of their international counterparts. The rally came amid moves by U.S. and European central bankers to quiet—at least temporarily—investors’ concerns about the U.S. economy and the finances of European governments and banks.
While U.S. stocks were the standouts, European and emerging markets stocks also posted double-digit results. The developed markets of the Pacific region were the weakest performers but still recorded a modest advance.
In July, the president of the European Central Bank declared that policymakers would do whatever was needed to preserve the euro common currency. That pronouncement was encouraging to investors, but Europe’s financial troubles are by no means resolved.
Vanguard economists believe the most likely scenario is that the Eurozone will “muddle through” for several years, with occasional spikes in market volatility, as fiscal tightening continues in the face of weak economic growth.
| Market Barometer | |||
| Average Annual Total Returns | |||
| Periods Ended September 30, 2012 | |||
| One | Three | Five | |
| Year | Years | Years | |
| Stocks | |||
| Russell 1000 Index (Large-caps) | 30.06% | 13.27% | 1.22% |
| Russell 2000 Index (Small-caps) | 31.91 | 12.99 | 2.21 |
| Dow Jones U.S. Total Stock Market Index | 30.00 | 13.29 | 1.53 |
| MSCI All Country World Index ex USA (International) | 14.48 | 3.17 | -4.12 |
| Bonds | |||
| Barclays U.S. Aggregate Bond Index (Broad taxable market) | 5.16% | 6.19% | 6.53% |
| Barclays Municipal Bond Index (Broad tax-exempt market) | 8.32 | 5.99 | 6.06 |
| Citigroup Three-Month U.S. Treasury Bill Index | 0.05 | 0.08 | 0.63 |
| CPI | |||
| Consumer Price Index | 1.99% | 2.33% | 2.11% |
3
Bonds produced solid returns; future results may be more muted
Bonds once again advanced; the broad U.S. taxable market returned about 5% for the 12 months. Among U.S. Treasuries, long-term bonds were particularly strong as they benefited from the Federal Reserve’s bond-buying program.
As bond prices rose, the yield of the 10-year U.S. Treasury note fell to a record low in July, closing below 1.5%. (Bond yields and prices move in opposite directions.) By the end of the period, the yield had climbed, but it still remained low by historical standards.
Bondholders have enjoyed years of strong returns. But as Tim Buckley, our incoming chief investment officer, has noted, investors shouldn’t be surprised if future results are much more modest. As yields tumble, the scope for further declines—and price increases—diminishes.
The Federal Reserve announced on September 13 that it would continue to hold its target for short-term interest rates between 0% and 0.25% at least through mid-2015. The exceptionally low rates, in place since late 2008, kept a tight lid on returns from money market funds and savings accounts.
The fund’s technology holdings hindered relative performance
The PRIMECAP Core Fund seeks to invest in companies with underappreciated long-term growth prospects. Since the fund’s inception in 2004, this contrarian
| Expense Ratios | ||
| Your Fund Compared With Its Peer Group | ||
| Peer Group | ||
| Fund | Average | |
| PRIMECAP Core Fund | 0.51% | 1.18% |
The fund expense ratio shown is from the prospectus dated January 27, 2012, and represents estimated costs for the current fiscal year. For the fiscal year ended September 30, 2012, the fund’s expense ratio was 0.50%. The peer-group expense ratio is derived from data provided by Lipper Inc. and captures information through year-end 2011.
Peer group: Multi-Cap Core Funds.
4
approach has been effective more often than not. However, a by-product of the fund’s willingness to ignore the market consensus in its search for superior investments can be occasional stretches when this distinctive approach holds back returns. Such was the case over the 2012 fiscal year.
The fund paid a price for its holdings in technology, where it lacked exposure to some of the sector’s brightest stars. PRIMECAP Core’s technology stocks climbed about 15%. Those in the benchmark returned more than 30%.
The fund hasn’t had meaningful exposure to certain companies that have best capitalized on high demand for smartphones and tablets. Instead, its tech holdings include a number of formerly high-flying companies that have fallen (temporarily, in the advisor’s judgment) from consumers’ and investors’ favor. The fund’s investments in home entertainment software firms suffered as consumers’ tastes and spending have shifted somewhat from gaming to mobile technology.
Industrial stocks were also a disappoint-ment for PRIMECAP Core. The fund’s airline and logistic companies––which are susceptible to swings both large and small––struggled over the period. Higher fuel prices and weaker global trade have cut into some companies’ profitability.
| Total Returns | |
| Inception Through September 30, 2012 | |
| Average | |
| Annual Return | |
| PRIMECAP Core Fund (Returns since inception: 12/9/2004) | 6.57% |
| MSCI US Prime Market 750 Index | 5.09 |
| Multi-Cap Core Funds Average | 3.80 |
| Multi-Cap Core Funds Average: Derived from data provided by Lipper Inc. | |
The figures shown represent past performance, which is not a guarantee of future results. (Current performance may be lower or higher than the performance data cited. For performance data current to the most recent month-end, visit our website at vanguard.com/performance.) Note, too, that both investment returns and principal value can fluctuate widely, so an investor’s shares, when sold, could be worth more or less than their original cost.
5
Against these sore spots for the fund, health care stocks provided at least a partial salve. The fund’s allocation to health care was more than double that of its index counterpart and accounted for 8 percentage points of its return. Most of the strength came from the biotech-nology industry, where the fund’s stocks benefited from developing drug pipelines and their strong financial position.
For more on the advisor’s strategy and outlook, please see the Advisor’s Report following this letter.
In seeking strong long-term results, the fund takes the patient approach
PRIMECAP Management Company, the fund’s advisor, maintains an investment philosophy rooted in a conviction that deep fundamental research can uncover opportunities that will yield outsized rewards over the next three to five years.
Since PRIMECAP Core’s inception on December 9, 2004, the fund has recorded an average annual return of 6.57%, more than 1 percentage point ahead of its market benchmark, the MSCI US Prime 750 Index, and more than 2 percentage points ahead of the average return of peer funds. An initial investment of $10,000 in the PRIMECAP Core Fund would have grown to $16,431, about $1,700 more than it would have earned had it been compounded at the benchmark’s return.
Of course, eight years is a relatively brief period for evaluating the fund’s long-term investment strategy. But we are confident that PRIMECAP Management’s deep expertise and quality of research will continue to work in investors’ favor.
Vanguard’s customary low costs helped the advisor’s cause and allowed shareholders to keep more of the fund’s returns.
The lessons of the financial crisis remain relevant four years later
In September, the end of your fund’s fiscal year, we marked the fourth anniversary of Lehman Brothers’ collapse, the start of the 2008–2009 financial crisis. When the Lehman news broke, I was speaking to institutional clients at an event in Washington, D.C., all of three weeks into my new role as Vanguard’s CEO.
In the ensuing months, I was struck both by how fortunate I was to work with a great team of Vanguard “crew” and by the remarkable steadiness demonstrated by our clients. Many clients experienced significant losses, but signs of panic were few. On balance, they remained committed to their long-term investment programs and managed to benefit from the financial markets’ subsequent recovery.
As the crisis recedes further in time, it’s important not to lose sight of the lessons that it illuminated about investing and
6
sound financial practices generally. First among those lessons is that diversification does work. Diversification didn’t immunize investors from the market’s decline, but it certainly helped to insulate them from the worst of it.
Second, saving money and living within your means are critical. Investors are acting on this lesson as they pay off debt, which is a form of saving, and increase their savings rates from the dangerously low levels that prevailed before the crisis.
Third, having the courage to stick with a sound investment plan—as so many of our clients did—is important during volatile, uncertain times. Investors who resisted the urge to bail out of stocks at the depths of the crisis have largely been rewarded in the succeeding years.
I am very optimistic that, if investors embrace these lessons, they can give themselves a better chance of reaching their long-term goals. As always, thank you for investing with Vanguard.
Sincerely,

F. William McNabb III
Chairman and Chief Executive Officer
October 11, 2012
7
Advisor’s Report
For the fiscal year ended September 30, 2012, Vanguard PRIMECAP Core Fund returned 22.55%, trailing both the 29.98% return of its benchmark, the unmanaged MSCI US Prime Market 750 Index, and the 25.24% average return of multi-capitalization core fund competitors.
The investment environment
The stock market showed strong gains over the past 12 months despite a more challenging global economic outlook.
Growth in U.S. gross domestic product (GDP) for the second quarter of 2012 was just 1.3%, suggesting a slowdown in the midst of an already tepid recovery. Consumer spending trends have been mixed, with signs of acceleration followed by periods of sluggishness as households struggle in the face of high unemployment, little growth in personal income, and a difficult housing market.
Despite news that the unemployment rate dropped below 8% in September for the first time since January 2009, job growth remains weak. The official unemployment rate likely understates the difficult job environment, since it does not reflect workers who are no longer seeking employment or those who are underemployed. Outside the United States, economic and geopolitical developments were largely negative. The sovereign-debt crisis continued to weigh on European economies, China showed signs of slowing economic growth, and tensions flared in the Middle East.
Management of the fund
Despite the subpar results of the past fiscal year, our investment approach remains consistent. We rely on fundamental research to identify companies whose revenues and earnings will, in our opinion, grow more rapidly over a three-to-five-year time frame than current valuations might suggest. We seek to capitalize on situations in which the fundamental value of a company significantly exceeds its current market value.
This investment strategy has led us to build and maintain significant investments in information technology and health care companies that we believe offer the potential for higher returns than the overall market will produce. These two sectors make up more than 50% of the fund’s holdings (versus slightly more than 30% for the MSCI US Prime Market 750 Index). Eight of the ten largest holdings in the fund are health care or information technology stocks.
Technology
Poor stock selection in the information technology sector hurt the fund’s relative returns for the past 12 months. The IT stocks in the MSCI US Prime Market 750 Index returned 31.1% for the fiscal year. In comparison, the fund’s holdings in the sector returned only 15.0%. A major reason for this gap was the fund’s minimal position in Apple (+76%), which in August attained the highest market capitalization of any company in history. Notable detractors within the portfolio were
8
Research in Motion (–63%) and Electronic Arts (–38%). Several of the fund’s largest IT holdings, including Texas Instruments (+6%), SanDisk (+8%), and Flextronics (+7%), had lower returns than the MSCI US Prime Market 750 Index; however, our holdings in ASML Holding (+57%) and Google (+47%) partially offset them.
Despite the disappointing results over the past 12 months, we remain enthusiastic about the fund’s information technology holdings for several reasons. Many of these companies are trading at attractive valuations, with good growth prospects and large cash balances. The adoption of mobile computing devices, such as smartphones and tablet computers, and the continued expansion of the internet through social networking and e-commerce applications are helping to drive growth in demand for semiconductors, computer hardware, software, storage, and technology-driven services such as consulting and data analytics. Some of the largest holdings in the portfolio, including Google, Qualcomm, Texas Instruments, Oracle, and Microsoft, are well-positioned to capitalize on these trends.
Health care
The fund’s health care stocks contributed favorably to its results. Two of our largest holdings, Biogen Idec (+60%) and Amgen (+56%), were among the biggest gainers. Biogen Idec reported favorable results from studies of its new oral drug to treat multiple sclerosis, while Amgen’s stock price increased following the company’s announcement in November 2011 of a share repurchase program that included a $5 billion Dutch tender offer.
We continue to believe that large pharmaceutical, biotechnology, and medical device companies will experience growth in revenues and earnings from new products, an aging global population, and growing demand in emerging markets.
In the wake of considerable political and regulatory challenges as well as an unusually high number of patent expirations, we are encouraged by an increase in new drug approvals by the U.S. Food and Drug Administration in the past two years. For the longer term, we believe that the aging of populations in the United States, Europe, and Japan, along with rising standards of living in developing markets such as China and India, should lead to greater demand for health care products.
The health care industry spends tens of billions of dollars annually on research and development, which we believe will lead to the discovery of more effective treatments for many diseases, such as cancer, diabetes, and Alzheimer’s. For example, because of the rapid decline in the cost of sequencing human genomes, it is expected that millions of individuals globally will have their genome sequenced in the near future. Further, cancer cell genomes are being sequenced to gain an understanding of the specific mutations responsible for their proliferation.
9
The availability of this increasingly rich and broad set of genetic information is helping researchers better understand how patients with certain genetic traits develop diseases and respond to pathogens, chemicals, and drugs. That growing knowledge base is enabling the development of new, highly effective targeted drug therapies and associated diagnostic tests, bringing the possibility of personalized medicine closer to reality.
Other sectors
Poor stock selection in the industrial and consumer discretionary sectors hurt the fund’s relative returns; Expeditors International (–10%), Southwest Airlines (+9%), and C.H. Robinson (–13%) were among the biggest detractors in the industrials sector. AMR (–87%), which filed for bankruptcy last fall, was another detractor. In the consumer discretionary sector, Amazon.com (+18%), Sony (–38%), and Bed Bath & Beyond (+10%) all lagged the MSCI US Prime Market 750 Index. The fund’s minimal exposure to the financial sector, combined with poor stock selection within the sector, also hurt returns. On the other hand, the fund benefited from having below-benchmark exposure to consumer staples and utilities, the two sectors with the lowest returns in the MSCI US Prime Market 750 Index over the past 12 months.
Outlook
As we enter fiscal year 2013, we are more tempered in our optimism for U.S. equities than we were a year ago. Valuations generally seem attractive relative to historical standards, especially given the low interest rate environment. Although the S&P 500 Index, which is generally representative of the overall stock market, is considerably higher than it was a year ago, equities remain attractive compared with most other asset classes. As we write, the average dividend of the S&P 500 is almost 2%, which is still above the current yield on the 10-year U.S. Treasury bond.
In the sectors where the fund has the greatest weightings, we find current valuations compelling. We believe that investors may be underestimating the growth potential of many companies.
Although we expect the economic growth rate in the United States to be modest in the near future, we believe that, because of globalization and innovation, many U.S. companies can grow revenues and earnings at a faster rate than the GDP will grow. U.S. corporations generate an increasing portion of their revenues and earnings from abroad; last year, 46% of the revenues for S&P 500 companies came from outside the United States.
Prospects for international growth are particularly attractive for companies in the information technology, health care, and industrials sectors.
10
We also believe that innovation by U.S. companies, particularly those in the information technology and health care sectors, should result in revenue and earnings growth opportunities that are not reflected in current expectations. These two sectors represent areas where we believe the United States has a strong competitive advantage relative to the rest of the world. We expect that the substantial investment in research and development will lead to new products and services that improve productivity for businesses and quality of life for consumers.
Furthermore, the stock market may be undervaluing the cash on the balance sheets of many companies. As U.S. corporations have recovered from the recession, many have improved their balance sheets by paying down debt and growing their cash balances, which represent an underutilized asset in the current low interest rate environment. That asset could be a source of higher returns in the future. Companies with strong cash flows have seen considerable appreciation in their stock price as they returned cash to shareholders by raising dividends or by buying back shares.
In closing, we note that the fund’s returns have generally lagged those of the MSCI US Prime Market 750 index for the past two years. We are certainly disappointed with these results, but we accept that our low-turnover approach will not produce returns that exceed the index every year. Our disciplined strategy of continuing to add to high-conviction, out-of-favor positions as they decline ensures that if our view of the fundamentals ultimately proves correct, the fund will hold larger positions on the way up than it did on the way down. In our view, this approach is instrumental to delivering superior relative returns over the long run.
PRIMECAP Management Company
October 12, 2012
11
PRIMECAP Core Fund
Fund Profile
As of September 30, 2012
| Portfolio Characteristics | |||
| MSCI US | DJ | ||
| Prime | U.S. Total | ||
| Market | Market | ||
| Fund | 750 Index | Index | |
| Number of Stocks | 139 | 744 | 3,638 |
| Median Market Cap | $44.7B | $50.2B | $35.6B |
| Price/Earnings Ratio | 17.2x | 16.4x | 17.0x |
| Price/Book Ratio | 2.9x | 2.3x | 2.2x |
| Return on Equity | 22.0% | 18.8% | 18.0% |
| Earnings Growth Rate | 11.7% | 10.8% | 10.4% |
| Dividend Yield | 1.9% | 2.1% | 2.0% |
| Foreign Holdings | 14.5% | 0.0% | 0.0% |
| Turnover Rate | 10% | — | — |
| Ticker Symbol | VPCCX | — | — |
| Expense Ratio1 | 0.51% | — | — |
| 30-Day SEC Yield | 1.39% | — | — |
| Short-Term Reserves | 1.9% | — | — |
| Sector Diversification (% of equity exposure) | |||
| MSCI US | DJ | ||
| Prime | U.S. Total | ||
| Market | Market | ||
| Fund | 750 Index | Index | |
| Consumer Discretionary | 11.0% | 12.0% | 12.0% |
| Consumer Staples | 1.8 | 10.4 | 9.5 |
| Energy | 4.4 | 11.0 | 10.4 |
| Financials | 7.4 | 14.8 | 16.0 |
| Health Care | 30.3 | 11.7 | 11.9 |
| Industrials | 14.3 | 10.0 | 10.6 |
| Information Technology | 25.4 | 19.8 | 19.2 |
| Materials | 4.5 | 3.7 | 3.9 |
| Telecommunication | |||
| Services | 0.1 | 3.1 | 2.9 |
| Utilities | 0.8 | 3.5 | 3.6 |
| Volatility Measures | ||
| DJ | ||
| MSCI US | U.S. Total | |
| Prime Market | Market | |
| 750 Index | Index | |
| R-Squared | 0.98 | 0.98 |
| Beta | 1.00 | 0.98 |
These measures show the degree and timing of the fund’s fluctuations compared with the indexes over 36 months.
| Ten Largest Holdings (% of total net assets) | ||
| Amgen Inc. | Biotechnology | 6.5% |
| Roche Holding AG | Pharmaceuticals | 4.4 |
| Eli Lilly & Co. | Pharmaceuticals | 3.5 |
| Google Inc. Class A | Internet Software & | |
| Services | 3.4 | |
| Marsh & McLennan Cos. | ||
| Inc. | Insurance Brokers | 3.1 |
| Biogen Idec Inc. | Biotechnology | 3.0 |
| Novartis AG | Pharmaceuticals | 3.0 |
| Medtronic Inc. | Health Care | |
| Equipment | 2.6 | |
| Johnson & Johnson | Pharmaceuticals | 2.5 |
| Boeing Co. | Aerospace & | |
| Defense | 2.2 | |
| Top Ten | 34.2% | |
The holdings listed exclude any temporary cash investments and equity index products.
Investment Focus
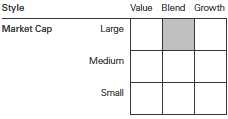
1 The expense ratio shown is from the prospectus dated January 27, 2012, and represents estimated costs for the current fiscal year. For the fiscal year ended September 30, 2012, the expense ratio was 0.50%.
12
PRIMECAP Core Fund
Performance Summary
All of the returns in this report represent past performance, which is not a guarantee of future results that may be achieved by the fund. (Current performance may be lower or higher than the performance data cited. For performance data current to the most recent month-end, visit our website at vanguard.com/performance.) Note, too, that both investment returns and principal value can fluctuate widely, so an investor’s shares, when sold, could be worth more or less than their original cost. The returns shown do not reflect taxes that a shareholder would pay on fund distributions or on the sale of fund shares.
Cumulative Performance: December 9, 2004, Through September 30, 2012
Initial Investment of $10,000
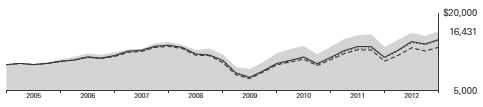
| Average Annual Total Returns | |||||
| Periods Ended September 30, 2012 | |||||
| Since | Final Value | ||||
| One | Five | Inception | of a $10,000 | ||
| Year | Years | (12/9/2004) | Investment | ||
| PRIMECAP Core Fund | 22.55% | 2.74% | 6.57% | $16,431 | |
| •••••••• | MSCI US Prime Market 750 Index | 29.98 | 1.34 | 5.09 | 14,732 |
| – – – – | Multi-Cap Core Funds Average | ||||
| 25.24 | -0.23 | 3.80 | 13,377 | ||
| Dow Jones U.S. Total Stock Market | 30.00 | 1.53 | 5.21 | 14,863 | |
| Multi-Cap Core Funds Average: Derived from data provided by Lipper Inc. | |||||
| "Since Inception" performance is calculated from the inception date for both the fund and its comparative standards. | |||||
See Financial Highlights for dividend and capital gains information.
13
PRIMECAP Core Fund
Fiscal-Year Total Returns (%): December 9, 2004, Through September 30, 2012
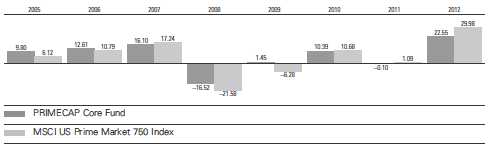
14
PRIMECAP Core Fund
Financial Statements
Statement of Net Assets
As of September 30, 2012
The fund reports a complete list of its holdings in regulatory filings four times in each fiscal year, at the quarter-ends. For the second and fourth fiscal quarters, the lists appear in the fund’s semiannual and annual reports to shareholders. For the first and third fiscal quarters, the fund files the lists with the Securities and Exchange Commission on Form N-Q. Shareholders can look up the fund’s Forms N-Q on the SEC’s website at sec.gov. Forms N-Q may also be reviewed and copied at the SEC’s Public Reference Room (see the back cover of this report for further information).
| Market | |||
| Value | |||
| Shares | ($000) | ||
| Common Stocks (98.6%) | |||
| Consumer Discretionary (10.8%) | |||
| TJX Cos. Inc. | 1,450,000 | 64,946 | |
| * | DIRECTV | 1,095,788 | 57,485 |
| Walt Disney Co. | 1,090,300 | 57,001 | |
| * | CarMax Inc. | 1,917,600 | 54,268 |
| Limited Brands Inc. | 1,071,200 | 52,767 | |
| * | Bed Bath & Beyond Inc. | 831,491 | 52,384 |
| Carnival Corp. | 1,014,400 | 36,965 | |
| Mattel Inc. | 1,000,000 | 35,480 | |
| Whirlpool Corp. | 330,000 | 27,360 | |
| * | Amazon.com Inc. | 79,700 | 20,269 |
| Sony Corp. ADR | 1,208,200 | 14,136 | |
| Lowe’s Cos. Inc. | 275,000 | 8,316 | |
| VF Corp. | 51,270 | 8,170 | |
| Macy’s Inc. | 162,300 | 6,106 | |
| Time Warner Cable Inc. | 53,500 | 5,086 | |
| Nordstrom Inc. | 60,000 | 3,311 | |
| Ross Stores Inc. | 40,350 | 2,607 | |
| Royal Caribbean | |||
| Cruises Ltd. | 77,000 | 2,326 | |
| Hasbro Inc. | 14,100 | 538 | |
| 509,521 | |||
| Consumer Staples (1.8%) | |||
| Kellogg Co. | 863,000 | 44,583 | |
| PepsiCo Inc. | 430,000 | 30,431 | |
| Costco Wholesale Corp. | 100,000 | 10,012 | |
| CVS Caremark Corp. | 21,000 | 1,017 | |
| 86,043 | |||
| Energy (4.3%) | |||
| Schlumberger Ltd. | 617,300 | 44,649 | |
| EOG Resources Inc. | 262,900 | 29,458 | |
| National Oilwell Varco Inc. | 250,000 | 20,028 | |
| Encana Corp. | 909,600 | 19,938 | |
| Noble Energy Inc. | 200,000 | 18,542 | |
| Petroleo Brasileiro SA ADR | |||
| Type A | 661,400 | 14,597 | |
| * | Cameron | ||
| International Corp. | 215,550 | 12,086 | |
| Market | |||
| Value | |||
| Shares | ($000) | ||
| Cenovus Energy Inc. | 303,624 | 10,581 | |
| Hess Corp. | 150,000 | 8,058 | |
| Cabot Oil & Gas Corp. | 152,900 | 6,865 | |
| * | McDermott | ||
| International Inc. | 500,000 | 6,110 | |
| * | Southwestern Energy Co. | 150,000 | 5,217 |
| Transocean Ltd. | 67,000 | 3,008 | |
| ExxonMobil Corp. | 24,000 | 2,195 | |
| Noble Corp. | 20,000 | 716 | |
| Petroleo Brasileiro SA ADR | 30,000 | 688 | |
| 202,736 | |||
| Financials (7.3%) | |||
| Marsh & | |||
| McLennan Cos. Inc. | 4,255,400 | 144,386 | |
| CharlesSchwab Corp. | 4,400,000 | 56,276 | |
| * | Berkshire Hathaway Inc. | ||
| Class B | 545,000 | 48,069 | |
| ChubbCorp. | 600,000 | 45,768 | |
| Willis Group Holdings plc | 567,900 | 20,967 | |
| Wells Fargo & Co. | 450,000 | 15,538 | |
| American Express Co. | 108,300 | 6,158 | |
| Progressive Corp. | 200,000 | 4,148 | |
| Comerica Inc. | 36,000 | 1,118 | |
| 342,428 | |||
| Health Care (29.9%) | |||
| Amgen Inc. | 3,601,900 | 303,712 | |
| Roche Holding AG | 1,106,400 | 206,948 | |
| EliLilly & Co. | 3,470,600 | 164,541 | |
| * | Biogen Idec Inc. | 951,097 | 141,932 |
| Novartis AG ADR | 2,286,350 | 140,062 | |
| Medtronic Inc. | 2,831,900 | 122,111 | |
| Johnson & Johnson | 1,699,850 | 117,137 | |
| GlaxoSmithKlineplc ADR | 1,457,000 | 67,372 | |
| Abbott Laboratories | 734,800 | 50,378 | |
| Sanofi ADR | 646,300 | 27,830 | |
| * | Waters Corp. | 325,094 | 27,090 |
| * | Boston Scientific Corp. | 3,632,200 | 20,849 |
| * | IlluminaInc. | 203,200 | 9,794 |
| Agilent Technologies Inc. | 70,000 | 2,691 | |
15
PRIMECAP Core Fund
| Market | |||
| Value | |||
| Shares | ($000) | ||
| Stryker Corp. | 45,500 | 2,533 | |
| * | Cerner Corp. | 5,000 | 387 |
| 1,405,367 | |||
| Industrials (14.1%) | |||
| Boeing Co. | 1,496,600 | 104,193 | |
| Honeywell | |||
| International Inc. | 1,390,100 | 83,058 | |
| Southwest Airlines Co. | 8,950,625 | 78,497 | |
| United Parcel Service Inc. | |||
| Class B | 975,900 | 69,845 | |
| FedEx Corp. | 597,475 | 50,558 | |
| Union Pacific Corp. | 307,750 | 36,530 | |
| ExpeditorsInternational of | |||
| Washington Inc. | 939,700 | 34,167 | |
| Rockwell Automation Inc. | 438,000 | 30,463 | |
| C.H. Robinson | |||
| Worldwide Inc. | 515,950 | 30,209 | |
| European Aeronautic | |||
| Defence and Space Co. | |||
| NV | 867,350 | 27,491 | |
| Norfolk Southern Corp. | 314,000 | 19,980 | |
| ^ | RitchieBros | ||
| Auctioneers Inc. | 898,300 | 17,274 | |
| Caterpillar Inc. | 196,050 | 16,868 | |
| * | Babcock & Wilcox Co. | 453,300 | 11,546 |
| * | AECOM Technology Corp. | 495,000 | 10,474 |
| Republic Services Inc. | |||
| Class A | 230,935 | 6,353 | |
| IDEX Corp. | 137,000 | 5,722 | |
| ^ | Canadian Pacific | ||
| Railway Ltd. | 63,030 | 5,225 | |
| CSX Corp. | 227,500 | 4,721 | |
| Cummins Inc. | 50,000 | 4,610 | |
| * | Delta Air Lines Inc. | 440,000 | 4,030 |
| * | United Continental | ||
| Holdings Inc. | 195,000 | 3,803 | |
| Safran SA | 100,000 | 3,597 | |
| SPX Corp. | 33,000 | 2,159 | |
| * | Jacobs Engineering | ||
| Group Inc. | 50,000 | 2,022 | |
| ChicagoBridge & | |||
| Iron Co. NV | 30,000 | 1,143 | |
| 664,538 | |||
| Information Technology (25.0%) | |||
| * | Google Inc. Class A | 214,100 | 161,538 |
| Texas Instruments Inc. | 3,776,700 | 104,048 | |
| Intuit Inc. | 1,612,500 | 94,944 | |
| QUALCOMM Inc. | 1,395,000 | 87,174 | |
| MicrosoftCorp. | 2,660,600 | 79,233 | |
| Oracle Corp. | 2,441,600 | 76,886 | |
| * | SanDisk Corp. | 1,326,016 | 57,589 |
| * | EMC Corp. | 2,040,100 | 55,633 |
| * | Flextronics | ||
| International Ltd. | 7,979,700 | 47,878 | |
| Market | |||
| Value | |||
| Shares | ($000) | ||
| VisaInc. Class A | 341,035 | 45,794 | |
| * | ElectronicArts Inc. | 3,475,800 | 44,108 |
| * | SymantecCorp. | 2,263,500 | 40,743 |
| ASML Holding NV | 654,800 | 35,150 | |
| AlteraCorp. | 950,000 | 32,286 | |
| Intel Corp. | 1,285,600 | 29,157 | |
| Telefonaktiebolaget LM | |||
| Ericsson ADR | 2,554,800 | 23,325 | |
| Applied Materials Inc. | 1,951,000 | 21,783 | |
| Accenture plc Class A | 309,200 | 21,653 | |
| KLA-TencorCorp. | 434,600 | 20,733 | |
| Corning Inc. | 1,296,700 | 17,052 | |
| * | Adobe Systems Inc. | 508,000 | 16,490 |
| Motorola Solutions Inc. | 252,000 | 12,739 | |
| * | Research In Motion Ltd. | 1,527,100 | 11,453 |
| Apple Inc. | 17,000 | 11,343 | |
| * | NVIDIA Corp. | 545,000 | 7,270 |
| Activision Blizzard Inc. | 575,000 | 6,486 | |
| CiscoSystems Inc. | 300,000 | 5,727 | |
| Mastercard Inc. Class A | 8,300 | 3,747 | |
| Hewlett-Packard Co. | 197,000 | 3,361 | |
| XilinxInc. | 37,300 | 1,246 | |
| Analog Devices Inc. | 30,000 | 1,176 | |
| 1,177,745 | |||
| Materials (4.5%) | |||
| Monsanto Co. | 772,350 | 70,299 | |
| Potash Corp. of | |||
| Saskatchewan Inc. | 1,275,900 | 55,400 | |
| Cabot Corp. | 740,000 | 27,062 | |
| Praxair Inc. | 214,700 | 22,303 | |
| Newmont Mining Corp. | 286,300 | 16,036 | |
| Greif Inc. Class A | 130,000 | 5,743 | |
| Dow Chemical Co. | 130,000 | 3,765 | |
| International Paper Co. | 100,000 | 3,632 | |
| * | Crown Holdings Inc. | 75,000 | 2,756 |
| ^ | Greif Inc. Class B | 36,500 | 1,805 |
| Kaiser Aluminum Corp. | 10,000 | 584 | |
| 209,385 | |||
| Telecommunication Services (0.1%) | |||
| * | Sprint Nextel Corp. | 731,300 | 4,037 |
| Utilities (0.8%) | |||
| Public Service Enterprise | |||
| Group Inc. | 616,493 | 19,839 | |
| ExelonCorp. | 199,500 | 7,098 | |
| NextEra Energy Inc. | 56,700 | 3,988 | |
| * | AES Corp. | 172,698 | 1,894 |
| Edison International | 35,800 | 1,636 | |
| FirstEnergyCorp. | 22,000 | 970 | |
| 35,425 | |||
| Total Common Stocks | |||
| (Cost $3,468,572) | 4,637,225 | ||
16
PRIMECAP Core Fund
| Market | ||
| Value | ||
| Shares | ($000) | |
| Temporary Cash Investment (2.1%) | ||
| Money Market Fund (2.1%) | ||
| 1,2 Vanguard Market | ||
| Liquidity Fund, 0.163% | ||
| (Cost $96,629) | 96,628,778 | 96,629 |
| Total Investments (100.7%) | ||
| (Cost $3,565,201) | 4,733,854 | |
| Other Assets and Liabilities (-0.7%) | ||
| Other Assets | 17,587 | |
| Liabilities2 | (49,043) | |
| (31,456) | ||
| Net Assets (100%) | ||
| Applicable to 313,906,748 outstanding | ||
| $.001 par value shares of beneficial | ||
| interest (unlimited authorization) | 4,702,398 | |
| Net Asset Value Per Share | $14.98 | |
| At September 30, 2012, net assets consisted of: | |
| Amount | |
| ($000) | |
| Paid-in Capital | 3,410,647 |
| Undistributed Net Investment Income | 41,625 |
| Accumulated Net Realized Gains | 81,380 |
| Unrealized Appreciation (Depreciation) | |
| Investment Securities | 1,168,653 |
| Foreign Currencies | 93 |
| Net Assets | 4,702,398 |
See Note A in Notes to Financial Statements.
* Non-income-producing security.
^ Part of security position is on loan to broker-dealers. The total value of securities on loan is $8,487,000.
1 Affiliated money market fund available only to Vanguard funds and certain trusts and accounts managed by Vanguard. Rate shown is the 7-day yield.
2 Includes $8,991,000 of collateral received for securities on loan.
ADR—American Depositary Receipt.
See accompanying Notes, which are an integral part of the Financial Statements.
17
PRIMECAP Core Fund
| Statement of Operations | |
| Year Ended | |
| September 30, 2012 | |
| ($000) | |
| Investment Income | |
| Income | |
| Dividends1 | 88,443 |
| Interest2 | 172 |
| Security Lending | 417 |
| Total Income | 89,032 |
| Expenses | |
| Investment Advisory Fees—Note B | 14,772 |
| The Vanguard Group—Note C | |
| Management and Administrative | 7,956 |
| Marketing and Distribution | 826 |
| Custodian Fees | 88 |
| Auditing Fees | 26 |
| Shareholders’ Reports | 51 |
| Trustees’ Fees and Expenses | 9 |
| Total Expenses | 23,728 |
| Net Investment Income | 65,304 |
| Realized Net Gain (Loss) | |
| Investment Securities Sold | 139,332 |
| Foreign Currencies | (72) |
| Realized Net Gain (Loss) | 139,260 |
| Change in Unrealized Appreciation (Depreciation) | |
| Investment Securities | 735,739 |
| Foreign Currencies | (112) |
| Change in Unrealized Appreciation (Depreciation) | 735,627 |
| Net Increase (Decrease) in Net Assets Resulting from Operations | 940,191 |
| 1 Dividends are net of foreign withholding taxes of $2,852,000. | |
| 2 Interest income from an affiliated company of the fund was $172,000. | |
See accompanying Notes, which are an integral part of the Financial Statements.
18
PRIMECAP Core Fund
| Statement of Changes in Net Assets | ||
| Year Ended September 30, | ||
| 2012 | 2011 | |
| ($000) | ($000) | |
| Increase (Decrease) in Net Assets | ||
| Operations | ||
| Net Investment Income | 65,304 | 50,863 |
| Realized Net Gain (Loss) | 139,260 | 98,546 |
| Change in Unrealized Appreciation (Depreciation) | 735,627 | (127,844) |
| Net Increase (Decrease) in Net Assets Resulting from Operations | 940,191 | 21,565 |
| Distributions | ||
| Net Investment Income | (55,432) | (51,418) |
| Realized Capital Gain | — | — |
| Total Distributions | (55,432) | (51,418) |
| Capital Share Transactions | ||
| Issued | 165,417 | 346,193 |
| Issued in Lieu of Cash Distributions | 49,692 | 46,358 |
| Redeemed1 | (742,140) | (587,212) |
| Net Increase (Decrease) from Capital Share Transactions | (527,031) | (194,661) |
| Total Increase (Decrease) | 357,728 | (224,514) |
| Net Assets | ||
| Beginning of Period | 4,344,670 | 4,569,184 |
| End of Period2 | 4,702,398 | 4,344,670 |
1 Net of redemption fees for fiscal 2012 and 2011 of $90,000 and $223,000, respectively. Effective May 23, 2012, the redemption fee was eliminated.
2 Net Assets—End of Period includes undistributed net investment income of $41,625,000 and $34,992,000.
See accompanying Notes, which are an integral part of the Financial Statements.
19
PRIMECAP Core Fund
Financial Highlights
| For a Share Outstanding | Year Ended September 30, | ||||
| Throughout Each Period | 2012 | 2011 | 2010 | 2009 | 2008 |
| Net Asset Value, Beginning of Period | $12.37 | $12.51 | $11.42 | $11.41 | $14.03 |
| Investment Operations | |||||
| Net Investment Income | .206 | .145 | .1331 | .097 | .1382 |
| Net Realized and Unrealized Gain (Loss) | |||||
| on Investments | 2.567 | (.143) | 1.051 | .030 | (2.417) |
| Total from Investment Operations | 2.773 | .002 | 1.184 | .127 | (2.279) |
| Distributions | |||||
| Dividends from Net Investment Income | (.163) | (.142) | (.094) | (.117) | (.110) |
| Distributions from Realized Capital Gains | — | — | — | — | (.231) |
| Total Distributions | (.163) | (.142) | (.094) | (.117) | (.341) |
| Net Asset Value, End of Period | $14.98 | $12.37 | $12.51 | $11.42 | $11.41 |
| Total Return3 | 22.55% | -0.10% | 10.39% | 1.45% | -16.52% |
| Ratios/Supplemental Data | |||||
| Net Assets, End of Period (Millions) | $4,702 | $4,345 | $4,569 | $4,245 | $3,253 |
| Ratio of Total Expenses to | |||||
| Average Net Assets | 0.50% | 0.51% | 0.51% | 0.54% | 0.50% |
| Ratio of Net Investment Income to | |||||
| Average Net Assets | 1.39% | 1.01% | 1.09%1 | 1.10% | 1.12%2 |
| Portfolio Turnover Rate | 10% | 9% | 8% | 5% | 9% |
1 Net investment income per share and the ratio of net investment income to average net assets include $.019 and 0.15%, respectively, resulting from a special dividend from Weyerhaeuser Co in July 2010.
2 Net investment income per share and the ratio of net investment income to average net assets include $.027 and 0.23%, respectively, resulting from a special dividend from ASML Holding NV in October 2007.
3 Total returns do not include transaction or account service fees that may have applied in the periods shown. Fund prospectuses provide information about any applicable transaction and account service fees.
See accompanying Notes, which are an integral part of the Financial Statements.
20
PRIMECAP Core Fund
Notes to Financial Statements
Vanguard PRIMECAP Core Fund is registered under the Investment Company Act of 1940 as an open-end investment company, or mutual fund.
A. The following significant accounting policies conform to generally accepted accounting principles for U.S. mutual funds. The fund consistently follows such policies in preparing its financial statements.
1. Security Valuation: Securities are valued as of the close of trading on the New York Stock Exchange (generally 4 p.m., Eastern time) on the valuation date. Equity securities are valued at the latest quoted sales prices or official closing prices taken from the primary market in which each security trades; such securities not traded on the valuation date are valued at the mean of the latest quoted bid and asked prices. Securities for which market quotations are not readily available, or whose values have been affected by events occurring before the fund’s pricing time but after the close of the securities’ primary markets, are valued at their fair values calculated according to procedures adopted by the board of trustees. These procedures include obtaining quotations from an independent pricing service, monitoring news to identify significant market- or security-specific events, and evaluating changes in the values of foreign market proxies (for example, ADRs, futures contracts, or exchange-traded funds), between the time the foreign markets close and the fund’s pricing time. When fair-value pricing is employed, the prices of securities used by a fund to calculate its net asset value may differ from quoted or published prices for the same securities. Investments in Vanguard Market Liquidity Fund are valued at that fund’s net asset value.
2. Foreign Currency: Securities and other assets and liabilities denominated in foreign currencies are translated into U.S. dollars using exchange rates obtained from an independent third party as of the fund’s pricing time on the valuation date. Realized gains (losses) and unrealized appreciation (depreciation) on investment securities include the effects of changes in exchange rates since the securities were purchased, combined with the effects of changes in security prices. Fluctuations in the value of other assets and liabilities resulting from changes in exchange rates are recorded as unrealized foreign currency gains (losses) until the assets or liabilities are settled in cash, at which time they are recorded as realized foreign currency gains (losses).
3. Federal Income Taxes: The fund intends to continue to qualify as a regulated investment company and distribute all of its taxable income. Management has analyzed the fund’s tax positions taken for all open federal income tax years (September 30, 2009–2012), and has concluded that no provision for federal income tax is required in the fund’s financial statements.
4. Distributions: Distributions to shareholders are recorded on the ex-dividend date.
5. Security Lending: The fund may lend its securities to qualified institutional borrowers to earn additional income. Security loans are required to be secured at all times by collateral at least equal to the market value of securities loaned. The fund invests cash collateral received in Vanguard Market Liquidity Fund, and records a liability for the return of the collateral, during the period the securities are on loan. Security lending income represents fees charged to borrowers plus income earned on investing cash collateral, less expenses associated with the loan.
6. Other: Dividend income is recorded on the ex-dividend date. Interest income includes income distributions received from Vanguard Market Liquidity Fund and is accrued daily. Security transactions are accounted for on the date securities are bought or sold. Costs used to determine realized gains (losses) on the sale of investment securities are those of the specific securities sold. Fees assessed on redemptions of capital shares prior to May 23, 2012, were credited to paid-in capital.
21
PRIMECAP Core Fund
B. PRIMECAP Management Company provides investment advisory services to the fund for a fee calculated at an annual percentage rate of average net assets. For the year ended September 30, 2012, the investment advisory fee represented an effective annual rate of 0.31% of the fund’s average net assets.
C. The Vanguard Group furnishes at cost corporate management, administrative, marketing, and distribution services. The costs of such services are allocated to the fund under methods approved by the board of trustees. The fund has committed to provide up to 0.40% of its net assets in capital contributions to Vanguard. At September 30, 2012, the fund had contributed capital of $670,000 to Vanguard (included in Other Assets), representing 0.01% of the fund’s net assets and 0.27% of Vanguard’s capitalization. The fund’s trustees and officers are also directors and officers of Vanguard.
D. Various inputs may be used to determine the value of the fund’s investments. These inputs are summarized in three broad levels for financial statement purposes. The inputs or methodologies used to value securities are not necessarily an indication of the risk associated with investing in those securities.
Level 1—Quoted prices in active markets for identical securities.
Level 2—Other significant observable inputs (including quoted prices for similar securities, interest rates, prepayment speeds, credit risk, etc.).
Level 3—Significant unobservable inputs (including the fund’s own assumptions used to determine the fair value of investments).
The following table summarizes the market value of the fund’s investments as of September 30, 2012, based on the inputs used to value them:
| Level 1 | Level 2 | Level 3 | |
| Investments | ($000) | ($000) | ($000) |
| Common Stocks | 4,399,189 | 238,036 | — |
| Temporary Cash Investments | 96,629 | — | — |
| Total | 4,495,818 | 238,036 | — |
E. Distributions are determined on a tax basis and may differ from net investment income and realized capital gains for financial reporting purposes. Differences may be permanent or temporary. Permanent differences are reclassified among capital accounts in the financial statements to reflect their tax character. Temporary differences arise when certain items of income, expense, gain, or loss are recognized in different periods for financial statement and tax purposes; these differences will reverse at some time in the future. Differences in classification may also result from the treatment of short-term gains as ordinary income for tax purposes.
The fund used a tax accounting practice to treat a portion of the price of capital shares redeemed during the year as distributions from net investment income and realized capital gains. Accordingly, the fund has reclassified $3,167,000 from undistributed net investment income, and $4,108,000 from accumulated net realized gains, to paid-in capital
During the year ended September 30, 2012, the fund realized net foreign currency losses of $72,000, which decreased distributable net income for tax purposes; accordingly, such losses have been reclassified from accumulated net realized gains to undistributed net investment income.
22
PRIMECAP Core Fund
The fund used capital loss carryforwards of $53,326,000 to offset taxable capital gains realized during the year ended September 30, 2012, reducing the amount of capital gains that would otherwise be available to distribute to shareholders. For tax purposes, at September 30, 2012, the fund had $48,460,000 of ordinary income and $81,378,000 of long-term capital gains available for distribution.
At September 30, 2012, the cost of investment securities for tax purposes was $3,565,201,000.
Net unrealized appreciation of investment securities for tax purposes was $1,168,653,000, consisting of unrealized gains of $1,354,336,000 on securities that had risen in value since their purchase and $185,683,000 in unrealized losses on securities that had fallen in value since their purchase.
F. During the year ended September 30, 2012, the fund purchased $461,581,000 of investment securities and sold $925,119,000 of investment securities, other than temporary cash investments.
G. Capital shares issued and redeemed were:
| Year Ended September 30, | ||
| 2012 | 2011 | |
| Shares | Shares | |
| (000) | (000) | |
| Issued | 11,732 | 24,985 |
| Issued in Lieu of Cash Distributions | 3,662 | 3,372 |
| Redeemed | (52,603) | (42,610) |
| Net Increase (Decrease) in Shares Outstanding | (37,209) | (14,253) |
H. In preparing the financial statements as of September 30, 2012, management considered the impact of subsequent events for potential recognition or disclosure in these financial statements.
23
Report of Independent Registered Public Accounting Firm
To the Trustees of Vanguard Fenway Funds and the Shareholders of the Vanguard PRIMECAP Core Fund:
In our opinion, the accompanying statement of net assets and the related statements of operations and of changes in net assets and the financial highlights present fairly, in all material respects, the financial position of the Vanguard PRIMECAP Core Fund (constituting a separate portfolio of Vanguard Fenway Funds, hereafter referred to as the “Fund”) at September 30, 2012, the results of its operations for the year then ended, the changes in its net assets for each of the two years in the period then ended and the financial highlights for each of the five years in the period then ended, in conformity with accounting principles generally accepted in the United States of America. These financial statements and financial highlights (hereafter referred to as “financial statements”) are the responsibility of the Fund’s management; our responsibility is to express an opinion on these financial statements based on our audits. We conducted our audits of these financial statements in accordance with the standards of the Public Company Accounting Oversight Board (United States). Those standards require that we plan and perform the audit to obtain reasonable assurance about whether the financial statements are free of material misstatement. An audit includes examining, on a test basis, evidence supporting the amounts and disclosures in the financial statements, assessing the accounting principles used and significant estimates made by management, and evaluating the overall financial statement presentation. We believe that our audits, which included confirmation of securities at September 30, 2012 by correspondence with the custodian and by agreement to the underlying ownership records of the transfer agent, provide a reasonable basis for our opinion.
PricewaterhouseCoopers LLP
Philadelphia, Pennsylvania
November 9, 2012
| Special 2012 tax information (unaudited) for Vanguard PRIMECAP Core Fund |
This information for the fiscal year ended September 30, 2012, is included pursuant to provisions of the Internal Revenue Code.
The fund distributed $55,432,000 of qualified dividend income to shareholders during the fiscal year.
For corporate shareholders, 100% of investment income (dividend income plus short-term gains, if any) qualifies for the dividends-received deduction.
24
Your Fund’s After-Tax Returns
This table presents returns for your fund both before and after taxes. The after-tax returns are shown in two ways: (1) assuming that an investor owned the fund during the entire period and paid taxes on the fund’s distributions, and (2) assuming that an investor paid taxes on the fund��s distributions and sold all shares at the end of each period.
Calculations are based on the highest individual federal income tax and capital gains tax rates in effect at the times of the distributions and the hypothetical sales. State and local taxes were not considered. After-tax returns reflect any qualified dividend income , using actual prior-year figures and estimates for 2012. (In the example, returns after the sale of fund shares may be higher than those assuming no sale. This occurs when the sale would have produced a capital loss. The calculation assumes that the investor received a tax deduction for the loss.)
Please note that your actual after-tax returns will depend on your tax situation and may differ from those shown. Also note that if you own the fund in a tax-deferred account, such as an individual retirement account or a 401(k) plan, this information does not apply to you. Such accounts are not subject to current taxes.
Finally, keep in mind that a fund’s performance—whether before or after taxes—does not guarantee future results.
| Average Annual Total Returns: PRIMECAP Core Fund | |||
| Periods Ended September 30, 2012 | |||
| Since | |||
| One | Five | Inception | |
| Year | Years | (12/9/2004) | |
| Returns Before Taxes | 22.55% | 2.74% | 6.57% |
| Returns After Taxes on Distributions | 22.34 | 2.51 | 6.36 |
| Returns After Taxes on Distributions and Sale of Fund Shares | 14.91 | 2.29 | 5.69 |
25
About Your Fund’s Expenses
As a shareholder of the fund, you incur ongoing costs, which include costs for portfolio management, administrative services, and shareholder reports (like this one), among others. Operating expenses, which are deducted from a fund’s gross income, directly reduce the investment return of the fund.
A typical fund’s expenses are expressed as a percentage of its average net assets. This figure is known as the expense ratio. The following examples are intended to help you understand the ongoing costs (in dollars) of investing in your fund and to compare these costs with those of other mutual funds. The examples are based on an investment of $1,000 made at the beginning of the period shown and held for the entire period.
The accompanying table illustrates your fund’s costs in two ways:
• Based on actual fund return. This section helps you to estimate the actual expenses that you paid over the period. The ”Ending Account Value“ shown is derived from the fund‘s actual return, and the third column shows the dollar amount that would have been paid by an investor who started with $1,000 in the fund. You may use the information here, together with the amount you invested, to estimate the expenses that you paid over the period.
To do so, simply divide your account value by $1,000 (for example, an $8,600 account value divided by $1,000 = 8.6), then multiply the result by the number given for your fund under the heading ”Expenses Paid During Period.“
• Based on hypothetical 5% yearly return. This section is intended to help you compare your fund‘s costs with those of other mutual funds. It assumes that the fund had a yearly return of 5% before expenses, but that the expense ratio is unchanged. In this case—because the return used is not the fund’s actual return—the results do not apply to your investment. The example is useful in making comparisons because the Securities and Exchange Commission requires all mutual funds to calculate expenses based on a 5% return. You can assess your fund’s costs by comparing this hypothetical example with the hypothetical examples that appear in shareholder reports of other funds.
Note that the expenses shown in the table are meant to highlight and help you compare ongoing costs only and do not reflect transaction costs incurred by the fund for buying and selling securities. Further, the expenses do not include any purchase, redemption, or account service fees described in the fund prospectus. If such fees were applied to your account, your costs would be higher. Your fund does not carry a “sales load.”
The calculations assume no shares were bought or sold during the period. Your actual costs may have been higher or lower, depending on the amount of your investment and the timing of any purchases or redemptions.
You can find more information about the fund’s expenses, including annual expense ratios, in the Financial Statements section of this report. For additional information on operating expenses and other shareholder costs, please refer to your fund’s current prospectus.
26
| Six Months Ended September 30, 2012 | |||
| Beginning | Ending | Expenses | |
| Account Value | Account Value | Paid During | |
| PRIMECAP Core Fund | 3/31/2012 | 9/30/2012 | Period |
| Based on Actual Fund Return | $1,000.00 | $1,016.28 | $2.53 |
| Based on Hypothetical 5% Yearly Return | 1,000.00 | 1,022.56 | 2.54 |
The calculations are based on expenses incurred in the most recent six-month period. The fund’s annualized six-month expense ratio for that period is 0.50%. The dollar amounts shown as “Expenses Paid” are equal to the annualized expense ratio multiplied by the average account value over the period, multiplied by the number of days in the most recent six-month period, then divided by the number of days in the most recent 12-month period.
27
Glossary
30-Day SEC Yield. A fund’s 30-day SEC yield is derived using a formula specified by the U.S. Securities and Exchange Commission. Under the formula, data related to the fund’s security holdings in the previous 30 days are used to calculate the fund’s hypothetical net income for that period, which is then annualized and divided by the fund’s estimated average net assets over the calculation period. For the purposes of this calculation, a security’s income is based on its current market yield to maturity (for bonds), its actual income (for asset-backed securities), or its projected dividend yield (for stocks). Because the SEC yield represents hypothetical annualized income, it will differ—at times significantly—from the fund’s actual experience. As a result, the fund’s income distributions may be higher or lower than implied by the SEC yield.
Beta. A measure of the magnitude of a fund’s past share-price fluctuations in relation to the ups and downs of a given market index. The index is assigned a beta of 1.00. Compared with a given index, a fund with a beta of 1.20 typically would have seen its share price rise or fall by 12% when the index rose or fell by 10%. For this report, beta is based on returns over the past 36 months for both the fund and the index. Note that a fund’s beta should be reviewed in conjunction with its R-squared (see definition). The lower the R-squared, the less correlation there is between the fund and the index, and the less reliable beta is as an indicator of volatility.
Dividend Yield. Dividend income earned by stocks, expressed as a percentage of the aggregate market value (or of net asset value, for a fund). The yield is determined by dividing the amount of the annual dividends by the aggregate value (or net asset value) at the end of the period. For a fund, the dividend yield is based solely on stock holdings and does not include any income produced by other investments.
Earnings Growth Rate. The average annual rate of growth in earnings over the past five years for the stocks now in a fund.
Equity Exposure. A measure that reflects a fund’s investments in stocks and stock futures. Any holdings in short-term reserves are excluded.
Expense Ratio. A fund’s total annual operating expenses expressed as a percentage of the fund’s average net assets. The expense ratio includes management and administrative expenses, but does not include the transaction costs of buying and selling portfolio securities.
Foreign Holdings. The percentage of a fund represented by securities or depositary receipts of companies based outside the United States.
Inception Date. The date on which the assets of a fund (or one of its share classes) are first invested in accordance with the fund’s investment objective. For funds with a subscription period, the inception date is the day after that period ends. Investment performance is measured from the inception date.
Median Market Cap. An indicator of the size of companies in which a fund invests; the midpoint of market capitalization (market price x shares outstanding) of a fund’s stocks, weighted by the proportion of the fund’s assets invested in each stock. Stocks representing half of the fund’s assets have market capitalizations above the median, and the rest are below it.
Price/Book Ratio. The share price of a stock divided by its net worth, or book value, per share. For a fund, the weighted average price/book ratio of the stocks it holds.
28
Price/Earnings Ratio. The ratio of a stock’s current price to its per-share earnings over the past year. For a fund, the weighted average P/E of the stocks it holds. P/E is an indicator of market expectations about corporate prospects; the higher the P/E, the greater the expectations for a company’s future growth.
R-Squared. A measure of how much of a fund’s past returns can be explained by the returns from the market in general, as measured by a given index. If a fund’s total returns were precisely synchronized with an index’s returns, its R-squared would be 1.00. If the fund’s returns bore no relationship to the index’s returns, its R-squared would be 0. For this report, R-squared is based on returns over the past 36 months for both the fund and the index.
Return on Equity. The annual average rate of return generated by a company during the past five years for each dollar of shareholder’s equity (net income divided by shareholder’s equity). For a fund, the weighted average return on equity for the companies whose stocks it holds.
Short-Term Reserves. The percentage of a fund invested in highly liquid, short-term securities that can be readily converted to cash.
Turnover Rate. An indication of the fund’s trading activity. Funds with high turnover rates incur higher transaction costs and may be more likely to distribute capital gains (which may be taxable to investors). The turnover rate excludes in-kind transactions, which have minimal impact on costs.
29
This page intentionally left blank.
This page intentionally left blank.
The People Who Govern Your Fund
The trustees of your mutual fund are there to see that the fund is operated and managed in your best interests since, as a shareholder, you are a part owner of the fund. Your fund’s trustees also serve on the board of directors of The Vanguard Group, Inc., which is owned by the Vanguard funds and provides services to them on an at-cost basis.
A majority of Vanguard’s board members are independent, meaning that they have no affiliation with Vanguard or the funds they oversee, apart from the sizable personal investments they have made as private individuals. The independent board members have distinguished backgrounds in business, academia, and public service. Each of the trustees and executive officers oversees 179 Vanguard funds.
The following table provides information for each trustee and executive officer of the fund. More information about the trustees is in the Statement of Additional Information, which can be obtained, without charge, by contacting Vanguard at 800-662-7447, or online at vanguard.com.
| InterestedTrustee1 | and Delphi Automotive LLP (automotive components); |
| Senior Advisor at New Mountain Capital; Trustee of | |
| F. William McNabb III | The Conference Board. |
| Born 1957. Trustee Since July 2009. Chairman of the | |
| Board. Principal Occupation(s) During the Past Five | Amy Gutmann |
| Years: Chairman of the Board of The Vanguard Group, | Born 1949. Trustee Since June 2006. Principal |
| Inc., and of each of the investment companies served | Occupation(s) During the Past Five Years: President |
| by The Vanguard Group, since January 2010; Director | of the University of Pennsylvania; Christopher H. |
| of The Vanguard Group since 2008; Chief Executive | Browne Distinguished Professor of Political Science |
| Officer and President of The Vanguard Group and of | in the School of Arts and Sciences with secondary |
| each of the investment companies served by The | appointments at the Annenberg School for |
| Vanguard Group since 2008; Director of Vanguard | Communication and the Graduate School of Education |
| Marketing Corporation; Managing Director of The | of the University of Pennsylvania; Member of the |
| Vanguard Group (1995–2008). | National Commission on the Humanities and Social |
| Sciences; Trustee of Carnegie Corporation of New | |
| IndependentTrustees | York and of the National Constitution Center; Chair |
| of the U.S. Presidential Commission for the Study | |
| Emerson U. Fullwood | of Bioethical Issues. |
| Born 1948. Trustee Since January 2008. Principal | JoAnn Heffernan Heisen |
| Occupation(s) During the Past Five Years: Executive | Born 1950. Trustee Since July 1998. Principal |
| Chief Staff and Marketing Officer for North America | Occupation(s) During the Past Five Years: Corporate |
| and Corporate Vice President (retired 2008) of Xerox | Vice President and Chief Global Diversity Officer |
| Corporation (document management products and | (retired 2008) and Member of the Executive |
| services); Executive in Residence and 2010 | Committee (1997–2008) of Johnson & Johnson |
| Distinguished Minett Professor at the Rochester | (pharmaceuticals/medical devices/consumer |
| Institute of Technology; Director of SPX Corporation | products); Director of Skytop Lodge Corporation |
| (multi-industry manufacturing), the United Way of | (hotels), the University Medical Center at Princeton, |
| Rochester, Amerigroup Corporation (managed health | the Robert Wood Johnson Foundation, and the Center |
| care), the University of Rochester Medical Center, | for Talent Innovation; Member of the Advisory Board |
| Monroe Community College Foundation, and North | of the Maxwell School of Citizenship and Public Affairs |
| Carolina A&T University. | at Syracuse University. |
| Rajiv L. Gupta | F. Joseph Loughrey |
| Born 1945. Trustee Since December 2001.2 | Born 1949. Trustee Since October 2009. Principal |
| Principal Occupation(s) During the Past Five Years: | Occupation(s) During the Past Five Years: President |
| Chairman and Chief Executive Officer (retired 2009) | and Chief Operating Officer (retired 2009) of Cummins |
| and President (2006–2008) of Rohm and Haas Co. | Inc. (industrial machinery); Director of SKF AB |
| (chemicals); Director of Tyco International, Ltd. | (industrial machinery), Hillenbrand, Inc. (specialized |
| (diversified manufacturing and services), Hewlett- | consumer services), the Lumina Foundation for |
| Packard Co. (electronic computer manufacturing), |
| Education, and Oxfam America; Chairman of the | Executive Officers | |
| Advisory Council for the College of Arts and Letters | ||
| and Member of the Advisory Board to the Kellogg | Glenn Booraem | |
| Institute for International Studies at the University | Born 1967. Controller Since July 2010. Principal | |
| of Notre Dame. | Occupation(s) During the Past Five Years: Principal | |
| of The Vanguard Group, Inc.; Controller of each of | ||
| Mark Loughridge | the investment companies served by The Vanguard | |
| Born 1953. Trustee Since March 2012. Principal | Group; Assistant Controller of each of the investment | |
| Occupation(s) During the Past Five Years: Senior Vice | companies served by The Vanguard Group (2001–2010). | |
| President and Chief Financial Officer at IBM (information | ||
| technology services); Fiduciary Member of IBM’s | Thomas J. Higgins | |
| Retirement Plan Committee. | Born 1957. Chief Financial Officer Since September | |
| 2008. Principal Occupation(s) During the Past Five | ||
| Scott C. Malpass | Years: Principal of The Vanguard Group, Inc.; Chief | |
| Born 1962. Trustee Since March 2012. Principal | Financial Officer of each of the investment companies | |
| Occupation(s) During the Past Five Years: Chief | served by The Vanguard Group; Treasurer of each of | |
| Investment Officer and Vice President at the University | the investment companies served by The Vanguard | |
| of Notre Dame; Assistant Professor of Finance at the | Group (1998–2008). | |
| Mendoza College of Business at Notre Dame; Member | ||
| of the Notre Dame 403(b) Investment Committee; | Kathryn J. Hyatt | |
| Director of TIFF Advisory Services, Inc. (investment | Born 1955. Treasurer Since November 2008. Principal | |
| advisor); Member of the Investment Advisory | Occupation(s) During the Past Five Years: Principal of | |
| Committees of the Financial Industry Regulatory | The Vanguard Group, Inc.; Treasurer of each of the | |
| Authority (FINRA) and of Major League Baseball. | investment companies served by The Vanguard | |
| Group; Assistant Treasurer of each of the investment | ||
| André F. Perold | companies served by The Vanguard Group (1988–2008). | |
| Born 1952. Trustee Since December 2004. Principal | ||
| Occupation(s) During the Past Five Years: George | Heidi Stam | |
| Gund Professor of Finance and Banking at the Harvard | Born 1956. Secretary Since July 2005. Principal | |
| Business School (retired 2011); Chief Investment | Occupation(s) During the Past Five Years: Managing | |
| Officer and Managing Partner of HighVista Strategies | Director of The Vanguard Group, Inc.; General Counsel | |
| LLC (private investment firm); Director of Rand | of The Vanguard Group; Secretary of The Vanguard | |
| Merchant Bank; Overseer of the Museum of Fine | Group and of each of the investment companies | |
| Arts Boston. | served by The Vanguard Group; Director and Senior | |
| Vice President of Vanguard Marketing Corporation. | ||
| Alfred M. Rankin, Jr. | ||
| Born 1941. Trustee Since January 1993. Principal | Vanguard Senior ManagementTeam | |
| Occupation(s) During the Past Five Years: Chairman, | ||
| President, and Chief Executive Officer of NACCO | Mortimer J. Buckley | Michael S. Miller |
| Industries, Inc. (forklift trucks/housewares/lignite); | Kathleen C. Gubanich | James M. Norris |
| Director of Goodrich Corporation (industrial products/ | Paul A. Heller | Glenn W. Reed |
| aircraft systems and services) and the National | Martha G. King | George U. Sauter |
| Association of Manufacturers; Chairman of the Board | Chris D. McIsaac | |
| of the Federal Reserve Bank of Cleveland and of | ||
| University Hospitals of Cleveland; Advisory Chairman | Chairman Emeritus and Senior Advisor | |
| of the Board of The Cleveland Museum of Art. | ||
| John J. Brennan | ||
| Peter F. Volanakis | Chairman, 1996–2009 | |
| Born 1955. Trustee Since July 2009. Principal | Chief Executive Officer and President, 1996–2008 | |
| Occupation(s) During the Past Five Years: President | ||
| and Chief Operating Officer (retired 2010) of Corning | ||
| Incorporated (communications equipment); Director | Founder | |
| of SPX Corporation (multi-industry manufacturing); | John C. Bogle | |
| Overseer of the Amos Tuck School of Business | Chairman and Chief Executive Officer, 1974–1996 | |
| Administration at Dartmouth College; Advisor to the | ||
| Norris Cotton Cancer Center. | ||
1 Mr. McNabb is considered an “interested person,” as defined in the Investment Company Act of 1940, because he is an officer of the Vanguard funds.
2 December 2002 for Vanguard Equity Income Fund, Vanguard Growth Equity Fund, the Vanguard Municipal Bond Funds, and the Vanguard State Tax-Exempt Funds.
 | |
| P.O. Box 2600 | |
| Valley Forge, PA 19482-2600 |
Connect with Vanguard® > vanguard.com
| Fund Information > 800-662-7447 | |
| Direct Investor Account Services > 800-662-2739 | |
| Institutional Investor Services > 800-523-1036 | |
| Text Telephone for People | |
| With Hearing Impairment > 800-749-7273 | |
| This material may be used in conjunction | |
| with the offering of shares of any Vanguard | |
| fund only if preceded or accompanied by | |
| the fund’s current prospectus. | |
| All comparative mutual fund data are from Lipper Inc. or | |
| Morningstar, Inc., unless otherwise noted. | |
| You can obtain a free copy of Vanguard’s proxy voting | |
| guidelines by visiting vanguard.com/proxyreporting or by | |
| calling Vanguard at 800-662-2739. The guidelines are | |
| also available from the SEC’s website, sec.gov. In | |
| addition, you may obtain a free report on how your fund | |
| voted the proxies for securities it owned during the 12 | |
| months ended June 30. To get the report, visit either | |
| vanguard.com/proxyreporting or sec.gov. | |
| You can review and copy information about your fund at | |
| the SEC’s Public Reference Room in Washington, D.C. To | |
| find out more about this public service, call the SEC at | |
| 202-551-8090. Information about your fund is also | |
| available on the SEC’s website, and you can receive | |
| copies of this information, for a fee, by sending a | |
| request in either of two ways: via e-mail addressed to | |
| publicinfo@sec.gov or via regular mail addressed to the | |
| Public Reference Section, Securities and Exchange | |
| Commission, Washington, DC 20549-1520. | |
| © 2012 The Vanguard Group, Inc. | |
| All rights reserved. | |
| Vanguard Marketing Corporation, Distributor. | |
| Q12200 112012 | |
Item 2: Code of Ethics. The Registrant has adopted a code of ethics that applies to the Registrant’s principal executive officer, principal financial officer, principal accounting officer or controller or persons performing similar functions. The Code of Ethics was amended during the reporting period covered by this report to make certain technical, non-material changes.
Item 3: Audit Committee Financial Expert. The following members of the Audit Committee have been determined by the Registrant’s Board of Trustees to be Audit Committee Financial Experts serving on its Audit Committee, and to be independent: Rajiv L. Gupta, Amy Gutmann, JoAnn Heffernan Heisen, F. Joseph Loughrey, Mark Loughridge, Scott C. Malpass, André F. Perold, and Alfred M. Rankin, Jr.
Item 4: Principal Accountant Fees and Services.
(a) Audit Fees.
Audit Fees of the Registrant
Fiscal Year Ended September 30, 2012: $82,000
Fiscal Year Ended September 30, 2011: $80,000
Aggregate Audit Fees of Registered Investment Companies in the Vanguard Group.
Fiscal Year Ended September 30, 2012: $4,809,780
Fiscal Year Ended September 30, 2011: $3,978,540
(b) Audit-Related Fees.
Fiscal Year Ended September 30, 2012: $1,812,565
Fiscal Year Ended September 30, 2011: $1,341,750
Includes fees billed in connection with assurance and related services provided to the Registrant, The Vanguard Group, Inc., Vanguard Marketing Corporation, and other registered investment companies in the Vanguard Group.
(c) Tax Fees.
Fiscal Year Ended September 30, 2012: $490,518
Fiscal Year Ended September 30, 2011: $373,830
Includes fees billed in connection with tax compliance, planning and advice services provided to the Registrant, The Vanguard Group, Inc., Vanguard Marketing Corporation, and other registered investment companies in the Vanguard Group and related to income and excise taxes.
(d) All Other Fees.
Fiscal Year Ended September 30, 2012: $16,000
Fiscal Year Ended September 30, 2011: $16,000
Includes fees billed for services related to risk management and privacy matters. Services were provided to the Registrant, The Vanguard Group, Inc., Vanguard Marketing Corporation, and other registered investment companies in the Vanguard Group.
(e) (1) Pre-Approval Policies. The policy of the Registrant’s Audit Committee is to consider and, if appropriate, approve before the principal accountant is engaged for such services, all specific audit and non-audit services provided to: (1) the Registrant; (2) The Vanguard Group, Inc.; (3) other entities controlled by The Vanguard Group, Inc. that provide ongoing services to the Registrant; and (4) other registered investment companies in the Vanguard Group. In making a determination, the Audit Committee considers whether the services are consistent with maintaining the principal accountant’s independence.
In the event of a contingency situation in which the principal accountant is needed to provide services in between scheduled Audit Committee meetings, the Chairman of the Audit Committee would be called on to consider and, if appropriate, pre-approve audit or permitted non-audit services in an amount sufficient to complete services through the next Audit Committee meeting, and to determine if such services would be consistent with maintaining the accountant’s independence. At the next scheduled Audit Committee meeting, services and fees would be presented to the Audit Committee for formal consideration, and, if appropriate, approval by the entire Audit Committee. The Audit Committee would again consider whether such services and fees are consistent with maintaining the principal accountant’s independence.
The Registrant’s Audit Committee is informed at least annually of all audit and non-audit services provided by the principal accountant to the Vanguard complex, whether such services are provided to: (1) the Registrant; (2) The Vanguard Group, Inc.; (3) other entities controlled by The Vanguard Group, Inc. that provide ongoing services to the Registrant; or (4) other registered investment companies in the Vanguard Group.
(2) No percentage of the principal accountant’s fees or services were approved pursuant to the waiver provision of paragraph (c)(7)(i)(C) of Rule 2-01 of Regulation S-X.
(f) For the most recent fiscal year, over 50% of the hours worked under the principal accountant’s engagement were not performed by persons other than full-time, permanent employees of the principal accountant.
(g) Aggregate Non-Audit Fees.
Fiscal Year Ended September 30, 2012: $506,518
Fiscal Year Ended September 30, 2011: $389,830
Includes fees billed for non-audit services provided to the Registrant, The Vanguard Group, Inc., Vanguard Marketing Corporation, and other registered investment companies in the Vanguard Group.
(h) For the most recent fiscal year, the Audit Committee has determined that the provision of all non-audit services was consistent with maintaining the principal accountant’s independence.
Item 5: Audit Committee of Listed Registrants.
Not Applicable.
Item 6: Investments.
Not Applicable.
Item 7: Disclosure of Proxy Voting Policies and Procedures for Closed-End Management Investment Companies.
Not Applicable.
Item 8: Portfolio Managers of Closed-End Management Investment Companies.
Not Applicable.
Item 9: Purchase of Equity Securities by Closed-End Management Investment Company and Affiliated
Purchasers.
Not Applicable.
Item 10: Submission of Matters to a Vote of Security Holders.
Not Applicable.
Item 11: Controls and Procedures.
(a) Disclosure Controls and Procedures. The Principal Executive and Financial Officers concluded that the Registrant's Disclosure Controls and Procedures are effective based on their evaluation of the Disclosure Controls and Procedures as of a date within 90 days of the filing date of this report.
(b) Internal Control Over Financial Reporting. There were no significant changes in Registrant’s Internal Control Over Financial Reporting or in other factors that could significantly affect this control subsequent to the date of the evaluation, including any corrective actions with regard to significant deficiencies and material weaknesses.
Item 12: Exhibits.
(a) Code of Ethics.
(b) Certifications.
Pursuant to the requirements of the Securities Exchange Act of 1934 and the Investment Company Act of 1940, the registrant has duly caused this report to be signed on its behalf by the undersigned, thereunto duly authorized.
| VANGUARD FENWAY FUNDS | |
| By: | /s/ F. WILLIAM MCNABB III* |
| F. WILLIAM MCNABB III | |
| CHIEF EXECUTIVE OFFICER | |
| Date: November 16, 2012 | |
Pursuant to the requirements of the Securities Exchange Act of 1934 and the Investment Company Act of 1940, this report has been signed below by the following persons on behalf of the registrant and in the capacities and on the dates indicated.
| VANGUARD FENWAY FUNDS | |
| By: | /s/ F. WILLIAM MCNABB III* |
| F. WILLIAM MCNABB III | |
| CHIEF EXECUTIVE OFFICER | |
| Date: November 16, 2012 | |
| VANGUARD FENWAY FUNDS | |
| By: | /s/ THOMAS J. HIGGINS* |
| THOMAS J. HIGGINS | |
| CHIEF FINANCIAL OFFICER | |
| Date: November 16, 2012 | |
* By: /s/ Heidi Stam
Heidi Stam, pursuant to a Power of Attorney filed on March 27, 2012 see file Number 2-11444, Incorporated by Reference.