UNITED STATES
SECURITIES AND EXCHANGE COMMISSION
Washington, D.C. 20549
FORM N-CSR
CERTIFIED SHAREHOLDER REPORT
OF
REGISTERED MANAGEMENT INVESTMENT COMPANIES
Investment Company Act file number: 811-05445
Name of Registrant: Vanguard Fenway Funds
Address of Registrant:
P.O. Box 2600
Valley Forge, PA 19482
Name and address of agent for service:
Heidi Stam, Esquire
P.O. Box 876
Valley Forge, PA 19482
Registrant’s telephone number, including area code: (610) 669-1000
Date of fiscal year end: September 30
Date of reporting period: October 1, 2014 – September 30, 2015
Item 1: Reports to Shareholders
Annual Report | September 30, 2015
Vanguard Equity Income Fund
Vanguard’s Principles for Investing Success
We want to give you the best chance of investment success. These principles, grounded in Vanguard’s research and experience, can put you on the right path.
Goals. Create clear, appropriate investment goals.
Balance. Develop a suitable asset allocation using broadly diversified funds.
Cost. Minimize cost.
Discipline. Maintain perspective and long-term discipline.
A single theme unites these principles: Focus on the things you can control.
We believe there is no wiser course for any investor.
| Contents | |
| Your Fund’s Total Returns. | 1 |
| Chairman’s Letter. | 2 |
| Advisors’ Report. | 8 |
| Fund Profile. | 12 |
| Performance Summary. | 13 |
| Financial Statements. | 15 |
| Your Fund’s After-Tax Returns. | 29 |
| About Your Fund’s Expenses. | 30 |
| Glossary. | 32 |
Please note: The opinions expressed in this report are just that—informed opinions. They should not be considered promises or advice.
Also, please keep in mind that the information and opinions cover the period through the date on the front of this report. Of course, the risks of investing in your fund are spelled out in the prospectus.
See the Glossary for definitions of investment terms used in this report.
About the cover: Pictured is a sailing block on the Brilliant, a 1932 schooner docked in Mystic, Connecticut. A type of pulley, the sailing block helps coordinate the setting of the sails. At Vanguard, the intricate coordination of technology and people allows us to help millions of clients around the world reach their financial goals.
| Your Fund’s Total Returns | ||||
| Fiscal Year Ended September 30, 2015 | ||||
| Total | ||||
| Returns | ||||
| Vanguard Equity Income Fund | ||||
| Investor Shares | -2.11% | |||
| Admiral™ Shares | -2.03 | |||
| FTSE High Dividend Yield Index | -2.53 | |||
| Equity Income Funds Average | -4.80 | |||
| Equity Income Funds Average: Derived from data provided by Lipper, a Thomson Reuters Company. | ||||
| Admiral Shares carry lower expenses and are available to investors who meet certain account-balance requirements. | ||||
| Your Fund’s Performance at a Glance | ||||
| September 30, 2014, Through September 30, 2015 | ||||
| Distributions Per Share | ||||
| Starting | Ending | |||
| Share | Share | Income | Capital | |
| Price | Price | Dividends | Gains | |
| Vanguard Equity Income Fund | ||||
| Investor Shares | $31.23 | $28.78 | $0.852 | $1.014 |
| Admiral Shares | 65.45 | 60.31 | 1.846 | 2.125 |
1

Chairman’s Letter
Dear Shareholder,
After a lukewarm start to the fiscal year ended September 30, 2015, the broad U.S. stock market struggled. For the 12 months, Vanguard Equity Income Fund returned about –2%. This marked the first fiscal year decline since 2009 for the fund, its benchmark index, and the broad market.
In a year of muted gains and negative returns, the types of companies your fund’s advisors invest in—ones that tend to be larger and more oriented toward value than growth—generally weren’t favored. For several years, investors pursued income-oriented stocks in a quest for yield. But that changed amid signals that the Federal Reserve might begin raising interest rates, which would dim the luster of dividend-paying stocks.
The fund’s benchmark, the FTSE High Dividend Yield Index, fell behind the broad market, a reversal from the prior fiscal year. Still, your fund’s result, although negative, was higher than that of its comparative standards, helped in part by the consumer-oriented holdings of the fund’s advisors, Wellington Management Company and Vanguard’s Quantitative Equity Group.
As of September 30, the fund’s 30-day SEC yield for Investor Shares stood at 3.12%, about half a percentage point higher than it was a year ago. As with bonds, when stock prices fall, their dividend yields rise. Your fund’s yield
2
remained about 1 percentage point higher than that of the broad U.S. stock market, as measured by the yield of Vanguard Total Stock Market Index Fund. (All returns and yields discussed in this letter are for Investor Shares unless otherwise noted.)
China’s economic woes weighed on stocks globally
The broad U.S. stock market returned –0.49% for the 12 months. The final two months were especially rocky as investors worried in particular about the global ripple effects of slower economic growth in China.
For much of the fiscal year, investors were preoccupied with the possibility of an increase in short-term interest rates. On September 17, the Federal Reserve announced that it would hold rates steady for the time being, a decision that to some investors indicated the Fed’s hesitancy over the fragility of global markets.
International stocks returned about –11%, held back in part by the dollar’s strength against many foreign currencies. Returns for emerging markets, which were especially hard hit by the concerns about China, trailed those of the developed markets of the Pacific region and Europe.
Taxable bonds recorded gains as investors searched for safety
The broad U.S. taxable bond market returned 2.94%, as investors gravitated toward safe-haven assets amid the global stock market turmoil. Stimulative monetary
| Market Barometer | |||
| Average Annual Total Returns | |||
| Periods Ended September 30, 2015 | |||
| One | Three | Five | |
| Year | Years | Years | |
| Stocks | |||
| Russell 1000 Index (Large-caps) | -0.61% | 12.66% | 13.42% |
| Russell 2000 Index (Small-caps) | 1.25 | 11.02 | 11.73 |
| Russell 3000 Index (Broad U.S. market) | -0.49 | 12.53 | 13.28 |
| FTSE All-World ex US Index (International) | -11.34 | 2.87 | 2.19 |
| Bonds | |||
| Barclays U.S. Aggregate Bond Index (Broad taxable market) | 2.94% | 1.71% | 3.10% |
| Barclays Municipal Bond Index (Broad tax-exempt market) | 3.16 | 2.88 | 4.14 |
| Citigroup Three-Month U.S. Treasury Bill Index | 0.02 | 0.02 | 0.04 |
| CPI | |||
| Consumer Price Index | -0.04% | 0.93% | 1.73% |
3
policies from many of the world’s central banks, declining inflation expectations, and global investors’ search for higher yields also helped lift U.S. bonds.
The yield of the 10-year Treasury note ended September at 2.05%, down from 2.48% a year earlier. (Bond prices and yields move in opposite directions.)
The Fed’s 0%–0.25% target for short-term interest rates continued to limit returns for money market funds and savings accounts.
International bond markets (as measured by the Barclays Global Aggregate Index ex USD) returned –7.67%, hurt by the dollar’s strength against many foreign currencies. Without this currency effect, international bonds advanced modestly.
The ten sectors were evenly split, as five gained and five declined
After notable ups and downs, five sectors ended the fiscal year higher and five ended it lower, in both the fund and its benchmark. However, the fund and index returns for many of the sectors diverged, in some cases markedly.
The consumer discretionary, consumer staples, financial, information technology, and utilities sectors all finished in positive territory. The relatively small consumer discretionary sector was the fund’s standout, with a strong double-digit gain that was well ahead of the benchmark’s return; the sector contributed significantly to the fund’s outperformance.
| Expense Ratios | |||
| Your Fund Compared With Its Peer Group | |||
| Investor | Admiral | Peer Group | |
| Shares | Shares | Average | |
| Equity Income Fund | 0.29% | 0.20% | 1.22% |
The fund expense ratios shown are from the prospectus dated January 27, 2015, and represent estimated costs for the current fiscal year. For the fiscal year ended September 30, 2015, the fund’s expense ratios were 0.26% for Investor Shares and 0.17% for Admiral Shares. The peer-group expense ratio is derived from data provided by Lipper, a Thomson Reuters Company, and captures information through year-end 2014.
Peer group: Equity Income Funds.
4
In the larger consumer staples sector, the fund’s holdings also gained more than their index counterparts. Both sectors were buoyed by hopes that lower gasoline prices would prompt consumers to open their wallets for other purchases. But in information technology, the fund’s modest gain came up a bit short compared with the benchmark.
In a period when prices for oil and natural gas and other resources fell sharply, the double-digit declines of both the energy and materials sectors made them the worst performers in both the fund and its benchmark. In energy, the fund performed in line with its benchmark. The fund’s materials holdings held up better than their index counterparts—making for relative success amid the downdraft.
The Advisors’ Report that follows this letter provides additional details about the management of the fund during the fiscal year.
On a separate note, earlier this year Wellington Management Company marked the 15th anniversary of its role in managing Vanguard Equity Income Fund. I would like to take this opportunity to thank Wellington, with which we have had a long and productive working relationship.
The fund has a solid history of beating its index and peers
Over the past decade, the Equity Income Fund has bested the average performance of its peer group in every year but one—an important measure of its success. More often than not, your fund also outperformed
| Total Returns | |
| Ten Years Ended September 30, 2015 | |
| Average | |
| Annual Return | |
| Equity Income Fund Investor Shares | 7.36% |
| Spliced Equity Income Index | 7.01 |
| Equity Income Funds Average | 5.59 |
For a benchmark description, see the Glossary.
Equity Income Funds Average: Derived from data provided by Lipper, a Thomson Reuters Company.
The figures shown represent past performance, which is not a guarantee of future results. (Current performance may be lower or higher than the performance data cited. For performance data current to the most recent month-end, visit our website at vanguard.com/performance.) Note, too, that both investment returns and principal value can fluctuate widely, so an investor’s shares, when sold, could be worth more or less than their original cost.
5
| Staying the course can help you stay closer to your fund’s return |
| When stock markets are highly volatile, as in recent months, it’s tempting to run for cover. |
| But the price of panic can be high. |
| A rough measure of what can be lost from attempts to time the market is the difference |
| between the returns produced by a fund and the returns earned by the fund’s investors. |
| The results shown in the Performance Summary later in this report are your fund’s time- |
| weighted returns—the average annual returns investors would have earned if they had invested |
| a lump sum in the fund at the start of the period and reinvested any distributions they received. |
| Their actual returns, however, depend on whether they subsequently bought or sold any shares. |
| There’s often a gap between this dollar-weighted return for investors and the fund’s time- |
| weighted return, as shown below. |
| Many sensible investment behaviors can contribute to the difference in returns, but industry |
| cash flow data suggest that one important factor is the generally counterproductive effort to |
| buy and sell at the “right” time. Keeping your emotions in check can help narrow the gap. |
Mutual fund returns and investor returns over the last decade

| Average fund return |
| Average investor return |
| Notes: Data are as of December 31, 2014. The average fund returns and average investor returns are from Morningstar. The average |
| fund returns are the average of the funds’ time-weighted returns in each category. The average investor returns assume that the growth |
| of a fund’s total net assets for a given period is driven by market returns and investor cash ow. To calculate investor return, a fund’s |
| change in assets for the period is discounted by the return of the fund to isolate how much of the asset growth was driven by cash ow. |
| A model, similar to an internal rate-of-return calculation, is then used to calculate a constant growth rate that links the beginning total |
| net assets and periodic cash ows to the ending total net assets. |
| Sources: Vanguard and Morningstar, Inc. |
6
its benchmark—which, of course, incurs no expenses. For the ten years as a whole, the fund’s 7.36% average annual return kept it ahead of its comparative standards.
Your fund’s dividend-oriented strategy modestly outpaced the 7.06% return of the broad U.S. stock market, as measured by the Dow Jones U.S. Total Stock Market Float Adjusted Index. As I’ve noted in the past, however—and as we saw in the year that just ended—there’s no guarantee that a strategy focused on dividend-paying stocks will always outperform the broad market.
A dose of discipline is crucial when markets become volatile
Although the broad U.S. stock market has posted gains for six straight calendar years—from 2009 to 2014—that streak may not last a seventh. Stocks tumbled in August and swung up and down in September.
Nobody can control the direction of the markets or reliably predict where they’ll go in the short term. However, investors can control how they react to unstable and turbulent markets.
During periods of market adversity, it’s more important than ever to keep sight of one of Vanguard’s key principles: Maintain perspective and long-term discipline. Whether you’re investing for yourself or on behalf of clients, your success is affected greatly by how you respond—or don’t respond—during turbulent markets. (You can read Vanguard’s Principles for Investing Success at vanguard.com/research.)
As I’ve written in the past, the best course for long-term investors is generally to ignore daily market moves and not make decisions based on emotion. (See the box on page 6 for more on the benefit of staying the course.) This is also a good time to evaluate your portfolio and make sure your asset allocation is aligned with your time horizon, goals, and risk tolerance.
The markets are unpredictable and often confounding. Keeping your long-term plans clearly in focus can help you weather these periodic storms.
As always, thank you for investing with Vanguard.
Sincerely,

F. William McNabb III
Chairman and Chief Executive Officer
October 14, 2015
7
Advisors’ Report
For the fiscal year ended September 30, 2015, Vanguard Equity Income Fund returned about –2%, ahead of its comparative standards. This reflects the combined results of your fund’s two independent investment advisors, Wellington Management Company and Vanguard’s Quantitative Equity Group. The use of two advisors provides exposure to distinct yet complementary investment approaches, enhancing the diversification of your fund. It is not uncommon for different advisors to have different views about individual securities or the broader investment environment.
The advisors, the percentage and amount of the fund’s assets each manages, and brief descriptions of their investment strategies are presented in the table below. The advisors have also prepared a discussion of the investment environment that existed during the fiscal year and of how their portfolio positioning reflects this assessment. These comments were prepared on October 12, 2015.
Wellington Management Company LLP
Portfolio Manager:
W. Michael Reckmeyer, III, CFA, Senior Managing Director and Equity Portfolio Manager
The investment environment remained precarious, with divergent trends in developed and emerging markets, uncertainty over when the Federal Reserve would begin to raise interest
| Vanguard Equity Income Fund Investment Advisors | |||
| Fund Assets Managed | |||
| Investment Advisor | % | $ Million | Investment Strategy |
| Wellington Management | 64 | 11,461 | A fundamental approach to seeking desirable stocks. |
| Company LLP | Our selections typically offer above-average dividend | ||
| yields, below-average valuations, and the potential for | |||
| dividend increases in the future. | |||
| Vanguard Quantitative | 34 | 6,130 | Employs a quantitative fundamental management |
| Equity Group | approach, using models that assess valuation, growth | ||
| prospects, management decisions, market sentiment, | |||
| and earnings and balance-sheet quality of companies | |||
| as compared with their peers. | |||
| Cash Investments | 2 | 184 | These short-term reserves are invested by Vanguard in |
| equity index products to simulate investment in stocks. | |||
| Each advisor may also maintain a modest cash | |||
| position. | |||
8
rates, heightened geopolitical risks such as increased tensions in the Middle East, and terrorism and cyber threats.
Emerging markets are experiencing slowing growth. China is transitioning from rapid to more moderate economic growth, with the extent of the slowdown still uncertain. Its government has employed several policy actions to stimulate economic activity—among them, adjusting fiscal and monetary policies and trying to support the stock market—but these have met with limited success. Other emerging economies are also slowing, with Brazil and Russia in severe recessions.
Europe is finally seeing solid growth aided by currency devaluation and improved credit availability, but the region’s dependence on exports raises the prospect that this growth could wane as emerging economies slow. Japan’s economy is growing at a moderate pace.
In the United States, economic activity has been slower than expected. The consumer remains resilient, buoyed by strong employment growth and solid wage gains, and has benefited from the windfall of lower oil prices. The industrial sector is slowing, hurt by the weakness in emerging markets, the stronger dollar, and the slowdown in the oil and gas sector.
Our performance was driven by positive security selection, particularly in the consumer discretionary and consumer staples sectors. Our position in Home Depot contributed most to relative performance. Sector allocation, a result of our bottom-up stock selection process, also added modestly to relative performance, most notably the portfolio’s overweight position in financials.
Selection was weaker in health care, information technology, and industrials. Not owning Apple—the stock didn’t meet our yield requirements—detracted the most from relative performance. Our underweight allocation (on average) to information technology and consumer staples also detracted.
At the end of the period, we were most overweight in the financial, industrial, and information technology sectors. Consumer staples, telecommunication services, and materials were our largest underweights relative to the benchmark.
Significant purchases in the past 12 months included new positions in Coca-Cola, Dominion Resources, Marathon Oil, and Union Pacific. We eliminated our positions in Unilever, WPP, and Akzo Nobel because of valuation, and we eliminated EI du Pont de Nemours and ConocoPhillips because of eroding fundamentals.
As always, we remain focused on finding investment opportunities in quality dividend-paying companies with superior total return potential at discounted valuations.
9
Vanguard Quantitative Equity Group
Portfolio Managers: James P. Stetler, Principal
James D. Troyer, CFA,
Principal Michael R. Roach, CFA
After six years of positive results, the broad U.S. equity market returned –0.49% for the fiscal year, with significant declines in the second half. Large- and mid-capitalization stocks declined a bit more, but the small-cap universe outperformed with an advance of more than 1%. Growth stocks easily outpaced value stocks: The Russell 3000 Growth Index returned about 3%, while its value counterpart returned about –4%. The broad international market, especially emerging markets, declined more than that.
The Federal Reserve held off on raising interest rates as it awaits further progress toward its employment and inflation targets. Real GDP in the second quarter increased at an annual rate of 3.9%, compared with an increase of 0.6% in the first quarter, reflecting positive contributions from exports, acceleration in personal consumption expenditures, and an increase in state and local government spending. The unemployment rate continued to improve over the past year. In September, total U.S. nonfarm payroll employment rose by 142,000 and the unemployment rate was 5.1%, down from 5.9% 12 months earlier.
The economic slowdown overseas, especially in emerging markets, continues to contribute to the volatility in the markets. Emerging-market currencies have lost value against the U.S. dollar; the possibility that the Fed might raise interest rates by the end of 2015 is pushing up the dollar and driving capital outflows from these currencies. Many emerging economies were also affected by weak commodity prices that contributed to lower export growth. China’s ongoing slowdown still represents significant downside risk to overall emerging-market performance.
Although we seek to understand the impact of macroeconomic factors on fund performance, our process is centered on specific stock fundamentals. We use a quantitative approach to systematically identify stocks in our investment universe that are more likely to exhibit long-term outperformance. Our process focuses on valuation as well as other factors that we believe affect fundamental growth. This allows us to take advantage of inefficiencies in the market caused by persistent biases in investor behavior.
We construct our portfolio with the goal of maximizing expected return while minimizing exposure to risks relative to the benchmark (such as industry selection) that our research indicates do not improve returns.
10
For the fiscal year, our growth and sentiment models were positive contributors to performance. However, our valuation, management decisions, and quality models did not perform as expected.
Performance within the FTSE benchmark was split. Five of the ten sector groups generated positive returns. Utilities and information technology did best, but their gains were more than offset by continued poor performance in energy and materials. Our stock selection results were mixed. We outperformed the benchmark in six sectors. Our strongest relative results came in technology, consumer discretionary, and materials; our weakest were in energy.
In technology, Broadridge Financial Solutions and Apple were our top contributors to relative performance. Cablevision Systems drove our results in consumer discretionary, and our exclusion of Freeport-McMoRan in materials also helped. Our energy sector selections were disappointing, as Ensco, ONEOK, and Atwood Oceanics detracted.
11
Equity Income Fund
Fund Profile
As of September 30, 2015
| Share-Class Characteristics | ||
| Investor | Admiral | |
| Shares | Shares | |
| Ticker Symbol | VEIPX | VEIRX |
| Expense Ratio1 | 0.29% | 0.20% |
| 30-Day SEC Yield | 3.12% | 3.21% |
| Portfolio Characteristics | |||
| DJ | |||
| U.S. | |||
| FTSE High | Total | ||
| Dividend | Market | ||
| Yield | FA | ||
| Fund | Index | Index | |
| Number of Stocks | 176 | 430 | 4,000 |
| Median Market Cap | $94.4B | $94.4B | $46.5B |
| Price/Earnings Ratio | 17.2x | 17.2x | 20.2x |
| Price/Book Ratio | 2.4x | 2.4x | 2.5x |
| Return on Equity | 18.1% | 18.1% | 17.2% |
| Earnings Growth | |||
| Rate | 6.2% | 4.1% | 10.1% |
| Dividend Yield | 3.4% | 3.6% | 2.1% |
| Foreign Holdings | 6.7% | 0.0% | 0.0% |
| Turnover Rate | 32% | — | — |
| Short-Term | |||
| Reserves | 2.0% | — | — |
| Sector Diversification (% of equity exposure) | |||
| FTSE High | DJ | ||
| Dividend | U.S. Total | ||
| Yield | Market | ||
| Fund | Index | FA Index | |
| Consumer | |||
| Discretionary | 6.2% | 6.6% | 13.7% |
| Consumer Staples | 11.7 | 14.7 | 8.7 |
| Energy | 10.5 | 10.7 | 6.3 |
| Financials | 17.0 | 14.4 | 18.3 |
| Health Care | 12.3 | 11.9 | 14.4 |
| Industrials | 12.4 | 11.2 | 10.6 |
| Information | |||
| Technology | 14.3 | 13.9 | 19.6 |
| Materials | 2.6 | 3.1 | 3.1 |
| Telecommunication | |||
| Services | 4.2 | 5.2 | 2.1 |
| Utilities | 8.8 | 8.3 | 3.2 |
| Volatility Measures | ||
| FTSE High | DJ | |
| Dividend | U.S. Total | |
| Yield | Market | |
| Index | FA Index | |
| R-Squared | 0.98 | 0.91 |
| Beta | 0.97 | 0.90 |
These measures show the degree and timing of the fund’s fluctuations compared with the indexes over 36 months.
| Ten Largest Holdings (% of total net assets) | ||
| Microsoft Corp. | Systems Software | 4.2% |
| Wells Fargo & Co. | Diversified Banks | 3.9 |
| JPMorgan Chase & Co. | Diversified Banks | 3.3 |
| Johnson & Johnson | Pharmaceuticals | 2.8 |
| Verizon Communications Integrated | ||
| Inc. | Telecommunication | |
| Services | 2.7 | |
| Merck & Co. Inc. | Pharmaceuticals | 2.6 |
| General Electric Co. | Industrial | |
| Conglomerates | 2.5 | |
| Exxon Mobil Corp. | Integrated Oil & Gas | 2.5 |
| Cisco Systems Inc. | Communications | |
| Equipment | 2.3 | |
| Home Depot Inc. | Home Improvement | |
| Retail | 2.2 | |
| Top Ten | 29.0% | |
The holdings listed exclude any temporary cash investments and equity index products.
Investment Focus
1 The expense ratios shown are from the prospectus dated January 27, 2015, and represent estimated costs for the current fiscal year. For the fiscal year ended September 30, 2015, the expense ratios were 0.26% for Investor Shares and 0.17% for Admiral Shares.
12
Equity Income Fund
Performance Summary
All of the returns in this report represent past performance, which is not a guarantee of future results that may be achieved by the fund. (Current performance may be lower or higher than the performance data cited. For performance data current to the most recent month-end, visit our website at vanguard.com/performance.) Note, too, that both investment returns and principal value can fluctuate widely, so an investor’s shares, when sold, could be worth more or less than their original cost. The returns shown do not reflect taxes that a shareholder would pay on fund distributions or on the sale of fund shares.
Cumulative Performance: September 30, 2005, Through September 30, 2015
Initial Investment of $10,000

| Average Annual Total Returns | ||||
| Periods Ended September 30, 2015 | ||||
| Final Value | ||||
| One | Five | Ten | of a $10,000 | |
| Year | Years | Years | Investment | |
| Equity Income Fund*Investor Shares | -2.11% | 13.27% | 7.36% | $20,352 |
| Spliced Equity Income Index | -2.53 | 13.47 | 7.01 | 19,690 |
| Equity Income Funds Average | -4.80 | 10.13 | 5.59 | 17,231 |
| Dow Jones U.S. Total Stock Market | ||||
| Float Adjusted Index | -0.55 | 13.26 | 7.06 | 19,778 |
For a benchmark description, see the Glossary.
Equity Income Funds Average: Derived from data provided by Lipper, a Thomson Reuters Company.
| Final Value | ||||
| One | Five | Ten | of a $50,000 | |
| Year | Years | Years | Investment | |
| Equity Income Fund Admiral Shares | -2.03% | 13.37% | 7.47% | $102,805 |
| Spliced Equity Income Index | -2.53 | 13.47 | 7.01 | 98,450 |
| Dow Jones U.S. Total Stock Market Float | ||||
| Adjusted Index | -0.55 | 13.26 | 7.06 | 98,892 |
See Financial Highlights for dividend and capital gains information.
13
Equity Income Fund
Fiscal-Year Total Returns (%): September 30, 2005, Through September 30, 2015

| Equity Income Fund Investor Shares |
| Spliced Equity Income Index |
For a benchmark description, see the Glossary.
14
Equity Income Fund
Financial Statements
Statement of Net Assets
As of September 30, 2015
The fund reports a complete list of its holdings in regulatory filings four times in each fiscal year, at the quarter-ends. For the second and fourth fiscal quarters, the lists appear in the fund’s semiannual and annual reports to shareholders. For the first and third fiscal quarters, the fund files the lists with the Securities and Exchange Commission on Form N-Q. Shareholders can look up the fund’s Forms N-Q on the SEC’s website at sec.gov. Forms N-Q may also be reviewed and copied at the SEC’s Public Reference Room (see the back cover of this report for further information).
| Market | |||
| Value• | |||
| Shares | ($000) | ||
| Common Stocks (97.3%)1 | |||
| Consumer Discretionary (5.9%) | |||
| Home Depot Inc. | 3,438,400 | 397,101 | |
| McDonald’s Corp. | 1,859,005 | 183,168 | |
| Thomson Reuters Corp. | 2,537,270 | 102,150 | |
| Target Corp. | 911,800 | 71,722 | |
| Carnival Corp. | 957,200 | 47,573 | |
| Darden Restaurants Inc. | 558,000 | 38,245 | |
| Omnicom Group Inc. | 553,100 | 36,449 | |
| General Motors Co. | 1,199,100 | 35,997 | |
| American Eagle Outfitters | |||
| Inc. | 2,173,300 | 33,969 | |
| Leggett & Platt Inc. | 797,300 | 32,889 | |
| ^ | Cracker Barrel Old | ||
| Country Store Inc. | 174,400 | 25,686 | |
| Hasbro Inc. | 179,800 | 12,971 | |
| Ford Motor Co. | 739,800 | 10,039 | |
| ^ | Autoliv Inc. | 71,700 | 7,816 |
| Time Warner Cable Inc. | 42,300 | 7,587 | |
| Cinemark Holdings Inc. | 158,700 | 5,156 | |
| Cablevision Systems Corp. | |||
| Class A | 147,300 | 4,783 | |
| Gannett Co. Inc. | 167,100 | 2,461 | |
| 1,055,762 | |||
| Consumer Staples (11.4%) | |||
| Coca-Cola Co. | 6,531,364 | 262,038 | |
| Kraft Heinz Co. | 3,534,470 | 249,463 | |
| Procter & Gamble Co. | 3,067,140 | 220,650 | |
| Philip Morris International | |||
| Inc. | 2,734,945 | 216,963 | |
| Wal-Mart Stores Inc. | 2,749,992 | 178,309 | |
| Altria Group Inc. | 3,132,975 | 170,434 | |
| British American Tobacco | |||
| plc | 3,083,855 | 170,156 | |
| PepsiCo Inc. | 1,703,090 | 160,601 | |
| Diageo plc ADR | 910,100 | 98,100 | |
| Reynolds American Inc. | 1,413,800 | 62,589 | |
| Dr Pepper Snapple Group | |||
| Inc. | 586,700 | 46,379 | |
| Clorox Co. | 399,900 | 46,200 | |
| Market | |||
| Value• | |||
| Shares | ($000) | ||
| ConAgra Foods Inc. | 1,076,200 | 43,597 | |
| Kimberly-Clark Corp. | 261,688 | 28,534 | |
| Ingredion Inc. | 309,100 | 26,988 | |
| Campbell Soup Co. | 389,000 | 19,715 | |
| Pinnacle Foods Inc. | 293,600 | 12,296 | |
| Avon Products Inc. | 1,371,200 | 4,456 | |
| Flowers Foods Inc. | 99,300 | 2,457 | |
| Coca-Cola Enterprises Inc. | 38,000 | 1,837 | |
| 2,021,762 | |||
| Energy (10.2%) | |||
| Exxon Mobil Corp. | 5,945,110 | 442,019 | |
| Chevron Corp. | 4,264,070 | 336,350 | |
| Suncor Energy Inc. | 7,461,910 | 199,382 | |
| Phillips 66 | 2,383,600 | 183,156 | |
| Occidental Petroleum | |||
| Corp. | 2,468,930 | 163,320 | |
| Marathon Oil Corp. | 5,649,100 | 86,996 | |
| Enbridge Inc. | 2,175,500 | 80,776 | |
| Valero Energy Corp. | 944,800 | 56,783 | |
| HollyFrontier Corp. | 797,000 | 38,926 | |
| Western Refining Inc. | 784,300 | 34,603 | |
| PBF Energy Inc. Class A | 1,161,900 | 32,800 | |
| ^ | Noble Corp. plc | 2,826,400 | 30,836 |
| Ensco plc Class A | 2,069,900 | 29,144 | |
| ^ | Atwood Oceanics Inc. | 1,234,600 | 18,284 |
| Delek US Holdings Inc. | 628,900 | 17,421 | |
| ^ | Nordic American Tankers | ||
| Ltd. | 1,048,500 | 15,937 | |
| ConocoPhillips | 314,000 | 15,060 | |
| Scorpio Tankers Inc. | 1,365,400 | 12,521 | |
| Kinder Morgan Inc. | 447,300 | 12,381 | |
| Teekay Corp. | 164,200 | 4,867 | |
| SemGroup Corp. Class A | 56,600 | 2,447 | |
| 1,814,009 | |||
| Financials (16.5%) | |||
| Wells Fargo & Co. | 13,671,340 | 702,023 | |
| JPMorgan Chase & Co. | 9,614,630 | 586,204 | |
| Marsh & McLennan Cos. | |||
| Inc. | 5,490,070 | 286,692 | |
15
| Equity Income Fund | ||
| Market | ||
| Value• | ||
| Shares | ($000) | |
| PNC Financial Services | ||
| Group Inc. | 2,653,092 | 236,656 |
| BlackRock Inc. | 606,730 | 180,484 |
| MetLife Inc. | 3,599,300 | 169,707 |
| ACE Ltd. | 1,640,040 | 169,580 |
| M&T Bank Corp. | 1,075,190 | 131,119 |
| US Bancorp | 2,402,740 | 98,536 |
| Principal Financial Group | ||
| Inc. | 1,396,500 | 66,110 |
| Travelers Cos. Inc. | 560,400 | 55,777 |
| Prudential Financial Inc. | 555,700 | 42,350 |
| Huntington Bancshares | ||
| Inc. | 3,204,600 | 33,969 |
| Lazard Ltd. Class A | 755,800 | 32,726 |
| Janus Capital Group Inc. | 2,162,100 | 29,405 |
| Validus Holdings Ltd. | 595,300 | 26,830 |
| Axis Capital Holdings Ltd. | 442,400 | 23,766 |
| First American Financial | ||
| Corp. | 561,100 | 21,922 |
| FNF Group | 239,600 | 8,499 |
| Endurance Specialty | ||
| Holdings Ltd. | 133,100 | 8,123 |
| PacWest Bancorp | 187,800 | 8,040 |
| Cincinnati Financial Corp. | 96,300 | 5,181 |
| Hanover Insurance Group | ||
| Inc. | 44,700 | 3,473 |
| First Commonwealth | ||
| Financial Corp. | 267,000 | 2,427 |
| Navient Corp. | 182,500 | 2,051 |
| 2,931,650 | ||
| Health Care (11.9%) | ||
| Johnson & Johnson | 5,370,145 | 501,303 |
| Merck & Co. Inc. | 9,269,424 | 457,817 |
| Pfizer Inc. | 12,480,644 | 392,017 |
| Bristol-Myers Squibb Co. | 3,640,332 | 215,508 |
| Roche Holding AG | 481,870 | 127,923 |
| Eli Lilly & Co. | 1,526,749 | 127,774 |
| AstraZeneca plc ADR | 3,674,098 | 116,910 |
| AbbVie Inc. | 1,822,300 | 99,151 |
| Novartis AG | 735,221 | 67,575 |
| Baxalta Inc. | 264,700 | 8,341 |
| Kindred Healthcare Inc. | 134,300 | 2,115 |
| Quality Systems Inc. | 70,000 | 873 |
| 2,117,307 | ||
| Industrials (12.0%) | ||
| General Electric Co. | 17,906,052 | 451,591 |
| 3M Co. | 1,836,930 | 260,422 |
| Eaton Corp. plc | 4,050,410 | 207,786 |
| United Technologies | ||
| Corp. | 2,032,780 | 180,897 |
| United Parcel Service Inc. | ||
| Class B | 1,582,130 | 156,140 |
| Raytheon Co. | 1,232,300 | 134,641 |
| Union Pacific Corp. | 1,367,400 | 120,892 |
| Market | ||
| Value• | ||
| Shares | ($000) | |
| Honeywell International | ||
| Inc. | 1,274,100 | 120,644 |
| Boeing Co. | 723,700 | 94,768 |
| Caterpillar Inc. | 1,337,800 | 87,439 |
| Waste Management Inc. | 1,542,590 | 76,836 |
| Lockheed Martin Corp. | 308,300 | 63,914 |
| Stanley Black & Decker | ||
| Inc. | 443,100 | 42,972 |
| PACCAR Inc. | 792,400 | 41,339 |
| Pitney Bowes Inc. | 1,715,900 | 34,061 |
| General Dynamics Corp. | 231,500 | 31,935 |
| Illinois Tool Works Inc. | 193,070 | 15,892 |
| GATX Corp. | 292,300 | 12,905 |
| RR Donnelley & Sons Co. | 155,700 | 2,267 |
| Aircastle Ltd. | 79,600 | 1,641 |
| West Corp. | 71,600 | 1,604 |
| Knoll Inc. | 54,800 | 1,204 |
| General Cable Corp. | 83,700 | 996 |
| 2,142,786 | ||
| Information Technology (13.8%) | ||
| Microsoft Corp. | 16,754,519 | 741,555 |
| Cisco Systems Inc. | 15,600,280 | 409,507 |
| Intel Corp. | 12,782,550 | 385,266 |
| International Business | ||
| Machines Corp. | 1,453,100 | 210,656 |
| Analog Devices Inc. | 3,098,160 | 174,767 |
| Texas Instruments Inc. | 2,573,100 | 127,420 |
| Maxim Integrated | ||
| Products Inc. | 3,091,617 | 103,260 |
| Symantec Corp. | 3,052,500 | 59,432 |
| Western Union Co. | 2,096,700 | 38,495 |
| QUALCOMM Inc. | 675,900 | 36,316 |
| Broadridge Financial | ||
| Solutions Inc. | 612,400 | 33,896 |
| Apple Inc. | 281,500 | 31,050 |
| Computer Sciences Corp. | 466,700 | 28,646 |
| Lexmark International Inc. | ||
| Class A | 917,700 | 26,595 |
| Leidos Holdings Inc. | 303,300 | 12,529 |
| Paychex Inc. | 246,400 | 11,736 |
| Diebold Inc. | 180,600 | 5,377 |
| Science Applications | ||
| International Corp. | 126,900 | 5,103 |
| EarthLink Holdings Corp. | 403,200 | 3,137 |
| Linear Technology Corp. | 36,700 | 1,481 |
| 2,446,224 | ||
| Materials (2.5%) | ||
| ^ Dow Chemical Co. | 3,598,620 | 152,581 |
| International Paper Co. | 2,561,520 | 96,800 |
| Nucor Corp. | 1,736,410 | 65,202 |
| LyondellBasell Industries | ||
| NV Class A | 676,400 | 56,385 |
| Avery Dennison Corp. | 630,700 | 35,679 |
| Bemis Co. Inc. | 586,400 | 23,204 |
16
| Equity Income Fund | ||
| Market | ||
| Value• | ||
| Shares | ($000) | |
| Domtar Corp. | 140,200 | 5,012 |
| EI du Pont de Nemours | ||
| & Co. | 74,270 | 3,580 |
| Commercial Metals Co. | 256,900 | 3,481 |
| 441,924 | ||
| Other (0.4%) | ||
| 2 Vanguard High Dividend | ||
| Yield ETF | 1,047,950 | 65,654 |
| Telecommunication Services (4.1%) | ||
| Verizon Communications | ||
| Inc. | 11,130,886 | 484,305 |
| AT&T Inc. | 3,998,197 | 130,261 |
| BCE Inc. | 2,887,500 | 118,183 |
| CenturyLink Inc. | 143,400 | 3,602 |
| 736,351 | ||
| Utilities (8.6%) | ||
| Dominion Resources Inc. | 2,509,000 | 176,583 |
| Xcel Energy Inc. | 4,743,590 | 167,970 |
| NextEra Energy Inc. | 1,695,016 | 165,349 |
| UGI Corp. | 4,172,390 | 145,283 |
| Eversource Energy | 2,806,390 | 142,059 |
| Duke Energy Corp. | 1,847,900 | 132,938 |
| National Grid plc | 8,299,777 | 115,594 |
| CMS Energy Corp. | 1,880,400 | 66,416 |
| American Electric Power | ||
| Co. Inc. | 982,000 | 55,836 |
| Exelon Corp. | 1,687,100 | 50,107 |
| Public Service Enterprise | ||
| Group Inc. | 1,182,300 | 49,846 |
| Edison International | 780,100 | 49,201 |
| Consolidated Edison Inc. | 723,100 | 48,339 |
| Vectren Corp. | 864,600 | 36,322 |
| Atmos Energy Corp. | 614,700 | 35,763 |
| FirstEnergy Corp. | 650,100 | 20,355 |
| WGL Holdings Inc. | 332,000 | 19,146 |
| Southern Co. | 369,300 | 16,508 |
| Ameren Corp. | 276,500 | 11,688 |
| New Jersey Resources | ||
| Corp. | 205,400 | 6,168 |
| IDACORP Inc. | 72,100 | 4,666 |
| NorthWestern Corp. | 61,900 | 3,332 |
| Portland General Electric | ||
| Co. | 84,900 | 3,139 |
| ONE Gas Inc. | 29,100 | 1,319 |
| 1,523,927 | ||
| Total Common Stocks | ||
| (Cost $15,021,652) | 17,297,356 | |
| Market | |||
| Value• | |||
| Shares | ($000) | ||
| Temporary Cash Investments (3.0%)1 | |||
| Money Market Fund (1.0%) | |||
| 3,4 | Vanguard Market | ||
| Liquidity Fund, | |||
| 0.189% | 174,131,720 | 174,132 | |
| Face | |||
| Amount | |||
| ($000) | |||
| Repurchase Agreement (1.8%) | |||
| Goldman Sachs & Co. | |||
| 0.120%, 10/1/15 (Dated | |||
| 9/30/15, Repurchase | |||
| Value $318,401,000, | |||
| collateralized by Federal | |||
| Home Loan Mortgage | |||
| Corp. 2.500%–5.500%, | |||
| 12/1/22–9/1/45, Federal | |||
| National Mortgage Assn. | |||
| 2.234%–6.500%, | |||
| 2/1/19–8/1/45, with a | |||
| value of $324,768,000) | 318,400 | 318,400 | |
| U.S. Government and Agency Obligations (0.2%) | |||
| 5 | Federal Home Loan | ||
| Bank Discount Notes, | |||
| 0.093%, 10/2/15 | 2,200 | 2,200 | |
| 5 | Federal Home Loan | ||
| Bank Discount Notes, | |||
| 0.095%, 10/7/15 | 2,000 | 2,000 | |
| 5 | Federal Home Loan | ||
| Bank Discount Notes, | |||
| 0.142%, 10/21/15 | 30,000 | 29,998 | |
| 5,6 | Federal Home Loan | ||
| Bank Discount Notes, | |||
| 0.100%, 10/23/15 | 5,600 | 5,600 | |
| 5,6 | Federal Home Loan | ||
| Bank Discount Notes, | |||
| 0.114%, 10/28/15 | 5,400 | 5,399 | |
| 5,6 | Federal Home Loan | ||
| Bank Discount Notes, | |||
| 0.120%, 10/30/15 | 100 | 100 | |
| 45,297 | |||
| Total Temporary Cash Investments | |||
| (Cost $537,829) | 537,829 | ||
| Total Investments (100.3%) | |||
| (Cost $15,559,481) | 17,835,185 | ||
17
| Equity Income Fund | |
| Amount | |
| ($000) | |
| Other Assets and Liabilities (-0.3%) | |
| Other Assets | |
| Investment in Vanguard | 1,631 |
| Receivables for Investment Securities Sold 31,655 | |
| Receivables for Accrued Income | 35,543 |
| Receivables for Capital Shares Issued | 56,133 |
| Other Assets | 2,026 |
| Total Other Assets | 126,988 |
| Liabilities | |
| Payables for Investment Securities | |
| Purchased | (59,678) |
| Collateral for Securities on Loan | (77,698) |
| Payables for Capital Shares Redeemed | (30,307) |
| Payables to Investment Advisor | (3,399) |
| Payables to Vanguard | (16,318) |
| Total Liabilities | (187,400) |
| Net Assets (100%) | 17,774,773 |
| At September 30, 2015, net assets consisted of: | |
| Amount | |
| ($000) | |
| Paid-in Capital | 14,904,548 |
| Overdistributed Net Investment Income | (1,440) |
| Accumulated Net Realized Gains | 598,108 |
| Unrealized Appreciation (Depreciation) | |
| Investment Securities | 2,275,704 |
| Futures Contracts | (2,022) |
| Foreign Currencies | (125) |
| Net Assets | 17,774,773 |
| Amount | |
| ($000) | |
| Investor Shares—Net Assets | |
| Applicable to 167,241,745 outstanding | |
| $.001 par value shares of beneficial | |
| interest (unlimited authorization) | 4,812,484 |
| Net Asset Value Per Share— | |
| Investor Shares | $28.78 |
| Admiral Shares—Net Assets | |
| Applicable to 214,924,800 outstanding | |
| $.001 par value shares of beneficial | |
| interest (unlimited authorization) | 12,962,289 |
| Net Asset Value Per Share— | |
| Admiral Shares | $60.31 |
• See Note A in Notes to Financial Statements.
^ Includes partial security positions on loan to broker-dealers. The total value of securities on loan is $77,176,000.
1 The fund invests a portion of its cash reserves in equity markets through the use of index futures contracts. After giving effect to futures investments, the fund’s effective common stock and temporary cash investment positions represent 98.1% and 2.2%, respectively, of net assets.
2 Considered an affiliated company of the fund as the issuer is another member of The Vanguard Group.
3 Affiliated money market fund available only to Vanguard funds and certain trusts and accounts managed by Vanguard. Rate shown is the 7-day yield.
4 Includes $77,698,000 of collateral received for securities on loan.
5 The issuer operates under a congressional charter; its securities are generally neither guaranteed by the U.S. Treasury nor backed by the full faith and credit of the U.S. government.
6 Securities with a value of $5,799,000 have been segregated as initial margin for open futures contracts.
ADR—American Depositary Receipt.
See accompanying Notes, which are an integral part of the Financial Statements.
18
| Equity Income Fund | |
| Statement of Operations | |
| Year Ended | |
| September 30, 2015 | |
| ($000) | |
| Investment Income | |
| Income | |
| Dividends1,2 | 558,105 |
| Interest2 | 472 |
| Securities Lending | 1,752 |
| Total Income | 560,329 |
| Expenses | |
| Investment Advisory Fees—Note B | |
| Basic Fee | 14,997 |
| Performance Adjustment | (991) |
| The Vanguard Group—Note C | |
| Management and Administrative—Investor Shares | 8,910 |
| Management and Administrative—Admiral Shares | 10,697 |
| Marketing and Distribution—Investor Shares | 1,240 |
| Marketing and Distribution—Admiral Shares | 2,199 |
| Custodian Fees | 168 |
| Auditing Fees | 36 |
| Shareholders’ Reports—Investor Shares | 112 |
| Shareholders’ Reports—Admiral Shares | 98 |
| Trustees’ Fees and Expenses | 29 |
| Total Expenses | 37,495 |
| Net Investment Income | 522,834 |
| Realized Net Gain (Loss) | |
| Investment Securities Sold2 | 708,688 |
| Futures Contracts | 1,427 |
| Foreign Currencies | (477) |
| Realized Net Gain (Loss) | 709,638 |
| Change in Unrealized Appreciation (Depreciation) | |
| Investment Securities | (1,606,967) |
| Futures Contracts | (295) |
| Foreign Currencies | (3) |
| Change in Unrealized Appreciation (Depreciation) | (1,607,265) |
| Net Increase (Decrease) in Net Assets Resulting from Operations | (374,793) |
1 Dividends are net of foreign withholding taxes of $4,550,000.
2 Dividend income, interest income, and realized net gain (loss) from affiliated companies of the fund were $2,213,000, $300,000, and $0, respectively.
See accompanying Notes, which are an integral part of the Financial Statements.
19
| Equity Income Fund | ||
| Statement of Changes in Net Assets | ||
| Year Ended September 30, | ||
| 2015 | 2014 | |
| ($000) | ($000) | |
| Increase (Decrease) in Net Assets | ||
| Operations | ||
| Net Investment Income | 522,834 | 454,786 |
| Realized Net Gain (Loss) | 709,638 | 770,697 |
| Change in Unrealized Appreciation (Depreciation) | (1,607,265) | 1,175,497 |
| Net Increase (Decrease) in Net Assets Resulting from Operations | (374,793) | 2,400,980 |
| Distributions | ||
| Net Investment Income | ||
| Investor Shares | (148,834) | (142,170) |
| Admiral Shares | (377,108) | (304,850) |
| Realized Capital Gain1 | ||
| Investor Shares | (178,446) | (136,041) |
| Admiral Shares | (410,635) | (265,749) |
| Total Distributions | (1,115,023) | (848,810) |
| Capital Share Transactions | ||
| Investor Shares | (307,678) | 165,292 |
| Admiral Shares | 1,725,388 | 2,156,810 |
| Net Increase (Decrease) from Capital Share Transactions | 1,417,710 | 2,322,102 |
| Total Increase (Decrease) | (72,106) | 3,874,272 |
| Net Assets | ||
| Beginning of Period | 17,846,879 | 13,972,607 |
| End of Period2 | 17,774,773 | 17,846,879 |
1 Includes fiscal 2015 and 2014 short-term gain distributions totaling $129,551,000 and $18,677,000, respectively. Short-term gain distributions are treated as ordinary income dividends for tax purposes.
2 Net Assets—End of Period includes undistributed (overdistributed) net investment income of ($1,440,000) and $2,145,000.
See accompanying Notes, which are an integral part of the Financial Statements.
20
| Equity Income Fund | |||||
| Financial Highlights | |||||
| Investor Shares | |||||
| For a Share Outstanding | Year Ended September 30, | ||||
| Throughout Each Period | 2015 | 2014 | 2013 | 2012 | 2011 |
| Net Asset Value, Beginning of Period | $31.23 | $28.26 | $24.31 | $19.40 | $18.83 |
| Investment Operations | |||||
| Net Investment Income | . 847 | .826 | .732 | .667 | .596 |
| Net Realized and Unrealized Gain (Loss) | |||||
| on Investments | (1.431) | 3.754 | 3.946 | 4.908 | .567 |
| Total from Investment Operations | (.584) | 4.580 | 4.678 | 5.575 | 1.163 |
| Distributions | |||||
| Dividends from Net Investment Income | (.852) | (. 811) | (.728) | (. 665) | (. 593) |
| Distributions from Realized Capital Gains | (1.014) | (.799) | — | — | — |
| Total Distributions | (1.866) | (1.610) | (.728) | (. 665) | (. 593) |
| Net Asset Value, End of Period | $28.78 | $31.23 | $28.26 | $24.31 | $19.40 |
| Total Return1 | -2.11% | 16.62% | 19.45% | 29.00% | 6.00% |
| Ratios/Supplemental Data | |||||
| Net Assets, End of Period (Millions) | $4,812 | $5,528 | $4,839 | $4,107 | $2,835 |
| Ratio of Total Expenses to Average Net Assets2 | 0.26% | 0.29% | 0.30% | 0.30% | 0.31% |
| Ratio of Net Investment Income to | |||||
| Average Net Assets | 2.72% | 2.74% | 2.81% | 3.00% | 2.89% |
| Portfolio Turnover Rate | 32% | 33% | 34% | 26% | 29% |
1 Total returns do not include account service fees that may have applied in the periods shown. Fund prospectuses provide information about any applicable account service fees.
2 Includes performance-based investment advisory fee increases (decreases) of (0.01%), 0.00%, 0.00%, 0.00%, and 0.01%.
See accompanying Notes, which are an integral part of the Financial Statements.
21
| Equity Income Fund | |||||
| Financial Highlights | |||||
| Admiral Shares | |||||
| For a Share Outstanding | Year Ended September 30, | ||||
| Throughout Each Period | 2015 | 2014 | 2013 | 2012 | 2011 |
| Net Asset Value, Beginning of Period | $65.45 | $59.24 | $50.94 | $40.67 | $39.47 |
| Investment Operations | |||||
| Net Investment Income | 1.834 | 1.790 | 1.585 | 1.445 | 1.286 |
| Net Realized and Unrealized Gain (Loss) | |||||
| on Investments | (3.003) | 7.853 | 8.293 | 10.265 | 1.194 |
| Total from Investment Operations | (1.169) | 9.643 | 9.878 | 11.710 | 2.480 |
| Distributions | |||||
| Dividends from Net Investment Income | (1.846) | (1.758) | (1.578) | (1.440) | (1.280) |
| Distributions from Realized Capital Gains | (2.125) | (1.675) | — | — | — |
| Total Distributions | (3.971) | (3.433) | (1.578) | (1.440) | (1.280) |
| Net Asset Value, End of Period | $60.31 | $65.45 | $59.24 | $50.94 | $40.67 |
| Total Return1 | -2.03% | 16.70% | 19.61% | 29.06% | 6.10% |
| Ratios/Supplemental Data | |||||
| Net Assets, End of Period (Millions) | $12,962 | $12,319 | $9,134 | $5,234 | $2,614 |
| Ratio of Total Expenses to Average Net Assets2 | 0.17% | 0.20% | 0.21% | 0.21% | 0.22% |
| Ratio of Net Investment Income to | |||||
| Average Net Assets | 2.81% | 2.83% | 2.90% | 3.09% | 2.98% |
| Portfolio Turnover Rate | 32% | 33% | 34% | 26% | 29% |
1 Total returns do not include account service fees that may have applied in the periods shown. Fund prospectuses provide information about any applicable account service fees.
2 Includes performance-based investment advisory fee increases (decreases) of (0.01%), 0.00%, 0.00%, 0.00%, and 0.01%.
See accompanying Notes, which are an integral part of the Financial Statements.
22
Equity Income Fund
Notes to Financial Statements
Vanguard Equity Income Fund is registered under the Investment Company Act of 1940 as an open-end investment company, or mutual fund. The fund offers two classes of shares: Investor Shares and Admiral Shares. Investor Shares are available to any investor who meets the fund’s minimum purchase requirements. Admiral Shares are designed for investors who meet certain administrative, service, and account-size criteria.
A. The following significant accounting policies conform to generally accepted accounting principles for U.S. investment companies. The fund consistently follows such policies in preparing its financial statements.
1. Security Valuation: Securities are valued as of the close of trading on the New York Stock Exchange (generally 4 p.m., Eastern time) on the valuation date. Equity securities are valued at the latest quoted sales prices or official closing prices taken from the primary market in which each security trades; such securities not traded on the valuation date are valued at the mean of the latest quoted bid and asked prices. Securities for which market quotations are not readily available, or whose values have been affected by events occurring before the fund’s pricing time but after the close of the securities’ primary markets, are valued at their fair values calculated according to procedures adopted by the board of trustees. These procedures include obtaining quotations from an independent pricing service, monitoring news to identify significant market- or security-specific events, and evaluating changes in the values of foreign market proxies (for example, ADRs, futures contracts, or exchange-traded funds), between the time the foreign markets close and the fund’s pricing time. When fair-value pricing is employed, the prices of securities used by a fund to calculate its net asset value may differ from quoted or published prices for the same securities. Investments in Vanguard Market Liquidity Fund are valued at that fund’s net asset value. Temporary cash investments acquired over 60 days to maturity are valued using the latest bid prices or using valuations based on a matrix system (which considers such factors as security prices, yields, maturities, and ratings), both as furnished by independent pricing services. Other temporary cash investments are valued at amortized cost, which approximates market value.
2. Foreign Currency: Securities and other assets and liabilities denominated in foreign currencies are translated into U.S. dollars using exchange rates obtained from an independent third party as of the fund’s pricing time on the valuation date. Realized gains (losses) and unrealized appreciation (depreciation) on investment securities include the effects of changes in exchange rates since the securities were purchased, combined with the effects of changes in security prices. Fluctuations in the value of other assets and liabilities resulting from changes in exchange rates are recorded as unrealized foreign currency gains (losses) until the assets or liabilities are settled in cash, at which time they are recorded as realized foreign currency gains (losses).
3. Futures Contracts: The fund uses index futures contracts to a limited extent, with the objective of maintaining full exposure to the stock market while maintaining liquidity. The fund may purchase or sell futures contracts to achieve a desired level of investment, whether to accommodate portfolio turnover or cash flows from capital share transactions. The primary risks associated with the use of futures contracts are imperfect correlation between changes in market values of stocks held by the fund and the prices of futures contracts, and the possibility of an illiquid market. Counterparty risk involving futures is mitigated because a regulated clearinghouse is the counterparty instead of the clearing broker. To further mitigate counterparty risk, the fund trades futures contracts on an exchange, monitors the financial strength of its clearing brokers and clearinghouse, and has entered into clearing agreements with its clearing brokers. The clearinghouse imposes initial margin requirements to secure the fund’s performance and requires daily settlement of variation margin representing changes in the market value of each contract.
23
Equity Income Fund
Futures contracts are valued at their quoted daily settlement prices. The aggregate settlement values of the contracts are not recorded in the Statement of Net Assets. Fluctuations in the value of the contracts are recorded in the Statement of Net Assets as an asset (liability) and in the Statement of Operations as unrealized appreciation (depreciation) until the contracts are closed, when they are recorded as realized futures gains (losses).
During the year ended September 30, 2015, the fund’s average investments in long and short futures contracts represented 1% and 0% of net assets, respectively, based on the average of aggregate settlement values at each quarter-end during the period.
4. Repurchase Agreements: The fund enters into repurchase agreements with institutional counterparties. Securities pledged as collateral to the fund under repurchase agreements are held by a custodian bank until the agreements mature. Each agreement requires that the market value of the collateral be sufficient to cover payments of interest and principal. The fund further mitigates its counterparty risk by entering into repurchase agreements only with a diverse group of prequalified counterparties, monitoring their financial strength, and entering into master repurchase agreements with its counterparties. The master repurchase agreements provide that, in the event of a counterparty’s default (including bankruptcy), the fund may terminate any repurchase agreements with that counterparty, determine the net amount owed, and sell or retain the collateral up to the net amount owed to the fund. Such action may be subject to legal proceedings, which may delay or limit the disposition of collateral.
5. Federal Income Taxes: The fund intends to continue to qualify as a regulated investment company and distribute all of its taxable income. Management has analyzed the fund’s tax positions taken for all open federal income tax years (September 30, 2012–2015), and has concluded that no provision for federal income tax is required in the fund’s financial statements.
6. Distributions: Distributions to shareholders are recorded on the ex-dividend date.
7. Securities Lending: To earn additional income, the fund lends its securities to qualified institutional borrowers. Security loans are required to be secured at all times by collateral in an amount at least equal to the market value of securities loaned. Daily market fluctuations could cause the value of loaned securities to be more or less than the value of the collateral received. When this occurs, the collateral is adjusted and settled on the next business day. The fund further mitigates its counterparty risk by entering into securities lending transactions only with a diverse group of prequalified counterparties, monitoring their financial strength, and entering into master securities lending agreements with its counterparties. The master securities lending agreements provide that, in the event of a counterparty’s default (including bankruptcy), the fund may terminate any loans with that borrower, determine the net amount owed, and sell or retain the collateral up to the net amount owed to the fund; however, such actions may be subject to legal proceedings. While collateral mitigates counterparty risk, in the absence of a default the fund may experience delays and costs in recovering the securities loaned. The fund invests cash collateral received in Vanguard Market Liquidity Fund, and records a liability in the Statement of Net Assets for the return of the collateral, during the period the securities are on loan. Securities lending income represents fees charged to borrowers plus income earned on invested cash collateral, less expenses associated with the loan.
8. Credit Facility: The fund and certain other funds managed by The Vanguard Group (“Vanguard”) participate in a $3 billion committed credit facility provided by a syndicate of lenders pursuant to a credit agreement that may be renewed annually; each fund is individually liable for its borrowings, if any, under the credit facility. Borrowings may be utilized for temporary and emergency purposes, and
24
Equity Income Fund
are subject to the fund’s regulatory and contractual borrowing restrictions. The participating funds are charged administrative fees and an annual commitment fee of 0.06% of the undrawn amount of the facility; these fees are allocated to the funds based on a method approved by the fund’s board of trustees and included in Management and Administrative expenses on the fund’s Statement of Operations. Any borrowings under this facility bear interest at a rate equal to the higher of the federal funds rate or LIBOR reference rate plus an agreed-upon spread.
The fund had no borrowings outstanding at September 30, 2015, or at any time during the period then ended.
9. Other: Dividend income is recorded on the ex-dividend date. Interest income includes income distributions received from Vanguard Market Liquidity Fund and is accrued daily. Premiums and discounts on debt securities purchased are amortized and accreted, respectively, to interest income over the lives of the respective securities. Security transactions are accounted for on the date securities are bought or sold. Costs used to determine realized gains (losses) on the sale of investment securities are those of the specific securities sold.
Each class of shares has equal rights as to assets and earnings, except that each class separately bears certain class-specific expenses related to maintenance of shareholder accounts (included in Management and Administrative expenses) and shareholder reporting. Marketing and distribution expenses are allocated to each class of shares based on a method approved by the board of trustees. Income, other non-class-specific expenses, and gains and losses on investments are allocated to each class of shares based on its relative net assets.
B. Wellington Management Company llp provides investment advisory services to a portion of the fund for a fee calculated at an annual percentage rate of average net assets managed by the advisor. The basic fee of Wellington Management Company llp is subject to quarterly adjustments based on performance relative to the FTSE High Dividend Yield Index for the preceding three years.
Vanguard provides investment advisory services to a portion of the fund as described below; the fund paid Vanguard advisory fees of $1,147,000 for the year ended September 30, 2015.
For the year ended September 30, 2015, the aggregate investment advisory fee represented an effective annual basic rate of 0.08% of the fund’s average net assets, before a decrease of $991,000 (0.01%) based on performance.
C. In accordance with the terms of a Funds’ Service Agreement (the “FSA”) between Vanguard and the fund, Vanguard furnishes to the fund investment advisory, corporate management, administrative, marketing, distribution and cash management services at Vanguard’s cost of operations (as defined by the FSA). These costs of operations are allocated to the fund based on methods and guidelines approved by the board of trustees. Vanguard does not require reimbursement in the current period for certain costs of operations (such as deferred compensation/benefits and risk/insurance costs); the fund’s liability for these costs of operations is included in Payables to Vanguard on the Statement of Net Assets.
Upon the request of Vanguard, the fund may invest up to 0.40% of its net assets as capital in Vanguard. At September 30, 2015, the fund had contributed to Vanguard capital in the amount of $1,631,000, representing 0.01% of the fund’s net assets and 0.65% of Vanguard’s capitalization. The fund’s trustees and officers are also directors and employees, respectively, of Vanguard.
25
Equity Income Fund
D. Various inputs may be used to determine the value of the fund’s investments. These inputs are summarized in three broad levels for financial statement purposes. The inputs or methodologies used to value securities are not necessarily an indication of the risk associated with investing in those securities.
Level 1—Quoted prices in active markets for identical securities.
Level 2—Other significant observable inputs (including quoted prices for similar securities, interest rates, prepayment speeds, credit risk, etc.).
Level 3—Significant unobservable inputs (including the fund’s own assumptions used to determine the fair value of investments).
The following table summarizes the market value of the fund’s investments as of September 30, 2015, based on the inputs used to value them:
| Level 1 | Level 2 | Level 3 | |
| Investments | ($000) | ($000) | ($000) |
| Common Stocks | 16,816,108 | 481,248 | — |
| Temporary Cash Investments | 174,132 | 363,697 | — |
| Futures Contracts—Assets1 | 2,077 | — | — |
| Total | 16,992,317 | 844,945 | — |
1 Represents variation margin on the last day of the reporting period.
E. At September 30, 2015, the aggregate settlement value of open futures contracts and the related unrealized appreciation (depreciation) were:
| ($000) | ||||
| Aggregate | ||||
| Number of | Settlement | Unrealized | ||
| Long (Short) | Value | Appreciation | ||
| Futures Contracts | Expiration | Contracts | Long (Short) | (Depreciation) |
| E-mini S&P 500 Index | December 2015 | 446 | 42,564 | (217) |
| S&P 500 Index | December 2015 | 204 | 97,344 | (1,805) |
| (2,022) |
Unrealized appreciation (depreciation) on open futures contracts is required to be treated as realized gain (loss) for tax purposes.
F. Distributions are determined on a tax basis and may differ from net investment income and realized capital gains for financial reporting purposes. Differences may be permanent or temporary. Permanent differences are reclassified among capital accounts in the financial statements to reflect their tax character. Temporary differences arise when certain items of income, expense, gain, or loss are recognized in different periods for financial statement and tax purposes. These differences will reverse at some time in the future. Differences in classification may also result from the treatment of short-term gains as ordinary income for tax purposes. The fund’s tax-basis capital gains and losses are determined only at the end of each fiscal year.
During the year ended September 30, 2015, the fund realized net foreign currency losses of $477,000, which decreased distributable net income for tax purposes; accordingly, such losses have been reclassified from accumulated net realized gains to overdistributed net investment income.
26
Equity Income Fund
The fund used a tax accounting practice to treat a portion of the price of capital shares redeemed during the year as distributions from realized capital gains. Accordingly, the fund has reclassified $86,187,000 from accumulated net realized gains to paid-in capital.
For tax purposes, at September 30, 2015, the fund had $148,224,000 of ordinary income and $466,551,000 of long-term capital gains available for distribution.
At September 30, 2015, the cost of investment securities for tax purposes was $15,563,864,000. Net unrealized appreciation of investment securities for tax purposes was $2,271,321,000, consisting of unrealized gains of $2,968,205,000 on securities that had risen in value since their purchase and $696,884,000 in unrealized losses on securities that had fallen in value since their purchase.
G. During the year ended September 30, 2015, the fund purchased $6,662,857,000 of investment securities and sold $5,866,061,000 of investment securities, other than temporary cash investments.
H. Capital share transactions for each class of shares were:
| Year Ended September 30, | ||||
| 2015 | 2014 | |||
| Amount | Shares | Amount | Shares | |
| ($000) | (000) | ($000) | (000) | |
| Investor Shares | ||||
| Issued | 1,014,630 | 32,639 | 1,351,608 | 44,836 |
| Issued in Lieu of Cash Distributions | 306,263 | 10,045 | 261,200 | 8,834 |
| Redeemed | (1,628,571) | (52,449) | (1,447,516) | (47,855) |
| Net Increase (Decrease)—Investor Shares | (307,678) | (9,765) | 165,292 | 5,815 |
| Admiral Shares | ||||
| Issued | 3,559,820 | 54,765 | 3,402,387 | 53,571 |
| Issued in Lieu of Cash Distributions | 672,092 | 10,525 | 490,387 | 7,895 |
| Redeemed | (2,506,524) | (38,575) | (1,735,964) | (27,436) |
| Net Increase (Decrease)—Admiral Shares | 1,725,388 | 26,715 | 2,156,810 | 34,030 |
I. Management has determined that no material events or transactions occurred subsequent to September 30, 2015, that would require recognition or disclosure in these financial statements.
27
Report of Independent Registered Public Accounting Firm
To the Board of Trustees of Vanguard Fenway Funds and the Shareholders of Vanguard Equity Income Fund:
In our opinion, the accompanying statement of net assets and the related statements of operations and of changes in net assets and the financial highlights present fairly, in all material respects, the financial position of Vanguard Equity Income Fund (constituting a separate portfolio of Vanguard Fenway Funds, hereafter referred to as the “Fund”) at September 30, 2015, the results of its operations for the year then ended, the changes in its net assets for each of the two years in the period then ended, and the financial highlights for each of the five years in the period then ended, in conformity with accounting principles generally accepted in the United States of America. These financial statements and financial highlights (hereafter referred to as “financial statements”) are the responsibility of the Fund’s management. Our responsibility is to express an opinion on these financial statements based on our audits. We conducted our audits of these financial statements in accordance with the standards of the Public Company Accounting Oversight Board (United States). Those standards require that we plan and perform the audit to obtain reasonable assurance about whether the financial statements are free of material misstatement. An audit includes examining, on a test basis, evidence supporting the amounts and disclosures in the financial statements, assessing the accounting principles used and significant estimates made by management, and evaluating the overall financial statement presentation. We believe that our audits, which included confirmation of securities at September 30, 2015 by correspondence with the custodian and brokers, by agreement to the underlying ownership records of the transfer agent and the application of alternative auditing procedures where securities purchased had not been received, provide a reasonable basis for our opinion.
/s/PricewaterhouseCoopers LLP
Philadelphia, Pennsylvania
November 10, 2015
| Special 2015 tax information (unaudited) for Vanguard Equity Income Fund |
| This information for the fiscal year ended September 30, 2015, is included pursuant to provisions of |
| the Internal Revenue Code. |
| The fund distributed $527,283,000 as capital gain dividends (20% rate gain distributions) to |
| shareholders during the fiscal year. |
| For nonresident alien shareholders, 100% of short-term capital gain dividends distributed by the fund |
| are qualified short-term capital gains. |
| The fund distributed $533,832,000 of qualified dividend income to shareholders during the fiscal year. |
| For corporate shareholders, 94.4% of investment income (dividend income plus short-term gains, |
| if any) qualifies for the dividends-received deduction. |
28
Your Fund’s After-Tax Returns
This table presents returns for your fund both before and after taxes. The after-tax returns are shown in two ways: (1) assuming that an investor owned the fund during the entire period and paid taxes on the fund’s distributions, and (2) assuming that an investor paid taxes on the fund’s distributions and sold all shares at the end of each period.
Calculations are based on the highest individual federal income tax and capital gains tax rates in effect at the times of the distributions and the hypothetical sales. State and local taxes were not considered. After-tax returns reflect any qualified dividend income, using actual prior-year figures and estimates for 2015. (In the example, returns after the sale of fund shares may be higher than those assuming no sale. This occurs when the sale would have produced a capital loss. The calculation assumes that the investor received a tax deduction for the loss.)
The table shows returns for Investor Shares only; returns for other share classes will differ. Please note that your actual after-tax returns will depend on your tax situation and may differ from those shown. Also note that if you own the fund in a tax-deferred account, such as an individual retirement account or a 401(k) plan, this information does not apply to you. Such accounts are not subject to current taxes.
Finally, keep in mind that a fund’s performance—whether before or after taxes—does not guarantee future results.
Average Annual Total Returns: Equity Income Fund Investor Shares
Periods Ended September 30, 2015
| One | Five | Ten | |
| Year | Years | Years | |
| Returns Before Taxes | -2.11% | 13.27% | 7.36% |
| Returns After Taxes on Distributions | -3.62 | 12.31 | 6.37 |
| Returns After Taxes on Distributions and Sale of Fund Shares | -0.11 | 10.63 | 5.93 |
29
About Your Fund’s Expenses
As a shareholder of the fund, you incur ongoing costs, which include costs for portfolio management, administrative services, and shareholder reports (like this one), among others. Operating expenses, which are deducted from a fund’s gross income, directly reduce the investment return of the fund.
A fund’s expenses are expressed as a percentage of its average net assets. This figure is known as the expense ratio. The following examples are intended to help you understand the ongoing costs (in dollars) of investing in your fund and to compare these costs with those of other mutual funds. The examples are based on an investment of $1,000 made at the beginning of the period shown and held for the entire period.
The accompanying table illustrates your fund’s costs in two ways:
• Based on actual fund return. This section helps you to estimate the actual expenses that you paid over the period. The ”Ending Account Value“ shown is derived from the fund‘s actual return, and the third column shows the dollar amount that would have been paid by an investor who started with $1,000 in the fund. You may use the information here, together with the amount you invested, to estimate the expenses that you paid over the period.
To do so, simply divide your account value by $1,000 (for example, an $8,600 account value divided by $1,000 = 8.6), then multiply the result by the number given for your fund under the heading ”Expenses Paid During Period.“
• Based on hypothetical 5% yearly return. This section is intended to help you compare your fund‘s costs with those of other mutual funds. It assumes that the fund had a yearly return of 5% before expenses, but that the expense ratio is unchanged. In this case—because the return used is not the fund’s actual return—the results do not apply to your investment. The example is useful in making comparisons because the Securities and Exchange Commission requires all mutual funds to calculate expenses based on a 5% return. You can assess your fund’s costs by comparing this hypothetical example with the hypothetical examples that appear in shareholder reports of other funds.
Note that the expenses shown in the table are meant to highlight and help you compare ongoing costs only and do not reflect transaction costs incurred by the fund for buying and selling securities. Further, the expenses do not include any purchase, redemption, or account service fees described in the fund prospectus. If such fees were applied to your account, your costs would be higher. Your fund does not carry a “sales load.”
The calculations assume no shares were bought or sold during the period. Your actual costs may have been higher or lower, depending on the amount of your investment and the timing of any purchases or redemptions.
You can find more information about the fund’s expenses, including annual expense ratios, in the Financial Statements section of this report. For additional information on operating expenses and other shareholder costs, please refer to your fund’s current prospectus.
30
| Six Months Ended September 30, 2015 | |||
| Beginning | Ending | Expenses | |
| Account Value | Account Value | Paid During | |
| Equity Income Fund | 3/31/2015 | 9/30/2015 | Period |
| Based on Actual Fund Return | |||
| Investor Shares | $1,000.00 | $941.85 | $1.22 |
| Admiral Shares | 1,000.00 | 942.16 | 0.78 |
| Based on Hypothetical 5% Yearly Return | |||
| Investor Shares | $1,000.00 | $1,023.82 | $1.27 |
| Admiral Shares | 1,000.00 | 1,024.27 | 0.81 |
The calculations are based on expenses incurred in the most recent six-month period. The fund’s annualized six-month expense ratios for that period are 0.25% for Investor Shares and 0.16% for Admiral Shares. The dollar amounts shown as “Expenses Paid” are equal to the annualized expense ratio multiplied by the average account value over the period, multiplied by the number of days in the most recent six-month period, then divided by the number of days in the most recent 12-month period (183/365).
31
Glossary
30-Day SEC Yield. A fund’s 30-day SEC yield is derived using a formula specified by the U.S. Securities and Exchange Commission. Under the formula, data related to the fund’s security holdings in the previous 30 days are used to calculate the fund’s hypothetical net income for that period, which is then annualized and divided by the fund’s estimated average net assets over the calculation period. For the purposes of this calculation, a security’s income is based on its current market yield to maturity (for bonds), its actual income (for asset-backed securities), or its projected dividend yield (for stocks). Because the SEC yield represents hypothetical annualized income, it will differ—at times significantly—from the fund’s actual experience. As a result, the fund’s income distributions may be higher or lower than implied by the SEC yield.
Beta. A measure of the magnitude of a fund’s past share-price fluctuations in relation to the ups and downs of a given market index. The index is assigned a beta of 1.00. Compared with a given index, a fund with a beta of 1.20 typically would have seen its share price rise or fall by 12% when the index rose or fell by 10%. For this report, beta is based on returns over the past 36 months for both the fund and the index. Note that a fund’s beta should be reviewed in conjunction with its R-squared (see definition). The lower the R-squared, the less correlation there is between the fund and the index, and the less reliable beta is as an indicator of volatility.
Dividend Yield. Dividend income earned by stocks, expressed as a percentage of the aggregate market value (or of net asset value, for a fund). The yield is determined by dividing the amount of the annual dividends by the aggregate value (or net asset value) at the end of the period. For a fund, the dividend yield is based solely on stock holdings and does not include any income produced by other investments.
Earnings Growth Rate. The average annual rate of growth in earnings over the past five years for the stocks now in a fund.
Equity Exposure. A measure that reflects a fund’s investments in stocks and stock futures. Any holdings in short-term reserves are excluded.
Expense Ratio. A fund’s total annual operating expenses expressed as a percentage of the fund’s average net assets. The expense ratio includes management and administrative expenses, but does not include the transaction costs of buying and selling portfolio securities.
Foreign Holdings. The percentage of a fund represented by securities or depositary receipts of companies based outside the United States.
Inception Date. The date on which the assets of a fund (or one of its share classes) are first invested in accordance with the fund’s investment objective. For funds with a subscription period, the inception date is the day after that period ends. Investment performance is measured from the inception date.
Median Market Cap. An indicator of the size of companies in which a fund invests; the midpoint of market capitalization (market price x shares outstanding) of a fund’s stocks, weighted by the proportion of the fund’s assets invested in each stock. Stocks representing half of the fund’s assets have market capitalizations above the median, and the rest are below it.
Price/Book Ratio. The share price of a stock divided by its net worth, or book value, per share. For a fund, the weighted average price/book ratio of the stocks it holds.
32
Price/Earnings Ratio. The ratio of a stock’s current price to its per-share earnings over the past year. For a fund, the weighted average P/E of the stocks it holds. P/E is an indicator of market expectations about corporate prospects; the higher the P/E, the greater the expectations for a company’s future growth.
R-Squared. A measure of how much of a fund’s past returns can be explained by the returns from the market in general, as measured by a given index. If a fund’s total returns were precisely synchronized with an index’s returns, its R-squared would be 1.00. If the fund’s returns bore no relationship to the index’s returns, its R-squared would be 0. For this report, R-squared is based on returns over the past 36 months for both the fund and the index.
Return on Equity. The annual average rate of return generated by a company during the past five years for each dollar of shareholder’s equity (net income divided by shareholder’s equity). For a fund, the weighted average return on equity for the companies whose stocks it holds.
Short-Term Reserves. The percentage of a fund invested in highly liquid, short-term securities that can be readily converted to cash.
Turnover Rate. An indication of the fund’s trading activity. Funds with high turnover rates incur higher transaction costs and may be more likely to distribute capital gains (which may be taxable to investors). The turnover rate excludes in-kind transactions, which have minimal impact on costs.
Benchmark Information
Spliced Equity Income Index: Russell 1000 Value Index through July 31, 2007; FTSE High Dividend Yield Index thereafter.
33
This page intentionally left blank.
This page intentionally left blank.
The People Who Govern Your Fund
The trustees of your mutual fund are there to see that the fund is operated and managed in your best interests since, as a shareholder, you are a part owner of the fund. Your fund’s trustees also serve on the board of directors of The Vanguard Group, Inc., which is owned by the Vanguard funds and provides services to them on an at-cost basis.
A majority of Vanguard’s board members are independent, meaning that they have no affiliation with Vanguard or the funds they oversee, apart from the sizable personal investments they have made as private individuals. The independent board members have distinguished backgrounds in business, academia, and public service. Each of the trustees and executive officers oversees 194 Vanguard funds.
The following table provides information for each trustee and executive officer of the fund. More information about the trustees is in the Statement of Additional Information, which can be obtained, without charge, by contacting Vanguard at 800-662-7447, or online at vanguard.com.
| InterestedTrustee1 | Rajiv L. Gupta |
| Born 1945. Trustee Since December 2001.2 Principal | |
| F. William McNabb III | Occupation(s) During the Past Five Years and Other |
| Born 1957. Trustee Since July 2009. Chairman of | Experience: Chairman and Chief Executive Officer |
| the Board. Principal Occupation(s) During the Past | (retired 2009) and President (2006–2008) of |
| Five Years and Other Experience: Chairman of the | Rohm and Haas Co. (chemicals); Director of Tyco |
| Board of The Vanguard Group, Inc., and of each of | International PLC (diversified manufacturing and |
| the investment companies served by The Vanguard | services), Hewlett-Packard Co. (electronic computer |
| Group, since January 2010; Director of The Vanguard | manufacturing), and Delphi Automotive PLC |
| Group since 2008; Chief Executive Officer and | (automotive components); Senior Advisor at New |
| President of The Vanguard Group, and of each of | Mountain Capital. |
| the investment companies served by The Vanguard | |
| Group, since 2008; Director of Vanguard Marketing | Amy Gutmann |
| Corporation; Managing Director of The Vanguard | Born 1949. Trustee Since June 2006. Principal |
| Group (1995–2008). | Occupation(s) During the Past Five Years and |
| Other Experience: President of the University of | |
| IndependentTrustees | Pennsylvania; Christopher H. Browne Distinguished |
| Professor of Political Science, School of Arts and | |
| Emerson U. Fullwood | Sciences, and Professor of Communication, Annenberg |
| Born 1948. Trustee Since January 2008. Principal | School for Communication, with secondary faculty |
| Occupation(s) During the Past Five Years and | appointments in the Department of Philosophy, School |
| Other Experience: Executive Chief Staff and | of Arts and Sciences, and at the Graduate School of |
| Marketing Officer for North America and Corporate | Education, University of Pennsylvania; Trustee of the |
| Vice President (retired 2008) of Xerox Corporation | National Constitution Center; Chair of the Presidential |
| (document management products and services); | Commission for the Study of Bioethical Issues. |
| Executive in Residence and 2009–2010 Distinguished | |
| Minett Professor at the Rochester Institute of | JoAnn Heffernan Heisen |
| Technology; Director of SPX Corporation (multi-industry | Born 1950. Trustee Since July 1998. Principal |
| manufacturing), the United Way of Rochester, | Occupation(s) During the Past Five Years and Other |
| Amerigroup Corporation (managed health care), the | Experience: Corporate Vice President and Chief |
| University of Rochester Medical Center, Monroe | Global Diversity Officer (retired 2008) and Member |
| Community College Foundation, and North Carolina | of the Executive Committee (1997–2008) of Johnson |
| A&T University. | & Johnson (pharmaceuticals/medical devices/ |
| consumer products); Director of Skytop Lodge | |
| Corporation (hotels), the University Medical Center | |
| at Princeton, the Robert Wood Johnson Foundation, | |
| and the Center for Talent Innovation; Member of | |
| the Advisory Board of the Institute for Women’s | |
| Leadership at Rutgers University. |
| F. Joseph Loughrey | Executive Officers | |
| Born 1949. Trustee Since October 2009. Principal | ||
| Occupation(s) During the Past Five Years and Other | Glenn Booraem | |
| Experience: President and Chief Operating Officer | Born 1967. Treasurer Since May 2015. Principal | |
| (retired 2009) of Cummins Inc. (industrial machinery); | Occupation(s) During the Past Five Years and | |
| Chairman of the Board of Hillenbrand, Inc. (specialized | Other Experience: Principal of The Vanguard Group, | |
| consumer services), and of Oxfam America; Director | Inc.; Treasurer of each of the investment companies | |
| of SKF AB (industrial machinery), Hyster-Yale Materials | served by The Vanguard Group; Controller of each of | |
| Handling, Inc. (forklift trucks), the Lumina Foundation | the investment companies served by The Vanguard | |
| for Education, and the V Foundation for Cancer | Group (2010–2015); Assistant Controller of each of | |
| Research; Member of the Advisory Council for the | the investment companies served by The Vanguard | |
| College of Arts and Letters and of the Advisory Board | Group (2001–2010). | |
| to the Kellogg Institute for International Studies, both | ||
| at the University of Notre Dame. | Thomas J. Higgins | |
| Born 1957. Chief Financial Officer Since September | ||
| Mark Loughridge | 2008. Principal Occupation(s) During the Past Five | |
| Born 1953. Trustee Since March 2012. Principal | Years and Other Experience: Principal of The Vanguard | |
| Occupation(s) During the Past Five Years and Other | Group, Inc.; Chief Financial Officer of each of the | |
| Experience: Senior Vice President and Chief Financial | investment companies served by The Vanguard Group; | |
| Officer (retired 2013) at IBM (information technology | Treasurer of each of the investment companies served | |
| services); Fiduciary Member of IBM’s Retirement Plan | by The Vanguard Group (1998–2008). | |
| Committee (2004–2013); Director of the Dow Chemical | ||
| Company; Member of the Council on Chicago Booth. | Peter Mahoney | |
| Born 1974. Controller Since May 2015. Principal | ||
| Scott C. Malpass | Occupation(s) During the Past Five Years and | |
| Born 1962. Trustee Since March 2012. Principal | Other Experience: Head of Global Fund Accounting | |
| Occupation(s) During the Past Five Years and Other | at The Vanguard Group, Inc.; Controller of each of the | |
| Experience: Chief Investment Officer and Vice | investment companies served by The Vanguard Group; | |
| President at the University of Notre Dame; Assistant | Head of International Fund Services at The Vanguard | |
| Professor of Finance at the Mendoza College of | Group (2008–2014). | |
| Business at Notre Dame; Member of the Notre Dame | ||
| 403(b) Investment Committee; Board Member of | Heidi Stam | |
| TIFF Advisory Services, Inc., and Catholic Investment | Born 1956. Secretary Since July 2005. Principal | |
| Services, Inc. (investment advisors); Member of | Occupation(s) During the Past Five Years and Other | |
| the Investment Advisory Committee of Major | Experience: Managing Director of The Vanguard | |
| League Baseball. | Group, Inc.; General Counsel of The Vanguard Group; | |
| Secretary of The Vanguard Group and of each of the | ||
| André F. Perold | investment companies served by The Vanguard Group; | |
| Born 1952. Trustee Since December 2004. Principal | Director and Senior Vice President of Vanguard | |
| Occupation(s) During the Past Five Years and Other | Marketing Corporation. | |
| Experience: George Gund Professor of Finance and | ||
| Banking, Emeritus at the Harvard Business School | Vanguard Senior ManagementTeam | |
| (retired 2011); Chief Investment Officer and Managing | ||
| Partner of HighVista Strategies LLC (private investment | Mortimer J. Buckley | Chris D. McIsaac |
| firm); Director of Rand Merchant Bank; Overseer of | Kathleen C. Gubanich | James M. Norris |
| the Museum of Fine Arts Boston. | Paul A. Heller | Thomas M. Rampulla |
| Martha G. King | Glenn W. Reed | |
| Peter F. Volanakis | John T. Marcante | Karin A. Risi |
| Born 1955. Trustee Since July 2009. Principal | ||
| Occupation(s) During the Past Five Years and Other | Chairman Emeritus and Senior Advisor | |
| Experience: President and Chief Operating Officer | ||
| (retired 2010) of Corning Incorporated (communications | John J. Brennan | |
| equipment); Trustee of Colby-Sawyer College; | Chairman, 1996–2009 | |
| Member of the Advisory Board of the Norris Cotton | Chief Executive Officer and President, 1996–2008 | |
| Cancer Center and of the Advisory Board of the | ||
| Parthenon Group (strategy consulting). | Founder | |
| John C. Bogle | ||
| Chairman and Chief Executive Officer, 1974–1996 | ||
1 Mr. McNabb is considered an “interested person,” as defined in the Investment Company Act of 1940, because he is an officer of the Vanguard funds.
2 December 2002 for Vanguard Equity Income Fund, the Vanguard Municipal Bond Funds, and the Vanguard State Tax-Exempt Funds.
 | |
| P.O. Box 2600 | |
| Valley Forge, PA 19482-2600 |
Connect with Vanguard® > vanguard.com
| Fund Information > 800-662-7447 | CFA® is a registered trademark owned by CFA Institute. |
| Direct Investor Account Services > 800-662-2739 | |
| Institutional Investor Services > 800-523-1036 | |
| Text Telephone for People | |
| Who Are Deaf or Hard of Hearing> 800-749-7273 | |
| This material may be used in conjunction | |
| with the offering of shares of any Vanguard | |
| fund only if preceded or accompanied by | |
| the fund’s current prospectus. | |
| All comparative mutual fund data are from Lipper, a | |
| Thomson Reuters Company, or Morningstar, Inc., unless | |
| otherwise noted. | |
| You can obtain a free copy of Vanguard’s proxy voting | |
| guidelines by visiting vanguard.com/proxyreporting or by | |
| calling Vanguard at 800-662-2739. The guidelines are | |
| also available from the SEC’s website, sec.gov. In | |
| addition, you may obtain a free report on how your fund | |
| voted the proxies for securities it owned during the 12 | |
| months ended June 30. To get the report, visit either | |
| vanguard.com/proxyreporting or sec.gov. | |
| You can review and copy information about your fund at | |
| the SEC’s Public Reference Room in Washington, D.C. To | |
| find out more about this public service, call the SEC at | |
| 202-551-8090. Information about your fund is also | |
| available on the SEC’s website, and you can receive | |
| copies of this information, for a fee, by sending a | |
| request in either of two ways: via email addressed to | |
| publicinfo@sec.gov or via regular mail addressed to the | |
| Public Reference Section, Securities and Exchange | |
| Commission, Washington, DC 20549-1520. | |
| © 2015 The Vanguard Group, Inc. | |
| All rights reserved. | |
| Vanguard Marketing Corporation, Distributor. | |
| Q650 112015 | |
Annual Report | September 30, 2015
Vanguard PRIMECAP Core Fund
Vanguard’s Principles for Investing Success
We want to give you the best chance of investment success. These principles, grounded in Vanguard’s research and experience, can put you on the right path.
Goals. Create clear, appropriate investment goals.
Balance. Develop a suitable asset allocation using broadly diversified funds.
Cost. Minimize cost.
Discipline. Maintain perspective and long-term discipline.
A single theme unites these principles: Focus on the things you can control.
We believe there is no wiser course for any investor.
| Contents | |
| Your Fund’s Total Returns. | 1 |
| Chairman’s Letter. | 2 |
| Advisor’s Report. | 9 |
| Fund Profile. | 12 |
| Performance Summary. | 13 |
| Financial Statements. | 15 |
| Your Fund’s After-Tax Returns. | 25 |
| About Your Fund’s Expenses. | 26 |
| Glossary. | 28 |
Please note: The opinions expressed in this report are just that—informed opinions. They should not be considered promises or advice.
Also, please keep in mind that the information and opinions cover the period through the date on the front of this report. Of course, the risks of investing in your fund are spelled out in the prospectus.
See the Glossary for definitions of investment terms used in this report.
About the cover: Pictured is a sailing block on the Brilliant, a 1932 schooner docked in Mystic, Connecticut. A type of pulley, the sailing block helps coordinate the setting of the sails. At Vanguard, the intricate coordination of technology and people allows us to help millions of clients around the world reach their financial goals.
| Your Fund’s Total Returns | ||||
| Fiscal Year Ended September 30, 2015 | ||||
| Total | ||||
| Returns | ||||
| Vanguard PRIMECAP Core Fund | -0.73% | |||
| MSCI US Prime Market 750 Index | -0.36 | |||
| Multi-Cap Core Funds Average | -2.37 | |||
| Multi-Cap Core Funds Average: Derived from data provided by Lipper, a Thomson Reuters Company. | ||||
| Your Fund’s Performance at a Glance | ||||
| September 30, 2014, Through September 30, 2015 | ||||
| Distributions Per Share | ||||
| Starting | Ending | |||
| Share | Share | Income | Capital | |
| Price | Price | Dividends | Gains | |
| Vanguard PRIMECAP Core Fund | $21.87 | $20.26 | $0.270 | $1.297 |
1

Chairman’s Letter
Dear Shareholder,
Vanguard PRIMECAP Core Fund couldn’t escape the broad market downdraft that occurred late in the fiscal year ended September 30, 2015. Although the fund isn’t closely aligned with its benchmark or the broad U.S. stock market, their performances were similar.
Over the 12 months, the PRIMECAP Core Fund returned –0.73%, slightly behind its benchmark and the broad U.S. stock market but a bit ahead of its multi-capitalization core fund peers.
Health care and technology holdings, which have frequently powered the fund’s outperformance, struggled. The consumer discretionary sector stood out.
If you hold fund shares in a taxable account, you may wish to review the table of after-tax returns, based on the highest federal income tax bracket, that appears later in this report.
China’s economic woes weighed on U.S. stocks
The broad U.S. stock market returned –0.49% for the 12 months. The final two months were especially rocky as investors worried in particular about the global ripple effects of slower economic growth in China.
For much of the fiscal year, investors were preoccupied with the possibility of an increase in short-term interest rates.
2
On September 17, the Federal Reserve announced that it would hold rates steady for the time being, a decision that to some investors indicated the Fed’s concern about the fragility of global markets.
International stocks returned about –11%, as the dollar’s strength against many foreign currencies weighed on results. Returns for emerging markets, which were especially hard hit by concerns about China, trailed those of the developed markets of the Pacific region and Europe.
Taxable bonds recorded gains as investors searched for safety
The broad U.S. taxable bond market returned 2.94% as investors gravitated toward safe-haven assets amid global stock market turmoil. Stimulative monetary policies from the world’s central banks, declining inflation expectations, and global investors’ search for higher yields also helped lift U.S. bonds.
The yield of the 10-year Treasury note ended September at 2.05%, down from 2.48% a year earlier. (Bond prices and yields move in opposite directions.)
International bond markets (as measured by the Barclays Global Aggregate Index ex USD) returned –7.67%, hurt by the dollar’s strength. Without this currency effect, international bonds advanced modestly.
The Fed’s 0%–0.25% target for short-term interest rates continued to limit returns for money market funds and savings accounts.
| Market Barometer | |||
| Average Annual Total Returns | |||
| Periods Ended September 30, 2015 | |||
| One | Three | Five | |
| Year | Years | Years | |
| Stocks | |||
| Russell 1000 Index (Large-caps) | -0.61% | 12.66% | 13.42% |
| Russell 2000 Index (Small-caps) | 1.25 | 11.02 | 11.73 |
| Russell 3000 Index (Broad U.S. market) | -0.49 | 12.53 | 13.28 |
| FTSE All-World ex US Index (International) | -11.34 | 2.87 | 2.19 |
| Bonds | |||
| Barclays U.S. Aggregate Bond Index (Broad taxable market) | 2.94% | 1.71% | 3.10% |
| Barclays Municipal Bond Index (Broad tax-exempt market) | 3.16 | 2.88 | 4.14 |
| Citigroup Three-Month U.S. Treasury Bill Index | 0.02 | 0.02 | 0.04 |
| CPI | |||
| Consumer Price Index | -0.04% | 0.93% | 1.73% |
3
Health care and IT stocks stumbled, but consumer discretionary thrived
Since its inception in 2004, the PRIMECAP Core Fund has outpaced its comparative standards by a notable margin. But that successful long-term record inevitably included some shortfalls along the way. Because the fund’s holdings have not traditionally resembled those of its benchmark, it’s possible for the fund to trail or trump its comparative standards.
PRIMECAP Management Company, the fund’s advisor, invests in undervalued growth companies that have been unappreciated, ignored, or cast aside by the marketplace. The stocks of these companies may languish or lag before being recognized. This approach requires conviction and patience from the advisor and also from the fund’s shareholders, who need to be willing to endure periods of disappointment to reap the potential benefits of long-term outperformance.
Using a rigorous screening process, PRIMECAP Management identifies and then invests in companies until they no longer fundamentally fit the portfolio and their valuations or business models have changed.
The PRIMECAP Core Fund’s combined exposure to health care and information technology approached 60%. The advisor’s holdings in both sectors detracted from performance, because of stocks the fund owned as well as those it didn’t.
| Expense Ratios | ||
| Your Fund Compared With Its Peer Group | ||
| Peer Group | ||
| Fund | Average | |
| PRIMECAP Core Fund | 0.50% | 1.21% |
The fund expense ratio shown is from the prospectus dated January 27, 2015, and represents estimated costs for the current fiscal year. For the fiscal year ended September 30, 2015, the fund’s expense ratio was 0.47%. The peer-group expense ratio is derived from data provided by Lipper, a Thomson Reuters Company, and captures information through year-end 2014.
Peer group: Multi-Cap Core Funds.
4
The fund’s health care stocks returned less than 2%, compared with about 6% for those held by the benchmark. Although PRIMECAP Core’s pharmaceutical stocks performed reasonably well, they couldn’t offset weakness in biotechnology stocks, some of which were hurt by significant product price increases. The fund also lacked investments in thriving managed-care companies.
Information technology also disappointed. The fund’s IT stocks declined about 5%, compared with an increase of about 2% for those in the benchmark. Most of the performance gap was evident in the hardware industry, where the stragglers outnumbered the stars; the fund owned most of the stragglers. Success in software was offset by weakness in communications equipment and IT services.
On a brighter note, the PRIMECAP Core Fund’s consumer discretionary holdings significantly boosted performance, climbing nearly 21% versus about 12% for those in the benchmark. Most of the strength was concentrated among a small group of apparel retailers and household appliance companies.
The fund’s industrial and financial stocks outpaced those of the benchmark but didn’t help the portfolio much. Energy holdings slid as low oil prices continued to hinder the sector, but the small allocation cushioned the fund from significant damage.
| Total Returns | |
| Ten Years Ended September 30, 2015 | |
| Average | |
| Annual Return | |
| PRIMECAP Core Fund | 8.91% |
| MSCI US Prime Market 750 Index | 7.09 |
| Multi-Cap Core Funds Average | 5.59 |
| Multi-Cap Core Funds Average: Derived from data provided by Lipper, a Thomson Reuters Company. | |
The figures shown represent past performance, which is not a guarantee of future results. (Current performance may be lower or higher than the performance data cited. For performance data current to the most recent month-end, visit our website at vanguard.com/performance.) Note, too, that both investment returns and principal value can fluctuate widely, so an investor’s shares, when sold, could be worth more or less than their original cost.
5
| Staying the course can help you stay closer to your fund’s return |
| When stock markets are highly volatile, as in recent months, it’s tempting to run for cover. |
| But the price of panic can be high. |
| A rough measure of what can be lost from attempts to time the market is the difference |
| between the returns produced by a fund and the returns earned by the fund’s investors. |
| The results shown in the Performance Summary later in this report are your fund’s time- |
| weighted returns—the average annual returns investors would have earned if they had invested |
| a lump sum in the fund at the start of the period and reinvested any distributions they received. |
| Their actual returns, however, depend on whether they subsequently bought or sold any shares. |
| There’s often a gap between this dollar-weighted return for investors and the fund’s time- |
| weighted return, as shown below. |
| Many sensible investment behaviors can contribute to the difference in returns, but industry |
| cash flow data suggest that one important factor is the generally counterproductive effort to |
| buy and sell at the “right” time. Keeping your emotions in check can help narrow the gap. |
| Mutual fund returns and investor returns over the last decade |

| Average fund return |
| Average investor return |
| Notes: Data are as of December 31, 2014. The average fund returns and average investor returns are from Morningstar. The average |
| fund returns are the average of the funds’ time-weighted returns in each category. The average investor returns assume that the growth |
| of a fund’s total net assets for a given period is driven by market returns and investor cash ow. To calculate investor return, a fund’s |
| change in assets for the period is discounted by the return of the fund to isolate how much of the asset growth was driven by cash ow. |
| A model, similar to an internal rate-of-return calculation, is then used to calculate a constant growth rate that links the beginning total |
| net assets and periodic cash ows to the ending total net assets. |
| Sources: Vanguard and Morningstar, Inc. |
6
For more about the advisor’s strategy and the fund’s positioning during the 12 months, please see the Advisor’s Report that follows this letter.
The advisor’s patience and focus helped lift results over a decade
Both the PRIMECAP Core Fund’s performance over the past decade and its path to that performance can be traced to the advisor’s strategy of investing with conviction and a long-term lens.
At times during the ten years ended September 30, 2015, some of the fund’s stock holdings and sector allocations appeared out of sync with market trends and investor sentiment. During one long stretch—in each fiscal year from 2010 through 2012—the fund lagged one or both of its comparative standards.
But for the period overall, PRIMECAP Management’s steadfast approach helped the fund register an average annual return of 8.91%, almost 2 percentage points ahead of its market benchmark and more than 3 percentage points higher than its peer-fund average.
The fund’s shareholders have benefited from the advisor’s experience and skill, along with the fund’s low costs, which allow shareholders to keep more of the returns on their investment.
A dose of discipline is crucial when markets become volatile
Although the broad U.S. stock market has posted gains for six straight calendar years—from 2009 to 2014—that streak may not last a seventh. Stocks tumbled in August and swung up and down in September.
Nobody can control the direction of the markets or reliably predict where they’ll go in the short term. However, investors can control how they react to unstable and turbulent markets.
During periods of market adversity, it’s more important than ever to keep sight of one of Vanguard’s key principles: Maintain perspective and long-term discipline. Whether you’re investing for yourself or on behalf of clients, your success is affected greatly by how you respond—or don’t respond—during turbulent markets. (You can read Vanguard’s Principles for Investing Success at vanguard.com/research.)
As I’ve written in the past, the best course for long-term investors is generally to ignore daily market moves and not make decisions based on emotion. (See the box on page 6 for more discussion on the benefit of staying the course.) This is also a good time to evaluate your portfolio
7
and make sure your asset allocation is aligned with your time horizon, goals, and risk tolerance.
The markets are unpredictable and often confounding. Keeping your long-term plans clearly in focus can be key as you weather these periodic storms.
As always, thank you for investing with Vanguard.
Sincerely,

F. William McNabb III
Chairman and Chief Executive Officer
October 16, 2015
8
Advisor’s Report
For the fiscal year ended September 30, 2015, Vanguard PRIMECAP Core Fund returned –0.73%, trailing both the –0.36% return of its fund’s benchmark, the unmanaged MSCI US Prime Market 750 Index, and the –0.61% return of the unmanaged Standard & Poor’s 500 Index. The fund exceeded the –2.37% average return of its multi-capitalization core fund competitors.
Relative to the S&P 500 Index, favorable sector allocations, including an underweight position in energy and overweight positions in health care and information technology, were roughly offset by unfavorable stock selection in those sectors.
The investment environment
Despite a record close on May 21, 2015, the S&P 500 Index delivered a slightly negative total return, as global growth concerns weighed on equity values late in the fiscal year.
The U.S. economy expanded at a modest pace, as real GDP growth averaged approximately 2% during the three quarters ended June 30. The labor market continued to improve, with the unemployment rate declining to 5.1% at the end of September. Monetary policy remained highly accommodative, as the Federal Reserve maintained its 0%–0.25% target for the federal funds rate. The dollar appreciated significantly, driven by the relative strength of the U.S. economy. The price of West Texas Intermediate crude oil declined by approximately 50%.
Concerns about China’s economic health intensified as the year progressed. The Shanghai Stock Exchange Composite Index experienced significant volatility, which reverberated across global financial markets. U.S. investors tried to assess the impact a slowing Chinese economy may have on the domestic economic recovery.
Outlook for U.S. equities
We find U.S. equities to be fairly valued at current levels. As of September 30, the S&P 500 Index was trading at approximately 16 times the next 12 months’ earnings, a reasonable valuation by historical standards, though the index appears more expensive on a price/sales ratio basis because profit margins are near all-time highs. We continue to believe that many individual stocks are attractively valued and that stocks represent a more attractive investment than bonds at current prices.
Portfolio update and outlook
For the 12 months, the portfolio was overweighted in information technology, health care, and industrial stocks. These sectors constituted 75% of the fund’s holdings on average (compared with a 45% combined average weighting in the S&P 500 Index).
Favorable sector allocations, notably in energy (underweight), health care (overweight), and information technology (overweight), were mostly offset by unfavorable stock selection. Negative stock selection, primarily in information technology, health care, and energy, more
9
than offset positive stock selection, primarily in industrials and consumer discretionary.
Unfavorable stock selection in information technology was driven by SanDisk (–44%), NetApp (–30%), and Hewlett-Packard (–26%) and by the fund’s underweight position in Apple (+11%). In health care, unfavorable selection was driven by Biogen (–12%) and Roche (–8%) and by not owning managed care companies, which performed well. In energy, unfavorable selection was led by Transocean (–56%). In industrials, Southwest Airlines (+13%) and Delta Air Lines (+25%) drove most of the outperformance. The largest positive contributors in consumer discretionary were L Brands (+41%), CarMax (+28%), Sony (+36%), Carnival (+27%), and TJX (+22%).
Energy
The fund remains significantly under-weighted in energy, which was the worst-performing sector in the S&P 500 Index over the 12 months. We cannot predict the direction of oil prices with any certainty, but we believe that technological innovation may exert downward pressure over the long term. Advancements such as hydraulic fracturing may continue to lower the cost of production, while new technologies such as vehicle electrification may reduce future demand.
We have found few compelling investments within the sector, as the valuations of many companies would require a rebound in oil prices to be attractive.
Although such a scenario is possible, we do not want to invest with a thesis predicated on higher oil prices. Oil prices also have an impact on our investments outside of the sector. We believe that certain holdings, such as airlines (overweight) and cruise lines (overweight), may continue to benefit from lower input costs if current oil prices persist, while others, such as some industrial companies, may continue to face weaker demand from energy-related customers.
Industrials
In industrials, we continue to find our investments in airlines attractive. The industry has consolidated significantly, and the four largest airlines now control over 80% of total capacity. Management teams are increasingly focused on generating adequate returns on capital rather than chasing unprofitable market share. Domestic capacity has been reduced since 2007, and utilization is high. In light of these industry dynamics, strong free cash flow, and low valuation multiples, we remain overweighted in airlines.
Information technology
We believe that our information technology holdings represent compelling investments. A major technological shift is under way as software, storage, and computer power continue to move to the internet-based “cloud.” This shift is helping enable new “big data” and mobility applications while increasing demand for certain types of storage and processing infrastructure. Although these trends have mixed implications for some holdings with legacy
10
technology, these companies’ strong competitive positions, cash-rich balance sheets, and healthy cash flow generation allow them to invest ample resources in cloud-based offerings. We believe the low valuation multiples assigned to many of these stocks more than adequately reflect the risks associated with this transition.
Health care
Although health care stock selection has been a significant detractor over the last 12 months, we feel that the industry’s long-term outlook remains favorable. Increasing demand for health care products will be driven by demographic trends as well as the industry’s ability to develop more effective therapies. The pipeline includes promising treatments for cancer, Alzheimer’s, and autoimmune diseases. In addition, the reduced cost of genetic sequencing may result in breakthroughs in drug development. With the recent pullback in health care stocks, valuations of large-cap biotechnology and pharmaceutical companies are reasonable, with some trading at a discount to the S&P 500 price/earnings multiple in spite of their superior growth profiles.
Tempering our positive outlook is the nearer-term uncertainty over reimbursement and pricing. Earlier this year, pharmacy benefit managers extracted higher-than-expected pricing concessions from AbbVie and Gilead as the firms competed for market share with their new hepatitis C drugs. Presidential candidate Hillary Clinton’s recent proposal to reduce prescription drug costs has again raised the specter of government-negotiated or mandated pricing. Although we are mindful of these potential negatives, we believe that companies with novel drug treatments that provide significant benefits over existing therapies will continue to receive favorable reimbursement from payors.
Conclusion
We remain committed to our investment philosophy, which is to invest in attractively priced stocks for the long term. This “bottom-up” approach often results in a portfolio that bears little resemblance to a market index; therefore, our results often deviate substantially from those of the index. Furthermore, our long-term investment horizon results in low portfolio turnover, which creates the possibility of extended periods of underperformance when the stocks in our portfolio fall out of favor. We nonetheless believe that this approach can generate superior results for shareholders over the long term.
PRIMECAP Management Company
October 14, 2015
11
PRIMECAP Core Fund
Fund Profile
As of September 30, 2015
| Portfolio Characteristics | |||
| DJ | |||
| U.S. | |||
| MSCI US | Total | ||
| Prime | Market | ||
| Market | FA | ||
| Fund | 750 Index | Index | |
| Number of Stocks | 149 | 747 | 4,000 |
| Median Market Cap | $48.7B | $63.3B | $46.5B |
| Price/Earnings Ratio | 20.6x | 19.5x | 20.2x |
| Price/Book Ratio | 3.5x | 2.6x | 2.5x |
| Return on Equity | 18.2% | 18.0% | 17.2% |
| Earnings Growth | |||
| Rate | 9.5% | 10.0% | 10.1% |
| Dividend Yield | 1.9% | 2.2% | 2.1% |
| Foreign Holdings | 12.5% | 0.0% | 0.0% |
| Turnover Rate | 10% | — | — |
| Ticker Symbol | VPCCX | — | — |
| Expense Ratio1 | 0.50% | — | — |
| 30-Day SEC Yield | 1.35% | — | — |
| Short-Term Reserves | 5.2% | — | — |
| Sector Diversification (% of equity exposure) | |||
| DJ | |||
| U.S. | |||
| MSCI US | Total | ||
| Prime | Market | ||
| Market | FA | ||
| Fund | 750 Index | Index | |
| Consumer Discretionary 12.5% | 13.7% | 13.7% | |
| Consumer Staples | 0.9 | 9.5 | 8.7 |
| Energy | 1.4 | 6.7 | 6.3 |
| Financials | 7.2 | 16.7 | 18.3 |
| Health Care | 29.3 | 14.5 | 14.4 |
| Industrials | 17.9 | 10.3 | 10.6 |
| Information Technology | 27.3 | 20.1 | 19.6 |
| Materials | 2.8 | 3.0 | 3.1 |
| Telecommunication | |||
| Services | 0.7 | 2.4 | 2.1 |
| Utilities | 0.0 | 3.1 | 3.2 |
| Volatility Measures | ||
| DJ | ||
| MSCI US | U.S. Total | |
| Prime Market | Market | |
| 750 Index | FA Index | |
| R-Squared | 0.91 | 0.91 |
| Beta | 0.94 | 0.92 |
These measures show the degree and timing of the fund’s fluctuations compared with the indexes over 36 months.
| Ten Largest Holdings (% of total net assets) | ||
| Eli Lilly & Co. | Pharmaceuticals | 5.1% |
| Southwest Airlines Co. | Airlines | 4.9 |
| Amgen Inc. | Biotechnology | 4.7 |
| Roche Holding AG | Pharmaceuticals | 4.1 |
| Biogen Inc. | Biotechnology | 3.6 |
| Google Inc. | Internet Software & | |
| Services | 3.4 | |
| Texas Instruments Inc. | Semiconductors | 2.8 |
| L Brands Inc. | Apparel Retail | 2.1 |
| Novartis AG | Pharmaceuticals | 2.1 |
| Johnson & Johnson | Pharmaceuticals | 2.1 |
| Top Ten | 34.9% | |
The holdings listed exclude any temporary cash investments and equity index products.
Investment Focus

1 The expense ratio shown is from the prospectus dated January 27, 2015, and represents estimated costs for the current fiscal year. For the fiscal year ended September 30, 2015, the expense ratio was 0.47%.
12
PRIMECAP Core Fund
Performance Summary
All of the returns in this report represent past performance, which is not a guarantee of future results that may be achieved by the fund. (Current performance may be lower or higher than the performance data cited. For performance data current to the most recent month-end, visit our website at vanguard.com/performance.) Note, too, that both investment returns and principal value can fluctuate widely, so an investor’s shares, when sold, could be worth more or less than their original cost. The returns shown do not reflect taxes that a shareholder would pay on fund distributions or on the sale of fund shares.
Cumulative Performance: September 30, 2005, Through September 30, 2015
Initial Investment of $10,000

| Average Annual Total Returns | ||||
| Periods Ended September 30, 2015 | ||||
| Final Value | ||||
| One | Five | Ten | of a $10,000 | |
| Year | Years | Years | Investment | |
| PRIMECAP Core Fund* | -0.73% | 13.94% | 8.91% | $23,473 |
| MSCI US Prime Market 750 Index | -0.36 | 13.44 | 7.09 | 19,845 |
| Multi-Cap Core Funds Average | -2.37 | 10.93 | 5.59 | 17,234 |
| Dow Jones U.S. Total Stock Market | ||||
| Float Adjusted Index | -0.55 | 13.26 | 7.06 | 19,778 |
Multi-Cap Core Funds Average: Derived from data provided by Lipper, a Thomson Reuters Company.
See Financial Highlights for dividend and capital gains information.
13
PRIMECAP Core Fund
Fiscal-Year Total Returns (%): September 30, 2005, Through September 30, 2015
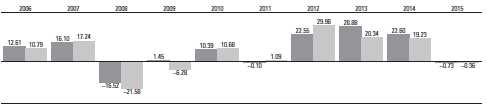
| PRIMECAP Core Fund |
| MSCI US Prime Market 750 Index |
14
PRIMECAP Core Fund
Financial Statements
Statement of Net Assets
As of September 30, 2015
The fund reports a complete list of its holdings in regulatory filings four times in each fiscal year, at the quarter-ends. For the second and fourth fiscal quarters, the lists appear in the fund’s semiannual and annual reports to shareholders. For the first and third fiscal quarters, the fund files the lists with the Securities and Exchange Commission on Form N-Q. Shareholders can look up the fund’s Forms N-Q on the SEC’s website at sec.gov. Forms N-Q may also be reviewed and copied at the SEC’s Public Reference Room (see the back cover of this report for further information).
| Market | |||
| Value• | |||
| Shares | ($000) | ||
| Common Stocks (95.0%) | |||
| Consumer Discretionary (11.9%) | |||
| L Brands Inc. | 1,649,454 | 148,665 | |
| * | CarMax Inc. | 1,811,400 | 107,452 |
| TJX Cos. Inc. | 1,425,000 | 101,773 | |
| * | Sony Corp. ADR | 3,455,500 | 84,660 |
| Carnival Corp. | 1,624,300 | 80,728 | |
| Walt Disney Co. | 750,000 | 76,650 | |
| Ross Stores Inc. | 1,015,900 | 49,241 | |
| Gildan Activewear Inc. | |||
| Class A | 953,900 | 28,770 | |
| Tribune Media Co. Class A | 803,500 | 28,605 | |
| Las Vegas Sands Corp. | 610,000 | 23,162 | |
| * | Bed Bath & Beyond Inc. | 337,491 | 19,244 |
| VF Corp. | 223,380 | 15,237 | |
| * | Amazon.com Inc. | 23,545 | 12,052 |
| Garmin Ltd. | 325,000 | 11,661 | |
| * | Urban Outfitters Inc. | 340,700 | 10,010 |
| Time Warner Cable Inc. | 50,000 | 8,968 | |
| * | Norwegian Cruise Line | ||
| Holdings Ltd. | 91,700 | 5,254 | |
| Royal Caribbean Cruises Ltd. | 42,000 | 3,742 | |
| Comcast Corp. Class A | 35,100 | 1,996 | |
| Newell Rubbermaid Inc. | 50,000 | 1,985 | |
| 819,855 | |||
| Consumer Staples (0.8%) | |||
| CVS Health Corp. | 302,377 | 29,173 | |
| PepsiCo Inc. | 300,000 | 28,290 | |
| 57,463 | |||
| Energy (1.3%) | |||
| Schlumberger Ltd. | 454,300 | 31,333 | |
| ^ | Transocean Ltd. | 1,408,300 | 18,195 |
| EOG Resources Inc. | 133,000 | 9,682 | |
| Cabot Oil & Gas Corp. | 425,000 | 9,291 | |
| National Oilwell Varco Inc. | 243,200 | 9,157 | |
| * | Southwestern Energy Co. | 609,300 | 7,732 |
| Exxon Mobil Corp. | 46,012 | 3,421 | |
| * | Cameron | ||
| International Corp. | 25,300 | 1,551 | |
| Market | |||
| Value• | |||
| Shares | ($000) | ||
| Encana Corp. | 60,000 | 386 | |
| * | Petroleo Brasileiro | ||
| SA ADR Type A | 75,000 | 276 | |
| Frank’s International NV | 10,000 | 153 | |
| * | Petroleo Brasileiro SA ADR | 30,000 | 131 |
| 91,308 | |||
| Financials (6.9%) | |||
| Marsh & McLennan | |||
| Cos. Inc. | 2,087,875 | 109,029 | |
| Charles Schwab Corp. | 3,729,511 | 106,515 | |
| JPMorgan Chase & Co. | 1,713,473 | 104,470 | |
| Wells Fargo & Co. | 1,202,000 | 61,723 | |
| Progressive Corp. | 1,174,800 | 35,996 | |
| US Bancorp | 628,000 | 25,754 | |
| Chubb Corp. | 131,800 | 16,165 | |
| Discover Financial | |||
| Services | 143,000 | 7,435 | |
| American Express Co. | 51,000 | 3,781 | |
| CME Group Inc. | 39,700 | 3,682 | |
| Comerica Inc. | 35,000 | 1,438 | |
| 475,988 | |||
| Health Care (27.9%) | |||
| Eli Lilly & Co. | 4,189,800 | 350,644 | |
| Amgen Inc. | 2,371,324 | 328,001 | |
| Roche Holding AG | 1,066,806 | 283,207 | |
| * | Biogen Inc. | 860,400 | 251,073 |
| Novartis AG ADR | 1,610,605 | 148,047 | |
| Johnson & Johnson | 1,536,650 | 143,446 | |
| Medtronic plc | 1,112,700 | 74,484 | |
| Abbott Laboratories | 1,707,700 | 68,684 | |
| Thermo Fisher | |||
| Scientific Inc. | 557,800 | 68,208 | |
| * | Boston Scientific Corp. | 3,327,200 | 54,599 |
| * | Illumina Inc. | 155,900 | 27,410 |
| * | Waters Corp. | 225,654 | 26,675 |
| Sanofi ADR | 541,000 | 25,681 | |
| GlaxoSmithKline plc ADR | 600,000 | 23,070 | |
| AbbVie Inc. | 376,000 | 20,458 | |
| Merck & Co. Inc. | 345,000 | 17,040 | |
15
| PRIMECAP Core Fund | |||
| Market | |||
| Value• | |||
| Shares | ($000) | ||
| Agilent Technologies Inc. | 382,600 | 13,135 | |
| Stryker Corp. | 45,500 | 4,282 | |
| * | Cerner Corp. | 10,000 | 600 |
| AstraZeneca plc ADR | 13,700 | 436 | |
| 1,929,180 | |||
| Industrials (17.0%) | |||
| Southwest Airlines Co. | 8,926,525 | 339,565 | |
| Airbus Group SE | 1,465,913 | 86,812 | |
| United Parcel Service Inc. | |||
| Class B | 827,500 | 81,666 | |
| FedEx Corp. | 488,175 | 70,287 | |
| Honeywell | |||
| International Inc. | 690,000 | 65,336 | |
| * | United Continental | ||
| Holdings Inc. | 1,088,000 | 57,718 | |
| Delta Air Lines Inc. | 1,146,000 | 51,421 | |
| Boeing Co. | 349,800 | 45,806 | |
| Deere & Co. | 512,600 | 37,932 | |
| * | Jacobs Engineering | ||
| Group Inc. | 729,100 | 27,290 | |
| Rockwell Automation Inc. | 260,200 | 26,402 | |
| Safran SA | 337,600 | 25,385 | |
| American Airlines | |||
| Group Inc. | 627,300 | 24,358 | |
| Union Pacific Corp. | 266,400 | 23,552 | |
| Caterpillar Inc. | 355,000 | 23,203 | |
| * | Hertz Global Holdings Inc. | 1,370,000 | 22,920 |
| Pentair plc | 415,000 | 21,182 | |
| CSX Corp. | 775,000 | 20,848 | |
| Norfolk Southern Corp. | 218,400 | 16,686 | |
| Ritchie Bros | |||
| Auctioneers Inc. | 618,300 | 16,002 | |
| * | AECOM | 525,000 | 14,443 |
| CH Robinson | |||
| Worldwide Inc. | 170,000 | 11,523 | |
| Republic Services Inc. | |||
| Class A | 266,935 | 10,998 | |
| Expeditors International | |||
| of Washington Inc. | 230,000 | 10,822 | |
| United Technologies Corp. | 120,000 | 10,679 | |
| IDEX Corp. | 139,000 | 9,911 | |
| * | TransDigm Group Inc. | 37,500 | 7,965 |
| Alaska Air Group Inc. | 100,000 | 7,945 | |
| Canadian Pacific | |||
| Railway Ltd. | 12,530 | 1,799 | |
| Tyco International plc | 50,000 | 1,673 | |
| * | Kirby Corp. | 16,000 | 991 |
| ^ | Chicago Bridge | ||
| & Iron Co. NV | 20,000 | 793 | |
| 1,173,913 | |||
| Information Technology (25.9%) | |||
| Texas Instruments Inc. | 3,845,800 | 190,444 | |
| Microsoft Corp. | 2,939,200 | 130,089 | |
| * | Google Inc. Class A | 188,472 | 120,315 |
| * | Google Inc. Class C | 188,441 | 114,651 |
| Market | |||
| Value• | |||
| Shares | ($000) | ||
| * | Flextronics | ||
| International Ltd. | 8,861,200 | 93,397 | |
| NetApp Inc. | 2,891,400 | 85,585 | |
| SanDisk Corp. | 1,567,516 | 85,163 | |
| Hewlett-Packard Co. | 3,207,967 | 82,156 | |
| Intel Corp. | 2,716,700 | 81,881 | |
| EMC Corp. | 3,080,300 | 74,420 | |
| QUALCOMM Inc. | 1,239,830 | 66,616 | |
| Telefonaktiebolaget | |||
| LM Ericsson ADR | 6,313,300 | 61,744 | |
| Cisco Systems Inc. | 2,252,600 | 59,131 | |
| Intuit Inc. | 551,500 | 48,946 | |
| ASML Holding NV | 480,000 | 42,230 | |
| KLA-Tencor Corp. | 790,000 | 39,500 | |
| * | Adobe Systems Inc. | 470,000 | 38,643 |
| NVIDIA Corp. | 1,500,000 | 36,975 | |
| Altera Corp. | 702,700 | 35,191 | |
| * | PayPal Holdings Inc. | 1,064,900 | 33,055 |
| Activision Blizzard Inc. | 900,000 | 27,801 | |
| * | eBay Inc. | 1,064,900 | 26,026 |
| Corning Inc. | 1,425,000 | 24,396 | |
| Oracle Corp. | 616,000 | 22,250 | |
| * | Electronic Arts Inc. | 325,000 | 22,019 |
| Visa Inc. Class A | 298,800 | 20,814 | |
| Analog Devices Inc. | 355,000 | 20,026 | |
| Applied Materials Inc. | 1,259,000 | 18,495 | |
| Symantec Corp. | 895,300 | 17,432 | |
| * | Yahoo! Inc. | 585,600 | 16,930 |
| Apple Inc. | 132,000 | 14,560 | |
| * | Keysight | ||
| Technologies Inc. | 435,300 | 13,425 | |
| * | Alibaba Group | ||
| Holding Ltd. ADR | 176,030 | 10,381 | |
| * | BlackBerry Ltd. | 1,547,500 | 9,486 |
| Broadcom Corp. Class A | 110,000 | 5,657 | |
| Teradyne Inc. | 120,000 | 2,161 | |
| * | Micron Technology Inc. | 110,000 | 1,648 |
| * | VMware Inc. Class A | 3,000 | 236 |
| 1,793,875 | |||
| Materials (2.6%) | |||
| Monsanto Co. | 853,350 | 72,825 | |
| Praxair Inc. | 229,700 | 23,397 | |
| Potash Corp. of | |||
| Saskatchewan Inc. | 929,976 | 19,111 | |
| Celanese Corp. Class A | 320,000 | 18,934 | |
| ^ | Dow Chemical Co. | 405,000 | 17,172 |
| EI du Pont de | |||
| Nemours & Co. | 275,000 | 13,255 | |
| * | Crown Holdings Inc. | 100,000 | 4,575 |
| Greif Inc. Class A | 125,400 | 4,002 | |
| LyondellBasell Industries | |||
| NV Class A | 46,200 | 3,851 | |
| Cabot Corp. | 100,000 | 3,156 | |
| Greif Inc. Class B | 37,000 | 1,431 | |
| Chemours Co. | 55,000 | 356 | |
| 182,065 | |||
16
| PRIMECAP Core Fund | ||
| Market | ||
| Value• | ||
| Shares | ($000) | |
| Telecommunication Services (0.7%) | ||
| AT&T Inc. | 905,492 | 29,501 |
| * Sprint Corp. | 4,430,000 | 17,011 |
| 46,512 | ||
| Total Common Stocks | ||
| (Cost $4,052,946) | 6,570,159 | |
| Temporary Cash Investment (5.3%) | ||
| Money Market Fund (5.3%) | ||
| 1,2 Vanguard Market | ||
| Liquidity Fund, 0.189% | ||
| (Cost $365,035) | 365,035,318 | 365,035 |
| Total Investments (100.3%) | ||
| (Cost $4,417,981) | 6,935,194 | |
| Amount | ||
| ($000) | ||
| Other Assets and Liabilities (-0.3%) | ||
| Other Assets | ||
| Investment in Vanguard | 645 | |
| Receivables for Investment Securities Sold 16,145 | ||
| Receivables for Accrued Income | 6,935 | |
| Receivables for Capital Shares Issued | 1,393 | |
| Total Other Assets | 25,118 | |
| Liabilities | ||
| Payables for Investment Securities | ||
| Purchased | (11,672) | |
| Collateral for Securities on Loan | (14,917) | |
| Payables to Investment Advisor | (5,625) | |
| Payables for Capital Shares Redeemed | (2,493) | |
| Payables to Vanguard | (8,195) | |
| Other Liabilities | (110) | |
| Total Liabilities | (43,012) | |
| Net Assets (100%) | ||
| Applicable to 341,471,724 outstanding | ||
| $.001 par value shares of beneficial | ||
| interest (unlimited authorization) | 6,917,300 | |
| Net Asset Value Per Share | $20.26 | |
| At September 30, 2015, net assets consisted of: | |
| Amount | |
| ($000) | |
| Paid-in Capital | 4,078,525 |
| Undistributed Net Investment Income | 57,888 |
| Accumulated Net Realized Gains | 263,820 |
| Unrealized Appreciation (Depreciation) | |
| Investment Securities | 2,517,213 |
| Foreign Currencies | (146) |
| Net Assets | 6,917,300 |
• See Note A in Notes to Financial Statements.
* Non-income-producing security.
^ Includes partial security positions on loan to broker-dealers. The total value of securities on loan is $14,871,000.
1 Affiliated money market fund available only to Vanguard funds and certain trusts and accounts managed by Vanguard. Rate shown is the 7-day yield.
2 Includes $14,917,000 of collateral received for securities on loan.
ADR—American Depositary Receipt.
See accompanying Notes, which are an integral part of the Financial Statements.
17
| PRIMECAP Core Fund | |
| Statement of Operations | |
| Year Ended | |
| September 30, 2015 | |
| ($000) | |
| Investment Income | |
| Income | |
| Dividends1 | 127,547 |
| Interest2 | 663 |
| Securities Lending | 1,958 |
| Total Income | 130,168 |
| Expenses | |
| Investment Advisory Fees—Note B | 22,757 |
| The Vanguard Group—Note C | |
| Management and Administrative | 10,569 |
| Marketing and Distribution | 1,013 |
| Custodian Fees | 128 |
| Auditing Fees | 31 |
| Shareholders’ Reports | 56 |
| Trustees’ Fees and Expenses | 11 |
| Total Expenses | 34,565 |
| Net Investment Income | 95,603 |
| Realized Net Gain (Loss) | |
| Investment Securities Sold | 323,757 |
| Foreign Currencies | 28 |
| Realized Net Gain (Loss) | 323,785 |
| Change in Unrealized Appreciation (Depreciation) | |
| Investment Securities | (477,802) |
| Foreign Currencies | 7 |
| Change in Unrealized Appreciation (Depreciation) | (477,795) |
| Net Increase (Decrease) in Net Assets Resulting from Operations | (58,407) |
| 1 Dividends are net of foreign withholding taxes of $3,131,000. | |
| 2 Interest income from an affiliated company of the fund was $663,000. | |
See accompanying Notes, which are an integral part of the Financial Statements.
18
| PRIMECAP Core Fund | ||
| Statement of Changes in Net Assets | ||
| Year Ended September 30, | ||
| 2015 | 2014 | |
| ($000) | ($000) | |
| Increase (Decrease) in Net Assets | ||
| Operations | ||
| Net Investment Income | 95,603 | 78,963 |
| Realized Net Gain (Loss) | 323,785 | 401,489 |
| Change in Unrealized Appreciation (Depreciation) | (477,795) | 801,653 |
| Net Increase (Decrease) in Net Assets Resulting from Operations | (58,407) | 1,282,105 |
| Distributions | ||
| Net Investment Income | (85,623) | (54,577) |
| Realized Capital Gain1 | (411,308) | (207,572) |
| Total Distributions | (496,931) | (262,149) |
| Capital Share Transactions | ||
| Issued | 800,640 | 478,435 |
| Issued in Lieu of Cash Distributions | 445,777 | 235,932 |
| Redeemed | (601,660) | (680,461) |
| Net Increase (Decrease) from Capital Share Transactions | 644,757 | 33,906 |
| Total Increase (Decrease) | 89,419 | 1,053,862 |
| Net Assets | ||
| Beginning of Period | 6,827,881 | 5,774,019 |
| End of Period2 | 6,917,300 | 6,827,881 |
1 Includes fiscal 2015 and 2014 short-term gain distributions totaling $11,734,000 and $0, respectively. Short-term gain distributions are treated as ordinary income for tax purposes.
2 Net Assets—End of Period includes undistributed (overdistributed) net investment income of $57,888,000 and $52,210,000.
See accompanying Notes, which are an integral part of the Financial Statements.
19
| PRIMECAP Core Fund | |||||
| Financial Highlights | |||||
| For a Share Outstanding | Year Ended September 30, | ||||
| Throughout Each Period | 2015 | 2014 | 2013 | 2012 | 2011 |
| Net Asset Value, Beginning of Period | $21.87 | $18.65 | $14.98 | $12.37 | $12.51 |
| Investment Operations | |||||
| Net Investment Income | . 285 | .255 | .242 | .206 | .145 |
| Net Realized and Unrealized Gain (Loss) | |||||
| on Investments | (. 328) | 3.820 | 3.955 | 2.567 | (.143) |
| Total from Investment Operations | (.043) | 4.075 | 4.197 | 2.773 | .002 |
| Distributions | |||||
| Dividends from Net Investment Income | (.270) | (.178) | (. 260) | (.163) | (.142) |
| Distributions from Realized Capital Gains | (1.297) | (.677) | (.267) | — | — |
| Total Distributions | (1.567) | (.855) | (.527) | (.163) | (.142) |
| Net Asset Value, End of Period | $20.26 | $21.87 | $18.65 | $14.98 | $12.37 |
| Total Return1 | -0.73% | 22.60% | 28.88% | 22.55% | -0.10% |
| Ratios/Supplemental Data | |||||
| Net Assets, End of Period (Millions) | $6,917 | $6,828 | $5,774 | $4,702 | $4,345 |
| Ratio of Total Expenses to | |||||
| Average Net Assets | 0.47% | 0.50% | 0.50% | 0.50% | 0.51% |
| Ratio of Net Investment Income to | |||||
| Average Net Assets | 1.29% | 1.23% | 1.42% | 1.39% | 1.01% |
| Portfolio Turnover Rate | 10% | 13% | 7% | 10% | 9% |
1 Total returns do not include transaction or account service fees that may have applied in the periods shown. Fund prospectuses provide information about any applicable transaction and account service fees.
See accompanying Notes, which are an integral part of the Financial Statements.
20
PRIMECAP Core Fund
Notes to Financial Statements
Vanguard PRIMECAP Core Fund is registered under the Investment Company Act of 1940 as an open-end investment company, or mutual fund.
A. The following significant accounting policies conform to generally accepted accounting principles for U.S. investment companies. The fund consistently follows such policies in preparing its financial statements.
1. Security Valuation: Securities are valued as of the close of trading on the New York Stock Exchange (generally 4 p.m., Eastern time) on the valuation date. Equity securities are valued at the latest quoted sales prices or official closing prices taken from the primary market in which each security trades; such securities not traded on the valuation date are valued at the mean of the latest quoted bid and asked prices. Securities for which market quotations are not readily available, or whose values have been affected by events occurring before the fund’s pricing time but after the close of the securities’ primary markets, are valued at their fair values calculated according to procedures adopted by the board of trustees. These procedures include obtaining quotations from an independent pricing service, monitoring news to identify significant market- or security-specific events, and evaluating changes in the values of foreign market proxies (for example, ADRs, futures contracts, or exchange-traded funds), between the time the foreign markets close and the fund’s pricing time. When fair-value pricing is employed, the prices of securities used by a fund to calculate its net asset value may differ from quoted or published prices for the same securities. Investments in Vanguard Market Liquidity Fund are valued at that fund’s net asset value.
2. Foreign Currency: Securities and other assets and liabilities denominated in foreign currencies are translated into U.S. dollars using exchange rates obtained from an independent third party as of the fund’s pricing time on the valuation date. Realized gains (losses) and unrealized appreciation (depreciation) on investment securities include the effects of changes in exchange rates since the securities were purchased, combined with the effects of changes in security prices. Fluctuations in the value of other assets and liabilities resulting from changes in exchange rates are recorded as unrealized foreign currency gains (losses) until the assets or liabilities are settled in cash, at which time they are recorded as realized foreign currency gains (losses).
3. Federal Income Taxes: The fund intends to continue to qualify as a regulated investment company and distribute all of its taxable income. Management has analyzed the fund’s tax positions taken for all open federal income tax years (September 30, 2012–2015), and has concluded that no provision for federal income tax is required in the fund’s financial statements.
4. Distributions: Distributions to shareholders are recorded on the ex-dividend date.
5. Securities Lending: To earn additional income, the fund lends its securities to qualified institutional borrowers. Security loans are required to be secured at all times by collateral in an amount at least equal to the market value of securities loaned. Daily market fluctuations could cause the value of loaned securities to be more or less than the value of the collateral received. When this occurs, the collateral is adjusted and settled on the next business day. The fund further mitigates its counterparty risk by entering into securities lending transactions only with a diverse group of prequalified counter-parties, monitoring their financial strength, and entering into master securities lending agreements with its counterparties. The master securities lending agreements provide that, in the event of a counterparty’s default (including bankruptcy), the fund may terminate any loans with that borrower, determine the net amount owed, and sell or retain the collateral up to the net amount owed to the fund; however, such actions may be subject to legal proceedings. While collateral mitigates counter-party risk, in the absence of a default the fund may experience delays and costs in recovering the securities loaned. The fund invests cash collateral received in Vanguard Market Liquidity Fund, and
21
PRIMECAP Core Fund
records a liability in the Statement of Net Assets for the return of the collateral, during the period the securities are on loan. Securities lending income represents fees charged to borrowers plus income earned on invested cash collateral, less expenses associated with the loan.
6. Credit Facility: The fund and certain other funds managed by The Vanguard Group (“Vanguard”) participate in a $3 billion committed credit facility provided by a syndicate of lenders pursuant to a credit agreement that may be renewed annually; each fund is individually liable for its borrowings, if any, under the credit facility. Borrowings may be utilized for temporary and emergency purposes, and are subject to the fund’s regulatory and contractual borrowing restrictions. The participating funds are charged administrative fees and an annual commitment fee of 0.06% of the undrawn amount of the facility; these fees are allocated to the funds based on a method approved by the fund’s board of trustees and included in Management and Administrative expenses on the fund’s Statement of Operations. Any borrowings under this facility bear interest at a rate equal to the higher of the federal funds rate or LIBOR reference rate plus an agreed-upon spread.
The fund had no borrowings outstanding at September 30, 2015, or at any time during the period then ended.
7. Other: Dividend income is recorded on the ex-dividend date. Interest income includes income distributions received from Vanguard Market Liquidity Fund and is accrued daily. Security transactions are accounted for on the date securities are bought or sold. Costs used to determine realized gains (losses) on the sale of investment securities are those of the specific securities sold.
B. PRIMECAP Management Company provides investment advisory services to the fund for a fee calculated at an annual percentage rate of average net assets. For the year ended September 30, 2015, the investment advisory fee represented an effective annual rate of 0.31% of the fund’s average net assets.
C. In accordance with the terms of a Funds’ Service Agreement (the “FSA”) between Vanguard and the fund, Vanguard furnishes to the fund corporate management, administrative, marketing, and distribution services at Vanguard’s cost of operations (as defined by the FSA). These costs of operations are allocated to the fund based on methods and guidelines approved by the board of trustees. Vanguard does not require reimbursement in the current period for certain costs of operations (such as deferred compensation/benefits and risk/insurance costs); the fund’s liability for these costs of operations is included in Payables to Vanguard on the Statement of Net Assets.
Upon the request of Vanguard, the fund may invest up to 0.40% of its net assets as capital in Vanguard. At September 30, 2015, the fund had contributed to Vanguard capital in the amount of $645,000, representing 0.01% of the fund’s net assets and 0.26% of Vanguard’s capitalization. The fund’s trustees and officers are also directors and employees, respectively, of Vanguard.
D. Various inputs may be used to determine the value of the fund’s investments. These inputs are summarized in three broad levels for financial statement purposes. The inputs or methodologies used to value securities are not necessarily an indication of the risk associated with investing in those securities.
Level 1—Quoted prices in active markets for identical securities.
Level 2—Other significant observable inputs (including quoted prices for similar securities, interest rates, prepayment speeds, credit risk, etc.).
Level 3—Significant unobservable inputs (including the fund’s own assumptions used to determine the fair value of investments).
22
PRIMECAP Core Fund
The following table summarizes the market value of the fund’s investments as of September 30, 2015, based on the inputs used to value them:
| Level 1 | Level 2 | Level 3 | |
| Investments | ($000) | ($000) | ($000) |
| Common Stocks | 6,174,755 | 395,404 | — |
| Temporary Cash Investments | 365,035 | — | — |
| Total | 6,539,790 | 395,404 | — |
E. Distributions are determined on a tax basis and may differ from net investment income and realized capital gains for financial reporting purposes. Differences may be permanent or temporary. Permanent differences are reclassified among capital accounts in the financial statements to reflect their tax character. Temporary differences arise when certain items of income, expense, gain, or loss are recognized in different periods for financial statement and tax purposes. These differences will reverse at some time in the future. Differences in classification may also result from the treatment of short-term gains as ordinary income for tax purposes.
During the year ended September 30, 2015, the fund realized net foreign currency gains of $28,000, which increased distributable net income for tax purposes; accordingly, such gains have been reclassified from accumulated net realized gains to undistributed net investment income.
The fund used a tax accounting practice to treat a portion of the price of capital shares redeemed during the year as distributions from net investment income and realized capital gains. Accordingly, the fund has reclassified $4,330,000 from undistributed net investment income, and $14,637,000 from accumulated net realized gains, to paid-in capital.
For tax purposes, at September 30, 2015, the fund had $65,698,000 of ordinary income and $263,909,000 of long-term capital gains available for distribution.
At September 30, 2015, the cost of investment securities for tax purposes was $4,417,981,000.
Net unrealized appreciation of investment securities for tax purposes was $2,517,213,000, consisting of unrealized gains of $2,749,140,000 on securities that had risen in value since their purchase and $231,927,000 in unrealized losses on securities that had fallen in value since their purchase.
F. During the year ended September 30, 2015, the fund purchased $882,215,000 of investment securities and sold $676,892,000 of investment securities, other than temporary cash investments.
G. Capital shares issued and redeemed were:
| Year Ended September 30, | ||
| 2015 | 2014 | |
| Shares | Shares | |
| (000) | (000) | |
| Issued | 36,473 | 23,520 |
| Issued in Lieu of Cash Distributions | 20,364 | 12,563 |
| Redeemed | (27,555) | (33,422) |
| Net Increase (Decrease) in Shares Outstanding | 29,282 | 2,661 |
H. Management has determined that no material events or transactions occurred subsequent to September 30, 2015, that would require recognition or disclosure in these financial statements.
23
Report of Independent Registered Public Accounting Firm
To the Board of Trustees of Vanguard Fenway Funds and the Shareholders of Vanguard PRIMECAP Core Fund:
In our opinion, the accompanying statement of net assets and the related statements of operations and of changes in net assets and the financial highlights present fairly, in all material respects, the financial position of Vanguard PRIMECAP Core Fund (constituting a separate portfolio of Vanguard Fenway Funds, hereafter referred to as the “Fund”) at September 30, 2015, the results of its operations for the year then ended, the changes in its net assets for each of the two years in the period then ended, and the financial highlights for each of the five years in the period then ended, in conformity with accounting principles generally accepted in the United States of America. These financial statements and financial highlights (hereafter referred to as “financial statements”) are the responsibility of the Fund’s management. Our responsibility is to express an opinion on these financial statements based on our audits. We conducted our audits of these financial statements in accordance with the standards of the Public Company Accounting Oversight Board (United States). Those standards require that we plan and perform the audit to obtain reasonable assurance about whether the financial statements are free of material misstatement. An audit includes examining, on a test basis, evidence supporting the amounts and disclosures in the financial statements, assessing the accounting principles used and significant estimates made by management, and evaluating the overall financial statement presentation. We believe that our audits, which included confirmation of securities at September 30, 2015 by correspondence with the custodian and broker, by agreement to the underlying ownership records of the transfer agent and the application of alternative auditing procedures where securities purchased had not been received, provide a reasonable basis for our opinion.
/s/PricewaterhouseCoopers LLP
Philadelphia, Pennsylvania
November 16, 2015
| Special 2015 tax information (unaudited) for Vanguard PRIMECAP Core Fund |
| This information for the fiscal year ended September 30, 2015, is included pursuant to provisions of |
| the Internal Revenue Code. |
| The fund distributed $414,212,000 as capital gain dividends (20% rate gain distributions) to share- |
| holders during the fiscal year. |
| For nonresident alien shareholders, 100% of short-term capital gain dividends distributed by the fund |
| are qualified short-term capital gains. |
| The fund distributed $97,357,000 of qualified dividend income to shareholders during the fiscal year. |
| For corporate shareholders, 100% of investment income (dividend income plus short-term gains, |
| if any) qualifies for the dividends-received deduction. |
24
Your Fund’s After-Tax Returns
This table presents returns for your fund both before and after taxes. The after-tax returns are shown in two ways: (1) assuming that an investor owned the fund during the entire period and paid taxes on the fund’s distributions, and (2) assuming that an investor paid taxes on the fund’s distributions and sold all shares at the end of each period.
Calculations are based on the highest individual federal income tax and capital gains tax rates in effect at the times of the distributions and the hypothetical sales. State and local taxes were not considered. After-tax returns reflect any qualified dividend income, using actual prior-year figures and estimates for 2015. (In the example, returns after the sale of fund shares may be higher than those assuming no sale. This occurs when the sale would have produced a capital loss. The calculation assumes that the investor received a tax deduction for the loss.)
Please note that your actual after-tax returns will depend on your tax situation and may differ from those shown. Also note that if you own the fund in a tax-deferred account, such as an individual retirement account or a 401(k) plan, this information does not apply to you. Such accounts are not subject to current taxes.
Finally, keep in mind that a fund’s performance—whether before or after taxes—does not guarantee future results.
| Average Annual Total Returns: PRIMECAP Core Fund | |||
| Periods Ended September 30, 2015 | |||
| One | Five | Ten | |
| Year | Years | Years | |
| Returns Before Taxes | -0.73% | 13.94% | 8.91% |
| Returns After Taxes on Distributions | -2.31 | 13.15 | 8.40 |
| Returns After Taxes on Distributions and Sale of Fund Shares | 1.06 | 11.23 | 7.30 |
25
About Your Fund’s Expenses
As a shareholder of the fund, you incur ongoing costs, which include costs for portfolio management, administrative services, and shareholder reports (like this one), among others. Operating expenses, which are deducted from a fund’s gross income, directly reduce the investment return of the fund.
A fund’s expenses are expressed as a percentage of its average net assets. This figure is known as the expense ratio. The following examples are intended to help you understand the ongoing costs (in dollars) of investing in your fund and to compare these costs with those of other mutual funds. The examples are based on an investment of $1,000 made at the beginning of the period shown and held for the entire period.
The accompanying table illustrates your fund’s costs in two ways:
• Based on actual fund return. This section helps you to estimate the actual expenses that you paid over the period. The ”Ending Account Value“ shown is derived from the fund‘s actual return, and the third column shows the dollar amount that would have been paid by an investor who started with $1,000 in the fund. You may use the information here, together with the amount you invested, to estimate the expenses that you paid over the period.
To do so, simply divide your account value by $1,000 (for example, an $8,600 account value divided by $1,000 = 8.6), then multiply the result by the number given for your fund under the heading ”Expenses Paid During Period.“
• Based on hypothetical 5% yearly return. This section is intended to help you compare your fund‘s costs with those of other mutual funds. It assumes that the fund had a yearly return of 5% before expenses, but that the expense ratio is unchanged. In this case—because the return used is not the fund’s actual return—the results do not apply to your investment. The example is useful in making comparisons because the Securities and Exchange Commission requires all mutual funds to calculate expenses based on a 5% return. You can assess your fund’s costs by comparing this hypothetical example with the hypothetical examples that appear in shareholder reports of other funds.
Note that the expenses shown in the table are meant to highlight and help you compare ongoing costs only and do not reflect transaction costs incurred by the fund for buying and selling securities. Further, the expenses do not include any purchase, redemption, or account service fees described in the fund prospectus. If such fees were applied to your account, your costs would be higher. Your fund does not carry a “sales load.”
The calculations assume no shares were bought or sold during the period. Your actual costs may have been higher or lower, depending on the amount of your investment and the timing of any purchases or redemptions.
You can find more information about the fund’s expenses, including annual expense ratios, in the Financial Statements section of this report. For additional information on operating expenses and other shareholder costs, please refer to your fund’s current prospectus.
26
| Six Months Ended September 30, 2015 | |||
| Beginning | Ending | Expenses | |
| Account Value | Account Value | Paid During | |
| PRIMECAP Core Fund | 3/31/2015 | 9/30/2015 | Period |
| Based on Actual Fund Return | $1,000.00 | $919.24 | $2.17 |
| Based on Hypothetical 5% Yearly Return | 1,000.00 | 1,022.81 | 2.28 |
The calculations are based on expenses incurred in the most recent six-month period. The fund’s annualized six-month expense ratio for that period is 0.45%. The dollar amounts shown as “Expenses Paid” are equal to the annualized expense ratio multiplied by the average account value over the period, multiplied by the number of days in the most recent six-month period, then divided by the number of days in the most recent 12-month period (183/365).
27
Glossary
30-Day SEC Yield. A fund’s 30-day SEC yield is derived using a formula specified by the U.S. Securities and Exchange Commission. Under the formula, data related to the fund’s security holdings in the previous 30 days are used to calculate the fund’s hypothetical net income for that period, which is then annualized and divided by the fund’s estimated average net assets over the calculation period. For the purposes of this calculation, a security’s income is based on its current market yield to maturity (for bonds), its actual income (for asset-backed securities), or its projected dividend yield (for stocks). Because the SEC yield represents hypothetical annualized income, it will differ—at times significantly—from the fund’s actual experience. As a result, the fund’s income distributions may be higher or lower than implied by the SEC yield.
Beta. A measure of the magnitude of a fund’s past share-price fluctuations in relation to the ups and downs of a given market index. The index is assigned a beta of 1.00. Compared with a given index, a fund with a beta of 1.20 typically would have seen its share price rise or fall by 12% when the index rose or fell by 10%. For this report, beta is based on returns over the past 36 months for both the fund and the index. Note that a fund’s beta should be reviewed in conjunction with its R-squared (see definition). The lower the R-squared, the less correlation there is between the fund and the index, and the less reliable beta is as an indicator of volatility.
Dividend Yield. Dividend income earned by stocks, expressed as a percentage of the aggregate market value (or of net asset value, for a fund). The yield is determined by dividing the amount of the annual dividends by the aggregate value (or net asset value) at the end of the period. For a fund, the dividend yield is based solely on stock holdings and does not include any income produced by other investments.
Earnings Growth Rate. The average annual rate of growth in earnings over the past five years for the stocks now in a fund.
Equity Exposure. A measure that reflects a fund’s investments in stocks and stock futures. Any holdings in short-term reserves are excluded.
Expense Ratio. A fund’s total annual operating expenses expressed as a percentage of the fund’s average net assets. The expense ratio includes management and administrative expenses, but does not include the transaction costs of buying and selling portfolio securities.
Foreign Holdings. The percentage of a fund represented by securities or depositary receipts of companies based outside the United States.
Inception Date. The date on which the assets of a fund (or one of its share classes) are first invested in accordance with the fund’s investment objective. For funds with a subscription period, the inception date is the day after that period ends. Investment performance is measured from the inception date.
Median Market Cap. An indicator of the size of companies in which a fund invests; the midpoint of market capitalization (market price x shares outstanding) of a fund’s stocks, weighted by the proportion of the fund’s assets invested in each stock. Stocks representing half of the fund’s assets have market capitalizations above the median, and the rest are below it.
Price/Book Ratio. The share price of a stock divided by its net worth, or book value, per share. For a fund, the weighted average price/book ratio of the stocks it holds.
28
Price/Earnings Ratio. The ratio of a stock’s current price to its per-share earnings over the past year. For a fund, the weighted average P/E of the stocks it holds. P/E is an indicator of market expectations about corporate prospects; the higher the P/E, the greater the expectations for a company’s future growth.
R-Squared. A measure of how much of a fund’s past returns can be explained by the returns from the market in general, as measured by a given index. If a fund’s total returns were precisely synchronized with an index’s returns, its R-squared would be 1.00. If the fund’s returns bore no relationship to the index’s returns, its R-squared would be 0. For this report, R-squared is based on returns over the past 36 months for both the fund and the index.
Return on Equity. The annual average rate of return generated by a company during the past five years for each dollar of shareholder’s equity (net income divided by shareholder’s equity). For a fund, the weighted average return on equity for the companies whose stocks it holds.
Short-Term Reserves. The percentage of a fund invested in highly liquid, short-term securities that can be readily converted to cash.
Turnover Rate. An indication of the fund’s trading activity. Funds with high turnover rates incur higher transaction costs and may be more likely to distribute capital gains (which may be taxable to investors). The turnover rate excludes in-kind transactions, which have minimal impact on costs.
29
This page intentionally left blank.
This page intentionally left blank.
The People Who Govern Your Fund
The trustees of your mutual fund are there to see that the fund is operated and managed in your best interests since, as a shareholder, you are a part owner of the fund. Your fund’s trustees also serve on the board of directors of The Vanguard Group, Inc., which is owned by the Vanguard funds and provides services to them on an at-cost basis.
A majority of Vanguard’s board members are independent, meaning that they have no affiliation with Vanguard or the funds they oversee, apart from the sizable personal investments they have made as private individuals. The independent board members have distinguished backgrounds in business, academia, and public service. Each of the trustees and executive officers oversees 194 Vanguard funds.
The following table provides information for each trustee and executive officer of the fund. More information about the trustees is in the Statement of Additional Information, which can be obtained, without charge, by contacting Vanguard at 800-662-7447, or online at vanguard.com.
| InterestedTrustee1 | Rajiv L. Gupta |
| Born 1945. Trustee Since December 2001.2 Principal | |
| F. William McNabb III | Occupation(s) During the Past Five Years and Other |
| Born 1957. Trustee Since July 2009. Chairman of | Experience: Chairman and Chief Executive Officer |
| the Board. Principal Occupation(s) During the Past | (retired 2009) and President (2006–2008) of |
| Five Years and Other Experience: Chairman of the | Rohm and Haas Co. (chemicals); Director of Tyco |
| Board of The Vanguard Group, Inc., and of each of | International PLC (diversified manufacturing and |
| the investment companies served by The Vanguard | services), Hewlett-Packard Co. (electronic computer |
| Group, since January 2010; Director of The Vanguard | manufacturing), and Delphi Automotive PLC |
| Group since 2008; Chief Executive Officer and | (automotive components); Senior Advisor at New |
| President of The Vanguard Group, and of each of | Mountain Capital. |
| the investment companies served by The Vanguard | |
| Group, since 2008; Director of Vanguard Marketing | Amy Gutmann |
| Corporation; Managing Director of The Vanguard | Born 1949. Trustee Since June 2006. Principal |
| Group (1995–2008). | Occupation(s) During the Past Five Years and |
| Other Experience: President of the University of | |
| IndependentTrustees | Pennsylvania; Christopher H. Browne Distinguished |
| Professor of Political Science, School of Arts and | |
| Emerson U. Fullwood | Sciences, and Professor of Communication, Annenberg |
| Born 1948. Trustee Since January 2008. Principal | School for Communication, with secondary faculty |
| Occupation(s) During the Past Five Years and | appointments in the Department of Philosophy, School |
| Other Experience: Executive Chief Staff and | of Arts and Sciences, and at the Graduate School of |
| Marketing Officer for North America and Corporate | Education, University of Pennsylvania; Trustee of the |
| Vice President (retired 2008) of Xerox Corporation | National Constitution Center; Chair of the Presidential |
| (document management products and services); | Commission for the Study of Bioethical Issues. |
| Executive in Residence and 2009–2010 Distinguished | |
| Minett Professor at the Rochester Institute of | JoAnn Heffernan Heisen |
| Technology; Director of SPX Corporation (multi-industry | Born 1950. Trustee Since July 1998. Principal |
| manufacturing), the United Way of Rochester, | Occupation(s) During the Past Five Years and Other |
| Amerigroup Corporation (managed health care), the | Experience: Corporate Vice President and Chief |
| University of Rochester Medical Center, Monroe | Global Diversity Officer (retired 2008) and Member |
| Community College Foundation, and North Carolina | of the Executive Committee (1997–2008) of Johnson |
| A&T University. | & Johnson (pharmaceuticals/medical devices/ |
| consumer products); Director of Skytop Lodge | |
| Corporation (hotels), the University Medical Center | |
| at Princeton, the Robert Wood Johnson Foundation, | |
| and the Center for Talent Innovation; Member of | |
| the Advisory Board of the Institute for Women’s | |
| Leadership at Rutgers University. |
| F. Joseph Loughrey | Executive Officers | |
| Born 1949. Trustee Since October 2009. Principal | ||
| Occupation(s) During the Past Five Years and Other | Glenn Booraem | |
| Experience: President and Chief Operating Officer | Born 1967. Treasurer Since May 2015. Principal | |
| (retired 2009) of Cummins Inc. (industrial machinery); | Occupation(s) During the Past Five Years and | |
| Chairman of the Board of Hillenbrand, Inc. (specialized | Other Experience: Principal of The Vanguard Group, | |
| consumer services), and of Oxfam America; Director | Inc.; Treasurer of each of the investment companies | |
| of SKF AB (industrial machinery), Hyster-Yale Materials | served by The Vanguard Group; Controller of each of | |
| Handling, Inc. (forklift trucks), the Lumina Foundation | the investment companies served by The Vanguard | |
| for Education, and the V Foundation for Cancer | Group (2010–2015); Assistant Controller of each of | |
| Research; Member of the Advisory Council for the | the investment companies served by The Vanguard | |
| College of Arts and Letters and of the Advisory Board | Group (2001–2010). | |
| to the Kellogg Institute for International Studies, both | ||
| at the University of Notre Dame. | Thomas J. Higgins | |
| Born 1957. Chief Financial Officer Since September | ||
| Mark Loughridge | 2008. Principal Occupation(s) During the Past Five | |
| Born 1953. Trustee Since March 2012. Principal | Years and Other Experience: Principal of The Vanguard | |
| Occupation(s) During the Past Five Years and Other | Group, Inc.; Chief Financial Officer of each of the | |
| Experience: Senior Vice President and Chief Financial | investment companies served by The Vanguard Group; | |
| Officer (retired 2013) at IBM (information technology | Treasurer of each of the investment companies served | |
| services); Fiduciary Member of IBM’s Retirement Plan | by The Vanguard Group (1998–2008). | |
| Committee (2004–2013); Director of the Dow Chemical | ||
| Company; Member of the Council on Chicago Booth. | Peter Mahoney | |
| Born 1974. Controller Since May 2015. Principal | ||
| Scott C. Malpass | Occupation(s) During the Past Five Years and | |
| Born 1962. Trustee Since March 2012. Principal | Other Experience: Head of Global Fund Accounting | |
| Occupation(s) During the Past Five Years and Other | at The Vanguard Group, Inc.; Controller of each of the | |
| Experience: Chief Investment Officer and Vice | investment companies served by The Vanguard Group; | |
| President at the University of Notre Dame; Assistant | Head of International Fund Services at The Vanguard | |
| Professor of Finance at the Mendoza College of | Group (2008–2014). | |
| Business at Notre Dame; Member of the Notre Dame | ||
| 403(b) Investment Committee; Board Member of | Heidi Stam | |
| TIFF Advisory Services, Inc., and Catholic Investment | Born 1956. Secretary Since July 2005. Principal | |
| Services, Inc. (investment advisors); Member of | Occupation(s) During the Past Five Years and Other | |
| the Investment Advisory Committee of Major | Experience: Managing Director of The Vanguard | |
| League Baseball. | Group, Inc.; General Counsel of The Vanguard Group; | |
| Secretary of The Vanguard Group and of each of the | ||
| André F. Perold | investment companies served by The Vanguard Group; | |
| Born 1952. Trustee Since December 2004. Principal | Director and Senior Vice President of Vanguard | |
| Occupation(s) During the Past Five Years and Other | Marketing Corporation. | |
| Experience: George Gund Professor of Finance and | ||
| Banking, Emeritus at the Harvard Business School | Vanguard Senior ManagementTeam | |
| (retired 2011); Chief Investment Officer and Managing | ||
| Partner of HighVista Strategies LLC (private investment | Mortimer J. Buckley | Chris D. McIsaac |
| firm); Director of Rand Merchant Bank; Overseer of | Kathleen C. Gubanich | James M. Norris |
| the Museum of Fine Arts Boston. | Paul A. Heller | Thomas M. Rampulla |
| Martha G. King | Glenn W. Reed | |
| Peter F. Volanakis | John T. Marcante | Karin A. Risi |
| Born 1955. Trustee Since July 2009. Principal | ||
| Occupation(s) During the Past Five Years and Other | Chairman Emeritus and Senior Advisor | |
| Experience: President and Chief Operating Officer | ||
| (retired 2010) of Corning Incorporated (communications | John J. Brennan | |
| equipment); Trustee of Colby-Sawyer College; | Chairman, 1996–2009 | |
| Member of the Advisory Board of the Norris Cotton | Chief Executive Officer and President, 1996–2008 | |
| Cancer Center and of the Advisory Board of the | ||
| Parthenon Group (strategy consulting). | Founder | |
| John C. Bogle | ||
| Chairman and Chief Executive Officer, 1974–1996 | ||
1 Mr. McNabb is considered an “interested person,” as defined in the Investment Company Act of 1940, because he is an officer of the Vanguard funds.
2 December 2002 for Vanguard Equity Income Fund, the Vanguard Municipal Bond Funds, and the Vanguard State Tax-Exempt Funds.
 | |
| P.O. Box 2600 | |
| Valley Forge, PA 19482-2600 |
Connect with Vanguard® > vanguard.com
| Fund Information > 800-662-7447 | |
| Direct Investor Account Services > 800-662-2739 | |
| Institutional Investor Services > 800-523-1036 | |
| Text Telephone for People | |
| Who Are Deaf or Hard of Hearing> 800-749-7273 | |
| This material may be used in conjunction | |
| with the offering of shares of any Vanguard | |
| fund only if preceded or accompanied by | |
| the fund’s current prospectus. | |
| All comparative mutual fund data are from Lipper, a | |
| Thomson Reuters Company, or Morningstar, Inc., unless | |
| otherwise noted. | |
| You can obtain a free copy of Vanguard’s proxy voting | |
| guidelines by visiting vanguard.com/proxyreporting or by | |
| calling Vanguard at 800-662-2739. The guidelines are | |
| also available from the SEC’s website, sec.gov. In | |
| addition, you may obtain a free report on how your fund | |
| voted the proxies for securities it owned during the 12 | |
| months ended June 30. To get the report, visit either | |
| vanguard.com/proxyreporting or sec.gov. | |
| You can review and copy information about your fund at | |
| the SEC’s Public Reference Room in Washington, D.C. To | |
| find out more about this public service, call the SEC at | |
| 202-551-8090. Information about your fund is also | |
| available on the SEC’s website, and you can receive | |
| copies of this information, for a fee, by sending a | |
| request in either of two ways: via email addressed to | |
| publicinfo@sec.gov or via regular mail addressed to the | |
| Public Reference Section, Securities and Exchange | |
| Commission, Washington, DC 20549-1520. | |
| © 2015 The Vanguard Group, Inc. | |
| All rights reserved. | |
| Vanguard Marketing Corporation, Distributor. | |
| Q12200 112015 | |
Item 2: Code of Ethics. The Registrant has adopted a code of ethics that applies to the Registrant’s principal executive officer, principal financial officer, principal accounting officer or controller or persons performing similar functions. The Code of Ethics was amended during the reporting period covered by this report to make certain technical, non-material changes.
Item 3: Audit Committee Financial Expert. The following members of the Audit Committee have been determined by the Registrant’s Board of Trustees to be Audit Committee Financial Experts serving on its Audit Committee, and to be independent: Rajiv L. Gupta, Amy Gutmann, JoAnn Heffernan Heisen, F. Joseph Loughrey, Mark Loughridge, Scott C. Malpass, and André F. Perold.
Item 4: Principal Accountant Fees and Services.
(a) Audit Fees.
Audit Fees of the Registrant
Fiscal Year Ended September 30, 2015: $67,000 Fiscal Year Ended September 30, 2014: $64,000
Aggregate Audit Fees of Registered Investment Companies in the Vanguard Group.
Fiscal Year Ended September 30, 2015: $7,000,200
Fiscal Year Ended September 30, 2014: $6,605,127
Includes fees billed in connection with audits of the Registrant, other registered investment companies in the Vanguard complex, The Vanguard Group, Inc. and Vanguard Marketing Corporation.
(b) Audit-Related Fees.
Fiscal Year Ended September 30, 2015: $2,899,096
Fiscal Year Ended September 30, 2014: $2,176,479
Includes fees billed in connection with assurance and related services provided to the Registrant, other registered investment companies in the Vanguard complex, The Vanguard Group, Inc., and Vanguard Marketing Corporation.
(c) Tax Fees.
Fiscal Year Ended September 30, 2015: $353,389
Fiscal Year Ended September 30, 2014: $316,869
Includes fees billed in connection with tax compliance, planning, and advice services provided to the Registrant, other registered investment companies in the Vanguard complex, The Vanguard Group, Inc., and Vanguard Marketing Corporation.
(d) All Other Fees.
Fiscal Year Ended September 30, 2015: $202,313
Fiscal Year Ended September 30, 2014: $198,163
Includes fees billed for services related to tax reported information provided to the Registrant, other registered investment companies in the Vanguard complex, The Vanguard Group, Inc., and Vanguard Marketing Corporation.
(e) (1) Pre-Approval Policies. The policy of the Registrant’s Audit Committee is to consider and, if appropriate, approve before the principal accountant is engaged for such services, all specific audit and non-audit services provided to: the Registrant, other registered investment companies in the Vanguard complex, The Vanguard Group, Inc., and entities controlled by The Vanguard Group, Inc. that provide ongoing services to the Registrant. In making a determination, the Audit Committee considers whether the services are consistent with maintaining the principal accountant’s independence.
In the event of a contingency situation in which the principal accountant is needed to provide services in between scheduled Audit Committee meetings, the Chairman of the Audit Committee would be called on to consider and, if appropriate, pre-approve audit or permitted non-audit services in an amount sufficient to complete services through the next Audit Committee meeting, and to determine if such services would be consistent with maintaining the accountant’s independence. At the next scheduled Audit Committee meeting, services and fees would be presented to the Audit Committee for formal consideration, and, if appropriate, approval by the entire Audit Committee. The Audit Committee would again consider whether such services and fees are consistent with maintaining the principal accountant’s independence.
The Registrant’s Audit Committee is informed at least annually of all audit and non-audit services provided by the principal accountant to the Vanguard complex, whether such services are provided to: the Registrant, other registered investment companies in the Vanguard complex, The Vanguard Group, Inc., or other entities controlled by The Vanguard Group, Inc. that provide ongoing services to the Registrant.
(2) No percentage of the principal accountant’s fees or services were approved pursuant to the waiver provision of paragraph (c)(7)(i)(C) of Rule 2-01 of Regulation S-X.
(f) For the most recent fiscal year, over 50% of the hours worked under the principal accountant’s engagement were not performed by persons other than full-time, permanent employees of the principal accountant.
(g) Aggregate Non-Audit Fees.
Fiscal Year Ended September 30, 2015: $555,702
Fiscal Year Ended September 30, 2014: $515,032
Includes fees billed for non-audit services provided to the Registrant, other registered investment companies in the Vanguard complex, The Vanguard Group, Inc., and Vanguard Marketing Corporation.
(h) For the most recent fiscal year, the Audit Committee has determined that the provision of all non-audit services was consistent with maintaining the principal accountant’s independence.
Item 5: Audit Committee of Listed Registrants.
Not Applicable.
Item 6: Investments.
Not Applicable.
Item 7: Disclosure of Proxy Voting Policies and Procedures for Closed-End Management Investment Companies.
Not Applicable.
Item 8: Portfolio Managers of Closed-End Management Investment Companies.
Not Applicable.
Item 9: Purchase of Equity Securities by Closed-End Management Investment Company and Affiliated Purchasers.
Not Applicable.
Item 10: Submission of Matters to a Vote of Security Holders.
Not Applicable.
Item 11: Controls and Procedures.
(a) Disclosure Controls and Procedures. The Principal Executive and Financial Officers concluded that the Registrant’s Disclosure Controls and Procedures are effective based on their evaluation of the Disclosure Controls and Procedures as of a date within 90 days of the filing date of this report.
(b) Internal Control Over Financial Reporting. There were no significant changes in Registrant’s Internal Control Over Financial Reporting or in other factors that could significantly affect this control subsequent to the date of the evaluation, including any corrective actions with regard to significant deficiencies and material weaknesses.
Item 12: Exhibits.
(a) Code of Ethics. (b) Certifications.
Pursuant to the requirements of the Securities Exchange Act of 1934 and the Investment Company Act of 1940, the registrant has duly caused this report to be signed on its behalf by the undersigned, thereunto duly authorized.
| VANGUARD FENWAY FUNDS | |
| By: | /s/ F. WILLIAM MCNABB III* |
| F. WILLIAM MCNABB III | |
| CHIEF EXECUTIVE OFFICER | |
| Date: November 18, 2015 | |
Pursuant to the requirements of the Securities Exchange Act of 1934 and the Investment Company Act of 1940, this report has been signed below by the following persons on behalf of the registrant and in the capacities and on the dates indicated.
| VANGUARD FENWAY FUNDS | |
| By: | /s/ F. WILLIAM MCNABB III* |
| F. WILLIAM MCNABB III | |
| CHIEF EXECUTIVE OFFICER | |
| Date: November 18, 2015 | |
| VANGUARD FENWAY FUNDS | |
| By: | /s/ THOMAS J. HIGGINS* |
| THOMAS J. HIGGINS | |
| CHIEF FINANCIAL OFFICER | |
| Date: November 18, 2015 | |
* By: /s/ Heidi Stam
Heidi Stam, pursuant to a Power of Attorney filed on April 22, 2014 see file Number 2-17620, Incorporated by Reference.