UNITED STATES
SECURITIES AND EXCHANGE COMMISSION
Washington, D.C. 20549
FORM N-CSR
CERTIFIED SHAREHOLDER REPORT
OF
REGISTERED MANAGEMENT INVESTMENT COMPANIES
| Investment Company Act file number: | 811-05445 | |
Name of Registrant: | Vanguard Fenway Funds | |
Address of Registrant: | P.O. Box 2600 | |
| Valley Forge, PA 19482 | ||
Name and address of agent for service: | Heidi Stam, Esquire | |
| P.O. Box 876 | ||
| Valley Forge, PA 19482 | ||
Registrant’s telephone number, including area code: (610) 669-1000 | ||
Date of fiscal year end: September 30 | ||
Date of reporting period: October 1, 2013 – September 30, 2014 | ||
Item 1: Reports to Shareholders | ||
![]()

Annual Report | September 30, 2014
Vanguard Equity Income Fund
The mission continues
On May 1, 1975, Vanguard began operations, a fledgling company based on the simple but revolutionary idea that a mutual fund company should be managed solely in the interest of its investors.
Four decades later, that revolutionary spirit continues to animate the enterprise. Vanguard remains on a mission to give investors the best chance of investment success.
As we mark our 40th anniversary, we thank you for entrusting your assets to Vanguard and giving us the opportunity to help you reach your financial goals in the decades to come.
| Contents | |
| Your Fund’s Total Returns. | 1 |
| Chairman’s Letter. | 2 |
| Advisors’ Report. | 7 |
| Fund Profile. | 11 |
| Performance Summary. | 12 |
| Financial Statements. | 14 |
| Your Fund’s After-Tax Returns. | 28 |
| About Your Fund’s Expenses. | 29 |
| Glossary. | 31 |
Please note: The opinions expressed in this report are just that—informed opinions. They should not be considered promises or advice.
Also, please keep in mind that the information and opinions cover the period through the date on the front of this report. Of course, the
risks of investing in your fund are spelled out in the prospectus.
See the Glossary for definitions of investment terms used in this report.
About the cover: Since our founding, Vanguard has drawn inspiration from the enterprise and valor demonstrated by British
naval hero Horatio Nelson and his command at the Battle of the Nile in 1798. The photograph displays a replica of a merchant
ship from the same era as Nelson’s flagship, the HMS Vanguard.
Your Fund’s Total Returns
| Fiscal Year Ended September 30, 2014 | |
| Total | |
| Returns | |
| Vanguard Equity Income Fund | |
| Investor Shares | 16.62% |
| Admiral™ Shares | 16.70 |
| FTSE High Dividend Yield Index | 19.02 |
| Equity Income Funds Average | 15.09 |
| Equity Income Funds Average: Derived from data provided by Lipper, a Thomson Reuters Company. | |
| Admiral Shares carry lower expenses and are available to investors who meet certain account-balance requirements. | |
Your Fund’s Performance at a Glance
September 30, 2013, Through September 30, 2014
| Distributions Per Share | ||||
| Starting | Ending | |||
| Share | Share | Income | Capital | |
| Price | Price | Dividends | Gains | |
| Vanguard Equity Income Fund | ||||
| Investor Shares | $28.26 | $31.23 | $0.811 | $0.799 |
| Admiral Shares | 59.24 | 65.45 | 1.758 | 1.675 |
1

Chairman’s Letter
Dear Shareholder,
In April, I wrote that the first half of the fiscal year was a tale of two quarters. It turns out that the full fiscal year was a tale of two halves. Much of your fund’s gain, along with those of its index and the broad U.S. market, was achieved in the first six months, before the stock market rally lost steam.
For the 12 months ended September 30, 2014, Vanguard Equity Income Fund returned 16.62% for Investor Shares and 16.70% for Admiral Shares. The fund’s result trailed that of its high-dividend-yield benchmark—which outperformed the broad U.S. stock market—but was ahead of the average return of peer funds. Thanks to returning more than 11% in the first six months, your fund notched its third-best fiscal year since 2004.
As of September 30, the fund’s 30-day SEC yield stood at 2.66%, down slightly from a year ago and still about 1 percentage point higher than that of the broad U.S. stock market, as measured by the yield of Vanguard Total Stock Market Index Fund.
Brief patchiness for stocks didn’t hinder strong returns
The broad U.S. stock market managed a robust return of nearly 18% for the 12 months ended September 30 despite stumbling later in the period. Generally strong corporate profits and progress in the U.S. economy carried the markets through most of the fiscal year. Toward the end, however, high stock valuations,
2
international tensions, the unsettled global economy, and the Federal Reserve’s gradual shift from its accommodative policies weighed on results.
During the final months of the fiscal year, the performance gap between U.S. and international stocks widened amid tensions in the Middle East and Ukraine and concerns over China’s slower growth and Europe’s slumping economy. In the end, international stocks returned about 5%. Emerging markets returned more than 6%, ahead of developed European markets; weakness in Japan weighed on the developed Pacific region.
Bonds bounced back strongly despite a pause late in the year
Bond returns, which were surprisingly robust through much of the 12 months, also met resistance late in the period. Still, the broad U.S. taxable bond market returned 3.96%, a significant recovery from its negative outcome a year ago.
Since January, the Fed has pared back its bond-buying program, with the aim of ending it in October. For most of the fiscal year, interest rates did not rise as analysts had predicted. The yield of the 10-year U.S. Treasury note ended September at 2.48%, down from 2.63% a year earlier. (Bond prices and yields move in opposite directions.)
| Market Barometer | |||
| Average Annual Total Returns | |||
| Periods Ended September 30, 2014 | |||
| One | Three | Five | |
| Year | Years | Years | |
| Stocks | |||
| Russell 1000 Index (Large-caps) | 19.01% | 23.23% | 15.90% |
| Russell 2000 Index (Small-caps) | 3.93 | 21.26 | 14.29 |
| Russell 3000 Index (Broad U.S. market) | 17.76 | 23.08 | 15.78 |
| FTSE All-World ex US Index (International) | 5.11 | 12.12 | 6.31 |
| Bonds | |||
| Barclays U.S. Aggregate Bond Index (Broad taxable market) | 3.96% | 2.43% | 4.12% |
| Barclays Municipal Bond Index (Broad tax-exempt market) | 7.93 | 4.56 | 4.67 |
| Citigroup Three-Month U.S. Treasury Bill Index | 0.04 | 0.04 | 0.06 |
| CPI | |||
| Consumer Price Index | 1.66% | 1.61% | 1.96% |
3
Municipal bonds returned 7.93% as strong investor demand and a limited supply of new issues helped drive up prices.
After this advance for U.S. taxable and tax-exempt bonds, it’s worth remembering that the current low yields imply lower future returns. As yields drop, the scope for further declines—and increases in prices—diminishes.
Money market funds and savings accounts posted negligible returns as the Fed kept its target for short-term interest rates at 0%–0.25%.
International bond markets (as measured by the Barclays Global Aggregate Index ex USD) returned –0.81% after sinking in September.
All industry groups advanced, but stock selection was mixed
Your fund’s advisors, Wellington Management Company and Vanguard Equity Investment Group, through its Quantitative Equity Group, invest in high-quality, well-established, mostly large companies with above-average current dividend yields and potential for long-term capital appreciation. This often leads them to invest in out-of-favor industries, where companies trade at a discount to the overall market’s valuation.
Favoring large-capitalization stocks proved rewarding, as they broadly outpaced small-company stocks in the fiscal year. (For example, the Russell 1000 Index returned about 19%, while its small-cap
| Expense Ratios | |||
| Your Fund Compared With Its Peer Group | |||
| Investor | Admiral | Peer Group | |
| Shares | Shares | Average | |
| Equity Income Fund | 0.30% | 0.21% | 1.22% |
The fund expense ratios shown are from the prospectus dated January 27, 2014, and represent estimated costs for the current fiscal year. For
the fiscal year ended September 30, 2014, the fund’s expense ratios were 0.29% for Investor Shares and 0.20% for Admiral Shares. The
peer-group expense ratio is derived from data provided by Lipper, a Thomson Reuters Company, and captures information through year-end
2013.
Peer group: Equity Income Funds.
4
counterpart returned about 4%.) And your fund’s holdings in all ten industry sectors posted gains, mostly in the double digits.
Information technology led the way with a return of nearly 32%, powered by exceptional returns among software and hardware holdings. Two other large sectors, financials and health care, were also among the best performers. Banks continue to report stronger balance sheets. And major pharmaceutical firms, the bulk of the fund’s health care holdings, have benefited from merger-and-acquisition activity and advances in genetically targeted treatments for diseases. Together, these three sectors contributed more than half of the fund’s total return for the year.
Notwithstanding this success, information technology held back the fund’s results compared with its index. The advisors’ somewhat lighter stake in IT was a factor, as were the index’s even stronger returns. There were also some disappointments among industrials.
The Advisors’ Report that follows this letter provides additional details about the management of the fund during the fiscal year.
Long-term results were solid over a decade of ups and downs
For the ten years ended September 30, 2014, the Equity Income Fund’s average annual return for Investor Shares was
| Total Returns | |
| Ten Years Ended September 30, 2014 | |
| Average | |
| Annual Return | |
| Equity Income Fund Investor Shares | 8.85% |
| Spliced Equity Income Index | 8.95 |
| Equity Income Funds Average | 7.47 |
For a benchmark description, see the Glossary.
Equity Income Funds Average: Derived from data provided by Lipper, a Thomson Reuters Company.
The figures shown represent past performance, which is not a guarantee of future results. (Current performance may be
lower or higher than the performance data cited. For performance data current to the most recent month-end, visit our
website at vanguard.com/performance.) Note, too, that both investment returns and principal value can fluctuate widely, so
an investor’s shares, when sold, could be worth more or less than their original cost.
5
8.85%, in line with its index—which of course incurs no expenses. Your fund outperformed its peer-group average by more than a percentage point, aided in part by Vanguard’s focus on low costs, which I address in my concluding remarks.
For income-oriented investors, another indicator of the fund’s success is its performance compared with the broad U.S. market. For the ten years, your fund’s dividend-oriented strategy outpaced the 8.59% return of the broad U.S. stock market, as measured by the Dow Jones U.S. Total Stock Market Float Adjusted Index. Of course, there’s no guarantee that a strategy focused on dividend-paying stocks will always outperform the broad market.
High costs don’t equal strong fund performance
The adage “you get what you pay for” doesn’t apply to mutual funds. In fact, the reverse is true: Research suggests that higher costs are consistent with weaker returns. (See, for example, Shopping for Alpha: You Get What You Don’t Pay For at vanguard.com/research.)
Shouldn’t paying the highest fees allow you to purchase the services of the greatest talents and therefore get the best returns? As it turns out, the data don’t support that argument. The explanation is simple: Every dollar paid for management fees is a dollar less earning potential return. Keeping expenses down can help narrow the gap between what the markets return and what investors actually earn.
That’s why Vanguard always seeks to minimize costs. Indexing, of course, is the purest form of low-cost investing. And we negotiate low fees for the Equity Income Fund and our other actively managed funds, which are run by world-class advisors. It’s a strategy that reflects decades of experience and research, boiled down to one tenet: The less you pay, the more you earn.
As always, thank you for investing with Vanguard.
Sincerely,

F. William McNabb III
Chairman and Chief Executive Officer
October 17, 2014
6
Advisors’ Report
For the fiscal year ended September 30, 2014, Vanguard Equity Income Fund returned more than 16%, trailing the 19.02% return of its benchmark, the FTSE High Dividend Yield Index. The fund’s return outperformed its peer-group average return. This reflects the combined results of your fund’s two independent investment advisors, Wellington Management Company and Vanguard Equity Investment Group. The use of two advisors provides exposure to distinct yet complementary investment approaches, enhancing the diversification of your fund. It is not uncommon for
different advisors to have different views about individual securities or the broader investment environment.
The advisors, the percentage and amount of the fund’s assets each manages, and brief descriptions of their investment strategies are presented in the table below. The advisors have also prepared a discussion of the investment environment that existed during the fiscal year and of how their portfolio positioning reflects this assessment. These comments were prepared on October 10, 2014.
| Vanguard Equity Income Fund Investment Advisors | |||
| Fund Assets Managed | |||
| Investment Advisor | % | $ Million | Investment Strategy |
| Wellington Management | 64 | 11,361 | A fundamental approach to seeking desirable stocks. |
| Company, LLP | Our selections typically offer above-average dividend | ||
| yields, below-average valuations, and the potential for | |||
| dividend increases in the future. | |||
| Vanguard Equity Investment | 34 | 6,146 | Employs a quantitative fundamental management |
| Group | approach, using models that assess valuation, growth | ||
| prospects, management decisions, market sentiment, | |||
| and earnings and balance-sheet quality of companies | |||
| as compared with their peers. | |||
| Cash Investments | 2 | 340 | These short-term reserves are invested by Vanguard in |
| equity index products to simulate investment in stocks. | |||
| Each advisor may also maintain a modest cash | |||
| position. | |||
7
Wellington Management Company, llp
Portfolio Manager:
W. Michael Reckmeyer, III, CFA,
Senior Vice President
and Equity Portfolio Manager
The investment outlook became more challenging, given slowing economic growth in international markets, rising geopolitical risks, and uncertainties about the unwinding of quantitative easing. Growth has slowed in developed as well as emerging markets. Tensions have escalated in the Middle East and the former Soviet Union, as have risks of terrorism, cyber threats, and Ebola. In the United States, quantitative easing was expected to conclude at the end of October, adding uncertainty. International markets weakened because of these developments, but U.S. markets were relatively resilient (through the end of September) despite elevated valuations.
We continue to believe that U.S. economic growth will settle into a range of 2.5%–3%. The private sector has been growing in this range for the past few years, but this has been somewhat offset by declining government stimulus. As the stimulus dissipates, underlying growth should become more apparent. We remain encouraged by the steady employment gains, strong auto sales, and rising capital spending plans. Wage gains have been muted, but we are at the point in the economic cycle where we expect to see stronger wage growth emerge. Although we remain optimistic, there are risks that
U.S. economic activity will be hurt by the slowing global economies as well as the stronger U.S. dollar.
International growth has been disappointing. European growth has moderated: Germany’s economy is slowing, Italy is in a recession, and France essentially is in a recession. The United Kingdom remains resilient, but the prospect of rising interest rates may begin to dampen economic activity. Emerging markets have also slowed: Brazil is in a recession, and Russia likely is falling into a recession. China’s growth has slowed, so the government is taking steps to stabilize the economy, but the effectiveness of these policies is uncertain.
Significant purchases during the past 12 months included new positions in Home Depot, MetLife, AkzoNobel, and Enbridge. We also added to positions in Verizon and Wal-Mart. We eliminated our positions in Lowe’s, Chubb, and AT&T because of valuations, and in Stanley Black & Decker and International Paper because of eroding fundamentals.
Vanguard Equity Investment Group
Portfolio Managers:
James P. Stetler, Principal
James D. Troyer, CFA, Principal
Michael R. Roach, CFA
U.S. equities continued to produce impressive results, with the broad U.S. equity market returning almost 18%.
8
Large-capitalization stocks easily outpaced smaller-cap equities. The U.S. equity market continued to provide superior results relative to international developed-and emerging-market returns.
Performance within the FTSE High Dividend Yield Index benchmark, which returned about 19%, was broad-based, as all ten sector groups generated positive returns. Results were best in information technology, materials, and health care. Consumer discretionary companies, while positive, lagged.
Part of the strength in the U.S. equity markets can be attributed to continued accommodative central bank monetary policies coupled with lower volatility across financial markets. At the beginning of July, the Chicago Board Options Exchange Volatility Index (VIX) registered its lowest level, 10.3, in the last five years. Volatility began to rise again in August and September but still remained below its long-term average.
The labor market continued to recover as the fiscal year-end saw the unemployment rate fall to 5.9%—a level not seen since July 2008. In addition, personal income has expanded and savings rates have dropped slightly, indicating possible consumer spending increases. Second-quarter GDP growth recovered from a disappointing first quarter, and both manufacturing and nonmanufacturing activity indexes are moving higher.
Still, there are many factors that can affect the markets in the coming months, including the U.S. midterm elections, the Federal Reserve’s winding down of its bond-purchase program at the end of October, speculation about when interest rates will rise, and geopolitical uncertainties.
While it’s important to understand how overall portfolio performance is affected by these macro factors, it should be pointed out that our approach to investing focuses on specific stock fundamentals. Our process compares all stocks in our investment universe within the same industry groups against one another in order to identify those that have characteristics that we believe will outperform over the long run. To do this, we use a strict quantitative process that concentrates on a combination of valuation and other factors that are focused on fundamental growth. Using the results of our model, we construct our portfolio, with the goal of maximizing expected return and minimizing exposure to risks that our research indicates do not improve returns, such as market capitalization and other risks relative to our benchmark. For the fiscal year, our valuation and growth models were strong contributors to performance. Our management decisions and quality models did not perform as expected, and our sentiment model was neutral.
9
Our company selection over the 12 months across sectors was effective: We produced positive stock selection results in seven of the ten sectors in the benchmark, with the strongest results in industrial and health care.
In industrials, General Dynamics, Lockheed Martin, and Northrop Grumman contributed most to relative performance. In health care, AbbVie, Eli Lilly, and Johnson & Johnson drove our positive results. Unfortunately, we could not avoid all poor performers. Our selections in the consumer discretionary sector were disappointing; Wynn Resorts and Garmin did not perform as expected.
10
Equity Income Fund
Fund Profile
As of September 30, 2014
| Share-Class Characteristics | ||
| Investor | Admiral | |
| Shares | Shares | |
| Ticker Symbol | VEIPX | VEIRX |
| Expense Ratio1 | 0.30% | 0.21% |
| 30-Day SEC Yield | 2.66% | 2.75% |
| Portfolio Characteristics | |||
| DJ | |||
| U.S. | |||
| FTSE High | Total | ||
| Dividend | Market | ||
| Yield | FA | ||
| Fund | Index | Index | |
| Number of Stocks | 176 | 391 | 3,768 |
| Median Market Cap | $96.8B | $141.1B | $51.1B |
| Price/Earnings Ratio | 16.4x | 16.6x | 20.5x |
| Price/Book Ratio | 2.6x | 2.6x | 2.6x |
| Return on Equity | 19.9% | 21.4% | 17.8% |
| Earnings Growth | |||
| Rate | 13.4% | 12.9% | 15.2% |
| Dividend Yield | 3.0% | 3.1% | 1.9% |
| Foreign Holdings | 10.2% | 0.0% | 0.0% |
| Turnover Rate | 33% | — | — |
| Short-Term Reserves | 1.0% | — | — |
| Sector Diversification (% of equity exposure) | |||
| FTSE High | DJ | ||
| Dividend | U.S. Total | ||
| Yield | Market | ||
| Fund | Index | FA Index | |
| Consumer | |||
| Discretionary | 6.1% | 5.4% | 12.5% |
| Consumer Staples | 12.4 | 13.7 | 8.3 |
| Energy | 11.4 | 11.4 | 9.1 |
| Financials | 15.9 | 12.3 | 17.4 |
| Health Care | 13.2 | 11.2 | 13.5 |
| Industrials | 12.0 | 11.1 | 11.2 |
| Information | |||
| Technology | 14.3 | 18.6 | 19.0 |
| Materials | 3.7 | 4.1 | 3.8 |
| Telecommunication | |||
| Services | 4.7 | 5.1 | 2.2 |
| Utilities | 6.3 | 7.1 | 3.0 |
| Volatility Measures | ||
| FTSE High | DJ | |
| Dividend | U.S. Total | |
| Yield | Market | |
| Index | FA Index | |
| R-Squared | 0.98 | 0.88 |
| Beta | 1.02 | 0.82 |
| These measures show the degree and timing of the fund’s fluctuations compared with the indexes over 36 months. | ||
| ||
| Ten Largest Holdings (% of total net assets) | ||
| Wells Fargo & Co. | Diversified Banks | 3.8% |
| Microsoft Corp. | Systems Software | 3.8 |
| Johnson & Johnson | Pharmaceuticals | 3.6 |
| Verizon Communications Integrated | ||
| Inc. | Telecommunication | |
| Services | 3.2 | |
| Exxon Mobil Corp. | Integrated Oil & Gas | 3.1 |
| Merck & Co. Inc. | Pharmaceuticals | 3.0 |
| Chevron Corp. | Integrated Oil & Gas | 2.8 |
| JPMorgan Chase & Co. | Diversified Banks | 2.8 |
| Apple Inc. | Technology | |
| Hardware, Storage & | ||
| Peripherals | 2.3 | |
| Intel Corp. | Semiconductors | 2.2 |
| Top Ten | 30.6% | |
| The holdings listed exclude any temporary cash investments and equity index products. | ||
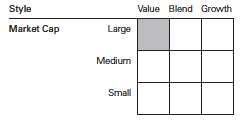
Investment Focus
1 The expense ratios shown are from the prospectus dated January 27, 2014, and represent estimated costs for the current fiscal year. For the fiscal
year ended September 30, 2014, the expense ratios were 0.29% for Investor Shares and 0.20% for Admiral Shares.
11
Equity Income Fund
Performance Summary
All of the returns in this report represent past performance, which is not a guarantee of future results that may be achieved by the fund. (Current performance may be lower or higher than the performance data cited. For performance data current to the most recent month-end, visit our website at vanguard.com/performance.) Note, too, that both investment returns and principal value can fluctuate widely, so an investor’s shares, when sold, could be worth more or less than their original cost. The returns shown do not reflect taxes that a shareholder would pay on fund distributions or on the sale of fund shares.
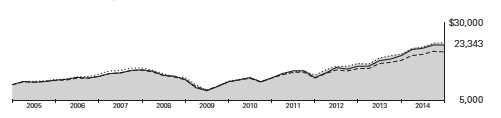
Cumulative Performance: September 30, 2004, Through September 30, 2014
Initial Investment of $10,000
| Average Annual Total Returns | |||||
| Periods Ended September 30, 2014 | |||||
| Final Value | |||||
| One | Five | Ten | of a $10,000 | ||
| Year | Years | Years | Investment | ||
| Equity Income Fund*Investor Shares | 16.62% | 16.23% | 8.85% | $23,343 | |
| •••••••• | Spliced Equity Income Index | 19.02 | 16.09 | 8.95 | 23,573 |
| – – – – | Equity Income Funds Average | 15.09 | 13.58 | 7.47 | 20,558 |
| Dow Jones U.S. Total Stock Market | |||||
| Float Adjusted Index | 17.69 | 15.84 | 8.59 | 22,805 | |
| For a benchmark description, see the Glossary. | |||||
| Equity Income Funds Average: Derived from data provided by Lipper, a Thomson Reuters Company. | |||||
| Final Value | ||||
| One | Five | Ten | of a $50,000 | |
| Year | Years | Years | Investment | |
| Equity Income Fund Admiral Shares | 16.70% | 16.34% | 8.96% | $117,971 |
| Spliced Equity Income Index | 19.02 | 16.09 | 8.95 | 117,864 |
| Dow Jones U.S. Total Stock Market Float | ||||
| Adjusted Index | 17.69 | 15.84 | 8.59 | 114,024 |
See Financial Highlights for dividend and capital gains information.
12
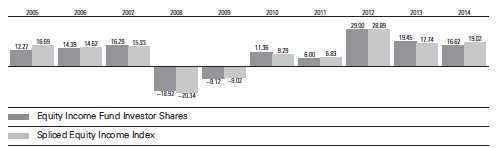
Equity Income Fund
Fiscal-Year Total Returns (%): September 30, 2004, Through September 30, 2014
13
Equity Income Fund
Financial Statements
Statement of Net Assets
As of September 30, 2014
The fund reports a complete list of its holdings in regulatory filings four times in each fiscal year, at the quarter-ends. For the second and fourth fiscal quarters, the lists appear in the fund’s semiannual and annual reports to shareholders. For the first and third fiscal quarters, the fund files the lists with the Securities and Exchange Commission on Form N-Q. Shareholders can look up the fund’s Forms N-Q on the SEC’s website at sec.gov. Forms N-Q may also be reviewed and copied at the SEC’s Public Reference Room (see the back cover of this report for further information).
| Market | ||
| Value | ||
| Shares | ($000) | |
| Common Stocks (97.5%)1 | ||
| Consumer Discretionary (5.8%) | ||
| Home Depot Inc. | 3,813,900 | 349,887 |
| McDonald’s Corp. | 1,811,505 | 171,749 |
| WPP plc | 6,011,071 | 120,424 |
| Thomson Reuters Corp. | 2,479,870 | 90,292 |
| Best Buy Co. Inc. | 1,081,200 | 36,318 |
| Kohl’s Corp. | 593,500 | 36,221 |
| Las Vegas Sands Corp. | 566,700 | 35,254 |
| H&R Block Inc. | 1,117,900 | 34,666 |
| Omnicom Group Inc. | 486,000 | 33,466 |
| Cablevision Systems | ||
| Corp. Class A | 1,859,900 | 32,567 |
| Garmin Ltd. | 575,800 | 29,936 |
| Mattel Inc. | 738,560 | 22,637 |
| Time Warner Cable Inc. | 126,200 | 18,108 |
| Ford Motor Co. | 884,300 | 13,079 |
| Carnival Corp. | 250,300 | 10,055 |
| Autoliv Inc. | 68,100 | 6,260 |
| Cracker Barrel Old | ||
| Country Store Inc. | 13,000 | 1,341 |
| Cato Corp. Class A | 12,900 | 445 |
| 1,042,705 | ||
| Consumer Staples (12.1%) | ||
| Procter & Gamble Co. | 3,353,440 | 280,817 |
| Wal-Mart Stores Inc. | 3,481,792 | 266,253 |
| Philip Morris | ||
| International Inc. | 3,012,145 | 251,213 |
| Kraft Foods Group Inc. | 4,109,270 | 231,763 |
| Unilever NV | 4,108,020 | 163,006 |
| Altria Group Inc. | 3,526,875 | 162,025 |
| PepsiCo Inc. | 1,643,190 | 152,964 |
| Diageo plc ADR | 889,500 | 102,648 |
| Anheuser-Busch | ||
| InBev NV ADR | 891,860 | 98,863 |
| Coca-Cola Co. | 2,183,464 | 93,147 |
| Kimberly-Clark Corp. | 809,688 | 87,098 |
| British American | ||
| Tobacco plc | 1,401,368 | 78,969 |
| Sysco Corp. | 1,830,860 | 69,481 |
| Dr Pepper Snapple | ||
| Group Inc. | 661,400 | 42,535 |
| Molson Coors Brewing | ||
| Co. Class B | 538,400 | 40,078 |
| Reynolds American Inc. | 308,400 | 18,196 |
| Clorox Co. | 71,600 | 6,876 |
| Ingredion Inc. | 41,500 | 3,145 |
| Vector Group Ltd. | 104,790 | 2,324 |
| General Mills Inc. | 23,000 | 1,160 |
| 2,152,561 | ||
| Energy (11.1%) | ||
| Exxon Mobil Corp. | 5,880,210 | 553,034 |
| Chevron Corp. | 4,198,770 | 500,997 |
| ConocoPhillips | 2,948,320 | 225,606 |
| Occidental | ||
| Petroleum Corp. | 2,195,730 | 211,119 |
| Suncor Energy Inc. | 5,607,410 | 202,708 |
| Enbridge Inc. | 2,365,100 | 113,241 |
| Royal Dutch Shell plc | ||
| Class B | 2,186,340 | 86,436 |
| ONEOK Inc. | 608,100 | 39,861 |
| Helmerich & Payne Inc. | 338,300 | 33,109 |
| Targa Resources Corp. | 86,400 | 11,765 |
| 1,977,876 | ||
| Financials (15.5%) | ||
| Wells Fargo & Co. | 13,202,640 | 684,821 |
| JPMorgan Chase & Co. | 8,256,930 | 497,398 |
| Marsh & McLennan | ||
| Cos. Inc. | 6,692,970 | 350,310 |
| PNC Financial Services | ||
| Group Inc. | 2,596,392 | 222,199 |
| BlackRock Inc. | 592,930 | 194,671 |
| ACE Ltd. | 1,440,540 | 151,069 |
| MetLife Inc. | 2,555,900 | 137,303 |
| M&T Bank Corp. | 947,090 | 116,767 |
| US Bancorp | 2,348,340 | 98,231 |
| Travelers Cos. Inc. | 582,000 | 54,673 |
| Navient Corp. | 2,054,500 | 36,385 |
14
Equity Income Fund
| Market | ||
| Value | ||
| Shares | ($000) | |
| Axis Capital Holdings Ltd. | 736,000 | 34,835 |
| PartnerRe Ltd. | 314,400 | 34,549 |
| Lazard Ltd. Class A | 658,700 | 33,396 |
| Validus Holdings Ltd. | 841,800 | 32,948 |
| Fifth Third Bancorp | 772,200 | 15,460 |
| Invesco Ltd. | 378,900 | 14,959 |
| People’s United | ||
| Financial Inc. | 816,700 | 11,818 |
| Home Loan Servicing | ||
| Solutions Ltd. | 282,600 | 5,988 |
| Janus Capital Group Inc. | 409,600 | 5,956 |
| Huntington | ||
| Bancshares Inc. | 610,900 | 5,944 |
| Capitol Federal | ||
| Financial Inc. | 483,000 | 5,709 |
| Principal Financial | ||
| Group Inc. | 96,500 | 5,063 |
| National Penn | ||
| Bancshares Inc. | 372,600 | 3,618 |
| Plum Creek | ||
| Timber Co. Inc. | 82,000 | 3,199 |
| First Commonwealth | ||
| Financial Corp. | 267,000 | 2,240 |
| Mercury General Corp. | 35,000 | 1,708 |
| Hanover Insurance | ||
| Group Inc. | 20,600 | 1,265 |
| Boston Private Financial | ||
| Holdings Inc. | 29,300 | 363 |
| 2,762,845 | ||
| Health Care (12.8%) | ||
| Johnson & Johnson | 6,110,845 | 651,355 |
| Merck & Co. Inc. | 8,993,424 | 533,130 |
| Pfizer Inc. | 11,255,544 | 332,826 |
| Roche Holding AG | 752,580 | 222,239 |
| Eli Lilly & Co. | 2,230,449 | 144,645 |
| Bristol-Myers Squibb Co. | 2,144,432 | 109,752 |
| AstraZeneca plc ADR | 1,451,049 | 103,663 |
| AbbVie Inc. | 1,664,300 | 96,130 |
| Baxter International Inc. | 1,308,450 | 93,908 |
| Quest Diagnostics Inc. | 122,100 | 7,409 |
| 2,295,057 | ||
| Industrials (11.7%) | ||
| General Electric Co. | 14,217,752 | 364,259 |
| United | ||
| Technologies Corp. | 2,611,980 | 275,825 |
| Eaton Corp. plc | 3,958,710 | 250,863 |
| 3M Co. | 1,627,230 | 230,546 |
| Waste Management Inc. | 2,934,990 | 139,500 |
| United Parcel Service Inc. | ||
| Class B | 1,397,030 | 137,314 |
| Lockheed Martin Corp. | 634,220 | 115,923 |
| Caterpillar Inc. | 946,700 | 93,752 |
| Illinois Tool Works Inc. | 1,078,070 | 91,011 |
| Boeing Co. | 710,800 | 90,542 |
| Schneider Electric SE | 1,062,371 | 81,508 |
| General Dynamics Corp. | 492,600 | 62,604 |
| Northrop Grumman Corp. | 253,013 | 33,337 |
| Pitney Bowes Inc. | 1,288,200 | 32,192 |
| L-3 Communications | ||
| Holdings Inc. | 266,700 | 31,716 |
| Copa Holdings SA Class A | 256,500 | 27,520 |
| Stanley Black & | ||
| Decker Inc. | 75,300 | 6,686 |
| GATX Corp. | 85,900 | 5,014 |
| Norfolk Southern Corp. | 44,400 | 4,955 |
| Iron Mountain Inc. | 99,200 | 3,239 |
| Emerson Electric Co. | 32,700 | 2,046 |
| Republic Services Inc. | ||
| Class A | 50,100 | 1,955 |
| 2,082,307 | ||
| Information Technology (13.7%) | ||
| Microsoft Corp. | 14,530,619 | 673,640 |
| Apple Inc. | 4,019,000 | 404,914 |
| Intel Corp. | 11,458,650 | 398,990 |
| Cisco Systems Inc. | 10,126,280 | 254,879 |
| Analog Devices Inc. | 3,963,260 | 196,142 |
| Symantec Corp. | 4,976,600 | 117,000 |
| Texas Instruments Inc. | 2,280,800 | 108,771 |
| Maxim Integrated | ||
| Products Inc. | 2,953,317 | 89,308 |
| Seagate Technology plc | 696,400 | 39,883 |
| Broadridge Financial | ||
| Solutions Inc. | 839,500 | 34,948 |
| Harris Corp. | 510,800 | 33,917 |
| Lexmark International Inc. | ||
| Class A | 722,700 | 30,715 |
| Computer Sciences Corp. | 466,700 | 28,539 |
| Cypress | ||
| Semiconductor Corp. | 2,300,500 | 22,717 |
| Western Union Co. | 663,300 | 10,639 |
| Diebold Inc. | 201,000 | 7,099 |
| Leidos Holdings Inc. | 63,400 | 2,177 |
| EarthLink Holdings Corp. | 120,300 | 411 |
| 2,454,689 | ||
| Materials (3.6%) | ||
| Dow Chemical Co. | 3,016,020 | 158,160 |
| EI du Pont | ||
| de Nemours & Co. | 1,608,217 | 115,406 |
| Akzo Nobel NV | 1,476,277 | 101,009 |
| Nucor Corp. | 1,697,110 | 92,119 |
| LyondellBasell | ||
| Industries NV Class A | 628,400 | 68,282 |
| Avery Dennison Corp. | 683,700 | 30,527 |
| Huntsman Corp. | 761,400 | 19,789 |
| Bemis Co. Inc. | 344,600 | 13,102 |
| International Paper Co. | 260,000 | 12,413 |
| Compass Minerals | ||
| International Inc. | 119,167 | 10,043 |
15
Equity Income Fund
| Market | ||
| Value | ||
| Shares | ($000) | |
| Steel Dynamics Inc. | 348,900 | 7,889 |
| Sonoco Products Co. | 148,300 | 5,827 |
| Innophos Holdings Inc. | 47,700 | 2,628 |
| Scotts Miracle-Gro Co. | ||
| Class A | 40,800 | 2,244 |
| A Schulman Inc. | 57,200 | 2,068 |
| Olin Corp. | 69,200 | 1,747 |
| RPM International Inc. | 36,400 | 1,666 |
| 644,919 | ||
| Other (0.4%) | ||
| ^,2 Vanguard High Dividend | ||
| Yield ETF | 1,047,950 | 69,594 |
| Telecommunication Services (4.6%) | ||
| Verizon | ||
| Communications Inc. | 11,443,086 | 572,040 |
| AT&T Inc. | 3,900,397 | 137,450 |
| BCE Inc. | 1,996,900 | 85,389 |
| CenturyLink Inc. | 343,800 | 14,058 |
| Frontier | ||
| Communications Corp. | 1,412,900 | 9,198 |
| 818,135 | ||
| Utilities (6.2%) | ||
| National Grid plc | 11,890,727 | 170,930 |
| UGI Corp. | 4,689,390 | 159,861 |
| Northeast Utilities | 2,742,890 | 121,510 |
| Xcel Energy Inc. | 3,921,590 | 119,216 |
| NextEra Energy Inc. | 999,916 | 93,872 |
| Southern Co. | 1,342,900 | 58,618 |
| Exelon Corp. | 1,466,500 | 49,993 |
| American Electric | ||
| Power Co. Inc. | 914,800 | 47,762 |
| Edison International | 764,300 | 42,740 |
| Entergy Corp. | 546,200 | 42,238 |
| AGL Resources Inc. | 669,400 | 34,367 |
| Vectren Corp. | 760,600 | 30,348 |
| Great Plains Energy Inc. | 955,200 | 23,087 |
| Westar Energy Inc. | ||
| Class A | 672,500 | 22,946 |
| New Jersey | ||
| Resources Corp. | 301,700 | 15,239 |
| Atmos Energy Corp. | 266,900 | 12,731 |
| Consolidated Edison Inc. | 171,800 | 9,734 |
| Ameren Corp. | 249,100 | 9,548 |
| FirstEnergy Corp. | 211,200 | 7,090 |
| Duke Energy Corp. | 89,600 | 6,699 |
| Portland General | ||
| Electric Co. | 167,000 | 5,364 |
| Empire District | ||
| Electric Co. | 204,914 | 4,949 |
| Pinnacle West | ||
| Capital Corp. | 85,900 | 4,693 |
| Alliant Energy Corp. | 76,000 | 4,211 | |
| SCANA Corp. | 74,700 | 3,706 | |
| WGL Holdings Inc. | 28,900 | 1,217 | |
| Avista Corp. | 21,200 | 647 | |
| 1,103,316 | |||
| Total Common Stocks | |||
| (Cost $13,521,333) | 17,404,004 | ||
| Temporary Cash Investments (2.7%)1 | |||
| Money Market Fund (1.6%) | |||
| 3,4 | Vanguard Market | ||
| Liquidity Fund, | |||
| 0.109% | 275,860,902 | 275,861 | |
| Face | |||
| Amount | |||
| ($000) | |||
| Repurchase Agreement (1.0%) | |||
| Goldman Sachs & Co. | |||
| 0.01%, 10/1/14 (Dated | |||
| 9/30/14, Repurchase | |||
| Value $176,400,000, | |||
| collateralized by Federal | |||
| National Mortgage Assn. | |||
| 3.500%, 4/1/26–8/1/42, | |||
| with a value of | |||
| $179,928,000) | 176,400 | 176,400 | |
| U.S. Government and Agency Obligations (0.1%) | |||
| 5 | Federal Home Loan | ||
| Bank Discount Notes, | |||
| 0.078%, 10/1/14 | 100 | 100 | |
| 5 | Federal Home Loan | ||
| Bank Discount Notes, | |||
| 0.079%, 10/8/14 | 500 | 500 | |
| 5,6 | Federal Home Loan | ||
| Bank Discount Notes, | |||
| 0.085%, 10/15/14 | 10,000 | 10,000 | |
| 5,6 | Federal Home Loan | ||
| Bank Discount Notes, | |||
| 0.074%, 12/3/14 | 2,000 | 2,000 | |
| 5,6 | Federal Home Loan | ||
| Bank Discount Notes, | |||
| 0.100%, 2/4/15 | 5,000 | 4,998 | |
| 17,598 | |||
| Total Temporary Cash Investments | |||
| (Cost $469,859) | 469,859 | ||
| Total Investments (100.2%) | |||
| (Cost $13,991,192) | 17,873,863 | ||
16
Equity Income Fund
| Market | |
| Value | |
| ($000) | |
| Other Assets and Liabilities (-0.2%) | |
| Other Assets | 73,782 |
| Liabilities4 | (100,766) |
| (26,984) | |
| Net Assets (100%) | 17,846,879 |
| At September 30, 2014, net assets consisted of: | |
| Amount | |
| ($000) | |
| Paid-in Capital | 13,400,651 |
| Undistributed Net Investment Income | 2,145 |
| Accumulated Net Realized Gains | 563,261 |
| Unrealized Appreciation (Depreciation) | |
| Investment Securities | 3,882,671 |
| Futures Contracts | (1,727) |
| Foreign Currencies | (122) |
| Net Assets | 17,846,879 |
| Amount | |
| ($000) | |
| Investor Shares—Net Assets | |
| Applicable to 177,006,856 outstanding | |
| $.001 par value shares of beneficial | |
| interest (unlimited authorization) | 5,527,723 |
| Net Asset Value Per Share— | |
| Investor Shares | $31.23 |
| Admiral Shares—Net Assets | |
| Applicable to 188,209,413 outstanding | |
| $.001 par value shares of beneficial | |
| interest (unlimited authorization) | 12,319,156 |
| Net Asset Value Per Share— | |
| Admiral Shares | $65.45 |
See Note A in Notes to Financial Statements.
^ Includes partial security positions on loan to broker-dealers. The total value of securities on loan is $1,846,000.
1 The fund invests a portion of its cash reserves in equity markets through the use of index futures contracts. After giving effect to futures
investments, the fund’s effective common stock and temporary cash investment positions represent 99.2% and 1.0%, respectively, of
net assets.
2 Considered an affiliated company of the fund as the issuer is another member of The Vanguard Group.
3 Affiliated money market fund available only to Vanguard funds and certain trusts and accounts managed by Vanguard. Rate shown is
the 7-day yield.
4 Includes $1,890,000 of collateral received for securities on loan.
5 The issuer operates under a congressional charter; its securities are generally neither guaranteed by the U.S. Treasury nor backed by
the full faith and credit of the U.S. government.
6 Securities with a value of $14,099,000 have been segregated as initial margin for open futures contracts.
ADR—American Depositary Receipt.
See accompanying Notes, which are an integral part of the Financial Statements.
17
Equity Income Fund
Statement of Operations
| Year Ended | |
| September 30, 2014 | |
| ($000) | |
| Investment Income | |
| Income | |
| Dividends1,2 | 490,769 |
| Interest2 | 401 |
| Securities Lending | 1,330 |
| Total Income | 492,500 |
| Expenses | |
| Investment Advisory Fees—Note B | |
| Basic Fee | 12,425 |
| Performance Adjustment | (260) |
| The Vanguard Group—Note C | |
| Management and Administrative—Investor Shares | 10,123 |
| Management and Administrative—Admiral Shares | 11,316 |
| Marketing and Distribution—Investor Shares | 1,270 |
| Marketing and Distribution—Admiral Shares | 2,401 |
| Custodian Fees | 157 |
| Auditing Fees | 34 |
| Shareholders’ Reports—Investor Shares | 136 |
| Shareholders’ Reports—Admiral Shares | 86 |
| Trustees’ Fees and Expenses | 26 |
| Total Expenses | 37,714 |
| Net Investment Income | 454,786 |
| Realized Net Gain (Loss) | |
| Investment Securities Sold2 | 729,916 |
| Futures Contracts | 40,827 |
| Foreign Currencies | (46) |
| Realized Net Gain (Loss) | 770,697 |
| Change in Unrealized Appreciation (Depreciation) | |
| Investment Securities | 1,173,606 |
| Futures Contracts | 2,074 |
| Foreign Currencies | (183) |
| Change in Unrealized Appreciation (Depreciation) | 1,175,497 |
| Net Increase (Decrease) in Net Assets Resulting from Operations | 2,400,980 |
| 1 Dividends are net of foreign withholding taxes of $4,123,000. | |
| 2 Dividend income, interest income, and realized net gain (loss) from affiliated companies of the fund were $1,968,000, $327,000, | |
| and $34,257,000, respectively. | |
See accompanying Notes, which are an integral part of the Financial Statements.
18
Equity Income Fund
Statement of Changes in Net Assets
| Year Ended September 30, | ||
| 2014 | 2013 | |
| ($000) | ($000) | |
| Increase (Decrease) in Net Assets | ||
| Operations | ||
| Net Investment Income | 454,786 | 330,626 |
| Realized Net Gain (Loss) | 770,697 | 565,543 |
| Change in Unrealized Appreciation (Depreciation) | 1,175,497 | 1,113,922 |
| Net Increase (Decrease) in Net Assets Resulting from Operations | 2,400,980 | 2,010,091 |
| Distributions | ||
| Net Investment Income | ||
| Investor Shares | (142,170) | (122,346) |
| Admiral Shares | (304,850) | (208,254) |
| Realized Capital Gain1 | ||
| Investor Shares | (136,041) | — |
| Admiral Shares | (265,749) | — |
| Total Distributions | (848,810) | (330,600) |
| Capital Share Transactions | ||
| Investor Shares | 165,292 | 65,329 |
| Admiral Shares | 2,156,810 | 2,886,791 |
| Net Increase (Decrease) from Capital Share Transactions | 2,322,102 | 2,952,120 |
| Total Increase (Decrease) | 3,874,272 | 4,631,611 |
| Net Assets | ||
| Beginning of Period | 13,972,607 | 9,340,996 |
| End of Period2 | 17,846,879 | 13,972,607 |
| 1 Includes fiscal 2014 short-term gain distributions totaling $18,677,000. Short-term gain distributions are treated as ordinary income dividends for tax purposes. | ||
| 2 Net Assets—End of Period includes undistributed (overdistributed) net investment income of $2,145,000 and ($5,575,000). | ||
See accompanying Notes, which are an integral part of the Financial Statements.
19
Equity Income Fund
Financial Highlights
| Investor Shares | |||||
| For a Share Outstanding | Year Ended September 30, | ||||
| Throughout Each Period | 2014 | 2013 | 2012 | 2011 | 2010 |
| Net Asset Value, Beginning of Period | $28.26 | $24.31 | $19.40 | $18.83 | $17.40 |
| Investment Operations | |||||
| Net Investment Income | . 826 | .732 | .667 | .596 | .526 |
| Net Realized and Unrealized Gain (Loss) | |||||
| on Investments | 3.754 | 3.946 | 4.908 | .567 | 1.432 |
| Total from Investment Operations | 4.580 | 4.678 | 5.575 | 1.163 | 1.958 |
| Distributions | |||||
| Dividends from Net Investment Income | (.811) | (.728) | (. 665) | (. 593) | (. 528) |
| Distributions from Realized Capital Gains | (.799) | — | — | — | — |
| Total Distributions | (1.610) | (.728) | (. 665) | (. 593) | (. 528) |
| Net Asset Value, End of Period | $31.23 | $28.26 | $24.31 | $19.40 | $18.83 |
| Total Return1 | 16.62% | 19.45% | 29.00% | 6.00% | 11.36% |
| Ratios/Supplemental Data | |||||
| Net Assets, End of Period (Millions) | $5,528 | $4,839 | $4,107 | $2,835 | $2,651 |
| Ratio of Total Expenses to Average Net Assets2 | 0.29% | 0.30% | 0.30% | 0.31% | 0.31% |
| Ratio of Net Investment Income to | |||||
| Average Net Assets | 2.74% | 2.81% | 3.00% | 2.89% | 2.88% |
| Portfolio Turnover Rate | 33% | 34% | 26% | 29% | 45% |
1 Total returns do not include account service fees that may have applied in the periods shown. Fund prospectuses provide information about
any applicable account service fees.
2 Includes performance-based investment advisory fee increases (decreases) of 0.00%, 0.00%, 0.00%, 0.01%, and 0.01%.
See accompanying Notes, which are an integral part of the Financial Statements.
20
Equity Income Fund
Financial Highlights
| Admiral Shares | |||||
| For a Share Outstanding | Year Ended September 30, | ||||
| Throughout Each Period | 2014 | 2013 | 2012 | 2011 | 2010 |
| Net Asset Value, Beginning of Period | $59.24 | $50.94 | $40.67 | $39.47 | $36.46 |
| Investment Operations | |||||
| Net Investment Income | 1.790 | 1.585 | 1.445 | 1.286 | 1.138 |
| Net Realized and Unrealized Gain (Loss) | |||||
| on Investments | 7.853 | 8.293 | 10.265 | 1.194 | 3.013 |
| Total from Investment Operations | 9.643 | 9.878 | 11.710 | 2.480 | 4.151 |
| Distributions | |||||
| Dividends from Net Investment Income | (1.758) | (1.578) | (1.440) | (1.280) | (1.141) |
| Distributions from Realized Capital Gains | (1.675) | — | — | — | — |
| Total Distributions | (3.433) | (1.578) | (1.440) | (1.280) | (1.141) |
| Net Asset Value, End of Period | $65.45 | $59.24 | $50.94 | $40.67 | $39.47 |
| Total Return | 16.70% | 19.61% | 29.06% | 6.10% | 11.50% |
| Ratios/Supplemental Data | |||||
| Net Assets, End of Period (Millions) | $12,319 | $9,134 | $5,234 | $2,614 | $1,667 |
| Ratio of Total Expenses to Average Net Assets1 | 0.20% | 0.21% | 0.21% | 0.22% | 0.22% |
| Ratio of Net Investment Income to | |||||
| Average Net Assets | 2.83% | 2.90% | 3.09% | 2.98% | 2.97% |
| Portfolio Turnover Rate | 33% | 34% | 26% | 29% | 45% |
| 1 Includes performance-based investment advisory fee increases (decreases) of 0.00%, 0.00%, 0.00%, 0.01%, and 0.01%. | |||||
See accompanying Notes, which are an integral part of the Financial Statements.
21
Equity Income Fund
Notes to Financial Statements
Vanguard Equity Income Fund is registered under the Investment Company Act of 1940 as an open-end investment company, or mutual fund. The fund offers two classes of shares: Investor Shares and Admiral Shares. Investor Shares are available to any investor who meets the fund’s minimum purchase requirements. Admiral Shares are designed for investors who meet certain administrative, service, and account-size criteria.
A. The following significant accounting policies conform to generally accepted accounting principles for U.S. investment companies. The fund consistently follows such policies in preparing its financial statements.
1. Security Valuation: Securities are valued as of the close of trading on the New York Stock Exchange (generally 4 p.m., Eastern time) on the valuation date. Equity securities are valued at the latest quoted sales prices or official closing prices taken from the primary market in which each security trades; such securities not traded on the valuation date are valued at the mean of the latest quoted bid and asked prices. Securities for which market quotations are not readily available, or whose values have been affected by events occurring before the fund’s pricing time but after the close of the securities’ primary markets, are valued at their fair values calculated according to procedures adopted by the board of trustees. These procedures include obtaining quotations from an independent pricing service, monitoring news to identify significant market- or security-specific events, and evaluating changes in the values of foreign market proxies (for example, ADRs, futures contracts, or exchange-traded funds), between the time the foreign markets close and the fund’s pricing time. When fair-value pricing is employed, the prices of securities used by a fund to calculate its net asset value may differ from quoted or published prices for the same securities. Investments in Vanguard Market Liquidity Fund are valued at that fund’s net asset value. Temporary cash investments acquired over 60 days to maturity are valued using the latest bid prices or using valuations based on a matrix system (which considers such factors as security prices, yields, maturities, and ratings), both as furnished by independent pricing services. Other temporary cash investments are valued at amortized cost, which approximates market value.
2. Foreign Currency: Securities and other assets and liabilities denominated in foreign currencies are translated into U.S. dollars using exchange rates obtained from an independent third party as of the fund’s pricing time on the valuation date. Realized gains (losses) and unrealized appreciation (depreciation) on investment securities include the effects of changes in exchange rates since the securities were purchased, combined with the effects of changes in security prices. Fluctuations in the value of other assets and liabilities resulting from changes in exchange rates are recorded as unrealized foreign currency gains (losses) until the assets or liabilities are settled in cash, at which time they are recorded as realized foreign currency gains (losses).
3. Futures Contracts: The fund uses index futures contracts to a limited extent, with the objective of maintaining full exposure to the stock market while maintaining liquidity. The fund may purchase or sell futures contracts to achieve a desired level of investment, whether to accommodate portfolio turnover or cash flows from capital share transactions. The primary risks associated with the use of futures contracts are imperfect correlation between changes in market values of stocks held by the fund and the prices of futures contracts, and the possibility of an illiquid market. Counterparty risk involving futures is mitigated because a regulated clearinghouse is the counterparty instead of the clearing broker. To further mitigate counterparty risk, the fund trades futures contracts on an exchange, monitors the financial strength of its clearing brokers and clearinghouse, and has entered into clearing agreements with its clearing brokers. The clearinghouse imposes initial margin requirements to secure the fund’s performance and requires daily settlement of variation margin representing changes in the market value of each contract.
22
Equity Income Fund
Futures contracts are valued at their quoted daily settlement prices. The aggregate settlement values of the contracts are not recorded in the Statement of Net Assets. Fluctuations in the value of the contracts are recorded in the Statement of Net Assets as an asset (liability) and in the Statement of Operations as unrealized appreciation (depreciation) until the contracts are closed, when they are recorded as realized futures gains (losses).
During the year ended September 30, 2014, the fund’s average investments in long and short futures contracts represented 2% and 0% of net assets, respectively, based on the average of aggregate settlement values at each quarter-end during the period.
4. Repurchase Agreements: The fund enters into repurchase agreements with institutional counterparties. Securities pledged as collateral to the fund under repurchase agreements are held by a custodian bank until the agreements mature. Each agreement requires that the market value of the collateral be sufficient to cover payments of interest and principal. The fund further mitigates its counterparty risk by entering into repurchase agreements only with a diverse group of prequalified counterparties, monitoring their financial strength, and entering into master repurchase agreements with its counterparties. The master repurchase agreements provide that, in the event of a counterparty’s default (including bankruptcy), the fund may terminate any repurchase agreements with that counterparty, determine the net amount owed, and sell or retain the collateral up to the net amount owed to the fund. Such action may be subject to legal proceedings, which may delay or limit the disposition of collateral.
5. Federal Income Taxes: The fund intends to continue to qualify as a regulated investment company and distribute all of its taxable income. Management has analyzed the fund’s tax positions taken for all open federal income tax years (September 30, 2011–2014), and has concluded that no provision for federal income tax is required in the fund’s financial statements.
6. Distributions: Distributions to shareholders are recorded on the ex-dividend date.
7. Securities Lending: To earn additional income, the fund lends its securities to qualified institutional borrowers. Security loans are required to be secured at all times by collateral in an amount at least equal to the market value of securities loaned. Daily market fluctuations could cause the value of loaned securities to be more or less than the value of the collateral received. When this occurs, the collateral is adjusted and settled on the next business day. The fund further mitigates its counterparty risk by entering into securities lending transactions only with a diverse group of prequalified counter-parties, monitoring their financial strength, and entering into master securities lending agreements with its counterparties. The master securities lending agreements provide that, in the event of a counterparty’s default (including bankruptcy), the fund may terminate any loans with that borrower, determine the net amount owed, and sell or retain the collateral up to the net amount owed to the fund; however, such actions may be subject to legal proceedings. While collateral mitigates counterparty risk, in the absence of a default the fund may experience delays and costs in recovering the securities loaned. The fund invests cash collateral received in Vanguard Market Liquidity Fund, and records a liability in the Statement of Net Assets for the return of the collateral, during the period the securities are on loan. Securities lending income represents fees charged to borrowers plus income earned on invested cash collateral, less expenses associated with the loan.
8. Credit Facility: The fund and certain other funds managed by The Vanguard Group participate in a $2.89 billion committed credit facility provided by a syndicate of lenders pursuant to a credit agreement that may be renewed annually; each fund is individually liable for its borrowings, if any,
23
Equity Income Fund
under the credit facility. Borrowings may be utilized for temporary and emergency purposes, and are subject to the fund’s regulatory and contractual borrowing restrictions. The participating funds are charged administrative fees and an annual commitment fee of 0.06% of the undrawn amount of the facility; these fees are allocated to the funds based on a method approved by the fund’s board of trustees and included in Management and Administrative expenses on the fund’s Statement of Operations. Any borrowings under this facility bear interest at a rate equal to the higher of the federal funds rate or LIBOR reference rate plus an agreed-upon spread.
The fund had no borrowings outstanding at September 30, 2014, or at any time during the period then ended.
9. Other: Dividend income is recorded on the ex-dividend date. Interest income includes income distributions received from Vanguard Market Liquidity Fund and is accrued daily. Premiums and discounts on debt securities purchased are amortized and accreted, respectively, to interest income over the lives of the respective securities. Security transactions are accounted for on the date securities are bought or sold. Costs used to determine realized gains (losses) on the sale of investment securities are those of the specific securities sold.
Each class of shares has equal rights as to assets and earnings, except that each class separately bears certain class-specific expenses related to maintenance of shareholder accounts (included in Management and Administrative expenses) and shareholder reporting. Marketing and distribution expenses are allocated to each class of shares based on a method approved by the board of trustees. Income, other non-class-specific expenses, and gains and losses on investments are allocated to each class of shares based on its relative net assets.
B. Wellington Management Company, LLP, provides investment advisory services to a portion of the fund for a fee calculated at an annual percentage rate of average net assets managed by the advisor. The basic fee of Wellington Management Company, LLP, is subject to quarterly adjustments based on performance for the preceding three years relative to the FTSE High Dividend Yield Index.
The Vanguard Group provides investment advisory services to a portion of the fund on an at-cost basis; the fund paid Vanguard advisory fees of $1,294,000 for the year ended September 30, 2014.
For the year ended September 30, 2014, the aggregate investment advisory fee represented an effective annual basic rate of 0.08% of the fund’s average net assets, before a decrease of $260,000 (0.00%) based on performance.
C. The Vanguard Group furnishes at cost corporate management, administrative, marketing, and distribution services. The costs of such services are allocated to the fund based on methods approved by the board of trustees. The fund has committed to invest up to 0.40% of its net assets in Vanguard. At September 30, 2014, the fund had contributed capital of $1,779,000 to Vanguard (included in Other Assets), representing 0.01% of the fund’s net assets and 0.71% of Vanguard’s capitalization. The fund’s trustees and officers are also directors and officers of Vanguard.
24
Equity Income Fund
D. Various inputs may be used to determine the value of the fund’s investments. These inputs are summarized in three broad levels for financial statement purposes. The inputs or methodologies used to value securities are not necessarily an indication of the risk associated with investing in those securities.
Level 1—Quoted prices in active markets for identical securities.
Level 2—Other significant observable inputs (including quoted prices for similar securities, interest rates, prepayment speeds, credit risk, etc.).
Level 3—Significant unobservable inputs (including the fund’s own assumptions used to determine the fair value of investments).
The following table summarizes the market value of the fund’s investments as of September 30, 2014, based on the inputs used to value them:
| Level 1 | Level 2 | Level 3 | |
| Investments | ($000) | ($000) | ($000) |
| Common Stocks | 16,542,489 | 861,515 | — |
| Temporary Cash Investments | 275,861 | 193,998 | — |
| Futures Contracts—Liabilities1 | (595) | — | — |
| Total | 16,817,755 | 1,055,513 | — |
| 1 Represents variation margin on the last day of the reporting period. | |||
E. At September 30, 2014, the aggregate settlement value of open futures contracts and the related unrealized appreciation (depreciation) were:
| ($000) | ||||
| Aggregate | ||||
| Number of | Settlement | Unrealized | ||
| Long (Short) | Value | Appreciation | ||
| Futures Contracts | Expiration | Contracts | Long (Short) | (Depreciation) |
| S&P 500 Index | December 2014 | 555 | 272,713 | (1,574) |
| E-mini S&P 500 Index | December 2014 | 205 | 20,146 | (153) |
| (1,727) |
Unrealized appreciation (depreciation) on open futures contracts is required to be treated as realized gain (loss) for tax purposes.
F. Distributions are determined on a tax basis and may differ from net investment income and realized capital gains for financial reporting purposes. Differences may be permanent or temporary. Permanent differences are reclassified among capital accounts in the financial statements to reflect their tax character. Temporary differences arise when certain items of income, expense, gain, or loss are recognized in different periods for financial statement and tax purposes. These differences will reverse at some time in the future. Differences in classification may also result from the treatment of short-term gains as ordinary income for tax purposes.
25
Equity Income Fund
During the year ended September 30, 2014, the fund realized net foreign currency losses of $46,000, which decreased distributable net income for tax purposes; accordingly, such losses have been reclassified from accumulated net realized gains to undistributed net investment income.
The fund used a tax accounting practice to treat a portion of the price of capital shares redeemed during the year as distributions from realized capital gains. Accordingly, the fund has reclassified $67,940,000 from accumulated net realized gains to paid-in capital.
For tax purposes, at September 30, 2014, the fund had $145,399,000 of ordinary income and $432,451,000 of long-term capital gains available for distribution.
At September 30, 2014, the cost of investment securities for tax purposes was $13,991,317,000. Net unrealized appreciation of investment securities for tax purposes was $3,882,546,000, consisting of unrealized gains of $3,947,836,000 on securities that had risen in value since their purchase and $65,290,000 in unrealized losses on securities that had fallen in value since their purchase.
G. During the year ended September 30, 2014, the fund purchased $7,124,926,000 of investment securities and sold $5,283,779,000 of investment securities, other than temporary cash investments.
H. Capital share transactions for each class of shares were:
| Year Ended September 30, | ||||
| 2014 | 2013 | |||
| Amount | Shares | Amount | Shares | |
| ($000) | (000) | ($000) | (000) | |
| Investor Shares | ||||
| Issued | 1,351,608 | 44,836 | 1,660,385 | 62,876 |
| Issued in Lieu of Cash Distributions | 261,200 | 8,834 | 113,805 | 4,261 |
| Redeemed | (1,447,516) | (47,855) | (1,708,861) | (64,935) |
| Net Increase (Decrease)—Investor Shares | 165,292 | 5,815 | 65,329 | 2,202 |
| Admiral Shares | ||||
| Issued | 3,402,387 | 53,571 | 3,878,687 | 69,335 |
| Issued in Lieu of Cash Distributions | 490,387 | 7,895 | 175,891 | 3,123 |
| Redeemed | (1,735,964) | (27,436) | (1,167,787) | (21,012) |
| Net Increase (Decrease) —Admiral Shares | 2,156,810 | 34,030 | 2,886,791 | 51,446 |
I. Management has determined that no material events or transactions occurred subsequent to September 30, 2014, that would require recognition or disclosure in these financial statements.
26
Report of Independent Registered
Public Accounting Firm
To the Board of Trustees of Vanguard Fenway Funds and the Shareholders of Vanguard Equity Income Fund:
In our opinion, the accompanying statement of net assets and the related statements of operations and of changes in net assets and the financial highlights present fairly, in all material respects, the financial position of Vanguard Equity Income Fund (constituting a separate portfolio of Vanguard Fenway Funds, hereafter referred to as the “Fund”) at September 30, 2014, the results of its operations for the year then ended, the changes in its net assets for each of the two years in the period then ended, and the financial highlights for each of the five years in the period then ended, in conformity with accounting principles generally accepted in the United States of America. These financial statements and financial highlights (hereafter referred to as “financial statements”) are the responsibility of the Fund’s management. Our responsibility is to express an opinion on these financial statements based on our audits.
We conducted our audits of these financial statements in accordance with the standards of the Public Company Accounting Oversight Board (United States). Those standards require that we plan and perform the audit to obtain reasonable assurance about whether the financial statements are free of material misstatement. An audit includes examining, on a test basis, evidence supporting the amounts and disclosures in the financial statements, assessing the accounting principles used and significant estimates made by management, and evaluating the overall financial statement presentation. We believe that our audits, which included confirmation of securities at September 30, 2014 by correspondence with the custodians and brokers and by agreement to the underlying ownership records of the transfer agent, provide a reasonable basis for our opinion.
/s/PricewaterhouseCoopers LLP
Philadelphia, Pennsylvania
November 14, 2014

This information for the fiscal year ended September 30, 2014, is included pursuant to provisions of
the Internal Revenue Code.
The fund distributed $436,785,000 as capital gain dividends (from net long-term capital gains) to
shareholders during the fiscal year.
For non-resident alien shareholders, 100% of short-term capital gain dividends distributed by the fund
are qualified short-term capital gains.
The fund distributed $457,702,000 of qualified dividend income to shareholders during the fiscal year.
For corporate shareholders, 66.6% of investment income (dividend income plus short-term gains,
if any) qualifies for the dividends-received deduction.
27
Your Fund’s After-Tax Returns
This table presents returns for your fund both before and after taxes. The after-tax returns are shown in two ways: (1) assuming that an investor owned the fund during the entire period and paid taxes on the fund’s distributions, and (2) assuming that an investor paid taxes on the fund’s distributions and sold all shares at the end of each period.
Calculations are based on the highest individual federal income tax and capital gains tax rates in effect at the times of the distributions and the hypothetical sales. State and local taxes were not considered. After-tax returns reflect any qualified dividend income, using actual prior-year figures and estimates for 2014. (In the example, returns after the sale of fund shares may be higher than those assuming no sale. This occurs when the sale would have produced a capital loss. The calculation assumes that the investor received a tax deduction for the loss.)
The table shows returns for Investor Shares only; returns for other share classes will differ. Please note that your actual after-tax returns will depend on your tax situation and may differ from those shown. Also note that if you own the fund in a tax-deferred account, such as an individual retirement account or a 401(k) plan, this information does not apply to you. Such accounts are not subject to current taxes.
Finally, keep in mind that a fund’s performance—whether before or after taxes—does not guarantee future results.
Average Annual Total Returns: Equity Income Fund Investor Shares
Periods Ended September 30, 2014
| One | Five | Ten | |
| Year | Years | Years | |
| Returns Before Taxes | 16.62% | 16.23% | 8.85% |
| Returns After Taxes on Distributions | 15.14 | 15.50 | 7.84 |
| Returns After Taxes on Distributions and Sale of Fund Shares | 10.47 | 13.12 | 7.14 |
28
About Your Fund’s Expenses
As a shareholder of the fund, you incur ongoing costs, which include costs for portfolio management, administrative services, and shareholder reports (like this one), among others. Operating expenses, which are deducted from a fund’s gross income, directly reduce the investment return of the fund.
A fund’s expenses are expressed as a percentage of its average net assets. This figure is known as the expense ratio. The following examples are intended to help you understand the ongoing costs (in dollars) of investing in your fund and to compare these costs with those of other mutual funds. The examples are based on an investment of $1,000 made at the beginning of the period shown and held for the entire period.
The accompanying table illustrates your fund’s costs in two ways:
• Based on actual fund return. This section helps you to estimate the actual expenses that you paid over the period. The ”Ending Account Value“ shown is derived from the fund‘s actual return, and the third column shows the dollar amount that would have been paid by an investor who started with $1,000 in the fund. You may use the information here, together with the amount you invested, to estimate the expenses that you paid over the period.
To do so, simply divide your account value by $1,000 (for example, an $8,600 account value divided by $1,000 = 8.6), then multiply the result by the number given for your fund under the heading ”Expenses Paid During Period.“
• Based on hypothetical 5% yearly return. This section is intended to help you compare your fund‘s costs with those of other mutual funds. It assumes that the fund had a yearly return of 5% before expenses, but that the expense ratio is unchanged. In this case—because the return used is not the fund’s actual return—the results do not apply to your investment. The example is useful in making comparisons because the Securities and Exchange Commission requires all mutual funds to calculate expenses based on a 5% return. You can assess your fund’s costs by comparing this hypothetical example with the hypothetical examples that appear in shareholder reports of other funds.
Note that the expenses shown in the table are meant to highlight and help you compare ongoing costs only and do not reflect transaction costs incurred by the fund for buying and selling securities. Further, the expenses do not include any purchase, redemption, or account service fees described in the fund prospectus. If such fees were applied to your account, your costs would be higher. Your fund does not carry a “sales load.”
The calculations assume no shares were bought or sold during the period. Your actual costs may have been higher or lower, depending on the amount of your investment and the timing of any purchases or redemptions.
You can find more information about the fund’s expenses, including annual expense ratios, in the Financial Statements section of this report. For additional information on operating expenses and other shareholder costs, please refer to your fund’s current prospectus.
29
| Six Months Ended September 30, 2014 | |||
| Beginning | Ending | Expenses | |
| Account Value | Account Value | Paid During | |
| Equity Income Fund | 3/31/2014 | 9/30/2014 | Period |
| Based on Actual Fund Return | |||
| Investor Shares | $1,000.00 | $1,045.62 | $1.49 |
| Admiral Shares | 1,000.00 | 1,046.14 | 1.03 |
| Based on Hypothetical 5% Yearly Return | |||
| Investor Shares | $1,000.00 | $1,023.61 | $1.47 |
| Admiral Shares | 1,000.00 | 1,024.07 | 1.01 |
The calculations are based on expenses incurred in the most recent six-month period. The fund’s annualized six-month expense ratios for that
period are 0.29% for Investor Shares and 0.20% for Admiral Shares. The dollar amounts shown as “Expenses Paid” are equal to the
annualized expense ratio multiplied by the average account value over the period, multiplied by the number of days in the most recent
six-month period, then divided by the number of days in the most recent 12-month period.
30
Glossary
30-Day SEC Yield. A fund’s 30-day SEC yield is derived using a formula specified by the U.S. Securities and Exchange Commission. Under the formula, data related to the fund’s security holdings in the previous 30 days are used to calculate the fund’s hypothetical net income for that period, which is then annualized and divided by the fund’s estimated average net assets over the calculation period. For the purposes of this calculation, a security’s income is based on its current market yield to maturity (for bonds), its actual income (for asset-backed securities), or its projected dividend yield (for stocks). Because the SEC yield represents hypothetical annualized income, it will differ—at times significantly—from the fund’s actual experience. As a result, the fund’s income distributions may be higher or lower than implied by the SEC yield.
Beta. A measure of the magnitude of a fund’s past share-price fluctuations in relation to the ups and downs of a given market index. The index is assigned a beta of 1.00. Compared with a given index, a fund with a beta of 1.20 typically would have seen its share price rise or fall by 12% when the index rose or fell by 10%. For this report, beta is based on returns over the past 36 months for both the fund and the index. Note that a fund’s beta should be reviewed in conjunction with its R-squared (see definition). The lower the R-squared, the less correlation there is between the fund and the index, and the less reliable beta is as an indicator of volatility.
Dividend Yield. Dividend income earned by stocks, expressed as a percentage of the aggregate market value (or of net asset value, for a fund). The yield is determined by dividing the amount of the annual dividends by the aggregate value (or net asset value) at the end of the period. For a fund, the dividend yield is based solely on stock holdings and does not include any income produced by other investments.
Earnings Growth Rate. The average annual rate of growth in earnings over the past five years for the stocks now in a fund.
Equity Exposure. A measure that reflects a fund’s investments in stocks and stock futures. Any holdings in short-term reserves are excluded.
Expense Ratio. A fund’s total annual operating expenses expressed as a percentage of the fund’s average net assets. The expense ratio includes management and administrative expenses, but does not include the transaction costs of buying and selling portfolio securities.
Foreign Holdings. The percentage of a fund represented by securities or depositary receipts of companies based outside the United States.
Inception Date. The date on which the assets of a fund (or one of its share classes) are first invested in accordance with the fund’s investment objective. For funds with a subscription period, the inception date is the day after that period ends. Investment performance is measured from the inception date.
Median Market Cap. An indicator of the size of companies in which a fund invests; the midpoint of market capitalization (market price x shares outstanding) of a fund’s stocks, weighted by the proportion of the fund’s assets invested in each stock. Stocks representing half of the fund’s assets have market capitalizations above the median, and the rest are below it.
Price/Book Ratio. The share price of a stock divided by its net worth, or book value, per share. For a fund, the weighted average price/book ratio of the stocks it holds.
31
Price/Earnings Ratio. The ratio of a stock’s current price to its per-share earnings over the past year. For a fund, the weighted average P/E of the stocks it holds. P/E is an indicator of market expectations about corporate prospects; the higher the P/E, the greater the expectations for a company’s future growth.
R-Squared. A measure of how much of a fund’s past returns can be explained by the returns from the market in general, as measured by a given index. If a fund’s total returns were precisely synchronized with an index’s returns, its R-squared would be 1.00. If the fund’s returns bore no relationship to the index’s returns, its R-squared would be 0. For this report, R-squared is based on returns over the past 36 months for both the fund and the index.
Return on Equity. The annual average rate of return generated by a company during the past five years for each dollar of shareholder’s equity (net income divided by shareholder’s equity). For a fund, the weighted average return on equity for the companies whose stocks it holds.
Short-Term Reserves. The percentage of a fund invested in highly liquid, short-term securities that can be readily converted to cash.
Turnover Rate. An indication of the fund’s trading activity. Funds with high turnover rates incur higher transaction costs and may be more likely to distribute capital gains (which may be taxable to investors). The turnover rate excludes in-kind transactions, which have minimal impact on costs.
Benchmark Information
Spliced Equity Income Index: Russell 1000 Value Index through July 31, 2007; FTSE High Dividend Yield Index thereafter.
32
This page intentionally left blank.
This page intentionally left blank.
This page intentionally left blank.
The People Who Govern Your Fund
The trustees of your mutual fund are there to see that the fund is operated and managed in your best interests since, as a shareholder, you are a part owner of the fund. Your fund’s trustees also serve on the board of directors of The Vanguard Group, Inc., which is owned by the Vanguard funds and provides services to them on an at-cost basis.
A majority of Vanguard’s board members are independent, meaning that they have no affiliation with Vanguard or the funds they oversee, apart from the sizable personal investments they have made as private individuals. The independent board members have distinguished backgrounds in business, academia, and public service. Each of the trustees and executive officers oversees 177 Vanguard funds.
The following table provides information for each trustee and executive officer of the fund. More information about the trustees is in the Statement of Additional Information, which can be obtained, without charge, by contacting Vanguard at 800-662-7447, or online at vanguard.com.
| InterestedTrustee1 | and Delphi Automotive LLP (automotive components); |
| Senior Advisor at New Mountain Capital. | |
| F. William McNabb III | |
| Born 1957. Trustee Since July 2009. Chairman of the | Amy Gutmann |
| Board. Principal Occupation(s) During the Past Five | Born 1949. Trustee Since June 2006. Principal |
| Years: Chairman of the Board of The Vanguard Group, | Occupation(s) During the Past Five Years: President of |
| Inc., and of each of the investment companies served | the University of Pennsylvania; Christopher H. Browne |
| by The Vanguard Group, since January 2010; Director | Distinguished Professor of Political Science, School of |
| of The Vanguard Group since 2008; Chief Executive | Arts and Sciences, and Professor of Communication, |
| Officer and President of The Vanguard Group, and of | Annenberg School for Communication, with secondary |
| each of the investment companies served by The | faculty appointments in the Department of Philosophy, |
| Vanguard Group, since 2008; Director of Vanguard | School of Arts and Sciences, and at the Graduate |
| Marketing Corporation; Managing Director of The | School of Education, University of Pennsylvania; |
| Vanguard Group (1995–2008). | Trustee of the National Constitution Center; Chair |
| of the Presidential Commission for the Study of | |
| Bioethical Issues. | |
| IndependentTrustees | |
| JoAnn Heffernan Heisen | |
| Emerson U. Fullwood | Born 1950. Trustee Since July 1998. Principal |
| Born 1948. Trustee Since January 2008. Principal | Occupation(s) During the Past Five Years: Corporate |
| Occupation(s) During the Past Five Years: Executive | Vice President and Chief Global Diversity Officer |
| Chief Staff and Marketing Officer for North America | (retired 2008) and Member of the Executive |
| and Corporate Vice President (retired 2008) of Xerox | Committee (1997–2008) of Johnson & Johnson |
| Corporation (document management products and | (pharmaceuticals/medical devices/consumer |
| services); Executive in Residence and 2009–2010 | products); Director of Skytop Lodge Corporation |
| Distinguished Minett Professor at the Rochester | (hotels), the University Medical Center at Princeton, |
| Institute of Technology; Director of SPX Corporation | the Robert Wood Johnson Foundation, and the Center |
| (multi-industry manufacturing), the United Way of | for Talent Innovation; Member of the Advisory Board |
| Rochester, Amerigroup Corporation (managed health | of the Maxwell School of Citizenship and Public Affairs |
| care), the University of Rochester Medical Center, | at Syracuse University. |
| Monroe Community College Foundation, and North | |
| Carolina A&T University. | F. Joseph Loughrey |
| Born 1949. Trustee Since October 2009. Principal | |
| Rajiv L. Gupta | Occupation(s) During the Past Five Years: President |
| Born 1945. Trustee Since December 2001.2 | and Chief Operating Officer (retired 2009) of Cummins |
| Principal Occupation(s) During the Past Five Years: | Inc. (industrial machinery); Chairman of the Board |
| Chairman and Chief Executive Officer (retired 2009) | of Hillenbrand, Inc. (specialized consumer services), |
| and President (2006–2008) of Rohm and Haas Co. | and of Oxfam America; Director of SKF AB (industrial |
| (chemicals); Director of Tyco International, Ltd. | machinery), Hyster-Yale Materials Handling, Inc. |
| (diversified manufacturing and services), Hewlett- | (forklift trucks), the Lumina Foundation for Education, |
| Packard Co. (electronic computer manufacturing), | |
| and the V Foundation for Cancer Research; Member | Executive Officers | |
| of the Advisory Council for the College of Arts and | ||
| Letters and of the Advisory Board to the Kellogg | Glenn Booraem | |
| Institute for International Studies, both at the | Born 1967. Controller Since July 2010. Principal | |
| University of Notre Dame. | Occupation(s) During the Past Five Years: Principal | |
| of The Vanguard Group, Inc.; Controller of each of | ||
| Mark Loughridge | the investment companies served by The Vanguard | |
| Born 1953. Trustee Since March 2012. Principal | Group; Assistant Controller of each of the investment | |
| Occupation(s) During the Past Five Years: Senior Vice | companies served by The Vanguard Group (2001–2010). | |
| President and Chief Financial Officer (retired 2013) | ||
| at IBM (information technology services); Fiduciary | Thomas J. Higgins | |
| Member of IBM’s Retirement Plan Committee (2004– | Born 1957. Chief Financial Officer Since September | |
| 2013); Member of the Council on Chicago Booth. | 2008. Principal Occupation(s) During the Past Five | |
| Years: Principal of The Vanguard Group, Inc.; Chief | ||
| Scott C. Malpass | Financial Officer of each of the investment companies | |
| Born 1962. Trustee Since March 2012. Principal | served by The Vanguard Group; Treasurer of each of | |
| Occupation(s) During the Past Five Years: Chief | the investment companies served by The Vanguard | |
| Investment Officer and Vice President at the University | Group (1998–2008). | |
| of Notre Dame; Assistant Professor of Finance at the | ||
| Mendoza College of Business at Notre Dame; Member | Kathryn J. Hyatt | |
| of the Notre Dame 403(b) Investment Committee; | Born 1955. Treasurer Since November 2008. Principal | |
| Board Member of TIFF Advisory Services, Inc. | Occupation(s) During the Past Five Years: Principal of | |
| (investment advisor); Member of the Investment | The Vanguard Group, Inc.; Treasurer of each of the | |
| Advisory Committees of the Financial Industry | investment companies served by The Vanguard | |
| Regulatory Authority (FINRA) and of Major League | Group; Assistant Treasurer of each of the investment | |
| Baseball. | companies served by The Vanguard Group (1988–2008). | |
| André F. Perold | Heidi Stam | |
| Born 1952. Trustee Since December 2004. Principal | Born 1956. Secretary Since July 2005. Principal | |
| Occupation(s) During the Past Five Years: George | Occupation(s) During the Past Five Years: Managing | |
| Gund Professor of Finance and Banking, Emeritus | Director of The Vanguard Group, Inc.; General Counsel | |
| at the Harvard Business School (retired 2011); | of The Vanguard Group; Secretary of The Vanguard | |
| Chief Investment Officer and Managing Partner of | Group and of each of the investment companies | |
| HighVista Strategies LLC (private investment firm); | served by The Vanguard Group; Director and Senior | |
| Director of Rand Merchant Bank; Overseer of the | Vice President of Vanguard Marketing Corporation. | |
| Museum of Fine Arts Boston. | ||
| Vanguard Senior ManagementTeam | ||
| Alfred M. Rankin, Jr. | ||
| Born 1941. Trustee Since January 1993. Principal | Mortimer J. Buckley | Chris D. McIsaac |
| Occupation(s) During the Past Five Years: Chairman, | Kathleen C. Gubanich | Michael S. Miller |
| President, and Chief Executive Officer of NACCO | Paul A. Heller | James M. Norris |
| Industries, Inc. (housewares/lignite), and of Hyster- | Martha G. King | Glenn W. Reed |
| Yale Materials Handling, Inc. (forklift trucks); Chairman | John T. Marcante | |
| of the Board of University Hospitals of Cleveland. | ||
| Peter F. Volanakis | Chairman Emeritus and Senior Advisor | |
| Born 1955. Trustee Since July 2009. Principal | ||
| Occupation(s) During the Past Five Years: President | John J. Brennan | |
| and Chief Operating Officer (retired 2010) of Corning | Chairman, 1996–2009 | |
| Incorporated (communications equipment); Trustee of | Chief Executive Officer and President, 1996–2008 | |
| Colby-Sawyer College; Member of the Advisory Board | ||
| of the Norris Cotton Cancer Center and of the Advisory | ||
| Board of the Parthenon Group (strategy consulting). | Founder | |
| John C. Bogle | ||
| Chairman and Chief Executive Officer, 1974–1996 | ||
1 Mr. McNabb is considered an “interested person,” as defined in the Investment Company Act of 1940, because he is an officer of the
Vanguard funds.
2 December 2002 for Vanguard Equity Income Fund, the Vanguard Municipal Bond Funds, and the Vanguard State Tax-Exempt Funds.
 | |
| P.O. Box 2600 | |
| Valley Forge, PA 19482-2600 | |
| Connect with Vanguard® > vanguard.com | |
| Fund Information > 800-662-7447 | CFA® is a registered trademark owned by CFA Institute. |
| Direct Investor Account Services > 800-662-2739 | |
| Institutional Investor Services > 800-523-1036 | |
| Text Telephone for People | |
| Who Are Deaf or Hard of Hearing> 800-749-7273 | |
| This material may be used in conjunction | |
| with the offering of shares of any Vanguard | |
| fund only if preceded or accompanied by | |
| the fund’s current prospectus. | |
| All comparative mutual fund data are from Lipper, a | |
| Thomson Reuters Company, or Morningstar, Inc., unless | |
| otherwise noted. | |
| You can obtain a free copy of Vanguard’s proxy voting | |
| guidelines by visiting vanguard.com/proxyreporting or by | |
| calling Vanguard at 800-662-2739. The guidelines are | |
| also available from the SEC’s website, sec.gov. In | |
| addition, you may obtain a free report on how your fund | |
| voted the proxies for securities it owned during the 12 | |
| months ended June 30. To get the report, visit either | |
| vanguard.com/proxyreporting or sec.gov. | |
| You can review and copy information about your fund at | |
| the SEC’s Public Reference Room in Washington, D.C. To | |
| find out more about this public service, call the SEC at | |
| 202-551-8090. Information about your fund is also | |
| available on the SEC’s website, and you can receive | |
| copies of this information, for a fee, by sending a | |
| request in either of two ways: via e-mail addressed to | |
| publicinfo@sec.gov or via regular mail addressed to the | |
| Public Reference Section, Securities and Exchange | |
| Commission, Washington, DC 20549-1520. | |
| © 2014 The Vanguard Group, Inc. | |
| All rights reserved. | |
| Vanguard Marketing Corporation, Distributor. | |
| Q650 112014 | |
![]()

Annual Report | September 30, 2014
Vanguard PRIMECAP Core Fund
The mission continues
On May 1, 1975, Vanguard began operations, a fledgling company based on the simple but revolutionary idea that a mutual fund company should be managed solely in the interest of its investors.
Four decades later, that revolutionary spirit continues to animate the enterprise. Vanguard remains on a mission to give investors the best chance of investment success.
As we mark our 40th anniversary, we thank you for entrusting your assets to Vanguard and giving us the opportunity to help you reach your financial goals in the decades to come.
| Contents | |
| Your Fund’s Total Returns. | 1 |
| Chairman’s Letter. | 2 |
| Advisor’s Report. | 8 |
| Fund Profile. | 11 |
| Performance Summary. | 12 |
| Financial Statements. | 14 |
| Your Fund’s After-Tax Returns. | 24 |
| About Your Fund’s Expenses. | 25 |
| Glossary. | 27 |
Please note: The opinions expressed in this report are just that—informed opinions. They should not be considered promises or advice.
Also, please keep in mind that the information and opinions cover the period through the date on the front of this report. Of course, the
risks of investing in your fund are spelled out in the prospectus.
See the Glossary for definitions of investment terms used in this report.
About the cover: Since our founding, Vanguard has drawn inspiration from the enterprise and valor demonstrated by British
naval hero Horatio Nelson and his command at the Battle of the Nile in 1798. The photograph displays a replica of a merchant
ship from the same era as Nelson’s flagship, the HMS Vanguard.
Your Fund’s Total Returns
| Fiscal Year Ended September 30, 2014 | |
| Total | |
| Returns | |
| Vanguard PRIMECAP Core Fund | 22.60% |
| MSCI US Prime Market 750 Index | 19.23 |
| Multi-Cap Core Funds Average | 14.62 |
| Multi-Cap Core Funds Average: Derived from data provided by Lipper, a Thomson Reuters Company. | |
Your Fund’s Performance at a Glance
September 30, 2013, Through September 30, 2014
| Distributions Per Share | ||||
| Starting | Ending | |||
| Share | Share | Income | Capital | |
| Price | Price | Dividends | Gains | |
| Vanguard PRIMECAP Core Fund | $18.65 | $21.87 | $0.178 | $0.677 |
1

Chairman’s Letter
Dear Shareholder,
Vanguard PRIMECAP Core Fund posted first-rate returns over the fiscal year, benefiting from its advisor’s decisions and a favorable stock market. The fund advanced nearly 23% for the 12 months ended September 30, 2014. It finished more than 3 percentage points ahead of its benchmark, the MSCI US Prime Market 750 Index, and about 8 percentage points better than the average return of its multi-capitalization core peers.
This strong performance coincides with a pair of milestones: December marks the tenth anniversary of both the PRIMECAP Core Fund and its advisory team from PRIMECAP Management Company.
The team has distinguished itself over the past decade through its experience, knowledge, and talent; the fund’s successful record reflects those qualities. I’m pleased to congratulate the advisor on its achievements.
If you hold fund shares in a taxable account, you may wish to review the table of after-tax returns, based on the highest federal income tax bracket, that appears later in this report.
Please note that as of September 30, 2014, the fund had realized short-term capital gains equal to less than 1% of fund assets and long-term capital gains equal to about 5% of fund assets. Gains will be distributed in December.
2
Despite patchiness of late, stocks posted solid returns
The broad U.S. stock market managed a robust return of nearly 18% for the fiscal year ended September 30, despite stumbling in two of the final three months. Generally strong corporate profits and progress in the U.S. economy carried the markets through most of the period. High stock valuations, international tensions, the unsettled global economy, and a gradual shift from the Federal Reserve’s accommodative policies weighed on more recent results.
Over the period’s final months, the performance gap between U.S. stocks and their international counterparts widened amid tensions in the Middle East and Ukraine,
China’s slower growth, and Europe’s slumping economy. International stocks returned about 5%. Emerging markets and the developed markets of Europe and the Pacific region all recorded single-digit returns.
Although they met some resistance, bonds still bounced back strongly
Bond returns, which were surprisingly robust through most of the fiscal year, also met resistance late in the period. Still, the broad U.S. taxable bond market returned 3.96%, a significant recovery from its negative outcome a year ago.
Since January, the Fed has pared back its bond-buying program, with the aim of ending it in October. Until recently, interest
| Market Barometer | |||
| Average Annual Total Returns | |||
| Periods Ended September 30, 2014 | |||
| One | Three | Five | |
| Year | Years | Years | |
| Stocks | |||
| Russell 1000 Index (Large-caps) | 19.01% | 23.23% | 15.90% |
| Russell 2000 Index (Small-caps) | 3.93 | 21.26 | 14.29 |
| Russell 3000 Index (Broad U.S. market) | 17.76 | 23.08 | 15.78 |
| FTSE All-World ex US Index (International) | 5.11 | 12.12 | 6.31 |
| Bonds | |||
| Barclays U.S. Aggregate Bond Index (Broad taxable market) | 3.96% | 2.43% | 4.12% |
| Barclays Municipal Bond Index (Broad tax-exempt market) | 7.93 | 4.56 | 4.67 |
| Citigroup Three-Month U.S. Treasury Bill Index | 0.04 | 0.04 | 0.06 |
| CPI | |||
| Consumer Price Index | 1.66% | 1.61% | 1.96% |
3
rates did not rise as analysts had predicted. The yield of the 10-year U.S. Treasury note ended September at 2.48%, down from 2.63% a year earlier. (Bond prices and yields move in opposite directions.)
Municipal bonds, which returned 7.93%, benefited from the broad market rally and a limited supply of new issues.
In light of this advance for U.S. taxable and tax-exempt bonds, it’s worth remembering that the current low yields imply lower future returns. As yields drop, the scope for further declines—and increases in prices—diminishes.
International bond markets (as measured by the Barclays Global Aggregate Index ex USD) returned –0.81% after sinking in September.
Money market funds and savings accounts posted negligible returns, as the Fed kept its target for short-term interest rates to 0%–0.25%.
Technology and health care were key to fund performance
The PRIMECAP Core Fund’s accomplishments are much easier to explain than to duplicate. Governed by a research-driven selection process, the advisor seeks out underappreciated growth and value companies, employs precise criteria, and
| Expense Ratios | ||
| Your Fund Compared With Its Peer Group | ||
| Peer Group | ||
| Fund | Average | |
| PRIMECAP Core Fund | 0.50% | 1.17% |
The fund expense ratio shown is from the prospectus dated January 27, 2014, and represents estimated costs for the current fiscal year. For
the fiscal year ended September 30, 2014, the fund’s expense ratio was 0.50%. The peer-group expense ratio is derived from data provided
by Lipper, a Thomson Reuters Company, and captures information through year-end 2013.
Peer group: Multi-Cap Core Funds.
4
invests for the long term. This contrarian approach typically produces a portfolio that looks and behaves differently than the benchmark.
This divergence resulted in underperfor-mance in fiscal years 2011 and 2012, when the fund trailed either one or both of its comparative standards. Patience and persistence are crucial to the process, because PRIMECAP Core’s portfolio is characterized by its low turnover and long-term holdings. Over time, shareholders have been rewarded for staying with the fund.
The information technology and health care sectors have traditionally determined PRIMECAP Core’s outcome, and that was certainly the case in fiscal year 2014. Tech and health care stocks made up more than 50% of the fund’s assets on average. This heavy exposure proved especially favorable as the pair powered the stock market and mostly outshined even the double-digit returns recorded by other sectors. Together, they were responsible for more than 14 percentage points of the fund’s return.
In IT, the advisor’s stock selection also provided a slight lift to performance. Technology products and services continue to extend their global reach as they become more accessible and affordable. At the
| Total Returns | |
| Inception Through September 30, 2014 | |
| Average | |
| Annual Return | |
| PRIMECAP Core Fund (Returns since inception: 12/9/2004) | 10.22% |
| MSCI US Prime Market 750 Index | 7.93 |
| Multi-Cap Core Funds Average | 6.67 |
| Multi-Cap Core Funds Average: Derived from data provided by Lipper, a Thomson Reuters Company. | |
The figures shown represent past performance, which is not a guarantee of future results. (Current performance may be
lower or higher than the performance data cited. For performance data current to the most recent month-end, visit our
website at vanguard.com/performance.) Note, too, that both investment returns and principal value can fluctuate widely, so
an investor’s shares, when sold, could be worth more or less than their original cost.
5
higher end of the market, consumers and corporations expanded their budgets and updated and replaced their equipment.
The advisor’s stock choices weren’t as successful in the health care sector. The fund’s holdings returned about 24%, compared with about 28% for those in the benchmark, but the fund’s outsized investment in health care was still a boon to return. Investors anticipated an increase in health care spending to coincide with the aging population and the expanded number of insured under the Affordable Care Act. The bulk of returns came from pharmaceutical and biotechnology companies as mergers and acquisitions, new drug development, and overseas opportunities combined with the larger trends lifting the industry. Health care and medical equipment firms also excelled.
PRIMECAP Core’s industrial stocks, which increased about 35% over the period, also contributed significantly to performance. Almost all of the strength came from select airline stocks that profited from mergers and acquisitions, in addition to lower fuel costs. For more about the advisor’s strategy and the fund’s positioning during the 12 months, please see the Advisor’s Report that follows this letter.
The advisor’s strategy has led to a notably solid long-term record
As I mentioned earlier, PRIMECAP Management Company directs the fund through a long-term lens. It is willing to endure market volatility and stand behind out-of-favor companies when it believes
the future is promising. Along with the broader stock market, the fund was punished during the financial crisis, but its investment strategy and philosophy have ultimately proved successful.
Since its December 9, 2004, inception, the PRIMECAP Core Fund has recorded an average annual return of 10.22%. This result is more than 2 percentage points ahead of its market benchmark, the MSCI US Prime Market 750 Index, and more than 3 percentage points ahead of its peer funds average. PRIMECAP Management should be commended for this impressive record. The advisor’s effort is boosted by Vanguard’s low costs, which ensure that shareholders retain more of the fund’s returns.
High costs don’t equal strong fund performance
The adage “you get what you pay for” doesn’t apply to mutual funds. In fact, the reverse is true: Research suggests that higher costs are consistent with weaker returns. (See, for example, Shopping for Alpha: You Get What You Don’t Pay For at vanguard.com/research.)
Shouldn’t paying the highest fees allow you to purchase the services of the greatest talents and therefore get the best returns? As it turns out, the data don’t support that argument. The explanation is simple: Every dollar paid for management fees is a dollar less earning potential return. Keeping expenses down can help narrow the gap between what the markets return and what investors actually earn.
6
That’s why Vanguard always seeks to minimize costs. Indexing, of course, is the purest form of low-cost investing. And we negotiate low fees for our actively managed funds, which are run by world-class advisors. It’s a strategy that reflects decades of experience and research, boiled down to one tenet: The less you pay, the more you keep.
As always, thank you for investing with Vanguard.
Sincerely,

F. William McNabb III
Chairman and Chief Executive Officer
October 17, 2014
7
Advisor’s Report
For the fiscal year ended September 30, 2014, Vanguard PRIMECAP Core Fund returned 22.60%, exceeding both the 19.23% return of its benchmark, the unmanaged MSCI US Prime Market 750 Index, and the 14.62% average return of its multi-capitalization core fund peers. Favorable sector allocations and positive stock selection in the industrial sector accounted for most of the fund’s outperformance.
The investment environment
Over the past 12 months, U.S. equities continued to appreciate, and the S&P 500 Index reached a new all-time high during the third calendar quarter. Small-capitalization stocks, as measured by the Russell 2000 Index, began to significantly underperform large-caps beginning in mid-March.
After a rocky start to the year, driven in part by unusually cold weather, the U.S. economy rebounded. Real gross domestic product (GDP) grew by 4.6% in the second calendar quarter after declining 2.1% during the first. The unemployment rate fell to 5.9% at the end of September, the lowest level since July 2008. The improving U.S. economic outlook stood in stark contrast to the deteriorating outlook in Europe, whose central bank introduced new stimulus measures, including an asset purchase program. The U.S. dollar appreciated against most foreign currencies, and commodity prices fell.
The Federal Reserve continued to tighten monetary policy by reducing the level of its monthly asset purchases. The asset purchase program is expected to end after the Fed’s October meeting. The central bank expects to maintain the current 0%–0.25% target federal funds rate for a considerable time after the asset purchase program ends.
On the geopolitical front, the United States and a number of other countries began conducting air strikes against the ISIS, or Islamic State, militant group. After annexing Crimea earlier in the year, Russia continued its support of pro-Russian rebel groups in Eastern Ukraine. In response, the European Union and the United States imposed economic sanctions, resulting in a devaluation of the ruble and a slowdown in exports to Russia from countries such as Germany. Toward the end of the fiscal year, outbreaks of the Ebola virus in several African countries caused increasing concern as the first cases appeared in the United States and Europe.
Outlook for U.S. equities
Looking ahead, we are less constructive on the outlook for U.S. equities than we have been in recent years. We do, however, continue to believe that many individual stocks are attractively valued and that stocks represent a more attractive investment than bonds at current prices.
As of September 30, 2014, the S&P 500 was trading at approximately 14.8 times 2015 consensus estimated earnings per share of $133. This is a reasonable valuation by historical standards, though the index appears more expensive on a price-to-sales multiple basis because profit
8
margins are near all-time highs. Calendar 2015 consensus estimates assume 4.2% sales per share growth and 11.7% earnings per share growth, which may prove difficult to achieve.
Portfolio update and outlook
The portfolio remains significantly overweight in health care and information technology stocks. As of September 30, 2014, these sectors comprised 57% of the fund’s holdings (compared to 32% for the S&P 500), including eight of the ten largest holdings in the fund.
Favorable sector allocation contributed roughly twice as much as stock selection to the fund’s success for the past fiscal year. Overweight positions in information technology and health care, the best performers in the S&P 500 over the period, benefited relative results, as did underweight positions in energy, consumer staples, consumer discretionary, telecommunication services, financials, and utilities.
In industrials, Southwest Airlines (+134%) and FedEx (+42%) were the most significant contributors to relative returns. These positives were partially offset by unfavorable stock selection in health care, including GlaxoSmithKline (-4%) and Roche (+13%), and in energy, notably Transocean (–24%).
Health care
We believe that favorable global demographic trends and ongoing innovation will create opportunities for health care companies to grow revenues faster than the overall economy for the foreseeable future. Aging populations in developed countries and China should lead to greater consumption of health care products and services. At the same time, rising disposable incomes and household wealth in developing countries should lead to higher usage by people of all ages.
The health care industry’s considerable investment in research and development over the years is driving the rise of new and more effective therapies for many diseases, such as cancer, diabetes, and Alzheimer’s. The precipitous decline in the cost of genetic DNA sequencing is allowing researchers to identify unknown diseases and rapidly develop therapies that improve the standard of care. Increasingly, drugs based on a better understanding of diseases’ underlying genetic causes are providing higher cure rates with fewer side effects than conventional treatments.
Technology
We continue to believe that many of the fund’s information technology holdings are attractively valued. The sector’s price-to-earnings multiple relative to that of the broader S&P 500 Index is near a multi-decade low, and tech companies are far better capitalized than those in other sectors. Many of the fund’s holdings have considerable percentages of their market capitalization in net cash on their balance sheets. Already at reasonable multiples, their valuations are even more attractive when their net cash balances are considered.
9
Conclusion
We remain committed to our investment philosophy, which is to invest in attractively priced individual stocks for the long term. This “bottom-up” approach often results in portfolios that bear little resemblance to market indexes; therefore, our results often deviate substantially. Furthermore, our long-term investment horizon causes low portfolio turnover, which creates the possibility for extended periods of under-performance when the stocks in our portfolio fall out of favor. We nonetheless believe that this approach can generate superior results for investors over the long term.
PRIMECAP Management Company
October 10, 2014
10
PRIMECAP Core Fund
Fund Profile
As of September 30, 2014
| Portfolio Characteristics | |||
| DJ | |||
| U.S. | |||
| MSCI US | Total | ||
| Prime | Market | ||
| Market | FA | ||
| Fund | 750 Index | Index | |
| Number of Stocks | 140 | 758 | 3,768 |
| Median Market Cap | $59.9B | $59.9B | $51.1B |
| Price/Earnings Ratio | 20.2x | 19.8x | 20.5x |
| Price/Book Ratio | 3.4x | 2.7x | 2.6x |
| Return on Equity | 19.6% | 18.7% | 17.8% |
| Earnings Growth | |||
| Rate | 15.1% | 15.2% | 15.2% |
| Dividend Yield | 1.7% | 2.0% | 1.9% |
| Foreign Holdings | 12.3% | 0.0% | 0.0% |
| Turnover Rate | 13% | — | — |
| Ticker Symbol | VPCCX | — | — |
| Expense Ratio1 | 0.50% | — | — |
| 30-Day SEC Yield | 1.16% | — | — |
| Short-Term Reserves | 4.9% | — | — |
| Sector Diversification (% of equity exposure) | |||
| DJ | |||
| U.S. | |||
| MSCI US | Total | ||
| Prime | Market | ||
| Market | FA | ||
| Fund | 750 Index | Index | |
| Consumer Discretionary 10.3% | 12.5% | 12.5% | |
| Consumer Staples | 1.0 | 9.1 | 8.3 |
| Energy | 3.5 | 9.5 | 9.1 |
| Financials | 6.5 | 16.3 | 17.4 |
| Health Care | 30.6 | 13.7 | 13.5 |
| Industrials | 17.2 | 10.5 | 11.2 |
| Information Technology | 26.9 | 19.3 | 19.0 |
| Materials | 3.9 | 3.6 | 3.8 |
| Telecommunication | |||
| Services | 0.1 | 2.4 | 2.2 |
| Utilities | 0.0 | 3.1 | 3.0 |
| Volatility Measures | ||
| DJ | ||
| MSCI US | U.S. Total | |
| Prime Market | Market | |
| 750 Index | FA Index | |
| R-Squared | 0.91 | 0.92 |
| Beta | 0.91 | 0.89 |
| These measures show the degree and timing of the fund’s fluctuations compared with the indexes over 36 months. | ||
| Ten Largest Holdings (% of total net assets) | ||
| Amgen Inc. | Biotechnology | 5.0% |
| Roche Holding AG | Pharmaceuticals | 4.7 |
| Southwest Airlines Co. | Airlines | 4.4 |
| Biogen Idec Inc. | Biotechnology | 4.2 |
| Eli Lilly & Co. | Pharmaceuticals | 3.8 |
| Google Inc. | Internet Software & | |
| Services | 3.1 | |
| Texas Instruments Inc. | Semiconductors | 2.7 |
| Johnson & Johnson | Pharmaceuticals | 2.6 |
| Novartis AG | Pharmaceuticals | 2.2 |
| Marsh & McLennan Cos. | ||
| Inc. | Insurance Brokers | 2.1 |
| Top Ten | 34.8% | |
| The holdings listed exclude any temporary cash investments and equity index products. | ||
Investment Focus
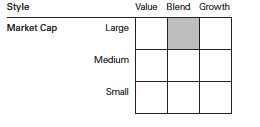
1 The expense ratio shown is from the prospectus dated January 27, 2014, and represents estimated costs for the current fiscal year. For the fiscal
year ended September 30, 2014, the expense ratio was 0.50%.
11
PRIMECAP Core Fund
Performance Summary
All of the returns in this report represent past performance, which is not a guarantee of future results that may be achieved by the fund. (Current performance may be lower or higher than the performance data cited. For performance data current to the most recent month-end, visit our website at vanguard.com/performance.) Note, too, that both investment returns and principal value can fluctuate widely, so an investor’s shares, when sold, could be worth more or less than their original cost. The returns shown do not reflect taxes that a shareholder would pay on fund distributions or on the sale of fund shares.
Cumulative Performance: December 9, 2004, Through September 30, 2014
Initial Investment of $10,000
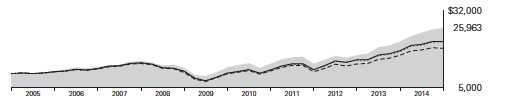
| Average Annual Total Returns | |||||
| Periods Ended September 30, 2014 | |||||
| Since | Final Value | ||||
| One | Five | Inception | of a $10,000 | ||
| Year | Years | (12/9/2004) | Investment | ||
| PRIMECAP Core Fund* | 22.60% | 16.39% | 10.22% | $25,963 | |
| •••••••• | MSCI US Prime Market 750 Index | 19.23 | 15.85 | 7.93 | 21,137 |
| – – – – | Multi-Cap Core Funds Average | 14.62 | 13.58 | 6.67 | 18,830 |
| Dow Jones U.S. Total Stock Market | |||||
| Float Adjusted Index | 17.69 | 15.84 | 7.96 | 21,200 | |
Multi-Cap Core Funds Average: Derived from data provided by Lipper, a Thomson Reuters Company.
"Since Inception" performance is calculated from the inception date for both the fund and its comparative standards.
See Financial Highlights for dividend and capital gains information.
12
PRIMECAP Core Fund
Fiscal-Year Total Returns (%): December 9, 2004, Through September 30, 2014
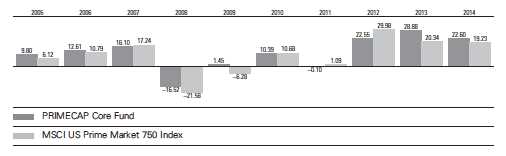
13
PRIMECAP Core Fund
Financial Statements
Statement of Net Assets
As of September 30, 2014
The fund reports a complete list of its holdings in regulatory filings four times in each fiscal year, at the quarter-ends. For the second and fourth fiscal quarters, the lists appear in the fund’s semiannual and annual reports to shareholders. For the first and third fiscal quarters, the fund files the lists with the Securities and Exchange Commission on Form N-Q. Shareholders can look up the fund’s Forms N-Q on the SEC’s website at sec.gov. Forms N-Q may also be reviewed and copied at the SEC’s Public Reference Room (see the back cover of this report for further information).
| Market | |||
| Value• | |||
| Shares | ($000) | ||
| Common Stocks (95.5%) | |||
| Consumer Discretionary (9.8%) | |||
| L Brands Inc. | 1,636,220 | 109,594 | |
| TJX Cos. Inc. | 1,425,000 | 84,317 | |
| * | CarMax Inc. | 1,721,400 | 79,959 |
| Walt Disney Co. | 815,000 | 72,559 | |
| * | DIRECTV | 734,488 | 63,548 |
| ^ | Sony Corp. ADR | 3,450,000 | 62,238 |
| Carnival Corp. | 1,437,200 | 57,732 | |
| Ross Stores Inc. | 495,500 | 37,450 | |
| Whirlpool Corp. | 205,000 | 29,858 | |
| * | Bed Bath & Beyond Inc. | 337,491 | 22,217 |
| VF Corp. | 223,380 | 14,750 | |
| * | Urban Outfitters Inc. | 401,000 | 14,717 |
| Gildan Activewear Inc. | |||
| Class A | 193,250 | 10,575 | |
| Time Warner Cable Inc. | 49,756 | 7,140 | |
| * | Amazon.com Inc. | 9,800 | 3,160 |
| Macy’s Inc. | 30,000 | 1,745 | |
| Las Vegas Sands Corp. | 25,000 | 1,555 | |
| 673,114 | |||
| Consumer Staples (1.0%) | |||
| PepsiCo Inc. | 425,000 | 39,563 | |
| CVS Health Corp. | 327,377 | 26,056 | |
| 65,619 | |||
| Energy (3.3%) | |||
| ^ | Transocean Ltd. | 2,399,100 | 76,699 |
| Schlumberger Ltd. | 507,100 | 51,567 | |
| EOG Resources Inc. | 243,000 | 24,062 | |
| National Oilwell Varco Inc. | 263,200 | 20,029 | |
| * | Cameron International Corp. | 250,100 | 16,602 |
| Cabot Oil & Gas Corp. | 391,000 | 12,782 | |
| Noble Energy Inc. | 181,000 | 12,373 | |
| * | Southwestern Energy Co. | 159,300 | 5,567 |
| Exxon Mobil Corp. | 46,012 | 4,327 | |
| Encana Corp. | 70,000 | 1,485 | |
| Petroleo Brasileiro SA ADR | |||
| Type A | 75,000 | 1,117 | |
| Petroleo Brasileiro SA ADR | 30,000 | 426 | |
| Frank’s International NV | 10,000 | 187 | |
| 227,223 | |||
| Financials (6.2%) | |||
| Marsh & McLennan | |||
| Cos. Inc. | 2,713,875 | 142,044 | |
| Charles Schwab Corp. | 3,870,511 | 113,754 | |
| Wells Fargo & Co. | 1,102,000 | 57,161 | |
| Chubb Corp. | 362,200 | 32,989 | |
| Willis Group Holdings plc | 415,200 | 17,189 | |
| Comerica Inc. | 276,000 | 13,762 | |
| CME Group Inc. | 159,700 | 12,769 | |
| Progressive Corp. | 465,000 | 11,755 | |
| American Express Co. | 108,300 | 9,481 | |
| US Bancorp | 224,000 | 9,370 | |
| Discover Financial Services | 39,000 | 2,511 | |
| 422,785 | |||
| Health Care (29.2%) | |||
| Amgen Inc. | 2,427,419 | 340,955 | |
| Roche Holding AG | 1,075,440 | 317,581 | |
| * | Biogen Idec Inc. | 861,373 | 284,951 |
| Eli Lilly & Co. | 4,026,900 | 261,144 | |
| Johnson & Johnson | 1,661,150 | 177,062 | |
| Novartis AG ADR | 1,612,605 | 151,794 | |
| Medtronic Inc. | 2,175,200 | 134,754 | |
| Abbott Laboratories | 1,628,700 | 67,738 | |
| AbbVie Inc. | 814,800 | 47,063 | |
| Thermo Fisher | |||
| Scientific Inc. | 351,600 | 42,790 | |
| * | Boston Scientific Corp. | 3,427,200 | 40,475 |
| Sanofi ADR | 541,000 | 30,529 | |
| GlaxoSmithKline plc ADR | 600,000 | 27,582 | |
| * | Illumina Inc. | 163,900 | 26,866 |
| * | Waters Corp. | 240,654 | 23,854 |
| Agilent Technologies Inc. | 313,100 | 17,840 | |
| Stryker Corp. | 45,500 | 3,674 | |
| * | Cerner Corp. | 10,000 | 596 |
| 1,997,248 | |||
14
PRIMECAP Core Fund
| Market | ||||
| Value• | ||||
| Shares | ($000) | |||
| Industrials (16.5%) | ||||
| Southwest Airlines Co. | 8,926,525 | 301,449 | ||
| FedEx Corp. | 597,475 | 96,462 | ||
| Honeywell | ||||
| International Inc. | 1,000,700 | 93,185 | ||
| United Parcel Service Inc. | ||||
| Class B | 827,500 | 81,335 | ||
| Boeing Co. | 479,600 | 61,091 | ||
| Airbus Group NV | 957,350 | 60,180 | ||
| * | United Continental | |||
| Holdings Inc. | 878,000 | 41,082 | ||
| Delta Air Lines Inc. | 1,018,000 | 36,801 | ||
| Caterpillar Inc. | 336,000 | 33,274 | ||
| Union Pacific Corp. | 306,400 | 33,220 | ||
| Rockwell Automation Inc. | 294,200 | 32,327 | ||
| Norfolk Southern Corp. | 252,650 | 28,196 | ||
| Pentair plc | 416,981 | 27,308 | ||
| * | Jacobs Engineering | |||
| Group Inc. | 550,000 | 26,851 | ||
| CH Robinson | ||||
| Worldwide Inc. | 390,210 | 25,879 | ||
| Safran SA | 305,000 | 19,774 | ||
| CSX Corp. | 586,700 | 18,810 | ||
| * | AECOM Technology Corp. | 495,000 | 16,706 | |
| * | Hertz Global Holdings Inc. | 570,000 | 14,472 | |
| ^ | Ritchie Bros | |||
| Auctioneers Inc. | 618,300 | 13,844 | ||
| United Technologies Corp. | 120,000 | 12,672 | ||
| Republic Services Inc. | ||||
| Class A | 266,935 | 10,416 | ||
| IDEX Corp. | 139,000 | 10,059 | ||
| Expeditors International | ||||
| of Washington Inc. | 230,000 | 9,333 | ||
| TransDigm Group Inc. | 25,000 | 4,608 | ||
| American Airlines Group Inc. | 97,300 | 3,452 | ||
| Cummins Inc. | 21,000 | 2,771 | ||
| Canadian Pacific Railway Ltd. | 12,530 | 2,600 | ||
| * | NOW Inc. | 65,800 | 2,001 | |
| * | Kirby Corp. | 16,000 | 1,886 | |
| Deere & Co. | 20,000 | 1,640 | ||
| Chicago Bridge & Iron | ||||
| Co. NV | 24,500 | 1,417 | ||
| 1,125,101 | ||||
| Information Technology (25.7%) | ||||
| Texas Instruments Inc. | 3,843,300 | 183,287 | ||
| Microsoft Corp. | 2,889,200 | 133,943 | ||
| SanDisk Corp. | 1,218,216 | 119,324 | ||
| * | Google Inc. Class A | 184,072 | 108,310 | |
| * | Google Inc. Class C | 184,072 | 106,276 | |
| Hewlett-Packard Co. | 2,696,500 | 95,645 | ||
| Intel Corp. | 2,716,700 | 94,595 | ||
| * | Flextronics | |||
| International Ltd. | 8,851,200 | 91,344 | ||
| EMC Corp. | 3,030,100 | 88,661 | |
| QUALCOMM Inc. | 1,172,830 | 87,692 | |
| Intuit Inc. | 918,500 | 80,507 | |
| KLA-Tencor Corp. | 700,300 | 55,170 | |
| Cisco Systems Inc. | 2,087,600 | 52,545 | |
| ASML Holding NV | 485,000 | 47,928 | |
| * | Electronic Arts Inc. | 1,256,000 | 44,726 |
| Telefonaktiebolaget LM | |||
| Ericsson ADR | 3,288,400 | 41,401 | |
| * | eBay Inc. | 714,900 | 40,485 |
| * | Adobe Systems Inc. | 498,000 | 34,457 |
| NVIDIA Corp. | 1,520,000 | 28,044 | |
| Corning Inc. | 1,425,000 | 27,560 | |
| Applied Materials Inc. | 1,240,000 | 26,796 | |
| Oracle Corp. | 680,800 | 26,061 | |
| Visa Inc. Class A | 115,735 | 24,694 | |
| Symantec Corp. | 991,600 | 23,313 | |
| Altera Corp. | 623,200 | 22,298 | |
| Analog Devices Inc. | 347,400 | 17,193 | |
| * | BlackBerry Ltd. | 1,527,100 | 15,179 |
| Apple Inc. | 137,550 | 13,858 | |
| Activision Blizzard Inc. | 580,000 | 12,058 | |
| MasterCard Inc. Class A | 83,000 | 6,135 | |
| * | Alibaba Group Holding Ltd. | ||
| ADR | 17,100 | 1,519 | |
| * | Micron Technology Inc. | 12,000 | 411 |
| * | VMware Inc. Class A | 3,000 | 282 |
| Motorola Solutions Inc. | 2,750 | 174 | |
| Accenture plc Class A | 2,000 | 163 | |
| 1,752,034 | |||
| Materials (3.7%) | |||
| Monsanto Co. | 873,350 | 98,261 | |
| Potash Corp. of | |||
| Saskatchewan Inc. | 933,500 | 32,262 | |
| Praxair Inc. | 229,700 | 29,631 | |
| EI du Pont de Nemours | |||
| & Co. | 275,000 | 19,734 | |
| Dow Chemical Co. | 350,000 | 18,354 | |
| Celanese Corp. Class A | 292,000 | 17,088 | |
| Cabot Corp. | 325,000 | 16,500 | |
| LyondellBasell Industries | |||
| NV Class A | 102,400 | 11,127 | |
| Greif Inc. Class A | 125,400 | 5,494 | |
| * | Crown Holdings Inc. | 100,000 | 4,452 |
| Greif Inc. Class B | 37,000 | 1,831 | |
| 254,734 | |||
| Telecommunication Services (0.1%) | |||
| * | Sprint Corp. | 650,000 | 4,121 |
| Total Common Stocks | |||
| (Cost $3,526,964) | 6,521,979 | ||
15
PRIMECAP Core Fund
| Market | ||
| Value• | ||
| Shares | ($000) | |
| Temporary Cash Investment (5.4%) | ||
| Money Market Fund (5.4%) | ||
| 1,2 Vanguard Market | ||
| Liquidity Fund, 0.109% | ||
| (Cost $365,580) | 365,579,652 | 365,580 |
| Total Investments (100.9%) | ||
| (Cost $3,892,544) | 6,887,559 | |
| Other Assets and Liabilities (-0.9%) | ||
| Other Assets | 9,458 | |
| Liabilities2 | (69,136) | |
| (59,678) | ||
| Net Assets (100%) | ||
| Applicable to 312,190,056 outstanding | ||
| $.001 par value shares of beneficial | ||
| interest (unlimited authorization) | 6,827,881 | |
| Net Asset Value Per Share | $21.87 | |
| At September 30, 2014, net assets consisted of: | |
| Amount | |
| ($000) | |
| Paid-in Capital | 3,414,801 |
| Undistributed Net Investment Income | 52,210 |
| Accumulated Net Realized Gains | 366,008 |
| Unrealized Appreciation (Depreciation) | |
| Investment Securities | 2,995,015 |
| Foreign Currencies | (153) |
| Net Assets | 6,827,881 |
• See Note A in Notes to Financial Statements.
* Non-income-producing security.
^ Includes partial security positions on loan to broker-dealers. The total value of securities on loan is $26,369,000.
1 Affiliated money market fund available only to Vanguard funds and certain trusts and accounts managed by Vanguard. Rate shown is
the 7-day yield.
2 Includes $27,773,000 of collateral received for securities on loan.
ADR—American Depositary Receipt.
See accompanying Notes, which are an integral part of the Financial Statements.
16
PRIMECAP Core Fund
Statement of Operations
| Year Ended | |
| September 30, 2014 | |
| ($000) | |
| Investment Income | |
| Income | |
| Dividends1 | 110,308 |
| Interest2 | 317 |
| Securities Lending | 311 |
| Total Income | 110,936 |
| Expenses | |
| Investment Advisory Fees—Note B | 19,806 |
| The Vanguard Group—Note C | |
| Management and Administrative | 11,099 |
| Marketing and Distribution | 874 |
| Custodian Fees | 108 |
| Auditing Fees | 30 |
| Shareholders’ Reports | 46 |
| Trustees’ Fees and Expenses | 10 |
| Total Expenses | 31,973 |
| Net Investment Income | 78,963 |
| Realized Net Gain (Loss) | |
| Investment Securities Sold | 401,139 |
| Foreign Currencies | 350 |
| Realized Net Gain (Loss) | 401,489 |
| Change in Unrealized Appreciation (Depreciation) | |
| Investment Securities | 802,097 |
| Foreign Currencies | (444) |
| Change in Unrealized Appreciation (Depreciation) | 801,653 |
| Net Increase (Decrease) in Net Assets Resulting from Operations | 1,282,105 |
| 1 Dividends are net of foreign withholding taxes of $3,030,000. | |
| 2 Interest income from an affiliated company of the fund was $317,000. | |
See accompanying Notes, which are an integral part of the Financial Statements.
17
PRIMECAP Core Fund
Statement of Changes in Net Assets
| Year Ended September 30, | ||
| 2014 | 2013 | |
| ($000) | ($000) | |
| Increase (Decrease) in Net Assets | ||
| Operations | ||
| Net Investment Income | 78,963 | 73,595 |
| Realized Net Gain (Loss) | 401,489 | 204,410 |
| Change in Unrealized Appreciation (Depreciation) | 801,653 | 1,024,463 |
| Net Increase (Decrease) in Net Assets Resulting from Operations | 1,282,105 | 1,302,468 |
| Distributions | ||
| Net Investment Income | (54,577) | (79,568) |
| Realized Capital Gain | (207,572) | (81,710) |
| Total Distributions | (262,149) | (161,278) |
| Capital Share Transactions | ||
| Issued | 478,435 | 402,141 |
| Issued in Lieu of Cash Distributions | 235,932 | 144,815 |
| Redeemed | (680,461) | (616,525) |
| Net Increase (Decrease) from Capital Share Transactions | 33,906 | (69,569) |
| Total Increase (Decrease) | 1,053,862 | 1,071,621 |
| Net Assets | ||
| Beginning of Period | 5,774,019 | 4,702,398 |
| End of Period1 | 6,827,881 | 5,774,019 |
| 1 Net Assets—End of Period includes undistributed (overdistributed) net investment income of $52,210,000 and $31,537,000. | ||
See accompanying Notes, which are an integral part of the Financial Statements.

PRIMECAP Core Fund
Financial Highlights
| For a Share Outstanding | Year Ended September 30, | ||||
| Throughout Each Period | 2014 | 2013 | 2012 | 2011 | 2010 |
| Net Asset Value, Beginning of Period | $18.65 | $14.98 | $12.37 | $12.51 | $11.42 |
| Investment Operations | |||||
| Net Investment Income | .255 | .242 | .206 | .145 | .1331 |
| Net Realized and Unrealized Gain (Loss) | |||||
| on Investments | 3.820 | 3.955 | 2.567 | (.143) | 1.051 |
| Total from Investment Operations | 4.075 | 4.197 | 2.773 | .002 | 1.184 |
| Distributions | |||||
| Dividends from Net Investment Income | (.178) | (. 260) | (.163) | (.142) | (. 094) |
| Distributions from Realized Capital Gains | (.677) | (.267) | — | — | — |
| Total Distributions | (.855) | (.527) | (.163) | (.142) | (. 094) |
| Net Asset Value, End of Period | $21.87 | $18.65 | $14.98 | $12.37 | $12.51 |
| Total Return2 | 22.60% | 28.88% | 22.55% | -0.10% | 10.39% |
| Ratios/Supplemental Data | |||||
| Net Assets, End of Period (Millions) | $6,828 | $5,774 | $4,702 | $4,345 | $4,569 |
| Ratio of Total Expenses to Average Net Assets | 0.50% | 0.50% | 0.50% | 0.51% | 0.51% |
| Ratio of Net Investment Income to | |||||
| Average Net Assets | 1.23% | 1.42% | 1.39% | 1.01% | 1.09%1 |
| Portfolio Turnover Rate | 13% | 7% | 10% | 9% | 8% |
1 Net investment income per share and the ratio of net investment income to average net assets include $.019 and 0.15%, respectively,
resulting from a special dividend from Weyerhaeuser Co. in July 2010.
2 Total returns do not include transaction or account service fees that may have applied in the periods shown. Fund prospectuses provide
information about any applicable transaction and account service fees.
See accompanying Notes, which are an integral part of the Financial Statements.
19
PRIMECAP Core Fund
Notes to Financial Statements
Vanguard PRIMECAP Core Fund is registered under the Investment Company Act of 1940 as an open-end investment company, or mutual fund.
A. The following significant accounting policies conform to generally accepted accounting principles for U.S. investment companies. The fund consistently follows such policies in preparing its financial statements.
1. Security Valuation: Securities are valued as of the close of trading on the New York Stock Exchange (generally 4 p.m., Eastern time) on the valuation date. Equity securities are valued at the latest quoted sales prices or official closing prices taken from the primary market in which each security trades; such securities not traded on the valuation date are valued at the mean of the latest quoted bid and asked prices. Securities for which market quotations are not readily available, or whose values have been affected by events occurring before the fund’s pricing time but after the close of the securities’ primary markets, are valued at their fair values calculated according to procedures adopted by the board of trustees. These procedures include obtaining quotations from an independent pricing service, monitoring news to identify significant market- or security-specific events, and evaluating changes in the values of foreign market proxies (for example, ADRs, futures contracts, or exchange-traded funds), between the time the foreign markets close and the fund’s pricing time. When fair-value pricing is employed, the prices of securities used by a fund to calculate its net asset value may differ from quoted or published prices for the same securities. Investments in Vanguard Market Liquidity Fund are valued at that fund’s net asset value.
2. Foreign Currency: Securities and other assets and liabilities denominated in foreign currencies are translated into U.S. dollars using exchange rates obtained from an independent third party as of the fund’s pricing time on the valuation date. Realized gains (losses) and unrealized appreciation (depreciation) on investment securities include the effects of changes in exchange rates since the securities were purchased, combined with the effects of changes in security prices. Fluctuations in the value of other assets and liabilities resulting from changes in exchange rates are recorded as unrealized foreign currency gains (losses) until the assets or liabilities are settled in cash, at which time they are recorded as realized foreign currency gains (losses).
3. Federal Income Taxes: The fund intends to continue to qualify as a regulated investment company and distribute all of its taxable income. Management has analyzed the fund’s tax positions taken for all open federal income tax years (September 30, 2011–2014), and has concluded that no provision for federal income tax is required in the fund’s financial statements.
4. Distributions: Distributions to shareholders are recorded on the ex-dividend date.
5. Securities Lending: To earn additional income, the fund lends its securities to qualified institutional borrowers. Security loans are required to be secured at all times by collateral in an amount at least equal to the market value of securities loaned. Daily market fluctuations could cause the value of loaned securities to be more or less than the value of the collateral received. When this occurs, the collateral is adjusted and settled on the next business day. The fund further mitigates its counterparty risk by entering into securities lending transactions only with a diverse group of prequalified counterparties, monitoring their financial strength, and entering into master securities lending agreements with its counterparties. The master securities lending agreements provide that, in the event of a counterparty’s default (including bankruptcy), the fund may terminate any loans with that borrower, determine the net amount owed, and sell or retain the collateral up to the net amount owed to the fund; however, such actions may be subject to legal proceedings. While collateral
20
PRIMECAP Core Fund
mitigates counterparty risk, in the absence of a default the fund may experience delays and costs in recovering the securities loaned. The fund invests cash collateral received in Vanguard Market Liquidity Fund, and records a liability in the Statement of Net Assets for the return of the collateral, during the period the securities are on loan. Securities lending income represents fees charged to borrowers plus income earned on invested cash collateral, less expenses associated with the loan.
6. Credit Facility: The fund and certain other funds managed by The Vanguard Group participate in a $2.89 billion committed credit facility provided by a syndicate of lenders pursuant to a credit agreement that may be renewed annually; each fund is individually liable for its borrowings, if any, under the credit facility. Borrowings may be utilized for temporary and emergency purposes, and are subject to the fund’s regulatory and contractual borrowing restrictions. The participating funds are charged administrative fees and an annual commitment fee of 0.06% of the undrawn amount of the facility; these fees are allocated to the funds based on a method approved by the fund’s board of trustees and included in Management and Administrative expenses on the fund’s Statement of Operations. Any borrowings under this facility bear interest at a rate equal to the higher of the federal funds rate or LIBOR reference rate plus an agreed-upon spread.
The fund had no borrowings outstanding at September 30, 2014, or at any time during the period then ended.
7. Other: Dividend income is recorded on the ex-dividend date. Interest income includes income distributions received from Vanguard Market Liquidity Fund and is accrued daily. Security transactions are accounted for on the date securities are bought or sold. Costs used to determine realized gains (losses) on the sale of investment securities are those of the specific securities sold.
B. PRIMECAP Management Company provides investment advisory services to the fund for a fee calculated at an annual percentage rate of average net assets. For the year ended September 30, 2014, the investment advisory fee represented an effective annual rate of 0.31% of the fund’s average net assets.
C. The Vanguard Group furnishes at cost corporate management, administrative, marketing, and distribution services. The costs of such services are allocated to the fund based on methods approved by the board of trustees. The fund has committed to invest up to 0.40% of its net assets in Vanguard. At September 30, 2014, the fund had contributed capital of $677,000 to Vanguard (included in Other Assets), representing 0.01% of the fund’s net assets and 0.27% of Vanguard’s capitalization. The fund’s trustees and officers are also directors and officers of Vanguard.
D. Various inputs may be used to determine the value of the fund’s investments. These inputs are summarized in three broad levels for financial statement purposes. The inputs or methodologies used to value securities are not necessarily an indication of the risk associated with investing in those securities.
Level 1—Quoted prices in active markets for identical securities.
Level 2—Other significant observable inputs (including quoted prices for similar securities, interest rates, prepayment speeds, credit risk, etc.).
Level 3—Significant unobservable inputs (including the fund’s own assumptions used to determine the fair value of investments).
21
PRIMECAP Core Fund
| The following table summarizes the market value of the fund’s investments as of September 30, 2014, | |||
| based on the inputs used to value them: | |||
| Level 1 | Level 2 | Level 3 | |
| Investments | ($000) | ($000) | ($000) |
| Common Stocks | 6,124,444 | 397,535 | — |
| Temporary Cash Investments | 365,580 | — | — |
| Total | 6,490,024 | 397,535 | — |
E. Distributions are determined on a tax basis and may differ from net investment income and realized capital gains for financial reporting purposes. Differences may be permanent or temporary. Permanent differences are reclassified among capital accounts in the financial statements to reflect their tax character. Temporary differences arise when certain items of income, expense, gain, or loss are recognized in different periods for financial statement and tax purposes. These differences will reverse at some time in the future. Differences in classification may also result from the treatment of short-term gains as ordinary income for tax purposes.
During the year ended September 30, 2014, the fund realized net foreign currency gains of $350,000, which increased distributable net income for tax purposes; accordingly, such gains have been reclassified from accumulated net realized gains to undistributed net investment income.
The fund used a tax accounting practice to treat a portion of the price of capital shares redeemed during the year as distributions from net investment income and realized capital gains. Accordingly, the fund has reclassified $4,063,000 from undistributed net investment income, and $20,446,000 from accumulated net realized gains, to paid-in capital.
For tax purposes, at September 30, 2014, the fund had $71,602,000 of ordinary income and $354,364,000 of long-term capital gains available for distribution.
At September 30, 2014, the cost of investment securities for tax purposes was $3,892,544,000. Net unrealized appreciation of investment securities for tax purposes was $2,995,015,000, consisting of unrealized gains of $3,091,408,000 on securities that had risen in value since their purchase and $96,393,000 in unrealized losses on securities that had fallen in value since their purchase.
F. During the year ended September 30, 2014, the fund purchased $822,224,000 of investment securities and sold $1,013,518,000 of investment securities, other than temporary cash investments.
G. Capital shares issued and redeemed were:
| Year Ended September 30, | ||
| 2014 | 2013 | |
| Shares | Shares | |
| (000) | (000) | |
| Issued | 23,520 | 23,662 |
| Issued in Lieu of Cash Distributions | 12,563 | 9,674 |
| Redeemed | (33,422) | (37,714) |
| Net Increase (Decrease) in Shares Outstanding | 2,661 | (4,378) |
H. Management has determined that no material events or transactions occurred subsequent to September 30, 2014, that would require recognition or disclosure in these financial statements.
22
Report of Independent Registered
Public Accounting Firm
To the Board of Trustees of Vanguard Fenway Funds and the Shareholders of the Vanguard PRIMECAP Core Fund:
In our opinion, the accompanying statement of net assets and the related statements of operations and of changes in net assets and the financial highlights present fairly, in all material respects, the financial position of the Vanguard PRIMECAP Core Fund (constituting a separate portfolio of Vanguard Fenway Funds, hereafter referred to as the “Fund”) at September 30, 2014, the results of its operations for the year then ended, the changes in its net assets for each of the two years in the period then ended, and the financial highlights for each of the five years in the period then ended, in conformity with accounting principles generally accepted in the United States of America. These financial statements and financial highlights (hereafter referred to as “financial statements”) are the responsibility of the Fund’s management. Our responsibility is to express an opinion on these financial statements based on our audits. We conducted our audits of these financial statements in accordance with the standards of the Public Company Accounting Oversight Board (United States). Those standards require that we plan and perform the audit to obtain reasonable assurance about whether the financial statements are free of material misstatement. An audit includes examining, on a test basis, evidence supporting the amounts and disclosures in the financial statements, assessing the accounting principles used and significant estimates made by management, and evaluating the overall financial statement presentation. We believe that our audits, which included confirmation of securities at September 30, 2014 by correspondence with the custodian and by agreement to the underlying ownership records of the transfer agent, provide a reasonable basis for our opinion.
/s/PricewaterhouseCoopers LLP
Philadelphia, Pennsylvania
November 14, 2014

This information for the fiscal year ended September 30, 2014, is included pursuant to provisions of the Internal Revenue Code.
The fund distributed $227,393,000 as capital gain dividends (from net long-term capital gains) to shareholders during the fiscal year.
The fund distributed $54,577,000 of qualified dividend income to shareholders during the fiscal year.
For corporate shareholders, 89.4% of investment income (dividend income plus short-term gains, if any) qualifies for the dividends-received deduction.
Your Fund’s After-Tax Returns
This table presents returns for your fund both before and after taxes. The after-tax returns are shown in two ways: (1) assuming that an investor owned the fund during the entire period and paid taxes on the fund’s distributions, and (2) assuming that an investor paid taxes on the fund’s distributions and sold all shares at the end of each period.
Calculations are based on the highest individual federal income tax and capital gains tax rates in effect at the times of the distributions and the hypothetical sales. State and local taxes were not considered. After-tax returns reflect any qualified dividend income, using actual prior-year figures and estimates for 2014. (In the example, returns after the sale of fund shares may be higher than those assuming no sale. This occurs when the sale would have produced a capital loss. The calculation assumes that the investor received a tax deduction for the loss.)
Please note that your actual after-tax returns will depend on your tax situation and may differ from those shown. Also note that if you own the fund in a tax-deferred account, such as an individual retirement account or a 401(k) plan, this information does not apply to you. Such accounts are not subject to current taxes.
Finally, keep in mind that a fund’s performance—whether before or after taxes—does not guarantee future results.
Average Annual Total Returns: PRIMECAP Core Fund
Periods Ended September 30, 2014
| Since | |||
| One | Five | Inception | |
| Year | Years | (12/9/2004) | |
| Returns Before Taxes | 22.60% | 16.39% | 10.22% |
| Returns After Taxes on Distributions | 21.33 | 15.92 | 9.87 |
| Returns After Taxes on Distributions and Sale of Fund Shares | 13.59 | 13.24 | 8.40 |
24
About Your Fund’s Expenses
As a shareholder of the fund, you incur ongoing costs, which include costs for portfolio management, administrative services, and shareholder reports (like this one), among others. Operating expenses, which are deducted from a fund’s gross income, directly reduce the investment return of the fund.
A fund’s expenses are expressed as a percentage of its average net assets. This figure is known as the expense ratio. The following examples are intended to help you understand the ongoing costs (in dollars) of investing in your fund and to compare these costs with those of other mutual funds. The examples are based on an investment of $1,000 made at the beginning of the period shown and held for the entire period.
The accompanying table illustrates your fund’s costs in two ways:
• Based on actual fund return. This section helps you to estimate the actual expenses that you paid over the period. The ”Ending Account Value“ shown is derived from the fund‘s actual return, and the third column shows the dollar amount that would have been paid by an investor who started with $1,000 in the fund. You may use the information here, together with the amount you invested, to estimate the expenses that you paid over the period.
To do so, simply divide your account value by $1,000 (for example, an $8,600 account value divided by $1,000 = 8.6), then multiply the result by the number given for your fund under the heading ”Expenses Paid During Period.“
• Based on hypothetical 5% yearly return. This section is intended to help you compare your fund‘s costs with those of other mutual funds. It assumes that the fund had a yearly return of 5% before expenses, but that the expense ratio is unchanged. In this case—because the return used is not the fund’s actual return—the results do not apply to your investment. The example is useful in making comparisons because the Securities and Exchange Commission requires all mutual funds to calculate expenses based on a 5% return. You can assess your fund’s costs by comparing this hypothetical example with the hypothetical examples that appear in shareholder reports of other funds.
Note that the expenses shown in the table are meant to highlight and help you compare ongoing costs only and do not reflect transaction costs incurred by the fund for buying and selling securities. Further, the expenses do not include any purchase, redemption, or account service fees described in the fund prospectus. If such fees were applied to your account, your costs would be higher. Your fund does not carry a “sales load.”
The calculations assume no shares were bought or sold during the period. Your actual costs may have been higher or lower, depending on the amount of your investment and the timing of any purchases or redemptions.
You can find more information about the fund’s expenses, including annual expense ratios, in the Financial Statements section of this report. For additional information on operating expenses and other shareholder costs, please refer to your fund’s current prospectus.
| Six Months Ended September 30, 2014 | |||
| Beginning | Ending | Expenses | |
| Account Value | Account Value | Paid During | |
| PRIMECAP Core Fund | 3/31/2014 | 9/30/2014 | Period |
| Based on Actual Fund Return | $1,000.00 | $1,069.44 | $2.59 |
| Based on Hypothetical 5% Yearly Return | 1,000.00 | 1,022.56 | 2.54 |
The calculations are based on expenses incurred in the most recent six-month period. The fund’s annualized six-month expense ratio for that
period is 0.50%. The dollar amounts shown as “Expenses Paid” are equal to the annualized expense ratio multiplied by the average account
value over the period, multiplied by the number of days in the most recent six-month period, then divided by the number of days in the most
recent 12-month period.
26
Glossary
30-Day SEC Yield. A fund’s 30-day SEC yield is derived using a formula specified by the U.S. Securities and Exchange Commission. Under the formula, data related to the fund’s security holdings in the previous 30 days are used to calculate the fund’s hypothetical net income for that period, which is then annualized and divided by the fund’s estimated average net assets over the calculation period. For the purposes of this calculation, a security’s income is based on its current market yield to maturity (for bonds), its actual income (for asset-backed securities), or its projected dividend yield (for stocks). Because the SEC yield represents hypothetical annualized income, it will differ—at times significantly—from the fund’s actual experience. As a result, the fund’s income distributions may be higher or lower than implied by the SEC yield.
Beta. A measure of the magnitude of a fund’s past share-price fluctuations in relation to the ups and downs of a given market index. The index is assigned a beta of 1.00. Compared with a given index, a fund with a beta of 1.20 typically would have seen its share price rise or fall by 12% when the index rose or fell by 10%. For this report, beta is based on returns over the past 36 months for both the fund and the index. Note that a fund’s beta should be reviewed in conjunction with its R-squared (see definition). The lower the R-squared, the less correlation there is between the fund and the index, and the less reliable beta is as an indicator of volatility.
Dividend Yield. Dividend income earned by stocks, expressed as a percentage of the aggregate market value (or of net asset value, for a fund). The yield is determined by dividing the amount of the annual dividends by the aggregate value (or net asset value) at the end of the period. For a fund, the dividend yield is based solely on stock holdings and does not include any income produced by other investments.
Earnings Growth Rate. The average annual rate of growth in earnings over the past five years for the stocks now in a fund.
Equity Exposure. A measure that reflects a fund’s investments in stocks and stock futures. Any holdings in short-term reserves are excluded.
Expense Ratio. A fund’s total annual operating expenses expressed as a percentage of the fund’s average net assets. The expense ratio includes management and administrative expenses, but does not include the transaction costs of buying and selling portfolio securities.
Foreign Holdings. The percentage of a fund represented by securities or depositary receipts of companies based outside the United States.
Inception Date. The date on which the assets of a fund (or one of its share classes) are first invested in accordance with the fund’s investment objective. For funds with a subscription period, the inception date is the day after that period ends. Investment performance is measured from the inception date.
Median Market Cap. An indicator of the size of companies in which a fund invests; the midpoint of market capitalization (market price x shares outstanding) of a fund’s stocks, weighted by the proportion of the fund’s assets invested in each stock. Stocks representing half of the fund’s assets have market capitalizations above the median, and the rest are below it.
Price/Book Ratio. The share price of a stock divided by its net worth, or book value, per share. For a fund, the weighted average price/book ratio of the stocks it holds.
27
Price/Earnings Ratio. The ratio of a stock’s current price to its per-share earnings over the past year. For a fund, the weighted average P/E of the stocks it holds. P/E is an indicator of market expectations about corporate prospects; the higher the P/E, the greater the expectations for a company’s future growth.
R-Squared. A measure of how much of a fund’s past returns can be explained by the returns from the market in general, as measured by a given index. If a fund’s total returns were precisely synchronized with an index’s returns, its R-squared would be 1.00. If the fund’s returns bore no relationship to the index’s returns, its R-squared would be 0. For this report, R-squared is based on returns over the past 36 months for both the fund and the index.
Return on Equity. The annual average rate of return generated by a company during the past five years for each dollar of shareholder’s equity (net income divided by shareholder’s equity). For a fund, the weighted average return on equity for the companies whose stocks it holds.
Short-Term Reserves. The percentage of a fund invested in highly liquid, short-term securities that can be readily converted to cash.
Turnover Rate. An indication of the fund’s trading activity. Funds with high turnover rates incur higher transaction costs and may be more likely to distribute capital gains (which may be taxable to investors). The turnover rate excludes in-kind transactions, which have minimal impact on costs.
28
This page intentionally left blank.
This page intentionally left blank.
This page intentionally left blank.
The People Who Govern Your Fund
The trustees of your mutual fund are there to see that the fund is operated and managed in your best interests since, as a shareholder, you are a part owner of the fund. Your fund’s trustees also serve on the board of directors of The Vanguard Group, Inc., which is owned by the Vanguard funds and provides services to them on an at-cost basis.
A majority of Vanguard’s board members are independent, meaning that they have no affiliation with Vanguard or the funds they oversee, apart from the sizable personal investments they have made as private individuals. The independent board members have distinguished backgrounds in business, academia, and public service. Each of the trustees and executive officers oversees 177 Vanguard funds.
The following table provides information for each trustee and executive officer of the fund. More information about the trustees is in the Statement of Additional Information, which can be obtained, without charge, by contacting Vanguard at 800-662-7447, or online at vanguard.com.
| InterestedTrustee1 | and Delphi Automotive LLP (automotive components); |
| Senior Advisor at New Mountain Capital. | |
| F. William McNabb III | |
| Born 1957. Trustee Since July 2009. Chairman of the | Amy Gutmann |
| Board. Principal Occupation(s) During the Past Five | Born 1949. Trustee Since June 2006. Principal |
| Years: Chairman of the Board of The Vanguard Group, | Occupation(s) During the Past Five Years: President of |
| Inc., and of each of the investment companies served | the University of Pennsylvania; Christopher H. Browne |
| by The Vanguard Group, since January 2010; Director | Distinguished Professor of Political Science, School of |
| of The Vanguard Group since 2008; Chief Executive | Arts and Sciences, and Professor of Communication, |
| Officer and President of The Vanguard Group, and of | Annenberg School for Communication, with secondary |
| each of the investment companies served by The | faculty appointments in the Department of Philosophy, |
| Vanguard Group, since 2008; Director of Vanguard | School of Arts and Sciences, and at the Graduate |
| Marketing Corporation; Managing Director of The | School of Education, University of Pennsylvania; |
| Vanguard Group (1995–2008). | Trustee of the National Constitution Center; Chair |
| of the Presidential Commission for the Study of | |
| Bioethical Issues. | |
| IndependentTrustees | |
| JoAnn Heffernan Heisen | |
| Emerson U. Fullwood | Born 1950. Trustee Since July 1998. Principal |
| Born 1948. Trustee Since January 2008. Principal | Occupation(s) During the Past Five Years: Corporate |
| Occupation(s) During the Past Five Years: Executive | Vice President and Chief Global Diversity Officer |
| Chief Staff and Marketing Officer for North America | (retired 2008) and Member of the Executive |
| and Corporate Vice President (retired 2008) of Xerox | Committee (1997–2008) of Johnson & Johnson |
| Corporation (document management products and | (pharmaceuticals/medical devices/consumer |
| services); Executive in Residence and 2009–2010 | products); Director of Skytop Lodge Corporation |
| Distinguished Minett Professor at the Rochester | (hotels), the University Medical Center at Princeton, |
| Institute of Technology; Director of SPX Corporation | the Robert Wood Johnson Foundation, and the Center |
| (multi-industry manufacturing), the United Way of | for Talent Innovation; Member of the Advisory Board |
| Rochester, Amerigroup Corporation (managed health | of the Maxwell School of Citizenship and Public Affairs |
| care), the University of Rochester Medical Center, | at Syracuse University. |
| Monroe Community College Foundation, and North | |
| Carolina A&T University. | F. Joseph Loughrey |
| Born 1949. Trustee Since October 2009. Principal | |
| Rajiv L. Gupta | Occupation(s) During the Past Five Years: President |
| Born 1945. Trustee Since December 2001.2 | and Chief Operating Officer (retired 2009) of Cummins |
| Principal Occupation(s) During the Past Five Years: | Inc. (industrial machinery); Chairman of the Board |
| Chairman and Chief Executive Officer (retired 2009) | of Hillenbrand, Inc. (specialized consumer services), |
| and President (2006–2008) of Rohm and Haas Co. | and of Oxfam America; Director of SKF AB (industrial |
| (chemicals); Director of Tyco International, Ltd. | machinery), Hyster-Yale Materials Handling, Inc. |
| (diversified manufacturing and services), Hewlett- | (forklift trucks), the Lumina Foundation for Education, |
| Packard Co. (electronic computer manufacturing), |
| and the V Foundation for Cancer Research; Member | Executive Officers | |
| of the Advisory Council for the College of Arts and | ||
| Letters and of the Advisory Board to the Kellogg | Glenn Booraem | |
| Institute for International Studies, both at the | Born 1967. Controller Since July 2010. Principal | |
| University of Notre Dame. | Occupation(s) During the Past Five Years: Principal | |
| of The Vanguard Group, Inc.; Controller of each of | ||
| Mark Loughridge | the investment companies served by The Vanguard | |
| Born 1953. Trustee Since March 2012. Principal | Group; Assistant Controller of each of the investment | |
| Occupation(s) During the Past Five Years: Senior Vice | companies served by The Vanguard Group (2001–2010). | |
| President and Chief Financial Officer (retired 2013) | ||
| at IBM (information technology services); Fiduciary | Thomas J. Higgins | |
| Member of IBM’s Retirement Plan Committee (2004– | Born 1957. Chief Financial Officer Since September | |
| 2013); Member of the Council on Chicago Booth. | 2008. Principal Occupation(s) During the Past Five | |
| Years: Principal of The Vanguard Group, Inc.; Chief | ||
| Scott C. Malpass | Financial Officer of each of the investment companies | |
| Born 1962. Trustee Since March 2012. Principal | served by The Vanguard Group; Treasurer of each of | |
| Occupation(s) During the Past Five Years: Chief | the investment companies served by The Vanguard | |
| Investment Officer and Vice President at the University | Group (1998–2008). | |
| of Notre Dame; Assistant Professor of Finance at the | ||
| Mendoza College of Business at Notre Dame; Member | Kathryn J. Hyatt | |
| of the Notre Dame 403(b) Investment Committee; | Born 1955. Treasurer Since November 2008. Principal | |
| Board Member of TIFF Advisory Services, Inc. | Occupation(s) During the Past Five Years: Principal of | |
| (investment advisor); Member of the Investment | The Vanguard Group, Inc.; Treasurer of each of the | |
| Advisory Committees of the Financial Industry | investment companies served by The Vanguard | |
| Regulatory Authority (FINRA) and of Major League | Group; Assistant Treasurer of each of the investment | |
| Baseball. | companies served by The Vanguard Group (1988–2008). | |
| André F. Perold | Heidi Stam | |
| Born 1952. Trustee Since December 2004. Principal | Born 1956. Secretary Since July 2005. Principal | |
| Occupation(s) During the Past Five Years: George | Occupation(s) During the Past Five Years: Managing | |
| Gund Professor of Finance and Banking, Emeritus | Director of The Vanguard Group, Inc.; General Counsel | |
| at the Harvard Business School (retired 2011); | of The Vanguard Group; Secretary of The Vanguard | |
| Chief Investment Officer and Managing Partner of | Group and of each of the investment companies | |
| HighVista Strategies LLC (private investment firm); | served by The Vanguard Group; Director and Senior | |
| Director of Rand Merchant Bank; Overseer of the | Vice President of Vanguard Marketing Corporation. | |
| Museum of Fine Arts Boston. | ||
| Vanguard Senior ManagementTeam | ||
| Alfred M. Rankin, Jr. | ||
| Born 1941. Trustee Since January 1993. Principal | Mortimer J. Buckley | Chris D. McIsaac |
| Occupation(s) During the Past Five Years: Chairman, | Kathleen C. Gubanich | Michael S. Miller |
| President, and Chief Executive Officer of NACCO | Paul A. Heller | James M. Norris |
| Industries, Inc. (housewares/lignite), and of Hyster- | Martha G. King | Glenn W. Reed |
| Yale Materials Handling, Inc. (forklift trucks); Chairman | John T. Marcante | |
| of the Board of University Hospitals of Cleveland. | ||
| Peter F. Volanakis | Chairman Emeritus and Senior Advisor | |
| Born 1955. Trustee Since July 2009. Principal | ||
| Occupation(s) During the Past Five Years: President | John J. Brennan | |
| and Chief Operating Officer (retired 2010) of Corning | Chairman, 1996–2009 | |
| Incorporated (communications equipment); Trustee of | Chief Executive Officer and President, 1996–2008 | |
| Colby-Sawyer College; Member of the Advisory Board | ||
| of the Norris Cotton Cancer Center and of the Advisory | Founder | |
| Board of the Parthenon Group (strategy consulting). | ||
| John C. Bogle | ||
| Chairman and Chief Executive Officer, 1974–1996 | ||
1 Mr. McNabb is considered an “interested person,” as defined in the Investment Company Act of 1940, because he is an officer of the
Vanguard funds.
2 December 2002 for Vanguard Equity Income Fund, the Vanguard Municipal Bond Funds, and the Vanguard State Tax-Exempt Funds.
 | |
| P.O. Box 2600 | |
| Valley Forge, PA 19482-2600 | |
| Connect with Vanguard® > vanguard.com | |
| Fund Information > 800-662-7447 | |
| Direct Investor Account Services > 800-662-2739 | |
| Institutional Investor Services > 800-523-1036 | |
| Text Telephone for People | |
| Who Are Deaf or Hard of Hearing> 800-749-7273 | |
| This material may be used in conjunction | |
| with the offering of shares of any Vanguard | |
| fund only if preceded or accompanied by | |
| the fund’s current prospectus. | |
| All comparative mutual fund data are from Lipper, a | |
| Thomson Reuters Company, or Morningstar, Inc., unless | |
| otherwise noted. | |
| You can obtain a free copy of Vanguard’s proxy voting | |
| guidelines by visiting vanguard.com/proxyreporting or by | |
| calling Vanguard at 800-662-2739. The guidelines are | |
| also available from the SEC’s website, sec.gov. In | |
| addition, you may obtain a free report on how your fund | |
| voted the proxies for securities it owned during the 12 | |
| months ended June 30. To get the report, visit either | |
| vanguard.com/proxyreporting or sec.gov. | |
| You can review and copy information about your fund at | |
| the SEC’s Public Reference Room in Washington, D.C. To | |
| find out more about this public service, call the SEC at | |
| 202-551-8090. Information about your fund is also | |
| available on the SEC’s website, and you can receive | |
| copies of this information, for a fee, by sending a | |
| request in either of two ways: via e-mail addressed to | |
| publicinfo@sec.gov or via regular mail addressed to the | |
| Public Reference Section, Securities and Exchange | |
| Commission, Washington, DC 20549-1520. | |
| © 2014 The Vanguard Group, Inc. | |
| All rights reserved. | |
| Vanguard Marketing Corporation, Distributor. | |
| Q12200 112014 | |
Item 2: Code of Ethics. The Registrant has adopted a code of ethics that applies to the Registrant’s principal executive officer, principal financial officer, principal accounting officer or controller or persons performing similar functions. The Code of Ethics was amended during the reporting period covered by this report to make certain technical, non-material changes.
Item 3: Audit Committee Financial Expert. The following members of the Audit Committee have been determined by the Registrant’s Board of Trustees to be Audit Committee Financial Experts serving on its Audit Committee, and to be independent: Rajiv L. Gupta, Amy Gutmann, JoAnn Heffernan Heisen, F. Joseph Loughrey, Mark Loughridge, Scott C. Malpass, André F. Perold, and Alfred M. Rankin, Jr.
Item 4: Principal Accountant Fees and Services.
(a) Audit Fees.
Audit Fees of the Registrant
Fiscal Year Ended September 30, 2014: $64,000
Fiscal Year Ended September 30, 2013: $82,000
Aggregate Audit Fees of Registered Investment Companies in the Vanguard Group.
Fiscal Year Ended September 30, 2014: $6,605,127
Fiscal Year Ended September 30, 2013: $5,714,113
Includes fees billed in connection with audits of the Registrant, other registered investment companies in the Vanguard complex, The Vanguard Group, Inc. and Vanguard Marketing Corporation.
(b) Audit-Related Fees.
Fiscal Year Ended September 30, 2014: $2,176,479
Fiscal Year Ended September 30, 2013: $1,552,950
Includes fees billed in connection with assurance and related services provided to the Registrant, other registered investment companies in the Vanguard complex, The Vanguard Group, Inc., and Vanguard Marketing Corporation.
(c) Tax Fees.
Fiscal Year Ended September 30, 2014: $316,869
Fiscal Year Ended September 30, 2013: $110,000
Includes fees billed in connection with tax compliance, planning, and advice services provided to the Registrant, other registered investment companies in the Vanguard complex, The Vanguard Group, Inc., and Vanguard Marketing Corporation.
(d) All Other Fees.
Fiscal Year Ended September 30, 2014: $198,163
Fiscal Year Ended September 30, 2013: $132,000
Includes fees billed for services related to tax reported information provided to the Registrant, other registered investment companies in the Vanguard complex, The Vanguard Group, Inc., and Vanguard Marketing Corporation.
(e) (1) Pre-Approval Policies. The policy of the Registrant’s Audit Committee is to consider and, if appropriate, approve before the principal accountant is engaged for such services, all specific audit and non-audit services provided to: the Registrant, other registered investment companies in the Vanguard complex, The Vanguard Group, Inc., and entities controlled by The Vanguard Group, Inc. that provide ongoing services to the Registrant. In making a determination, the Audit Committee considers whether the services are consistent with maintaining the principal accountant’s independence.
In the event of a contingency situation in which the principal accountant is needed to provide services in between scheduled Audit Committee meetings, the Chairman of the Audit Committee would be called on to consider and, if appropriate, pre-approve audit or permitted non-audit services in an amount sufficient to complete services through the next Audit Committee meeting, and to determine if such services would be consistent with maintaining the accountant’s independence. At the next scheduled Audit Committee meeting, services and fees would be presented to the Audit Committee for formal consideration, and, if appropriate, approval by the entire Audit Committee. The Audit Committee would again consider whether such services and fees are consistent with maintaining the principal accountant’s independence.
The Registrant’s Audit Committee is informed at least annually of all audit and non-audit services provided by the principal accountant to the Vanguard complex, whether such services are provided to: the Registrant, other registered investment companies in the Vanguard complex, The Vanguard Group, Inc., or other entities controlled by The Vanguard Group, Inc. that provide ongoing services to the Registrant.
(2) No percentage of the principal accountant’s fees or services were approved pursuant to the waiver provision of paragraph (c)(7)(i)(C) of Rule 2-01 of Regulation S-X.
(f) For the most recent fiscal year, over 50% of the hours worked under the principal accountant’s engagement were not performed by persons other than full-time, permanent employees of the principal accountant.
(g) Aggregate Non-Audit Fees.
Fiscal Year Ended September 30, 2014: $515,032
Fiscal Year Ended September 30, 2013: $242,000
Includes fees billed for non-audit services provided to the Registrant, other registered investment companies in the Vanguard complex, The Vanguard Group, Inc., and Vanguard Marketing Corporation.
(h) For the most recent fiscal year, the Audit Committee has determined that the provision of all non-audit services was consistent with maintaining the principal accountant’s independence.
Item 5: Audit Committee of Listed Registrants.
Not Applicable.
Item 6: Investments.
Not Applicable.
Item 7: Disclosure of Proxy Voting Policies and Procedures for Closed-End Management
Investment Companies.
Not Applicable.
Item 8: Portfolio Managers of Closed-End Management Investment Companies.
Not Applicable.
Item 9: Purchase of Equity Securities by Closed-End Management Investment Company and
Affiliated Purchasers.
Not Applicable.
Item 10: Submission of Matters to a Vote of Security Holders.
Not Applicable.
Item 11: Controls and Procedures.
(a) Disclosure Controls and Procedures. The Principal Executive and Financial Officers concluded that the Registrant’s Disclosure Controls and Procedures are effective based on their evaluation of the Disclosure Controls and Procedures as of a date within 90 days of the filing date of this report.
(b) Internal Control Over Financial Reporting. There were no significant changes in Registrant’s Internal Control Over Financial Reporting or in other factors that could significantly affect this control subsequent to the date of the evaluation, including any corrective actions with regard to significant deficiencies and material weaknesses.
Item 12: Exhibits.
(a) Code of Ethics.
(b) Certifications.
Pursuant to the requirements of the Securities Exchange Act of 1934 and the Investment Company Act of 1940, the registrant has duly caused this report to be signed on its behalf by the undersigned, thereunto duly authorized.
| VANGUARD FENWAY FUNDS | |
| BY: | /s/ F. WILLIAM MCNABB III* |
| F. WILLIAM MCNABB III | |
| CHIEF EXECUTIVE OFFICER | |
| Date: November 19, 2014 | |
Pursuant to the requirements of the Securities Exchange Act of 1934 and the Investment Company Act of 1940, this report has been signed below by the following persons on behalf of the registrant and in the capacities and on the dates indicated.
| VANGUARD FENWAY FUNDS | |
| BY: | /s/ F. WILLIAM MCNABB III* |
| F. WILLIAM MCNABB III | |
| CHIEF EXECUTIVE OFFICER | |
| Date: November 19, 2014 | |
| VANGUARD FENWAY FUNDS |
BY: | /s/ THOMAS J. HIGGINS* |
| THOMAS J. HIGGINS | |
| CHIEF FINANCIAL OFFICER | |
| Date: November 19, 2014 | |
* By: /s/ Heidi Stam
Heidi Stam, pursuant to a Power of Attorney filed on April 22, 2014 see file Number 2-17620, Incorporated by Reference.