UNITED STATES
SECURITIES AND EXCHANGE COMMISSION
Washington, D.C. 20549
FORM N-CSR
CERTIFIED SHAREHOLDER REPORT
OF
REGISTERED MANAGEMENT INVESTMENT COMPANIES
| Investment Company Act file number: | 811-5445 |
| Name of Registrant: | Vanguard Fenway Funds |
| Address of Registrant: | P.O. Box 2600 |
| Valley Forge, PA 19482 | |
| Name and address of agent for service: | Heidi Stam, Esquire |
| P.O. Box 876 | |
| Valley Forge, PA 19482 | |
| Registrant’s telephone number, including area code: | (610) 669-1000 |
| Date of fiscal year end: | September 30 |
| Date of reporting period: | October 1, 2008 – September 30, 2009 |
Item 1: Reports to Shareholders
![]()
| Vanguard Equity Income Fund |
| Annual Report |
| September 30, 2009 |

> Vanguard Equity Income Fund returned about –9%, as a rally in the second
half of the year failed to offset the fund’s steep decline in the first half.
> The fund’s heavy allocation to financials, typically a rich vein of dividend-paying
stocks, was the fund’s—and the market’s—biggest trouble spot.
> The fund’s dividend yield has declined from 2008 levels, in large part because
cash-strapped companies have trimmed dividend payouts.
| Contents | |
| Your Fund’s Total Returns | 1 |
| President’s Letter | 2 |
| Advisors’ Report | 8 |
| Results of Proxy Voting | 11 |
| Fund Profile | 13 |
| Performance Summary | 14 |
| Financial Statements | 16 |
| Your Fund’s After-Tax Returns | 30 |
| About Your Fund’s Expenses | 31 |
| Glossary | 33 |
Please note: The opinions expressed in this report are just that—informed opinions. They should not be considered promises or advice.
Also, please keep in mind that the information and opinions cover the period through the date on the front of this report. Of course, the
risks of investing in your fund are spelled out in the prospectus.
Cover photograph: Veronica Coia.
Your Fund’s Total Returns
| Fiscal Year Ended September 30, 2009 | ||
| Ticker | Total | |
| Symbol | Returns | |
| Vanguard Equity Income Fund | ||
| Investor Shares | VEIPX | –9.12% |
| Admiral™ Shares1 | VEIRX | –9.05 |
| FTSE High Dividend Yield Index | –9.02 | |
| Equity Income Funds Average2 | –6.36 |
| Your Fund’s Performance at a Glance | ||||
| September 30, 2008–September 30, 2009 | ||||
| Distributions Per Share | ||||
| Starting | Ending | Income | Capital | |
| Share Price | Share Price | Dividends | Gains | |
| Vanguard Equity Income Fund | ||||
| Investor Shares | $20.02 | $17.40 | $0.587 | $0.112 |
| Admiral Shares | 41.97 | 36.46 | 1.270 | 0.235 |
1 A lower-cost class of shares available to many longtime shareholders and to those with significant investments in the fund.
2 Derived from data provided by Lipper Inc.
1

President’s Letter
Dear Shareholder,
During the 12 months ended September 30, 2009, Vanguard Equity Income Fund returned about –9%, a disappointing number that incorporates a dramatic six-month decline and a powerful six-month rally. The fund performed in line with its benchmark index, but trailed its equity income fund peers.
At the end of the period, the fund’s Investor Shares had a 30-day SEC yield of 2.80% (Admiral Shares: 2.90%), significantly higher than the stock market’s yield. Both the fund’s and the stock market’s yields have declined over the past year, a reflection of big dividend cuts across corporate America.
After a precipitous fall, stock markets rebound
In recent months, the financial markets have performed so strongly that it’s almost hard to remember that less than a year ago the global financial system stood on the brink of collapse. Since then, markets have pulled back from the abyss. Although unemployment remains near generational highs, and the prospects of a robust recovery seem dim, the global economy has begun to grind into gear.
2
Reminders of the markets’ dark days are nevertheless apparent in the index returns for both the past 12 months and the past three years. Over both periods, U.S. stocks recorded negative returns. Global stocks did better over the past 12 months, recouping their late-2008 losses thanks to general strength in developed economies and a powerful rally in emerging markets. Over the past three years, however, international stocks posted a modestly negative return.
The bond market’s turnabout has been equally dramatic
The stock market’s collapse and recovery echo even more dramatic developments in the bond market. At the end of 2008,
as the credit markets nearly ceased to function, the difference between the yields of corporate bonds and Treasury bonds spiked to levels last seen during the Great Depression.
The Federal Reserve and its central bank counterparts around the world responded with aggressive monetary stimulus efforts, while global governments opened the fiscal taps. Investors first tiptoed, then stampeded, back into the market, boosting bond prices and bringing down yields. Over the past 12 months, taxable U.S. bonds returned more than 10%; municipal securities did even better, returning almost 15%, as measured by the Barclays Capital Municipal Bond Index.
| Market Barometer | |||
| Average Annual Total Returns | |||
| Periods Ended September 30, 2009 | |||
| One Year | Three Years | Five Years | |
| Stocks | |||
| Russell 1000 Index (Large-caps) | –6.14% | –5.10% | 1.49% |
| Russell 2000 Index (Small-caps) | –9.55 | –4.57 | 2.41 |
| Dow Jones U.S. Total Stock Market Index | –5.83 | –4.58 | 1.93 |
| MSCI All Country World Index ex USA (International) | 6.43 | –0.78 | 8.59 |
| Bonds | |||
| Barclays Capital U.S. Aggregate Bond Index | |||
| (Broad taxable market) | 10.56% | 6.41% | 5.13% |
| Barclays Capital Municipal Bond Index | 14.85 | 5.13 | 4.78 |
| Citigroup 3-Month Treasury Bill Index | 0.39 | 2.63 | 2.96 |
| CPI | |||
| Consumer Price Index | –1.29% | 2.10% | 2.61% |
3
The Fed’s rescue campaign has imposed a heavy price on short-term savings vehicles such as money market funds. In December 2008, the Fed reduced its target for the federal funds rate, a benchmark for the interest rates paid by money market instruments and other very short-term securities, to between 0% and 0.25%. The Fed has said it expects to maintain its target at this level “for an extended period.”
As the financial crisis intensified, bank stocks caused pain
Like its benchmark index and mutual fund peers, Vanguard Equity Income Fund typically has a sizable allocation to banks, brokerages, and other financial
stocks. These companies have traditionally been a reliable source of dividend income. During the past 12 months, however, they were one of the bleakest corners of the capital markets.
When these stocks collapsed in late 2008, Vanguard Equity Income Fund had nowhere to hide. Many of these same stocks have since rebounded, but their prices remain well below earlier highs, helping to keep the fund’s 12-month return at about –9%. As global economies contracted, materials and industrial stocks, both sensitive to the rhythms of the business cycle, also put pressure on performance.
| Expense Ratios1 | |||
| Your Fund Compared With Its Peer Group | |||
| Investor | Admiral | Equity Income | |
| Shares | Shares | Funds Average | |
| Equity Income Fund | 0.37% | 0.24% | 1.34% |
1 The fund expense ratios shown are from the prospectus dated January 15, 2009, and represent estimated costs for the current fiscal year
based on the fund’s net assets as of the prospectus date. For the fiscal year ended September 30, 2009, the fund’s expense ratios were
0.36% for Investor Shares and 0.24% for Admiral Shares. The peer-group ratio is derived from data provided by Lipper Inc. and captures
information through year-end 2008.
4
The impact of the financial crisis on stock prices was one disappointment. Its impact on dividends was another. As companies struggled to stabilize their balance sheets, many cut their dividends. At the start of the year, the fund’s Investor Shares had a 30-day SEC yield of 3.79%; a year later, the figure was 2.80%. Standard & Poor’s reported that in the three months ended September 30, 2009, 113 U.S. companies cut their dividends, the highest number since the third quarter of 1982.
Bright spots included stocks in the telecommunications, health care, and technology sectors, which produced positive returns for the full 12 months. Tech stocks began to lead the market higher in March 2009, as companies
that had deferred necessary investment in technologies began to open their wallets. Despite their positive returns, the fund’s tech stocks failed to keep pace with the broader sector’s rally.
Talented management and low costs have kept fund ahead of the pack
Although the fund’s 12-month returns were notably weaker than the average return of its peer group, it’s unwise to make too much of one-year results. As long as the fund’s advisors, Wellington Management Company and Vanguard Quantitative Equity Group, continue to execute the same strategy that, in our judgment, will produce long-term success, we place much more weight on the long-term returns.
| Total Returns | |
| Ten Years Ended September 30, 2009 | |
| Average | |
| Annual Return | |
| Equity Income Fund Investor Shares | 3.03% |
| Spliced Equity Income Index1 | 3.28 |
| Equity Income Funds Average2 | 2.13 |
The figures shown represent past performance, which is not a guarantee of future results. (Current performance
may be lower or higher than the performance data cited. For performance data current to the most recent month-
end, visit our website at www.vanguard.com/performance.) Note, too, that both investment returns and principal
value can fluctuate widely, so an investor’s shares, when sold, could be worth more or less than their original cost.
1 Russell 1000 Value Index through July 31, 2007; FTSE High Dividend Yield Index thereafter.
2 Derived from data provided by Lipper Inc.
5
A long-term perspective gives investors a sense of how the fund has performed through a variety of market environments. During the past 10 years—an environment that was much tougher than a typical decade-long stretch—the Investor Shares of Vanguard Equity Income Fund returned 3.03%, 0.9 percentage point more than the peer-group average. In addition to the skills of its advisors, that margin highlights the value of low costs. Vanguard Equity Income’s cost advantage might give it a head start of 0.8 to 1.2 percentage points on some of its peer funds.
Although the fund finished a few steps behind its benchmark index over the past decade, it’s worth noting that until July 2007, the fund’s benchmark was inconsistent with its equity income mandate. The Russell 1000 Value Index includes a number of stocks that pay no dividends.
A word on expenses
The fund’s expense ratio has risen over the past fiscal year. The explanation is threefold.
| Investment insight | |||
| The conflict between cost and yield | |||
| When a stock in your fund’s portfolio pays a dividend, that money has two places | |||
| to go: to your account or to the fund company’s ledger. | |||
| During the 12 months ended September 30, 2009, equity income funds had an | |||
| average distributed yield—the past year’s income distributions divided by their | |||
| September 30 NAV—of 2.54%, according to data from Lipper Inc. Over the same | |||
| period, Vanguard Equity Income Fund’s distributed yield was 3.37%. | |||
| You can chalk up much of the difference to costs. In the table below, we add the | |||
| expense ratio to the 12-month distributed yield for both Vanguard Equity Income | |||
| Fund and the peer-group average. The resulting “gross yields”—the dividend yields | |||
| before expenses—are similar. | |||
| After costs, however, the much less expensive Vanguard Equity Income Fund provided | |||
| its shareholders with a much more generous yield than the typical fund. | |||
| Estimated | 12-month | ||
| gross yield | Expense ratio | distribution yield | |
| Vanguard Equity Income Fund Investor Shares | 3.73% | 0.36% | 3.37% |
| Equity Income Funds Average | 3.88 | 1.34 | 2.54 |
| Source: Derived from data provided by Lipper Inc. | |||
6
First, as the value of fund assets has declined, the fund’s fixed expenses have accounted for a modestly higher percentage of fund assets. Second, the Vanguard funds’ contracts with external advisors typically include breakpoint pricing. As assets rise above a breakpoint threshold, advisory fees are paid at a lower rate. When assets fall, as they have during fiscal 2009, a smaller portion of assets is subject to the lower rate, causing the overall rate to increase.
Finally, Vanguard’s contracts with external advisors generally include an incentive-fee provision that is contingent on the advisors’ performance relative to their benchmarks. This fee structure helps to ensure that the interests of the fund shareholders and advisors remain aligned. Over the past year, the advisory fee increased as the fund’s relative performance improved. The fund’s financial statements include more information about Vanguard Equity Income Fund’s incentive fee.
Important lessons from an unsettled period
The past year’s market tumult has provided a powerful, if not entirely welcome, lesson in the critical importance of balance, diversification, and a commitment to a long-term plan. When
the stock market tumbled in late 2008 and early 2009, the diversification benefits of a bond allocation became crystal clear. During the past six months, the stock market’s powerful rally has underscored the benefit of sticking with your long-term equity allocation through the inevitable moments of anxiety and doubt.
Where do we go from here? Although it seems as if the worst is behind us, the financial markets’ short-term direction is impossible to forecast with accuracy. The best response to this uncertainty is, again, a plan based on reasonable long-term return and risk expectations that you can stick with through periods of market turmoil. For income-oriented investors, Vanguard Equity Income Fund can play an important role in such a plan.
Thank you for entrusting your assets to Vanguard.
Sincerely,

F. William McNabb III
President and Chief Executive Officer
October 15, 2009
7
Advisors’ Report
For the fiscal year ended September 30, the Equity Income Fund returned about –9%, reflecting the combined results of your fund’s two independent investment advisors. The use of two advisors provides exposure to distinct, yet complementary, investment approaches, enhancing the diversification of your fund. It is not uncommon for different advisors to have different views about individual securities or the broader investment environment.
The advisors, the percentage of the fund’s assets each manages, and a brief description of their investment strategies are presented in the table below. The advisors have also prepared a discussion of the investment environment that existed during the fiscal year and of how their portfolio positioning reflects this assessment. These comments were prepared on October 21, 2009.
Wellington Management Company, LLP
Portfolio Manager:
W. Michael Reckmeyer, III, CFA,
Senior Vice President
The economy appears to be rebounding from one of the worst economic downturns in recent history in response to massive government fiscal and monetary stimulus programs. The result has been a significantly improved corporate bond market and surging stock markets. This directly benefits consumers’ wealth and confidence, but importantly allows companies to recapitalize their balance sheets.
The key consideration going forward is the magnitude and sustainability of the recovery. Several headwinds remain, which leads us to conclude that economic growth will be moderate. The unwinding of federal stimulus programs, high debt
| Vanguard Equity Income Fund Investment Advisors | |||
| Fund Assets Managed | |||
| Investment Advisor | % | $ Million | Investment Strategy |
| Wellington Management | 61 | 2,347 | A fundamental approach to seeking desirable stocks. |
| Company, LLP | Our selections typically offer above-average dividend | ||
| yields, below-average valuations, and the potential | |||
| for dividend increases in the future. | |||
| Vanguard Quantitative | 36 | 1,418 | Employs a quantitative fundamental management |
| Equity Group | approach, using models that assess valuation, growth | ||
| prospects, management decisions, market sentiment, | |||
| and earnings quality of companies as compared with | |||
| their peers. | |||
| Cash Investments | 3 | 134 | These short-term reserves are invested by Vanguard |
| in equity index products to simulate investment in | |||
| stocks. Each advisor also may maintain a modest | |||
| cash position. | |||
8
levels and unemployment, a lack of wage gains, and the possibility of higher taxes all may curtail consumer spending.
Globally, economic growth appears to be on the mend. China’s economic growth remains strong, driven largely by aggressive fiscal stimulus programs. Europe also appears to be passing an important inflection point, suggesting that better economic activity is ahead.
Over the past 12 months, we repositioned the portfolio to be more cyclical by adding to our holdings in the industrials, consumer discretionary, and technology sectors.
We also increased our exposure to the health care sector as valuations became more attractive. We reduced holdings in utilities and telecommunication services. In keeping with our philosophy, changes to the portfolio’s positioning were largely done on a bottom-up basis. During this economic crisis, company valuations in the more defensive sectors became stretched, creating opportunities to sell out of these companies and reinvest into ones with more attractive valuations.
We continue to focus on higher-quality companies with a dividend orientation. While dividend reductions have been more pronounced during this downturn, we continue to believe in the importance of dividends to the portfolio’s total return, and as economic growth improves we should see an increase in dividend payments.
Our largest purchases over the 12 months included pharmaceutical companies Johnson & Johnson and Merck, financial company Wells Fargo, and energy company Occidental Petroleum. Our sales included firms that reached or approached our target prices, such as Consolidated Edison, as well as firms with fundamental disappointments, such as Abbott Laboratories, U.S. Bancorp, and Verizon Communications.
Vanguard Quantitative Equity Group
Portfolio Manager:
James P. Stetler, Principal
The fiscal year has been a roller-coaster ride for the Equity Income Fund and the equity markets in general. The credit crisis that began in 2007 accelerated with the failure of Lehman Brothers late in 2008. Equity markets plunged for the first six months of the fund’s fiscal year by more than 31% as measured by the Russell 3000 Index. Value stocks fared worse than their growth counterparts, returning –35.6% vs. –26.6% for growth-oriented companies.
As government rescue and stimulus plans were announced and it became apparent that the financial markets were not going to implode, the second half of the fiscal year witnessed a dramatic snapback. The Russell 3000 reversed course and climbed back more than 35%, leaving the total return of the U.S. equity market for the
9
12-month period at about –6%. Growth stocks, as they did last year, outperformed value stocks by a margin of more than 8 percentage points.
Although the worst recession in decades has not been declared officially over, many investment professionals are indicating that it may have come to an end during the third quarter of this year. [On October 29, the Commerce Department announced that the economy had grown by 3.5% in the three months through September.] However, the challenges that lie ahead are many and are not easily resolved. Rising unemployment, the state of credit markets, and massive government deficits are just a few of the issues that need to be addressed in order for long-term economic growth to be restored.
In reviewing the performance of our portfolio for the year, it is clear that our investment process struggled. We have five components in our company evaluation process: valuation, quality, growth, management decisions, and market sentiment. Valuation measures the price we will pay for a stock’s earnings or cash flow. Our quality score separates cheap stocks that deserve their low valuation because of poor margins from their more profitable peers. Our growth
indicator differentiates between companies with low valuations resulting from poor growth prospects and firms with more attractive prospects. Since actions often speak louder than words, another component evaluates the decisions corporate managers make to enhance shareholder value. Finally, our market sentiment score measures the market’s overall evaluation of the company’s value.
Our company ranking process was ineffective during this period because the market did not reward the metrics we deem important to superior performance: low valuation, balance sheet quality, attractive growth prospects, and positive market sentiment. Some are calling the market recovery a “junk rally” as those companies with poor prospects that had fallen the most during the onset of the crisis rallied the most during the market snapback.
Our stock selection was strongest in the telecommunications sector, led by CenturyTel. Our selections were most disappointing in the financial, consumer discretionary, and industrial sectors as companies such as Wells Fargo, ArvinMeritor, and Caterpillar did not perform as expected.
10
Results of Proxy Voting
At a special meeting of shareholders on July 2, 2009, fund shareholders approved the following two proposals:
Proposal 1—Elect trustees for each fund.*
The individuals listed in the table below were elected as trustees for each fund. All trustees with the exception of Messrs. McNabb and Volanakis (both of whom already served as directors of The Vanguard Group, Inc.) served as trustees to the funds prior to the shareholder meeting.
| Percentage | |||
| Trustee | For | Withheld | For |
| John J. Brennan | 381,461,550 | 10,736,721 | 97.3% |
| Charles D. Ellis | 375,348,055 | 16,850,216 | 95.7% |
| Emerson U. Fullwood | 377,280,677 | 14,917,594 | 96.2% |
| Rajiv L. Gupta | 381,215,106 | 10,983,165 | 97.2% |
| Amy Gutmann | 381,699,062 | 10,499,209 | 97.3% |
| JoAnn Heffernan Heisen | 381,602,478 | 10,595,793 | 97.3% |
| F. William McNabb III | 381,115,414 | 11,082,857 | 97.2% |
| André F. Perold | 377,090,732 | 15,107,539 | 96.1% |
| Alfred M. Rankin, Jr. | 381,547,990 | 10,650,281 | 97.3% |
| Peter F. Volanakis | 381,683,908 | 10,514,362 | 97.3% |
| * Results are for all funds within the same trust. |
Proposal 2—Update and standardize the funds’ fundamental policies regarding:
(a) Purchasing and selling real estate.
(b) Issuing senior securities.
(c) Borrowing money.
(d) Making loans.
(e) Purchasing and selling commodities.
(f) Concentrating investments in a particular industry or group of industries.
(g) Eliminating outdated fundamental investment policies not required by law.
The revised fundamental policies are clearly stated and simple, yet comprehensive, making oversight and compliance more efficient than under the former policies. The revised fundamental policies will allow the funds to respond more quickly to regulatory and market changes, while avoiding the costs and delays associated with successive shareholder meetings.
| Broker | Percentage | ||||
| Equity Income Fund | For | Abstain | Against | Non-Votes | For |
| 2a | 104,254,548 | 3,415,494 | 4,614,017 | 11,093,723 | 84.5% |
| 2b | 103,827,681 | 3,790,086 | 4,666,291 | 11,093,724 | 84.2% |
| 2c | 102,305,178 | 3,627,679 | 6,351,203 | 11,093,723 | 82.9% |
| 2d | 102,657,448 | 3,700,020 | 5,926,592 | 11,093,723 | 83.2% |
| 2e | 97,392,950 | 3,619,045 | 11,272,065 | 11,093,723 | 78.9% |
| 2f | 103,405,799 | 3,750,918 | 5,127,343 | 11,093,723 | 83.8% |
| 2g | 104,774,445 | 3,602,106 | 3,907,506 | 11,093,725 | 84.9% |
11
Fund shareholders did not approve this proposal:
Proposal 3—Institute procedures to prevent holding investments in companies that, in the judgment of the board, substantially contribute to genocide or crimes against humanity, the most egregious violations of human rights.
The trustees recommended a vote against the proposal because it called for procedures that duplicate existing practices and procedures of the Vanguard funds.
| Broker | Percentage | ||||
| Vanguard Fund | For | Abstain | Against | Non-Votes | For |
| Equity Income Fund | 16,478,591 | 5,163,754 | 90,641,702 | 11,093,736 | 13.4% |
12
Equity Income Fund
Fund Profile
As of September 30, 2009
| Portfolio Characteristics | |||
| Comparative | Broad | ||
| Fund | Index1 | Index2 | |
| Number of Stocks | 163 | 485 | 4,324 |
| Median Market Cap | $55.1B | $44.6B | $29.0B |
| Price/Earnings Ratio | 17.3x | 23.6x | 27.9x |
| Price/Book Ratio | 2.0x | 1.8x | 2.1x |
| Yield3 | 3.2% | 1.9% | |
| Investor Shares | 2.8% | ||
| Admiral Shares | 2.9% | ||
| Return on Equity | 19.9% | 18.0% | 19.1% |
| Earnings Growth Rate | 2.2% | –1.3% | 9.6% |
| Foreign Holdings | 3.9% | 0.0% | 0.0% |
| Turnover Rate | 51% | — | — |
| Expense Ratio4 | — | — | |
| Investor Shares | 0.37% | ||
| Admiral Shares | 0.24% | ||
| Short-Term Reserves | 0.4% | — | — |
| Sector Diversification (% of equity exposure) | |||
| Comparative | Broad | ||
| Fund | Index1 | Index2 | |
| Consumer Discretionary | 8.8% | 7.6% | 10.1% |
| Consumer Staples | 10.9 | 10.7 | 9.9 |
| Energy | 9.5 | 6.7 | 11.0 |
| Financials | 22.1 | 23.9 | 16.7 |
| Health Care | 11.1 | 11.8 | 12.9 |
| Industrials | 14.9 | 14.1 | 10.6 |
| Information Technology | 6.5 | 5.0 | 18.2 |
| Materials | 4.2 | 5.0 | 3.9 |
| Telecommunication | |||
| Services | 4.6 | 6.5 | 2.9 |
| Utilities | 7.4 | 8.7 | 3.8 |
| Volatility Measures5 | ||
| Fund Versus | Fund Versus | |
| Spliced Index6 | Broad Index2 | |
| R-Squared | 0.99 | 0.91 |
| Beta | 0.90 | 0.88 |
| Ten Largest Holdings7 (% of total net assets) | ||
| JPMorgan Chase & Co. | diversified financial services | 4.5% |
| Wells Fargo & Co. | diversified banks | 3.5 |
| Johnson & Johnson | pharmaceuticals | 3.4 |
| Chevron Corp. | integrated oil & gas | 3.3 |
| AT&T Inc. | integrated telecommunication services | 3.0 |
| Pfizer Inc. | pharmaceuticals | 3.0 |
| General Electric Co. | industrial conglomerates | 2.8 |
| Merck & Co. Inc. | pharmaceuticals | 2.3 |
| Intel Corp. | semiconductors | 2.3 |
| Philip Morris International Inc. | tobacco | 2.1 |
| Top Ten | 30.2% | |
Investment Focus
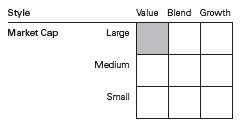
1 FTSE High Dividend Yield
2 Dow Jones U.S. Total Stock Market Index.
3 30-day SEC yield for the fund; annualized dividend yield for the indexes. See the Glossary.
4 The expense ratios shown are from the prospectus dated January 15, 2009, and represent estimated costs for the current fiscal year based
on the fund’s net assets as of the prospectus date. For the fiscal year ended September 30, 2009, the expense ratios were 0.36% for
Investor Shares and 0.24% for Admiral Shares.
5 For an explanation of R-squared, beta, and other terms used here, see the Glossary.
6 Russell 1000 Value Index through July 31, 2007; FTSE High Dividend Yield Index thereafter.
7 The holdings listed exclude any temporary cash investments and equity index products.
13
Equity Income Fund
Performance Summary
All of the returns in this report represent past performance, which is not a guarantee of future results that may be achieved by the fund. (Current performance may be lower or higher than the performance data cited. For performance data current to the most recent month-end, visit our website at www.vanguard.com/performance.) Note, too, that both investment returns and principal value can fluctuate widely, so an investor’s shares, when sold, could be worth more or less than their original cost. The returns shown do not reflect taxes that a shareholder would pay on fund distributions or on the sale of fund shares.
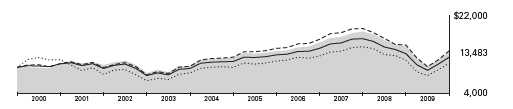
Cumulative Performance: September 30, 1999–September 30, 2009
Initial Investment of $10,000
| Average Annual Total Returns | Final Value | |||
| Periods Ended September 30, 2009 | of a $10,000 | |||
| One Year | Five Years | Ten Years | Investment | |
| Equity Income Fund Investor Shares1 | –9.12% | 1.93% | 3.03% | $13,483 |
| Dow Jones U.S. Total Stock Market Index | –5.83 | 1.93 | 0.94 | 10,978 |
| Spliced Equity Income Index2 | –9.02 | 2.25 | 3.28 | 13,805 |
| Equity Income Funds Average3 | –6.36 | 1.69 | 2.13 | 12,347 |
| Final Value | ||||
| Since | of a $100,000 | |||
| One Year | Five Years | Inception4 | Investment | |
| Equity Income Fund Admiral Shares | –9.05% | 2.06% | 2.36% | $120,911 |
| Dow Jones U.S. Total Stock Market Index | –5.83 | 1.93 | 1.66 | 114,303 |
| Spliced Equity Income Index2 | –9.02 | 2.25 | 2.80 | 125,200 |
1 Total returns do not include the account service fee that may be applicable to certain accounts with balances below $10,000.
2 Russell 1000 Value Index through July 31, 2007; FTSE High Dividend Yield Index thereafter.
3 Derived from data provided by Lipper Inc.
4 Performance for the fund’s Admiral Shares and its comparative standards is calculated since the inception of the share class:
August 13, 2001.
14
Equity Income Fund
Fiscal-Year Total Returns (%): September 30, 1999–September 30, 2009
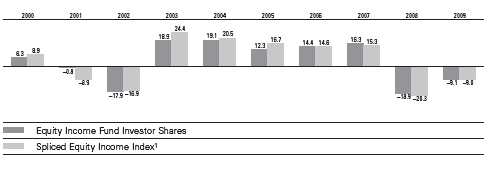
1 Russell 1000 Value Index through July 31, 2007; FTSE High Dividend Yield Index thereafter.
Note: See Financial Highlights tables for dividend and capital gains information.
15
Equity Income Fund
Financial Statements
Statement of Net Assets
As of September 30, 2009
The fund reports a complete list of its holdings in regulatory filings four times in each fiscal year, at the quarter-ends. For the second and fourth fiscal quarters, the lists appear in the fund’s semiannual and annual reports to shareholders. For the first and third fiscal quarters, the fund files the lists with the Securities and Exchange Commission on Form N-Q. Shareholders can look up the fund’s Forms N-Q on the SEC’s website at www.sec.gov. Forms N-Q may also be reviewed and copied at the SEC’s Public Reference Room (see the back cover of this report for further information).
| Market | ||
| Value• | ||
| Shares | ($000) | |
| Common Stocks (97.4%)1 | ||
| Consumer Discretionary (8.5%) | ||
| Home Depot Inc. | 3,062,200 | 81,577 |
| McDonald’s Corp. | 1,111,005 | 63,405 |
| Genuine Parts Co. | 1,145,400 | 43,594 |
| Sherwin-Williams Co. | 614,900 | 36,992 |
| VF Corp. | 200,000 | 14,486 |
| Mattel Inc. | 751,200 | 13,867 |
| Whirlpool Corp. | 141,600 | 9,906 |
| Fortune Brands Inc. | 214,500 | 9,219 |
| McGraw-Hill Cos. Inc. | 335,600 | 8,437 |
| Gannett Co. Inc. | 656,028 | 8,207 |
| DR Horton Inc. | 700,400 | 7,992 |
| Hasbro Inc. | 194,800 | 5,406 |
| Limited Brands Inc. | 309,800 | 5,264 |
| Tupperware Brands Corp. | 125,800 | 5,022 |
| H&R Block Inc. | 253,100 | 4,652 |
| Cooper Tire & Rubber Co. | 253,074 | 4,449 |
| Darden Restaurants Inc. | 125,000 | 4,266 |
| Cracker Barrel Old Country | ||
| Store Inc. | 54,700 | 1,882 |
| Brinker International Inc. | 92,500 | 1,455 |
| Lennar Corp. Class A | 17,000 | 242 |
| Newell Rubbermaid Inc. | 13,200 | 207 |
| 330,527 | ||
| Consumer Staples (10.5%) | ||
| Philip Morris | ||
| International Inc. | 1,718,655 | 83,767 |
| Nestle SA ADR | 1,419,500 | 60,506 |
| Kimberly-Clark Corp. | 752,575 | 44,387 |
| Altria Group Inc. | 2,019,155 | 35,961 |
| Coca-Cola Co. | 644,582 | 34,614 |
| Sysco Corp. | 1,229,688 | 30,558 |
| PepsiCo Inc. | 497,500 | 29,183 |
| General Mills Inc. | 373,100 | 24,020 |
| Kraft Foods Inc. | 753,389 | 19,792 |
| Lorillard Inc. | 170,000 | 12,631 |
| ConAgra Foods Inc. | 465,700 | 10,096 |
| Clorox Co. | 157,800 | 9,282 |
| Market | |||
| Value• | |||
| Shares | ($000) | ||
| Hershey Co. | 198,500 | 7,714 | |
| Sara Lee Corp. | 520,400 | 5,797 | |
| Kellogg Co. | 8,400 | 414 | |
| 408,722 | |||
| Energy (9.0%) | |||
| Chevron Corp. | 1,805,300 | 127,147 | |
| BP PLC ADR | 1,065,000 | 56,690 | |
| ConocoPhillips | 1,175,300 | 53,077 | |
| Occidental Petroleum Corp. | 594,100 | 46,578 | |
| Total SA ADR | 599,700 | 35,538 | |
| Marathon Oil Corp. | 820,600 | 26,177 | |
| Southern Union Co. | 187,500 | 3,898 | |
| Spectra Energy Corp. | 67,700 | 1,282 | |
| 350,387 | |||
| Exchange-Traded Fund (1.1%) | |||
| ^,2 | Vanguard Value ETF | 963,400 | 44,393 |
| Financials (21.6%) | |||
| JPMorgan Chase & Co. | 3,979,300 | 174,373 | |
| Wells Fargo & Co. | 4,874,173 | 137,354 | |
| Bank of America Corp. | 4,007,328 | 67,804 | |
| Goldman Sachs Group Inc. | 267,100 | 49,240 | |
| ACE Ltd. | 805,000 | 43,035 | |
| PNC Financial Services | |||
| Group Inc. | 818,382 | 39,765 | |
| Bank of New York | |||
| Mellon Corp. | 1,361,870 | 39,481 | |
| Chubb Corp. | 691,462 | 34,857 | |
| Toronto-Dominion Bank | 474,900 | 30,607 | |
| Unum Group | 1,210,900 | 25,962 | |
| Aflac Inc. | 554,200 | 23,687 | |
| US Bancorp | 985,736 | 21,548 | |
| Allstate Corp. | 692,300 | 21,198 | |
| Travelers Cos. Inc. | 357,900 | 17,619 | |
| BB&T Corp. | 464,800 | 12,661 | |
| Hudson City Bancorp Inc. | 672,600 | 8,845 | |
| Axis Capital Holdings Ltd. | 283,400 | 8,553 | |
| T Rowe Price Group Inc. | 179,400 | 8,199 | |
16
| Equity Income Fund | ||
| Market | ||
| Value• | ||
| Shares | ($000) | |
| Endurance Specialty | ||
| Holdings Ltd. | 223,700 | 8,158 |
| American Express Co. | 231,800 | 7,858 |
| Federated Investors Inc. | ||
| Class B | 289,157 | 7,625 |
| New York Community | ||
| Bancorp Inc. | 633,400 | 7,233 |
| NYSE Euronext | 231,100 | 6,676 |
| Waddell & | ||
| Reed Financial Inc. | 222,500 | 6,330 |
| Bank of Hawaii Corp. | 145,300 | 6,036 |
| Protective Life Corp. | 238,400 | 5,107 |
| Ameriprise Financial Inc. | 138,002 | 5,014 |
| NBT Bancorp Inc. | 156,258 | 3,522 |
| Morgan Stanley | 100,000 | 3,088 |
| MetLife Inc. | 80,200 | 3,053 |
| Oriental Financial | ||
| Group Inc. | 113,100 | 1,436 |
| GAMCO Investors Inc. | 30,600 | 1,398 |
| GFI Group Inc. | 148,553 | 1,074 |
| Advance America Cash | ||
| Advance Centers Inc. | 137,141 | 768 |
| First American Corp. | 15,000 | 486 |
| United Bankshares Inc. | 15,900 | 312 |
| 839,962 | ||
| Health Care (10.6%) | ||
| Johnson & Johnson | 2,200,305 | 133,977 |
| Pfizer Inc. | 7,068,731 | 116,987 |
| Merck & Co. Inc. | 2,879,214 | 91,070 |
| Bristol-Myers Squibb Co. | 989,732 | 22,289 |
| Wyeth | 350,900 | 17,047 |
| Eli Lilly & Co. | 513,149 | 16,949 |
| GlaxoSmithKline PLC ADR | 413,400 | 16,333 |
| 414,652 | ||
| Industrials (14.5%) | ||
| General Electric Co. | 6,622,572 | 108,743 |
| 3M Co. | 946,400 | 69,844 |
| Waste Management Inc. | 1,520,700 | 45,347 |
| Eaton Corp. | 611,500 | 34,605 |
| Stanley Works | 804,600 | 34,348 |
| Republic Services Inc. | ||
| Class A | 1,222,700 | 32,487 |
| Illinois Tool Works Inc. | 716,800 | 30,615 |
| Caterpillar Inc. | 567,100 | 29,109 |
| PACCAR Inc. | 732,000 | 27,604 |
| Ingersoll-Rand PLC | 834,600 | 25,597 |
| United Parcel Service Inc. | ||
| Class B | 359,200 | 20,284 |
| Honeywell International Inc. | 456,162 | 16,946 |
| Tyco International Ltd. | 380,700 | 13,127 |
| Northrop Grumman Corp. | 244,413 | 12,648 |
| Schneider Electric SA | 108,584 | 11,048 |
| Dover Corp. | 273,300 | 10,593 |
| Briggs & Stratton Corp. | 418,200 | 8,117 |
| Pitney Bowes Inc. | 320,900 | 7,974 |
| Market | ||
| Value• | ||
| Shares | ($000) | |
| Boeing Co. | 117,400 | 6,357 |
| Hubbell Inc. Class B | 107,800 | 4,528 |
| Apogee Enterprises Inc. | 265,675 | 3,991 |
| Raytheon Co. | 80,400 | 3,857 |
| Emerson Electric Co. | 70,500 | 2,826 |
| Federal Signal Corp. | 185,715 | 1,335 |
| Deluxe Corp. | 56,500 | 966 |
| Deere & Co. | 9,900 | 425 |
| 563,321 | ||
| Information Technology (6.0%) | ||
| Intel Corp. | 4,547,500 | 88,995 |
| Microsoft Corp. | 2,771,100 | 71,744 |
| Texas Instruments Inc. | 1,067,700 | 25,294 |
| Automatic Data | ||
| Processing Inc. | 342,000 | 13,441 |
| Analog Devices Inc. | 359,300 | 9,909 |
| Diebold Inc. | 243,500 | 8,018 |
| Maxim Integrated | ||
| Products Inc. | 437,800 | 7,942 |
| Xilinx Inc. | 257,400 | 6,028 |
| Linear Technology Corp. | 131,700 | 3,639 |
| 235,010 | ||
| Materials (4.0%) | ||
| EI Du Pont de | ||
| Nemours & Co. | 1,204,127 | 38,701 |
| Packaging Corp. | ||
| of America | 1,297,800 | 26,475 |
| Air Products & | ||
| Chemicals Inc. | 294,100 | 22,816 |
| PPG Industries Inc. | 384,100 | 22,358 |
| Eastman Chemical Co. | 144,000 | 7,710 |
| Bemis Co. Inc. | 258,900 | 6,708 |
| Glatfelter | 543,500 | 6,239 |
| Temple-Inland Inc. | 352,200 | 5,783 |
| Stepan Co. | 74,000 | 4,446 |
| Compass Minerals | ||
| International Inc. | 71,500 | 4,406 |
| Sonoco Products Co. | 138,800 | 3,823 |
| Sensient | ||
| Technologies Corp. | 103,127 | 2,864 |
| Dow Chemical Co. | 70,200 | 1,830 |
| Lubrizol Corp. | 24,100 | 1,722 |
| Worthington Industries Inc. | 68,700 | 955 |
| Innophos Holdings Inc. | 32,818 | 607 |
| 157,443 | ||
| Telecommunication Services (4.4%) | ||
| AT&T Inc. | 4,346,005 | 117,386 |
| Verizon | ||
| Communications Inc. | 1,479,628 | 44,788 |
| CenturyTel Inc. | 189,546 | 6,369 |
| Qwest Communications | ||
| International Inc. | 913,200 | 3,479 |
| Windstream Corp. | 30,100 | 305 |
| 172,327 | ||
17
Equity Income Fund
| Market | ||
| Value• | ||
| Shares | ($000) | |
| Utilities (7.2%) | ||
| FPL Group Inc. | 997,766 | 55,106 |
| Dominion | ||
| Resources Inc. | 1,501,030 | 51,785 |
| Exelon Corp. | 571,600 | 28,363 |
| American Electric | ||
| Power Co. Inc. | 749,700 | 23,233 |
| Northeast Utilities | 836,000 | 19,847 |
| Entergy Corp. | 215,800 | 17,234 |
| Edison International | 512,000 | 17,193 |
| Public Service Enterprise | ||
| Group Inc. | 396,520 | 12,466 |
| FirstEnergy Corp. | 254,200 | 11,622 |
| NiSource Inc. | 665,300 | 9,241 |
| Atmos Energy Corp. | 261,910 | 7,381 |
| UGI Corp. | 287,300 | 7,200 |
| National Fuel Gas Co. | 109,000 | 4,993 |
| Avista Corp. | 232,684 | 4,705 |
| AGL Resources Inc. | 70,000 | 2,469 |
| PG&E Corp. | 51,700 | 2,093 |
| PNM Resources Inc. | 179,000 | 2,091 |
| Sempra Energy | 26,600 | 1,325 |
| Southern Co. | 39,300 | 1,245 |
| DPL Inc. | 42,400 | 1,107 |
| 280,699 | ||
| Total Common Stocks | ||
| (Cost $3,643,182) | 3,797,443 |
| Market | ||
| Value• | ||
| Shares | ($000) | |
| Temporary Cash Investments (2.8%)1 | ||
| Money Market Fund (2.1%) | ||
| 3,4 Vanguard Market Liquidity | ||
| Fund, 0.267% | 82,196,256 | 82,196 |
| Face | ||
| Amount | ||
| ($000) | ||
| Repurchase Agreement (0.4%) | ||
| Goldman Sachs & Co. | ||
| 0.050%, 10/1/09 | ||
| (Dated 9/30/09, | ||
| Repurchase Value | ||
| $13,000,000, | ||
| collateralized by | ||
| Federal National | ||
| Mortgage Assn. | ||
| 5.500%, 1/1/39) | 13,000 | 13,000 |
| U.S. Government and Agency Obligations (0.3%) | ||
| 5,6 Federal Home Loan | ||
| Bank Discount Notes, | ||
| 0.220%, 3/26/10 | 12,000 | 11,989 |
| Total Temporary Cash Investments | ||
| (Cost $107,183) | 107,185 | |
| Total Investments (100.2%) | ||
| (Cost $3,750,365) | 3,904,628 | |
| Other Assets and Liabilities (–0.2%) | ||
| Other Assets | 14,834 | |
| Liabilities4 | (20,893) | |
| (6,059) | ||
| Net Assets (100%) | 3,898,569 | |
18
Equity Income Fund
| At September 30, 2009, net assets consisted of: | |
| Amount | |
| ($000) | |
| Paid-in Capital | 4,535,134 |
| Overdistributed Net Investment Income | (4,554) |
| Accumulated Net Realized Losses | (787,546) |
| Unrealized Appreciation (Depreciation) | |
| Investment Securities | 154,263 |
| Futures Contracts | 1,272 |
| Net Assets | 3,898,569 |
| Investor Shares—Net Assets | |
| Applicable to 139,294,573 outstanding | |
| $.001 par value shares of beneficial | |
| interest (unlimited authorization) | 2,423,298 |
| Net Asset Value Per Share— | |
| Investor Shares | $17.40 |
| Admiral Shares—Net Assets | |
| Applicable to 40,459,726 outstanding | |
| $.001 par value shares of beneficial | |
| interest (unlimited authorization) | 1,475,271 |
| Net Asset Value Per Share— | |
| Admiral Shares | $36.46 |
• See Note A in Notes to Financial Statements.
^ Part of security position is on loan to broker-dealers. The total value of securities on loan is $318,000.
1 The fund invests a portion of its cash reserves in equity markets through the use of index futures contracts. After giving effect to futures
investments, the fund’s effective common stock and temporary cash investment positions represent 99.7% and 0.5%, respectively, of
net assets.
2 Considered an affiliated company of the fund as the issuer is another member of The Vanguard Group.
3 Affiliated money market fund available only to Vanguard funds and certain trusts and accounts managed by Vanguard. Rate shown is the
7-day yield.
4 Includes $331,000 of collateral received for securities on loan.
5 Securities with a value of $11,989,000 have been segregated as initial margin for open futures contracts.
6 The issuer operates under a congressional charter; its securities are not backed by the full faith and credit of the U.S. government.
ADR—American Depositary Receipt.
See accompanying Notes, which are an integral part of the Financial Statements.
19
Equity Income Fund
Statement of Operations
| Year Ended | |
| September 30, 2009 | |
| ($000) | |
| Investment Income | |
| Income | |
| Dividends1,2 | 139,692 |
| Interest2 | 794 |
| Security Lending | 369 |
| Total Income | 140,855 |
| Expenses | |
| Investment Advisory Fees—Note B | |
| Basic Fee | 2,705 |
| Performance Adjustment | 535 |
| The Vanguard Group—Note C | |
| Management and Administrative—Investor Shares | 4,679 |
| Management and Administrative—Admiral Shares | 1,510 |
| Marketing and Distribution—Investor Shares | 610 |
| Marketing and Distribution—Admiral Shares | 344 |
| Custodian Fees | 55 |
| Auditing Fees | 26 |
| Shareholders’ Reports and Proxies—Investor Shares | 241 |
| Shareholders’ Reports and Proxies—Admiral Shares | 20 |
| Trustees’ Fees and Expenses | 7 |
| Total Expenses | 10,732 |
| Expenses Paid Indirectly | (128) |
| Net Expenses | 10,604 |
| Net Investment Income | 130,251 |
| Realized Net Gain (Loss) | |
| Investment Securities Sold2 | (734,390) |
| Futures Contracts | (36,043) |
| Foreign Currencies | (11) |
| Realized Net Gain (Loss) | (770,444) |
| Change in Unrealized Appreciation (Depreciation) | |
| Investment Securities | 218,786 |
| Futures Contracts | 4,664 |
| Foreign Currencies | 23 |
| Change in Unrealized Appreciation (Depreciation) | 223,473 |
| Net Increase (Decrease) in Net Assets Resulting from Operations | (416,720) |
1 Dividends are net of foreign withholding taxes of $918,000.
2 Dividend income, interest income, and realized net gain (loss) from affiliated companies of the fund were $1,327,000, $628,000, and $0,
respectively.
See accompanying Notes, which are an integral part of the Financial Statements.
20
Equity Income Fund
Statement of Changes in Net Assets
| Year Ended September 30, | ||
| 2009 | 2008 | |
| ($000) | ($000) | |
| Increase (Decrease) in Net Assets | ||
| Operations | ||
| Net Investment Income | 130,251 | 167,213 |
| Realized Net Gain (Loss) | (770,444) | 43,919 |
| Change in Unrealized Appreciation (Depreciation) | 223,473 | (1,257,213) |
| Net Increase (Decrease) in Net Assets Resulting from Operations | (416,720) | (1,046,081) |
| Distributions | ||
| Net Investment Income | ||
| Investor Shares | (79,799) | (101,519) |
| Admiral Shares | (51,186) | (68,969) |
| Realized Capital Gain1 | ||
| Investor Shares | (14,956) | (170,339) |
| Admiral Shares | (9,460) | (112,961) |
| Total Distributions | (155,401) | (453,788) |
| Capital Share Transactions | ||
| Investor Shares | 136,361 | 86,183 |
| Admiral Shares | (3,445) | 49,809 |
| Net Increase (Decrease) from Capital Share Transactions | 132,916 | 135,992 |
| Total Increase (Decrease) | (439,205) | (1,363,877) |
| Net Assets | ||
| Beginning of Period | 4,337,774 | 5,701,651 |
| End of Period2 | 3,898,569 | 4,337,774 |
1 Includes fiscal 2008 short-term gain distributions totaling $32,961,000. Short-term gain distributions are treated as ordinary income
dividends for tax purposes.
2 Net Assets—End of Period includes undistributed (overdistributed) net investment income of ($4,554,000) and ($3,809,000).
See accompanying Notes, which are an integral part of the Financial Statements.
21
Equity Income Fund
Financial Highlights
| Investor Shares | |||||
| For a Share Outstanding | Year Ended September 30, | ||||
| Throughout Each Period | 2009 | 2008 | 2007 | 2006 | 2005 |
| Net Asset Value, Beginning of Period | $20.02 | $27.01 | $25.21 | $23.73 | $22.82 |
| Investment Operations | |||||
| Net Investment Income | .585 | .770 | .733 | .703 | .653 |
| Net Realized and Unrealized Gain (Loss) | |||||
| on Investments | (2.506) | (5.617) | 3.215 | 2.541 | 2.069 |
| Total from Investment Operations | (1.921) | (4.847) | 3.948 | 3.244 | 2.722 |
| Distributions | |||||
| Dividends from Net Investment Income | (.587) | (.785) | (.730) | (.710) | (.640) |
| Distributions from Realized Capital Gains | (.112) | (1.358) | (1.418) | (1.054) | (1.172) |
| Total Distributions | (.699) | (2.143) | (2.148) | (1.764) | (1.812) |
| Net Asset Value, End of Period | $17.40 | $20.02 | $27.01 | $25.21 | $23.73 |
| Total Return1 | –9.12% | –18.92% | 16.29% | 14.39% | 12.27% |
| Ratios/Supplemental Data | |||||
| Net Assets, End of Period (Millions) | $2,423 | $2,626 | $3,445 | $3,035 | $2,934 |
| Ratio of Total Expenses to | |||||
| Average Net Assets2 | 0.36% | 0.30% | 0.29% | 0.31% | 0.32% |
| Ratio of Net Investment Income to | |||||
| Average Net Assets | 3.76% | 3.30% | 2.79% | 2.94% | 2.80% |
| Portfolio Turnover Rate | 51% | 55% | 51% | 26% | 42% |
1 Total returns do not include the account service fee that may be applicable to certain accounts with balances below $10,000.
2 Includes performance-based investment advisory fee increases (decreases) of 0.02%, 0.00%, 0.00%, (0.01%), and (0.01%).
See accompanying Notes, which are an integral part of the Financial Statements.
22
Equity Income Fund
Financial Highlights
| Admiral Shares | |||||
| For a Share Outstanding | Year Ended September 30, | ||||
| Throughout Each Period | 2009 | 2008 | 2007 | 2006 | 2005 |
| Net Asset Value, Beginning of Period | $41.97 | $56.62 | $52.84 | $49.74 | $47.83 |
| Investment Operations | |||||
| Net Investment Income | 1.264 | 1.673 | 1.601 | 1.545 | 1.434 |
| Net Realized and Unrealized Gain (Loss) | |||||
| on Investments | (5.269) | (11.772) | 6.746 | 5.324 | 4.338 |
| Total from Investment Operations | (4.005) | (10.099) | 8.347 | 6.869 | 5.772 |
| Distributions | |||||
| Dividends from Net Investment Income | (1.270) | (1.705) | (1.595) | (1.560) | (1.406) |
| Distributions from Realized Capital Gains | (.235) | (2.846) | (2.972) | (2.209) | (2.456) |
| Total Distributions | (1.505) | (4.551) | (4.567) | (3.769) | (3.862) |
| Net Asset Value, End of Period | $36.46 | $41.97 | $56.62 | $52.84 | $49.74 |
| Total Return | –9.05% | –18.82% | 16.44% | 14.55% | 12.42% |
| Ratios/Supplemental Data | |||||
| Net Assets, End of Period (Millions) | $1,475 | $1,711 | $2,256 | $1,783 | $1,417 |
| Ratio of Total Expenses to | |||||
| Average Net Assets1 | 0.24% | 0.18% | 0.17% | 0.17% | 0.19% |
| Ratio of Net Investment Income to | |||||
| Average Net Assets | 3.88% | 3.42% | 2.91% | 3.08% | 2.96% |
| Portfolio Turnover Rate | 51% | 55% | 51% | 26% | 42% |
| 1 Includes performance-based investment advisory fee increases (decreases) of 0.02%, 0.00%, 0.00%, (0.01%), and (0.01%). | |||||
See accompanying Notes, which are an integral part of the Financial Statements.
23
Equity Income Fund
Notes to Financial Statements
Vanguard Equity Income Fund is registered under the Investment Company Act of 1940 as an open-end investment company, or mutual fund. The fund offers two classes of shares: Investor Shares and Admiral Shares. Investor Shares are available to any investor who meets the fund’s minimum purchase requirements. Admiral Shares are designed for investors who meet certain administrative, service, tenure, and account-size criteria.
A. The following significant accounting policies conform to generally accepted accounting principles for U.S. mutual funds. The fund consistently follows such policies in preparing its financial statements.
1. Security Valuation: Securities are valued as of the close of trading on the New York Stock Exchange (generally 4 p.m., Eastern time) on the valuation date. Equity securities are valued at the latest quoted sales prices or official closing prices taken from the primary market in which each security trades; such securities not traded on the valuation date are valued at the mean of the latest quoted bid and asked prices. Securities for which market quotations are not readily available, or whose values have been affected by events occurring before the fund’s pricing time but after the close of the securities’ primary markets, are valued at their fair values calculated according to procedures adopted by the board of trustees. These procedures include obtaining quotations from an independent pricing service, monitoring news to identify significant market- or security-specific events, and evaluat ing changes in the values of foreign market proxies (for example, ADRs, futures contracts, or exchange-traded funds), between the time the foreign markets close and the fund’s pricing time. When fair-value pricing is employed, the prices of securities used by a fund to calculate its net asset value may differ from quoted or published prices for the same securities. Investments in Vanguard Market Liquidity Fund are valued at that fund’s net asset value. Temporary cash investments acquired over 60 days to maturity are valued using the latest bid prices or using valuations based on a matrix system (which considers such factors as security prices, yields, maturities, and ratings), both as furnished by independent pricing services. Other temporary cash investments are valued at amortized cost, which approximates market value.
2. Foreign Currency: Securities and other assets and liabilities denominated in foreign currencies are translated into U.S. dollars using exchange rates obtained from an independent third party as of the fund’s pricing time on the valuation date. Realized gains (losses) and unrealized appreciation (depreciation) on investment securities include the effects of changes in exchange rates since the securities were purchased, combined with the effects of changes in security prices. Fluctuations in the value of other assets and liabilities resulting from changes in exchange rates are recorded as unrealized foreign currency gains (losses) until the assets or liabilities are settled in cash, at which time they are recorded as realized foreign currency gains (losses).
3. Futures Contracts: The fund uses index futures contracts to a limited extent, with the objective of maintaining full exposure to the stock market while maintaining liquidity. The fund may purchase or sell futures contracts to achieve a desired level of investment, whether to accommodate portfolio turnover or cash flows from capital share transactions. The primary risks associated with the use of futures contracts are imperfect correlation between changes in market values of stocks held by the fund and the prices of futures contracts, and the possibility of an illiquid market.
24
Equity Income Fund
Futures contracts are valued at their quoted daily settlement prices. The aggregate principal amounts of the contracts are not recorded in the Statement of Net Assets. Fluctuations in the value of the contracts are recorded in the Statement of Net Assets as an asset (liability) and in the Statement of Operations as unrealized appreciation (depreciation) until the contracts are closed, when they are recorded as realized futures gains (losses).
4. Repurchase Agreements: The fund may invest in repurchase agreements. Securities pledged as collateral for repurchase agreements are held by a custodian bank until the agreements mature. Each agreement requires that the market value of the collateral be sufficient to cover payments of interest and principal; however, in the event of default or bankruptcy by the other party to the agreement, retention of the collateral may be subject to legal proceedings.
5. Federal Income Taxes: The fund intends to continue to qualify as a regulated investment company and distribute all of its taxable income. Management has analyzed the fund’s tax positions taken for all open federal income tax years (September 30, 2006–2009), and has concluded that no provision for federal income tax is required in the fund’s financial statements.
6. Distributions: Distributions to shareholders are recorded on the ex-dividend date.
7. Security Lending: The fund may lend its securities to qualified institutional borrowers to earn additional income. Security loans are required to be secured at all times by collateral at least equal to the market value of securities loaned. The fund invests cash collateral received in Vanguard Market Liquidity Fund, and records a liability for the return of the collateral, during the period the securities are on loan. Security lending income represents the income earned on investing cash collateral, less expenses associated with the loan.
8. Other: Dividend income is recorded on the ex-dividend date. Interest income includes income distributions received from Vanguard Market Liquidity Fund and is accrued daily. Security transactions are accounted for on the date securities are bought or sold. Costs used to determine realized gains (losses) on the sale of investment securities are those of the specific securities sold.
Each class of shares has equal rights as to assets and earnings, except that each class separately bears certain class-specific expenses related to maintenance of shareholder accounts (included in Management and Administrative expenses), shareholder reporting, and proxies. Marketing and distribution expenses are allocated to each class of shares based on a method approved by the board of trustees. Income, other non-class-specific expenses, and gains and losses on investments are allocated to each class of shares based on its relative net assets.
B. Wellington Management Company, LLP , provides investment advisory services to a portion of the fund for a fee calculated at an annual percentage rate of average net assets managed by the advisor. The basic fee for Wellington Management Company, LLP, is subject to quarterly adjustments based on the fund’s performance for the preceding three years relative to the Lipper Equity Income Average for periods prior to April 1, 2008, and the new benchmark, the FTSE High Dividend Yield Index, beginning April 1, 2008. The benchmark change will be fully phased in by March 2011.
25
Equity Income Fund
The Vanguard Group provides investment advisory services to a portion of the fund on an at-cost basis; the fund paid Vanguard advisory fees of $408,000 for the year ended September 30, 2009.
For the year ended September 30, 2009, the aggregate investment advisory fee represented an effective annual basic rate of 0.08% of the fund’s average net assets, before an increase of $535,000 (0.02%) based on performance.
C. The Vanguard Group furnishes at cost corporate management, administrative, marketing, and distribution services. The costs of such services are allocated to the fund under methods approved by the board of trustees. The fund has committed to provide up to 0.40% of its net assets in capital contributions to Vanguard. At September 30, 2009, the fund had contributed capital of $818,000 to Vanguard (included in Other Assets), representing 0.02% of the fund’s net assets and 0.33% of Vanguard’s capitalization. The fund’s trustees and officers are also directors and officers of Vanguard.
D. The fund has asked its investment advisors to direct certain security trades, subject to obtaining the best price and execution, to brokers who have agreed to rebate to the fund part of the commissions generated. Such rebates are used solely to reduce the fund’s management and administrative expenses. The fund’s custodian bank has also agreed to reduce its fees when the fund maintains cash on deposit in the non-interest-bearing custody account. For the year ended September 30, 2009, these arrangements reduced the fund’s management and administrative expenses by $127,000 and custodian fees by $1,000. The total expense reduction represented an effective annual rate of 0.00% of the fund’s average net assets.
E. Various inputs may be used to determine the value of the fund’s investments. These inputs are summarized in three broad levels for financial statement purposes. The inputs or methodologies used to value securities are not necessarily an indication of the risk associated with investing in those securities.
Level 1—Quoted prices in active markets for identical securities.
Level 2—Other significant observable inputs (including quoted prices for similar securities, interest rates, prepayment speeds, credit risk, etc.).
Level 3—Significant unobservable inputs (including the fund’s own assumptions used to determine the fair value of investments).
The following table summarizes the fund’s investments as of September 30, 2009, based on the inputs used to value them:
| Level 1 | Level 2 | Level 3 | |
| Investments | ($000) | ($000) | ($000) |
| Common Stocks | 3,786,395 | 11,048 | — |
| Temporary Cash Investments | 82,196 | 24,989 | — |
| Futures Contracts—Liabilities1 | (164) | — | — |
| Total | 3,868,427 | 36,037 | — |
1 Represents variation margin on the last day of the reporting period.
26
Equity Income Fund
F. At September 30, 2009, the aggregate settlement value of open futures contracts and the related unrealized appreciation (depreciation) were:
| ($000) | ||||
| Number of | Aggregate | Unrealized | ||
| Long (Short) | Settlement | Appreciation | ||
| Futures Contracts | Expiration | Contracts | Value | (Depreciation) |
| S&P 500 Index | December 2009 | 327 | 86,074 | 1,272 |
| E-mini S&P 500 Index | December 2009 | 91 | 4,791 | — |
Unrealized appreciation (depreciation) on open futures contracts is required to be treated as realized gain (loss) for tax purposes.
G. Distributions are determined on a tax basis and may differ from net investment income and realized capital gains for financial reporting purposes. Differences may be permanent or temporary. Permanent differences are reclassified among capital accounts in the financial statements to reflect their tax character. Temporary differences arise when certain items of income, expense, gain, or loss are recognized in different periods for financial statement and tax purposes; these differences will reverse at some time in the future. Differences in classification may also result from the treatment of short-term gains as ordinary income for tax purposes.
During the year ended September 30, 2009, the fund realized net foreign currency losses of $11,000, which decreased distributable net income for tax purposes; accordingly, such losses have been reclassified from accumulated net realized losses to undistributed net investment income.
For tax purposes, at September 30, 2009, the fund had $3,991,000 of ordinary income available for distribution. The fund had available capital loss carryforwards totaling $55,116,000 to offset future net capital gains through September 30, 2017. In addition, the fund realized losses of $727,490,000 during the period from November 1, 2008, through September 30, 2009, which are deferred and will be treated as realized for tax purposes in fiscal 2010.
At September 30, 2009, the cost of investment securities for tax purposes was $3,754,051,000. Net unrealized appreciation of investment securities for tax purposes was $150,577,000, consisting of unrealized gains of $435,764,000 on securities that had risen in value since their purchase and $285,187,000 in unrealized losses on securities that had fallen in value since their purchase.
H. During the year ended September 30, 2009, the fund purchased $1,881,461,000 of investment securities and sold $1,732,472,000 of investment securities, other than temporary cash investments.
27
Equity Income Fund
I. Capital share transactions for each class of shares were:
| Year Ended September 30, | ||||
| 2009 | 2 008 | |||
| Amount | Shares | Amount | Shares | |
| ($000) | (000) | ($000) | (000) | |
| Investor Shares | ||||
| Issued | 571,703 | 37,049 | 451,252 | 19,519 |
| Issued in Lieu of Cash Distributions | 86,878 | 5,584 | 250,105 | 10,727 |
| Redeemed | (522,220) | (34,497) | (615,174) | (26,649) |
| Net Increase (Decrease)—Investor Shares | 136,361 | 8,136 | 86,183 | 3,597 |
| Admiral Shares | ||||
| Issued | 297,028 | 9,259 | 280,117 | 5,772 |
| Issued in Lieu of Cash Distributions | 49,009 | 1,503 | 152,414 | 3,117 |
| Redeemed | (349,482) | (11,079) | (382,722) | (7,963) |
| Net Increase (Decrease)—Admiral Shares | (3,445) | (317) | 49,809 | 926 |
J. In preparing the financial statements as of September 30, 2009, management considered the impact of subsequent events occurring through November 10, 2009, for potential recognition or disclosure in these financial statements.
28
Report of Independent Registered
Public Accounting Firm
To the Trustees of Vanguard Fenway Funds and the Shareholders of Vanguard Equity Income Fund:
In our opinion, the accompanying statement of net assets and the related statements of operations and of changes in net assets and the financial highlights present fairly, in all material respects, the financial position of Vanguard Equity Income Fund (the “Fund”) at September 30, 2009, the results of its operations for the year then ended, the changes in its net assets for each of the two years in the period then ended and the financial highlights for each of the five years in the period then ended, in conformity with accounting principles generally accepted in the United States of America. These financial statements and financial highlights (hereafter referred to as “financial statements”) are the responsibility of the Fund’s management; our responsibility is to express an opinion on these financial statements based on our audits. We conducted our audits of these financial statement s in accordance with the standards of the Public Company Accounting Oversight Board (United States). Those standards require that we plan and perform the audit to obtain reasonable assurance about whether the financial statements are free of material misstatement. An audit includes examining, on a test basis, evidence supporting the amounts and disclosures in the financial statements, assessing the accounting principles used and significant estimates made by management, and evaluating the overall financial statement presentation. We believe that our audits, which included confirmation of securities at September 30, 2009 by correspondence with the custodians and brokers, and by agreement to the underlying ownership records for Vanguard Market Liquidity Fund, provide a reasonable basis for our opinion.
PricewaterhouseCoopers LLP
Philadelphia, Pennsylvania
November 10, 2009
Special 2009 tax information (unaudited) for Vanguard Equity Income Fund
This information for the fiscal year ended September 30, 2009, is included pursuant to provisions of the Internal Revenue Code.
The fund distributed $24,436,000 as capital gain dividends (from net long-term capital gains) to shareholders during the fiscal year.
The fund distributed $130,985,000 of qualified dividend income to shareholders during the fiscal year.
For corporate shareholders, 98.3% of investment income (dividend income plus short-term gains, if any) qualifies for the dividends-received deduction.
29
Your Fund’s After-Tax Returns
This table presents returns for your fund both before and after taxes. The after-tax returns are shown in two ways: (1) assuming that an investor owned the fund during the entire period and paid taxes on the fund’s distributions, and (2) assuming that an investor paid taxes on the fund’s distributions and sold all shares at the end of each period.
Calculations are based on the highest individual federal income tax and capital gains tax rates in effect at the times of the distributions and the hypothetical sales. State and local taxes were not considered. After-tax returns reflect any qualified dividend income, using actual prior-year figures and estimates for 2009. (In the example, returns after the sale of fund shares may be higher than those assuming no sale. This occurs when the sale would have produced a capital loss. The calculation assumes that the investor received a tax deduction for the loss.)
The table shows returns for Investor Shares only; returns for other share classes will differ. Please note that your actual after-tax returns will depend on your tax situation and may differ from those shown. Also note that if you own the fund in a tax-deferred account, such as an individual retirement account or a 401(k) plan, this information does not apply to you. Such accounts are not subject to current taxes.
Finally, keep in mind that a fund’s performance—whether before or after taxes—does not guarantee future results.
| Average Annual Total Returns: Equity Income Fund Investor Shares1 | |||
| Periods Ended September 30, 2009 | |||
| One | Five | Ten | |
| Year | Years | Years | |
| Returns Before Taxes | –9.12% | 1.93% | 3.03% |
| Returns After Taxes on Distributions | –9.72 | 0.69 | 1.75 |
| Returns After Taxes on Distributions and Sale of Fund Shares | –5.27 | 1.61 | 2.27 |
1 Total returns do not include the account service fee that may be applicable to certain accounts with balances below $10,000.
30
About Your Fund’s Expenses
As a shareholder of the fund, you incur ongoing costs, which include costs for portfolio management, administrative services, and shareholder reports (like this one), among others. Operating expenses, which are deducted from a fund’s gross income, directly reduce the investment return of the fund.
A fund’s expenses are expressed as a percentage of its average net assets. This figure is known as the expense ratio. The following examples are intended to help you understand the ongoing costs (in dollars) of investing in your fund and to compare these costs with those of other mutual funds. The examples are based on an investment of $1,000 made at the beginning of the period shown and held for the entire period.
The accompanying table illustrates your fund’s costs in two ways:
• Based on actual fund return. This section helps you to estimate the actual expenses that you paid over the period. The “Ending Account Value” shown is derived from the fund’s actual return, and the third column shows the dollar amount that would have been paid by an investor who started with $1,000 in the fund. You may use the information here, together with the amount you invested, to estimate the expenses that you paid over the period.
To do so, simply divide your account value by $1,000 (for example, an $8,600 account value divided by $1,000 = 8.6), then multiply the result by the number given for your fund under the heading “Expenses Paid During Period.”
• Based on hypothetical 5% yearly return. This section is intended to help you compare your fund’s costs with those of other mutual funds. It assumes that the fund had a yearly return of 5% before expenses, but that the expense ratio is unchanged. In this case—because the return used is not the fund’s actual return—the results do not apply to your investment. The example is useful in making comparisons because the Securities and Exchange Commission requires all mutual funds to calculate expenses based on a 5% return. You can assess your fund’s costs by comparing this hypothetical example with the hypothetical examples that appear in shareholder reports of other funds.
| Six Months Ended September 30, 2009 | |||
| Beginning | Ending | Expenses | |
| Account Value | Account Value | Paid During | |
| Equity Income Fund | 3/31/2009 | 9/30/2009 | Period1 |
| Based on Actual Fund Return | |||
| Investor Shares | $1,000.00 | $1,315.29 | $2.03 |
| Admiral Shares | 1,000.00 | 1,315.64 | 1.39 |
| Based on Hypothetical 5% Yearly Return | |||
| Investor Shares | $1,000.00 | $1,023.31 | $1.78 |
| Admiral Shares | 1,000.00 | 1,023.87 | 1.22 |
1 The calculations are based on expenses incurred in the most recent six-month period. The fund’s annualized six-month expense ratios for
that period are 0.35% for Investor Shares and 0.24% for Admiral Shares. The dollar amounts shown as “Expenses Paid” are equal to the
annualized expense ratio multiplied by the average account value over the period, multiplied by the number of days in the most recent
six-month period, then divided by the number of days in the most recent 12-month period.
31
Note that the expenses shown in the table are meant to highlight and help you compare ongoing costs only and do not reflect transaction costs incurred by the fund for buying and selling securities. Further, the expenses do not include the account service fee described in the prospectus. If such a fee were applied to your account, your costs would be higher. Your fund does not charge transaction fees, such as purchase or redemption fees, nor does it carry a “sales load.”
The calculations assume no shares were bought or sold during the period. Your actual costs may have been higher or lower, depending on the amount of your investment and the timing of any purchases or redemptions.
You can find more information about the fund’s expenses, including annual expense ratios, in the Financial Statements section of this report. For additional information on operating expenses and other shareholder costs, please refer to your fund’s current prospectus.
32
Glossary
Beta. A measure of the magnitude of a fund’s past share-price fluctuations in relation to the ups and downs of a given market index. The index is assigned a beta of 1.00. Compared with a given index, a fund with a beta of 1.20 typically would have seen its share price rise or fall by 12% when the index rose or fell by 10%. For this report, beta is based on returns over the past 36 months for both the fund and the index. Note that a fund’s beta should be reviewed in conjunction with its R-squared (see definition). The lower the R-squared, the less correlation there is between the fund and the index, and the less reliable beta is as an indicator of volatility.
Earnings Growth Rate. The average annual rate of growth in earnings over the past five years for the stocks now in a fund.
Equity Exposure. A measure that reflects a fund’s investments in stocks and stock futures. Any holdings in short-term reserves are excluded.
Expense Ratio. The percentage of a fund’s average net assets used to pay its annual administrative and advisory expenses. These expenses directly reduce returns to investors.
Foreign Holdings. The percentage of a fund represented by stocks or depositary receipts of companies based outside the United States.
Inception Date. The date on which the assets of a fund (or one of its share classes) are first invested in accordance with the fund’s investment objective. For funds with a subscription period, the inception date is the day after that period ends. Investment performance is measured from the inception date.
Median Market Cap. An indicator of the size of companies in which a fund invests; the midpoint of market capitalization (market price x shares outstanding) of a fund’s stocks, weighted by the proportion of the fund’s assets invested in each stock. Stocks representing half of the fund’s assets have market capitalizations above the median, and the rest are below it.
Price/Book Ratio. The share price of a stock divided by its net worth, or book value, per share. For a fund, the weighted average price/book ratio of the stocks it holds.
Price/Earnings Ratio. The ratio of a stock’s current price to its per-share earnings over the past year. For a fund, the weighted average P/E of the stocks it holds. P/E is an indicator of market expectations about corporate prospects; the higher the P/E, the greater the expectations for a company’s future growth.
R-Squared. A measure of how much of a fund’s past returns can be explained by the returns from the market in general, as measured by a given index. If a fund’s total returns were precisely synchronized with an index’s returns, its R-squared would be 1.00. If the fund’s returns bore no relationship to the index’s returns, its R-squared would be 0. For this report, R-squared is based on returns over the past 36 months for both the fund and the index.
Return on Equity. The annual average rate of return generated by a company during the past five years for each dollar of shareholder’s equity (net income divided by shareholder’s equity). For a fund, the weighted average return on equity for the companies whose stocks it holds.
Short-Term Reserves. The percentage of a fund invested in highly liquid, short-term securities that can be readily converted to cash.
33
Turnover Rate. An indication of the fund’s trading activity. Funds with high turnover rates incur higher transaction costs and may be more likely to distribute capital gains (which may be taxable to investors). The turnover rate excludes in-kind transactions, which have minimal impact on costs.
Yield. A fund’s 30-day SEC yield is derived using a formula specified by the U.S. Securities and Exchange Commission. Under the formula, data related to the fund’s security holdings in the previous 30 days are used to calculate the fund’s hypothetical net income for that period, which is then annualized and divided by the fund’s estimated average net assets over the calculation period. For the purposes of this calculation, a security’s income is based on its current market yield to maturity (in the case of bonds) or its projected dividend yield (for stocks). Because the SEC yield represents hypothetical annualized income, it will differ—at times significantly—from the fund’s actual experience. As a result, the fund’s income distributions may be higher or lower than implied by the SEC y ield.
34
This page intentionally left blank.
The People Who Govern Your Fund
The trustees of your mutual fund are there to see that the fund is operated and managed in your best interests since, as a shareholder, you are a part owner of the fund. Your fund’s trustees also serve on the board of directors of The Vanguard Group, Inc., which is owned by the Vanguard funds and provides services to them on an at-cost basis.
A majority of Vanguard’s board members are independent, meaning that they have no affiliation with Vanguard or the funds they oversee, apart from the sizable personal investments they have made as private individuals. The independent board members have distinguished backgrounds in business, academia, and public service. Each of the trustees and executive officers oversees 156 Vanguard funds.
The following table provides information for each trustee and executive officer of the fund. More information about the trustees is in the Statement of Additional Information, which can be obtained, without charge, by contacting Vanguard at 800-662-7447, or online at www.vanguard.com.
| Interested Trustees | Emerson U. Fullwood |
| Born 1948. Trustee Since January 2008. Principal | |
| John J. Brennan1 | Occupation(s) During the Past Five Years: Executive |
| Born 1954. Trustee Since May 1987. Chairman of | Chief Staff and Marketing Officer for North America |
| the Board. Principal Occupation(s) During the Past | and Corporate Vice President (retired 2008) of Xerox |
| Five Years: Chairman of the Board and Director/Trustee | Corporation (photocopiers and printers); Director of |
| of The Vanguard Group, Inc., and of each of the | SPX Corporation (multi-industry manufacturing), the |
| investment companies served by The Vanguard Group; | United Way of Rochester, the Boy Scouts of America, |
| Chief Executive Officer (1996–2008) and President | Amerigroup Corporation (direct health and medical |
| (1989–2008) of The Vanguard Group and of each of the | insurance carriers), and Monroe Community College |
| investment companies served by The Vanguard Group; | Foundation. |
| Chairman of the Financial Accounting Foundation; | |
| Governor of the Financial Industry Regulatory Authority | Rajiv L. Gupta |
| (FINRA); Director of United Way of Southeastern | Born 1945. Trustee Since December 2001.2 Principal |
| Pennsylvania. | Occupation(s) During the Past Five Years: Chairman |
| and Chief Executive Officer (retired 2009) and President | |
| F. William McNabb III1 | (2006–2008) of Rohm and Haas Co. (chemicals); Board |
| Born 1957. Trustee Since July 2009. Principal | Member of American Chemistry Council; Director of |
| Occupation(s) During the Past Five Years: Director of | Tyco International, Ltd. (diversified manufacturing and |
| The Vanguard Group, Inc., since 2008; Chief Executive | services) and Hewlett-Packard Co. (electronic computer |
| Officer and President of The Vanguard Group and of | manufacturing); Trustee of The Conference Board. |
| each of the investment companies served by The | |
| Vanguard Group since 2008; Director of Vanguard | Amy Gutmann |
| Marketing Corporation; Managing Director of The | Born 1949. Trustee Since June 2006. Principal |
| Vanguard Group (1995–2008). | Occupation(s) During the Past Five Years: President of |
| the University of Pennsylvania; Christopher H. Browne | |
| Distinguished Professor of Political Science in the School | |
| Independent Trustees | of Arts and Sciences with secondary appointments |
| at the Annenberg School for Communication and the | |
| Charles D. Ellis | Graduate School of Education of the University of |
| Born 1937. Trustee Since January 2001. Principal | Pennsylvania; Director of Carnegie Corporation of |
| Occupation(s) During the Past Five Years: Applecore | New York, Schuylkill River Development Corporation, |
| Partners (pro bono ventures in education); Senior | and Greater Philadelphia Chamber of Commerce; |
| Advisor to Greenwich Associates (international business | Trustee of the National Constitution Center. |
| strategy consulting); Successor Trustee of Yale University; | |
| Overseer of the Stern School of Business at New York | |
| University; Trustee of the Whitehead Institute for | |
| Biomedical Research. |
| JoAnn Heffernan Heisen | Executive Officers | |
| Born 1950. Trustee Since July 1998. Principal | ||
| Occupation(s) During the Past Five Years: Corporate | Thomas J. Higgins1 | |
| Vice President and Chief Global Diversity Officer since | Born 1957. Chief Financial Officer Since September | |
| 2006 (retired 2008) and Member of the Executive | 2008. Principal Occupation(s) During the Past Five | |
| Committee (retired 2008) of Johnson & Johnson | Years: Principal of The Vanguard Group, Inc.; Chief | |
| (pharmaceuticals/consumer products); Vice President | Financial Officer of each of the investment companies | |
| and Chief Information Officer of Johnson & Johnson | served by The Vanguard Group since 2008; Treasurer | |
| (1997–2005); Director of the University Medical Center | of each of the investment companies served by The | |
| at Princeton and Women’s Research and Education | Vanguard Group (1998–2008). | |
| Institute. | ||
| Kathryn J. Hyatt1 | ||
| André F. Perold | Born 1955. Treasurer Since November 2008. Principal | |
| Born 1952. Trustee Since December 2004. Principal | Occupation(s) During the Past Five Years: Principal of | |
| Occupation(s) During the Past Five Years: George Gund | The Vanguard Group, Inc.; Treasurer of each of the | |
| Professor of Finance and Banking, Harvard Business | investment companies served by The Vanguard | |
| School; Chairman of UNX, Inc. (equities trading firm); | Group since 2008; Assistant Treasurer of each of the | |
| Chair of the Investment Committee of HighVista | investment companies served by The Vanguard Group | |
| Strategies LLC (private investment firm). | (1988–2008). | |
| Alfred M. Rankin, Jr. | Heidi Stam1 | |
| Born 1941. Trustee Since January 1993. Principal | Born 1956. Secretary Since July 2005. Principal | |
| Occupation(s) During the Past Five Years: Chairman, | Occupation(s) During the Past Five Years: Managing | |
| President, and Chief Executive Officer of NACCO | Director of The Vanguard Group, Inc., since 2006; | |
| Industries, Inc. (forklift trucks/housewares/lignite); | General Counsel of The Vanguard Group since 2005; | |
| Director of Goodrich Corporation (industrial products/ | Secretary of The Vanguard Group and of each of the | |
| aircraft systems and services); Deputy Chairman of | investment companies served by The Vanguard Group | |
| the Federal Reserve Bank of Cleveland. | since 2005; Director and Senior Vice President of | |
| Vanguard Marketing Corporation since 2005; Principal | ||
| Peter F. Volanakis | of The Vanguard Group (1997–2006). | |
| Born 1955. Trustee Since July 2009. Principal | ||
| Occupation(s) During the Past Five Years: President | ||
| since 2007 and Chief Operating Officer since 2005 | Vanguard Senior Management Team | |
| of Corning Incorporated (communications equipment); | ||
| President of Corning Technologies (2001–2005); Director | R. Gregory Barton | Michael S. Miller |
| of Corning Incorporated and Dow Corning; Trustee of | Mortimer J. Buckley | James M. Norris |
| the Corning Incorporated Foundation and the Corning | Kathleen C. Gubanich | Glenn W. Reed |
| Museum of Glass; Overseer of the Amos Tuck School | Paul A. Heller | George U. Sauter |
| of Business Administration at Dartmouth College. | ||
| Founder | ||
| John C. Bogle | ||
| Chairman and Chief Executive Officer, 1974–1996 | ||
1 These individuals are “interested persons” as defined in the Investment Company Act of 1940.
2 December 2002 for Vanguard Equity Income Fund, Vanguard Growth Equity Fund, the Vanguard Municipal Bond Funds, and the Vanguard
State Tax-Exempt Funds.

P.O. Box 2600
Valley Forge, PA 19482-2600
Connect with Vanguard® > www.vanguard.com
| Fund Information > 800-662-7447 | All comparative mutual fund data are from Lipper Inc. |
| or Morningstar, Inc., unless otherwise noted. | |
| Direct Investor Account Services > 800-662-2739 | |
| Institutional Investor Services > 800-523-1036 | You can obtain a free copy of Vanguard’s proxy voting |
| guidelines by visiting our website, www.vanguard.com, | |
| Text Telephone for People | and searching for “proxy voting guidelines,” or by |
| With Hearing Impairment > 800-749-7273 | calling Vanguard at 800-662-2739. The guidelines are |
| also available from the SEC’s website, www.sec.gov. | |
| In addition, you may obtain a free report on how your | |
| fund voted the proxies for securities it owned during | |
| the 12 months ended June 30. To get the report, visit | |
| This material may be used in conjunction | either www.vanguard.com or www.sec.gov. |
| with the offering of shares of any Vanguard | |
| fund only if preceded or accompanied by | |
| the fund’s current prospectus. | You can review and copy information about your fund |
| at the SEC’s Public Reference Room in Washington, D.C. | |
| CFA® is a trademark owned by CFA Institute. | To find out more about this public service, call the SEC |
| at 202-551-8090. Information about your fund is also | |
| available on the SEC’s website, and you can receive | |
| copies of this information, for a fee, by sending a | |
| request in either of two ways: via e-mail addressed to | |
| publicinfo@sec.gov or via regular mail addressed to the | |
| Public Reference Section, Securities and Exchange | |
| Commission, Washington, DC 20549-0102. | |
| �� | |
| © 2009 The Vanguard Group, Inc. | |
| All rights reserved. | |
| Vanguard Marketing Corporation, Distributor. | |
| Q650 112009 | |
![]()
| Vanguard Growth Equity Fund |
| Annual Report |
| September 30, 2009 |

> For the fiscal year ended September 30, 2009, Vanguard Growth Equity Fund
returned –8.25%.
> The fund trailed the return of its benchmark, the Russell 1000 Growth Index,
as well as the average return of large-capitalization growth funds.
> Since January 2009, the fund’s management team has included Jennison
Associates LLC, which now oversees the assets formerly managed by Turner
Investment Partners, LLC.
| Contents | |
| Your Fund’s Total Returns | 1 |
| President’s Letter | 2 |
| Advisors’ Report | 8 |
| Results of Proxy Voting | 11 |
| Fund Profile | 12 |
| Performance Summary | 13 |
| Financial Statements | 14 |
| Your Fund’s After-Tax Returns | 24 |
| About Your Fund’s Expenses | 25 |
| Glossary | 27 |
Please note: The opinions expressed in this report are just that—informed opinions. They should not be considered promises or advice.
Also, please keep in mind that the information and opinions cover the period through the date on the front of this report. Of course, the
risks of investing in your fund are spelled out in the prospectus.
Cover photograph: Veronica Coia.
Your Fund’s Total Returns
| Fiscal Year Ended September 30, 2009 | ||
| Ticker | Total | |
| Symbol | Returns | |
| Vanguard Growth Equity Fund | VGEQX | –8.25% |
| Russell 1000 Growth Index | –1.85 | |
| Large-Cap Growth Funds Average1 | –3.02 |
| Your Fund’s Performance at a Glance | ||||
| September 30, 2008–September 30, 2009 | ||||
| Distributions Per Share | ||||
| Starting | Ending | Income | Capital | |
| Share Price | Share Price | Dividends | Gains | |
| Vanguard Growth Equity Fund | $9.46 | $8.60 | $0.062 | $0.000 |
1 Derived from data provided by Lipper Inc.
1

President’s Letter
Dear Shareholder,
The fiscal year covered in this report was an extremely volatile time for the U.S. stock market. In the beginning of the period, stocks suffered some of their worst returns on record. In mid-March, the market began to rally and stocks started to bounce back. Although stocks were able to recover some lost ground in the second half of the year, the gains weren’t enough to make up for the dramatic losses of the first several months.
Vanguard Growth Equity Fund returned –8.25% for the fiscal year ended September 30, 2009, lagging its benchmark, the Russell 1000 Growth Index, which returned –1.85%. The fund also finished behind the –3.02% average return for large-cap growth funds for the period.
The fund’s biggest losses stemmed from its holdings in the financial, industrial, consumer staples, and materials sectors. These industries were among the sectors that were hammered hard in the past year’s economic turbulence.
If you hold shares in a taxable account, you may wish to review the table and discussion on after-tax returns for the fiscal year, based on the highest tax bracket, later in this report.
2
After a precipitous fall, stock markets rebound
In recent months, the financial markets have performed so strongly that it’s almost hard to remember that less than a year ago the global financial system stood on the brink of collapse. Since then, markets have pulled back from the abyss. Although unemployment remains near generational highs, and the prospects of a robust recovery seem dim, the global economy has begun to grind into gear.
Reminders of the markets’ dark days are nevertheless apparent in the index returns for both the past 12 months and the past three years. Over both periods, U.S. stocks recorded negative returns.
Global stocks did better over the past 12 months, recouping their late-2008 losses thanks to general strength in developed economies and a powerful rally in emerging markets. Over the past three years, however, international stocks posted a modestly negative return.
The bond market’s turnabout has been equally dramatic
The stock market’s collapse and recovery echo even more dramatic developments in the bond market. At the end of 2008, as the credit markets nearly ceased to function, the difference between the yields of corporate bonds and U.S. Treasury bonds spiked to levels last seen during the Great Depression.
| Market Barometer | |||
| Average Annual Total Returns | |||
| Periods Ended September 30, 2009 | |||
| One Year | Three Years | Five Years | |
| Stocks | |||
| Russell 1000 Index (Large-caps) | –6.14% | –5.10% | 1.49% |
| Russell 2000 Index (Small-caps) | –9.55 | –4.57 | 2.41 |
| Dow Jones U.S. Total Stock Market Index | –5.83 | –4.58 | 1.93 |
| MSCI All Country World Index ex USA (International) | 6.43 | –0.78 | 8.59 |
| Bonds | |||
| Barclays Capital U.S. Aggregate Bond Index | |||
| (Broad taxable market) | 10.56% | 6.41% | 5.13% |
| Barclays Capital Municipal Bond Index | 14.85 | 5.13 | 4.78 |
| Citigroup 3-Month Treasury Bill Index | 0.39 | 2.63 | 2.96 |
| CPI | |||
| Consumer Price Index | –1.29% | 2.10% | 2.61% |
3
The Federal Reserve and its central bank counterparts around the world responded with aggressive monetary stimulus efforts, while global governments opened the fiscal taps. Investors first tiptoed, then stampeded, back into the market, boosting bond prices and bringing down yields. Over the past 12 months, taxable U.S. bonds returned more than 10%; municipal securities did even better, returning almost 15%, as measured by the Barclays Capital Municipal Bond Index.
The Fed’s rescue campaign has imposed a heavy price on short-term savings vehicles such as money market funds. In December 2008, the Fed reduced its target for the federal funds rate, a benchmark for the interest rates paid by money
market instruments and other very short-term securities, to between 0% and 0.25%. The Fed has said it expects to maintain its target at this level “for an extended period.”
Stock selection a factor in disappointing returns
By blending the distinct, yet complementary, investment management styles of its two advisors, Jennison Associates LLC and Baillie Gifford Overseas Ltd., Vanguard Growth Equity Fund aims to outperform the Russell 1000 Growth Index. For the 12 months ended September 30, 2009, the fund was unable to achieve its goal and closed the period several points behind its benchmark.
| Expense Ratios1 | ||
| Your Fund Compared With Its Peer Group | ||
| Large-Cap | ||
| Growth Funds | ||
| Fund | Average | |
| Growth Equity Fund | 0.60% | 1.34% |
1 The fund expense ratio shown is from the prospectus dated March 17, 2009, and represents estimated costs for the current fiscal year
based on the fund’s net assets as of the prospectus date. For the fiscal year ended September 30, 2009, the fund’s expense ratio was
0.51%. The peer-group expense ratio is derived from data provided by Lipper Inc. and captures information through year-end 2008.
4
The fund suffered from substantial losses in the financial sector. Relative to the index, the portfolio was heavily invested in insurance companies, which performed poorly for the period. In particular, property and casualty insurance companies—including Berkshire Hathaway and ACE—weighed on the fund’s returns.
Industrial stocks were also among the fund’s worst performers. Industrial conglomerates, machinery companies, and railroads were badly battered during the downturn, as manufacturers suffered from shrinking orders and high inventories. Although these stocks have begun to bounce back in recent months, their gains weren’t enough to make up for the losses of the first six months.
In consumer staples, the fund’s stock selection in the retail food industry, which included the grocery stores Whole Foods Market and Kroger, hurt returns relative to the benchmark. These companies suffered along with the economy, as some consumers preferred to do their grocery shopping at discount stores. Poor stock selection in materials, particularly in the paper products and metals and mining industries, also put a damper on performance.
Although the fund posted positive results in the information technology sector, it lagged behind its benchmark’s returns in the sector. Technology stocks spiked, as corporations seemed ready to resume spending on communications equipment,
| Total Returns | |
| Ten Years Ended September 30, 2009 | |
| Average | |
| Annual Return | |
| Growth Equity Fund1 | –3.41% |
| Russell 1000 Growth Index | –2.56 |
| Large-Cap Growth Funds Average2 | –2.81 |
The figures shown represent past performance, which is not a guarantee of future results. (Current performance
may be lower or higher than the performance data cited. For performance data current to the most recent month-
end, visit our website at www.vanguard.com/performance.) Note, too, that both investment returns and principal
value can fluctuate widely, so an investor’s shares, when sold, could be worth more or less than their original cost.
1 Prior to June 12, 2000, the fund was organized as the Turner Growth Equity Fund.
2 Derived from data provided by Lipper Inc.
5
computer hardware, and computer software. The Growth Equity Fund wasn’t as heavily weighted in technology as its benchmark, and, therefore, missed out on some of the industry’s gains.
Despite posting overall negative returns in energy and telecommunication services, the portfolio benefited from strong stock selection in these sectors. The fund’s advisors avoided some of the hardest-hit companies in both of these industries, which boosted returns relative to the benchmark.
A troubled two years disrupts long-term results
Vanguard often advises that investors consider the long-term results when evaluating a fund’s performance. The long-term perspective can nevertheless be distorted, for better or worse, by the most recent short-term results. The Growth Equity Fund’s sizable losses over the past two years have obscured some signs of strength in the longer-term record.
Over the past decade through September 30, Vanguard Growth Equity Fund has returned an average of –3.41% annually. Just two years ago, at the end of fiscal 2007 and before the fund’s long-term performance average was pummeled by the recent downturn, the fund reported a more palatable average yearly return for the decade of 5.1%, 1 percentage point better than its benchmark.
As I indicated in our previous semiannual report to you, changes have been made to the fund’s management structure. The fund’s advisory team now includes Jennison Associates, which oversees the assets formerly managed by Turner Investment Partners. (Baillie Gifford Overseas Ltd. continues as an existing advisor.) The fund’s investment objective remains the same. Going forward, we believe the Growth Equity Fund has the potential to produce competitive returns for the long-term.
Set your sights on the future
During the past 12 months, investors have been forced to endure extreme volatility in the stock market. In the beginning of the fiscal year, U.S. stocks experienced one of their toughest economic periods since the 1930s and suffered from record declines. In March, the market began to turn around and stocks were able to recover some of their losses. Although the stock market seems to be on the right path for now, its near-term direction is impossible to forecast with accuracy.
Because such uncertainty is forever present in the financial markets, Vanguard encourages investors to always follow a couple of simple principles—maintain a long-term perspective and stay focused on your goals. Establishing a well-balanced and diversified portfolio that is consistent with your long-term goals and risk tolerance can help you follow these guidelines.
6
Such a portfolio can provide you with some protection from the stock market’s inevitable ups and downs, while allowing you to participate in its long-term potential for growth. With its low costs and broad diversification among domestic growth stocks, we believe that the Growth Equity Fund can play an important role in a well-balanced portfolio.
Thank you for entrusting your assets to Vanguard.
Sincerely,

F. William McNabb III
President and Chief Executive Officer
October 15, 2009
7
Advisors’ Report
For the fiscal year ended September 30, 2009, the Growth Equity Fund returned –8.25%. Your fund is managed by two independent advisors, a strategy that enhances the fund’s diversification by providing exposure to distinct, yet complementary, investment approaches. It’s not uncommon for different advisors to have different views about individual securities or the broader investment environment.
The advisors, the percentage of fund assets each manages, and brief descriptions of their investment strategies are presented in the table below. The advisors have also prepared a discussion of the investment environment that existed during the fiscal year and of how portfolio positioning reflects this assessment. These comments were prepared on October 21, 2009.
Baillie Gifford Overseas Ltd.
Portfolio Manager:
Mick Brewis, Partner and Head of
North American Investment Team
The fund’s past fiscal year has been split evenly into two very different performance periods. In the first six months, we encountered the follow-through of one of the greatest financial crises of all time; then, in the second half of the period, we saw an aggressive snapback in the markets. The rally has been driven by investors’ realization that steep declines in inventories were not necessarily permanent, as well as by the Federal Reserve’s actions to lower interest rates and push liquidity into the markets. Many financial institutions may continue to suffer from aftershocks, but at this point the effects we are seeing probably signify a traditional recession.
Vanguard Growth Equity Fund Investment Advisors
| Fund Assets Managed | |||
| Investment Advisor | % | $ Million | Investment Strategy |
| Baillie Gifford Overseas Ltd. | 48 | 286 | Uses a fundamental approach to identify quality |
| growth companies. The firm considers the | |||
| sustainability of earnings growth to be a critical | |||
| factor in evaluating a company’s prospects. The | |||
| firm looks for companies with attractive industry | |||
| backgrounds, strong competitive positions within | |||
| those industries, high-quality earnings, and a | |||
| favorable attitude toward shareholders. | |||
| Jennison Associates LLC | 48 | 284 | Uses a research-driven, fundamental investment |
| approach that relies on in-depth company knowledge | |||
| gleaned through meetings with management, | |||
| customers, and suppliers. | |||
| Cash Investments | 4 | 24 | These short-term reserves are invested by Vanguard |
| in equity index products to simulate investment in | |||
| stocks. Each advisor also may maintain a modest | |||
| cash position. | |||
8
As we survey the damage, we continue to see pressure on corporate profits. Cost cutting was decisive and aggressive, which means that the declines have been partly mitigated, but we will continue to see the effects of this action on consumer spending and employment for some time to come. The portfolio has had a bias to companies with long-term, steady growth, and the short-term upward correction has tended to favor names that have come back from the brink, such as banks and those with unwieldy debt burdens.
Portfolio turnover remains low, with new purchases skewed to health care companies such as Johnson & Johnson, Merck, Baxter International, Bristol-Myers Squibb, and Stryker. We believe research and development productivity is starting to improve at several pharmaceutical companies, and that the impact of political reform will not be as negative as the depressed valuations imply. We have tended to eliminate those companies exposed to the global commodity cycle, including Suncor Energy, Diamond Offshore Drilling, Arch Coal, and U.S. Steel.
Looking forward, the portfolio is invested in strong growth franchises, which should prosper under a number of scenarios. With consumer and U.S. government debt at high levels, general U.S. economic growth rates may be muted, but the companies in our portion of the portfolio are well placed for this environment, and we are confident about their prospects.
Many of these companies—Wal-Mart and Berkshire Hathaway are good examples—are out of favor with the market, and are attractively valued, in our view.
Jennison Associates LLC
Portfolio Manager:
Kathleen A. McCarragher,
Managing Director
Jennison Associates began managing about half of the portfolio’s assets in January 2009. Our investment strategy is based on the philosophy that internal fundamental research and a highly interactive investment process lead to successful stock selection and portfolio construction. We believe that a stock’s value over time is driven by above-average growth in units, revenues, earnings, and cash flow. We seek to capture the acceleration of growth or the inflection point in a company’s growth rate that is not fully reflected in the stock’s price, and we value the duration of that growth.
In the roughly nine months since the portfolio’s inception, stock selection aided portfolio performance broadly, especially in the consumer discretionary, financial, health care, and consumer staples sectors. In consumer discretionary, Amazon.com’s strong earnings reflected the secular shift toward e-commerce and Amazon’s continued market-share gains. Goldman Sachs Group was a standout in financials, benefiting from a solid balance sheet and deft navigation of the uneven market environment. In health care,
9
optical-care leader Alcon rose on better-than-expected earnings and moves by Swiss pharmaceutical company Novartis to buy a majority stake in it.
In consumer staples, Cadbury advanced on Kraft Foods’ acquisition bid. After Cadbury rejected Kraft’s initial offer, Cadbury’s share price traded above the offer price on expectations of a higher bid, either from Kraft or another bidder. Information technology holding Apple rose on better-than-expected iPod and iPhone sales. We believe Apple’s creativity and innovation in product design and marketing will continue to drive gains. Internet search leader Google advanced on solid earnings growth and margin expansion. The company’s continued investment in capacity and in research and development should lead to new streams of revenue through product innovation, new formats, and new technologies.
In industrials, an underweighted position was beneficial, although stock selection hurt returns. Security selection was also detrimental in materials. Key individual detractors included health care holding BioMarin Pharmaceuticals, which fell on disappointing earnings, revenue, and guidance, and First Solar, which declined as price discounting by competitors pressured the energy holding’s pricing and margins. We eliminated our positions in both stocks.
We expect the earnings growth of companies held in the portfolio to be spurred by top-line growth fueled by economic expansion and market-share gains born of weakened competition and new product introductions. We believe business fundamentals are improving at a greater number of companies, despite what may be an uneven and fitful path to recovery.
10
Results of Proxy Voting
At a special meeting of shareholders on July 2, 2009, fund shareholders approved the following two proposals:
Proposal 1—Elect trustees for each fund.*
The individuals listed in the table below were elected as trustees for each fund. All trustees with the exception of Messrs. McNabb and Volanakis (both of whom already served as directors of The Vanguard Group, Inc.) served as trustees to the funds prior to the shareholder meeting.
| Percentage | |||
| Trustee | For | Withheld | For |
| John J. Brennan | 381,461,550 | 10,736,721 | 97.3% |
| Charles D. Ellis | 375,348,055 | 16,850,216 | 95.7% |
| Emerson U. Fullwood | 377,280,677 | 14,917,594 | 96.2% |
| Rajiv L. Gupta | 381,215,106 | 10,983,165 | 97.2% |
| Amy Gutmann | 381,699,062 | 10,499,209 | 97.3% |
| JoAnn Heffernan Heisen | 381,602,478 | 10,595,793 | 97.3% |
| F. William McNabb III | 381,115,414 | 11,082,857 | 97.2% |
| André F. Perold | 377,090,732 | 15,107,539 | 96.1% |
| Alfred M. Rankin, Jr. | 381,547,990 | 10,650,281 | 97.3% |
| Peter F. Volanakis | 381,683,908 | 10,514,362 | 97.3% |
| * Results are for all funds within the same trust. |
Proposal 2—Update and standardize the funds’ fundamental policies regarding:
(a) Purchasing and selling real estate.
(b) Issuing senior securities.
(c) Borrowing money.
(d) Making loans.
(e) Purchasing and selling commodities.
(f) Concentrating investments in a particular industry or group of industries.
(g) Eliminating outdated fundamental investment policies not required by law.
The revised fundamental policies are clearly stated and simple, yet comprehensive, making oversight and compliance more efficient than under the former policies. The revised fundamental policies will allow the funds to respond more quickly to regulatory and market changes, while avoiding the costs and delays associated with successive shareholder meetings.
| Broker | Percentage | ||||
| Vanguard Fund | For | Abstain | Against | Non-Votes | For |
| Growth Equity Fund | |||||
| 2a | 40,158,940 | 999,537 | 5,622,440 | 1,741,388 | 82.8% |
| 2b | 39,961,997 | 1,062,321 | 5,756,600 | 1,741,387 | 82.4% |
| 2c | 39,705,426 | 1,104,372 | 5,971,120 | 1,741,387 | 81.8% |
| 2d | 39,751,110 | 1,091,366 | 5,938,441 | 1,741,388 | 81.9% |
| 2e | 39,994,091 | 1,000,248 | 5,786,580 | 1,741,386 | 82.4% |
| 2f | 39,938,762 | 1,047,544 | 5,794,612 | 1,741,387 | 82.3% |
| 2g | 45,120,433 | 1,060,810 | 599,677 | 1,741,385 | 93.0% |
11
Growth Equity Fund
Fund Profile
As of September 30, 2009
| Portfolio Characteristics | |||
| Comparative | Broad | ||
| Fund | Index1 | Index2 | |
| Number of Stocks | 79 | 624 | 4,324 |
| Median Market Cap | $42.2B | $37.2B | $29.0B |
| Price/Earnings Ratio | 22.5x | 22.0x | 27.9x |
| Price/Book Ratio | 3.4x | 3.6x | 2.1x |
| Yield3 | 0.8% | 1.6% | 1.9% |
| Return on Equity | 22.6% | 23.5% | 19.1% |
| Earnings Growth Rate | 15.8% | 16.6% | 9.6% |
| Foreign Holdings | 7.0% | 0.0% | 0.0% |
| Turnover Rate | 98% | — | — |
| Expense Ratio4 | 0.60% | — | — |
| Short-Term Reserves | 1.1% | — | — |
| Sector Diversification (% of equity exposure) | |||
| Comparative | Broad | ||
| Fund | Index1 | Index2 | |
| Consumer Discretionary | 8.2% | 10.4% | 10.1% |
| Consumer Staples | 16.3 | 16.0 | 9.9 |
| Energy | 9.1 | 4.2 | 11.0 |
| Financials | 9.8 | 5.2 | 16.7 |
| Health Care | 21.8 | 16.7 | 12.9 |
| Industrials | 7.4 | 10.2 | 10.6 |
| Information Technology | 23.7 | 31.7 | 18.2 |
| Materials | 2.8 | 4.0 | 3.9 |
| Telecommunication | |||
| Services | 0.7 | 0.6 | 2.9 |
| Utilities | 0.2 | 1.0 | 3.8 |
| Volatility Measures5 | ||
| Fund Versus | Fund Versus | |
| Comparative Index1 | Broad Index2 | |
| R-Squared | 0.95 | 0.88�� |
| Beta | 1.06 | 0.99 |
| Ten Largest Holdings6 (% of total net assets) | ||
| Baxter International Inc. | health care equipment | 3.2% |
| Cisco Systems, Inc. | communications equipment | 3.1 |
| PepsiCo, Inc. | soft drinks | 2.6 |
| Walgreen Co. | drug retail | 2.5 |
| Berkshire Hathaway Inc. Class B | property and casualty insurance | 2.4 |
| Progressive Corp. | property and casualty insurance | 2.4 |
| Google Inc. Class A | Internet software and services | 2.4 |
| Johnson & Johnson | pharmaceuticals | 2.3 |
| Oracle Corp. | systems software | 2.3 |
| Apple Inc. | computer hardware | 2.1 |
| Top Ten | 25.3% | |
Investment Focus
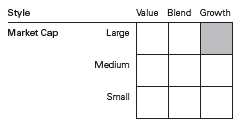
1 Russell 1000 Growth Index.
2 Dow Jones U.S. Total Stock Market Index.
3 30-day SEC yield for the fund; annualized dividend yield for the indexes. See the Glossary.
4 The expense ratio shown is from the prospectus dated March 17, 2009, and represents estimated costs for the current fiscal year based
on the fund’s net assets as of the prospectus date. For the fiscal year ended September 30, 2009, the fund’s expense ratio was 0.51%.
5 For an explanation of R-squared, beta, and other items used here, see the Glossary.
6 The holdings listed exclude any temporary cash investments and equity index products.
12
Growth Equity Fund
Performance Summary
All of the returns in this report represent past performance, which is not a guarantee of future results that may be achieved by the fund. (Current performance may be lower or higher than the performance data cited. For performance data current to the most recent month-end, visit our website at www.vanguard.com/performance.) Note, too, that both investment returns and principal value can fluctuate widely, so an investor’s shares, when sold, could be worth more or less than their original cost. The returns shown do not reflect taxes that a shareholder would pay on fund distributions or on the sale of fund shares.
Cumulative Performance: September 30, 1999–September 30, 2009
Initial Investment of $10,000
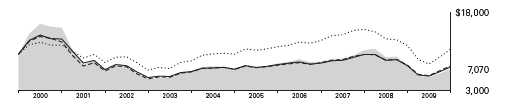
| Average Annual Total Returns | Final Value | ||||
| Periods Ended September 30, 2009 | of a $10,000 | ||||
| One Year | Five Years | Ten Years | Investment | ||
 | Growth Equity Fund1 | –8.25% | 0.04% | –3.41% | $7,070 |
 | Dow Jones U.S. Total Stock Market Index�� | –5.83 | 1.93 | 0.94 | 10,978 |
 | Russell 1000 Growth Index | –1.85 | 1.86 | –2.56 | 7,720 |
 | Large-Cap Growth Funds Average2 | –3.02 | 1.23 | –2.81 | 7,517 |
Fiscal-Year Total Returns (%): September 30, 1999–September 30, 2009
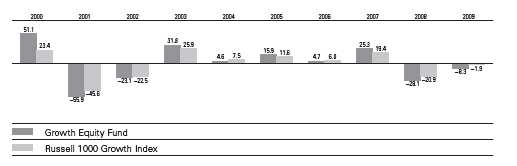
1 Total returns do not include the account service fee that may be applicable to certain accounts with balances below $10,000.
2 Derived from data provided by Lipper Inc.
Note: See Financial Highlights table for dividend and capital gains information.
13
Growth Equity Fund
Financial Statements
Statement of Net Assets
As of September 30, 2009
The fund reports a complete list of its holdings in regulatory filings four times in each fiscal year, at the quarter-ends. For the second and fourth fiscal quarters, the lists appear in the fund’s semiannual and annual reports to shareholders. For the first and third fiscal quarters, the fund files the lists with the Securities and Exchange Commission on Form N-Q. Shareholders can look up the fund’s Forms N-Q on the SEC’s website at www.sec.gov. Forms N-Q may also be reviewed and copied at the SEC’s Public Reference Room (see the back cover of this report for further information).
| Market | |||
| Value• | |||
| Shares | ($000) | ||
| Common Stocks (94.3%)1 | |||
| Consumer Discretionary (7.7%) | |||
| Walt Disney Co. | 392,147 | 10,768 | |
| * | Amazon.com Inc. | 106,309 | 9,925 |
| Omnicom Group Inc. | 193,840 | 7,160 | |
| NIKE Inc. Class B | 76,968 | 4,980 | |
| * | Starbucks Corp. | 229,200 | 4,733 |
| * | Carmax Inc. | 168,400 | 3,520 |
| Home Depot Inc. | 124,380 | 3,313 | |
| Coach Inc. | 46,800 | 1,541 | |
| 45,940 | |||
| Consumer Staples (15.5%) | |||
| PepsiCo Inc. | 260,594 | 15,286 | |
| Walgreen Co. | 402,700 | 15,089 | |
| Wal-Mart Stores Inc. | 194,770 | 9,561 | |
| Alberto-Culver Co. Class B | 314,130 | 8,695 | |
| Kroger Co. | 367,620 | 7,588 | |
| Brown-Forman Corp. | |||
| Class B | 153,400 | 7,397 | |
| Colgate-Palmolive Co. | 80,193 | 6,117 | |
| Cadbury PLC ADR | 113,230 | 5,799 | |
| Costco Wholesale Corp. | 100,198 | 5,657 | |
| Procter & Gamble Co. | 80,660 | 4,672 | |
| Unilever PLC ADR | 125,000 | 3,585 | |
| Shoppers Drug Mart Corp. | 69,540 | 2,854 | |
| 92,300 | |||
| Energy (8.4%) | |||
| Schlumberger Ltd. | 194,849 | 11,613 | |
| Apache Corp. | 118,570 | 10,888 | |
| Occidental Petroleum Corp. | 73,620 | 5,772 | |
| EOG Resources Inc. | 66,400 | 5,545 | |
| Petroleo Brasileiro SA ADR | 107,500 | 4,934 | |
| * | Southwestern Energy Co. | 112,150 | 4,787 |
| * | Weatherford | ||
| International Ltd. | 198,800 | 4,121 | |
| * | Ultra Petroleum Corp. | 50,820 | 2,488 |
| 50,148 | |||
| Market | |||
| Value• | |||
| Shares | ($000) | ||
| Financials (9.0%) | |||
| * | Berkshire Hathaway Inc. | ||
| Class B | 4,370 | 14,521 | |
| * | Progressive Corp. | 866,290 | 14,363 |
| Goldman Sachs Group Inc. | 66,046 | 12,176 | |
| JPMorgan Chase & Co. | 129,500 | 5,675 | |
| ^ | M&T Bank Corp. | 67,680 | 4,218 |
| * | Markel Corp. | 8,190 | 2,701 |
| 53,654 | |||
| Health Care (20.9%) | |||
| Baxter International Inc. | 333,647 | 19,021 | |
| Johnson & Johnson | 223,750 | 13,624 | |
| Merck & Co. Inc. | 349,000 | 11,039 | |
| * | Gilead Sciences Inc. | 221,702 | 10,327 |
| Bristol-Myers Squibb Co. | 455,300 | 10,253 | |
| * | Medco Health Solutions Inc. | 176,704 | 9,774 |
| Teva Pharmaceutical | |||
| Industries Ltd. ADR | 181,685 | 9,186 | |
| Alcon Inc. | 53,344 | 7,397 | |
| Roche Holding AG ADR | 171,148 | 6,943 | |
| * | Celgene Corp. | 108,263 | 6,052 |
| * | Mylan Inc. | 332,062 | 5,316 |
| Abbott Laboratories | 93,024 | 4,602 | |
| Stryker Corp. | 94,740 | 4,304 | |
| * | Vertex Pharmaceuticals Inc. | 95,400 | 3,616 |
| * | Edwards Lifesciences Corp. | 38,650 | 2,702 |
| 124,156 | |||
| Industrials (6.9%) | |||
| United Parcel Service Inc. | |||
| Class B | 151,880 | 8,577 | |
| Rockwell | |||
| Automation Inc. | 174,300 | 7,425 | |
| Flowserve Corp. | 49,200 | 4,848 | |
| Deere & Co. | 111,040 | 4,766 | |
| United Technologies Corp. | 75,550 | 4,603 | |
| * | Stericycle Inc. | 94,670 | 4,587 |
| Danaher Corp. | 44,160 | 2,973 | |
14
Growth Equity Fund
| Market | |||
| Value• | |||
| Shares | ($000) | ||
| Ritchie Bros Auctioneers Inc. | 86,710 | 2,146 | |
| Precision Castparts Corp. | 7,700 | 784 | |
| 40,709 | |||
| Information Technology (22.6%) | |||
| * | Cisco Systems Inc. | 787,041 | 18,527 |
| * | Google Inc. Class A | 28,650 | 14,206 |
| Oracle Corp. | 648,817 | 13,521 | |
| * | Apple Inc. | 66,206 | 12,273 |
| QUALCOMM Inc. | 261,787 | 11,775 | |
| Microsoft Corp. | 338,131 | 8,754 | |
| Visa Inc. Class A | 104,884 | 7,249 | |
| Hewlett-Packard Co. | 141,442 | 6,677 | |
| * | Adobe Systems Inc. | 194,177 | 6,416 |
| Linear Technology Corp. | 212,390 | 5,868 | |
| International Business | |||
| Machines Corp. | 46,300 | 5,538 | |
| Mastercard Inc. Class A | 24,800 | 5,013 | |
| * | Agilent Technologies Inc. | 178,180 | 4,959 |
| * | eBay Inc. | 156,860 | 3,703 |
| * | NetApp Inc. | 137,800 | 3,677 |
| * | Baidu Inc. ADR | 8,700 | 3,402 |
| * | Autodesk Inc. | 105,320 | 2,507 |
| 134,065 | |||
| Materials (2.7%) | |||
| Monsanto Co. | 98,263 | 7,606 | |
| Praxair Inc. | 70,300 | 5,743 | |
| Potash Corp. of | |||
| Saskatchewan Inc. | 26,970 | 2,446 | |
| 15,795 | |||
| Telecommunication Services (0.6%) | |||
| * | American Tower Corp. | ||
| Class A | 93,500 | 3,404 | |
| Total Common Stocks | |||
| (Cost $546,324) | 560,171 | ||
| Market | ||
| Value• | ||
| Shares | ($000) | |
| Temporary Cash Investments (5.5%)1 | ||
| Money Market Fund (4.6%) | ||
| 2,3 Vanguard Market Liquidity | ||
| Fund, 0.267% | 27,431,281 | 27,431 |
| Face | ||
| Amount | ||
| ($000) | ||
| U.S. Government and Agency Obligations (0.9%) | ||
| 4,5 Federal Home Loan | ||
| Bank Discount Notes, | ||
| 0.220%, 3/26/10 | 5,000 | 4,996 |
| Total Temporary Cash Investments | ||
| (Cost $32,426) | 32,427 | |
| Total Investments (99.8%) | ||
| (Cost $578,750) | 592,598 | |
| Other Assets and Liabilities (0.2%) | ||
| Other Assets | 12,413 | |
| Liabilities3 | (11,261) | |
| 1,152 | ||
| Net Assets (100%) | ||
| Applicable to 69,005,612 outstanding | ||
| $.001 par value shares of beneficial | ||
| interest (unlimited authorization) | 593,750 | |
| Net Asset Value Per Share | $8.60 | |
| At September 30, 2009, net assets consisted of: | ||
| Amount | ||
| ($000) | ||
| Paid-in Capital | 1,272,874 | |
| Undistributed Net Investment Income | 1,916 | |
| Accumulated Net Realized Losses | (695,595) | |
| Unrealized Appreciation (Depreciation) | ||
| Investment Securities | 13,848 | |
| Futures Contracts | 707 | |
| Net Assets | 593,750 | |
• See Note A in Notes to Financial Statements.
* Non-income-producing security.
^ Part of security position is on loan to broker-dealers. The total value of securities on loan is $2,113,000.
1 The fund invests a portion of its cash reserves in equity markets through the use of index futures contracts. After giving effect to futures
investments, the fund’s effective common stock and temporary cash investment positions represent 98.3% and 1.5%, respectively, of
net assets.
2 Affiliated money market fund available only to Vanguard funds and certain trusts and accounts managed by Vanguard. Rate shown is the
7-day yield.
3 Includes $2,170,000 of collateral received for securities on loan.
4 The issuer operates under a congressional charter; its securities are not backed by the full faith and credit of the U.S. government.
5 Securities with a value of $4,996,000 have been segregated as initial margin for open futures contracts.
ADR—American Depositary Receipt.
See accompanying Notes, which are an integral part of the Financial Statements.
15
Growth Equity Fund
Statement of Operations
| Year Ended | |
| September 30, 2009 | |
| ($000) | |
| Investment Income | |
| Income | |
| Dividends1 | 7,675 |
| Interest2 | 319 |
| Security Lending | 268 |
| Total Income | 8,262 |
| Expenses | |
| Investment Advisory Fees—Note B | |
| Basic Fee | 1,417 |
| Performance Adjustment | (474) |
| The Vanguard Group—Note C | |
| Management and Administrative | 1,418 |
| Marketing and Distribution | 181 |
| Custodian Fees | 23 |
| Auditing Fees | 21 |
| Shareholders’ Reports and Proxies | 71 |
| Trustees’ Fees and Expenses | 1 |
| Total Expenses | 2,658 |
| Expenses Paid Indirectly | (168) |
| Net Expenses | 2,490 |
| Net Investment Income | 5,772 |
| Realized Net Gain (Loss) | |
| Investment Securities Sold | (195,469) |
| Futures Contracts | (7,564) |
| Foreign Currencies | 153 |
| Realized Net Gain (Loss) | (202,880) |
| Change in Unrealized Appreciation (Depreciation) | |
| Investment Securities | 120,812 |
| Futures Contracts | 1,990 |
| Change in Unrealized Appreciation (Depreciation) | 122,802 |
| Net Increase (Decrease) in Net Assets Resulting from Operations | (74,306) |
1 Dividends are net of foreign withholding taxes of $90,000.
2 Interest income from an affiliated company of the fund was $267,000.
See accompanying Notes, which are an integral part of the Financial Statements.
16
Growth Equity Fund
Statement of Changes in Net Assets
| Year Ended September 30, | ||
| 2009 | 2008 | |
| ($000) | ($000) | |
| Increase (Decrease) in Net Assets | ||
| Operations | ||
| Net Investment Income | 5,772 | 1,806 |
| Realized Net Gain (Loss) | (202,880) | (10,899) |
| Change in Unrealized Appreciation (Depreciation) | 122,802 | (303,587) |
| Net Increase (Decrease) in Net Assets Resulting from Operations | (74,306) | (312,680) |
| Distributions | ||
| Net Investment Income | (4,464) | (1,264) |
| Realized Capital Gain | — | — |
| Total Distributions | (4,464) | (1,264) |
| Capital Share Transactions | ||
| Issued | 94,847 | 437,240 |
| Issued in Lieu of Cash Distributions | 4,238 | 1,204 |
| Redeemed | (157,944) | (367,899) |
| Net Increase (Decrease) from Capital Share Transactions | (58,859) | 70,545 |
| Total Increase (Decrease) | (137,629) | (243,399) |
| Net Assets | ||
| Beginning of Period | 731,379 | 974,778 |
| End of Period1 | 593,750 | 731,379 |
| 1 Net Assets—End of Period includes undistributed net investment income of $1,916,000 and $455,000. | ||
See accompanying Notes, which are an integral part of the Financial Statements.
17
Growth Equity Fund
Financial Highlights
| For a Share Outstanding | Year Ended September 30, | ||||
| Throughout Each Period | 2009 | 2008 | 2007 | 2006 | 2005 |
| Net Asset Value, Beginning of Period | $9.46 | $13.18 | $10.52 | $10.05 | $8.68 |
| Investment Operations | |||||
| Net Investment Income | .085 | .015 | .020 | (.009) | .001 |
| Net Realized and Unrealized Gain (Loss) | |||||
| on Investments | (.883) | (3.720) | 2.640 | .480 | 1.380 |
| Total from Investment Operations | (.798) | (3.705) | 2.660 | .471 | 1.381 |
| Distributions | |||||
| Dividends from Net Investment Income | (.062) | (.015) | — | (.001) | (.011) |
| Distributions from Realized Capital Gains | — | — | — | — | — |
| Total Distributions | (.062) | (.015) | — | (.001) | (.011) |
| Net Asset Value, End of Period | $8.60 | $9.46 | $13.18 | $10.52 | $10.05 |
| Total Return1 | –8.25% | –28.15% | 25.29% | 4.69% | 15.92% |
| Ratios/Supplemental Data | |||||
| Net Assets, End of Period (Millions) | $594 | $731 | $975 | $759 | $713 |
| Ratio of Total Expenses to | |||||
| Average Net Assets2 | 0.51% | 0.72% | 0.68% | 0.91% | 0.88% |
| Ratio of Net Investment Income to | |||||
| Average Net Assets | 1.10% | 0.18% | 0.14% | (0.04%) | 0.01% |
| Portfolio Turnover Rate | 98% | 222% | 131% | 147% | 147% |
1 Total returns do not include the account service fee that may be applicable to certain accounts with balances below $10,000.
2 Includes performance-based investment advisory fee increases (decreases) of (0.09)%, 0.08%, 0.04%, 0.19%, and 0.11%.
See accompanying Notes, which are an integral part of the Financial Statements.
18
Growth Equity Fund
Notes to Financial Statements
Vanguard Growth Equity Fund is registered under the Investment Company Act of 1940 as an open-end investment company, or mutual fund.
A. The following significant accounting policies conform to generally accepted accounting principles for U.S. mutual funds. The fund consistently follows such policies in preparing its financial statements.
1. Security Valuation: Securities are valued as of the close of trading on the New York Stock Exchange (generally 4 p.m., Eastern time) on the valuation date. Equity securities are valued at the latest quoted sales prices or official closing prices taken from the primary market in which each security trades; such securities not traded on the valuation date are valued at the mean of the latest quoted bid and asked prices. Securities for which market quotations are not readily available, or whose values have been affected by events occurring before the fund’s pricing time but after the close of the securities’ primary markets, are valued at their fair values calculated according to procedures adopted by the board of trustees. These procedures include obtaining quotations from an independent pricing service, monitoring news to identify significant market- or security-specific events, and evaluat ing changes in the values of foreign market proxies (for example, ADRs, futures contracts, or exchange-traded funds), between the time the foreign markets close and the fund’s pricing time. When fair-value pricing is employed, the prices of securities used by a fund to calculate its net asset value may differ from quoted or published prices for the same securities. Investments in Vanguard Market Liquidity Fund are valued at that fund’s net asset value. Temporary cash investments acquired over 60 days to maturity are valued using the latest bid prices or using valuations based on a matrix system (which considers such factors as security prices, yields, maturities, and ratings), both as furnished by independent pricing services. Other temporary cash investments are valued at amortized cost, which approximates market value.
2. Foreign Currency: Securities and other assets and liabilities denominated in foreign currencies are translated into U.S. dollars using exchange rates obtained from an independent third party as of the fund’s pricing time on the valuation date. Realized gains (losses) and unrealized appreciation (depreciation) on investment securities include the effects of changes in exchange rates since the securities were purchased, combined with the effects of changes in security prices. Fluctuations in the value of other assets and liabilities resulting from changes in exchange rates are recorded as unrealized foreign currency gains (losses) until the assets or liabilities are settled in cash, at which time they are recorded as realized foreign currency gains (losses).
3. Futures Contracts: The fund uses index futures contracts to a limited extent, with the objective of maintaining full exposure to the stock market while maintaining liquidity. The fund may purchase or sell futures contracts to achieve a desired level of investment, whether to accommodate portfolio turnover or cash flows from capital share transactions. The primary risks associated with the use of futures contracts are imperfect correlation between changes in market values of stocks held by the fund and the prices of futures contracts, and the possibility of an illiquid market.
Futures contracts are valued at their quoted daily settlement prices. The aggregate principal amounts of the contracts are not recorded in the Statement of Net Assets. Fluctuations in the value of the contracts are recorded in the Statement of Net Assets as an asset (liability) and in the Statement of Operations as unrealized appreciation (depreciation) until the contracts are closed, when they are recorded as realized futures gains (losses).
19
Growth Equity Fund
4. Federal Income Taxes: The fund intends to continue to qualify as a regulated investment company and distribute all of its taxable income. Management has analyzed the fund’s tax positions taken for all open federal income tax years (September 30, 2006–2009), and has concluded that no provision for federal income tax is required in the fund’s financial statements.
5. Distributions: Distributions to shareholders are recorded on the ex-dividend date.
6. Security Lending: The fund may lend its securities to qualified institutional borrowers to earn additional income. Security loans are required to be secured at all times by collateral at least equal to the market value of securities loaned. The fund invests cash collateral received in Vanguard Market Liquidity Fund, and records a liability for the return of the collateral, during the period the securities are on loan. Security lending income represents the income earned on investing cash collateral, less expenses associated with the loan.
7. Other: Dividend income is recorded on the ex-dividend date. Interest income includes income distributions received from Vanguard Market Liquidity Fund and is accrued daily. Security transactions are accounted for on the date securities are bought or sold. Costs used to determine realized gains (losses) on the sale of investment securities are those of the specific securities sold.
B. Baillie Gifford Overseas Ltd. and, beginning in January 2009, Jennison Associates LLC, each provide investment advisory services to a portion of the fund for fees calculated at an annual percentage rate of average net assets managed by the advisor. The basic fee of Baillie Gifford Overseas Ltd. is subject to quarterly adjustments based on performance since June 30, 2008, relative to the S&P 500 Index.
In accordance with the advisory contract entered into with Jennison Associates LLC in January 2009, beginning January 1, 2010, the investment advisory fee will be subject to quarterly adjustments based on performance since March 31, 2009, relative to the Russell 1000 Growth Index. Until January 2009, a portion of the fund was managed by Turner Investment Partners, LLC. The basic fee paid to Turner Investment Partners, LLC was subject to quarterly adjustments based on performance for the preceding three years relative to the Russell 1000 Growth Index.
The Vanguard Group manages the cash reserves of the fund on an at-cost basis.
For the year ended September 30, 2009, the aggregate investment advisory fee represented an effective annual basic rate of 0.27% of the fund’s average net assets, before a decrease of $474,000 (0.09%) based on performance.
C. The Vanguard Group furnishes at cost corporate management, administrative, marketing, and distribution services. The costs of such services are allocated to the fund under methods approved by the board of trustees. The fund has committed to provide up to 0.40% of its net assets in capital contributions to Vanguard. At September 30, 2009, the fund had contributed capital of $123,000 to Vanguard (included in Other Assets), representing 0.02% of the fund’s net assets and 0.05% of Vanguard’s capitalization. The fund’s trustees and officers are also directors and officers of Vanguard.
D. The fund has asked its investment advisors to direct certain security trades, subject to obtaining the best price and execution, to brokers who have agreed to rebate to the fund part of the commissions generated. Such rebates are used solely to reduce the fund’s management and administrative expenses. For the year ended September 30, 2009, these arrangements reduced the fund’s expenses by $168,000 (an annual rate of 0.03% of average net assets).
20
Growth Equity Fund
E. Various inputs may be used to determine the value of the fund’s investments. These inputs are summarized in three broad levels for financial statement purposes. The inputs or methodologies used to value securities are not necessarily an indication of the risk associated with investing in those securities.
Level 1—Quoted prices in active markets for identical securities.
Level 2—Other significant observable inputs (including quoted prices for similar securities, interest
rates, prepayment speeds, credit risk, etc.).
Level 3—Significant unobservable inputs (including the fund’s own assumptions used to determine
the fair value of investments).
The following table summarizes the fund’s investments as of September 30, 2009, based on the inputs used to value them:
| Level 1 | Level 2 | Level 3 | |
| Investments | ($000) | ($000) | ($000) |
| Common Stocks | 560,171 | — | — |
| Temporary Cash Investments | 27,431 | 4,996 | — |
| Futures Contracts—Liabilities1 | (43) | — | — |
| Total | 587,559 | 4,996 | — |
| 1 Represents variation margin on the last day of the reporting period. | |||
F. At September 30, 2009, the aggregate settlement value of open futures contracts and the related unrealized appreciation (depreciation) were:
| ($000) | ||||
| Number of | Aggregate | Unrealized | ||
| Long (Short) | Settlement | Appreciation | ||
| Futures Contracts | Expiration | Contracts | Value | (Depreciation) |
| S&P 500 Index | December 2009 | 90 | 23,690 | 707 |
Unrealized appreciation (depreciation) on open futures contracts is required to be treated as realized gain (loss) for tax purposes.
G. Distributions are determined on a tax basis and may differ from net investment income and realized capital gains for financial reporting purposes. Differences may be permanent or temporary. Permanent differences are reclassified among capital accounts in the financial statements to reflect their tax character. Temporary differences arise when certain items of income, expense, gain, or loss are recognized in different periods for financial statement and tax purposes; these differences will reverse at some time in the future. Differences in classification may also result from the treatment of short-term gains as ordinary income for tax purposes.
During the year ended September 30, 2009, the fund realized net foreign currency gains of $153,000, which increased distributable net income for tax purposes; accordingly, such gains have been reclassified from accumulated net realized losses to undistributed net investment income.
21
Growth Equity Fund
For tax purposes, at September 30, 2009, the fund had $3,612,000 of ordinary income available for distribution. The fund had available capital loss carryforwards totaling $538,056,000 to offset future net capital gains of $327,753,000 through September 30, 2010, $136,482,000 through September 30, 2011, and $73,821,000 through September 30, 2017. In addition, the fund realized losses of $156,681,000 during the period from November 1, 2008, through September 30, 2009, which are deferred and will be treated as realized for tax purposes in fiscal 2010.
At September 30, 2009, the cost of investment securities for tax purposes was $578,750,000. Net unrealized appreciation of investment securities for tax purposes was $13,848,000, consisting of unrealized gains of $57,722,000 on securities that had risen in value since their purchase and $43,874,000 in unrealized losses on securities that had fallen in value since their purchase.
H. During the year ended September 30, 2009, the fund purchased $496,733,000 of investment securities and sold $557,742,000 of investment securities, other than temporary cash investments.
I. Capital shares issued and redeemed were:
| Year Ended September 30, | ||
| 2009 | 2008 | |
| Shares | Shares | |
| (000) | (000) | |
| Issued | 12,991 | 34,487 |
| Issued in Lieu of Cash Distributions | 629 | 88 |
| Redeemed | (21,902) | (31,229) |
| Net Increase (Decrease) in Shares Outstanding | (8,282) | 3,346 |
J. In preparing the financial statements as of September 30, 2009, management considered the impact of subsequent events occurring through November 10, 2009, for potential recognition or disclosure in these financial statements.
22
Report of Independent Registered
Public Accounting Firm
To the Trustees of Vanguard Fenway Funds and the Shareholders of Vanguard Growth Equity Fund:
In our opinion, the accompanying statement of net assets and the related statements of operations and of changes in net assets and the financial highlights present fairly, in all material respects, the financial position of Vanguard Growth Equity Fund (the “Fund”) at September 30, 2009, the results of its operations for the year then ended, the changes in its net assets for each of the two years in the period then ended and the financial highlights for each of the five years in the period then ended, in conformity with accounting principles generally accepted in the United States of America. These financial statements and financial highlights (hereafter referred to as “financial statements”) are the responsibility of the Fund’s management; our responsibility is to express an opinion on these financial statements based on our audits. We conducted our audits of these financial statement s in accordance with the standards of the Public Company Accounting Oversight Board (United States). Those standards require that we plan and perform the audit to obtain reasonable assurance about whether the financial statements are free of material misstatement. An audit includes examining, on a test basis, evidence supporting the amounts and disclosures in the financial statements, assessing the accounting principles used and significant estimates made by management, and evaluating the overall financial statement presentation. We believe that our audits, which included confirmation of securities at September 30, 2009 by correspondence with the custodian and broker and by agreement to the underlying ownership records of Vanguard Market Liquidity Fund, provide a reasonable basis for our opinion.
PricewaterhouseCoopers LLP
Philadelphia, Pennsylvania
November 10, 2009

Special 2009 tax information (unaudited) for Vanguard Growth Equity Fund
This information for the fiscal year ended September 30, 2009, is included pursuant to provisions of
the Internal Revenue Code.
The fund distributed $4,464,000 of qualified dividend income to shareholders during the fiscal year.
For corporate shareholders, 100% of investment income (dividend income plus short-term gains,
if any) qualifies for the dividends-received deduction.
23
Your Fund’s After-Tax Returns
This table presents returns for your fund both before and after taxes. The after-tax returns are shown in two ways: (1) assuming that an investor owned the fund during the entire period and paid taxes on the fund’s distributions, and (2) assuming that an investor paid taxes on the fund’s distributions and sold all shares at the end of each period.
Calculations are based on the highest individual federal income tax and capital gains tax rates in effect at the times of the distributions and the hypothetical sales. State and local taxes were not considered. After-tax returns reflect any qualified dividend income, using actual prior-year figures and estimates for 2009. (In the example, returns after the sale of fund shares may be higher than those assuming no sale. This occurs when the sale would have produced a capital loss. The calculation assumes that the investor received a tax deduction for the loss.)
Please note that your actual after-tax returns will depend on your tax situation and may differ from those shown. Also note that if you own the fund in a tax-deferred account, such as an individual retirement account or a 401(k) plan, this information does not apply to you. Such accounts are not subject to current taxes.
Finally, keep in mind that a fund’s performance—whether before or after taxes—does not guarantee future results.
| Average Annual Total Returns: Growth Equity Fund1 | |||
| Periods Ended September 30, 2009 | |||
| One | Five | Ten | |
| Year | Years | Years | |
| Returns Before Taxes | –8.25% | 0.04% | –3.41% |
| Returns After Taxes on Distributions | –8.38 | 0.01 | –4.15 |
| Returns After Taxes on Distributions and Sale of Fund Shares | –5.25 | 0.03 | –3.01 |
1 Total returns do not include the account service fee that may be applicable to certain accounts with balances below $10,000.
24
About Your Fund’s Expenses
As a shareholder of the fund, you incur ongoing costs, which include costs for portfolio management, administrative services, and shareholder reports (like this one), among others. Operating expenses, which are deducted from a fund’s gross income, directly reduce the investment return of the fund.
A fund’s expenses are expressed as a percentage of its average net assets. This figure is known as the expense ratio. The following examples are intended to help you understand the ongoing costs (in dollars) of investing in your fund and to compare these costs with those of other mutual funds. The examples are based on an investment of $1,000 made at the beginning of the period shown and held for the entire period.
The accompanying table illustrates your fund’s costs in two ways:
• Based on actual fund return. This section helps you to estimate the actual expenses that you paid over the period. The “Ending Account Value” shown is derived from the fund’s actual return, and the third column shows the dollar amount that would have been paid by an investor who started with $1,000 in the fund. You may use the information here, together with the amount you invested, to estimate the expenses that you paid over the period.
To do so, simply divide your account value by $1,000 (for example, an $8,600 account value divided by $1,000 = 8.6), then multiply the result by the number given for your fund under the heading “Expenses Paid During Period.”
• Based on hypothetical 5% yearly return. This section is intended to help you compare your fund’s costs with those of other mutual funds. It assumes that the fund had a yearly return of 5% before expenses, but that the expense ratio is unchanged. In this case—because the return used is not the fund’s actual return—the results do not apply to your investment. The example is useful in making comparisons because the Securities and Exchange Commission requires all mutual funds to calculate expenses based on a 5% return. You can assess your fund’s costs by comparing this hypothetical example with the hypothetical examples that appear in shareholder reports of other funds.
| Six Months Ended September 30, 2009 | |||
| Beginning | Ending | Expenses | |
| Account Value | Account Value | Paid During | |
| Growth Equity Fund | 3/31/2009 | 9/30/2009 | Period1 |
| Based on Actual Fund Return | $1,000.00 | $1,299.09 | $3.11 |
| Based on Hypothetical 5% Yearly Return | 1,000.00 | 1,022.36 | 2.74 |
Note that the expenses shown in the table are meant to highlight and help you compare ongoing costs only and do not reflect transaction costs incurred by the fund for buying and selling securities. Further, the expenses do not include the account service fee described in the prospectus. If such a fee were applied to your account, your costs would be higher. Your fund does not charge transaction fees, such as purchase or redemption fees, nor does it carry a “sales load.”
1 The calculations are based on expenses incurred in the most recent six-month period. The fund’s annualized six-month expense ratio for
that period is 0.54%. The dollar amounts shown as “Expenses Paid” are equal to the annualized expense ratio multiplied by the average
account value over the period, multiplied by the number of days in the most recent six-month period, then divided by the number of days
in the most recent 12-month period.
25
The calculations assume no shares were bought or sold during the period. Your actual costs may have been higher or lower, depending on the amount of your investment and the timing of any purchases or redemptions.
You can find more information about the fund’s expenses, including annual expense ratios, in the Financial Statements section of this report. For additional information on operating expenses and other shareholder costs, please refer to your fund’s current prospectus.
26
Glossary
Beta. A measure of the magnitude of a fund’s past share-price fluctuations in relation to the ups and downs of a given market index. The index is assigned a beta of 1.00. Compared with a given index, a fund with a beta of 1.20 typically would have seen its share price rise or fall by 12% when the index rose or fell by 10%. For this report, beta is based on returns over the past 36 months for both the fund and the index. Note that a fund’s beta should be reviewed in conjunction with its R-squared (see definition). The lower the R-squared, the less correlation there is between the fund and the index, and the less reliable beta is as an indicator of volatility.
Earnings Growth Rate. The average annual rate of growth in earnings over the past five years for the stocks now in a fund.
Equity Exposure. A measure that reflects a fund’s investments in stocks and stock futures. Any holdings in short-term reserves are excluded.
Expense Ratio. The percentage of a fund’s average net assets used to pay its annual administrative and advisory expenses. These expenses directly reduce returns to investors.
Foreign Holdings. The percentage of a fund represented by stocks or depositary receipts of companies based outside the United States.
Inception Date. The date on which the assets of a fund (or one of its share classes) are first invested in accordance with the fund’s investment objective. For funds with a subscription period, the inception date is the day after that period ends. Investment performance is measured from the inception date.
Median Market Cap. An indicator of the size of companies in which a fund invests; the midpoint of market capitalization (market price x shares outstanding) of a fund’s stocks, weighted by the proportion of the fund’s assets invested in each stock. Stocks representing half of the fund’s assets have market capitalizations above the median, and the rest are below it.
Price/Book Ratio. The share price of a stock divided by its net worth, or book value, per share. For a fund, the weighted average price/book ratio of the stocks it holds.
Price/Earnings Ratio. The ratio of a stock’s current price to its per-share earnings over the past year. For a fund, the weighted average P/E of the stocks it holds. P/E is an indicator of market expectations about corporate prospects; the higher the P/E, the greater the expectations for a company’s future growth.
R-Squared. A measure of how much of a fund’s past returns can be explained by the returns from the market in general, as measured by a given index. If a fund’s total returns were precisely synchronized with an index’s returns, its R-squared would be 1.00. If the fund’s returns bore no relationship to the index’s returns, its R-squared would be 0. For this report, R-squared is based on returns over the past 36 months for both the fund and the index.
Return on Equity. The annual average rate of return generated by a company during the past five years for each dollar of shareholder’s equity (net income divided by shareholder’s equity). For a fund, the weighted average return on equity for the companies whose stocks it holds.
Short-Term Reserves. The percentage of a fund invested in highly liquid, short-term securities that can be readily converted to cash.
27
Turnover Rate. An indication of the fund’s trading activity. Funds with high turnover rates incur higher transaction costs and may be more likely to distribute capital gains (which may be taxable to investors). The turnover rate excludes in-kind transactions, which have minimal impact on costs.
Yield. A fund’s 30-day SEC yield is derived using a formula specified by the U.S. Securities and Exchange Commission. Under the formula, data related to the fund’s security holdings in the previous 30 days are used to calculate the fund’s hypothetical net income for that period, which is then annualized and divided by the fund’s estimated average net assets over the calculation period. For the purposes of this calculation, a security’s income is based on its current market yield to maturity (in the case of bonds) or its projected dividend yield (for stocks). Because the SEC yield represents hypothetical annualized income, it will differ—at times significantly—from the fund’s actual experience. As a result, the fund’s income distributions may be higher or lower than implied by the SEC y ield.
28
This page intentionally left blank.
The People Who Govern Your Fund
The trustees of your mutual fund are there to see that the fund is operated and managed in your best interests since, as a shareholder, you are a part owner of the fund. Your fund’s trustees also serve on the board of directors of The Vanguard Group, Inc., which is owned by the Vanguard funds and provides services to them on an at-cost basis.
A majority of Vanguard’s board members are independent, meaning that they have no affiliation with Vanguard or the funds they oversee, apart from the sizable personal investments they have made as private individuals. The independent board members have distinguished backgrounds in business, academia, and public service. Each of the trustees and executive officers oversees 156 Vanguard funds.
The following table provides information for each trustee and executive officer of the fund. More information about the trustees is in the Statement of Additional Information, which can be obtained, without charge, by contacting Vanguard at 800-662-7447, or online at www.vanguard.com.
| Interested Trustees | Emerson U. Fullwood |
| Born 1948. Trustee Since January 2008. Principal | |
| John J. Brennan1 | Occupation(s) During the Past Five Years: Executive |
| Born 1954. Trustee Since May 1987. Chairman of | Chief Staff and Marketing Officer for North America |
| the Board. Principal Occupation(s) During the Past | and Corporate Vice President (retired 2008) of Xerox |
| Five Years: Chairman of the Board and Director/Trustee | Corporation (photocopiers and printers); Director of |
| of The Vanguard Group, Inc., and of each of the | SPX Corporation (multi-industry manufacturing), the |
| investment companies served by The Vanguard Group; | United Way of Rochester, the Boy Scouts of America, |
| Chief Executive Officer (1996–2008) and President | Amerigroup Corporation (direct health and medical |
| (1989–2008) of The Vanguard Group and of each of the | insurance carriers), and Monroe Community College |
| investment companies served by The Vanguard Group; | Foundation. |
| Chairman of the Financial Accounting Foundation; | |
| Governor of the Financial Industry Regulatory Authority | Rajiv L. Gupta |
| (FINRA); Director of United Way of Southeastern | Born 1945. Trustee Since December 2001.2 Principal |
| Pennsylvania. | Occupation(s) During the Past Five Years: Chairman |
| and Chief Executive Officer (retired 2009) and President | |
| F. William McNabb III1 | (2006–2008) of Rohm and Haas Co. (chemicals); Board |
| Born 1957. Trustee Since July 2009. Principal | Member of American Chemistry Council; Director of |
| Occupation(s) During the Past Five Years: Director of | Tyco International, Ltd. (diversified manufacturing and |
| The Vanguard Group, Inc., since 2008; Chief Executive | services) and Hewlett-Packard Co. (electronic computer |
| Officer and President of The Vanguard Group and of | manufacturing); Trustee of The Conference Board. |
| each of the investment companies served by The | |
| Vanguard Group since 2008; Director of Vanguard | Amy Gutmann |
| Marketing Corporation; Managing Director of The | Born 1949. Trustee Since June 2006. Principal |
| Vanguard Group (1995–2008). | Occupation(s) During the Past Five Years: President of |
| the University of Pennsylvania; Christopher H. Browne | |
| Distinguished Professor of Political Science in the School | |
| Independent Trustees | of Arts and Sciences with secondary appointments |
| at the Annenberg School for Communication and the | |
| Charles D. Ellis | Graduate School of Education of the University of |
| Born 1937. Trustee Since January 2001. Principal | Pennsylvania; Director of Carnegie Corporation of |
| Occupation(s) During the Past Five Years: Applecore | New York, Schuylkill River Development Corporation, |
| Partners (pro bono ventures in education); Senior | and Greater Philadelphia Chamber of Commerce; |
| Advisor to Greenwich Associates (international business | Trustee of the National Constitution Center. |
| strategy consulting); Successor Trustee of Yale University; | |
| Overseer of the Stern School of Business at New York | |
| University; Trustee of the Whitehead Institute for | |
| Biomedical Research. |
| JoAnn Heffernan Heisen | Executive Officers | |
| Born 1950. Trustee Since July 1998. Principal | ||
| Occupation(s) During the Past Five Years: Corporate | Thomas J. Higgins1 | |
| Vice President and Chief Global Diversity Officer since | Born 1957. Chief Financial Officer Since September | |
| 2006 (retired 2008) and Member of the Executive | 2008. Principal Occupation(s) During the Past Five | |
| Committee (retired 2008) of Johnson & Johnson | Years: Principal of The Vanguard Group, Inc.; Chief | |
| (pharmaceuticals/consumer products); Vice President | Financial Officer of each of the investment companies | |
| and Chief Information Officer of Johnson & Johnson | served by The Vanguard Group since 2008; Treasurer | |
| (1997–2005); Director of the University Medical Center | of each of the investment companies served by The | |
| at Princeton and Women’s Research and Education | Vanguard Group (1998–2008). | |
| Institute. | ||
| Kathryn J. Hyatt1 | ||
| André F. Perold | Born 1955. Treasurer Since November 2008. Principal | |
| Born 1952. Trustee Since December 2004. Principal | Occupation(s) During the Past Five Years: Principal of | |
| Occupation(s) During the Past Five Years: George Gund | The Vanguard Group, Inc.; Treasurer of each of the | |
| Professor of Finance and Banking, Harvard Business | investment companies served by The Vanguard | |
| School; Chairman of UNX, Inc. (equities trading firm); | Group since 2008; Assistant Treasurer of each of the | |
| Chair of the Investment Committee of HighVista | investment companies served by The Vanguard Group | |
| Strategies LLC (private investment firm). | (1988–2008). | |
| Alfred M. Rankin, Jr. | Heidi Stam1 | |
| Born 1941. Trustee Since January 1993. Principal | Born 1956. Secretary Since July 2005. Principal | |
| Occupation(s) During the Past Five Years: Chairman, | Occupation(s) During the Past Five Years: Managing | |
| President, and Chief Executive Officer of NACCO | Director of The Vanguard Group, Inc., since 2006; | |
| Industries, Inc. (forklift trucks/housewares/lignite); | General Counsel of The Vanguard Group since 2005; | |
| Director of Goodrich Corporation (industrial products/ | Secretary of The Vanguard Group and of each of the | |
| aircraft systems and services); Deputy Chairman of | investment companies served by The Vanguard Group | |
| the Federal Reserve Bank of Cleveland. | since 2005; Director and Senior Vice President of | |
| Vanguard Marketing Corporation since 2005; Principal | ||
| Peter F. Volanakis | of The Vanguard Group (1997–2006). | |
| Born 1955. Trustee Since July 2009. Principal | ||
| Occupation(s) During the Past Five Years: President | ||
| since 2007 and Chief Operating Officer since 2005 | Vanguard Senior Management Team | |
| of Corning Incorporated (communications equipment); | ||
| President of Corning Technologies (2001–2005); Director | R. Gregory Barton | Michael S. Miller |
| of Corning Incorporated and Dow Corning; Trustee of | Mortimer J. Buckley | James M. Norris |
| the Corning Incorporated Foundation and the Corning | Kathleen C. Gubanich | Glenn W. Reed |
| Museum of Glass; Overseer of the Amos Tuck School | Paul A. Heller | George U. Sauter |
| of Business Administration at Dartmouth College. | ||
| Founder | ||
| John C. Bogle | ||
| Chairman and Chief Executive Officer, 1974–1996 | ||
1 These individuals are “interested persons” as defined in the Investment Company Act of 1940.
2 December 2002 for Vanguard Equity Income Fund, Vanguard Growth Equity Fund, the Vanguard Municipal Bond Funds, and the Vanguard
State Tax-Exempt Funds.

P.O. Box 2600
Valley Forge, PA 19482-2600
Connect with Vanguard® > www.vanguard.com
| Fund Information > 800-662-7447 | All comparative mutual fund data are from Lipper Inc. |
| or Morningstar, Inc., unless otherwise noted. | |
| Direct Investor Account Services > 800-662-2739 | |
| Institutional Investor Services > 800-523-1036 | You can obtain a free copy of Vanguard’s proxy voting |
| guidelines by visiting our website, www.vanguard.com, | |
| Text Telephone for People | and searching for “proxy voting guidelines,” or by |
| With Hearing Impairment > 800-749-7273 | calling Vanguard at 800-662-2739. The guidelines are |
| also available from the SEC’s website, www.sec.gov. | |
| In addition, you may obtain a free report on how your | |
| fund voted the proxies for securities it owned during | |
| the 12 months ended June 30. To get the report, visit | |
This material may be used in conjunction | either www.vanguard.com or www.sec.gov. |
| with the offering of shares of any Vanguard | |
| fund only if preceded or accompanied by | |
| the fund’s current prospectus. | You can review and copy information about your fund |
| at the SEC’s Public Reference Room in Washington, D.C. | |
| To find out more about this public service, call the SEC | |
| at 202-551-8090. Information about your fund is also | |
| available on the SEC’s website, and you can receive | |
| copies of this information, for a fee, by sending a | |
| request in either of two ways: via e-mail addressed to | |
| publicinfo@sec.gov or via regular mail addressed to the | |
| Public Reference Section, Securities and Exchange | |
| Commission, Washington, DC 20549-0102. | |
| © 2009 The Vanguard Group, Inc. | |
| All rights reserved. | |
| Vanguard Marketing Corporation, Distributor. | |
| Q5440 112009 | |
![]()
| Vanguard PRIMECAP Core Fund |
| Annual Report |
| September 30, 2009 |

> Vanguard PRIMECAP Core Fund returned about 1% for the 2009 fiscal year, while its comparative standards sustained losses.
> Information technology and consumer discretionary, two of the fund’s largest sectors, contributed the most to its success.
> Another large sector, health care, weighed on performance in part because of the uncertain outlook for health care reform.
| Contents | |
| Your Fund’s Total Returns | 1 |
| President’s Letter | 2 |
| Advisor’s Report | 7 |
| Results of Proxy Voting | 12 |
| Fund Profile | 13 |
| Performance Summary | 14 |
| Financial Statements | 15 |
| Your Fund’s After-Tax Returns | 25 |
| About Your Fund’s Expenses | 26 |
| Glossary | 28 |
Please note: The opinions expressed in this report are just that—informed opinions. They should not be considered promises or advice.
Also, please keep in mind that the information and opinions cover the period through the date on the front of this report. Of course, the
risks of investing in your fund are spelled out in the prospectus.
Cover photograph: Veronica Coia.
Your Fund’s Total Returns
| Fiscal Year Ended September 30, 2009 | ||
| Ticker | Total | |
| Symbol | Returns | |
| Vanguard PRIMECAP Core Fund | VPCCX | 1.45% |
| MSCI US Prime Market 750 Index | –6.28 | |
| Multi-Cap Core Funds Average1 | –4.30 |
| Your Fund’s Performance at a Glance | ||||
| September 30, 2008–September 30, 2009 | ||||
| Distributions Per Share | ||||
| Starting | Ending | Income | Capital | |
| Share Price | Share Price | Dividends | Gains | |
| Vanguard PRIMECAP Core Fund | $11.41 | $11.42 | $0.117 | $0.000 |
1 Derived from data provided by Lipper Inc.
1

President’s Letter
Dear Shareholder,
Stocks continued to fall steeply and broadly during the first half of the fiscal year, then dramatically turned around in mid-March as investors became more confident about credit markets and the economy. After losing almost one-quarter of its value in the first six months, Vanguard PRIMECAP Core Fund bounced back to return 1.45% for the year. Although modest in absolute terms, this performance was several percentage points ahead of the return of the fund’s benchmark and the average return of multi-capitalization core fund peers.
Amid the market’s remarkable inconsistency, the strategy followed by PRIMECAP Management Company, the fund’s advisor, was remarkably consistent—staying the course and sparing investors the worst of the downturn, then participating in the recovery. A heavy weighting in information technology and consumer discretionary stocks, a light investment in beleaguered financials, and good stock selection in all three sectors helped the fund outpace its benchmark index.
If you hold shares in a taxable account, you may wish to review the table and discussion on after-tax returns for the fiscal year, based on the highest tax bracket, later in this report.
Please note that effective August 14, 2009, the fund was closed to most new accounts. Existing shareholders may invest up to $25,000 annually.
2
After a precipitous fall stock markets rebound
In recent months, the financial markets have performed so strongly that it’s almost hard to remember that less than a year ago the global financial system stood on the brink of collapse. Since then, markets have pulled back from the abyss. Although unemployment remains near generational highs, and the prospects of a robust recovery seem dim, the global economy has begun to grind into gear.
Reminders of the markets’ dark days are nevertheless apparent in the index returns for both the past 12 months and the past three years. Over both periods, U.S. stocks recorded negative returns. Global stocks did better over the past 12 months, recouping their late-2008 losses thanks to
general strength in developed economies and a powerful rally in emerging markets. Over the past three years, however, international stocks posted a modestly negative return.
The bond market’s turnabout has been equally dramatic
The stock market’s collapse and recovery echo even more dramatic developments in the bond market. At the end of 2008, as the credit markets nearly ceased to function, the difference between the yields of corporate bonds and Treasury bonds spiked to levels last seen during the Great Depression.
The Federal Reserve and its central bank counterparts around the world responded with aggressive monetary stimulus efforts,
| Market Barometer | |||
| Average Annual Total Returns | |||
| Periods Ended September 30, 2009 | |||
| One Year | Three Years | Five Years | |
| Stocks | |||
| Russell 1000 Index (Large-caps) | –6.14% | –5.10% | 1.49% |
| Russell 2000 Index (Small-caps) | –9.55 | –4.57 | 2.41 |
| Dow Jones U.S. Total Stock Market Index | –5.83 | –4.58 | 1.93 |
| MSCI All Country World Index ex USA (International) | 6.43 | –0.78 | 8.59 |
| Bonds | |||
| Barclays Capital U.S. Aggregate Bond Index | |||
| (Broad taxable market) | 10.56% | 6.41% | 5.13% |
| Barclays Capital Municipal Bond Index | 14.85 | 5.13 | 4.78 |
| Citigroup 3-Month Treasury Bill Index | 0.39 | 2.63 | 2.96 |
| CPI | |||
| Consumer Price Index | –1.29% | 2.10% | 2.61% |
3
while global governments opened the fiscal taps. Investors first tiptoed, then stampeded, back into the market, boosting bond prices and bringing down yields. Over the past 12 months, taxable U.S. bonds returned more than 10%; municipal securities did even better, returning almost 15%, as measured by the Barclays Capital Municipal Bond Index.
The Fed’s rescue campaign has imposed a heavy price on short-term savings vehicles such as money market funds. In December 2008, the Fed reduced its target for the federal funds rate, a benchmark for the interest rates paid by money market instruments and other very short-term securities, to between
0% and 0.25%. The Fed has said it expects to maintain its target at this level “for an extended period.”
Long-term focus reaps rewards across cycles
PRIMECAP seeks to identify companies that appear out of favor and are expected to outperform the market over a three-to-five-year investment horizon. Since the launch of the PRIMECAP Core Fund almost five years ago, this strategy has produced a portfolio whose composition and performance differ—sometimes significantly—from those of its benchmark index and peers. Of course, the advisor’s decisions can’t be expected to generate superior returns in all market cycles, so it’s important to keep a long-term perspective when evaluating this fund.
| Expense Ratios1 | ||
| Your Fund Compared With Its Peer Group | ||
| Multi-Cap | ||
| Core Funds | ||
| Fund | Average | |
| PRIMECAP Core Fund | 0.55% | 1.18% |
1 The fund expense ratio shown is from the prospectus dated January 15, 2009, and represents estimated costs for the current fiscal year based on the fund’s net assets as of the prospectus date. For the fiscal year ended September 30, 2009, the fund’s expense ratio was 0.54%. The peer-group expense ratio is derived from data provided by Lipper Inc. and captures information through year-end 2008.
4
For example, a year ago, the fund’s heavy commitment to economically sensitive information technology and consumer discretionary companies accounted for almost two-thirds of the fund’s decline. This year, however, those companies added more than 7 percentage points to the fund’s return, helping to underscore the importance of a patient strategy.
Tech stocks were a consistent strength for the fund in the 2009 fiscal year—relatively resilient during the downturn, and robust during the rally. Among the standout contributors for the year were ASML Holding (a Netherlands-based supplier of lithography systems used in microchip manufacturing), Flextronics International (a provider of design, engineering, and manufacturing
services for electronic products), Google, and EMC (a provider of technologies to manage and protect information).
Consumer discretionary stocks became a bright spot when consumer confidence turned the corner. A strong second-half comeback—and the advisor’s successful stock selection—produced a double-digit 12-month gain for this sector in the fund, compared with a very modest gain in the benchmark. A variety of retailers—including Bed Bath & Beyond, Amazon.com, CarMax, and off-price apparel merchant The TJX Companies—were among the leading contributors.
In contrast, the health care sector—after holding up relatively well during the market’s steep decline—remained in
| Total Returns | |
| December 9, 2004,1 Through September 30, 2009 | |
| Average | |
| Annual Return | |
| PRIMECAP Core Fund | 4.15% |
| MSCI US Prime Market 750 Index | 0.27 |
| Multi-Cap Core Funds Average2 | –0.08 |
The figures shown represent past performance, which is not a guarantee of future results. (Current performance may be lower or higher than the performance data cited. For performance data current to the most recent month-end, visit our website at www.vanguard.com/performance.) Note, too, that both investment returns and principal value can fluctuate widely, so an investor’s shares, when sold, could be worth more or less than their original cost.
1 Fund inception.
2 Derived from data provided by Lipper Inc.
5
negative territory for the year (in both the fund and its benchmark). The fund had some successes among biotechnology firms. But the gains were overshadowed by declines in major pharmaceutical makers—including top-ten holdings Novartis and Eli Lilly—partly reflecting uncertainty surrounding the ongoing debate over health care reform, the movement toward generic drugs, and concerns about the industry’s ability to develop new drugs. Medical-device maker Medtronic, also a top-ten holding, sustained double-digit losses.
For more on the advisor’s strategy and outlook, please see the Advisor’s Report following this letter.
Old-fashioned precepts still work in today’s markets
Stocks have taken investors on a roller-coaster ride over the last two years. After soaring to record highs in October 2007, the U.S. stock market in 2008 suffered its worst calendar year since the 1930s, before turning around this past spring. Investors were given a strong dose of reality—not only by the volatile stock market but also by the demise of some major financial institutions and the persistence of the longest recession in seven decades.
Now that the markets and the economy have pulled back from the brink, it’s a good opportunity for you to reevaluate
your long-term investment objectives, time frame, and risk tolerance, and to make sure your investment plan is still appropriate. Remember that patience is often rewarded: Many investors who did not panic and sell out as stocks sank have recovered a substantial share of their paper losses.
The old-fashioned principles of discipline, patience, and taking a long-term view have been key to the growth-oriented investment strategy of PRIMECAP Core Fund’s advisor—and to the fund’s success for almost five years. The fund’s low costs help shareholders keep more of the returns, a benefit that can compound over time and help the fund play a valuable role within a diversified portfolio.
Thank you for entrusting your assets to Vanguard.
Sincerely,

F. William McNabb III
President and Chief Executive Officer
October 15, 2009
6
Advisor’s Report
For the fiscal year ended September 30, Vanguard PRIMECAP Core Fund returned 1.45%, outpacing the –4.30% average return of multi-capitalization core funds and the –6.28% return of the MSCI US Prime Market 750 Index. Our outsized investment and favorable stock selection in information technology—the fund’s largest sector at September 30—and in consumer discretionary stocks boosted performance.
Investment environment
The turmoil in the financial markets that began in the summer of 2007 intensified last fall following the failure of Lehman Brothers and the government rescue of AIG. The capital markets were effectively frozen, with the exception of government-guaranteed programs, through the early months of 2009 because of concerns about the solvency of major financial institutions, widening credit spreads, and uncertainty about the valuation of financial assets. The resulting lack of availability of credit as well as general fears of a further collapse of the financial system contributed to a dramatic decline in economic activity.
In an effort to restore confidence and trust in the financial markets, the U.S. government initiated massive fiscal and monetary stimulus programs along with numerous facilities to guarantee investments in commercial paper, bank debt, and other securities. These actions began to take hold and investor sentiment began to improve in March. This turnaround was evident not only in the dramatic stock market rally that ensued—
which was led by lower-quality, higher-risk stocks—but also in the return of investors’ appetite for risk in the bond markets. Credit spreads above the yields on U.S. Treasury bonds began falling to more normal levels, leading to strong performance for corporate bonds—especially high-yield bonds—at the expense of Treasuries.
Despite improvement in the short-term funding markets, access to credit has remained difficult for many consumers and businesses. Banks and other financial institutions continued to experience mounting credit losses from loans and securities that were originated during an extended period of underpriced risk and excessive leverage. For example, the Federal Deposit Insurance Corporation’s list of problem banks rose above 400 at the end of June, the highest number since 1994.
There are, however, encouraging signs that the economy is emerging from recession: Real gross domestic product (GDP) has been shrinking at a slower rate. (On October 29, the preliminary report for third-quarter GDP showed growth for the first time in more than a year.) Still, unemployment and home foreclosures have continued to rise, and consumer and business spending has remained weak.
From its peak in October 2007 through March 2009, the S&P 500 experienced the largest market decline since the Great Depression, a reflection of investors’
7
anxiety about the failing global economy. Since early March, however, the S&P 500 has rebounded sharply on signs that the financial markets are stabilizing and that the decline in economic activity has slowed. As a result of the market’s dramatic rally, we believe that equity investment opportunities are no longer as compelling as they were earlier this year, but we continue to find promising stocks into which we can deploy capital.
Management of the fund
We have not wavered in our investment objective or strategy throughout the large swings in the stock market over the past 18 months: We seek to find companies whose long-term fundamentals will, in our estimation, evolve significantly better than current valuation suggests. We rely on rigorous fundamental research and meet not only with company management but also with competitors, suppliers, and customers—to help identify potential opportunities and to reassess our conviction in our holdings. And we invest with a long-term perspective, in the expectation that over a three- to five-year horizon, our selections will outperform the market.
Since the fund’s inception almost five years ago, we have established significant investments in technology and health care stocks. Together, these two sectors represented more than half of the fund’s assets, on average, during the year, compared with less than one-third of the benchmark.
In technology, we are particularly enthusiastic about the growth opportunities represented by trends in mobile broadband communications. The global population of broadband users continues to grow; at the same time, the mix of users continues to shift to mobile devices from fixed-line equipment. Traffic growth is accelerated further by the increased demand for data transmission in addition to voice. The world’s developing countries are expected to continue to adopt broadband and to become more reliant on mobile devices such as smart phones and netbook computers.
The fund has invested in several companies that should benefit from the anticipated growth in broadband usage as well as the growth in software applications, e-commerce, and other activities that should result from this broad shift in the behavior of consumers and businesses throughout the world. Texas Instruments, Ericsson, and QUALCOMM are expected to benefit from the growth in mobile devices, networks, and communications infrastructure. Google and Amazon.com are well positioned in Internet advertising and e-commerce, respectively, two areas that are expected to experience rapid growth with more mobile broadband subscribers and expanded usage of the Internet. Oracle, Microsoft, and EMC provide many of the software applications and data storage systems needed to support the increased Internet activity enabled by mobile broadband. During the year, we opportunistically increased our stake in
8
most of these companies—notably Ericsson and Motorola—and we established a position in Hewlett-Packard.
For the year, the technology sector—representing about one-quarter of fund assets, on average, during the fiscal year—was the leading contributor to the fund’s absolute and relative performance. Among our most successful holdings were ASML Holding (+70%), a Netherlands-based maker of lithography systems used to manufacture integrated circuits; Google (+24%); Flextronics International (+6%), a provider of design and electronics manufacturing services; and EMC (+42%), a provider of data management services.
In the health care sector, our investment thesis is based on global demographic trends and a belief in the power of science. The demand for health care will continue to grow given the growth in worldwide population, increasing life expectancy, and the rapid increase in income in developing countries such as China and India. At the same time, scientific developments such as the sequencing of the human genome earlier this decade are expected to lead to the development of new drugs, medical devices, and other treatments. We are particularly excited about the potential for more customized treatments for diseases and other ailments.
Consistent with these themes, our five largest holdings at September 30, 2009, were pharmaceutical firms Amgen, Eli Lilly, Novartis, and Roche Holdings, plus
medical-device maker Medtronic. Among these five companies, only Roche (+7%) and Amgen (+2%) posted positive total returns for the fiscal year. In March, Switzerland-based Roche completed its acquisition of Genentech, while Amgen has been awaiting Food and Drug Administration (FDA) approval of a biologics license application for Denosumab, a new treatment for osteoporosis and certain forms of cancer. (On October 19, the FDA requested additional information from Amgen, postponing a final approval decision.) Unlike some other major drug makers, Amgen does not face the expiration of major patents, and we believe the company has a solid pipeline of future drugs that may be brought to market.
Eli Lilly (–21%) does face patent expirations and has suffered setbacks with two drugs in late-stage clinical trials this year. In July, the FDA gave final approval to Eli Lilly’s blood thinner Prasugrel (which will be marketed in the United States as Effient), but the drug’s rollout has been slower than anticipated. We believe that these challenges are fully reflected in Eli Lilly’s stock price; the stock trades at less than eight times earnings. We remain optimistic about the company’s long-term prospects. For example, significant resources are being invested in research and development of protein inhibitors that may prove successful in treating Alzheimer’s disease.
The valuation of Medtronic (–25%) fell to its lowest level in about two decades—in part because of integration issues related to the company’s November 2007
9
acquisition of Kyphon, which specialized in spinal treatments. Spinal therapies are among the fastest-growing areas in orthopedics. We believe Medtronic is well positioned there, and in solutions for cardiac rhythm management, diabetes, and neurological diseases.
Overall, the health care sector weighed on the fund’s performance for the year, especially in the second half. Both Eli Lilly and Medtronic were among the notable detractors. During the year, we selectively increased our position in each of the fund’s top five health care holdings.
We had mixed results in two sectors that are more sensitive to economic cycles: success in consumer discretionary but disappointment in industrials. Some of the best contributors were: Bed Bath & Beyond (+20%); Amazon.com (+28%); The TJX Companies (+24%), owners of off-price retailers T.J. Maxx and Marshalls; and CarMax (+49%), which has gained market share, benefiting from used-car demand and the fragmented nature of the dealer network. We increased our holdings in each of these companies, especially in Bed Bath & Beyond—which we regard as well managed and well capitalized—where we took advantage of a buying opportunity created by the inventory liquidation of a bankrupt competitor.
In industrials, several of our holdings struggled amid the sluggish economy and weak demand, including United Parcel Service (–7%) and FedEx (–4%), plus
Southwest Airlines (–34%) and American Airlines’ parent AMR (–19%). We increased our position in each of these companies based on the strength of their brands. Southwest Airlines, one of the notable detractors from the fund’s performance, was one of our largest purchases for the year. We also increased our holdings of Boeing, which continued to face delays with its new 787 “Dreamliner” aircraft, and we established a position in C.H. Robinson Worldwide—a produce-sourcing and transport and logistics company.
In the materials sector, our holdings of Monsanto and Potash Corp. of Saskat-chewan struggled, after major gains in fiscal years 2007 and 2008. Year-over-year, we raised our stake in both companies, although we selectively sold shares during the year. And we continue to underweight the financial sector overall as we remain concerned about the deleveraging process throughout the financial system, the ongoing credit issues faced by many financial institutions, and the prospect of tighter regulation and oversight.
Outlook
Looking beyond the collective sigh of relief that the economy and credit markets appear to have averted disaster, it is difficult to predict the future course of the economy and the markets. Although we do not know whether the economic recovery will be U-shaped, W-shaped, or otherwise, we expect the economy will begin to grow modestly in what is likely to be the most notably jobless recovery in
10
generations. On balance, our outlook for the rest of 2009 and into 2010 remains uncertain but cautiously optimistic.
We see two potential areas of concern stemming from the fiscal and monetary policy actions undertaken to avert disaster: inflation risk and the unintended consequences of the increased government involvement in the private sector. While near-term inflation appears not to be a threat, the longer-term effects of the massive economic stimulus could portend future price pressure and continued weakness in the U.S. dollar.
We are also concerned about the government’s significantly expanded role in owning and/or overseeing financial institutions and private industry (for example, the auto industry), and the potential impact of this involvement on entrepreneurship and productivity growth in the future. We believe that,
over time, scarce economic resources such as capital and labor are better allocated by free markets than by regulations and other government involvement.
Although the outcome of the ongoing debate over health care reform remains unknown, the outline of a possible consensus has been emerging recently. It appears that final legislation will not be as sweeping as initially anticipated, and that price controls are unlikely—at least in the near future. Our biotech holdings are intrinsically less vulnerable to health care reform, and it is possible that pharmaceutical companies could benefit as several million uninsured Americans gain access to health insurance.
As has been the case for several years, we remain enthusiastic about our holdings and their potential to deliver superior performance going forward.
| Joel P. Fried | Howard B. Schow | |
| Portfolio Manager | Portfolio Manager | |
| Theo A. Kolokotrones | ||
| Portfolio Manager | ||
| Mitchell J. Milias | Alfred W. Mordecai | |
| Portfolio Manager | Portfolio Manager | |
| David H. Van Slooten | ||
| Portfolio Manager | ||
PRIMECAP Management Company October 30, 2009
11
Results of Proxy Voting
At a special meeting of shareholders on July 2, 2009, fund shareholders approved the following two proposals:
Proposal 1—Elect trustees for each fund.*
The individuals listed in the table below were elected as trustees for each fund. All trustees with the exception of Messrs. McNabb and Volanakis (both of whom already served as directors of The Vanguard Group, Inc.) served as trustees to the funds prior to the shareholder meeting.
| Percentage | |||
| Trustee | For | Withheld | For |
| John J. Brennan | 381,461,550 | 10,736,721 | 97.3% |
| Charles D. Ellis | 375,348,055 | 16,850,216 | 95.7% |
| Emerson U. Fullwood | 377,280,677 | 14,917,594 | 96.2% |
| Rajiv L. Gupta | 381,215,106 | 10,983,165 | 97.2% |
| Amy Gutmann | 381,699,062 | 10,499,209 | 97.3% |
| JoAnn Heffernan Heisen | 381,602,478 | 10,595,793 | 97.3% |
| F. William McNabb III | 381,115,414 | 11,082,857 | 97.2% |
| André F. Perold | 377,090,732 | 15,107,539 | 96.1% |
| Alfred M. Rankin, Jr. | 381,547,990 | 10,650,281 | 97.3% |
| Peter F. Volanakis | 381,683,908 | 10,514,362 | 97.3% |
| * Results are for all funds within the same trust. |
Proposal 2—Update and standardize the funds’ fundamental policies regarding:
(a) Purchasing and selling real estate.
(b) Issuing senior securities.
(c) Borrowing money.
(d) Making loans.
(e) Purchasing and selling commodities.
(f) Concentrating investments in a particular industry or group of industries.
(g) Eliminating outdated fundamental investment policies not required by law.
The revised fundamental policies are clearly stated and simple, yet comprehensive, making oversight and compliance more efficient than under the former policies. The revised fundamental policies will allow the funds to respond more quickly to regulatory and market changes, while avoiding the costs and delays associated with successive shareholder meetings.
| Broker | Percentage | ||||
| PRIMECAP Core Fund | For | Abstain | Against | Non-Votes | For |
| 2a | 185,999,668 | 3,735,418 | 8,311,135 | 22,251,962 | 84.4% |
| 2b | 186,465,785 | 4,260,066 | 7,320,370 | 22,251,962 | 84.6% |
| 2c | 184,794,390 | 4,048,117 | 9,203,715 | 22,251,961 | 83.9% |
| 2d | 183,712,956 | 4,081,162 | 10,252,104 | 22,251,961 | 83.4% |
| 2e | 185,388,014 | 3,970,851 | 8,687,358 | 22,251,960 | 84.2% |
| 2f | 186,485,595 | 4,025,525 | 7,535,099 | 22,251,963 | 84.7% |
| 2g | 188,171,113 | 4,424,614 | 5,450,493 | 22,251,962 | 85.4% |
12
PRIMECAP Core Fund
Fund Profile
As of September 30, 2009
| Portfolio Characteristics | ||
| Comparative | ||
| Fund | Index1 | |
| Number of Stocks | 141 | 755 |
| Median Market Cap | $27.6B | $34.4B |
| Price/Earnings Ratio | 34.6x | 25.2x |
| Price/Book Ratio | 2.7x | 2.2x |
| Yield2 | 0.8% | 2.0% |
| Return on Equity | 19.6% | 20.1% |
| Earnings Growth Rate | 11.6% | 10.1% |
| Foreign Holdings | 15.4% | 0.0% |
| Turnover Rate | 5% | — |
| Expense Ratio3 | 0.55% | — |
| Short-Term Reserves | 6.9% | — |
| Sector Diversification (% of equity exposure) | ||
| Comparative | ||
| Fund | Index1 | |
| Consumer Discretionary | 14.3% | 9.5% |
| Consumer Staples | 1.7 | 10.7 |
| Energy | 6.9 | 11.8 |
| Financials | 5.3 | 15.4 |
| Health Care | 23.9 | 12.9 |
| Industrials | 14.6 | 10.4 |
| Information Technology | 25.3 | 18.7 |
| Materials | 7.1 | 3.7 |
| Telecommunication Services | 0.3 | 3.1 |
| Utilities | 0.6 | 3.8 |
| Volatility Measures4 | |
| Fund Versus | |
| Comparative Index1 | |
| R-Squared | 0.94 |
| Beta | 0.93 |
| Ten Largest Holdings5 (% of total net assets) | ||
| Amgen Inc. | biotechnology | 4.1% |
| Eli Lilly & Co. | pharmaceuticals | 3.1 |
| Novartis AG ADR | pharmaceuticals | 2.8 |
| Roche Holdings AG | pharmaceuticals | 2.8 |
| Medtronic Inc. | health care | |
| equipment | 2.2 | |
| Marsh & McLennan | ||
| Cos. Inc. | insurance brokers | 2.0 |
| Bed Bath & Beyond Inc. | home furnishing | |
| retail | 2.0 | |
| Southwest Airlines Co. | airlines | 2.0 |
| Google Inc. Class A | Internet software | |
| and services | 1.9 | |
| Oracle Corp. | systems software | 1.9 |
| Top Ten | 24.8% | |
Investment Focus
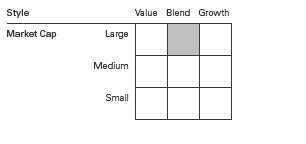
1 MSCI US Prime Market 750 Index.
2 30-day SEC yield for the fund; annualized dividend yield for the index. See the Glossary.
3 The expense ratio shown is from the prospectus dated January 15, 2009, and represents estimated costs for the current fiscal year based
on the fund’s net assets as of the prospectus date. For the fiscal year ended September 30, 2009, the expense ratio was 0.54%.
4 For an explanation of R-squared, beta, and other terms used here, see the Glossary.
5 The holdings listed exclude any temporary cash investments and equity index products.
13
PRIMECAP Core Fund
Performance Summary
All of the returns in this report represent past performance, which is not a guarantee of future results that may be achieved by the fund. (Current performance may be lower or higher than the performance data cited. For performance data current to the most recent month-end, visit our website at www.vanguard.com/performance.) Note, too, that both investment returns and principal value can fluctuate widely, so an investor’s shares, when sold, could be worth more or less than their original cost. The returns shown do not reflect taxes that a shareholder would pay on fund distributions or on the sale of fund shares.
Cumulative Performance: December 9, 2004–September 30, 2009
Initial Investment of $10,000
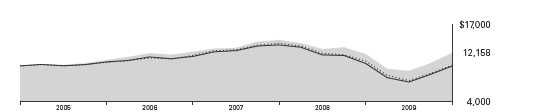
| Average Annual Total Returns | Final Value | ||
| Periods Ended September 30, 2009 | of a $10,000 | ||
| One Year | Since Inception1 | Investment | |
| PRIMECAP Core Fund2 | 1.45% | 4.15% | $12,158 |
| MSCI US Prime Market 750 Index | –6.28 | 0.27 | 10,130 |
| Multi-Cap Core Funds Average3 | –4.30 | –0.08 | 9,963 |
Fiscal-Year Total Returns (%): December 9, 2004–September 30, 2009
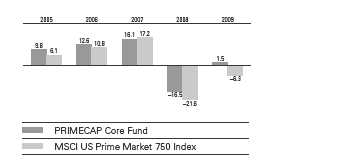
1 Performance for the fund and its comparative standards is calculated since the fund’s inception: December 9, 2004.
2 Total return figures do not include the 1% fee assessed on redemptions of shares held less than one year, or the account service fee that
may be applicable to certain accounts with balances below $10,000.
3 Derived from data provided by Lipper Inc.
Note: See Financial Highlights table for dividend and capital gains information.
14
PRIMECAP Core Fund
Financial Statements
Statement of Net Assets
As of September 30, 2009
The fund reports a complete list of its holdings in regulatory filings four times in each fiscal year, at the quarter-ends. For the second and fourth fiscal quarters, the lists appear in the fund’s semiannual and annual reports to shareholders. For the first and third fiscal quarters, the fund files the lists with the Securities and Exchange Commission on Form N-Q. Shareholders can look up the fund’s Forms N-Q on the SEC’s website at www.sec.gov. Forms N-Q may also be reviewed and copied at the SEC’s Public Reference Room (see the back cover of this report for further information).
| Market | |||
| Value• | |||
| Shares | ($000) | ||
| Common Stocks (93.3%) | |||
| Consumer Discretionary (13.3%) | |||
| * | Bed Bath & Beyond Inc. | 2,308,091 | 86,646 |
| Whirlpool Corp. | 918,200 | 64,237 | |
| TJX Cos. Inc. | 1,375,725 | 51,108 | |
| Sony Corp. ADR | 1,700,000 | 49,640 | |
| * | Kohl’s Corp. | 858,700 | 48,989 |
| * | Amazon.com Inc. | 490,000 | 45,746 |
| * | CarMax Inc. | 2,020,000 | 42,218 |
| * | DIRECTV Group Inc. | 1,383,325 | 38,152 |
| Walt Disney Co. | 1,245,000 | 34,188 | |
| Mattel Inc. | 1,305,200 | 24,094 | |
| Target Corp. | 396,250 | 18,497 | |
| Best Buy Co. Inc. | 442,600 | 16,606 | |
| Nordstrom Inc. | 440,400 | 13,450 | |
| * | Chico’s FAS Inc. | 850,000 | 11,050 |
| Carnival Corp. | 220,000 | 7,322 | |
| Lowe’s Cos. Inc. | 317,000 | 6,638 | |
| * | Viacom Inc. Class B | 100,000 | 2,804 |
| * | Expedia Inc. | 108,250 | 2,593 |
| Eastman Kodak Co. | 300,000 | 1,434 | |
| * | HSN Inc. | 21,650 | 352 |
| * | Ticketmaster | ||
| Entertainment Inc. | 21,650 | 253 | |
| 566,017 | |||
| Consumer Staples (1.6%) | |||
| Kellogg Co. | 558,000 | 27,470 | |
| Procter & Gamble Co. | 300,000 | 17,376 | |
| Avon Products Inc. | 340,000 | 11,547 | |
| Costco Wholesale Corp. | 100,000 | 5,646 | |
| Sysco Corp. | 200,000 | 4,970 | |
| 67,009 | |||
| Energy (6.4%) | |||
| Schlumberger Ltd. | 1,019,100 | 60,738 | |
| EOG Resources Inc. | 509,000 | 42,507 | |
| * | National Oilwell Varco Inc. | 895,000 | 38,601 |
| EnCana Corp. | 634,000 | 36,525 | |
| * | Southwestern Energy Co. | 450,000 | 19,206 |
| Cabot Oil & Gas Corp. | 490,000 | 17,517 | |
| Market | |||
| Value• | |||
| Shares | ($000) | ||
| Noble Energy Inc. | 160,000 | 10,554 | |
| Murphy Oil Corp. | 167,000 | 9,614 | |
| Peabody Energy Corp. | 240,000 | 8,933 | |
| ConocoPhillips | 180,000 | 8,129 | |
| * | Transocean Ltd. | 55,000 | 4,704 |
| * | Exterran Holdings Inc. | 185,000 | 4,392 |
| * | Pride International Inc. | 115,000 | 3,501 |
| Petroleo Brasileiro SA ADR | |||
| Series A | 80,000 | 3,145 | |
| Petroleo Brasileiro SA ADR | 36,100 | 1,657 | |
| Noble Corp. | 20,000 | 759 | |
| Arch Coal Inc. | 20,000 | 443 | |
| * | Seahawk Drilling Inc. | 8,766 | 272 |
| 271,197 | |||
| Financials (5.0%) | |||
| Marsh & McLennan | |||
| Cos. Inc. | 3,504,000 | 86,654 | |
| * | Berkshire Hathaway Inc. | ||
| Class B | 13,600 | 45,193 | |
| Chubb Corp. | 540,000 | 27,221 | |
| Discover Financial Services | 1,306,400 | 21,203 | |
| Wells Fargo & Co. | 550,000 | 15,499 | |
| * | Progressive Corp. | 560,000 | 9,285 |
| Bank of New York | |||
| Mellon Corp. | 216,982 | 6,290 | |
| * | Tree.com Inc. | 3,608 | 27 |
| 211,372 | |||
| Health Care (22.3%) | |||
| * | Amgen Inc. | 2,902,000 | 174,787 |
| Eli Lilly & Co. | 4,022,000 | 132,847 | |
| Novartis AG ADR | 2,373,600 | 119,582 | |
| Roche Holdings AG | 733,800 | 118,647 | |
| Medtronic Inc. | 2,482,000 | 91,338 | |
| GlaxoSmithKline PLC ADR | 1,530,400 | 60,466 | |
| * | Boston Scientific Corp. | 5,546,300 | 58,735 |
| * | Waters Corp. | 945,000 | 52,788 |
| * | Biogen Idec Inc. | 1,039,400 | 52,510 |
| Johnson & Johnson | 440,000 | 26,792 | |
| Wyeth | 495,000 | 24,047 | |
15
PRIMECAP Core Fund
| Market | |||
| Value• | |||
| Shares | ($000) | ||
| Sanofi-Aventis SA ADR | 613,000 | 22,650 | |
| * | Sepracor Inc. | 190,400 | 4,360 |
| * | Cerner Corp. | 36,000 | 2,693 |
| * | Illumina Inc. | 45,000 | 1,913 |
| * | Genzyme Corp. | 9,100 | 516 |
| 944,671 | |||
| Industrials (13.7%) | |||
| Southwest Airlines Co. | 8,775,025 | 84,240 | |
| Boeing Co. | 1,480,700 | 80,180 | |
| United Parcel Service Inc. | |||
| Class B | 1,153,615 | 65,145 | |
| FedEx Corp. | 711,200 | 53,496 | |
| Honeywell | |||
| International Inc. | 1,381,000 | 51,304 | |
| * | McDermott | ||
| International Inc. | 1,700,000 | 42,959 | |
| Caterpillar Inc. | 748,950 | 38,444 | |
| Expeditors International | |||
| of Washington Inc. | 884,000 | 31,073 | |
| * | AMR Corp. | 3,262,740 | 25,939 |
| Union Pacific Corp. | 328,150 | 19,148 | |
| Norfolk Southern Corp. | 417,700 | 18,007 | |
| CH Robinson | |||
| Worldwide Inc. | 310,000 | 17,903 | |
| Canadian Pacific | |||
| Railway Ltd. | 231,430 | 10,819 | |
| Rockwell | |||
| Automation Inc. | 250,000 | 10,650 | |
| Burlington Northern | |||
| Santa Fe Corp. | 100,000 | 7,983 | |
| Avery Dennison Corp. | 120,000 | 4,321 | |
| Deere & Co. | 100,000 | 4,292 | |
| Goodrich Corp. | 77,500 | 4,211 | |
| Cummins Inc. | 93,700 | 4,199 | |
| Chicago Bridge & | |||
| Iron Co. NV | 166,870 | 3,117 | |
| SPX Corp. | 20,000 | 1,225 | |
| 3M Co. | 13,000 | 959 | |
| 579,614 | |||
| Information Technology (23.6%) | |||
| * | Google Inc. Class A | 165,000 | 81,815 |
| Oracle Corp. | 3,896,500 | 81,203 | |
| ASML Holding NV | 2,700,345 | 79,849 | |
| * | Intuit Inc. | 2,610,000 | 74,385 |
| * | Flextronics | ||
| International Ltd. | 7,965,000 | 59,419 | |
| Texas Instruments Inc. | 2,470,000 | 58,514 | |
| * | EMC Corp. | 3,263,000 | 55,602 |
| Telefonaktiebolaget LM | |||
| Ericsson ADR | 5,340,000 | 53,507 | |
| Microsoft Corp. | 1,924,900 | 49,836 | |
| * | SanDisk Corp. | 2,219,500 | 48,163 |
| * | Symantec Corp. | 2,281,800 | 37,581 |
| Market | |||
| Value• | |||
| Shares | ($000) | ||
| Intel Corp. | 1,884,700 | 36,884 | |
| QUALCOMM Inc. | 819,500 | 36,861 | |
| Applied Materials Inc. | 2,271,000 | 30,431 | |
| Altera Corp. | 1,480,000 | 30,355 | |
| Corning Inc. | 1,980,800 | 30,326 | |
| * | Research In Motion Ltd. | 448,600 | 30,303 |
| * | Electronic Arts Inc. | 1,451,100 | 27,643 |
| Motorola Inc. | 1,775,000 | 15,247 | |
| * | Accenture PLC Class A | 380,500 | 14,181 |
| KLA-Tencor Corp. | 393,000 | 14,093 | |
| * | Cisco Systems Inc. | 481,600 | 11,337 |
| Hewlett-Packard Co. | 200,000 | 9,442 | |
| * | eBay Inc. | 304,600 | 7,192 |
| * | Yahoo! Inc. | 375,000 | 6,679 |
| * | Adobe Systems Inc. | 195,400 | 6,456 |
| * | NVIDIA Corp. | 320,000 | 4,810 |
| * | Agilent Technologies Inc. | 170,000 | 4,731 |
| * | Apple Inc. | 11,000 | 2,039 |
| Xilinx Inc. | 65,000 | 1,522 | |
| * | IAC/InterActiveCorp | 54,125 | 1,093 |
| * | VMware Inc. Class A | 17,400 | 699 |
| * | Dell Inc. | 44,000 | 671 |
| Intersil Corp. Class A | 30,000 | 459 | |
| * | Verigy Ltd. | 20,814 | 242 |
| 1,003,570 | |||
| Materials (6.6%) | |||
| Monsanto Co. | 812,050 | 62,853 | |
| Vulcan Materials Co. | 1,050,600 | 56,806 | |
| Potash Corp. of | |||
| Saskatchewan Inc. | 572,800 | 51,747 | |
| Praxair Inc. | 466,208 | 38,084 | |
| Newmont Mining Corp. | 450,000 | 19,809 | |
| International Paper Co. | 690,000 | 15,339 | |
| Freeport-McMoRan | |||
| Copper & Gold Inc. | 200,000 | 13,722 | |
| Weyerhaeuser Co. | 261,399 | 9,580 | |
| * | Domtar Corp. | 175,480 | 6,180 |
| Alcoa Inc. | 366,900 | 4,814 | |
| Dow Chemical Co. | 114,300 | 2,980 | |
| 281,914 | |||
| Telecommunication Services (0.3%) | |||
| * | Sprint Nextel Corp. | 2,461,150 | 9,722 |
| AT&T Inc. | 30,000 | 810 | |
| 10,532 | |||
| Utilities (0.5%) | |||
| * | AES Corp. | 998,000 | 14,790 |
| Edison International | 200,000 | 6,716 | |
| FPL Group Inc. | 22,700 | 1,254 | |
| 22,760 | |||
| Total Common Stocks | |||
| (Cost $3,838,976) | 3,958,656 | ||
16
PRIMECAP Core Fund
| Market | ||
| Value• | ||
| Shares | ($000) | |
| Temporary Cash Investment (6.9%) | ||
| Money Market Fund (6.9%) | ||
| 1 Vanguard Market | ||
| Liquidity Fund, 0.267% | ||
| (Cost $293,556) | 293,556,171 | 293,556 |
| Total Investments (100.2%) | ||
| (Cost $4,132,532) | 4,252,212 | |
| Other Assets and Liabilities (–0.2%) | ||
| Other Assets | 5,111 | |
| Liabilities | (12,321) | |
| (7,210) | ||
| Net Assets (100%) | ||
| Applicable to 371,703,084 outstanding | ||
| $.001 par value shares of beneficial | ||
| interest (unlimited authorization) | 4,245,002 | |
| Net Asset Value Per Share | $11.42 | |
| At September 30, 2009, net assets consisted of: | |
| Amount | |
| ($000) | |
| Paid-in Capital | 4,192,533 |
| Undistributed Net Investment Income | 21,722 |
| Accumulated Net Realized Losses | (88,932) |
| Unrealized Appreciation (Depreciation) | |
| Investment Securities | 119,680 |
| Foreign Currencies | (1) |
| Net Assets | 4,245,002 |
• See Note A in Notes to Financial Statements.
* Non-income-producing security.
1 Affiliated money market fund available only to Vanguard funds and certain trusts and accounts managed by Vanguard. Rate shown is
the 7-day yield.
ADR—American Depositary Receipt.
See accompanying Notes, which are an integral part of the Financial Statements.
17
PRIMECAP Core Fund
Statement of Operations
| Year Ended | |
| September 30, 2009 | |
| ($000) | |
| Investment Income | |
| Income | |
| Dividends1 | 48,014 |
| Interest2 | 2,057 |
| Security Lending | 627 |
| Total Income | 50,698 |
| Expenses | |
| Investment Advisory Fees—Note B | 9,772 |
| The Vanguard Group—Note C | |
| Management and Administrative | 5,814 |
| Marketing and Distribution | 883 |
| Custodian Fees | 57 |
| Auditing Fees | 21 |
| Shareholders’ Reports and Proxies | 157 |
| Trustees’ Fees and Expenses | 5 |
| Total Expenses | 16,709 |
| Net Investment Income | 33,989 |
| Realized Net Gain (Loss) | |
| Investment Securities Sold | (73,819) |
| Foreign Currencies | 21 |
| Realized Net Gain (Loss) | (73,798) |
| Change in Unrealized Appreciation (Depreciation) | |
| Investment Securities | 231,048 |
| Foreign Currencies | 12 |
| Change in Unrealized Appreciation (Depreciation) | 231,060 |
| Net Increase (Decrease) in Net Assets Resulting from Operations | 191,251 |
1 Dividends are net of foreign withholding taxes of $1,452,000.
2 Interest income from an affiliated company of the fund was $2,057,000.
See accompanying Notes, which are an integral part of the Financial Statements.
18
PRIMECAP Core Fund
Statement of Changes in Net Assets
| Year Ended September 30, | ||
| 2009 | 2008 | |
| ($000) | ($000) | |
| Increase (Decrease) in Net Assets | ||
| Operations | ||
| Net Investment Income | 33,989 | 37,049 |
| Realized Net Gain (Loss) | (73,798) | 730 |
| Change in Unrealized Appreciation (Depreciation) | 231,060 | (643,827) |
| Net Increase (Decrease) in Net Assets Resulting from Operations | 191,251 | (606,048) |
| Distributions | ||
| Net Investment Income | (34,373) | (26,723) |
| Realized Capital Gain1 | — | (56,117) |
| Total Distributions | (34,373) | (82,840) |
| Capital Share Transactions | ||
| Issued | 1,403,364 | 1,112,307 |
| Issued in Lieu of Cash Distributions | 30,939 | 74,752 |
| Redeemed2 | (599,122) | (550,567) |
| Net Increase (Decrease) from Capital Share Transactions | 835,181 | 636,492 |
| Total Increase (Decrease) | 992,059 | (52,396) |
| Net Assets | ||
| Beginning of Period | 3,252,943 | 3,305,339 |
| End of Period3 | 4,245,002 | 3,252,943 |
1 Includes fiscal 2008 short-term gain distributions totaling $15,062,000. Short-term gain distributions are treated as ordinary income
dividends for tax purposes.
2 Net of redemption fees for fiscal 2009 and 2008 of $1,191,000 and $799,000, respectively.
3 Net Assets—End of Period includes undistributed net investment income of $21,722,000 and $22,085,000.
See accompanying Notes, which are an integral part of the Financial Statements.
19
PRIMECAP Core Fund
Financial Highlights
| Dec. 9, | |||||
| 20041 to | |||||
| Year Ended September 30, | Sept. 30, | ||||
| For a Share Outstanding Throughout Each Period | 2009 | 2008 | 2007 | 2006 | 2005 |
| Net Asset Value, Beginning of Period | $11.41 | $14.03 | $12.28 | $10.98 | $10.00 |
| Investment Operations | |||||
| Net Investment Income | .097 | .1382 | .095 | .090 | .030 |
| Net Realized and Unrealized Gain (Loss) | |||||
| on Investments | .030 | (2.417) | 1.861 | 1.289 | .950 |
| Total from Investment Operations | .127 | (2.279) | 1.956 | 1.379 | .980 |
| Distributions | |||||
| Dividends from Net Investment Income | (.117) | (.110) | (.095) | (.050) | — |
| Distributions from Realized Capital Gains | — | (.231) | (.111) | (.029) | — |
| Total Distributions | (.117) | (.341) | (.206) | (.079) | — |
| Net Asset Value, End of Period | $11.42 | $11.41 | $14.03 | $12.28 | $10.98 |
| Total Return3 | 1.45% | –16.52% | 16.10% | 12.61% | 9.80% |
| Ratios/Supplemental Data | |||||
| Net Assets, End of Period (Millions) | $4,245 | $3,253 | $3,305 | $2,208 | $942 |
| Ratio of Total Expenses to Average Net Assets | 0.54% | 0.50% | 0.55% | 0.60% | 0.72%4 |
| Ratio of Net Investment Income to | |||||
| Average Net Assets | 1.10% | 1.12%2 | 0.73% | 0.90% | 0.58%4 |
| Portfolio Turnover Rate | 5% | 9% | 10% | 5% | 6% |
1 Inception.
2 Net investment income per share and the ratio of net investment income to average net assets include $.027 and 0.23%, respectively,
resulting from a special dividend from ASML Holding NV in October 2007.
3 Total returns do not reflect the 1% transaction fee on redemptions of shares held for less than one year, or the account service fee that
may be applicable to certain accounts with balances below $10,000.
4 Annualized.
See accompanying Notes, which are an integral part of the Financial Statements.
20
PRIMECAP Core Fund
Notes to Financial Statements
Vanguard PRIMECAP Core Fund is registered under the Investment Company Act of 1940 as an open-end investment company, or mutual fund.
A. The following significant accounting policies conform to generally accepted accounting principles for U.S. mutual funds. The fund consistently follows such policies in preparing its financial statements.
1. Security Valuation: Securities are valued as of the close of trading on the New York Stock Exchange (generally 4 p.m., Eastern time) on the valuation date. Equity securities are valued at the latest quoted sales prices or official closing prices taken from the primary market in which each security trades; such securities not traded on the valuation date are valued at the mean of the latest quoted bid and asked prices. Securities for which market quotations are not readily available, or whose values have been affected by events occurring before the fund’s pricing time but after the close of the securities’ primary markets, are valued at their fair values calculated according to procedures adopted by the board of trustees. These procedures include obtaining quotations from an independent pricing service, monitoring news to identify significant market- or security-specific events, and evaluating changes in the values of foreign market proxies (for example, ADRs, futures contracts, or exchange-traded funds), between the time the foreign markets close and the fund’s pricing time. When fair-value pricing is employed, the prices of securities used by a fund to calculate its net asset value may differ from quoted or published prices for the same securities. Investments in Vanguard Market Liquidity Fund are valued at that fund’s net asset value.
2. Foreign Currency: Securities and other assets and liabilities denominated in foreign currencies are translated into U.S. dollars using exchange rates obtained from an independent third party as of the fund’s pricing time on the valuation date. Realized gains (losses) and unrealized appreciation (depreciation) on investment securities include the effects of changes in exchange rates since the securities were purchased, combined with the effects of changes in security prices. Fluctuations in the value of other assets and liabilities resulting from changes in exchange rates are recorded as unrealized foreign currency gains (losses) until the assets or liabilities are settled in cash, at which time they are recorded as realized foreign currency gains (losses).
3. Federal Income Taxes: The fund intends to continue to qualify as a regulated investment company and distribute all of its taxable income. Management has analyzed the fund’s tax positions taken for all open federal income tax years (September 30, 2006–2009), and has concluded that no provision for federal income tax is required in the fund’s financial statements.
4. Distributions: Distributions to shareholders are recorded on the ex-dividend date.
5. Security Lending: The fund may lend its securities to qualified institutional borrowers to earn additional income. Security loans are required to be secured at all times by collateral at least equal to the market value of securities loaned. The fund invests cash collateral received in Vanguard Market Liquidity Fund, and records a liability for the return of the collateral, during the period the securities are on loan. Security lending income represents the income earned on investing cash collateral, less expenses associated with the loan.
6. Other: Dividend income is recorded on the ex-dividend date. Interest income includes income distributions received from Vanguard Market Liquidity Fund and is accrued daily. Security transactions are accounted for on the date securities are bought or sold. Costs used to determine realized gains (losses) on the sale of investment securities are those of the specific securities sold. Fees assessed on redemptions of capital shares are credited to paid-in capital.
21
PRIMECAP Core Fund
B. PRIMECAP Management Company provides investment advisory services to the fund for a fee calculated at an annual percentage rate of average net assets. For the year ended September 30, 2009, the investment advisory fee represented an effective annual rate of 0.32% of the fund’s average net assets.
C. The Vanguard Group furnishes at cost corporate management, administrative, marketing, and distribution services. The costs of such services are allocated to the fund under methods approved by the board of trustees. The fund has committed to provide up to 0.40% of its net assets in capital contributions to Vanguard. At September 30, 2009, the fund had contributed capital of $851,000 to Vanguard (included in Other Assets), representing 0.02% of the fund’s net assets and 0.34% of Vanguard’s capitalization. The fund’s trustees and officers are also directors and officers of Vanguard.
D. Various inputs may be used to determine the value of the fund’s investments. These inputs are summarized in three broad levels for financial statement purposes. The inputs or methodologies used to value securities are not necessarily an indication of the risk associated with investing in those securities.
Level 1—Quoted prices in active markets for identical securities.
Level 2—Other significant observable inputs (including quoted prices for similar securities, interest rates, prepayment speeds, credit risk, etc.).
Level 3—Significant unobservable inputs (including the fund’s own assumptions used to determine the fair value of investments).
The following table summarizes the fund’s investments as of September 30, 2009, based on the inputs used to value them:
| Level 1 | Level 2 | Level 3 | |
| Investments | ($000) | ($000) | ($000) |
| Common Stocks | 3,840,009 | 118,647 | — |
| Temporary Cash Investments | 293,556 | — | — |
| Total | 4,133,565 | 118,647 | — |
E. Distributions are determined on a tax basis and may differ from net investment income and realized capital gains for financial reporting purposes. Differences may be permanent or temporary. Permanent differences are reclassified among capital accounts in the financial statements to reflect their tax character. Temporary differences arise when certain items of income, expense, gain, or loss are recognized in different periods for financial statement and tax purposes; these differences will reverse at some time in the future. Differences in classification may also result from the treatment of short-term gains as ordinary income for tax purposes.
During the year ended September 30, 2009, the fund realized net foreign currency gains of $21,000, which increased distributable net income for tax purposes; accordingly, such gains have been reclassified from accumulated net realized losses to undistributed net investment income.
For tax purposes, at September 30, 2009, the fund had $24,923,000 of ordinary income available for distribution. The fund had available capital loss carryforwards totaling $15,115,000 to offset future net capital gains through September 30, 2017. In addition, the fund realized losses of $73,818,000 during the period from November 1, 2008, through September 30, 2009, which are deferred and will be treated as realized for tax purposes in fiscal 2010.
22
PRIMECAP Core Fund
At September 30, 2009, the cost of investment securities for tax purposes was $4,132,532,000. Net unrealized appreciation of investment securities for tax purposes was $119,680,000, consisting of unrealized gains of $482,499,000 on securities that had risen in value since their purchase and $362,819,000 in unrealized losses on securities that had fallen in value since their purchase.
F. During the year ended September 30, 2009, the fund purchased $1,128,948,000 of investment securities and sold $150,145,000 of investment securities, other than temporary cash investments.
| G. Capital shares issued and redeemed were: | ||
| Year Ended September 30, | ||
| 2009 | 2008 | |
| Shares | Shares | |
| (000) | (000) | |
| Issued | 148,431 | 87,101 |
| Issued in Lieu of Cash Distributions | 3,602 | 5,799 |
| Redeemed | (65,435) | (43,408) |
| Net Increase (Decrease) in Shares Outstanding | 86,598 | 49,492 |
H. In preparing the financial statements as of September 30, 2009, management considered the impact of subsequent events occurring through November 10, 2009, for potential recognition or disclosure in these financial statements.
23
Report of Independent Registered
Public Accounting Firm
To the Trustees of Vanguard Fenway Funds and the Shareholders of the Vanguard PRIMECAP Core Fund:
In our opinion, the accompanying statement of net assets and the related statements of operations and of changes in net assets and the financial highlights present fairly, in all material respects, the financial position of the Vanguard PRIMECAP Core Fund (the “Fund”) at September 30, 2009, the results of its operations for the year then ended, the changes in its net assets for each of the two years in the period then ended and the financial highlights for each of the periods indicated, in conformity with accounting principles generally accepted in the United States of America. These financial statements and financial highlights (hereafter referred to as “financial statements”) are the responsibility of the Fund’s management; our responsibility is to express an opinion on these financial statements based on our audits. We conducted our audits of these financial statements in accordance with the sta ndards of the Public Company Accounting Oversight Board (United States). Those standards require that we plan and perform the audit to obtain reasonable assurance about whether the financial statements are free of material misstatement. An audit includes examining, on a test basis, evidence supporting the amounts and disclosures in the financial statements, assessing the accounting principles used and significant estimates made by management, and evaluating the overall financial statement presentation. We believe that our audits, which included confirmation of securities at September 30, 2009 by correspondence with the custodian and by agreement to the underlying ownership records of Vanguard Market Liquidity Fund, provide a reasonable basis for our opinion.
PricewaterhouseCoopers LLP
Philadelphia, Pennsylvania
November 10, 2009

Special 2009 tax information (unaudited) for Vanguard PRIMECAP Core Fund
This information for the fiscal year ended September 30, 2009, is included pursuant to provisions of the Internal Revenue Code.
The fund distributed $34,373,000 of qualified dividend income to shareholders during the fiscal year.
For corporate shareholders, 100% of investment income (dividend income plus short-term gains, if any) qualifies for the dividends-received deduction.
24
Your Fund’s After-Tax Returns
This table presents returns for your fund both before and after taxes. The after-tax returns are shown in two ways: (1) assuming that an investor owned the fund during the entire period and paid taxes on the fund’s distributions, and (2) assuming that an investor paid taxes on the fund’s distributions and sold all shares at the end of each period.
Calculations are based on the highest individual federal income tax and capital gains tax rates in effect at the times of the distributions and the hypothetical sales. State and local taxes were not considered. After-tax returns reflect any qualified dividend income, using actual prior-year figures and estimates for 2009. (In the example, returns after the sale of fund shares may be higher than those assuming no sale. This occurs when the sale would have produced a capital loss. The calculation assumes that the investor received a tax deduction for the loss.)
Please note that your actual after-tax returns will depend on your tax situation and may differ from those shown. Also note that if you own the fund in a tax-deferred account, such as an individual retirement account or a 401(k) plan, this information does not apply to you. Such accounts are not subject to current taxes.
Finally, keep in mind that a fund’s performance—whether before or after taxes—does not guarantee future results.
| Average Annual Total Returns: PRIMECAP Core Fund1 | ||
| Periods Ended September 30, 2009 | ||
| One | Since | |
| Year | Inception2 | |
| Returns Before Taxes | 1.45% | 4.15% |
| Returns After Taxes on Distributions | 1.25 | 3.92 |
| Returns After Taxes on Distributions and Sale of Fund Shares | 1.12 | 3.52 |
1 Total return figures do not include the 1% fee assessed on redemptions of shares held less than one year, or the account service fee that
may be applicable to certain accounts with balances below $10,000.
2 Inception date: December 9, 2004.
25
About Your Fund’s Expenses
As a shareholder of the fund, you incur ongoing costs, which include costs for portfolio management, administrative services, and shareholder reports (like this one), among others. Operating expenses, which are deducted from a fund’s gross income, directly reduce the investment return of the fund.
A fund’s expenses are expressed as a percentage of its average net assets. This figure is known as the expense ratio. The following examples are intended to help you understand the ongoing costs (in dollars) of investing in your fund and to compare these costs with those of other mutual funds. The examples are based on an investment of $1,000 made at the beginning of the period shown and held for the entire period.
The accompanying table illustrates your fund’s costs in two ways:
• Based on actual fund return. This section helps you to estimate the actual expenses that you paid over the period. The “Ending Account Value” shown is derived from the fund’s actual return, and the third column shows the dollar amount that would have been paid by an investor who started with $1,000 in the fund. You may use the information here, together with the amount you invested, to estimate the expenses that you paid over the period.
To do so, simply divide your account value by $1,000 (for example, an $8,600 account value divided by $1,000 = 8.6), then multiply the result by the number given for your fund under the heading “Expenses Paid During Period.”
• Based on hypothetical 5% yearly return. This section is intended to help you compare your fund’s costs with those of other mutual funds. It assumes that the fund had a yearly return of 5% before expenses, but that the expense ratio is unchanged. In this case—because the return used is not the fund’s actual return—the results do not apply to your investment. The example is useful in making comparisons because the Securities and Exchange Commission requires all mutual funds to calculate expenses based on a 5% return. You can assess your fund’s costs by comparing this hypothetical example with the hypothetical examples that appear in shareholder reports of other funds.
| Six Months Ended September 30, 2009 | |||
| Beginning | Ending | Expenses | |
| Account Value | Account Value | Paid During | |
| PRIMECAP Core Fund | 3/31/2009 | 9/30/2009 | Period1 |
| Based on Actual Fund Return | $1,000.00 | $1,327.91 | $3.15 |
| Based on Hypothetical 5% Yearly Return | 1,000.00 | 1,022.36 | 2.74 |
Note that the expenses shown in the table are meant to highlight and help you compare ongoing costs only and do not reflect transaction costs incurred by the fund for buying and selling securities. Further, the expenses do not include the 1% fee on redemptions of shares held for less than one year, nor do they include the account service fee described in the prospectus. If such fees were applied to your account, your costs would be higher. Your fund does not carry a “sales load.”
1 The calculations are based on expenses incurred in the most recent six-month period. The fund’s annualized six-month expense ratio for that period is 0.54%. The dollar amounts shown as “Expenses Paid” are equal to the annualized expense ratio multiplied by the average account value over the period, multiplied by the number of days in the most recent six-month period, then divided by the number of days in the most recent 12-month period.
26
The calculations assume no shares were bought or sold during the period. Your actual costs may have been higher or lower, depending on the amount of your investment and the timing of any purchases or redemptions.
You can find more information about the fund’s expenses, including annual expense ratios, in the Financial Statements section of this report. For additional information on operating expenses and other shareholder costs, please refer to your fund’s current prospectus.
27
Glossary
Beta. A measure of the magnitude of a fund’s past share-price fluctuations in relation to the ups and downs of a given market index. The index is assigned a beta of 1.00. Compared with a given index, a fund with a beta of 1.20 typically would have seen its share price rise or fall by 12% when the index rose or fell by 10%. For this report, beta is based on returns over the past 36 months for both the fund and the index. Note that a fund’s beta should be reviewed in conjunction with its R-squared (see definition). The lower the R-squared, the less correlation there is between the fund and the index, and the less reliable beta is as an indicator of volatility.
Earnings Growth Rate. The average annual rate of growth in earnings over the past five years for the stocks now in a fund.
Equity Exposure. A measure that reflects a fund’s investments in stocks and stock futures. Any holdings in short-term reserves are excluded.
Expense Ratio. The percentage of a fund’s average net assets used to pay its annual administrative and advisory expenses. These expenses directly reduce returns to investors.
Foreign Holdings. The percentage of a fund represented by stocks or depositary receipts of companies based outside the United States.
Inception Date. The date on which the assets of a fund (or one of its share classes) are first invested in accordance with the fund’s investment objective. For funds with a subscription period, the inception date is the day after that period ends. Investment performance is measured from the inception date.
Median Market Cap. An indicator of the size of companies in which a fund invests; the midpoint of market capitalization (market price x shares outstanding) of a fund’s stocks, weighted by the proportion of the fund’s assets invested in each stock. Stocks representing half of the fund’s assets have market capitalizations above the median, and the rest are below it.
Price/Book Ratio. The share price of a stock divided by its net worth, or book value, per share. For a fund, the weighted average price/book ratio of the stocks it holds.
Price/Earnings Ratio. The ratio of a stock’s current price to its per-share earnings over the past year. For a fund, the weighted average P/E of the stocks it holds. P/E is an indicator of market expectations about corporate prospects; the higher the P/E, the greater the expectations for a company’s future growth.
R-Squared. A measure of how much of a fund’s past returns can be explained by the returns from the market in general, as measured by a given index. If a fund’s total returns were precisely synchronized with an index’s returns, its R-squared would be 1.00. If the fund’s returns bore no relationship to the index’s returns, its R-squared would be 0. For this report, R-squared is based on returns over the past 36 months for both the fund and the index.
Return on Equity. The annual average rate of return generated by a company during the past five years for each dollar of shareholder’s equity (net income divided by shareholder’s equity). For a fund, the weighted average return on equity for the companies whose stocks it holds.
Short-Term Reserves. The percentage of a fund invested in highly liquid, short-term securities that can be readily converted to cash.
28
Turnover Rate. An indication of the fund’s trading activity. Funds with high turnover rates incur higher transaction costs and may be more likely to distribute capital gains (which may be taxable to investors). The turnover rate excludes in-kind transactions, which have minimal impact on costs.
Yield. A fund’s 30-day SEC yield is derived using a formula specified by the U.S. Securities and Exchange Commission. Under the formula, data related to the fund’s security holdings in the previous 30 days are used to calculate the fund’s hypothetical net income for that period, which is then annualized and divided by the fund’s estimated average net assets over the calculation period. For the purposes of this calculation, a security’s income is based on its current market yield to maturity (in the case of bonds) or its projected dividend yield (for stocks). Because the SEC yield represents hypothetical annualized income, it will differ—at times significantly—from the fund’s actual experience. As a result, the fund’s income distributions may be higher or lower than implied by the SEC yield.
29
This page intentionally left blank.
This page intentionally left blank.
The People Who Govern Your Fund
The trustees of your mutual fund are there to see that the fund is operated and managed in your best interests since, as a shareholder, you are a part owner of the fund. Your fund’s trustees also serve on the board of directors of The Vanguard Group, Inc., which is owned by the Vanguard funds and provides services to them on an at-cost basis.
A majority of Vanguard’s board members are independent, meaning that they have no affiliation with Vanguard or the funds they oversee, apart from the sizable personal investments they have made as private individuals. The independent board members have distinguished backgrounds in business, academia, and public service. Each of the trustees and executive officers oversees 156 Vanguard funds.
The following table provides information for each trustee and executive officer of the fund. More information about the trustees is in the Statement of Additional Information, which can be obtained, without charge, by contacting Vanguard at 800-662-7447, or online at www.vanguard.com.
| Interested Trustees | Emerson U. Fullwood |
| Born 1948. Trustee Since January 2008. Principal | |
| John J. Brennan1 | Occupation(s) During the Past Five Years: Executive |
| Born 1954. Trustee Since May 1987. Chairman of | Chief Staff and Marketing Officer for North America |
| the Board. Principal Occupation(s) During the Past | and Corporate Vice President (retired 2008) of Xerox |
| Five Years: Chairman of the Board and Director/Trustee | Corporation (photocopiers and printers); Director of |
| of The Vanguard Group, Inc., and of each of the | SPX Corporation (multi-industry manufacturing), the |
| investment companies served by The Vanguard Group; | United Way of Rochester, the Boy Scouts of America, |
| Chief Executive Officer (1996–2008) and President | Amerigroup Corporation (direct health and medical |
| (1989–2008) of The Vanguard Group and of each of the | insurance carriers), and Monroe Community College |
| investment companies served by The Vanguard Group; | Foundation. |
| Chairman of the Financial Accounting Foundation; | |
| Governor of the Financial Industry Regulatory Authority | Rajiv L. Gupta |
| (FINRA); Director of United Way of Southeastern | Born 1945. Trustee Since December 2001.2 Principal |
| Pennsylvania. | Occupation(s) During the Past Five Years: Chairman |
| and Chief Executive Officer (retired 2009) and President | |
| F. William McNabb III1 | (2006–2008) of Rohm and Haas Co. (chemicals); Board |
| Born 1957. Trustee Since July 2009. Principal | Member of American Chemistry Council; Director of |
| Occupation(s) During the Past Five Years: Director of | Tyco International, Ltd. (diversified manufacturing and |
| The Vanguard Group, Inc., since 2008; Chief Executive | services) and Hewlett-Packard Co. (electronic computer |
| Officer and President of The Vanguard Group and of | manufacturing); Trustee of The Conference Board. |
| each of the investment companies served by The | |
| Vanguard Group since 2008; Director of Vanguard | Amy Gutmann |
| Marketing Corporation; Managing Director of The | Born 1949. Trustee Since June 2006. Principal |
| Vanguard Group (1995–2008). | Occupation(s) During the Past Five Years: President of |
| the University of Pennsylvania; Christopher H. Browne | |
| Distinguished Professor of Political Science in the School | |
| Independent Trustees | of Arts and Sciences with secondary appointments |
| at the Annenberg School for Communication and the | |
| Charles D. Ellis | Graduate School of Education of the University of |
| Born 1937. Trustee Since January 2001. Principal | Pennsylvania; Director of Carnegie Corporation of |
| Occupation(s) During the Past Five Years: Applecore | New York, Schuylkill River Development Corporation, |
| Partners (pro bono ventures in education); Senior | and Greater Philadelphia Chamber of Commerce; |
| Advisor to Greenwich Associates (international business | Trustee of the National Constitution Center. |
| strategy consulting); Successor Trustee of Yale University; | |
| Overseer of the Stern School of Business at New York | |
| University; Trustee of the Whitehead Institute for | |
| Biomedical Research. |
| JoAnn Heffernan Heisen | Executive Officers | |
| Born 1950. Trustee Since July 1998. Principal | ||
| Occupation(s) During the Past Five Years: Corporate | Thomas J. Higgins1 | |
| Vice President and Chief Global Diversity Officer since | Born 1957. Chief Financial Officer Since September | |
| 2006 (retired 2008) and Member of the Executive | 2008. Principal Occupation(s) During the Past Five | |
| Committee (retired 2008) of Johnson & Johnson | Years: Principal of The Vanguard Group, Inc.; Chief | |
| (pharmaceuticals/consumer products); Vice President | Financial Officer of each of the investment companies | |
| and Chief Information Officer of Johnson & Johnson | served by The Vanguard Group since 2008; Treasurer | |
| (1997–2005); Director of the University Medical Center | of each of the investment companies served by The | |
| at Princeton and Women’s Research and Education | Vanguard Group (1998–2008). | |
| Institute. | ||
| Kathryn J. Hyatt1 | ||
| André F. Perold | Born 1955. Treasurer Since November 2008. Principal | |
| Born 1952. Trustee Since December 2004. Principal | Occupation(s) During the Past Five Years: Principal of | |
| Occupation(s) During the Past Five Years: George Gund | The Vanguard Group, Inc.; Treasurer of each of the | |
| Professor of Finance and Banking, Harvard Business | investment companies served by The Vanguard | |
| School; Chairman of UNX, Inc. (equities trading firm); | Group since 2008; Assistant Treasurer of each of the | |
| Chair of the Investment Committee of HighVista | investment companies served by The Vanguard Group | |
| Strategies LLC (private investment firm). | (1988–2008). | |
| Alfred M. Rankin, Jr. | Heidi Stam1 | |
| Born 1941. Trustee Since January 1993. Principal | Born 1956. Secretary Since July 2005. Principal | |
| Occupation(s) During the Past Five Years: Chairman, | Occupation(s) During the Past Five Years: Managing | |
| President, and Chief Executive Officer of NACCO | Director of The Vanguard Group, Inc., since 2006; | |
| Industries, Inc. (forklift trucks/housewares/lignite); | General Counsel of The Vanguard Group since 2005; | |
| Director of Goodrich Corporation (industrial products/ | Secretary of The Vanguard Group and of each of the | |
| aircraft systems and services); Deputy Chairman of | investment companies served by The Vanguard Group | |
| the Federal Reserve Bank of Cleveland. | since 2005; Director and Senior Vice President of | |
| Vanguard Marketing Corporation since 2005; Principal | ||
| Peter F. Volanakis | of The Vanguard Group (1997–2006). | |
| Born 1955. Trustee Since July 2009. Principal | ||
| Occupation(s) During the Past Five Years: President | ||
| since 2007 and Chief Operating Officer since 2005 | Vanguard Senior Management Team | |
| of Corning Incorporated (communications equipment); | ||
| President of Corning Technologies (2001–2005); Director | R. Gregory Barton | Michael S. Miller |
| of Corning Incorporated and Dow Corning; Trustee of | Mortimer J. Buckley | James M. Norris |
| the Corning Incorporated Foundation and the Corning | Kathleen C. Gubanich | Glenn W. Reed |
| Museum of Glass; Overseer of the Amos Tuck School | Paul A. Heller | George U. Sauter |
| of Business Administration at Dartmouth College. | ||
| Founder | ||
| John C. Bogle | ||
| Chairman and Chief Executive Officer, 1974–1996 | ||
1 These individuals are “interested persons” as defined in the Investment Company Act of 1940.
2 December 2002 for Vanguard Equity Income Fund, Vanguard Growth Equity Fund, the Vanguard Municipal Bond Funds, and the Vanguard
State Tax-Exempt Funds.

P.O. Box 2600
Valley Forge, PA 19482-2600
Connect with Vanguard® > www.vanguard.com
| Fund Information > 800-662-7447 | All comparative mutual fund data are from Lipper Inc. |
| or Morningstar, Inc., unless otherwise noted. | |
| Direct Investor Account Services > 800-662-2739 | |
| Institutional Investor Services > 800-523-1036 | You can obtain a free copy of Vanguard’s proxy voting |
| guidelines by visiting our website, www.vanguard.com, | |
| Text Telephone for People | and searching for “proxy voting guidelines,” or by |
| With Hearing Impairment > 800-749-7273 | calling Vanguard at 800-662-2739. The guidelines are |
| also available from the SEC’s website, www.sec.gov. | |
| In addition, you may obtain a free report on how your | |
| fund voted the proxies for securities it owned during | |
| the 12 months ended June 30. To get the report, visit | |
| This material may be used in conjunction | either www.vanguard.com or www.sec.gov. |
| with the offering of shares of any Vanguard | |
| fund only if preceded or accompanied by | |
| the fund’s current prospectus. | You can review and copy information about your fund |
| at the SEC’s Public Reference Room in Washington, D.C. | |
| To find out more about this public service, call the SEC | |
| at 202-551-8090. Information about your fund is also | |
| available on the SEC’s website, and you can receive | |
| copies of this information, for a fee, by sending a | |
| request in either of two ways: via e-mail addressed to | |
| publicinfo@sec.gov or via regular mail addressed to the | |
| Public Reference Section, Securities and Exchange | |
| Commission, Washington, DC 20549-1520. | |
| © 2009 The Vanguard Group, Inc. | |
| All rights reserved. | |
| Vanguard Marketing Corporation, Distributor. | |
| Q12200 112009 | |
Item 2: Code of Ethics. The Registrant has adopted a code of ethics that applies to the Registrant’s principal executive officer, principal financial officer, principal accounting officer or controller or persons performing similar functions. The Code of Ethics was amended during the reporting period covered by this report to make certain technical, non-material changes.
Item 3: Audit Committee Financial Expert. The following members of the Audit Committee have been determined by the Registrant’s Board of Trustees to be Audit Committee Financial Experts serving on its Audit Committee, and to be independent: Charles D. Ellis, Rajiv L. Gupta, JoAnn Heffernan Heisen, André F. Perold, and Alfred M. Rankin, Jr.
Item 4: Principal Accountant Fees and Services.
(a) Audit Fees.
Audit Fees of the Registrant
Fiscal Year Ended September 30, 2009: $68,000
Fiscal Year Ended September 30, 2008: $65,000
Aggregate Audit Fees of Registered Investment Companies in the Vanguard Group.
Fiscal Year Ended September 30, 2009: $3,354,640
Fiscal Year Ended September 30, 2008: $3,055,590
(b) Audit-Related Fees.
Fiscal Year Ended September 30, 2009: $876,210
Fiscal Year Ended September 30, 2008: $626,240
Includes fees billed in connection with assurance and related services provided to the Registrant, The Vanguard Group, Inc., Vanguard Marketing Corporation, and other registered investment companies in the Vanguard Group.
(c) Tax Fees.
Fiscal Year Ended September 30, 2009: $423,070
Fiscal Year Ended September 30, 2008: $230,400
Includes fees billed in connection with tax compliance, planning and advice services provided to the Registrant, The Vanguard Group, Inc., Vanguard Marketing Corporation, and other registered investment companies in the Vanguard Group and related to income and excise taxes.
(d) All Other Fees.
Fiscal Year Ended September 30, 2009: $0
Fiscal Year Ended September 30, 2008: $0
Includes fees billed for services related to risk management and privacy matters. Services were provided to the Registrant, The Vanguard Group, Inc., Vanguard Marketing Corporation, and other registered investment companies in the Vanguard Group.
(e) (1) Pre-Approval Policies. The policy of the Registrant’s Audit Committee is to consider and, if appropriate, approve before the principal accountant is engaged for such services, all specific audit and non-audit services provided to: (1) the Registrant; (2) The Vanguard Group, Inc.; (3) other entities controlled by The Vanguard Group, Inc. that provide ongoing services to the Registrant; and (4) other registered investment companies in the Vanguard Group. In making a determination, the Audit Committee considers whether the services are consistent with maintaining the principal accountant’s independence.
In the event of a contingency situation in which the principal accountant is needed to provide services in between scheduled Audit Committee meetings, the Chairman of the Audit Committee would be called on to consider and, if appropriate, pre-approve audit or permitted non-audit services in an amount sufficient to complete services through the next Audit Committee meeting, and to determine if such services would be consistent with maintaining the accountant’s independence. At the next scheduled Audit Committee meeting, services and fees would be presented to the Audit Committee for formal consideration, and, if appropriate, approval by the entire Audit Committee. The Audit Committee would again consider whether such services and fees are consistent with maintaining the principal accountant’s independence.
The Registrant’s Audit Committee is informed at least annually of all audit and non-audit services provided by the principal accountant to the Vanguard complex, whether such services are provided to: (1) the Registrant; (2) The Vanguard Group, Inc.; (3) other entities controlled by The Vanguard Group, Inc. that provide ongoing services to the Registrant; or (4) other registered investment companies in the Vanguard Group.
(2) No percentage of the principal accountant’s fees or services were approved pursuant to the waiver provision of paragraph (c)(7)(i)(C) of Rule 2-01 of Regulation S-X.
(f) For the most recent fiscal year, over 50% of the hours worked under the principal accountant’s engagement were not performed by persons other than full-time, permanent employees of the principal accountant.
(g) Aggregate Non-Audit Fees.
Fiscal Year Ended September 30, 2009: $423,070
Fiscal Year Ended September 30, 2008: $230,400
Includes fees billed for non-audit services provided to the Registrant, The Vanguard Group, Inc., Vanguard Marketing Corporation, and other registered investment companies in the Vanguard Group.
(h) For the most recent fiscal year, the Audit Committee has determined that the provision of all non-audit services was consistent with maintaining the principal accountant’s independence.
Item 5: Not Applicable.
Item 6: Not Applicable.
Item 7: Not Applicable.
Item 8: Not Applicable.
Item 9: Not Applicable.
Item 10: Not Applicable.
Item 11: Controls and Procedures.
(a) Disclosure Controls and Procedures. The Principal Executive and Financial Officers concluded that the Registrant's Disclosure Controls and Procedures are effective based on their evaluation of the Disclosure Controls and Procedures as of a date within 90 days of the filing date of this report.
(b) Internal Control Over Financial Reporting. There were no significant changes in Registrant’s Internal Control Over Financial Reporting or in other factors that could significantly affect this control subsequent to the date of the evaluation, including any corrective actions with regard to significant deficiencies and material weaknesses.
Item 12: Exhibits.
(a) Code of Ethics.
(b) Certifications.
Pursuant to the requirements of the Securities Exchange Act of 1934 and the Investment Company Act of 1940, the registrant has duly caused this report to be signed on its behalf by the undersigned, thereunto duly authorized.
| VANGUARD FENWAY FUNDS | |
| BY: | /s/ F. WILLIAM MCNABB III* |
| F. WILLIAM MCNABB III | |
| CHIEF EXECUTIVE OFFICER | |
Date: November 20, 2009
Pursuant to the requirements of the Securities Exchange Act of 1934 and the Investment Company Act of 1940, this report has been signed below by the following persons on behalf of the registrant and in the capacities and on the dates indicated.
| VANGUARD FENWAY FUNDS | |
| BY: | /s/ F. WILLIAM MCNABB III* |
| F. WILLIAM MCNABB III | |
| CHIEF EXECUTIVE OFFICER | |
Date: November 20, 2009
| VANGUARD FENWAY FUNDS | |
| BY: | /s/ THOMAS J. HIGGINS* |
| THOMAS J. HIGGINS | |
| CHIEF FINANCIAL OFFICER | |
Date: November 20, 2009
* By: /s/ Heidi Stam
Heidi Stam, pursuant to a Power of Attorney filed on July 24, 2009, see file Number
2-88373, and a Power of Attorney filed on October 16, 2009, see File Number 2-52698,
both Incorporated by Reference.