UNITED STATES
SECURITIES AND EXCHANGE COMMISSION
Washington, D.C. 20549
FORM N-CSR
CERTIFIED SHAREHOLDER REPORT
OF
REGISTERED MANAGEMENT INVESTMENT COMPANIES
Investment Company Act file number: 811-5445
Name of Registrant: Vanguard Fenway Funds
Address of Registrant: | P.O. Box 2600 |
| Valley Forge, PA 19482 |
|
|
Name and address of agent for service: | Heidi Stam, Esquire |
| P.O. Box 876 |
| Valley Forge, PA 19482 |
|
|
Registrant’s telephone number, including area code: (610) 669-1000
Date of fiscal year end: September 30
Date of reporting period: October 1, 2007–September 30, 2008
Item 1: Reports to Shareholders |


> | Vanguard Equity Income Fund Investor Shares returned –18.9% for the fiscal year ended September 30, 2008. |
> | This disappointing return was nevertheless superior to the return of the fund’s benchmark index, the FTSE High Dividend Yield Index, and the average return of its peer group. |
> | The fund’s industrial, telecommunication services, and financial sectors weighed heavily on its performance. |
Contents |
|
|
|
Your Fund’s Total Returns | 1 |
President’s Letter | 2 |
Advisors’ Report | 7 |
Fund Profile | 10 |
Performance Summary | 11 |
Financial Statements | 13 |
Your Fund’s After-Tax Returns | 26 |
About Your Fund’s Expenses | 27 |
Glossary | 29 |
Please note: The opinions expressed in this report are just that—informed opinions. They should not be considered promises or advice. Also, please keep in mind that the information and opinions cover the period through the date on the front of this report. Of course, the risks of investing in your fund are spelled out in the prospectus.
Your Fund’s Total Returns
Fiscal Year Ended September 30, 2008 |
|
|
| Ticker | Total |
| Symbol | Returns |
Vanguard Equity Income Fund |
|
|
Investor Shares | VEIPX | –18.9% |
Admiral™ Shares1 | VEIRX | –18.8 |
FTSE High Dividend Yield Index |
| –20.3 |
Average Equity Income Fund2 |
| –20.8 |
Your Fund’s Performance at a Glance |
|
|
|
|
September 30, 2007–September 30, 2008 |
|
|
|
|
|
|
| Distributions Per Share | |
| Starting | Ending | Income | Capital |
| Share Price | Share Price | Dividends | Gains |
Vanguard Equity Income Fund |
|
|
|
|
Investor Shares | $27.01 | $20.02 | $0.785 | $1.358 |
Admiral Shares | 56.62 | 41.97 | 1.705 | 2.846 |
1 | A lower-cost class of shares available to many longtime shareholders and to those with significant investments in the fund. |
2 | Derived from data provided by Lipper Inc. |
1

President’s Letter
Dear Shareholder,
For the 12 months ended September 30, Vanguard Equity Income Fund Investor Shares returned –18.9%, while the lower-cost Admiral Shares returned –18.8%. In the unsettled stock market, “success” was a relative term, and the fund had more success than its comparative standards, the FTSE High Dividend Yield Index and the Average Equity Income Fund, both of which posted declines of more than –20%.
At the end of the fiscal year, the 30-day SEC yield for the fund’s Investor Shares was 3.79% (3.92% for Admiral Shares), significantly higher than the 2.84% yield (2.95% for Admiral Shares) at the beginning of the period.
Credit-market turbulence weighed heavily on stock prices
Troubles simmering in the credit markets for much of the past year came to a boil at the end of the fiscal period, producing several high-profile bankruptcies and putting severe pressure on stock prices around the world. The broad U.S. stock market returned –21.2% for the 12 months ended September 30. In September alone, stock prices fell more than 9%. International stock markets were similarly disappointing, returning –30.0% for the full 12 months.
2
Policymakers and elected officials, both in the United States and abroad, responded to the upheavals with dramatic new programs designed to help stabilize the credit markets. As participants struggled to make sense of the markets’ fast-changing dynamics, stock prices were exceptionally volatile, with daily ups and downs of 2 percentage points or more becoming commonplace.
U.S. Treasuries rallied in a nervous market
Nervousness in the stock market was echoed, and even amplified, in the bond market. For the 12 months, the broad U.S. bond market returned 3.7%, largely on the strength of Treasuries—investors’ security of choice in times of duress. Corporate bonds generally produced negative returns for the period, coming under heavy selling pressure during investors’ flight to safety. Even the municipal market, made up of generally high-quality securities issued by states and municipalities, recorded a negative 12-month return.
The U.S. Federal Reserve Board responded to the turmoil with a dramatic easing of monetary policy. Over the full 12 months, the Fed reduced its target for the federal funds rate from 4.75% to 2.00%. On October 8, shortly after the close of the fiscal period, the Fed cut rates again, to 1.50%. The move was made in coordination with rate cuts by several other central banks.
Market Barometer |
|
|
|
Average Annual Total Returns | |||
Periods Ended September 30, 2008 | |||
| One Year | Three Years | Five Years |
Stocks |
|
|
|
Russell 1000 Index (Large-caps) | –22.1% | 0.1% | 5.5% |
Russell 2000 Index (Small-caps) | –14.5 | 1.8 | 8.1 |
Dow Jones Wilshire 5000 Index (Entire market) | –21.2 | 0.6 | 6.0 |
MSCI All Country World Index ex USA (International) | –30.0 | 3.1 | 11.8 |
|
|
|
|
Bonds |
|
|
|
Lehman U.S. Aggregate Bond Index (Broad taxable market) | 3.7% | 4.2% | 3.8% |
Lehman Municipal Bond Index | –1.9 | 1.9 | 2.8 |
Citigroup 3-Month Treasury Bill Index | 2.6 | 4.0 | 3.1 |
|
|
|
|
CPI |
|
|
|
Consumer Price Index | 4.9% | 3.2% | 3.4% |
3
The fund’s return was weak, yet stronger than its benchmark’s
Vanguard Equity Income Fund seeks to provide above-average yield plus long-term capital growth by investing in undervalued companies. As is almost always the case, the fund was a richer source of dividend income than the broad stock market, but the treacherous market environment made capital appreciation a near impossibility during the past 12 months.
While the fund managed to beat its benchmark index, its returns across all economic sectors were negative for the period. The fund’s financial sector, which accounts for roughly a quarter of its holdings, performed poorly (–27%), trimming more than 6 percentage points from the fund’s return. Oddly enough, this performance was strong relative to the performance of financial stocks in the fund’s benchmark index, where they returned –36%. The fund managed to minimize its exposure to financial companies battered by the subprime mortgage crisis by underweighting companies such as Washington Mutual, Wachovia, Freddie Mac, and Fannie Mae.
The fund’s industrial and telecommunication services sectors also performed weakly, while holding up somewhat better than those same sectors in the index. Uncertainty in the economy and concern about near-term demand caused some industrial firms, such as General Electric (–36%), to lower earnings expectations.
Expense Ratios1 |
|
|
|
Your Fund Compared With Its Peer Group |
|
|
|
| Investor | Admiral | Average Equity |
| Shares | Shares | Income Fund |
Equity Income Fund | 0.29% | 0.17% | 1.33% |
1 | The fund expense ratios shown are from the prospectus dated January 28, 2008. For the fiscal year ended September 30, 2008, the fund’s expense ratios were 0.30% for Investor Shares and 0.18% for Admiral Shares. The peer-group expense ratio is derived from data provided by Lipper Inc. and captures information through year-end 2007. |
4
In telecommunication services, the economic slowdown was evident in the returns of AT&T (–31%) and Verizon Communications (–24%). Energy stocks were another weak spot. After climbing to all-time highs earlier this year, prices for crude oil declined and sent energy stocks such as Chevron and Conoco-Phillips tumbling as the companies made plans to cut back on capital spending for exploration and production.
The fund has a track record of outperforming its peers
Over the past ten years, the Equity Income Fund has posted an average annual return of 5.3%, a little more than 1 percentage point above the average return of its peers. The fund also surpassed by more than 1 percentage point the annual return of the Dow Jones Wilshire 5000 Index, a common measure of the broad U.S. stock market.
In evaluating the fund’s long-term performance, it is important to note the disciplined investment strategies employed by the fund’s two advisors, Vanguard Quantitative Equity Group and Wellington Management Company, LLP. The Quantitative Equity Group uses sophisticated computer models to assess characteristics such as valuation, marketplace sentiment, and earnings quality. Wellington Management uses a more traditional approach of fundamental analysis to seek out stocks that have above-average dividend yields and below-average valuations. In addition to this diversity of management styles, the fund’s
Total Returns |
|
Ten Years Ended September 30, 2008 |
|
| Average |
| Annual Return |
Equity Income Fund Investor Shares | 5.3% |
Spliced Equity Income Index1 | 6.1 |
Average Equity Income Fund2 | 4.1 |
The figures shown represent past performance, which is not a guarantee of future results. (Current performance may be lower or higher than the performance data cited. For performance data current to the most recent month-end, visit our website at www.vanguard.com/performance.) Note, too, that both investment returns and principal value can fluctuate widely, so an investor’s shares, when sold, could be worth more or less than their original cost.
1 | Russell 1000 Value Index through July 31, 2007; FTSE High Dividend Yield Index thereafter. |
2 | Derived from data provided by Lipper Inc. |
5
performance has benefited from an extremely low expense ratio—more than 1 percentage point less than the peer-group average.
Uncertain markets require long-term perspective
The turbulence in the markets over the past year has left many people disappointed and uncertain about their investments. The stock market’s volatility has been jolting, but a long-term perspective suggests that these unpredictable movements are an unavoidable trade-off for the potential to earn long-term returns superior to those of lower-risk assets. In such uncertain times, seasoned investors understand that panic is not the answer.
The best response to uncertainty may be to diversify both within and across asset classes, which is why we counsel investors to hold a broadly diversified portfolio of stocks and fixed income investments in proportions consistent with their goals, risk tolerance, and time horizon.
In recent months, of course, even balanced portfolios of stocks and bonds have endured tough times, although they’ve performed better than an all-stock portfolio. Still, everything that history has taught us about the markets suggests that these principles can put you in the best position to achieve long-term investment success. We’re confident that Vanguard Equity Income Fund can play a valuable role in such a portfolio.
Thank you for entrusting your assets to Vanguard.
Sincerely,

F. William McNabb III
President and Chief Executive Officer October 17, 2008
6
Advisors’ Report
For the fiscal year ended September 30, the Equity Income Fund’s Investor Shares returned –18.9%, reflecting the combined results of your fund’s two independent investment advisors. The use of two advisors provides exposure to distinct, yet complementary, investment approaches, enhancing the diversification of your fund.
The advisors, the percentage of the fund’s assets each manages, and a brief description of their investment strategies are presented in the table below. The advisors have also prepared a discussion of the investment environment that existed during the fiscal year and of how their portfolio positioning reflects this assessment. These comments were prepared on October 21, 2008.
Wellington Management Company, LLP
Portfolio Manager:
W. Michael Reckmeyer, III CFA,
Vice President
In the United States, economic growth further decelerated toward the end of the fiscal year, amid a consensus that we are in a recession that will persist into 2009. The consumer is under continued strain from inflationary pressures related to food, energy, and medical costs in addition to rising unemployment and reduced wealth resulting from falling home and stock market values. The financial crisis has spread from subprime loans to encompass most consumer and corporate borrowing activity, which is further dampening economic prospects. The federal
Vanguard Equity Income Fund Investment Advisors | |||
|
|
|
|
| Fund Assets Managed |
| |
Investment Advisor | % | $ Million | Investment Strategy |
Wellington Management | 57 | 2,503 | A fundamental approach to seeking |
Company, LLP |
|
| desirable stocks. Our selections |
|
|
| typically offer above-average dividend |
|
|
| yields, below-average valuations, and the |
|
|
| potential for dividend increases in the |
|
|
| future. |
Vanguard Quantitative | 39 | 1,680 | Employs a quantitative fundamental |
Equity Group |
|
| management approach, using models |
|
|
| that assess valuation, market |
|
|
| sentiment, and earnings quality of |
|
|
| companies as compared with their peers. |
Cash Investments1 | 4 | 155 | — |
1 These short-term reserves are invested by Vanguard in equity index products to simulate investment in stocks. Each advisor also may maintain a modest cash position.
7
government has become increasingly aggressive in trying to find solutions to help resolve the financial crisis, but more actions may be necessary.
Economic growth has eroded outside the United States as well. Developed economies such as Japan and Europe are in, or close to, a recession, and emerging markets have also begun to slow.
Cautious positioning in the financial services sector has served the fund well, as we have attempted to invest in companies with attractive valuations, high dividend yields, and manageable subprime exposures.
Our largest purchases over the past 12 months included energy firms BP and Total, the pharmaceutical company Pfizer, and global bank JPMorgan Chase. Our sales included two large energy concerns, ConocoPhillips and ExxonMobil. Other sales resulted from stocks reaching or approaching our target prices, as was the case with Exelon, Southern, Citigroup, Pitney Bowes, UBS, and Wyeth.
Vanguard Quantitative Equity Group
Portfolio Manager:
James P. Stetler, Principal
As 2008 draws to a close, the global economy has decelerated, credit markets continue to stagnate, and the actions taken by world governments have yet to reduce uncertainty and stimulate recovery. The fiscal year has been an extremely difficult time for equity markets both in the United States and abroad. The U.S. market was off –21.5%, as measured by the Russell 3000 Index, and international equities were down by more than –30% in the MSCI EAFE Index.
The performance of our portion of the fund, relative to its benchmark, depends on our ability to rank stocks against their industry and market-capitalization peers and accurately predict the outperformers from the underperformers. This evaluation process relies on three independent stock-selection models to rank companies on their relative valuation, market sentiment, and earnings-quality characteristics. Relative to the benchmark, our portfolio
8
will generally have a lower price/earnings profile, a return-on-equity premium, and a similar expected earnings growth rate and dividend yield. In other words, we’re investing in profitable companies that are trading at lower valuation levels than their industry peers.
Our stock-selection results were strongest within the financial sector, as our model avoided or underweighted the sector’s poorest performers, such as Wachovia, SLM, National City, Citigroup, and Freddie Mac. We also benefited from an overweighted position in Wells Fargo. Tempering those results were disappointments in the materials and consumer staples sectors. Selections such as Freeport-McMoRan, Southern Copper, Lubrizol, ConAgra Foods, and SuperValu detracted from our overall results.
Uncertainty and volatility may be with us for a while. However, we will continue to manage the portfolio in a disciplined and prudent fashion, and we look forward to reporting to you in six months.
9
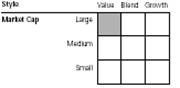
Fund Profile
As of September 30, 2008
Portfolio Characteristics |
|
| |
|
| Comparative | Broad |
| Fund | Index1 | Index2 |
Number of Stocks | 190 | 557 | 4,679 |
Median Market Cap | $49.3B | $50.1B | $29.6B |
Price/Earnings Ratio | 12.5x | 14.8x | 15.5x |
Price/Book Ratio | 1.9x | 2.0x | 2.2x |
Yield3 |
| 4.0% | 2.3% |
Investor Shares | 3.8% |
|
|
Admiral Shares | 3.9% |
|
|
Return on Equity | 20.0% | 20.0% | 20.0% |
Earnings Growth Rate | 12.4% | 9.5% | 17.7% |
Foreign Holdings | 5.1% | 0.0% | 0.0% |
Turnover Rate | 55% | — | — |
Expense Ratio |
|
|
|
(9/30/2007)4 |
| — | — |
Investor Shares | 0.29% |
|
|
Admiral Shares | 0.17% |
|
|
Short-Term Reserves | –1.1%5 | — | — |
Sector Diversification (% of equity exposure) | |||
|
| Comparative | Broad |
| Fund | Index1 | Index2 |
Consumer Discretionary | 4.6% | 6.1% | 9.2% |
Consumer Staples | 15.6 | 17.3 | 10.5 |
Energy | 8.0 | 6.3 | 12.6 |
Financials | 23.8 | 23.9 | 17.4 |
Health Care | 11.7 | 12.9 | 13.0 |
Industrials | 11.4 | 13.1 | 11.4 |
Information Technology | 3.0 | 1.4 | 15.6 |
Materials | 5.7 | 4.5 | 3.7 |
Telecommunication |
|
|
|
Services | 5.8 | 5.6 | 2.8 |
Utilities | 10.4 | 8.9 | 3.8 |
Volatility Measures6 |
| |
| Fund Versus | Fund Versus |
| Spliced Index7 | Broad Index2 |
R-Squared | 0.96 | 0.84 |
Beta | 0.88 | 0.77 |
Ten Largest Holdings8(% of total net assets) | ||
|
|
|
General Electric Co. | industrial conglomerates | 4.0% |
JPMorgan Chase & Co. | diversified financial services | 3.8 |
Bank of America Corp. | diversified financial services | 3.7 |
AT&T Inc. | integrated telecommunication services | 3.3 |
Chevron Corp. | integrated oil and gas | 3.3 |
Pfizer Inc. | pharmaceuticals | 2.7 |
U.S. Bancorp | diversified banks | 2.6 |
Verizon Communications Inc. | integrated telecommunication services | 2.1 |
Philip Morris International Inc. | tobacco | 2.0 |
Dominion Resources, Inc. | multi-utilities | 1.9 |
Top Ten |
| 29.4% |
Investment Focus
1 FTSE High Dividend Yield Index..
2 Dow Jones Wilshire 5000 Index.
3 30-day SEC yield for the fund; annualized dividend yield for the indexes. See the Glossary.
4 The expense ratios shown are from the prospectus dated January 28, 2008. For the fiscal year ended September 30, 2008, expense ratios were 0.30% for Investor Shares and 0.18% for Admiral Shares.
5 The fund invested a portion of its cash reserves in equity markets through the use of index futures contracts. After the effect of the futures investments, the fund’s temporary cash position was negative.
6 For an explanation of R-squared, beta, and other terms used here, see the Glossary.
7 Russell 1000 Value Index through July 31, 2007; FTSE High Dividend Yield Index thereafter.
8 The holdings listed exclude any temporary cash investments and equity index products.
10
Performance Summary
All of the returns in this report represent past performance, which is not a guarantee of future results that may be achieved by the fund. (Current performance may be lower or higher than the performance data cited. For performance data current to the most recent month-end, visit our website at www.vanguard.com/performance.) Note, too, that both investment returns and principal value can fluctuate widely, so an investor’s shares, when sold, could be worth more or less than their original cost. The returns shown do not reflect taxes that a shareholder would pay on fund distributions or on the sale of fund shares.
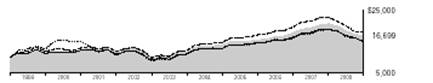
Cumulative Performance: September 30, 1998–September 30, 2008
Initial Investment of $10,000
|
|
| ||
| Average Annual Total Returns | Final Value | ||
Periods Ended September 30, 2008 | of a $10,000 | |||
| One Year | Five Years | Ten Years | Investment |
Equity Income Fund Investor Shares1 | –18.92% | 7.59% | 5.26% | $16,699 |
Dow Jones Wilshire 5000 Index | –21.20 | 6.04 | 4.00 | 14,801 |
Spliced Equity Income Index2 | –20.34 | 8.17 | 6.06 | 18,015 |
Average Equity Income Fund3 | –20.75 | 6.31 | 4.10 | 14,942 |
|
|
|
| Final Value |
|
|
| Since | of a $100,000 |
| One Year | Five Years | Inception4 | Investment |
Equity Income Fund Admiral Shares | –18.82% | 7.73% | 4.07% | $132,941 |
Dow Jones Wilshire 5000 Index | –21.20 | 6.04 | 2.75 | 121,384 |
Spliced Equity Income Index2 | –20.34 | 8.17 | 4.58 | 137,617 |
1 | Total returns do not include the account service fee that may be applicable to certain accounts with balances below $10,000. |
2 | Russell 1000 Value Index through July 31, 2007; FTSE High Dividend Yield Index thereafter. |
3 | Derived from data provided by Lipper Inc. |
4 | Performance for the fund’s Admiral Shares and its comparative standards is calculated since the inception of the share class: August 13, 2001. |
11
Fiscal-Year Total Returns (%): September 30, 1998–September 30, 2008
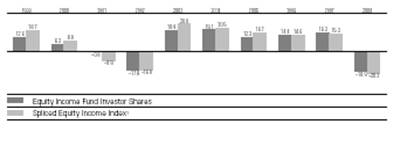
1Russell 1000 Value Index through July 31, 2007; FTSE High Dividend Yield Index thereafter. Note: See Financial Highlights tables for dividend and capital gains information.
12
Financial Statements
Statement of Net Assets
As of September 30, 2008
The fund provides a complete list of its holdings four times in each fiscal year, at the quarter-ends. For the second and fourth fiscal quarters, the lists appear in the fund’s semiannual and annual reports to shareholders. For the first and third fiscal quarters, the fund files the lists with the Securities and Exchange Commission on Form N-Q. Shareholders can look up the fund’s Forms N-Q on the SEC’s website at www.sec.gov. Forms N-Q may also be reviewed and copied at the SEC’s Public Reference Room (see the back cover of this report for further information).
|
| Market | |
|
| Value• | |
| Shares | ($000) | |
Common Stocks (96.1%)1 |
|
| |
Consumer Discretionary (4.2%) |
|
| |
| Home Depot, Inc. | 2,250,600 | 58,268 |
| Genuine Parts Co. | 968,200 | 38,931 |
| McDonald’s Corp. | 479,605 | 29,592 |
| VF Corp. | 108,000 | 8,350 |
| CBS Corp. | 480,900 | 7,012 |
| Hasbro, Inc. | 194,800 | 6,763 |
| Black & Decker Corp. | 107,300 | 6,518 |
| Darden Restaurants Inc. | 202,100 | 5,786 |
| Limited Brands, Inc. | 298,100 | 5,163 |
| ArvinMeritor, Inc. | 368,700 | 4,808 |
| Oxford Industries, Inc. | 116,800 | 3,017 |
| Jones Apparel Group, Inc. | 94,100 | 1,742 |
| Carnival Corp. | 45,400 | 1,605 |
| Sherwin-Williams Co. | 21,500 | 1,229 |
| Autoliv, Inc. | 31,300 | 1,056 |
| Whirlpool Corp. | 7,200 | 571 |
| Superior Industries International, Inc. | 25,400 | 487 |
| Sinclair Broadcast Group, Inc. | 82,000 | 413 |
|
| 181,311 | |
Consumer Staples (14.9%) |
|
| |
| Philip Morris |
|
|
| International Inc. | 1,804,755 | 86,809 |
| The Procter & Gamble Co. | 1,114,220 | 77,650 |
| Nestle SA ADR | 1,601,100 | 68,967 |
| Kimberly-Clark Corp. | 892,975 | 57,901 |
| Altria Group, Inc. | 2,796,355 | 55,480 |
| PepsiCo, Inc. | 546,000 | 38,913 |
| The Coca-Cola Co. | 693,505 | 36,673 |
| General Mills, Inc. | 460,873 | 31,671 |
| ConAgra Foods, Inc. | 1,436,300 | 27,950 |
| Unilever NV ADR | 832,600 | 23,446 |
| SuperValu Inc. | 996,000 | 21,613 |
| Lorillard, Inc. | 299,900 | 21,338 |
| Diageo PLC ADR | 278,150 | 19,153 |
| Kraft Foods Inc. | 489,089 | 16,018 |
| Anheuser-Busch Cos., Inc. | 162,800 | 10,563 |
| Colgate-Palmolive Co. | 111,900 | 8,432 |
| Reynolds American Inc. | 173,000 | 8,411 |
| H.J. Heinz Co. | 162,900 | 8,130 |
| Avon Products, Inc. | 183,000 | 7,607 |
| Nu Skin Enterprises, Inc. | 346,200 | 5,615 |
| Universal Corp. (VA) | 92,900 | 4,561 |
| J.M. Smucker Co. | 74,200 | 3,761 |
| UST, Inc. | 50,700 | 3,374 |
| Lancaster Colony Corp. | 46,100 | 1,736 |
| Sysco Corp. | 40,100 | 1,236 |
| Nash-Finch Co. | 4,100 | 177 |
|
|
| 647,185 |
Energy (7.4%) |
|
| |
| Chevron Corp. | 1,718,400 | 141,734 |
| ConocoPhillips Co. | 963,900 | 70,606 |
| Total SA ADR | 741,500 | 44,994 |
| BP PLC ADR | 715,700 | 35,907 |
| Marathon Oil Corp. | 532,800 | 21,243 |
| Patterson-UTI Energy, Inc. | 215,600 | 4,316 |
| Spectra Energy Corp. | 67,700 | 1,611 |
|
|
| 320,411 |
Exchange-Traded Fund (1.2%) |
|
| |
| Vanguard Value ETF | 963,400 | 50,492 |
|
|
|
|
Financials (22.9%) |
|
| |
| Capital Markets (1.6%) |
|
|
| Bank of New York Mellon Corp. | 1,338,270 | 43,601 |
| Morgan Stanley | 524,900 | 12,073 |
| Merrill Lynch & Co., Inc. | 317,600 | 8,035 |
^ | Allied Capital Corp. | 236,700 | 2,556 |
| Waddell & Reed Financial, Inc. | 64,000 | 1,584 |
| Federated Investors, Inc. | 46,257 | 1,334 |
|
|
|
|
| Commercial Banks (7.0%) |
|
|
| U.S. Bancorp | 3,098,676 | 111,614 |
| Wells Fargo & Co. | 2,003,220 | 75,181 |
| PNC Financial Services Group | 777,182 | 58,055 |
^ | BB&T Corp. | 335,500 | 12,682 |
13
|
|
| Market |
|
|
| Value• |
|
| Shares | ($000) |
| Fifth Third Bancorp | 522,112 | 6,213 |
| Bank of Hawaii Corp. | 104,000 | 5,559 |
^ | First BanCorp Puerto Rico | 489,800 | 5,417 |
| FirstMerit Corp. | 218,600 | 4,591 |
| Pacific Capital Bancorp | 213,148 | 4,338 |
| NBT Bancorp, Inc. | 118,058 | 3,532 |
| Regions Financial Corp. | 292,900 | 2,812 |
| Popular, Inc. | 293,361 | 2,432 |
| SunTrust Banks, Inc. | 51,300 | 2,308 |
| Wachovia Corp. | 491,100 | 1,719 |
| Huntington Bancshares Inc. | 200,600 | 1,603 |
| First Merchants Corp. | 66,809 | 1,523 |
| Comerica, Inc. | 36,000 | 1,180 |
| Commerce Bancshares, Inc. | 24,600 | 1,141 |
| First Community Bancshares, Inc. | 26,137 | 981 |
| City Holding Co. | 20,380 | 861 |
| National Penn Bancshares Inc. | 43,300 | 632 |
| Oriental Financial Group Inc. | 29,000 | 518 |
| City Bank Lynnwood (WA) | 1,263 | 20 |
|
|
|
|
| Consumer Finance (0.1%) |
|
|
| Advanta Corp. Class B | 199,892 | 1,645 |
|
|
|
|
| Diversified Financial Services (8.6%) |
| |
| JPMorgan Chase & Co. | 3,493,800 | 163,160 |
| Bank of America Corp. | 4,552,138 | 159,325 |
| Citigroup, Inc. | 2,497,300 | 51,220 |
|
|
|
|
| Insurance (4.5%) |
|
|
| The Chubb Corp. | 1,109,662 | 60,920 |
| The Allstate Corp. | 1,172,900 | 54,094 |
| Ace Ltd. | 690,200 | 37,360 |
| The Travelers Cos., Inc. | 322,800 | 14,591 |
| The Hartford Financial Services Group Inc. | 196,208 | 8,043 |
| Axis Capital Holdings Ltd. | 212,100 | 6,726 |
| Aspen Insurance Holdings Ltd. | 228,000 | 6,270 |
| IPC Holdings Ltd. | 181,800 | 5,492 |
| Endurance Specialty Holdings Ltd. | 40,100 | 1,240 |
| Safety Insurance Group, Inc. | 27,300 | 1,035 |
|
|
|
|
| Real Estate Investment Trusts (REITs) (0.9%) |
| |
| Host Hotels & Resorts Inc. REIT | 2,295,700 | 30,510 |
| Kimco Realty Corp. REIT | 242,809 | 8,969 |
|
|
|
|
| Thrifts & Mortgage Finance (0.2%) |
|
|
| Hudson City Bancorp, Inc. | 394,200 | 7,273 |
| New York Community Bancorp, Inc. | 159,900 | 2,685 |
|
|
| 994,653 |
| Health Care (11.0%) |
|
|
| Pfizer Inc. | 6,278,031 | 115,767 |
| Johnson & Johnson | 1,045,205 | 72,412 |
| Abbott Laboratories | 1,240,070 | 71,403 |
| Bristol-Myers Squibb Co. | 2,254,132 | 46,999 |
| Eli Lilly & Co. | 1,024,949 | 45,128 |
| Wyeth | 1,162,498 | 42,943 |
| GlaxoSmithKline PLC ADR | 783,700 | 34,060 |
| Baxter International, Inc. | 367,900 | 24,145 |
| Merck & Co., Inc. | 728,714 | 22,998 |
| Owens & Minor, Inc. Holding Co. | 31,900 | 1,547 |
|
|
| 477,402 |
| Industrials (10.8%) |
|
|
| General Electric Co. | 6,766,172 | 172,537 |
| Waste Management, Inc. | 1,675,500 | 52,761 |
| Norfolk Southern Corp. | 548,000 | 36,283 |
| 3M Co. | 506,900 | 34,626 |
| PACCAR, Inc. | 780,800 | 29,819 |
| Schneider Electric SA | 327,443 | 28,119 |
| Caterpillar, Inc. | 289,800 | 17,272 |
| Honeywell International Inc. | 361,762 | 15,031 |
| Raytheon Co. | 240,700 | 12,880 |
| Northrop Grumman Corp. | 189,813 | 11,491 |
| United Parcel Service, Inc. | 151,800 | 9,547 |
| Emerson Electric Co. | 158,200 | 6,453 |
| GATX Corp. | 143,676 | 5,685 |
| The Timken Co. | 192,400 | 5,455 |
| Arkansas Best Corp. | 152,000 | 5,121 |
| R.R. Donnelley & Sons Co. | 201,600 | 4,945 |
| Pacer International, Inc. | 250,611 | 4,128 |
| Eaton Corp. | 72,200 | 4,056 |
| Republic Services, Inc. Class A | 119,651 | 3,587 |
| Illinois Tool Works, Inc. | 65,900 | 2,929 |
| A.O. Smith Corp. | 57,467 | 2,252 |
| Hubbell Inc. Class B | 43,100 | 1,511 |
| The Standard Register Co. | 149,600 | 1,474 |
| Applied Industrial Technology, Inc. | 41,800 | 1,126 |
| Genco Shipping and Trading Ltd. | 23,100 | 768 |
| Horizon Lines Inc. | 47,927 | 473 |
|
|
| 470,329 |
| Information Technology (2.5%) |
|
|
| Microsoft Corp. | 1,600,700 | 42,723 |
| Intel Corp. | 2,118,400 | 39,678 |
| Automatic Data Processing, Inc. | 279,800 | 11,961 |
| Analog Devices, Inc. | 185,000 | 4,875 |
| Xilinx, Inc. | 189,300 | 4,439 |
| Diebold, Inc. | 48,600 | 1,609 |
| infoGROUP, Inc. | 145,583 | 962 |
| United Online, Inc. | 73,300 | 690 |
14
|
| Market | |
|
| Value• | |
| Shares | ($000) | |
| Linear Technology Corp. | 13,700 | 420 |
| Methode Electronics, Inc. Class A | 32,711 | 292 |
|
| 107,649 | |
|
|
| |
Materials (5.5%) |
|
| |
| E.I. du Pont de Nemours & Co. | 992,627 | 40,003 |
| Dow Chemical Co. | 1,236,745 | 39,304 |
| Packaging Corp. of America | 1,408,800 | 32,656 |
| International Paper Co. | 1,103,800 | 28,897 |
| PPG Industries, Inc. | 421,500 | 24,582 |
| Air Products & Chemicals, Inc. | 322,800 | 22,108 |
| Nucor Corp. | 207,200 | 8,184 |
| Freeport-McMoRan Copper & Gold, Inc. Class B | 131,700 | 7,487 |
| Alcoa Inc. | 320,500 | 7,237 |
| Eastman Chemical Co. | 116,600 | 6,420 |
| Lubrizol Corp. | 129,600 | 5,591 |
| Southern Copper Corp. (U.S. Shares) | 246,900 | 4,711 |
| Worthington Industries, Inc. | 313,900 | 4,690 |
| Compass Minerals International, Inc. | 66,600 | 3,489 |
| Bemis Co., Inc. | 82,800 | 2,163 |
| Ashland, Inc. | 59,000 | 1,725 |
| Greif Inc. Class B Shares | 14,101 | 736 |
|
| 239,983 | |
Telecommunication Services (5.6%) |
| ||
| AT&T Inc. | 5,129,005 | 143,202 |
| Verizon Communications Inc. | 2,862,557 | 91,859 |
| Embarq Corp. | 143,800 | 5,831 |
| Windstream Corp. | 5,100 | 56 |
|
| 240,948 | |
Utilities (10.1%) |
|
| |
| Dominion Resources, Inc. | 1,889,930 | 80,851 |
| FPL Group, Inc. | 1,270,666 | 63,915 |
| Consolidated Edison Inc. | 1,435,100 | 61,652 |
| American Electric Power Co., Inc. | 1,097,000 | 40,677 |
| PG&E Corp. | 930,400 | 34,844 |
| Entergy Corp. | 303,400 | 27,006 |
| SCANA Corp. | 545,700 | 21,244 |
| Southern Co. | 410,200 | 15,460 |
| Duke Energy Corp. | 744,734 | 12,981 |
| Exelon Corp. | 155,900 | 9,762 |
| Edison International | 226,000 | 9,017 |
| MDU Resources Group, Inc. | 250,700 | 7,270 |
| Sempra Energy | 139,500 | 7,041 |
| ONEOK, Inc. | 176,900 | 6,085 |
| Alliant Energy Corp. | 188,900 | 6,084 |
| Public Service Enterprise Group, Inc. | 175,200 | 5,745 |
| DTE Energy Co. | 138,500 | 5,557 |
| Progress Energy, Inc. | 128,300 | 5,534 |
| PPL Corp. | 124,100 | 4,594 |
| Xcel Energy, Inc. | 147,866 | 2,956 |
| FirstEnergy Corp. | 36,800 | 2,465 | |
| Wisconsin Energy Corp. | 43,100 | 1,935 | |
| Pepco Holdings, Inc. | 68,800 | 1,576 | |
| DPL Inc. | 35,200 | 873 | |
| UGI Corp. Holding Co. | 28,600 | 737 | |
|
|
| 435,861 | |
Total Common Stocks |
|
| ||
(Cost $4,230,738) |
| 4,166,224 | ||
Temporary Cash Investments (1.8%)1 |
|
| ||
Money Market Fund (1.3%) |
|
| ||
2,3 | Vanguard Market |
|
| |
| Liquidity Fund, 2.296% | 56,252,685 | 56,253 | |
|
|
|
| |
|
| Face |
| |
|
| Amount |
| |
|
| ($000) |
| |
Repurchase Agreement (0.3%) |
|
| ||
| JPMorgan Securities Inc. |
|
| |
| 1.750%, 10/1/08 |
|
| |
| (Dated 9/30/08, |
|
| |
| Repurchase Value |
|
| |
| $12,901,000, |
|
| |
| collateralized by |
|
| |
| Federal National |
|
| |
| Mortgage Assn. |
|
| |
| 5.000%–7.000%, |
|
| |
| 8/1/20–4/1/38) | 12,900 | 12,900 | |
|
|
|
| |
U.S. Agency Obligation (0.2%) |
|
| ||
4,5 | Federal Home Loan Bank |
|
| |
| 2.576%, 11/24/08 | 9,500 | 9,454 | |
Total Temporary Cash Investments |
|
| ||
(Cost $78,616) |
| 78,607 | ||
Total Investments (97.9%) |
|
| ||
(Cost $4,309,354) |
| 4,244,831 | ||
Other Assets and Liabilities (2.1%) |
|
| ||
Other Assets |
| 132,527 | ||
Liabilities3 |
| (39,584) | ||
|
|
| 92,943 | |
Net Assets (100%) |
| 4,337,774 | ||
15
At September 30, 2008, net assets consisted of:
| Amount |
| ($000) |
Paid-in Capital | 4,402,218 |
Overdistributed Net Investment Income | (3,809) |
Accumulated Net Realized Gains | 7,303 |
Unrealized Appreciation (Depreciation) |
|
Investment Securities | (64,523) |
Futures Contracts | (3,392) |
Foreign Currencies | (23) |
Net Assets | 4,337,774 |
|
|
Investor Shares—Net Assets |
|
Applicable to 131,158,645 outstanding |
|
$.001 par value shares of beneficial |
|
interest (unlimited authorization) | 2,626,378 |
Net Asset Value Per Share— Investor Shares | $20.02 |
|
|
Admiral Shares—Net Assets |
|
Applicable to 40,776,380 outstanding |
|
$.001 par value shares of beneficial |
|
interest (unlimited authorization) | 1,711,396 |
Net Asset Value Per Share— Admiral Shares | $41.97 |
• See Note A in Notes to Financial Statements.
^ Part of security position is on loan to broker-dealers. The total value of securities on loan is $10,183,000.
1The fund invests a portion of its cash reserves in equity markets through the use of index futures contracts. After giving effect to futures investments, the fund’s effective common stock and temporary cash investment positions represent 98.7% and (–0.8%), respectively, of net assets.
2 Affiliated money market fund available only to Vanguard funds and certain trusts and accounts managed by Vanguard. Rate shown is the 7-day yield.
3 Includes $10,687,000 of collateral received for securities on loan.
4 Securities with a value of $9,454,000 have been segregated as initial margin for open futures contracts.
5 The issuer operates under a congressional charter; its securities are neither issued nor guaranteed by the U.S. government. ADR—American Depositary Receipt.
REIT—Real Estate Investment Trust.
See accompanying Notes, which are an integral part of the Financial Statements.
16
Statement of Operations
| Year Ended |
| September 30, 2008 |
| ($000) |
Investment Income |
|
Income |
|
Dividends1,2 | 174,096 |
Interest2 | 4,821 |
Security Lending | 626 |
Total Income | 179,543 |
Expenses |
|
Investment Advisory Fees—Note B |
|
Basic Fee | 3,584 |
Performance Adjustment | 247 |
The Vanguard Group—Note C |
|
Management and Administrative—Investor Shares | 5,858 |
Management and Administrative—Admiral Shares | 1,553 |
Marketing and Distribution—Investor Shares | 656 |
Marketing and Distribution—Admiral Shares | 378 |
Custodian Fees | 46 |
Auditing Fees | 25 |
Shareholders’ Reports—Investor Shares | 72 |
Shareholders’ Reports—Admiral Shares | 8 |
Trustees’ Fees and Expenses | 8 |
Total Expenses | 12,435 |
Expenses Paid Indirectly | (105) |
Net Expenses | 12,330 |
Net Investment Income | 167,213 |
Realized Net Gain (Loss) |
|
Investment Securities Sold2 | 65,854 |
Futures Contracts | (21,930) |
Foreign Currencies | (5) |
Realized Net Gain (Loss) | 43,919 |
Change in Unrealized Appreciation (Depreciation) |
|
Investment Securities | (1,250,819) |
Futures Contracts | (6,371) |
Foreign Currencies | (23) |
Change in Unrealized Appreciation (Depreciation) | (1,257,213) |
Net Increase (Decrease) in Net Assets Resulting from Operations | (1,046,081) |
1 | Dividends are net of foreign withholding taxes of $665,000. |
2 | Dividend income, interest income, and realized net gain (loss) from affiliated companies of the fund were $1,799,000, $2,732,000, and $0, respectively. |
See accompanying Notes, which are an integral part of the Financial Statements.
17
Statement of Changes in Net Assets
| Year Ended September 30, | |
| 2008 | 2007 |
| ($000) | ($000) |
Increase (Decrease) in Net Assets |
|
|
Operations |
|
|
Net Investment Income | 167,213 | 154,496 |
Realized Net Gain (Loss) | 43,919 | 362,346 |
Change in Unrealized Appreciation (Depreciation) | (1,257,213) | 291,868 |
Net Increase (Decrease) in Net Assets Resulting from Operations | (1,046,081) | 808,710 |
Distributions |
|
|
Net Investment Income |
|
|
Investor Shares | (101,519) | (92,731) |
Admiral Shares | (68,969) | (61,257) |
Realized Capital Gain1 |
|
|
Investor Shares | (170,339) | (174,299) |
Admiral Shares | (112,961) | (105,036) |
Total Distributions | (453,788) | (433,323) |
Capital Share Transactions |
|
|
Investor Shares | 86,183 | 176,982 |
Admiral Shares | 49,809 | 330,863 |
Net Increase (Decrease) from Capital Share Transactions | 135,992 | 507,845 |
Total Increase (Decrease) | (1,363,877) | 883,232 |
Net Assets |
|
|
Beginning of Period | 5,701,651 | 4,818,419 |
End of Period2 | 4,337,774 | 5,701,651 |
1 Includes fiscal 2008 and 2007 short-term gain distributions totaling $32,961,000 and $30,140,000, respectively. Short-term gain distributions are treated as ordinary income dividends for tax purposes.
2 Net Assets—End of Period includes undistributed (overdistributed) net investment income of ($3,809,000) and ($529,000). See accompanying Notes, which are an integral part of the Financial Statements.
18
Financial Highlights
Investor Shares |
|
|
|
|
|
|
|
|
|
|
|
|
| ||||
For a Share Outstanding | Year Ended September 30, | ||||
Throughout Each Period | 2008 | 2007 | 2006 | 2005 | 2004 |
Net Asset Value, Beginning of Period | $27.01 | $25.21 | $23.73 | $22.82 | $20.11 |
Investment Operations |
|
|
|
|
|
Net Investment Income | .770 | .733 | .703 | .653 | .576 |
Net Realized and Unrealized Gain (Loss) |
|
|
|
|
|
on Investments | (5.617) | 3.215 | 2.541 | 2.069 | 3.196 |
Total from Investment Operations | (4.847) | 3.948 | 3.244 | 2.722 | 3.772 |
Distributions |
|
|
|
|
|
Dividends from Net Investment Income | (.785) | (.730) | (.710) | (.640) | (.585) |
Distributions from Realized Capital Gains | (1.358) | (1.418) | (1.054) | (1.172) | (.477) |
Total Distributions | (2.143) | (2.148) | (1.764) | (1.812) | (1.062) |
Net Asset Value, End of Period | $20.02 | $27.01 | $25.21 | $23.73 | $22.82 |
|
|
|
|
|
|
Total Return1 | –18.92% | 16.29% | 14.39% | 12.27% | 19.07% |
|
|
|
|
|
|
Ratios/Supplemental Data |
|
|
|
|
|
Net Assets, End of Period (Millions) | $2,626 | $3,445 | $3,035 | $2,934 | $2,838 |
Ratio of Total Expenses to |
|
|
|
|
|
Average Net Assets2 | 0.30% | 0.29% | 0.31% | 0.32% | 0.32% |
Ratio of Net Investment Income to |
|
|
|
|
|
Average Net Assets | 3.30% | 2.79% | 2.94% | 2.80% | 2.61% |
Portfolio Turnover Rate | 55% | 51% | 26% | 42% | 36% |
1 | Total returns do not include the account service fee that may be applicable to certain accounts with balances below $10,000. |
2 | Includes performance-based investment advisory fee increases (decreases) of 0.00%, 0.00%, (0.01%), (0.01%), and 0.00%. See accompanying Notes, which are an integral part of the Financial Statements. |
19
Admiral Shares |
|
|
|
|
|
|
|
|
|
|
|
|
|
|
| ||
For a Share Outstanding | Year Ended September 30, | ||||
Throughout Each Period | 2008 | 2007 | 2006 | 2005 | 2004 |
Net Asset Value, Beginning of Period | $56.62 | $52.84 | $49.74 | $47.83 | $42.15 |
Investment Operations |
|
|
|
|
|
Net Investment Income | 1.673 | 1.601 | 1.545 | 1.434 | 1.255 |
Net Realized and Unrealized Gain (Loss) |
|
|
|
|
|
on Investments | (11.772) | 6.746 | 5.324 | 4.338 | 6.698 |
Total from Investment Operations | (10.099) | 8.347 | 6.869 | 5.772 | 7.953 |
Distributions |
|
|
|
|
|
Dividends from Net Investment Income | (1.705) | (1.595) | (1.560) | (1.406) | (1.273) |
Distributions from Realized Capital Gains | (2.846) | (2.972) | (2.209) | (2.456) | (1.000) |
Total Distributions | (4.551) | (4.567) | (3.769) | (3.862) | (2.273) |
Net Asset Value, End of Period | $41.97 | $56.62 | $52.84 | $49.74 | $47.83 |
|
|
|
|
|
|
Total Return | –18.82% | 16.44% | 14.55% | 12.42% | 19.19% |
|
|
|
|
|
|
Ratios/Supplemental Data |
|
|
|
|
|
Net Assets, End of Period (Millions) | $1,711 | $2,256 | $1,783 | $1,417 | $610 |
Ratio of Total Expenses to |
|
|
|
|
|
Average Net Assets1 | 0.18% | 0.17% | 0.17% | 0.19% | 0.22% |
Ratio of Net Investment Income to |
|
|
|
|
|
Average Net Assets | 3.42% | 2.91% | 3.08% | 2.96% | 2.71% |
Portfolio Turnover Rate | 55% | 51% | 26% | 42% | 36% |
1 Includes performance-based investment advisory fee increases (decreases) of 0.00%, 0.00%, (0.01%), (0.01%), and 0.00%. See accompanying Notes, which are an integral part of the Financial Statements.
20
Notes to Financial Statements
Vanguard Equity Income Fund is registered under the Investment Company Act of 1940 as an open-end investment company, or mutual fund. The fund offers two classes of shares, Investor Shares and Admiral Shares. Investor Shares are available to any investor who meets the fund’s minimum purchase requirements. Admiral Shares are designed for investors who meet certain administrative, service, tenure, and account-size criteria.
A. The following significant accounting policies conform to generally accepted accounting principles for U.S. mutual funds. The fund consistently follows such policies in preparing its financial statements.
1. Security Valuation: Securities are valued as of the close of trading on the New York Stock Exchange (generally 4 p.m., Eastern time) on the valuation date. Equity securities are valued at the latest quoted sales prices or official closing prices taken from the primary market in which each security trades; such securities not traded on the valuation date are valued at the mean of the latest quoted bid and asked prices. Securities for which market quotations are not readily available, or whose values have been affected by events occurring before the fund’s pricing time but after the close of the securities’ primary markets, are valued at their fair values calculated according to procedures adopted by the board of trustees. These procedures include obtaining quotations from an independent pricing service, monitoring news to identify significant market- or security-specific events, and evaluating changes in the values of foreign market proxies (for example, ADRs, futures contracts, or exchange-traded funds), between the time the foreign markets close and the fund’s pricing time. When fair-value pricing is employed, the prices of securities used by a fund to calculate its net asset value may differ from quoted or published prices for the same securities. Investments in Vanguard Market Liquidity Fund are valued at that fund’s net asset value. Temporary cash investments acquired over 60 days to maturity are valued using the latest bid prices or using valuations based on a matrix system (which considers such factors as security prices, yields, maturities, and ratings), both as furnished by independent pricing services. Other temporary cash investments are valued at amortized cost, which approximates market value.
2. Foreign Currency: Securities and other assets and liabilities denominated in foreign currencies are translated into U.S. dollars using exchange rates obtained from an independent third party as of the fund’s pricing time on the valuation date. Realized gains (losses) and unrealized appreciation (depreciation) on investment securities include the effects of changes in exchange rates since the securities were purchased, combined with the effects of changes in security prices. Fluctuations in the value of other assets and liabilities resulting from changes in exchange rates are recorded as unrealized foreign currency gains (losses) until the assets or liabilities are settled in cash, at which time they are recorded as realized foreign currency gains (losses).
3. Futures Contracts: The fund uses index futures contracts to a limited extent, with the objective of maintaining full exposure to the stock market while maintaining liquidity. The fund may purchase or sell futures contracts to achieve a desired level of investment, whether to accommodate portfolio turnover or cash flows from capital share transactions. The primary risks associated with the use of futures contracts are imperfect correlation between changes in market values of stocks held by the fund and the prices of futures contracts, and the possibility of an illiquid market.
Futures contracts are valued at their quoted daily settlement prices. The aggregate principal amounts of the contracts are not recorded in the Statement of Net Assets. Fluctuations in the value of the contracts are recorded in the Statement of Net Assets as an asset (liability) and in the Statement of Operations as unrealized appreciation (depreciation) until the contracts are closed, when they are recorded as realized futures gains (losses).
21
4. Repurchase Agreements: The fund may invest in repurchase agreements. Securities pledged as collateral for repurchase agreements are held by a custodian bank until the agreements mature. Each agreement requires that the market value of the collateral be sufficient to cover payments of interest and principal; however, in the event of default or bankruptcy by the other party to the agreement, retention of the collateral may be subject to legal proceedings.
5. Federal Income Taxes: The fund intends to continue to qualify as a regulated investment company and distribute all of its taxable income. Management has analyzed the fund’s tax positions taken on federal income tax returns for all open tax years (tax years ended September 30, 2005–2008), and has concluded that no provision for federal income tax is required in the fund’s financial statements.
6. Distributions: Distributions to shareholders are recorded on the ex-dividend date.
7. Security Lending: The fund may lend its securities to qualified institutional borrowers to earn additional income. Security loans are required to be secured at all times by collateral at least equal to the market value of securities loaned. The fund invests cash collateral received in Vanguard Market Liquidity Fund, and records a liability for the return of the collateral, during the period the securities are on loan. Security lending income represents the income earned on investing cash collateral, less expenses associated with the loan.
8. Other: Dividend income is recorded on the ex-dividend date. Interest income includes income distributions received from Vanguard Market Liquidity Fund and is accrued daily. Security transactions are accounted for on the date securities are bought or sold. Costs used to determine realized gains (losses) on the sale of investment securities are those of the specific securities sold.
Each class of shares has equal rights as to assets and earnings, except that each class separately bears certain class-specific expenses related to maintenance of shareholder accounts (included in Management and Administrative expenses) and shareholder reporting. Marketing and distribution expenses are allocated to each class of shares based on a method approved by the board of trustees. Income, other non-class-specific expenses, and gains and losses on investments are allocated to each class of shares based on its relative net assets.
B. Wellington Management Company, LLP, provides investment advisory services to a portion of the fund for a fee calculated at an annual percentage rate of average net assets managed by the advisor. The basic fee for Wellington Management Company, LLP, is subject to quarterly adjustments based on the fund’s performance for the preceding three years relative to the Lipper Equity Income Average for periods prior to April 1, 2008, and the new benchmark, the FTSE High Dividend Yield Index, beginning April 1, 2008. The benchmark change will be fully phased in by March 2011.
The Vanguard Group provides investment advisory services to a portion of the fund on an at-cost basis; the fund paid Vanguard advisory fees of $408,000 for the year ended September 30, 2008.
For the year ended September 30, 2008, the aggregate investment advisory fee represented an effective annual basic rate of 0.07% of the fund’s average net assets before an increase of $247,000 (0.00%) based on performance.
C. The Vanguard Group furnishes at cost corporate management, administrative, marketing, and distribution services. The costs of such services are allocated to the fund under methods approved by the board of trustees. The fund has committed to provide up to 0.40% of its net assets in capital contributions to Vanguard. At September 30, 2008, the fund had contributed capital of $395,000 to Vanguard (included in Other Assets), representing 0.01% of the fund’s net assets and 0.39% of Vanguard’s capitalization. The fund’s trustees and officers are also directors and officers of Vanguard.
22
D. The fund has asked its investment advisors to direct certain security trades, subject to obtaining the best price and execution, to brokers who have agreed to rebate to the fund part of the commissions generated. Such rebates are used solely to reduce the fund’s management and administrative expenses. The fund’s custodian bank has also agreed to reduce its fees when the fund maintains cash on deposit in the non-interest-bearing custody account. For the year ended September 30, 2008, these arrangements reduced the fund’s management and administrative expenses by $96,000 and custodian fees by $9,000.
E. Distributions are determined on a tax basis and may differ from net investment income and realized capital gains for financial reporting purposes. Differences may be permanent or temporary. Permanent differences are reclassified among capital accounts in the financial statements to reflect their tax character. Temporary differences arise when certain items of income, expense, gain, or loss are recognized in different periods for financial statement and tax purposes; these differences will reverse at some time in the future. Differences in classification may also result from the treatment of short-term gains as ordinary income for tax purposes.
During the year ended September 30, 2008, the fund realized net foreign currency losses of $5,000, which decreased distributable net income for tax purposes; accordingly, such losses have been reclassified from accumulated net realized gains to undistributed net investment income.
The fund used a tax accounting practice to treat a portion of the price of capital shares redeemed during the year as distributions from realized capital gains. Accordingly, the fund has reclassified $21,911,000 from accumulated net realized gains to paid-in capital.
For tax purposes, at September 30, 2008, the fund had $4,919,000 of ordinary income and $24,436,000 of long-term capital gains available for distribution.
At September 30, 2008, the cost of investment securities for tax purposes was $4,329,879,000. Net unrealized depreciation of investment securities for tax purposes was $85,048,000, consisting of unrealized gains of $413,657,000 on securities that had risen in value since their purchase and $498,705,000 in unrealized losses on securities that had fallen in value since their purchase.
At September 30, 2008, the aggregate settlement value of open futures contracts expiring in December 2008 and the related unrealized appreciation (depreciation) were:
|
| ($000) | |
| Number of | Aggregate | Unrealized |
| Long (Short) | Settlement | Appreciation |
Futures Contracts | Contracts | Value | (Depreciation) |
E-Mini S&P 500 Index | 1,023 | 59,794 | (258) |
S&P 500 Index | 188 | 54,943 | (3,134) |
Unrealized appreciation (depreciation) on open futures contracts is required to be treated as realized gain (loss) for tax purposes.
F. During the year ended September 30, 2008, the fund purchased $2,696,188,000 of investment securities and sold $2,898,868,000 of investment securities, other than temporary cash investments.
23
G. Capital share transactions for each class of shares were:
| Year Ended September 30, | |||
| 2008 | 2007 | ||
| Amount | Shares | Amount | Shares |
| ($000) | (000) | ($000) | (000) |
Investor Shares |
|
|
|
|
Issued | 451,252 | 19,519 | 709,555 | 27,339 |
Issued in Lieu of Cash Distributions | 250,105 | 10,727 | 244,816 | 9,571 |
Redeemed | (615,174) | (26,649) | (777,389) | (29,743) |
Net Increase (Decrease)—Investor Shares | 86,183 | 3,597 | 176,982 | 7,167 |
Admiral Shares |
|
|
|
|
Issued | 280,117 | 5,772 | 524,010 | 9,574 |
Issued in Lieu of Cash Distributions | 152,414 | 3,117 | 138,185 | 2,575 |
Redeemed | (382,722) | (7,963) | (331,332) | (6,045) |
Net Increase (Decrease)—Admiral Shares | 49,809 | 926 | 330,863 | 6,104 |
H. In September 2006, the Financial Accounting Standards Board issued Statement of Financial Accounting Standards No. 157 (“FAS 157”), “Fair Value Measurements.” FAS 157 establishes a framework for measuring fair value and expands disclosures about fair value measurements in financial statements.
The various inputs that may be used to determine the value of the fund’s investments are summarized in three broad levels. The inputs or methodologies used for valuing securities are not necessarily an indication of the risk associated with investing in those securities.
Level 1—Quoted prices in active markets for identical securities.
Level 2—Other significant observable inputs (including quoted prices for similar securities, interest rates, prepayment speeds, credit risk, etc.).
Level 3—Significant unobservable inputs (including the fund’s own assumptions used to determine the fair value of investments).
The following table summarizes the fund’s investments as of September 30, 2008, based on the inputs used to value them:
| Investments | Futures |
| in Securities | Contracts |
Valuation Inputs | ($000) | ($000) |
Level 1—Quoted prices | 4,194,358 | (3,392) |
Level 2—Other significant observable inputs | 50,473 | — |
Level 3—Significant unobservable inputs | — | — |
Total | 4,244,831 | (3,392) |
24
Report of Independent Registered
Public Accounting Firm
To the Trustees of Vanguard Fenway Funds and the Shareholders of Vanguard Equity Income Fund:
In our opinion, the accompanying statement of net assets and the related statements of operations and of changes in net assets and the financial highlights present fairly, in all material respects, the financial position of Vanguard Equity Income Fund (the “Fund”) at September 30, 2008, the results of its operations for the year then ended, the changes in its net assets for each of the two years in the period then ended and the financial highlights for each of the five years in the period then ended, in conformity with accounting principles generally accepted in the United States of America. These financial statements and financial highlights (hereafter referred to as “financial statements”) are the responsibility of the Fund’s management; our responsibility is to express an opinion on these financial statements based on our audits. We conducted our audits of these financial statements in accordance with the standards of the Public Company Accounting Oversight Board (United States). Those standards require that we plan and perform the audit to obtain reasonable assurance about whether the financial statements are free of material misstatement. An audit includes examining, on a test basis, evidence supporting the amounts and disclosures in the financial statements, assessing the accounting principles used and significant estimates made by management, and evaluating the overall financial statement presentation. We believe that our audits, which included confirmation of securities at September 30, 2008 by correspondence with the custodians and brokers, and by agreement to the underlying ownership records for Vanguard Market Liquidity Fund, provide a reasonable basis for our opinion.
PricewaterhouseCoopers LLP
Philadelphia, Pennsylvania
November 19, 2008
Special 2008 tax information (unaudited) for Vanguard Equity Income Fund
This information for the fiscal year ended September 30, 2008, is included pursuant to provisions of the Internal Revenue Code.
The fund distributed $272,240,000 as capital gain dividends (from net long-term capital gains) to shareholders during the fiscal year.
For non-resident alien shareholders, 100% of short-term capital gain dividends distributed by the fund are qualified short-term capital gains.
The fund distributed $170,423,000 of qualified dividend income to shareholders during the fiscal year.
For corporate shareholders, 87.9% of investment income (dividend income plus short-term gains, if any) qualifies for the dividends-received deduction.
25
Your Fund’s After-Tax Returns
This table presents returns for your fund both before and after taxes. The after-tax returns are shown in two ways: (1) assuming that an investor owned the fund during the entire period and paid taxes on the fund’s distributions, and (2) assuming that an investor paid taxes on the fund’s distributions and sold all shares at the end of each period.
Calculations are based on the highest individual federal income tax and capital gains tax rates in effect at the times of the distributions and the hypothetical sales. State and local taxes were not considered. After-tax returns reflect any qualified dividend income, using actual prior-year figures and estimates for 2008. (In the example, returns after the sale of fund shares may be higher than those assuming no sale. This occurs when the sale would have produced a capital loss. The calculation assumes that the investor received a tax deduction for the loss.)
The table shows returns for Investor Shares only; returns for other share classes will differ. Please note that your actual after-tax returns will depend on your tax situation and may differ from those shown. Also note that if you own the fund in a tax-deferred account, such as an individual retirement account or a 401(k) plan, this information does not apply to you. Such accounts are not subject to current taxes.
Finally, keep in mind that a fund’s performance—whether before or after taxes—does not guarantee future results.
Average Annual Total Returns: Equity Income Fund Investor Shares1 |
|
| |
Periods Ended September 30, 2008 |
|
|
|
| One | Five | Ten |
| Year | Years | Years |
Returns Before Taxes | –18.92% | 7.59% | 5.26% |
Returns After Taxes on Distributions | –20.09 | 6.27 | 3.82 |
Returns After Taxes on Distributions and Sale of Fund Shares | –10.70 | 6.48 | 4.07 |
1 Total returns do not include the account service fee that may be applicable to certain accounts with balances below $10,000.
26
About Your Fund’s Expenses
As a shareholder of the fund, you incur ongoing costs, which include costs for portfolio management, administrative services, and shareholder reports (like this one), among others. Operating expenses, which are deducted from a fund’s gross income, directly reduce the investment return of the fund.
A fund’s expenses are expressed as a percentage of its average net assets. This figure is known as the expense ratio. The following examples are intended to help you understand the ongoing costs (in dollars) of investing in your fund and to compare these costs with those of other mutual funds. The examples are based on an investment of $1,000 made at the beginning of the period shown and held for the entire period.
The accompanying table illustrates your fund’s costs in two ways:
• Based on actual fund return. This section helps you to estimate the actual expenses that you paid over the period. The “Ending Account Value” shown is derived from the fund’s actual return, and the third column shows the dollar amount that would have been paid by an investor who started with $1,000 in the fund. You may use the information here, together with the amount you invested, to estimate the expenses that you paid over the period.
To do so, simply divide your account value by $1,000 (for example, an $8,600 account value divided by $1,000 = 8.6), then multiply the result by the number given for your fund under the heading “Expenses Paid During Period.”
• Based on hypothetical 5% yearly return. This section is intended to help you compare your fund’s costs with those of other mutual funds. It assumes that the fund had a yearly return of 5% before expenses, but that the expense ratio is unchanged. In this case—because the return used is not the fund’s actual return—the results do not apply to your investment. The example is useful in making comparisons because the Securities and Exchange Commission requires all mutual funds to calculate expenses based on a 5% return. You can assess your fund’s costs by comparing this hypothetical example with the hypothetical examples that appear in shareholder reports of other funds.
Six Months Ended September 30, 2008 |
|
| |
| Beginning | Ending | Expenses |
| Account Value | Account Value | Paid During |
Equity Income Fund | 3/31/2008 | 9/30/2008 | Period1 |
Based on Actual Fund Return |
|
|
|
Investor Shares | $1,000.00 | $909.61 | $1.48 |
Admiral Shares | 1,000.00 | 910.61 | 0.86 |
Based on Hypothetical 5% Yearly Return |
|
|
|
Investor Shares | $1,000.00 | $1,023.51 | $1.57 |
Admiral Shares | 1,000.00 | 1,024.17 | 0.91 |
1 | The calculations are based on expenses incurred in the most recent six-month period. The fund’s annualized six-month expense ratios for that period are 0.31% for Investor Shares and 0.18% for Admiral Shares. The dollar amounts shown as “Expenses Paid” are equal to the annualized expense ratio multiplied by the average account value over the period, multiplied by the number of days in the most recent six-month period, then divided by the number of days in the most recent 12-month period. |
27
Note that the expenses shown in the table are meant to highlight and help you compare ongoing costs only and do not reflect transaction costs incurred by the fund for buying and selling securities. Further, the expenses do not include the account service fee described in the prospectus. If such a fee were applied to your account, your costs would be higher. Your fund does not charge transaction fees, such as purchase or redemption fees, nor does it carry a “sales load.”
The calculations assume no shares were bought or sold during the period. Your actual costs may have been higher or lower, depending on the amount of your investment and the timing of any purchases or redemptions.
You can find more information about the fund’s expenses, including annual expense ratios, in the Financial Statements section of this report. For additional information on operating expenses and other shareholder costs, please refer to your fund’s current prospectus.
28
Glossary
Beta. A measure of the magnitude of a fund’s past share-price fluctuations in relation to the ups and downs of a given market index. The index is assigned a beta of 1.00. Compared with a given index, a fund with a beta of 1.20 typically would have seen its share price rise or fall by 12% when the index rose or fell by 10%. For this report, beta is based on returns over the past 36 months for both the fund and the index. Note that a fund’s beta should be reviewed in conjunction with its R-squared (see definition). The lower the R-squared, the less correlation there is between the fund and the index, and the less reliable beta is as an indicator of volatility.
Earnings Growth Rate. The average annual rate of growth in earnings over the past five years for the stocks now in a fund.
Equity Exposure. A measure that reflects a fund’s investments in stocks and stock futures. Any holdings in short-term reserves are excluded.
Expense Ratio. The percentage of a fund’s average net assets used to pay its annual administrative and advisory expenses. These expenses directly reduce returns to investors.
Foreign Holdings. The percentage of a fund represented by stocks or depositary receipts of companies based outside the United States.
Inception Date. The date on which the assets of a fund (or one of its share classes) are first invested in accordance with the fund’s investment objective. For funds with a subscription period, the inception date is the day after that period ends. Investment performance is measured from the inception date.
Median Market Cap. An indicator of the size of companies in which a fund invests; the midpoint of market capitalization (market price x shares outstanding) of a fund’s stocks, weighted by the proportion of the fund’s assets invested in each stock. Stocks representing half of the fund’s assets have market capitalizations above the median, and the rest are below it.
Price/Book Ratio. The share price of a stock divided by its net worth, or book value, per share. For a fund, the weighted average price/book ratio of the stocks it holds.
Price/Earnings Ratio. The ratio of a stock’s current price to its per-share earnings over the past year. For a fund, the weighted average P/E of the stocks it holds. P/E is an indicator of market expectations about corporate prospects; the higher the P/E, the greater the expectations for a company’s future growth.
R-Squared. A measure of how much of a fund’s past returns can be explained by the returns from the market in general, as measured by a given index. If a fund’s total returns were precisely synchronized with an index’s returns, its R-squared would be 1.00. If the fund’s returns bore no relationship to the index’s returns, its R-squared would be 0. For this report, R-squared is based on returns over the past 36 months for both the fund and the index.
Return on Equity. The annual average rate of return generated by a company during the past five years for each dollar of shareholder’s equity (net income divided by shareholder’s equity). For a fund, the weighted average return on equity for the companies whose stocks it holds.
Short-Term Reserves. The percentage of a fund invested in highly liquid, short-term securities that can be readily converted to cash.
29
Turnover Rate. An indication of the fund’s trading activity. Funds with high turnover rates incur higher transaction costs and may be more likely to distribute capital gains (which may be taxable to investors). The turnover rate excludes in-kind transactions, which have minimal impact on costs.
Yield. A fund’s 30-day SEC yield is derived using a formula specified by the U.S. Securities and Exchange Commission. Under the formula, data related to the fund’s security holdings in the previous 30 days are used to calculate the fund’s hypothetical net income for that period, which is then annualized and divided by the fund’s estimated average net assets over the calculation period. For the purposes of this calculation, a security’s income is based on its current market yield to maturity (in the case of bonds) or its projected dividend yield (for stocks). Because the SEC yield represents hypothetical annualized income, it will differ—at times significantly—from the fund’s actual experience. As a result, the fund’s income distributions may be higher or lower than implied by the SEC yield.
30
This page intentionally left blank.
The People Who Govern Your Fund
The trustees of your mutual fund are there to see that the fund is operated and managed in your best interests since, as a shareholder, you are a part owner of the fund. Your fund’s trustees also serve on the board of directors of The Vanguard Group, Inc., which is owned by the Vanguard funds and provides services to them on an at-cost basis.
A majority of Vanguard’s board members are independent, meaning that they have no affiliation with Vanguard or the funds they oversee, apart from the sizable personal investments they have made as private individuals.
Our independent board members bring distinguished backgrounds in business, academia, and public service to their task of working with Vanguard officers to establish the policies and oversee the activities of the funds. Among board members’ responsibilities are selecting investment advisors for the funds; monitoring fund operations, performance, and costs; reviewing contracts; nominating and selecting new trustees/directors; and electing Vanguard officers.
Each trustee serves a fund until its termination; or until the trustee’s retirement, resignation, or death; or otherwise as specified in the fund’s organizational documents. Any trustee may be removed at a shareholders’ meeting by a vote representing two-thirds of the net asset value of all shares of the fund together with shares of other Vanguard funds organized within the same trust. The table on these two pages shows information for each trustee and executive officer of the fund. The mailing address of the trustees and officers is P.O. Box 876, Valley Forge, PA 19482.
Chairman of the Board and Trustee | |
|
|
John J. Brennan1 |
|
Born 1954 | Principal Occupation(s) During the Past Five Years: Chairman of the Board and Director/ |
Trustee Since May 1987; | Trustee of The Vanguard Group, Inc., and of each of the investment companies served |
Chairman of the Board | by The Vanguard Group; Chief Executive Officer and President of The Vanguard Group |
156 Vanguard Funds Overseen | and of each of the investment companies served by The Vanguard Group (1996–2008). |
|
|
Independent Trustees |
|
|
|
Charles D. Ellis |
|
Born 1937 | Principal Occupation(s) During the Past Five Years: Applecore Partners (pro bono ventures |
Trustee Since January 2001 | in education); Senior Advisor to Greenwich Associates (international business strategy |
156 Vanguard Funds Overseen | consulting); Successor Trustee of Yale University; Overseer of the Stern School of Business |
| at New York University; Trustee of the Whitehead Institute for Biomedical Research. |
|
|
Emerson U. Fullwood |
|
Born 1948 | Principal Occupation(s) During the Past Five Years: Executive Chief Staff and Marketing |
Trustee Since January 2008 | Officer for North America since 2004 and Corporate Vice President of Xerox Corporation |
156 Vanguard Funds Overseen | (photocopiers and printers); Director of SPX Corporation (multi-industry manufacturing), |
| of the United Way of Rochester, and of the Boy Scouts of America. |
|
|
Rajiv L. Gupta |
|
Born 1945 | Principal Occupation(s) During the Past Five Years: Chairman, President, and |
Trustee Since December 20012 | Chief Executive Officer of Rohm and Haas Co. (chemicals); Board Member of |
156 Vanguard Funds Overseen | the American Chemistry Council; Director of Tyco International, Ltd. (diversified |
| manufacturing and services) since 2005. |
|
|
Amy Gutmann |
|
Born 1949 | Principal Occupation(s) During the Past Five Years: President of the University of |
Trustee Since June 2006 | Pennsylvania since 2004; Professor in the School of Arts and Sciences, Annenberg School |
156 Vanguard Funds Overseen | for Communication, and Graduate School of Education of the University of Pennsylvania |
| since 2004; Provost (2001–2004) and Laurance S. Rockefeller Professor of Politics and |
| the University Center for Human Values (1990–2004), Princeton University; Director of |
| Carnegie Corporation of New York since 2005 and of Schuylkill River Development |
| Corporation and Greater Philadelphia Chamber of Commerce since 2004; Trustee of |
| the National Constitution Center since 2007. |
JoAnn Heffernan Heisen |
|
Born 1950 | Principal Occupation(s) During the Past Five Years: Corporate Vice President and |
Trustee Since July 1998 | Chief Global Diversity Officer since 2006, Vice President and Chief Information |
156 Vanguard Funds Overseen | Officer (1997–2005), and Member of the Executive Committee of Johnson & |
| Johnson (pharmaceuticals/consumer products); Director of the University Medical |
| Center at Princeton and Women’s Research and Education Institute. |
|
|
André F. Perold |
|
Born 1952 | Principal Occupation(s) During the Past Five Years: George Gund Professor of Finance |
Trustee Since December 2004 | and Banking, Harvard Business School; Senior Associate Dean and Director of Faculty |
156 Vanguard Funds Overseen | Recruiting, Harvard Business School; Director and Chairman of UNX, Inc. (equities |
| trading firm); Chair of the Investment Committee of HighVista Strategies LLC (private |
| investment firm) since 2005. |
|
|
Alfred M. Rankin, Jr. |
|
Born 1941 | Principal Occupation(s) During the Past Five Years: Chairman, President, Chief Executive |
Trustee Since January 1993 | Officer, and Director of NACCO Industries, Inc. (forklift trucks/housewares/lignite); Director |
156 Vanguard Funds Overseen | of Goodrich Corporation (industrial products/aircraft systems and services). |
|
|
J. Lawrence Wilson |
|
Born 1936 | Principal Occupation(s) During the Past Five Years: Retired Chairman and Chief Executive |
Trustee Since April 1985 | Officer of Rohm and Haas Co. (chemicals); Director of Cummins Inc. (diesel engines) and |
156 Vanguard Funds Overseen | AmerisourceBergen Corp. (pharmaceutical distribution); Trustee of Vanderbilt University |
| and of Culver Educational Foundation. |
|
|
Executive Officers1 |
|
|
|
Thomas J. Higgins |
|
Born 1957 | Principal Occupation(s) During the Past Five Years: Principal of The Vanguard Group, Inc.; |
Chief Financial Officer | Treasurer of each of the investment companies served by The Vanguard Group; Chief |
Since September 2008 | Financial Officer of each of the investment companies served by The Vanguard |
Treasurer Since July 1998 | Group since 2008. |
156 Vanguard Funds Overseen |
|
|
|
F. William McNabb III |
|
Born 1957 | Principal Occupation(s) During the Past Five Years: Chief Executive Officer, Director, |
Chief Executive Officer | and President of The Vanguard Group, Inc., since 2008; Chief Executive Officer and |
Since August 31, 2008 | President of each of the investment companies served by The Vanguard Group since |
President Since March 2008 | 2008; Director of Vanguard Marketing Corporation; Managing Director of The Vanguard |
156 Vanguard Funds Overseen | Group (1995–2008). |
|
|
Heidi Stam |
|
Born 1956 | Principal Occupation(s) During the Past Five Years: Managing Director of The Vanguard |
Secretary Since July 2005 | Group, Inc., since 2006; General Counsel of The Vanguard Group since 2005; Secretary of |
156 Vanguard Funds Overseen | The Vanguard Group and of each of the investment companies served by The Vanguard |
| Group since 2005; Director and Senior Vice President of Vanguard Marketing Corporation |
| since 2005; Principal of The Vanguard Group (1997–2006). |
Vanguard Senior Management Team |
|
| |
|
|
|
|
R. Gregory Barton | Kathleen C. Gubanich | Michael S. Miller | Glenn W. Reed |
Mortimer J. Buckley | Paul A. Heller | Ralph K. Packard | George U. Sauter |
Founder |
|
John C. Bogle |
Chairman and Chief Executive Officer, 1974–1996 |
1 | These individuals are “interested persons” as defined in the Investment Company Act of 1940. |
2 | December 2002 for Vanguard Equity Income Fund, Vanguard Growth Equity Fund, the Vanguard Municipal Bond Funds, and the Vanguard State Tax-Exempt Funds. |
More information about the trustees is in the Statement of Additional Information, available from The Vanguard Group.

P.O. Box 2600
Valley Forge, PA 19482-2600
Connect with Vanguard® > www.vanguard.com
Fund Information > 800-662-7447 | Russell is a trademark of The Frank |
| Russell Company. |
|
|
Direct Investor Account Services > 800-662-2739 | S&P 500® is a trademark of The McGraw- |
| Hill Companies, Inc., and has been |
| licensed for use by The Vanguard Group, |
Institutional Investor Services > 800-523-1036 | Inc. Vanguard mutual funds are not |
| sponsored, endorsed, sold, or promoted |
| by Standard & Poor’s, and Standard & |
Text Telephone for People | Poor’s makes no representation regarding |
| the advisability of investing in the funds. |
With Hearing Impairment > 800-952-3335 |
|
| All comparative mutual fund data are from |
This material may be used in conjunction | Lipper Inc. or Morningstar, Inc., unless |
with the offering of shares of any Vanguard | otherwise noted. |
fund only if preceded or accompanied by |
|
the fund’s current prospectus. | You can obtain a free copy of Vanguard’s |
| proxy voting guidelines by visiting our |
CFA® is a trademark owned by CFA Institute. | website, www.vanguard.com, and |
| searching for “proxy voting guidelines,” or |
“FTSE®” is a trademark jointly owned by the London | by calling Vanguard at 800-662-2739. |
Stock Exchange plc and The Financial Times | The guidelines are also available from |
Limited and is used by FTSE International Limited | the SEC’s website, www.sec.gov. |
under license. FTSE High Dividend Yield Index is | In addition, you may obtain a free report |
calculated by FTSE International Limited. FTSE | on how your fund voted the proxies for |
International Limited does not sponsor, endorse, or | securities it owned during the 12 months |
promote the fund; is not in any way | ended June 30. To get the report, visit |
connected to it; and does not accept any liability in | either www.vanguard.com or |
relation to its issue, operation, and trading. | www.sec.gov. |
|
|
The funds or securities referred to herein are not | You can review and copy information about your |
sponsored, endorsed, or promoted by MSCI, and | fund at the SEC’s Public Reference Room in |
MSCI bears no liability with respect to any such | Washington, D.C. |
funds or securities. For any such funds or securities, |
|
the prospectus or the Statement of Additional | To find out more about this public service, |
Information contains a more detailed description of | call the SEC at 202-551-8090. Information |
the limited relationship MSCI has with The Vanguard | about your fund is also available on the SEC’s |
Group and any related funds. | website, and you can receive copies of this |
| information, for a fee, by sending a request in |
| either of two ways: via e-mail addressed to |
| publicinfo@sec.gov or via regular mail |
| addressed to the Public Reference Section, |
| Securities and Exchange Commission, |
| Washington, DC 20549-0102. |
|
|
| © 2008 The Vanguard Group, Inc. |
| All rights reserved. |
| Vanguard Marketing Corporation, |
| Distributor. |
| Q650 112008 |

> | Vanguard Growth Equity Fund returned –28.1% for the fiscal year ended September 30, 2008. |
> | The fund’s return trailed both the return of its benchmark, the Russell 1000 Growth Index, and the average return of its peer mutual funds. |
> | The information technology, consumer discretionary, and industrial sectors weighed heavily on the fund’s performance. |
Contents |
|
|
|
Your Fund’s Total Returns | 1 |
President’s Letter | 2 |
Advisors’ Report | 7 |
Fund Profile | 11 |
Performance Summary | 12 |
Financial Statements | 13 |
Your Fund’s After-Tax Returns | 24 |
About Your Fund’s Expenses | 25 |
Glossary | 27 |
Please note: The opinions expressed in this report are just that—informed opinions. They should not be considered promises or advice. Also, please keep in mind that the information and opinions cover the period through the date on the front of this report. Of course, the risks of investing in your fund are spelled out in the prospectus.
Your Fund’s Total Returns
Fiscal Year Ended September 30, 2008 |
|
|
| Ticker | Total |
| Symbol | Returns |
Vanguard Growth Equity Fund | VGEQX | –28.1% |
Russell 1000 Growth Index |
| –20.9 |
Average Large-Cap Growth Fund1 |
| –23.0 |
Your Fund’s Performance at a Glance |
|
| ||
September 30, 2007–September 30, 2008 |
|
| ||
|
|
| Distributions Per Share | |
| Starting | Ending | Income | Capital |
| Share Price | Share Price | Dividends | Gains |
Vanguard Growth Equity Fund | $13.18 | $9.46 | $0.015 | $0.000 |
1 Derived from data provided by Lipper Inc.
1

President’s Letter
Dear Shareholder,
Vanguard Growth Equity Fund returned a disappointing –28.1% for the 12 months ended September 30, 2008. The fund lagged both the Russell 1000 Growth Index and its peers among large-capitalization growth funds during a treacherous period in the markets.
As investors flocked from equities to less volatile investments, growth stocks were pummeled. The fund’s subpar stock selection resulted in additional losses for the fiscal year.
Credit market turbulence
weighed heavily on stock prices
Troubles simmering in the credit markets for much of the past year came to a boil at the end of the fiscal period, producing several high-profile bankruptcies and putting severe pressure on stock prices around the world. The broad U.S. stock market returned –21.2% for the 12 months ended September 30. In September alone, stock prices fell more than 9%. International stock markets were similarly disappointing, returning –30.0% for the full 12 months.
Policymakers and elected officials, both in the United States and abroad, responded to the upheavals with dramatic new programs designed to help stabilize the credit markets. As participants struggled to make sense of the markets’ fast-changing dynamics, stock prices were exceptionally volatile, with daily ups and downs of 2 percentage points or more becoming commonplace.
2
U.S. Treasuries rallied in a nervous market
Nervousness in the stock market was echoed, and even amplified, in the bond market. For the 12 months, the broad U.S. bond market returned 3.7%, largely on the strength of Treasuries—investors’ security of choice in times of duress. Corporate bonds generally produced negative returns for the period, coming under heavy selling pressure during investors’ flight to safety. Even the municipal market, made up of generally high-quality securities issued by states and municipalities, recorded a negative 12-month return.
The U.S. Federal Reserve Board responded to the turmoil with a dramatic easing of monetary policy. Over the full 12 months, the Fed reduced its target for the federal funds rate from 4.75% to 2.00%. On October 8, shortly after the close of the fiscal period, the Fed cut rates again, to 1.50%. The move was made in coordination with rate cuts by several other central banks.
Poor stock selection hurt the fund’s performance
Vanguard Growth Equity Fund seeks to invest in midsized and large companies with strong earnings prospects. The fund’s poor performance during the fiscal year was partly a reflection of the downturn in the economy and the ongoing crises in the financial markets, which have held back earnings for many of the fund’s largest holdings.
Market Barometer |
|
|
|
| Average Annual Total Returns | ||
| Periods Ended September 30, 2008 | ||
| One Year | Three Years | Five Years |
Stocks |
|
|
|
Russell 1000 Index (Large-caps) | –22.1% | 0.1% | 5.5% |
Russell 2000 Index (Small-caps) | –14.5 | 1.8 | 8.1 |
Dow Jones Wilshire 5000 Index (Entire market) | –21.2 | 0.6 | 6.0 |
MSCI All Country World Index ex USA (International) | –30.0 | 3.1 | 11.8 |
|
|
|
|
Bonds |
|
|
|
Lehman U.S. Aggregate Bond Index (Broad taxable market) | 3.7% | 4.2% | 3.8% |
Lehman Municipal Bond Index | –1.9 | 1.9 | 2.8 |
Citigroup 3-Month Treasury Bill Index | 2.6 | 4.0 | 3.1 |
|
|
|
|
CPI |
|
|
|
Consumer Price Index | 4.9% | 3.2% | 3.4% |
3
The Growth Equity Fund, like its benchmark, has significant exposure to the information technology sector, which accounted for about 28% of assets, on average, during the past year. Compared with the index’s IT holdings, the fund’s stock selections in the sector were subpar. All told, the fund’s tech stocks depressed the fund’s overall return by nearly 11 percentage points. Tech companies that were notably hard-hit included Intel (–26%), Apple (–26%), Google (–29%), and Cisco Systems (–32%).
Besides the poor showing of IT stocks, the consumer discretionary and industrial sectors were notable weak spots for the period. As consumers strained to pay higher energy and food costs, non-essentials became a lower priority, as evidenced by the returns of companies such as Amazon (–22%), luxury accessory designer and maker Coach (–47%), and gaming resort developer Las Vegas Sands (–73%). And in industrials, companies that make heavy machinery or supply the aerospace industry, such as Deere & Co. (–32%) and General Electric (–36%), registered notably low returns.
The fund’s advisors—Turner Investment Partners, LLC, and Baillie Gifford Overseas Ltd., the latter of which joined the fund just six months ago—were more successful relative to the index in selecting stocks within the health care, financial, and materials sectors. Although these holdings also posted negative returns, their declines
Total Returns |
|
Ten Years Ended September 30, 2008 |
|
| Average |
| Annual Return |
Growth Equity Fund1 | 0.6% |
Russell 1000 Growth Index | 0.6 |
Average Large-Cap Growth Fund2 | 1.0 |
The figures shown represent past performance, which is not a guarantee of future results. (Current performance may be lower or higher than the performance data cited. For performance data current to the most recent month-end, visit our website at www.vanguard.com/performance.) Note, too, that both investment returns and principal value can fluctuate widely, so an investor’s shares, when sold, could be worth more or less than their original cost.
1 Prior to June 12, 2000, the fund was organized as the Turner Growth Equity Fund.
2 Derived from data provided by Lipper Inc.
4
were less severe than those of the same index sectors. A noteworthy success was Gilead Sciences (+12%), a biopharma-ceutical company that develops and manufactures therapies for HIV and other life-threatening diseases.
The fund has a creditable record over the past decade
Despite the fund’s disappointing return in this most recent fiscal year, Vanguard Growth Equity Fund’s performance over the past ten years has matched that of its benchmark. As of September 30, 2008, the fund’s average annual return over the decade stood at 0.6%, similar to that of the Russell 1000 Growth Index, but slightly behind the average return for its large-cap growth peers.
Long-time investors in the Growth Equity Fund know that its aggressive pursuit of above-average results comes with the risk of underperformance. In the fiscal period, the stock market’s dreary performance contributed to your fund’s downturn in the short run. Still, we believe the skill and experience of the fund’s advisors will serve you well over the long term.
In addition, the fund’s performance has benefited from an extremely low expense ratio—half the peer-group average. (The costs of your fund and its competitors are shown below.)
Expense Ratios1 |
|
|
Your Fund Compared With Its Peer Group |
|
|
|
| Average |
|
| Large-Cap |
| Fund | Growth Fund |
Growth Equity Fund | 0.68% | 1.36% |
1 | The fund expense ratio shown is from the prospectus dated June 23, 2008. For the fiscal year ended September 30, 2008, the fund’s expense ratio was 0.72%. The peer-group expense ratio is derived from data provided by Lipper Inc. and captures information through year-end 2007. |
5
Focus on the long term during uncertain times
The past year’s turbulent market has left many investors disappointed and uncertain about their investments. The stock market’s volatility has been jolting, but a long-term perspective holds that these unpredictable movements in the financial markets are an unavoidable trade-off for the potential to earn long-term returns superior to those of lower-risk assets. In such uncertain times, seasoned investors understand that panic is not the answer.
The best response to uncertainty may be diversification both within and across asset classes, which is why we counsel investors to hold a broadly diversified portfolio of stocks and fixed income investments in proportions consistent with their goals, risk tolerance, and time horizon.
In recent months, of course, even balanced portfolios of stocks and bonds have endured tough times, although they’ve outperformed many all-stock portfolios. Still, everything that history has taught us about the markets suggests that these principles can put you in the best position to achieve long-term investment success. Vanguard Growth Equity Fund can play a valuable role in such a portfolio.
Thank you for entrusting your assets to Vanguard.
Sincerely,

F. William McNabb III
President and Chief Executive Officer
October 17, 2008
6
Advisors’ Report
During the fiscal year ended September 30, 2008, the Growth Equity Fund returned –28.1%, reflecting the combined results of your fund’s independent investment advisors. The use of two advisors provides exposure to distinct, yet complementary, investment approaches to a particular market segment, enhancing the diversification of your fund.
The advisors, the percentages of fund assets they manage, and brief descriptions of their investment strategies are presented in the table below. The advisors have also prepared a discussion of the investment environment that existed during the fiscal year and of how their portfolio positioning reflects this assessment. These comments were prepared on October 21, 2008.
Turner Investment Partners, LLC
Robert E. Turner, CFA, Chairman
and Chief Investment Officer
Mark D. Turner, President
and Senior Portfolio Manager
Christopher K. McHugh, Vice President
and Senior Portfolio Manager
During the Growth Equity Fund’s fiscal year, a crisis of confidence gripped the U.S. equity markets in a manner rarely seen before. After overseeing the sale of Bear Stearns to rival JPMorgan Chase during first-quarter 2008, the Federal Reserve Board and U.S. Treasury once again shared the spotlight as the U.S. government seized control of Freddie Mac and Fannie Mae, injected $85
Vanguard Growth Equity Fund Investment Advisors | |||
|
|
|
|
| Fund Assets Managed |
| |
Investment Advisor | % | $ Million | Investment Strategy |
Turner Investment Partners, LLC | 67 | 491 | Evaluates investment ideas through a |
|
|
| blend of quantitative, fundamental, |
|
|
| and technical criteria. |
|
|
| It is interested primarily in money flow, |
|
|
| which measures investor interest in a |
|
|
| stock based on its trading volume, |
|
|
| pricing patterns, and relative strengths |
|
|
| versus other stocks in the same industry. |
Baillie Gifford Overseas Ltd. | 29 | 212 | Uses a fundamental approach to identify |
|
|
| quality growth companies. The firm |
|
|
| considers the sustainability of earnings |
|
|
| growth to be a critical factor in evaluating |
|
|
| a company’s prospects. Looks for |
|
|
| companies with attractive industry |
|
|
| backgrounds, strong competitive |
|
|
| positions within those industries, |
|
|
| high-quality earnings, and a favorable |
|
|
| attitude toward shareholders. |
Cash Investments1 | 4 | 28 | — |
1 These short-term reserves are invested by Vanguard in equity index products to simulate investment in stocks. Each advisor also may maintain a modest cash position.
7
billion of taxpayer money into American International Group (AIG), passed on a rescue plan for Lehman Brothers, temporarily banned short-selling of a large number of stocks, and announced a massive rescue plan for U.S. financial markets. The largest bank failure in U.S. history also occurred as Washington Mutual sold most of its operations to JPMorgan Chase, while the ailing Wachovia was acquired, finally, by Wells Fargo, nixing Citigroup’s prior offer. Given this backdrop, the equity markets retreated substantially for the 12 months as the S&P 500 Index dropped more than –20%.
Risk-aversion was on the minds of investors as they flocked toward low-risk investments, pushing yields of 3-month Treasuries close to zero in the month of September. (At the end of September 2007, 3-month Treasuries yielded 3.8%.)
With regard to stocks, valuations declined over the fiscal year, and those companies with the highest projected earnings growth (companies that we generally find attractive) fared the worst. Compared with the fund’s benchmark, the Russell 1000 Growth Index, the fund’s results in the consumer and technology sectors detracted the most from performance. However, underperformance in these sectors was partially offset by excess return in the health care sector.
Within the tech sector, our holdings in the semiconductor area were the largest detractors to relative performance. Although this positioning has hampered results, we continue to hold an overweighted position in several companies in this industry, as demand for chipsets has bottomed, in our opinion, and new product initiatives should help to drive earnings growth going forward.
Consumer sentiment remained weak as individuals coped with a number of headline issues, including higher energy prices, deteriorating home prices, and increasing unemployment. Given this environment, some of the higher-growth companies in the consumer discretionary sector whose shares we own are executing well (e.g., Guess?), but are not being recognized by investors at this time. Conversely, slower-growth companies that we have not owned, such as Wal-Mart and McDonald’s, have traded higher.
In health care, our core holdings in Intuitive Surgical and Gilead Sciences continued to be standouts. The fundamental earnings drivers for both companies remained intact; Intuitive continues to benefit from strong sales of its robotic surgical devices, while the HIV drug franchise of Gilead remains unparalleled.
8
The current environment has been extremely challenging; however, from a fundamental standpoint, the market seems to be slightly undervalued, and earnings outside the financial services and consumer sectors are solid. In addition, both corporations and investors have historically high levels of cash on the sidelines waiting patiently to reenter the market. Inflation concerns appear to be subsiding, and the U.S. government is actively working to shore up investor confidence. We expect corporate profits to improve next year, and stock price declines could moderate before year’s end. However, it is critical for confidence to be regained in the credit market before equities can post a sustainable advance.
Baillie Gifford Overseas Ltd.
Mick Brewis, Partner and Head of North American Investment Team
It has been a bruising year for equity investors, a period characterized by negative returns, financial turbulence on a near-unprecedented scale, and dwindling economic activity. However, analyzing the current difficulties within a longer-term framework provides room for a more positive view amid the doom and gloom. In particular, we can take comfort in the facts that the U.S. authorities are taking appropriate action, that economic imbalances are being corrected, and that current volatility and pessimism are almost certainly creating long-term investment opportunities.
A momentous past few weeks have seen large swaths of the banking market nationalized and the investment banking industry decimated as the financial crisis deepened. We have been impressed by the response so far of both the Federal Reserve Board and the U.S. Treasury. Despite the initial failure of the U.S. House of Representatives on September 29 to pass Treasury Secretary Henry Paulson’s $700 billion bailout plan, Congress ultimately passed a revised rescue package several days after the close of the fund’s fiscal year. We believe it is likely that the collective actions of the authorities will stabilize the U.S. housing market and financial system.
The ultimate outcome will involve a necessary adjustment to the significant imbalances that have characterized the past decade. This adjustment will be painful in many quarters. Unemployment is likely to rise and, although the corporate sector has made good progress in reorienting its sales effort toward the developing world, corporate profits are likely to come under some pressure. Nevertheless, the largest of the world’s imbalances, the U.S. current-account deficit, is shrinking as currency markets begin to impose a more sustainable pattern on world trade. The debt-inflated U.S. housing market is subsiding to more sensible levels as consumers relearn the attractions of saving, while the banks are advancing the process of deleveraging. These adjustments will almost certainly
9
provide a stronger foundation for earnings growth, equity returns, and economic activity in the long term.
We are confident our Growth Equity Fund holdings represent attractive investment opportunities, as their future earnings-growth potential in some cases is being ignored in the current turbulence. At a time when capital is scarce, the long-term beneficiaries will be businesses with well-managed, resilient franchises, robust returns on capital, and strong cash flows. The attractions of these characteristics have been disguised by the world’s love affair with risk, leverage, and unsustainably high growth rates over the past few years. However, these companies have the ability not only to grow earnings at an attractive pace but to benefit from the fallout from the current financial crisis, which provides them with the potential to enhance their long-term competitive advantages.
10
Fund Profile
As of September 30, 2008
Portfolio Characteristics |
|
| |
|
| Comparative | Broad |
| Fund | Index1 | Index2 |
Number of Stocks | 107 | 647 | 4,679 |
Median Market Cap | $22.2B | $31.9B | $29.6B |
Price/Earnings Ratio | 18.0x | 16.1x | 15.5x |
Price/Book Ratio | 3.2x | 3.4x | 2.2x |
Yield3 | 0.8% | 1.5% | 2.3% |
Return on Equity | 22.7% | 23.5% | 20.0% |
Earnings Growth Rate | 24.6% | 22.6% | 17.7% |
Foreign Holdings | 5.9% | 0.0% | 0.0% |
Turnover Rate | 222% | — | — |
Expense Ratio |
|
|
|
(9/30/2007)4 | 0.68% | — | — |
Short-Term Reserves | –1.2%5 | — | — |
Sector Diversification (% of equity exposure) | |||
|
| Comparative | Broad |
| Fund | Index1 | Index2 |
Consumer Discretionary | 10.1% | 9.5% | 9.2% |
Consumer Staples | 13.2 | 13.7 | 10.5 |
Energy | 12.2 | 10.2 | 12.6 |
Financials | 8.3 | 4.5 | 17.3 |
Health Care | 12.4 | 14.1 | 13.0 |
Industrials | 14.7 | 13.1 | 11.4 |
Information Technology | 23.2 | 28.6 | 15.7 |
Materials | 4.9 | 3.8 | 3.7 |
Telecommunication |
|
|
|
Services | 0.9 | 0.8 | 2.8 |
Utilities | 0.1 | 1.7 | 3.8 |
Volatility Measures6 |
| |
| Fund Versus | Fund Versus |
| Comparative Index1 | Broad Index2 |
R-Squared | 0.90 | 0.82 |
Beta | 1.20 | 1.23 |
Ten Largest Holdings7 | (% of total net assets) | |
|
|
|
Schlumberger Ltd. | oil and gas equipment and services | 3.6% |
QUALCOMM Inc. | communications equipment | 2.8 |
PepsiCo, Inc. | soft drinks | 2.8 |
Apple Inc. | computer hardware | 2.5 |
Google Inc. | Internet software and services | 2.3 |
Monsanto Co. | fertilizers and agricultural chemicals | 2.2 |
Intel Corp. | semiconductors | 2.1 |
Genentech, Inc. | biotechnology | 2.0 |
Hewlett-Packard Co. | computer hardware | 1.9 |
Gilead Sciences, Inc. | biotechnology | 1.8 |
Top Ten |
| 24.0% |
Investment Focus
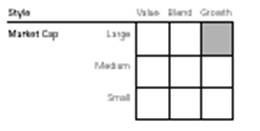
1 Russell 1000 Growth Index.
2 Dow Jones Wilshire 5000 Index.
3 30-day SEC yield for the fund; annualized dividend yield for the indexes. See the Glossary.
4 | The expense ratio shown is from the prospectus dated June 23, 2008. For the fiscal year ended September 30, 2008, the expense ratio was 0.72%. |
5 | The fund invested a portion of its cash reserves in equity markets through the use of index futures contracts. After the effect of the futures investments, the fund’s temporary cash position was negative. |
6 For an explanation of R-squared, beta, and other terms used here, see the Glossary.
7 The holdings listed exclude any temporary cash investments and equity index products.
11
Performance Summary
All of the returns in this report represent past performance, which is not a guarantee of future results that may be achieved by the fund. (Current performance may be lower or higher than the performance data cited. For performance data current to the most recent month-end, visit our website at www.vanguard.com/performance.) Note, too, that both investment returns and principal value can fluctuate widely, so an investor’s shares, when sold, could be worth more or less than their original cost. The returns shown do not reflect taxes that a shareholder would pay on fund distributions or on the sale of fund shares.
Cumulative Performance: September 30, 1998–September 30, 2008
Initial Investment of $10,000
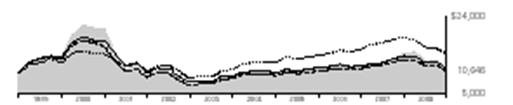
|
|
|
| |
|
|
|
|
|
| Average Annual Total Returns | Final Value | ||
| Periods Ended September 30, 2008 | of a $10,000 | ||
| One Year | Five Years | Ten Years | Investment |
Growth Equity Fund1 | –28.15% | 2.69% | 0.63% | $10,646 |
Dow Jones Wilshire 5000 Index | –21.20 | 6.04 | 4.00 | 14,801 |
Russell 1000 Growth Index | –20.88 | 3.74 | 0.59 | 10,607 |
Average Large-Cap Growth Fund2 | –22.95 | 2.98 | 0.99 | 11,034 |
Fiscal-Year Total Returns (%): September 30, 1998–September 30, 2008
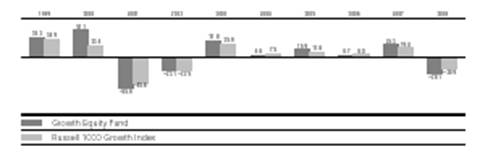
1 Total returns do not include the account service fee that may be applicable to certain accounts with balances below $10,000.
2 Derived from data provided by Lipper Inc.
Note: See Financial Highlights table for dividend and capital gains information.
12
Financial Statements
Statement of Net Assets
As of September 30, 2008
The fund provides a complete list of its holdings four times in each fiscal year, at the quarter-ends. For the second and fourth fiscal quarters, the lists appear in the fund’s semiannual and annual reports to shareholders. For the first and third fiscal quarters, the fund files the lists with the Securities and Exchange Commission on Form N-Q. Shareholders can look up the fund’s Forms N-Q on the SEC’s website at www.sec.gov. Forms N-Q may also be reviewed and copied at the SEC’s Public Reference Room (see the back cover of this report for further information).
|
|
| Market |
|
|
| Value• |
|
| Shares | ($000) |
Common Stocks (95.3%)1 |
|
| |
Consumer Discretionary (9.7%) |
|
| |
* | Kohl’s Corp. | 178,120 | 8,208 |
| Staples, Inc. | 307,850 | 6,927 |
| Guess?, Inc. | 194,340 | 6,761 |
| Comcast Corp. Class A | 329,850 | 6,475 |
*,^ | MGM Mirage, Inc. | 210,430 | 5,997 |
* | Urban Outfitters, Inc. | 167,890 | 5,351 |
| Omnicom Group Inc. | 137,260 | 5,293 |
* | Amazon.com, Inc. | 72,570 | 5,280 |
* | NVR, Inc. | 8,740 | 4,999 |
| Harley-Davidson, Inc. | 131,760 | 4,915 |
| Pulte Homes, Inc. | 253,480 | 3,541 |
| Sherwin-Williams Co. | 61,360 | 3,507 |
| Home Depot, Inc. | 85,970 | 2,226 |
*,^ | CarMax, Inc. | 121,560 | 1,702 |
|
|
| 71,182 |
Consumer Staples (12.6%) |
|
| |
| PepsiCo, Inc. | 289,790 | 20,653 |
| Kimberly-Clark Corp. | 140,350 | 9,100 |
| Walgreen Co. | 292,700 | 9,062 |
| CVS/Caremark Corp. | 217,070 | 7,307 |
| Wal-Mart Stores, Inc. | 116,680 | 6,988 |
| Brown-Forman Corp. Class B | 86,920 | 6,242 |
| The Estee Lauder Cos. Inc. Class A | 93,610 | 4,672 |
| Wm. Wrigley Jr. Co. | 58,670 | 4,658 |
| General Mills, Inc. | 65,600 | 4,508 |
^ | Whole Foods Market, Inc. | 219,090 | 4,388 |
| Campbell Soup Co. | 112,760 | 4,353 |
| McCormick & Co., Inc. | 101,530 | 3,904 |
| The Clorox Co. | 59,580 | 3,735 |
| Shoppers Drug Mart Corp. | 49,050 | 2,367 |
* | Central European Distribution Corp. | 7 | — |
|
|
| 91,937 |
Energy (11.6%) |
|
| |
| Schlumberger Ltd. | 333,140 | 26,015 |
| EOG Resources, Inc. | 101,320 | 9,064 |
| Petroleo Brasileiro SA ADR | 188,560 | 8,287 |
* | Ultra Petroleum Corp. | 141,040 | 7,805 |
| Apache Corp. | 68,520 | 7,145 | |
| Valero Energy Corp. | 229,360 | 6,950 | |
* | Southwestern Energy Co. | 207,380 | 6,333 | |
| Arch Coal, Inc. | 126,450 | 4,159 | |
| Diamond Offshore Drilling, Inc. | 30,550 | 3,149 | |
| Suncor Energy, Inc. | 72,700 | 3,006 | |
* | Transocean, Inc. | 25,870 | 2,842 | |
|
|
| 84,755 | |
Financials (7.6%) |
|
| ||
* | Berkshire Hathaway Inc. Class B | 2,550 | 11,207 | |
| Progressive Corp. of Ohio | 530,460 | 9,230 | |
| T. Rowe Price Group Inc. | 122,440 | 6,576 | |
| U.S. Bancorp | 170,890 | 6,155 | |
| The Goldman Sachs Group, Inc. | 45,260 | 5,793 | |
| Marsh & McLennan Cos., Inc. | 174,352 | 5,537 | |
| Hudson City Bancorp, Inc. | 271,170 | 5,003 | |
| M & T Bank Corp. | 44,730 | 3,992 | |
* | Markel Corp. | 5,590 | 1,965 | |
|
|
| 55,458 | |
Health Care (11.8%) |
|
| ||
* | Genentech, Inc. | 161,740 | 14,343 | |
* | Gilead Sciences, Inc. | 283,370 | 12,916 | |
| Abbott Laboratories | 178,110 | 10,256 | |
| Baxter International, Inc. | 151,540 | 9,946 | |
* | Genzyme Corp. | 88,970 | 7,197 | |
| Covidien Ltd. | 107,650 | 5,787 | |
| Pfizer Inc. | 289,820 | 5,344 | |
* | Intuitive Surgical, Inc. | 18,930 | 4,562 | |
13
|
|
| Market | |
|
|
| Value• | |
|
| Shares | ($000) | |
* | Charles River |
|
| |
| Laboratories, Inc. | 78,350 | 4,351 | |
* | Express Scripts Inc. | 57,656 | 4,256 | |
| Allergan, Inc. | 54,220 | 2,792 | |
* | United Therapeutics Corp. | 25,030 | 2,632 | |
* | Illumina, Inc. | 52,510 | 2,128 | |
|
|
| 86,510 | |
Industrials (14.2%) |
|
| ||
* | First Solar, Inc. | 53,690 | 10,143 | |
| United Parcel Service, Inc. | 155,160 | 9,758 | |
| Union Pacific Corp. | 121,980 | 8,680 | |
* | Siemens AG | 90,300 | 8,478 | |
| Ritchie Bros. Auctioneers Inc. | 315,450 | 7,558 | |
| Deere & Co. | 150,230 | 7,436 | |
*,^ | SunPower Corp. Class A | 86,800 | 6,157 | |
| Robert Half International, Inc. | 224,020 | 5,545 | |
| Rockwell Automation, Inc. | 118,240 | 4,415 | |
* | FTI Consulting, Inc. | 58,709 | 4,241 | |
| Flowserve Corp. | 44,710 | 3,969 | |
| SNC-Lavalin Group Inc. | 107,690 | 3,894 | |
| Harsco Corp. | 103,160 | 3,837 | |
| Pentair, Inc. | 104,060 | 3,597 | |
| Fluor Corp. | 57,250 | 3,189 | |
| United Technologies Corp. | 51,760 | 3,109 | |
| Cummins Inc. | 67,760 | 2,962 | |
* | Stericycle, Inc. | 44,100 | 2,598 | |
| Canadian Pacific Railway Ltd. | 37,090 | 1,989 | |
| Fastenal Co. | 39,390 | 1,945 | |
|
|
| 103,500 | |
Information Technology (22.3%) |
|
| ||
| QUALCOMM Inc. | 480,950 | 20,666 | |
* | Apple Inc. | 159,040 | 18,077 | |
* | Google Inc. | 41,650 | 16,682 | |
| Intel Corp. | 822,430 | 15,404 | |
| Hewlett-Packard Co. | 305,230 | 14,114 | |
| Applied Materials, Inc. | 694,060 | 10,501 | |
* | Broadcom Corp. | 445,520 | 8,300 | |
* | Adobe Systems, Inc. | 187,120 | 7,386 | |
| Xilinx, Inc. | 296,400 | 6,951 | |
* | Juniper Networks, Inc. | 316,980 | 6,679 | |
* | F5 Networks, Inc. | 256,690 | 6,001 | |
* | salesforce.com, inc. | 120,500 | 5,832 | |
* | LAM Research Corp. | 166,650 | 5,248 | |
| Visa Inc. | 85,250 | 5,234 | |
* | Baidu.com, Inc. | 17,560 | 4,359 | |
| Linear Technology Corp. | 115,190 | 3,532 | |
* | Activision Blizzard, Inc. | 225,330 | 3,477 | |
* | eBay Inc. | 112,600 | 2,520 | |
* | Autodesk, Inc. | 73,160 | 2,455 | |
|
|
| 163,418 | |
Materials (4.7%) |
|
| ||
| Monsanto Co. | 161,780 | 16,013 | |
| International Paper Co. | 264,740 | 6,931 |
| Praxair, Inc. | 67,540 | 4,845 |
| Potash Corp. of Saskatchewan, Inc. | 26,190 | 3,395 |
| United States Steel Corp. | 40,760 | 3,163 |
|
| 34,347 | |
Telecommunication Services (0.8%) |
|
| |
* NII Holdings Inc. | 152,540 | 5,784 | |
Total Common Stocks |
|
| |
(Cost $803,850) |
| 696,891 | |
Temporary Cash Investments (3.9%)1 |
| ||
Money Market Fund (3.2%) |
|
| |
2,3 Vanguard Market Liquidity |
|
| |
Fund, 2.296% | 23,363,602 | 23,363 | |
|
|
| |
|
|
| |
| Face |
| |
| Amount |
| |
| ($000) |
| |
U.S. Government Agency Obligation (0.7%) |
|
| |
4 Federal Home Loan Bank |
|
| |
5 2.576%, 11/24/08 | 5,000 | 4,976 | |
Total Temporary Cash Investments |
|
| |
(Cost $28,344) |
| 28,339 | |
Total Investments (99.2%) |
|
| |
(Cost $832,194) |
| 725,230 | |
Other Assets and Liabilities (0.8%) |
|
| |
Other Assets |
| 34,794 | |
Liabilities3 |
| (28,645) | |
|
| 6,149 | |
Net Assets (100%) |
|
| |
Applicable to 77,288,068 outstanding |
|
| |
$.001 par value shares of beneficial |
|
| |
interest (unlimited authorization) |
| 731,379 | |
Net Asset Value Per Share |
| $9.46 | |
14
At September 30, 2008, net assets consisted of: | |
| Amount |
| ($000) |
Paid-in Capital | 1,331,733 |
Undistributed Net Investment Income | 455 |
Accumulated Net Realized Losses | (492,562) |
Unrealized Appreciation (Depreciation) |
|
Investment Securities | (106,964) |
Futures Contracts | (1,283) |
Net Assets | 731,379 |
•See Note A in Notes to Financial Statements.
*Non-income-producing security.
^Part of security position is on loan to broker-dealers. The total value of securities on loan is $7,786,000.
1The fund invests a portion of its cash reserves in equity markets through the use of index futures contracts. After giving effect to futures investments, the fund’s effective common stock and temporary cash investment positions represent 99.3% and (0.1%), respectively, of net assets.
2Affiliated money market fund available only to Vanguard funds and certain trusts and accounts managed by Vanguard. Rate shown is the 7-day yield.
3Includes $8,173,000 of collateral received for securities on loan.
4The issuer operates under a congressional charter; its securities are neither issued nor guaranteed by the U.S. government.
5Securities with a value of $4,976,000 have been segregated as initial margin for open futures contracts. ADR—American Depositary Receipt.
See accompanying Notes, which are an integral part of the Financial Statements.
15
Statement of Operations
| Year Ended |
| September 30, 2008 |
| ($000) |
Investment Income |
|
Income |
|
Dividends1 | 7,304 |
Interest2 | 1,032 |
Security Lending | 314 |
Total Income | 8,650 |
Expenses |
|
Investment Advisory Fees—Note B |
|
Basic Fee | 3,618 |
Performance Adjustment | 773 |
The Vanguard Group—Note C |
|
Management and Administrative | 2,462 |
Marketing and Distribution | 225 |
Custodian Fees | 43 |
Auditing Fees | 20 |
Shareholders’ Reports | 31 |
Trustees’ Fees and Expenses | 2 |
Total Expenses | 7,174 |
Expenses Paid Indirectly | (330) |
Net Expenses | 6,844 |
Net Investment Income | 1,806 |
Realized Net Gain (Loss) |
|
Investment Securities Sold | (8,483) |
Futures Contracts | (2,485) |
Foreign Currencies | 69 |
Realized Net Gain (Loss) | (10,899) |
Change in Unrealized Appreciation (Depreciation) |
|
Investment Securities | (302,304) |
Futures Contracts | (1,283) |
Foreign Currencies | — |
Change in Unrealized Appreciation (Depreciation) | (303,587) |
Net Increase (Decrease) in Net Assets Resulting from Operations | (312,680) |
1 Dividends are net of foreign withholding taxes of $54,000.
2 Interest income from an affiliated company of the fund was $978,000.
See accompanying Notes, which are an integral part of the Financial Statements.
16
Statement of Changes in Net Assets
| Year Ended September 30, | |
| 2008 | 2007 |
| ($000) | ($000) |
Increase (Decrease) In Net Assets |
|
|
Operations |
|
|
Net Investment Income | 1,806 | 1,071 |
Realized Net Gain (Loss) | (10,899) | 62,822 |
Change in Unrealized Appreciation (Depreciation) | (303,587) | 120,725 |
Net Increase (Decrease) in Net Assets Resulting from Operations | (312,680) | 184,618 |
Distributions |
|
|
Net Investment Income | (1,264) | — |
Realized Capital Gain | — | — |
Total Distributions | (1,264) | — |
Capital Share Transactions |
|
|
Issued | 437,240 | 248,529 |
Issued in Lieu of Cash Distributions | 1,204 | — |
Redeemed | (367,899) | (217,555) |
Net Increase (Decrease) from Capital Share Transactions | 70,545 | 30,974 |
Total Increase (Decrease) | (243,399) | 215,592 |
Net Assets |
|
|
Beginning of Period | 974,778 | 759,186 |
End of Period1 | 731,379 | 974,778 |
1 Net Assets—End of Period includes undistributed (overdistributed) net investment income of $455,000 and ($156,000). See accompanying Notes, which are an integral part of the Financial Statements.
17
Financial Highlights
|
|
|
| ||
For a Share Outstanding | Year Ended September 30, | ||||
Throughout Each Period | 2008 | 2007 | 2006 | 2005 | 2004 |
Net Asset Value, Beginning of Period | $13.18 | $10.52 | $10.05 | $8.68 | $8.32 |
Investment Operations |
|
|
|
|
|
Net Investment Income (Loss) | .015 | .020 | (.009) | .001 | .010 |
Net Realized and Unrealized Gain (Loss) |
|
|
|
|
|
on Investments | (3.720) | 2.640 | .480 | 1.380 | .370 |
Total from Investment Operations | (3.705) | 2.660 | .471 | 1.381 | .380 |
Distributions |
|
|
|
|
|
Dividends from Net Investment Income | (.015) | — | (.001) | (.011) | (.020) |
Distributions from Realized Capital Gains | — | — | — | — | — |
Total Distributions | (.015) | — | (.001) | (.011) | (.020) |
Net Asset Value, End of Period | $9.46 | $13.18 | $10.52 | $10.05 | $8.68 |
|
|
|
|
|
|
Total Return1 | –28.15% | 25.29% | 4.69% | 15.92% | 4.56% |
|
|
|
|
|
|
Ratios/Supplemental Data |
|
|
|
|
|
Net Assets, End of Period (Millions) | $731 | $975 | $759 | $713 | $765 |
Ratio of Total Expenses to |
|
|
|
|
|
Average Net Assets2 | 0.72% | 0.68% | 0.91% | 0.88% | 0.72% |
Ratio of Net Investment Income (Loss) |
|
|
|
|
|
to Average Net Assets | 0.18% | 0.14% | (0.04%) | 0.01% | 0.14% |
Portfolio Turnover Rate | 222% | 131% | 147% | 147% | 162% |
1Total returns do not include the account service fee that may be applicable to certain accounts with balances below $10,000.
2 Includes performance-based investment advisory fee increases (decreases) of 0.08%, 0.04%, 0.19%, 0.11%, and (0.04%).
Notes to Financial Statements
Vanguard Growth Equity Fund is registered under the Investment Company Act of 1940 as an open-end investment company, or mutual fund.
A. The following significant accounting policies conform to generally accepted accounting principles for U.S. mutual funds. The fund consistently follows such policies in preparing its financial statements.
1. Security Valuation: Securities are valued as of the close of trading on the New York Stock Exchange (generally 4 p.m., Eastern time) on the valuation date. Equity securities are valued at the latest quoted sales prices or official closing prices taken from the primary market in which each security trades; such securities not traded on the valuation date are valued at the mean of the latest quoted bid and asked prices. Securities for which market quotations are not readily available, or whose values have been affected by events occurring before the fund’s pricing time but after the close of the securities’ primary
18
markets, are valued at their fair values calculated according to procedures adopted by the board of trustees. These procedures include obtaining quotations from an independent pricing service, monitoring news to identify significant market- or security-specific events, and evaluating changes in the values of foreign market proxies (for example, ADRs, futures contracts, or exchange-traded funds), between the time the foreign markets close and the fund’s pricing time. When fair-value pricing is employed, the prices of securities used by a fund to calculate its net asset value may differ from quoted or published prices for the same securities. Investments in Vanguard Market Liquidity Fund are valued at that fund’s net asset value. Temporary cash investments acquired over 60 days to maturity are valued using the latest bid prices or using valuations based on a matrix system (which considers such factors as security prices, yields, maturities, and ratings), both as furnished by independent pricing services. Other temporary cash investments are valued at amortized cost, which approximates market value.
2. Foreign Currency: Securities and other assets and liabilities denominated in foreign currencies are translated into U.S. dollars using exchange rates obtained from an independent third party as of the fund’s pricing time on the valuation date. Realized gains (losses) and unrealized appreciation (depreciation) on investment securities include the effects of changes in exchange rates since the securities were purchased, combined with the effects of changes in security prices. Fluctuations in the value of other assets and liabilities resulting from changes in exchange rates are recorded as unrealized foreign currency gains (losses) until the assets or liabilities are settled in cash, at which time they are recorded as realized foreign currency gains (losses).
3. Futures Contracts: The fund uses index futures contracts to a limited extent, with the objective of maintaining full exposure to the stock market while maintaining liquidity. The fund may purchase or sell futures contracts to achieve a desired level of investment, whether to accommodate portfolio turnover or cash flows from capital share transactions. The primary risks associated with the use of futures contracts are imperfect correlation between changes in market values of stocks held by the fund and the prices of futures contracts, and the possibility of an illiquid market.
Futures contracts are valued at their quoted daily settlement prices. The aggregate principal amounts of the contracts are not recorded in the Statement of Net Assets. Fluctuations in the value of the contracts are recorded in the Statement of Net Assets as an asset (liability) and in the Statement of Operations as unrealized appreciation (depreciation) until the contracts are closed, when they are recorded as realized futures gains (losses).
4. Federal Income Taxes: The fund intends to continue to qualify as a regulated investment company and distribute all of its taxable income. Management has analyzed the fund’s tax positions taken on federal income tax returns for all open tax years (tax years ended September 30, 2005–2008), and has concluded that no provision for federal income tax is required in the fund’s financial statements.
5. Distributions: Distributions to shareholders are recorded on the ex-dividend date.
6. Security Lending: The fund may lend its securities to qualified institutional borrowers to earn additional income. Security loans are required to be secured at all times by collateral at least equal to the market value of securities loaned. The fund invests cash collateral received in Vanguard Market Liquidity Fund, and records a liability for the return of the collateral, during the period the securities are on loan. Security lending income represents the income earned on investing cash collateral, less expenses associated with the loan.
19
7. Other: Dividend income is recorded on the ex-dividend date. Interest income includes income distributions received from Vanguard Market Liquidity Fund and is accrued daily. Security transactions are accounted for on the date securities are bought or sold. Costs used to determine realized gains (losses) on the sale of investment securities are those of the specific securities sold.
B. Turner Investment Partners, LLC, and beginning in April 2008, Baillie Gifford Overseas Ltd. each provide investment advisory services to a portion of the fund for fees calculated at an annual percentage rate of average net assets managed by the advisor. The basic fee of Turner Investment Partners, LLC, is subject to quarterly adjustments based on performance for the preceding three years relative to the Russell 1000 Growth Index. In accordance with the advisory contract entered into with Baillie Gifford Overseas Ltd. in April 2008, beginning April 1, 2009, the investment advisory fee will be subject to quarterly adjustments based on performance since June 30, 2008, relative to the S&P 500 Index.
The Vanguard Group manages the cash reserves of the fund on an at-cost basis.
For the year ended September 30, 2008, the aggregate investment advisory fee represented an effective annual basic rate of 0.36% of the fund’s average net assets before an increase of $773,000 (0.08%) based on performance.
C. The Vanguard Group furnishes at cost corporate management, administrative, marketing, and distribution services. The costs of such services are allocated to the fund under methods approved by the board of trustees. The fund has committed to provide up to 0.40% of its net assets in capital contributions to Vanguard. At September 30, 2008, the fund had contributed capital of $75,000 to Vanguard (included in Other Assets), representing 0.01% of the fund’s net assets and 0.07% of Vanguard’s capitalization. The fund’s trustees and officers are also directors and officers of Vanguard.
D. The fund has asked its investment advisors to direct certain security trades, subject to obtaining the best price and execution, to brokers who have agreed to rebate to the fund part of the commissions generated. Such rebates are used solely to reduce the fund’s management and administrative expenses. For the year ended September 30, 2008, these arrangements reduced the fund’s expenses by $330,000 (an annual rate of 0.03% of average net assets).
E. Distributions are determined on a tax basis and may differ from net investment income and realized capital gains for financial reporting purposes. Differences may be permanent or temporary. Permanent differences are reclassified among capital accounts in the financial statements to reflect their tax character. Temporary differences arise when certain items of income, expense, gain, or loss are recognized in different periods for financial statement and tax purposes; these differences will reverse at some time in the future. Differences in classification may also result from the treatment of short-term gains as ordinary income for tax purposes.
During the year ended September 30, 2008, the fund realized net foreign currency gains of $69,000, which increased distributable net income for tax purposes; accordingly, such gains have been reclassified from accumulated net realized losses to undistributed net investment income.
For tax purposes, at September 30, 2008, the fund had $2,190,000 of ordinary income available for distribution. The fund had available realized losses of $493,466,000 to offset future net capital gains of $327,754,000 through September 30, 2010, $136,482,000 through September 30, 2011, and $29,230,000 through September 30, 2017.
20
At September 30, 2008, the cost of investment securities for tax purposes was $832,421,000. Net unrealized depreciation of investment securities for tax purposes was $107,191,000, consisting of unrealized gains of $9,940,000 on securities that had risen in value since their purchase and $117,131,000 in unrealized losses on securities that had fallen in value since their purchase.
At September 30, 2008, the aggregate settlement value of open futures contracts expiring in December 2008 and the related unrealized appreciation (depreciation) were:
|
| ($000) | |
| Number of | Aggregate | Unrealized |
| Long (Short) | Settlement | Appreciation |
Futures Contracts | Contracts | Value | (Depreciation) |
E-mini S&P 500 Index | 300 | 17,535 | (659) |
S&P 500 Index | 39 | 11,398 | (624) |
Unrealized appreciation (depreciation) on open futures contracts is required to be treated as realized gain (loss) for tax purposes.
F. During the year ended September 30, 2008, the fund purchased $2,204,039,000 of investment securities and sold $2,147,968,000 of investment securities other than temporary cash investments.
G. Capital shares issued and redeemed were:
| Year Ended September 30, | |
| 2008 | 2007 |
| Shares | Shares |
| (000) | (000) |
Issued | 34,487 | 20,867 |
Issued in Lieu of Cash Distributions | 88 | — |
Redeemed | (31,229) | (19,088) |
Net Increase (Decrease) in Shares Outstanding | 3,346 | 1,779 |
H. In September 2006, the Financial Accounting Standards Board issued Statement of Financial Accounting Standards No. 157 (“FAS 157”), “Fair Value Measurements.” FAS 157 establishes a framework for measuring fair value and expands disclosures about fair value measurements in financial statements.
The various inputs that may be used to determine the value of the fund’s investments are summarized in three broad levels. The inputs or methodologies used for valuing securities are not necessarily an indication of the risk associated with investing in those securities.
Level 1—Quoted prices in active markets for identical securities.
Level 2—Other significant observable inputs (including quoted prices for similar securities, interest rates, prepayment speeds, credit risk, etc.).
Level 3—Significant unobservable inputs (including the fund’s own assumptions used to determine the fair value of investments).
21
The following table summarizes the fund’s investments as of September 30, 2008, based on the inputs used to value them:
| Investments | Futures |
| in Securities | Contracts |
Valuation Inputs | ($000) | ($000) |
Level 1—Quoted prices | 720,254 | (1,283) |
Level 2—Other significant observable inputs | 4,976 | — |
Level 3—Significant unobservable inputs | — | — |
Total | 725,230 | (1,283) |
22
Report of Independent Registered
Public Accounting Firm
To the Trustees of Vanguard Fenway Funds and the Shareholders of Vanguard Growth Equity Fund:
In our opinion, the accompanying statement of net assets and the related statements of operations and of changes in net assets and the financial highlights present fairly, in all material respects, the financial position of Vanguard Growth Equity Fund (the “Fund”) at September 30, 2008, the results of its operations for the year then ended, the changes in its net assets for each of the two years in the period then ended and the financial highlights for each of the five years in the period then ended, in conformity with accounting principles generally accepted in the United States of America. These financial statements and financial highlights (hereafter referred to as “financial statements”) are the responsibility of the Fund’s management; our responsibility is to express an opinion on these financial statements based on our audits. We conducted our audits of these financial statements in accordance with the standards of the Public Company Accounting Oversight Board (United States). Those standards require that we plan and perform the audit to obtain reasonable assurance about whether the financial statements are free of material misstatement. An audit includes examining, on a test basis, evidence supporting the amounts and disclosures in the financial statements, assessing the accounting principles used and significant estimates made by management, and evaluating the overall financial statement presentation. We believe that our audits, which included confirmation of securities at September 30, 2008 by correspondence with the custodian and broker and by agreement to the underlying ownership records for Vanguard Market Liquidity Fund, provide a reasonable basis for our opinion.
PricewaterhouseCoopers LLP
Philadelphia, Pennsylvania
November 19, 2008
Special 2008 tax information (unaudited) for Vanguard Growth Equity Fund
This information for the fiscal year ended September 30, 2008, is included pursuant to provisions of the Internal Revenue Code.
The fund distributed $1,264,000 of qualified dividend income to shareholders during the fiscal year.
For corporate shareholders, 100.0% of investment income (dividend income plus short-term gains, if any) qualifies for the dividends-received deduction.
23
Your Fund’s After-Tax Returns
This table presents returns for your fund both before and after taxes. The after-tax returns are shown in two ways: (1) assuming that an investor owned the fund during the entire period and paid taxes on the fund’s distributions, and (2) assuming that an investor paid taxes on the fund’s distributions and sold all shares at the end of each period.
Calculations are based on the highest individual federal income tax and capital gains tax rates in effect at the times of the distributions and the hypothetical sales. State and local taxes were not considered. After-tax returns reflect any qualified dividend income, using actual prior-year figures and estimates for 2008. (In the example, returns after the sale of fund shares may be higher than those assuming no sale. This occurs when the sale would have produced a capital loss. The calculation assumes that the investor received a tax deduction for the loss.)
Please note that your actual after-tax returns will depend on your tax situation and may differ from those shown. Also note that if you own the fund in a tax-deferred account, such as an individual retirement account or a 401(k) plan, this information does not apply to you. Such accounts are not subject to current taxes.
Finally, keep in mind that a fund’s performance—whether before or after taxes—does not guarantee future results.
Average Annual Total Returns: Growth Equity Fund1 |
|
| |
Periods Ended September 30, 2008 |
|
|
|
| One | Five | Ten |
| Year | Years | Years |
Returns Before Taxes | –28.15% | 2.69% | 0.63% |
Returns After Taxes on Distributions | –28.16 | 2.68 | –0.42 |
Returns After Taxes on Distributions and Sale of Fund Shares | –18.27 | 2.31 | 0.18 |
1 Total returns do not include the account service fee that may be applicable to certain accounts with balances below $10,000.
24
About Your Fund’s Expenses
As a shareholder of the fund, you incur ongoing costs, which include costs for portfolio management, administrative services, and shareholder reports (like this one), among others. Operating expenses, which are deducted from a fund’s gross income, directly reduce the investment return of the fund.
A fund’s expenses are expressed as a percentage of its average net assets. This figure is known as the expense ratio. The following examples are intended to help you understand the ongoing costs (in dollars) of investing in your fund and to compare these costs with those of other mutual funds. The examples are based on an investment of $1,000 made at the beginning of the period shown and held for the entire period.
The accompanying table illustrates your fund’s costs in two ways:
• Based on actual fund return. This section helps you to estimate the actual expenses that you paid over the period. The “Ending Account Value” shown is derived from the fund’s actual return, and the third column shows the dollar amount that would have been paid by an investor who started with $1,000 in the fund. You may use the information here, together with the amount you invested, to estimate the expenses that you paid over the period.
To do so, simply divide your account value by $1,000 (for example, an $8,600 account value divided by $1,000 = 8.6), then multiply the result by the number given for your fund under the heading “Expenses Paid During Period.”
• Based on hypothetical 5% yearly return. This section is intended to help you compare your fund’s costs with those of other mutual funds. It assumes that the fund had a yearly return of 5% before expenses, but that the expense ratio is unchanged. In this case—because the return used is not the fund’s actual return—the results do not apply to your investment. The example is useful in making comparisons because the Securities and Exchange Commission requires all mutual funds to calculate expenses based on a 5% return. You can assess your fund’s costs by comparing this hypothetical example with the hypothetical examples that appear in shareholder reports of other funds.
Six Months Ended September 30, 2008 |
|
|
|
| Beginning | Ending | Expenses |
| Account Value | Account Value | Paid During |
Growth Equity Fund | 3/31/2008 | 9/30/2008 | Period1 |
Based on Actual Fund Return | $1,000.00 | $824.04 | $2.61 |
Based on Hypothetical 5% Yearly Return | 1,000.00 | 1,022.21 | 2.89 |
Note that the expenses shown in the table are meant to highlight and help you compare ongoing costs only and do not reflect transaction costs incurred by the fund for buying and selling securities. Further, the expenses do not include the account service fee described in the prospectus. If such a fee were applied to your account, your costs would be higher. Your fund does not charge transaction fees, such as purchase or redemption fees, nor does it carry a “sales load.”
1 | The calculations are based on expenses incurred in the most recent six-month period. The fund’s annualized six-month expense ratio for that period is 0.57%. The dollar amounts shown as “Expenses Paid” are equal to the annualized expense ratio multiplied by the average account value over the period, multiplied by the number of days in the most recent six-month period, then divided by the number of days in the most recent 12-month period. |
25
The calculations assume no shares were bought or sold during the period. Your actual costs may have been higher or lower, depending on the amount of your investment and the timing of any purchases or redemptions.
You can find more information about the fund’s expenses, including annual expense ratios, in the Financial Statements section of this report. For additional information on operating expenses and other shareholder costs, please refer to your fund’s current prospectus.
26
Glossary
Beta. A measure of the magnitude of a fund’s past share-price fluctuations in relation to the ups and downs of a given market index. The index is assigned a beta of 1.00. Compared with a given index, a fund with a beta of 1.20 typically would have seen its share price rise or fall by 12% when the index rose or fell by 10%. For this report, beta is based on returns over the past 36 months for both the fund and the index. Note that a fund’s beta should be reviewed in conjunction with its R-squared (see definition). The lower the R-squared, the less correlation there is between the fund and the index, and the less reliable beta is as an indicator of volatility.
Earnings Growth Rate. The average annual rate of growth in earnings over the past five years for the stocks now in a fund.
Equity Exposure. A measure that reflects a fund’s investments in stocks and stock futures. Any holdings in short-term reserves are excluded.
Expense Ratio. The percentage of a fund’s average net assets used to pay its annual administrative and advisory expenses. These expenses directly reduce returns to investors.
Foreign Holdings. The percentage of a fund represented by stocks or depositary receipts of companies based outside the United States.
Inception Date. The date on which the assets of a fund (or one of its share classes) are first invested in accordance with the fund’s investment objective. For funds with a subscription period, the inception date is the day after that period ends. Investment performance is measured from the inception date.
Median Market Cap. An indicator of the size of companies in which a fund invests; the midpoint of market capitalization (market price x shares outstanding) of a fund’s stocks, weighted by the proportion of the fund’s assets invested in each stock. Stocks representing half of the fund’s assets have market capitalizations above the median, and the rest are below it.
Price/Book Ratio. The share price of a stock divided by its net worth, or book value, per share. For a fund, the weighted average price/book ratio of the stocks it holds.
Price/Earnings Ratio. The ratio of a stock’s current price to its per-share earnings over the past year. For a fund, the weighted average P/E of the stocks it holds. P/E is an indicator of market expectations about corporate prospects; the higher the P/E, the greater the expectations for a company’s future growth.
R-Squared. A measure of how much of a fund’s past returns can be explained by the returns from the market in general, as measured by a given index. If a fund’s total returns were precisely synchronized with an index’s returns, its R-squared would be 1.00. If the fund’s returns bore no relationship to the index’s returns, its R-squared would be 0. For this report, R-squared is based on returns over the past 36 months for both the fund and the index.
Return on Equity. The annual average rate of return generated by a company during the past five years for each dollar of shareholder’s equity (net income divided by shareholder’s equity). For a fund, the weighted average return on equity for the companies whose stocks it holds.
27
Short-Term Reserves. The percentage of a fund invested in highly liquid, short-term securities that can be readily converted to cash.
Turnover Rate. An indication of the fund’s trading activity. Funds with high turnover rates incur higher transaction costs and may be more likely to distribute capital gains (which may be taxable to investors). The turnover rate excludes in-kind transactions, which have minimal impact on costs.
Yield. A fund’s 30-day SEC yield is derived using a formula specified by the U.S. Securities and Exchange Commission. Under the formula, data related to the fund’s security holdings in the previous 30 days are used to calculate the fund’s hypothetical net income for that period, which is then annualized and divided by the fund’s estimated average net assets over the calculation period. For the purposes of this calculation, a security’s income is based on its current market yield to maturity (in the case of bonds) or its projected dividend yield (for stocks). Because the SEC yield represents hypothetical annualized income, it will differ—at times significantly—from the fund’s actual experience. As a result, the fund’s income distributions may be higher or lower than implied by the SEC yield.
28
This page intentionally left blank.
This page intentionally left blank.
This page intentionally left blank.
The People Who Govern Your Fund
The trustees of your mutual fund are there to see that the fund is operated and managed in your best interests since, as a shareholder, you are a part owner of the fund. Your fund’s trustees also serve on the board of directors of The Vanguard Group, Inc., which is owned by the Vanguard funds and provides services to them on an at-cost basis.
A majority of Vanguard’s board members are independent, meaning that they have no affiliation with Vanguard or the funds they oversee, apart from the sizable personal investments they have made as private individuals.
Our independent board members bring distinguished backgrounds in business, academia, and public service to their task of working with Vanguard officers to establish the policies and oversee the activities of the funds. Among board members’ responsibilities are selecting investment advisors for the funds; monitoring fund operations, performance, and costs; reviewing contracts; nominating and selecting new trustees/directors; and electing Vanguard officers.
Each trustee serves a fund until its termination; or until the trustee’s retirement, resignation, or death; or otherwise as specified in the fund’s organizational documents. Any trustee may be removed at a shareholders’ meeting by a vote representing two-thirds of the net asset value of all shares of the fund together with shares of other Vanguard funds organized within the same trust. The table on these two pages shows information for each trustee and executive officer of the fund. The mailing address of the trustees and officers is P.O. Box 876, Valley Forge, PA 19482.
Chairman of the Board and Trustee | |
|
|
John J. Brennan1 |
|
Born 1954 | Principal Occupation(s) During the Past Five Years: Chairman of the Board and Director/ |
Trustee Since May 1987; | Trustee of The Vanguard Group, Inc., and of each of the investment companies served |
Chairman of the Board | by The Vanguard Group; Chief Executive Officer and President of The Vanguard Group |
156 Vanguard Funds Overseen | and of each of the investment companies served by The Vanguard Group (1996–2008). |
|
|
Independent Trustees |
|
|
|
Charles D. Ellis |
|
Born 1937 | Principal Occupation(s) During the Past Five Years: Applecore Partners (pro bono ventures |
Trustee Since January 2001 | in education); Senior Advisor to Greenwich Associates (international business strategy |
156 Vanguard Funds Overseen | consulting); Successor Trustee of Yale University; Overseer of the Stern School of Business |
| at New York University; Trustee of the Whitehead Institute for Biomedical Research. |
|
|
Emerson U. Fullwood |
|
Born 1948 | Principal Occupation(s) During the Past Five Years: Executive Chief Staff and Marketing |
Trustee Since January 2008 | Officer for North America since 2004 and Corporate Vice President of Xerox Corporation |
156 Vanguard Funds Overseen | (photocopiers and printers); Director of SPX Corporation (multi-industry manufacturing), |
| of the United Way of Rochester, and of the Boy Scouts of America. |
|
|
Rajiv L. Gupta |
|
Born 1945 | Principal Occupation(s) During the Past Five Years: Chairman, President, and |
Trustee Since December 20012 | Chief Executive Officer of Rohm and Haas Co. (chemicals); Board Member of |
156 Vanguard Funds Overseen | the American Chemistry Council; Director of Tyco International, Ltd. (diversified |
| manufacturing and services) since 2005. |
|
|
Amy Gutmann |
|
Born 1949 | Principal Occupation(s) During the Past Five Years: President of the University of |
Trustee Since June 2006 | Pennsylvania since 2004; Professor in the School of Arts and Sciences, Annenberg School |
156 Vanguard Funds Overseen | for Communication, and Graduate School of Education of the University of Pennsylvania |
| since 2004; Provost (2001–2004) and Laurance S. Rockefeller Professor of Politics and |
| the University Center for Human Values (1990–2004), Princeton University; Director of |
| Carnegie Corporation of New York since 2005 and of Schuylkill River Development |
| Corporation and Greater Philadelphia Chamber of Commerce since 2004; Trustee of |
| the National Constitution Center since 2007. |
JoAnn Heffernan Heisen |
|
Born 1950 | Principal Occupation(s) During the Past Five Years: Corporate Vice President and |
Trustee Since July 1998 | Chief Global Diversity Officer since 2006, Vice President and Chief Information |
156 Vanguard Funds Overseen | Officer (1997–2005), and Member of the Executive Committee of Johnson & |
| Johnson (pharmaceuticals/consumer products); Director of the University Medical |
| Center at Princeton and Women’s Research and Education Institute. |
|
|
André F. Perold |
|
Born 1952 | Principal Occupation(s) During the Past Five Years: George Gund Professor of Finance |
Trustee Since December 2004 | and Banking, Harvard Business School; Senior Associate Dean and Director of Faculty |
156 Vanguard Funds Overseen | Recruiting, Harvard Business School; Director and Chairman of UNX, Inc. (equities |
| trading firm); Chair of the Investment Committee of HighVista Strategies LLC (private |
| investment firm) since 2005. |
|
|
Alfred M. Rankin, Jr. |
|
Born 1941 | Principal Occupation(s) During the Past Five Years: Chairman, President, Chief Executive |
Trustee Since January 1993 | Officer, and Director of NACCO Industries, Inc. (forklift trucks/housewares/lignite); Director |
156 Vanguard Funds Overseen | of Goodrich Corporation (industrial products/aircraft systems and services). |
|
|
J. Lawrence Wilson |
|
Born 1936 | Principal Occupation(s) During the Past Five Years: Retired Chairman and Chief Executive |
Trustee Since April 1985 | Officer of Rohm and Haas Co. (chemicals); Director of Cummins Inc. (diesel engines) and |
156 Vanguard Funds Overseen | AmerisourceBergen Corp. (pharmaceutical distribution); Trustee of Vanderbilt University |
| and of Culver Educational Foundation. |
|
|
Executive Officers1 |
|
|
|
Thomas J. Higgins |
|
Born 1957 | Principal Occupation(s) During the Past Five Years: Principal of The Vanguard Group, Inc.; |
Chief Financial Officer | Treasurer of each of the investment companies served by The Vanguard Group; Chief |
Since September 2008 | Financial Officer of each of the investment companies served by The Vanguard |
Treasurer Since July 1998 | Group since 2008. |
156 Vanguard Funds Overseen |
|
|
|
F. William McNabb III |
|
Born 1957 | Principal Occupation(s) During the Past Five Years: Chief Executive Officer, Director, |
Chief Executive Officer | and President of The Vanguard Group, Inc., since 2008; Chief Executive Officer and |
Since August 31, 2008 | President of each of the investment companies served by The Vanguard Group since |
President Since March 2008 | 2008; Director of Vanguard Marketing Corporation; Managing Director of The Vanguard |
156 Vanguard Funds Overseen | Group (1995–2008). |
|
|
Heidi Stam |
|
Born 1956 | Principal Occupation(s) During the Past Five Years: Managing Director of The Vanguard |
Secretary Since July 2005 | Group, Inc., since 2006; General Counsel of The Vanguard Group since 2005; Secretary of |
156 Vanguard Funds Overseen | The Vanguard Group and of each of the investment companies served by The Vanguard |
| Group since 2005; Director and Senior Vice President of Vanguard Marketing Corporation |
| since 2005; Principal of The Vanguard Group (1997–2006). |
Vanguard Senior Management Team |
|
| |
|
|
|
|
R. Gregory Barton | Kathleen C. Gubanich | Michael S. Miller | Glenn W. Reed |
Mortimer J. Buckley | Paul A. Heller | Ralph K. Packard | George U. Sauter |
Founder |
|
John C. Bogle |
Chairman and Chief Executive Officer, 1974–1996 |
1 These individuals are “interested persons” as defined in the Investment Company Act of 1940.
2 December 2002 for Vanguard Equity Income Fund, Vanguard Growth Equity Fund, the Vanguard Municipal Bond Funds, and the Vanguard State Tax-Exempt Funds.
More information about the trustees is in the Statement of Additional Information, available from The Vanguard Group.

P.O. Box 2600
Valley Forge, PA 19482-2600
Connect with Vanguard® > www.vanguard.com
Fund Information > 800-662-7447 | All comparative mutual fund data are |
| from Lipper Inc. or Morningstar, Inc., |
| unless otherwise noted. |
Direct Investor Account Services > 800-662-2739 |
|
| You can obtain a free copy of Vanguard’s |
| proxy voting guidelines by visiting our |
Institutional Investor Services > 800-523-1036 | website, www.vanguard.com, and |
| searching for “proxy voting guidelines,” or |
Text Telephone for People | by calling Vanguard at 800-662-2739. |
With Hearing Impairment > 800-952-3335 | The guidelines are also available from |
| the SEC’s website, www.sec.gov. |
| In addition, you may obtain a free report |
| on how your fund voted the proxies for |
This material may be used in conjunction | securities it owned during the 12 months |
with the offering of shares of any Vanguard | ended June 30. To get the report, visit |
fund only if preceded or accompanied by | either www.vanguard.com or |
the fund’s current prospectus. | www.sec.gov. |
|
|
The funds or securities referred to herein are not | You can review and copy information |
sponsored, endorsed, or promoted by MSCI, and MSCI | about your fund at the SEC’s Public |
bears no liability with respect to any such funds or | Reference Room in Washington, D.C. |
securities. For any such funds or securities, the | To find out more about this public |
prospectus or the Statement of Additional Information | service, call the SEC at 202-551-8090. |
contains a more detailed description of the limited | Information about your fund is also |
relationship MSCI has with The Vanguard Group and | available on the SEC’s website, and you |
any related funds. | can receive copies of this information, |
| for a fee, by sending a request in either |
Russell is a trademark of The Frank Russell Company. | of two ways: via e-mail addressed to |
| publicinfo@sec.gov or via regular mail |
S&P ® and S&P 500 ® are trademarks of The McGraw-Hill | addressed to the Public Reference |
Companies, Inc., and have been licensed for use by The | Section, Securities and Exchange |
Vanguard Group, Inc. Vanguard mutual funds are not | Commission, Washington, DC 20549- |
sponsored, endorsed, sold, or promoted by Standard & | 0102. |
Poor’s, and Standard & Poor’s makes no representation |
|
regarding the advisability of investing in the funds. |
|
|
|
| © 2008 The Vanguard Group, Inc. |
| All rights reserved. |
| Vanguard Marketing Corporation, |
| Distributor. |
| Q5440 112008 |


> | For its 2008 fiscal year, Vanguard PRIMECAP Core Fund returned –16.5%, a disappointing result that nevertheless was significantly ahead of the fund’s comparative standards. |
> | A heavy commitment to economically sensitive information technology and consumer discretionary companies accounted for almost two-thirds of the fund’s decline. |
> | Favorable stock selection across nearly all sectors bolstered the fund’s relative performance in a distressed market. |
Contents |
|
|
|
Your Fund’s Total Returns | 1 |
President’s Letter | 2 |
Advisor’s Report | 7 |
Fund Profile | 10 |
Performance Summary | 11 |
Financial Statements | 12 |
Your Fund’s After-Tax Returns | 22 |
About Your Fund’s Expenses | 23 |
Glossary | 25 |
Please note: The opinions expressed in this report are just that—informed opinions. They should not be considered promises or advice. Also, please keep in mind that the information and opinions cover the period through the date on the front of this report. Of course, the risks of investing in your fund are spelled out in the prospectus.
Your Fund’s Total Returns
Fiscal Year Ended September 30, 2008 |
|
|
| Ticker | Total |
| Symbol | Returns |
Vanguard PRIMECAP Core Fund | VPCCX | –16.5% |
MSCI US Prime Market 750 Index |
| –21.6 |
Average Multi-Cap Core Fund1 |
| –22.8 |
Your Fund’s Performance at a Glance |
|
| ||
September 30, 2007–September 30, 2008 |
|
| ||
|
|
| Distributions Per Share | |
| Starting | Ending | Income | Capital |
| Share Price | Share Price | Dividends | Gains |
Vanguard PRIMECAP Core Fund | $14.03 | $11.41 | $0.110 | $0.231 |
1Derived from data provided by Lipper Inc.
1

President’s Letter
Dear Shareholder,
For the 12 months ended September 30, Vanguard PRIMECAP Core Fund returned –16.5%, holding up considerably better than the MSCI US Prime Market 750 Index and the average multi-capitalization core fund in a tough environment.
Although the fiscal year began auspiciously, widespread credit market turmoil battered stocks far below their October 2007 peaks by the end of the period. Nearly all sectors in the fund, and the stock market in general, lost ground. However, the advisor’s favorable stock selection across most sectors—especially materials, beleaguered financial companies, and health care—boosted the fund’s relative performance. Growth- and value-oriented stocks rotated in and out of favor with investors during the year, ending with no clear winner; the PRIMECAP Core Fund—along with its benchmark and peers—holds a combination of both.
For those who invest in the fund through taxable accounts, page 22 shows after-tax returns based on the highest tax bracket.
Credit market turbulence weighed heavily on stock prices
Troubles simmering in the credit markets for much of the past year came to a boil at the end of the fiscal period, producing several high-profile bankruptcies and putting severe pressure on stock prices around the world. The broad U.S. stock market returned –21.2% for the 12 months ended September 30. In September alone, stock prices fell more than 9%.
2
International stock markets were similarly disappointing, returning –30.0% for the full 12 months.
Policymakers and elected officials, both in the United States and abroad, responded to the upheavals with dramatic new programs designed to help stabilize the credit markets. As participants struggled to make sense of the markets’ fast-changing dynamics, stock prices were exceptionally volatile, with daily ups and downs of 2 percentage points or more becoming common.
U.S. Treasuries rallied in a nervous market
Nervousness in the stock market was echoed, and even amplified, in the bond market. For the 12 months, the broad U.S. bond market returned 3.7%, largely on the strength of Treasuries—investors’ security of choice in times of duress. Corporate bonds generally produced negative returns for the period, coming under heavy selling pressure during investors’ flight to safety. Even the municipal market, made up of generally high-quality securities issued by states and municipalities, recorded a negative 12-month return.
The U.S. Federal Reserve Board responded to the turmoil with a dramatic easing of monetary policy. Over the full 12 months, the Fed reduced its target for the federal funds rate from 4.75% to 2.00%. On October 8, shortly after the close of the fiscal period, the Fed cut rates again,
Market Barometer |
|
|
|
| Average Annual Total Returns | ||
Periods Ended September 30, 2008 | |||
| One Year | Three Years | Five Years |
Stocks |
|
|
|
Russell 1000 Index (Large-caps) | –22.1% | 0.1% | 5.5% |
Russell 2000 Index (Small-caps) | –14.5 | 1.8 | 8.1 |
Dow Jones Wilshire 5000 Index (Entire market) | –21.2 | 0.6 | 6.0 |
MSCI All Country World Index ex USA (International) | –30.0 | 3.1 | 11.8 |
|
|
|
|
Bonds |
|
|
|
Lehman U.S. Aggregate Bond Index (Broad taxable market) | 3.7% | 4.2% | 3.8% |
Lehman Municipal Bond Index | –1.9 | 1.9 | 2.8 |
Citigroup 3-Month Treasury Bill Index | 2.6 | 4.0 | 3.1 |
|
|
|
|
CPI |
|
|
|
Consumer Price Index | 4.9% | 3.2% | 3.4% |
3
to 1.50%. The move was made in coordination with rate cuts by several other central banks.
Stock selection added value within several sectors
The primary drivers of PRIMECAP Core Fund’s performance were its information technology and consumer discretionary holdings. Together, they represented about 40% of the fund’s average assets and accounted for almost two-thirds of the fund’s decline. The advisor has been building these positions since the fund was launched almost four years ago, anticipating expanded use of computer chips and other electronics, particularly in the developing world, as well as product innovations in consumer electronics and online retailing. Amid the slowing economy, however, companies in both sectors struggled.
As credit grew scarce, consumers and businesses (including major financial customers) cut spending on technology, which trimmed more than 7 percentage points from the fund’s return. Among the notable detractors were semiconductor firms Texas Instruments (a top-ten holding during the year) and Netherlands-based ASML Holding, and communications equipment providers including Corning, Sweden’s LM Ericsson Telephone, Motorola, and Canada’s Nortel Networks.
Cash-strapped households created headwinds for consumer discretionary
Expense Ratios1 |
|
|
Your Fund Compared With Its Peer Group |
|
|
|
| Average |
|
| Multi-Cap |
| Fund | Core Fund |
PRIMECAP Core Fund | 0.55% | 1.27% |
1The fund expense ratio shown is from the prospectus dated January 28, 2008. For the fiscal year ended September 30, 2008, the fund’s expense ratio was 0.50%. The peer-group expense ratio is derived from data provided by Lipper Inc. and captures information through year-end 2007.
4
companies. Among the holdings that weighed on performance were electronics giant Sony and a variety of retailers: in apparel, Chico’s FAS and Nordstrom; in used cars, CarMax; and in online retailers, Amazon.com.
PRIMECAP Management Company, the fund’s advisor, seeks to identify companies or industries that appear to have superior long-term growth potential but are underappreciated by the market. This somewhat contrarian strategy can cause the fund’s results to diverge significantly from the performance of its benchmark index and peers, as was evident during the volatile 12 months. Two of the smaller sectors in the portfolio—materials and financials—illustrate this point.
After climbing steeply during much of the fiscal year, prices of raw materials and industrial commodities reversed course in mid-summer, leading to a –21% return for the market’s materials sector. By contrast, the fund’s materials holdings gained almost 3%. The advisor managed to capitalize on rising grain and food prices through sizable investments in fertilizer producer Potash Corp. of Saskatchewan (a top-ten holding) and Monsanto. Rohm & Haas, a specialty chemicals company that agreed to be acquired by Dow Chemical, was also a strong contributor.
In the embattled financial sector, although gains were scarce, the fund’s relatively small exposure to banks, brokerages, insurers, and other financial companies helped shareholders escape some of the industry’s
Total Returns |
|
December 9, 2004,1 Through September 30, 2008 |
|
| Average |
| Annual Return |
PRIMECAP Core Fund | 4.9% |
MSCI US Prime Market 750 Index | 2.1 |
Average Multi-Cap Core Fund2 | 1.2 |
The figures shown represent past performance, which is not a guarantee of future results. (Current performance may be lower or higher than the performance data cited. For performance data current to the most recent month-end, visit our website at www.vanguard.com/performance.) Note, too, that both investment returns and principal value can fluctuate widely, so an investor’s shares, when sold, could be worth more or less than their original cost.
1Fund inception.
2Derived from data provided by Lipper Inc.
5
ongoing problems. The advisor also held some of the sector’s better performers, including insurance broker Marsh & McLennan and holding company Berkshire Hathaway. Both companies notched double-digit gains for the year, helping to moderate some of the downdraft from mostly small positions in newsmakers and fallen giants AIG, Fannie Mae, Freddie Mac, and Washington Mutual.
For more on the advisor’s strategy and outlook, please see the Advisor’s Report on page 7.
Focus and discipline build long-term results
PRIMECAP Management Company adheres to a disciplined, focused, and patient investment philosophy, which is evident in the portfolio established over the past four years. The fund’s 4.9% average annual return since its inception in December 2004 has outpaced the performance of its benchmark index and the average return of competing multi-cap core funds. While the fund is still relatively young, we believe the advisor has laid a solid foundation for the future. And the fund’s low expense ratio has helped shareholders to keep more of the returns, an advantage that compounds over time.
During turbulent times, focus on the long term
Over the past year—and more acutely in recent weeks—global financial markets have experienced an unprecedented confluence of events. Understandably, many investors have been unnerved by the headlines about shrinking investment portfolios, declining home values, tight credit, and last-minute bank rescues. We firmly believe that maintaining a long-term perspective can help investors get through such rocky periods. Selling in a panic—or letting your emotions drive your investment decisions—is often a recipe for disappointment.
Instead, it’s important to focus on the time-tested principles of balance and diversification, both within and across asset classes. That’s why we encourage you to determine a mix of stock, bond, and money market funds that is consistent with your goals, time horizon, and tolerance for the markets’ inevitable ups and downs—and then try to stick with it. Of course, even balanced portfolios have faced tough times during the past 12 months. Everything that history has taught us about the markets, however, suggests that these principles can put you in the best position to achieve long-term investment success.
Thank you for your confidence in Vanguard.
Sincerely,

F. William McNabb III
President and Chief Executive Officer
October 17, 2008
6
Advisor’s Report
For the fiscal year ended September 30, Vanguard PRIMECAP Core Fund returned –16.5%, outperforming the –21.6% return of the MSCI US Prime Market 750 Index and the –22.8% average return of multi-cap core funds.
Investment environment
As the fiscal year came to a close, the deterioration in the financial sector accelerated. Many of the larger players experienced significant asset write-downs, recapitalizations, and even bankruptcies. The urgency to deleverage and rapidly falling stock prices led to a further decline in the sector.
The Federal Reserve Board and the U.S. Treasury responded swiftly, introducing a number of programs designed to help stabilize the markets, including the $700 billion Emergency Economic Stabilization Act of 2008. The act gives the Treasury broad authority to help banks strengthen their balance sheets. The bill’s passage by Congress was keenly anticipated—passage came a few days after the end of the fund’s fiscal year—but initially, at least, the financial markets remained under severe pressure. Stock prices fell sharply, and credit-market activity came to a near-standstill.
These dramatic events capped a 12-month period of already-poor stock market performance. What at first looked like a slowdown seemed likely to become a recession. The employment situation continues to deteriorate, and retail sales have declined significantly. Although the sharp correction in energy and commodity prices has hurt investors, the cost relief to consumers will potentially have the same impact as a tax cut and will help overextended household budgets.
Management of the fund
Our primary objective is to identify companies whose long-term fundamentals will evolve significantly better than the current Wall Street consensus or valuation suggests. To help find these underappreciated companies, we rely on rigorous fundamental research and meet not only with company management but also with competitors, suppliers, and customers. We invest with a long-term perspective, in the expectation that over a three- to five-year horizon our choices will outperform the market.
In recent years, this process has led us to establish large positions in information technology, health care, and consumer discretionary stocks. Together, these holdings accounted for more than 65% of portfolio assets at the end of the period. All three groups struggled during the past 12 months. Our consumer discretionary and information technology stocks each lost more than –20% of their value, while our health care holdings sustained a more modest decline of roughly –10%. Bright spots included Amgen and Genentech, both of which benefited from investors’ renewed interest in biotech stocks.
Among the weaker performers were pharmaceuticals giant Eli Lilly, which has been buffeted by regulatory setbacks, and technology holdings Texas Instruments and ASML Holding, which fell sharply on a collapse in demand for computers and computer chips. Also, in consumer
7
discretionary, Sony and women’s clothing retailer Chico’s hurt overall returns as discretionary spending on electronics, entertainment, and clothing has softened.
During the past 12 months, the fund earned relatively strong returns in the materials sector. Potash Corp. of Saskatchewan, the world’s leading supplier of fertilizer compound potash, has capitalized on the global boom in grain prices. Insurance broker Marsh & McLennan also helped overall returns as its stock price rose about 24% during the period. On a relative basis, the fund overall benefited from its limited exposure to financial stocks. At the end of the period, financials accounted for more than 5% of assets, roughly one-third of the benchmark weighting. This low weighting largely reflects our longstanding assessment that the sector’s opaque financial statements make certain businesses difficult to value.
Outlook
As previously mentioned, our greatest areas of conviction remain health care and information technology. The bearish arguments on the health care sector are well known: increased scrutiny during the Food and Drug Administration (FDA) approval process, patent expirations, generic competition, price controls, and government intervention. We have been surprised and disappointed by the difficulties that pharmaceutical companies have encountered in trying to get new products approved by the FDA. In our view, however, investors are overlooking some companies’ promising drug pipelines, exciting and innovative new medical devices, and valuations that are near 30-year lows. We have positioned the portfolio to take advantage of a potential shift in market leadership, and we believe the innovation and financial strength of the health care industry is likely to be recognized in the coming years.
Historically, technology spending has been cyclical, and tech stocks are trading at valuations that suggest this is still the case. In addition, there is a pervasive fear that the meltdown in the financial sector will have a significant impact on technology spending, as financial firms have traditionally been large consumers of information technology. We think the tech industry has changed dramatically over the last ten years: Market shares are more concentrated, companies are more global in nature, and balance sheets are among the strongest in corporate America. We maintain our conviction in the companies we own in this area, and we look for a recovery in 2009.
The most immediate concern is the financial-market turmoil. The lack of liquidity in many areas of the market is debilitating for corporate America. Long term, we believe the equity markets will recover and investors will be rewarded for purchasing equities. However, the recovery in economic growth will take time, as the system needs to deleverage the excesses of the past seven or eight years. Unlike in
8
some prior recoveries, we do not view the consumer as the engine for growth; consumers have taken on excessive debt and need to repair their damaged balance sheets. Personal saving has been nonexistent and needs to increase. The process will take time, and patience is required.
We remain optimistic about the fund’s portfolio. We believe that the companies we hold are positioned well for what might prove to be an increasingly difficult economic environment. In difficult times, fundamentals matter most, and we will continue to search for companies whose valuations now make them attractive long-term investments.
We thank you for entrusting your hard-earned capital to us. We will continue to work diligently to prove worthy of that trust.
Joel P. Fried |
| Howard B. Schow |
Portfolio Manager |
| Portfolio Manager |
| Theo A. Kolokotrones |
|
| Portfolio Manager |
|
Mitchell J. Milias |
| Alfred W. Mordecai |
Portfolio Manager |
| Portfolio Manager |
| David H. Van Slooten |
|
| Portfolio Manager |
|
|
|
|
|
|
|
PRIMECAP Management Company, LLP | October 14, 2008 | |
9
Fund Profile
As of September 30, 2008
Portfolio Characteristics |
|
|
|
| Comparative |
| Fund | Index1 |
Number of Stocks | 135 | 740 |
Median Market Cap | $29.5B | $38.7B |
Price/Earnings Ratio | 17.0x | 14.9x |
Price/Book Ratio | 2.5x | 2.3x |
Yield2 | 1.1% | 2.3% |
Return on Equity | 19.9% | 21.0% |
Earnings Growth Rate | 22.0% | 18.1% |
Foreign Holdings | 15.4% | 0.0% |
Turnover Rate | 9% | — |
Expense Ratio (9/30/2007)3 | 0.55% | — |
Short-Term Reserves | 13.3% | — |
Sector Diversification (% of equity exposure) | ||
|
| Comparative |
| Fund | Index1 |
Consumer Discretionary | 15.8% | 8.9% |
Consumer Staples | 0.7 | 11.6 |
Energy | 6.7 | 13.0 |
Financials | 5.9 | 16.1 |
Health Care | 25.3 | 13.1 |
Industrials | 11.3 | 10.9 |
Information Technology | 25.2 | 16.0 |
Materials | 8.4 | 3.6 |
Telecommunication Services | 0.4 | 3.1 |
Utilities | 0.3 | 3.7 |
Volatility Measures4 |
|
| Fund Versus |
| Comparative Index1 |
R-Squared | 0.91 |
Beta | 0.91 |
Ten Largest Holdings5 (% of total net assets) | ||
|
|
|
Eli Lilly & Co. | pharmaceuticals | 3.8% |
Amgen, Inc. | biotechnology | 3.6 |
Novartis AG ADR | pharmaceuticals | 3.5 |
Medtronic, Inc. | health care equipment | 3.1 |
Southwest Airlines Co. | airlines | 2.4 |
Intuit, Inc. | application software | 2.3 |
Oracle Corp. | systems software | 2.2 |
Marsh & McLennan Cos., Inc. | insurance brokers | 2.0 |
Whirlpool Corp. | household appliances | 1.9 |
Potash Corp. of Saskatchewan, Inc. | fertilizers and agricultural chemicals | 1.8 |
Top Ten |
| 26.6% |
Investment Focus
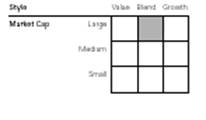
1 MSCI US Prime Market 750 Index.
2 30-day SEC yield for the fund; annualized dividend yield for the index. See the Glossary.
3 The fund expense ratio shown is from the prospectus dated January 28, 2008. For the fiscal year ended September 30, 2008, the expense ratio was 0.50%.
4 For an explanation of R-squared, beta, and other terms used here, see the Glossary.
5 The holdings listed exclude any temporary cash investments and equity index products.
10
Performance Summary
All of the returns in this report represent past performance, which is not a guarantee of future results that may be achieved by the fund. (Current performance may be lower or higher than the performance data cited. For performance data current to the most recent month-end, visit our website at www.vanguard.com/performance.) Note, too, that both investment returns and principal value can fluctuate widely, so an investor’s shares, when sold, could be worth more or less than their original cost. The returns shown do not reflect taxes that a shareholder would pay on fund distributions or on the sale of fund shares.
Cumulative Performance: December 9, 2004–September 30, 2008
Initial Investment of $10,000
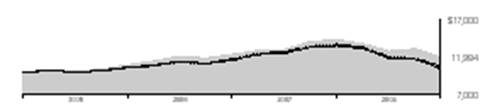
|
|
| |
Average Annual Total Returns |
| ||
Periods Ended September 30, 2008 | Final Value of a | ||
|
| Since | $10,000 |
| One Year | Inception1 | Investment |
PRIMECAP Core Fund2 | –16.52% | 4.87% | $11,984 |
MSCI US Prime Market 750 Index | –21.58 | 2.06 | 10,809 |
Average Multi-Cap Core Fund3 | –22.79 | 1.18 | 10,457 |
Fiscal-Year Total Returns (%): December 9, 2004–September 30, 2008
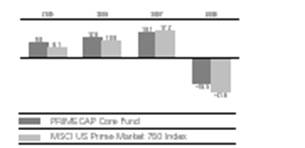
1 Performance for the fund and its comparative standards is calculated since the fund’s inception: December 9, 2004.
2 Total returns do not include the 1% fee assessed on redemptions of shares held less than one year, or the account
service fee that may be applicable to certain accounts with balances below $10,000.
3 Derived from data provided by Lipper Inc.
Note: See Financial Highlights table for dividend and capital gains information.
11
Financial Statements
Statement of Net Assets
As of September 30, 2008
The fund provides a complete list of its holdings four times in each fiscal year, at the quarter-ends. For the second and fourth fiscal quarters, the lists appear in the fund’s semiannual and annual reports to shareholders. For the first and third fiscal quarters, the fund files the lists with the Securities and Exchange Commission on Form N-Q. Shareholders can look up the fund’s Forms N-Q on the SEC’s website at www.sec.gov. Forms N-Q may also be reviewed and copied at the SEC’s Public Reference Room (see the back cover of this report for further information).
|
|
| Market |
|
|
| Value• |
|
| Shares | ($000) |
Common Stocks (86.8%) |
|
| |
Consumer Discretionary (13.7%) |
|
| |
| Whirlpool Corp. | 763,200 | 60,514 |
* | Bed Bath & Beyond, Inc. | 1,636,791 | 51,412 |
| Sony Corp. ADR | 1,500,000 | 46,305 |
| TJX Cos., Inc. | 1,358,725 | 41,468 |
* | Kohl’s Corp. | 852,700 | 39,292 |
* | DIRECTV Group, Inc. | 1,198,925 | 31,376 |
* | Amazon.com, Inc. | 377,500 | 27,467 |
| The Walt Disney Co. | 855,400 | 26,252 |
*, | ^CarMax, Inc. | 1,863,000 | 26,082 |
| Mattel, Inc. | 1,105,200 | 19,938 |
| Best Buy Co., Inc. | 442,600 | 16,598 |
| Target Corp. | 276,450 | 13,560 |
| Nordstrom, Inc. | 440,400 | 12,692 |
| Carnival Corp. | 220,000 | 7,777 |
| Lowe’s Cos., Inc. | 317,000 | 7,510 |
* | Viacom Inc. Class B | 263,400 | 6,543 |
* | Chico’s FAS, Inc. | 915,000 | 5,005 |
| Eastman Kodak Co. | 300,000 | 4,614 |
* | Expedia, Inc. | 108,250 | 1,636 |
* | HSN, Inc. | 21,650 | 238 |
* | Ticketmaster | 21,650 | 232 |
* | Interval Leisure Group, Inc. | 21,650 | 225 |
| Idearc Inc. | 150,000 | 188 |
|
|
| 446,924 |
Consumer Staples (0.6%) |
|
| |
| Avon Products, Inc. | 340,000 | 14,134 |
| Costco Wholesale Corp. | 100,000 | 6,493 |
|
|
| 20,627 |
Energy (5.8%) |
|
| |
| Schlumberger Ltd. | 732,400 | 57,193 |
| EnCana Corp. | 544,500 | 35,790 |
| EOG Resources, Inc. | 400,000 | 35,784 |
| Arch Coal, Inc. | 854,200 | 28,095 |
| Murphy Oil Corp. | 167,000 | 10,711 |
* | National Oilwell Varco Inc. | 203,000 | 10,197 |
| Peabody Energy Corp. | 150,000 | 6,750 |
* | Exterran Holdings, Inc. | 57,000 | 1,822 |
| Noble Corp. | 38,000 | 1,668 |
* | Pride International, Inc. | 13,000 | 385 |
|
|
| 188,395 |
Financials (5.2%) |
|
| |
| Marsh & McLennan |
|
|
| Cos., Inc. | 2,085,175 | 66,225 |
* | Berkshire Hathaway Inc. Class B | 10,400 | 45,708 |
| Bank of New York Mellon Corp. | 525,002 | 17,105 |
| Discover Financial Services | 1,059,300 | 14,640 |
| The Chubb Corp. | 210,000 | 11,529 |
| Progressive Corp. of Ohio | 338,000 | 5,881 |
| Capital One Financial Corp. | 73,000 | 3,723 |
| Wells Fargo & Co. | 25,000 | 938 |
| AFLAC Inc. | 9,000 | 529 |
| JPMorgan Chase & Co. | 10,000 | 467 |
| Citigroup, Inc. | 20,000 | 410 |
| State Street Corp. | 5,000 | 284 |
| TCF Financial Corp. | 5,000 | 90 |
* | Tree.com, Inc. | 3,608 | 17 |
|
|
| 167,546 |
Health Care (21.9%) |
|
| |
| Eli Lilly & Co. | 2,838,300 | 124,970 |
* | Amgen, Inc. | 1,962,100 | 116,294 |
| Novartis AG ADR | 2,145,600 | 113,373 |
| Medtronic, Inc. | 2,008,700 | 100,636 |
| GlaxoSmithKline PLC ADR | 1,279,000 | 55,585 |
* | Boston Scientific Corp. | 4,356,300 | 53,452 |
| Roche Holdings AG | 330,000 | 51,659 |
* | Genentech, Inc. | 229,000 | 20,308 |
* | Waters Corp. | 305,100 | 17,751 |
* | Biogen Idec Inc. | 330,000 | 16,596 |
| Sanofi-Aventis ADR | 473,000 | 15,547 |
| Wyeth | 335,000 | 12,375 |
* | Sepracor Inc. | 620,400 | 11,359 |
* | Genzyme Corp. | 9,100 | 736 |
|
|
| 710,641 |
12
|
|
| Market |
|
|
| Value• |
|
| Shares | ($000) |
Industrials (9.8%) |
|
| |
| Southwest Airlines Co. | 5,449,125 | 79,067 |
| United Parcel Service, Inc. | 797,715 | 50,168 |
| FedEx Corp. | 383,600 | 30,320 |
| Honeywell International Inc. | 680,200 | 28,262 |
* | McDermott International, Inc. | 798,000 | 20,389 |
| Expeditors International of Washington, Inc. | 515,016 | 17,943 |
| Union Pacific Corp. | 249,750 | 17,772 |
| The Boeing Co. | 285,000 | 16,345 |
| Avery Dennison Corp. | 340,000 | 15,123 |
* | AMR Corp. | 1,129,300 | 11,090 |
| Caterpillar, Inc. | 178,650 | 10,647 |
| Burlington Northern Santa Fe Corp. | 100,000 | 9,243 |
| Canadian Pacific Railway Ltd. | 66,830 | 3,599 |
| General Electric Co. | 100,000 | 2,550 |
| Deere & Co. | 32,900 | 1,629 |
| Norfolk Southern Corp. | 21,900 | 1,450 |
| Chicago Bridge & Iron Co. N.V. | 60,000 | 1,154 |
| Cummins Inc. | 23,000 | 1,006 |
| 3M Co. | 13,000 | 888 |
| Pitney Bowes, Inc. | 14,000 | 466 |
| Goodrich Corp. | 10,000 | 416 |
|
|
| 319,527 |
Information Technology (21.8%) |
| ||
* | Intuit, Inc. | 2,392,400 | 75,624 |
* | Oracle Corp. | 3,540,500 | 71,908 |
| Texas Instruments, Inc. | 2,470,000 | 53,105 |
| Microsoft Corp. | 1,814,900 | 48,440 |
| ASML Holding NV (New York Shares) | 2,385,511 | 42,009 |
* | Google Inc. | 95,700 | 38,330 |
* | Symantec Corp. | 1,918,700 | 37,568 |
* | EMC Corp. | 2,921,000 | 34,935 |
| Intel Corp. | 1,788,700 | 33,502 |
^ | LM Ericsson Telephone Co. ADR Class B | 3,164,000 | 29,837 |
| Altera Corp. | 1,390,000 | 28,745 |
| Corning, Inc. | 1,830,200 | 28,624 |
* | SanDisk Corp. | 1,347,200 | 26,338 |
| QUALCOMM Inc. | 526,800 | 22,637 |
* | Research In Motion Ltd. | 327,400 | 22,361 |
| Applied Materials, Inc. | 1,306,500 | 19,767 |
* | eBay Inc. | 744,600 | 16,664 |
| Accenture Ltd. | 380,500 | 14,459 |
* | Flextronics International Ltd. | 1,910,000 | 13,523 |
| KLA-Tencor Corp. | 310,000 | 9,811 |
* | Cisco Systems, Inc. | 374,600 | 8,451 |
| Motorola, Inc. | 1,015,000 | 7,247 |
* | Yahoo! Inc. | 405,000 | 7,007 |
* | Agilent Technologies, Inc. | 170,000 | 5,042 |
* | Adobe Systems, Inc. | 107,000 | 4,223 |
* | NVIDIA Corp. | 246,000 | 2,635 |
* | Nortel Networks Corp. | 675,750 | 1,514 |
| Xilinx, Inc. | 61,000 | 1,430 |
* | Micron Technology, Inc. | 350,000 | 1,418 |
* | IAC/InterActiveCorp | 54,125 | 936 |
* | Dell Inc. | 44,000 | 725 |
| Intersil Corp. | 30,000 | 497 |
* | VMware Inc. | 17,400 | 464 |
| Visa Inc. | 7,300 | 448 |
* | Verigy Ltd. | 20,814 | 339 |
|
|
| 710,563 |
Materials (7.3%) |
|
| |
| Potash Corp. of |
|
|
| Saskatchewan, Inc. | 448,100 | 59,154 |
| Monsanto Co. | 448,350 | 44,378 |
| Praxair, Inc. | 395,108 | 28,345 |
| Rohm & Haas Co. | 341,000 | 23,870 |
^ | Vulcan Materials Co. | 252,000 | 18,774 |
| International Paper Co. | 670,000 | 17,540 |
| Newmont Mining Corp. (Holding Co.) | 317,300 | 12,298 |
| Weyerhaeuser Co. | 178,767 | 10,830 |
* | Domtar Corp. | 1,879,372 | 8,645 |
| Alcoa Inc. | 366,900 | 8,285 |
| Freeport-McMoRan Copper & Gold, Inc. Class B | 91,120 | 5,180 |
| Dow Chemical Co. | 29,000 | 922 |
|
|
| 238,221 |
Telecommunication Services (0.4%) |
| ||
| Sprint Nextel Corp. | 1,801,150 | 10,987 |
| AT&T Inc. | 20,000 | 558 |
|
|
| 11,545 |
Utilities (0.3%) |
|
| |
* | AES Corp. | 675,000 | 7,891 |
| Sierra Pacific Resources | 83,100 | 796 |
|
|
| 8,687 |
Total Common Stocks |
|
| |
(Cost $2,934,044) |
| 2,822,676 | |
Temporary Cash Investment (14.2%) |
|
| |
1,2 | Vanguard Market Liquidity |
|
|
| Fund, 2.296% | 462,940,000 | 462,940 |
Total Investments (101.0%) |
|
| |
(Cost $3,396,984) |
| 3,285,616 | |
Other Assets and Liabilities (–1.0%) |
|
| |
Other Assets |
| 8,385 | |
Liabilities2 |
| (41,058) | |
|
|
| (32,673) |
Net Assets (100%) |
|
| |
Applicable to 285,105,503 outstanding |
|
| |
$.001 par value shares of beneficial |
|
| |
interest (unlimited authorization) |
| 3,252,943 | |
Net Asset Value Per Share |
| $11.41 | |
13
At September 30, 2008, net assets consisted of: | |
| Amount |
| ($000) |
Paid-in Capital | 3,357,352 |
Undistributed Net Investment Income | 22,085 |
Accumulated Net Realized Losses | (15,113) |
Unrealized Appreciation (Depreciation) |
|
Investment Securities | (111,368) |
Foreign Currencies | (13) |
Net Assets | 3,252,943 |
• See Note A in Notes to Financial Statements.
* Non-income-producing security.
^ Part of security position is on loan to broker-dealers. The total value of securities on loan is $26,957,000.
1 Affiliated money market fund available only to Vanguard funds and certain trusts and accounts managed by Vanguard. Rate shown is the 7-day yield.
2 Includes $28,344,000 of collateral received for securities on loan. ADR—American Depositary Receipt.
See accompanying Notes, which are an integral part of the Financial Statements.
14
Statement of Operations
| Year Ended |
| September 30, 2008 |
| ($000) |
Investment Income |
|
Income |
|
Dividends1 | 46,288 |
Interest2 | 6,180 |
Security Lending | 1,028 |
Total Income | 53,496 |
Expenses |
|
Investment Advisory Fees—Note B | 10,534 |
The Vanguard Group—Note C |
|
Management and Administrative | 4,930 |
Marketing and Distribution | 833 |
Custodian Fees | 56 |
Auditing Fees | 20 |
Shareholders’ Reports | 69 |
Trustees’ Fees and Expenses | 5 |
Total Expenses | 16,447 |
Net Investment Income | 37,049 |
Realized Net Gain (Loss) |
|
Investment Securities Sold | 744 |
Foreign Currencies | (14) |
Realized Net Gain (Loss) | 730 |
Change in Unrealized Appreciation (Depreciation) |
|
Investment Securities | (643,806) |
Foreign Currencies | (21) |
Change in Unrealized Appreciation (Depreciation) | (643,827) |
Net Increase (Decrease) in Net Assets Resulting from Operations | (606,048) |
1 Dividends are net of foreign withholding taxes of $1,334,000.
2 Interest income from an affiliated company of the fund was $6,180,000.
See accompanying Notes, which are an integral part of the Financial Statements.
15
Statement of Changes in Net Assets
| Year Ended September 30, | |
| 2008 | 2007 |
| ($000) | ($000) |
Increase (Decrease) in Net Assets |
|
|
Operations |
|
|
Net Investment Income | 37,049 | 20,350 |
Realized Net Gain (Loss) | 730 | 49,956 |
Change in Unrealized Appreciation (Depreciation) | (643,827) | 340,619 |
Net Increase (Decrease) in Net Assets Resulting from Operations | (606,048) | 410,925 |
Distributions |
|
|
Net Investment Income | (26,723) | (18,806) |
Realized Capital Gain1 | (56,117) | (21,974) |
Total Distributions | (82,840) | (40,780) |
Capital Share Transactions |
|
|
Issued | 1,112,307 | 1,135,559 |
Issued in Lieu of Cash Distributions | 74,752 | 37,043 |
Redeemed2 | (550,567) | (445,147) |
Net Increase (Decrease) from Capital Share Transactions | 636,492 | 727,455 |
Total Increase (Decrease) | (52,396) | 1,097,600 |
Net Assets |
|
|
Beginning of Period | 3,305,339 | 2,207,739 |
End of Period3 | 3,252,943 | 3,305,339 |
1 Includes fiscal 2008 and 2007 short-term gain distributions totaling $15,062,000 and $6,533,000, respectively. Short-term gain distributions are treated as ordinary income dividends for tax purposes.
2 Net of redemption fees of $799,000 and $1,350,000.
3 Net Assets—End of Period includes undistributed net investment income of $22,085,000 and $11,773,000. See accompanying Notes, which are an integral part of the Financial Statements.
16
Financial Highlights
|
|
|
|
|
|
|
|
| Dec. 9, |
Year Ended September 30, | 20041 to | |||
|
|
|
| Sept. 30, |
For a Share Outstanding Throughout Each Period | 2008 | 2007 | 2006 | 2005 |
Net Asset Value, Beginning of Period | $14.03 | $12.28 | $10.98 | $10.00 |
Investment Operations |
|
|
|
|
Net Investment Income | .1382 | .095 | .090 | .030 |
Net Realized and Unrealized Gain (Loss) on Investments | (2.417) | 1.861 | 1.289 | .950 |
Total from Investment Operations | (2.279) | 1.956 | 1.379 | .980 |
Distributions |
|
|
|
|
Dividends from Net Investment Income | (.110) | (.095) | (.050) | — |
Distributions from Realized Capital Gains | (.231) | (.111) | (.029) | — |
Total Distributions | (.341) | (.206) | (.079) | — |
Net Asset Value, End of Period | $11.41 | $14.03 | $12.28 | $10.98 |
|
|
|
|
|
Total Return3 | –16.52% | 16.10% | 12.61% | 9.80% |
|
|
|
|
|
Ratios/Supplemental Data |
|
|
|
|
Net Assets, End of Period (Millions) | $3,253 | $3,305 | $2,208 | $942 |
Ratio of Total Expenses to Average Net Assets | 0.50% | 0.55% | 0.60% | 0.72%4 |
Ratio of Net Investment Income to Average Net Assets | 1.12%2 | 0.73% | 0.90% | 0.58%4 |
Portfolio Turnover Rate | 9% | 10% | 5% | 6% |
1 Inception.
2 | Net investment income per share and the ratio of net investment income to average net assets include $.027 and 0.23%, respectively, resulting from a special dividend from ASML Holding NV in October 2007. |
3 Total returns do not reflect the 1% fee assessed on redemptions of shares held for less than one year, or the account service fee that may be applicable to certain accounts with balances below $10,000.
4 Annualized.
See accompanying Notes, which are an integral part of the Financial Statements.
17
Notes to Financial Statements
Vanguard PRIMECAP Core Fund is registered under the Investment Company Act of 1940 as an open-end investment company, or mutual fund.
A. The following significant accounting policies conform to generally accepted accounting principles for U.S. mutual funds. The fund consistently follows such policies in preparing its financial statements.
1. Security Valuation: Securities are valued as of the close of trading on the New York Stock Exchange (generally 4 p.m., Eastern time) on the valuation date. Equity securities are valued at the latest quoted sales prices or official closing prices taken from the primary market in which each security trades; such securities not traded on the valuation date are valued at the mean of the latest quoted bid and asked prices. Securities for which market quotations are not readily available, or whose values have been affected by events occurring before the fund’s pricing time but after the close of the securities’ primary markets, are valued at their fair values calculated according to procedures adopted by the board of trustees. These procedures include obtaining quotations from an independent pricing service, monitoring news to identify significant market- or security-specific events, and evaluating changes in the values of foreign market proxies (for example, ADRs, futures contracts, or exchange-traded funds), between the time the foreign markets close and the fund’s pricing time. When fair-value pricing is employed, the prices of securities used by a fund to calculate its net asset value may differ from quoted or published prices for the same securities. Investments in Vanguard Market Liquidity Fund are valued at that fund’s net asset value.
2. Foreign Currency: Securities and other assets and liabilities denominated in foreign currencies are translated into U.S. dollars using exchange rates obtained from an independent third party as of the fund’s pricing time on the valuation date. Realized gains (losses) and unrealized appreciation (depreciation) on investment securities include the effects of changes in exchange rates since the securities were purchased, combined with the effects of changes in security prices. Fluctuations in the value of other assets and liabilities resulting from changes in exchange rates are recorded as unrealized foreign currency gains (losses) until the assets or liabilities are settled in cash, at which time they are recorded as realized foreign currency gains (losses).
3. Federal Income Taxes: The fund intends to continue to qualify as a regulated investment company and distribute all of its taxable income. Management has analyzed the fund’s tax positions taken on federal income tax returns for all open tax years (tax years ended September 30, 2005–2008), and has concluded that no provision for federal income tax is required in the fund’s financial statements.
4. Distributions: Distributions to shareholders are recorded on the ex-dividend date.
5. Security Lending: The fund may lend its securities to qualified institutional borrowers to earn additional income. Security loans are required to be secured at all times by collateral at least equal to the market value of securities loaned. The fund invests cash collateral received in Vanguard Market Liquidity Fund, and records a liability for the return of the collateral, during the period the securities are on loan. Security lending income represents the income earned on investing cash collateral, less expenses associated with the loan.
6. Other: Dividend income is recorded on the ex-dividend date. Interest income includes income distributions received from Vanguard Market Liquidity Fund and is accrued daily. Security transactions are accounted for on the date securities are bought or sold. Costs used to determine realized gains (losses) on the sale of investment securities are those of the specific securities sold. Fees assessed on redemptions of capital shares are credited to paid-in capital.
18
B. PRIMECAP Management Company provides investment advisory services to the fund for a fee calculated at an annual percentage rate of average net assets. For the year ended September 30, 2008, the investment advisory fee represented an effective annual rate of 0.32% of the fund’s average net assets.
C. The Vanguard Group furnishes at cost corporate management, administrative, marketing, and distribution services. The costs of such services are allocated to the fund under methods approved by the board of trustees. The fund has committed to provide up to 0.40% of its net assets in capital contributions to Vanguard. At September 30, 2008, the fund had contributed capital of $307,000 to Vanguard (included in Other Assets), representing 0.01% of the fund’s net assets and 0.31% of Vanguard’s capitalization. The fund’s trustees and officers are also directors and officers of Vanguard.
D. Distributions are determined on a tax basis and may differ from net investment income and realized capital gains for financial reporting purposes. Differences may be permanent or temporary. Permanent differences are reclassified among capital accounts in the financial statements to reflect their tax character. Temporary differences arise when certain items of income, expense, gain, or loss are recognized in different periods for financial statement and tax purposes; these differences will reverse at some time in the future. Differences in classification may also result from the treatment of short-term gains as ordinary income for tax purposes.
During the year ended September 30, 2008, the fund realized net foreign currency losses of $14,000, which decreased distributable net income for tax purposes; accordingly, such losses have been reclassified from accumulated net realized losses to undistributed net investment income.
For tax purposes, at September 30, 2008, the fund had $24,920,000 of ordinary income available for distribution. Tax-basis capital gains required to be distributed in December 2007 included net gains realized through October 31, 2007. Subsequently, the fund realized capital losses of $15,115,000 which are available to offset future net capital gains.
At September 30, 2008, the cost of investment securities for tax purposes was $3,396,984,000. Net unrealized depreciation of investment securities for tax purposes was $111,368,000, consisting of unrealized gains of $319,868,000 on securities that had risen in value since their purchase and $431,236,000 in unrealized losses on securities that had fallen in value since their purchase.
E. During the year ended September 30, 2008, the fund purchased $599,480,000 of investment securities and sold $285,765,000 of investment securities, other than temporary cash investments.
F. Capital shares issued and redeemed were:
| Year Ended September 30, | |
| 2008 | 2007 |
| Shares | Shares |
| (000) | (000) |
Issued | 87,101 | 86,606 |
Issued In Lieu of Cash Distributions | 5,799 | 2,917 |
Redeemed | (43,408) | (33,765) |
Net Increase (Decrease) in Shares Outstanding | 49,492 | 55,758 |
19
G. In September 2006, the Financial Accounting Standards Board issued Statement of Financial Accounting Standards No. 157 (“FAS 157”), “Fair Value Measurements.” FAS 157 establishes a framework for measuring fair value and expands disclosures about fair value measurements in financial statements.
The various inputs that may be used to determine the value of the fund’s investments are summarized in three broad levels. The inputs or methodologies used for valuing securities are not necessarily an indication of the risk associated with investing in those securities.
Level 1—Quoted prices in active markets for identical securities.
Level 2—Other significant observable inputs (including quoted prices for similar securities, interest rates, prepayment speeds, credit risk, etc.).
Level 3—Significant unobservable inputs (including the fund’s own assumptions used to determine the fair value of investments).
The following table summarizes the fund’s investments as of September 30, 2008, based on the inputs used to value them:
| Investments |
| in Securities |
Valuation Inputs | ($000) |
Level 1—Quoted prices | 3,233,957 |
Level 2—Other significant observable inputs | 51,659 |
Level 3—Significant unobservable inputs | — |
Total | 3,285,616 |
20
Report of Independent Registered
Public Accounting Firm
To the Trustees of Vanguard Fenway Funds and the Shareholders of Vanguard PRIMECAP Core Fund:
In our opinion, the accompanying statement of net assets and the related statements of operations and of changes in net assets and the financial highlights present fairly, in all material respects, the financial position of Vanguard PRIMECAP Core Fund (the “Fund”) at September 30, 2008, the results of its operations for the year then ended, the changes in its net assets for each of the two years in the period then ended and the financial highlights for each of the periods indicated, in conformity with accounting principles generally accepted in the United States of America. These financial statements and financial highlights (hereafter referred to as “financial statements”) are the responsibility of the Fund’s management; our responsibility is to express an opinion on these financial statements based on our audits. We conducted our audits of these financial statements in accordance with the standards of the Public Company Accounting Oversight Board (United States). Those standards require that we plan and perform the audit to obtain reasonable assurance about whether the financial statements are free of material misstatement. An audit includes examining, on a test basis, evidence supporting the amounts and disclosures in the financial statements, assessing the accounting principles used and significant estimates made by management, and evaluating the overall financial statement presentation. We believe that our audits, which included confirmation of securities at September 30, 2008 by correspondence with the custodian and by agreement to the underlying ownership records for Vanguard Market Liquidity Fund, provide a reasonable basis for our opinion.
PricewaterhouseCoopers LLP
Philadelphia, Pennsylvania
November 19, 2008
Special 2008 tax information (unaudited) for Vanguard PRIMECAP Core Fund
This information for the fiscal year ended September 30, 2008, is included pursuant to provisions of the Internal Revenue Code.
The fund distributed $41,056,000 as capital gain dividends (from net long-term capital gains) to shareholders during the fiscal year.
For non-resident alien shareholders, 100% of short-term capital gain dividends distributed by the fund are qualified short-term capital gains.
The fund distributed $26,723,000 of qualified dividend income to shareholders during the fiscal year.
For corporate shareholders, 70.9% of investment income (dividend income plus short-term gains, if any) qualifies for the dividends-received deduction.
21
Your Fund’s After-Tax Returns
This table presents returns for your fund both before and after taxes. The after-tax returns are shown in two ways: (1) assuming that an investor owned the fund during the entire period and paid taxes on the fund’s distributions, and (2) assuming that an investor paid taxes on the fund’s distributions and sold all shares at the end of each period.
Calculations are based on the highest individual federal income tax and capital gains tax rates in effect at the times of the distributions and the hypothetical sales. State and local taxes were not considered. After-tax returns reflect any qualified dividend income, using actual prior-year figures and estimates for 2008. (In the example, returns after the sale of fund shares may be higher than those assuming no sale. This occurs when the sale would have produced a capital loss. The calculation assumes that the investor received a tax deduction for the loss.)
Please note that your actual after-tax returns will depend on your tax situation and may differ from those shown. Also note that if you own the fund in a tax-deferred account, such as an individual retirement account or a 401(k) plan, this information does not apply to you. Such accounts are not subject to current taxes.
Finally, keep in mind that a fund’s performance—whether before or after taxes—does not guarantee future results.
Average Annual Total Returns: PRIMECAP Core Fund1 |
|
|
Periods Ended September 30, 2008 |
|
|
| One | Since |
| Year | Inception2 |
Returns Before Taxes | –16.52% | 4.87% |
Returns After Taxes on Distributions | –16.89 | 4.63 |
Returns After Taxes on Distributions and Sale of Fund Shares | –10.27 | 4.16 |
1 Total returns do not include the 1% fee assessed on redemptions of shares held less than one year, or the account service fee that may be applicable to certain accounts with balances below $10,000.
2 Inception date: December 9, 2004.
22
About Your Fund’s Expenses
As a shareholder of the fund, you incur ongoing costs, which include costs for portfolio management, administrative services, and shareholder reports (like this one), among others. Operating expenses, which are deducted from a fund’s gross income, directly reduce the investment return of the fund.
A fund’s expenses are expressed as a percentage of its average net assets. This figure is known as the expense ratio. The following examples are intended to help you understand the ongoing costs (in dollars) of investing in your fund and to compare these costs with those of other mutual funds. The examples are based on an investment of $1,000 made at the beginning of the period shown and held for the entire period.
The accompanying table illustrates your fund’s costs in two ways:
• Based on actual fund return. This section helps you to estimate the actual expenses that you paid over the period. The “Ending Account Value” shown is derived from the fund’s actual return, and the third column shows the dollar amount that would have been paid by an investor who started with $1,000 in the fund. You may use the information here, together with the amount you invested, to estimate the expenses that you paid over the period.
To do so, simply divide your account value by $1,000 (for example, an $8,600 account value divided by $1,000 = 8.6), then multiply the result by the number given for your fund under the heading “Expenses Paid During Period.”
• Based on hypothetical 5% yearly return. This section is intended to help you compare your fund’s costs with those of other mutual funds. It assumes that the fund had a yearly return of 5% before expenses, but that the expense ratio is unchanged. In this case—because the return used is not the fund’s actual return—the results do not apply to your investment. The example is useful in making comparisons because the Securities and Exchange Commission requires all mutual funds to calculate expenses based on a 5% return. You can assess your fund’s costs by comparing this hypothetical example with the hypothetical examples that appear in shareholder reports of other funds.
Six Months Ended September 30, 2008 |
|
|
|
| Beginning | Ending | Expenses |
| Account Value | Account Value | Paid During |
PRIMECAP Core Fund | 3/31/2008 | 9/30/2008 | Period1 |
Based on Actual Fund Return | $1,000.00 | $934.48 | $2.33 |
Based on Hypothetical 5% Yearly Return | 1,000.00 | 1,022.66 | 2.43 |
Note that the expenses shown in the table are meant to highlight and help you compare ongoing costs only and do not reflect transaction costs incurred by the fund for buying and selling securities. Further, the expenses do not include the 1% fee on redemptions of shares held for less than one year, nor do they include the account service fee described in the prospectus. If such fees were applied to your account, your costs would be higher. Your fund does not carry a “sales load.”
1 The calculations are based on expenses incurred in the most recent six-month period. The fund’s annualized six-month expense ratio for that period is 0.48%. The dollar amounts shown as “Expenses Paid” are equal to the annualized expense ratio multiplied by the average account value over the period, multiplied by the number of days in the most recent six-month period, then divided by the number of days in the most recent 12-month period.
23
The calculations assume no shares were bought or sold during the period. Your actual costs may have been higher or lower, depending on the amount of your investment and the timing of any purchases or redemptions.
You can find more information about the fund’s expenses including annual expense ratios, in the Financial Statements section of this report. For additional information on operating expenses and other shareholder costs, please refer to your fund’s current prospectus.
24
Glossary
Beta. A measure of the magnitude of a fund’s past share-price fluctuations in relation to the ups and downs of a given market index. The index is assigned a beta of 1.00. Compared with a given index, a fund with a beta of 1.20 typically would have seen its share price rise or fall by 12% when the index rose or fell by 10%. For this report, beta is based on returns over the past 36 months for both the fund and the index. Note that a fund’s beta should be reviewed in conjunction with its R-squared (see definition). The lower the R-squared, the less correlation there is between the fund and the index, and the less reliable beta is as an indicator of volatility.
Earnings Growth Rate. The average annual rate of growth in earnings over the past five years for the stocks now in a fund.
Equity Exposure. A measure that reflects a fund’s investments in stocks and stock futures. Any holdings in short-term reserves are excluded.
Expense Ratio. The percentage of a fund’s average net assets used to pay its annual administrative and advisory expenses. These expenses directly reduce returns to investors.
Foreign Holdings. The percentage of a fund represented by stocks or depositary receipts of companies based outside the United States.
Inception Date. The date on which the assets of a fund (or one of its share classes) are first invested in accordance with the fund’s investment objective. For funds with a subscription period, the inception date is the day after that period ends. Investment performance is measured from the inception date.
Median Market Cap. An indicator of the size of companies in which a fund invests; the midpoint of market capitalization (market price x shares outstanding) of a fund’s stocks, weighted by the proportion of the fund’s assets invested in each stock. Stocks representing half of the fund’s assets have market capitalizations above the median, and the rest are below it.
Price/Book Ratio. The share price of a stock divided by its net worth, or book value, per share. For a fund, the weighted average price/book ratio of the stocks it holds.
Price/Earnings Ratio. The ratio of a stock’s current price to its per-share earnings over the past year. For a fund, the weighted average P/E of the stocks it holds. P/E is an indicator of market expectations about corporate prospects; the higher the P/E, the greater the expectations for a company’s future growth.
R-Squared. A measure of how much of a fund’s past returns can be explained by the returns from the market in general, as measured by a given index. If a fund’s total returns were precisely synchronized with an index’s returns, its R-squared would be 1.00. If the fund’s returns bore no relationship to the index’s returns, its R-squared would be 0. For this report, R-squared is based on returns over the past 36 months for both the fund and the index.
Return on Equity. The annual average rate of return generated by a company during the past five years for each dollar of shareholder’s equity (net income divided by shareholder’s equity). For a fund, the weighted average return on equity for the companies whose stocks it holds.
Short-Term Reserves. The percentage of a fund invested in highly liquid, short-term securities that can be readily converted to cash.
25
Turnover Rate. An indication of the fund’s trading activity. Funds with high turnover rates incur higher transaction costs and may be more likely to distribute capital gains (which may be taxable to investors). The turnover rate excludes in-kind transactions, which have minimal impact on costs.
Yield. A fund’s 30-day SEC yield is derived using a formula specified by the U.S. Securities and Exchange Commission. Under the formula, data related to the fund’s security holdings in the previous 30 days are used to calculate the fund’s hypothetical net income for that period, which is then annualized and divided by the fund’s estimated average net assets over the calculation period. For the purposes of this calculation, a security’s income is based on its current market yield to maturity (in the case of bonds) or its projected dividend yield (for stocks). Because the SEC yield represents hypothetical annualized income, it will differ—at times significantly—from the fund’s actual experience. As a result, the fund’s income distributions may be higher or lower than implied by the SEC yield.
26
This page intentionally left blank.
The People Who Govern Your Fund
The trustees of your mutual fund are there to see that the fund is operated and managed in your best interests since, as a shareholder, you are a part owner of the fund. Your fund’s trustees also serve on the board of directors of The Vanguard Group, Inc., which is owned by the Vanguard funds and provides services to them on an at-cost basis.
A majority of Vanguard’s board members are independent, meaning that they have no affiliation with Vanguard or the funds they oversee, apart from the sizable personal investments they have made as private individuals.
Our independent board members bring distinguished backgrounds in business, academia, and public service to their task of working with Vanguard officers to establish the policies and oversee the activities of the funds. Among board members’ responsibilities are selecting investment advisors for the funds; monitoring fund operations, performance, and costs; reviewing contracts; nominating and selecting new trustees/directors; and electing Vanguard officers.
Each trustee serves a fund until its termination; or until the trustee’s retirement, resignation, or death; or otherwise as specified in the fund’s organizational documents. Any trustee may be removed at a shareholders’ meeting by a vote representing two-thirds of the net asset value of all shares of the fund together with shares of other Vanguard funds organized within the same trust. The table on these two pages shows information for each trustee and executive officer of the fund. The mailing address of the trustees and officers is P.O. Box 876, Valley Forge, PA 19482.
Chairman of the Board and Trustee | |
|
|
John J. Brennan1 |
|
Born 1954 | Principal Occupation(s) During the Past Five Years: Chairman of the Board and Director/ |
Trustee Since May 1987; | Trustee of The Vanguard Group, Inc., and of each of the investment companies served |
Chairman of the Board | by The Vanguard Group; Chief Executive Officer and President of The Vanguard Group |
156 Vanguard Funds Overseen | and of each of the investment companies served by The Vanguard Group (1996–2008). |
|
|
Independent Trustees |
|
|
|
Charles D. Ellis |
|
Born 1937 | Principal Occupation(s) During the Past Five Years: Applecore Partners (pro bono ventures |
Trustee Since January 2001 | in education); Senior Advisor to Greenwich Associates (international business strategy |
156 Vanguard Funds Overseen | consulting); Successor Trustee of Yale University; Overseer of the Stern School of Business |
| at New York University; Trustee of the Whitehead Institute for Biomedical Research. |
|
|
Emerson U. Fullwood |
|
Born 1948 | Principal Occupation(s) During the Past Five Years: Executive Chief Staff and Marketing |
Trustee Since January 2008 | Officer for North America since 2004 and Corporate Vice President of Xerox Corporation |
156 Vanguard Funds Overseen | (photocopiers and printers); Director of SPX Corporation (multi-industry manufacturing), |
| of the United Way of Rochester, and of the Boy Scouts of America. |
|
|
Rajiv L. Gupta |
|
Born 1945 | Principal Occupation(s) During the Past Five Years: Chairman, President, and |
Trustee Since December 20012 | Chief Executive Officer of Rohm and Haas Co. (chemicals); Board Member of |
156 Vanguard Funds Overseen | the American Chemistry Council; Director of Tyco International, Ltd. (diversified |
| manufacturing and services) since 2005. |
|
|
Amy Gutmann |
|
Born 1949 | Principal Occupation(s) During the Past Five Years: President of the University of |
Trustee Since June 2006 | Pennsylvania since 2004; Professor in the School of Arts and Sciences, Annenberg School |
156 Vanguard Funds Overseen | for Communication, and Graduate School of Education of the University of Pennsylvania |
| since 2004; Provost (2001–2004) and Laurance S. Rockefeller Professor of Politics and |
| the University Center for Human Values (1990–2004), Princeton University; Director of |
| Carnegie Corporation of New York since 2005 and of Schuylkill River Development |
| Corporation and Greater Philadelphia Chamber of Commerce since 2004; Trustee of |
| the National Constitution Center since 2007. |
JoAnn Heffernan Heisen |
|
Born 1950 | Principal Occupation(s) During the Past Five Years: Corporate Vice President and |
Trustee Since July 1998 | Chief Global Diversity Officer since 2006, Vice President and Chief Information |
156 Vanguard Funds Overseen | Officer (1997–2005), and Member of the Executive Committee of Johnson & |
| Johnson (pharmaceuticals/consumer products); Director of the University Medical |
| Center at Princeton and Women’s Research and Education Institute. |
|
|
André F. Perold |
|
Born 1952 | Principal Occupation(s) During the Past Five Years: George Gund Professor of Finance |
Trustee Since December 2004 | and Banking, Harvard Business School; Senior Associate Dean and Director of Faculty |
156 Vanguard Funds Overseen | Recruiting, Harvard Business School; Director and Chairman of UNX, Inc. (equities |
| trading firm); Chair of the Investment Committee of HighVista Strategies LLC (private |
| investment firm) since 2005. |
|
|
Alfred M. Rankin, Jr. |
|
Born 1941 | Principal Occupation(s) During the Past Five Years: Chairman, President, Chief Executive |
Trustee Since January 1993 | Officer, and Director of NACCO Industries, Inc. (forklift trucks/housewares/lignite); Director |
156 Vanguard Funds Overseen | of Goodrich Corporation (industrial products/aircraft systems and services). |
|
|
J. Lawrence Wilson |
|
Born 1936 | Principal Occupation(s) During the Past Five Years: Retired Chairman and Chief Executive |
Trustee Since April 1985 | Officer of Rohm and Haas Co. (chemicals); Director of Cummins Inc. (diesel engines) and |
156 Vanguard Funds Overseen | AmerisourceBergen Corp. (pharmaceutical distribution); Trustee of Vanderbilt University |
| and of Culver Educational Foundation. |
|
|
Executive Officers1 |
|
|
|
Thomas J. Higgins |
|
Born 1957 | Principal Occupation(s) During the Past Five Years: Principal of The Vanguard Group, Inc.; |
Chief Financial Officer | Treasurer of each of the investment companies served by The Vanguard Group; Chief |
Since September 2008 | Financial Officer of each of the investment companies served by The Vanguard |
Treasurer Since July 1998 | Group since 2008. |
156 Vanguard Funds Overseen |
|
|
|
F. William McNabb III |
|
Born 1957 | Principal Occupation(s) During the Past Five Years: Chief Executive Officer, Director, |
Chief Executive Officer | and President of The Vanguard Group, Inc., since 2008; Chief Executive Officer and |
Since August 31, 2008 | President of each of the investment companies served by The Vanguard Group since |
President Since March 2008 | 2008; Director of Vanguard Marketing Corporation; Managing Director of The Vanguard |
156 Vanguard Funds Overseen | Group (1995–2008). |
|
|
Heidi Stam |
|
Born 1956 | Principal Occupation(s) During the Past Five Years: Managing Director of The Vanguard |
Secretary Since July 2005 | Group, Inc., since 2006; General Counsel of The Vanguard Group since 2005; Secretary of |
156 Vanguard Funds Overseen | The Vanguard Group and of each of the investment companies served by The Vanguard |
| Group since 2005; Director and Senior Vice President of Vanguard Marketing Corporation |
| since 2005; Principal of The Vanguard Group (1997–2006). |
Vanguard Senior Management Team |
|
| |
|
|
|
|
R. Gregory Barton | Kathleen C. Gubanich | Michael S. Miller | Glenn W. Reed |
Mortimer J. Buckley | Paul A. Heller | Ralph K. Packard | George U. Sauter |
Founder |
|
John C. Bogle |
Chairman and Chief Executive Officer, 1974–1996 |
1 These individuals are “interested persons” as defined in the Investment Company Act of 1940.
2 December 2002 for Vanguard Equity Income Fund, Vanguard Growth Equity Fund, the Vanguard Municipal Bond Funds, and the Vanguard State Tax-Exempt Funds.
More information about the trustees is in the Statement of Additional Information, available from The Vanguard Group.

P.O. Box 2600
Valley Forge, PA 19482-2600
Connect with Vanguard® > www.vanguard.com
Fund Information > 800-662-7447 | All comparative mutual fund data are from |
| Lipper Inc. or Morningstar, Inc., |
| unless otherwise noted. |
Direct Investor Account Services > 800-662-2739 |
|
| You can obtain a free copy of Vanguard’s |
| proxy voting guidelines by visiting our |
Institutional Investor Services > 800-523-1036 | website, www.vanguard.com, and |
| searching for “proxy voting guidelines,” or |
Text Telephone for People | by calling Vanguard at 800-662-2739. |
With Hearing Impairment > 800-952-3335 | The guidelines are also available from |
| the SEC’s website, www.sec.gov. In |
| addition, you may obtain a free report on |
| how your fund voted the proxies for |
This material may be used in conjunction | securities it owned during the 12 months |
with the offering of shares of any Vanguard | ended June 30. To get the report, visit |
fund only if preceded or accompanied by | either www.vanguard.com or |
the fund’s current prospectus. | www.sec.gov. |
|
|
The funds or securities referred to herein are not | You can review and copy information |
sponsored, endorsed, or promoted by MSCI, and | about your fund at the SEC’s Public |
MSCI bears no liability with respect to any such | Reference Room in Washington, D.C. |
funds or securities. For any such funds or securities, | To find out more about this public service, |
the prospectus or the Statement of Additional | call the SEC at 202-551-8090. |
Information contains a more detailed description of | Information about your fund is also |
the limited relationship MSCI has with The Vanguard | available on the SEC’s website, and you |
Group and any related funds. | can receive copies of this information, |
| for a fee, by sending a |
Russell is a trademark of The Frank Russell | request in either of two ways: via e-mail |
Company. | addressed to publicinfo@sec.gov or |
| via regular mail addressed to the |
| Public Reference Section, Securities and |
| Exchange Commission, Washington, DC |
| 20549-0102. |
|
|
|
|
| © 2008 The Vanguard Group, Inc. All |
| rights reserved. |
| Vanguard Marketing Corporation, |
| Distributor. |
| Q12200 112008 |
Item 2: Code of Ethics. The Registrant has adopted a code of ethics that applies to the Registrant’s principal executive officer, principal financial officer, principal accounting officer or controller or persons performing similar functions. The Code of Ethics was amended during the reporting period covered by this report to make certain technical, non-material changes.
Item 3: Audit Committee Financial Expert. The following members of the Audit Committee have been determined by the Registrant’s Board of Trustees to be Audit Committee Financial Experts serving on its Audit Committee, and to be independent: Charles D. Ellis, Rajiv L. Gupta, JoAnn Heffernan Heisen, André F. Perold, Alfred M. Rankin, Jr., and J. Lawrence Wilson.
Item 4: Principal Accountant Fees and Services.
(a) Audit Fees.
Audit Fees of the Registrant
Fiscal Year Ended September 30, 2008: $65,000
Fiscal Year Ended September 30, 2007: $65,000
Aggregate Audit Fees of Registered Investment Companies in the Vanguard Group.
Fiscal Year Ended September 30, 2008: $3,055,590
Fiscal Year Ended September 30, 2007: $2,835,320
(b) Audit-Related Fees.
Fiscal Year Ended September 30, 2008: $626,240
Fiscal Year Ended September 30, 2007: $630,400
Includes fees billed in connection with assurance and related services provided to the Registrant, The Vanguard Group, Inc., Vanguard Marketing Corporation, and other registered investment companies in the Vanguard Group.
(c) Tax Fees.
Fiscal Year Ended September 30, 2008: $230,400
Fiscal Year Ended September 30, 2007: $215,900
Includes fees billed in connection with tax compliance, planning and advice services provided to the Registrant, The Vanguard Group, Inc., Vanguard Marketing Corporation, and other registered investment companies in the Vanguard Group and related to income and excise taxes.
(d) All Other Fees.
Fiscal Year Ended September 30, 2008: $0
Fiscal Year Ended September 30, 2007: $0
Includes fees billed for services related to risk management and privacy matters. Services were provided to the Registrant, The Vanguard Group, Inc., Vanguard Marketing Corporation, and other registered investment companies in the Vanguard Group.
(e) (1) Pre-Approval Policies. The policy of the Registrant’s Audit Committee is to consider and, if appropriate, approve before the principal accountant is engaged for such services, all specific audit and non-audit services provided to: (1) the Registrant; (2) The Vanguard Group, Inc.; (3) other entities controlled by The Vanguard Group, Inc. that provide ongoing services to the Registrant; and (4) other registered investment companies in the Vanguard Group. In making a determination, the Audit Committee considers whether the services are consistent with maintaining the principal accountant’s independence.
In the event of a contingency situation in which the principal accountant is needed to provide services in between scheduled Audit Committee meetings, the Chairman of the Audit Committee would be called on to consider and, if appropriate, pre-approve audit or permitted non-audit services in an amount sufficient to complete services through the next Audit Committee meeting, and to determine if such services would be consistent with maintaining the accountant’s independence. At the next scheduled Audit Committee meeting, services and fees would be presented to the Audit Committee for formal consideration, and, if appropriate, approval by the entire Audit Committee. The Audit Committee would again consider whether such services and fees are consistent with maintaining the principal accountant’s independence.
The Registrant’s Audit Committee is informed at least annually of all audit and non-audit services provided by the principal accountant to the Vanguard complex, whether such services are provided to: (1) the Registrant; (2) The Vanguard Group, Inc.; (3) other entities controlled by The Vanguard Group, Inc. that provide ongoing services to the Registrant; or (4) other registered investment companies in the Vanguard Group.
(2) No percentage of the principal accountant’s fees or services were approved pursuant to the waiver provision of paragraph (c)(7)(i)(C) of Rule 2-01 of Regulation S-X.
(f) For the most recent fiscal year, over 50% of the hours worked under the principal accountant’s engagement were not performed by persons other than full-time, permanent employees of the principal accountant.
(g) Aggregate Non-Audit Fees.
Fiscal Year Ended September 30, 2008: $230,400
Fiscal Year Ended September 30, 2007: $215,900
Includes fees billed for non-audit services provided to the Registrant, The Vanguard Group, Inc., Vanguard Marketing Corporation, and other registered investment companies in the Vanguard Group.
(h) For the most recent fiscal year, the Audit Committee has determined that the provision of all non-audit services was consistent with maintaining the principal accountant’s independence.
Item 5: Not Applicable.
Item 6: Not Applicable.
Item 7: Not Applicable.
Item 8: Not Applicable.
Item 9: Not Applicable.
Item 10: Not Applicable.
Item 11: Controls and Procedures.
(a) Disclosure Controls and Procedures. The Principal Executive and Financial Officers concluded that the Registrant's Disclosure Controls and Procedures are effective based on their evaluation of the Disclosure Controls and Procedures as of a date within 90 days of the filing date of this report.
(b) Internal Control Over Financial Reporting. There were no significant changes in Registrant’s Internal Control Over Financial Reporting or in other factors that could significantly affect this control subsequent to the date of the evaluation, including any corrective actions with regard to significant deficiencies and material weaknesses.
Item 12: Exhibits.
| (a) | Code of Ethics. |
| (b) | Certifications. |
Pursuant to the requirements of the Securities Exchange Act of 1934 and the Investment Company Act of 1940, the registrant has duly caused this report to be signed on its behalf by the undersigned, thereunto duly authorized.
| VANGUARD FENWAY FUNDS |
|
|
By: | /s/ F. WILLIAM MCNABB III* |
| F. WILLIAM MCNABB III |
| CHIEF EXECUTIVE OFFICER |
|
|
Date: November 18, 2008 | |
Pursuant to the requirements of the Securities Exchange Act of 1934 and the Investment Company Act of 1940, this report has been signed below by the following persons on behalf of the registrant and in the capacities and on the dates indicated.
| VANGUARD FENWAY FUNDS |
|
|
By: | /s/ F. WILLIAM MCNABB III* |
| F. WILLIAM MCNABB III |
| CHIEF EXECUTIVE OFFICER |
|
|
Date: November 18, 2008 | |
| VANGUARD FENWAY FUNDS |
|
|
By: | /s/ THOMAS J. HIGGINS* |
| THOMAS J. HIGGINS |
| CHIEF FINANCIAL OFFICER |
|
|
Date: November 18, 2008 | |
* By: /s/ Heidi Stam
Heidi Stam, pursuant to a Power of Attorney filed on January 18, 2008, see file Number 2-29601, Incorporated by Reference; and pursuant to a Power of Attorney filed on September 26, 2008, see File Number 2-47371, Incorporated by Reference.