UNITED STATES
SECURITIES AND EXCHANGE COMMISSION
Washington, D.C. 20549
FORM N-CSR
CERTIFIED SHAREHOLDER REPORT
OF
REGISTERED MANAGEMENT COMPANY
| Investment Company Act file number: | 811-5445 |
| Name of Registrant: | Vanguard Fenway Funds |
| Address of Registrant: | P.O. Box 2600 Valley Forge, PA 19482 |
| Name and address of agent for service: | Heidi Stam, Esquire P.O. Box 876 Valley Forge, PA 19482 |
Registrant’s telephone number, including area code: (610) 669-1000
| Date of fiscal year end: | September 30 |
| Date of reporting period: | October 1, 2005 - September 30, 2006 |
| Item 1: | Reports to Shareholders |
|
|
|
|
| Vanguard® Equity Income Fund |
|
|
|
|
|
|
|
|
|
|
| > Annual Report |
|
|
|
|
|
|
|
|
|
|
|
|
|
|
|
|
|
|
| September 30, 2006 |
|
|
|
|
|
|
|
| ||
|
|
| |
|
|
| |
|
|
| |
|
|
| |
|
|
| |
|
|
| |
|
|
| |
|
|
| |

> | Returns for Vanguard Equity Income Fund were in line with its benchmark and well ahead of the average gain among its peer funds for the 2006 fiscal year. The fund’s Investor Shares returned 14.4%, and Admiral Shares, 14.5%. |
> | The fund benefited from a defensive turn among investors, who embraced large companies with stable earnings and dividends. |
> | The fund’s returns over the past decade have solidly outpaced both the broad market and the average return among peer funds. |
Contents |
|
|
|
Your Fund’s Total Returns | 1 |
Chairman’s Letter | 2 |
Advisors’ Report | 7 |
Fund Profile | 9 |
Performance Summary | 10 |
Financial Statements | 12 |
Your Fund’s After-Tax Returns | 25 |
About Your Fund’s Expenses | 26 |
Glossary | 28 |
Please note: The opinions expressed in this report are just that—informed opinions. They should not be considered promises or advice. Also, please keep in mind that the information and opinions cover the period through the date on the cover of this report. Of course, the risks of investing in your fund are spelled out in the prospectus.
Your Fund’s Total Returns
Fiscal Year Ended September 30, 2006 |
|
| Total |
| Returns |
Vanguard Equity Income Fund |
|
Investor Shares | 14.4% |
AdmiralTM Shares1 | 14.5 |
Russell 1000 Value Index | 14.6 |
Average Equity Income Fund2 | 11.7 |
Dow Jones Wilshire 5000 Index | 10.5 |
Your Fund’s Performance at a Glance | ||||
September 30, 2005–September 30, 2006 | ||||
|
|
| Distributions Per Share | |
| Starting | Ending | Income | Capital |
| Share Price | Share Price | Dividends | Gains |
Vanguard Equity Income Fund |
|
|
|
|
Investor Shares | $23.73 | $25.21 | $0.710 | $1.054 |
Admiral Shares | 49.74 | 52.84 | 1.560 | 2.209 |
1 A lower-cost class of shares available to many longtime shareholders and to those with significant investments in the fund.
2 Derived from data provided by Lipper Inc.
1

Chairman’s Letter
Dear Shareholder,
The stock market took a defensive turn during Vanguard Equity Income Fund’s fiscal year ended September 30, 2006, benefiting the large, stable, dividend-paying companies the fund favors. The fund’s Investor Shares gained 14.4%; Admiral Shares were up 14.5%. The fund’s performance was in line with that of its index, the Russell 1000 Value Index, and well ahead of the average return among its peer funds.
The U.S. economy slowed as the fund’s fiscal year progressed, drawing investors to companies that tend to perform better in a weakened environment. For example, some of the fund’s biggest gains came from diversified financial companies and consumer staples stocks. These were attractive not only for their consistent dividends but also for their ability, relative to other sectors, to resist business cycles.
At the end of the fiscal year, the Equity Income Fund’s dividend yields were 2.79% and 2.93% for Investor and Admiral Shares, respectively.
Stocks endured some rough going, then recovered to post strong results
The stock market advanced through the first part of the fund’s fiscal year, then hit a speed bump in May, as investors feared that the economy was growing too rapidly. But a slowdown in the housing market, coupled with a late-summer decline in oil prices, helped to allay inflation concerns. The broad market rebounded to post a
2
solid 10.5% return for the 12-month period. Value-oriented stocks outperformed growth stocks, and large-capitalization stocks edged out small-caps, one of the market’s best-performing segments in recent years.
International stocks handily outpaced domestic issues, continuing a multiyear trend. European and emerging market stocks fared particularly well. Stocks in the Pacific region also performed admirably, even though Japanese stocks did not fully participate in the global market’s summer recovery.
In the bond market, prices rallied as the Fed paused
At its August and September meetings, the Federal Reserve Board twice voted to maintain the federal funds rate at 5.25%, marking a pause in the central bank’s two-year inflation-fighting campaign. With investor sentiment buoyed by the Fed’s near-term inflation outlook, interest rates decreased, driving bond prices higher. The broad taxable bond market finished the period with a 3.7% return, and municipal bonds performed slightly better.
Although rates decreased along the entire maturity spectrum in late summer, the difference between the yields of the shortest- and longest-term issues remained narrow by historical standards. At the end of September, the U.S. Treasury yield curve was actually inverted, meaning that short-term issues such as 3-month and 6-month Treasury notes offered higher yields than those with longer maturities.
Market Barometer |
| ||
| Average Annual Total Returns | ||
| Periods Ended September 30, 2006 | ||
| One Year | Three Years | Five Years |
Stocks |
|
|
|
Russell 1000 Index (Large-caps) | 10.2% | 12.8% | 7.6% |
Russell 2000 Index (Small-caps) | 9.9 | 15.5 | 13.8 |
Dow Jones Wilshire 5000 Index (Entire Market) | 10.5 | 13.3 | 8.6 |
MSCI All Country World Index ex USA (International) | 19.4 | 23.9 | 16.4 |
|
|
|
|
Bonds |
|
|
|
Lehman Aggregate Bond Index (Broad Taxable Market) | 3.7% | 3.4% | 4.8% |
Lehman Municipal Bond Index | 4.5 | 4.4 | 5.2 |
Citigroup 3-Month Treasury Bill Index | 4.4 | 2.6 | 2.2 |
|
|
|
|
CPI |
|
|
|
Consumer Price Index | 2.1% | 3.1% | 2.6% |
3
Last year’s best-performer list was turned on its head
The fund’s performance for the fiscal year just concluded was in some ways a mirror image of the report I delivered a year ago. Then, as now, the fund produced attractive double-digit gains. However, a year ago, energy and utilities stocks produced the lion’s share of the gain. During the most recent fiscal year, the fund’s holdings in both categories suffered declines while the financials sector—a laggard a year ago—was by far the top contributor to returns.
The so-called money center banks—whose business lines are much broader than retail banking—were the financials sector’s leaders. Bank of America, JPMorgan Chase, and Citigroup benefited from record levels of corporate bond issuance, an active merger and acquisition market, and increased exposure to rapidly growing international markets. Despite their strong absolute returns, the fund’s financials holdings didn’t quite keep pace with the index’s financials stocks, largely because of your fund’s slightly smaller allocation to this admirably performing sector.
Telecommunications stocks were also large contributors. Two industry giants that are merging—AT&T and BellSouth—were among the fund’s top-five contributors for the year. Gains were also strong among the fund’s consumer discretionary stocks, including Family Dollar Stores and International Game Technology, which manufactures computerized gaming equipment.
Expense Ratios1 |
|
|
|
Your fund compared with its peer group |
|
|
|
|
|
| Average |
| Investor | Admiral | Equity |
| Shares | Shares | Income Fund |
Equity Income Fund | 0.31% | 0.17% | 1.37% |
1 Fund expense ratios reflect the 12 months ended September 30, 2006. Peer-group expense ratio is derived from data provided by Lipper Inc. and captures information through year-end 2005.
4
As I mentioned earlier, energy and utilities stocks were a drag on performance. ConocoPhillips, one of the fund’s largest holdings, was the biggest detractor for the year. It is part-owner of an Alaskan oil field that was temporarily shut down owing to a leaking pipeline. In the consumer discretionary sector, newspaper companies, whose advertising revenue is under pressure from the Internet, also hurt returns.
This discussion of fund performance is based on the entire portfolio, which is split between two managers: Wellington Management Company, LLP, and Vanguard Quantitative Equity Group. To read a report from each advisor, please turn to page 7.
Long-term performance puts fund ahead
The fund’s emphasis on dividend-paying stocks with low prices relative to earnings has produced competitive long-term results. As the table below shows, the Equity Income Fund Investor Shares’ average annual total return of 10.0% over the past decade exceeds that of its average peer fund by about 2 percentage points per year. An investor who put $10,000 into the Equity Income Fund ten years ago would have $4,185 more in his or her account than the balance produced by the average gain among peer-group funds.
Over the ten years ended September 30, the fund has also surpassed the average annual return of the broad-market Dow Jones Wilshire 5000 Composite Index
Total Returns |
|
|
Ten Years Ended September 30, 2006 |
|
|
| Average | Final Value of a $10,000 |
| Annual Return | Initial Investment |
Equity Income Fund Investor Shares | 10.0% | $26,030 |
Russell 1000 Value Index | 11.2 | 28,909 |
Average Equity Income Fund | 8.1 | 21,845 |
Dow Jones Wilshire 5000 Composite Index | 8.6 | 22,871 |
5
by more than 1 percentage point. However, over the same ten-year period, the fund’s return has lagged that of the Russell 1000 Value Index by slightly more than 1 percentage point.
Provision your portfolio for a long-term journey
Although the stock market finished the 12-month period with a solid return, the journey was circuitous: a strong start, a mid-May swoon, and a powerful finish. These ups and downs are an unavoidable fact of investing life.
Our time-tested counsel to shareholders navigating the market’s peaks and valleys in pursuit of long-term goals is to diversify both within and across asset classes. Within the stock market portion of your portfolio, for example, you can complement the large-cap-oriented Vanguard Equity Income Fund with smaller stocks, potentially moderating your portfolio’s volatility. And you can temper portfolio risk more dramatically by balancing stock funds with bond and money market funds in an allocation consistent with your goals and circumstances.
This simple plan gives you the opportunity to pursue the high potential returns available from stocks, while paying heed to risk control. Vanguard Equity Income Fund can play an important role in such a plan.
Thank you for entrusting your assets to Vanguard.
Sincerely,

John J. Brennan
Chairman and Chief Executive Officer
October 16, 2006
6
Advisors’ Report
During the 12 months ended September 30, 2006, the Investor Shares of Vanguard Equity Income Fund returned 14.4% and the lower-cost Admiral Shares returned 14.5%. This performance reflects the combined efforts of your fund’s two independent advisors. The use of two advisors provides exposure to distinct, yet complementary, investment approaches, enhancing the diversification of your fund.
The advisors, the percentage of fund assets each manages, and a brief description of their investment strategies are presented in the table below. Each advisor has also prepared a discussion of the investment environment that existed during the 2006 fiscal year and of how the portfolio positioning reflects this assessment.
Wellington Management Company, LLP
Portfolio Manager:
John R. Ryan, Senior Vice President, Partner
In our portion of the fund, we employ a fundamental approach to identify desirable individual stocks, seeking those that typically offer above-average dividend yields, below-average valuations, and the potential for dividend increases in the future.
U.S. economic growth has begun to slow from the robust growth experienced in the first half of the Equity Income Fund’s fiscal 2006. In particular, as of the fiscal year-end, new housing starts were declining rapidly, automotive manufacturers had announced production cuts, and consumer spending was showing signs of slowing, owing to both higher interest rates and continued high energy prices.
Vanguard Equity Income Fund
| Fund Assets Managed |
| ||
Investment Advisor | % | $ Million | Investment Strategy | |
Wellington Management | 57 | 2,741 | A fundamental approach to seeking desirable stocks. | |
Company, LLP |
|
| Our selections typically offer above-average dividend | |
|
|
| yields, below-average valuations, and the potential | |
|
|
| for dividend increases in the future. | |
Vanguard Quantitative Equity Group | 38 | 1,844 | Quantitative management with the primary | |
|
|
| assessment of a company’s future prospects made | |
|
|
| by evaluating its current valuation characteristics. | |
Cash Investments1 | 5 | 233 | — | |
1 These short-term reserves are invested by The Vanguard Group in equity index products to simulate investment in stocks. Each advisor also may maintain a modest cash position.
7
As a result of these decelerating dynamics, we anticipate that U.S. economic growth will slow to the 2%–3% range, but without triggering a recession. We have recently seen significant declines in both the price of oil and interest rates, which we hope will enable consumers to improve their liquidity and cushion the expected economic weakness.
Global economic growth remains strong as major economies expand concurrently. Despite our expectation that domestic economic growth will slow, we anticipate that global economic growth will remain strong over the next 12 months.
Over the fiscal year, our stock purchases for the fund exhibited no overall theme, but, rather, reflected stock-specific fundamentals. Among our largest purchases were Pitney Bowes, General Electric, Allstate, and Host Hotels & Resorts. Our sales consisted of stocks that reached our price targets, such as Caterpillar, Rockwell Automation, Emerson Electric, and Regency Centers Corp. REIT. Within energy, we sold BP and bought Chevron, a company that we felt had more attractive valuation measures.
Vanguard Quantitative Equity Group
Portfolio Manager:
James P. Stetler, Principal
Our portion of the fund is managed using a quantitative strategy that focuses on valuation characteristics. We identify securities whose current valuation characteristics are attractive relative to both their history and to the market.
Unlike our other quantitatively managed portfolios, we do not “risk-control” the Equity Income portfolio to have the same market capitalization and sector exposures as the benchmark. This process can, over time, rotate the portfolio out of specific stocks and sectors that have been performing well and into those higher-yielding stocks and sectors that have been under pressure. As these companies revert upward to their long-term pricing mean, we hope to capture that potential for capital appreciation, while ensuring that a high proportion of investors’ returns will come from relatively safe dividend income.
Over the past year, sector-weighting differences between the portfolio and its benchmark, the Russell 1000 Value Index, had a net positive impact on the fund’s overall performance. Underweightings in the energy and utility sectors were strong contributors to relative performance, although an overweighted position in consumer discretionary stocks detracted from our results. In terms of individual security positions, our portfolio benefited from strong returns among some of our consumer stock holdings (e.g., Family Dollar Stores, International Game Technology, and Mattel) and an overweighted position in financial services firm State Street. Some of our other financial picks did not fare as well, as we were underrepresented in some of the largest high-performing money center banks (e.g., Bank of America, JPMorgan Chase, and Citigroup).
8
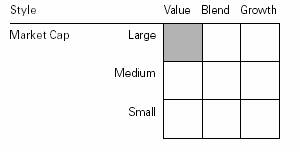
Fund Profile
As of September 30, 2006
Portfolio Characteristics |
|
| |
|
| Comparative | Broad |
| Fund | Index1 | Index2 |
Number of Stocks | 153 | 614 | 4,974 |
Median Market Cap | $37.5B | $49.0B | $27.5B |
Price/Earnings Ratio | 16.0x | 14.7x | 17.2x |
Price/Book Ratio | 2.6x | 2.2x | 3.7x |
Yield |
| 2.5% | 1.7% |
Investor Shares | 2.8% |
|
|
Admiral Shares | 2.9% |
|
|
Return on Equity | 19.8% | 17.3% | 15.4% |
Earnings Growth Rate | 12.8% | 15.6% | 15.7% |
Foreign Holdings | 2.7% | 0.0% | 1.1% |
Turnover Rate | 26% | — | — |
Expense Ratio |
| — | — |
Investor Shares | 0.31% |
|
|
Admiral Shares | 0.17% |
|
|
Short-Term Reserves | 1% | — | — |
Sector Diversification (% of portfolio) |
| ||
|
| Comparative | Broad |
| Fund | Index1 | Index2 |
Consumer Discretionary | 10% | 8% | 12% |
Consumer Staples | 12 | 8 | 9 |
Energy | 6 | 13 | 9 |
Financials | 30 | 37 | 23 |
Health Care | 10 | 7 | 12 |
Industrials | 10 | 7 | 11 |
Information Technology | 2 | 4 | 15 |
Materials | 7 | 4 | 3 |
Telecommunication Services | 6 | 6 | 3 |
Utilities | 6 | 6 | 3 |
Short-Term Reserves | 1% | — | — |
Volatility Measures3 |
| |
| Fund Versus | Fund Versus |
| Comparative Index1 | Broad Index2 |
R-Squared | 0.93 | 0.79 |
Beta | 0.91 | 0.77 |
Ten Largest Holdings4 (% of total net assets) |
| |
|
|
|
Bank of America Corp. | diversified financial services | 3.5% |
AT&T Inc. | integrated telecommunication services | 3.1 |
ExxonMobil Corp. | integrated oil and gas | 2.5 |
Citigroup, Inc. | diversified financial services | 2.4 |
General Electric Co. | industrial conglomerates | 1.9 |
Wyeth | pharmaceuticals | 1.8 |
Altria Group, Inc. | tobacco | 1.6 |
Wells Fargo & Co. | diversified banks | 1.5 |
UBS AG (New York Shares) | diversified capital markets | 1.5 |
Pfizer Inc. | pharmaceuticals | 1.4 |
Top Ten |
| 21.2% |
Investment Focus
1 Russell 1000 Value Index.
2 Dow Jones Wilshire 5000 Index.
3 For an explanation of R-squared, beta, and other terms used here, see the Glossary on page 28.
4 “Ten Largest Holdings” excludes any temporary cash investments and equity index products.
9
Performance Summary
All of the returns in this report represent past performance, which is not a guarantee of future results that may be achieved by the fund. (Current performance may be lower or higher than the performance data cited. For performance data current to the most recent month-end, visit our website at www.vanguard.com.) Note, too, that both investment returns and principal value can fluctuate widely, so an investor’s shares, when sold, could be worth more or less than their original cost. The returns shown do not reflect taxes that a shareholder would pay on fund distributions or on the sale of fund shares.
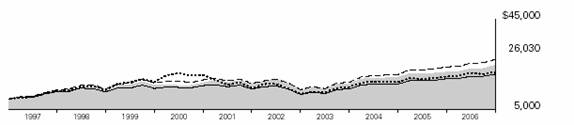
Cumulative Performance: September 30, 1996–September 30, 2006
Initial Investment of $10,000
| Average Annual Total Returns | Final Value | ||
| Periods Ended September 30, 2006 | of a $10,000 | ||
| One Year | Five Years | Ten Years | Investment |
Equity Income Fund Investor Shares | 14.39% | 8.34% | 10.04% | $26,030 |
Dow Jones Wilshire 5000 Index | 10.48 | 8.64 | 8.62 | 22,871 |
Russell 1000 Value Index | 14.62 | 10.73 | 11.20 | 28,909 |
Average Equity Income Fund1 | 11.74 | 8.15 | 8.13 | 21,845 |
|
|
|
| Final Value |
|
|
| Since | of a $100,000 |
| One Year | Five Years | Inception2 | Investment |
Equity Income Fund Admiral Shares | 14.55% | 8.46% | 6.87% | $140,636 |
Dow Jones Wilshire 5000 Index | 10.48 | 8.64 | 5.49 | 131,573 |
Russell 1000 Value Index | 14.62 | 10.73 | 8.19 | 149,796 |
1 Derived from data provided by Lipper Inc.
2 August 13, 2001.
Note: See Financial Highlights tables on pages 18 and 19 for dividend and capital gains information.
10
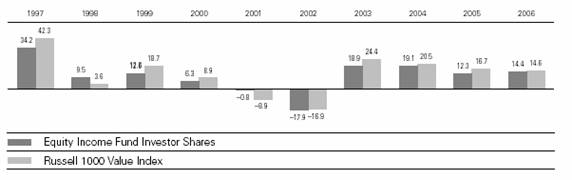
Fiscal-Year Total Returns (%): September 30, 1996–September 30, 2006
11
Financial Statements
Statement of Net Assets
As of September 30, 2006
The fund provides a complete list of its holdings four times in each fiscal year, at the quarter-ends. For the second and fourth fiscal quarters, the lists appear in the fund’s semiannual and annual reports to shareholders. For the first and third fiscal quarters, the fund files the lists with the Securities and Exchange Commission on Form N-Q. Shareholders can look up the fund’s Forms N-Q on the SEC’s website at www.sec.gov. Forms N-Q may also be reviewed and copied at the SEC’s Public Reference Room (see the back cover of this report for further information).
|
|
| Market |
|
|
| Value• |
|
| Shares | ($000) |
Common Stocks (95.1%)1 |
|
| |
Consumer Discretionary (8.9%) |
|
| |
| Gannett Co., Inc. | 709,000 | 40,292 |
| Mattel, Inc. | 1,668,210 | 32,864 |
| Family Dollar Stores, Inc. | 1,101,100 | 32,196 |
| Jones Apparel Group, Inc. | 890,700 | 28,894 |
^ | General Motors Corp. | 856,800 | 28,497 |
| Gentex Corp. | 1,942,901 | 27,609 |
| Leggett & Platt, Inc. | 1,014,300 | 25,388 |
| Brunswick Corp. | 736,300 | 22,965 |
| Newell Rubbermaid, Inc. | 776,700 | 21,996 |
^ | New York Times Co. Class A | 905,800 | 20,815 |
| Tribune Co. | 631,820 | 20,673 |
| The McClatchy Co. Class A | 365,265 | 15,411 |
| Regal Entertainment Group Class A | 748,800 | 14,841 |
| Station Casinos, Inc. | 247,800 | 14,330 |
| Eastman Kodak Co. | 633,224 | 14,184 |
| International Game Technology | 327,297 | 13,583 |
| Dow Jones & Co., Inc. | 395,400 | 13,262 |
| McDonald’s Corp. | 311,600 | 12,190 |
| Belo Corp. Class A | 754,100 | 11,922 |
| Limited Brands, Inc. | 442,112 | 11,712 |
| OSI Restaurant Partners, Inc. | 210,700 | 6,681 |
|
|
| 430,305 |
Consumer Staples (11.8%) |
|
| |
| Altria Group, Inc. | 1,021,455 | 78,192 |
| Kimberly-Clark Corp. | 943,775 | 61,685 |
| Colgate-Palmolive Co. | 719,000 | 44,650 |
| Kellogg Co. | 805,310 | 39,879 |
| General Mills, Inc. | 689,473 | 39,024 |
| PepsiCo, Inc. | 561,500 | 36,644 |
^ | Kraft Foods Inc. | 926,997 | 33,057 |
| Sysco Corp. | 920,800 | 30,801 |
| ConAgra Foods, Inc. | 1,198,900 | 29,349 |
| The Coca-Cola Co. | 643,505 | 28,752 |
| Avon Products, Inc. | 924,600 | 28,348 |
| Campbell Soup Co. | 601,100 | 21,940 |
| Diageo PLC ADR | 301,850 | 21,443 |
| Anheuser-Busch Cos., Inc. | 299,000 | 14,206 |
| Sara Lee Corp. | 818,470 | 13,153 |
| H.J. Heinz Co. | 294,100 | 12,332 |
| The Procter & Gamble Co. | 167,220 | 10,364 |
| J.M. Smucker Co. | 149,400 | 7,164 |
| The Hershey Co. | 125,700 | 6,719 |
| Wm. Wrigley Jr. Co. | 100,800 | 4,643 |
| The Clorox Co. | 60,897 | 3,837 |
|
|
| 566,182 |
Energy (5.5%) |
|
| |
| ExxonMobil Corp. | 1,798,305 | 120,666 |
| Chevron Corp. | 806,600 | 52,316 |
| ConocoPhillips Co. | 814,400 | 48,481 |
| Royal Dutch Shell PLC ADR Class B | 289,877 | 19,822 |
| Royal Dutch Shell PLC ADR Class A | 212,500 | 14,046 |
| Kinder Morgan, Inc. | 55,750 | 5,845 |
| BP PLC ADR | 85,158 | 5,585 |
|
|
| 266,761 |
Financials (28.4%) |
|
| |
| Capital Markets (4.7%) |
|
|
| UBS AG (New York Shares) | 1,212,800 | 71,931 |
| The Bank of New York Co., Inc. | 1,213,500 | 42,788 |
| Merrill Lynch & Co., Inc. | 546,023 | 42,710 |
| Mellon Financial Corp. | 769,600 | 30,091 |
| State Street Corp. | 438,114 | 27,338 |
| Northern Trust Corp. | 225,900 | 13,199 |
|
|
|
|
| Commercial Banks (8.0%) |
|
|
| Wells Fargo & Co. | 2,054,330 | 74,326 |
| Wachovia Corp. | 848,824 | 47,364 |
| PNC Financial Services Group | 588,782 | 42,651 |
| U.S. Bancorp | 1,259,179 | 41,830 |
| SunTrust Banks, Inc. | 458,100 | 35,402 |
| Fifth Third Bancorp | 732,700 | 27,901 |
| Comerica, Inc. | 350,200 | 19,933 |
| City National Corp. | 206,900 | 13,875 |
12
|
|
| Market |
|
|
| Value• |
|
| Shares | ($000) |
| BB&T Corp. | 311,800 | 13,651 |
| Popular, Inc. | 700,400 | 13,616 |
| First Horizon National Corp. | 352,000 | 13,380 |
| Huntington Bancshares Inc. | 538,500 | 12,886 |
| Synovus Financial Corp. | 353,000 | 10,368 |
| Zions Bancorp | 105,300 | 8,404 |
| FirstMerit Corp. | 248,000 | 5,746 |
| TCF Financial Corp. | 109,895 | 2,889 |
|
|
|
|
| Diversified Financial Services (7.0%) |
|
|
| Bank of America Corp. | 3,188,638 | 170,815 |
| Citigroup, Inc. | 2,320,966 | 115,282 |
| JPMorgan Chase & Co. | 1,111,300 | 52,187 |
|
|
|
|
| Insurance (5.2%) |
|
|
| The Allstate Corp. | 818,800 | 51,363 |
| The Chubb Corp. | 924,200 | 48,021 |
| ACE Ltd. | 574,200 | 31,426 |
| Cincinnati Financial Corp. | 606,843 | 29,165 |
| MBIA, Inc. | 444,235 | 27,294 |
| Arthur J. Gallagher & Co. | 864,439 | 23,055 |
| Marsh & McLennan Cos., Inc. | 543,100 | 15,288 |
| Fidelity National Financial, Inc. | 309,940 | 12,909 |
| Nationwide Financial Services, Inc. | 139,100 | 6,691 |
| Mercury General Corp. | 72,200 | 3,582 |
^ | Fidelity National Title Group, Inc. Class A | 54,239 | 1,137 |
|
|
|
|
| Real Estate (0.9%) |
|
|
| Host Marriott Corp. REIT | 1,654,800 | 37,945 |
| KKR Financial Corp. REIT | 297,900 | 7,311 |
|
|
|
|
| Thrifts & Mortgage Finance (2.6%) |
|
|
| Freddie Mac | 463,100 | 30,717 |
| New York Community |
|
|
| Bancorp, Inc. | 1,669,300 | 27,343 |
| Washington Mutual, Inc. | 522,265 | 22,703 |
| Fannie Mae | 313,900 | 17,550 |
| Countrywide Financial Corp. | 449,900 | 15,765 |
| Astoria Financial Corp. | 338,250 | 10,425 |
|
|
| 1,370,253 |
Health Care (9.5%) |
|
| |
| Wyeth | 1,700,598 | 86,458 |
| Pfizer Inc. | 2,428,880 | 68,883 |
| Abbott Laboratories | 1,417,770 | 68,847 |
| Bristol-Myers Squibb Co. | 2,210,132 | 55,076 |
| Baxter International, Inc. | 964,400 | 43,842 |
| AstraZeneca Group PLC ADR | 491,300 | 30,706 |
| Eli Lilly & Co. | 538,049 | 30,669 |
| Johnson & Johnson | 470,805 | 30,574 |
Merck & Co., Inc. | 705,314 | 29,553 |
GlaxoSmithKline PLC ADR | 228,393 | 12,157 |
|
| 456,765 |
Industrials (9.8%) |
|
|
General Electric Co. | 2,648,272 | 93,484 |
United Parcel Service, Inc. | 705,400 | 50,746 |
Deere & Co. | 584,800 | 49,071 |
Pitney Bowes, Inc. | 1,040,335 | 46,160 |
Caterpillar, Inc. | 674,300 | 44,369 |
Waste Management, Inc. | 789,300 | 28,952 |
American Standard Cos., Inc. | 657,500 | 27,595 |
3M Co. | 343,900 | 25,593 |
Goodrich Corp. | 617,700 | 25,029 |
R.R. Donnelley & Sons Co. | 541,900 | 17,861 |
Honeywell International Inc. | 401,762 | 16,432 |
Masco Corp. | 565,444 | 15,505 |
American Power Conversion Corp. | 423,409 | 9,298 |
Avery Dennison Corp. | 141,500 | 8,514 |
Ingersoll-Rand Co. | 163,800 | 6,221 |
The Boeing Co. | 77,732 | 6,129 |
|
| 470,959 |
Information Technology (1.2%) |
|
|
Automatic Data |
|
|
Processing, Inc. | 628,100 | 29,734 |
Paychex, Inc. | 299,400 | 11,033 |
Taiwan Semiconductor Manufacturing Co. Ltd. ADR | 1,146,100 | 11,003 |
Intel Corp. | 264,900 | 5,449 |
|
| 57,219 |
Materials (6.9%) |
|
|
Dow Chemical Co. | 1,502,945 | 58,585 |
E.I. du Pont de Nemours & Co. | 988,727 | 42,357 |
Alcoa Inc. | 1,384,100 | 38,810 |
Air Products & Chemicals, Inc. | 500,700 | 33,232 |
PPG Industries, Inc. | 457,400 | 30,682 |
Packaging Corp. of America | 1,155,000 | 26,796 |
International Paper Co. | 753,970 | 26,110 |
Weyerhaeuser Co. | 421,200 | 25,916 |
Bowater Inc. | 1,189,684 | 24,472 |
Valspar Corp. | 467,600 | 12,438 |
Freeport-McMoRan Copper & Gold, Inc. Class B | 124,200 | 6,615 |
Temple-Inland Inc. | 120,400 | 4,828 |
|
| 330,841 |
Telecommunication Services (5.8%) |
|
|
AT&T Inc. | 4,624,353 | 150,569 |
Verizon Communications Inc. | 1,567,657 | 58,207 |
BellSouth Corp. | 962,106 | 41,130 |
13
|
| Market |
|
| Value• |
| Shares | ($000) |
Sprint Nextel Corp. | 1,004,400 | 17,225 |
Vodafone Group PLC ADR | 481,687 | 11,011 |
Chunghwa Telecom Co., Ltd. ADR | 180,100 | 3,118 |
|
| 281,260 |
Utilities (6.0%) |
|
|
FPL Group, Inc. | 1,262,566 | 56,816 |
Dominion Resources, Inc. | 694,985 | 53,159 |
Exelon Corp. | 646,500 | 39,139 |
PPL Corp. | 726,300 | 23,895 |
SCANA Corp. | 563,400 | 22,688 |
Southern Co. | 624,400 | 21,517 |
Consolidated Edison Inc. | 414,800 | 19,164 |
Northeast Utilities | 618,300 | 14,388 |
Duke Energy Corp. | 416,634 | 12,582 |
Pinnacle West Capital Corp. | 250,200 | 11,272 |
Entergy Corp. | 113,200 | 8,856 |
NiSource, Inc. | 299,500 | 6,511 |
|
| 289,987 |
Exchange-Traded Funds (1.3%) |
|
|
2 Vanguard Value ETF | 963,400 | 61,369 |
Total Common Stocks |
|
|
(Cost $3,687,084) |
| 4,581,901 |
Temporary Cash Investments (5.8%)1 |
|
|
Money Market Fund (4.2%) |
|
|
3 Vanguard Market Liquidity |
|
|
Fund, 5.306% | 159,914,315 | 159,914 |
3 Vanguard Market Liquidity |
|
|
Fund, 5.306%—Note G | 45,185,000 | 45,185 |
|
| 205,099 |
Repurchase Agreement (1.3%) |
|
|
Goldman, Sachs & Co. 5.370%, |
|
|
10/2/06 (Dated 9/30/06, |
|
|
Repurchase Value |
|
|
$61,027,000, collateralized |
|
|
by Federal Home Loan |
|
|
Mortgage Corp. 4.500%, |
|
|
4/1/20, Federal National |
|
|
Mortgage Assn. |
|
|
5.000%, 9/1/35) | 61,000 | 61,000 |
U.S. Agency Obligations (0.3%) |
|
|
4 Federal Home Loan |
|
|
Mortgage Corp. |
|
|
5.199%, 10/17/2006 | 1,000 | 998 |
5 5.193%, 10/18/2006 | 3,000 | 2,993 |
5 5.150%, 12/26/2006 | 9,500 | 9,386 |
4 Federal National |
|
|
Mortgage Assn. |
|
|
5 5.336%, 10/4/2006 | 2,000 | 1,999 |
|
| 15,376 |
Total Temporary Cash Investments |
|
|
(Cost $281,473) |
| 281,475 |
Total Investments (100.9%) |
|
|
(Cost $3,968,557) |
| 4,863,376 |
Other Assets and Liabilities (–0.9%) |
|
|
Other Assets—Note C |
| 17,782 |
Liabilities—Note G |
| (62,739) |
|
| (44,957) |
Net Assets (100%) |
| 4,818,419 |
14
At September 30, 2006, net assets consisted of:6 | |
| Amount |
| ($000) |
Paid-in Capital | 3,701,588 |
Overdistributed Net Investment Income | (1,037) |
Accumulated Net Realized Gains | 220,461 |
Unrealized Appreciation |
|
Investment Securities | 894,819 |
Futures Contracts | 2,588 |
Net Assets | 4,818,419 |
|
|
Investor Shares—Net Assets |
|
Applicable to 120,394,101 outstanding $.001 |
|
par value shares of beneficial interest |
|
(unlimited authorization) | 3,035,218 |
Net Asset Value Per Share— |
|
Investor Shares | $25.21 |
|
|
Admiral Shares—Net Assets |
|
Applicable to 33,746,469 outstanding $.001 |
|
par value shares of beneficial interest |
|
(unlimited authorization) | 1,783,201 |
Net Asset Value Per Share— |
|
Admiral Shares | $52.84 |
• | See Note A in Notes to Financial Statements. |
^ | Part of security position is on loan to broker-dealers. See Note G in Notes to Financial Statements. |
1 The fund invests a portion of its cash reserves in equity markets through the use of index futures contracts. After giving effect to futures investments, the fund’s effective common stock and temporary cash investment positions represent 98.8% and 2.1%, respectively, of net assets. See Note E in Notes to Financial Statements.
2 Considered an affiliated company of the fund as the issuer is another member of The Vanguard Group.
3 Affiliated money market fund available only to Vanguard funds and certain trusts and accounts managed by Vanguard. Rate shown is the 7-day yield.
4 The issuer operates under a congressional charter; its securities are neither issued nor guaranteed by the U.S. government. If needed, access to additional funding from the U.S. Treasury (beyond the issuer’s line of credit) would require congressional action.
5 Securities with a value of $14,378,000 have been segregated as initial margin for open futures contracts.
6 See Note E in Notes to Financial Statements for the tax-basis components of net assets.
ADR—American Depositary Receipt.
REIT—Real Estate Investment Trust.
15
Statement of Operations
| Year Ended |
| September 30, 2006 |
| ($000) |
Investment Income |
|
Income |
|
Dividends1 | 136,452 |
Interest1 | 5,068 |
Security Lending | 685 |
Total Income | 142,205 |
Expenses |
|
Investment Advisory Fees—Note B |
|
Basic Fee | 3,276 |
Performance Adjustment | (360) |
The Vanguard Group—Note C |
|
Management and Administrative |
|
Investor Shares | 5,914 |
Admiral Shares | 1,296 |
Marketing and Distribution |
|
Investor Shares | 733 |
Admiral Shares | 284 |
Custodian Fees | 136 |
Auditing Fees | 26 |
Shareholders’ Reports |
|
Investor Shares | 99 |
Admiral Shares | 4 |
Trustees’ Fees and Expenses | 5 |
Total Expenses | 11,413 |
Expenses Paid Indirectly—Note D | (159) |
Net Expenses | 11,254 |
Net Investment Income | 130,951 |
Realized Net Gain (Loss) |
|
Investment Securities Sold1 | 248,532 |
Futures Contracts | 2,550 |
Realized Net Gain (Loss) | 251,082 |
Change in Unrealized Appreciation (Depreciation) |
|
Investment Securities | 214,147 |
Futures Contracts | 2,521 |
Change in Unrealized Appreciation (Depreciation) | 216,668 |
Net Increase (Decrease) in Net Assets Resulting from Operations | 598,701 |
1 Dividend income, interest income, and realized net gain (loss) from affiliated companies of the fund were $1,684,000, $3,237,000, and $3,484,000, respectively.
16
Statement of Changes in Net Assets
| Year Ended September 30, | |
| 2006 | 2005 |
| ($000) | ($000) |
Increase (Decrease) in Net Assets |
|
|
Operations |
|
|
Net Investment Income | 130,951 | 112,916 |
Realized Net Gain (Loss) | 251,082 | 223,447 |
Change in Unrealized Appreciation (Depreciation) | 216,668 | 108,524 |
Net Increase (Decrease) in Net Assets Resulting from Operations | 598,701 | 444,887 |
Distributions |
|
|
Net Investment Income |
|
|
Investor Shares | (83,049) | (84,682) |
Admiral Shares | (49,152) | (26,180) |
Realized Capital Gain1 |
|
|
Investor Shares | (124,461) | (149,036) |
Admiral Shares | (65,693) | (31,863) |
Total Distributions | (322,355) | (291,761) |
Capital Share Transactions—Note H |
|
|
Investor Shares | (73,058) | (28,703) |
Admiral Shares | 263,647 | 779,228 |
Net Increase (Decrease) from Capital Share Transactions | 190,589 | 750,525 |
Total Increase (Decrease) | 466,935 | 903,651 |
Net Assets |
|
|
Beginning of Period | 4,351,484 | 3,447,833 |
End of Period2 | 4,818,419 | 4,351,484 |
1 Includes fiscal 2006 and 2005 short-term gain distributions totaling $20,387,000 and $74,551,000, respectively. Short-term gain distributions are treated as ordinary income dividends for tax purposes.
2 Net Assets–End of Period includes undistributed (overdistributed) net investment income of ($1,037,000) and $213,000.
17
Financial Highlights
Equity Income Fund Investor Shares
For a Share Outstanding | Year Ended September 30, | ||||
Throughout Each Period | 2006 | 2005 | 2004 | 2003 | 2002 |
Net Asset Value, Beginning of Period | $23.73 | $22.82 | $20.11 | $17.36 | $22.22 |
Investment Operations |
|
|
|
|
|
Net Investment Income | .703 | .653 | .576 | .50 | .48 |
Net Realized and Unrealized Gain (Loss) |
|
|
|
|
|
on Investments | 2.541 | 2.069 | 3.196 | 2.75 | (4.26) |
Total from Investment Operations | 3.244 | 2.722 | 3.772 | 3.25 | (3.78) |
Distributions |
|
|
|
|
|
Dividends from Net Investment Income | (.710) | (.640) | (.585) | (.50) | (.48) |
Distributions from Realized Capital Gains | (1.054) | (1.172) | (.477) | — | (.60) |
Total Distributions | (1.764) | (1.812) | (1.062) | (.50) | (1.08) |
Net Asset Value, End of Period | $25.21 | $23.73 | $22.82 | $20.11 | $17.36 |
|
|
|
|
|
|
Total Return | 14.39% | 12.27% | 19.07% | 18.87% | –17.89% |
|
|
|
|
|
|
Ratios/Supplemental Data |
|
|
|
|
|
Net Assets, End of Period (Millions) | $3,035 | $2,934 | $2,838 | $2,221 | $1,776 |
Ratio of Total Expenses to |
|
|
|
|
|
Average Net Assets1 | 0.31% | 0.32% | 0.32% | 0.45% | 0.46% |
Ratio of Net Investment Income to |
|
|
|
|
|
Average Net Assets | 2.94% | 2.80% | 2.61% | 2.61% | 2.21% |
Portfolio Turnover Rate | 26% | 42% | 36% | 55% | 21% |
1 Includes performance-based investment advisory fee increases (decreases) of (0.01%), (0.01%), 0.00%, 0.03%, and 0.03%.
18
Equity Income Fund Admiral Shares
For a Share Outstanding | Year Ended September 30, | ||||
Throughout Each Period | 2006 | 2005 | 2004 | 2003 | 2002 |
|
|
|
|
|
|
Net Asset Value, Beginning of Period | $49.74 | $47.83 | $42.15 | $36.39 | $46.57 |
Investment Operations |
|
|
|
|
|
Net Investment Income | 1.545 | 1.434 | 1.255 | 1.078 | 1.040 |
Net Realized and Unrealized Gain (Loss) |
|
|
|
|
|
on Investments | 5.324 | 4.338 | 6.698 | 5.770 | (8.918) |
Total from Investment Operations | 6.869 | 5.772 | 7.953 | 6.848 | (7.878) |
Distributions |
|
|
|
|
|
Dividends from Net Investment Income | (1.560) | (1.406) | (1.273) | (1.088) | (1.044) |
Distributions from Realized Capital Gains | (2.209) | (2.456) | (1.000) | — | (1.258) |
Total Distributions | (3.769) | (3.862) | (2.273) | (1.088) | (2.302) |
Net Asset Value, End of Period | $52.84 | $49.74 | $47.83 | $42.15 | $36.39 |
|
|
|
|
|
|
Total Return | 14.55% | 12.42% | 19.19% | 18.98% | –17.80% |
|
|
|
|
|
|
Ratios/Supplemental Data |
|
|
|
|
|
Net Assets, End of Period (Millions) | $1,783 | $1,417 | $610 | $416 | $253 |
Ratio of Total Expenses to |
|
|
|
|
|
Average Net Assets1 | 0.17% | 0.19% | 0.22% | 0.35% | 0.39% |
Ratio of Net Investment Income to |
|
|
|
|
|
Average Net Assets | 3.08% | 2.96% | 2.71% | 2.71% | 2.29% |
Portfolio Turnover Rate | 26% | 42% | 36% | 55% | 21% |
1 Includes performance-based investment advisory fee increases (decreases) of (0.01%), (0.01%), 0.00%, 0.03%, and 0.03%. See accompanying Notes, which are an integral part of the Financial Statements.
19
Notes to Financial Statements
Vanguard Equity Income Fund is registered under the Investment Company Act of 1940 as an open-end investment company, or mutual fund. The fund files reports with the SEC under the name Vanguard Fenway Funds. The fund offers two classes of shares, Investor Shares and Admiral Shares. Investor Shares are available to any investor who meets the fund’s minimum purchase requirements. Admiral Shares are designed for investors who meet certain administrative, servicing, tenure, and account-size criteria.
A. The following significant accounting policies conform to generally accepted accounting principles for U.S. mutual funds. The fund consistently follows such policies in preparing its financial statements.
1. Security Valuation: Securities are valued as of the close of trading on the New York Stock Exchange (generally 4:00 p.m. Eastern time) on the valuation date. Equity securities are valued at the latest quoted sales prices or official closing prices taken from the primary market in which each security trades; such securities not traded on the valuation date are valued at the mean of the latest quoted bid and asked prices. Securities for which market quotations are not readily available, or whose values have been materially affected by events occurring before the fund’s pricing time but after the close of the securities’ primary markets, are valued by methods deemed by the board of trustees to represent fair value. Investments in Vanguard Market Liquidity Fund are valued at that fund’s net asset value. Temporary cash investments acquired over 60 days to maturity are valued using the latest bid prices or using valuations based on a matrix system (which considers such factors as security prices, yields, maturities, and ratings), both as furnished by independent pricing services. Other temporary cash investments are valued at amortized cost, which approximates market value.
2. Futures Contracts: The fund uses index futures contracts to a limited extent, with the objective of maintaining full exposure to the stock market while maintaining liquidity. The fund may purchase or sell futures contracts to achieve a desired level of investment, whether to accommodate portfolio turnover or cash flows from capital share transactions. The primary risks associated with the use of futures contracts are imperfect correlation between changes in market values of stocks held by the fund and the prices of futures contracts, and the possibility of an illiquid market.
Futures contracts are valued at their quoted daily settlement prices. The aggregate principal amounts of the contracts are not recorded in the Statement of Net Assets. Fluctuations in the value of the contracts are recorded in the Statement of Net Assets as an asset (liability) and in the Statement of Operations as unrealized appreciation (depreciation) until the contracts are closed, when they are recorded as realized futures gains (losses).
3. Repurchase Agreements: The fund may invest in repurchase agreements. Securities pledged as collateral for repurchase agreements are held by a custodian bank until the agreements mature. Each agreement requires that the market value of the collateral be sufficient to cover payments of interest and principal; however, in the event of default or bankruptcy by the other party to the agreement, retention of the collateral may be subject to legal proceedings.
4. Federal Income Taxes: The fund intends to continue to qualify as a regulated investment company and distribute all of its taxable income. Accordingly, no provision for federal income taxes is required in the financial statements.
5. Distributions: Distributions to shareholders are recorded on the ex-dividend date.
20
6. Security Lending: The fund may lend its securities to qualified institutional borrowers to earn additional income. Security loans are required to be secured at all times by collateral at least equal to the market value of securities loaned. The fund invests cash collateral received in Vanguard Market Liquidity Fund, and records a liability for the return of the collateral, during the period the securities are on loan. Security lending income represents the income earned on investing cash collateral, less expenses associated with the loan.
7. Other: Dividend income is recorded on the ex-dividend date. Interest income includes income distributions received from Vanguard Market Liquidity Fund and is accrued daily. Security transactions are accounted for on the date securities are bought or sold. Costs used to determine realized gains (losses) on the sale of investment securities are those of the specific securities sold.
Each class of shares has equal rights as to assets and earnings, except that each class separately bears certain class-specific expenses related to maintenance of shareholder accounts (included in Management and Administrative expenses) and shareholder reporting. Marketing and distribution expenses are allocated to each class of shares based on a method approved by the board of trustees. Income, other non-class-specific expenses, and gains and losses on investments are allocated to each class of shares based on its relative net assets.
B. Wellington Management Company, LLP, provides investment advisory services to a portion of the fund for a fee calculated at an annual percentage rate of average net assets managed by the advisor. The basic fee for Wellington Management Company, LLP, is subject to quarterly adjustments based on performance for the preceding three years relative to the Lipper Equity Income average.
The Vanguard Group provides investment advisory services to a portion of the fund on an at-cost basis; the fund paid Vanguard advisory fees of $462,000 for the year ended September 30, 2006.
For the year ended September 30, 2006, the aggregate investment advisory fee represented an effective annual basic rate of 0.07% of the fund’s average net assets before a decrease of $360,000 (0.01%) based on performance.
C. The Vanguard Group furnishes at cost corporate management, administrative, marketing, and distribution services. The costs of such services are allocated to the fund under methods approved by the board of trustees. The fund has committed to provide up to 0.40% of its net assets in capital contributions to Vanguard. At September 30, 2006, the fund had contributed capital of $489,000 to Vanguard (included in Other Assets), representing 0.01% of the fund’s net assets and 0.49% of Vanguard’s capitalization. The fund’s trustees and officers are also directors and officers of Vanguard.
D. The fund has asked its investment advisors to direct certain security trades, subject to obtaining the best price and execution, to brokers who have agreed to rebate to the fund part of the commissions generated. Such rebates are used solely to reduce the fund’s management and administrative expenses. For the year ended September 30, 2006, these arrangements reduced expenses by $159,000.
E. Distributions are determined on a tax basis and may differ from net investment income and realized capital gains for financial reporting purposes. Differences may be permanent or temporary. Permanent differences are reclassified among capital accounts in the financial statements to reflect their tax character. Temporary differences arise when certain items of income, expense, gain, or loss are recognized in different periods for financial statement and tax purposes; these differences will reverse at some time in the future. Differences in classification may also result from the treatment of short-term gains as ordinary income for tax purposes.
21
The fund used a tax accounting practice to treat a portion of the price of capital shares redeemed during the year as distributions from realized capital gains. Accordingly, the fund has reclassified $25,631,000 from accumulated net realized gains to paid-in capital.
For tax purposes, at September 30, 2006, the fund had $28,428,000 of ordinary income and $200,159,000 of long-term capital gains available for distribution.
At September 30, 2006, cost of investment securities for tax purposes was $3,969,000. Net unrealized appreciation of investment securities for tax purposes was $894,724,000, consisting of unrealized gains of $956,602,000 on securities that had risen in value since their purchase and $61,878,000 in unrealized losses on securities that had fallen in value since their purchase.
At September 30, 2006, the aggregate settlement value of open futures contracts expiring in December 2006 and the related unrealized appreciation (depreciation) were:
|
|
| ($000) |
|
| Aggregate | Unrealized |
| Number of | Settlement | Appreciation |
Futures Contracts | Long Contracts | Value | (Depreciation) |
S&P 500 Index | 367 | 123,440 | 2,260 |
E-mini S&P 500 Index | 817 | 54,960 | 328 |
Unrealized appreciation (depreciation) on open futures contracts is required to be treated as realized gain (loss) for tax purposes.
F. During the year ended September 30, 2006, the fund purchased $1,106,673,000 of investment securities and sold $1,243,841,000 of investment securities other than temporary cash investments.
G. The market value of securities on loan to broker/dealers at September 30, 2006, was $43,786,000, for which the fund received cash collateral of $45,185,000.
22
H. Capital share transactions for each class of shares were:
|
| Year Ended September 30, | ||
|
| 2006 |
| 2005 |
| Amount | Shares | Amount | Shares |
| ($000) | (000) | ($000) | (000) |
Investor Shares |
|
|
|
|
Issued | 555,813 | 23,157 | 835,292 | 35,731 |
Issued in Lieu of Cash Distributions | 188,442 | 8,066 | 212,252 | 9,176 |
Redeemed | (817,313) | (34,482) | (1,076,247) | (45,633) |
Net Increase (Decrease)—Investor Shares | (73,058) | (3,259) | (28,703) | (726) |
Admiral Shares |
|
|
|
|
Issued | 426,653 | 8,510 | 864,898 | 17,467 |
Issued in Lieu of Cash Distributions | 92,378 | 1,884 | 43,432 | 894 |
Redeemed | (255,384) | (5,137) | (129,102) | (2,620) |
Net Increase (Decrease)—Admiral Shares | 263,647 | 5,257 | 779,228 | 15,741 |
I. In June 2006, the Financial Accounting Standards Board issued Interpretation No. 48 (“FIN 48”), “Accounting for Uncertainty in Income Taxes.” FIN 48 establishes the minimum threshold for recognizing, and a system for measuring, the benefits of tax-return positions in financial statements. FIN 48 will be effective for the fund’s fiscal year beginning October 1, 2007. Management is in the process of analyzing the fund’s tax positions for purposes of implementing FIN 48; based on the analysis completed to date, management does not believe the adoption of FIN 48 will result in any material impact to the fund’s financial statements.
23
Report of Independent Registered Public Accounting Firm
To the Trustees of Vanguard Fenway Funds and the Shareholders of Vanguard Equity Income Fund:
In our opinion, the accompanying statement of net assets and the related statements of operations and of changes in net assets and the financial highlights present fairly, in all material respects, the financial position of Vanguard Equity Income Fund (the "Fund") at September 30, 2006, the results of its operations for the year then ended, the changes in its net assets for each of the two years in the period then ended, and the financial highlights for each of the five years in the period then ended, in conformity with accounting principles generally accepted in the United States of America. These financial statements and financial highlights (hereafter referred to as "financial statements") are the responsibility of the Fund's management; our responsibility is to express an opinion on these financial statements based on our audits. We conducted our audits of these financial statements in accordance with the standards of the Public Company Accounting Oversight Board (United States), which require that we plan and perform the audit to obtain reasonable assurance about whether the financial statements are free of material misstatement. An audit includes examining, on a test basis, evidence supporting the amounts and disclosures in the financial statements, assessing the accounting principles used and significant estimates made by management, and evaluating the overall financial statement presentation. We believe that our audits, which included confirmation of securities at September 30, 2006 by correspondence with the custodian and brokers, and by agreement to the underlying ownership records for Vanguard Market Liquidity Fund, provide a reasonable basis for our opinion.
PricewaterhouseCoopers LLP
Philadelphia, Pennsylvania
November 13, 2006
Special 2006 tax information (unaudited) for Vanguard Equity Income Fund
This information for the fiscal year ended September 30, 2006, is included pursuant to provisions of the Internal Revenue Code.
The fund distributed $192,824,000 as capital gain dividends (from net long-term capital gains) to shareholders during the fiscal year, all of which is designated as a 20% rate gain distribution.
The fund distributed $132,201,000 of qualified dividend income to shareholders during the fiscal year.
For corporate shareholders, 79.7% of investment income (dividend income plus short-term gains, if any) qualifies for the dividends-received deduction.
24
Your Fund’s After-Tax Returns
This table presents returns for your fund both before and after taxes. The after-tax returns are shown in two ways: (1) assuming that an investor owned the fund during the entire period and paid taxes on the fund’s distributions, and (2) assuming that an investor paid taxes on the fund’s distributions and sold all shares at the end of each period.
Calculations are based on the highest individual federal income tax and capital gains tax rates in effect at the times of the distributions and the hypothetical sales. State and local taxes were not considered. After-tax returns reflect any qualified dividend income, using actual prior-year figures and estimates for 2006. (In the example, returns after the sale of fund shares may be higher than those assuming no sale. This occurs when the sale would have produced a capital loss. The calculation assumes that the investor received a tax deduction for the loss.)
The table shows returns for Investor Shares only; returns for other share classes will differ. Please note that your actual after-tax returns will depend on your tax situation and may differ from those shown. Also note that if you own the fund in a tax-deferred account, such as an individual retirement account or a 401(k) plan, this information does not apply to you. Such accounts are not subject to current taxes.
Finally, keep in mind that a fund’s performance—whether before or after taxes—does not guarantee future results.
Average Annual Total Returns: Equity Income Investor Shares | |||
Periods Ended September 30, 2006 |
|
|
|
| One | Five | Ten |
| Year | Years | Years |
Returns Before Taxes | 14.39% | 8.34% | 10.04% |
Returns After Taxes on Distributions | 13.05 | 7.23 | 8.37 |
Returns After Taxes on Distributions and Sale of Fund Shares | 10.69 | 6.83 | 7.98 |
25
About Your Fund’s Expenses
As a shareholder of the fund, you incur ongoing costs, which include costs for portfolio management, administrative services, and shareholder reports (like this one), among others. Operating expenses, which are deducted from a fund’s gross income, directly reduce the investment return of the fund.
A fund’s expenses are expressed as a percentage of its average net assets. This figure is known as the expense ratio. The following examples are intended to help you understand the ongoing costs (in dollars) of investing in your fund and to compare these costs with those of other mutual funds. The examples are based on an investment of $1,000 made at the beginning of the period shown and held for the entire period.
The table below illustrates your fund’s costs in two ways:
• Based on actual fund return. This section helps you to estimate the actual expenses that you paid over the period. The “Ending Account Value” shown is derived from the fund’s actual return, and the third column shows the dollar amount that would have been paid by an investor who started with $1,000 in the fund. You may use the information here, together with the amount you invested, to estimate the expenses that you paid over the period.
To do so, simply divide your account value by $1,000 (for example, an $8,600 account value divided by $1,000 = 8.6), then multiply the result by the number given for your fund under the heading “Expenses Paid During Period.”
• Based on hypothetical 5% yearly return. This section is intended to help you compare your fund’s costs with those of other mutual funds. It assumes that the fund had a yearly return of 5% before expenses, but that the expense ratio is unchanged. In this case—because the return used is not the fund’s actual return—the results do not apply to your investment. The example is useful in making comparisons because the Securities and Exchange Commission requires all mutual funds to calculate expenses based on a 5% return. You can assess your fund’s costs by comparing this hypothetical example with the hypothetical examples that appear in shareholder reports of other funds.
Six Months Ended September 30, 2006 |
|
|
|
| Beginning | Ending | Expenses |
| Account Value | Account Value | Paid During |
Equity Income Fund | 3/31/2006 | 9/30/2006 | Period1 |
Based on Actual Fund Return |
|
|
|
Investor Shares | $1,000.00 | $1,076.04 | $1.67 |
Admiral Shares | 1,000.00 | 1,076.57 | 0.94 |
Based on Hypothetical 5% Yearly Return |
|
|
|
Investor Shares | $1,000.00 | $1,023.46 | $1.62 |
Admiral Shares | 1,000.00 | 1,024.17 | 0.91 |
1 The calculations are based on expenses incurred in the most recent six-month period. The fund’s annualized six-month expense ratios for that period are 0.32% for Investor Shares and 0.18% for Admiral Shares. The dollar amounts shown as “Expenses Paid” are equal to the annualized expense ratio multiplied by the average account value over the period, multiplied by the number of days in the most recent six-month period, then divided by the number of days in the most recent 12-month period.
26
Note that the expenses shown in the table on page 26 are meant to highlight and help you compare ongoing costs only and do not reflect any transactional costs or account maintenance fees. They do not include your fund’s low-balance fee, which is described in the prospectus. If this fee were applied to your account, your costs would be higher. Your fund does not charge transaction fees, such as purchase or redemption fees, nor does it carry a “sales load.”
The calculations assume no shares were bought or sold during the period. Your actual costs may have been higher or lower, depending on the amount of your investment and the timing of any purchases or redemptions.
You can find more information about the fund’s expenses, including annual expense ratios, in the Financial Statements section of this report. For additional information on operating expenses and other shareholder costs, please refer to the appropriate fund prospectus.
27
Glossary
Beta. A measure of the magnitude of a fund’s past share-price fluctuations in relation to the ups and downs of a given market index. The index is assigned a beta of 1.00. Compared with a given index, a fund with a beta of 1.20 typically would have seen its share price rise or fall by 12% when the index rose or fell by 10%. A fund’s beta should be reviewed in conjunction with its R-squared (see definition below). The lower the R-squared, the less correlation there is between the fund and the index, and the less reliable beta is as an indicator of volatility.
Earnings Growth Rate. The average annual rate of growth in earnings over the past five years for the stocks now in a fund.
Expense Ratio. The percentage of a fund’s average net assets used to pay its annual administrative and advisory expenses. These expenses directly reduce returns to investors.
Foreign Holdings. The percentage of a fund represented by stocks or depositary receipts of companies based outside the United States.
Median Market Cap. An indicator of the size of companies in which a fund invests; the midpoint of market capitalization (market price x shares outstanding) of a fund’s stocks, weighted by the proportion of the fund’s assets invested in each stock. Stocks representing half of the fund’s assets have market capitalizations above the median, and the rest are below it.
Price/Book Ratio. The share price of a stock divided by its net worth, or book value, per share. For a fund, the weighted average price/book ratio of the stocks it holds.
Price/Earnings Ratio. The ratio of a stock’s current price to its per-share earnings over the past year. For a fund, the weighted average P/E of the stocks it holds. P/E is an indicator of market expectations about corporate prospects; the higher the P/E, the greater the expectations for a company’s future growth.
R-Squared. A measure of how much of a fund’s past returns can be explained by the returns from the market in general, as measured by a given index. If a fund’s total returns were precisely synchronized with an index’s returns, its R-squared would be 1.00. If the fund’s returns bore no relationship to the index’s returns, its R-squared would be 0.
Return on Equity. The annual average rate of return generated by a company during the past five years for each dollar of shareholder’s equity (net income divided by shareholder’s equity). For a fund, the weighted average return on equity for the companies whose stocks it holds.
Short-Term Reserves. The percentage of a fund invested in highly liquid, short-term securities that can be readily converted to cash.
Turnover Rate. An indication of the fund’s trading activity. Funds with high turnover rates incur higher transaction costs and may be more likely to distribute capital gains (which may be taxable to investors). The turnover rate excludes in-kind transactions, which have minimal impact on costs.
Yield. A snapshot of a fund’s income from interest and dividends. The yield, expressed as a percentage of the fund’s net asset value, is based on income earned over the past 30 days and is annualized, or projected forward for the coming year. The index yield is based on the current annualized rate of income provided by securities in the index.
28
This page intentionally left blank.
This page intentionally left blank.
This page intentionally left blank.
The People Who Govern Your Fund
The trustees of your mutual fund are there to see that the fund is operated and managed in your best interests since, as a shareholder, you are a part owner of the fund. Your fund’s trustees also serve on the board of directors of The Vanguard Group, Inc., which is owned by the Vanguard funds and provides services to them on an at-cost basis.
A majority of Vanguard’s board members are independent, meaning that they have no affiliation with Vanguard or the funds they oversee, apart from the sizable personal investments they have made as private individuals.
Our independent board members bring distinguished backgrounds in business, academia, and public service to their task of working with Vanguard officers to establish the policies and oversee the activities of the funds. Among board members’ responsibilities are selecting investment advisors for the funds; monitoring fund operations, performance, and costs; reviewing contracts; nominating and selecting new trustees/directors; and electing Vanguard officers.
Each trustee serves a fund until its termination; or until the trustee’s retirement, resignation, or death; or otherwise as specified in the fund’s organizational documents. Any trustee may be removed at a shareholders’ meeting by a vote representing two-thirds of the net asset value of all shares of the fund together with shares of other Vanguard funds organized within the same trust. The table on these two pages shows information for each trustee and executive officer of the fund. The mailing address of the trustees and officers is P.O. Box 876, Valley Forge, PA 19482.
Chairman of the Board, Chief Executive Officer, and Trustee | |
|
|
John J. Brennan1 |
|
Born 1954 | Principal Occupation(s) During the Past Five Years: Chairman of the Board, Chief |
Trustee since May 1987; | Executive Officer, and Director/Trustee of The Vanguard Group, Inc., and of each |
Chairman of the Board and | of the investment companies served by The Vanguard Group. |
Chief Executive Officer |
|
142 Vanguard Funds Overseen | |
|
|
Independent Trustees |
|
|
|
Charles D. Ellis |
|
Born 1937 | Principal Occupation(s) During the Past Five Years: Applecore Partners (pro bono ventures |
Trustee since January 2001 | in education); Senior Advisor to Greenwich Associates (international business strategy |
142 Vanguard Funds Overseen | consulting); Successor Trustee of Yale University; Overseer of the Stern School of Business |
| at New York University; Trustee of the Whitehead Institute for Biomedical Research. |
|
|
Rajiv L. Gupta |
|
Born 1945 | Principal Occupation(s) During the Past Five Years: Chairman and Chief Executive Officer |
Trustee since December 20012 | of Rohm and Haas Co. (chemicals); Board Member of the American Chemistry Council; |
142 Vanguard Funds Overseen | Director of Tyco International, Ltd. (diversified manufacturing and services) (since 2005); |
| Trustee of Drexel University and of the Chemical Heritage Foundation. |
|
|
Amy Gutmann |
|
Born 1949 | Principal Occupation(s) During the Past Five Years: President of the University of |
Trustee since June 2006 | Pennsylvania since 2004; Professor in the School of Arts and Sciences, Annenberg School |
142 Vanguard Funds Overseen | for Communication, and Graduate School of Education of the University of Pennsylvania |
| since 2004; Provost (2001–2004) and Laurance S. Rockefeller Professor of Politics and the |
| University Center for Human Values (1990–2004), Princeton University; Director of Carnegie |
| Corporation of New York and of Philadelphia 2016 (since 2005) and of Schuylkill River |
| Development Corporation and Greater Philadelphia Chamber of Commerce (since 2004). |
JoAnn Heffernan Heisen |
| |
Born 1950 | Principal Occupation(s) During the Past Five Years: Corporate Vice President and Chief | |
Trustee since July 1998 | Global Diversity Officer (since January 2006), Vice President and Chief Information | |
142 Vanguard Funds Overseen | Officer (1997–2005), and Member of the Executive Committee of Johnson & Johnson | |
| (pharmaceuticals/consumer products); Director of the University Medical Center at | |
| Princeton and Women’s Research and Education Institute. | |
|
| |
André F. Perold |
| |
Born 1952 | Principal Occupation(s) During the Past Five Years: George Gund Professor of Finance and | |
Trustee since December 2004 | Banking, Harvard Business School (since 2000); Senior Associate Dean, Director of Faculty | |
142 Vanguard Funds Overseen | Recruiting, and Chair of Finance Faculty, Harvard Business School; Director and Chairman | |
| of UNX, Inc. (equities trading firm) (since 2003); Director of registered investment | |
| companies advised by Merrill Lynch Investment Managers and affiliates (1985–2004), | |
| Genbel Securities Limited (South African financial services firm) (1999–2003), Gensec | |
| Bank (1999–2003), Sanlam, Ltd. (South African insurance company) (2001–2003), and | |
| Stockback, Inc. (credit card firm) (2000–2002). | |
|
| |
Alfred M. Rankin, Jr. |
| |
Born 1941 | Principal Occupation(s) During the Past Five Years: Chairman, President, Chief Executive | |
Trustee since January 1993 | Officer, and Director of NACCO Industries, Inc. (forklift trucks/housewares/ lignite); | |
142 Vanguard Funds Overseen | Director of Goodrich Corporation (industrial products/aircraft systems and services). | |
|
| |
J. Lawrence Wilson |
| |
Born 1936 | Principal Occupation(s) During the Past Five Years: Retired Chairman and Chief Executive | |
Trustee since April 1985 | Officer of Rohm and Haas Co. (chemicals); Director of Cummins Inc. (diesel engines), | |
142 Vanguard Funds Overseen | MeadWestvaco Corp. (packaging products), and AmerisourceBergen Corp. (pharmaceutical | |
| distribution); Trustee of Vanderbilt University and of Culver Educational Foundation. | |
|
| |
Executive Officers1 |
| |
|
| |
Heidi Stam |
| |
Born 1956 | Principal Occupation(s) During the Past Five Years: Principal of The Vanguard Group, Inc., | |
Secretary since July 2005 | since November 1997; General Counsel of The Vanguard Group since July 2005; | |
142 Vanguard Funds Overseen | Secretary of The Vanguard Group and of each of the investment companies served | |
| by The Vanguard Group since July 2005. | |
|
| |
Thomas J. Higgins |
| |
Born 1957 | Principal Occupation(s) During the Past Five Years: Principal of The Vanguard Group, Inc.; | |
Treasurer since July 1998 | Treasurer of each of the investment companies served by The Vanguard Group. | |
142 Vanguard Funds Overseen |
| |
|
| |
Vanguard Senior Management Team | ||
|
| |
R. Gregory Barton | Kathleen C. Gubanich | Michael S. Miller |
Mortimer J. Buckley | Paul A. Heller | Ralph K. Packard |
James H. Gately | F. William McNabb, III | George U. Sauter |
|
| |
Founder |
| |
|
| |
John C. Bogle |
| |
Chairman and Chief Executive Officer, 1974–1996 | ||
1 Officers of the funds are “interested persons” as defined in the Investment Company Act of 1940.
2 December 2002 for Vanguard Equity Income Fund, Vanguard Growth Equity Fund, the Vanguard Municipal Bond Funds, and the Vanguard State Tax-Exempt Funds.
More information about the trustees is in the Statement of Additional Information, available from The Vanguard Group.
|
|
| P.O. Box 2600 |
| Valley Forge, PA 19482-2600 |

Connect with Vanguard™ > www.vanguard.com
Fund Information > 800-662-7447 | Vanguard, Admiral, Connect with Vanguard, and the ship |
| logo are trademarks of The Vanguard Group, Inc. |
Direct Investor Account Services > 800-662-2739 |
|
| All other marks are the exclusive property of their |
Institutional Investor Services > 800-523-1036 | respective owners. |
|
|
Text Telephone > 800-952-3335 |
|
| All comparative mutual fund data are from Lipper Inc. |
| or Morningstar, Inc., unless otherwise noted. |
|
|
|
|
This material may be used in conjunction | You can obtain a free copy of Vanguard’s proxy voting |
with the offering of shares of any Vanguard | guidelines by visiting our website, www.vanguard.com, |
fund only if preceded or accompanied by | and searching for “proxy voting guidelines,” or by calling |
the fund’s current prospectus. | Vanguard at 800-662-2739. They are also available from |
| the SEC’s website, www.sec.gov. In addition, you may |
| obtain a free report on how your fund voted the proxies for |
| securities it owned during the 12 months ended June 30. |
| To get the report, visit either www.vanguard.com |
| or www.sec.gov. |
|
|
| You can review and copy information about your fund |
| at the SEC’s Public Reference Room in Washington, D.C. |
| To find out more about this public service, call the SEC |
| at 202-551-8090. Information about your fund is also |
| available on the SEC’s website, and you can receive |
| copies of this information, for a fee, by sending a |
| request in either of two ways: via e-mail addressed to |
| publicinfo@sec.gov or via regular mail addressed to the |
| Public Reference Section, Securities and Exchange |
| Commission, Washington, DC 20549-0102. |
|
|
|
|
|
|
|
|
| © 2006 The Vanguard Group, Inc. |
| All rights reserved. |
| Vanguard Marketing Corporation, Distributor. |
|
|
| Q650 112006 |
|
|
|
|
| Vanguard® Growth Equity Fund |
|
|
|
|
|
|
|
|
|
|
| > Annual Report |
|
|
|
|
|
|
|
|
|
|
|
|
|
|
|
|
|
|
| September 30, 2006 |
|
|
|
|
|
|
|
| ||
|
|
| |
|
|
| |
|
|
| |
|
|
| |
|
|
| |
|
|
| |
|
|
| |
|
|
| |

> | For the year ended September 30, 2006, Vanguard Growth Equity Fund gained 4.7%, topping the average return of peer funds but trailing the performance of its benchmark index. |
> | Poor stock selection within two of the fund’s largest sectors—technology and health care—put a drag on performance. |
> | The 2006 fiscal year was generally a tough one for growth stocks, with a market environment that consistently favored value-oriented shares. |
Contents |
|
|
|
Your Fund’s Total Returns | 1 |
Chairman’s Letter | 2 |
Advisor’s Report | 7 |
Fund Profile | 9 |
Performance Summary | 10 |
Financial Statements | 11 |
Your Fund’s After-Tax Returns | 19 |
About Your Fund’s Expenses | 20 |
Trustees Approve Advisory Agreement | 22 |
Glossary | 23 |
Please note: The opinions expressed in this report are just that—informed opinions. They should not be considered promises or advice. Also, please keep in mind that the information and opinions cover the period through the date on the cover of this report. Of course, the risks of investing in your fund are spelled out in the prospectus.
Your Fund’s Total Returns
Fiscal Year Ended September 30, 2006 |
|
| Total |
| Return |
Vanguard Growth Equity Fund | 4.7% |
Russell 1000 Growth Index | 6.0 |
Average Large-Cap Growth Fund1 | 3.5 |
Dow Jones Wilshire 5000 Index | 10.5 |
Your Fund’s Performance at a Glance | ||||
September 30, 2005–September 30, 2006 | ||||
|
|
| Distributions Per Share | |
| Starting | Ending | Income | Capital |
| Share Price | Share Price | Dividends | Gains |
Vanguard Growth Equity Fund | $10.05 | $10.52 | $0.001 | $0.000 |
1 Derived from data provided by Lipper Inc.
1

Chairman’s Letter
Dear Shareholder,
Vanguard Growth Equity Fund returned 4.7% for the 12 months ended September 30, 2006, finishing below the 6.0% gain of the Russell 1000 Growth Index, but ahead of the 3.5% average return captured by large-capitalization growth funds.
Within the fund’s important consumer discretionary sector, the investment advisor excelled in choosing some of the best-performing stocks, helping the portfolio to outperform the index. On the other hand, on an absolute basis, the advisor’s stock selections in the large health care and information technology sectors were disappointing. Strong gains from top-ten holdings such as Google and Apple Computer were offset by large exposures to poorly performing companies such as eBay and QUALCOMM.
Stocks endured some rough going, then recovered to post strong results
The stock market advanced through the first part of the fund’s fiscal year, then hit a speed bump in May, as investors feared that the economy was growing too rapidly. But a slowdown in the housing market, coupled with a late-summer decline in oil prices, helped to allay inflation concerns. The broad market rebounded to post a solid 10.5% return for the 12-month period. Value-oriented stocks outperformed growth stocks, and large-capitalization stocks edged out small-caps, one of the market’s best-performing segments in recent years.
2
International stocks handily outpaced domestic issues, continuing a multiyear trend. European and emerging market stocks fared particularly well. Stocks in the Pacific region also performed admirably, even though Japanese stocks did not fully participate in the global market’s summer recovery.
In the bond market, prices rallied as the Fed paused
At its August and September meetings, the Federal Reserve Board twice voted to maintain the federal funds rate at 5.25%, marking a pause in the central bank’s two-year inflation-fighting campaign. With investor sentiment buoyed by the Fed’s near-term inflation outlook, interest rates decreased, driving bond prices higher. The broad taxable bond market finished the period with a 3.7% return, and municipal bonds performed slightly better.
Although rates decreased along the entire maturity spectrum in late summer, the difference between the yields of the shortest- and longest-term issues remained narrow by historical standards. At the end of September, the U.S. Treasury yield curve was actually inverted, meaning that short-term issues such as 3-month and 6-month Treasury notes offered higher yields than those with longer maturities.
The advisor’s stock selections were spotty across growth sectors
During fiscal 2006, Vanguard Growth Equity Fund was, like its benchmark, heavily weighted in three sectors: information technology, health care,
Market Barometer |
| ||
| Average Annual Total Returns | ||
| Periods Ended September 30, 2006 | ||
| One Year | Three Years | Five Years |
Stocks |
|
|
|
Russell 1000 Index (Large-caps) | 10.2% | 12.8% | 7.6% |
Russell 2000 Index (Small-caps) | 9.9 | 15.5 | 13.8 |
Dow Jones Wilshire 5000 Index (Entire market) | 10.5 | 13.3 | 8.6 |
MSCI All Country World Index ex USA (International) | 19.4 | 23.9 | 16.4 |
|
|
|
|
Bonds |
|
|
|
Lehman Aggregate Bond Index (Broad taxable market) | 3.7% | 3.4% | 4.8% |
Lehman Municipal Bond Index | 4.5 | 4.4 | 5.2 |
Citigroup 3-Month Treasury Bill Index | 4.4 | 2.6 | 2.2 |
|
|
|
|
CPI |
|
|
|
Consumer Price Index | 2.1% | 3.1% | 2.6% |
3
and consumer discretionary. Shrewd stock selection by the fund’s advisor, Turner Investment Partners, in the consumer discretionary sector helped the portfolio to outperform the index’s holdings and captured the returns of some of the best-performing stocks. Familiar brands such as Starbucks, Sony, and apparel maker Coach did very well during the year.
Information technology and health care accounted for nearly half of the portfolio’s holdings. Unfortunately, the advisor’s successes with consumer stocks were not duplicated here. Although the fund did hold some of the period’s best-performing tech stocks—such as Hewlett-Packard and Akamai Technologies and top-ten holdings Google and Apple Computer—it also held stocks that performed poorly, and large exposures to companies such as eBay and QUALCOMM offset gains made elsewhere. In the health care sector, the fund held many of the period’s mediocre performers, and did not hold other stocks that thrived.
In the consumer staples and industrials sectors, the advisor’s picks underperformed those in the index; in the financials and telecommunication services sectors, on the other hand, the fund’s stocks outperformed. Both Chicago Mercantile Exchange and NII Holdings did well during the year. The gains made in these sectors, however, were not significant enough to offset the fund’s other, larger sector commitments.
Over a decade, the fund slightly led its benchmark
For the decade that ended September 30, Vanguard Growth Equity Fund’s annualized gain bested that of its benchmark index and the average return of its peers by a
Total Returns |
|
|
Ten Years Ended September 30, 2006 |
|
|
| Average | Final Value of a $10,000 |
| Annual Return | Initial Investment |
Growth Equity Fund1 | 5.7% | $17,362 |
Russell 1000 Growth Index | 5.5 | 17,009 |
Average Large-Cap Growth Fund | 5.6 | 17,300 |
Dow Jones Wilshire 5000 Composite Index | 8.6 | 22,871 |
1 Prior to June 12, 2000, the fund was organized as the Turner Growth Equity Fund.
4
slim margin. Like other funds that are concentrated in growth stocks, the fund has been slow to recover from the brutal downturn that followed the exhilarating advances of 1999 and early 2000.
Looking at the fund’s long-term gain tends to mask one of the realities of investing in such a highly concentrated, aggressive fund—namely, its volatility. Turner Investment Partners seeks out stocks of companies whose earnings are on the upswing and then tries to sell them before earnings begin to decline, a strategy that can by turns produce heady gains or rough patches. For example, the fund’s best single-year gain exceeded 50% in fiscal-year 2000; that was immediately followed by its biggest single-year decline. Our long-term expectation, of course, is that the advisor’s disciplined execution of this aggressive strategy will produce solid performance for long-term shareholders. This goal is made more obtainable by the fund’s historically low expenses, which allow investors to keep as much of the fund’s return as possible.
The fund’s strategy rewards a long-term perspective
Central to Turner’s strategy is the conviction that earnings expectations drive stock performance, and the advisor is particularly vigilant regarding the earnings and revenue targets of the companies the fund holds. In addition, the advisor executes this aggressive strategy with relatively high portfolio turnover.
While Turner has succeeded, over time, in adding value using this approach, there is short-term risk, embedded in such an
Expense Ratios1 |
|
|
Your fund compared with its peer group |
|
|
|
| Average |
|
| Large-Cap |
| Fund | Growth Fund |
Growth Equity Fund | 0.91% | 1.46% |
1 Fund expense ratio reflects the 12 months ended September 30, 2006. Peer-group expense ratio is derived from data provided by Lipper Inc. and captures information through year-end 2005.
5
aggressive strategy. Only by sticking with the Growth Equity Fund over a long period can investors benefit from the fund’s aggressive style.
As we have counseled investors through the years, sticking with a carefully considered, balanced portfolio of stock, bond, and money market funds suited to your unique circumstances can be critical to your long-term investing success. We believe low-cost, diversified index funds are best at the core of your portfolio, with actively managed funds such as Vanguard Growth Equity Fund playing a valuable, but limited, secondary role.
Thank you for investing with Vanguard.
Sincerely,

John J. Brennan
Chairman and Chief Executive Officer
October 10, 2006
6
Advisor’s Report
Throughout the 12 months ended September 30, the market had to contend with investor uncertainty about possible Federal Reserve Board actions regarding interest rates, an acceleration in the inflation rate, higher energy prices, and the strength of the economy. Investors fretted that the Fed would ultimately either hike rates not enough, which could intensify inflationary trends, or hike rates too much, which could bring on a recession. After raising the target federal funds rate 17 consecutive times since 2004, the Fed held the line in August and again in September, keeping its short-term rate target at 5.25%.
Despite the uncertainties, equities provided good results, with the Russell 1000 Index climbing more than 10% for the 12-month period. However, valuations continued to contract, and investors remained focused on cheaper stocks with lower expected earnings. Therefore, the performance of value stocks trounced that of growth issues by more than 800 basis points—8 percentage points—for the year. In a tough environment, the Growth Equity Fund trailed the return of its performance benchmark by 1.3 percentage points.
We continue to position the portfolio to have roughly the same sector allocations as the Russell 1000 Growth Index, leaving stock selection as the key source of potential excess return versus the benchmark. During the 12-month period, the health care sector was largely responsible for the fund’s underperformance versus the benchmark. Within this sector we had success with Gilead Sciences, on the strength of its HIV-treatment business, and with the foreign pharmaceutical companies Roche Holding and AstraZeneca. However, results were weighed down in part by Wyeth. This stock traded lower because of an FDA warning letter citing concerns involving a key manufacturing plant. Given the near-term uncertainty regarding operations at the facility, we elected to sell the stock and wait for more clarity on the situation. Johnson & Johnson was another stock that hurt relative results. We sold this stock late in 2005, and it subsequently rebounded. However, we believe the company will struggle to generate continued earnings growth in the future.
The industrials sector also weighed down relative results, as Caterpillar detracted from performance. We sold the stock late in 2005 because of concerns that manufacturing costs would crimp earnings. We bought it back in the second quarter in anticipation of stronger commercial construction activity in the United States and emerging markets. In retrospect, we would have been better off holding the stock from start to finish.
The telecommunication services sector, with a gain of about 40%, posted the greatest absolute return for the fund and also its best performance relative to the benchmark index. Excess return in the sector was driven by our holdings in America Movil and NII Holdings. These companies provide wireless services to Latin American markets, which have very low wireless penetration and adoption rates that continue to ramp up nicely.
7
The financials sector also contributed to the fund’s performance on both an absolute and relative basis. The general rebound in the U.S. stock market gave a boost to stocks of companies with exposure to the market. Standouts included T. Rowe Price and Charles Schwab. T. Rowe Price continues to experience strong institutional cash flows, and we believe it is poised to do well as a result of the recently approved Pension Protection Act. This measure is aimed at shoring up the nation’s ailing pension system by requiring employers to improve the funding status of their pension plans. It also encourages employee participation in defined contribution plans and IRAs, which should help fuel asset growth. Although Charles Schwab witnessed a modest slowdown in trading during the summer months, customer assets continued to rise at a healthy pace as cash deposits and fixed income investing proved popular.
As this is written, the bull market for stocks, which began in late 2002, is getting long in the tooth. But there’s been a steady reduction in the market’s price/earnings multiple since 2002; during that time, corporate profits have risen more than 120%, but the market is up only about 70%. By that standard, we think the market still has some upside potential, despite the headwinds of weaker housing sales and high energy prices.
We bring a bottom-up perspective to our research, and we continue to find stocks with healthy earnings growth that trade at reasonable valuations. The Growth Equity Fund now has a price/earnings multiple that is below 20 times next year’s projected earnings, with an estimated earnings growth that is above 20%. As the economy slows a bit, we believe that it is possible for valuations to expand for stocks of companies that can post above-market earnings growth. In such an environment, growth stocks may finally, after seven years, begin to outperform value stocks for a sustained period.
Bob Turner
Chairman and Chief Investment Officer
Turner Investment Partners
October 10, 2006
8
Fund Profile
As of September 30, 2006
Portfolio Characteristics |
|
| |
|
| Comparative | Broad |
| Fund | Index1 | Index2 |
Number of Stocks | 81 | 683 | 4,974 |
Median Market Cap | $25.4B | $34.4B | $27.5B |
Price/Earnings Ratio | 24.9x | 21.1x | 17.2x |
Price/Book Ratio | 4.1x | 4.0x | 3.7x |
Yield | 0.4% | 1.2% | 1.7% |
Return on Equity | 18.0% | 19.8% | 15.4% |
Earnings Growth Rate | 22.8% | 18.8% | 15.7% |
Foreign Holdings | 8.4% | 0.0% | 1.1% |
Turnover Rate | 147% | — | — |
Expense Ratio | 0.91% | — | — |
Short-Term Reserves | 0% | — | — |
Sector Diversification (% of portfolio) |
| ||
|
| Comparative | Broad |
| Fund | Index1 | Index2 |
Consumer Discretionary | 16% | 14% | 12% |
Consumer Staples | 8 | 10 | 9 |
Energy | 3 | 4 | 9 |
Financials | 10 | 8 | 23 |
Health Care | 19 | 18 | 12 |
Industrials | 10 | 14 | 11 |
Information Technology | 28 | 27 | 15 |
Materials | 3 | 3 | 3 |
Telecommunication Services | 3 | 1 | 3 |
Utilities | 0 | 1 | 3 |
Volatility Measures3 |
| |
| Fund Versus | Fund Versus |
| Comparative Index1 | Broad Index2 |
R-Squared | 0.90 | 0.88 |
Beta | 1.22 | 1.28 |
Ten Largest Holdings4 (% of total net assets) | ||
|
|
|
General Electric Co. | industrial conglomerates | 4.0% |
Cisco Systems, Inc. | communications equipment | 3.7 |
Google Inc. | internet software and services | 3.3 |
PepsiCo, Inc. | soft drinks | 2.8 |
Gilead Sciences, Inc. | biotechnology | 2.3 |
The Procter & Gamble Co. | household products | 2.2 |
Apple Computer, Inc. | computer hardware | 2.0 |
International Game Technology | casinos and gaming | 2.0 |
Texas Instruments, Inc. | semiconductors | 1.8 |
Baxter International, Inc. | health care equipment | 1.8 |
Top Ten |
| 25.9% |
Investment Focus
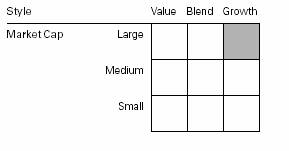
1 Russell 1000 Growth Index.
2 Dow Jones Wilshire 5000 Index.
3 For an explanation of R-squared, beta, and other terms used here, see the Glossary on page 23.
4 “Ten Largest Holdings” excludes any temporary cash investments and equity index products.
9
Performance Summary
All of the returns in this report represent past performance, which is not a guarantee of future results that may be achieved by the fund. (Current performance may be lower or higher than the performance data cited. For performance data current to the most recent month-end, visit our website at www.vanguard.com.) Note, too, that both investment returns and principal value can fluctuate widely, so an investor’s shares, when sold, could be worth more or less than their original cost. The returns shown do not reflect taxes that a shareholder would pay on fund distributions or on the sale of fund shares.
Cumulative Performance: September 30, 1996–September 30, 2006
Initial Investment of $10,000
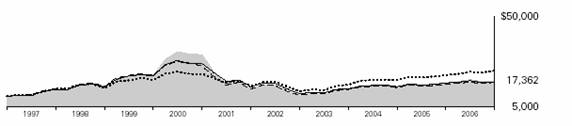
| Average Annual Total Returns | Final Value | ||
| Periods Ended September 30, 2006 | of a $10,000 | ||
| One Year | Five Years | Ten Years | Investment |
Growth Equity Fund | 4.69% | 5.16% | 5.67% | $17,362 |
Dow Jones Wilshire 5000 Index | 10.48 | 8.64 | 8.62 | 22,871 |
Russell 1000 Growth Index | 6.04 | 4.42 | 5.46 | 17,009 |
Average Large-Cap Growth Fund1 | 3.53 | 3.31 | 5.63 | 17,300 |
Fiscal-Year Total Returns (%): September 30, 1996–September 30, 2006

1 Derived from data provided by Lipper Inc.
Note: See Financial Highlights table on page 15 for dividend and capital gains information.
10
Financial Statements
Statement of Net Assets
As of September 30, 2006
The fund provides a complete list of its holdings four times in each fiscal year, at the quarter-ends. For the second and fourth fiscal quarters, the lists appear in the fund’s semiannual and annual reports to shareholders. For the first and third fiscal quarters, the fund files the lists with the Securities and Exchange Commission on Form N-Q. Shareholders can look up the fund’s Forms N-Q on the SEC’s website at www.sec.gov. Forms N-Q may also be reviewed and copied at the SEC’s Public Reference Room (see the back cover of this report for further information).
|
|
| Market |
|
|
| Value• |
|
| Shares | ($000) |
Common Stocks (100.0%) |
|
| |
Consumer Discretionary (16.0%) |
|
| |
| International Game Technology | 366,280 | 15,201 |
| News Corp., Class A | 641,750 | 12,610 |
* | Comcast Corp. Class A | 305,730 | 11,266 |
* | Coach, Inc. | 310,201 | 10,671 |
| Omnicom Group Inc. | 98,420 | 9,212 |
* | Las Vegas Sands Corp. | 125,120 | 8,552 |
* | Toyota Motor Corp. ADR | 69,570 | 7,576 |
| TJX Cos., Inc. | 256,060 | 7,177 |
* | Starbucks Corp. | 194,530 | 6,624 |
*^ | Nutri/System Inc. | 102,580 | 6,390 |
| Nordstrom, Inc. | 149,160 | 6,309 |
| Abercrombie & Fitch Co. | 79,290 | 5,509 |
| Starwood Hotels & Resorts Worldwide, Inc. | 89,380 | 5,112 |
* | Scientific Games Corp. | 153,880 | 4,893 |
* | Focus Media Holding Ltd. ADR | 74,930 | 4,340 |
|
|
| 121,442 |
Consumer Staples (7.9%) |
|
| |
| PepsiCo, Inc. | 330,890 | 21,594 |
| The Procter & Gamble Co. | 273,090 | 16,926 |
| Archer-Daniels-Midland Co. | 245,630 | 9,305 |
| Fomento Economico Mexicano, SA de CV ADR | 77,160 | 7,480 |
| CVS Corp. | 151,560 | 4,868 |
|
|
| 60,173 |
Energy (3.4%) |
|
| |
* | Cameron International Corp. | 187,080 | 9,038 |
* | National Oilwell Varco Inc. | 147,660 | 8,645 |
| XTO Energy, Inc. | 187,950 | 7,918 |
|
|
| 25,601 |
Financials (10.1%) |
|
| |
| The Goldman Sachs Group, Inc. | 71,500 | 12,096 |
| UBS AG (New York Shares) | 187,810 | 11,139 |
| Charles Schwab Corp. | 618,650 | 11,074 |
| T. Rowe Price Group Inc. | 224,800 | 10,757 |
| The Chicago Mercantile Exchange | 20,100 | 9,613 |
| The Chubb Corp. | 159,570 | 8,291 |
| Wells Fargo & Co. | 214,780 | 7,771 |
* | CB Richard Ellis Group, Inc. | 233,390 | 5,741 |
|
|
| 76,482 |
Health Care (18.5%) |
|
| |
* | Gilead Sciences, Inc. | 257,520 | 17,692 |
| Baxter International, Inc. | 305,700 | 13,897 |
| Abbott Laboratories | 269,910 | 13,107 |
| Roche Holding AG ADR | 130,140 | 11,286 |
| Allergan, Inc. | 90,420 | 10,182 |
* | Express Scripts Inc. | 134,380 | 10,144 |
* | WellPoint Inc. | 130,860 | 10,083 |
| Quest Diagnostics, Inc. | 147,400 | 9,015 |
* | Thermo Electron Corp. | 224,210 | 8,818 |
| Novartis AG ADR | 125,350 | 7,325 |
* | Henry Schein, Inc. | 123,968 | 6,216 |
* | Intuitive Surgical, Inc. | 56,100 | 5,916 |
* | Celgene Corp. | 133,680 | 5,788 |
* | Covance, Inc. | 63,090 | 4,188 |
| Shire Pharmaceuticals Group PLC ADR | 79,260 | 3,915 |
* | Health Net Inc. | 67,940 | 2,957 |
|
|
| 140,529 |
Industrials (10.3%) |
|
| |
| General Electric Co. | 853,530 | 30,130 |
| Caterpillar, Inc. | 163,670 | 10,769 |
| FedEx Corp. | 79,880 | 8,681 |
| ABB Ltd. ADR | 613,660 | 8,088 |
| Roper Industries Inc. | 167,910 | 7,512 |
* | Wesco International, Inc. | 89,280 | 5,181 |
| C.H. Robinson Worldwide Inc. | 102,980 | 4,591 |
* | US Airways Group Inc. | 75,170 | 3,332 |
|
|
| 78,284 |
11
|
|
| Market |
|
|
| Value• |
|
| Shares | ($000) |
Information Technology (27.6%) |
|
| |
| Communications Equipment (7.6%) |
|
|
* | Cisco Systems, Inc. | 1,234,760 | 28,399 |
| Motorola, Inc. | 463,780 | 11,595 |
| QUALCOMM Inc. | 296,840 | 10,790 |
* | JDS Uniphase Corp. | 3,169,570 | 6,941 |
|
|
|
|
| Computers & Peripherals (3.6%) |
|
|
* | Apple Computer, Inc. | 199,530 | 15,370 |
* | SanDisk Corp. | 123,990 | 6,638 |
* | Sun Microsystems, Inc. | 1,136,550 | 5,649 |
|
|
|
|
| Internet Software & Services (4.4%) |
|
|
* | Google Inc. | 61,880 | 24,870 |
* | Akamai Technologies, Inc. | 165,030 | 8,250 |
|
|
|
|
| IT Services (1.7%) |
|
|
* | Cognizant Technology Solutions Corp. | 113,180 | 8,382 |
| Global Payments Inc. | 97,850 | 4,306 |
|
|
|
|
| Semiconductors & Semiconductor Equipment (7.5%) |
|
|
| Texas Instruments, Inc. | 420,610 | 13,985 |
* | Micron Technology, Inc. | 697,450 | 12,136 |
| Applied Materials, Inc. | 668,920 | 11,860 |
* | MEMC Electronic Materials, Inc. | 220,190 | 8,066 |
* | ASML Holding (New York) | 242,410 | 5,643 |
* | NVIDIA Corp. | 177,780 | 5,261 |
|
|
|
|
| Software (2.8%) |
|
|
* | Oracle Corp. | 459,180 | 8,146 |
* | Electronic Arts Inc. | 95,120 | 5,296 |
* | Citrix Systems, Inc. | 139,390 | 5,047 |
* | salesforce.com, Inc. | 78,210 | 2,806 |
|
|
| 209,436 |
Materials (3.5%) |
|
| |
| Monsanto Co. | 225,850 | 10,617 |
| BHP Billiton Ltd. ADR | 216,860 | 8,215 |
| Ecolab, Inc. | 169,870 | 7,274 |
|
|
| 26,106 |
Telecommunication Services (2.7%) |
|
|
* NII Holdings Inc. | 187,220 | 11,638 |
* Crown Castle International Corp. | 256,720 | 9,047 |
|
| 20,685 |
Total Common Stocks |
|
|
(Cost $684,123) |
| 758,738 |
Temporary Cash Investment (0.7%) |
|
|
1 Vanguard Market Liquidity Fund, 5.306%—Note G |
|
|
(Cost $5,688) | 5,687,500 | 5,688 |
Total Investments (100.7%) |
|
|
(Cost $689,811) |
| 764,426 |
Other Assets and Liabilities (–0.7%) |
|
|
Other Assets—Note C |
| 21,217 |
Liabilities—Note G |
| (26,457) |
|
| (5,240) |
Net Assets (100%) |
|
|
Applicable to 72,163,253 outstanding $.001 |
|
|
par value shares of beneficial interest |
|
|
(unlimited authorization) |
| 759,186 |
Net Asset Value Per Share |
| $10.52 |
At September 30, 2006, net assets consisted of:2 | ||
| Amount | Per |
| ($000) | Share |
Paid-in Capital | 1,230,214 | $17.05 |
Overdistributed Net |
|
|
Investment Income | (1,227) | (.02) |
Accumulated Net |
|
|
Realized Losses | (544,416) | (7.54) |
Unrealized Appreciation | 74,615 | 1.03 |
Net Assets | 759,186 | $10.52 |
• | See Note A in Notes to Financial Statements. |
* | Non-income-producing security. |
^ | Part of security position is on loan to broker-dealers. See Note G in Notes to Financial Statements. |
1 Affiliated money market fund available only to Vanguard funds and certain trusts and accounts managed by Vanguard. Rate shown is the 7-day yield.
2 See Note E in Notes to Financial Statements for the tax-basis components of net assets.
ADR—American Depositary Receipt.
12
Statement of Operations
| Year Ended |
| September 30, 2006 |
| ($000) |
Investment Income |
|
Income |
|
Dividends | 5,896 |
Interest1 | 554 |
Security Lending | 19 |
Total Income | 6,469 |
Expenses |
|
Investment Advisory Fees—Note B |
|
Basic Fee | 3,010 |
Performance Adjustment | 1,473 |
The Vanguard Group—Note C |
|
Management and Administrative | 2,224 |
Marketing and Distribution | 208 |
Custodian Fees | 21 |
Auditing Fees | 18 |
Shareholders’ Reports | 25 |
Trustees’ Fees and Expenses | 1 |
Total Expenses | 6,980 |
Expenses Paid Indirectly—Note D | (231) |
Net Expenses | 6,749 |
Net Investment Income (Loss) | (280) |
Realized Net Gain (Loss) on Investment Securities Sold | 51,651 |
Change in Unrealized Appreciation (Depreciation) of Investment Securities | (19,950) |
Net Increase (Decrease) in Net Assets Resulting from Operations | 31,421 |
1 Interest income from an affiliated company of the fund was $554,000.
13
Statement of Changes in Net Assets
| Year Ended September 30, | |
| 2006 | 2005 |
| ($000) | ($000) |
Increase (Decrease) in Net Assets |
|
|
Operations |
|
|
Net Investment Income (Loss) | (280) | 46 |
Realized Net Gain (Loss) | 51,651 | 54,527 |
Change in Unrealized Appreciation (Depreciation) | (19,950) | 54,443 |
Net Increase (Decrease) in Net Assets Resulting from Operations | 31,421 | 109,016 |
Distributions |
|
|
Net Investment Income | (71) | (899) |
Realized Capital Gain | — | — |
Total Distributions | (71) | (899) |
Capital Share Transactions—Note H |
|
|
Issued | 194,867 | 131,761 |
Issued in Lieu of Cash Distributions | 68 | 856 |
Redeemed | (180,174) | (292,892) |
Net Increase (Decrease) from Capital Share Transactions | 14,761 | (160,275) |
Total Increase (Decrease) | 46,111 | (52,158) |
Net Assets |
|
|
Beginning of Period | 713,075 | 765,233 |
End of Period1 | 759,186 | 713,075 |
1 Net Assets—End of Period includes undistributed (overdistributed) net investment income of ($1,227,000) and ($893,000).
14
Financial Highlights
Growth Equity Fund |
|
|
|
|
|
|
|
|
|
|
|
For a Share Outstanding | Year Ended September 30, | ||||
Throughout Each Period | 2006 | 2005 | 2004 | 2003 | 2002 |
Net Asset Value, Beginning of Period | $10.05 | $8.68 | $8.32 | $6.33 | $8.23 |
Investment Operations |
|
|
|
|
|
Net Investment Income (Loss) | (.009) | .001 | .01 | .018 | .01 |
Net Realized and Unrealized Gain (Loss) |
|
|
|
|
|
on Investments | .480 | 1.380 | .37 | 1.990 | (1.91) |
Total from Investment Operations | .471 | 1.381 | .38 | 2.008 | (1.90) |
Distributions |
|
|
|
|
|
Dividends from Net Investment Income | (.001) | (.011) | (.02) | (.018) | — |
Distributions from Realized Capital Gains | — | — | — | — | — |
Total Distributions | (.001) | (.011) | (.02) | (.018) | — |
Net Asset Value, End of Period | $10.52 | $10.05 | $8.68 | $8.32 | $6.33 |
|
|
|
|
|
|
Total Return | 4.69% | 15.92% | 4.56% | 31.79% | –23.09% |
|
|
|
|
|
|
Ratios/Supplemental Data |
|
|
|
|
|
Net Assets, End of Period (Millions) | $759 | $713 | $765 | $724 | $500 |
Ratio of Total Expenses to |
|
|
|
|
|
Average Net Assets1 | 0.91% | 0.88% | 0.72% | 0.54% | 0.58% |
Ratio of Net Investment Income (Loss) |
|
|
|
|
|
to Average Net Assets | (0.04%) | 0.01% | 0.14% | 0.25% | 0.12% |
Portfolio Turnover Rate | 147% | 147% | 162% | 220% | 273% |
1 Includes performance-based investment advisory fee increases (decreases) of 0.19%, 0.11%, (0.04%), (0.29%), and (0.20%).
See accompanying Notes, which are an integral part of the Financial Statements.
15
Notes to Financial Statements
Vanguard Growth Equity Fund is registered under the Investment Company Act of 1940 as an open-end investment company, or mutual fund. The fund files reports with the SEC under the company name Vanguard Fenway Funds.
A. The following significant accounting policies conform to generally accepted accounting principles for U.S. mutual funds. The fund consistently follows such policies in preparing its financial statements.
1. Security Valuation: Securities are valued as of the close of trading on the New York Stock Exchange (generally 4:00 p.m. Eastern time) on the valuation date. Equity securities are valued at the latest quoted sales prices or official closing prices taken from the primary market in which each security trades; such securities not traded on the valuation date are valued at the mean of the latest quoted bid and asked prices. Securities for which market quotations are not readily available, or whose values have been materially affected by events occurring before the fund’s pricing time but after the close of the securities’ primary markets, are valued by methods deemed by the board of trustees to represent fair value. Investments in Vanguard Market Liquidity Fund are valued at that fund’s net asset value.
2. Federal Income Taxes: The fund intends to continue to qualify as a regulated investment company and distribute all of its taxable income. Accordingly, no provision for federal income taxes is required in the financial statements.
3. Distributions: Distributions to shareholders are recorded on the ex-dividend date.
4. Security Lending: The fund may lend its securities to qualified institutional borrowers to earn additional income. Security loans are required to be secured at all times by collateral at least equal to the market value of securities loaned. The fund invests cash collateral received in Vanguard Market Liquidity Fund, and records a liability for the return of the collateral, during the period the securities are on loan. Security lending income represents the income earned on investing cash collateral, less expenses associated with the loan.
5. Other: Dividend income is recorded on the ex-dividend date. Interest income includes income distributions received from Vanguard Market Liquidity Fund and is accrued daily. Security transactions are accounted for on the date securities are bought or sold. Costs used to determine realized gains (losses) on the sale of investment securities are those of the specific securities sold.
B. Turner Investment Partners provides investment advisory services to the fund for a fee calculated at an annual percentage rate of average net assets. The basic fee is subject to quarterly adjustments based on the fund’s performance for the preceding three years relative to the Russell 1000 Growth Index. For the year ended September 30, 2006, the investment advisory fee represented an effective annual basic rate of 0.39% of the fund’s average net assets before an increase of $1,473,000 (0.19%) based on performance.
C. The Vanguard Group furnishes at cost corporate management, administrative, marketing, and distribution services. The costs of such services are allocated to the fund under methods approved by the board of trustees. The fund has committed to provide up to 0.40% of its net assets in capital contributions to Vanguard. At September 30, 2006, the fund had contributed capital of $80,000 to Vanguard (included in Other Assets), representing 0.01% of the fund’s net assets and 0.08% of Vanguard’s capitalization. The fund’s trustees and officers are also directors and officers of Vanguard.
16
D. The fund has asked its investment advisor to direct certain security trades, subject to obtaining the best price and execution, to brokers who have agreed to rebate to the fund part of the commissions generated. Such rebates are used solely to reduce the fund’s management and administrative expenses. For the year ended September 30, 2006, these arrangements reduced the fund’s expenses by $231,000 (an annual rate of 0.03% of average net assets).
E. Distributions are determined on a tax basis and may differ from net investment income and realized capital gains for financial reporting purposes. Differences may be permanent or temporary. Permanent differences are reclassified among capital accounts in the financial statements to reflect their tax character. Temporary differences arise when certain items of income, expense, gain, or loss are recognized in different periods for financial statement and tax purposes; these differences will reverse at some time in the future. Differences in classification may also result from the treatment of short-term gains as ordinary income for tax purposes.
For tax purposes, the fund had a net operating loss of $25,000 for the year ended September 30, 2006; this amount has been reclassified from overdistributed net investment income to paid-in capital. At September 30, 2006, the fund had available realized losses of $544,258,000 to offset future net capital gains of $407,776,000 through September 30, 2010, and $136,482,000 through September 30, 2011.
At September 30, 2006, the cost of investment securities for tax purposes was $689,817,000. Net unrealized appreciation of investment securities for tax purposes was $74,609,000, consisting of unrealized gains of $88,602,000 on securities that had risen in value since their purchase and $13,993,000 in unrealized losses on securities that had fallen in value since their purchase.
F. During the year ended September 30, 2006, the fund purchased $1,137,394,000 of investment securities and sold $1,112,216,000 of investment securities other than temporary cash investments.
G. The market value of securities on loan to broker-dealers at September 30, 2006, was $5,450,000, for which the fund received cash collateral of $5,688,000.
H. Capital shares issued and redeemed were:
| Year Ended September 30, | |
| 2006 | 2005 |
| Shares | Shares |
| (000) | (000) |
Issued | 18,437 | 14,116 |
Issued in Lieu of Cash Distributions | 6 | 89 |
Redeemed | (17,218) | (31,404) |
Net Increase (Decrease) in Shares Outstanding | 1,225 | (17,199) |
I. In June 2006, the Financial Accounting Standards Board issued Interpretation No. 48 (“FIN 48”), “Accounting for Uncertainty in Income Taxes.” FIN 48 establishes the minimum threshold for recognizing, and a system for measuring, the benefits of tax-return positions in financial statements. FIN 48 will be effective for the fund's fiscal year beginning October 1, 2007. Management is in the process of analyzing the fund's tax positions for purposes of implementing FIN 48; based on the analysis completed to date, management does not believe the adoption of FIN 48 will result in any material impact to the fund's financial statements.
17
Report of Independent Registered Public Accounting Firm
To the Trustees of Vanguard Fenway Funds and the Shareholders of Vanguard Growth Equity Fund:
In our opinion, the accompanying statement of net assets and the related statements of operations and of changes in net assets and the financial highlights present fairly, in all material respects, the financial position of Vanguard Growth Equity Fund (the “Fund”) at September 30, 2006, the results of its operations for the year then ended, the changes in its net assets for each of the two years in the period then ended, and the financial highlights for each of the five years in the period then ended, in conformity with accounting principles generally accepted in the United States of America. These financial statements and financial highlights (hereafter referred to as “financial statements”) are the responsibility of the Fund’s management; our responsibility is to express an opinion on these financial statements based on our audits. We conducted our audits of these financial statements in accordance with the standards of the Public Company Accounting Oversight Board (United States), which require that we plan and perform the audit to obtain reasonable assurance about whether the financial statements are free of material misstatement. An audit includes examining, on a test basis, evidence supporting the amounts and disclosures in the financial statements, assessing the accounting principles used and significant estimates made by management, and evaluating the overall financial statement presentation. We believe that our audits, which included confirmation of securities at September 30, 2006 by correspondence with the custodian and by agreement to the underlying ownership records for Vanguard Market Liquidity Fund, provide a reasonable basis for our opinion.
PricewaterhouseCoopers LLP
Philadelphia, Pennsylvania
November 13, 2006
Special 2006 tax information (unaudited) for Vanguard Growth Equity Fund
This information for the fiscal year ended September 30, 2006, is included pursuant to provisions of the Internal Revenue Code.
The fund distributed $71,000 of qualified dividend income to shareholders during the fiscal year.
18
Your Fund’s After-Tax Returns
This table presents returns for your fund both before and after taxes. The after-tax returns are shown in two ways: (1) assuming that an investor owned the fund during the entire period and paid taxes on the fund’s distributions, and (2) assuming that an investor paid taxes on the fund’s distributions and sold all shares at the end of each period.
Calculations are based on the highest individual federal income tax and capital gains tax rates in effect at the times of the distributions and the hypothetical sales. State and local taxes were not considered. After-tax returns reflect any qualified dividend income, using actual prior-year figures and estimates for 2006. (In the example, returns after the sale of fund shares may be higher than those assuming no sale. This occurs when the sale would have produced a capital loss. The calculation assumes that the investor received a tax deduction for the loss.)
Please note that your actual after-tax returns will depend on your tax situation and may differ from those shown. Also note that if you own the fund in a tax-deferred account, such as an individual retirement account or a 401(k) plan, this information does not apply to you. Such accounts are not subject to current taxes.
Finally, keep in mind that a fund’s performance—whether before or after taxes—does not guarantee future results.
Average Annual Total Returns: Growth Equity Fund |
|
|
|
Periods Ended September 30, 2006 |
|
|
|
| One | Five | Ten |
| Year | Years | Years |
Returns Before Taxes | 4.69% | 5.16% | 5.67% |
Returns After Taxes on Distributions | 4.69 | 5.13 | 3.13 |
Returns After Taxes on Distributions and Sale of Fund Shares | 3.05 | 4.43 | 3.76 |
19
About Your Fund’s Expenses
As a shareholder of the fund, you incur ongoing costs, which include costs for portfolio management, administrative services, and shareholder reports (like this one), among others. Operating expenses, which are deducted from a fund’s gross income, directly reduce the investment return of the fund.
A fund’s expenses are expressed as a percentage of its average net assets. This figure is known as the expense ratio. The following examples are intended to help you understand the ongoing costs (in dollars) of investing in your fund and to compare these costs with those of other mutual funds. The examples are based on an investment of $1,000 made at the beginning of the period shown and held for the entire period.
The table below illustrates your fund’s costs in two ways:
• Based on actual fund return. This section helps you to estimate the actual expenses that you paid over the period. The “Ending Account Value” shown is derived from the fund’s actual return, and the third column shows the dollar amount that would have been paid by an investor who started with $1,000 in the fund. You may use the information here, together with the amount you invested, to estimate the expenses that you paid over the period.
To do so, simply divide your account value by $1,000 (for example, an $8,600 account value divided by $1,000 = 8.6), then multiply the result by the number given for your fund under the heading “Expenses Paid During Period.”
• Based on hypothetical 5% yearly return. This section is intended to help you compare your fund’s costs with those of other mutual funds. It assumes that the fund had a yearly return of 5% before expenses, but that the expense ratio is unchanged. In this case—because the return used is not the fund’s actual return—the results do not apply to your investment. The example is useful in making comparisons because the Securities and Exchange Commission requires all mutual funds to calculate expenses based on a 5% return. You can assess your fund’s costs by comparing this hypothetical example with the hypothetical examples that appear in shareholder reports of other funds.
Six Months Ended September 30, 2006 |
|
|
|
| Beginning | Ending | Expenses |
| Account Value | Account Value | Paid During |
Growth Equity Fund | 3/31/2006 | 9/30/2006 | Period1 |
Based on Actual Fund Return | $1,000.00 | $952.04 | $3.77 |
Based on Hypothetical 5% Yearly Return | 1,000.00 | 1,021.21 | 3.90 |
Note that the expenses shown in the table are meant to highlight and help you compare ongoing costs only and do not reflect any transactional costs or account maintenance fees. They do not include your fund’s low-balance fee, which is described in the prospectus. If this fee were applied to your account, your costs would be higher. Your fund does not charge transaction fees, such as purchase or redemption fees, nor does it carry a “sales load.”
1 The calculations are based on expenses incurred in the most recent six-month period. The fund’s annualized six-month expense ratio for that period is 0.77%. The dollar amounts shown as “Expenses Paid” are equal to the annualized expense ratio multiplied by the average account value over the period, multiplied by the number of days in the most recent six-month period, then divided by the number of days in the most recent 12-month period.
20
The calculations assume no shares were bought or sold during the period. Your actual costs may have been higher or lower, depending on the amount of your investment and the timing of any purchases or redemptions.
You can find more information about the fund’s expenses, including annual expense ratios, in the Financial Statements section of this report. For additional information on operating expenses and other shareholder costs, please refer to the appropriate fund prospectus.
21
Trustees Approve Advisory Agreement
The board of trustees of Vanguard Growth Equity Fund has renewed the fund’s investment advisory agreement with Turner Investment Partners, Inc. The board determined that the retention of Turner was in the best interests of the fund and its shareholders.
The board based its decision upon an evaluation of Turner’s investment staff, portfolio management process, and performance. The trustees considered the factors discussed below, among others. However, no single factor determined whether the board approved the agreement. Rather, it was the totality of the circumstances that drove the board’s decision.
Nature, extent, and quality of services
The board considered the quality of the fund’s investment management over both the short and long term and took into account the organizational depth and stability of the firm. The board noted that Turner Investment Partners has 16 years of experience in managing growth equity portfolios. Bob Turner, co-founder of Turner Investment Partners, has been the portfolio manager since the fund’s inception in 1992. The Fund was adopted by Vanguard in 2000. Using a combination of quantitative, fundamental, and technical analyses, Turner seeks to buy stocks with strong earnings potential and reasonable valuations.
The board concluded that the advisor’s experience, stability, depth, and performance, among other factors, warranted continuation of the advisory agreement.
Investment performance
The board considered the short- and long-term performance of the fund, including any periods of outperformance or underperformance of a relevant benchmark and peer group. The board noted that the advisor has carried out the fund’s investment strategy in disciplined fashion, and the results have been in line with expectations. Information about the fund’s performance, including some of the data considered by the board, can be found in the Performance Summary section of this report.
Cost
The board concluded that the fund’s expense ratio was far below the average expense ratio charged by funds in its peer group. The board noted that the fund’s advisory fee was also well below the peer-group average. Information about the fund’s expense ratio appears in the About Your Fund’s Expenses section of this report as well as in the Financial Statements section, which also includes information about the advisory fee rate. The board did not consider profitability of Turner Investment Partners in determining whether to approve the advisory fee, because Turner is independent of Vanguard and the advisory fee is the result of arm’s-length negotiations.
The benefit of economies of scale
The board concluded that the fund’s shareholders benefit from economies of scale because of breakpoints in the fund’s advisory fee schedule. The breakpoints reduce the effective rate of the fee as the fund’s assets increase.
The board also approved a change to the process for the quarterly calculation of Turner’s asset-based fee. The calculation now will be based on the average daily net assets of the fund rather than the average month-end net assets.
The advisory agreement will continue for one year and is renewable by the fund’s board after that for successive one-year periods.
22
Glossary
Beta. A measure of the magnitude of a fund’s past share-price fluctuations in relation to the ups and downs of a given market index. The index is assigned a beta of 1.00. Compared with a given index, a fund with a beta of 1.20 typically would have seen its share price rise or fall by 12% when the index rose or fell by 10%. A fund’s beta should be reviewed in conjunction with its R-squared (see definition below). The lower the R-squared, the less correlation there is between the fund and the index, and the less reliable beta is as an indicator of volatility.
Earnings Growth Rate. The average annual rate of growth in earnings over the past five years for the stocks now in a fund.
Expense Ratio. The percentage of a fund’s average net assets used to pay its annual administrative and advisory expenses. These expenses directly reduce returns to investors.
Foreign Holdings. The percentage of a fund represented by stocks or depositary receipts of companies based outside the United States.
Median Market Cap. An indicator of the size of companies in which a fund invests; the midpoint of market capitalization (market price x shares outstanding) of a fund’s stocks, weighted by the proportion of the fund’s assets invested in each stock. Stocks representing half of the fund’s assets have market capitalizations above the median, and the rest are below it.
Price/Book Ratio. The share price of a stock divided by its net worth, or book value, per share. For a fund, the weighted average price/book ratio of the stocks it holds.
Price/Earnings Ratio. The ratio of a stock’s current price to its per-share earnings over the past year. For a fund, the weighted average P/E of the stocks it holds. P/E is an indicator of market expectations about corporate prospects; the higher the P/E, the greater the expectations for a company’s future growth.
R-Squared. A measure of how much of a fund’s past returns can be explained by the returns from the market in general, as measured by a given index. If a fund’s total returns were precisely synchronized with an index’s returns, its R-squared would be 1.00. If the fund’s returns bore no relationship to the index’s returns, its R-squared would be 0.
Return on Equity. The annual average rate of return generated by a company during the past five years for each dollar of shareholder’s equity (net income divided by shareholder’s equity). For a fund, the weighted average return on equity for the companies whose stocks it holds.
Short-Term Reserves. The percentage of a fund invested in highly liquid, short-term securities that can be readily converted to cash.
Turnover Rate. An indication of the fund’s trading activity. Funds with high turnover rates incur higher transaction costs and may be more likely to distribute capital gains (which may be taxable to investors). The turnover rate excludes in-kind transactions, which have minimal impact on costs.
Yield. A snapshot of a fund’s income from interest and dividends. The yield, expressed as a percentage of the fund’s net asset value, is based on income earned over the past 30 days and is annualized, or projected forward for the coming year. The index yield is based on the current annualized rate of income provided by securities in the index.
23
This page intentionally left blank.
This page intentionally left blank.
The People Who Govern Your Fund
The trustees of your mutual fund are there to see that the fund is operated and managed in your best interests since, as a shareholder, you are a part owner of the fund. Your fund’s trustees also serve on the board of directors of The Vanguard Group, Inc., which is owned by the Vanguard funds and provides services to them on an at-cost basis.
A majority of Vanguard’s board members are independent, meaning that they have no affiliation with Vanguard or the funds they oversee, apart from the sizable personal investments they have made as private individuals.
Our independent board members bring distinguished backgrounds in business, academia, and public service to their task of working with Vanguard officers to establish the policies and oversee the activities of the funds. Among board members’ responsibilities are selecting investment advisors for the funds; monitoring fund operations, performance, and costs; reviewing contracts; nominating and selecting new trustees/directors; and electing Vanguard officers.
Each trustee serves a fund until its termination; or until the trustee’s retirement, resignation, or death; or otherwise as specified in the fund’s organizational documents. Any trustee may be removed at a shareholders’ meeting by a vote representing two-thirds of the net asset value of all shares of the fund together with shares of other Vanguard funds organized within the same trust. The table on these two pages shows information for each trustee and executive officer of the fund. The mailing address of the trustees and officers is P.O. Box 876, Valley Forge, PA 19482.
Chairman of the Board, Chief Executive Officer, and Trustee | |
|
|
John J. Brennan1 |
|
Born 1954 | Principal Occupation(s) During the Past Five Years: Chairman of the Board, Chief |
Trustee since May 1987; | Executive Officer, and Director/Trustee of The Vanguard Group, Inc., and of each |
Chairman of the Board and | of the investment companies served by The Vanguard Group. |
Chief Executive Officer |
|
142 Vanguard Funds Overseen | |
|
|
Independent Trustees |
|
|
|
Charles D. Ellis |
|
Born 1937 | Principal Occupation(s) During the Past Five Years: Applecore Partners (pro bono ventures |
Trustee since January 2001 | in education); Senior Advisor to Greenwich Associates (international business strategy |
142 Vanguard Funds Overseen | consulting); Successor Trustee of Yale University; Overseer of the Stern School of Business |
| at New York University; Trustee of the Whitehead Institute for Biomedical Research. |
|
|
Rajiv L. Gupta |
|
Born 1945 | Principal Occupation(s) During the Past Five Years: Chairman and Chief Executive Officer |
Trustee since December 20012 | of Rohm and Haas Co. (chemicals); Board Member of the American Chemistry Council; |
142 Vanguard Funds Overseen | Director of Tyco International, Ltd. (diversified manufacturing and services) (since 2005); |
| Trustee of Drexel University and of the Chemical Heritage Foundation. |
|
|
Amy Gutmann |
|
Born 1949 | Principal Occupation(s) During the Past Five Years: President of the University of |
Trustee since June 2006 | Pennsylvania since 2004; Professor in the School of Arts and Sciences, Annenberg School |
142 Vanguard Funds Overseen | for Communication, and Graduate School of Education of the University of Pennsylvania |
| since 2004; Provost (2001–2004) and Laurance S. Rockefeller Professor of Politics and the |
| University Center for Human Values (1990–2004), Princeton University; Director of Carnegie |
| Corporation of New York and of Philadelphia 2016 (since 2005) and of Schuylkill River |
| Development Corporation and Greater Philadelphia Chamber of Commerce (since 2004). |
JoAnn Heffernan Heisen |
| |
Born 1950 | Principal Occupation(s) During the Past Five Years: Corporate Vice President and Chief | |
Trustee since July 1998 | Global Diversity Officer (since January 2006), Vice President and Chief Information | |
142 Vanguard Funds Overseen | Officer (1997–2005), and Member of the Executive Committee of Johnson & Johnson | |
| (pharmaceuticals/consumer products); Director of the University Medical Center at | |
| Princeton and Women’s Research and Education Institute. | |
|
| |
André F. Perold |
| |
Born 1952 | Principal Occupation(s) During the Past Five Years: George Gund Professor of Finance and | |
Trustee since December 2004 | Banking, Harvard Business School (since 2000); Senior Associate Dean, Director of Faculty | |
142 Vanguard Funds Overseen | Recruiting, and Chair of Finance Faculty, Harvard Business School; Director and Chairman | |
| of UNX, Inc. (equities trading firm) (since 2003); Director of registered investment | |
| companies advised by Merrill Lynch Investment Managers and affiliates (1985–2004), | |
| Genbel Securities Limited (South African financial services firm) (1999–2003), Gensec | |
| Bank (1999–2003), Sanlam, Ltd. (South African insurance company) (2001–2003), and | |
| Stockback, Inc. (credit card firm) (2000–2002). | |
|
| |
Alfred M. Rankin, Jr. |
| |
Born 1941 | Principal Occupation(s) During the Past Five Years: Chairman, President, Chief Executive | |
Trustee since January 1993 | Officer, and Director of NACCO Industries, Inc. (forklift trucks/housewares/ lignite); | |
142 Vanguard Funds Overseen | Director of Goodrich Corporation (industrial products/aircraft systems and services). | |
|
| |
J. Lawrence Wilson |
| |
Born 1936 | Principal Occupation(s) During the Past Five Years: Retired Chairman and Chief Executive | |
Trustee since April 1985 | Officer of Rohm and Haas Co. (chemicals); Director of Cummins Inc. (diesel engines), | |
142 Vanguard Funds Overseen | MeadWestvaco Corp. (packaging products), and AmerisourceBergen Corp. (pharmaceutical | |
| distribution); Trustee of Vanderbilt University and of Culver Educational Foundation. | |
|
| |
Executive Officers1 |
| |
|
| |
Heidi Stam |
| |
Born 1956 | Principal Occupation(s) During the Past Five Years: Principal of The Vanguard Group, Inc., | |
Secretary since July 2005 | since November 1997; General Counsel of The Vanguard Group since July 2005; | |
142 Vanguard Funds Overseen | Secretary of The Vanguard Group and of each of the investment companies served | |
| by The Vanguard Group since July 2005. | |
|
| |
Thomas J. Higgins |
| |
Born 1957 | Principal Occupation(s) During the Past Five Years: Principal of The Vanguard Group, Inc.; | |
Treasurer since July 1998 | Treasurer of each of the investment companies served by The Vanguard Group. | |
142 Vanguard Funds Overseen |
| |
|
| |
Vanguard Senior Management Team | ||
|
| |
R. Gregory Barton | Kathleen C. Gubanich | Michael S. Miller |
Mortimer J. Buckley | Paul A. Heller | Ralph K. Packard |
James H. Gately | F. William McNabb, III | George U. Sauter |
|
| |
Founder |
| |
|
| |
John C. Bogle |
| |
Chairman and Chief Executive Officer, 1974–1996 | ||
1 Officers of the funds are “interested persons” as defined in the Investment Company Act of 1940.
2 December 2002 for Vanguard Equity Income Fund, Vanguard Growth Equity Fund, the Vanguard Municipal Bond Funds, and the Vanguard State Tax-Exempt Funds.
More information about the trustees is in the Statement of Additional Information, available from The Vanguard Group.
|
|
| P.O. Box 2600 |
| Valley Forge, PA 19482-2600 |

Connect with Vanguard™ > www.vanguard.com
Fund Information > 800-662-7447 | Vanguard, Connect with Vanguard, and the ship logo |
| are trademarks of The Vanguard Group, Inc. |
Direct Investor Account Services > 800-662-2739 |
|
| All other marks are the exclusive property of their |
Institutional Investor Services > 800-523-1036 | respective owners. |
|
|
Text Telephone > 800-952-3335 | All comparative mutual fund data are from Lipper Inc. |
| or Morningstar, Inc., unless otherwise noted. |
|
|
|
|
|
|
|
|
This material may be used in conjunction | You can obtain a free copy of Vanguard’s proxy voting |
with the offering of shares of any Vanguard | guidelines by visiting our website, www.vanguard.com, |
fund only if preceded or accompanied by | and searching for “proxy voting guidelines,” or by calling |
the fund’s current prospectus. | Vanguard at 800-662-2739. They are also available from |
| the SEC’s website, www.sec.gov. In addition, you may |
| obtain a free report on how your fund voted the proxies for |
| securities it owned during the 12 months ended June 30. |
| To get the report, visit either www.vanguard.com |
| or www.sec.gov. |
|
|
| You can review and copy information about your fund |
| at the SEC’s Public Reference Room in Washington, D.C. |
| To find out more about this public service, call the SEC |
| at 202-551-8090. Information about your fund is also |
| available on the SEC’s website, and you can receive |
| copies of this information, for a fee, by sending a |
| request in either of two ways: via e-mail addressed to |
| publicinfo@sec.gov or via regular mail addressed to the |
| Public Reference Section, Securities and Exchange |
| Commission, Washington, DC 20549-0102. |
|
|
|
|
|
|
|
|
| © 2006 The Vanguard Group, Inc. |
| All rights reserved. |
| Vanguard Marketing Corporation, Distributor. |
|
|
| Q5440 112006 |
|
|
|
|
| Vanguard® PRIMECAP Core Fund |
|
|
|
|
|
|
|
|
|
|
| > Annual Report |
|
|
|
|
|
|
|
|
|
|
|
|
|
|
|
|
|
|
| September 30, 2006 |
|
|
|
|
|
|
|
| ||
|
|
| |
|
|
| |
|
|
| |
|
|
| |
|
|
| |
|
|
| |
|
|
| |
|
|
| |

> | Vanguard PRIMECAP Core Fund returned 12.6%, outpacing its comparative standards, for the 12 months ended September 30. |
> | The fund’s success reflected strong stock selection in the consumer discretionary, information technology, and energy sectors. |
> | The fund’s weak spots were mainly errors of omission, such as an underweighting in financials. |
Contents |
|
|
|
Your Fund’s Total Returns | 1 |
Chairman’s Letter | 2 |
Advisor’s Report | 6 |
Fund Profile | 9 |
Performance Summary | 10 |
Financial Statements | 11 |
Your Fund’s After-Tax Returns | 21 |
About Your Fund’s Expenses | 22 |
Glossary | 23 |
Please note: The opinions expressed in this report are just that—informed opinions. They should not be considered promises or advice. Also, please keep in mind that the information and opinions cover the period through the date on the cover of this report. Of course, the risks of investing in your fund are spelled out in the prospectus.
Your Fund’s Total Returns
Fiscal year ended September 30, 2006 |
|
| Total |
| Returns |
Vanguard PRIMECAP Core Fund | 12.6% |
MSCI US Prime Market 750 Index | 10.8 |
Average Multi-Cap Core Fund1 | 8.4 |
Your Fund’s Performance at a Glance | ||||
September 30, 2005–September 30, 2006 | ||||
|
|
| Distributions Per Share | |
| Starting | Ending | Income | Capital |
| Share Price | Share Price | Dividends | Gains |
Vanguard PRIMECAP Core Fund | $10.98 | $12.28 | $0.050 | $0.029 |
1 Derived from data provided by Lipper Inc.
1

Chairman’s Letter
Dear Shareholder,
During its first full fiscal year, Vanguard PRIMECAP Core Fund returned 12.6%, besting its benchmark index and peer-group average. This impressive showing in a buoyant market reflected benchmark-beating stock selection in the consumer discretionary, information technology, and energy arenas.
If you own Vanguard PRIMECAP Core Fund in a taxable account, you may wish to review our report on the fund’s after-tax returns on page 21.
Stocks endured some rough going, then recovered to post strong results
The stock market advanced through the first part of the fund’s fiscal year, then hit a speed bump in May, as investors feared that the economy was growing too rapidly. But a slowdown in the housing market, coupled with a late-summer decline in oil prices, helped to allay inflation concerns. The broad market rebounded to post a solid 10.5% return for the 12 months. Value-oriented stocks outperformed growth stocks, and large-capitalization stocks edged out small-caps, one of the market’s best-performing segments in recent years.
International stocks handily outpaced domestic issues, continuing a multiyear trend. European and emerging-market stocks fared particularly well. Stocks in the Pacific region also performed admirably, even though Japanese stocks did not fully participate in the global market’s summer recovery.
2
In the bond market, prices rallied as the Fed paused
At its August and September meetings, the Federal Reserve Board twice voted to maintain the federal funds rate at 5.25%, marking a pause in the central bank’s two-year inflation-fighting campaign. With investor sentiment buoyed by the Fed’s near-term inflation outlook, interest rates decreased, driving bond prices higher. The broad taxable bond market finished the period with a 3.7% return, and municipal bonds performed slightly better.
Although rates decreased along the entire maturity spectrum in late summer, the difference between the yields of the shortest- and longest-term issues remained narrow by historical standards. At the end of September, the U.S. Treasury yield curve was actually inverted, meaning that short-term issues such as 3-month and 6-month Treasury notes offered higher yields than those with longer maturities.
Your fund took a distinctive path to market-beating performance
Vanguard PRIMECAP Core Fund began operations less than two years ago. Because the fund’s advisor, PRIMECAP Management Company, invests with a long time horizon, the portfolio is still taking shape. Indeed, at the end of the fiscal year, the fund still had about 8% of its assets in short-term reserves.
Market Barometer |
| ||
| Average Annual Total Returns | ||
| Periods Ended September 30, 2006 | ||
| One Year | Three Years | Five Years |
Stocks |
|
|
|
Russell 1000 Index (Large-caps) | 10.2% | 12.8% | 7.6% |
Russell 2000 Index (Small-caps) | 9.9 | 15.5 | 13.8 |
Dow Jones Wilshire 5000 Index (Entire market) | 10.5 | 13.3 | 8.6 |
MSCI All Country World Index ex USA (International) | 19.4 | 23.9 | 16.4 |
|
|
|
|
Bonds |
|
|
|
Lehman Aggregate Bond Index (Broad taxable market) | 3.7% | 3.4% | 4.8% |
Lehman Municipal Bond Index | 4.5 | 4.4 | 5.2 |
Citigroup 3-Month Treasury Bill Index | 4.4 | 2.6 | 2.2 |
|
|
|
|
CPI |
|
|
|
Consumer Price Index | 2.1% | 3.1% | 2.6% |
3
The early results are nevertheless impressive—both the fund’s return and the manner in which it was produced. For example, while the information technology sector in the overall market turned in a generally lackluster performance, your fund capitalized on a concentrated selection of firms that produce software, chip-making equipment, and materials for flat-screen TVs.
A similar divergence worked to the fund’s benefit in the consumer discretionary sector. The fund earned returns above 20% from holdings at the nexus of entertainment delivery and production, such as Univision, Walt Disney, Sony, and DIRECTV. The fund also held retailers—for example, TJX Companies and Kohl’sthat rallied despite investor uncertainty about consumer spending power. In the broad market, by contrast, consumer discretionary stocks generated below-benchmark returns, depressed by results for homebuilders, automakers, and other purveyors of big-ticket items.
We expect this tendency to look—and behave—differently from the market to be a defining characteristic of Vanguard PRIMECAP Core Fund. The difference reflects PRIMECAP Management Company’s emphasis on intensive stock-by-stock research and willingness to invest heavily in what it considers the best opportunities, whatever their market sector or benchmark weighting may be.
Expense Ratios1 |
|
|
Your fund compared with its peer group |
|
|
|
| Average |
|
| Multi-Cap |
| Fund | Core Fund |
PRIMECAP Core Fund | 0.60% | 1.28% |
Total Returns |
|
|
| December 9, 2004,2 Through September 30, 2006 | |
| Average | Final Value of a $10,000 |
| Annual Return | Initial Investment |
PRIMECAP Core Fund | 12.5% | $12,364 |
MSCI US Prime Market 750 Index | 9.4 | 11,757 |
Average Multi-Cap Core Fund | 8.4 | 11,576 |
1 Fund expense ratio reflects the 12 months ended September 30, 2006. Peer-group expense ratio is derived from data provided by Lipper Inc. and captures information through year-end 2005.
2 Inception date.
4
At times, of course, the fund can pay a penalty for being different. During the past 12 months, for example, it missed out on opportunities in the financials sector. The advisor maintained relatively modest exposure to strongly performing banks, brokerages, and other financial services firms, and the fund’s holdings in the sector underperformed those in the benchmark.
Since the fund’s December 9, 2004, inception, however, successes have more than offset the shortfalls. The fund has returned an annualized 12.5%, compared with the benchmark’s 9.4% result and the peer group’s average return of 8.4%. Even over this short time period, a hypothetical investment of $10,000 in Vanguard PRIMECAP Core Fund would have produced several hundred dollars more wealth than that same investment compounded at the returns of the comparative standards.
Provision your portfolio for a long-term journey
Although the U.S. stock market finished the 12-month period with a solid return, the journey was circuitous: a strong start, a mid-May swoon, and a powerful finish. These ups and downs are an unavoidable fact of investing life.
Our time-tested counsel to shareholders traveling across the market’s peaks and valleys toward long-term goals is to diversify both within and across asset classes. Within the stock market portion of your portfolio, for example, you can complement the large-cap-oriented PRIMECAP Core Fund with smaller stocks, potentially moderating the overall volatility of your stock investments. You can temper portfolio risk more dramatically by balancing stock funds with bond and money market funds in an allocation consistent with your goals and circumstances.
This simple plan gives you the opportunity to pursue the high potential returns available from stocks while paying heed to risk control. Vanguard PRIMECAP Core Fund can play an important role in such a plan.
Thank you for entrusting your assets to Vanguard.
Sincerely,

John J. Brennan
Chairman and Chief Executive Officer
October 13, 2006
5
Advisor’s Report
During the past 12 months, equity markets delivered solid returns. Vanguard PRIMECAP Core Fund returned 12.6%, exceeding the 10.8% return of the MSCI US Prime Market 750 Index and the 8.4% average gain of the fund’s peer group.
Investment environment
Overall, fiscal 2006 was a strong year for stocks; however, it was a relatively challenging environment for growth stocks, as investors showed a strong preference for value stocks. Stocks struggled during the summer as the market wrestled with whether the Federal Reserve Board would continue to hike interest rates, threatening economic growth, or would pause, satisfied that the specter of inflation was less of a concern than preserving economic growth.
Since the Fed’s August 8 decision to leave short-term interest rates unchanged, stocks have trended higher. Additionally, energy and commodity prices have recently declined from historical highs, providing much-needed relief to consumers and further mitigating inflationary concerns. Valuations, in our view, appear attractive in light of low long-term interest rates and modest inflationary expectations; however, with corporate profit margins at record highs, multiple expansion from the current level may prove difficult.
We continue to see relatively low premiums for high-quality growth stocks. The valuation differential between growth and value stocks remains near a 20-year low. Because our objective is to buy companies with superior growth at reasonable prices, we believe this valuation compression has afforded us some compelling investment opportunities.
Our successes
The fund’s outperformance relative to the index was driven by stock selections in the information technology and consumer discretionary sectors. Our small position in a handful of energy-related companies that largely resisted the sector’s pullback also made an important contribution.
Among technology stocks, our increased emphasis on software companies contributed significantly to the fiscal year’s results. During the period, we earned strong returns from Intuit and Oracle. Other strong technology performers included Corning, the leading manufacturer of glass substrate used in LCD televisions, and semiconductor-equipment company ASML Holding.
T
he fund earned excellent returns in the consumer discretionary sector from broadcasting and entertainment companies such as Univision, Walt Disney, DIRECTV, and Sony. Our returns in the embattled energy sector were driven by an emphasis on equipment and service companies such as Schlumberger, which proved less sensitive than producers to the downturn in oil and gas prices.
6
Roche Holdings, Novartis, TJX, and Monsanto also made strong contributions to our returns during the year.
Our shortfalls
We sustained setbacks in our health care positions. Medical-device makers Boston Scientific and Medtronic performed poorly. Product recalls, FDA inquiries, safety concerns, and declining reimbursement rates have had a short-term impact on growth rates and investor psychology. Additionally, Boston Scientific has found the initial integration of Guidant to be more challenging than expected. We have increased our holdings of these two stocks, as we believe the short-term issues will eventually be favorably resolved and the long-term growth prospects of the implantable device and stent industries remain intact.
Other shortfalls included semiconductor company Intel, telecommunications companies Nortel and Sprint Nextel, Internet companies eBay and Yahoo!, drug company Sepracor, and energy companies EOG Resources and EnCana.
Outlook
We remain especially enthusiastic about information technology and health care companies—sectors that accounted for many of our largest purchases during the past 12 months. We’ve added to some of the software companies that helped generate strong returns during the past year, including Oracle. We believe that four major trends will drive strong demand for software through the rest of the decade and beyond: (1) the availability of inexpensive bandwidth as broadband penetration among U.S. households doubles from 40%; (2) the sharing and storage of digital information, such as photos, data files, music, and video; (3) the convergence of voice, data, video, and wireless services; and (4) the need to protect and secure data and identities.
We’ve also been adding to our positions in the health care sector, although the recent performance of health care stocks has continued to be poor. Pharmaceuticals have been among the worst-performing industry groups within the Standard & Poor’s 500 Index for the past four years, and we have continued to increase our commitment to the group. Despite public concern about drug prices, we see pharmaceuticals as part of the solution to higher health care costs. A recent study of nearly 200,000 patients published in the New England Journal of Medicine showed that capping drug benefits not only resulted in increased hospitalizations and deaths but produced no net cost savings. The money saved by spending less on drugs was spent on increased medical care for those patients whose drug benefits were capped. With the difference between the price/earnings ratios of pharmaceutical stocks and that of the S&P 500 close to a 40-year low, they appear undervalued.
7
We believe that the two segments of the economy most vulnerable to a slowdown are consumers and financial institutions. Consumer home equity extractions, which ranged between $100 billion and $200 billion for most of the 1980s and early 1990s, increased to $700 billion in 2005. With short-term interest rates rising and the housing market seemingly slowing, this source of liquidity is drying up.
Financial institutions will be hurt by deteriorating consumer finances, as well as by the relatively flat yield curve, which makes it more difficult for banks to arbitrage the difference between the interest rates of short-term deposits and long-term investments. While financial stocks account for approximately 22% of the MSCI US Prime Market 750 Index’s value, the sector makes up only about 7% of portfolio assets, reflecting our pessimism for this area.
Joel P. Fried |
| Howard B. Schow |
Portfolio Manager |
| Portfolio Manager |
| Theo A. Kolokotrones |
|
| Portfolio Manager |
|
Mitchell J. Milias |
| Alfred W. Mordecai |
Portfolio Manager |
| Portfolio Manager |
|
|
|
|
|
|
PRIMECAP Management Company, LLP | October 18, 2006 | |
8
Fund Profile
As of September 30, 2006
Portfolio Characteristics |
|
|
|
| Comparative |
| Fund | Index1 |
Number of Stocks | 103 | 750 |
Median Market Cap | $27.7B | $44.8B |
Price/Earnings Ratio | 21.8x | 17.3x |
Price/Book Ratio | 3.2x | 2.8x |
Yield | 0.9% | 1.8% |
Return on Equity | 14.9% | 18.5% |
Earnings Growth Rate | 16.8% | 17.1% |
Foreign Holdings | 16.3% | 0.0% |
Turnover Rate | 5% | — |
Expense Ratio | 0.60% | — |
Short-Term Reserves | 8% | — |
Sector Diversification (% of portfolio) |
| |
|
| Comparative |
| Fund | Index1 |
Consumer Discretionary | 15% | 11% |
Consumer Staples | 1 | 9 |
Energy | 5 | 9 |
Financials | 7 | 22 |
Health Care | 22 | 13 |
Industrials | 8 | 11 |
Information Technology | 26 | 15 |
Materials | 7 | 3 |
Telecommunication Services | 1 | 3 |
Utilities | 0 | 4 |
Short-Term Reserves | 8% | — |
Ten Largest Holdings2 (% of total net assets) | ||
|
|
|
Eli Lilly & Co. | pharmaceuticals | 3.2% |
Novartis AG ADR | pharmaceuticals | 3.1 |
Medtronic, Inc. | health care equipment | 2.8 |
Intuit, Inc. | application software | 2.5 |
ASML Holding (New York) | semiconductor equipment | 2.4 |
Pfizer Inc. | pharmaceuticals | 2.3 |
Corning, Inc. | communications equipment | 2.0 |
Schlumberger Ltd. | oil and gas equipment and services | 2.0 |
GlaxoSmithKline PLC ADR | pharmaceuticals | 2.0 |
Oracle Corp. | systems software | 2.0 |
Top Ten |
| 24.3% |
Investment Focus
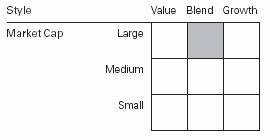
1 MSCI US Prime Market 750 Index.
2 “Ten Largest Holdings” excludes any temporary cash investments and equity index products. See page 23 for a glossary of investment terms.
9
Performance Summary
All of the returns in this report represent past performance, which is not a guarantee of future results that may be achieved by the fund. (Current performance may be lower or higher than the performance data cited. For performance data current to the most recent month-end, visit our website at www.vanguard.com.) Note, too, that both investment returns and principal value can fluctuate widely, so an investor’s shares, when sold, could be worth more or less than their original cost. The returns shown do not reflect taxes that a shareholder would pay on fund distributions or on the sale of fund shares.
Cumulative Performance: December 9, 2004–September 30, 2006
Initial Investment of $10,000
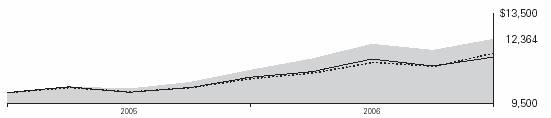
| Average Annual Total Returns | Final Value | |
| Periods Ended September 30, 2006 | of a $10,000 | |
| One Year | Since Inception1 | Investment |
PRIMECAP Core Fund2 | 12.61% | 12.46% | $12,364 |
MSCI US Prime Market 750 Index | 10.79 | 9.36 | 11,757 |
Average Multi-Cap Core Fund3 | 8.38 | 8.43 | 11,576 |
Fiscal Year Total Returns (%): December 9, 2004–September 30, 2006
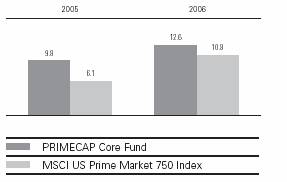
1 December 9, 2004.
2 Total return figures do not reflect of the 1% fee assessed on redemptions of shares held for less than one year.
3 Derived from data provided by Lipper Inc.
Note: See Financial Highlights table on page 16 for dividend and capital gains information.
10
Financial Statements
Statement of Net Assets
As of September 30, 2006
The fund provides a complete list of its holdings four times in each fiscal year, at the quarter-ends. For the second and fourth fiscal quarters, the lists appear in the fund’s semiannual and annual reports to shareholders. For the first and third fiscal quarters, the fund files the lists with the Securities and Exchange Commission on Form N-Q. Shareholders can look up the fund’s Forms N-Q on the SEC’s website at www.sec.gov. Forms N-Q may also be reviewed and copied at the SEC’s Public Reference Room (see the back cover of this report for further information).
|
|
| Market |
|
|
| Value• |
|
| Shares | ($000) |
Common Stocks (91.8%) |
|
| |
Consumer Discretionary (15.2%) |
|
| |
* | Bed Bath & Beyond, Inc. | 1,117,791 | 42,767 |
| Sony Corp. ADR | 1,049,000 | 42,338 |
* | Kohl’s Corp. | 486,200 | 31,564 |
| TJX Cos., Inc. | 993,025 | 27,834 |
| The Walt Disney Co. | 787,900 | 24,354 |
* | Univision Communications Inc. | 700,000 | 24,038 |
* | DIRECTV Group, Inc. | 1,120,725 | 22,056 |
* | Comcast Corp. Class A | 540,000 | 19,899 |
| Best Buy Co., Inc. | 296,900 | 15,902 |
| Mattel, Inc. | 765,200 | 15,074 |
| Whirlpool Corp. | 160,000 | 13,458 |
| Yum! Brands, Inc. | 214,000 | 11,139 |
| Nordstrom, Inc. | 237,400 | 10,042 |
| Target Corp. | 177,650 | 9,815 |
| Eastman Kodak Co. | 300,000 | 6,720 |
| Time Warner, Inc. | 353,250 | 6,440 |
| Lowe’s Cos., Inc. | 130,600 | 3,665 |
| News Corp., Class A | 180,000 | 3,537 |
* | IAC/InterActiveCorp | 108,250 | 3,113 |
* | Expedia, Inc. | 108,250 | 1,697 |
|
|
| 335,452 |
Consumer Staples (0.7%) |
|
| |
| Avon Products, Inc. | 340,000 | 10,424 |
| Costco Wholesale Corp. | 100,000 | 4,968 |
|
|
| 15,392 |
Energy (4.8%) |
|
| |
| Schlumberger Ltd. | 722,900 | 44,841 |
| EnCana Corp. | 414,900 | 19,372 |
| EOG Resources, Inc. | 240,000 | 15,612 |
| Murphy Oil Corp. | 167,000 | 7,941 |
* | National Oilwell Varco Inc. | 80,000 | 4,684 |
| Chevron Corp. | 64,440 | 4,180 |
* | Transocean Inc. | 48,425 | 3,546 |
| GlobalSantaFe Corp. | 70,000 | 3,499 |
* | Cameron International Corp. 39,300 |
| 1,899 |
| Pioneer Natural Resources Co. | 32,900 | 1,287 |
|
|
| 106,861 |
Financials (7.0%) |
|
| |
* | Berkshire Hathaway Inc.Class B | 9,400 | 29,836 |
| Marsh & McLennan Cos., Inc. | 968,175 | 27,254 |
| The Bank of New York Co., Inc. | 669,800 | 23,617 |
| The Chubb Corp. | 363,950 | 18,911 |
| Fannie Mae | 260,000 | 14,537 |
| The St. Paul Travelers, Cos. Inc. | 250,000 | 11,723 |
| American International Group, Inc. | 149,725 | 9,921 |
| MBIA, Inc. | 117,425 | 7,215 |
| Fifth Third Bancorp | 176,800 | 6,733 |
| Washington Mutual, Inc. | 100,000 | 4,347 |
|
|
| 154,094 |
Health Care (22.1%) |
|
| |
| Biotechnology (2.8%) |
|
|
* | Amgen, Inc. | 510,300 | 36,502 |
* | Biogen Idec Inc. | 528,425 | 23,610 |
* | Genzyme Corp. | 9,100 | 614 |
|
|
|
|
| Health Care Equipment & Supplies (4.5%) |
|
|
| Medtronic, Inc. | 1,313,500 | 60,999 |
* | Boston Scientific Corp. | 2,619,991 | 38,750 |
|
|
|
|
| Life Science Tools & Services (0.6%) |
|
|
* | Waters Corp. | 280,000 | 12,678 |
|
|
|
|
| Pharmaceuticals (14.3%) |
|
|
| Eli Lilly & Co. | 1,245,000 | 70,965 |
| Novartis AG ADR | 1,177,800 | 68,831 |
11
|
|
| Market |
|
|
| Value• |
|
| Shares | ($000) |
| Pfizer Inc. | 1,774,550 | 50,326 |
| GlaxoSmithKline PLC ADR | 840,000 | 44,713 |
| Roche Holdings AG | 245,000 | 42,210 |
* | Sepracor Inc. | 780,400 | 37,803 |
|
|
| 488,001 |
Industrials (8.1%) |
|
| |
| Southwest Airlines Co. | 2,550,825 | 42,497 |
| Avery Dennison Corp. | 560,000 | 33,695 |
| FedEx Corp. | 204,975 | 22,277 |
| Union Pacific Corp. | 200,000 | 17,600 |
| 3M Co. | 163,000 | 12,130 |
| Fluor Corp. | 155,000 | 11,918 |
| General Electric Co. | 300,000 | 10,590 |
* | McDermott International, Inc. | 240,000 | 10,032 |
| Burlington Northern Santa Fe Corp. | 100,000 | 7,344 |
| Canadian National Railway Co. | 160,000 | 6,710 |
| Caterpillar, Inc. | 60,950 | 4,011 |
|
|
| 178,804 |
Information Technology (26.4%) |
|
| |
| Communications Equipment (6.1%) |
|
|
* | Corning, Inc. | 1,841,700 | 44,956 |
| LM Ericsson Telephone Co. ADR Class B | 560,000 | 19,292 |
* | Research In Motion Ltd. | 154,300 | 15,839 |
* | Nortel Networks Corp. | 6,757,500 | 15,542 |
* | Comverse Technology, Inc. | 686,725 | 14,723 |
| Motorola, Inc. | 540,000 | 13,500 |
| QUALCOMM Inc. | 306,800 | 11,152 |
|
|
|
|
| Computers & Peripherals (1.2%) |
|
|
* | EMC Corp. | 2,157,300 | 25,844 |
|
|
|
|
| Electronic Equipment & Instruments (0.7%) |
|
|
* | Agilent Technologies, Inc. | 455,000 | 14,874 |
|
|
|
|
| Internet Software & Services (1.9%) |
|
|
* | eBay Inc. | 635,500 | 18,023 |
* | Yahoo! Inc. | 639,000 | 16,154 |
* | Google Inc. | 18,000 | 7,234 |
|
|
|
|
| IT Services (0.9%) |
|
|
| Accenture Ltd. | 380,500 | 12,066 |
| Paychex, Inc. | 240,000 | 8,844 |
|
|
|
|
| Semiconductors &Semiconductor Equipment (8.1%) |
|
|
* | ASML Holding (New York) | 2,282,400 | 53,134 |
| Texas Instruments, Inc. | 1,256,900 | 41,792 |
| Intel Corp. | 1,700,300 | 34,975 |
| Applied Materials, Inc. | 1,050,100 | 18,618 |
* | Altera Corp. | 720,000 | 13,234 |
| KLA-Tencor Corp. | 240,000 | 10,673 |
* | Micron Technology, Inc. | 350,000 | 6,090 |
|
|
|
|
| Software (7.5%) |
|
|
* | Intuit, Inc. | 1,689,600 | 54,219 |
* | Oracle Corp. | 2,500,600 | 44,361 |
| Microsoft Corp. | 1,274,500 | 34,832 |
* | Symantec Corp. | 1,536,900 | 32,705 |
|
|
| 582,676 |
Materials (6.7%) |
|
| |
| Potash Corp. of |
|
|
| Saskatchewan, Inc. | 191,100 | 19,911 |
| Praxair, Inc. | 326,975 | 19,344 |
| Monsanto Co. | 355,350 | 16,705 |
| Weyerhaeuser Co. | 266,600 | 16,404 |
| Alcoa Inc. | 480,300 | 13,468 |
| Vulcan Materials Co. | 172,000 | 13,459 |
| Inco Ltd. | 160,000 | 12,203 |
| MeadWestvaco Corp. | 400,000 | 10,604 |
| Dow Chemical Co. | 237,225 | 9,247 |
| Phelps Dodge Corp. | 104,000 | 8,809 |
| Newmont Mining Corp. |
|
|
| (Holding Co.) | 200,000 | 8,549 |
|
|
| 148,703 |
Telecommunication Services (0.8%) |
|
| |
Sprint Nextel Corp. | 890,050 | 15,264 | |
Embarq Corp. | 34,897 | 1,688 | |
|
|
| 16,952 |
Total Common Stocks |
|
| |
(Cost $1,835,111) |
| 2,026,935 | |
Temporary Cash Investment (8.5%) |
|
| |
1 | Vanguard Market Liquidity |
|
|
| Fund, 5.306% |
|
|
| (Cost $186,571) | 186,570,889 | 186,571 |
Total Investments (100.3%) |
|
| |
(Cost $2,021,682) |
| 2,213,506 | |
Other Assets and Liabilities (–0.3%) |
|
| |
Other Assets—Note C |
| 5,632 | |
Liabilities |
| (11,399) | |
|
|
| (5,767) |
Net Assets (100%) |
|
| |
Applicable to 179,855,588 outstanding |
|
| |
$.001 par value shares of beneficial |
|
| |
interest (unlimited authorization) |
| 2,207,739 | |
Net Asset Value Per Share |
| $12.28 | |
12
At September 30, 2006, net assets consisted of:2 | ||
| Amount | Per |
| ($000) | Share |
Paid-in Capital | 1,989,373 | $11.07 |
Undistributed Net |
|
|
Investment Income | 11,441 | .06 |
Accumulated Net |
|
|
Realized Gains | 15,098 | .08 |
Unrealized Appreciation |
|
|
Investment Securities | 191,824 | 1.07 |
Foreign Currencies | 3 | — |
Net Assets | 2,207,739 | $12.28 |
• | See Note A in Notes to Financial Statements. |
* | Non-income-producing security. |
1 Affiliated money market fund available only to Vanguard funds and certain trusts and accounts managed by Vanguard. Rate shown is the 7-day yield.
2 See Note D in Notes to Financial Statements for the tax-basis components of net assets. ADR—American Depositary Receipt.
13
Statement of Operations
| Year Ended |
| September 30, 2006 |
| ($000) |
Investment Income |
|
Income |
|
Dividends1 | 15,732 |
Interest2 | 8,478 |
Security Lending | 80 |
Total Income | 24,290 |
Expenses |
|
Investment Advisory Fees—Note B | 5,625 |
The Vanguard Group—Note C |
|
Management and Administrative | 3,656 |
Marketing and Distribution | 361 |
Custodian Fees | 25 |
Auditing Fees | 18 |
Shareholders’ Reports | 33 |
Trustees’ Fees and Expenses | 2 |
Total Expenses | 9,720 |
Net Investment Income | 14,570 |
Realized Net Gain (Loss) |
|
Investment Securities Sold | 16,330 |
Foreign Currencies | (6) |
Realized Net Gain (Loss) | 16,324 |
Change in Unrealized Appreciation (Depreciation) |
|
Investment Securities | 137,586 |
Foreign Currencies | 3 |
Change in Unrealized Appreciation (Depreciation) | 137,589 |
Net Increase (Decrease) in Net Assets Resulting from Operations | 168,483 |
1 Dividends are net of foreign withholding taxes of $280,000.
2 Interest income from an affiliated company of the fund was $8,478,000.
14
Statement of Changes in Net Assets
| Year Ended | Dec. 9, 20041 |
| Sept. 30, | to Sept. 30, |
| 2006 | 2005 |
| ($000) | ($000) |
Increase (Decrease) in Net Assets |
|
|
Operations |
|
|
Net Investment Income | 14,570 | 2,782 |
Realized Net Gain (Loss) | 16,324 | 2,517 |
Unrealized Appreciation (Depreciation) | 137,589 | 54,238 |
Net Increase (Decrease) in Net Assets Resulting from Operations | 168,483 | 59,537 |
Distributions |
|
|
Net Investment Income | (5,225) | — |
Realized Capital Gain2 | (3,030) | — |
Total Distributions | (8,255) | — |
Capital Share Transactions—Note F |
|
|
Issued | 1,275,807 | 909,458 |
Issued in Lieu of Cash Distributions | 7,589 | — |
Redeemed3 | (178,080) | (26,800) |
Net Increase (Decrease) from Capital Share Transactions | 1,105,316 | 882,658 |
Total Increase (Decrease) | 1,265,544 | 942,195 |
Net Assets |
|
|
Beginning of Period | 942,195 | — |
End of Period4 | 2,207,739 | 942,195 |
1 Inception.
2 Includes fiscal 2006 short-term gain distributions totaling $3,030,000. Short-term gain distributions are treated as ordinary income dividends for tax purposes.
3 Net of redemption fees of $760,000 and $245,000.
4 Net Assets–End of Period includes undistributed net investment income of $11,441,000 and $2,730,000.
15
Financial Highlights
| Year | Dec. 9, |
| Ended | 20041 to |
| Sept. 30, | Sept. 30, |
For a Share Outstanding Throughout Each Period | 2006 | 2005 |
Net Asset Value, Beginning of Period | $10.98 | $10.00 |
Investment Operations |
|
|
Net Investment Income | .090 | .03 |
Net Realized and Unrealized Gain (Loss) on Investments | 1.289 | .95 |
Total from Investment Operations | 1.379 | .98 |
Distributions |
|
|
Dividends from Net Investment Income | (.050) | — |
Distributions from Realized Capital Gains | (.029) | — |
Total Distributions | (.079) | — |
Net Asset Value, End of Period | $12.28 | $10.98 |
|
|
|
Total Return2 | 12.61% | 9.80% |
|
|
|
Ratios/Supplemental Data |
|
|
Net Assets, End of Period (Millions) | $2,208 | $942 |
Ratio of Total Expenses to Average Net Assets | 0.60% | 0.72%3 |
Ratio of Net Investment Income to Average Net Assets | 0.90% | 0.58%3 |
Portfolio Turnover Rate | 5% | 6% |
1 Inception.
2 Total return does not reflect the 1% fee assessed on redemptions of shares held for less than one year.
3 Annualized.
See accompanying Notes, which are an integral part of the Financial Statements.
16
Notes to Financial Statements
Vanguard PRIMECAP Core Fund is registered under the Investment Company Act of 1940 as an open-end investment company, or mutual fund. The fund files reports with the SEC under the company name Vanguard Fenway Funds.
A. The following significant accounting policies conform to generally accepted accounting principles for U.S. mutual funds. The fund consistently follows such policies in preparing its financial statements.
1. Security Valuation: Securities are valued as of the close of trading on the New York Stock Exchange (generally 4:00 p.m., Eastern time) on the valuation date. Equity securities are valued at the latest quoted sales prices or official closing prices taken from the primary market in which each security trades; such securities not traded on the valuation date are valued at the mean of the latest quoted bid and asked prices. Securities for which market quotations are not readily available, or whose values have been affected by events occurring before the fund’s pricing time but after the close of the securities’ primary markets, are valued at their fair values calculated according to procedures adopted by the board of trustees. These procedures include obtaining quotations from an independent pricing service, monitoring news to identify significant market- or security-specific events, and evaluating changes in the values of foreign market proxies (for example, ADRs, futures contracts, or exchange-traded funds) between the time the foreign markets close and the fund’s pricing time. When fair-value pricing is employed, the prices of securities used by a fund to calculate its net asset value may differ from quoted or published prices for the same securities. Investments in Vanguard Market Liquidity Fund are valued at that fund’s net asset value.
2. Foreign Currency: Securities and other assets and liabilities denominated in foreign currencies are translated into U.S. dollars at the exchange rates on the valuation date as employed by Morgan Stanley Capital International (MSCI) in the calculation of its indexes. As part of the fund’s fair-value procedures, exchange rates may be adjusted if they change significantly before the fund’s pricing time but after the time at which the MSCI rates are determined (generally 11:00 a.m., Eastern time).
Realized gains (losses) and unrealized appreciation (depreciation) on investment securities include the effects of changes in exchange rates since the securities were purchased, combined with the effects of changes in security prices. Fluctuations in the value of other assets and liabilities resulting from changes in exchange rates are recorded as unrealized foreign currency gains (losses) until the asset or liability is settled in cash, when they are recorded as realized foreign currency gains (losses).
3. Federal Income Taxes: The fund intends to continue to qualify as a regulated investment company and distribute all of its taxable income. Accordingly, no provision for federal income taxes is required in the financial statements.
4. Distributions: Distributions to shareholders are recorded on the ex-dividend date.
5. Security Lending: The fund may lend its securities to qualified institutional borrowers to earn additional income. Security loans are required to be secured at all times by collateral at least equal to the market value of securities loaned. The fund invests cash collateral received in Vanguard Market Liquidity Fund, and records a liability for the return of the collateral, during the period the securities are on loan. Security lending income represents the income earned on investing cash collateral, less expenses associated with the loan.
17
6. Other: Dividend income is recorded on the ex-dividend date. Interest income includes income distributions received from Vanguard Market Liquidity Fund and is accrued daily. Security transactions are accounted for on the date securities are bought or sold. Costs used to determine realized gains (losses) on the sale of investment securities are those of the specific securities sold. Fees assessed on redemptions of capital shares are credited to paid-in capital.
B. PRIMECAP Management Company provides investment advisory services to the fund for a fee calculated at an annual percentage rate of average net assets. For the year ended September 30, 2006, the investment advisory fee represented an effective annual rate of 0.35% of the fund’s average net assets.
C. The Vanguard Group furnishes at cost corporate management, administrative, marketing, and distribution services. The costs of such services are allocated to the fund under methods approved by the board of trustees. The fund has committed to provide up to 0.40% of its net assets in capital contributions to Vanguard. At September 30, 2006, the fund had contributed capital of $223,000 to Vanguard (included in Other Assets), representing 0.01% of the fund’s net assets and 0.22% of Vanguard’s capitalization. The fund’s trustees and officers are also directors and officers of Vanguard.
D. Distributions are determined on a tax basis and may differ from net investment income and realized capital gains for financial reporting purposes. Differences may be permanent or temporary. Permanent differences are reclassified among capital accounts in the financial statements to reflect their tax character. Temporary differences arise when certain items of income, expense, gain, or loss are recognized in different periods for financial statement and tax purposes; these differences will reverse at some time in the future. Differences in classification may also result from the treatment of short-term gains as ordinary income for tax purposes.
During the year ended September 30, 2006, the fund realized net foreign currency losses of $6,000, which decreased distributable net investment income for tax purposes; accordingly, such losses have been reclassified from accumulated net realized gains to undistributed net investment income.
The fund used a tax accounting practice to treat a portion of the price of capital shares redeemed during the year as distributions from net investment income and realized capital gains. Accordingly, the fund has reclassified $628,000 from undistributed net investment income, and $675,000 from accumulated net realized gains, to paid-in capital.
For tax purposes, at September 30, 2006, the fund had $18,593,000 of ordinary income and $8,767,000 of long-term capital gains available for distribution.
At September 30, 2006, the cost of investment securities for tax purposes was $2,021,682,000. Net unrealized appreciation of investment securities for tax purposes was $191,824,000, consisting of unrealized gains of $248,834,000 on securities that had risen in value since their purchase and $57,010,000 in unrealized losses on securities that had fallen in value since their purchase.
E. During the year ended September 30, 2006, the fund purchased $1,089,112,000 of investment securities and sold $69,538,000 of investment securities, other than temporary cash investments.
18
F. Capital shares issued and redeemed were:
| Year Ended | December 9, 20041 to |
| September 30, 2006 | September 30, 2005 |
| Shares | Shares |
| (000) | (000) |
Issued | 108,570 | 88,417 |
Issued in Lieu of Cash Distributions | 660 | — |
Redeemed | (15,210) | (2,581) |
Net Increase (Decrease) in Shares Outstanding | 94,020 | 85,836 |
G. In June 2006, the Financial Accounting Standards Board issued Interpretation No. 48 (“FIN 48”), “Accounting for Uncertainty in Income Taxes.” FIN 48 establishes the minimum threshold for recognizing, and a system for measuring, the benefits of tax-return positions in financial statements. FIN 48 will be effective for the fund’s fiscal year beginning October 1, 2007. Management is in the process of analyzing the fund’s tax positions for purposes of implementing FIN 48; based on the analysis completed to date, management does not believe the adoption of FIN 48 will result in any material impact to the fund’s financial statements.
1 Inception.
19
Report of Independent Registered Public Accounting Firm
To the Trustees of Vanguard Fenway Funds and the Shareholders of Vanguard PRIMECAP Core Fund:
In our opinion, the accompanying statement of net assets and the related statements of operations and of changes in net assets and the financial highlights present fairly, in all material respects, the financial position of Vanguard PRIMECAP Core Fund (the “Fund”) at September 30, 2006, the results of its operations for the year then ended and the changes in its net assets and the financial highlights for the year then ended and for the period from December 9, 2004 (commencement of operations) through September 30, 2005, in conformity with accounting principles generally accepted in the United States of America. These financial statements and financial highlights (hereafter referred to as “financial statements”) are the responsibility of the Fund’s management; our responsibility is to express an opinion on these financial statements based on our audits. We conducted our audits of these financial statements in accordance with the standards of the Public Company Accounting Oversight Board (United States), which require that we plan and perform the audit to obtain reasonable assurance about whether the financial statements are free of material misstatement. An audit includes examining, on a test basis, evidence supporting the amounts and disclosures in the financial statements, assessing the accounting principles used and significant estimates made by management, and evaluating the overall financial statement presentation. We believe that our audits, which included confirmation of securities at September 30, 2006 by correspondence with the custodian and by agreement to the underlying ownership records for Vanguard Market Liquidity Fund, provide a reasonable basis for our opinion.
PricewaterhouseCoopers LLP
Philadelphia, Pennsylvania
November 13, 2006
Special 2006 tax information (unaudited) for Vanguard PRIMECAP Core Fund
This information for the fiscal year ended September 30, 2006, is included pursuant to provisions of the Internal Revenue Code.
The fund distributed $378,000 as capital gain dividends (from net long-term capital gains) to shareholders during the fiscal year.
The fund distributed $6,991,000 of qualified dividend income to shareholders during the fiscal year.
For corporate shareholders, 58.3% of investment income (dividend income plus short-term gains, if any) qualifies for the dividends-received deduction.
20
Your Fund’s After-Tax Returns
This table presents returns for your fund both before and after taxes. The after-tax returns are shown in two ways: (1) assuming that an investor owned the fund during the entire period and paid taxes on the fund’s distributions, and (2) assuming that an investor paid taxes on the fund’s distributions and sold all shares at the end of each period.
Calculations are based on the highest individual federal income tax and capital gains tax rates in effect at the times of the distributions and the hypothetical sales. State and local taxes were not considered. After-tax returns reflect any qualified dividend income, using actual prior-year figures and estimates for 2006. (In the example, returns after the sale of fund shares may be higher than those assuming no sale. This occurs when the sale would have produced a capital loss. The calculation assumes that the investor received a tax deduction for the loss.)
Please note that your actual after-tax returns will depend on your tax situation and may differ from those shown. Also note that if you own the fund in a tax-deferred account, such as an individual retirement account or a 401(k) plan, this information does not apply to you. Such accounts are not subject to current taxes.
Finally, keep in mind that a fund’s performance—whether before or after taxes—does not guarantee future results.
Average Annual Total Returns: PRIMECAP Core Fund |
|
|
Periods Ended September 30, 2006 |
|
|
| One | Since |
| Year1 | Inception2 |
Returns Before Taxes | 12.61% | 12.46% |
Returns After Taxes on Distributions | 12.47 | 12.38 |
Returns After Taxes on Distributions and Sale of Fund Shares | 8.31 | 10.64 |
1 Total return figures do not reflect the 1% fee assessed on redemptions of shares held less than one year.
2 December 9, 2004.
21
About Your Fund’s Expenses
As a shareholder of the fund, you incur ongoing costs, which include costs for portfolio management, administrative services, and shareholder reports (like this one), among others. Operating expenses, which are deducted from a fund’s gross income, directly reduce the investment return of the fund.
A fund’s expenses are expressed as a percentage of its average net assets. This figure is known as the expense ratio. The following examples are intended to help you understand the ongoing costs (in dollars) of investing in your fund and to compare these costs with those of other mutual funds. The examples are based on an investment of $1,000 made at the beginning of the period shown and held for the entire period.
The table below illustrates your fund’s costs in two ways:
• Based on actual fund return. This section helps you to estimate the actual expenses that you paid over the period. The “Ending Account Value” shown is derived from the fund’s actual return, and the third column shows the dollar amount that would have been paid by an investor who started with $1,000 in the fund. You may use the information here, together with the amount you invested, to estimate the expenses that you paid over the period.
To do so, simply divide your account value by $1,000 (for example, an $8,600 account value divided by $1,000 = 8.6), then multiply the result by the number given for your fund under the heading “Expenses Paid During Period.”
• Based on hypothetical 5% yearly return. This section is intended to help you compare your fund’s costs with those of other mutual funds. It assumes that the fund had a yearly return of 5% before expenses, but that the expense ratio is unchanged. In this case—because the return used is not the fund’s actual return—the results do not apply to your investment. The example is useful in making comparisons because the Securities and Exchange Commission requires all mutual funds to calculate expenses based on a 5% return. You can assess your fund’s costs by comparing this hypothetical example with the hypothetical examples that appear in shareholder reports of other funds.
Six Months Ended September 30, 2006 |
|
|
|
| Beginning | Ending | Expenses |
| Account Value | Account Value | Paid During |
PRIMECAP Core Fund | 3/31/2006 | 9/30/2006 | Period1 |
Based on Actual Fund Return | $1,000.00 | $1,019.09 | $2.94 |
Based on Hypothetical 5% Yearly Return | 1,000.00 | 1,022.16 | 2.94 |
Note that the expenses shown in the table are meant to highlight and help you compare ongoing costs only; they do not include your fund’s low-balance fee or the 1% fee on redemptions of shares held for less than one year. These fees are fully described in the prospectus. If the fees were applied to your account, your costs would be higher. Your fund does not carry a “sales load.”
The calculations assume no shares were bought or sold during the period. Your actual costs may have been higher or lower, depending on the amount of your investment and the timing of any purchases or redemptions.
You can find more information about the fund’s expenses in the Financial Statements section of this report. For additional information on operating expenses and other shareholder costs, please refer to the current fund prospectus.
1 These calculations are based on expenses incurred in the most recent six-month period. The fund’s annualized six-month expense ratio for that period is 0.58%. The dollar amounts shown as “Expenses Paid” are equal to the annualized expense ratio multiplied by the average account value over the period, multiplied by the number of days in the most recent six-month period, then divided by the number of days in the most recent 12-month period.
22
Glossary
Earnings Growth Rate. The average annual rate of growth in earnings over the past five years for the stocks now in a fund.
Expense Ratio. The percentage of a fund’s average net assets used to pay its annual administrative and advisory expenses. These expenses directly reduce returns to investors.
Foreign Holdings. The percentage of a fund represented by stocks or depositary receipts of companies based outside the United States.
Median Market Cap. An indicator of the size of companies in which a fund invests; the midpoint of market capitalization (market price x shares outstanding) of a fund’s stocks, weighted by the proportion of the fund’s assets invested in each stock. Stocks representing half of the fund’s assets have market capitalizations above the median, and the rest are below it.
Price/Book Ratio. The share price of a stock divided by its net worth, or book value, per share. For a fund, the weighted average price/book ratio of the stocks it holds.
Price/Earnings Ratio. The ratio of a stock’s current price to its per-share earnings over the past year. For a fund, the weighted average P/E of the stocks it holds. P/E is an indicator of market expectations about corporate prospects; the higher the P/E, the greater the expectations for a company’s future growth.
Return on Equity. The annual average rate of return generated by a company during the past five years for each dollar of shareholder’s equity (net income divided by shareholder’s equity). For a fund, the weighted average return on equity for the companies whose stocks it holds.
Short-Term Reserves. The percentage of a fund invested in highly liquid, short-term securities that can be readily converted to cash.
Turnover Rate. An indication of the fund’s trading activity. Funds with high turnover rates incur higher transaction costs and may be more likely to distribute capital gains (which may be taxable to investors). The turnover rate excludes in-kind transactions, which have minimal impact on costs.
Yield. A snapshot of a fund’s income from interest and dividends. The yield, expressed as a percentage of the fund’s net asset value, is based on income earned over the past 30 days and is annualized, or projected forward for the coming year. The index yield is based on the current annualized rate of income provided by securities in the index.
23
The People Who Govern Your Fund
The trustees of your mutual fund are there to see that the fund is operated and managed in your best interests since, as a shareholder, you are a part owner of the fund. Your fund’s trustees also serve on the board of directors of The Vanguard Group, Inc., which is owned by the Vanguard funds and provides services to them on an at-cost basis.
A majority of Vanguard’s board members are independent, meaning that they have no affiliation with Vanguard or the funds they oversee, apart from the sizable personal investments they have made as private individuals.
Our independent board members bring distinguished backgrounds in business, academia, and public service to their task of working with Vanguard officers to establish the policies and oversee the activities of the funds. Among board members’ responsibilities are selecting investment advisors for the funds; monitoring fund operations, performance, and costs; reviewing contracts; nominating and selecting new trustees/directors; and electing Vanguard officers.
Each trustee serves a fund until its termination; or until the trustee’s retirement, resignation, or death; or otherwise as specified in the fund’s organizational documents. Any trustee may be removed at a shareholders’ meeting by a vote representing two-thirds of the net asset value of all shares of the fund together with shares of other Vanguard funds organized within the same trust. The table on these two pages shows information for each trustee and executive officer of the fund. The mailing address of the trustees and officers is P.O. Box 876, Valley Forge, PA 19482.
Chairman of the Board, Chief Executive Officer, and Trustee | |
|
|
John J. Brennan1 |
|
Born 1954 | Principal Occupation(s) During the Past Five Years: Chairman of the Board, Chief |
Trustee since May 1987; | Executive Officer, and Director/Trustee of The Vanguard Group, Inc., and of each |
Chairman of the Board and | of the investment companies served by The Vanguard Group. |
Chief Executive Officer |
|
142 Vanguard Funds Overseen | |
|
|
Independent Trustees |
|
|
|
Charles D. Ellis |
|
Born 1937 | Principal Occupation(s) During the Past Five Years: Applecore Partners (pro bono ventures |
Trustee since January 2001 | in education); Senior Advisor to Greenwich Associates (international business strategy |
142 Vanguard Funds Overseen | consulting); Successor Trustee of Yale University; Overseer of the Stern School of Business |
| at New York University; Trustee of the Whitehead Institute for Biomedical Research. |
|
|
Rajiv L. Gupta |
|
Born 1945 | Principal Occupation(s) During the Past Five Years: Chairman and Chief Executive Officer |
Trustee since December 20012 | of Rohm and Haas Co. (chemicals); Board Member of the American Chemistry Council; |
142 Vanguard Funds Overseen | Director of Tyco International, Ltd. (diversified manufacturing and services) (since 2005); |
| Trustee of Drexel University and of the Chemical Heritage Foundation. |
|
|
Amy Gutmann |
|
Born 1949 | Principal Occupation(s) During the Past Five Years: President of the University of |
Trustee since June 2006 | Pennsylvania since 2004; Professor in the School of Arts and Sciences, Annenberg School |
142 Vanguard Funds Overseen | for Communication, and Graduate School of Education of the University of Pennsylvania |
| since 2004; Provost (2001–2004) and Laurance S. Rockefeller Professor of Politics and the |
| University Center for Human Values (1990–2004), Princeton University; Director of Carnegie |
| Corporation of New York and of Philadelphia 2016 (since 2005) and of Schuylkill River |
| Development Corporation and Greater Philadelphia Chamber of Commerce (since 2004). |
JoAnn Heffernan Heisen |
| |
Born 1950 | Principal Occupation(s) During the Past Five Years: Corporate Vice President and Chief | |
Trustee since July 1998 | Global Diversity Officer (since January 2006), Vice President and Chief Information | |
142 Vanguard Funds Overseen | Officer (1997–2005), and Member of the Executive Committee of Johnson & Johnson | |
| (pharmaceuticals/consumer products); Director of the University Medical Center at | |
| Princeton and Women’s Research and Education Institute. | |
|
| |
André F. Perold |
| |
Born 1952 | Principal Occupation(s) During the Past Five Years: George Gund Professor of Finance and | |
Trustee since December 2004 | Banking, Harvard Business School (since 2000); Senior Associate Dean, Director of Faculty | |
142 Vanguard Funds Overseen | Recruiting, and Chair of Finance Faculty, Harvard Business School; Director and Chairman | |
| of UNX, Inc. (equities trading firm) (since 2003); Director of registered investment | |
| companies advised by Merrill Lynch Investment Managers and affiliates (1985–2004), | |
| Genbel Securities Limited (South African financial services firm) (1999–2003), Gensec | |
| Bank (1999–2003), Sanlam, Ltd. (South African insurance company) (2001–2003), and | |
| Stockback, Inc. (credit card firm) (2000–2002). | |
|
| |
Alfred M. Rankin, Jr. |
| |
Born 1941 | Principal Occupation(s) During the Past Five Years: Chairman, President, Chief Executive | |
Trustee since January 1993 | Officer, and Director of NACCO Industries, Inc. (forklift trucks/housewares/ lignite); | |
142 Vanguard Funds Overseen | Director of Goodrich Corporation (industrial products/aircraft systems and services). | |
|
| |
J. Lawrence Wilson |
| |
Born 1936 | Principal Occupation(s) During the Past Five Years: Retired Chairman and Chief Executive | |
Trustee since April 1985 | Officer of Rohm and Haas Co. (chemicals); Director of Cummins Inc. (diesel engines), | |
142 Vanguard Funds Overseen | MeadWestvaco Corp. (packaging products), and AmerisourceBergen Corp. (pharmaceutical | |
| distribution); Trustee of Vanderbilt University and of Culver Educational Foundation. | |
|
| |
Executive Officers1 |
| |
|
| |
Heidi Stam |
| |
Born 1956 | Principal Occupation(s) During the Past Five Years: Principal of The Vanguard Group, Inc., | |
Secretary since July 2005 | since November 1997; General Counsel of The Vanguard Group since July 2005; | |
142 Vanguard Funds Overseen | Secretary of The Vanguard Group and of each of the investment companies served | |
| by The Vanguard Group since July 2005. | |
|
| |
Thomas J. Higgins |
| |
Born 1957 | Principal Occupation(s) During the Past Five Years: Principal of The Vanguard Group, Inc.; | |
Treasurer since July 1998 | Treasurer of each of the investment companies served by The Vanguard Group. | |
142 Vanguard Funds Overseen |
| |
|
| |
Vanguard Senior Management Team | ||
|
| |
R. Gregory Barton | Kathleen C. Gubanich | Michael S. Miller |
Mortimer J. Buckley | Paul A. Heller | Ralph K. Packard |
James H. Gately | F. William McNabb, III | George U. Sauter |
|
| |
Founder |
| |
|
| |
John C. Bogle |
| |
Chairman and Chief Executive Officer, 1974–1996 | ||
1 Officers of the funds are “interested persons” as defined in the Investment Company Act of 1940.
2 December 2002 for Vanguard Equity Income Fund, Vanguard Growth Equity Fund, the Vanguard Municipal Bond Funds, and the Vanguard State Tax-Exempt Funds.
More information about the trustees is in the Statement of Additional Information, available from The Vanguard Group.
|
|
| P.O. Box 2600 |
| Valley Forge, PA 19482-2600 |

Connect with Vanguard™ > www.vanguard.com
Fund Information > 800-662-7447 | Vanguard, Connect with Vanguard, and the ship logo |
| are trademarks of The Vanguard Group, Inc. |
Direct Investor Account Services > 800-662-2739 |
|
| All other marks are the exclusive property of their |
Institutional Investor Services > 800-523-1036 | respective owners. |
|
|
Text Telephone > 800-952-3335 | All comparative mutual fund data are from Lipper Inc. |
| or Morningstar, Inc., unless otherwise noted. |
|
|
|
|
|
|
|
|
This material may be used in conjunction | You can obtain a free copy of Vanguard’s proxy voting |
with the offering of shares of any Vanguard | guidelines by visiting our website, www.vanguard.com, |
fund only if preceded or accompanied by | and searching for “proxy voting guidelines,” or by calling |
the fund’s current prospectus. | Vanguard at 800-662-2739. They are also available from |
| the SEC’s website, www.sec.gov. In addition, you may |
| obtain a free report on how your fund voted the proxies for |
| securities it owned during the 12 months ended June 30. |
| To get the report, visit either www.vanguard.com |
| or www.sec.gov. |
|
|
| You can review and copy information about your fund |
| at the SEC’s Public Reference Room in Washington, D.C. |
| To find out more about this public service, call the SEC |
| at 202-551-8090. Information about your fund is also |
| available on the SEC’s website, and you can receive |
| copies of this information, for a fee, by sending a |
| request in either of two ways: via e-mail addressed to |
| publicinfo@sec.gov or via regular mail addressed to the |
| Public Reference Section, Securities and Exchange |
| Commission, Washington, DC 20549-0102. |
|
|
|
|
|
|
|
|
| © 2006 The Vanguard Group, Inc. |
| All rights reserved. |
| Vanguard Marketing Corporation, Distributor. |
|
|
| Q12200 112006 |
Item 2: Code of Ethics. The Registrant has adopted a code of ethics that applies to the Registrant's principal executive officer, principal financial officer, principal accounting officer or controller or persons performing similar functions. The Code of Ethics was amended during the reporting period covered by this report to make certain technical, non-material changes.
Item 3: Audit Committee Financial Expert. The following members of the Audit Committee have been determined by the Registrant’s Board of Trustees to be Audit Committee Financial Experts serving on its Audit Committee, and to be independent: Charles D. Ellis, Rajiv L. Gupta, JoAnn Heffernan Heisen, André F. Perold, Alfred M. Rankin, Jr., and J. Lawrence Wilson.
Item 4: Principal Accountant Fees and Services.
(a) Audit Fees.
Audit Fees of the Registrant
Fiscal Year Ended September 30, 2006: $62,000
Fiscal Year Ended September 30, 2005: $54,000
Aggregate Audit Fees of Registered Investment Companies in the Vanguard Group
Fiscal Year Ended September 30, 2006: $2,347,620
Fiscal Year Ended September 30, 2005: $2,152,740
(b) Audit-Related Fees.
Fiscal Year Ended September 30, 2006: $530,000
Fiscal Year Ended September 30, 2005: $382,200
Includes fees billed in connection with assurance and related services provided to the Registrant, The Vanguard Group, Inc., Vanguard Marketing Corporation, and other registered investment companies in the Vanguard Group.
(c) Tax Fees.
Fiscal Year Ended September 30, 2006: $101,300
Fiscal Year Ended September 30, 2005: $94,400
Includes fees billed in connection with tax compliance, planning and advice services provided to the Registrant, The Vanguard Group, Inc., Vanguard Marketing Corporation, and other registered investment companies in the Vanguard Group and related to income and excise taxes.
(d) All Other Fees.
Fiscal Year Ended September 30, 2006: $0
Fiscal Year Ended September 30, 2005: $0
Includes fees billed for services related to risk management and privacy matters. Services were provided to the Registrant, The Vanguard Group, Inc., Vanguard Marketing Corporation, and other registered investment companies in the Vanguard Group.
(e) (1) Pre-Approval Policies. The policy of the Registrant’s Audit Committee is to consider and, if appropriate, approve before the principal accountant is engaged for such services, all specific audit and non-audit services provided to: (1) the Registrant; (2) The Vanguard Group, Inc.; (3) other entities controlled by The Vanguard Group, Inc. that provide ongoing services to the Registrant; and (4) other registered investment companies in the Vanguard Group. In making a determination, the Audit Committee considers whether the services are consistent with maintaining the principal accountant’s independence.
In the event of a contingency situation in which the principal accountant is needed to provide services in between scheduled Audit Committee meetings, the Chairman of the Audit Committee would be called on to consider and, if appropriate, pre-approve audit or permitted non-audit services in an amount sufficient to complete services through the next Audit Committee meeting, and to determine if such services would be consistent with maintaining the accountant’s independence. At the next scheduled Audit Committee meeting, services and fees would be presented to the Audit Committee for formal consideration, and, if appropriate, approval by the entire Audit Committee. The Audit Committee would again consider whether such services and fees are consistent with maintaining the principal accountant’s independence.
The Registrant’s Audit Committee is informed at least annually of all audit and non-audit services provided by the principal accountant to the Vanguard complex, whether such services are provided to: (1) the Registrant; (2) The Vanguard Group, Inc.; (3) other entities controlled by The Vanguard Group, Inc. that provide ongoing services to the Registrant; or other registered investment companies in the Vanguard Group.
(2) No percentage of the principal accountant’s fees or services were approved pursuant to the waiver provision of paragraph (c)(7)(i)(C) of Rule 2-01 of Regulation S-X.
(f) For the most recent fiscal year, over 50% of the hours worked under the principal accountant’s engagement were not performed by persons other than full-time, permanent employees of the principal accountant.
(g) Aggregate Non-Audit Fees.
Fiscal Year Ended September 30, 2006: $101,300
Fiscal Year Ended September 30, 2005: $98,400
Includes fees billed for non-audit services provided to the Registrant, The Vanguard Group, Inc., Vanguard Marketing Corporation, and other registered investment companies in the Vanguard Group.
(h) For the most recent fiscal year, the Audit Committee has determined that the provision of all non-audit services was consistent with maintaining the principal accountant’s independence.
Item 5: Not applicable.
Item 6: Not applicable.
Item 7: Not applicable.
Item 8: Not applicable.
Item 9: Not applicable.
Item 10: Not applicable
Item 11: Controls and Procedures.
(a) Disclosure Controls and Procedures. The Principal Executive and Financial Officers concluded that the Registrant’s Disclosure Controls and Procedures are effective based on their evaluation of the Disclosure Controls and Procedures as of a date within 90 days of the filing date of this report.
(b) Internal Control Over Financial Reporting. There were no significant changes in Registrant’s internal control over financial reporting or in other factors that could significantly affect this control subsequent to the date of the evaluation, including any corrective actions with regard to significant deficiencies and material weaknesses.
Item 12: Exhibits.
(a) Code of Ethics.
(b) Certifications.
Pursuant to the requirements of the Securities Exchange Act of 1934 and the Investment Company Act of 1940, the registrant has duly caused this report to be signed on its behalf by the undersigned, thereunto duly authorized.
| VANGUARD FENWAY FUNDS | |
| BY: | (signature) |
| (HEIDI STAM) JOHN J. BRENNAN* CHIEF EXECUTIVE OFFICER |
| Date: | November 17, 2006 |
Pursuant to the requirements of the Securities Exchange Act of 1934 and the Investment Company Act of 1940, this report has been signed below by the following persons on behalf of the registrant and in the capacities and on the dates indicated.
| VANGUARD FENWAY FUNDS | |
| BY: | (signature) |
| (HEIDI STAM) JOHN J. BRENNAN* CHIEF EXECUTIVE OFFICER |
| Date: | November 17, 2006 |
| VANGUARD FENWAY FUNDS | |
| BY: | (signature) |
| (HEIDI STAM) THOMAS J. HIGGINS* TREASURER |
| Date: | November 17, 2006 |
* By Power of Attorney. See File Number 002-65955-99, filed on July 27, 2006. Incorporated by Reference.